UNITED STATES
SECURITIES AND EXCHANGE COMMISSION
Washington, D.C. 20549
FORM 10-K10-K/A
(Amendment No. 1)
(Mark One)
| | | | | |
| ☑ | ANNUAL REPORT PURSUANT TO SECTION 13 OR 15(d) OF THE SECURITIES EXCHANGE ACT OF 1934 |
For the fiscal year ended: December 31, 20222023
OR
| | | | | |
| ☐ | TRANSITION REPORT PURSUANT TO SECTION 13 OR 15(d) OF THE SECURITIES EXCHANGE ACT OF 1934 |
For the transition period from to .
Commission file number 1-9444
CEDAR FAIR, L.P.
(Exact name of registrant as specified in its charter)
| | | | | | | | |
| Delaware | | 34-1560655 |
(State or other jurisdiction of
incorporation or organization) | | (I.R.S. Employer
Identification No.) |
One Cedar Point Drive, Sandusky, Ohio 44870-5259
(Address of principal executive offices) (Zip Code)
(419) 626-0830
(Registrant’s telephone number, including area code)
Securities registered pursuant to Section 12(b) of the Act:
| | | | | | | | |
| Title of each class | Trading Symbol(s) | Name of each exchange on which registered |
Depositary Units (Representing
Limited Partner Interests) | FUN | New York Stock Exchange |
Securities registered pursuant to Section 12(g) of the Act: None
Indicate by check mark if the registrant is a well-known seasoned issuer, as defined in Rule 405 of the Securities Act.
☑ Yes ☐ No
Indicate by check mark if the registrant is not required to file reports pursuant to Section 13 or Section 15(d) of the Act.
☐ Yes ☑ No
Indicate by check mark whether the registrant (1) has filed all reports required to be filed by Section 13 or 15(d) of the Securities Exchange Act of 1934 during the preceding 12 months (or for such shorter period that the registrant was required to file such reports), and (2) has been subject to such filing requirements for the past 90 days. ☑ Yes ☐ No
Indicate by check mark whether the registrant has submitted electronically every Interactive Data File required to be submitted pursuant to Rule 405 of Regulation S-T (§232.405 of this chapter) during the preceding 12 months (or for such shorter period that the registrant was required to submit such files). ☑ Yes ☐ No
Indicate by check mark whether the registrant is a large accelerated filer, an accelerated filer, a non-accelerated filer, a smaller reporting company, or an emerging growth company. See the definitions of "large accelerated filer," "accelerated filer," "smaller reporting company," and "emerging growth company" in Rule 12b-2 of the Exchange Act.
| | | | | | | | | | | | | | | | | | | | |
| Large accelerated filer | | ☑ | | Accelerated filer | | ☐ |
| | | |
| Non-accelerated filer | | ☐ | | Smaller reporting company | | ☐ |
| | | | | | |
| | | | Emerging growth company | | ☐ |
If an emerging growth company, indicate by check mark if the registrant has elected not to use the extended transition period for complying with any new or revised financial accounting standards provided pursuant to Section 13(a) of the Exchange Act. ☐
Indicate by check mark whether the registrant has filed a report on and attestation to its management's assessment of the effectiveness of its internal control over financial reporting under Section 404(b) of the Sarbanes-Oxley Act (15 U.S.C. 7262(b)) by the registered public accounting firm that prepared or issued its audit report. ☑
If securities are registered pursuant to Section 12(b) of the Act, indicate by check mark whether the financial statements of the registrant included in the filing reflect the correction of an error to previously issued financial statements. ☐
Indicate by check mark whether any of those error corrections are restatements that required a recovery analysis of incentive-based compensation received by any of the registrant's executive officers during the relevant recovery period pursuant to §240.10D-1(b). ☐
Indicate by check mark whether the registrant is a shell company (as defined in Rule 12b-2 of the Exchange Act). ☐ Yes ☑ No
The aggregate market value of Depositary Units held by non-affiliates of the Registrant based on the closing price of such units on June 24, 202223, 2023 of $42.80$39.99 per unit was approximately $2,404,874,220.$2,016,277,365.
Number of Depositary Units representing limited partner interests outstanding as of February 10, 2023: 51,930,650April 19, 2024: 51,252,360 units
DOCUMENTS INCORPORATED BY REFERENCE
Part III of this Form 10-K incorporates by reference certain information from the Registrant's definitive proxy statement to be used in connection with its annual meeting of limited partner unitholders to be held in May 2023.None
************
Page 1 of 5954 pages
CEDAR FAIR, L.P.
20222023 FORM 10-K10-K/A CONTENTS
PART IEXPLANATORY NOTE
Unless the context otherwise indicates, all references to "we," "us," "our,"This Amendment on Form 10-K/A (the "Amendment" or the "Partnership" in this"Form 10-K/A") amends the Annual Report on Form 10-K refer toof Cedar Fair, L.P. together("Cedar Fair" or the "Partnership") for the year ended December 31, 2023, as filed with its affiliated companies.the Securities and Exchange Commission ("SEC") on February 16, 2024 (the "Original Form 10-K"). This Amendment is being filed solely for the purpose of disclosing information required in Part III that the Partnership will not be incorporating by reference to a definitive proxy statement. No other parts or disclosures from the Original Form 10-K are included in this Amendment other than Parts III and IV below, and except as required to reflect the matters set forth in such included disclosure, this Amendment does not reflect events or developments that have occurred after the date of the Original Form 10-K and does not modify or update disclosures presented in the Original Form 10-K in any way.
Among other things, forward-looking statements made in the Original Form 10-K have not been revised to reflect events, results, or developments that occurred or facts that have become known to us after the date of the Original Form 10-K (other than as discussed above), and such forward-looking statements should be read in their historical context. Accordingly, this Amendment should be read in conjunction with our filings made with the SEC subsequent to the filing of the Original Form 10-K.
PART III
ITEM 1. BUSINESS.10. DIRECTORS, EXECUTIVE OFFICERS AND CORPORATE GOVERNANCE.
We are one of the largest regional amusement park operators in the world with 13 properties in our portfolio consisting of amusement parks, water parks and complementary resort facilities. We are a publicly traded Delaware limited partnership formed in 1987 and managed by Cedar Fair Management, Inc. ("CFMI"), an Ohio corporation (the "General Partner"), whose shares are heldowned by an Ohio trust. Our parkstrust, is the General Partner of the Partnership and has full responsibility for the management of the Partnership. For additional information, see Note 1 in the Notes to the Consolidated Financial Statements of the Original Form 10-K.
Board of Directors
The Board of Directors of CFMI (the "Board of Directors" or "Board") is currently comprised of eight directors. The directors are family-oriented, with recreational facilities for peopledivided into three classes: Class I, Class II, and Class III, and each class consists of all ages,three directors except Class III. Matthew A. Ouimet was in Class III and provide clean and attractive environments with exciting rides and immersive entertainment. We generate revenue from sales of admission to our amusement parks and water parks, from purchases of food, merchandise and games both inside and outside our parks, andresigned from the saleBoard of accommodations and other extra-charge products.
Our parks operate seasonally exceptDirectors effective September 1, 2023. A successor for Knott's Berry Farm, which is typically open daily on a year-round basis. Our seasonal parks are generally open daily from Memorial Day until Labor Day. OutsideMr. Ouimet has not been elected. The term of daily operations, our seasonal parks are open during select weekends, including at most propertieseach director in each respective class expires in the fourth quarter for Halloweenyear noted below when the director's successor is duly elected and winter events. As a result, a substantial portion of our revenues from these seasonal parks are generated from Memorial Day through Labor Day with the major portion concentrated during the peak vacation months of July and August.
The demographic groups that are most important to our business are families and young people ages 12 through 24. Families are believed to be attracted by a combination of rides, live entertainment and the clean, wholesome atmosphere. Young people are believed to be attracted by the action-packed rides. We conduct active television, radio, newspaper and internet advertising campaigns in our major market areas geared toward these two groups.
IMPACT OF COVID-19 PANDEMIC
The novel coronavirus (COVID-19) pandemic had a material impact on our business in 2020, had a continuing negative impact in 2021 and may have a longer-term negative effect. Beginning on March 14, 2020, we closed our properties for several months in response to the spread of COVID-19 and local government mandates. We ultimately resumed partial operations at 10 of our 13 properties in 2020, operating in accordance with local and state guidelines. We delayed the opening of our U.S. properties for the 2021 operating season until May 2021 and opened our Canadian property in July 2021. Upon opening in 2021, we operated with capacity restrictions, guest reservations, and other operating protocols in place. As vaccination distribution efforts continued during the second quarter of 2021 and we were able to hire additional labor, we removed most capacity restrictions, guest reservation requirements and other protocols at our U.S. properties beginning in July 2021. Canada's Wonderland operated with capacity restrictions, guest reservations, and other operating protocols in place throughout 2021.
Each of our properties opened for the 2022 operating season as planned and without restrictions. We currently anticipate continuing to operate without restrictions for the 2023 operating season. However, we have and may continue to adjust future park operating calendars as we respond to changes in guest demand, labor availability and any federal, provincial, state and local restrictions. Our future operations are dependent on factors beyond our knowledge or control, including any future actions taken to contain the COVID-19 pandemic and changing risk tolerances of our employees and guests regarding health matters.
DESCRIPTION OF OUR PARKS
Cedar Point
Cedar Fair's flagship park, Cedar Point, was first developed as a recreational area in 1870. Located on a peninsula in Sandusky, Ohio bordered by Lake Erie between Cleveland and Toledo, Cedar Point serves a six-state region which includes nearly all of Ohio and Michigan, western Pennsylvania and New York, northern West Virginia and Indiana, as well as southwestern Ontario, Canada. Attractive to both families and thrill-seekers, the park features 18 roller coasters, including many record-breakers, and three children's areas. Located adjacent to the park is Cedar Point Shores Water Park, a separately gated water park featuring more than 15 water rides and attractions. Cedar Point also features four hotels, three marinas, an upscale campground, and the nearby Cedar Point Sports Center which features both indoor and outdoor sports facilities. Cedar Point's four hotels include:
Hotel Breakers - the park's largest hotel and only hotel located on the Cedar Point peninsula, featuring various dining and lounge facilities, a mile-long beach, lake swimming, a conference/meeting center, an indoor pool and multiple outdoor pools;
Castaway Bay Indoor Waterpark Resort - a year-round hotel located adjacent to the entrance to the park featuring tropical, Caribbean themed hotel rooms centered around an indoor water park, as well as a marina and dining facilities;
Cedar Point's Express Hotel - a limited-service seasonal hotel located adjacent to the entrance to the park; and
Sawmill Creek Resort - a year-round resort lodge located near Cedar Point in Huron, Ohio, featuring a golf course, marina, half-mile beach, dining and shopping facilities, and a conference/meeting center.qualified.
Knott's Berry FarmClass II Directors serving until 2024:
| | | | | | | | | | | | | | |
| Name | | Age | | Position(s) |
| | | | |
Michelle M.
Frymire | | 57 | | | Michelle McKinney Frymire has extensive executive-level and financial experience with both public and private companies. Most recently, she served as CEO of CWT (formerly Carlson Wagonlit Travel), a leader in travel management technology, from May 2021 to May 2022, when she steered the company through the pandemic, driving the company’s global strategy and overseeing significant investment in the company’s product and technology platforms. As a travel management platform, CWT was heavily impacted by the COVID-19 pandemic and with the support of nearly all of its debt holders CWT filed a pre-packaged Chapter 11 bankruptcy on November 11, 2021, in the U.S. Bankruptcy Court for the Southern District of Texas. CWT’s plan of reorganization was approved by the Bankruptcy Court the following day, on November 12, 2021, and CWT was able to exit Chapter 11 on November 19, 2021. Prior to serving as CEO, Ms. Frymire served as president and CFO of CWT, in charge of global business strategy and transformation. Prior to joining CWT, Frymire was CFO for U.S. Risk Insurance Group, LLC, a privately owned specialty lines underwriting manager and wholesale broker, from 2017 to 2019. From 2015 to 2017, she served as CFO for Service King Collision Repair Centers, an auto body collision repair company. From 2009 to 2015, Frymire served in a variety of roles for The Service Master Companies, Inc., a residential and commercial services company, most recently as vice president, corporate FP&A and strategy, as well as CFO for TruGreen, a lawn and landscape service provider, from 2009 to 2013. From 2005 to 2009, Frymire was CFO, vacation ownership for Starwood Hotels & Resorts Worldwide, Inc., a former hospitality company. From 1998 to 2005, Frymire served in a variety of roles for Delta Air Lines, Inc. (NYSE: DAL), a global airline carrier, including vice president of finance - marketing, international, network and technology. From 1991 to 1998, she served in a variety of finance roles for Continental Airlines, a former global airline carrier, and American Airlines (NASDAQ: AAL), a global airline carrier. Ms. Frymire serves as a board director for Sonder (NASDAQ: SOND), a hospitality company, where she sits on the audit committee and chairs the nominating, corporate governance & social responsibility committee. Ms. Frymire also serves as a board director for NCR Atleos (NYSE: NATL), where she sits on the compensation committee and chairs the nominating and governance committee. Ms. Frymire previously served on the board of Spirit Realty Capital (NYSE: SRC), a triple net lease REIT, from April 2021 until the company was sold in January 2024. At Cedar Fair, Ms. Frymire has served as a director since October 2022 and serves as a member of the Audit Committee and People, Culture & Compensation Committee. Ms. Frymire is qualified to serve on the Board of Directors as a result of her extensive executive-level and financial experience, including in the technology, travel and hospitality sectors, as well as her corporate governance experience. |
Daniel J.
Hanrahan | | 66 | | | Daniel J. Hanrahan brings more than 40 years of experience, including from a variety of sales and marketing, general manager, president and chief executive officer roles across the consumer packaged goods, retail, travel and hospitality sectors. In January 2020, he was appointed Chairman of the Board of Directors. He served as the president and chief executive officer and director of the Regis Corporation (NYSE: RGS), a global leader in beauty salons and cosmetology, from August 2012 through April 2017. Prior to joining Regis, he served as president and CEO of Celebrity Cruises, a cruise line and division of Royal Caribbean Cruises (NYSE: RCL), from 2007 to 2012. He was promoted to president in 2005 and to CEO in 2007 after his highly successful management of the sales and marketing division for Royal Caribbean. Prior to joining Royal Caribbean, Mr. Hanrahan served in executive-level positions with Polaroid Corporation and Reebok International Ltd. In 2004, he was named one of the “Top 25 Extraordinary Minds in Hospitality Sales and Marketing” by Hospitality and Sales Marketing Association International. From 2017 to 2021, Mr. Hanrahan was a director and member of the audit committee at Lindblad Expeditions Holdings, Inc. (NASDAQ: LIND), a global provider of expedition cruises and adventure travel experiences. He joined the board of Foss Swim Schools, a Prairie Capital company, in April 2019. Mr. Hanrahan joined Sycamore Partners as an advisor in 2021. At Cedar Fair, Mr. Hanrahan has served as a director since June 2012. Mr. Hanrahan is qualified to serve on the Board of Directors primarily as a result of his significant executive-level experience across a wide spectrum of consumer-facing brands, including in the retail, travel and hospitality sectors, as well as his more than 40 years of experience in sales and marketing. |
| Jennifer Mason | | 54 | | | Jennifer Mason is global officer, treasurer and risk management at Marriott International, Inc. (NASDAQ: MAR), a hospitality company with over 30 brands and nearly 8,700 properties in 139 countries and territories. In her role at Marriott, she oversees global capital markets and hotel financing, financial strategy and capital allocation, financial risk management, and global capital transactions and treasury services. Ms. Mason is also responsible for the company’s global risk management function including insurance, claims, business continuity and global safety and security. Prior to her current role, Ms. Mason was CFO for Marriott’s U.S. & Canada division, with accountability for financial management including responsibilities for the continent's P&L, budgeting, forecasting, cash management, internal controls, asset management and feasibility. Since 1992, Ms. Mason has held several other leadership positions at Marriott, including senior vice president of IT business partnership & planning, as well as senior vice president, sales & marketing planning support. In her first 16 years with Marriott, Ms. Mason held several positions of increasing responsibility in internal audit, corporate financial planning & analysis, lodging finance and business development. She was regional director for the Mid-Atlantic region and vice president, finance business partner for sales and marketing, before serving in her senior vice president roles. At Cedar Fair, Ms. Mason has served as a director since October 2022 and is a member of the Audit Committee and Nominating and Corporate Governance Committee. She is qualified to serve on the Board of Directors as a result of her executive-level experience within the hospitality sector, including her experience in financial and risk management leadership positions. |
Knott's Berry Farm, located near Los Angeles in Buena Park, California, first opened in 1920 and was acquired by the Partnership in 1997. The park is one
Class I Directors serving until 2025:
| | | | | | | | | | | | | | |
| Name | | Age | | Position(s) |
| | | | |
| Louis Carr | | 67 | | | Louis Carr is president of Media Sales for BET Media Group, a leading provider of quality entertainment, music, news and public affairs television programming for the African-American audience and a subsidiary of Paramount Global (NASDAQ: PARA). Mr. Carr has been with BET Networks for 37 years and is recognized as one of the most influential and prominent African Americans in the media and marketing industries. In 2016, Mr. Carr earned the Diversity Award from the Hyatt Corporation and another Lifetime Achievement Award from the Patricia Martin Legacy celebration honoring his work around diversity from both a personal and professional standpoint. In 2023, Mr. Carr was inducted into the Advertising Hall of Fame and awarded the Chicago Advertising Federation Silver Medal Award. He has also been recognized by theboardiQ as a Top 100 Hall of Fame African American and was named one of the Most Influential Black Corporate Directors by Savoy Magazine. He has also been listed on NAMIC’s Most Influential African Americans list in the cable industry several times. Mr. Carr has served on the boards of the Ad Council; International Radio and Television Society (IRTS); American Advertising Federation (AAF); the Video Advertising Board (VAB), formerly the CAB; and Boys Hope Girls Hope. He currently serves on the board of the United States Track and Field Foundation and Drake University. Utilizing his B.A. in Journalism from Drake University, he has become a compelling author, writing two books titled Dirty Little Secrets and The Little Black Book: Daily Motivations for Business and Personal Growth. At Cedar Fair, Mr. Carr has served as a director since 2020 and is the Chair of the Nominating and Corporate Governance Committee. Mr. Carr is qualified to serve on the Board of Directors primarily as a result of his more than 35 years of experience as an entertainment, media, and advertising executive. |
D. Scott
Olivet | | 62 | | | D. Scott Olivet is the chief executive officer of Renegade Brands, an investment company that primarily invests in apparel and other consumer companies; chief executive officer of DSO Advisors, which provides strategic, brand and organizational effectiveness consulting and executive coaching services; and an operating partner at Altamont Capital Partners, a private equity firm. From 2013 to 2019, Mr. Olivet served as chief executive officer of the coordinating and shared services entity for a portfolio of Altamont Capital owned businesses. From 2011 to 2012, Mr. Olivet served as full-time chairman of Collective Brands Inc. From 2009 to 2011, Mr. Olivet served as chief executive officer of RED Digital Cinema Camera company. From 2005 to July 2009, Mr. Olivet served as chief executive officer and director of Oakley, a manufacturer of sports performance equipment, then served as chairman of the board from July 2009 to February 2011. Prior to joining Oakley, he served as vice president of NIKE Subsidiaries and New Business Development where he was responsible for the Hurley, Converse, Cole Haan, Bauer Hockey, and Starter brands; senior vice president of Real Estate, Store Design, and Construction with Gap Inc., with responsibility across Gap, Banana Republic, and Old Navy brands; and as a partner with Bain & Company where he was also the leader of the worldwide practice in organizational effectiveness and change management. Mr. Olivet serves as executive chairman of RED Digital Cinema, an American manufacturer of digital cinematography tools, a position he has held since July 2009. Mr. Olivet also serves as chairman of Future Stitch since July 2018, director of Reef since October 2018, and director of Brixton Manufacturing since October 2014. He has previously served on the boards of Oakley, Collective Brands, Skullcandy, Fox Racing, Mervin Manufacturing, Dakine, HUF, and Hybrid Apparel. At Cedar Fair, Mr. Olivet has served as a director since 2013, is the Chair of the People, Culture & Compensation Committee and is a member of the Nominating and Corporate Governance Committee. Mr. Olivet is qualified to serve on the Board of Directors primarily as a result of his particular knowledge and professional experience in retail, merchandising, marketing, finance, strategy, technology, international business, and multi-division general management experience from his past public board experience and service as president and CEO of a nationally recognized company that conducts business in the retail industry. |
Carlos A.
Ruisanchez | | 53 | | | Carlos A. Ruisanchez is a seasoned executive with extensive strategy, finance and senior management experience in the hospitality industry, including casinos, hotels, restaurants and entertainment businesses. He is the co-founder of Sorelle Capital, a firm focused on investing in and helping grow companies in the hospitality, consumer, and real estate sectors. Mr. Ruisanchez also serves as an independent director of Southwest Gas Holdings (NYSE: SWX). Prior to Sorelle, he served as president and chief financial officer and board member of Pinnacle Entertainment, Inc. (NASDAQ: PNK), a leading regional gaming entertainment company, until its sale in October 2018. Mr. Ruisanchez joined Pinnacle in August 2008 as its executive vice president, strategic planning and development. He became Pinnacle's chief financial officer in 2011, president and chief financial officer in 2013, and board member in 2016. During his tenure at Pinnacle, Mr. Ruisanchez, in addition to leading all of Pinnacle's finance and analytic functions, led all merger, acquisition and divestiture activities, and new development representing billions of dollars of transactions. Prior to joining Pinnacle, he worked at Bear, Stearns & Co. Inc., an investment banking firm, since 1997 and most recently served as senior managing director responsible for corporate clients in the gaming, lodging and leisure industries, as well as financial sponsor banking relationships. At Cedar Fair, Mr. Ruisanchez has served as a director since 2019, is the Chair of the Audit Committee and is a member of the People, Culture & Compensation Committee. Mr. Ruisanchez's extensive experience as a senior executive in the finance and entertainment industries provides the Board of Directors with expertise in operations, accounting, corporate finance, real estate, corporate governance, regulatory and risk assessment issues. |
Amusement Today's international survey. Adjacent to Knott's Berry Farm is Knott's Soak City, a separately gated seasonal water park that features multiple water rides and attractions. Knott's Berry Farm also features the Knott's Berry Farm Hotel, a full-service hotel located adjacent to Knott's Berry Farm featuring a pool, fitness facilities and meeting/banquet facilities.
Canada's Wonderland,Class III Directors serving until 2026:
| | | | | | | | | | | | | | |
| Name | | Age | | Position(s) |
| | | | |
| Nina Barton | | 50 | | | Nina Barton is a consumer packaged goods executive with more than 25 years of experience, including extensive marketing experience. She was most recently the CEO of Vytalogy Wellness, a modern wellness company with vitamin and supplement brands, from July 2021 to November 2023. In this role, Ms. Barton was responsible for leading the company’s more than 600 employees and driving the strategy and growth of its vitamin and supplement brands, Natrol and Jarrow Formulas. Prior to Vytalogy Wellness, Ms. Barton spent more than 10 years in leadership positions across various categories at The Kraft Heinz Company (NASDAQ: KHC), a multinational food company. Most recently, she served as the global chief growth officer at Kraft and was responsible for leading their global strategy, including eCommerce, R&D and marketing. Prior to joining Kraft in 2011, Ms. Barton held numerous marketing and leadership positions at multinational consumer packaged goods companies, including Johnson & Johnson (NYSE: JNJ), L’Oréal and Procter & Gamble (NYSE: PG). At Cedar Fair, Ms. Barton has served as a director since 2023 and is a member of the Audit Committee. Ms. Barton is qualified to serve on the Board of Directors as a result of her past experiences across multiple consumer-facing brands, as well as her many years of marketing experience. |
Richard A.
Zimmerman | | 63 | | | Richard A. Zimmerman has been president and chief executive officer of Cedar Fair since January 2018 and a member of the Board of Directors since April 2019. Prior to becoming CEO, Mr. Zimmerman served as president and chief operating officer from October 2016 to December 2017 and served as chief operating officer from October 2011 to October 2016. Prior to that, he was appointed as executive vice president in November 2010 and as regional vice president in June 2007. He has been with Cedar Fair since 2006, when it acquired Kings Dominion. Mr. Zimmerman was vice president and general manager of Kings Dominion from 1998 through 2007. He also is a senior advisor at Velocity Capital Management, a private equity firm that invests in the sports, media and entertainment sectors. Mr. Zimmerman's leadership and management skills and his insights from his experience as Cedar Fair's president and chief executive officer provide guidance, operational knowledge and management perspective to the Board. |
Executive Officers
Information regarding executive officers of the Partnership is included in the Original Form 10-K under the caption "Supplemental Item. Information about our Executive Officers" in Item 1 of Part I and is incorporated herein by reference.
Director Nominations
There were no material changes to the nomination procedures by which unitholders may recommend nominees to our Board of Directors, as described in our most recent proxy statement.
Audit Committee
The Partnership has a combination amusementseparately designated standing audit committee (the "Audit Committee"). The Audit Committee is responsible for appointing and water park located near Torontomeeting with our independent registered public accounting firm and for assisting the Board in Vaughan, Ontario, first opened in 1981its oversight of the financial statement reporting, internal audit and was acquiredrisk management functions. The Audit Committee meets frequently during the year and discusses with management and our independent registered public accountant: (1) current business trends affecting the Partnership; (2) major risks facing the Partnership; (3) steps management has taken to monitor and control such risks; and (4) adequacy of internal controls that could significantly affect the Partnership's financial statements. The Audit Committee reviews the Partnership's enterprise risk management process for identification of and response to risks related to cyber-security and data protection, and other risks that may materially impact the business. The Audit Committee Chair provides the Board with regular reports concerning its risk oversight activities.
The Audit Committee consists of Carlos A. Ruisanchez (Chair), Nina Barton, Michelle M. Frymire and Jennifer Mason. All committee members are independent directors under New York Stock Exchange ("NYSE") listing standards and as required under Section 301 of the Sarbanes-Oxley Act of 2002. Mr. Ruisanchez and Mses. Frymire and Mason qualify as Audit Committee Financial Experts as defined by the Partnership in 2006. It contains numerous attractions, including 18 roller coasters,SEC.
Code of Conduct and is oneEthics and Corporate Governance Guidelines
Our Corporate Governance Guidelines, Code of Conduct and Ethics, and the charters of the most attended amusement parks in North America. Canada's Wonderland is inBoard committees provide the framework for the governance of the Partnership.
The Corporate Governance Guidelines cover, among other things, the composition and functions of the Board, the qualifications and responsibilities of directors, director independence, the selection process for new directors, Board committees, compensation of the Board and the responsibilities of the Chairman of the Board.
We have adopted and maintain a culturally diverse metropolitan market with large populationsCode of different ethnicitiesConduct and national origins. Each year the park showcases an extensive entertainmentEthics that covers all directors, officers and special event line-up which includes cultural festivals.
Kings Island
Kings Island, a combination amusement and water park located near Cincinnati, Ohio, first opened in 1972 and was acquired byemployees of the Partnership and its subsidiaries. The Code of Conduct and Ethics requires, among other things, that the directors, officers and employees exhibit and promote the highest standards of honest and ethical conduct, avoid conflicts of interest, comply with laws, rules and regulations, and otherwise act in 2006. Kings Island is also onethe Partnership's best interest.
We intend to post amendments to or waivers from the Partnership's Corporate Governance Guidelines and Code of Conduct and Ethics on our Investor Relations website at http://ir.cedarfair.com. No waivers have been made or granted prior to the date of this Form 10-K/A.
Availability of Corporate Governance Documents
Our Corporate Governance Guidelines, Code of Conduct and Ethics, and charters for each of the most attended amusement parks in North America. The park features a children's area that has been consistently named onecommittees of the "Best Kids' AreaBoard are available on our Investor Relations website at http://ir.cedarfair.com. A printed copy of each of these documents is available, without charge, by sending a written request to: Cedar Fair L.P., One Cedar Point Drive, Sandusky, Ohio 44870-5259, Attention: Investor Relations, or by sending an email to investing@cedarfair.com.
Unit Ownership Guidelines
The Board maintains unit ownership guidelines for our Chief Executive Officer and his direct reports. The Chief Executive Officer is required to hold units having a value of at least four times his base salary, and his direct reports are required to hold units with a value of at least two times their base salaries. Furthermore, the Chief Executive Officer and his direct reports are not permitted to sell any units until (1) he or she has met the unit ownership guidelines, and (2) the sale would not result in his or her ownership falling below the unit ownership guidelines. The Chief Executive Officer's direct reports currently include the Chief Operating Officer, the Executive Vice President and Chief Financial Officer, the Executive Vice President and Chief Legal Officer and Corporate Secretary, and the Senior Vice President, Corporate Strategy. Executives have five years from becoming an executive officer to gain compliance with the guidelines. The Board reviews compliance with the guidelines annually. As of April 19, 2024, the Chief Executive Officer and his direct reports were all in compliance with the guidelines. Units held directly or beneficially owned, units held in benefit plans (e.g., in 401(k) accounts), performance units (as if earned at 100% of target), vested and unvested restricted units and phantom units will be counted for purposes of determining compliance with the unit ownership guidelines.
The Board also maintains unit ownership guidelines for the directors. The guidelines require directors (excluding the Chief Executive Officer) to accumulate units equal to at least five times the annual cash retainer within five years of becoming a director. Furthermore, directors are not permitted to sell any units until (1) he or she has met the unit ownership guidelines, and (2) the sale would not result in his or her ownership falling below the unit ownership guidelines. The Chief Executive Officer is required to maintain ownership consistent with the executive requirements. As of April 19, 2024, all directors were in compliance with the guidelines or are expected to meet the guidelines in the World"prescribed time frame.
Anti-Hedging Policy
Certain forms of hedging or monetization transactions, such as zero-cost collars and forward sale contracts, allow a director, officer or employee to lock in much of the value of his or her unit holdings, often in exchange for all or part of the potential for upside appreciation in the unit. These transactions allow the director, officer or employee to continue to own the covered securities, but without the full risks and rewards of ownership. When that occurs, the director, officer or employee may no longer have the same objectives as the Company's other unitholders. Therefore, directors, officers, and employees are prohibited from engaging in any such transaction.
Delinquent Section 16(a) Reports
Section 16(a) of the Exchange Act requires our directors and executive officers, and persons who own more than 10% of our common shares, to file with the SEC reports of ownership of our securities on Form 3 and changes in reported ownership on Form 4 or Form 5, as applicable. Such directors, executive officers and greater than 10% unitholders are also required by SEC rules to furnish us with copies of all Section 16(a) forms filed.
Based solely upon a review of the reports furnished to us, or written representations from reporting persons that all other reportable transactions were reported, we believe that during the year ended December 31, 2023, our directors, executive officers and greater than 10% unitholders timely filed all reports they were required to file under Section 16(a).
ITEM 11. EXECUTIVE COMPENSATION.
Compensation Discussion and Analysis
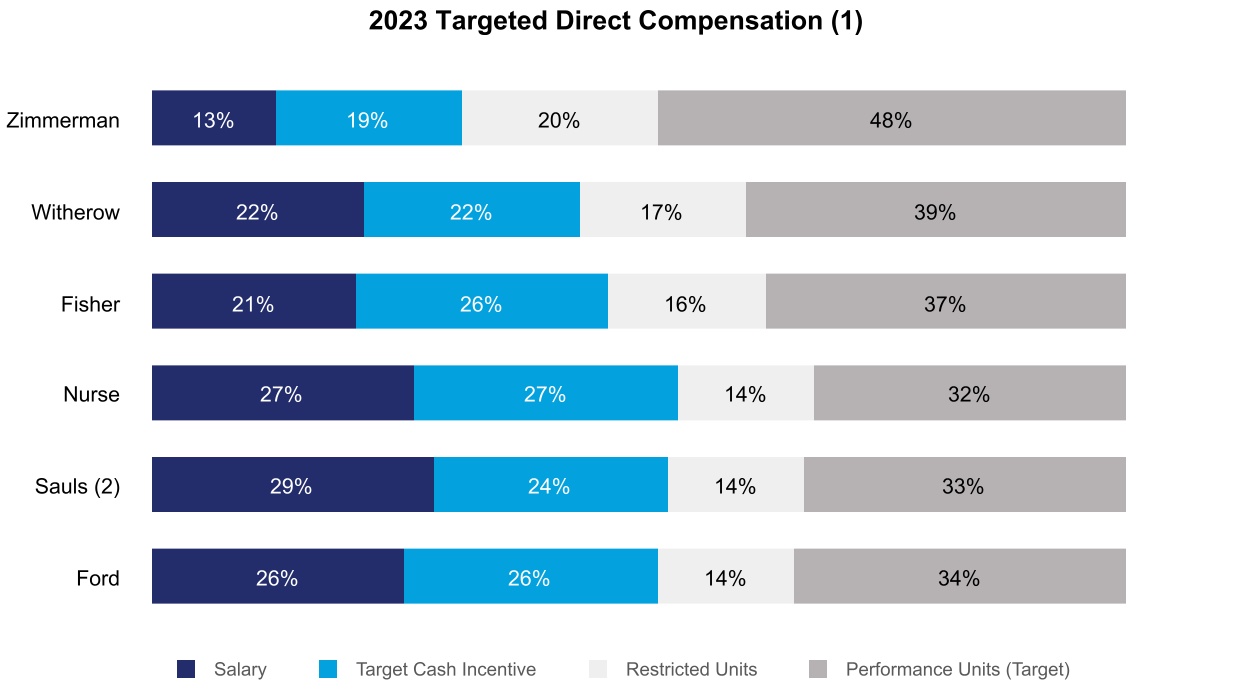
This Compensation Discussion and Analysis describes our compensation philosophy and objectives, the material elements of our named executive officer compensation, and how and why we have arrived at specific compensation policies and decisions. Following the summary is a detailed discussion of the compensation awarded to, earned by, and/or paid to the following individuals, who were the named executive officers for 2023:
•Amusement Today. The park's market area includes Cincinnati, DaytonRichard A. Zimmerman, President and Columbus, Ohio; Louisville and Lexington, Kentucky; and Indianapolis, Indiana.Chief Executive Officer;
Carowinds•Tim V. Fisher, Chief Operating Officer;
Carowinds,•Brian M. Nurse, Executive Vice President, Chief Legal Officer and Corporate Secretary;
•Monica R. Sauls, Senior Vice President and Chief Human Resources Officer; and
•Kelley S. Ford, Former Executive Vice President and Chief Marketing Officer.
This information should be read in conjunction with the compensation tables, related narratives, and notes contained later in this Form 10-K/A.
SUMMARY
Overview
Cedar Fair has a combination amusementlong-standing track record of creating value for our unitholders. We believe our compensation program design supports our continued delivery of results and water park located in Charlotte, North Carolina, first opened in 1973incentivizes the high-performing executive team. Our 2023 approach:
•Continued to emphasize performance-based compensation;
•Maintained a straightforward design, consistent with our overall compensation philosophy and was acquired by the Partnership in 2006. Carowinds' major markets include Charlotte, Greensboro, and Raleigh, North Carolina;objectives as well as Greenvillealigned with unitholder value creation; and Columbia, South Carolina. The park also features Camp Wilderness Resort, an upscale campground,
•Continued to reflect our desire to attract and retain critical talent and incentivize our team to further optimize and drive business results in direct alignment with our unitholders’ interests and long-term value creation.
We had a strong operating year despite unusually inclement weather, particularly at our California parks, that impacted our results during the first quarter of 2023. This resulted in reduced attendance and lower season pass sales as compared to 2022. We reassessed our pricing strategy and cost savings initiatives and implemented changes during the last six months of 2023. Our efforts led to stronger results during the second half of 2023 and a SpringHill Suitesmeaningful increase in season-long product sales for the 2024 operating season. We progressed against our capital allocation priorities, including strengthening our balance sheet, accelerating the return of capital to our unitholders, and reinvesting in growth opportunities. In November 2023, we entered into a definitive merger agreement to combine with Six Flags Entertainment Corporation ("Six Flags") (such agreement, the "merger agreement" and the merger transactions contemplated thereby, the "merger"). The closing of the merger is subject to receipt of regulatory approvals and satisfaction of other customary closing conditions.
We set challenging targets for 2023 in both our cash and equity incentive programs. This resulted in 91.7% achievement of the annual financial target and a resulting payout of 39.7%-43.1% of target for our 2023 cash incentive awards. 2023 was also the first year for which performance against the goals was measured under our 2021-2025 performance units. The 2021-2025 performance unit awards have three components: (1) functional currency Adjusted EBITDA goals (up to 200% of the target units); (2) net leverage ratio reduction goals (a potential additional 50% of the target units); and (3) un-levered pre-tax free cash flow goals (a potential additional 50% of the target units). As to (1), we achieved 97.3% of the functional currency Adjusted EBITDA goal for 2023, resulting in payouts of 80% on that component of the 2021-2025 performance unit awards. As to (2), we achieved our net leverage ratio reduction goal for 2023, which will result in full payouts of that component of the awards in March 2025, subject to continuous employment requirements. As to (3), we did not achieve our un-levered pre-tax free cash flow target for 2023. The 2021-2025 performance award program provides additional opportunities to earn the remaining potential units for the functional currency Adjusted EBITDA and un-levered pre-tax free cash flow components of the award, based on targets for 2024 and, if applicable, 2025.
Compensation Philosophy and Objectives
Our executive compensation program is designed to: (1) incentivize our key employees to drive superior results; (2) give key employees a proprietary and vested interest in our growth and performance; and (3) enhance our ability to attract, retain and motivate exceptional leaders upon whom, in large measure, our sustained growth, progress, and profitability depend. We believe our executive compensation program should be directly tied to board-approved annual and long-range plans that align with unitholder interests. Our program is designed to directly tie compensation to Company performance and to reward individual
performance. Our incentive awards directly tie to Company achievement of Adjusted EBITDA and un-levered pre-tax free cash flow goals. Adjusted EBITDA represents earnings before interest, taxes, depreciation, amortization, other non-cash items, and adjustments as defined in our credit agreement. We use Adjusted EBITDA as a key performance measure because it closely tracks core operating performance across park operating units. Further, Adjusted EBITDA is widely used by Marriott hotel located adjacentanalysts, investors, direct industry peers, and other comparable companies to evaluate operating performance. We also use un-levered pre-tax free cash flow goals, which we have viewed to be an effective measure for our long-term awards in light of our post-pandemic strategic focus on strengthening the park entrance. balance sheet and execution of a more dimensionalized capital allocation strategy that balances growth, deleveraging, distribution and return of capital to our unitholders.
Our unitholder-approved incentive plan allows us to provide a mix of compensation that drives our management team to achieve strong annual results and to deliver long-term value for all unitholders. Our compensation structure provides us with flexibility to evolve our compensation program from year to year as our business, the market, or the industry requires while remaining true to our overall compensation philosophy and long-term value enhancing approach. We are focused on taking the appropriate actions when they are necessary. We have used this flexibility over the years to respond to external impacts, including the impact of COVID-19 in previous years, consistent with our ongoing priority of aligning executive compensation and unitholder interests, while ensuring we attract and retain key talent and incenting them to make decisions that drive long-term unitholder value. We emphasize protecting the health and safety of our guests and associates, enhancing liquidity, and using metrics that are resilient to business disruptions.
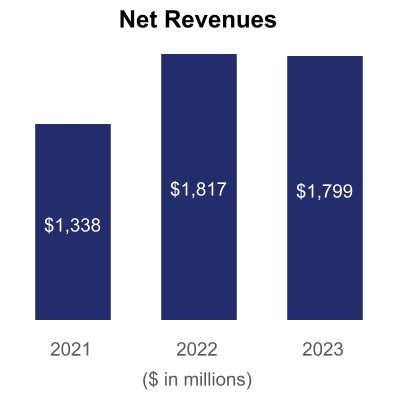
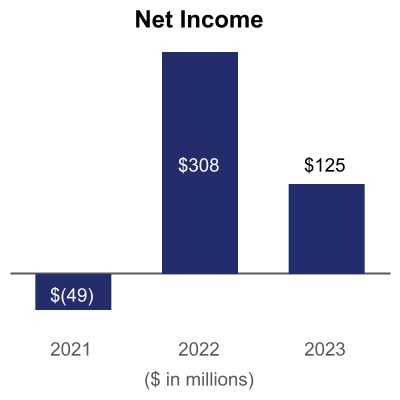
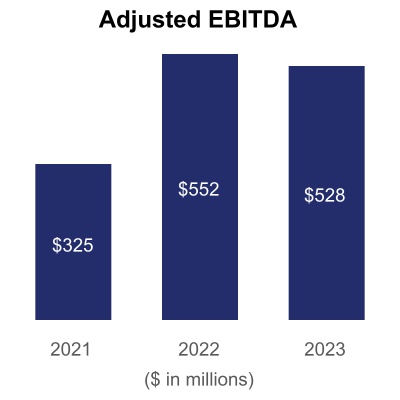
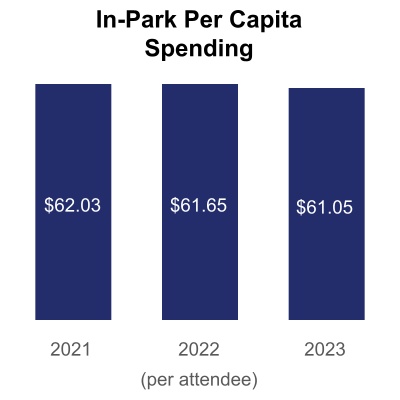
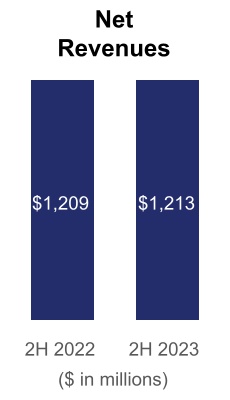
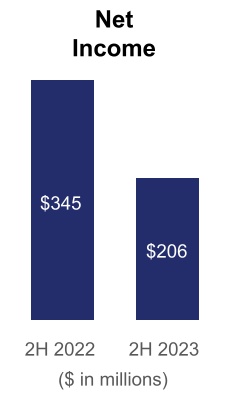
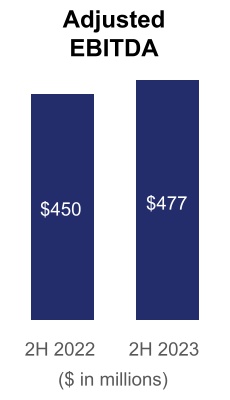
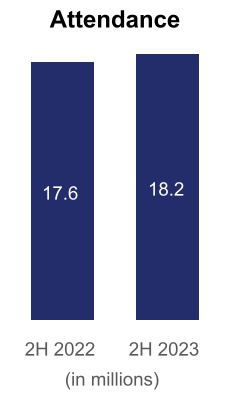
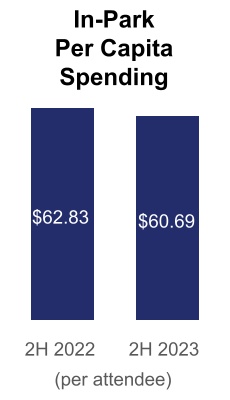
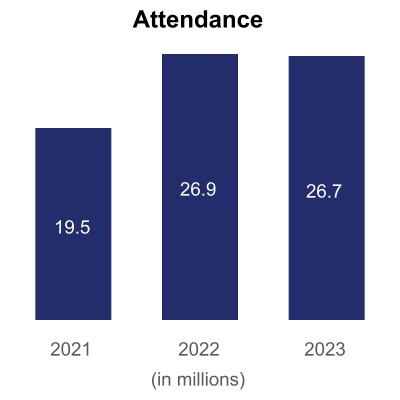
Company Performance During 2023
The SpringHill Suites is a Marriott franchise operated by Cedar Fair.graphs below illustrate some of our key performance metrics for each of the last three fiscal years. The hotel is open year-round and features suites, an outdoor pool, fitness center and bar.
Kings Dominion
Kings Dominion, a combination amusement and water park located near Richmond, Virginia, first opened in 1975 and2021 period was acquiredsignificantly disrupted by the PartnershipCOVID-19 pandemic.
In 2023, we achieved net revenues of $1.8 billion, net income of $125 million, and Adjusted EBITDA of $528 million. Net income in 2006. The park's market area includes Richmond and Norfolk, Virginia; Raleigh, North Carolina; Baltimore, Maryland and Washington, D.C. Additionally, the park offers Kings Dominion Camp Wilderness Campground, an upscale campground.
California's Great America
California's Great America,2022 included a combination amusement and water park located in Santa Clara, California, first opened in 1976 and was acquired by the Partnership in 2006. The park draws its visitors primarily from San Jose, San Francisco, Sacramento, Modesto and Monterey, among other cities in northern California. On June 27, 2022, we sold$155 million gain on sale of the land at California's Great America. Concurrently with the sale, we entered into a lease contract that allows us to operate the park during a six-year term, and we have an option to extendthrough the term for an additional five years. The lease is subject to early termination by the buyer with at least two years' prior notice.
Dorney Park
Dorney Park, a combination amusement and water park located in Allentown, Pennsylvania, was first developed as a summer resort area in 1884 and was acquired by the Partnership in 1992. Dorney Park's major markets include Philadelphia, Lancaster, Harrisburg, York, Scranton, Wilkes-Barre, Hazleton and the Lehigh Valley, Pennsylvania; New York City; and New Jersey.
Worlds of Fun
Worlds of Fun, which opened in 1973 and was acquired by the Partnership in 1995, is a combination amusement and water park located in Kansas City, Missouri. Worlds of Fun serves a market area centered in Kansas City, as well as most of Missouri and portions of Kansas and Nebraska. Worlds of Fun also features Worlds of Fun Village, an upscale campground.
Valleyfair
Valleyfair, which opened in 1976 and was acquired by the Partnership's predecessor in 1978, is a combination amusement and water park located near Minneapolis-St. Paul in Shakopee, Minnesota. Valleyfair's market area is centered in Minneapolis-St. Paul, but the park also draws visitors from other areas in Minnesota and surrounding states.
Michigan's Adventure
Michigan's Adventure, which opened in 1956 as Deer Park and was acquired by the Partnership in 2001, is a combination amusement and water park located in Muskegon, Michigan. Michigan's Adventure serves a market area principally from central and western Michigan and eastern Indiana.
Schlitterbahn Waterpark & Resort New Braunfels
Schlitterbahn Waterpark & Resort New Braunfels began as a resort in 1966, was introduced as a water park in 1979 and was acquired by the Partnership in 2019. The park is consistently rated the best water park in the industry by Amusement Today's international survey and is one of the most attended water parks in North America. The park, located in New Braunfels, Texas, features many river rides, water slides and attractions along the Comal River. The Resort at Schlitterbahn New Braunfels includes hotel rooms, suites, cabins, luxury suites and vacation homes. Schlitterbahn Waterpark & Resort New Braunfels’ major markets include San Antonio, Austin and Houston, Texas.
Schlitterbahn Waterpark Galveston
Schlitterbahn Waterpark Galveston opened in 2006 and was acquired by the Partnership in 2019. The park is one of the most attended water parks in North America. The park, located in Galveston, Texas, features many water attractions including an award-winning water coaster and a one-mile long river system. Schlitterbahn Waterpark Galveston serves a market area centered in Houston, Texas, as well as the tourism population in Galveston Island, Texas, a barrier island on the Texas Gulf Coast.
CAPITAL EXPENDITURES
We believe that annual park attendance is influenced by annual investments in our properties, including new attractions and infrastructure, among other factors. Capital expenditures are planned on a seasonal basis with most expenditures made prior to the beginning of the peak2027 operating season. Capital expenditures made
Attendance in a calendar year may differ materially2023 totaled 26.7 million, decreasing 247,000 visits, or less than 1%, from amounts identified with a particular operating season because of timing considerations such as weather conditions, site preparation requirements and availability of ride components, which may result in accelerated or delayed expenditures around calendar year-end. Due to the effects of the COVID-19 pandemic, some capital expenditures were suspended in 2020 and 2021 in order to maintain flexibility and retain liquidity.
COMPETITION
We compete for discretionary spending with all aspects of the recreation industry within our primary market areas, including other destination and regional amusement parks. We also compete with other forms of entertainment and recreational activities, including movies, sports events, restaurants and vacation travel.
The principal competitive factors in the amusement park industry include the uniqueness and perceived quality of the rides and attractions in a particular park, proximity to metropolitan areas, the atmosphere and cleanliness of the park, and the quality and variety of the food and immersive entertainment available. We believe that our parks feature a variety of high-quality rides and attractions, restaurants, gift shops and family atmosphere to make them highly competitive with other parks and forms of entertainment.
GOVERNMENT REGULATION
Our operations are subject to regulatory requirements, such as those relating to employment practices, environmental requirements, and other regulatory matters. We are subject to extensive federal and state employment laws and regulations, including wage and hour laws and other pay practices and employee record-keeping requirements. We may be required to incur costs to comply with these requirements, and the costs of compliance, investigation, remediation, litigation, and resolution of regulatory matters could be substantial.
We also are subject to federal, state and local environmental laws and regulations such as those relating to water resources; discharges to air, water and land; the handling and disposal of solid and hazardous waste; and the cleanup of properties affected by regulated materials. Under these laws and regulations, we may be required to investigate and clean up hazardous or toxic substances or chemical releases from current or formerly owned or operated facilities or to mitigate potential environmental risks. Environmental laws typically impose cleanup responsibility and liability without regard to whether the relevant entity knew of or caused the presence of the contaminants. The costs of investigation, remediation or removal of regulated materials may be substantial, and the presence of those substances, or the failure to remediate a property properly, may impair our ability to use, transfer or obtain financing with respect to our property.
Currently, we believe we are in substantial compliance with applicable requirements under these laws and regulations. However, such requirements have generally become stricter over time, and there can be no assurance that new requirements, changes in enforcement policies or newly discovered conditions relating to our properties or operations will not require significant expenditures in the future.
All rides are inspected daily by both our maintenance and ride operations personnel before being placed into operation for our guests. The parks are also periodically inspected by our insurance carrier and, at all parks except Valleyfair, Worlds of Fun, Schlitterbahn Waterpark New Braunfels, Schlitterbahn Waterpark Galveston and Carowinds' South Carolina rides, by state or county ride-safety inspectors. Valleyfair, Worlds of Fun, Schlitterbahn Waterpark New Braunfels, Schlitterbahn Waterpark Galveston and Carowinds each contract with a third party to inspect our rides pursuant to Minnesota, Missouri, Texas and South Carolina law, respectively, and submit the third-party report to the respective state agency. Additionally, all parks have added ride maintenance and operation inspections completed by third party qualified inspectors to make sure our standards are being maintained.
HUMAN CAPITAL
We employ approximately 4,400 full-time employees and employed approximately 48,800 seasonal and part-time employees in 2022, many of whom are high school and college students. We house some of our seasonal employees in dormitories owned by us at Cedar Point, Kings Island, Carowinds, Kings Dominion and Valleyfair, or rented by us at Dorney Park, Worlds of Fun, Schlitterbahn Waterpark New Braunfels and Schlitterbahn Waterpark Galveston. Approximately 260 of our employees are represented by labor unions. We believe we maintain good relations with our employees.
Our employee guidelines and policies are founded on our cornerstones of safety, service and cleanliness and our core values of integrity, courtesy and inclusiveness. Our highest priority continues to be the safety and well-being of our guests and employees. We continue to monitor developments of the COVID-19 pandemic, as well as federal, state and local guidelines, and update our safety protocols based on the most recent recommendations and requirements. We are committed to equal opportunity employment and prohibit harassment or discrimination of any kind. We have adopted an open door policy to encourage an honest employer-associate relationship, which includes a confidential hotline available to all employees. As part of our commitment to our core values, we created a diversity, equity and inclusion ("DE&I") council and provided DE&I training to our employees in 2021. In 2022, we published our first Environmental, Social and Governance ("ESG") Strategy Report to establish an enterprise-wide framework to address ESG issues. The framework includes the prioritization of five key strategic pillars: Safety, Associate Happiness, Community, Environment, and Operations and Governance. The report included the introduction of the Associate Happiness Model, focusing on DE&I, and the Cedar Fair Safety Model, focusing on the safety of our employees and guests.
We maintain training programs for new employees, including safety training specific to job responsibilities. We participate in the J-1 Visa program providing cultural and educational exchange opportunities for our associates. We also have partnered with Bowling Green State University to create the Cedar Fair Resort and Attraction Management program, a bachelor's degree program, which is housed in downtown Sandusky, Ohio in a facility jointly owned by the Partnership and a third party developer. The bachelor's degree program prepares students for management careers at Cedar Fair parks or a similar establishment. We encourage a promote-from-within policy.
Our executive compensation program is designed to incentivize our key employees to drive superior results, to give key employees a vested interest in our growth and performance, and to enhance our ability to attract and retain exceptional managerial talent. Our executive compensation program rewards both successful individual performance and the consolidated operating results of the Partnership by directly tying compensation to our performance.
AVAILABLE INFORMATION
Copies of our annual report on Form 10-K, quarterly reports on Form 10-Q, and current reports on Form 8-K and all amendments to those reports as filed or furnished with the SEC are available without charge upon written request to our Investor Relations Office or through our website (www.ir.cedarfair.com).
We use our website www.ir.cedarfair.com as a channel of distribution of information. The information we post through this channel may be deemed material. Accordingly, investors should monitor this channel, in addition to following our news releases, SEC filings, and public conference calls and webcasts. The contents of our website, including without limitation the ESG Strategy Report referenced above, shall not be deemed to be incorporated herein by reference.
The SEC maintains an Internet site at http://www.sec.gov that contains our reports, proxy statements and other information.
SUPPLEMENTAL ITEM. Information about our Executive Officers
| | | | | | | | | | | | | | |
Name | | Age | | Position(s) |
| | | | |
Richard A. Zimmerman | | 62 | | | Richard Zimmerman has been President and Chief Executive Officer since January 2018 and a member of the Board of Directors since April 2019. Prior to becoming CEO, he served as President and Chief Operating Officer from October 2016 through December 2017 and served as Chief Operating Officer from 2011 through 2016. Prior to that, he was appointed as Executive Vice President in 2010 and as Regional Vice President in 2007. He has been with Cedar Fair since 2006, when Kings Dominion was acquired. Richard served as Vice President and General Manager of Kings Dominion from 1998 through 2006. |
Brian C. Witherow | | 56 | | | Brian Witherow has served as Executive Vice President and Chief Financial Officer since 2012. Prior to that, he served as Vice President and Corporate Controller beginning in 2005. Brian has been with Cedar Fair in various other positions since 1995. |
Tim V. Fisher | | 62 | | | Tim Fisher joined Cedar Fair as Chief Operating Officer in December 2017. Prior to joining Cedar Fair, he served as Chief Executive Officer of Village Roadshow Theme Parks International, an Australian-based theme park operator, since March 2017. Prior to this appointment with Village Roadshow Theme Parks International, Tim served as Chief Executive Officer of Village Roadshow Theme Parks since 2009. |
Brian M. Nurse | | 51 | | | Brian Nurse joined Cedar Fair as Executive Vice President, Chief Legal Officer and Secretary in November 2021. Prior to joining Cedar Fair, he served as Senior Vice President, General Counsel and Secretary for World Wrestling Entertainment, Inc. ("WWE"), an integrated media and entertainment company, from September 2018 to November 2020. Prior to joining WWE, Brian served as Vice President, Associate General Counsel and Secretary at Nestle Waters North America, Inc., a former division of Nestle S.A. which is a multinational food and drink corporation, from 2012 to 2018. Prior to that, he was Senior Legal Counsel for North American beverage/soft drink brands at PepsiCo, Inc., a multinational food, snack and beverage corporation, from 2003 to 2012. |
Kelley S. Ford | | 58 | | | Kelley Ford has served as Executive Vice President and Chief Marketing Officer since 2012. Prior to joining Cedar Fair, she served as Senior Vice President, Marketing Planning Director for TD Bank from 2010 through 2012. Prior to joining TD Bank, Kelley served as Senior Vice President of Brand Strategy and Management at Bank of America from 2005 through 2010. |
David R. Hoffman | | 54 | | | Dave Hoffman has served as Senior Vice President and Chief Accounting Officer since 2012. Prior to that, he served as Vice President of Finance and Corporate Tax since 2010. He served as Vice President of Corporate Tax from 2006 through 2010. Prior to joining Cedar Fair, Dave served as a business advisor with Ernst & Young from 2002 through 2006. |
Charles E. Myers | | 59 | | | Charles Myers joined Cedar Fair as Senior Vice President, Creative Development in June 2019. Prior to joining Cedar Fair, he held a variety of Senior Leadership roles including Show Design, Production Management and Producing at Walt Disney Imagineering, the research and development arm of the Walt Disney Company, from 2013 to June 2019. Prior to this, he served as Senior Vice President, Licensing, Project Development & Business Development of Paramount Pictures from 2002 to 2013. |
ITEM 1A. RISK FACTORS.
Risks Related to the Amusement Park Industry
Instability in economic conditions could impact our business, including our results of operations and financial condition.
Uncertain or deteriorating economic conditions, including during inflationary and recessionary periods, may adversely impact attendance figures and guest spending patterns at our parks as uncertain economic conditions affect our guests' levels of discretionary spending. Both attendance and in-park spending at our parks are key drivers of our revenues and profitability, and reductions in either can directly and negatively affect revenues and profitability. A decrease in discretionary spending due to a decline in consumer confidence in the economy, an economic slowdown or deterioration in the economy could adversely affect the frequency with which our guests choose to attend our parks and the amount that our guests spend on our products when they visit.
Periods of inflation or economic downturn could also impact our ability to obtain supplies and services and increase our operating costs. We continue to see some inflationary effects and supply chain disruptions on our business, which may continue or worsen. In addition, the existence of unfavorable general economic conditions may also hinder the ability of those with which we do business, including vendors, concessionaires and customers, to satisfy their obligations to us. The materialization of these risks could lead to a decrease in our revenues, operating income and cash flows.
The COVID-19 pandemic has adversely impacted our business and may continue to adversely impact our business, as well as intensify certain risks we face, for an unknown length of time.
Since 2020, the COVID-19 pandemic has had a material negative impact on our business. On March 14, 2020, we closed our properties in response to federal and local recommendations and restrictions to mitigate the spread of COVID-19. We were ultimately able to resume partial operations, subject to capacity, social distancing mandates and other governmental restrictions, at 10 of our 13 properties on a staggered basis in 2020. We operated all of our properties in 2021. However, 2021 operating seasons were delayed and certain restrictions remained in place at some of our properties. Each of our properties opened for the 2022 operating season as planned and without restrictions.
Consumer behavior and preferences changed in response to the effects of the COVID-19 pandemic and may remain changed both in the short term and long term, including impacts on discretionary consumer spending due to significant economic uncertainty and changing risk tolerances of our employees and guests regarding health matters. In 2020, we experienced lower demand upon reopening our properties resulting in a material decrease in revenues generated. In 2021 and 2022, attendance improved, but we experienced lower demand at certain times and at certain properties. Future significant volatility or reductions in demand for, or interest in, our parks could materially adversely impact attendance, in-park2022. In-park per capita spending and revenue. In addition, we could experience damagein 2023 declined $0.60, or 1%, from 2022. Out-of-park revenues reached a new high in 2023, increasing $10 million, or 5%, compared to our brand and reputation due to actual or perceived health risks associated with our parks or the amusement park industry which could have a similar material adverse effect on attendance, in-park per capita spending and revenue. We may also continue to experience operational risks due to the COVID-19 pandemic, including limitations on our ability to recruit and train employees in sufficient numbers to fully staff our parks as a result of changing risk tolerances.2022.
Because our amusement and water parks are the primary sources of net income and operating cash flows, any future mandated or voluntary closures or other operating restrictions would adversely impact our business and financial results. Our parks are geographically located throughout the United States and in Canada. The duration and severity of the COVID-19 pandemic and the related restrictions at any one location could result in a potentially disproportionate amount of risk if concentrated amongst our largest properties.
We have not previously experienced the level of disruption caused by the COVID-19 pandemic. It is difficult for management to estimate future performance under these conditions, and the ultimate impact of the COVID-19 pandemic on our business, results of operations and financial condition cannot be reasonably predicted.
The high fixed cost structure of amusement park operations can result in significantly lower margins, profitability and cash flows if attendance levels do not meet expectations.
A large portion of our expense is relatively fixed because the costs for full-time employees, maintenance, utilities, advertising and insurance do not vary significantly with attendance. These fixed costs may increase and may not be able to be reduced at a rate proportional with ongoing attendance levels. If cost-cutting efforts are insufficient or are impractical, we could experience a material decline in margins, profitability and cash flows. Such effects can be especially pronounced during periods of economic contraction or slow economic growth.
Bad or extreme weather conditions can adversely impact attendance at our parks, which in turn would reduce our revenues.
Because most of the attractions at our parks are outdoors, attendance at our parks can be adversely affected by continuous bad or extreme weather and by forecasts of bad or mixed weather conditions, which would negatively affect our revenues. We believe that our ownership of many parks in different geographic locations reduces, but does not completely eliminate, the effect that adverse weather can have on our consolidated results.
Our insurance coverage may not be adequate to cover all possible losses that we could suffer, and our insurance costs may increase.
Although we carry liability insurance to cover possible incidents, there can be no assurance that our coverage will be adequate to cover liabilities, that we will be able to obtain coverage at commercially reasonable rates, or that we will be able to obtain adequate coverage should a catastrophic incident occur at our parks or at other parks. Companies engaged in the amusement park business may be sued for substantial damages in the event of an actual or alleged incident. An incident occurring at our parks or at competing parks could reduce attendance, increase insurance premiums, and negatively impact our operating results.
Unanticipated construction delays in completing capital improvement projects in our parks and resort facilities, significant ride downtime, or other unplanned park closures could adversely affect our revenues.
A principal competitive factor for an amusement park is the uniqueness and perceived quality of its rides and attractions in a particular market area. Accordingly, the regular addition of new rides and attractions is important, and a key element of our revenue growth is strategic capital spending on new rides and attractions. Any construction delays could adversely affect our attendance and our ability to realize revenue growth. Further, when rides, attractions, or an entire park, have unplanned downtime and/or closures, our revenue could be adversely affected.
There is a risk of accidents or other incidents occurring at amusement and water parks, which may reduce attendance and negatively impact our revenues.
The safety of our guests and employees is one of our top priorities. Our amusement and water parks feature thrill rides. There are inherent risks involved with these attractions, and an accident or a serious injury at any of our parks could result in negative publicity and could reduce attendance and result in decreased revenues. In addition, accidents or injuries at parks operated by our competitors could influence the general attitudes of amusement park patrons and adversely affect attendance at our parks. Other types of incidents such as food borne illnesses and disruptive, negative guest behavior which have either been alleged or proved to be attributable to our parks or our competitors could adversely affect attendance and revenues.
Extended disruptions to our technology platforms may adversely impact our sales and revenues.
A large portion of our sales are processed online and utilize third party technology platforms. Our increased dependence on these technology platforms may adversely impact our sales, and therefore our revenues, if key systems are disrupted for an extended period of time.
Risks Related to Our Strategy
Our growth strategy may not achieve the anticipated results.
Our future success will depend on our ability to grow our business, including fully recovering from the effects of the COVID-19 pandemic. We grow our business through acquisitions and capital investments to improve our parks through new rides and attractions, as well as in-park product offerings and product offerings outside of our parks. Our growth and innovation strategies require significant commitments of management resources and our investments may not grow our revenues at the rate we expect or at all. As a result, we may not be able to recover the costs incurred in developing new projects and initiatives, or to realize their intended or projected benefits, which could have a material adverse effect on our business, financial condition or results of operations.
We compete for discretionary spending and discretionary free time with many other entertainment alternatives and are subject to factors that generally affect the recreation and leisure industry, including general economic conditions.
Our parks compete for discretionary spending and discretionary free time with other amusement, water and theme parks and with other types of recreational activities and forms of entertainment, including movies, sporting events, restaurants and vacation travel. Our business is also subject to factors that generally affect the recreation and leisure industries and are not within our control. Such factors include, but are not limited to, general economic conditions, including relative fuel prices, and changes in consumer tastes and spending habits. There may be a material adverse effect on our business, financial condition or results of operations if we are unable to effectively compete with other entertainment alternatives.
The operating seasonOur 2023 results were impacted by unusually inclement weather, particularly at most of our California parks, is of limited duration, which can magnify the impact of adverse conditions or events occurring within that operating season.
Twelve of our properties are seasonal and are generally open daily from Memorial Day through Labor Day. Outside of daily operations, our seasonal properties are typically open during select weekends, including at most properties in the fourth quarter for Halloween and winter events. As a result, a substantial portion of our revenues from these seasonal parks are generated from Memorial Day through Labor Day with the major portion concentrated during the peak vacationfirst quarter of 2023. This resulted in reduced attendance and lower season pass sales as compared to 2022. We reassessed our pricing strategy and cost savings initiatives and implemented changes during the last six months of July and August. Consequently, when adverse conditions or events occur2023. Our efforts led to stronger results during the operating season, particularly during the peak vacation monthssecond half of July2023, including expanded margins and August or the important fall season, there is only a limited period of time during which the impact of those conditions or events can be mitigated. Accordingly, the timing of such conditions or events may have a disproportionate adverse effect upon our revenues.
Risks Related to Human Capital
Increased costs of labor and employee health and welfare benefits may impact our results of operations.
Labor is a primary component in the cost of operating our business. Increased labor costs, due to competition, inflationary pressures, increased federal, state or local minimum wage requirements, and increased employee benefit costs, including health care costs, could adversely impact our operating expenses. Over the past two to three years, we experienced a meaningful increase in seasonal labor rate in orderseason-long product sales for the 2024 operating season. The graphs below illustrate some our key performance metrics for the second half of 2023 as compared to recruit employees in a challenging labor market. Continued increases to both market wage ratesthe second half of 2022. Our 2023 and the statutory minimum wage rates could also materially impact our future seasonal labor rates. It is possible that these changes could significantly increase our labor costs, which would adversely affect our operating2022 results and cash flows.
Our business depends on our ability to meet our workforce needs.
Our success depends on our ability to attract, motivate and retain qualified employees to keep pacewere not comparable with our needs. If2021 results due to the effects of the COVID-19 pandemic.
For additional information regarding attendance, in-park per capita spending, out of park revenues, and Adjusted EBITDA, including how we are unable to do so, our resultsdefine and use those measures and a reconciliation of operationsAdjusted EBITDA from net income, see Item 7. Management’s Discussion and cash flows may be adversely affected. We employAnalysis of Financial Condition and Results of Operations on pages 18-24 of the Original Form 10-K. For a significant workforce each season. We recruit year-round to fill thousandsreconciliation of staffing positions to ensure the appropriate workforce is in place at the right time. There is no assurance that we will be able to recruitin-park and hire adequate personnel as the business requires or that we will not experience material increases in the cost of securing our workforce in the future.
If we lose key personnel, our business may be adversely affected.
Our success depends in part upon a number of key employees, including our senior management team, whose members have been involved in the leisure and hospitality industries for an average of more than 20 years. The loss of services of our key employees or our inability to replace our key employees could cause disruption in important operational, financial and strategic functions and have a material adverse effect on our business.
Risks Related to Our Capital Structure
The amount of our indebtedness could adversely affect our ability to raise additional capital to fund our operations, limit our ability to react to changes in the economy or our industry and prevent us from fulfilling our obligations under our debt agreements.
We had $2.3 billion of outstanding indebtedness as of December 31, 2022 (before reduction of debt issuance costs).
The amount of our indebtedness could have important consequences. For example, it could:
•limit our ability to borrow money for our working capital, capital expenditures, debt service requirements, strategic initiatives or other purposes;
•limit our flexibility in planning or reacting to changes in business and future business operations; and
In addition, we may not be able to generate sufficient cash flow from operations, or be able to draw under our revolving credit facility or otherwise, in an amount sufficient to fund our liquidity needs, including the payment of principal and interest on our debt obligations. If ourThese results, strong cash flows, and capital resources are insufficient to service our indebtedness, we may be forced to reduce or delay capital expenditures, suspend partnership distributions, sell assets, seek additional capital or restructure or refinance our indebtedness. These alternative measures may not be successful and may not permitthe prior year sale-leaseback of the land at California's Great America allowed us to meetprogress against our scheduled debt service obligations. Our ability to restructure or refinance our debt in the future will depend on the conditioncapital allocation priorities coming out of the COVID-19 pandemic, including accelerating the return of capital to investors, strengthening the balance sheet, and credit marketsreinvesting in growth opportunities. Recent achievements and our financial condition at such time. Any refinancing of our debt could be at higher interest rates and may require us to comply with more onerous covenants, which could further restrict our business operations. In addition,current initiatives include the terms of our existing or future debt agreements, including our credit agreement and the indentures governing our notes, may restrict us from adopting some of these alternatives. In the absence of sufficient operating results and resources, we could face substantial liquidity problems and might be required to dispose of material assets or operations to meet our debt service and other obligations. We may not be able to consummate those dispositions for fair market value or at all. Furthermore, any proceeds that we could realize from any such dispositions may not be adequate to meet our debt service obligations then due.following:
| | | | | | | | |
| Accelerating Return to Investors | Strengthening the Balance Sheet | Reinvesting in Growth Opportunities |
l Reinstated quarterly distributions, paying $1.20 per LP unit in 2023 and $0.60 per LP unit in 2022 following a suspension of distributions in March 2020 | l Redeemed $450 million of senior notes in the fourth quarter of 2021
| l Invested over $400 million in capital expenditures from 2022-2023, including new themed sections of our parks, new roller coasters, new food and beverage facilities, major events (including multiple milestone anniversaries), and the renovations of three hotel properties
|
l Sold the land at California's Great America in 2022 for $310 million and executed related leaseback
|
l Authorized two $250 million unit repurchase programs:
•repurchasing 4.5 million units for an aggregate amount of $187 million in 2022; and
•repurchasing 1.7 million units for an aggregate amount of $74.5 million in 2023 | l Repaid remaining term loan facility of $264 million in 2022 | l Plan to invest $210-$220 million in capital expenditures in 2024, including new roller coasters, such as a world-class roller coaster at Cedar Point, and other rides and attractions, including upgraded food and beverage facilities |
l Achieved our net leverage goal for 2023 that we set for our 2021-2025 performance unit awards
|
l In February 2023, extended our revolver maturity to 2028, subject to restrictions on the amount of notes outstanding
| l Entered into a definitive merger agreement to combine with Six Flags in November 2023 (subject to receipt of regulatory approvals, and other customary closing conditions)
|
DespiteOur Compensation Governance Reflects Best Practices
| | | | | |
| WHAT WE DO |
| a | Our named executive officer annual and long-term incentive compensation is contingent on corporate performance to enhance alignment with our unitholders. |
| a | We have mandatory unit ownership guidelines of four times salary for our Chief Executive Officer and two times salary for his direct reports. |
| a | Cash incentive compensation is subject to clawback provisions for our Chief Executive Officer and his direct reports. |
| a | Our People, Culture & Compensation Committee (the "Compensation Committee") is comprised solely of directors who are independent under the standards of the SEC and the NYSE, including the heightened standards applicable to Compensation Committee members. |
| a | We periodically rotate the Compensation Committee chair assignment. |
| a | Our Compensation Committee has retained Semler Brossy as its independent compensation consultant to advise and report directly to the Committee. |
| a | We conduct an annual risk assessment of our compensation programs in consultation with Semler Brossy. |
| a | We offer our unitholders the opportunity to cast an advisory vote on our executive compensation every year. |
| WHAT WE DO NOT DO |
| x | We do not provide for excise tax “gross ups”. |
| x | We do not provide significant perquisites. |
| x | We do not allow hedging of our Company's securities. |
| x | We do not allow pledging of our Company's securities or holding its units in margin accounts. |
Consideration of Last Year’s Advisory Unitholder Vote on Executive Compensation
At the amount2023 Annual Meeting of Limited Partner Unitholders, approximately 92% of the unit votes cast were to approve the compensation of the Company’s named executive officers. The Compensation Committee believes that this reflects our unitholders’ overall support of our indebtedness,performance-based approach and focus on long-term value creation. Consistent with our 2022 compensation framework, the Compensation Committee maintained a strong performance orientation in the Company’s 2023 executive compensation structure. Future advisory votes on executive compensation will serve as an additional tool, along with unitholder engagement, to inform the Compensation Committee with regard to how our unitholders perceive the alignment of our compensation programs with their interests.
DETERMINING EXECUTIVE COMPENSATION
We combine the compensation elements discussed below in a manner that we may be ablebelieve will optimize each executive’s contribution to incur additional indebtedness, which could further exacerbate the risks associatedCompany. We recognize and consider many factors in assessing an individual’s total compensation potential. The range of targeted compensation varies by position and reflects the unique skills, expertise, and individual contributions of each executive. In general, we work within market-based ranges of base salary commensurate with the amountexecutive’s scope of responsibilities. We use our cash incentive and unit-based award programs to challenge the executives to achieve superior annual and long-term results for the benefit of the Company and its unitholders. Because a significant portion of this compensation is dependent on performance results, an executive’s actual total compensation can vary considerably if we have a year that exceeds, or fails to meet, expectations. We believe that this design effectively aligns our unitholders' interests with our executives and appropriately motivates our executives to achieve peak corporate performance in both the short- and long-term.
Role of the Compensation Consultant
The Compensation Committee engages an independent executive compensation consulting firm (1) to provide information and advice on competitive practices and trends in our industry, (2) to make recommendations regarding the design of our indebtedness.
compensation program, (3) to assist with the review of compensation practices and an assessment of the effectiveness of these practices, and (4) to
Our debt agreements contain restrictionsidentify and evaluate compensation elements or situations that could limit our flexibility in investing in our business, including the ability to pay partnership distributions.
Our credit agreementmay raise material risks. The compensation consultant is retained by and the indentures governing our notes contain, and any future indebtedness of ours will likely contain, a number of covenants that could impose significant financial restrictions on us, including restrictions on our and our subsidiaries' ability to, among other things:
•pay distributions on or make distributions in respect of our partnership units or make other Restricted Payments, including unit repurchases;
•incur additional debt or issue certain preferred equity;
•make certain investments;
•sell certain assets;
•create restrictions on distributions from restricted subsidiaries;
•create liens on certain assets to secure debt;
•consolidate, merge, amalgamate, sell or otherwise dispose of all or substantially all our assets;
•enter into certain transactions with our affiliates; and
•designate our subsidiaries as unrestricted subsidiaries.
Our credit agreement includes a Senior Secured Leverage Ratio of 4.50x Total First Lien Senior Secured Debt-to-Consolidated EBITDA, which will step down to 4.00x in the second quarter of 2023 and which will step down further to 3.75x in the third quarter of 2023. Following an amendment in the first quarter of 2023, this financial covenant is only required to be tested at the end of any fiscal quarter in which revolving credit facility borrowings are outstanding.
Our credit agreement and fixed rate note agreements include Restricted Payment provisions, which could limit our ability to pay partnership distributions. Pursuantreports directly to the terms of the indenture governing the 2027 senior notes, which includes the most restrictive of these Restricted Payments provisions, if our pro forma Total-Indebtedness-to-Consolidated-Cash-Flow Ratio is greater than 5.25x, we can still make Restricted Payments of $100 million annually so longCompensation Committee and regularly attends and participates in Compensation Committee meetings.
The Compensation Committee has retained Semler Brossy as no default or event of default has occurredits independent compensation consultant since 2018. Semler Brossy provides market data and is continuing. If our pro forma Total-Indebtedness-to-Consolidated-Cash-Flow Ratio is less than or equal to 5.25x, we can make Restricted Payments up to our Restricted Payment pool.
Variable rate indebtedness could subject us to the risk of higher interest rates, which could cause our future debt service obligations to increase.
Certain of our borrowings may be at variable rates of interest and expose us to interest rate risk. If interest rates increase, our annual debt service obligations on any variable-rate indebtedness would increase even though the amount borrowed remained the same, and our net income would decrease.
Risks Related to Legal, Regulatory and Compliance Matters
Cyber-security risks and the failure to maintain the integrity of internal or customer data could result in damages to our reputation and/or subject us to costs, fines or lawsuits.
In the normal course of business, we, or third parties on our behalf, collect and retain large volumes of internal and customer data, including credit card numbers and other personally identifiable information, which is used for marketing and promotional purposes, and our various information technology systems enter, process, summarize and report such data. We also maintain personally identifiable information about our employees. The integrity and protection of such data is critical to our business, and our guests and employees have a high expectation that we will adequately protect their personal information. The regulatory environment,research as well as insights on executive compensation practices and trends, and provides advice and counsel to the requirements imposed on us byCompensation Committee throughout the credit card industry, governing information, securityyear. Semler Brossy assisted with our executive compensation benchmarking update in August 2022 and privacy laws is increasingly demanding and continues to evolve. Maintaining compliance with applicable security and privacy regulations may increase our operating costs and/or adversely impact our ability to market our parks, products and services to our guests. Furthermore, if a person could circumvent our security measures, he or she could destroy or steal valuable information or disrupt our operations. Any security breach could expose us to risks of data loss,CEO compensation benchmarking update in February 2023, which could harm our reputation and result in remedial and other costs, fines or lawsuits. Although we carry liability insurance to cover this risk, there can be no assurance that our coverage will be adequate to cover liabilities, or that we will be able to obtain adequate coverage should a catastrophic incident occur.
Our operations, our workforce and our ownership of property subject us to various laws and regulatory compliance, which may create uncertainty regarding future expenditures and liabilities.
We may be required to incur costs to comply with regulatory requirements, such as those relating to employment practices, environmental requirements, and other regulatory matters, and the costs of compliance, investigation, remediation, litigation, and resolution of regulatory matters could be substantial. We may also be required to incur additional costs and commit management resources to comply with proposed regulatory requirements that may become effective in the near future, including environmental, social and governance initiatives ("ESG") which continue to be a focus for investors and other stakeholders. Any ESG initiatives entered into by us may not realize their intended or projected benefits.
Compensation Consultant Conflicts Assessment
The Compensation Committee annually assesses the independence of Semler Brossy in accordance with the Securities and Exchange Commission (“SEC”) rules and has concluded that Semler Brossy’s work for the Compensation Committee is independent and does not present any conflicts of interest. The Committee took certain factors, which it believes may affect the independence of a compensation consultant, into consideration when selecting Semler Brossy in accordance with applicable SEC rules. In particular, the Committee considered: (1) whether any other services had been or were being provided by Semler Brossy to the Company, (2) the amount of fees paid by the Company to Semler Brossy as a percent of Semler Brossy’s total revenues, (3) Semler Brossy’s policies and procedures designed to prevent conflicts, a copy of which was provided to the Committee, (4) Semler Brossy’s ownership of Company units, and (5) any business or personal relationships between Semler Brossy and any Committee members or the Company’s executive officers. Following the consideration of these factors, the Committee determined that Semler Brossy is independent.
Peer Group and Peer Group Review
Compensation information from our peer group and broader industry compensation surveys are two reference points that the Compensation Committee considers in the executive compensation decision-making process. The Compensation Committee conducts a thorough review of its established peer group annually with the assistance of Semler Brossy.
The Company only has a couple of direct industry peers that are similar to us in size and meet our other criteria. Therefore, our approach is to create a peer group that combines our direct industry peers with a broader market basket of companies, with similar characteristics, from related industries that, in total, reflects a reasonably comparable group. In establishing and updating our compensation peer group, we focus on U.S. publicly traded companies in family-oriented leisure, recreation, and entertainment, with similar business models and markets to ours and with annual revenues between approximately 0.4 to 2.5 times our revenues. We are subject to extensive federalalso review and state employment lawsreference growth profiles and regulations, including wage and hour laws and other pay practicesyields, market capitalization, and employee record-keeping requirements.counts. We periodically have hadevaluate certain qualitative factors including seasonality, entertainment focus, ownership profile, multiple sources of revenues, and meaningful capital investment. The goal is for peer group companies to meet the majority of these qualitative and may havequantitative criteria. The set of companies used in the compensation peer group is, therefore, different from the set of companies included in the S&P Movies and Entertainment Index used as the index of peer companies in our Original Form 10-K performance graph and in our pay versus performance table included in this Form 10-K/A.
Following the December 2021 review, we updated our executive compensation peer group to defend against lawsuits asserting non-compliance. Such lawsuits can be costly, time consuminginclude the companies in the following list. We re-assessed the peer group in consultation with Semler Brossy in the summer of 2022, and distract management,made no changes to the peer group. The Compensation Committee concluded this updated peer group meets its goal stated in the approach set forth in the preceding paragraph.
| | | | | | | | |
| Bally's Corporation | Dave & Buster's Entertainment, Inc. | Six Flags Entertainment Corporation |
| BJ's Restaurants, Inc. | Golden Entertainment, Inc. | The Cheesecake Factory Incorporated |
| Boyd Gaming Corporation | Party City Holdco Inc. | The Marcus Corporation |
| Choice Hotels International, Inc. | Pebblebrook Hotel Trust | Travel & Leisure |
| Churchill Downs Incorporated | Playa Hotels & Resorts N.V. | Vail Resorts, Inc. |
| Cinemark Holdings, Inc. | SeaWorld Entertainment, Inc. | Wyndham Hotels & Resorts, Inc. |
| Cracker Barrel Old Country Store, Inc. | | |
This peer group was used by Semler Brossy for both the executive compensation benchmarking study (conducted in August 2022) and adverse rulingsthe CEO compensation benchmarking study (conducted in these types of claims could negatively affect our business, financial condition or results.February 2023), utilized by the Committee in setting targeted compensation levels for 2023.
In October 2023, we removed two companies from the peer group: Churchill Downs Incorporated (based on qualitative considerations) and Party City Holdco Inc. (due to bankruptcy). We also are subjectadded two new companies to federal, statethe peer group: Hilton Grand Vacations (to add an additional company in the hotels, resorts and local environmental lawscruise lines industry) and regulations suchTopgolf Callaway (to add a company with apparel/retail focus in addition to leisure facilities).
Market Analysis
The Compensation Committee requests its compensation consultant to analyze the compensation of our executives relative to that of executives in similar positions at our peer companies as those relating to water resources; discharges to air, waterwell as survey data and land; the handling and disposal of solid and hazardous waste; and the cleanup of properties affected by regulated materials. Under these laws and regulations, we may be required to investigate and clean up hazardous or toxic substances or chemical releases from current or formerly owned or operated facilities or to mitigate potential environmental risks. Environmental laws typically impose cleanup responsibility and liability without regard to whether the relevant entity knew of or caused the presence of the contaminants. The costs of investigation, remediation or removal of regulated materials may be substantial, and the presence of those substances, or the failure to remediateprovide a property properly, may impair our ability to use, transfer or obtain financing regarding our property.
Our tax treatment is dependent on our status as a partnership for federal income tax purposes. If the tax laws were to treat us as a corporation or we become subject to a material amount of entity-level taxation, it may substantially reduce our available cash.
We are a limited partnership under Delaware law and are treated as a partnership for federal income tax purposes. A change in current tax law may cause us to be taxed as a corporation for federal income tax purposes or otherwise subject us to taxation as an entity. If we were treated as a corporation for federal income tax purposes, we would pay federal income tax on our entire taxable income at the corporate tax rate, rather than only on the taxable income from our corporate subsidiaries, and may be subject to additional state taxes at varying rates. Further, unitholder distributions would generally be taxed again as corporate distributions or dividends and no income, gains, losses, or deductions would flow through to unitholders. Because additional entity level taxes would be imposed upon us as a corporation, our available cash could be substantially reduced. Although we are not currently aware of any legislative proposal that would adversely impact our treatment as a partnership, we are unable to predict whether any changes or other proposals will ultimately be enacted.
Our status as a partnership for federal income tax purposes subjects us and our unitholders to additional tax reporting that may be costly and may increase complexity.
Because we are treated as a partnership for federal income tax purposes, we are required to annually report to the Committee from time-to-time, but not less than bi-annually. While we review this market compensation information in our unitholders certain partnership items. The nature of these items and the evolving legislation surrounding these reporting requirements may increase our unitholders' compliance cost and the cost of owning our units.
General Risk Factors
Other factors, including local events, natural disasters, pandemics and terrorist activities, or threats of these events, could adversely impact park attendance and our revenues.
Lower attendance may result from various local events, natural disasters, pandemics or terrorist activities, or threats of these events, all of which are outside of our control.
ITEM 1B. UNRESOLVED STAFF COMMENTS.
None.decision-making process,
ITEM 2.PROPERTIES.the information is one data point and the Committee exercises judgment and discretion when setting compensation levels. Our executive compensation program is more heavily weighted to performance-based compensation; and our general objective is to provide base salaries within a competitive range at or near the 50th percentile of our survey data and peer group (where available for certain positions) and to provide total direct compensation opportunities that are between the 50th and 75th percentiles of our peer group and aligned with comparable survey data, subject to other individual considerations. Other factors we consider in setting compensation include: general industry practices, general economic conditions and external factors affecting our business, recent and projected Company performance, growth and returns to unitholders, internal equity, retention and recruiting goals, transitioning of compensation in connection with leadership succession, the significant industry expertise of the team, and recent individual performance and individual performance expectations. The Committee does not rely on any single factor as a substitute for its own judgment in making compensation decisions, but instead applies its independent discretion and judgment in making compensation decisions in their entirety.
| | | | | | | | | | | | | | | | | |
| Park | | Location | Approximate Total
Acreage | Approximate Developed Acreage | Approximate Undeveloped Acreage |
Cedar Point
Cedar Point Shores | (1) | Sandusky, Ohio | 835 | | 725 | | 110 | |
Knott's Berry Farm
Knott's Soak City | | Buena Park, California | 175 | | 175 | | — | |
| Canada's Wonderland | | Vaughan, Ontario, Canada | 295 | | 295 | | — | |
| Kings Island | | Mason, Ohio | 680 | | 330 | | 350 | |
| Carowinds | | Charlotte, North Carolina and Fort Mill, South Carolina | 400 | | 300 | | 100 | |
| Kings Dominion | | Doswell, Virginia | 740 | | 280 | | 460 | |
| California's Great America | (2) | Santa Clara, California | 175 | | 175 | | — | |
| Dorney Park | | Allentown, Pennsylvania | 210 | | 180 | | 30 | |
| Worlds of Fun | | Kansas City, Missouri | 350 | | 250 | | 100 | |
| Valleyfair | | Shakopee, Minnesota | 190 | | 110 | | 80 | |
| Michigan's Adventure | | Muskegon, Michigan | 260 | | 120 | | 140 | |
| Schlitterbahn Waterpark & Resort New Braunfels | | New Braunfels, Texas | 90 | | 75 | | 15 | |
| Schlitterbahn Waterpark Galveston | (3) | Galveston, Texas | 40 | | 35 | | 5 | |
(1) Cedar PointAlthough our Board makes the final compensation decisions for the named executive officers, the process of determining compensation is a collaborative one between the Board, the Compensation Committee, and Cedar Point Shores are located on approximately 365 acres, virtuallythe Chief Executive Officer. Our Chief Executive Officer dedicates time each year to formally review all of whichhis direct reports, including the other named executive officers. He reviews each individual's achievement of individual performance objectives established before the operating season begins (where applicable) and makes recommendations to the Compensation Committee regarding the compensation of each individual. The Compensation Committee, in consultation with the Chief Executive Officer and independent compensation consultant, makes compensation determinations and adjustments as it deems appropriate in accordance with the applicable compensation plans, and in turn, reports its recommendations to the Board for its approval. Decisions regarding the Chief Executive Officer’s compensation are made by the Compensation Committee and the Board, based upon a review of his performance relative to agreed objectives, including a self-assessment, in consultation with the independent compensation consultant.
The Board generally reviews compensation matters after the conclusion of the peak season when significant financial results are available. The Chief Executive Officer completes his evaluations of the other named executive officers’ performance against their established targets and achievement of their individual performance objectives. Based upon that determination, he prepares recommendations and calculations with respect to cash incentive payouts and equity compensation awards for the current year as well as recommendations for compensation adjustments for the coming year. The Chief Executive Officer generally presents this report to the Compensation Committee and to the Board by January. A final review takes place in February when financial results have been developed,finalized and final review of individual goal achievement has been completed. Based on Company performance, park performance, and individual performance, the Cedar Point peninsulaCompensation Committee approves final calculations with regard to cash incentive and equity compensation award payouts, subject to Board approval and final audited results. We approved the 2022 payouts and our 2023 executive compensation levels and program in Sandusky, Ohio. We also own approximately 470 acresFebruary 2023.
COMPENSATION PERFORMANCE MEASURES
Our executive compensation program is designed around the achievement of propertyconsolidated operating results of the Company (with key performance metrics based on Adjusted EBITDA and un-levered pre-tax free cash flow) and individual performance objectives. The Compensation Committee has the mainland near Cedar Point with approximately 110 acres undeveloped. Cedar Point's Express Hotel, Castaway Bay Indoor Waterpark Resortflexibility to use other metrics, and an adjoining restaurant, Castaway Bay Marina, seasonal-employee housing complexes, Cedar Point Sports Centerwe used additional measures in recent years in response to the extreme disruption to the business from the COVID-19 pandemic. Our 2016 Omnibus Incentive Plan does not limit the performance criteria from which the Committee may choose in structuring awards.
The financial goals for our 2023 cash incentive awards were based on functional currency Adjusted EBITDA before incentive compensation expense weighted at 90% for our CEO, CFO and Sawmill Creek Resort are locatedCOO and 85% for our other NEOs. The remaining portion of our 2023 cash incentive awards were based on this property.
We control, through ownership or an easement,set three-year cumulative un-levered pre-tax free cash flow targets for our 2023 performance units. We viewed these targets to be effective in aligning those awards with our post-pandemic goals to strengthen the balance sheet and execute a six-mile public highwaymore dimensionalized capital allocation strategy.
The following chart summarizes our key financial performance measures, how we use and own approximately 40 acres of vacant land adjacenthave recently used them in our compensation program, and the definitions and methods we use to this highway, which is a secondary access route to Cedar Point and serves about 250 private residences. We maintain this roadway pursuant to deed provisions. We also own the Cedar Point Causeway, a four-lane roadway across Sandusky Bay, which is the principal access road to Cedar Point.
(2) We sold the land at California's Great America on June 27, 2022. Concurrently with the sale of the land, we entered into a lease contract that allows us to operate the park during a six-year term, and we have an option to extend the term for an additional five years. The lease is subject to early termination by the buyer with at least two years' prior notice; see Note 11.
(3) We lease the land at Schlitterbahn Waterpark Galveston through a long-term lease agreement. The lease is renewable in 2024 with options to renew at our discretion through 2049 and a right of first refusal clause to purchase the land.
compute them. All of our property is owned in fee simple and is encumbered by our credit agreement and the 2025 senior notes, with the exception of the land at California's Great America, the land at Schlitterbahn Waterpark Galveston, the land at the location of the Cedar Fair Resort and Attraction Management program, and portions of the six-mile public highway that serves as secondary access route to Cedar Point. We consider our properties to be well maintained, in good condition and adequate for our present uses and business requirements.
ITEM 3.LEGAL PROCEEDINGS.
None.
ITEM 4. MINE SAFETY DISCLOSURES.
Not applicable.these measures are non-GAAP financial measures.
PART II
| | | | | |
| Adjusted EBITDA | •Used in: ◦2024 Performance Unit Awards (as one of two metrics) ITEM 5. MARKET FOR REGISTRANT'S DEPOSITARY UNITS, RELATED UNITHOLDER MATTERS AND ISSUER
PURCHASES OF DEPOSITARY UNITS.
Cedar Fair, L.P. Depositary Units representing limited partner interests are listed for trading on The New York Stock Exchange under the symbol "FUN". As of February 10, 2023, there were approximately 4,600 registered holders of Cedar Fair, L.P. Depositary Units, representing limited partner interests. Item 12 in this Form 10-K includes information regarding our equity incentive plan, which is incorporated herein by reference.
Our credit agreement and fixed rate note agreements include Restricted Payment provisions, which could limit our ability to pay partnership distributions. Pursuant to the terms of the indenture governing the 2027 senior notes, which includes the most restrictive of these Restricted Payments provisions, if our pro forma Total-Indebtedness-to-Consolidated-Cash-Flow Ratio is greater than 5.25x, we can still make Restricted Payments of $100 million annually so long as no default or event of default has occurred and is continuing. If our pro forma Total-Indebtedness-to-Consolidated-Cash-Flow Ratio is less than or equal to 5.25x, we can make Restricted Payments up to our Restricted Payment pool. Our pro forma Total-Indebtedness-to-Consolidated-Cash-Flow Ratio was less than 5.25x as of December 31, 2022.
Unitholder Return Performance Graph
The graph below shows a comparison of the five-year cumulative total return (assuming all distributions/dividends reinvested) for Cedar Fair, L.P. limited partnership units, the S&P 500 Index, the S&P 400 Index, and the S&P - Movies and Entertainment Index, assuming investment of $100 on December 31, 2017.
| | | | | | | | | | | | | | | | | | | | | | | | | | | | | | | | | | | | | | | | | | | | | | | | Base Period | | | Return | | | | 2017 | | | 2018 | | 2019 | | 2020 | | 2021 | | 2022 | | Cedar Fair, L.P. | | | $ | 100.00 | | | | $ | 77.35 | | | $ | 97.04 | | | $ | 72.57 | | | $ | 92.35 | | | $ | 77.36 | | | S&P 500 | | | 100.00 | | | | 95.62 | | | 125.73 | | | 148.87 | | | 191.60 | | | 156.90 | | | S&P 400 | | | 100.00 | | | | 88.92 | | | 112.22 | | | 127.55 | | | 159.13 | | | 138.34 | | | S&P Movies and Entertainment | | | 100.00 | | | | 100.61 | | | 127.49 | | | 177.32 | | | 172.96 | | | 86.08 | |
•Adjusted EBITDA represents earnings before interest, taxes, depreciation, amortization, other non-cash items, and adjustments as defined in our credit agreement.
•This is a key performance measure because it closely tracks core operating performance across park operating units and is widely used by analysts, investors, direct industry peers, and other comparable companies to evaluate operating performance.
|
Functional Currency Adjusted EBITDA
| •Used in: ◦Cash Incentive Awards ◦Performance Unit Awards (as the main metric for 2021 awards)
•This measurement differs from the Adjusted EBITDA amounts we report in our earnings releases and financial reports because functional currency Adjusted EBITDA is calculated using the functional currency of the country where the income or loss was earned (i.e., the Canadian dollar for our Canadian operations).
•This eliminates unpredictable and artificial increases or decreases based solely on currency fluctuations.
•The targeted and actual performance calculations for our annual cash incentive awards were based on earnings before incentive-based compensation expenses, which we compute by adding back the cash costs of our performance-based compensation programs to the functional currency Adjusted EBITDA amounts.
|
| Un-Levered Pre-Tax Free Cash Flow | •Used in: ◦2022, 2023 and 2024 Performance Units (as the sole metric for the 2022 and 2023 awards, as one of two metrics for the 2024 awards; a three-year cumulative goal) ◦2021 Performance Units (as an award enhancement; additional units may be earned based on achievement of the un-levered pre-tax free cash flow goals)
•We use this as a key performance metric in these awards because it is consistent with our post-pandemic business goals and broadening of our capital allocation strategies.
•Un-levered pre-tax free cash flow for each calendar year is computed as consolidated Adjusted EBITDA for such calendar year less net cash used for investing activities (before any business acquisitions) for such calendar year, as recorded in the consolidated financial statements of the Company which are examined by the independent accountants for the Company.
•Targets are in U.S. dollars – “functional currency” will not be used to compute un-levered pre-tax free cash flow performance.
|
| Net Leverage Ratio | •Used in: ◦2021 Performance Units (as an award enhancement; additional units could be earned based on achievement of the net leverage ratio goals)
•Net leverage ratio is computed as the ratio of (a) Net Debt (defined as Consolidated Total Debt per the Company’s Amended and Restated Credit Agreement less cash and cash equivalents as recorded in the consolidated financial statements of the Company), to (b) consolidated Adjusted EBITDA for the period of four (4) consecutive fiscal quarters most recently ended on or prior to such date.
•Targets are in U.S. dollars – “functional currency” is not used to compute net leverage ratio performance. |
ELEMENTS OF EXECUTIVE COMPENSATION
Overview
Our executive compensation program is designed around total direct compensation - the combination of base salary, annual cash incentive awards, and long-term incentive compensation. In setting targeted total direct compensation, the Compensation Committee seeks to establish each compensation element at a level that is commensurate with the executive's job responsibilities, is competitive with market pay, and will retain, attract, and motivate top talent while keeping overall pay levels aligned with unitholders’ interests. The Committee also seeks to incentivize a combination of short-term performance, building and making investments for our future, and long-term performance, fostering sustained growth and profitability of the Company. The 2023 compensation opportunities were designed consistent with this approach. The following table sets forth each element of our executive compensation program, principal objectives of these elements and certain recent highlights.
| | | | | |
| Compensation Element | Principal Objective & Select Highlights |
| Base Salary | Fixed compensation element intended to reward senior leadership skills, experience, and core competencies.
|
Issuer Purchases of Equity Securities | | | | | |
| Compensation Element | Principal Objective & Select Highlights |
| Annual Cash Incentive Awards (1) | Variable compensation element intended to reward contributions to our short-term business objectives and achievement of strategic or individual goals.
•Consistent with the prior year, the majority of the 2023 cash incentive award opportunities were based on a functional currency Adjusted EBITDA before incentive compensation expense goal. The balance was tied to individual goals. The financial goal portion was weighted at 90% for our CEO, CFO and COO and was weighted at 85% for our other named executive officers.
•For 2023 cash incentive awards, we achieved 91.7% of target (33% payout) on the financial goals and 100% payout on the individual performance objectives, resulting in total award payouts of 39.7%-43.1% of target.
|
Long-Term Incentive Compensation (2) Restricted Unit Awards (3) Performance Unit Awards (3) | Variable compensation element intended to reward contributions to our long-term success, drive achievement of our mission and key strategic objectives, and align each named executive officer’s commitment with our unitholders' interests.
•For our regular 2023 long-term incentive awards, we maintained a three-year measurement period and a three-year cumulative financial goal. The metric for the 2023-2025 performance unit awards is cumulative un-levered pre-tax free cash flow. We view this metric as consistent with our post-pandemic strategic focus on strengthening the balance sheet and executing a more dimensionalized capital allocation strategy that balances growth, deleveraging, distribution and return of capital to our unitholders. Payouts can range from 0% to 200% of the target. Our named executive officer 2023 regular equity awards were weighted 70% performance awards and 30% time-based units.
•2023 was the first year for which performance against the goals was measured under our 2021-2025 performance units. The 2021-2025 performance awards have three components: (1) functional currency Adjusted EBITDA goals (up to 200% of the target units); (2) net leverage ratio reduction goals (a potential additional 50% of the target units); and (3) un-levered pre-tax free cash flow goals (a potential additional 50% of the target units). As to (1), we achieved 97.3% of the functional currency Adjusted EBITDA goal for 2023, resulting in payouts of 80% on that component of the 2021-2025 performance unit awards. As to (2), we achieved our net leverage ratio reduction goal for 2023, which will result in full payouts of that component of the 2021-2025 performance unit awards in March 2025, subject to continuous employment requirements. As to (3), we did not achieve our un-levered pre-tax free cash flow target for 2023. The 2021-2025 performance award program provides additional opportunities to earn the remaining potential units for the functional currency Adjusted EBITDA and un-levered pre-tax free cash flow components of the award based on targets applicable in 2024 and, if applicable, in 2025.
|
| Merger Completion Awards | We approved transaction-based awards (the “Merger Completion Awards”) to Messrs. Zimmerman, Witherow, Fisher and Nurse and Ms. Sauls to recognize their efforts in connection with our entry into the merger agreement with Six Flags, and to facilitate successful completion of the transactions contemplated by the merger agreement.
•The awards made to Messrs. Zimmerman, Witherow, Fisher and Nurse are unit-based, and the units will only be earned if the transaction closing occurs. ◦These unit-based awards will be converted into corresponding awards denominated in shares of the combined company’s common stock, based on the Cedar Fair exchange ratio set forth in the merger agreement. •Ms. Sauls' Merger Completion Award of $200,000 would be paid in cash and will only be earned if the transaction closing occurs. •50% of the equity or cash, as applicable, would be payable 12 months after the grant date, and the other 50% of the equity or cash, as applicable, would be payable on June 4, 2025, subject to both the completion of the merger and the continuous employment requirements of the awards.
|
Retirement, Health, Life and Disability Benefits and Executive Perquisites
| The named executive officers may participate in the Company’s 401(k) plan, which is available to all our eligible employees. The named executive officers participate in other employee benefit plans available to all our eligible employees, including health, life and disability plans. We provide limited perquisites to certain of our named executive officers that we believe are reasonable and would enhance the competitiveness of our compensation packages.
|
| Change in Control and Termination Protection | Provide protection if the executive’s employment terminates for a qualifying event or circumstances or in the event of a change in control.
|
The following(1) We may from time-to-time award discretionary bonuses to our named executive officers separate from our annual cash incentive program.
(2) We may make other types of long-term cash or unit-based incentive awards to our executives. See, for example, the Merger Completion Awards discussed in this table summarizes repurchasesand in the "Merger Completion Awards" section below.
(3) Under the merger agreement with Six Flags, outstanding equity awards will be converted into a corresponding award denominated in shares of the combined company's common stock in connection with the merger. Performance-based Cedar Fair L.P. Depositary Units representing limited partner interests byequity awards will not be subject to future performance-based vesting conditions post-closing (but will remain subject to service-based vesting conditions). See the Partnership during the three months ended December 31, 2022:
| | | | | | | | | | | | | | | | | | | | | | | | | | |
| | (a) | | (b) | | (c) | | (d) |
Period | | Total Number of Units Purchased (1) | | Average Price Paid per Unit | | Total Number of Units Purchased as Part of Publicly Announced Plans or Programs (2) | | Maximum Number (or Approximate Dollar Value) of Units that May Yet Be Purchased Under the Plans or Programs (2) |
| September 26 - October 31 | | 1,230,943 | | | $ | 40.22 | | | 1,230,943 | | | $ | 134,529,377 | |
| November 1 - November 30 | | 879,404 | | | $ | 40.74 | | | 879,404 | | | $ | 98,703,337 | |
| December 1 - December 31 | | 905,837 | | | $ | 39.84 | | | 905,837 | | | $ | 62,618,601 | |
| Total | | 3,016,184 | | | $ | 40.26 | | | 3,016,184 | | | $ | 62,618,601 | |
(1)All units purchased were repurchased pursuant to our unit repurchase program described in Footnote 2.
(2)On August 3, 2022, we announced that our Board of Directors approved a unit repurchase plan authorizing the Partnership to repurchase units"Long-Term Incentive Compensation" section below for an aggregate purchase price of not more than $250 million. No limit was placed on the duration of the repurchase program; see Note 8.
ITEM 6. RESERVED.
ITEM 7. MANAGEMENT'S DISCUSSION AND ANALYSIS OF FINANCIAL CONDITION AND RESULTS OF OPERATIONS.
Business Overview
We generate our revenues from sales of (1) admission to our amusement parks and water parks, (2) food, merchandise and games both inside and outside our parks, and (3) accommodations, extra-charge products, and other revenue sources. Our principal costs and expenses, which include salaries and wages, operating supplies, maintenance and advertising, are relatively fixed for a typical operating season and do not vary significantly with attendance.
Each of our properties is overseen by a general manager and operates autonomously. Management reviews operating results, evaluates performance and makes operating decisions, including allocating resources, on a property-by-property basis.
Along with attendance and in-park per capita spending statistics, discrete financial information and operating results are prepared at the individual park level for use by the CEO, who is the Chief Operating Decision Maker (CODM), as well as by the Chief Financial Officer, the Chief Operating Officer, Senior Vice Presidents and the general managers.
Compensation Mix
We seek to balance the total direct compensation mix for each executive so that it achieves our overall compensation objectives. The following table presents certain financial data expressed as a percentmix of total net revenuescompensation and selective statistical information for the periods indicated.
| | | | | | | | | | | | | | | | | | | | | | | | | | | | | | | | | | | | | | |
| | Years Ended December 31, |
| | 2022 | | 2021 | | 2020 |
| | (In thousands, except per capita spending, operating days and percentages) |
| Net revenues: | | | | | | | | | | | | |
| Admissions | | $ | 925,903 | | | 50.9 | % | | $ | 674,799 | | | 50.4 | % | | $ | 67,852 | | | 37.4 | % |
| Food, merchandise and games | | 602,603 | | | 33.2 | % | | 432,513 | | | 32.3 | % | | 76,921 | | | 42.4 | % |
| Accommodations, extra-charge products and other | | 288,877 | | | 15.9 | % | | 230,907 | | | 17.3 | % | | 36,782 | | | 20.3 | % |
| Net revenues | | 1,817,383 | | | 100.0 | % | | 1,338,219 | | | 100.0 | % | | 181,555 | | | 100.0 | % |
| Operating costs and expenses | | 1,289,142 | | | 70.9 | % | | 1,030,466 | | | 77.0 | % | | 483,891 | | | 266.5 | % |
| Depreciation and amortization | | 153,274 | | | 8.4 | % | | 148,803 | | | 11.1 | % | | 157,549 | | | 86.8 | % |
| Loss on impairment / retirement of fixed assets, net | | 10,275 | | | 0.6 | % | | 10,486 | | | 0.8 | % | | 8,135 | | | 4.5 | % |
| Loss on impairment of goodwill and other intangibles | | — | | | — | % | | — | | | — | % | | 103,999 | | | 57.3 | % |
| Gain on sale of land | | (155,250) | | | (8.5) | % | | — | | | — | % | | — | | | — | % |
| Loss (gain) on other assets | | — | | | — | % | | 129 | | | — | % | | (11) | | | — | % |
| Operating income (loss) | | 519,942 | | | 28.6 | % | | 148,335 | | | 11.1 | % | | (572,008) | | | (315.1) | % |
| Interest and other expense, net | | 148,332 | | | 8.2 | % | | 183,732 | | | 13.7 | % | | 150,222 | | | 82.7 | % |
| Net effect of swaps | | (25,641) | | | (1.4) | % | | (19,000) | | | (1.4) | % | | 15,849 | | | 8.7 | % |
| Loss on early debt extinguishment | | 1,810 | | | 0.1 | % | | 5,909 | | | 0.4 | % | | 2,262 | | | 1.2 | % |
| Loss (gain) on foreign currency | | 23,784 | | | 1.3 | % | | 6,177 | | | 0.5 | % | | (12,183) | | | (6.7) | % |
| Provision (benefit) for taxes | | 63,989 | | | 3.5 | % | | 20,035 | | | 1.5 | % | | (137,915) | | | (76.0) | % |
| Net (loss) income | | $ | 307,668 | | | 16.9 | % | | $ | (48,518) | | | (3.6) | % | | $ | (590,243) | | | (325.1) | % |
| Other data: | | | | | | | | | | | | |
| Attendance | | 26,912 | | | | | 19,498 | | | | | 2,595 | | | |
| In-park per capita spending | | $ | 61.65 | | | | | $ | 62.03 | | | | | $ | 46.38 | | | |
| Operating days | | 2,302 | | | | | 1,765 | | | | | 487 | | | |
Impactrelative levels of COVID-19 Pandemiceach element is position dependent and may vary year-to-year, including changes in connection with promotions and leadership transitions.
The novel coronavirus (COVID-19) pandemic had2023 targeted direct compensation mix includes base salary, annual cash incentive compensation and long-term incentive compensation (performance units and time-based unit awards). The performance weighting in the long-term incentive component for all our named executive officers is 70% performance awards and 30% time-based units.
The graphic below illustrates the 2023 targeted total direct compensation mix for Messrs. Zimmerman, Witherow, Fisher and Nurse and for Mses. Sauls and Ford. 87% of our CEO's targeted compensation and, on average, 76% of the targeted compensation for our other named executive officers presented below is variable or at risk based on performance and continued employment with the Company. See the discussions of each element of incentive compensation for information regarding maximum possible payouts and forfeiture exceptions.
(1) The Merger Completion Awards were not considered to be part of the regular 2023 target direct compensation and are therefore excluded from this graphic.
(2) Ms. Sauls' new hire award is not considered to be part of her regular 2023 target direct compensation and is excluded from this graphic. The amounts for Ms. Sauls' salary and target cash incentive reflect the pro-rata portion of 2023 that she was employed with the Company.
We approved 2024 targeted total direct compensation opportunities and grants for our executives in March 2024 that reflect a material impact on our business in 2020, had a continuing negative impact in 2021 and may have a longer-term negative effect. Beginning on March 14, 2020, we closed our properties for several months in responsemix of awards similar to the spread2023 mix with adjustments to individual compensation levels to reflect merit increases and expanded roles. We made certain adjustments to the performance metrics and scales for our 2024 incentive awards. Our 2024 cash incentive awards are based solely on Company financial targets, and our 2024 performance unit awards are based on two three-year cumulative goals (Un-levered Pre-Tax Free Cash Flow (weighted at 60%) and Adjusted EBITDA (weighted at 40%)). The executives’ final compensation mix for 2024 is subject to change, including in connection with the merger.
Base Salary
We pay base salaries to provide a fixed amount of COVID-19compensation that is not subject to performance-related risk, that is competitive with market pay and local government mandates. We ultimately resumed partial operations at 10that is commensurate with the executive’s scope of our 13 properties in 2020, operating in accordanceresponsibilities, performance, historical compensation levels, tenure with local and state guidelines. Due to soft demand trends upon reopening in 2020, park operating calendars were adjusted for the remainder of 2020, including reduced operating days per week and operating hours within each operating day and earlier closure of certain parks than a typical operating year. Following March 14, 2020, Knott's Berry Farm's partial operations in 2020 were limited to culinary festivals.
We delayed the opening of our U.S. properties for the 2021 operating season until May 2021 and opened our Canadian property in July 2021. Upon opening in 2021, we operated with capacity restrictions, guest reservations,Company and other
operating protocolsexperience. We do not consider the earnings of prior long-term incentive awards or retirement plans when determining base salaries. Base salaries may be reviewed and adjusted from time to time, subject to the employment agreement terms, where applicable. Based on the factors identified above, the Compensation Committee reviews and recommends to the Board adjustments to the base salary for each of the named executive officers on an annual basis, in
place. Our 2021 operating calendars were designedconnection with promotions or a substantial change in responsibilities or as otherwise deemed appropriate. See Narrative to align with anticipated capacity restrictions, guest demandSummary Compensation and labor availability, including fewer operating days in July and August at someGrants of our smaller properties andPlan Based Awards Tables - Employment Agreements for additional operating days in September andinformation on the fourth quarter at mostterms of our properties. As vaccination distribution efforts continued during the second quarter of 2021 and we were able to hire additional labor, we removed most capacity restrictions, guest reservation requirements and other protocols at our U.S. properties beginning in July 2021. Canada's Wonderland operated with capacity restrictions, guest reservations, and other operating protocols in place upon opening and throughout 2021.
Each of our properties opened for the 2022 operating season as planned and without restrictions. We currently anticipate continuing to operate without restrictions for the 2023 operating season. However, we have and may continue to adjust future park operating calendars as we respond to changes in guest demand, labor availability and any federal, provincial, state and local restrictions. Our future operations are dependent on factors beyond our knowledge or control, including any future actions taken to contain the COVID-19 pandemic and changing risk tolerances of our employees and guests regarding health matters.
Critical Accounting PoliciesThe base salary for each named executive officer is set at a level that the Compensation Committee believes is appropriate on an individual basis when considered with other elements of compensation. In reviewing the named executive officer’s salary, the Compensation Committee generally considers, among other things:
Management's Discussion•the individual named executive officer’s performance, experience, skills and Analysistime in position;
•the Company’s overall performance, returns to our unitholders, and continued expectations for growth; and
•the Chief Executive Officer's recommendations for the other named executive officers.
We increased named executive officer base salaries for 2023 to recognize and reward individual contributions to Company performance in 2022, successful results in response to the continued challenges of Financial Conditionthe business recovery, and Resultsexecution of Operationsstrategic goals designed to strengthen the Company for the future. Base salaries were further adjusted for 2024 following a similar review process. The annual base salaries for the named executive officers for 2022, 2023 and 2024 were as follows:
| | | | | | | | | | | |
| Named Executive Officer | 2022 Annual Salary | 2023 Annual Salary | 2024 Annual Salary |
| Zimmerman | $908,400 | $950,000 | $1,000,000 |
| Witherow | $561,400 | $578,200 | $607,100 |
| Fisher | $630,000 | $648,900 | $681,300 |
| Nurse | $425,000 | $437,800 | $500,000 |
| Sauls * | N/A | $400,000 | $412,000 |
| Ford | $426,400 | $437,100 | N/A |
* Table reflects an annualized amount. Ms. Sauls joined the Company on March 20, 2023, and her 2023 salary for the portion of 2023 employed was $300,000.
Cash Incentive Awards
Our annual cash incentive awards provide an element of compensation that is contingent on, and motivates the achievement of, annual performance objectives. The performance objectives and percentage of base salary that may be earned as a cash incentive generally are determined for each named executive officer and are approved by the Compensation Committee and Board by March of the applicable year. The performance objectives may vary and be weighted differently for each position and may use multiple measures of performance, including individual, business unit, management unit and Company performance goals.
Overview of 2023 Cash Incentive Awards
Our 2023 cash incentive awards continued to be based uponin part on Company functional currency Adjusted EBITDA financial goals and in part on individual performance goals. We continue to believe Adjusted EBITDA is a key metric for the Company and that it is well understood by our consolidated financial statements, which were prepared in accordance with accounting principles generally acceptedinvestor community and internal participants. We therefore chose to retain the focus on Adjusted EBITDA in the United States of America. These principles require us to make judgments, estimates and assumptions duringannual incentive program.
We retained the
normal course of business that affect the amounts reportedsame general performance/payout scale for 2023 as we used in short-term cash incentive awards in the
Consolidated Financial Statements and related notes. The following discussion addresses our critical accounting policies, which are those that are most important toprior year. We maintained the
portrayal of our financial condition and operating results or involve a higher degree of judgment and complexity (see Note 2 for a complete discussion of our significant accounting policies). Applicationweighting of the critical accounting policies described below involvesfinancial goal portion for our CEO, COO and CFO at 90%, in recognition of the exerciselevel of judgmentaccountability for EBITDA performance for those three roles. We also maintained the weighting of 85% financial and 15% individual goals for our other named executive officers. The individual goals were directly linked to Company goals, and the use of assumptions as to future uncertainties, and as a result, actual results could differ from these estimates and assumptions.
Impairment of Long-Lived Assets
Long-lived assets, including property and equipment, are reviewed for impairment uponweighting between the occurrence of events or changes in circumstances that would indicate that the carrying value of the assets may not be recoverable. A significant amount of judgment is involved in determining if an indicator of impairment has occurred. Such indicators may include, among others: a significant decrease in the market price of a long-lived asset; a significant adverse change in the extent or manner in which a long-lived asset is being used or in its physical condition; a significant adverse change in legal factors or in the business climate; an accumulation of costs significantly in excess of the amount originally expected for the acquisition or construction of a long-lived asset; past, current or future operating or cash flow losses that demonstrate continuing losses associated with the use of a long-lived asset; and a current expectation that a long-lived asset will be sold or disposed significantly before the end of its previously estimated useful life. An impairment loss may be recognized when estimated undiscounted future cash flows expected to result from the use of the asset, including disposition, are less than the carrying value of the asset. The measurement of the impairment loss to be recognized isthree individual goals were based on the difference betweenlevel of impact and difficulty. Payouts on the fair value and the carrying amountsindividual goals portion of the assets. Fair value is generally determined usingawards could range from 0% to 200% with assessment for each goal based on a combination of a cost and market approach. Significant factors considered in the cost approach include replacement cost, reproduction cost, depreciation, physical deterioration, functional obsolescence and economic obsolescence of the assets. The market approach estimates fair value by utilizing market data for similar assets. In order to determine if an asset has been impaired, assets are grouped and tested at the lowest level for which identifiable, independent cash flows are available.four-point rating scale.
The determination of whether an indicator of impairment has occurred and the estimation of undiscounted cash flows requires management to make significant estimates and consider an anticipated course of action as of the balance sheet date. Subsequent changes arising from changes in anticipated actions could impact the determination of whether impairment exists, the estimation of undiscounted cash flows and whether the effects could materially impact the consolidated financial statements.
Goodwill and Other Intangible Assets
Goodwill and other indefinite-lived intangible assets, including trade-names, are reviewed for impairment annually, or more frequently if indicators of impairment exist. A significant amount of judgment is involved in determining if an indicator of impairment has occurred. Such indicators may include, among others: a significant decline in expected future cash flows; a sustained, significant decline in equity price and market capitalization; a significant adverse change in legal factors or in the business climate; unanticipated competition; the testing for recoverability of a significant asset group within a reporting unit; and slower growth rates. The fair value of a reporting unit is established using a combination of an income (discounted cash flow) approach and market approach. The income approach uses a reporting unit's projection of estimated operating results and discounted cash flows using a weighted-average cost of capital that reflects current market conditions. Estimated operating results are established using management's best estimates of economic and market conditions over the projected period including growth rates in revenues and costs, estimates of future expected changes in operating margins and cash expenditures. Other significant estimates and assumptions include terminal value growth rates, future estimates of capital expenditures and changes in future working capital requirements. A market approach estimates fair value by applying cash flow multiples to the reporting unit's operating performance. The multiples are derived from comparable publicly traded companies with similar operating and investment characteristics of the reporting units.
It is possible that our assumptions about future performance, as well as the economic outlook and related conclusions regarding valuation, could change adversely, which may result in additional impairment that would have a material effect on our financial position and results of operations in future periods.
Self-Insurance Reserves
Self-insurance reserves are recorded2023 target award opportunities for the estimated amountsnamed executive officers (as a percentage of guest2023 base salary and employee claims and related expenses incurred each period. Reserves are establishedin dollars) were as follows:
| | | | | | | | | | | | | | |
| Named Executive Officer | | Target Award as a Percentage of Base Salary | | Target Award in Dollars |
| Zimmerman | | 150% | | $1,425,000 |
| Witherow | | 100% | | $578,200 |
| Fisher | | 125% | | $811,125 |
| Nurse | | 100% | | $437,800 |
| Sauls * | | 80% | | $251,616 |
| Ford | | 100% | | $437,100 |
* Amount for both identified claims and incurred but not reported ("IBNR") claims and are recorded when claim amounts become probable and estimable. Reserves for identified claims areMs. Sauls reflects the pro-rated target opportunity based upon our historical claim experience and third-party estimateson the number of settlement costs. Reserves for IBNR claims are based upon our claims data history. Self-insurance reserves are periodically reviewed for changes in facts and circumstances and adjustments are made as necessary. The ultimate cost for identified claims can be difficult to predict due todays she was employed with the unique facts and circumstances associated with each claim.
Revenue RecognitionFinal 2023 Cash Incentive Award Payouts
As disclosed withinFinal 2023 cash incentive payouts for the consolidated statements of operations and comprehensive income (loss), revenues are generated from sales of (1) admission to our amusement parks and water parks, (2) food, merchandise and games both inside and outside the parks, and (3) accommodations, extra-charge products, and other revenue sources. Most revenues are recognized on a daily basisnamed executive officers - based on actual guest spend at our properties. Revenues from multi-use products, including season-long products for admission, dining, beverage and other products, are recognized over the estimated numberachievement of uses expected for each type of product. The estimated number of uses is reviewed and may be updated periodically during the operating season prior to the ticket or product expiration, which generally occurs no later than the close91.7% of the operating season associated with that product.financial target and each executive having met expectations and achieving 100% on their individual goals - were as follows:
| | | | | | | | | | | | | | | | | | | | |
| Named Executive Officer | | Cash Incentive Payout | | Cash Incentive Payout as a Percentage of Target | | Cash Incentive Payout as a Percentage of 2023 Annual Salary |
| Zimmerman | | $565,725 | | 39.7% | | 59.6% |
| Witherow | | $229,545 | | 39.7% | | 39.7% |
| Fisher | | $322,017 | | 39.7% | | 49.6% |
| Nurse | | $188,473 | | 43.1% | | 43.1% |
| Sauls * | | $108,321 | | 43.1% | | 36.1% |
| Ford | | $188,172 | | 43.1% | | 43.1% |
* The numbertotal cash incentive payout, payout as a percentage of uses is estimated based on historical usage adjustedtarget and payout as a percentage of 2023 annual salary for current period trends.
Due to the effectsMs. Sauls reflect proration of the COVID-19 pandemic, we extended the validity of our 2020 season-long products through the 2021 operating season in order to ensure our season pass holders received a full season of access to our parks. The extended validity of the 2020 season-long products resulted in a significant amount of revenue deferred from 2020 into 2021. In addition to the extended validity through 2021, Knott's Berry Farm also offered a further day-for-day extension into calendar year 2022 for 2020 and 2021 season-long products for every day the park was closed in 2021, and Canada's Wonderland extended its 2020 and 2021 season-long products through Labour Day, or September 5, 2022. All revenue related to season-long product extensions was recognized by the third quarter of 2022. In order to calculate revenue recognized on extended season-long products, management made significant estimates regarding the estimated number of uses expected for these season-long products for admission, dining, beverage and other products, including during interim periods.
Income Taxes
Our legal entity structure includes both partnerships and corporate subsidiaries. We are subject to publicly traded partnership tax ("PTP tax") on certain partnership level gross income (net revenues less cost of food, merchandise, and games revenues), state and local income taxes on partnership income, U.S. federal state and local income taxes on income from our corporate subsidiaries and foreign income taxes on our foreign subsidiary. As such, the total provision for taxes includesall amounts for the PTP gross income tax and federal, state, local and foreign income taxes. Under applicable accounting rules, the total provision for income taxes includes the amount of taxes payable for the current year and the impact of deferred tax assets and liabilities, which represents future tax consequences of events that are recognized in different periods in the financial statements than for tax purposes.
Our corporate subsidiaries account for income taxes under the asset and liability method. Accordingly, deferred tax assets and liabilities are recognized for the future book and tax consequences attributable to temporary differences between the financial statement carrying amounts of existing assets and liabilities and their respective tax bases. Deferred tax assets and liabilities are determined using enacted tax rates expected to apply in the year in which those temporary differences are expected to be recovered or settled. The effect on deferred tax assets and liabilities of a change in tax law is recognized in income at the time of enactment of such change in tax law. Any interest or penalties due for payment of income taxes are included in the provision for income taxes.
We record a valuation allowance if, based on the weightnumber of available evidence, it is more likely than not that somedays Ms. Sauls was employed during 2023.
2023 Cash Incentive Performance Goals
Payouts of the Company performance-based portion or all, of a deferred tax asset will not be realized. The need for this allowance isthe award were based on several factors includingspecified threshold, target and maximum levels of performance and were interpolated for performance between those levels. Payouts of the ten-year carryforward period allowedCompany performance-based portion of the 2023 cash awards were calculated at the following scale (with amounts interpolated between the various levels):
| | | | | | | | |
Level of Performance
as a Percentage of Company Financial Target Achieved | | Payout as a Percentage of Target Award
(Company-based portion) |
| < 91% of target | | No Payout |
| = 91% of target | | 25% |
| = 93% of target | | 50% |
| = 100% of target | | 100% |
| = 105% of target | | 150% |
| ≥ 107% of target | | 200% |
No cash incentive awards were eligible to be paid to the executives if functional currency Adjusted EBITDA before incentive compensation expense fell below the threshold level of performance.
The target functional currency Adjusted EBITDA before incentive compensation expense for excess foreign tax credits, experience2023 was $624 million. The Company achieved functional currency Adjusted EBITDA before incentive compensation expense of $572 million in 2023, which represented approximately 91.7% of the target. See Compensation Discussion and Analysis - Compensation Performance Measures for an explanation of how we compute this measure. Based on this level of performance achievement, the payouts of the Company performance-based portion of the cash incentive awards to dateeach of foreign tax credit limitations, carryforward periodsthe named executive officers were at 33% of state net operating losses,their respective targets. Payout on the portion of the target awards based on the achievement of individual objectives could range from 0% to 200% and management's long-term estimateswas dependent on the level of domesticachievement of three individual performance goals. Each goal was assigned a weighting based upon level of impact and foreign source income.degree of difficulty, with the total weighting of the three goals adding to 100%. Achievement for each goal could range from 0% to 200% and was evaluated using a four-point scale – did not meet goal (0%), met some goal (50%), met goal (100%), and exceeded goal (150-200%). The final payout on this portion of the awards was a weighted average of the performance achieved.
There is inherent uncertaintyIndividuals’ goals were derived from Company goals, primarily in the estimates usedareas of value creation and performance enhancing initiatives, and set in consultation with the Chief Executive Officer and executive leadership team. The individual goals were aligned with our key strategic priorities: (1) business recovery and reinvestment in the core business and organization; (2) deleveraging the balance sheet; and (3) returning capital to projectour unitholders via quarterly distributions and our unit repurchase program. In assessing each individual’s performance against their goals, the amountCompensation Committee reviewed the Chief Executive Officer’s assessment of foreign tax creditthe other named executive officers’ performance, reviewed the Chief Executive Officer’s self-assessment and state net operating loss carryforwards that are more likely than not to be realized. It is possible that our future income projections, as well as the economic outlook and related conclusions regarding valuation allowances could change, which may result in additional valuation allowance being recorded or may result in additional valuation allowance reductions, and which may have a material negative or positive effect on our reported financial positiondiscussed progress and results with Mr. Zimmerman. The Compensation Committee determined that each named executive officer met expectations (100%) on each of operations in future periods.their respective individual goals. Accordingly, the Committee approved payouts on the individual performance-based portion of each of the named executive officers’ respective award targets at 100%.
Results of Operations
We believe the following non-GAAP financial measures are key performance metrics in our managerial and operational reporting. They are used as major factors in significant operational decisions as they are primary driversIn consideration of our financialoverall compensation objectives and operational performance, measuring demand, pricing and consumer behavior:
Attendance is defined as the numbermix of guest visitsdifferent types of compensation that were awarded this year, no additional cash bonuses were paid to our amusement parks and separately gated outdoor water parks.
In-park per capita spending is calculated as revenues generated within our amusement parks and separately gated outdoor water parks along with related parking revenues (in-park revenues), divided by total attendance.
Out-of-park revenues are defined as revenues from resorts, out-of-park food and retail locations, online transaction fees charged to customers, sponsorships, and all other out-of-park operations.
Net revenues consist of in-park revenues and out-of-park revenues less amounts remitted to outside parties under concessionaire arrangements; see Note 3.named executive officers for fiscal year 2023.
We provide long-term incentive compensation awards to senior management. We give a greater weighting to long-term performance than to short-term compensation potential in our overall compensation programs. Outstanding awards have been made under our 2016 Omnibus Incentive Plan, which allows us to grant options, restricted units, unit appreciation rights, performance awards and other types of unit-based awards. We use these types of awards because we believe they give key employees a proprietary and vested interest in our growth and performance, and they align key employees’ interests with those of our unitholders. We also believe that the vesting schedule for these awards aids us in retaining executives and motivates superior performance over the long term. The below sections summarize the 2023-2025 performance unit awards and the 2023 restricted unit awards. If the proposed merger with Six Flags closes, these awards are subject to conversion into awards of the combined company as set forth in the merger agreement, which are further described in the respective sections below.
Overview of 2023 Long-Term Incentive Compensation Awards
For our executives’ 2023 equity awards, we retained our general approach of using a mix of performance unit awards and time-based restricted unit awards. Our named executive officers' 2023 equity awards are weighted at 70% performance awards (30% time-based units). The awards provide for the restricted units to vest in equal increments over a three-year period consistent with prior year awards. We kept the performance/payout percentage scale for the performance units the same as the percentage scale used in the 2022 performance unit awards. We also set a three-year cumulative un-levered pre-tax free cash flow target for the 2023-2025 performance units, consistent with the prior year. We viewed these goals to be effective to align those awards with our post-pandemic goals for strengthening the balance sheet and executing a more dimensionalized capital allocation strategy that balances growth, deleveraging, distribution and return of capital to our unitholders.
Target 2023 Total Long-Term Incentive Award Values
Following are the named executive officers’ 2023 targeted long-term incentive awards, which were determined as a target dollar value at grant, along with the percentage of base salary that those target dollar values reflect:
| | | | | | | | | | | | | | |
| Named Executive Officer | | LTI Award at
Grant in Dollars | | LTI Award as a
Percentage of Base Salary |
| Zimmerman | | $5,000,000 | | 526% |
| Witherow | | $1,450,000 | | 251% |
| Fisher | | $1,660,000 | | 256% |
| Nurse | | $750,000 | | 171% |
| Sauls | | $500,000 | | 125% * |
| Ford | | $804,000 | | 184% |
* As a percentage of annualized salary level.
In setting long-term incentive award levels for 2023, the ResultsCompensation Committee focused primarily on the dollar value of Operations section, we discussthe awards, including the relation to total targeted direct compensation and in the context of the most recently refreshed market comparability study. Once grant date target award values were established, they were allocated to performance unit awards (at target) (70%) and restricted unit awards (30%), and converted to a number of units based on the unit price on the day before the grant date.
2023-2025 Performance Unit Awards
The numbers of potential performance units that may be earned under the 2023-2025 performance unit awards granted to our 2022named executive officers in February 2023, except for the award for Ms. Sauls which was granted in March 2023, (1) for achieving targeted performance, and 2021 results, including a comparison(2) at maximum, were as follows:
| | | | | | | | | | | | | | | | | | | | |
| Named Executive Officer | | | | 2023-2025
Performance Unit Awards (Target) | | 2023-2025
Performance Unit Awards (Maximum) |
| Zimmerman | | | | 80,682 | | 161,364 |
| Witherow | | | | 23,398 | | 46,796 |
| Fisher | | | | 26,787 | | 53,574 |
| Nurse | | | | 12,102 | | 24,204 |
| Sauls | | | | 7,991 | | 15,982 |
| Ford | | | | 12,974 | | 25,948 |
The number of our 2022 results with our 2021 and 2019 results. The comparisonpotential performance units payable is dependent upon the level of our 2022 to 2019 results is provided duethree-year cumulative un-levered pre-tax free cash flow achieved relative to the effects of the COVID-19 pandemic on our 2021 and 2020 results. For a discussion regarding our 2020 results, including comparisons of our 2021 results to our 2020 and 2019 results, see "Management's Discussion and Analysis of Financial Condition and Results of Operations" within the Company's Annual Report on Form 10-Kperformance goals established for the 2023-2025 performance units. No awards will be paid if the threshold level of performance is not achieved. The three-year cumulative free cash flow for these awards will be the sum of un-levered pre-tax free cash flow for each calendar year ended December 31, 2021, filed within the SEC on February 18, 2022.
2022 vs. 2021
Due to the effects of the COVID-19 pandemic, the results for the year ended December 31, 2022 were not directly comparable with the results for the year ended December 31, 2021. The year ended December 31, 2022 included 2,302 operating days compared with 1,765 operating days for the year ended December 31, 2021.
In the 2021 period, and due to the effects ofachievement for each year will be computed in U.S. dollars and on the COVID-19 pandemic, we postponedsame basis as the opening of our parks for the 2021 operating season to May 2021, when all of our properties opened on a staggered basis exceptun-levered pre-tax free cash flow achievement for our Canadian property, Canada's Wonderland, which opened in July 2021. Upon opening in 2021, park operating calendars were reduced, guest reservations were required,2021-2025 performance units and some operating restrictions were in place. We removed most capacity restrictions, guest reservation requirements and other protocols at our U.S. properties beginning in July 2021. Operating restrictions remained in place at our Canadian property throughout 2021. We adjusted our 2021 operating calendars to reflect anticipated changes in guest demand, labor availability and state and local restrictions by including fewer operating days in July and August at some of our smaller properties and by including additional operating days in September and the fourth quarter at most of our properties. The 2021 period also included the results from limited out-of-park operations prior to the May 2021 opening of our parks. Limited out-of-park operations included some of our hotel properties and a culinary festival at Knott's Berry Farm from March 5, 2021 through May 2, 2021. Each of our properties opened for the 2022 operating season as planned and without restrictions.
The following table presents key financial information and operating statistics for the years ended December 31, 2022 and December 31, 2021:
| | | | | | | | | | | | | | | | | | | | | | | | | | |
| | | | | | | Increase (Decrease) |
| | | December 31, 2022 | | December 31, 2021 | | $ | | % |
| | (Amounts in thousands, except for per capita and operating days) |
| Net revenues | | $ | 1,817,383 | | | $ | 1,338,219 | | | $ | 479,164 | | | 35.8 | % |
| Operating costs and expenses | | 1,289,142 | | | 1,030,466 | | | 258,676 | | | 25.1 | % |
| Depreciation and amortization | | 153,274 | | | 148,803 | | | 4,471 | | | 3.0 | % |
| Loss on impairment/retirement of fixed assets, net | | 10,275 | | | 10,486 | | | (211) | | | N/M |
| | | | | | | | |
| Gain on sale of land | | (155,250) | | | — | | | (155,250) | | | N/M |
| Loss on other assets | | — | | | 129 | | | (129) | | | N/M |
| Operating income | | $ | 519,942 | | | $ | 148,335 | | | $ | 371,607 | | | 250.5 | % |
| | | | | | | | |
| Other Data: | | | | | | | | |
| | | | | | | | |
| | | | | | | | |
| Attendance (1) | | 26,912 | | | 19,498 | | | 7,414 | | | 38.0 | % |
| In-park per capita spending (1) | | $ | 61.65 | | | $ | 62.03 | | | $ | (0.38) | | | (0.6) | % |
| Out-of-park revenues | | $ | 213,337 | | | $ | 167,978 | | | $ | 45,359 | | | 27.0 | % |
| Operating days | | 2,302 | | | 1,765 | | | 537 | | | 30.4 | % |
N/M Not meaningful due to the nature of the expense line-item.
(1) Attendance and in-park per capita spending are non-GAAP financial measures. Theses metrics are used as major factors in significant operational decisions as they are primary drivers of our financial and operational performance, measuring demand, pricing and consumer behavior. See the definition and calculation of these measures above.
Consolidated net revenues totaled $1.8 billion for the year ended December 31, 2022 compared with $1.3 billion for 2021. This increase in net revenues was attributable to a 537 operating day increase in 2022 resulting in a 7.4 million-visit increase in attendance and a $45.4 million increase in out-of-park revenues. In-park per capita spending for the year ended December 31, 2022 decreased 0.6% to $61.65, which was driven by lower sales volume per guest on extra-charge products and a higher season pass mix. While the majority of the increase in out-of-park revenues was attributable to the 537 operating day increase in 2022, out-of-park revenues also increased due to the reopening of Castaway Bay Resort and Sawmill Creek Resort at Cedar Point following temporary closures for renovations and higher average daily room rates across much of our resort portfolio, offset somewhat by a prior period culinary festival at Knott's Berry Farm. The increase in net revenues included a $6.5 million unfavorable impact of foreign currency exchange rates at our Canadian park.
Payouts of the 537 operating day increase in 2022. While2023-2025 performance unit awards will be based on the majorityfollowing scale (with amounts interpolated between the various levels):
| | | | | | | | |
Level of Performance as a Percentage of
Cumulative Un-Levered Pre-Tax Free Cash Flow Target Achieved | | Payout as a Percentage of Target
Number of Units |
| < 93% of target | | No Payout |
| = 93% of target | | 50% |
| = 100% of target | | 100% |
| = 105% of target | | 150% |
| ≥ 107% of target | | 200% |
These awards will accrue distribution equivalents when we make partnership distributions, which will be deemed to be reinvested and paid out along with the original awards, subject to achievement of the $166.1 million increasesame performance targets. If earned, the 2023-2025 awards would be paid after the end of the performance period only in operating expenses was attributableunits, consistent with our program’s focus on alignment with our unitholders’ interests, and subject to the increaseexecutive remaining in operating days, there was also an increasecontinuous employment through the payment date except for certain qualifying terminations.
Under the merger agreement, if the proposed merger with Six Flags closes, these (and other) performance units will be converted into a corresponding award denominated in full-time wages primarily related to a planned increase in head count at select parks, and incremental land lease and property tax costs associatedshares of the combined company’s common stock, with the sale-leasebacknumber of shares of the land at California's Great America.combined company’s common stock subject to such converted award based on the Cedar Fair exchange ratio in the merger agreement. The increase in operating costsconverted Cedar Fair equity awards will remain outstanding and expenses included a $3.2 million favorable impact of foreign currency exchange rates at our Canadian park.
Depreciation and amortization expense for the year ended December 31, 2022 increased $4.5 million compared with 2021 due primarilysubject to the reduction of the estimated useful lives of the long-lived assets at California's Great America following the sale-leaseback of the land at California's Great America. The loss on impairment / retirement of fixed assets for 2022 was $10.3 million compared to $10.5 million for 2021. The loss on impairment / retirement of fixed assets for both periods included retirements of assets in the normal course of business. The 2021 period also included the impairment of a few specific assets in the second half of 2021.
After a $155.3 million gain on the sale of the land at California's Great America during the third quarter of 2022same terms and the items above, operating income for 2022 totaled $519.9 million compared with $148.3 million for 2021.
Interest expense for 2022 decreased $32.1 million compared with 2021 primarily dueconditions as applied to the redemption of the 2024 senior notes in December 2021, and the repayment of our senior secured term loan facility and related termination of our interest rate swap agreements during the third quarter of 2022. The net effect of our swaps resulted in a $25.6 million benefit to earnings for 2022 compared with a $19.0 million benefit to earnings for 2021. The difference was attributable to the change in fair market value of our swap portfoliocorresponding Cedar Fair equity award immediately prior to the terminationapplicable time, including vesting protections for qualifying terminations that occur within a period of 24 months following the closing date. Under the merger agreement, performance-based Cedar Fair equity awards will convert based on the greater of target and actual performance or, in the case of any performance period that is not in progress as of the closing effective time, target performance, as applicable. However, the Board may determine, at its discretion and subject to approval requirements in the merger agreement, that only a pro-rata portion of the target number of 2024-2026 performance units, based on the portion of the performance period completed prior to closing, will be converted into time-based restricted stock units of the combined company in connection with the merger. Performance-based Cedar Fair equity awards that are converted in the merger will not be subject to future performance-based vesting conditions (but will remain subject to service-based vesting conditions).
2023 Restricted Unit Awards
The time-based restricted unit awards granted to our interest rate swap agreements. Upon terminationnamed executive officers in February 2023, except for the award for Ms. Sauls which was granted in March 2023, were as follows:
| | | | | | | | |
| Named Executive Officer | | 2023 Restricted Unit Awards |
| Zimmerman | | 34,578 |
| Witherow | | 10,028 |
| Fisher | | 11,480 |
| Nurse | | 5,187 |
| Sauls | | 3,425 |
| Ford | | 5,560 |
One-third of our interest rate swap agreements, we received $5.3 million at settlement, netthese time-based restricted units vests each year over an approximate three-year period. The restricted periods lapse in February of fees. In addition, we recognized a loss on early debt extinguishment of $1.8 million in 2022 upon full repayment of our senior secured term debt facility,2024, 2025 and we recognized a $5.9 million loss on early debt extinguishment in 2021 related2026, respectively, subject to the full redemptionexecutive’s continuous employment through the applicable payment date and exceptions in the employment and grant agreements and our executive severance plan. Restricted units are non-transferable during the restricted period. These awards will accrue distribution equivalents when we make partnership distributions, which will be paid out in cash upon the lapse of our 2024 senior notes. During 2022, we also recognized a $23.8 million net charge to earnings for foreign currency gains and losses compared with a $6.2 million net charge to earnings for 2021. Both amounts primarily represented the remeasurement of U.S.-dollar denominated notes to our Canadian entity's functional currency.
For 2022, a provision for taxes of $64.0 million was recorded to account for PTP taxes and federal, state, local and foreign income taxes compared with $20.0 million recorded for 2021. The increase in provision for taxes was primarily attributable to higher pretax income from our taxable subsidiaries in 2022.
After the items above, net income for 2022 totaled $307.7 million, or $5.45 per diluted limited partner unit, compared with a net loss of $48.5 million, or $0.86 per diluted unit, for 2021.
2022 vs. 2019
As described above, the results for the year ended December 31, 2022 were not directly comparablerestricted period along with the resultsoriginal awards. The continuous employment exceptions contained in the employment and grant agreements and our executive severance plan provide for continued vesting in qualifying termination situations, and include exceptions for double trigger change-in-control situations.
Under the year ended December 31, 2021 duemerger agreement, if the proposed merger with Six Flags closes, these (and other) restricted units will be converted into a corresponding award relating to shares of the combined company’s common stock, with the number of shares of the combined company’s common stock subject to such converted award based on the Cedar Fair exchange ratio in the merger agreement. The converted Cedar Fair equity awards will remain outstanding and subject to the effects of the COVID-19 pandemic. Therefore, we have included analysis comparing our 2022 results with our 2019 results. While the 2019 results are more comparablesame terms and conditions as applied to the 2022 results,corresponding Cedar Fair equity award immediately prior to the 2022 results are also not directly comparable with the 2019 results due to general inflationary impacts following three years of passedapplicable time, including rising costsvesting protections for qualifying terminations that occur within a period of 24 months following the COVID-19 pandemic, and the acquisition of Schlitterbahn Waterpark and Resort New Braunfels and Schlitterbahn Waterpark Galveston ("Schlitterbahn parks") on July 1, 2019. The year ended December 31, 2022 included 2,302 operating days compared with a total of 2,224 operating days for the year ended December 31, 2019. There were 85 incremental operating days at the Schlitterbahn parks in 2022 compared with 2019. Excluding the Schlitterbahn parks, there were seven fewer operating days in 2022 compared with 2019. The following table presents key financial information and operating statistics for the years ended December 31, 2022 and December 31, 2019:closing date.
| | | | | | | | | | | | | | | | | | | | | | | | | | |
| | | | | | | Increase (Decrease) |
| | | December 31, 2022 | | December 31, 2019 | | $ | | % |
| | (Amounts in thousands, except for per capita and operating days) |
| Net revenues | | $ | 1,817,383 | | | $ | 1,474,925 | | | $ | 342,458 | | | 23.2 | % |
| Operating costs and expenses | | 1,289,142 | | | 990,716 | | | 298,426 | | | 30.1 | % |
| Depreciation and amortization | | 153,274 | | | 170,456 | | | (17,182) | | | (10.1) | % |
| Loss on impairment/retirement of fixed assets, net | | 10,275 | | | 4,931 | | | 5,344 | | | N/M |
| | | | | | | | |
| Gain on sale of land | | (155,250) | | | — | | | (155,250) | | | N/M |
| Gain on other assets | | — | | | (617) | | | 617 | | | N/M |
| Operating income | | $ | 519,942 | | | $ | 309,439 | | | $ | 210,503 | | | 68.0 | % |
| | | | | | | | |
| Other Data: | | | | | | | | |
| | | | | | | | |
| | | | | | | | |
| Attendance (1) | | 26,912 | | | 27,938 | | | (1,026) | | | (3.7) | % |
| In-park per capita spending (1) (2) | | $ | 61.65 | | | $ | 48.32 | | | $ | 13.33 | | | 27.6 | % |
| Out-of-park revenues (2) | | $ | 213,337 | | | $ | 168,708 | | | $ | 44,629 | | | 26.5 | % |
| Operating days | | 2,302 | | | 2,224 | | | 78 | | | 3.5 | % |
N/M Not meaningful dueWe approved transaction-based awards (the “Merger Completion Awards”) to Messrs. Zimmerman, Witherow, Fisher and Nurse and Ms. Sauls to recognize their efforts in connection with our entry into the merger agreement with Six Flags, and to facilitate successful completion of the transactions contemplated by the merger agreement. Messrs. Zimmerman, Witherow, Fisher and Nurse received unit-based awards, and Ms. Sauls' award would pay out in cash. All of the Merger Completion Awards are subject to the naturetransaction closing and will only be earned if the transaction closing occurs.
Upon the closing, the unit-based Merger Completion Awards will be converted into corresponding awards denominated in shares of the expense line-item
(1) Attendancecombined company’s common stock, based on the Cedar Fair exchange ratio set forth in the merger agreement. 50% of the equity or cash, as applicable, subject to these awards would be payable 12 months after the grant date, and in-park per capita spending are non-GAAP financial measures. Theses metrics are usedthe other 50% of the equity or cash, as major factorsapplicable, subject to these awards would be payable on June 4, 2025, subject to the continuous employment requirements of the awards. If the closing date is extended in significant operational decisions as they are primary drivers of our financial and operational performance, measuring demand, pricing and consumer behavior. Seeaccordance with the definition and calculationmerger agreement, there would be corresponding extensions to the vesting dates of these measures above.awards.
(2) Net revenues as disclosed within the statementsMr. Zimmerman received Merger Completion Awards with respect to a total of operations and comprehensive income (loss) consist114,737 units, with a portion of in-park revenues and out-of-park revenues less amounts remitted to outside parties under concessionaire arrangements. In-park per capita spending is calculated as in-park revenues divided by total attendance. In-park revenues and concessionaire remittance totaled $1.35 billion and $43.7 million, respectively, for the year endedthose units covered in a December 31, 2019.
For the year ended December 31, 2022, net revenues totaled $1.8 billion compared with $1.5 billion for 2019. The increase in net revenues reflected the impact of a 28%, or $13.33, increase in in-park per capita spending to $61.65,award and a 26.5%, or $44.6portion of those units covered in a February 2024 award. The number of units underlying each other named executive officer recipient's Merger Completion Awards are as follows: Mr. Witherow (50,994 units); Mr. Fisher (50,994 units) and Mr. Nurse (25,497 units). Ms. Sauls is eligible to receive $200,000 in cash under her Merger Completion Award.
Ms. Sauls' New Hire Award
We granted Ms. Sauls an additional 12,000 time-based restricted units upon her hire in March 2023. The award cliff vests on February 23, 2026 to enhance its retentive value. Accordingly, these restricted units are subject to transfer restrictions until February 2026, and Mr. Sauls must remain in continuous employment through the February 2026 vesting date subject to exceptions set forth in the Severance Plan. The award will accrue distribution equivalents when we make partnership distributions, which will be paid out in cash upon the lapse of the restricted period.
Prior Year Award Performance and Payout Determinations
2023 was the first year for which performance against the goals was measured under our 2021-2025 performance units. Our executives earned compensation from the 2021-2025 performance awards based on the Company’s achievement level relative to the 2023 functional currency Adjusted EBITDA target and based upon the additional leverage ratio reduction target.
The performance goals for 2023 functional currency Adjusted EBITDA under the 2021-2025 performance units and related payout scale were as follows (with amounts interpolated between the various levels):
| | | | | | | | |
| 2023 Functional Currency Adjusted EBITDA * | | Payout as a Percentage of Target
Number of Units |
| < $530,100,000 | | No Payout |
| = $530,100,000 | | 50% |
| = $570,000,000 | | 100% |
| = $598,500,000 | | 150% |
| ≥ $609,900,000 | | 200% |
The Company achieved functional currency Adjusted EBITDA of $554 million increase in out-of-park revenues. These increases2023, which resulted in achieving 97.3% of the 2023 functional currency Adjusted EBITDA performance target. As a result, 80% of the target number of potential 2021-2025 performance units were partially offset bypaid out in February 2024.Under the impactaward terms, the executives will have additional opportunities to earn up to a total of a 4%, or 1.0 million-visit, decline200% of the target number of potential units based on functional currency Adjusted EBITDA targets for 2024 and, if applicable, 2025. To earn units under the Adjusted EBITDA portion of the award in attendance. The increase in in-park per capita spending was driven bycalendar years 2024 and 2025, the calculated payout must be incrementally higher guest spending across all key revenue categories, particularly admissions, food and beverage and extra-charge products. The increase in food and beverage and extra-charge spending was driven by both increased pricing and increased sales volume. The increase in out-of-park revenues was attributable to higher average daily room rates across much of our resort portfolio, increased online transaction fees charged to customers, higher sales at Knott's Berry Farm's Marketplace, as well as revenues from properties that opened or were acquired in 2019, includingthan the Resort at Schlitterbahn New Braunfels and a hotel adjacent to Carowinds. The decline in attendance was driven by an expected slower recovery in group sales attendanceprior year(s) and the planned reductionunits earned in those years will be limited to the incremental difference, if any. 2023 will not be re-tested when we assess performance achievement in the subsequent year(s).
Performance against the 2023 un-levered pre-tax free cash flow and net leverage ratio goals under the 2021-2025 performance units also was measured.We achieved a net leverage ratio of low-value ticket programs. The increase in4.2x for 2023.This achieved our goal of having a net revenues included a $2.6 million favorable impact of foreign currency exchange rates at our Canadian park.
Operating costs and expensesleverage ratio less than 5.0x for the year ended December 31, 2022 increased $298.4 million compared with 2019. This was the result of a $38.0 million increase in COGS, a $222.1 million increase in operating expenses and a $38.3 million increase in SG&A expense. COGS as a percentage of food, merchandise and games revenue increased 0.6% as the result of general inflationary cost pressures. The increase in operating expenses was attributable to a significant increase in seasonal labor rate, higher full-time wages primarily related to a planned increase in head count at select parks, higher related employee taxes and benefits, the inclusion2023.Accordingly, an additional 50% of the Schlitterbahn parks, higher coststarget number of potential performance units will be payable under this component of the 2021-2025 awards in March 2025, subject to the continuous employment requirements of the awards.
The Company did not achieve its un-levered pre-tax free cash flow goal for supplies,2023 under the 2021 performance units, which was to achieve un-levered pre-tax free cash flow equal to or greater than $400 million for 2023. Under the award terms, executives will have additional opportunities to earn units based upon un-levered pre-tax cash flow targets for 2024 and, incremental land lease and property tax costs associatedif applicable, 2025. The targets become incrementally more challenging each year.
Under the merger agreement, if the proposed merger with Six Flags closes, these (and other) performance units will be converted into a corresponding award denominated in shares of the combined company’s common stock, with the sale-leasebacknumber of the land at California's Great America. The increase in SG&A expense was largely due to an increase in full-time wages, including an increase in accrued bonus and equity-based compensation plan expenses, as well as an increase in transaction fees and technology related costs. These increases in SG&A expense were offset by a decline in advertising costs driven by a more efficient digital media strategy. The increase in operating costs and expenses included a $1.4 million unfavorable impactshares of foreign currency exchange rates at our Canadian park.
Depreciation and amortization expense for the year ended December 31, 2022 decreased $17.2 million compared with 2019 due primarily to the full depreciation of 15-year useful lived property and equipment from our 2006 acquisition of Paramount Parks, Inc., as well as the change in estimated useful life of a long-lived asset at Kings Dominion in 2019. These decreases were somewhat offset by the reduction of the estimated useful lives of the long-lived assets at California's Great America following the sale-leaseback of the land at California's Great America. The loss on impairment / retirement of fixed assets for 2022 was $10.3 million compared with $4.9 million for 2019, both of which included retirements of assets in the normal course of business.
After a $155.3 million gain on the sale of land at California's Great America during the third quarter of 2022 and the items above, operating income for 2022 totaled $519.9 million compared with $309.4 million for 2019.
Interestcombined company’s common stock subject to such converted award based on the Cedar Fair exchange ratio in the merger agreement. The converted Cedar Fair equity awards will remain outstanding and subject to the same terms and conditions as applied to the corresponding Cedar Fair equity award immediately prior to the applicable time, including vesting protections for qualifying terminations that occur within a period of 24 months following the closing date. Under the merger agreement, performance-based Cedar Fair equity awards will convert based on the greater of target and actual performance or, in the case of any performance period that is not in progress as of the closing effective time, target performance, as applicable. However, the Board may determine, at its discretion and subject to approval requirements in the merger agreement, that only a pro-rata portion of the target number of 2024-2026 performance units, based on the portion of the performance period completed prior to closing, will be converted into time-based restricted stock units of the combined company in connection with the merger. Performance-based Cedar Fair awards that are converted in the merger will not be subject to future performance-based vesting conditions (but will remain subject to service-based vesting conditions).
Employment Agreements, Post-Employment and Change in Control Compensation
We have multi-year employment agreements with Messrs. Zimmerman, Witherow and Fisher. Mr. Zimmerman’s employment agreement became effective in 2018 as part of our executive leadership transition process and continues until Mr. Zimmerman’s employment is terminated. Our agreements with Messrs. Witherow and Fisher automatically renewed in December 2023. The executives’ employment under these agreements continues through December 31, 2025, and the agreements automatically renewed for additional 24-month periods and will continue to renew unless terminated by one of the parties. In December 2023, Ms. Ford agreed to transition out of her role as Executive Vice President and Chief Marketing Officer and entered into a separation agreement with the Company. Ms. Ford remained employed with the Company in a non-executive role until March 29, 2024.
We adopted an executive severance plan in 2022 (the “Severance Plan”) for new executive officers and for certain other Company executives who do not have employment agreements. Mr. Nurse and Ms. Sauls accordingly participate in our Severance Plan and do not have employment agreements with the Company. See Potential Payments Upon Termination or Change in Control section for further discussion of our Severance Plan. The employment agreements and the Severance Plan provide for certain benefits in termination and change-in-control situations. In addition, certain of our incentive plans contain termination and change-in-control provisions that apply to our named executive officers. The employment agreements and Severance Plan foster long-term retention while still allowing the Compensation Committee to exercise considerable discretion in designing incentive compensation programs. The agreements that would apply to our named executive officers in a termination and change-in-control situation are discussed in detail under the Potential Payments Upon Termination or Change in Control section below. The merger agreement with Six Flags specifies how equity awards will be treated in connection with the merger. See Narrative to the Summary Compensation and Grants of Plan Based Awards Tables - Treatment of Equity Awards Under the Merger Agreement. Clawback Policy
The named executive officers’ incentive-based compensation is subject to our Clawback Policy. We adopted the clawback policy in October 2023 as required under the final exchange listing standards that implemented the clawback provisions of the final SEC rules under the Dodd-Frank Wall Street Reform and Consumer Protection Act of 2010. Under our Clawback Policy, if the Company is required to prepare an accounting restatement, our Board shall require reimbursement or forfeiture of any excess incentive-based compensation received by any executive officer during the three (3) completed fiscal years immediately preceding the date on which the Company is required to make the restatement. Our employment agreements and certain other arrangements such as our equity awards also contain certain clawback provisions.
Retirement Programs
Our named executive officers participate in our tax-qualified Cedar Fair Retirement Savings Plan. This plan, or a similar plan, is available to all of our eligible employees and contains a 401(k) matching program. It also had a profit-sharing component through 2022, with the annual amount of the profit-sharing contribution determined by the Board, after consideration of the Compensation Committee’s recommendation. Our contributions to this plan for our named executive officers are included in the “All Other Compensation” column of the Summary Compensation Table. Perquisites
We provide limited perquisites to certain of our named executive officers that we believe are reasonable, competitive and consistent with our overall compensation philosophy. When used, we believe that these benefits generally enhance the competitiveness of our compensation packages and represent a small percentage of overall compensation. The Company covers and reimburses commuting expenses for Mr. Nurse, including the cost of housing and transportation in connection with his travel to our office in Charlotte, NC. Amounts for such commuting expenses are included in the “All Other Compensation” column of the Summary Compensation Table.
RISK ASSESSMENT PROCESS
The Compensation Committee has reviewed our compensation programs and concluded that our compensation policies and practices do not create risks that are reasonably likely to have a material adverse effect on the Company. This risk assessment process included a review of the design and operation of our compensation programs, consultation with our compensation consultants at Semler Brossy, review of a risk assessment matrix which aided us in the process of identifying and evaluating situations or compensation elements that may raise material risks, and an evaluation of the controls and processes we have in place to manage those risks. Because we provide different types of compensation, consider various factors in assessing Company and individual performance, and the Compensation Committee retains discretion in certain compensation matters, we believe that our compensation program provides an effective and appropriate mix of incentives to help ensure the Company’s performance is focused on long-term value creation and does not encourage our executives to take unreasonable risks with respect to our business.
IMPACT OF TAX AND ACCOUNTING CONSIDERATIONS
In adopting various executive compensation plans and packages, as well as in making certain executive compensation decisions, particularly with respect to grants of unit-based long-term incentive awards, the Compensation Committee considers the accounting treatment and the anticipated financial statement impact of such decisions, as well as the anticipated dilutive impact on our unitholders.
As a result of our status as a Partnership, Section 162(m) of the Internal Revenue Code does not apply to Cedar Fair.
SECURITIES TRADING POLICY
Our Company has a policy that executive officers and non-employee directors may not purchase or sell our units when they may be in possession of nonpublic material information. In addition, this policy restricts short sale transactions and transactions involving put or call options relating to our securities, pledging of our securities, and holding of our securities in margin accounts.
Summary Compensation Table
The table below summarizes the total compensation paid to or earned by each of the named executive officers for the fiscal year ended December 31, 2023. The table also summarizes, for each of our named executive officers for 2023 who was also one of our named executive officers for 2022 and/or 2021, the total compensation paid to or earned by the officer for the fiscal years ended December 31, 2022 and 2021.
| | | | | | | | | | | | | | | | | | | | | | | | | | | | | | | | | | | | | | | | |
| (a) | (b) | (c) | | (d) | (e) | (f) | (g) | (h) | (i) | (j) |
| Name and Principal Position | Year | Salary
($) | Bonus
($) | Unit Awards
($) (1) | Option Awards
($) | Non-Equity Incentive Plan Compensation
($) (2) | Change in Pension Value and Non-qualified Deferred Compensation Earnings ($) | All Other Compensation
($) (3) | Total ($) |
| Richard A. Zimmerman | 2023 | $ | 950,000 | | | — | | | $ | 4,999,979 | | | — | | $ | 565,725 | | — | | | $ | 19,812 | | | $ | 6,535,516 | |
| President and Chief Executive Officer | 2022 | $ | 908,400 | | | — | | | $ | 4,375,035 | | | — | | $ | 1,986,671 | | — | | | $ | 15,676 | | | $ | 7,285,782 | |
| 2021 | $ | 850,000 | | | — | | | $ | 6,716,340 | | | — | | $ | 2,416,125 | | — | | | $ | 8,700 | | | $ | 9,991,165 | |
| | | | | | | | | | | | | | |
| Brian C. Witherow | 2023 | $ | 578,200 | | | — | | | $ | 1,450,020 | | | — | | $ | 229,545 | | — | | | $ | 19,812 | | | $ | 2,277,577 | |
| Executive Vice President and Chief Financial Officer | 2022 | $ | 561,400 | | | — | | | $ | 1,418,998 | | | — | | $ | 820,205 | | — | | | $ | 15,676 | | | $ | 2,816,279 | |
| 2021 | $ | 532,000 | | | — | | | $ | 2,114,268 | | | — | | $ | 1,008,140 | | — | | | $ | 8,666 | | | $ | 3,663,074 | |
| | | | | | | | | | | | | | |
| Tim V. Fisher | 2023 | $ | 648,900 | | | — | | | $ | 1,660,022 | | | — | | $ | 322,016 | | — | | | $ | 19,812 | | | $ | 2,650,750 | |
| Chief Operating Officer | 2022 | $ | 630,000 | | | — | | | $ | 3,783,005 | | | — | | $ | 1,152,900 | | — | | | $ | 15,676 | | | $ | 5,581,581 | |
| 2021 | $ | 600,000 | | | — | | | $ | 2,369,476 | | | — | | $ | 1,421,250 | | — | | | $ | 8,700 | | | $ | 4,399,426 | |
| | | | | | | | | | | | | | |
| Brian M. Nurse (4) | 2023 | $ | 437,800 | | | — | | | $ | 749,997 | | | — | | $ | 188,473 | | — | | | $ | 43,823 | | | $ | 1,420,093 | |
| Executive Vice President, Chief Legal Officer and Corporate Secretary | 2022 | $ | 425,000 | | | — | | | $ | 708,012 | | | — | | $ | 619,863 | | — | | | $ | 36,797 | | | $ | 1,789,672 | |
| | | | | | | | | | | | | |
| | | | | | | | | | | | | | |
| Monica R. Sauls (5) | 2023 | $ | 300,000 | | | — | | | $ | 1,025,621 | | | — | | $ | 108,321 | | — | | | $ | 11,077 | | | $ | 1,445,019 | |
| Senior Vice President and Chief Human Resources Officer | | | | | | | | | | | | | | |
| | | | | | | | | | | | | |
| | | | | | | | | | | | | | |
| Kelley S. Ford (6) | 2023 | $ | 437,100 | | | — | | | $ | 804,005 | | | — | | $ | 188,172 | | — | | | $ | 19,812 | | | $ | 1,449,089 | |
| Former Executive Vice President and Chief Marketing Officer | 2022 | $ | 426,400 | | | — | | | $ | 804,034 | | | — | | $ | 619,986 | | — | | | $ | 15,676 | | | $ | 1,866,096 | |
| 2021 | $ | 402,000 | | | — | | | $ | 1,173,279 | | | — | | $ | 761,790 | | — | | | $ | 8,700 | | | $ | 2,345,769 | |
| | | | | | | | | | | | | | |
(1) The amounts in column (e) reflect the aggregate grant date fair value computed in accordance with FASB ASC Topic 718 of unit-based awards other than options granted during the fiscal year ended December 31, 2023, 2022 or 2021, as applicable. The amounts included in this table for all performance unit and other incentive-based unit awards were computed based on the probable outcome of the applicable performance conditions on the grant date, which was the target level of performance for all goals applicable to such unit awards other than the unit-based Merger Completion Awards.
The 2023 amount for each executive includes the grant date fair value of the 2023 restricted unit awards and the grant date fair value of the performance unit awards for the 2023-2025 performance period. The ASC Topic 718 grant date fair value of the 2023-2025 performance unit awards by executive assuming target and maximum levels of performance are as follows: Mr. Zimmerman - $3,499,985 (target), $6,999,970 (maximum); Mr. Witherow - $1,015,005 (target), $2,030,010 (maximum); Mr. Fisher - $1,162,020 (target), $2,324,040 (maximum); Mr. Nurse - $524,985 (target), $1,049,970 (maximum); Ms. Sauls - $350,006 (target), $700,012 (maximum); and Ms. Ford - $562,812 (target), $1,125,624 (maximum). The 2023 amount for Ms. Sauls also includes the grant date fair value of an additional 12,000 time-based restricted units new hire award made to Ms. Sauls in March 2023. Messrs. Zimmerman, Witherow, Fisher and Nurse also received unit-based Merger Completion Awards related to the proposed merger with Six Flags. Since the consummation of the business combination was not deemed probable under ASC Topic 718, the grant date fair value of the unit-based Merger Completion Awards, based on the probable outcome of the performance condition at the grant date, is reflected as $0 in column (e). The grant date fair value of the number of units that would be earned under the December 2023 awards if the merger closing occurs would have been as follows: Mr. Zimmerman - $3,571,295; Mr. Witherow - $1,999,985; Mr. Fisher - $1,999,985; and Mr. Nurse - $999,992.
The 2022 amount for each executive includes the grant date fair value of the 2022 restricted unit awards and the grant date fair value of the performance unit awards for the 2022-2024 performance period. The ASC Topic 718 grant date fair value of the 2022-2024 performance unit awards by executive assuming target and maximum levels of performance are as follows: Mr. Zimmerman - $3,062,525 (target), $6,125,049 (maximum); Mr. Witherow - $993,276 (target), $1,986,552 (maximum); Mr. Fisher - $1,120,009 (target), $2,240,018 (maximum); Mr. Nurse - $495,609 (target), $991,217 (maximum); and Ms. Ford - $562,807 (target), $1,125,614 (maximum). The 2022 amount for Mr. Fisher also includes an additional 50,000 time-based restricted units award made to Mr. Fisher in August 2022 in recognition of Mr. Fisher's leadership and efforts in completing the sale of the land at California's Great America.
The 2021 amount for each executive includes the grant date fair value of the 2021 restricted unit awards, the grant date fair value of the performance unit awards for the 2021-2025 performance period, and the grant date fair value of the modified 2018-2020 performance unit awards. The modified 2018-2020 performance unit awards were part of the executives' targeted total direct compensation opportunities for 2018. However, the 2021 accounting expense in connection with the final payouts on these awards is included in this table in accordance with applicable SEC rules. The ASC Topic 718 grant date fair value of the 2021-2025 performance unit awards by executive assuming achievement of the targeted and maximum levels of performance on all three goals are as follows: Mr. Zimmerman - $4,759,953 (target), $7,139,930 (maximum); Mr. Witherow - $1,276,769 (target), $1,915,153 (maximum); Mr. Fisher - $1,440,031 (target), $2,160,047 (maximum); and Ms. Ford - $723,575 (target), $1,085,363 (maximum).
Assumptions used in the calculation of these amounts are discussed in Note 8 to the Partnership's audited financial statements for the fiscal year ended December 31, 2023, included in the Original Form 10-K.
(3) The amounts shown in column (i) reflect, for each named executive officer, 401(k) matching contributions and profit-sharing contributions. Prior to March 27, 2023, 401(k) matching contributions were 3% of pay and profit-sharing contributions were 4% of pay up to the respective limitations imposed under rules of the Internal Revenue Service. Beginning March 27, 2023, we increased 401(k) matching contributions from 3% of pay to 4% of pay and discontinued profit-sharing contributions. There were no 2021 profit-sharing contributions for the named executive officers, and no 2022 profit-sharing contributions for Mr. Nurse and no 2023 profit-sharing contributions for Ms. Sauls as they were not employed with us during the respective performance periods. The amounts shown in column (i) for Mr. Nurse also reflect $30,988 and $30,047 of commuting expenses, including the cost of housing and transportation in connection with his travel to our office in Charlotte, North Carolina, for 2023 and 2022, respectively. For additional discussion of contributions that we make for our named executive officers under our Retirement Savings Plan and of perquisites we provide our named executive officers, see Compensation Discussion and Analysis - Elements of Executive Compensation - Retirement Programs and Compensation Discussion and Analysis - Elements of Executive Compensation - Perquisites. (4) Mr. Nurse joined Cedar Fair as Executive Vice President, Chief Legal Officer and Corporate Secretary on November 15, 2021.
(5) Ms. Sauls joined Cedar Fair as Senior Vice President and Chief Human Resources Officer on March 20, 2023.
(6) Ms. Ford resigned as Executive Vice President and Chief Marketing Officer in December 2023. She remained an employee of Cedar Fair until March 29, 2024, serving in a non-executive role.
Grants of Plan-Based Awards Table for 2023
| | | | | | | | | | | | | | | | | | | | | | | | | | | | | | | | | | | | | | | | | | | | | | | | | | | | | | | | | | | |
| (a) | (b) | (c) | (d) | (e) | (f) | (g) | (h) | (i) | (j) | (k) | (l) |
| | Estimated Possible Payouts Under Non-Equity Incentive Plan Awards | Estimated Future Payouts Under Equity Incentive Plan Awards | All Other Unit Awards: Number of Units (#) | All Other Option Awards: Number of Securities Underlying Options (#) | Exercise or Base Price of Option Awards ($/unit) | Grant Date Fair Value of Unit and Option Awards ($) |
| Name | Grant Date | Threshold
($) | Target
($) | Maximum
($) | Threshold
(#) | Target
(#) | Maximum
(#) |
| | | | | | | | | | | | | | | | | | | |
| Zimmerman | 2/9/23 | — | | | — | | | — | | | 40,341 | | (2) | 80,682 | | (2) | 161,364 | | (2) | — | | | — | | — | | $ | 3,499,985 | | |
| 2/9/23 | — | | | — | | | — | | | — | | | — | | | — | | | 34,578 | | (3) | — | | — | | $ | 1,499,994 | | |
| 12/4/23 | — | | | — | | | — | | | — | | | 91,058 | | (4) | — | | | — | | | — | | — | | — | | (4) |
| | $ | 320,625 | | (1) | $ | 1,425,000 | | (1) | $ | 2,850,000 | | (1) | — | | | — | | | — | | | — | | | — | | — | | — | | |
| | | | | | | | | | | | | | | | | | | |
| | | | | | | | | | | | | | | | | | | |
| Witherow | 2/9/23 | — | | | — | | | — | | | 11,699 | | (2) | 23,398 | | (2) | 46,796 | | (2) | — | | | — | | — | | $ | 1,015,005 | | |
| 2/9/23 | — | | | — | | | — | | | — | | | — | | | — | | | 10,028 | | (3) | — | | — | | $ | 435,015 | | |
| 12/4/23 | — | | | — | | | — | | | — | | | 50,994 | | (4) | — | | | — | | | — | | — | | — | | (4) |
| | $ | 130,095 | | (1) | $ | 578,200 | | (1) | $ | 1,156,400 | | (1) | — | | | — | | | — | | | — | | | — | | — | | — | | |
| | | | | | | | | | | | | | | | | | | |
| | | | | | | | | | | | | | | | | | | |
| Fisher | 2/9/23 | — | | | — | | | — | | | 13,394 | | (2) | 26,787 | | (2) | 53,574 | | (2) | — | | | — | | — | | $ | 1,162,020 | | |
| 2/9/23 | — | | | — | | | — | | | — | | | — | | | — | | | 11,480 | | (3) | — | | — | | $ | 498,002 | | |
| 12/4/23 | — | | | — | | | — | | | — | | | 50,994 | | (4) | — | | | — | | | — | | — | | — | | (4) |
| | $ | 182,503 | | (1) | $ | 811,125 | | (1) | $ | 1,622,250 | | (1) | — | | | — | | | — | | | — | | | — | | — | | — | | |
| | | | | | | | | | | | | | | | | | | |
| | | | | | | | | | | | | | | | | | | |
| Nurse | 2/9/23 | — | | | — | | | — | | | 6,051 | | (2) | 12,102 | | (2) | 24,204 | | (2) | — | | | — | | — | | $ | 524,985 | | |
| 2/9/23 | — | | | — | | | — | | | — | | | — | | | — | | | 5,187 | | (3) | — | | — | | $ | 225,012 | | |
| 12/4/23 | — | | | — | | | — | | | — | | | 25,497 | | (4) | — | | | — | | | — | | — | | — | | (4) |
| | $ | 93,033 | | (1) | $ | 437,800 | | (1) | $ | 875,600 | | (1) | — | | | — | | | — | | | — | | | — | | — | | — | | |
| | | | | | | | | | | | | | | | | | | |
| | | | | | | | | | | | | | | | | | | |
| Sauls | 3/20/23 | — | | | — | | | — | | | 3,996 | | (2) | 7,991 | | (2) | 15,982 | | (2) | — | | | — | | — | | $ | 350,006 | | |
| 3/20/23 | — | | | — | | | — | | | — | | | — | | | — | | | 3,425 | | (3) | — | | — | | $ | 150,015 | | |
| 3/20/23 | — | | | — | | | — | | | — | | | — | | | — | | | 12,000 | | (5) | — | | — | | $ | 525,600 | | |
| | $ | 53,468 | | (1) | $ | 251,616 | | (1) | $ | 503,233 | | (1) | — | | | — | | | — | | | — | | | — | | — | | — | | |
| | — | | | $ | 200,000 | | (6) | $ | — | | — | — | | | — | | | — | | | — | | | — | | — | | — | | |
| | | | | | | | | | | | | | | | | | | |
| | | | | | | | | | | | | | | | | | | |
| Ford | 2/9/23 | — | | | — | | | — | | | 6,487 | | (2) | 12,974 | | (2) | 25,948 | | (2) | — | | | — | | — | | $ | 562,812 | | |
| 2/9/23 | — | | | — | | | — | | | — | | | — | | | — | | | 5,560 | | (3) | — | | — | | $ | 241,193 | | |
| | $ | 92,884 | | (1) | $ | 437,100 | | (1) | $ | 874,200 | | (1) | — | | | — | | | — | | | — | | | — | | — | | — | | |
| | | | | | | | | | | | | | | | | | | |
(1) Amounts reflect possible payouts under 2023 cash incentive awards that were based on the achievement of Company and individual performance measures. The threshold, target and maximum opportunities in column (c), (d) and (e), respectively, assume achievement of the threshold, target or maximum level of the Company performance goals, and assume 0% payout, 100% payout and 200% payout on the individual component. There was an additional level in between threshold and target for the Company performance goals for which 50% of that portion of the target award could have been earned, and there was an additional level in between target and maximum for the Company performance goals for which 150% of that portion of the target award could have been earned. There was no threshold for the individual performance component.
Narrative to Summary Compensation and Grants of Plan-Based Awards Tables
The description that follows summarizes the terms and conditions of our employment arrangements with Messrs. Zimmerman, Witherow, Fisher, and Nurse and Ms. Sauls. It also summarizes the terms of and the programs under which the compensation reflected in the tables for our named executive officers was awarded. Additional information is provided in the Compensation Discussion and Analysis and Potential Payments upon Termination or Change in Control sections. Ms. Ford was employed under an employment agreement, and we entered into a transition and release agreement with Ms. Ford in connection with her departure. See the Potential Payments upon Termination or Change in Control section (and the "Payments and Benefits in Connection with Ms. Ford's Separation" discussion therein) regarding her arrangements. Employment Agreements
We have an employment agreement with Richard A. Zimmerman, our President and Chief Executive Officer, which was entered into in 2017, took effect in January 2018 and which will continue indefinitely until his employment is terminated under the terms of the employment agreement. The agreement establishes Mr. Zimmerman's base salary at an annual rate of $750,000 commencing in 2018 and provides that his base salary will be reviewed from time to time, but will not be subject to decrease except in the event of salary reductions applicable to substantially all of our senior executives. Under the agreement, during his employment period, Mr. Zimmerman is eligible to participate in our cash incentive compensation plans and equity incentive plans, including our 2016 Omnibus Incentive Plan, at a level appropriate to his respective position and performance, as determined by the Board. Per the terms of his employment agreement, his target cash incentive award for 2018 was 115% of his base salary. The agreement provides that his cash incentive targets will be reviewed from time to time but will not be subject to decrease except in the event of a target reduction applicable to substantially all of our senior executives.
The agreement provides that, if Mr. Zimmerman's employment is terminated, in certain situations he becomes fully vested in any equity awards made under Cedar Fair’s Omnibus Incentive Plan that vest within 18 months after his termination of employment. This 18-month provision does not apply to Mr. Zimmerman's Merger Completion Awards. The agreement provides for any Omnibus Plan equity awards to immediately vest upon a change in control; however, the employment agreement change in control provisions were waived or modified for Mr. Zimmerman's outstanding equity awards. Any calendar year cash incentive compensation awards are to be paid to Mr. Zimmerman at the same time as our other senior executives and no later than March 15 following the end of the year. Mr. Zimmerman generally must be employed on the last day of the year to receive a cash incentive award for that year, but the agreements specify certain situations where a termination of employment would not result in forfeiture of a cash incentive award. See the Potential Payments Upon Termination or Change in Control section for detailed descriptions of the above-described situations and other potential termination and change in control benefits. In addition, Mr. Zimmerman is eligible to participate in any benefit and compensation plans that we offer from time to time, including medical, disability, life insurance, 401(k) and deferred compensation plans, on the same basis as our other senior executives, and he is entitled to four weeks of annual paid vacation days. The agreement contains non-competition, confidentiality, non-disparagement and assignment of inventions provisions and a clawback provision in favor of Cedar Fair that is further described below. Our employment agreements with Mr. Witherow (our Executive Vice President and Chief Financial Officer) and Mr. Fisher (our Chief Operating Officer) were automatically renewed on January 1, 2024. The executives’ employment under the agreements continues through December 31, 2025, subject to 24-month automatic renewal periods until either party provides written notice of its intent to terminate the agreement at least 60 days prior to the automatic renewal date. The agreements entitle each executive to receive a specified annual base salary, which will be reviewed from time to time but will not be subject to decrease except in the event of salary reductions applicable to substantially all of our senior executives. The minimum annual base salary amount specified in the agreement for Mr. Witherow, which was effective beginning January 2015, was $416,000. Mr. Fisher's agreement
established his minimum base salary at an annual rate of $550,000 commencing in 2018. During the employment period, each executive is eligible to participate in our cash incentive compensation plans and equity incentive plans, including our Omnibus Incentive Plan, at a level appropriate to his or her position and performance, as determined by the Board. Any calendar year cash incentive awards are to be paid to the executive at the same time as our other senior executives and no later than March 15 following the end of the year. The executives generally must be employed on the last day of the year to receive a cash incentive award for that year, but the agreement specifies certain situations where a termination of employment would not result in forfeiture of a cash incentive award. The agreement also provides that, if employment is terminated in certain situations, the executive will become fully vested in any equity awards made under Cedar Fair’s Omnibus Incentive Plan that vest within 18 months after the termination of employment. This 18-month provision does not apply to the executive's Merger Completion Award. The agreement provides for any Omnibus Plan equity awards to immediately vest upon a change in control; however, the employment agreement change in control provisions were waived or modified for the named executive officers' outstanding equity awards.
Mr. Nurse and Ms. Sauls participate in our Severance Plan and do not have an employment agreement with the Company. For a description of the benefits under our Severance Plan, see the Potential Payments Upon Termination or Change in Control section. In addition, pursuant to a letter agreement between the Company and Mr. Nurse, the Company has agreed to reimburse Mr. Nurse for certain commuting expenses incurred in connection with his travel to our office in Charlotte, North Carolina, including the cost of airfare, airport parking and rental car expenses. Under the letter agreement, the Company also agreed to gross up applicable withholding taxes to the extent the commuting expense reimbursements are treated as Mr. Nurse’s taxable income. In 2023, the Company did not provide any other gross ups except an immaterial amount to Mr. Witherow for a holiday gift program. See the Potential Payments Upon Termination or Change in Control section for detailed descriptions of those situations and other potential termination and change in control benefits for each of our NEOs. In addition, each executive is eligible to participate in any benefit and compensation plans that we offer from time to time, including medical, disability, life insurance, 401(k) and deferred compensation plans, on the same basis as our other senior executives (other than the CEO), and the executive is entitled to annual vacation days and reimbursement for reasonable business expenses incurred in performing his or her duties in accordance with policies that we maintain from time to time. Each agreement, as well as our Severance Plan, contains non-competition, confidentiality, non-disparagement and assignment of inventions provisions and a clawback provision in favor of Cedar Fair that is further described below. Under the clawback provisions of our employment agreements, our Board may require an executive to return their incentive compensation paid or granted within the preceding twenty-four months, if (i) the payment was predicated upon achieving certain financial results that were subsequently the subject of a substantial restatement of Cedar Fair's financial statements filed with the Securities and Exchange Commission, (ii) the Board determines that the executive engaged in intentional misconduct that caused or substantially caused the need for the substantial restatement, and (iii) a lower payment would have been made based upon the restated financial results. Our named executive officers' incentive-based compensation also is subject to our Clawback Policy. For a discussion of the benefits that would be provided by the employment agreements in the event of each executive's death, retirement, disability or other terminations or upon a change in control, see Potential Payments Upon Termination or Change in Control in this Form 10-K/A. Cash Incentive Awards and Bonuses
The amounts reported in column (g) of the Summary Compensation Table represent final payouts of the annual cash incentive awards for 2023, 2022 and 2021, which were tied to the achievement of performance measures and target award opportunities established by March of the applicable year. For 2023 and 2022 and for Messrs. Zimmerman, Witherow and Fisher, 90% of the target cash incentive award opportunities were based on a target for consolidated functional currency Adjusted EBITDA before incentive compensation expense for the year, and 10% of the target cash incentive award opportunities were based upon the achievement of individual performance goals. For 2023 and 2022 increased $51.6 million compared with 2019 due to interest incurredand for Mr. Nurse and Mses. Sauls and Ford, as applicable, 85% of the target cash incentive award opportunities were based on a target for consolidated functional currency Adjusted EBITDA before incentive compensation expense for the year, and 15% of the target cash incentive awards were based upon the achievement of individual performance goals. For 2021 and for all named executive officers, 70% of the target cash incentive award opportunities were based on consolidated functional currency Adjusted EBITDA targets, and 30% of the target cash incentive awards were based on achievement of Company-level strategic objectives. The targeted levels of Adjusted EBITDA performance for 2021 varied depending on the 2025 senior notes, 2028 senior noteslevel of attendance achieved. For 2023, 2022 and 2029 senior notes offset2021, payout of the Adjusted EBITDA portion of the award could range from 0% up to a maximum of 200% of the target award, and specific threshold, target and maximum levels of performance and related payout scales were established. In addition to the threshold, target and maximum levels, there was an additional level for the Adjusted EBITDA portion of the award between target and maximum for which 150% of the target award could be earned. For 2023 and 2022, we added a 25% threshold payout level to the performance / payout curve for achievement at 91% of target versus the historical 50% threshold payout level for achievement at 93% of target. The 2021 Adjusted EBITDA targets varied based on attendance levels, and there was an associated Adjusted EBITDA target and a range of potential payouts within each tier of attendance. The payout of the Adjusted EBITDA portion of the 2021 awards was capped at 125% if Adjusted EBITDA was negative. For 2023 and 2022, payout of the individual performance-based portion of the award could range from 0% to 200% and was dependent on the level of achievement of three individual goals. For 2021, payout of the strategic objective portion of the award could range from 0% to 200% and was dependent on the achievement of specific initiatives. The threshold, target and maximum cash incentive awards for 2023 are reported in partcolumns (c), (d) and (e), respectively, of the Grants of Plan-Based Awards Table. For additional detail regarding our cash incentive award program and the 2023 cash incentive awards (including the percentage of 2023 base salary represented by each executive's
Option Awards
We did not grant options to our named executive officers in 2023, 2022 or 2021.
Restricted Unit Awards
We made time-based restricted unit grants to our named executive officers in 2023, 2022 and 2021. The grant date fair values of restricted units are included in the applicable year's amounts in the Unit Awards column (e) of the Summary Compensation Table. The restricted period on the 2023, 2022 and 2021 awards will lapse upon the executive's continuous employment through the applicable vesting dates, as follows: | | | | | | | | | | | |
| Grant: | 2021 Restricted Unit Awards | 2022 Restricted Unit Awards | 2023 Restricted Unit Awards |
| | | |
| Vesting Dates: | 1/3 - February 2022 (1) | 1/3 - February 2023 (1) | 1/3 - February 2024 (1) |
| 1/3 - February 2023 (1) | 1/3 - February 2024 (1) | 1/3 - February 2025 |
| 1/3 - February 2024 (1) | 1/3 - February 2025 | 1/3 - February 2026 |
(1) Vested prior to the date of this 10-K/A.
The table above does not include: (1) the restricted unit new hire award to Mr. Nurse in November 2021, which vests on February 24, 2025; (2) the additional 50,000 time-based restricted unit award to Mr. Fisher in August 2022, which vests on August 23, 2025; and (3) the restricted unit new hire award to Ms. Sauls in March 2023, which vests on February 23, 2026.
The executive is unable to sell, transfer, pledge or assign restricted units during the applicable restricted period and will not receive any payments or partnership distributions during that period, but the executive may vote the restricted units during the restricted period. The restricted units accumulate distribution equivalents during the restricted period in the same form as any such distributions. Upon the expiration of the applicable restricted period, the units will thereafter be unrestricted and any accrued distribution equivalents will be paid promptly. Our employment agreements provide for 18 month continued vesting of these restricted units for qualifying terminations. Mr. Nurse and Ms. Sauls are entitled to continued vesting in a prorated portion of these restricted units for qualifying terminations under the Severance Plan adopted in 2022. Otherwise, executives will forfeit their restricted units and any distribution equivalents if they do not satisfy the continuous employment requirement, except in the cases of death, disability and retirement, and change in control. The named executive officers' outstanding restricted unit awards are subject to the change in control provisions in our 2016 Omnibus Incentive Plan; however, the restricted unit award agreements for Mr. Nurse (since his 2022 restricted unit award) and for Ms. Sauls modify the double trigger to a single trigger if our equity awards are not assumed or replaced following a change in control in which our units become exchangeable for the securities of another entity. See "Treatment of Equity Awards Under the Merger Agreement" regarding how these awards would be treated in connection with the proposed merger. For additional detail regarding the 2023 restricted unit awards, see Compensation Discussion and Analysis - Elements of Executive Compensation - Long-Term Incentive Compensation (and the "- 2023 Restricted Unit Awards" discussion therein). Performance Unit Awards
We made performance unit awards to our named executive officers in 2023, 2022 and 2021. The grant date fair values of the performance unit awards granted, calculated in accordance with ASC Topic 718 and based upon the probable outcome of the performance conditions, are included in the 2023, 2022 and 2021 amounts set forth in the Unit Awards column (e) of the Summary Compensation Table, respectively. 2023-2025 Performance Unit Awards
The 2023 performance unit awards are subject to the level of achievement of cumulative un-levered pre-tax free cash flow versus the target set by the impactPeople, Culture & Compensation Committee for the January 1, 2023 through December 31, 2025 performance period. Executives are eligible to receive up to 200% of the redemptiontarget number of potential performance units for the applicable performance period. Payouts will be determined based on a sliding scale of performance objectives, and no awards will be paid if the threshold performance level is not achieved.
The 2023 performance unit awards will be payable in units if earned. Distribution equivalents are earned on the number of performance units that become payable after the grant date and before the payment date of the 2024 senior notesaward. Any amounts earned under the 2023 performance unit awards would be paid after the end of the performance period and by March 2026. Our employment agreements provide for 18 month continued vesting of these performance awards following qualifying terminations. Mr. Nurse and Ms. Sauls are entitled to continued vesting in December 2021a prorated portion of the target number of potential 2023-2025 performance units following qualifying terminations under the Severance Plan. Otherwise, an executive must remain in continuous employment with us through the payment date or will forfeit the entire award, except in qualifying termination scenarios and
subject to change in control provisions. Awards will be prorated in the event of death, disability or retirement. The 2023 performance unit awards are subject to the change in control provisions in our 2016 Omnibus Incentive Plan, and the prepaymentaward agreements provide for payment at target in qualifying scenarios; however, the agreements for Mr. Nurse and Ms. Sauls modify the double trigger to a single trigger if our equity awards are not assumed or replaced following a change in control in which our units become exchangeable for the securities of term debtanother entity. See "Treatment of Equity Awards Under the Merger Agreement" regarding how these awards would be treated in 2020. connection with the proposed merger. For additional detail regarding the 2023 performance units (including the payout scale for the awards), see Compensation Discussion and Analysis - Elements of Executive Compensation - Long-Term Incentive Compensation (and the "- 2023-2025 Performance Unit Awards" discussion therein). 2022-2024 Performance Unit Awards
The 2025 senior notes2022 performance unit awards are subject to the level of achievement of cumulative un-levered pre-tax free cash flow versus the target set by the People, Culture & Compensation Committee for the January 1, 2022 through December 31, 2024 performance period. Executives are eligible to receive up to 200% of the target number of potential performance units for the applicable performance period. Payouts will be determined based on a sliding scale of performance objectives, and no awards will be paid if the threshold performance level is not achieved.
The 2022 performance unit awards will be payable in units if earned. Distribution equivalents are earned on the number of performance units that become payable after the grant date and before the payment date of the award. Any amounts earned under the 2022 performance unit awards would be paid after the end of the performance period and by March 2025. Our employment agreements provide for 18 month continued vesting of these performance awards following qualifying terminations. Mr. Nurse is entitled to continued vesting in a prorated portion of the target number of potential 2022-2024 performance units following qualifying terminations under the Severance Plan. Otherwise, an executive must remain in continuous employment with us through the payment date or will forfeit the entire award, except in qualifying termination scenarios and subject to change in control provisions. Awards will be prorated in the event of death, disability or retirement. The 2022 performance unit awards are subject to the change in control provisions in our 2016 Omnibus Incentive Plan, and the 2028 senior notes were issuedaward agreements provide for payment at target in 2020qualifying scenarios; however, Mr. Nurse's agreement modifies the double trigger to supplement liquiditya single trigger if our equity awards are not assumed or replaced following a change in responsecontrol in which our units become exchangeable for the securities of another entity. See "Treatment of Equity Awards Under the Merger Agreement" regarding how these awards would be treated in connection with the proposed merger.
2021-2025 Performance Unit Awards
The 2021 performance unit awards are subject to the impactslevel of achievement of functional currency Adjusted EBITDA, un-levered pre-tax free cash flow, and net leverage ratio goals. The 2021 awards have annual goals for each of 2023, 2024 and 2025 that increase each year, and there are several potential payout dates. Executives are eligible to receive up to 200% of a targeted number of potential performance units specified in the award agreements for the applicable performance period for the Adjusted EBITDA portion of the 2021 performance unit awards. Payouts on the Adjusted EBITDA portion of the awards are determined based on a sliding scale of performance objectives, and no awards would be paid if the threshold performance level is not achieved. Units under the Adjusted EBITDA portion of the award vest as they are earned starting with 2023 and become payable shortly after the end of the calendar year in which units are earned, subject to the executive remaining in continuous employment through the payment date except for certain qualifying terminations. The Company achieved 97.3% of the functional currency Adjusted EBITDA goal for 2023, resulting in payouts of 80% on that portion of the award. To earn units under the Adjusted EBITDA portion of the award in calendar years 2024 and 2025, the calculated payout must be incrementally higher than the prior year(s) and the units earned in those years will be limited to the incremental difference, if any. Once we have determined payout for a given year, that year will not be re-tested when we assess performance achievement in the subsequent year(s). Payouts of the Adjusted EBITDA portion of the award are based on the following scale (with amounts interpolated between the various levels and payout as a percentage of the target number of Adjusted EBITDA units): achievement of less than 93% of the applicable annual functional currency Adjusted EBITDA target (0% payout); achievement of 93% of the applicable annual functional currency Adjusted EBITDA target (50% payout); achievement of 100% of the applicable annual functional currency Adjusted EBITDA target (100% payout); achievement of 105% of the applicable annual functional currency Adjusted EBITDA target (150% payout); and achievement greater than or equal to 107% of the applicable annual functional currency Adjusted EBITDA target (200% payout).
Performance against the un-levered pre-tax free cash flow and net leverage ratio goals under the 2021 performance units was measured for 2023, and the Company exceeded its net leverage ratio reduction goal for 2023. Performance against the un-levered pre-tax free cash flow goals will be measured for each of 2024 and, if applicable, 2025, and the targets become incrementally more challenging each year. Executives are eligible to receive 50% of the number of potential performance units that would be payable for achieving target Adjusted EBITDA performance for each of the un-levered pre-tax free cash flow and net leverage ratio portions of the 2021 performance unit awards. Each of these additional goals will be determined to have achieved or not achieved with no interpolation for performance or payout. Once the un-levered pre-tax free cash flow goal or net leverage ratio goal has been achieved in a given year, additional units cannot be earned for achievement of such metric in the subsequent year(s). Payouts for the 2021 performance unit awards may thus range from 0% to 300%.
The 2021 performance unit awards are payable in units if earned. Distribution equivalents are earned on the number of performance units that become payable after the grant date and before the payment date of the award. The first payout on the Adjusted EBITDA portion of the 2021 performance units occurred in the first three months of 2024 (based on achievement of 2023
goals). The net leverage ratio portion of the 2021 performance units will be paid in the first three months of 2025, subject to continuous employment requirements. There are two additional potential payout dates for the 2024 and 2025 Adjusted EBITDA goals and the un-levered pre-tax free cash flow portion of these awards. Our employment agreements provide for 18 month continued vesting of these performance awards following qualifying terminations. Our Severance Plan adopted in 2022 also provides for 18 month continued vesting of these performance awards following qualifying terminations. Otherwise, an executive must remain in continuous employment with us through the payment date or will forfeit the entire award, except in qualifying termination scenarios and subject to change in control provisions. Awards will be prorated in the event of death, disability or retirement. The 2021 performance unit awards are subject to the change in control provisions in our 2016 Omnibus Incentive Plan, and the award agreements provide for payment at target in qualifying scenarios; however, see "Treatment of Equity Award Under the Merger Agreement" regarding how these awards would be treated in connection with the proposed merger.
2018-2020 Performance Unit Awards
Because of the significant disruption to our business from the COVID-19 pandemic, and the 2029 senior notesimpact of the 2020 Adjusted EBITDA loss on the cumulative achievement for 2018-2020, three-year performance was below the threshold and none of the potential units would have been earned under the 2018-2020 performance unit awards. The People, Culture & Compensation Committee and Board decided to allow management the opportunity to potentially earn an award and to evaluate performance after completion of the performance period taking into account actual 2018-2019 Adjusted EBITDA achieved and management’s performance relative to the Company’s strategic goals established during 2020. We modified the 2018-2020 performance unit awards and approved payouts at 81.3% of the target number of units in February 2021. The modified grant date fair value of these awards, calculated in accordance with ASC Topic 718, are included in the 2021 amounts set forth in the Unit Awards column (e) of the Summary Compensation Table. Merger Completion Awards
We made additional transaction-based awards (the “Merger Completion Awards”) to certain named executive officers in recognition of their efforts in connection with Cedar Fair's entry into a definitive merger agreement with Six Flags and to facilitate successful completion of the transactions contemplated by the merger agreement. Messrs. Zimmerman, Witherow, Fisher and Nurse received unit-based awards, and Ms. Sauls’ award would pay out in cash. All of the Merger Completion Awards are subject to the transaction closing and will only be earned if the transaction closing occurs. An executive must remain in continuous employment with us through the payment date or will forfeit the entire award.
Upon the closing, the unit-based Merger Completion Awards will be converted into corresponding awards denominated in shares of the combined company’s common stock, based on the Cedar Fair exchange ratio set forth in the merger agreement. 50% of the equity or cash, as applicable, subject to these awards would be payable 12 months after the grant date, and the other 50% of the equity or cash, as applicable, subject to these awards would be payable on June 4, 2025, subject to the continuous employment requirements of the awards. If the closing date is extended in accordance with the merger agreement, there would be corresponding extensions to the vesting dates of these awards. Distribution equivalents are earned in cash on the Merger Completion Awards. Since the consummation of the business combination was not deemed probable under ASC Topic 718, the grant date fair value of the unit-based Merger Completion Awards is reflected as $0 in the Unit Awards column (e) of the Summary Compensation Table. The units covered by Mr. Zimmerman’s December 2023 Merger Completion Award are reflected in column (h) of the Grants of Plan-Based Awards Table. Mr. Zimmerman received a Merger Completion Award covering an additional 23,679 units in February 2024. Treatment of Equity Awards Under the Merger Agreement
Under the merger agreement, if the proposed merger with Six Flags closes, restricted units will be converted into a corresponding award relating to shares of the combined company’s common stock, with the number of shares of the combined company’s common stock subject to such converted award based on the Cedar Fair exchange ratio in the merger agreement. Also under the merger agreement, if the proposed merger with Six Flags closes, performance units will be converted into a corresponding award denominated in shares of the combined company’s common stock, with the number of shares of the combined company’s common stock subject to such converted award based on the Cedar Fair exchange ratio in the merger agreement. The converted Cedar Fair equity awards will remain outstanding and subject to the same terms and conditions as applied to the corresponding Cedar Fair equity award immediately prior to the applicable time, including vesting protections for qualifying terminations that occur within a period of 24 months following the closing date. Under the merger agreement, performance-based Cedar Fair equity awards will convert based on the greater of target and actual performance or, in the case of any performance period that is not in progress as of the closing effective time, target performance, as applicable, and will not be subject to future performance-based vesting conditions (but will remain subject to service-based vesting conditions). The 2024-2026 performance units permit the Board to determine, at its discretion and subject to approval requirements in the merger agreement, that only a pro-rata portion of the target number of 2024-2026 performance units will be converted into time-based restricted stock units in connection with the merger.
Outstanding Equity Awards at Fiscal Year-End for 2023
| | | | | | | | | | | | | | | | | | | | | | | | | | | | | | | | | | | | | | | | | | | | | | | | | | |
| Option Awards | | Unit Awards |
| (a) | (b) | (c) | (d) | (e) | (f) | | (g) | (h) | (i) | (j) |
| Name | Number of Securities Underlying Unexercised Options Exercisable
(#) | Number of Securities Underlying Unexercised Options Unexercisable
(#) | Equity Incentive Plan Awards: Number of Securities Underlying Unexercised Unearned Options
(#) | Option Exercise Price
($) | Option Expiration Date | | Number of Units That Have Not Vested
(#) (1) | Market Value of Units That Have Not Vested
($) (2) | Equity Incentive Plan Awards: Number of Unearned Units or Other Rights That Have Not Vested
(#) | Equity Incentive Plan Awards: Market or Payout Value of Unearned Units or Other Rights That Have Not Vested
($) |
| | | | | | | | | | | | | | | | |
| Zimmerman | | | | | | | | | 7,164 | | (3) | $ | 298,022 | | | | | | |
| | | | | | | | | 15,300 | | (4) | $ | 636,480 | | | | | | |
| | | | | | | | | 34,578 | | (5) | $ | 1,417,698 | | | | | | |
| | | | | | | | | | | | | | | | |
| | | | | | | | | | | | | | | | |
| | | | | | | | | 68,089 | | (6) | $ | 2,709,934 | | (6) | 89,039 | | (6) | $ | 3,543,760 | | (6) |
| | | | | | | | | | | | | 111,860 | | (10) | $ | 4,452,028 | | (10) |
| | | | | | | | | | | | | 83,081 | | (11) | $ | 3,306,624 | | (11) |
| | | | | | | | | | | | | 91,058 | | (12) | $ | 3,651,426 | | (12) |
| | | | | | | | | | | | | | | | |
| Witherow | | | | | | | | | 2,989 | | (3) | $ | 124,342 | | | | | | |
| | | | | | | | | 4,962 | | (4) | $ | 206,419 | | | | | | |
| | | | | | | | | 10,028 | | (5) | $ | 411,148 | | | | | | |
| | | | | | | | | | | | | | | | |
| | | | | | | | | | | | | | | | |
| | | | | | | | | 18,264 | | (6) | $ | 726,895 | | (6) | 23,883 | | (6) | $ | 950,555 | | (6) |
| | | | | | | | | | | | | 36,280 | | (10) | $ | 1,443,944 | | (10) |
| | | | | | | | | | | | | 24,094 | | (11) | $ | 958,941 | | (11) |
| | | | | | | | | | | | | 50,994 | | (12) | $ | 2,044,859 | | (12) |
| Fisher | | | | | | | | | 3,371 | | (3) | $ | 140,234 | | | | | | |
| | | | | | | | | 5,594 | | (4) | $ | 232,710 | | | | | | |
| | | | | | | | | 11,480 | | (5) | $ | 470,680 | | | | | | |
| | | | | | | | | 50,000 | | (7) | $ | 2,080,000 | | | | | | |
| | | | | | | | | | | | | | | | |
| | | | | | | | | 20,599 | | (6) | $ | 819,820 | | (6) | 26,937 | | (6) | $ | 1,072,073 | | (6) |
| | | | | | | | | | | | | 40,908 | | (10) | $ | 1,628,138 | | (10) |
| | | | | | | | | | | | | 27,583 | | (11) | $ | 1,097,803 | | (11) |
| | | | | | | | | | | | | 50,994 | | (12) | $ | 2,044,859 | | (12) |
| Nurse | | | | | | | | | 1,275 | | (3) | $ | 53,040 | | | | | | |
| | | | | | | | | 2,476 | | (4) | $ | 103,002 | | | | | | |
| | | | | | | | | 5,187 | | (5) | $ | 212,667 | | | | | | |
| | | | | | | | | 10,000 | | (8) | $ | 416,000 | | | | | | |
| | | | | | | | | | | | | | | | |
| | | | | | | | | 7,791 | | (6) | $ | 310,078 | | (6) | 10,188 | | (6) | $ | 405,486 | | (6) |
| | | | | | | | | | | | | 18,102 | | (10) | $ | 720,460 | | (10) |
| | | | | | | | | | | | | 12,462 | | (11) | $ | 495,988 | | (11) |
| | | | | | | | | | | | | 25,497 | | (12) | $ | 1,022,430 | | (12) |
| | | | | | | | | | | | | | | | |
| | | | | | | | | | | | | | | | |
| Sauls | | | | | | | | | 3,425 | | (5) | $ | 139,398 | | | | | | |
| | | | | | | | | 12,000 | | (9) | $ | 488,400 | | | | | | |
| | | | | | | | | | | | | | | | |
| | | | | | | | | | | | | | | | |
| | | | | | | | | | | | | | | | |
| | | | | | | | | | | | | | | | |
| | | | | | | | | | | | | 8,173 | | (11) | $ | 325,285 | | (11) |
| | | | | | | | | | | | | | | | |
| | | | | | | | | | | | | | | | |
| Ford | | | | | | | | | 1,694 | | (3) | $ | 70,470 | | | | | | |
| | | | | | | | | 2,812 | | (4) | $ | 116,979 | | | | | | |
| | | | | | | | | 3,707 | | (5) | $ | 151,987 | | | | | | |
| | | | | | | | | | | | | | | | |
| | | | | | | | | | | | | | | | |
| | | | | | | | | 10,351 | | (6) | $ | 411,954 | | (6) | 13,535 | | (6) | $ | 538,709 | | (6) |
| | | | | | | | | | | | | 20,556 | | (10) | $ | 818,129 | | (10) |
| | | | | | | | | | | | | | | | |
| | | | | | | | | | | | | | | | |
(1) Column includes restricted units.
(2) The market values for restricted units were issued atcalculated by multiplying the closing market price of our units on December 31, 2023 as reported on the NYSE ($39.80), by the number of restricted units in column (g), and adding to that the amount of cash distribution equivalents accumulated on the restricted units from the grant date of the award through December 31, 2023. See Narrative to Summary Compensation and Grants of Plan-Based Awards Table – Restricted Unit Awards for additional detail. (3) Amounts represent 2021 restricted unit awards. These awards vested and were paid on February 26, 2024. These restricted units accumulated distribution equivalents during the restricted period that were payable in the same form as accrued when the awards vested. Distribution equivalents accumulated as of the fiscal year-end are reflected only in column (h) as all distribution equivalents on the restricted units were accrued in cash.
(4) Amounts represent 2022 restricted unit awards. One half of these restricted units vested on February 26, 2024 and the remaining one half will vest on February 24, 2025. These restricted units accumulate distribution equivalents during the restricted period that will be payable in the same form as accrued when the awards vest. Distribution equivalents accumulated as of the fiscal year-end are reflected only in column (h) as all distribution equivalents on the restricted units have been accrued in cash.
(5) Amounts represent 2023 restricted unit awards. One-third of these restricted units vested on February 26, 2024, and one-third will vest on February 24, 2025 and February 23, 2026. Ms. Ford forfeited the one-third of her restricted units that would have vested on February 23, 2026 upon termination. Therefore, for Ms. Ford, one-half of these restricted units vested on February 26, 2024 and the remaining one half will vest on February 24, 2025. These restricted units accumulate distribution equivalents during the restricted period that will be payable in the same form as accrued when the awards vest. Distribution equivalents accumulated as of the fiscal year-end are reflected only in column (h) as all distribution equivalents on the restricted units have been accrued in cash.
(6) Amounts represent 2021-2025 performance units that are contingent upon the level of achievement of consolidated functional currency Adjusted EBITDA, un-levered pre-tax free cash flow and net leverage ratio goals. The amounts set forth in column (g) include units and distribution equivalents earned as of December 31, 2023, including an 80% payout related to the 2023 consolidated functional currency Adjusted EBITDA goal and a 50% payout related to the 2023 net leverage goal. The payout related to the 2023 consolidated functional currency Adjusted EBITDA goal was paid in February 2024. The payout related to the 2023 net leverage goal will be payable during the first quarter of 2025. The amounts set forth in column (i) assume that the maximum number of remaining units are earned and assume the reinvestment in distribution equivalent units of partnership distributions on such remaining maximum number from the grant date of the award through December 31, 2023. The actual number of units and distribution equivalents earned will be determined (as applicable) following the end of 2024 and 2025. Any units earned under the remaining Adjusted EBITDA portions of the awards will vest and be payable shortly after the end of the second quarter of 2019calendar year in coordination withwhich units are earned. Any units earned under the acquisitionun-levered pre-tax free cash flow portion of the Schlitterbahn parks. The net effectawards would be payable in early 2025 (if goal is achieved in 2024) or early 2026 (if goal is achieved in 2025). Market value reported in column (h) is calculated by multiplying the actual number of units and distribution equivalent units earned through December 31, 2023 set forth in column (g) by the closing market price of our swaps resultedunits as of December 31, 2023. Market value reported in column (j) is calculated by multiplying the maximum remaining number of units and distribution equivalent units through December 31, 2023 that may be earned set forth in column (i) by the closing market price of our units as of December 31, 2023.
(7) Amount represents a $25.6 million benefitrestricted unit award to earningsMr. Fisher on August 23, 2022. The award vests on August 23, 2025. These restricted units accumulate distribution equivalents during the restricted period that will be payable in the same form as accrued when the awards vest. Distribution equivalents accumulated as of the fiscal year-end are reflected only in column (h) as all distribution equivalents on the restricted units have been accrued in cash.
(8) Amount represents a restricted unit new hire award to Mr. Nurse on November 17, 2021. The award vests on February 24, 2025. These restricted units accumulate distribution equivalents during the restricted period that will be payable in the same form as accrued when the awards vest. Distribution equivalents accumulated as of the fiscal year-end are reflected only in column (h) as all distribution equivalents on the restricted units have been accrued in cash.
(9) Amount represents a restricted unit new hire award to Ms. Sauls on March 20, 2023. The award vests on February 23, 2026. These restricted units accumulate distribution equivalents during the restricted period that will be payable in the same form as accrued when the awards vest. Distribution equivalents accumulated as of the fiscal year-end are reflected only in column (h) as all distribution equivalents on the restricted units have been accrued in cash.
(10) Amounts represent 2022 performance units that are contingent upon the level of achievement of cumulative un-levered pre-tax free cash flow versus the target during the period from January 2022 through December 2024. The amounts set forth in column (i) assume that the maximum number of units are earned and assume the reinvestment in distribution equivalent units of partnership distributions on such maximum number from the grant date of the award through December 31, 2023. The actual number of units and distribution equivalents earned will be determined following the end of the performance period and would vest and be payable in units by March 2025. Market value reported in column (j) was calculated by multiplying the
maximum number of units and distribution equivalent units through December 31, 2023 that may be earned set forth in column (i) by the closing market price of our units as of December 31, 2023.
(11) Amounts represent 2023 performance units that are contingent upon the level of achievement of cumulative un-levered pre-tax free cash flow versus the target during the period from January 2023 through December 2025. The amounts set forth in column (i) assume that the target number of units are earned and assume the reinvestment in distribution equivalent units of partnership distributions on such target number from the grant date of the award through December 31, 2023. The actual number of units and distribution equivalents earned will be determined following the end of the performance period and would vest and be payable in units by March 2026. Market value reported in column (j) was calculated by multiplying the target number of units and distribution equivalent units through December 31, 2023 that may be earned set forth in column (i) by the closing market price of our units as of December 31, 2023. For additional information regarding these awards, see Compensation Discussion and Analysis - Elements of Executive Compensation - Long-Term Incentive Compensation - 2023-2025 Performance Unit Awards. (12) Amounts represent unit-based Merger Completion Awards that are contingent upon the closing of the proposed merger with Six Flags and reflect the number of units that would be earned if the merger closing occurs. These unit-based awards accumulate distribution equivalents that will be payable in the same form as accrued when the awards vest. Distribution equivalents accumulated as of the fiscal year-end are reflected only in column (j) as all distribution equivalents on these unit-based awards have been accrued in cash. The equity and distributions earned upon closing will be payable 50% 12 months after December 4, 2023 and 50% 18 months after December 4, 2023. Market value reported in column (j) was calculated by multiplying the target number of units that may be earned set forth in column (i) by the closing market price of our units as of December 31, 2023 plus the value of distribution equivalents earned through December 31, 2023. For additional information regarding these awards, see Compensation Discussion and Analysis - Elements of Executive Compensation - Merger Completion Awards.
Option Exercises and Units Vested in 2023
| | | | | | | | | | | | | | | | | | | | | | | | | | |
| Option Awards | | Unit Awards |
| (a) | (b) | (c) | | (d) | (e) |
| Name | Number of Units Acquired on Exercise (#) | Value Realized on Exercise ($) | | Number of Units Acquired on Vesting
(#) (2) | Value Realized on Vesting
($) (2) |
| Zimmerman | 32,929 | | $ | 263,432 | | (1) | | 6,116 | | (3) | $ | 283,171 | | (3) |
| | | | | 7,164 | | (4) | $ | 331,693 | | (4) |
| | | | | 7,650 | | (5) | $ | 354,195 | | (5) |
| | | | | | | | |
| Witherow | 27,092 | | $ | 216,736 | | (1) | | 2,551 | | (3) | $ | 118,111 | | (3) |
| | | | | 2,989 | | (4) | $ | 138,391 | | (4) |
| | | | | 2,482 | | (5) | $ | 114,917 | | (5) |
| | | | | | | | |
| Fisher | | | | | 2,878 | | (3) | $ | 133,251 | | (3) |
| | | | | 3,371 | | (4) | $ | 156,077 | | (4) |
| | | | | 2,799 | | (5) | $ | 129,594 | | (5) |
| | | | | | | | |
| | | | | | | | |
| Nurse | | | | | 2,550 | | (4) | $ | 118,065 | | (4) |
| | | | | 1,238 | | (5) | $ | 57,319 | | (5) |
| | | | | | | | |
| | | | | | | | |
| | | | | | | | |
| | | | | | | | |
| Sauls | | | | | — | | (6) | $ | — | | (6) |
| Ford | 13,943 | | $ | 112,241 | | (1) | | 1,205 | | (3) | $ | 55,792 | | (3) |
| | | | | 1,694 | | (4) | $ | 78,432 | | (4) |
| | | | | 1,406 | | (5) | $ | 65,098 | | (5) |
| | | | | | | | |
(1) The value realized on the exercise of unit options is equal to the number of units acquired multiplied by the difference between the exercise price and the closing price of our units on the NYSE on the day before the date of exercise.
(2) The amounts in column (d) reflect the total number of restricted units that vested for 2022 compared with a $16.5 million charge to earningseach executive in 2023. The amounts in column (e) do not reflect accrued distribution equivalents in the form of cash for restricted units.
(3) Reflects the vesting and related value of one-third of the 2020 restricted unit awards granted in 2019. The difference was attributablevalue realized on the vesting of restricted units is calculated as the number of restricted units vested multiplied by the closing price of our units on the NYSE on the day before the date of vesting. In addition to the changeamounts in fair marketcolumn (e), each named executive officer also received distribution equivalents in the form of cash for these units as follows: Mr. Zimmerman ($15,107), Mr. Witherow ($6,303), Mr. Fisher ($7,109) and Ms. Ford ($2,977).
(4) Reflects the vesting and related value of our swap portfolio prior to terminationone-third of the 2021 restricted unit awards. The value realized on the vesting of restricted units is calculated as the number of restricted units vested multiplied by the closing price of our interest rate swap agreements. We terminated our interest rate swap agreements duringunits on the third quarterNYSE on the day before the date of vesting. In addition to the amounts in column (e), each named executive officer also received distribution equivalents in the form of cash for these units as follows: Mr. Zimmerman ($4,298), Mr. Witherow ($1,793), Mr. Fisher ($2,023), Mr. Nurse ($1,538) and Ms. Ford ($1,016).
(5) Reflects the vesting and related value of one-third of the 2022 followingrestricted unit awards. The value realized on the full repaymentvesting of restricted units is calculated as the number of restricted units vested multiplied by the closing price of our senior secured term loan facility resulting in a $5.3 million cash receipt upon termination, netunits on the NYSE on the day before the date of fees.vesting. In addition we recognized a $1.8 million lossto the amounts in column (e), each named executive officer also received distribution equivalents in the form of cash for these units as follows: Mr. Zimmerman ($4,590), Mr. Witherow ($1,489), Mr. Fisher ($1,679), Mr. Nurse ($743) and Ms. Ford ($844).
(6) Ms. Sauls joined Cedar Fair as Senior Vice President and Chief Human Resources Officer on early debt extinguishmentMarch 20, 2023. She was not granted any awards that vested in 2023.
Pay Versus Performance Disclosure
| | | | | | | | | | | | | | | | | | | | | | | | | | |
| (a) | (b) | (c) | (d) | (e) | (f) | (g) | (h) | (i) |
| Year | Summary Compensation Table Total for PEO (1) | Compensation Actually Paid to PEO (1) | Average Summary Compensation Table Total for Non-PEO NEOs (2) | Average Compensation Actually Paid to Non-PEO NEOs (2) | Value of Initial Fixed $100 Investment Based On: | Net Income (Loss)
(in thousands) | Functional Currency Adjusted EBITDA
(in thousands) (4) |
| Total Unitholder Return | Peer Group Total Unitholder Return
(TSR) (3) |
| 2023 | $ | 6,535,516 | | $ | 5,806,727 | | $ | 1,848,506 | | $ | 1,603,003 | | $ | 79.03 | | $ | 88.49 | | $ | 124,559 | | $ | 554,352 | |
| 2022 | $ | 7,285,782 | | $ | 8,372,850 | | $ | 3,013,407 | | $ | 3,296,205 | | $ | 79.72 | | $ | 67.52 | | $ | 307,668 | | $ | 580,644 | |
| 2021 (5) | $ | 9,991,165 | | $ | 10,624,247 | | $ | 2,933,892 | | $ | 2,962,471 | | $ | 95.16 | | $ | 135.66 | | $ | (48,518) | | $ | 331,396 | |
| 2020 (5) | $ | 1,437,733 | | $ | (3,110,511) | | $ | 787,701 | | $ | (767,643) | | $ | 74.79 | | $ | 139.08 | | $ | (590,243) | | $ | (309,114) | |
(1) Mr. Zimmerman was the primary executive officer ("PEO") in all periods presented. Compensation Actually Paid to Mr. Zimmerman is derived from the Summary Compensation Table Total for each fiscal year by making the following deductions and additions for 2023, 2022, upon full repayment2021 and 2020:
| | | | | | | | | | | | | | |
| 2023 | 2022 | 2021 | 2020 |
| Summary Compensation Table ("SCT") Total | $ | 6,535,516 | | $ | 7,285,782 | | $ | 9,991,165 | | $ | 1,437,733 | |
| Less: | | | | |
| SCT - Unit Awards | 4,999,979 | | 4,375,035 | | 6,716,340 | | 637,497 | |
| Prior fiscal year ("PY") fair value for awards that were forfeited during fiscal year ("CY") | — | | — | | — | | 4,139,387 | |
| Plus: | | | | |
| Fair value of awards granted during CY that were outstanding and unvested at PY | 4,682,828 | | 5,439,517 | | 6,473,209 | | 898,250 | |
| Change in fair value of awards granted in prior years that were unvested at PY | (785,718) | | (318,879) | | 596,903 | | (549,718) | |
| Change in fair value of awards granted in prior years that vested in CY | 305,629 | | 315,429 | | 115,847 | | (151,817) | |
| Grant date fair value of awards that were granted and vested in CY | — | | — | | 163,463 | | — | |
| Distributions paid on restricted unit awards during CY | 68,451 | | 26,036 | | — | | 31,925 | |
| Compensation Actually Paid | $ | 5,806,727 | | $ | 8,372,850 | | $ | 10,624,247 | | $ | (3,110,511) | |
(2) The 2023 non-primary executive officer named executive officers ("Non-PEO NEOs") included Messrs. Witherow, Fisher and Nurse and Mses. Sauls and Ford. The 2022 Non-PEO NEOs included Messrs. Witherow, Fisher and Nurse and Ms. Ford. The 2021 Non-PEO NEOs included Messrs. Witherow and Fisher, Ms. Ford, Mr. Craig A. Heckman, former Executive Vice President, Human Resources, and Mr. Duffield E. Milkie, former Executive Vice President and General Counsel. The 2020 Non-PEO NEOs included Messrs. Witherow, Fisher and Milkie and Ms. Ford. Compensation Actually Paid to the Non-PEO NEOs is derived from the average Summary Compensation Table Total for each fiscal year by making the following deductions and additions for 2023, 2022, 2021 and 2020:
| | | | | | | | | | | | | | |
| 2023 | 2022 | 2021 | 2020 |
| Summary Compensation Table ("SCT") Total | $ | 1,848,506 | | $ | 3,013,407 | | $ | 2,933,892 | | $ | 787,701 | |
| Less: | | | | |
| SCT - Unit Awards | 1,137,933 | | 1,678,512 | | 1,551,155 | | 299,100 | |
| Prior fiscal year ("PY") fair value for awards that were forfeited during fiscal year ("CY") | — | | — | | — | | 1,449,486 | |
| Plus: | | | | |
| Fair value of awards granted during CY that were outstanding and unvested at PY | 940,386 | | 1,925,121 | | 1,188,835 | | 421,440 | |
| Change in fair value of awards granted in prior years that were unvested at PY | (153,589) | | (109,154) | | 279,877 | | (191,200) | |
| Change in fair value of awards granted in prior years that vested in CY | 75,117 | | 128,793 | | 60,055 | | (48,102) | |
| Grant date fair value of awards that were granted and vested in CY | — | | — | | 50,967 | | — | |
| Distributions paid on restricted unit awards during CY | 30,516 | | 16,550 | | — | | 11,104 | |
| Compensation Actually Paid | $ | 1,603,003 | | $ | 3,296,205 | | $ | 2,962,471 | | $ | (767,643) | |
(3) The amounts set forth under the heading "Peer Group Total Unitholder Return (TSR)" reflect the comprehensive total unitholder return, as of our senior secured term debt facility. During 2022, we also recognized a $23.8 million net charge to earnings for foreign currency gainsthe applicable fiscal year-end, of an initial investment of $100 as of December 31, 2019 into the S&P - Movies and losses compared with a $21.1 million net benefit to earnings for 2019. Both amounts primarily represented the remeasurement of U.S.-dollar denominated notes to our Canadian entity's functional currency.Entertainment Index.
For 2022, a provision for taxes of $64.0 million was recorded to account for PTP taxes and federal, state, local and foreign income taxes compared with $42.8 million recorded for 2019. The increase in provision for taxes was primarily attributable to higher pretax income from our taxable subsidiaries in 2022.
After the items above, net income for 2022 totaled $307.7 million, or $5.45 per diluted limited partner unit, compared with $172.4 million, or $3.03 per diluted unit, for 2019.
Adjusted EBITDA
(4) Functional Currency Adjusted EBITDA represents earnings before interest, taxes, depreciation, amortization, other non-cash items, and adjustments as defined in our
credit agreement. This measurement differs from the Adjusted EBITDA amounts we report in our earnings releases and financial reports because functional currency Adjusted EBITDA is calculated using the functional currency of the country where the income or loss was earned (i.e., the Canadian dollar for our Canadian operations). See the discussion under Compensation Discussion and Analysis - Compensation
Performance Measures. Functional Currency Adjusted EBITDA is reported as the Company-selected measure for all periods presented but may not have been the most important measure for prior periods and may be a different measure in future years. (5) The COVID-19 pandemic had a material impact on our business in 2020, and to a lesser extent in 2021.
Disclosures Concerning Pay-Versus-Performance
This disclosure is being provided as required by the final rules issued by the Securities and Exchange Commission on August 25, 2022, and certain measures disclosed in the table above and discussed below, including “Compensation Actually Paid,” are calculated in accordance with those rules. The People, Culture & Compensation Committee did not consider these measures (other than Functional Currency Adjusted EBITDA) or calculations in setting compensation for the named executive officers or for linking executive compensation with Company performance for 2023 or any prior periods. For a description of the People, Culture & Compensation Committee’s processes, policies, and considerations when setting compensation and evaluating performance, please see Compensation Discussion and Analysis. Relationship Between Company TSR and “Compensation Actually Paid”
Our TSR increased 6% over the disclosed period from $74.79 in 2020 to $79.03 at the end of 2023, but was significantly impacted (particularly in 2020) by the COVID-19 pandemic during that period. The "Compensation Actually Paid" to our PEO and non-PEO NEOs (on average) in 2020, in particular, reflect the challenges of that year at $(3,110,511) and $(767,643), respectively. "Compensation Actually Paid" increased in 2021, reflective of the recovery of our business and our unit price during that year to $10,624,247 for our PEO and $2,962,471 for our non-PEO NEOs (on average). For 2022, the "Compensation Actually Paid" to our PEO decreased to $8,372,850. "Compensation Actually Paid" to our non-PEO NEOs (on average) increased to $3,296,205 for 2022, but was affected by the granting of a one-time award to Mr. Fisher during the year and base salary increases for the non-PEO NEO's in 2022 (following no increases in 2021 in response to the COVID-19 pandemic). In 2023, "Compensation Actually Paid" to our PEO decreased to $5,806,727 and "Compensation Actually Paid" to our non-PEO NEOs (on average) decreased to $1,603,003. Thus, over the period “Compensation Actually Paid” generally increased in correlation with changes in the Company’s TSR, even though we have not used TSR as a metric for incentive compensation awards during the disclosed period. We believe this is because a significant portion of named executive officer compensation is granted through restricted unit awards and performance unit awards which track the Company’s unit price. In addition, we use financial metrics in our incentive plans, each of which may indirectly impact our unit price. Accordingly, as the Company’s unit price increases (and TSR likewise increases), we would expect the value of a named executive officer’s long-term incentives to generally increase in correlation. Similarly, as the Company’s unit price decreases, we would expect the value of a named executive officer’s long-term incentives to generally decrease in correlation.
Relationship Between Net Income and “Compensation Actually Paid”
The Company does not directly employ net income as a financial performance measure upon which named executive officer compensation may be earned. However, net income movements impact the metrics we use in our annual incentive plans and the cumulative Functional Currency Adjusted EBITDA metric used as the main metric for our 2021-2025 performance unit awards and as the sole metric in our performance units awarded in and prior to 2020. Accordingly, annual cash incentive awards were earned in all years presented by our PEO and non-PEO NEOs based on achievement against the applicable annual targets, except for in 2020 due to the severe disruption in our business due to the COVID-19 pandemic. The Company achieved 97.3% of the Functional Currency Adjusted EBITDA goal component of the 2021-2025 performance unit awards for 2023. Because of the severe disruption in our business because of the COVID-19 pandemic, however, the Company did not achieve any of its cumulative Functional Currency Adjusted EBITDA targets over the 2022, 2021 and 2020 periods presented, as those targets were set prior to the onset of the pandemic in anticipation of normalized operations and growth.
Relationship Between Functional Currency Adjusted EBITDA and “Compensation Actually Paid”
Reflective of the Company’s strategic objective to deliver consistent profitable growth, Functional Currency Adjusted EBITDA (as defined in our Compensation Discussion and Analysis above) has served as a key financial performance measure upon which annual cash incentive awards and long-term performance units could be earned throughout the period presented. Thus, Functional Currency Adjusted EBITDA in part would impact “Compensation Actually Paid” based on the Company’s achievement against the applicable targets. Over the four-year period, PEO Compensation Actually Paid increased 287% and non-PEO average Compensation Actually Paid increased 309%, while Functional Currency Adjusted EBITDA increased 279% over the same period. 2023 cash incentive awards were based on Functional Currency Adjusted EBITDA before incentive-compensation expenses as described in Compensation Discussion and Analysis - Compensation Performance Measures. Comparison Between Company TSR and Peer Group TSR
Over the four-year period measured in the table above, the Company’s TSR has increased by approximately 5.7%, while the TSR of the S&P - Movies and Entertainment Index has decreased by approximately 36.4% over the same period.
Most Important Financial Measures
The below tabular list identifies the financial measures deemed by the People, Culture & Compensation Committee to be the most important financial measures for linking the compensation of the Company’s named executive officers to the performance of the
| | | | | |
| MOST IMPORTANT FINANCIAL MEASURES |
| • | Functional Currency Adjusted EBITDA |
| • | Functional Currency Adjusted EBITDA before incentive compensation expense |
| • | Un-Levered Pre-Tax Free Cash Flow |
| • | Net Leverage Ratio |
Pay Ratio Disclosure
SEC rules require us to disclose the median of the annual total compensation of all employees (except our CEO), the annual total compensation of the CEO and the ratio of these two amounts for our last completed fiscal year.
We identified the median employee from a comparison of compensation information for all Company employees as of November 5, 2023 other than our CEO. The 2023 date for identifying the median employee differs from the 2022 date as the comparable Sunday for 2023, as compared to the 2022 date, was selected resulting in a calendar shift. Given the nature of our business, we rely heavily on seasonal, entry-level employees, some of whom only work one or two months per year. Consequently, as of the date we determined our median employee, seasonal employees accounted for 58.7% of our workforce. To identify the median employee, we used annual earnings reported to taxing authorities (for example, in the United States, information reported on W-2s), and ranked employees from highest to lowest. For purposes of this determination, compensation paid in Canadian dollars to our Canadian employees was converted to U.S. dollars using Canadian to U.S. dollar exchange rates, consistent with the exchange methodology used in our financial reporting. The median employee of all employees except the CEO was a seasonal employee.
Once we found the median employee, we computed the annual total compensation for 2023 for that employee in the same manner as total compensation is determined for the Summary Compensation Table. Accordingly, we determined that the median of the annual total compensation of all employees (except our CEO) was $14,650 for 2023. In 2023, Richard Zimmerman held the position of Chief Executive Officer of the Company. Mr. Zimmerman's compensation for 2023, calculated in the same manner as in the Summary Compensation Table, totaled $6,535,516. This resulted in an estimated CEO to median employee pay ratio of 446:1.
Potential Payments Upon Termination or Change in Control
The following summaries describe and quantify the payments that each named executive officer would receive if his or her employment with us were terminated or if we had a change in control. These payments and benefits derive from a combination of employment agreements, our Executive and Management Severance Plan (the "Severance Plan"), and our Omnibus Incentive Plans and related award agreements. In all cases, our severance arrangements, and the timing and amount of payments thereunder, are intended to comply with the requirements of Section 409A of the Code. We have quantified the potential payments assuming that the termination or change in control occurred on December 31, 2023 and the relevant unit price is the closing market price of our units on the NYSE on December 31, 2023, which was $39.80 per unit. Ms. Ford was not serving as an executive officer on December 31, 2023. Payments and benefits in connection with Ms. Ford's transition and release agreement and employment agreement are discussed and quantified separately under "Payments and Benefits in Connection with Ms. Ford's Separation".
Payments Pursuant to Employment Agreements or Severance Plan (other than in connection with a Change in Control)
The following information summarizes payments that our named executive officers will receive in the event of terminations without cause, as a result of death or disability, in connection with non-renewals of their employment agreements, as applicable, and in general. Descriptions of release requirements and restrictions relating to such payments and benefits, and of certain key defined terms, are provided at the end of this section. For information regarding payments in the event of a change in control, see "Payments Upon a Termination Following a Change in Control" below. For additional information regarding payments in the event of death, disability or retirement, see “Payments Upon Death, Disability or Retirement under our Incentive Plans” below.
Terminations without Cause or due to Disability and Resignations for Good Reason
If we terminate the employment of Messrs. Zimmerman, Witherow, Fisher or Nurse, or Ms. Sauls without cause or because of a disability, or if any of those executives resign for good reason (in each case, other than in connection with a change in control), each executive will be entitled to:
•Payment of accrued and unpaid base salary, reimbursement of business expenses and payment for accrued and unused vacation days, each as accrued as of the termination date, in a lump sum within 30 days following termination;
•Cash severance payments, as follows:
▪for Mr. Zimmerman, an amount equal to two times his base salary, payable in a single lump sum on the first regularly scheduled payroll date following the 60th day after the termination; or
▪for the other executives, an amount equal to one items base salary, payable at the same time salary otherwise would be paid to such executives over the 12-month period following termination, but with the first payment being made on the first regularly scheduled payroll date following the 60th day after the termination and including any payments that otherwise would be due earlier.
The amount of such cash severance payments will be reduced by any payments received from any short- or long-term disability plan maintained by us, where applicable;
•Any unpaid annual cash incentive award earned with respect to a calendar year ending on or before the date of termination, payable at the same time payment would have been made had the executive continued to be employed;
•A pro-rata portion of his or her annual cash incentive award for the calendar year of termination, based on actual performance (with certain qualitative performance criteria being deemed satisfied in full or to have fully met expectations), which amount will be prorated based on the number of days the executive is employed during the applicable year and payable at the same time payment is made to other senior executives and no later than March 15 of the next calendar year;
•Payment of the after-tax monthly Consolidated Omnibus Budget Reconciliation Act ("COBRA") continuation coverage premium under our medical plans (less the amount of the executive's contribution as if he or she was an active employee), until the earliest of twelve months after termination, the date the executive is no longer eligible for COBRA or the date that he or she obtains other employment with medical benefits, with the first COBRA premium payment being made following the timely delivery of a general release and including any amounts due prior thereto;
•For Messrs. Zimmerman, Witherow and Fisher, full vesting in any equity awards made under Cedar Fair’s Omnibus Incentive Plans that vest within 18 months after his termination of employment without cause or his resignation for good reason, unless otherwise specifically exempted from vesting by the terms of the underlying award agreement (as is the case for the Merger Completion Awards). Equity awards other than options that vest under this provision will be paid or vest on the scheduled payment date under the award agreement without regard to the continuous employment requirements or proration. Options that vest within the 18-month period will terminate 30 calendar days after the vesting date unless exercised;
•For Mr. Nurse and Ms. Sauls, pro-rata vesting of any equity awards (except for Mr. Nurse's 2021-2025 award and his Merger Completion Award) outstanding on the date of a qualifying termination of employment without cause or his or her resignation for good reason, based on the number of full months of the applicable performance period (for performance-based awards) or vesting period (for non-performance-based awards) completed prior to the date of termination and the target number of potential performance units (where applicable). Except for such proration and prorated target payouts (where applicable), equity awards other than options that vest under this provision will be paid or vest on the scheduled payment date under the award agreement without regard to the continuous employment requirements. Mr. Nurse would continue to vest and become fully vested in any payments under the 2021-2025 performance unit awards that are scheduled to vest within 18 months after his qualifying termination of employment without cause or resignation for good reason. Any unvested portions of Mr. Nurse’s 2021-2025 performance units that vest under this provision will be paid or vest on the scheduled payment date under the award agreement based on actual performance but without regard to the continuous employment requirements or proration; and
•All other accrued amounts or benefits the executive is due under our benefit plans, programs or policies (other than severance).
Death
If the employment of any of Messrs. Zimmerman, Witherow, Fisher or Nurse, or Ms. Sauls is terminated by reason of death, the executive or his or her legal representatives shall be entitled to:
•Payment of accrued and unpaid base salary, reimbursement of business expenses and payment for accrued and unused vacation days, each as accrued as of the termination date, in a lump sum within 30 days following termination;
•Any unpaid annual cash incentive award earned with respect to a calendar year ending on or before the date of termination, payable at the same time payment would have been made had the executive continued to be employed;
•A pro-rata portion of his or her annual cash incentive award for the calendar year of termination, based on actual performance (with certain qualitative performance criteria being deemed satisfied in full or to have fully met expectations), which amount will be prorated based on the number of days the executive is employed during the applicable year and payable at the same time payment is made to other senior executives and no later than March 15 of the next calendar year;
•Payment of the after-tax monthly COBRA continuation coverage premium under our medical plans for the executive's spouse and eligible dependents (less the amount of the executive's contribution as if he or she was an active employee) for a period of up to twelve months after executive's death, if permitted under applicable law; and
•All other accrued amounts or benefits the executive is due under our benefit plans, programs or policies (other than severance).
Non-Renewal
For each of Messrs. Witherow and Fisher, in certain situations where the executive’s employment agreement is not renewed (described below), the executive will be entitled to:
•Payment of accrued and unpaid base salary, reimbursement of business expenses and payment for accrued and unused vacation days, each as accrued as of the termination date, in a lump sum within 30 days following termination;
•An amount equal to his base salary, payable at the same time salary otherwise would be paid over the 12-month period following termination, but with the first payment being made on the first regularly scheduled payroll date following the 60th day after the termination and including any payments that otherwise would be due earlier;
•Any unpaid annual cash incentive award earned with respect to a calendar year ending on or before the date of termination, payable at the same time payment would have been made had the executive continued to be employed;
•Payment of the after-tax monthly COBRA continuation coverage premium under our medical plans (less the amount of the executive's contribution as if he was an active employee), until the earliest of twelve months after termination, the date the executive is no longer eligible for COBRA or the date that he obtains other employment with medical benefits, with the first COBRA premium payment being made following the timely delivery of a general release and including any amounts due prior thereto;
•All other accrued amounts or benefits the executive is due under our benefit plans, programs or policies (other than severance); and
•Full vesting in any equity awards made under Cedar Fair’s Omnibus Incentive Plans that vest within 18 months after his termination of employment, unless otherwise specifically exempted from vesting by the terms of the underlying award agreement (as is the case for the Merger Completion Awards), with such awards vesting and being paid as described above for terminations without cause or resignations for good reason.
Messrs. Witherow and Fisher will qualify for these non-renewal benefits if we are not willing to renew the employment agreement and the executive chooses to terminate his employment immediately following the employment period.
Other Terminations
If the executive's employment is terminated for any reason other than those described above or those described under "Payments Upon a Change in Control or a Termination Following a Change in Control," which we refer to in the tables below as “All Terminations,” the executive or his or her legal representatives will be entitled to receive a lump sum payment within 30 days following termination consisting of accrued and unpaid base salary, reimbursement of business expenses and payment for accrued and unused vacation days, each as accrued as of the date of termination. The executive also will be entitled to any unpaid annual cash incentive award earned with respect to a calendar year ending on or before the date of termination, payable at the same time payment would have been made had the executive continued to be employed, and all other accrued amounts or benefits the executive is due under our benefit plans, programs or policies (other than severance).
Releases and Restrictions; Certain Definitions
Any termination payments under the employment agreements and Severance Plan are subject to execution, timely delivery, and non-revocation of a general release in favor of Cedar Fair. In addition, each executive is subject to non-competition, non-solicitation, confidentiality, non-disparagement and cooperation provisions. The employment agreements provide that the non-competition and non-solicitation obligations last for a minimum of twelve months after termination (regardless of the reason for termination), and last twelve months plus the number of months for which he or she receives severance payments or 18-month continued equity vesting, subject to a 36-month cap under Mr. Zimmerman's employment agreement. The non-competition and non-solicitation period in the Severance Plan lasts for the period of employment and the eighteen months after termination (regardless of the reason for termination), and the Severance Plan has forfeiture provisions for competitive activity during any period of severance benefits, among other things.
Under the employment agreements and Severance Plan, “cause” means: (i) the executive's willful and continued failure to perform his or her duties or follow the lawful direction of the Board (or, for the executives other than Mr. Zimmerman, the Chief Executive Officer or the Board) or a material breach of fiduciary duty after written notice of the breach; (ii) theft, fraud, or dishonesty with regard to Cedar Fair or in connection with the executive's duties; (iii) indictment for or conviction of (or guilty or no contest plea to) a felony or any lesser offense involving fraud or moral turpitude; (iv) material violation of our code of conduct or similar written policies after written notice specifying the violation; (v) willful misconduct unrelated to us that has, or is likely to have, a material negative impact on us after written notice specifying the failure or breach; (vi) gross negligence or willful misconduct relating to our affairs; (vii) material breach by the executive of his or her employment agreement (or, for Mr. Nurse, breach of the Severance Plan); (viii) a final and non-appealable determination by a court or other governmental body that the executive has materially violated federal or state securities laws; or (ix) a breach or contravention of another employment agreement or other agreement or
policy by virtue of the executive's employment with us or performance of his or her duties, or the existence of any other limitation on his or her activities on our behalf except for confidentiality obligations to former employers.
“Disability” means a physical or mental incapacity or disability that renders or is likely to render the executive unable to perform his or her material duties for either 180 days in any twelve-month period or 90 consecutive days, as determined by a physician selected by us.
“Good reason” means, without the executive's express consent: (i) any material diminution in his or her responsibilities, authorities or duties; (ii) any material reduction in the executive's (x) base salary, or (y) target cash incentive opportunity (except in the event of an across the board reduction in base salary or cash incentive opportunity applicable to substantially all of our senior executives); (iii) a material breach of the employment agreement (where applicable) by us; or (iv) a forced relocation of his or her place of employment by the greater of seventy (70) miles or the distance constituting a “material change in the geographic location” of the executive's place of employment under Section 409A. The events described in (iv) do not constitute "good reason" under Mr. Zimmerman's employment agreement. The events described in (i), (ii) and (iv) will not constitute “good reason,” nor will the events described in (iii) constitute "good reason" under Mr. Zimmerman's employment agreement, unless the executive notifies us in writing and we fail to cure the situation within the time periods specified in the agreement.
Payments upon Death, Disability or Retirement under our Incentive Plans
Any cash incentive awards outstanding at the time of death or retirement will be paid on a prorated basis. Our performance unit awards under the Omnibus Incentive Plans will be payable in the event of death or disability while employed by us, or retirement at age 62 or over from employment with us, with amounts being prorated where the death, separation from service due to disability or retirement occurs during the performance period. The proration under the 2021-2025 performance unit awards would depend upon the year in which amounts are earned. Restrictions on our outstanding restricted unit awards will lapse upon death, disability or retirement. Options awarded under the Omnibus Incentive Plans will expire on the earlier of the ten year anniversary of the grant date or the date that is thirty (30) days after a separation from service under the plan. The named executive officers also will receive payments in these situations as described above under “Payments Pursuant to Employment Agreements (other than in connection with a Change in Control).”
Payments upon a Termination Following a Change in Control
Our employment agreements with Messrs. Zimmerman, Witherow and Fisher, and the Severance Plan as it applies to Mr. Nurse and Ms. Sauls, provide for certain benefits and payments in the event of qualifying terminations following a change in control. Our incentive plans and award agreements also contain change-in-control provisions. Each of our incentive plans, award agreements, employment agreements and our Severance Plan uses the “change in control” definition provided by Section 409A of the Code or a definition based on the 409A definition. As a result, if a change in control occurs under one plan or agreement, it will trigger provisions under the other plans and agreements as well. “Change-in-control” events include:
•a change in ownership of the Partnership which generally would occur when a person or group acquires units representing more than 50 percent of the total fair market value or total voting power of the Partnership;
•a change in the effective control of the Partnership, which could occur even if a change in ownership has not occurred, and would occur if either (i) a person or group acquires units, all at once or over a period of 12 months, representing 30 percent or more of the total voting power of the Partnership, or (ii) a majority of our directors will have been replaced during a 12-month period by directors not endorsed by a majority of the Board before the date of appointment or election; or
•a change in ownership of a substantial portion of the assets of the Partnership, which would occur if a person or group acquires, all at once or over a period of 12 months, assets from us that have a total gross fair market value equal to or more than 40 percent of the total gross fair market value of all of our assets immediately before the acquisition(s), determined without regard to any liabilities associated with such assets.
Section 409A and its rules contain detailed provisions for determining whether a change-in-control event has occurred. The above descriptions of change-in-control events are general summaries only, and we refer you to Section 409A and its rules for additional detail.
Our employment agreements and Severance Plan contain double trigger change in control provisions, which means that two events must occur for a participant to receive payments under the change in control provision. First, a change in control must occur. Second, the executive's employment must be terminated within 24 months following the change in control. Terminations for “good reason” (as defined above) by the executive qualify for change in control protection in addition to involuntary terminations. Our 2016 Omnibus Incentive Plan has a double trigger change in control provision, subject to our award and employment agreement terms and Committee discretion. While most of the employment agreement change in control benefits are subject to the double trigger, the agreements also provide that any equity awards under our Omnibus Plans (including any successor plans) fully and immediately vest upon a change in control (i.e., a single trigger for the equity awards), with performance awards payable at target or as specified in the plan or the award terms. Our named executive officers with employment agreements have waived or modified the single trigger provisions for all of their outstanding equity awards. Accordingly, the double trigger plan provision applies under all of the outstanding performance and restricted unit awards for Messrs. Zimmerman, Witherow and Fisher. Mr.
Nurse's and Ms. Sauls' outstanding equity awards are subject to the double trigger change in control provisions in the Omnibus Plan; however, performance and restricted unit award agreements for grants in and after 2022 for Severance Plan participants, including Mr. Nurse and Ms. Sauls, modify the double trigger to a single trigger if our equity awards are not assumed or replaced following a change in control in which our units become exchangeable for the securities of another entity (at the target units for performance awards). The change in control provisions of the employment agreements, Severance Plan and Omnibus Plan do not apply to the Merger Completion Awards.
If we terminate the employment of Mr. Zimmerman, Mr. Witherow, Mr. Fisher or Mr. Nurse, or Ms. Sauls without cause (or, for Mr. Zimmerman, Mr. Witherow or Mr. Fisher, because of a disability) within 24 months following a change in control, or if any of those executives resign for good reason within 24 months following a change in control, the executive is entitled to the payments and benefits described above under “Payments Pursuant to Employment Agreements or Severance Plan (other than in connection with a Change in Control) - Terminations without Cause or due to Disability and Resignations for Good Reason,” except that:
•For Mr. Zimmerman, Mr. Witherow or Mr. Fisher, in lieu of his or her non-change in control severance or base salary continuation, as applicable:
▪Each executive other than Mr. Zimmerman will receive a lump sum severance amount equal to two and one-half times the executive's annual cash compensation for the year preceding the calendar year in which the change in control occurred, less $1; and
▪Mr. Zimmerman will receive a lump sum severance amount equal to three times annual cash compensation for the year preceding the calendar year in which the change in control occurred, less $1; and
◦The executive will have the right to continue medical and dental insurance coverage under COBRA during the 30-month period following the termination, and to receive monthly reimbursement of such COBRA continuation coverage premiums from us, if permitted by applicable law.
•For Mr. Nurse and Ms. Sauls, in lieu of his or her non-change in control severance or base salary continuation, Mr. Nurse and Ms. Sauls will receive a lump sum severance amount equal to two and one-half times his or her annual cash compensation for the year preceding the calendar year in which the change in control occurred; and
•For Mr. Nurse and Ms. Sauls, the pro-rata portion of his or her annual cash incentive award for the calendar year of termination, will be based on target performance (except, if such termination occurs on the last day of the calendar year, then it will be based on actual performance) and will be payable at in a lump sum on the next regularly scheduled payroll date following the sixtieth (60th) day after termination.
For purposes of our employment agreements, “cash compensation” with respect to any calendar year is defined as (a) the total salary payable, (b) target annual cash incentive compensation with respect to that calendar year, even if not paid during the year, and (c) with respect to any multi-year cash bonus, the amount actually paid. "Cash compensation" under our Severance Plan with respect to any calendar year is defined as (a) the total salary payable and (b) target annual cash incentive compensation with respect to that calendar year, even if not paid during the year. Any lump sum payments made pursuant to the employment agreements or Severance Plan in connection with a change in control will be paid on the next regularly scheduled payroll date following the sixtieth day after the termination, subject to the requirements of Section 409A.
In addition, upon a change in control triggering event, named executive officer equity incentive plan awards would vest or be paid as follows pursuant to the 2016 Omnibus Incentive Plan and award agreements:
•All performance awards will be deemed to have been earned and payable in full and any other restriction shall lapse and the awards will be paid within 30 days. Our outstanding performance awards will be deemed earned at the target level.
•All restrictions applicable to our outstanding restricted unit awards will lapse and restricted units will become fully vested and transferable.
•Unless the Committee determines otherwise, if we make “other unit awards” under the 2016 Omnibus Incentive Plan, all restrictions, limitations and other conditions applicable to such awards would lapse and those awards would become fully vested and transferable and be issued, settled or distributed, as applicable within 30 days. (These provisions do not apply to the Merger Completion Awards.)
•Unless the Committee determines otherwise, if we grant options or unit appreciation rights under the 2016 Omnibus Incentive Plan, any unvested options and unit appreciation rights would vest and become fully exercisable. Option holders could elect to “cash out” any options within 60 days for the difference between the price of the option and the fair market value per unit at the time of the election.
Our executive employment agreements cap the present value of the aggregate payments, distributions and benefits provided to or for the executive's benefit which constitute parachute payments under Section 280G of the Code at 299% of the base amount (as defined for purposes of Section 280G) (the "280G cap"). If the present value exceeds the 280G cap, the payments, distributions and benefits to the executive will be reduced in the order specified in his or her employment agreement so that the reduced amount will result in no portion of his or her payments, distributions and benefits being subject to excise tax. We refer to this type of provision as a “280G cap and cutback provision” below. Our Severance Plan has a “280G best-net provision.” Under our Severance Plan, if the present value of the aggregate payments, distributions and benefits provided to or for the executive's benefit which constitute parachute payments under Section 280G exceeds the 280G cap, then such payments, distributions and benefits are either (i) paid and delivered in full, or (ii) paid and delivered in such lesser amount as would result in no portion of such payments, distributions and benefits being subject to the excise tax, whichever of the foregoing amounts (taking into account the applicable federal, state and local income taxes and the excise tax) results in the receipt on an after-tax basis of materially larger payments, distributions and benefits to the executive as determined by the Company.
Payments of change-in-control amounts or provisions of change-in-control benefits under the employment agreements and Severance Plan are conditioned upon the execution and non-revocation of a mutually acceptable separation agreement and release.
Payments and Benefits in Connection with Ms. Ford's Separation
We entered into a transition and release agreement (the “transition agreement”) with Ms. Ford in December 2023 in connection with her transition out of her role as Executive Vice President and Chief Marketing Officer of the Company. She remained a non-executive employee of Cedar Fair until March 29, 2024. The transition agreement provided that Ms. Ford will receive the severance and benefits set forth in Sections 6.1(b), (d), (e), and (f) of her employment agreement, subject to certain conditions. In accordance with the foregoing and subject to compliance with her obligations under the transition agreement and the employment agreement, Ms. Ford received or will receive: (i) twelve months of cash severance, payable at the same time salary otherwise would be paid over the 12-month period following termination ($437,100 in total over such period); (ii) a pro-rata portion of her 2023 annual cash incentive award ($188,172); (iii) payment of her portion of the after-tax monthly COBRA coverage premium for up to twelve months (estimated value of $18,431); and (iv) full vesting in equity awards made under our Omnibus Incentive Plan that are scheduled to vest within eighteen months of the date of termination, with such awards to be paid or vest on the scheduled payment date under the award agreement without regard to continuous employment requirements or proration. With respect to the foregoing clause (iv), Ms. Ford is eligible to continue to vest in the following (inclusive of distribution and distribution equivalents earned through December 31, 2023): 8,213 restricted units that will vest in 2024 or 2025, which we estimate had a value of $339,437 as of December 31, 2023; the units payable during the first quarter of 2024 under her 2021-2025 performance unit award based upon the achievement of the 2023 functional currency Adjusted EBITDA goal, which we estimate had a value of $253,510 as of December 31, 2023; the units payable during the first quarter of 2025 under her 2021-2025 performance unit award based upon the achievement of the 2023 net leverage ratio goal, which we estimate had a value of $158,444 as of December 31, 2023; any additional units earned under the remaining portion of her 2021-2025 performance unit award based upon functional currency Adjusted EBITDA and un-levered pre-tax free cash flow achievement during 2024, which vest and become payable during the first quarter of 2025, (we estimate that the maximum such potential additional units had a value of $538,709 as of December 31, 2023; any such additional potential 2021-2025 performance units not earned based upon 2024 performance would be forfeited); and up to 20,556 2022-2024 performance units (i.e., the maximum possible number of units that may be earned), which we estimate had a value of $818,129 as of December 31, 2023. The value of such equity awards will depend on the unit price as of such future payment dates, on distributions or distribution equivalents on such awards, and (for the 2021-2025 and 2022-2024 performance awards) on the level of achievement of each award. Ms. Ford is not eligible to continue to vest in her 2023-2025 performance award, as such award is scheduled to vest after eighteen months following Ms. Ford's date of termination. Ms. Ford is also eligible for outplacement services. Ms. Ford is subject to non-competition, non-solicitation, confidentiality, non-disparagement and cooperation provisions contained in her employment agreement, and her severance payments and continued equity vesting are subject to such provisions. The merger agreement with Six Flags specifies how equity awards will be treated and converted in connection with the merger. See Narrative to Summary Compensation and Grants of Plan-Based Awards Table – Treatment of Equity Awards Under the Merger Agreement for additional information.
Table of Potential Payments Upon Termination or Change in Control
The payments that would have been made to each of the named executive officers upon a termination of his or her employment, or a qualifying termination of employment following a change in control of the Partnership, as of December 31, 2023 are as follows:
| | | | | | | | | | | | | | | | | | | | | | | | | | | | | | | | | | | | | | | | |
Name/
Benefits and Payments Upon Separation | All Terminations | Termination Other than For Cause or For Good Reason | Termination upon Non-renewal | Disability | Death | | Qualifying Termination upon Change in Control |
| Richard A. Zimmerman | | | | | | | | | | | | | | |
| Earned but unpaid salary | $ | 41,644 | | | $ | 41,644 | | | $ | — | | | $ | 41,644 | | | $ | 41,644 | | | | | $ | 41,644 | | |
| Severance | — | | | 1,900,000 | | | — | | | 1,900,000 | | | — | | | | | 1,715,056 | | (1) |
| Incentive compensation | 565,725 | | | 565,725 | | | — | | | 565,725 | | | 565,725 | | | | | 1,425,000 | | |
| Restricted units | — | | | 1,879,634 | | (3) | — | | | 2,352,200 | | | 2,352,200 | | | | | 2,352,200 | | |
| Performance units | — | | | 10,705,722 | | (4) | — | | | 10,323,921 | | (5) | 10,323,921 | | (5) | | | 7,614,934 | | (7) |
| | | | | | | | | | | | | | |
| Health benefits | — | | | 13,334 | | | — | | | 13,334 | | | 13,334 | | | | | 55,884 | | |
| Total | $ | 607,369 | | | $ | 15,106,059 | | (6) | $ | — | | | $ | 15,196,824 | | | $ | 13,296,824 | | | | | $ | 13,204,718 | | |
| Brian C. Witherow | | | | | | | | | | | | | | |
| Earned but unpaid salary | $ | 25,346 | | | $ | 25,346 | | | $ | 25,346 | | | $ | 25,346 | | | $ | 25,346 | | | | | $ | 25,346 | | |
| Severance | — | | | 578,200 | | | 578,200 | | | 578,200 | | | — | | | | | 2,806,999 | | (2) |
| Incentive compensation | 229,545 | | | 229,545 | | | 229,545 | | | 229,545 | | | 229,545 | | | | | 578,200 | | |
| Restricted units | — | | | 604,860 | | (3) | 604,860 | | (3) | 741,910 | | | 741,910 | | | | | 741,910 | | |
| Performance units | — | | | 3,121,395 | | (4) | 3,121,395 | | (4) | 2,959,727 | | (5) | 2,959,727 | | (5) | | | 2,239,427 | | (7) |
| | | | | | | | | | | | | | |
| Health benefits | — | | | 20,318 | | | 20,318 | | | 20,318 | | | 20,318 | | | | | 53,436 | | |
| Total | $ | 254,891 | | | $ | 4,579,664 | | (6) | $ | 4,579,664 | | (6) | $ | 4,555,046 | | | $ | 3,976,846 | | | | | $ | 6,445,318 | | |
| Tim V. Fisher | | | | | | | | | | | | | | |
| Earned but unpaid salary | $ | 28,445 | | | $ | 28,445 | | | $ | 28,445 | | | $ | 28,445 | | | $ | 28,445 | | | | | $ | 28,445 | | |
| Severance | — | | | 648,900 | | | 648,900 | | | 648,900 | | | — | | | | | 1,006,466 | | (1) |
| Incentive compensation | 322,016 | | | 322,016 | | | 322,016 | | | 322,016 | | | 322,016 | | | | | 811,125 | | |
| Restricted units | — | | | 686,731 | | (3) | 686,731 | | (3) | 2,923,624 | | | 2,923,624 | | | | | 2,923,624 | | |
| Performance units | — | | | 3,520,031 | | (4) | 3,520,031 | | (4) | 3,343,253 | | (5) | 3,343,253 | | (5) | | | 2,541,787 | | (7) |
| | | | | | | | | | | | | | |
| Health benefits | — | | | 14,165 | | | 14,165 | | | 14,165 | | | 14,165 | | | | | 41,020 | | |
| Total | $ | 350,461 | | | $ | 5,220,288 | | (6) | $ | 5,220,288 | | (6) | $ | 7,280,403 | | | $ | 6,631,503 | | | | | $ | 7,352,467 | | |
| Brian M. Nurse | | | | | | | | | | | | | | |
| Earned but unpaid salary | $ | 19,191 | | | $ | 19,191 | | | $ | — | | | $ | 19,191 | | | $ | 19,191 | | | | | $ | 19,191 | | |
| Severance | — | | | 437,800 | | | — | | | 437,800 | | | — | | | | | 2,125,000 | | (2) |
| Incentive compensation | 188,473 | | | 188,473 | | | — | | | 188,473 | | | 188,473 | | | | | 188,473 | | |
| Restricted units | — | | | 502,762 | | (3) | — | | | 784,709 | | | 784,709 | | | | | 784,709 | | |
| Performance units | — | | | 1,106,415 | | (4) | — | | | 1,361,200 | | (5) | 1,361,200 | | (5) | | | 1,094,420 | | (7) |
| | | | | | | | | | | | | | |
| Health benefits | — | | | 7,455 | | | — | | | 7,455 | | | 7,455 | | | | | 7,455 | | |
| Total | $ | 207,664 | | | $ | 2,262,096 | | (6) | $ | — | | | $ | 2,798,828 | | | $ | 2,361,028 | | | | | $ | 4,219,248 | | |
| | | | | | | |
| Monica R. Sauls | | | | | | | | | | | | | | |
| Earned but unpaid salary | $ | 17,534 | | | $ | 17,534 | | | $ | — | | | $ | 17,534 | | | $ | 17,534 | | | | | $ | 17,534 | | |
| Severance | — | | | 400,000 | | | — | | | 400,000 | | | — | | | | | — | | (2) |
| Incentive compensation | 108,321 | | | 108,321 | | | — | | | 108,321 | | | 108,321 | | | | | 251,616 | | |
| Restricted units | — | | | 246,813 | | (3) | — | | | 627,798 | | | 627,798 | | | | | 627,798 | | |
| Performance units | — | | | 212,028 | | (4) | — | | | 108,428 | | (5) | 108,428 | | (5) | | | 321,653 | | (7) |
| | | | | | | | | | | | | | |
| | | | | | | | | | | | | | |
| | | | | | | | | | | | | | |
| Total | $ | 125,855 | | | $ | 984,696 | | (6) | $ | — | | | $ | 1,262,081 | | | $ | 862,081 | | | | | $ | 1,218,601 | | |
(1) Amounts were decreased by $5,097,943 and $2,537,283 to comply with the 280G cap and cutback provision of Mr. Zimmerman's and Mr. Fisher's employment agreements, respectively. Pre-capped severance amount based on 2022 cash compensation, as defined in their employment agreements, and described above on pages 38-43, which reflects the salary and target annual cash incentive award for 2022. See Summary Compensation Table for increased 2023 salary versus 2022 and Grants of Plan-Based Awards Table for 2023 target cash incentive opportunity, which would result in higher severance amount for change in control and termination dates on and after January 1, 2024 (subject to the 280G cap and cutback provision). (2) Severance amount based on 2022 cash compensation is described above on pages 38-43, which reflects the base salary and target annual cash incentive award for 2022. See Summary Compensation Table for increased 2023 salary versus 2022 and Grants of Plan-Based Awards Table for 2023 target cash incentive opportunity, which would result in higher severance amount for change in control and termination dates on and after January 1, 2024 (subject to the 280G cap and cutback provision or best-net provision, where applicable). In accordance with the Severance Plan, the amount reported in the row "Severance" for Mr. Nurse is not reduced in respect of 280G because a reduced payment did not result in the best payment outcome, net of taxes, for him.
(3) Amount includes the restricted units awarded to each of Messrs. Zimmerman, Witherow and Fisher in 2021 and 2022, and two-thirds of the restricted units awarded in 2023. The amount includes the restricted units awarded in 2021, 2022 and 2023 for Mr. Nurse, and restricted units awarded in 2023 for Ms. Sauls, pro-rated based on the number of full months of the applicable vesting period completed prior to the date of termination. Amount based on value of the units, including the value of any accumulated distribution equivalents, as of the assumed termination date. Value of this award depends on the unit price as of the later applicable payment dates and could differ from that assumed herein. Value of the restricted units also depends on the value of future partnership distributions made prior to the payment date.
(4) Amount includes estimated possible payouts under the 2021-2025 performance unit awards for Messrs. Zimmerman, Witherow, Fisher and Nurse on the first potential payment date under those awards and estimated possible payouts under the 2022-2024 performance unit awards for Messrs. Zimmerman, Witherow and Fisher. Those estimates are calculated assuming that the maximum possible number of units that may be earned at the earliest possible payment date, are based on the value of the units as of December 31, 2023 and include distribution equivalents through such date. The total units that could become payable under those awards could be lower, however, and the final calculation could differ from these estimates depending on the level of performance actually attained and when such performance is achieved. Amounts also include prorated portions of Mr. Nurse's 2022-2024 performance unit award and Mr. Nurse's and Ms. Sauls' 2023-2025 performance unit award, based on the target number of units. Future distribution equivalents could also increase these amounts. Additionally, as payments would not be made until the scheduled payment dates, the value of the units would depend on the unit price as of the later applicable payment date(s) and on the value of future distributions made prior to the payment date(s).
(5) If each of the named executive officers had died or had become disabled on December 31, 2023, he or she would be entitled to receive payment as provided in his or her 2021-2025, 2022-2024 and 2023-2025 performance unit awards as if he or she were employed on the applicable payment date. Any such payments from the performance awards would be prorated as of December 31, 2023, the date of death or disability, and would depend upon the level of attainment of the performance metrics. Ms. Sauls was not granted a 2021-2025 performance unit award or a 2022-2024 performance unit award, as she was not employed during those performance periods. Amounts in the table reflect an estimate of potential payouts under the 2021-2025, 2022-2024 and 2023-2025 performance unit awards. These estimates are calculated based on the maximum possible number of units that may be earned under the 2021-2025 and 2022-2024 performance unit award and the target number of units under the 2023-2025 performance unit awards. These estimates assume such amounts are earned at the earliest possible payment dates, are based on the value of the units as of December 31, 2023 and include distribution equivalents. The total units that could become payable and the final proration calculation could differ from these estimates, however, depending on the level of performance actually attained and when such performance is achieved. Future distribution equivalents could also increase the unit amount. Additionally, as payments would not be made until the scheduled payment dates, the value of the units would depend on the unit price as of the later applicable payment date(s) and on the value of future distributions made prior to the payment date(s).
(6) Total value could be higher or lower depending upon the factors described in footnotes 3, 4 and 5.
Director Compensation
Director Compensation for 2024
The People, Culture & Compensation Committee of the Board of Directors recommends the fees paid to directors and board committee members for services in those capacities. The schedule of fees for 2024 is as follows:
1. For service as a member of the Board, a retainer of $75,000 per annum, payable in cash quarterly, plus $1,500 payable in cash for attendance at each meeting of the Board after the 20th Board meeting, plus $150,000 per annum to be paid in limited partnership units, adjusted for fractional units as needed;
2. For service as an Audit Committee member, a fee of $12,500 per annum (excluding committee chair); for service as a Nominating and Corporate Governance Committee member, a fee of $7,500 per annum (excluding committee chair); and for service as a People, Culture & Compensation Committee member, a fee of $10,000 per annum (excluding committee chair); and
3. For service as Chairman of the Board of Directors, a fee of $125,000 per annum; for service as Chair of the Audit Committee of the Board, a fee of $25,000 per annum; for service as the Chair of the Nominating and Corporate Governance Committee, a fee of $15,000 per annum; and for service as the Chair of the People, Culture & Compensation Committee, a fee of $20,000 per annum. The payment for service as Chairman of the Board of Directors may be paid in cash, limited partnership units, or a combination of cash and units.
These fees are payable only to non-management directors. Management directors receive no additional compensation for service as a director. All directors receive reimbursement from the Partnership for reasonable expenses incurred in connection with service in that capacity. Additionally, all directors are to accumulate units equal to five times the annual cash retainer within five years of becoming a director. The directors have the option to elect to defer some or all of their annual equity payment. The deferred units accrue distribution equivalents and are paid out in cash, limited partnership units, or a combination of cash and units, upon the director’s departure from the Board.
Director Compensation for 2023
The table that follows summarizes the director compensation paid by the Partnership for the fiscal year ended December 31, 2023. The schedule of non-employee director fees for 2023 was as follows:
1. For service as a member of the Board, a retainer of $75,000 per annum, payable in cash quarterly, plus $1,500 payable in cash for attendance at each meeting of the Board after the 20th Board meeting, plus $150,000 per annum to be paid in limited partnership units, adjusted for fractional units as needed;
2. For service as an Audit Committee member, a fee of $12,500 per annum (excluding committee chair); for service as a Nominating and Corporate Governance Committee member, a fee of $7,500 per annum (excluding committee chair); and for service as a People, Culture & Compensation Committee member, a fee of $10,000 per annum (excluding committee chair); and
3. For service as Chairman of the Board of Directors, a fee of $125,000 per annum; for service as Chair of the Audit Committee of the Board, a fee of $25,000 per annum; for service as the Chair of the Nominating and Corporate Governance Committee, a fee of $15,000 per annum; and for service as the Chair of the People, Culture & Compensation Committee, a fee of $20,000 per annum. The payment for service as Chairman of the Board of Directors may be paid in cash, limited partnership units, or a combination of cash and units.
These fees were payable only to non-management directors. Management directors received no additional compensation for service as a director. All directors receive reimbursement from the Partnership for reasonable expenses incurred in connection with service in that capacity.
| | | | | | | | | | | | | | | | | | | | | | | |
| (a) | (b) | (c) | (d) | (e) | (f) | (g) | (h) |
| Name (1) | Fees Earned or Paid in Cash
($) | Unit Awards
($) (4) | Option Awards
($) | Non-Equity Incentive Plan Compensation
($) | Change in Pension Value and Nonqualified Deferred Compensation Earnings ($) | All Other Compensation
($) | Total
($) |
| Nina Barton (2) | $ | 51,322 | | $ | 91,261 | | — | | — | | — | | — | | $ | 142,583 | |
| Louis Carr | $ | 96,034 | | $ | 150,006 | | — | | — | | — | | — | | $ | 246,040 | |
| Gina D. France (2) | $ | 42,380 | | $ | 58,770 | | — | | — | | — | | — | | $ | 101,150 | |
| Michelle M. Frymire | $ | 93,365 | | $ | 150,006 | | — | | — | | — | | — | | $ | 243,371 | |
| Daniel J. Hanrahan | $ | 200,000 | | $ | 150,006 | | — | | — | | — | | — | | $ | 350,006 | |
| Jennifer Mason | $ | 91,899 | | $ | 150,006 | | — | | — | | — | | — | | $ | 241,905 | |
| D. Scott Olivet | $ | 102,500 | | $ | 150,006 | | — | | — | | — | | — | | $ | 252,506 | |
| Matthew A. Ouimet (3) | $ | 56,802 | | $ | 99,885 | | — | | — | | — | | — | | $ | 156,687 | |
| Carlos A. Ruisanchez | $ | 110,000 | | $ | 150,006 | | — | | — | | — | | — | | $ | 260,006 | |
(1)Richard A. Zimmerman is not included in this table as Mr. Zimmerman was an employee of the Partnership in 2023 and did not receive any additional compensation for service as a director. The compensation to Mr. Zimmerman as an employee of the Partnership is shown in the Summary Compensation Table and our other Executive Compensation disclosures. (2)Gina D. France did not stand for re-election to the Board at the 2023 Annual Meeting. Nina Barton was nominated and elected as her successor at the 2023 Annual Meeting.
(3)Matthew A. Ouimet resigned effective September 1, 2023.
(4)The amounts in column (c) reflect the grant date fair value computed in accordance with FASB ASC Topic 718 of units awarded to each member of the Board in 2023. For 2023, Mses. Frymire and Mason and Messrs. Hanrahan and Ruisanchez each received their annual equity payment in the form of 3,769 units, and Messrs. Carr and Olivet each received their annual equity payment in the form of 3,769 deferred units. Ms. France received the portion earned of her annual equity payment in the form of 1,306 units. Ms. Barton and Mr. Ouimet received the portion earned of their annual equity payments in the form of 2,293 units and 2,494 deferred units, respectively. As of December 31, 2023, Ms. Barton had 2,293 deferred units outstanding, Mr. Carr had 9,720 deferred units outstanding, Mr. Hanrahan had 17,774 deferred units outstanding, Mr. Olivet had 25,059 deferred units outstanding and Mr. Ruisanchez had 6,164 deferred units outstanding.
People, Culture & Compensation Committee Report
The People, Culture & Compensation Committee has reviewed and discussed with management the Compensation Discussion and Analysis included in this Form 10-K/A. Based on the review and discussions, the People, Culture & Compensation Committee recommended to the Board of Directors that the Compensation Discussion and Analysis be included in the Partnership's Annual Report on Form 10-K/A for the fiscal year ended December 31, 2023.
D. Scott Olivet, Chair
Michelle McKinney Frymire
Carlos A. Ruisanchez
Compensation Committee Interlocks and Insider Participation
None of our directors who served on the People, Culture & Compensation Committee during 2023 were current or former officers or employees of the Partnership or had any relationship with us that would be required to be disclosed by us under applicable related party requirements. There are no interlocking relationships between the Partnership's executive officers or directors and the board or compensation committee of another entity.
Annex A to Item 11. Executive Compensation - Additional Reconciliations of Non-GAAP Financial Measures
A reconciliation of Adjusted EBITDA from net income and a reconciliation of in-park and out-of-park revenues for the second half of 2023 and 2022 follows:
| | | | | | | | | | | |
| Six months ended |
| (In thousands) | December 31, 2023 | | December 31, 2022 |
| Net income | $ | 205,541 | | | $ | 345,405 | |
| Interest expense | 72,275 | | | 73,603 | |
| Interest income | (2,126) | | | (3,070) | |
| Provision for taxes | 58,470 | | | 63,766 | |
| Depreciation and amortization | 96,220 | | | 94,638 | |
| EBITDA | 430,380 | | | 574,342 | |
| Loss on early debt extinguishment | — | | | 1,810 | |
| Net effect of swaps | — | | | (3,700) | |
| Non-cash foreign currency loss | 1,540 | | | 14,008 | |
| Non-cash equity compensation expense | 14,991 | | | 8,706 | |
| Loss on impairment / retirement of fixed assets, net | 7,306 | | | 7,528 | |
| Gain on sale of land | — | | | (155,250) | |
Costs related to proposed merger (1) | 22,287 | | | — | |
Other (2) | 853 | | | 2,372 | |
| Adjusted EBITDA | $ | 477,357 | | | $ | 449,816 | |
(1) Consists of third-party investment banking, consulting and legal costs related to the proposed merger with Six Flags. These costs are added back to net income to calculate Adjusted EBITDA as defined in our current and prior credit agreements. Adjusted EBITDA is not a measurement of operating performance computed in accordance with generally accepted accounting principles ("GAAP") and should not be considered as a substitute for operating income, net income or cash flows from operating activities computed in accordance with GAAP. Management believes Adjusted EBITDA is a meaningful measure of park-level operating profitability and we use it for measuring returns on capital investments, evaluating potential acquisitions, determining awards under incentive compensation plans, and calculating compliance with certain loan covenants. Adjusted EBITDA is widely used by analysts, investors and comparable companies in our industry to evaluate our operating performance on a consistent basis, as well as more easily compare our results with those of other companies in our industry. This measure is provided as a supplemental measure of our operating results and may not be comparable to similarly titled measures of other companies.
The table below sets forth a reconciliation of Adjusted EBITDA to net income (loss) for the periods indicated. Due to the effects of the COVID-19 pandemic on our 2021 and 2020 results, we included a comparison of 2022 results to 2019 results.
| | | | | | | | | | | | | | | | | | | | | | |
| | Years Ended December 31, |
| (In thousands) | | 2022 | | 2021 | | | | 2019 |
| Net income (loss) | | $ | 307,668 | | | $ | (48,518) | | | | | $ | 172,365 | |
| Interest expense | | 151,940 | | | 184,032 | | | | | 100,364 | |
| Interest income | | (3,621) | | | (94) | | | | | (2,033) | |
| Provision for taxes | | 63,989 | | | 20,035 | | | | | 42,789 | |
| Depreciation and amortization | | 153,274 | | | 148,803 | | | | | 170,456 | |
| EBITDA | | 673,250 | | | 304,258 | | | | | 483,941 | |
| Loss on early debt extinguishment | | 1,810 | | | 5,909 | | | | | — | |
| Net effect of swaps | | (25,641) | | | (19,000) | | | | | 16,532 | |
| Non-cash foreign currency loss (gain) | | 23,856 | | | 6,255 | | | | | (21,061) | |
| Non-cash equity compensation expense | | 20,589 | | | 15,431 | | | | | 12,434 | |
| Loss on impairment/retirement of fixed assets, net | | 10,275 | | | 10,486 | | | | | 4,931 | |
| | | | | | | | |
| Gain on sale of land | | (155,250) | | | — | | | | | — | |
| Loss (gain) on other assets | | — | | | 129 | | | | | (617) | |
| Acquisition-related costs | | — | | | — | | | | | 7,162 | |
| | | | | | | | |
Other (1) | | 3,064 | | | 1,173 | | | | | 1,351 | |
| Adjusted EBITDA | | $ | 551,953 | | | $ | 324,641 | | | | | $ | 504,673 | |
(1)(2) Consists of certain costs as defined in our current and prior credit agreements. These items are excluded from the calculation ofadded back to net income to calculate Adjusted EBITDA and have included certain legal expenses, and severance and related benefits.benefits and contract termination costs. This balance also includes unrealized gains and losses on short-term investments.
| | | | | | | | | | | | | | | | | |
| Six months ended | | |
| (In thousands) | December 31, 2023 | | December 31, 2022 | | | | | | |
| In-park revenues | $ | 1,105,052 | | | $ | 1,106,660 | | | | | | | |
| Out-of-park revenues | 141,555 | | | 137,223 | | | | | | | |
| Concessionaire remittance | (33,475) | | | (34,826) | | | | | | | |
| Net revenues | $ | 1,213,132 | | | $ | 1,209,057 | | | | | | | |
For 2022, Adjusted EBITDA increased $227.3 million compared with 2021. The increase was primarily due to the 537 operating day increase in 2022 and the related improvement in attendance and out-of-park revenues offset somewhat by an increase in expenses incurred, particularly for labor and cost of goods sold. As compared with 2019, Adjusted EBITDA increased $47.3 million for 2022. This increase in Adjusted EBITDA was due to higher net revenues in 2022 driven by higher in-park per capita spending, increased out-of-park revenues and the inclusion of the Schlitterbahn parks, all of which were somewhat offset by increased costs in the current period, particularly labor costs and macro-environment inflationary pressures that increased other operating costs and expenses across our operations.
Liquidity and Capital Resources
Our principal sources of liquidity typically include cash from operating activities, funding from our long-term debt obligations and existing cash on hand. Due to the seasonality of our business, we typically fund pre-opening operations with revolving credit borrowings. Revolving credit borrowings are typically reduced with our positive cash flow during the seasonal operating period. Our primary uses of liquidity typically include operating expenses, partnership distributions, capital expenditures, interest payments, income tax obligations, and recently, limited partnership unit repurchases.
We funded our 2022 liquidity needs and expect to fund our 2023 liquidity needs from cash from operating activities and borrowings from our revolving credit facility. As of December 31, 2022, we had cash on hand of $101.2 million and availability under our revolving credit facility of $280.1 million. Based on this level of liquidity, we concluded that we will have sufficient liquidity to satisfy our obligations and remain in compliance with our debt covenants at least through the first quarter of 2024. Due to limited open operations in 2020 and early 2021, our 2020 and first quarter 2021 liquidity needs were funded from cash on hand from senior notes issued in 2020. We began generating positive cash flows from operations during the second quarter of 2021.
Management has been focused on driving profitable and sustainable growth in the business, reducing the Partnership's outstanding debt, reinstating the quarterly partnership distribution, and accelerating the return of capital to our unitholders.
–We expect to invest between $185 million and $200 million in capital expenditures for the 2023 operating season, which will include large-scale updates to major sections of our parks, new roller coasters and other rides and attractions, upgraded and expanded food and beverage facilities, the renovation of the Knott's Berry Farm Hotel and major events to celebrate two 50-year park anniversaries.
–We sold the land at California's Great America for a cash purchase price of $310 million, subject to customary prorations in June 27, 2022; see Note 4.–We continue to make progress towards our goal of reducing outstanding debt. In December 2021, we redeemed $450 million of senior unsecured notes due 2024. In 2022, we repaid the remaining outstanding principal amount on our senior secured term loan facility totaling $264.3 million.
–We began paying partnership distributions again following a suspension of partnership distributions that began in March 2020. We paid partnership distributions of $0.30 per limited partner unit on both September 15, 2022 and December 15, 2022. On February 16, 2023, we announced that our Board declared an additional partnership distribution of $0.30 per limited partner unit, which will be payable on March 21, 2023 to unitholders of record on March 7, 2023.
–Lastly, on August 3, 2022, we announced that our Board of Directors approved a unit repurchase plan authorizing the Partnership to repurchase units for an aggregate purchase price of not more than $250 million; see Note 8. There were 4.5 million limited partnership units repurchased during the year ended December 31, 2022 at an average price of $41.28 per limited partner unit for an aggregate amount of $187.4 million. There was $62.6 million of remaining availability under the repurchase program as of December 31, 2022. Through January 31, 2023, we had repurchased approximately 5.0 million limited partnership units for an aggregate amount of $208.0 million.
We anticipate cash interest payments between $130 million and $140 million during 2023 of which approximately 70% of the payments will occur in the second and fourth quarters. We anticipate cash payments for income taxes to range from $50 million to $60 million in 2023.
As of December 31, 2022, deferred revenue totaled $172.7 million, including non-current deferred revenue. This represented a decrease of $24.9 million compared with total deferred revenue as of December 31, 2021. The decrease in total deferred revenue was largely attributable to approximately $30 million of 2020 and 2021 season-long product extensions at Knott's Berry Farm and Canada's Wonderland in 2021 into the 2022 operating season. Excluding the prior period deferred revenue associated with product extensions, deferred revenue increased 3% as of December 31, 2022 compared with deferred revenue as of December 31, 2021.
Operating Activities
Net cash from operating activities in 2022 totaled $407.7 million compared with $201.2 million in 2021 and net cash for operating activities of $416.5 million in 2020. The variance between years was attributable to lower earnings in 2020, and to a lesser extent in 2021, as a result of disrupted operations due to the COVID-19 pandemic.
Cash interest payments totaled $137.7 million in 2022 compared with $174.3 million in 2021 and $130.4 million in 2020. The decrease in cash interest payments from 2021 was attributable to the redemption of the 2024 senior notes in December 2021,
and the repayment of our senior secured term loan facility and related termination of our interest rate swap agreements during the third quarter of 2022. The increase in cash interest payments from 2020 was attributable to a full year of interest paid on the 2025 senior notes and 2028 senior notes which were issued during 2020 offset by the redemption of the 2024 senior notes and repayment of our senior secured term loan facility in the current year. Net cash refunds for income taxes totaled $47.2 million in 2022 compared with net cash payments of $10.1 million in 2021 and $1.8 million in 2020. The variance between years for cash (refunds) payments for income taxes was attributable to $90.7 million in tax refunds received in the current year for the net operating loss in tax year 2020 being carried back to prior years. The remaining variance was due to the impact of disrupted operations in 2020, and to a lesser extent 2021.
Investing Activities
Net cash from investing activities in 2022 totaled $126.6 million, an increase of $184.4 million compared with net cash for investing activities in 2021 and an increase of $247.5 million compared with net cash for investing activities in 2020. The increases from 2021 and 2020 were attributable to the current year sale of the land at California's Great America somewhat offset by higher capital spending in 2022 following a planned reduction in capital spending in 2020 and 2021 to retain liquidity as a result of the impact of the COVID-19 pandemic.
Financing Activities
Net cash for financing activities in 2022 totaled $489.6 million, an increase of $23.1 million compared with 2021 and a decrease of $1.2 billion compared with net cash from financing activities in 2020. The variances from 2021 and 2020 were attributable to the impacts of the COVID-19 pandemic and the related timing of debt borrowings and payments. In 2020, we borrowed additional debt as a result of the impacts of the COVID-19 pandemic. In 2021 and 2022, we reduced our outstanding debt by redeeming the 2024 senior notes in 2021 and repaying our senior secured term loan facility in 2022. In 2022, we also repurchased $184.6 million of limited partnership units. We made partnership distributions in the third and fourth quarters of 2022 and the first quarter of 2020.
Contractual Obligations
As of December 31, 2022, our primary contractual obligations consisted of outstanding long-term debt agreements. We also have various commitments under our lease agreements; see Note 11. Before reduction for debt issuance costs, our long-term debt agreements consisted of the following:
•$1.0 billion of 5.500% senior secured notes, maturing in May 2025, issued at par. The 2025 senior notes and the related guarantees are secured by first-priority liens on the issuers' and the guarantors' assets that secure all the obligations under our credit facilities. The 2025 senior notes may be redeemed, in whole or in part, at various prices depending on the date redeemed. The 2025 senior notes pay interest semi-annually in May and November.
•$500 million of 5.375% senior unsecured notes, maturing in April 2027, issued at par. The 2027 senior notes may be redeemed, in whole or in part, at various prices depending on the date redeemed. The 2027 senior notes pay interest semi-annually in April and October.
•$300 million of 6.500% senior unsecured notes, maturing in October 2028, issued at par. Prior to October 1, 2023, up to 35% of the 2028 senior notes may be redeemed with the net cash proceeds of certain equity offerings at a price equal to 106.500% of the principal amount thereof, together with accrued and unpaid interest and additional interest, if any. The 2028 senior notes may be redeemed, in whole or in part, at any time prior to October 1, 2023 at a price equal to 100% of the principal amount of the notes redeemed plus a "make-whole" premium together with accrued and unpaid interest and additional interest, if any, to the redemption date. Thereafter, the 2028 senior notes may be redeemed, in whole or in part, at various prices depending on the date redeemed. The 2028 senior notes pay interest semi-annually in April and October.
•$500 million of 5.250% senior unsecured notes, maturing in July 2029, issued at par. The 2029 senior notes may be redeemed, in whole or in part, at any time prior to July 15, 2024 at a price equal to 100% of the principal amount of the notes redeemed plus a "make-whole" premium together with accrued and unpaid interest and additional interest, if any, to the redemption date. Thereafter, the 2029 senior notes may be redeemed, in whole or in part, at various prices depending on the date redeemed. The 2029 senior notes pay interest semi-annually in January and July.
•No borrowings under the $300 million senior secured revolving credit facility under our current credit agreement with a Canadian sub-limit of $15 million. Following an amendment in the first quarter of 2023 (see Note 13), the revolving credit facility bears interest at Secured Overnight Financing Rate ("SOFR") plus 350 bps and requires the payment of a 62.5 bps commitment fee per annum on the unused portion of the credit facilities. Following the amendment, the senior secured revolving credit facility matures on February 10, 2028, provided that the maturity date will be (x) January 30, 2025 if at least $200.0 million of the 2025 senior notes remain outstanding as of that date, or (y) January 14, 2027 if at least $200.0 million of the 2027 senior notes remain outstanding as of that date. The credit agreement provides for the issuance of documentary and standby letters of credit. After letters of credit, which totaled $19.9 million as of December 31, 2022 and $15.8 million as of December 31, 2021, we had availability under our revolving credit facility of
$280.1 million as of December 31, 2022 and $359.2 million as of December 31, 2021. Our letters of credit are primarily in place to backstop insurance arrangements.
On December 17, 2021, we redeemed $450 million of 5.375% senior unsecured notes, which otherwise would have matured in June 2024, at a redemption price equal to 100.896% of the principal amount plus accrued and unpaid interest. We repaid the remaining outstanding balance on our senior secured term loan facility in 2022 ($264.3 million in principal amount), completing the full repayment of the term loan during the third quarter of 2022. Subsequently, we also terminated our interest rate swap agreements.
The 2017 Credit Agreement, as amended, includes a Senior Secured Leverage Ratio of 4.50x Total First Lien Senior Secured Debt-to-Consolidated EBITDA, which will step down to 4.00x in the second quarter of 2023 and which will step down further to 3.75x in the third quarter of 2023. Following the amendment in the first quarter of 2023, this financial covenant is only required to be tested at the end of any fiscal quarter in which revolving credit facility borrowings are outstanding. The 2017 Credit Agreement, as amended and as in effect prior to the first quarter of 2023 amendment, included an Additional Restrictions Period to provide further covenant relief during the COVID-19 pandemic. We terminated the Additional Restrictions Period during the first quarter of 2022 by achieving compliance with the Senior Secured Leverage Ratio covenant as of the end of the fourth quarter of 2021. We were in compliance with the applicable financial covenants under our credit agreement during 2022.
Our credit agreement and fixed rate note agreements include Restricted Payment provisions, which could limit our ability to pay partnership distributions. Pursuant to the terms of the indenture governing the 2027 senior notes, which includes the most restrictive of these Restricted Payments provisions, if our pro forma Total-Indebtedness-to-Consolidated-Cash-Flow Ratio is greater than 5.25x, we can still make Restricted Payments of $100 million annually so long as no default or event of default has occurred and is continuing. If our pro forma Total-Indebtedness-to-Consolidated-Cash-Flow Ratio is less than or equal to 5.25x, we can make Restricted Payments up to our Restricted Payment pool. Our pro forma Total-Indebtedness-to-Consolidated-Cash-Flow Ratio was less than 5.25x as of December 31, 2022.
Financial and Non-Financial Disclosure About Issuers and Guarantors of our Registered Senior Notes
As discussed within the Long-Term Debt footnote at Note 6, we had four tranches of fixed rate senior notes outstanding at December 31, 2022: the 2025, 2027, 2028 and 2029 senior notes. The 2024 senior notes were fully redeemed on December 17, 2021. The 2024, 2027, 2028 and 2029 senior notes were registered under the Securities Act of 1933. The 2025 senior notes were sold in a private placement in reliance on exemptions from registration under the Securities Act of 1933. Cedar Fair, L.P., Canada's Wonderland Company ("Cedar Canada"), and Magnum Management Corporation ("Magnum") were the co-issuers of the 2024 senior notes. Cedar Fair, L.P., Cedar Canada, Magnum, and Millennium Operations LLC (“Millennium”) are the co-issuers of the 2027, 2028 and 2029 senior notes. Our senior notes have been irrevocably and unconditionally guaranteed, on a joint and several basis, by each wholly owned subsidiary of Cedar Fair (other than the co-issuers) that guarantees our credit facilities under our credit agreement. A full listing of the issuers and guarantors of our registered senior notes can be found within Exhibit 22, and additional information with respect to our registered senior notes and the related guarantees follows.
The 2027, 2028 and 2029 senior notes each rank equally in right of payment with all of each issuer’s existing and future senior unsecured debt, including the other registered senior notes. However, the 2027, 2028 and 2029 senior notes rank effectively junior to our secured debt under the 2017 Credit Agreement, as amended, and the 2025 senior notes to the extent of the value of the assets securing such debt.
In the event that the co-issuers (except for Cedar Fair, L.P.) or any subsidiary guarantor is released from its obligations under our senior secured credit facilities (or the 2017 Credit Agreement, as amended), such entity will also be released from its obligations under the registered senior notes. In addition, the co-issuers (except for Cedar Fair, L.P.) or any subsidiary guarantor can be released from its obligations under the 2027, 2028 and 2029 senior notes under the following circumstances, assuming the associated transactions are in compliance with the applicable provisions of the indentures governing the 2027, 2028 and 2029 senior notes: i) any direct or indirect sale, conveyance or other disposition of the capital stock of such entity following which the entity ceases to be a direct or indirect subsidiary of Cedar Fair or a sale or disposition of all or substantially all of the assets of such entity; ii) if such entity is dissolved or liquidated; iii) if we designate such entity as an Unrestricted Subsidiary; iv) upon transfer of such entity in a qualifying transaction if following such transfer the entity ceases to be a direct or indirect Restricted Subsidiary of Cedar Fair or is a Restricted Subsidiary that is not a guarantor under any credit facility; or v) in the case of the subsidiary guarantors, upon a discharge of the indenture or upon any legal defeasance or covenant defeasance of the indenture.
The obligations of each guarantor are limited to the extent necessary to prevent such guarantee from constituting a fraudulent conveyance or fraudulent transfer under applicable law. This provision may not, however, protect a guarantee from being voided under fraudulent transfer law, or may reduce the applicable guarantor’s obligation to an amount that effectively makes its guarantee worthless. If a guarantee were rendered voidable, it could be subordinated by a court to all other indebtedness of the guarantor, and depending on the amount of such indebtedness, could reduce the guarantee to zero. Each guarantor that makes a payment or distribution under a guarantee is entitled to a pro rata contribution from each other guarantor based on the respective net assets of the guarantors.
The following tables provide summarized financial information for each of our co-issuers and guarantors of the 2024, 2027, 2028 and 2029 senior notes (the "Obligor Group"). We presented each entity that is or was a co-issuer of any series of the registered senior notes separately. The subsidiaries that guarantee the 2027, 2028 and 2029 senior notes are presented on a combined basis with intercompany balances and transactions between entities in such guarantor subsidiary group eliminated. Intercompany balances and transactions between the co-issuers and guarantor subsidiaries have not been eliminated. The subsidiaries that guaranteed the 2024 senior notes included the guarantor subsidiary group, as well as Millennium. Millennium is a co-issuer under the 2027, 2028 and 2029 senior notes and was a guarantor under the 2024 senior notes. Certain subsidiaries of Cedar Fair did not guarantee our credit facilities or senior notes as the assets and results of operations of these subsidiaries were immaterial (the "non-guarantor" subsidiaries). The summarized financial information excludes results of the non-guarantor subsidiaries and does not reflect investments of the Obligor Group in the non-guarantor subsidiaries. The Obligor Group's amounts due from, amounts due to, and transactions with the non-guarantor subsidiaries have not been eliminated and included intercompany receivables from non-guarantors of $14.3 million and $14.0 million as of December 31, 2022 and December 31, 2021, respectively.
| | | | | | | | | | | | | | | | | | | | | | | | | | | | | | | | | | | | |
Summarized Financial Information
(In thousands) | | Cedar Fair L.P. (Parent) | | Magnum
(Co-Issuer Subsidiary) | | Cedar Canada
(Co-Issuer Subsidiary) | | Millennium
(Co-Issuer 2027, 2028 & 2029
Guarantor 2024) | | Guarantor Subsidiaries (1) | | | | |
| Balance as of December 31, 2022 | | | | | | | | | | | | |
| Current Assets | | $ | 507 | | | $ | 32,194 | | | $ | 82,860 | | | $ | 409,869 | | | $ | 1,400,403 | | | | | |
| Non-Current Assets | | (202,160) | | | 1,583,510 | | | 563,637 | | | 2,214,189 | | | 1,870,827 | | | | | |
| Current Liabilities | | 237,793 | | | 1,247,618 | | | 261,744 | | | 213,669 | | | 103,436 | | | | | |
| Non-Current Liabilities | | 147,937 | | | 1,238 | | | 14,142 | | | 2,135,550 | | | 159,493 | | | | | |
| Balance as of December 31, 2021 | | | | | | | | | | | | |
| Current Assets | | $ | 517 | | | $ | 97,221 | | | $ | 96,042 | | | $ | 572,865 | | | $ | 1,187,211 | | | | | |
| Non-Current Assets | | (138,126) | | | 1,647,952 | | | 540,332 | | | 2,368,737 | | | 2,145,307 | | | | | |
| Current Liabilities | | 410,779 | | | 1,331,130 | | | 29,050 | | | 227,483 | | | 58,949 | | | | | |
| Non-Current Liabilities | | 147,021 | | | 21,274 | | | 24,043 | | | 2,385,100 | | | 97,803 | | | | | |
| | | | | | | | | | | | | | | | | | | | | | | | | | | | | | | | | | | | |
| | | | | | | | | | | | | | |
| Year Ended December 31, 2022 | | | | | | | | | | | | |
| Net revenues | | $ | 210,192 | | | $ | 522,915 | | | $ | 179,180 | | | $ | 2,174,828 | | | $ | 320,682 | | | | | |
| Operating income (loss) | | 207,251 | | | (116,440) | | | 80,880 | | | 124,469 | | | 224,675 | | | | | |
| Net income | | 308,808 | | | 141,776 | | | 65,665 | | | — | | | 216,578 | | | | | |
| | | | | | | | | | | | | | |
| Year Ended December 31, 2021 | | | | | | | | | | | | |
| Net revenues | | $ | 35,908 | | | $ | 363,340 | | | $ | 75,353 | | | $ | 1,449,022 | | | $ | 344,778 | | | | | |
| Operating income (loss) | | 31,808 | | | (156,079) | | | 12,545 | | | 136,844 | | | 124,405 | | | | | |
| Net (loss) income | | (46,741) | | | (34,647) | | | 1,967 | | | — | | | 62,586 | | | | | |
(1)With respect to the 2024 senior notes, if the financial information presented for Millennium was combined with that of the other guarantor subsidiaries that have been presented on a combined basis, the following additional intercompany balances and transactions between Millennium and such other guarantor entities would be eliminated: Current Assets and Current Liabilities - $13.7 million as of December 31, 2022 and $13.4 million as of December 31, 2021; Non-Current Assets - $2.10 billion as of December 31, 2022 and $2.25 billion as of December 31, 2021; and Net revenues - $43.6 million as of December 31, 2022 and $126.6 million as of December 31, 2021. Combined amounts for all guarantors of the 2024 senior notes for all other line items within the table would be computed by adding the amounts in the Millennium and Guarantor Subsidiaries columns.
Quantitative and Qualitative Disclosures about Market Risk
We are exposed to market risks from fluctuations in interest rates and currency exchange rates on our operations in Canada, and from time to time, on imported rides and equipment. The objective of our financial risk management is to reduce the potential negative impact of interest rate and foreign currency exchange rate fluctuations to acceptable levels. We do not acquire market risk sensitive instruments for trading purposes.
We typically manage interest rate risk using a combination of fixed-rate long-term debt, interest rate swaps that fix our variable-rate long-term debt, and variable-rate borrowings under our revolving credit facility. Translation exposures with regard to our Canadian operations are not hedged.
We repaid all of our outstanding variable-rate long-term debt during the third quarter of 2022 and subsequently terminated our interest rate swap agreements. Therefore, as of December 31, 2022, all of our outstanding long-term debt represented fixed-rate debt except for revolving credit borrowings. Assuming the daily average balance over the past twelve months on revolving credit borrowings of approximately $52.7 million, a hypothetical 100 bps increase in 30-day SOFR on our variable-rate debt would lead to an increase of approximately $0.5 million in cash interest costs over the next twelve months.
A uniform 10% strengthening of the U.S. dollar relative to the Canadian dollar would result in an $8.1 million decrease in annual operating income for the year ended December 31, 2022.
Forward Looking Statements
Some of the statements contained in this report (including the "Management's"Management’s Discussion and Analysis of Financial Condition and Results of Operations" section) that are not historical in nature are forward-looking statements within the meaning of the federal securities laws, including Section 27A of the Securities Act of 1933 and Section 21E of the Securities Exchange Act of 1934, including statements as to our expectations, beliefs, goals and strategies regarding the future. These forward-looking statements may involve current plans, estimates, expectations and ambitions that are subject to risks, uncertainties and uncertaintiesassumptions that are difficult to predict, may be beyond our control and could cause actual results to differ materially from those described in such statements. Although we believe that the expectations reflected in such forward-looking statements are reasonable, we can give no assurance that such expectations will prove to be correct, or that our growth strategies will achieve the targeted results.results, that the proposed transaction with Six Flags will close or that the Company will realize the anticipated benefits thereof. Important risk factors including those listed under Item 1A in this Form 10-Kthat may cause such a difference and could adversely affect attendance at our parks, our future financial performance, and our growth strategies and/or the proposed transaction, and could cause actual results to differ materially from our expectations.expectations or otherwise to fluctuate or decrease, include, but are not limited to: general economic conditions, the impacts of public health concerns; adverse weather conditions; competition for consumer leisure time and spending; unanticipated construction delays; changes in our capital investment plans and projects; the expected timing and likelihood of completion of the proposed transaction, including the timing, receipt and terms and conditions of any required governmental and regulatory approvals of the proposed transaction; anticipated tax treatment, unforeseen liabilities, future capital expenditures, revenues, expenses, earnings, synergies, economic performance, indebtedness, financial condition, losses, future prospects, business and management strategies for the management, expansion and growth of the combined company’s operations and other conditions to the completion of the proposed transaction, including the possibility that any of the anticipated benefits of the proposed transaction will not be realized or will not be realized within the expected time period; the occurrence of any event, change or other circumstances that could give rise to the termination of the merger agreement; the outcome of any legal proceedings that may be instituted against Cedar Fair, Six Flags or their respective directors and others following announcement of the merger agreement and proposed transaction; the inability to consummate the transaction due to the failure to satisfy other conditions to complete the transaction; risks that the proposed transaction disrupts and/or harms current plans and operations of Cedar Fair or Six Flags, including that management’s time and attention will be diverted on transaction-related issues; the amount of the costs, fees, expenses and charges related to the transaction, including the possibility that the transaction may be more expensive to complete than anticipated; the ability of Cedar Fair and Six Flags to successfully integrate their businesses and to achieve anticipated synergies and value creation; potential adverse reactions or changes to business relationships resulting from the announcement or completion of the proposed transaction; legislative, regulatory and economic developments and changes in laws, regulations, and policies affecting Cedar Fair and Six Flags; potential business uncertainty, including the outcome of commercial negotiations and changes to existing business relationships during the pendency of the proposed transaction that could affect Cedar Fair’s and/or Six Flags’ financial performance and operating results; acts of terrorism or outbreak of war, hostilities, civil unrest, and other political or security disturbances; the impacts of pandemics or other public health crises, including the effects of government responses on people and economies; risks related to the potential impact of general economic, political and market factors on the companies or the proposed transaction; other factors we discuss from time to time in our reports filed with the Securities and Exchange Commission (the "SEC"); and those risks described in the registration statement on Form S-4 and the accompanying proxy statement/prospectus. Additional information on risk factors that may affect our business and financial results can be found in on the Original Form 10-K and in the filings we make from time to time with the SEC. We do not undertake any obligation to publicly update or revise any forward-looking statements to reflect future events, information or circumstances that arise after the filing date of this document.
ITEM 7A. QUANTITATIVE AND QUALITATIVE DISCLOSURES ABOUT MARKET RISK.
The information appearing under the subheading "Quantitative and Qualitative Disclosures about Market Risk" under the heading "Management's Discussion and Analysis of Financial Condition and Results of Operations" of this Report is incorporated herein by reference.
ITEM 8. FINANCIAL STATEMENTS AND SUPPLEMENTARY DATA.
CEDAR FAIR, L.P.
FINANCIAL STATEMENTS INDEX
REPORT OF INDEPENDENT REGISTERED PUBLIC ACCOUNTING FIRM
To the Unitholders and the Board of Directors of
Cedar Fair, L.P.
Opinions on the Financial Statements and Internal Control over Financial Reporting
We have audited the accompanying consolidated balance sheets of Cedar Fair, L.P., and subsidiaries (the "Partnership") as of December 31, 2022 and 2021, the related consolidated statements of operations and comprehensive income (loss), partners' deficit, and cash flows for each of the three years in the period ended December 31, 2022, and the related notes (collectively referred to as the “financial statements”). We also have audited the Partnership's internal control over financial reporting as of December 31, 2022, based on criteria established in Internal Control - Integrated Framework (2013) issued by the Committee of Sponsoring Organizations of the Treadway Commission (COSO).
In our opinion, the financial statements referred to above present fairly, in all material respects, the financial position of the Partnership as of December 31, 2022 and 2021, and the results of its operations and its cash flows for each of the three years in the period ended December 31, 2022, in conformity with accounting principles generally accepted in the United States of America. Also, in our opinion, the Partnership maintained, in all material respects, effective internal control over financial reporting as of December 31, 2022, based on criteria established in Internal Control - Integrated Framework (2013) issued by COSO.
Basis for Opinions
The Partnership's management is responsible for these financial statements, for maintaining effective internal control over financial reporting, and for its assessment of the effectiveness of internal control over financial reporting, included in the accompanying Management's Report on Internal Control over Financial Reporting. Our responsibility is to express an opinion on these financial statements and an opinion on the Partnership's internal control over financial reporting based on our audits. We are a public accounting firm registered with the Public Company Accounting Oversight Board (United States) (PCAOB) and are required to be independent with respect to the Partnership in accordance with the U.S. federal securities laws and the applicable rules and regulations of the Securities and Exchange Commission and the PCAOB.
We conducted our audits in accordance with the standards of the PCAOB. Those standards require that we plan and perform the audits to obtain reasonable assurance about whether the financial statements are free of material misstatement, whether due to error or fraud, and whether effective internal control over financial reporting was maintained in all material respects.
Our audits of the financial statements included performing procedures to assess the risks of material misstatement of the financial statements, whether due to error or fraud, and performing procedures to respond to those risks. Such procedures included examining, on a test basis, evidence regarding the amounts and disclosures in the financial statements. Our audits also included evaluating the accounting principles used and significant estimates made by management, as well as evaluating the overall presentation of the financial statements. Our audit of internal control over financial reporting included obtaining an understanding of internal control over financial reporting, assessing the risk that a material weakness exists, and testing and evaluating the design and operating effectiveness of internal control based on the assessed risk. Our audits also included performing such other procedures as we considered necessary in the circumstances. We believe that our audits provide a reasonable basis for our opinions.
Definition and Limitations of Internal Control over Financial Reporting
A company’s internal control over financial reporting is a process designed to provide reasonable assurance regarding the reliability of financial reporting and the preparation of financial statements for external purposes in accordance with generally accepted accounting principles. A company’s internal control over financial reporting includes those policies and procedures that (1) pertain to the maintenance of records that, in reasonable detail, accurately and fairly reflect the transactions and dispositions of the assets of the company; (2) provide reasonable assurance that transactions are recorded as necessary to permit preparation of financial statements in accordance with generally accepted accounting principles, and that receipts and expenditures of the company are being made only in accordance with authorizations of management and directors of the company; and (3) provide reasonable assurance regarding prevention or timely detection of unauthorized acquisition, use, or disposition of the company’s assets that could have a material effect on the financial statements.
Because of its inherent limitations, internal control over financial reporting may not prevent or detect misstatements. Also, projections of any evaluation of effectiveness to future periods are subject to the risk that controls may become inadequate because of changes in conditions, or that the degree of compliance with the policies or procedures may deteriorate.
Critical Audit Matters
The critical audit matters communicated below are matters arising from the current-period audit of the financial statements that were communicated or required to be communicated to the audit committee and that (1) relate to accounts or disclosures that are material to the financial statements and (2) involved our especially challenging, subjective, or complex judgments. The communication of critical audit matters does not alter in any way our opinion on the financial statements, taken as a whole, and we are not, by communicating the critical audit matters below, providing a separate opinion on the critical audit matters or on the accounts or disclosures to which they relate.
Deferred Revenues - Refer to Notes 2 and 3 to the consolidated financial statements
Critical Audit Matter Description
The Partnership defers revenue for its multi-use products, including season-long products for admissions, dining, beverages, and other products and recognizes revenues over the estimated number of uses expected for each type of product. The Partnership estimates a redemption rate for each multi-use product using historical and forecasted uses at each park. Revenue is then recognized on a pro-rated basis based on the estimated allocated selling price of the multi-use product and the estimated uses of that product. During the third quarter of 2022, management began selling multi-use products for the 2023 operating season. These products include providing the customer park access for the remainder of the 2022 operating season. Deferred revenue as of December 31, 2022 was $163 million.
Auditing the amount of deferred revenue associated with the multi-use products that should be recognized in each fiscal year required a high degree of auditor judgment and increased extent of effort.
How the Critical Audit Matter Was Addressed in the Audit
Our audit procedures related to the estimated park use projections and the recognition of revenue from deferred revenue included the following, among others:
•We tested the effectiveness of controls over revenue recognition related to multi-use products.
•We tested the completeness and accuracy of the year end deferred revenue balance.
•We evaluated the reasonableness of the year-over-year change in deferred revenue.
•We tested whether revenue relating to the current fiscal year was appropriately recognized.
Schlitterbahn Goodwill Valuation - Refer to Notes 2 and 5 to the consolidated financial statements
Critical Audit Matter Description
The Partnership's evaluation of goodwill for impairment involves the comparison of the fair value of each reporting unit to its carrying value. The Partnership determines the fair value of its reporting units using a combination of an income (discounted cash flow) approach and the market approach. The determination of the fair value using the income approach requires management to make significant assumptions related to terminal value growth rates and weighted-average cost of capital. The determination of the fair value using the market approach requires management to make significant assumptions related to the selection of comparable publicly traded companies and cash flow multiples to determine the fair value. The goodwill balance was $263 million as of December 31, 2022, of which $93 million was allocated to the Schlitterbahn Waterpark & Resort New Braunfels and the Schlitterbahn Waterpark Galveston Reporting Unit ("Schlitterbahn").
Given the significant estimates and assumptions management makes to estimate the fair value of Schlitterbahn and the sensitivity of Schlitterbahn's fair value to changes in those estimates and assumptions, performing audit procedures to evaluate the reasonableness of management's estimates and assumptions, including terminal value growth rate, weighted-average cost of capital, comparable publicly traded companies, and cash flow multiples required a high degree of auditor judgment and an increased extent of effort, including the need to involve our fair value specialists.
How the Critical Audit Matter Was Addressed in the Audit
Our audit procedures related to the selection of the terminal value growth rate and weighted-average cost of capital for Schlitterbahn and the selection of comparable publicly traded companies and cash flow multiples. Those procedures included the following, among others:
•We tested the effectiveness of controls over management's goodwill impairment analysis, including those over the determination of the fair value of Schlitterbahn, such as controls related to management's selection of the terminal value growth rate, weighted-average cost of capital, comparable publicly traded companies, and cash flow multiples.
•We considered the impact of changes in the regulatory and operating environment on management's assumptions.
•With the assistance of our fair value specialists, we evaluated the terminal value growth rate and weighted-average cost of capital, including testing the underlying source information and the mathematical accuracy of the calculations, and developing ranges of independent estimates and comparing those to the terminal value growth rate and weighted-average cost of capital selected by management.
•With the assistance of our fair value specialists, we evaluated the selected comparable publicly traded companies and cash flow multiples, including testing the underlying source information and mathematical accuracy of the calculations, and comparing the multiples selected by management to its comparable publicly traded companies.
/s/ DELOITTE & TOUCHE LLP
Cleveland, Ohio
February 17, 2023
We have served as the Partnership’s auditor since 2004.
CEDAR FAIR, L.P.
CONSOLIDATED BALANCE SHEETS
(In thousands)
| | | | | | | | | | | | | | |
| | | December 31, 2022 | | December 31, 2021 |
| ASSETS | | | | |
| Current Assets: | | | | |
| Cash and cash equivalents | | $ | 101,189 | | | $ | 61,119 | |
| Receivables | | 70,926 | | | 62,109 | |
| Inventories | | 45,297 | | | 32,113 | |
| Prepaid insurance | | 12,570 | | | 10,914 | |
| Current income tax receivable | | — | | | 84,051 | |
| Other current assets | | 13,777 | | | 13,335 | |
| | 243,759 | | | 263,641 | |
| Property and Equipment: | | | | |
| Land | | 287,968 | | | 443,190 | |
| Land improvements | | 492,324 | | | 486,014 | |
| Buildings | | 930,850 | | | 855,297 | |
| Rides and equipment | | 2,030,640 | | | 1,986,235 | |
| Construction in progress | | 75,377 | | | 57,666 | |
| | 3,817,159 | | | 3,828,402 | |
| Less accumulated depreciation | | (2,234,800) | | | (2,117,659) | |
| | 1,582,359 | | | 1,710,743 | |
| Goodwill | | 263,206 | | | 267,232 | |
| Other Intangibles, net | | 48,950 | | | 49,994 | |
| Right-of-Use Asset | | 92,966 | | | 16,294 | |
| Other Assets | | 4,657 | | | 5,116 | |
| | $ | 2,235,897 | | | $ | 2,313,020 | |
| LIABILITIES AND PARTNERS’ EQUITY | | | | |
| Current Liabilities: | | | | |
| | | | |
| Accounts payable | | $ | 54,983 | | | $ | 53,912 | |
| Deferred revenue | | 162,711 | | | 187,599 | |
| Accrued interest | | 32,173 | | | 32,011 | |
| Accrued taxes | | 35,329 | | | 9,075 | |
| Accrued salaries, wages and benefits | | 53,332 | | | 53,833 | |
| Self-insurance reserves | | 27,766 | | | 24,573 | |
| Other accrued liabilities | | 30,678 | | | 20,511 | |
| | 396,972 | | | 381,514 | |
| Deferred Tax Liability | | 69,412 | | | 66,483 | |
| Derivative Liability | | — | | | 20,086 | |
| Lease Liability | | 81,757 | | | 13,345 | |
| | | | |
| Other Liabilities | | 11,203 | | | 11,144 | |
| Long-Term Debt: | | | | |
| | | | |
| Term debt | | — | | | 258,391 | |
| Notes | | 2,268,155 | | | 2,260,545 | |
| | 2,268,155 | | | 2,518,936 | |
| Partners’ Deficit: | | | | |
| Special L.P. interests | | 5,290 | | | 5,290 | |
| General partner | | (4) | | | (7) | |
| Limited partners, 52,563 and 56,854 units outstanding as of December 31, 2022 and December 31, 2021, respectively | | (612,497) | | | (712,714) | |
| Accumulated other comprehensive income | | 15,609 | | | 8,943 | |
| | (591,602) | | | (698,488) | |
| | $ | 2,235,897 | | | $ | 2,313,020 | |
The accompanying Notes to Consolidated Financial Statements are an integral part of these statements.
CEDAR FAIR, L.P.
CONSOLIDATED STATEMENTS OF OPERATIONS AND COMPREHENSIVE INCOME (LOSS)
(In thousands, except per unit amounts)
| | | | | | | | | | | | | | | | | | | | |
| | Years Ended December 31, |
| | 2022 | | 2021 | | 2020 |
| Net revenues: | | | | | | |
| Admissions | | $ | 925,903 | | | $ | 674,799 | | | $ | 67,852 | |
| Food, merchandise and games | | 602,603 | | | 432,513 | | | 76,921 | |
| Accommodations, extra-charge products and other | | 288,877 | | | 230,907 | | | 36,782 | |
| | 1,817,383 | | | 1,338,219 | | | 181,555 | |
| Costs and expenses: | | | | | | |
| Cost of food, merchandise and games revenues | | 164,246 | | | 112,466 | | | 27,991 | |
| Operating expenses | | 864,304 | | | 698,242 | | | 347,782 | |
| Selling, general and administrative | | 260,592 | | | 219,758 | | | 108,118 | |
| Depreciation and amortization | | 153,274 | | | 148,803 | | | 157,549 | |
| Loss on impairment / retirement of fixed assets, net | | 10,275 | | | 10,486 | | | 8,135 | |
| Loss on impairment of goodwill and other intangibles | | — | | | — | | | 103,999 | |
| Gain on sale of land | | (155,250) | | | — | | | — | |
| Loss (gain) on other assets | | — | | | 129 | | | (11) | |
| | 1,297,441 | | | 1,189,884 | | | 753,563 | |
| Operating income (loss) | | 519,942 | | | 148,335 | | | (572,008) | |
| Interest expense | | 151,940 | | | 184,032 | | | 150,669 | |
| Net effect of swaps | | (25,641) | | | (19,000) | | | 15,849 | |
| Loss on early debt extinguishment | | 1,810 | | | 5,909 | | | 2,262 | |
| Loss (gain) on foreign currency | | 23,784 | | | 6,177 | | | (12,183) | |
| Other income | | (3,608) | | | (300) | | | (447) | |
| Income (loss) before taxes | | 371,657 | | | (28,483) | | | (728,158) | |
| Provision (benefit) for taxes | | 63,989 | | | 20,035 | | | (137,915) | |
| Net income (loss) | | 307,668 | | | (48,518) | | | (590,243) | |
| Net income (loss) allocated to general partner | | 3 | | | — | | | (6) | |
| Net income (loss) allocated to limited partners | | $ | 307,665 | | | $ | (48,518) | | | $ | (590,237) | |
| | | | | | |
| Net income (loss) | | $ | 307,668 | | | $ | (48,518) | | | $ | (590,243) | |
| Other comprehensive income (loss), (net of tax): | | | | | | |
| Foreign currency translation | | 6,666 | | | 6,344 | | | (7,147) | |
| | | | | | |
| Other comprehensive income (loss), (net of tax) | | 6,666 | | | 6,344 | | | (7,147) | |
| Total comprehensive income (loss) | | $ | 314,334 | | | $ | (42,174) | | | $ | (597,390) | |
| Basic income (loss) per limited partner unit: | | | | | | |
| Weighted average limited partner units outstanding | | 55,825 | | | 56,610 | | | 56,476 | |
| Net income (loss) per limited partner unit | | $ | 5.51 | | | $ | (0.86) | | | $ | (10.45) | |
| Diluted income (loss) per limited partner unit: | | | | | | |
| Weighted average limited partner units outstanding | | 56,414 | | | 56,610 | | | 56,476 | |
| Net income (loss) per limited partner unit | | $ | 5.45 | | | $ | (0.86) | | | $ | (10.45) | |
The accompanying Notes to Consolidated Financial Statements are an integral part of these statements.
CEDAR FAIR, L.P.
CONSOLIDATED STATEMENTS OF PARTNERS’ DEFICIT
(In thousands, except per unit amounts)
| | | | | | | | | | | | | | | | | | | | | | | | | | | | | | | | | | | |
| Limited Partnership Units Outstanding | | Limited Partners’ Deficit | | General Partner’s Deficit | | Special L.P. Interests | | Accumulated Other Comprehensive Income (Loss) | | Total Partners’ Deficit |
| Balance as of December 31, 2019 | 56,666 | | | $ | (25,001) | | | $ | (1) | | | $ | 5,290 | | | $ | 9,746 | | | $ | (9,966) | |
| Net loss | — | | | (590,237) | | | (6) | | | — | | | — | | | (590,243) | |
| Partnership distribution declared ($0.935 per unit) | — | | | (53,020) | | | — | | | — | | | — | | | (53,020) | |
| Limited partnership units related to equity-based compensation | 40 | | | (4,721) | | | — | | | — | | | — | | | (4,721) | |
| Tax effect of units involved in treasury unit transactions | — | | | (1,490) | | | — | | | — | | | — | | | (1,490) | |
| Foreign currency translation adjustment, net of tax $(546) | — | | | — | | | — | | | — | | | (7,147) | | | (7,147) | |
| | | | | | | | | | | |
| Other | — | | | 150 | | | — | | | — | | | — | | | 150 | |
| Balance as of December 31, 2020 | 56,706 | | | $ | (674,319) | | | $ | (7) | | | $ | 5,290 | | | $ | 2,599 | | | $ | (666,437) | |
| Net loss | — | | | (48,518) | | | — | | | — | | | — | | | (48,518) | |
| | | | | | | | | | | |
| Limited partnership units related to equity-based compensation | 148 | | | 11,050 | | | — | | | — | | | — | | | 11,050 | |
| Tax effect of units involved in treasury unit transactions | — | | | (927) | | | — | | | — | | | — | | | (927) | |
| Foreign currency translation adjustment, net of tax $(154) | — | | | — | | | — | | | — | | | 6,344 | | | 6,344 | |
| | | | | | | | | | | |
| | | | | | | | | | | |
| Balance as of December 31, 2021 | 56,854 | | | $ | (712,714) | | | $ | (7) | | | $ | 5,290 | | | $ | 8,943 | | | $ | (698,488) | |
| Net income | — | | | 307,665 | | | 3 | | | — | | | — | | | 307,668 | |
| Repurchase of limited partnership units | (4,539) | | | (187,381) | | | — | | | — | | | — | | | (187,381) | |
| Partnership distribution declared ($0.600 per unit) | — | | | (33,455) | | | — | | | — | | | — | | | (33,455) | |
| Limited partnership units related to equity-based compensation | 248 | | | 15,452 | | | — | | | — | | | — | | | 15,452 | |
| Tax effect of units involved in treasury unit transactions | — | | | (2,064) | | | — | | | — | | | — | | | (2,064) | |
| Foreign currency translation adjustment, net of tax $2,082 | — | | | — | | | — | | | — | | | 6,666 | | | 6,666 | |
| | | | | | | | | | | |
| | | | | | | | | | | |
| Balance as of December 31, 2022 | 52,563 | | | $ | (612,497) | | | $ | (4) | | | $ | 5,290 | | | $ | 15,609 | | | $ | (591,602) | |
The accompanying Notes to Consolidated Financial Statements are an integral part of these statements.
CEDAR FAIR, L.P.
CONSOLIDATED STATEMENTS OF CASH FLOWS
(In thousands)
| | | | | | | | | | | | | | | | | | | | |
| | Years Ended December 31, |
| | 2022 | | 2021 | | 2020 |
| CASH FLOWS FROM (FOR) OPERATING ACTIVITIES | | | | | | |
| Net income (loss) | | $ | 307,668 | | | $ | (48,518) | | | $ | (590,243) | |
| Adjustments to reconcile net income (loss) to net cash from (for) operating activities: | | | | | | |
| Depreciation and amortization | | 153,274 | | | 148,803 | | | 157,549 | |
| Loss on early debt extinguishment | | 1,810 | | | 5,909 | | | 2,262 | |
| Loss on impairment of goodwill and other intangibles | | — | | | — | | | 103,999 | |
| Non-cash foreign currency loss (gain) on USD notes | | 23,274 | | | 5,986 | | | (9,344) | |
| Non-cash equity-based compensation expense | | 20,589 | | | 15,431 | | | (209) | |
| Non-cash deferred income tax expense (benefit) | | 4,385 | | | 26,888 | | | (41,933) | |
| Net effect of swaps | | (25,641) | | | (19,000) | | | 15,849 | |
| Gain on sale of land before cash closing costs | | (159,405) | | | — | | | — | |
| Other non-cash expenses | | 16,917 | | | 21,005 | | | 14,547 | |
| Change in operating assets and liabilities: | | | | | | |
| (Increase) decrease in receivables | | (9,117) | | | (27,651) | | | 28,729 | |
| (Increase) decrease in inventories | | (13,400) | | | 15,384 | | | (14,499) | |
| (Increase) decrease in tax receivable/payable | | 110,511 | | | (16,602) | | | (97,488) | |
| (Increase) decrease in other assets | | 5,595 | | | 1,928 | | | (12,180) | |
| Increase (decrease) in accounts payable | | (8,721) | | | 34,515 | | | (9,917) | |
| Increase (decrease) in deferred revenue | | (23,677) | | | 3,622 | | | 31,160 | |
| Increase (decrease) in accrued interest | | 162 | | | (1,711) | | | 12,235 | |
| Increase (decrease) in accrued salaries, wages and benefits | | (274) | | | 28,850 | | | (4,609) | |
| Increase (decrease) in other liabilities | | 3,722 | | | 6,387 | | | (2,445) | |
| Net cash from (for) operating activities | | 407,672 | | | 201,226 | | | (416,537) | |
| CASH FLOWS FROM (FOR) INVESTING ACTIVITIES | | | | | | |
| Capital expenditures | | (183,352) | | | (59,183) | | | (129,087) | |
| | | | | | |
| Proceeds from sale of land | | 310,000 | | | — | | | — | |
| Proceeds from sale of other assets | | — | | | 1,405 | | | 8,266 | |
| Net cash from (for) investing activities | | 126,648 | | | (57,778) | | | (120,821) | |
| CASH FLOWS (FOR) FROM FINANCING ACTIVITIES | | | | | | |
| | | | | | |
| Note borrowings | | — | | | — | | | 1,300,000 | |
| Term debt payments | | (264,250) | | | — | | | (465,125) | |
| Note payments, including amounts paid for early termination | | — | | | (460,755) | | | — | |
| Repurchase of limited partnership units | | (184,646) | | | — | | | — | |
| Distributions paid to partners | | (33,455) | | | — | | | (53,020) | |
| Payment of debt issuance costs | | — | | | (367) | | | (46,849) | |
| Payments related to tax withholding for equity compensation | | (5,137) | | | (4,652) | | | (4,624) | |
| Other | | (2,064) | | | (659) | | | 468 | |
| Net cash (for) from financing activities | | (489,552) | | | (466,433) | | | 730,850 | |
| EFFECT OF EXCHANGE RATE CHANGES ON CASH AND CASH EQUIVALENTS | | (4,698) | | | 7,368 | | | 992 | |
| Net increase (decrease) for the year | | 40,070 | | | (315,617) | | | 194,484 | |
| Balance, beginning of year | | 61,119 | | | 376,736 | | | 182,252 | |
| Balance, end of year | | $ | 101,189 | | | $ | 61,119 | | | $ | 376,736 | |
| | | | | | |
| SUPPLEMENTAL INFORMATION | | | | | | |
| Cash payments for interest | | $ | 137,694 | | | $ | 174,253 | | | $ | 130,444 | |
| Interest capitalized | | 2,825 | | | 1,741 | | | 2,653 | |
| Cash payments for income taxes, net of refunds | | (47,248) | | | 10,054 | | | 1,792 | |
| Capital expenditures in accounts payable | | 14,542 | | | 7,368 | | | 3,286 | |
The accompanying Notes to Consolidated Financial Statements are an integral part of these statements.
CEDAR FAIR, L.P.
INDEX FOR NOTES TO CONSOLIDATED FINANCIAL STATEMENTS
CEDAR FAIR, L.P.
NOTES TO CONSOLIDATED FINANCIAL STATEMENTS
(1) Partnership Organization:
Cedar Fair, L.P. (together with its affiliated companies, the "Partnership") is a Delaware limited partnership that commenced operations in 1983 when it acquired Cedar Point, Inc., and became a publicly traded partnership in 1987. The Partnership's general partner is Cedar Fair Management, Inc., an Ohio corporation (the “General Partner”), whose shares are held by an Ohio trust. The General Partner owns a 0.001% interest in the Partnership's income, losses and cash distributions, except in defined circumstances, and has full responsibility for management of the Partnership. As of December 31, 2022, there were 52,562,832 outstanding limited partnership units listed on The New York Stock Exchange, net of 4,499,151 units held in treasury. As of December 31, 2021, there were 56,854,214 outstanding limited partnership units listed, net of 207,769 units held in treasury.
The General Partner may, with the approval of a specified percentage of the limited partners, make additional capital contributions to the Partnership, but is only obligated to do so if the liabilities of the Partnership cannot otherwise be paid or there exists a negative balance in its capital account at the time of its withdrawal from the Partnership. The General Partner, in accordance with the terms of the Partnership Agreement, is required to make regular cash distributions on a quarterly basis of all the Partnership's available cash, as defined in the Partnership Agreement. Following the temporary closure of our parks in March 2020 in response to COVID-19 health recommendations, the Board of Directors suspended quarterly partnership distributions to maintain flexibility and additional liquidity. The Board of Directors reinstituted quarterly partnership distributions and declared quarterly partnership distributions in the third and fourth quarters of 2022. The General Partner paid $0.60 per limited partner unit in distributions, or approximately $33.5 million in aggregate, in 2022.
(2) Description of the Business and Significant Accounting Policies:
Impact of COVID-19 Pandemic
The novel coronavirus (COVID-19) pandemic had a material impact on our business in 2020, had a continuing negative impact in 2021 and may have a longer-term negative effect. Beginning on March 14, 2020, we closed our properties for several months in response to the spread of COVID-19 and local government mandates. We ultimately resumed partial operations at 10 of our 13 properties in 2020, operating in accordance with local and state guidelines. Due to soft demand trends upon reopening in 2020, park operating calendars were adjusted for the remainder of 2020, including reduced operating days per week and operating hours within each operating day and earlier closure of certain parks than a typical operating year. Following March 14, 2020, Knott's Berry Farm's partial operations in 2020 were limited to culinary festivals.
We delayed the opening of our U.S. properties for the 2021 operating season until May 2021 and opened our Canadian property in July 2021. Upon opening in 2021, we operated with capacity restrictions, guest reservations, and other operating protocols in place. Our 2021 operating calendars were designed to align with anticipated capacity restrictions, guest demand and labor availability, including fewer operating days in July and August at some of our smaller properties and additional operating days in September and the fourth quarter at most of our properties. As vaccination distribution efforts continued during the second quarter of 2021 and we were able to hire additional labor, we removed most capacity restrictions, guest reservation requirements and other protocols at our U.S. properties beginning in July 2021. Canada's Wonderland operated with capacity restrictions, guest reservations, and other operating protocols in place upon opening and throughout 2021.
Each of our properties opened for the 2022 operating season as planned and without restrictions. We currently anticipate continuing to operate without restrictions for the 2023 operating season. However, we have and may continue to adjust future park operating calendars as we respond to changes in guest demand, labor availability and any federal, provincial, state and local restrictions. Our future operations are dependent on factors beyond our knowledge or control, including any future actions taken to contain the COVID-19 pandemic and changing risk tolerances of our employees and guests regarding health matters.
On March 27, 2020, the Coronavirus Aid, Relief, and Economic Security Act (the "CARES Act") was signed into law. During the year ended December 31, 2020, benefits from the CARES Act included an $8.2 million deferral of the employer's share of Social Security taxes and $3.7 million in tax benefits from the Employee Retention Credit program. We also received $0.5 million in tax benefits from the Employee Retention Credit program during the year ended December 31, 2021. The deferral of the employer's share of Social Security taxes was payable in 50% increments in the fourth quarter of 2021 and the fourth quarter of 2022. The current portion of the deferral was included within "Accrued salaries, wages and benefits" and the non-current portion of the deferral was included within "Other Liabilities" within the consolidated balance sheets for 2020 and 2021. The tax benefits from the Employee Retention Credit program were recorded as a reduction to wage expense within the consolidated statements of operations and comprehensive loss as the benefits were offered to defray labor costs during the COVID-19 pandemic.
We also received $5.1 million and $5.0 million from the Canada Emergency Wage Subsidy ("CEWS") during the years ended December 31, 2021 and December 31, 2020, respectively. The CEWS provides cash payments to Canadian employers that experienced a decline in revenues related to the COVID-19 pandemic. We also recorded the CEWS payments as a reduction to wage expense within the consolidated statements of operations and comprehensive loss as the payments were offered to defray labor costs during the COVID-19 pandemic.
Significant Accounting Policies
We use the following policies in the preparation of the accompanying consolidated financial statements.
Principles of Consolidation
The consolidated financial statements include the accounts of the Partnership and its subsidiaries, all of which are wholly owned or the Partnership is the primary beneficiary. Intercompany transactions and balances are eliminated in consolidation.
Foreign Currency
The U.S. dollar is our reporting currency and the functional currency for most of our operations. The financial statements of our Canadian subsidiary are measured using the Canadian dollar as its functional currency. Assets and liabilities are translated into U.S. dollars at the appropriate spot rates as of the balance sheet date, while income and expenses are translated at average monthly exchange rates. Translation gains and losses are included as components of accumulated other comprehensive income (loss) in partners' deficit. Gains or losses from remeasuring foreign currency transactions from the transaction currency to functional currency are included in income (loss). Foreign currency losses (gains) for the periods presented were as follows:
| | | | | | | | | | | | | | | | | | | | |
| | Years Ended December 31, |
| (In thousands) | | 2022 | | 2021 | | 2020 |
| Loss (gain) on foreign currency related to re-measurement of U.S. dollar denominated notes held in Canada | | $ | 23,274 | | | $ | 5,986 | | | $ | (9,344) | |
| Loss (gain) on other transactions | | 510 | | | 191 | | | (2,839) | |
| Loss (gain) on foreign currency | | $ | 23,784 | | | $ | 6,177 | | | $ | (12,183) | |
Segment Reporting
Our properties operate autonomously, and management reviews operating results, evaluates performance and makes operating decisions, including the allocation of resources, on a property-by-property basis. In addition to reviewing and evaluating performance of the business at the property level, the structure of our management incentive compensation systems is centered on the operating results of each property as an integrated operating unit. Therefore, each property represents a separate operating segment of our business with the exception of the Schlitterbahn parks, which are aggregated into one segment. Although we manage our properties with a high degree of autonomy, each property offers and markets a similar collection of products and services to similar customers. In addition, our properties have similar economic characteristics, in that they show similar long-term growth trends in key industry metrics such as attendance, in-park per capita spending, net revenue, operating margin and operating profit. Therefore, we operate within a single reportable segment of amusement/water parks with accompanying resort facilities.
Estimates
The preparation of financial statements in conformity with GAAP requires management to make estimates and assumptions that affect the reported amounts of assets and liabilities, the disclosure of contingent assets and liabilities at the date of the financial statements, and the reported amounts of revenues and expenses during each period. Actual results could differ from those estimates.
Fair Value
Fair value is the price that would be received to sell an asset or paid to transfer a liability in an orderly transaction between market participants, or an exit price. Inputs to valuation techniques used to measure fair value may be observable or unobservable, and valuation techniques used to measure fair value should maximize the use of relevant observable inputs and minimize the use of unobservable inputs. Accordingly, a hierarchical disclosure framework ranks the quality and reliability of information used to determine fair values. The three broad levels of inputs defined by the fair value hierarchy are as follows:
•Level 1 – inputs to the valuation methodology are quoted prices (unadjusted) for identical assets or liabilities in active markets.
•Level 2 – inputs to the valuation methodology include quoted prices for similar assets and liabilities in active markets, and inputs that are observable for the asset or liability, either directly or indirectly, for substantially the full term of the financial instrument.
•Level 3 – inputs to the valuation methodology are unobservable and significant to the fair value measurement.
A financial instrument's categorization within the valuation hierarchy is based upon the lowest level of input that is significant to the fair value measurement. Assets and liabilities recognized or disclosed at fair value on a recurring basis include our derivatives, debt and short-term investments.
Cash and Cash Equivalents
We consider all highly liquid instruments purchased with an original maturity of three months or less to be cash equivalents.
Inventories
Our inventories primarily consist of purchased products, such as merchandise and food, for sale to our customers. Inventories are stated at the lower of cost or market using the first-in, first-out (FIFO) or average cost methods of accounting at the park level.
Property and Equipment
Property and equipment are recorded at cost. Expenditures made to maintain such assets in their original operating condition are expensed as incurred, and improvements and upgrades are generally capitalized. Depreciation is computed on a straight-line basis over the estimated useful lives of the assets. Depreciation expense totaled $153.0 million in 2022, $148.4 million in 2021, and $157.0 million in 2020.
The estimated useful lives of the assets are as follows:
| | | | | | | | | | | |
Land improvements | Approximately | | 25 years |
Buildings | 25 years | - | 40 years |
Rides | 10 years | - | 20 years |
Equipment | 2 years | - | 10 years |
Impairment of Long-Lived Assets
Long-lived assets are reviewed for impairment upon the occurrence of events or changes in circumstances that would indicate that the carrying value of the assets may not be recoverable. A significant amount of judgment is involved in determining if an indicator of impairment has occurred. Such indicators may include, among others: a significant decrease in the market price of a long-lived asset; a significant adverse change in the extent or manner in which a long-lived asset is being used or in its physical condition; a significant adverse change in legal factors or in the business climate; an accumulation of costs significantly in excess of the amount originally expected for the acquisition or construction of a long-lived asset; past, current or future operating or cash flow losses that demonstrate continuing losses associated with the use of a long-lived asset; and a current expectation that a long-lived asset will be sold or disposed significantly before the end of its previously estimated useful life. An impairment loss may be recognized when estimated undiscounted future cash flows expected to result from the use of the asset, including disposition, are less than the carrying value of the asset. The measurement of the impairment loss to be recognized is based on the difference between the fair value and the carrying amounts of the assets. Fair value is generally determined using a combination of a cost and market approach. Significant factors considered in the cost approach include replacement cost, reproduction cost, depreciation, physical deterioration, functional obsolescence and economic obsolescence of the assets. The market approach estimates fair value by utilizing market data for similar assets. In order to determine if an asset has been impaired, assets are grouped and tested at the lowest level for which identifiable, independent cash flows are available.
Accounting for Business Combinations
Business combinations are accounted for under the acquisition method of accounting. The amounts assigned to the identifiable assets acquired and liabilities assumed in connection with acquisitions are based on estimated fair values as of the date of the acquisition, with the remainder, if any, recorded as goodwill. The fair values are determined by management, taking into consideration information supplied by the management of the acquired entities, valuations supplied by independent appraisal experts and other relevant information. The valuations are generally based upon future cash flow projections for the acquired assets, discounted to present value. The determination of fair values requires significant judgment by management.
Goodwill
Goodwill is reviewed annually for impairment, or whenever events or changes in circumstances indicate that the carrying value may not be recoverable. Goodwill is allocated to reporting units and goodwill impairment tests are performed at the reporting unit level. We perform our annual goodwill impairment test as of the first day of the fourth quarter.
We may elect to first perform a qualitative assessment to determine whether it is more likely than not that a reporting unit is impaired. If we do not perform a qualitative assessment, or if we determine that it is not more likely than not that the fair value of the reporting unit exceeds its carrying amount, we calculate the fair value of the reporting unit. The fair value of a reporting unit is established using a combination of an income (discounted cash flow) approach and market approach. The income approach uses a reporting unit's projection of estimated operating results and discounted cash flows using a weighted-average cost of capital that reflects current market conditions. Estimated operating results are established using management's best estimates of economic and market conditions over the projected period including growth rates in revenues and costs, estimates of future expected changes in operating margins and cash expenditures. Other significant estimates and assumptions include terminal value growth rates, future estimates of capital expenditures and changes in future working capital requirements. A market approach estimates fair value by applying cash flow multiples to the reporting unit's operating performance. The multiples are derived from comparable publicly traded companies with similar operating and investment characteristics of the reporting units. If an impairment is identified, an impairment charge is recognized for the amount by which a reporting unit's carrying amount exceeds its fair value, not to exceed the carrying amount of goodwill.
Other Intangible Assets
Our finite-lived intangible assets consist primarily of licenses, franchise agreements and the California's Great America trade name. These intangible assets are amortized on a straight-line basis over the life of the agreement, ranging from five to twenty years.
Our indefinite-lived intangible assets consist of trade names other than the California's Great America trade name. Our indefinite-lived trade names are reviewed annually for impairment, or more frequently if impairment indicators arise. We may elect to first perform a qualitative assessment to determine whether it is more likely than not that a trade name is impaired. If we do not perform a qualitative assessment, or if we determine that it is not more likely than not that the fair value of the trade name exceeds its carrying amount, we calculate the fair value of the trade name using a relief-from-royalty model. Principal assumptions under the relief-from-royalty model include royalty rates, growth rates in revenues, estimates of future expected changes in operating margins, terminal value growth rates, and a discount rate based on a weighted-average cost of capital that reflects current market conditions. We assess the indefinite-lived trade names for impairment separately from goodwill.
Self-Insurance Reserves
Self-insurance reserves are recorded for the estimated amounts of guest and employee claims and related expenses incurred each period. Reserves are established for both identified claims and incurred but not reported ("IBNR") claims and are recorded when claim amounts become probable and estimable. Reserves for identified claims are based upon our historical claim experience and third-party estimates of settlement costs. Reserves for IBNR claims are based upon our claims data history. Self-insurance reserves are periodically reviewed for changes in facts and circumstances and adjustments are made as necessary. As of December 31, 2022 and December 31, 2021, the accrued self-insurance reserves totaled $27.8 million and $24.6 million, respectively.
Derivative Financial Instruments
We are exposed to market risks, primarily resulting from changes in interest rates and currency exchange rates. To manage these risks, we may enter into derivative transactions pursuant to our overall financial risk management program. We do not use derivative financial instruments for trading purposes. We typically do not designate our derivatives as cash flow hedges. Instruments that do not qualify for hedge accounting are prospectively adjusted to fair value each reporting period through "Net effect of swaps".
Leases
We have commitments under various operating leases. Right-of-use assets and lease liabilities are recognized at the present value of the future lease payments at the lease commencement date. The discount rate used to determine the present value of the future lease payments is generally our incremental borrowing rate as the rate implicit in most of our leases is not readily determinable. As a practical expedient, a relief provided in the accounting standard to simplify compliance, we do not recognize right-of-use assets and lease liabilities for leases with an original term of one year or less and have elected to not separate lease components from non-lease components. The current portion of our lease liability is recorded within "Other accrued liabilities" in the consolidated balance sheets.
Revenue Recognition and related receivables and contract liabilities
As disclosed within the consolidated statements of operations and comprehensive income (loss), revenues are generated from sales of (1) admission to our amusement parks and water parks, (2) food, merchandise and games both inside and outside the parks, and (3) accommodations, extra-charge products, and other revenue sources. Admission revenues include amounts paid to gain admission into our parks, including parking fees. Revenues related to extra-charge products, including premium benefit offerings such as front-of-line products, and online transaction fees charged to customers are included in "Accommodations, extra-charge products and other". Due to our highly seasonal operations, a substantial portion of our revenues typically are generated from Memorial Day through Labor Day. Most revenues are recognized on a daily basis based on actual guest spend at our properties. Revenues from multi-use products, including season-long products for admission, dining, beverage and other products, are recognized over the estimated number of uses expected for each type of product. The estimated number of uses is reviewed and may be updated periodically during the operating season prior to the ticket or product expiration, which generally occurs no later than the close of the operating season associated with that product. The number of uses is estimated based on historical usage adjusted for current period trends. For any bundled products that include multiple performance obligations, revenue is allocated using the retail price of each distinct performance obligation and any inherent discounts are allocated based on the gross margin and expected redemption of each performance obligation. We do not typically provide for refunds or returns.
In some instances, we arrange with outside parties ("concessionaires") to provide goods to guests, typically food and merchandise, and we act as an agent, resulting in net revenues recorded within the consolidated statements of operations and comprehensive income (loss). Concessionaire arrangement revenues are recognized over the operating season and are variable. Sponsorship revenues and marina revenues, which are classified as "Accommodations, extra-charge products and other," are recognized over the park operating season which represents the period in which the performance obligations are satisfied. Sponsorship revenues are either fixed or are variable based on achievement of specified operating metrics. We estimate variable revenues and perform a constraint analysis using both historical information and current trends to determine the amount of revenue that is not probable of a significant reversal.
Most deferred revenue is classified as current within the balance sheet. However, a portion of deferred revenue is typically classified as non-current during the third quarter related to season-long products sold in the current season for use in the subsequent season. Season-long products are typically sold beginning in August of the year preceding the operating season. Season-long products may subsequently be recognized 12 to 16 months after purchase depending on the date of sale. We estimate the number of uses expected outside of the next twelve months for each type of product and classify the related deferred revenue as non-current in the consolidated balance sheets.
Except for the non-current deferred revenue described above, our contracts with customers typically have an original duration of one year or less. For these short-term contracts, we use the practical expedient applicable to such contracts and have not disclosed the transaction price for the remaining performance obligations as of the end of each reporting period or when we expect to recognize this revenue. Further, we elected to recognize incremental costs of obtaining a contract as an expense when incurred as the amortization period of the asset would be less than one year. Lastly, we elected not to adjust consideration for the effects of significant financing components of our installment purchase plans because the terms of these plans do not exceed one year.
Advertising Costs
Production costs of commercials and programming are expensed in the year first aired. All other costs associated with advertising, promotion and marketing programs are expensed as incurred, or for certain costs, over each park's operating season. Certain prepaid costs incurred through year-end for the following year's advertising programs are included within "Other current assets" in the consolidated balance sheets. Advertising expense totaled $45.5 million in 2022, $37.0 million in 2021 and $10.5 million in 2020. Due to the effects of the COVID-19 pandemic, we incurred limited advertising expense in 2020 to correspond with lower than typical attendance levels and abbreviated park operating calendars. In 2021, we also incurred less advertising costs due to fewer operating days in the year.
Equity-Based Compensation
We measure compensation cost for all equity-based awards at fair value on the date of grant. We recognize the compensation cost over the service period. We recognize forfeitures as they occur.
Income Taxes
Our legal entity structure includes both partnerships and corporate subsidiaries. We are subject to publicly traded partnership tax ("PTP tax") on certain partnership level gross income (net revenues less cost of food, merchandise, and games revenues), state and local income taxes on partnership income, U.S. federal state and local income taxes on income from our corporate subsidiaries and foreign income taxes on our foreign subsidiary. As such, the total provision for taxes includes amounts for the PTP gross income tax and federal, state, local and foreign income taxes. Under applicable accounting rules, the total provision for income taxes includes the amount of taxes payable for the current year and the impact of deferred tax assets and liabilities, which represents future tax consequences of events that are recognized in different periods in the financial statements than for tax purposes.
Neither financial reporting income, nor the cash distributions to unitholders, can be used as a substitute for the detailed tax calculations that we must perform annually for our partners. Net income from the Partnership is not treated as passive income for federal income tax purposes. As a result, partners subject to the passive activity loss rules are not permitted to offset income from the Partnership with passive losses from other sources.
Our corporate subsidiaries account for income taxes under the asset and liability method. Accordingly, deferred tax assets and liabilities are recognized for the future book and tax consequences attributable to temporary differences between the financial statement carrying amounts of existing assets and liabilities and their respective tax bases. Deferred tax assets and liabilities are determined using enacted tax rates expected to apply in the year in which those temporary differences are expected to be recovered or settled. The effect on deferred tax assets and liabilities of a change in tax law is recognized in income at the time of enactment of such change in tax law. Any interest or penalties due for payment of income taxes are included in the provision for income taxes.
Earnings Per Unit
For purposes of calculating the basic and diluted earnings per limited partner unit, no adjustments have been made to the reported amounts of net income (loss). The unit amounts used in calculating the basic and diluted earnings per limited partner unit for the years ended December 31, 2022, 2021 and 2020 are as follows:
| | | | | | | | | | | | | | | | | | | | |
| | Years Ended December 31, |
| (In thousands, except per unit amounts) | | 2022 | | 2021 | | 2020 |
| Basic weighted average units outstanding | | 55,825 | | | 56,610 | | | 56,476 | |
| Effect of dilutive units: | | | | | | |
| | 72 | | | — | | | — | |
| | 29 | | | — | | | — | |
| | 463 | | | — | | | — | |
| | 25 | | | — | | | — | |
| | | | | | |
| Diluted weighted average units outstanding | | 56,414 | | | 56,610 | | | 56,476 | |
| Net (loss) income per unit - basic | | $ | 5.51 | | | $ | (0.86) | | | $ | (10.45) | |
| Net (loss) income per unit - diluted | | $ | 5.45 | | | $ | (0.86) | | | $ | (10.45) | |
There were approximately 0.4 million and 0.3 million potentially dilutive units excluded from the computation of diluted loss per limited partner unit for the years ended December 31, 2021 and 2020, respectively, as their effect would have been anti-dilutive due to the net loss in the period.
New Accounting Pronouncements
In March 2020, the FASB issued Accounting Standards Update No. 2020-04, Facilitation of the Effects of Reference Rate Reform on Financial Reporting ("ASU 2020-04"). ASU 2020-04 provides optional guidance to ease the potential burden in accounting for (or recognizing the effects of) reference rate reform on contracts, hedging relationships, and other transactions that reference London Interbank Offered Rate ("LIBOR") or another reference rate expected to be discontinued because of reference rate reform. ASU 2020-04 is effective as of March 12, 2020 through December 31, 2022. In January 2021, the FASB amended ASU 2020-04 by issuing Accounting Standards Update No. 2021-01, Reference Rate Reform Scope ("ASU 2021-01"). ASU 2021-01 clarifies the scope of optional expedients and exceptions to derivatives that are affected by the discounting transition. The standard did not have a material effect on the consolidated financial statements and related disclosures.
(3) Revenue Recognition:
As disclosed within the consolidated statements of operations and comprehensive income (loss), revenues are generated from sales of (1) admission to our amusement parks and water parks, (2) food, merchandise and games both inside and outside the parks, and (3) accommodations, extra-charge products, and other revenue sources. Admission revenues include amounts paid to gain admission into our parks, including parking fees. Revenues related to extra-charge products, including premium benefit offerings such as front-of-line products, and online transaction fees charged to customers are included in "Accommodations, extra-charge products and other".
The following table presents net revenues disaggregated by revenues generated within the parks and revenues generated from out-of-park operations less amounts remitted to outside parties under concessionaire arrangements for the periods presented. The amounts are not comparable due to the effects of the COVID-19 pandemic.
| | | | | | | | | | | | | | | | | | | | |
| | Years Ended December 31, |
| (In thousands) | | 2022 | | 2021 | | 2020 |
| In-park revenues | | $ | 1,659,183 | | | $ | 1,209,505 | | | $ | 120,370 | |
| Out-of-park revenues | | 213,337 | | | 167,978 | | | 67,375 | |
| Concessionaire remittance | | (55,137) | | | (39,264) | | | (6,190) | |
| Net revenues | | $ | 1,817,383 | | | $ | 1,338,219 | | | $ | 181,555 | |
Many products, including season-long products, are sold to customers in advance, resulting in a contract liability ("deferred revenue"). Deferred revenue is typically at its highest immediately prior to the peak summer season, and at its lowest at the beginning of the calendar year following the close of our parks' operating seasons. Season-long products represent most of the deferred revenue balance in any given period.
Due to the effects of the COVID-19 pandemic, we extended the validity of our 2020 season-long products through the 2021 operating season in order to ensure our season pass holders received a full season of access to our parks. The extended validity of the 2020 season-long products resulted in a significant amount of revenue deferred from 2020 into 2021. All 2020 and 2021 season-long product revenue had been recognized as of December 31, 2021 except for season-long product extensions into 2022 at two parks. Knott's Berry Farm offered a further day-for-day extension into calendar year 2022 for 2020 and 2021 season-long products for every day the park was closed in 2021. The extension for the 2020 and 2021 season-long products at Knott's
Berry Farm concluded and all related revenue had been recognized by the end of the second quarter of 2022. Canada's Wonderland extended its 2020 and 2021 season-long products through Labour Day, or September 5, 2022. All Canada's Wonderland 2020 and 2021 season-long product revenue had been recognized by the end of the third quarter of 2022. In order to calculate revenue recognized on these extended season-long products, management made significant estimates regarding the estimated number of uses expected for these season-long products for admission, dining, beverage and other products, including during interim periods.
Of the $187.6 million of current deferred revenue recorded as of January 1, 2022, all of the deferred revenue was recognized by December 31, 2022, except for an immaterial amount of deferred revenue for prepaid products such as gift cards and prepaid games cards. As of December 31, 2022, we had recorded $10.0 million of non-current deferred revenue which largely represented prepaid lease payments for a portion of the California's Great America parking lot. The prepaid lease payments are being recognized through 2027 following the sale of the land under California's Great America; see Note 4. Prior to the sale, the prepaid lease payments were being recognized through 2039.
Payment is due immediately on the transaction date for most products. Our receivable balance includes outstanding amounts on installment purchase plans which are offered for season-long products, and includes sales to retailers, group sales and catering activities which are billed. Installment purchase plans vary in length from three monthly installments to 12 monthly installments. Payment terms for billings are typically net 30 days. Receivables in a typical operating year are highest in the peak summer months and lowest in the winter months. We are not exposed to a significant concentration of customer credit risk. As of December 31, 2022 and December 31, 2021, we recorded a $5.8 million and $5.7 million allowance for doubtful accounts, respectively, representing estimated defaults on installment purchase plans. The default estimate is calculated using historical default rates adjusted for current period trends. The allowance for doubtful accounts is recorded as a reduction of deferred revenue to the extent revenue has not been recognized on the corresponding season-long products.
(4) Long-Lived Assets:
Long-lived assets are reviewed for impairment upon the occurrence of events or changes in circumstances that would indicate that the carrying value of the assets may not be recoverable. In order to determine if an asset has been impaired, assets are grouped and tested at the lowest level for which identifiable, independent cash flows are available. A significant amount of judgment is involved in determining if an indicator of impairment has occurred. Such indicators may include, among others: a significant decrease in the market price of a long-lived asset; a significant adverse change in the extent or manner in which a long-lived asset is being used or in its physical condition; a significant adverse change in legal factors or in the business climate; an accumulation of costs significantly in excess of the amount originally expected for the acquisition or construction of a long-lived asset; past, current or future operating or cash flow losses that demonstrate continuing losses associated with the use of a long-lived asset; and a current expectation that a long-lived asset will be sold or disposed significantly before the end of its previously estimated useful life. Any adverse change in these factors could have a significant impact on the recoverability of these assets and could have a material impact on the consolidated financial statements.
On June 27, 2022, the Partnership sold the land at California's Great America for a cash purchase price of $310 million, subject to customary prorations, which resulted in a $155.3 million gain recorded, net of transaction costs, within "Gain on sale of assets" in the consolidated statement of operations and comprehensive income (loss) during the third quarter of 2022. Concurrently with the sale, we entered into a lease contract that allows us to operate the park during a six-year term; see Note 11. As a result, we changed the estimated useful lives of the remaining property and equipment at California's Great America to an approximate 5.5-year period, or through December 31, 2027. We expect this to result in an approximate $8 million increase in annual depreciation expense over the 5.5-year period. We may dispose of the remaining property and equipment at California's Great America significantly before the end of their previously estimated useful lives if the assets are not sold to a third party or transferred for an alternate use. As a result, we also tested the long-lived assets at California's Great America for impairment during the second quarter of 2022, which resulted in no impairment. The fair value of the long-lived assets was determined using a replacement cost approach. We concluded no other indicators of impairment existed during 2022 and 2021, respectively. We based our conclusions on our financial performance projections, as well as an updated analysis of macroeconomic and industry-specific conditions.
During the first and third quarters of 2020 and due to the negative effects of the COVID-19 pandemic on our forecasted operating results, we tested our long-lived assets for impairment. We concluded the estimated fair values of the long-lived assets at the Schlitterbahn parks no longer exceeded the related carrying values during the first quarter of 2020. Therefore, we recorded a $2.7 million impairment charge equal to the difference between the fair value and the carrying amounts of the assets in "Loss on impairment / retirement of fixed assets" within the consolidated statement of operations and comprehensive loss during the first quarter of 2020. The fair value of the long-lived assets was determined using a real and personal property appraisal which was performed in accordance with ASC 820 - Fair Value Measurement.
(5) Goodwill and Other Intangible Assets:
Goodwill and other indefinite-lived intangible assets, including trade names are reviewed for impairment annually, or more frequently if indicators of impairment exist. During the second quarter of 2022, we concluded the useful life of the trade name, California's Great America, was no longer indefinite due to the then-anticipated sale of the land and the eventual disposal of the remaining assets; see Note 4. As a result, we tested the California's Great America trade name totaling $0.7 million for impairment during the second quarter of 2022 resulting in no impairment charge. The fair value of the trade name was calculated using a relief-from-royalty model. We are amortizing the trade name over an approximate 5.5-year period, or through December 31, 2027. We concluded no other indicators of impairment existed during 2022 and 2021, respectively. We based our conclusions on our financial performance projections, as well as an updated analysis of macroeconomic and industry-specific conditions. We performed our annual impairment test as of the first days of the fourth quarter in 2022 and 2021, respectively, and concluded there was no further impairment of the carrying value of goodwill or other indefinite-lived intangible assets in either period.
As of our 2022 annual impairment test on September 26, 2022, the Schlitterbahn Waterpark & Resort New Braunfels and the Schlitterbahn Waterpark Galveston ("Schlitterbahn") reporting unit's fair value exceeded its carrying value by less than 10%. The fair value of the Schlitterbahn parks reporting unit was impacted by a slower than expected near-term recovery of attendance following the COVID-19 pandemic, increased projected capital expenditures, and an increase in the weighted average cost of capital. If future operating results do not meet expectations, the goodwill assigned to the Schlitterbahn reporting unit may become impaired. The goodwill assigned to the Schlitterbahn reporting unit totaled $93.1 million as of December 31, 2022. The fair values of all other reporting units with goodwill exceeded their respective carrying values by a substantial margin.
During the first and third quarters of 2020 and due to the negative effects of the COVID-19 pandemic on our forecasted operating results, we tested our goodwill and indefinite-lived intangible assets for impairment. We concluded the estimated fair value of goodwill at the Schlitterbahn parks and Dorney Park reporting units, and the estimated fair value of the Schlitterbahn trade name no longer exceeded their carrying values. Therefore, we recorded a $73.6 million, $6.8 million and $7.9 million impairment of goodwill at the Schlitterbahn parks, goodwill at Dorney Park, and the Schlitterbahn trade name, respectively, during the first quarter of 2020. We also recorded an $11.3 million, $2.3 million and $2.2 million impairment of goodwill at the Schlitterbahn parks, goodwill at Dorney Park, and the Schlitterbahn trade name, respectively, during the third quarter of 2020. The impairment charges were equal to the amount by which the carrying amounts exceeded the assets' fair value and were recorded in "Loss on impairment of goodwill and other intangibles" within the consolidated statement of operations and comprehensive loss.
The fair value of our reporting units is established using a combination of an income (discounted cash flow) approach and market approach. The income approach uses each reporting unit's projection of estimated operating results and discounted cash flows using a weighted-average cost of capital that reflects current market conditions. Estimated operating results are established using our best estimates of economic and market conditions over the projected period including growth rates in revenues and costs, estimates of future expected changes in operating margins and cash expenditures. Other significant estimates and assumptions include terminal value growth rates, future estimates of capital expenditures and changes in future working capital requirements. The market approach estimates fair value by applying cash flow multiples to each reporting unit's operating performance. The multiples are derived from comparable publicly traded companies with similar operating and investment characteristics of the reporting units. The impairment charges recognized are for the amount by which the reporting unit's carrying amount exceeds its fair value.
Our indefinite-lived intangible assets consist of trade names. The fair value of our trade names is calculated using a relief-from-royalty model. The impairment charges recognized are for the amount by which the trade name's carrying amount exceeds its fair value.
Management makes significant estimates calculating the fair value of our reporting units and trade names. Actual results could materially differ from these estimates.
Changes in the carrying value of goodwill for the years ended December 31, 2022 and December 31, 2021 were:
| | | | | | | | |
(In thousands) | | Goodwill |
Balance as of December 31, 2020 | | $ | 266,961 | |
| | |
Foreign currency exchange translation | | 271 | |
Balance as of December 31, 2021 | | $ | 267,232 | |
| | |
Foreign currency exchange translation | | (4,026) | |
Balance as of December 31, 2022 | | $ | 263,206 | |
As of December 31, 2022 and December 31, 2021, other intangible assets consisted of the following:
| | | | | | | | | | | | | | | | | | | | | | | | | | |
| (In thousands) | | Weighted Average Amortization Period | | Gross Carrying Amount | | Accumulated Amortization | | Net Carrying Value |
| December 31, 2022 | | | | | | | | |
| Other intangible assets: | | | | | | | | |
| Trade names (1) | | 5.5 years | | $ | 48,619 | | | $ | (63) | | | $ | 48,556 | |
| License / franchise agreements | | 13.0 years | | 4,293 | | | (3,899) | | | 394 | |
| Total other intangible assets | | | | $ | 52,912 | | | $ | (3,962) | | | $ | 48,950 | |
| | | | | | | | |
| December 31, 2021 | | | | | | | | |
| Other intangible assets: | | | | | | | | |
| Trade names | | — | | | $ | 49,515 | | | $ | — | | | $ | 49,515 | |
| License / franchise agreements | | 12.0 years | | 4,262 | | | (3,783) | | | 479 | |
| Total other intangible assets | | | | $ | 53,777 | | | $ | (3,783) | | | $ | 49,994 | |
(1) The weighted average amortization period represents the California's Great America trade name. Our other trade names are indefinite-lived.
Amortization expense of finite-lived other intangible assets for 2022, 2021 and 2020 was immaterial and is expected to be immaterial going forward.
(6) Long-Term Debt:
Long-term debt as of December 31, 2022 and December 31, 2021 consisted of the following:
| | | | | | | | | | | | | | |
| (In thousands) | | December 31, 2022 | | December 31, 2021 |
| | | | |
| U.S. term loan averaging 2.56% in 2022; 1.85% in 2021 (1) | | $ | — | | | $ | 264,250 | |
| Notes | | | | |
| | | | |
| 2025 U.S. fixed rate senior secured notes at 5.500% | | 1,000,000 | | | 1,000,000 | |
| 2027 U.S. fixed rate senior unsecured notes at 5.375% | | 500,000 | | | 500,000 | |
| 2028 U.S. fixed rate senior unsecured notes at 6.500% | | 300,000 | | | 300,000 | |
| 2029 U.S. fixed rate senior unsecured notes at 5.250% | | 500,000 | | | 500,000 | |
| | 2,300,000 | | | 2,564,250 | |
| Less current portion | | — | | | — | |
| | 2,300,000 | | | 2,564,250 | |
| Less debt issuance costs and original issue discount | | (31,845) | | | (45,314) | |
| | $ | 2,268,155 | | | $ | 2,518,936 | |
(1)The weighted average interest rates do not reflect the effect of interest rate swap agreements; see Note 7. The 2022 year-to-date interest rate reflects borrowings prior to full repayment of the term loan facility during the third quarter of 2022.
Term Debt and Revolving Credit Facilities
In April 2017, we amended and restated our credit agreement (the "2017 Credit Agreement") which includes our senior secured revolving credit facility and which included a senior secured term loan facility. During 2022, we made the remaining $264.3 million of principal payments on the senior secured term loan facility, fully repaying the term loan facility. As a result, we recognized a $1.8 million loss on early debt extinguishment during the third quarter of 2022, inclusive of the write-off of debt issuance costs and original issue discount. Prior to repayment, the term loan facility was scheduled to mature on April 15, 2024 and bore interest at London InterBank Offered Rate ("LIBOR") plus 175 basis points (bps).
As of December 31, 2022, our total senior secured revolving credit facility capacity under the 2017 Credit Agreement, as amended, was $300 million with a Canadian sub-limit of $15 million. The senior secured revolving credit facility bore interest at LIBOR plus 350 bps or Canadian Dollar Offered Rate ("CDOR") plus 250 bps, requires the payment of a 62.5 bps commitment fee per annum on the unused portion of the revolving credit facility, in each case without any step-downs, and matured in December 2023. In April 2022, $75 million of the senior secured revolving credit facility capacity under the 2017 Credit Agreement matured, and the outstanding borrowings were repaid. While such $75 million of senior secured revolving credit facility capacity was available, borrowings under this portion of the revolver capacity bore interest at LIBOR plus 300 bps or CDOR plus 200 bps, and the unused portion of this revolving credit facility capacity required the payment of a 37.5 bps commitment fee per annum. The 2017 Credit Agreement, as amended, also provides for the issuance of documentary and standby letters of credit, and is collateralized by substantially all of the assets of the Partnership. We amended the 2017 Credit
Agreement in February 2022 to allow for greater sale and leaseback transactions. In the first quarter of 2023, we further amended the 2017 Credit Agreement to extend the maturity of the senior secured revolving credit facility, among other things; see Note 13.
As of December 31, 2022 and December 31, 2021, no amounts were outstanding under the revolving credit facility. After letters of credit of $19.9 million and $15.8 million, we had $280.1 million and $359.2 million of availability under our revolving credit facility as of December 31, 2022 and December 31, 2021, respectively. The maximum outstanding revolving credit facility balance during 2022 was $185.0 million.
Notes
In April 2020, as a result of the anticipated effects of the COVID-19 pandemic, we issued $1.0 billion of 5.500% senior secured notes due 2025 ("2025 senior notes") in a private placement. The 2025 senior notes and the related guarantees are secured by first-priority liens on the issuers' and the guarantors' assets that secure all the obligations under our credit facilities. The net proceeds from the offering of the 2025 senior notes were used to repay $463.3 million of our then-outstanding senior secured term loan facility. The remaining amount was for general corporate and working capital purposes, including fees and expenses related to the transaction. The 2025 senior notes pay interest semi-annually in May and November, with the principal due in full on May 1, 2025. The 2025 senior notes may be redeemed, in whole or in part, at various prices depending on the date redeemed.
In June 2014, we issued $450 million of 5.375% senior unsecured notes due 2024 ("2024 senior notes"). The 2024 senior notes paid interest semi-annually in June and December, with the principal due in full on June 1, 2024. On December 17, 2021, we redeemed all of the 2024 senior notes at a redemption price equal to 100.896% of the principal amount plus accrued and unpaid interest. As a result, we recognized a $5.9 million loss on early debt extinguishment during the fourth quarter of 2021, inclusive of debt premium payments of $4.1 million and the write-off of debt issuance costs of $1.8 million.
In April 2017, we issued $500 million of 5.375% senior unsecured notes due 2027 ("2027 senior notes"). The 2027 senior notes pay interest semi-annually in April and October, with the principal due in full on April 15, 2027. The 2027 senior notes may be redeemed, in whole or in part, at various prices depending on the date redeemed.
In June 2019, we issued $500 million of 5.250% senior unsecured notes due 2029 ("2029 senior notes"). The 2029 senior notes pay interest semi-annually in January and July, with the principal due in full on July 15, 2029. The 2029 senior notes may be redeemed, in whole or in part, at any time prior to July 15, 2024 at a price equal to 100% of the principal amount of the notes redeemed plus a "make-whole" premium together with accrued and unpaid interest and additional interest, if any, to the redemption date. Thereafter, the 2029 senior notes may be redeemed, in whole or in part, at various prices depending on the date redeemed.
In October 2020, in response to the continuing effects of the COVID-19 pandemic, we issued $300 million of 6.500% senior unsecured notes due 2028 ("2028 senior notes"). The net proceeds from the offering of the 2028 senior notes were for general corporate and working capital purposes, including fees and expenses related to the transaction. The 2028 senior notes pay interest semi-annually in April and October with the principal due in full on October 1, 2028. Prior to October 1, 2023, up to 35% of the 2028 senior notes may be redeemed with the net cash proceeds of certain equity offerings at a price equal to 106.500% of the principal amount thereof, together with accrued and unpaid interest, if any. The 2028 senior notes may be redeemed, in whole or in part, at any time prior to October 1, 2023 at a price equal to 100% of the principal amount of the notes redeemed plus a "make-whole" premium together with accrued and unpaid interest and additional interest, if any, to the redemption date. Thereafter, the 2028 senior notes may be redeemed, in whole or in part, at various prices depending on the date redeemed.
As market conditions warrant, we may from time to time repurchase our outstanding debt securities in privately negotiated or open market transactions, by tender offer, exchange offer or otherwise.
Covenants
The 2017 Credit Agreement, as amended, includes a Senior Secured Leverage Ratio of 4.50x Total First Lien Senior Secured Debt-to-Consolidated EBITDA, which will step down to 4.00x in the second quarter of 2023 and which will step down further to 3.75x in the third quarter of 2023. Following the amendment in the first quarter of 2023, this financial covenant is only required to be tested at the end of any fiscal quarter in which revolving credit facility borrowings are outstanding. The 2017 Credit Agreement, as amended and as in effect prior to the first quarter of 2023 amendment, included an Additional Restrictions Period to provide further covenant relief during the COVID-19 pandemic. We terminated the Additional Restrictions Period during the first quarter of 2022 by achieving compliance with the Senior Secured Leverage Ratio covenant as of the end of the fourth quarter of 2021. We were in compliance with the applicable financial covenants under our credit agreement during 2022.
Our credit agreement and fixed rate note agreements include Restricted Payment provisions, which could limit our ability to pay partnership distributions. Pursuant to the terms of the indenture governing the 2027 senior notes, which includes the most restrictive of these Restricted Payments provisions, if our pro forma Total-Indebtedness-to-Consolidated-Cash-Flow Ratio is greater than 5.25x, we can still make Restricted Payments of $100 million annually so long as no default or event of default has occurred and is continuing. If our pro forma Total-Indebtedness-to-Consolidated-Cash-Flow Ratio is less than or equal to 5.25x,
we can make Restricted Payments up to our Restricted Payment pool. Our pro forma Total-Indebtedness-to-Consolidated-Cash-Flow Ratio was less than 5.25x as of December 31, 2022.
(7) Derivative Financial Instruments:
Derivative financial instruments are used within our overall risk management program to manage certain interest rate and foreign currency risks. By utilizing a derivative instrument to hedge exposure to LIBOR rate changes, we are exposed to counterparty credit risk, in particular the failure of the counterparty to perform under the terms of the derivative contract. To mitigate this risk, hedging instruments are placed with a counterparty that we believe poses minimal credit risk. We do not use derivative financial instruments for trading purposes.
As of December 31, 2021, we had four interest rate swap agreements with a notional value of $500 million that converted one-month variable rate LIBOR to a fixed rate of 2.88% through December 31, 2023. This resulted in a 4.63% fixed interest rate for borrowings under our then-outstanding senior secured term loan facility after the impact of interest rate swap agreements. None of the interest rate swap agreements were designated as hedging instruments. We terminated our interest rate swap agreements during the third quarter of 2022 following the full repayment of our senior secured term loan facility, resulting in a $5.3 million cash receipt, net of fees. The fair value of our swap portfolio, including the location within the consolidated balance sheets, for the periods presented were as follows:
| | | | | | | | | | | | | | |
(In thousands) | Balance Sheet Location | December 31, 2022 | | December 31, 2021 |
Derivatives not designated as hedging instruments: | | | | |
| | | | |
Interest rate swaps | Derivative Liability | — | | | $ | (20,086) | |
| | | | |
Instruments that do not qualify for hedge accounting are adjusted to fair value each reporting period through "Net effect of swaps" within the consolidated statements of operations and comprehensive income (loss).
(8) Partners' Equity and Equity-Based Compensation:
Special L.P. Interests
In accordance with the Partnership Agreement, certain partners were allocated $5.3 million of 1987 and 1988 taxable income (without any related cash distributions) for which they received Special L.P. Interests. The Special L.P. Interests do not participate in cash distributions and have no voting rights. However, the holders of Special L.P. Interests will receive in the aggregate $5.3 million upon liquidation of the Partnership.
Equity-Based Incentive Plan
The 2016 Omnibus Incentive Plan was approved by our unitholders in June 2016 and allows the awarding of up to 2.8 million unit options and other forms of equity as determined by the Compensation Committee of the Board of Directors as an element of compensation to senior management, key employees and directors. The 2016 Omnibus Incentive Plan superseded the 2008 Omnibus Incentive Plan which was approved by our unitholders in May 2008 and allowed the awarding of up to 2.5 million unit options and other forms of equity. Outstanding awards under the 2008 Omnibus Incentive Plan continue to be in effect and are governed by the terms of that plan. The 2016 Omnibus Incentive Plan provides an opportunity for officers, directors, and eligible persons to acquire an interest in the growth and performance of our units and provides employees annual and long-term incentive awards as determined by the Board of Directors. Under the 2016 Omnibus Incentive Plan, the Compensation Committee of the Board of Directors may grant unit options, unit appreciation rights, restricted units, performance awards, other unit awards, cash incentive awards and unrestricted unit awards. The awards granted by the Compensation Committee fall into two categories, Awards Payable in Cash or Equity, and Awards Payable in Equity. The impact of these awards is more fully described below.
Equity-based compensation expense recognized in the consolidated statements of operations and comprehensive income (loss) within "Selling, General and Administrative Expense" for the applicable periods was as follows:
| | | | | | | | | | | | | | | | | | | | |
| | Years Ended December 31, |
| (In thousands) | | 2022 | | 2021 (1) | | 2020 (2) |
| Awards Payable in Cash or Equity | | | | | | |
| | | | | | |
| | | | | | |
| Deferred units | | $ | (206) | | | $ | 1,014 | | | $ | (588) | |
| Awards Payable in Equity | | | | | | |
| Performance units | | 12,787 | | | 10,554 | | | (5,270) | |
| Restricted units | | 7,613 | | | 4,878 | | | 5,061 | |
| | | | | | |
| Total equity-based compensation expense | | $ | 20,194 | | | $ | 16,446 | | | $ | (797) | |
(1) Due to the effects of the COVID-19 pandemic on 2020 results, the 2018-2020 three-year performance plan was below the payout threshold. Given that two full years of the program were completed, the 2018-2020 performance unit awards were modified to allow for a payout taking into account 2018-2019 results, management's performance relative to 2020
COVID-19 strategic goals and 2020 pre-COVID-19 forecast, resulting in $3.9 million of additional expense recognized during the year ended December 31, 2021.
(2) The market value of our deferred unit awards and the anticipated payout of our annual performance unit awards decreased due to the effects of the COVID-19 pandemic resulting in expense reversed during the year ended December 31, 2020.
Awards Payable in Cash or Equity
Deferred Units
| | | | | | | | | | | | | | |
| (In thousands, except per unit amounts) | | Number of Units | | Weighted Average Grant Date Fair Value Per Unit |
| Outstanding deferred units at December 31, 2021 | | 56 | | | $ | 51.70 | |
Granted (1) | | 7 | | | $ | 42.31 | |
| | | | |
| Settled | | (13) | | | $ | 56.67 | |
| Outstanding deferred units at December 31, 2022 | | 50 | | | $ | 49.00 | |
(1) Includes 1 forfeitable distribution-equivalent units
Deferred unit awards vest over a one-year period and the settlement of these units is deferred until the individual's service to the Partnership ends. The deferred units begin to accumulate distribution-equivalents upon vesting and are paid when the restriction ends. The effect of outstanding deferred unit awards has been included in the diluted earnings per unit calculation for the year ended December 31, 2022, as a portion of the awards are expected to be settled in limited partnership units. As of December 31, 2022, the market value of the deferred units was $2.1 million, was classified as current and was recorded within "Other accrued liabilities" within the consolidated balance sheet. As of December 31, 2022, there was no unamortized expense related to unvested deferred unit awards as all units were fully vested.
Awards Payable in Equity
Performance Units
| | | | | | | | | | | | | | |
| (In thousands, except per unit amounts) | | Number of Units | | Weighted Average Grant Date Fair Value Per Unit |
| Unvested performance units at December 31, 2021 | | 430 | | | $ | 43.13 | |
Granted (1) | | 414 | | | $ | 55.73 | |
| Forfeited | | (15) | | | $ | 54.71 | |
| Vested | | (92) | | | $ | 27.92 | |
| Unvested performance units at December 31, 2022 | | 737 | | | $ | 51.87 | |
(1) Includes 10 forfeitable distribution-equivalent units
Of the unvested performance units outstanding as of December 31, 2022, 343,511 units represented annual awards for the 2022-2024 three-year performance period. The number of performance units issuable under these performance unit awards are contingently based upon certain performance targets over the three-year vesting period. The annual performance awards and the related forfeitable distribution-equivalent units are paid out in the first quarter following the performance period in limited partnership units. Our annual performance unit awards based upon the 2020-2022 three-year performance period did not payout due to the effects of the COVID-19 pandemic.
The remaining outstanding performance units as of December 31, 2022 represented the 2021-2025 performance-based units awarded in 2021. These units were awarded instead of the traditional annual performance unit awards with three-year performance periods due to continued uncertainty related to the COVID-19 pandemic. The number of performance units issuable under the 2021-2025 performance-based unit awards are contingently based upon three separate financial performance targets which can vest over a three to five-year period. The performance targets become incrementally higher over the five-year period. The 2021-2025 performance-based unit awards and related forfeitable distribution-equivalent units will be paid out in limited partnership units upon the achievement of each target in the first quarter following the year the target was earned. The first opportunity for units to be paid out under the 2021-2025 performance-based unit awards will be in the first quarter of 2024.
The effect of outstanding performance unit awards, for which the performance conditions had been met, have been included in the diluted earnings per unit calculation for the year ended December 31, 2022.
The vested performance units for the year ended December 31, 2022 represented performance-based other units awarded in 2020 to incentivize optimal executive performance in light of the effects of the COVID-19 pandemic. The number of units issuable
were contingently based upon the level of attainment of various performance objectives over a six-month period with the awards payable in limited partnership units following the one-year anniversary of the six-month performance period, which occurred in the first quarter of 2022. These unit awards did not earn distribution-equivalent units.
As of December 31, 2022, unamortized compensation expense related to unvested performance unit awards was $20.6 million, which is expected to be amortized over a weighted average period of 1.7 years. The fair value of the performance units is based on the unit price the day before the date of grant. We assess the probability of the performance targets being met and may reverse prior period expense or recognize additional expense accordingly.
Restricted Units
| | | | | | | | | | | | | | |
| (In thousands, except per unit amounts) | | Number of Units | | Weighted Average Grant Date Fair Value Per Unit |
| Unvested restricted units at December 31, 2021 | | 228 | | | $ | 49.44 | |
| Granted | | 241 | | | $ | 52.65 | |
| Forfeited | | (7) | | | $ | 53.82 | |
| Vested | | (121) | | | $ | 49.02 | |
| Unvested restricted units at December 31, 2022 | | 341 | | | $ | 51.77 | |
As of December 31, 2022, 212,273 of our outstanding restricted units vest evenly over an approximate three-year period, 107,274 units outstanding vest following an approximate three-year cliff vesting period, and 21,235 units outstanding vest under alternate vesting schedules, all of which approximate three years. Restrictions on our restricted unit awards lapse upon vesting. During the vesting period for restricted unit awards, the units accumulate forfeitable distribution-equivalents, which when the units are fully vested, are payable in cash. As of December 31, 2022, the amount of forfeitable distribution equivalents accrued totaled $0.3 million; $0.1 million of which was classified as current and recorded within "Other accrued liabilities" within the consolidated balance sheet and $0.1 million of which was classified as non-current and recorded within "Other Liabilities".
As of December 31, 2022, unamortized compensation expense, determined as the market value of the units on the day before the date of grant, related to unvested restricted unit awards was $10.2 million, which is expected to be amortized over a weighted average period of 1.9 years.
Unit Options
| | | | | | | | | | | | | | | | | | | | | | | | | | |
| (In thousands, except per unit amounts) | | Unit Options | | Weighted Average Exercise Price | | Weighted Average Remaining Contractual Life | | Aggregate Intrinsic Value |
| Options outstanding at December 31, 2021 | | 118 | | | $ | 35.27 | | | | | |
| | | | | | | | |
| Exercised | | (27) | | | $ | 29.53 | | | | | |
| | | | | | | | |
| Options outstanding at December 31, 2022 | | 91 | | | $ | 36.95 | | | | | |
| Options exercisable, end of year | | 91 | | | $ | 36.95 | | | 0.2 years | | $ | 399 | |
Unit options are issued with an exercise price no less than the market closing price of the Partnership's units on the day before the date of grant. Outstanding unit options vested over three years and have a maximum term of ten years. As of December 31, 2022, we had 90,928 fixed-price unit options outstanding under the 2008 Omnibus Incentive Plan. No options have been granted under the 2016 Omnibus Incentive Plan.
The exercise price of the unit options outstanding was $36.95 as of December 31, 2022. The total intrinsic value of unit options exercised during the years ended December 31, 2022, 2021 and 2020 was $0.7 million, $2.0 million, and $0.0 million, respectively.
We have a policy of issuing limited partnership units from treasury to satisfy unit option exercises, and we expect our treasury unit balance to be sufficient for 2023 based on estimates of unit option exercises for that period.
Unit Repurchase Plan
On August 3, 2022, we announced that our Board of Directors approved a unit repurchase plan authorizing the Partnership to repurchase units for an aggregate purchase price of not more than $250 million. The unit repurchase program is subject to Rule 10b-18 of the Securities Exchange Act of 1934. Subject to applicable rules and regulations, we may repurchase units from time-to-time in the open market or by negotiated transactions. The amount and timing of repurchases are based on a variety of factors, including liquidity, capital needs of the business, market conditions, regulatory requirements, and other corporate considerations. No limit was placed on the duration of the repurchase program. The unit repurchase program does not obligate the Partnership to repurchase any minimum dollar amount or specific number of units, and the program may be modified, suspended or discontinued at any time.
There were 4.5 million limited partnership units repurchased during the year ended December 31, 2022 at an average price of $41.28 per limited partner unit for an aggregate amount of $187.4 million. There was $62.6 million of remaining availability under the repurchase program as of December 31, 2022. There were no unit repurchases in 2021 or 2020.
(9) Retirement Plans:
We have trusteed, noncontributory retirement plans for most of our full-time employees. Contributions are discretionary and amounts accrued were approximately $4.8 million and $1.8 million for the years ended December 31, 2022 and 2021, respectively. For the year ended December 31, 2020, we did not make any discretionary contributions due to the effects of the COVID-19 pandemic on our financial performance. Additionally, we have a trusteed, contributory retirement plan for most of our full-time employees. This plan permits employees to contribute specified percentages of their salary, matched up to a limit. Matching contributions, net of forfeitures, approximated $5.7 million, $4.7 million and $3.8 million for the years ended December 31, 2022, 2021 and 2020, respectively.
In addition, approximately 260 employees are covered by union-sponsored, multi-employer pension plans for which approximately $2.1 million, $1.9 million and $2.0 million were contributed for the years ended December 31, 2022, 2021 and 2020, respectively. A union representing approximately 15 employees is expected to decertify in 2023. The related withdrawal liability is expected to be immaterial.
(10) Income and Partnership Taxes:
Federal and state tax legislation in 1997 provided a permanent income tax exemption to existing publicly traded partnerships (PTP), such as Cedar Fair, L.P., with a PTP tax levied on partnership gross income (net revenues less cost of food, merchandise and games) beginning in 1998. In addition, income taxes are recognized for the amount of income taxes payable by Cedar Fair, L.P. and its corporate subsidiaries for the current year and for the impact of deferred tax assets and liabilities that represent future tax consequences of events that have been recognized differently in the financial statements than for tax purposes. As such, the "Provision (benefit) for taxes" includes amounts for both the PTP tax and for federal, state, local and foreign income taxes.
The 2022 tax provision totaled $64.0 million, which consisted of a $14.4 million provision for the PTP tax and a $49.6 million provision for income taxes. This compared with a 2021 tax provision of $20.0 million, which consisted of a $10.3 million provision for the PTP tax and a $9.7 million provision for income taxes, and a 2020 tax benefit of $137.9 million, which consisted of a $2.5 million provision for the PTP tax and a $140.4 million benefit for income taxes. The calculation of the tax provision (benefit) involves significant estimates and assumptions. Actual results could differ from those estimates.
Significant components of income (loss) before taxes for the years ended December 31, 2022, 2021 and 2020 were as follows:
| | | | | | | | | | | | | | | | | | | | |
| (In thousands) | | 2022 | | 2021 | | 2020 |
| Domestic | | $ | 327,897 | | | $ | (3,603) | | | $ | (675,746) | |
| Foreign | | 43,760 | | | (24,880) | | | (52,412) | |
| Total income (loss) before taxes | | $ | 371,657 | | | $ | (28,483) | | | $ | (728,158) | |
| | | | | | |
The provision (benefit) for income taxes was comprised of the following for the years ended December 31, 2022, 2021 and 2020:
| | | | | | | | | | | | | | | | | | | | |
| (In thousands) | | 2022 | | 2021 | | 2020 |
| Current federal | | $ | 22,912 | | | $ | (21,438) | | | $ | (61,726) | |
| Current state and local | | 2,799 | | | 1,395 | | | (3,747) | |
| Current foreign | | 19,456 | | | 2,896 | | | (32,987) | |
| Total current | | 45,167 | | | (17,147) | | | (98,460) | |
| Deferred federal, state and local | | 6,113 | | | 17,870 | | | (43,220) | |
| Deferred foreign | | (1,728) | | | 9,018 | | | 1,287 | |
| Total deferred | | 4,385 | | | 26,888 | | | (41,933) | |
| Total provision (benefit) for income taxes | | $ | 49,552 | | | $ | 9,741 | | | $ | (140,393) | |
The provision (benefit) for income taxes for the corporate subsidiaries differed from the amount computed by applying the U.S. federal statutory income tax rate of 21% to income (loss) before taxes. The sources and tax effects of the differences were as follows:
| | | | | | | | | | | | | | | | | | | | |
| (In thousands) | | 2022 | | 2021 | | 2020 |
| Income tax provision based on the U.S. federal statutory tax rate | | $ | 78,048 | | | $ | (5,981) | | | $ | (152,913) | |
| Partnership (income) loss not subject to corporate income tax | | (38,556) | | | 257 | | | 47,631 | |
| State and local taxes, net | | 8,154 | | | 776 | | | (20,594) | |
| Valuation allowance | | 9 | | | 14,619 | | | 3,150 | |
| Expired foreign tax credits | | — | | | 888 | | | 2,253 | |
| Tax credits | | (1,483) | | | (901) | | | (426) | |
| Change in U.S. tax law | | (107) | | | (1,326) | | | (17,983) | |
| Foreign currency translation losses (gains) | | 4,754 | | | 1,143 | | | (1,455) | |
| Nondeductible expenses and other | | (1,267) | | | 266 | | | (56) | |
| Total provision (benefit) for income taxes | | $ | 49,552 | | | $ | 9,741 | | | $ | (140,393) | |
Deferred income taxes reflect the net tax effects of temporary differences between the carrying amounts of assets and liabilities for financial reporting purposes and the amounts used for income tax purposes.
Significant components of deferred tax assets and liabilities as of December 31, 2022 and December 31, 2021 were as follows:
| | | | | | | | | | | | | | |
| (In thousands) | | 2022 | | 2021 |
| Deferred tax assets: | | | | |
| Compensation | | $ | 14,817 | | | $ | 11,835 | |
| Accrued expenses | | 4,135 | | | 5,051 | |
| Foreign tax credits | | 11,467 | | | 8,392 | |
| Tax attribute carryforwards | | 13,823 | | | 20,580 | |
| Derivatives | | — | | | 5,021 | |
| Foreign currency translation | | 5,313 | | | 2,523 | |
| Deferred revenue | | 1,911 | | | 3,539 | |
| Lease liability | | 19,037 | | | — | |
| | | | |
| Deferred tax assets | | 70,503 | | | 56,941 | |
| Valuation allowance | | (24,228) | | | (24,374) | |
| Net deferred tax assets | | 46,275 | | | 32,567 | |
| Deferred tax liabilities: | | | | |
| Property | | (76,871) | | | (78,062) | |
| Intangibles | | (20,170) | | | (20,988) | |
| Right-of-use asset | | (18,646) | | | — | |
| Deferred tax liabilities | | (115,687) | | | (99,050) | |
| Net deferred tax liability | | $ | (69,412) | | | $ | (66,483) | |
We record a valuation allowance if, based on the weight of available evidence, it is more likely than not that some portion, or all, of a deferred tax asset will not be realized. The need for this allowance is based on several factors including the carryforward periods for net operating losses and tax credits, prior experience of tax credit limitations, and management's long-term estimates of domestic and foreign source income.
As of December 31, 2022, we recorded a $24.2 million valuation allowance related to two items, $11.5 million related to foreign tax credits and $12.7 million related to other tax attribute carryforwards. The valuation allowance related to foreign tax credits equaled the entire $11.5 million deferred tax asset for foreign tax credit carryforwards. We do not expect to fully realize the foreign tax credit carryforwards primarily due to the U.S. statutory rate being less than the Canadian statutory tax rate. The amount recorded represented a $3.1 million increase in the valuation allowance from 2021.
The valuation allowance related to other tax attributes is the sum of $10.4 million and $2.3 million and related to $11.5 million of state net operating loss carryforwards and $2.3 million of Canadian capital loss carryforwards, respectively. We do not expect to fully realize all of the unused state net operating loss carryforwards before they expire from 2025 to 2041. This represented a $3.1 million decrease in the valuation allowance from 2021 due to income in the corporate subsidiaries. The valuation allowance relating to Canadian capital losses equals the total amount generated during 2021. We do not expect to use these capital losses as they are only available to offset Canadian capital gain. The amount recorded for Canadian capital losses represented a $0.1 million decrease in valuation allowance from 2021.
The CARES Act resulted in various changes to the U.S. tax law, including, among other things, allowing net operating losses arising in tax years 2018 through 2020 to be carried back to the preceding five taxable years and removing the limitation that such losses only offset 80% of taxable income. As a result of these changes, we received U.S. tax refunds attributable to the net operating loss in tax year 2020 being carried back to prior years. We received refunds of $77.1 million during the second quarter of 2022 and an additional $2.5 million during the fourth quarter of 2022. We also received $11.1 million in tax refunds attributable to the net operating loss of our Canadian corporate subsidiary being carried back to prior years in Canada during the first quarter of 2022. The refunds were recorded within "Current income tax receivable" in the consolidated balance sheet as of December 31, 2021.
We have recorded a deferred tax liability of $1.2 million and $3.3 million as of December 31, 2022 and December 31, 2021, respectively, to account for foreign currency translation adjustments in other comprehensive income.
Our unrecognized tax benefits, including accrued interest and penalties, were not material in any year presented. We recognize accrued interest and penalties related to unrecognized tax benefits as income tax expense.
We are subject to taxation in the U.S., Canada and various state and local jurisdictions. Our tax returns are subject to examination by state and federal tax authorities. With few exceptions, we are no longer subject to examination by the major taxing authorities for tax years before 2018.
(11) Lease Commitments:
Our most significant lease commitment is for the land at California's Great America, which we sold on June 27, 2022. Concurrently with the sale of the land, we entered into a lease contract that allows us to operate the park during a six-year term, and we have an option to extend the term for an additional five years. The lease is subject to early termination by the buyer with at least two years' prior notice. The annual base rent under the lease liability was initially $12.2 million and will increase by 2.5% per year. Upon commencement of the lease, we recognized a right-of-use asset and lease liability equal to the annual base rent for the initial six-year term. Upon termination of the lease, we will close existing park operations and remove the rides and attractions from the land. As of December 31, 2022, we included estimated lease payments to dismantle and remove rides and attractions totaling $12.9 million within the right-of-use asset and lease liability. The discount rate used to determine the present value of the future lease payments was our incremental borrowing rate. We sublease a portion of the California's Great America parking lot to the Santa Clara Stadium Authority during Levi's Stadium events. The lease payments were prepaid, and the corresponding income is being recognized over the lease term, or through 2027. The annual lease income recognized is immaterial.
Other significant lease commitments include corporate office space in Charlotte, North Carolina and the land on which Schlitterbahn Waterpark Galveston is located. The corporate office space is generally leased through 2029. The Schlitterbahn Waterpark Galveston land lease has an initial term through 2024 with renewal options at our discretion through 2049, which we have concluded we are reasonably certain to exercise. We have also entered into various operating leases for office equipment, vehicles, storage and revenue-generating assets.
Total lease cost and related supplemental information for the years ended December 31, 2022, 2021 and 2020 were as follows:
| | | | | | | | | | | | | | | | | | | | | | |
| | Years Ended December 31, | | |
| (In thousands, except for lease term and discount rate) | | 2022 | | 2021 | | 2020 | | |
| Operating lease expense | | $ | 9,857 | | | $ | 2,711 | | | $ | 2,797 | | | |
| Variable lease expense | | 972 | | | 872 | | | 173 | | | |
| Short-term lease expense | | 8,769 | | | 7,563 | | | 2,205 | | | |
| Sublease income | | (715) | | | — | | | — | | | |
| Total lease cost | | $ | 18,883 | | | $ | 11,146 | | | $ | 5,175 | | | |
| | | | | | | | |
| Weighted-average remaining lease term | | 6.7 years | | 14.1 years | | 16.8 years | | |
| Weighted-average discount rate | | 3.7 | % | | 3.7 | % | | 4.1 | % | | |
| Operating cash flows for operating leases | | $ | 9,034 | | | $ | 2,299 | | | $ | 2,679 | | | |
| Leased assets obtained in exchange for new operating lease liabilities (non-cash activity) | | $ | 85,789 | | | $ | 4,914 | | | $ | 1,769 | | | |
Future undiscounted cash flows under our operating leases and a reconciliation to the operating lease liabilities recognized as of December 31, 2022 are included below:
| | | | | | | | |
| (In thousands) | | December 31, 2022 |
| Undiscounted cash flows | | |
| 2023 | | $ | 15,256 | |
| 2024 | | 15,039 | |
| 2025 | | 15,251 | |
| 2026 | | 15,316 | |
| 2027 | | 15,325 | |
| Thereafter | | 31,836 | |
| Total | | $ | 108,023 | |
| | |
| Present value of cash flows | | |
| Current lease liability | | $ | 12,043 | |
| Lease Liability | | 81,757 | |
| Total | | $ | 93,800 | |
| | |
| Difference between undiscounted cash flows and discounted cash flows | | $ | 14,223 | |
(12) Fair Value Measurements:
The table below presents the balances of assets and liabilities measured at fair value as of December 31, 2022 and December 31, 2021 on a recurring basis, as well as the fair values of other financial instruments, including their locations within the consolidated balance sheets:
| | | | | | | | | | | | | | | | | | | | | | | | | | | | | |
| (In thousands) | | | | | December 31, 2022 | | December 31, 2021 |
| Balance Sheet Location | Fair Value Hierarchy Level | | Carrying Value | Fair Value | | Carrying Value | Fair Value |
| Financial assets (liabilities) measured on a recurring basis: | | | | | | |
| Short-term investments | | Other current assets | Level 1 | | $ | 432 | | $ | 432 | | | $ | 478 | | $ | 478 | |
| Interest rate swaps | | Derivative Liability | Level 2 | | — | | — | | | $ | (20,086) | | $ | (20,086) | |
| Other financial assets (liabilities): | | | | | | |
| Term debt | | Long-Term Debt (1) | Level 2 | | — | | — | | | $ | (264,250) | | $ | (257,644) | |
| | | | | | | | | |
| 2025 senior notes | | Long-Term Debt (1) | Level 2 | | $ | (1,000,000) | | $ | (985,000) | | | $ | (1,000,000) | | $ | (1,035,000) | |
| 2027 senior notes | | Long-Term Debt (1) | Level 1 | | $ | (500,000) | | $ | (476,250) | | | $ | (500,000) | | $ | (513,750) | |
| 2028 senior notes | | Long-Term Debt (1) | Level 1 | | $ | (300,000) | | $ | (291,000) | | | $ | (300,000) | | $ | (319,125) | |
| 2029 senior notes | | Long-Term Debt (1) | Level 1 | | $ | (500,000) | | $ | (446,250) | | | $ | (500,000) | | $ | (513,750) | |
(1)Carrying values of long-term debt balances are before reductions for debt issuance costs and original issue discount of $31.8 million and $45.3 million as of December 31, 2022 and December 31, 2021, respectively.
Fair values of the interest rate swap agreements are determined using significant inputs, including LIBOR forward curves, which are considered Level 2 observable market inputs.
The carrying value of cash and cash equivalents, accounts receivable, accounts payable, and accrued liabilities approximates fair value because of the short maturity of these instruments. There were no assets or liabilities measured at fair value on a non-recurring basis as of December 31, 2022 or December 31, 2021.
(13) Subsequent Events:
On February 10, 2023, we further amended the 2017 Credit Agreement to extend the maturity date of our senior secured revolving credit facility, convert the existing LIBOR-based interest rate for our senior secured revolving credit facility to the applicable Secured Overnight Financing Rate ("SOFR"), and make other certain amendments to provide greater covenant flexibility, including modifying the requirement for the financial maintenance covenant to only be applicable at the end of any fiscal quarter in which revolving credit borrowings are outstanding. Following this amendment, the senior secured revolving credit facility matures on February 10, 2028, provided that the maturity date will be (x) January 30, 2025 if at least $200.0 million of the 2025 senior notes remain outstanding as of that date, or (y) January 14, 2027 if at least $200.0 million of the 2027 senior notes remain outstanding as of that date. In addition, the senior secured revolving credit facility will bear interest at SOFR plus 350 bps.
ITEM 9. CHANGES IN AND DISAGREEMENTS WITH ACCOUNTANTS ON ACCOUNTING
AND FINANCIAL DISCLOSURE.
None.
ITEM 9A. CONTROLS AND PROCEDURES.
Disclosure Controls and Procedures
We maintain a system of controls and procedures designed to ensure that information required to be disclosed by us in our reports under the Securities Exchange Act of 1934, as amended, is recorded, processed, summarized and reported within the time periods specified by the Commission and that such information is accumulated and communicated to management, including the Chief Executive Officer and the Chief Financial Officer, as appropriate, to allow timely decisions regarding required disclosure. As of December 31, 2022, management, with the participation of our Chief Executive Officer and Chief Financial Officer, has evaluated the effectiveness of our disclosure controls and procedures. Based upon that evaluation, the Chief Executive Officer and Chief Financial Officer concluded that our disclosure controls and procedures were effective as of December 31, 2022.
Management's Report on Internal Control over Financial Reporting
Management is responsible for establishing and maintaining adequate internal control over financial reporting, as defined in Rules 13a-15(f) and 15d-15(f) under the Exchange Act. Our internal control over financial reporting is a process designed to provide reasonable assurance regarding the reliability of financial reporting and the preparation of financial statements for external purposes in accordance with generally accepted accounting principles. Management, with the participation of our Chief Executive Officer and Chief Financial Officer, assessed the effectiveness of our internal control over financial reporting as of December 31, 2022. In making this assessment, it used the criteria described in "Internal Control - Integrated Framework" (2013) issued by the Committee of Sponsoring Organizations (COSO) of the Treadway Commission. As a result of its assessment, management concluded that, as of December 31, 2022, our internal control over financial reporting was effective. Deloitte & Touche LLP, the independent registered public accounting firm that audited the financial statements included in this Form 10-K, has issued an attestation report on our internal control over financial reporting.
Changes in Internal Control over Financial Reporting
There were no changes in our internal control over financial reporting that occurred during the fourth quarter of 2022 that have materially affected, or are reasonably likely to materially affect, our internal control over financial reporting.
ITEM 9B. OTHER INFORMATION.
None.
ITEM 9C. DISCLOSURE REGARDING FOREIGN JURISDICTIONS THAT PREVENT INSPECTIONS.
Not applicable.
PART III
ITEM 10. DIRECTORS, EXECUTIVE OFFICERS AND CORPORATE GOVERNANCE.
Cedar Fair Management, Inc., an Ohio corporation owned by an Ohio trust, is the General Partner of the Partnership and has full responsibility for the management of the Partnership; see Note 1.
A. Identification of Directors:
The information required by this item is incorporated by reference to the material in our Proxy Statement to be used in connection with the annual meeting of limited partner unitholders to be held in May 2023 (the "Proxy Statement") under the captions "Proposal One. Election of Directors", "Board Committees", and, if required, "Delinquent Section 16(a) Reports".
B. Identification of Executive Officers:
Information regarding executive officers of the Partnership is included in this Annual Report on Form 10-K under the caption "Supplemental Item. Information about our Executive Officers" in Item 1 of Part I and is incorporated herein by reference.
C. Code of Ethics and Certifications:
In accordance with Section 406 of the Sarbanes-Oxley Act of 2002 and Item 406 of Regulation S-K, we have adopted a Code of Conduct and Ethics (the "Code"), which applies to all directors, officers and employees, including the Chief Executive Officer, Chief Financial Officer and Chief Accounting Officer. A copy of the Code is available on our Investor Relations website (www.ir.cedarfair.com).
We submitted an unqualified Section 303A.12(a) Chief Executive Officer certification to the New York Stock Exchange on June 15, 2022, stating that we were in compliance with the NYSE's Corporate Governance Listing Standards. The Chief Executive Officer and Chief Financial Officer certifications under Section 302 of the Sarbanes-Oxley Act are included as exhibits to this Form 10-K.
ITEM 11. EXECUTIVE COMPENSATION.
The information required by this item is incorporated by reference to the material in our Proxy Statement under the captions "Executive Compensation", "Compensation Committee Interlocks and Insider Participation", and "Compensation Committee Report".
ITEM 12. SECURITY OWNERSHIP OF CERTAIN BENEFICIAL OWNERS AND MANAGEMENT AND RELATED UNITHOLDER MATTERS.
The information required by this item is incorporated by reference to the material in our Proxy Statement under the caption "SecuritySecurity Ownership of Certain Beneficial Owners and Management".Management
The following tables set forth the number and percentage of Partnership units beneficially owned by each of the Partnership's directors, each of the named executive officers, and all current directors and executive officers as a group as of April 19, 2024, and by each person known by the Partnership to own 5% or more of its units.
Directors, Board Nominees and Executive Officers
| | | | | | | | | | | | | | | | | | | | | | | | | | |
| Amount and Nature of Beneficial Ownership |
| Name of Beneficial Owner | Beneficial Ownership (1) | | Voting Power (1) | | Investment Power | Percentage of Units (2) |
| Sole | Shared | | Sole | Shared |
| Richard A. Zimmerman | 325,388 | | (3) | 325,388 | | — | | | 258,515 | | — | | * |
| Brian C. Witherow | 190,572 | | (4) | 188,204 | | 2,368 | | | 168,549 | | 2,368 | | * |
| Tim V. Fisher | 121,179 | | (5) | 121,179 | | — | | | 48,721 | | — | | * |
| Brian M. Nurse | 27,974 | | (6) | 27,974 | | — | | | 6,044 | | — | | * |
| Monica R. Sauls | 18,479 | | (7) | 18,479 | | — | | | 580 | | — | | * |
| Kelley S. Ford | 61,023 | | (8) | 61,023 | | — | | | 57,764 | | — | | * |
| Nina Barton | 2,309 | | (9) | 2,309 | | — | | | 2,309 | | — | | * |
| Louis Carr | 10,234 | | (9) | 10,234 | | — | | | 10,234 | | — | | * |
| Michelle M. Frymire | 4,556 | | | 4,556 | | — | | | 4,556 | | — | | * |
| Daniel J. Hanrahan | 56,211 | | (9) | 56,211 | | — | | | 56,211 | | — | | * |
| Jennifer Mason | 4,556 | | | 4,556 | | — | | | 4,556 | | — | | * |
| D. Scott Olivet | 32,463 | | (9) | 32,463 | | — | | | 32,463 | | — | | * |
| Carlos A. Ruisanchez | 24,571 | | (9) | 24,571 | | — | | | 24,571 | | — | | * |
| All directors and executive officers as a group (15 individuals) (10) | 949,136 | | | 946,768 | | 2,368 | | | 734,352 | | 2,368 | | 1.9% |
* Less than one percent of outstanding units.
EQUITY COMPENSATION PLAN INFORMATION(2) Each beneficial owner's ownership percentage has been calculated including any deferred units the beneficial owner has the right to acquire within 60 days after April 19, 2024. The ownership percentage of the directors and executive officers as a group has been calculated assuming any deferred units that the directors as a group have a right to acquire within 60 days after April 19, 2024.
(3) Consists of 258,515 units as to which Mr. Zimmerman has sole voting and investment power which are directly owned by Mr. Zimmerman as of April 19, 2024 and the restricted units referenced in footnote 1.
(4) Consists of 168,549 units as to which Mr. Witherow has sole voting and investment power which are directly owned by Mr. Witherow as of April 19, 2024 and the restricted units referenced in footnote 1; as well as 2,368 units for which he has shared voting and investment power.
(5) Consists of 48,721 units as to which Mr. Fisher has sole voting and investment power which are directly owned by Mr. Fisher as of April 19, 2024 and the restricted units referenced in footnote 1.
(6) Consists of 6,044 units as to which Mr. Nurse has sole voting and investment power which are directly owned by Mr. Nurse as of April 19, 2024 and the restricted units referenced in footnote 1.
(7) Consists of 580 units as to which Ms. Sauls has sole voting and investment power which are directly owned by Ms. Sauls as of April 19, 2024 and the restricted units referenced in footnote 1.
(8) Consists of 57,764 units as to which Ms. Ford has sole voting and investment power which are directly owned by Ms. Ford as of April 19, 2024 and the restricted units referenced in footnote 1.
(9) Includes units which such directors have the vested right to acquire (within 60 days of April 19, 2024) through the conversion of deferred units under the director equity deferred compensation program upon termination of a service as a director of
Cedar Fair: Ms. Barton, 2,309; Mr. Carr, 9,789 units; Mr. Hanrahan, 17,900 units; Mr. Olivet, 25,237 units; and Mr. Ruisanchez, 6,208 units.
(10) The table only includes executive officers as of April 19, 2024. The unit amounts listed include a total of 61,443 units of limited partner interest which all executive officers and directors as of April 19, 2024 as a group have deferred equity compensation with the right to acquire within 60 days from April 19, 2024.
5% or Greater Unitholders
| | | | | | | | | | | |
| Name and Address of Beneficial Owner | Amount and Nature of Beneficial Ownership | | Percentage of Units |
Morgan Stanley
Morgan Stanley Strategic Investments, Inc.
1585 Broadway
New York, NY 10036 | 4,669,409 | (1) | 9.1% |
The Goldman Sachs Group, Inc.
Goldman Sachs & Co. LLC
200 West Street
New York, NY 10282 | 4,010,517 | (2) | 7.8% |
ING Groep, N.V.
PO Box 1800
Amsterdam, P7
1000 BV Amsterdam
ING Financial Markets LLC
1133 Avenue of the Americas
New York, NY 10036 | 3,798,700 | (3) | 7.4% |
JPMorgan Chase & Co.
383 Madison Avenue
New York, NY 10179 | 2,950,980 | (4) | 5.8% |
(1) Based upon a Schedule 13G/A filing by Morgan Stanley and Morgan Stanley Strategic Investments, Inc. on February 12, 2024. On the Schedule 13G/A, Morgan Stanley reported shared voting power over 4,587,352 units and reported shared dispositive power over and aggregate beneficial ownership of 4,669,409 units. Morgan Stanley Strategic Investments, Inc. reported shared voting power, shared dispositive power over and aggregate beneficial ownership of 4,535,168 units.
(2) Based upon a Schedule 13G/A filing by The Goldman Sachs Group, Inc. and Goldman Sachs & Co. LLC ("Goldman Sachs") on February 6, 2024. On the Schedule 13G/A, Goldman Sachs reported shared voting power over 4,007,317 units and reported shared dispositive power over and aggregate beneficial ownership of 4,010,517 units.
(3) Based upon a Schedule 13G/A filing by ING Groep, N.V. and ING Financial Markets LLC ("ING") on February 8, 2024. On the Schedule 13G/A, ING reported shared voting power, shared dispositive power over and aggregate beneficial ownership of 3,798,700 units.
(4) Based upon a Schedule 13G filing by JP Morgan Chase & Co. ("JPMorgan") on February 6, 2024. On the Schedule 13G, JPMorgan reported shared voting power, shared dispositive power and aggregate beneficial ownership of 2,950,980 units.
Equity Compensation Plan Information
The following table sets forth information concerning units authorized or available for issuance under our equity compensation plan
(see Note 8) as of December 31, 2022:2023: | | | | | | | | | | | | | | | | | | | | |
| Plan Category | |
Number of units to be issued upon exercise of outstanding options, warrants and rights (a) (1) | |
Weighted-average exercise price of outstanding options, warrants and rights (b) (2) | | Number of units remaining available for future issuance under equity compensation plans
(excluding units
reflected in column (a))
(c) |
| Equity compensation plans approved by unitholders | | 1,181,686 | | | $ | 36.95 | | | 1,435,133 | |
| Equity compensation plans not approved by unitholders | | — | | | — | | | — | |
| Total | | 1,181,686 | | | $ | 36.95 | | | 1,435,133 | |
| | | | | | | | | | | | | | | | | | | | |
| Plan Category | |
Number of units to be issued upon exercise of outstanding options, warrants and rights (a) (1) | |
Weighted-average exercise price of outstanding options, warrants and rights
(b) | | Number of units remaining available for future issuance under equity compensation plans
(excluding units
reflected in column (a))
(c) |
| Equity compensation plans approved by unitholders | | 1,599,491 | | | — | | | 636,090 | |
| Equity compensation plans not approved by unitholders | | — | | | — | | | — | |
| Total | | 1,599,491 | | | — | | | 636,090 | |
(1)The units in column (a) include performance awards and deferred unit awards at the maximum number of units issuable, as well as unit options outstanding.issuable.
(2)The weighted average priceSee Note 8 in column (b) represents"Notes to Consolidated Financial Statements" in the weighted average price of 90,928 unit options outstanding. Performance awards and deferred unit awards are excluded from column (b).
ITEM 13. CERTAIN RELATIONSHIPS AND RELATED TRANSACTIONS, AND DIRECTOR INDEPENDENCE.
The information required by this item is incorporated by reference to the material in our Proxy Statement under the captions "CertainCertain Relationships and Related Transactions", "Board Independence",Transactions
There were no transactions that must be disclosed between the Partnership and "Board Committees".our officers or directors, or any person related to our officers or directors, or with any holder of more than 5% of the outstanding units or any person related to such unitholder, during 2023 and through the date of this filing.
The Board's Corporate Governance Guidelines include policies and procedures for the review and approval of interested transactions, which are defined as transactions in which CFMI or the Partnership participate and any executive officer, director, beneficial owner of more than 5% of the Partnership's units, or immediate family member of any of the foregoing, has a direct or indirect material interest. The definition of interested transactions is intended to cover the types of transactions subject to Regulation S-K Item 404 and excludes certain types of transactions consistent with that regulation. The policy generally presumes a related party's interest to be material unless clearly incidental in nature or determined in accordance with the policy to be immaterial in nature.
Each executive officer and director is required to notify the Chair of the Nominating and Corporate Governance Committee of his or her intention to enter into, or to cause CFMI or the Partnership to enter into, an interested transaction. The Committee reviews the material facts of all interested transactions requiring its approval, and the disinterested members of the Committee either approve or disapprove the entry into the interested transaction. The policy also provides a mechanism for Committee review and ratification or modification of any interested transactions as to which advance approval is not feasible or that were entered into in error. In determining whether to approve or ratify a transaction, the Committee considers whether or not the transaction is in, or not inconsistent with, the best interests of the Partnership, taking into account the following (among other factors it considers appropriate): (i) the position within or relationship of the related party with the Partnership or CFMI, (ii) the extent of the related party's interest in the transaction, (iii) the business purpose for and reasonableness of the transaction, including available alternatives for achieving the business purpose, (iv) whether the terms of the transaction are comparable to those that could be negotiated with an unrelated third party, (v) whether the transaction impacts the independence or objectivity of the director or executive officer, and (vi) whether the transaction creates the perception of impropriety. Authority is delegated under the policy to the Chair of the Nominating and Corporate Governance Committee to pre-approve or ratify any interested transactions that do not involve a director and that are expected to involve less than $120,000, subject to subsequent review by the Committee. No director is allowed to participate in any discussion or approval of an interested transaction for which he or she is a related party, except for providing material information as to the transaction and for counting to determine the presence of a quorum to act on the transaction. An ad hoc committee of at least two independent directors may be designated by the Board where less than two members of the Committee would be available to review an interested transaction involving a member of a committee.
Board Independence
The Board has affirmatively determined that current Board members: Nina Barton, Louis Carr, Michelle M. Frymire, Daniel J. Hanrahan, Jennifer Mason, D. Scott Olivet, and Carlos A. Ruisanchez, meet the independence criteria of the NYSE listing standards and our Corporate Governance Guidelines. The Board has determined Richard A. Zimmerman is not independent because he is a current executive officer of the Partnership. The Board also determined that former directors, Gina D. France and Matthew A. Ouimet, who served as directors during 2023, met the independence criteria of the NYSE listing standards and our Corporate Governance Guidelines. In addition to the independence criteria contained in the NYSE listing standards, the Board has adopted additional standards to determine director independence. These standards are located in our Corporate Governance Guidelines on our website.
In making the independence determinations, the Board considered Ms. Mason's current position as Global Officer, Treasurer and Risk Management at Marriott International, Inc. In 2023, Cedar Fair paid approximately $350,000 of franchise fees to Marriott International, Inc. The Board determined that this relationship was not material and did not impair the independence of Ms. Mason.
The Board has three committees: an Audit Committee, a Compensation Committee and a Nominating and Corporate Governance Committee. Each Committee is composed entirely of independent directors, as that term is defined in the NYSE listing standards, and each member of the Audit Committee is independent as required under Section 301 of the Sarbanes-Oxley Act of 2002.
ITEM 14. PRINCIPAL ACCOUNTANT FEES AND SERVICES.
The information required by this item is incorporated by reference to the material in our Proxy Statement under the caption "IndependentIndependent Registered Public Accounting Firm Services and Fees".Fees
The aggregate fees billed or expected to be billed for the audit and non-audit services provided to us by our principal accountant during the last two fiscal years are set forth below.
| | | | | | | | |
| Type of Fees | 2023 | 2022 |
| Audit Fees | $ | 1,746,843 | | $ | 1,464,068 | |
| Audit-Related Fees | — | | — | |
| Tax Fees | 293,162 | | 319,876 | |
| Other Fees | 610,046 | | 3,790 | |
| Total | $ | 2,650,051 | | $ | 1,787,734 | |
Audit-Related Fees consist of fees billed or expected to be billed by Deloitte that principally include assurance services that are reasonably related to the performance of the audit or review of the Partnership's financial statements and other attestation services or consultations that are not reported under audit fees.
Tax Fees consist of fees billed or expected to be billed by Deloitte for services related to tax compliance ($260,641 and $265,323 for 2023 and 2022, respectively) and tax planning ($32,521 and $54,553 for 2023 and 2022, respectively).
Other Fees consist of fees for permitted services rendered by Deloitte that do not fit within the above category descriptions. In 2023, due diligence services rendered for the proposed merger with Six Flags were included within this category.
Audit Committee Pre-Approval Policy
The Audit Committee reviews and pre-approves each audit and non-audit service engagement with the Partnership's independent auditor, and pre-approved all services provided in 2023. The Audit Committee has adopted a policy providing pre-approval thresholds for permissible non-attest professional fees for services, including those non-attest services provided by Deloitte, on a fixed fee or time and material basis. Permissible non-attest fees up to $50,000 can be approved by the Chief Financial Officer or Chief Accounting Officer, greater than $50,000 require approval by the Chair of the Audit Committee and greater than $250,000 require approval by the full Audit Committee. Approvals by the Chief Financial Officer, Chief Accounting Officer or Chair of the Audit Committee are subject to ratification by the Audit Committee.
PART IV
ITEM 15. EXHIBITS AND FINANCIAL STATEMENT SCHEDULES.
A. 1. Financial Statements
The following consolidated financial statements of the Registrant, the notes thereto and the related Report of Independent Registered Public Accounting Firm are filed under Item 8 of this Report: | | | | | | | | |
| | Page |
(i) | Report of Independent Registered Public Accounting Firm | |
(ii) | Consolidated Balance Sheets - December 31, 2022 and 2021 | |
(iii) | Consolidated Statements of Operations and Comprehensive Income (Loss) - Years ended December 31, 2022, 2021, and 2020 | |
(iv) | Consolidated Statements of Cash Flows - Years ended December 31, 2022, 2021, and 2020 | |
(v) | Consolidated Statements of Partners' Deficit - Years ended December 31, 2022, 2021, and 2020 | |
(vi) | Notes to Consolidated Financial Statements - December 31, 2022, 2021, and 2020 | |
A. 2. Financial Statement Schedules
All schedules are omitted as the information is not required or is otherwise furnished.
A. 3. Exhibits
The exhibits listed below are incorporated herein by reference to prior SEC filings by the Registrant or are included as exhibits in this Form 10-K.10-K/A.
| | | | | |
| Exhibit Number | Description |
| |
| |
| |
| |
| Sixth Amended and Restated Agreement of Limited Partnership of Cedar Fair, L.P., as amended by that First Amendment, dated June 1, 2017, that Second Amendment, dated August 2, 2019, and that Third Amendment, dated April 1, 2020. Incorporated herein by reference to Exhibit 3.1 to the Registrant's Form 10-Q (File No. 001-09444) filed May 6, 2020. |
| Indenture, dated as of April 13, 2017, by and among Cedar Fair, L.P., Canada’s Wonderland Company, Magnum Management Corporation and Millennium Operations LLC, as issuers, the guarantors named therein and The Bank of New York Mellon Corporation, as trustee (including Form of 5.375% Senior Note due 2027). Incorporated herein by reference to Exhibit 4.1 to the Registrant’s Form 8-K (File No. 001-09444) filed on April 13, 2017. |
| Registration Rights Agreement, dated April 13, 2017, by and among Cedar Fair, L.P., Canada’s Wonderland Company, Magnum Management Corporation and Millennium Operations LLC, as issuers, the guarantors named therein and J.P. Morgan Securities LLC, on behalf of itself and as representative of the initial purchasers named therein. Incorporated herein by reference to Exhibit 4.3 to the Registrant’s Form 8-K (File No. 001-09444) filed on April 13, 2017. |
| Indenture, dated as of June 27, 2019, by and among Cedar Fair, L.P., Canada’s Wonderland Company, Magnum Management Corporation and Millennium Operations LLC, as issuers, the guarantors named therein and The Bank of New York Mellon, as trustee (including Form of 5.250% Senior Note due 2029). Incorporated herein by reference to Exhibit 4.1 to the Registrant's Form 8-K (File No. 001-09444) filed on June 27, 2019. |
| Registration Rights Agreement, dated June 27, 2019, by and among Cedar Fair, L.P., Canada’s Wonderland Company, Magnum Management Corporation and Millennium Operations LLC, as issuers, the guarantors named therein and J.P. Morgan Securities LLC, on behalf of itself and as representative of the initial purchasers named therein. Incorporated herein by reference to Exhibit 4.3 to the Registrant's Form 8-K (File No. 001-09444) filed on June 27, 2019. |
| Indenture, dated as of April 27, 2020, by and among Cedar Fair, L.P., Canada’s Wonderland Company, Magnum Management Corporation and Millennium Operations LLC, as issuers, the guarantors named therein, The Bank of New York Mellon, as trustee and notes US collateral agent and BNY Trust Company of Canada, as notes Canadian collateral agent (including Form of 5.500% Senior Note due 2025). Incorporated herein by reference to Exhibit 4.1 to the Registrant's Form 8-K (Form No. 001-09444) filed on April 29, 2020. |
| Indenture, dated as of October 7, 2020, by and among Cedar Fair, L.P., Canada’s Wonderland Company, Magnum Management Corporation and Millennium Operations LLC, as issuers, the guarantors named therein and The Bank of New York Mellon, as trustee (including Form 6.500% Senior Note due 2028). Incorporated herein by reference to Exhibit 4.1 to the Registrant's Form 8-K (File No. 001-09444) filed on October 7, 2020. |
| Registration Rights Agreement, dated October 7, 2020, by and among Cedar Fair, L.P., Canada’s Wonderland Company, Magnum Management Corporation and Millennium Operations LLC, as issuers, the guarantors named therein and J.P. Morgan Securities LLC, on behalf of itself and as representative of the initial purchasers named therein. Incorporated herein by reference to Exhibit 4.3 to the Registrant's Form 8-K (File No. 001-09444) filed on October 7, 2020. |
| |
| | | | | |
Exhibit Number | Description |
| |
| |
| |
| |
| |
| |
| |
| |
| Restatement Agreement, dated April 13, 2017, among Cedar Fair, L.P., Magnum Management Corporation, Canada’s Wonderland Company and Millennium Operations LLC, as borrowers, the several lenders from time to time party thereto, JPMorgan Chase Bank, N.A. as administrative agent and collateral agent and the other parties thereto. Incorporated herein by reference to Exhibit 10.1 to the Registrant's Form 8-K (File No. 001-09444) filed on April 13, 2017. |
| |
| |
| |
| |
| |
| Amendment No. 1, dated March 14, 2018, to Restatement Agreement, dated April 13, 2017, among Cedar Fair, L.P., Magnum Management Corporation, Canada’s Wonderland Company and Millennium Operations LLC, as borrowers, the several lenders from time to time party thereto, JPMorgan Chase Bank, N.A., as administrative agent and collateral agent and the other parties thereto. Incorporated herein by reference to Exhibit 10.1 to the Registrant's Form 8-K (File No. 001-09444) filed on March 14, 2018. |
| |
| Amendment No. 2, dated April 27, 2020, to the Amended and Restated Credit Agreement, dated April 13, 2017, among Cedar Fair, L.P., Magnum, Cedar Canada and Millennium, as borrowers, the lenders party thereto from time to time, JPMorgan Chase Bank, N.A., as administrative agent and collateral agent and the other parties thereto. Incorporated herein by reference to Exhibit 10.1 to the Registrant's Form 8-K (File No. 001-09444) filed on April 29, 2020. |
| |
| Amendment No. 3, dated as of September 28, 2020, to the Amended and Restated Credit Agreement, dated as of April 13, 2017, among Cedar Fair, Magnum, Cedar Canada and Millennium, as borrowers, the lenders party thereto from time to time, JPMorgan Chase Bank, N.A., as administrative agent and collateral agent and the other parties thereto. Incorporated herein by reference to Exhibit 10.1 to the Registrant's Form 8-K (File No. 001-09444) filed on September 30, 2020. |
| |
| |
| | | | | |
Exhibit Number | Description |
| |
| |
| Amendment No. 4, dated as of December 15, 2021, to the Amended and Restated Credit Agreement, dated as of April 13, 2017, among Cedar Fair, Magnum, Cedar Canada and Millennium, as borrowers, the lenders party thereto from time to time, JPMorgan Chase Bank, N.A., as administrative agent and collateral agent and the other parties thereto. Incorporated herein by reference to Exhibit 10.26 to the Registrant's Form 10-K (File No. 001-09444) filed on February 18, 2022. |
| Amendment No. 5, dated as of February 7, 2022, to the Amended and Restated Credit Agreement, dated as of April 13, 2017, among Cedar Fair, Magnum, Cedar Canada and Millennium, as borrowers, the lenders party thereto from time to time, JPMorgan Chase Bank, N.A., as administrative agent and collateral agent and the other parties thereto. Incorporated herein by reference to Exhibit 10.1 to the Registrant's Form 10-Q (File No. 001-09444) filed on May 4, 2022. |
| |
| |
| |
| |
| |
| |
| Amendment No. 6, dated February 10, 2023, to the Amended and Restated Credit Agreement, dated April 13, 2017, among Cedar Fair, L.P., Magnum, Cedar Canada and Millennium, as borrowers, the lenders party thereto from time to time, JPMorgan Chase Bank, N.A., as administrative agent and collateral agent and the other parties thereto. Incorporated herein by reference to Exhibit 10.1 to the Registrant's Form 8-K (File No. 001-09444) filed on February 10, 2023. |
| |
| |
| |
| |
| |
| |
| |
| |
| |
101 104 | | The following materials from the Partnership's Annual Report on Form 10-K for the year ended December 31, 2022 formatted in Inline XBRL: (i) the Consolidated Statements of Operations and Comprehensive Income (Loss), (ii) the Consolidated Balance Sheets, (iii) the Consolidated Statements of Cash Flows, (iv) the Consolidated Statements of Partners' Deficit, and (v) related notes, tagged as blocks of text and including detailed tags. |
104 | | The cover page from the Partnership's Annual Report on Form 10-K10-K/A for the year ended December 31, 2022,2023, formatted in Inline XBRL (included as Exhibit 101). |
(+) Management contract or compensatory plan or arrangement.
ITEM 16.FORM 10-K SUMMARY.
None.
SIGNATURES
Pursuant to the requirements of Section 13 or 15(d) of the Securities Exchange Act of 1934, the registrant has duly caused this report to be signed on its behalf by the undersigned, thereunto duly authorized.
CEDAR FAIR, L.P.
(Registrant)
DATED: February 17, 2023April 29, 2024
By: Cedar Fair Management, Inc.
General Partner
| | |
| /S/ Richard A. Zimmerman |
| Richard A. Zimmerman |
| President and Chief Executive Officer |
Pursuant to the requirements of the Securities Exchange Act of 1934, this report has been signed below by the following persons on behalf of the registrant and in the capacities and on the dates indicated.
| | | | | | | | | | | | | | |
| Signature | | Title | Date |
| | | | |
| /S/ | Richard A. Zimmerman | | Director, President and Chief Executive Officer | February 17, 2023April 29, 2024 |
| Richard A. Zimmerman | | (Principal Executive Officer) | |
| | | | |
| /S/ | Brian C. Witherow | | Executive Vice President and Chief Financial Officer | February 17, 2023April 29, 2024 |
| Brian C. Witherow | | (Principal Financial Officer) | |
| | | | |
| /S/ | David R. Hoffman | | Senior Vice President and Chief Accounting Officer | February 17, 2023April 29, 2024 |
| David R. Hoffman | | (Principal Accounting Officer) | |
| | | | |
| /S/ | Daniel J. Hanrahan | | Chairman of the Board of Directors | February 17, 2023April 29, 2024 |
| Daniel J. Hanrahan | | | |
| | | | |
| /S/ | Nina Barton | | Director | April 29, 2024 |
| Nina Barton | | | |
| | | | |
| /S/ | Louis Carr | | Director | February 17, 2023April 29, 2024 |
| Louis Carr | | | |
| | | | |
/S/ | Gina D. France | | Director | February 17, 2023 |
| Gina D. France | | | |
| | | | |
| /S/ | Michelle M. Frymire | | Director | February 17, 2023April 29, 2024 |
| Michelle M. Frymire | | | |
| | | | |
| /S/ | Jennifer Mason | | Director | February 17, 2023April 29, 2024 |
| Jennifer Mason | | | |
| | | | |
| /S/ | D. Scott Olivet | | Director | February 17, 2023April 29, 2024 |
| D. Scott Olivet | | | |
| | | | |
/S/ | Matthew A. Ouimet | | Director | February 17, 2023 |
| Matthew A. Ouimet | | | |
| | | | |
| /S/ | Carlos A. Ruisanchez | | Director | February 17, 2023April 29, 2024 |
| Carlos A. Ruisanchez | | | |