UNITED STATES
SECURITIES AND EXCHANGE COMMISSION
Washington, D.C. 20549
FORM
10-K☒ | |
ANNUAL REPORT PURSUANT TO SECTION 13 OR 15(d) OF THE SECURITIES EXCHANGE ACT OF 1934 |
For the fiscal year ended
December 31,☐ | |
TRANSITION REPORT PURSUANT TO SECTION 13 OR 15(d) OF THE SECURITIES EXCHANGE ACT OF 1934 |
For the transition period from _______________________________ to_________________________________________
Commission File Number: 1-09447
KAISER ALUMINUM CORPORATION
(Exact name of registrant as specified in its charter)
Delaware | 94-3030279 | |
(State or other jurisdiction of incorporation or organization) | (I.R.S. Employer Identification No.) | |
27422 Portola Parkway, Suite 200 Foothill Ranch, California | 92610-2831 | |
(Address of principal executive offices) | (Zip Code) |
(949) 614-1740
(Address of principal executive offices) (Zip Code)
Securities Registered Pursuant to Section 12(b) of the Act:
Title of each class | Trading symbol | Name of each exchange on which registered | ||
Common stock, par value $0.01 per share | KALU | Nasdaq Global Select Market |
Securities Registered Pursuant to Section 12(g) of the Act: None
Indicate by check mark if the registrant is a well-known seasoned issuer, as defined in Rule 405 of the Securities Act. Yes ☒Yes ☒ No ☐
Indicate by check mark if the registrant is not required to file reports pursuant to Section 13 or Section 15(d) of Act. Yes ☐ No No☒
Indicate by check mark whether the registrant (1) has filed all reports required to be filed by Section 13 or 15(d) of the Securities Exchange Act of 1934 during the preceding 12 months (or for such shorter period that the registrant was required to file such reports), and (2) has been subject to such filing requirements for the past 90 days. Yes ☒Yes ☒ No ☐
Indicate by check mark whether the registrant has submitted electronically every Interactive Data File required to be submitted pursuant to Rule 405 of Regulation S-T (§232.405 of this chapter) during the preceding 12 months (or for such shorter period that the registrant was required to submit such files). Yes ☒Yes ☒ No ☐
Indicate by check mark whether the registrant is a large accelerated filer, an accelerated filer, a non-accelerated filer, a smaller reporting company, or an emerging growth company. See the definitions of "large“large accelerated filer," "accelerated” “accelerated filer," "smaller” “smaller reporting company"company” and "emerging“emerging growth company"company” in Rule 12b-2 of the Exchange Act:
Large accelerated filer | ☒ | Accelerated filer | ☐ | |||
Non-accelerated filer | ☐ | Smaller reporting company | ☐ | |||
Emerging growth company | ☐ | |||||
If an emerging growth company, indicate by check mark if the registrant has elected not to use the extended transition period for complying with any new or revised financial accounting standards provided pursuant to Section 13(a) of the Exchange Act. ☐
Indicate by check mark whether the registrant has filed a report on and attestation to its management’s assessment of the effectiveness of its internal control over financial reporting under Section 404(b) of the Sarbanes-Oxley Act (15 U.S.C. 7262(b)) by the registered public accounting firm that prepared or issued its audit report. ☒
Indicate by check mark whether the registrant is a shell company (as defined in Rule 12b-2 of the Exchange Act). Yes ☐ No ☒
The aggregate market value of the registrant'sregistrant’s common stock held by non-affiliates of the registrant as of the last business day of the registrant'sregistrant’s most recently completed second fiscal quarter (June 30, 2019)2021) was approximately $1.5$1.9 billion.
As of February 14, 2020,22, 2022, there were 15,854,18215,865,118 shares of the Common Stock of the registrant outstanding.
Documents Incorporated by Reference. Certain portions of the registrant'sregistrant’s definitive proxy statement related to the registrant's 2020registrant’s 2022 annual meeting of stockholders are incorporated by reference into Part III of this Annual Report on Form 10-K.
TABLE OF CONTENTS
3 | |||
13 | |||
26 | |||
26 | |||
27 | |||
27 | |||
28 | |||
29 | |||
Management’s Discussion and Analysis of Financial Condition and Results of Operations | 30 | ||
43 | |||
45 | |||
Changes in and Disagreements with Accountants on Accounting and Financial Disclosure | 91 | ||
91 | |||
92 | |||
Item 9C. | Disclosure Regarding Foreign Jurisdictions that Prevent Inspection | 92 | |
93 | |||
93 | |||
Security Ownership of Certain Beneficial Owners and Management and Related Stockholder Matters | 93 | ||
Certain Relationships and Related Transactions and Director Independence | 93 | ||
93 | |||
94 | |||
97 | |||
98 | |||
PART I
Forward-Looking Statements
This Annual Report on Form 10-K (this "Report"“Report”) contains statements which constitute "forward-looking statements"“forward-looking statements” within the meaning of the Private Securities Litigation Reform Act of 1995.1995, Section 27A of the Securities Act of 1933, as amended (the “Securities Act”) and Section 21E of the Securities Exchange Act of 1934, as amended (the “Exchange Act”), as applicable. These statements appear throughout this Report, including Item 1. "Business“Business – Business Operations,"” Item 1A. "Risk Factors,"“Risk Factors” and Item 7. "Management's“Management’s Discussion and Analysis of Financial Condition and Results of Operations."” These forward-looking statements can be identified by the use of forward-looking terminology such as "believes," "expects," "may," "estimates," "will," "should," "plans"“believes,” “expects,” “may,” “estimates,” “will,” “should,” “plans” or "anticipates,"“anticipates,” or the negative of the foregoing or other variations or comparable terminology, or by discussions of strategy.
Readers are cautioned that any such forward-looking statements are not guarantees of future performance and involve significant risks and uncertainties and that actual results may vary from those in the forward-looking statements as a result of various factors. These factors include: (i) the effectiveness of management'smanagement’s strategies and decisions;decisions, including strategic investments, capital spending strategies and the execution of those strategies; (ii) general economic and business conditions, including the impact of the global pandemic of Coronavirus Disease 2019 (“COVID-19”) and governmental and other actions taken in response, cyclicality, reshoring, supply interruptions, including the most recent disruptions resulting from the supply demand imbalances in the magnesium and silicon markets, and other conditions that impact demand in the aerospace,aerospace/high strength, automotive, general engineering, packaging and other end markets we serve; (iii) our ability to participate in mature and anticipated new automotive programs expected to launch in the future and successfully launch new automotive programs; (iv) changes or shifts in defense spending due to competing national priorities; (v) developments in technology; (vi) new or modified statutory or regulatory requirements; (vii) changing prices and market conditions; and (viii) other factors discussed in Item 1A. "Risk Factors"“Risk Factors” and elsewhere in this Report. No assurance can be given that these are all of the factors that could cause actual results to vary materially from the forward-looking statements.
Readers are urged to consider these factors carefully in evaluating any forward-looking statements and are cautioned not to place undue reliance on these forward-looking statements. The forward-looking statements included herein are made only as of the date of this Report and we undertake no obligation to update or revise any information contained in this Report or to publicly release any revisions to any forward-looking statements that may be made to reflect events or circumstances that occur, or that we become aware of, after the date of this Report except as required by law.
Item 1.
BusinessAvailability of Information
We file Annual Reports on Form 10-K, Quarterly Reports on Form 10-Q, Current Reports on Form 8-K, Proxy Statements, any amendments to those reports and statements and other information with the Securities and Exchange Commission ("SEC"(“SEC”). You may obtain the documents that we file electronically from the SEC'sSEC’s website at
Business Overview
Kaiser Aluminum Corporation, a Delaware corporation, manufactures and sells semi-fabricated specialty aluminum mill products for the following end market applications: (i) aerospace and high strength ("(“Aero/HS products"products”); (ii) beverage and food packaging products (“Packaging”); (iii) automotive ("(“Automotive Extrusions"Extrusions”); (iv) general engineering ("(“GE products"products”); and (v) other industrial ("(“Other products"products”). Our fabricated aluminum mill products include flat-rolled (plate, sheet and sheet)coil), extruded (rod, bar, hollows and shapes), drawn (rod, bar, pipe, tube and wire) and certain cast aluminum products. The sophistication of our products is due to the metallurgy and physical properties of the metal and the special characteristics that are required for particular end uses. We strategically choose to serve technically challenging applications for which we can deploy our core metallurgical and process technology capabilities to produce highly engineered mill products with differentiated characteristics that present opportunities for us to receive premium pricing and to create long-term profitable growth. A fundamental part of our business model is to remain neutral to the impact from fluctuations in the market price for aluminum and certain alloys, thereby earning profit predominately from the
conversion of aluminum into semi-fabricated mill products. We refer to this as “metal price neutrality.” See “Pricing, Metal Price Risk Management and Hedging” section below for more details.
With respect to the global market for flat-rolled aluminum mill products, our focus is on heat treat plate and sheet for applications that require higher strength and other desired product attributes that cannot be achieved by common alloy rolled products. The primary end market applications of flat-rolled heat treat plate and sheet are Aero/HS products (which we sell globally) and GE products (which we predominantly sell within North America).
Similarly, in the areas of extruded and drawn aluminum mill products, weour focus is on demanding Aero/HS products, Automotive Extrusions and GE products for demanding applications that require high strength, machinability or other specific properties where we can create and maintain a defensible competitive position because of our technical expertise, strong production capability and high product quality.position. We primarily serve North American demand for extruded and drawn aluminum mill products.
Our rolling mill in Spokane, Washington ("Trentwood"(“Trentwood”) produces heat treat plate and sheet for aerospace and general engineering end market applications. applications and our Warrick facility produces bare and coated aluminum coil used for can stock applications in the beverage and food packaging industry.Our 11 extrusion/drawing facilities, 10 of which are in the United States and one of which is in Canada, serve aerospace, automotive or general engineering applications. Our newest facility which we acquired on September 19, 2018, is located in Columbia, New Jersey and focuses on multi-material advanced manufacturing methods and techniques which include multi-axis computer numerical control ("CNC"(“CNC”) machining, additive manufacturing ("(“3D Printing"Printing”), welding and fabrication for demanding aerospace and defense, automotive, high tech and general industrial applications. In 2019,2021, our consolidated Net sales totaled $1.5$2.6 billion on 625.01,121.6 million pounds shipped from our facilities. We employed approximately 2,820 people at December 31, 2019.
We purchase primary and scrap, or recycled, aluminum, our main raw material, and alloys at prices that fluctuate on a monthly basis, and our pricing policies generally allow us to pass the underlying cost of metalaluminum and alloys through to our customers so that we remain neutral to metal pricing. However, for some of our higher value added revenue products sold on a spot basis, competitive dynamics may limit the amount and/or delay the timing of selling price increases to recover our increased aluminum and alloy costs, resulting in a lag up to several months during which we may be exposed to metal price risk. As a result, we can experience an adverse impact when metalaluminum and alloy prices increase and a favorable impact to us when metalaluminum and alloy prices decline, as we and our competitors tend to defer adjusting pricing unless market dynamics require such in a declining metal cost environment. Additionally, we sometimes enter into firm-price customer sales agreements that specify a firm underlying metal price plus a conversion price. Spot sales with lagged metalaluminum and alloy price pass through and firm-price sales agreements create metal price exposure for us, which we mitigate through a hedging programand related programs with an objective to remain metal price neutral.
We have long-standing relationships with our customers, which consist primarily of blue-chip companies including leading aerospace and automotive manufacturers, tier one aerospace and automotive suppliers, and metal service centers.centers and beverage and food packaging manufacturers. Approximately 52%71% of our shipments is sold direct to manufacturers or tier one suppliers and approximately 48%29% is sold to metal service centers. In our served markets, we seek to be the supplier of choice by pursuing "Best“Best in Class"Class” customer satisfaction driven by quality, availability, service and delivery performance. We strive tobelieve we differentiate our product portfolio through our broad product offering and our KaiserSelect
We further strive to enhance the efficiency of product flow to our customers and our status as a supplier of choice by tightly integrating the management of our operations across multiple production facilities, product lines and target markets. Additionally, our strategy to be athe supplier of choice and a low cost producer is facilitatedenabled by a culture of continuous improvement that is facilitated by the Kaiser Production System ("KPS"(“KPS”), an integrated application of tools such as Lean Manufacturing, Six Sigma and Total Productive Manufacturing. Using KPS, we seek to continuously reduce our own manufacturing costs and eliminate waste throughout the value chain.
A key component of our business model is to maintain financial strength and flexibility through the business and economic cycles to continue to support our strategic growth initiatives and return cash to shareholders.cycles. We manage and monitor our financial strength through routine analysis of our liquidity position under scenarios of varying business and economic cycles.
Products
Overview
Our business focuses on producing rolled, extruded and drawn aluminum products used principally for aerospace and defense, aluminum beverage and food packaging, automotive and general engineering products that include consumer durables, electronics and products for electrical and machinery and equipment applications. Our engineers, metallurgists and sales personnel work collaboratively with our customers to help our customers design products for challenging applications where product performance is critical. Furthermore, our Centers for Excellence, dedicated research and development centers devoted to product performance enhancement and process development within our production operations, are focused on: (i) controlling the manufacturing process; (ii) maximizing the use of recycled aluminum; (iii) improving product quality; and (iv) ensuring consistency and enhanced product attributes. See "
We believe aluminum is highly sustainable because it is infinitely recyclable and the recycling process requires significantly less energy compared with the original mining and refining process. Our highly engineered solutions contribute to reduced carbon emissions by enabling improved performance of consumer products, light‑weighting in applications such as aircraft and transportation for fuel efficiency and increasing the use of recyclable aluminum beverage and food packaging. Overall, we remain focused on providing products that meet the needs of our customers for demanding applications while being part of the carbon solution for “Best in Class” customer satisfaction.
Aero/HS Products.
Our Aero/HS products include heat treat plate and sheet, hard alloy extruded shapes, cold finish rod and bar, seamless drawn tube and billet used for a wide variety of end uses in the global aerospace and defense industries. Typical applications are structural aircraft components that must perform consistently under extreme variations in temperature and pressure due to frequent take-offs, landings and changes in altitude. Required physical properties include high tensile strength, superior fatigue resistance and exceptional durability even in harsh environments. We use high-strength 2000- and 7000-series alloys and apply a variety of thermal practices to manufacture our Aero/HS products to meet the demanding specifications required for such safety-critical applications. While competing materials such as titanium and composites have displaced aluminum for certain applications on several newer aircraft designs, aluminum continues to be the material used most extensively for structural aerospace and defense applications because it is light weight, can meet demanding performance requirements and is cost effective relative to other materials.Packaging. Our Packaging products consist of bare and coated 3000- and 5000-series alloy aluminum coil used in the aerospacebeverage and defense industries' consumption of fabricated aluminum products is driven by factorsfood packaging industry, with applications that include airframe build rates,coated food stock, coated end and tab stock, body stock and bottle stock. Our Warrick rolling mill is one of four major aluminum rolling mills currently dedicated to the mixpackaging industry in North America, with one of aircraft models being builtthe world’s largest ingot casting facilities, hot and defense spending. Unanticipated changes in build ratescold rolling, coated finishing and mixslitting capacity. The Warrick rolling mill has a unique capability to produce high-margin coated packaging products representing approximately 62% of aircraft models being built can trigger restocking or destocking throughout the long aerospace supply chain, temporarily impacting demand for our Aero/HS products. Growth in demand for aerospace plate has exceeded demand growth for other forms of Aero/HS products as aircraft manufacturers have migrated to monolithic component design, where a single piece of aluminum, usually a plate, is heavily machined to form a desired part rather than creating the same part by assembling sub-components made of aluminum sheet, extrusions or forgings that are affixed to one another using rivets, bolts or welds. As more applications convert to monolithic design, we expect aerospace plate demand to continue to grow at a pace higher than our other Aero/HS products.total Packaging shipments.
Automotive Extrusions.
Automotive Extrusions consist of extruded aluminum products for many North American automotive applications. Examples of the variety of extruded products that we supply to the automotive industry include extruded products for the body-in-white structural components, crash management systems, anti-lock braking systems and drawn tube for drive shafts. For some Automotive Extrusions, we perform limited fabrication, including sawing and cutting to length.GE Products.
Our broad portfolio of GE products consists primarily of 6000-series alloy plate, sheet, rod, bar, tube, wire and standard extruded shapes. The 6000-series alloy is an extremely versatile, medium-strength, heat treatable alloy that can be both extruded and rolled. Our GE products have a wide range of uses and applications, many of which involve further fabrication for numerous transportation and other industrial end market applications where machining of plate, rod and bar is intensive. For example, our GE products are used to produce armor for military vehicles, ordnances, manufacturing cells for semiconductor production, numerous electronic devices, after-market motor sport parts, tooling plate, parts for machinery and equipment,Other Products. Other products consist of rerolled, extruded, drawn and cast billet aluminum products for a variety of North American industrial end uses. Demand for Other products tends to mirror broad economic patterns and industrial activity in North America. We continue to exit these non-core applications and redirectfocus our resources and production capacity to focus on strategic Aero/HS products, Packaging, Automotive Extrusions and GE products.
Markets
Sales, Marketing and Distribution
Industry sales for fabricated products fluctuate in response to competitive and market dynamics. Sales are made directly to customers by our sales personnel located in the United States, Canada, Western Europe and China and by independent sales agents in other regions of Asia, Latin America and the Middle East. Our sales and marketing efforts are focused on the markets for Aero/HS products, Packaging, Automotive Extrusions and GE products.
Aero/HS Products.
We sell our Aero/HS products to metal service centers, as well as directly to aerospace manufacturers and tier one suppliers. Sales are made primarily under long-term agreements,Packaging. Our Packaging products are sold primarily to North American food packaging manufacturers and beverage can manufacturers and fillers. Sales are made primarily under long-term agreements by a North American direct sales force. Aluminum can stock demand is driven by the packaging industry’s shift towards environmentally sustainable materials due to the fact that aluminum is infinitely recyclable and has the highest consumer recycling rate among beverage containers. Major players have already transitioned some plastic bottled water and carbonated soft drink production to aluminum. We anticipate further growth will be underpinned by sustainability trends, the secular shift from plastic to aluminum and the fact that North American packaging capacity has been reallocated towards other end markets, including automotive and industrial.
Automotive Extrusions. Our Automotive Extrusions are sold primarily to tier one automotive suppliers. Almost all sales of Automotive Extrusions occurare made under long-term agreements entered through direct channels using a North American direct sales force that works closely with our technical sales support organization. Demand for Automotive Extrusions is determined based upon automotive build rates in North America and aluminum content. We believe fuel efficiency standards, along with consumer preference for larger vehicles and the growing conversion to electric vehicles, will continue to drive growth in demand for aluminum extruded components in passenger vehicles as a replacement for the heavier weight of steel components.
GE Products.
A majority of our GE products are sold to large metal service centers in North America on an order-by-order basis, with orders primarily consisting of standard catalog type items shipped with a relatively short lead-time. We service this market with a North American sales force focused on GE products and Aero/HS products. Demand for our GE products is closely related to the North America general industrial growth and the recent desire of many companies to lessen their risk of supply chain disruptions by reshoring suppliers and shortening the supply chain. Demand is also impacted by the destocking and restocking of inventory throughout the supply chain.Customers
In 2019,2021, we had over 730600 customers, of which, our two largest customers wereincluding the following key customers: (i) Crown Holdings Inc.; (ii) Ford Motor Company; (iii) Reliance Steel & Aluminum Co. ("Reliance"); (iv) Silgan Containers Corporation; and (v) The Boeing Company ("Boeing").Company. While the loss of Reliance or Boeing asany one of these customers could have a material adverse effect on us, we believe that our long-standing relationship with each is good and that the risk of losing either as aany customer is remote. See Note 1617 of Notes to Consolidated Financial Statements included in this Report for information about our significant concentrations.
Competition
The fabricated aluminum industry is highly competitive. We seek to further differentiate ourselves from our competitors through our ongoing investments to continuously improve the quality and machinability of our products, manufacture and deliver unique
product attributes (KaiserSelect®) and provide a broad product offering while maintaining a strong customer focus to achieve “Best in Class” status in our markets.
Our primary competitors in the global market for Aero/HS products are Arconic, Inc., Constellium N.V. and Novelis Inc. In North America, our primary competitors for Packaging are Arconic, Inc., Constellium N.V., Novelis, Inc. and Tri-Arrows Aluminum, Inc. In serving our North American customers for both Automotive Extrusions and GE products, our primary competitors are Arconic, Inc. and Norsk Hydro ASA, and for certain of these products, we also compete with smaller, regional participants. In North America, we also compete with general engineering heat treat plate products imported from South Africa, Europe and China. Some of our competitors are substantially larger, have greater financial resources and may have other strategic advantages.
Because many of our products are used in safety critical applications, our customers have demanding standards for product quality and consistency that make it difficult to become a qualified supplier. Suppliers must pass a rigorous qualification process to sell to both airframe and automotive manufacturers and must also make significant investments in infrastructure and specialized equipment to supply products for these high strength applications. Further, sophisticated manufacturing processes make it difficult to become a qualified supplier, even with proper equipment. For example, producing heat treat plate and sheet products, particularly for aerospace applications, requires technological expertise that only a few companies have developed through significant investment in research and development and decades of operating experience. To be a supplier in the packaging market, demanding standards are also required. Producing coated end, tab and body stock for the can market requires the development of alloys and application of coatings that must pass stringent customer qualifications and be compliant with Food and Drug Administration (“FDA”) regulations. Our experienced and dedicated research and development team, combined with our Customer Service group, coordinate with coating suppliers, manufacturing operations and our customers to create these alloy and coating systems.
Research and Development
Our products are differentiated based on the metallurgy and physical properties of the metal and special characteristics that are required for particular end uses. A significant amount of our research and development is devoted to product and process development within our production operations, and is largely focused on controlling the manufacturing process to improve product quality, ensure consistency and enhance one or more specific product attributes. This has resulted in the creation and delivery of our highly differentiated KaiserSelect® products.
We operate threefour research and development centers. Our Rolling and Heat Treat Center and our Metallurgical Analysis Center are both located at our Trentwood facility. The Rolling and Heat Treat Center has complete hot rolling, cold rolling and heat treat capabilities to simulate, in small lots, processing of flat-rolled products for process and product development on an experimental scale. The Metallurgical Analysis Center consists of a full metallographic laboratory and a scanning electron microscope to support research and development programs as well as respond to plant technical service requests. The third center, our Solidification and Casting Center, is located in Newark, Ohio, and has a developmental casting unit capable of casting billets and ingots for extrusion and rolling experiments. The casting unit is also capable of casting full size billets and ingots for processing on the production extrusion presses and rolling mills.
Our Imperial Machine & Tool Co. (“IMT”) subsidiary, located in Columbia, New Jersey, provides us with significant technology and intellectual property that complements our metallurgical and application engineering expertise to further advance our capability to deliver highly engineered solutions for our customers. IMT'sIMT’s multi-material expertise in aluminum, titanium, tantalum, molybdenum, nickel alloys, tungsten, cobalt chromium and stainless steel offers a differentiated approach by combining traditional machining know-how and related technical capabilities with additive manufacturing expertise to drive innovative solutions over the longer term.
We hold numerous patents, trademarks, trade secrets and copyrights that relate to the design, use and marketing of products. We consider this intellectual property to be important, but no single property is material to the overall conduct of our business.
Resources
Manufacturing Processes
We use two main processes, flat rolling and extrusion/drawing, to produce our fabricated products using a cast of alloyed prime and recycled aluminum in the desired forms and dimensions and with the desired physical properties. Both processes start by heating an aluminum rolling ingot or extrusion billet to an elevated temperature at which the metal is malleable and then applying pressure in
a manner that both forces the metal into a desired shape and begins the “working” of the metal to enhance its strength and related properties.
Flat Rolling. Our manufacturing process for aluminum flat-rolled products uses ingot, a large rectangular slab of aluminum, as the starter material. The ingot is processed through a series of rolling operations that can be done at elevated (hot) or room (cold) temperatures. Finishing steps may include heat treatment, annealing, stretching, leveling, coating and slitting to achieve the desired metallurgical, dimensional and/or performance characteristics. Aluminum flat-rolled products are manufactured in a variety of alloys, a range of tempers (hardness), gauges (thickness) and widths and various finishes. Flat-rolled aluminum semi‑finished products are classified as plate (0.250 inches or greater in thickness), sheet (0.249 inches down to 0.008 inches in thickness) or coil (0.249 inches down to 0.001 inches in thickness).
Extrusion/Drawing. Our extrusion process begins with a cast billet, which is an aluminum cylinder of varying length and diameter cut from a cast log. After heating the billet to make the metal malleable, it is placed into an extrusion press and squeezed (extruded) through a die that gives the material the desired two-dimensional cross section. The material can be quenched as it leaves the press, or processed through a post-extrusion heat treatment cycle, to control the material’s physical properties. The extrusion is straightened, typically by stretching, and then cut to length before being hardened in aging ovens. Drawing is a fabrication operation in which extruded tubes and rods are pulled through a die, or drawn. The primary purpose of drawing is to reduce the diameter and wall thickness while improving physical properties and dimensions. Material may go through multiple drawing steps to achieve the final dimensional specifications. Extruded and drawn semi-fabricated products are manufactured in a variety of alloys and a range of tempers.
Additionally, some of our locations have remelt and casting operations to produce the ingot or log for flat rolling or extrusion. To produce the ingot or log, we purchase primary aluminum, recycled scrap aluminum segregated by alloys and other metals (including copper, zinc and magnesium) that are necessary to create various aluminum alloys. We also recycle internally generated scrap from our own manufacturing processes. Initially in solid form, aluminum is heated in a vessel to a temperature at which it melts. While in molten form, additional metals (aluminum alloyed scrap, alloy metals, primary aluminum or high purity aluminum) are introduced to achieve the proper mixture of chemical elements for a particular alloy. When the desired chemical composition of the molten metal has been achieved, it is poured through a mold in which the molten metal cools in a controlled manner and solidifies into a rolling ingot or extrusion log. The size of the mold determines the dimensions of the rolling ingot or extrusion log. Our casting operations at our facilities in Kalamazoo, Michigan; London, Ontario; Los Angeles, California; Newark, Ohio and Sherman, Texas produce extrusion log and cut billet for their operations and for our other facilities that do not have casting operations. Our Trentwood and Warrick facilities cast rolling ingot for their own consumption.
IMT is a leader in advanced manufacturing methods and techniques, which include multi-axis CNC machining, 3D Printing, welding and fabrication for aerospace and defense, automotive, high tech and general industrial applications.
Many of our facilities employ the same basic manufacturing process and produce the same types of products. We make a significant effort to tightly integrate the management of our multiple manufacturing locations, product lines and end market applications to most efficiently and effectively serve the needs of our customers. We centralize purchasing of our primary and scrap, or recycled, aluminum requirements and related alloying agents in order to better manage price, credit and other benefits. We believe that integration of our operations allows us to capture efficiencies while allowing our facilities to remain highly focused on their specific processes and end market applications.
Raw Materials
To make our fabricated products, we purchase primary aluminum and scrap, or recycled, aluminum from third-party suppliers in varying percentages depending on various market factors, including price and availability. The price we pay for primary aluminum is typically based on the average Midwest Transaction Price (“Midwest Price”), which reflects the primary aluminum supply/demand dynamics in North America. The average Midwest Price is comprised of the average London Metal Exchange (“LME”) plus average Midwest premium. The average LME and the average Midwest premium for 2021, 2020 and 2019 were $1.12 + $0.26, $0.77 + $0.12 and $0.81 + $0.18, respectively. Scrap aluminum is typically purchased at a discount to the Midwest Price but can require additional processing.
In addition to selling fabricated aluminum industry is highly competitive. We focus our fabricating operations on technically challenging applications for flat-rolled heat treat plate and sheet and extruded/drawn products that allow us to apply our core metallurgical and process technology capabilities to produce highly engineered products with differentiated characteristics. We seek to further differentiate ourselves from our competitors by providing a broad product offering and striving to deliver "Best in Class" customer satisfaction.
Suppliers
We purchase raw materials from a wide array of vendors. In most instances, we have greater financial resources and may have other strategic advantages.
Pricing, Metal Price Risk Management and Hedging
As noted above, we purchase primary and scrap, or recycled, aluminum, our principal raw material, on a floating price basis typically based on the average Midwest Price. Our pricing of labor subjectfabricated aluminum products is generally intended to collective bargaining agreements.
• | Spot price. A majority of our customers for GE products and some of our customers for Aero/HS products pay a product price that incorporates the spot price of primary aluminum (Midwest Price) in effect at the time of shipment to a customer. Spot prices for these products change regularly based on competitive dynamics. Fluctuation in the underlying aluminum price is a significant factor influencing changes in competitive spot prices. Through spot pricing, we generally can pass aluminum price risk through to customers. For some of our higher value added revenue products sold on a spot basis, however, the pass through of aluminum price movements can lag by several months (the timing of which depends in part on market conditions), with a favorable impact to us when aluminum prices decline and an adverse impact to us when aluminum prices increase. We, from time to time, enter into hedging transactions with third parties to minimize the impact to us of aluminum price swings for these higher value added revenue products. |
• | ||||
Index-based price. The pricing structure of our typical automotive and aerospace contracts calls for our customer to pay a product price that incorporates a monthly index-based price for primary aluminum, such as the average Midwest Price for primary aluminum. Index-based pricing typically allows us to pass aluminum price risk through to the customer and applies to virtually all of our Automotive Extrusions sales and the majority of our Aero/HS products and Packaging sales. |
• | Firm-price. Some of our customers who commit to volumes and timing of delivery pay a firm-price, creating aluminum price risk that we must hedge. We are able to limit exposure to aluminum price risks created by firm-price customer sales contracts by using third-party hedging instruments. Total fabricated product shipments for which we were subject to price risk were, in millions of pounds, 187.2, 127.6 and 182.4 during 2021, 2020 and 2019, respectively. |
In addition to the aluminum pricing mechanisms described above, we also strive to pass through the cost of alloys through either pricing adders or surcharge mechanisms. In some cases, the passing through of this alloy cost can lag the actual alloy cost by several months, the timing of which is dependent on market conditions and customer agreements, with a favorable impact to us when alloy price declines and an adverse impact to us when alloy price increases. As with aluminum, we, from time to time, enter into either hedging transactions with third parties or firm price physical contracts to minimize the impact to us of alloy price fluctuations.
All metal procurement and hedging activities are managed centrally to minimize transaction costs, monitor consolidated net exposures and respond promptly to changes in market factors. Hedging activities are conducted in compliance with a policy approved by our Board of Directors and administered by our hedging committee (members of which include our principal executive officer, principal financial officer and principal accounting officer).
Seasonality
Under normal operating and economic conditions, we generally have immaterial fluctuations in our overall portfolio quarter‑over‑quarter results. Within our individual end markets, our Packaging shipments are generally weighted towards the second half of the year as compared to the first half while our Aero/HS products, Automotive Extrusions and GE products shipments are generally weighted slightly more toward the first half of the year as compared to the second half. This fluctuation in shipments is usually driven by lower demand during summer vacation and year-end holiday shut downs and year-end inventory rebalancing by our end customers. During these periods of lower demand we generally perform planned major maintenance at our facilities, which can affect cost and operating results.
Government Regulation
Our operations are subject to numerous federal, state and local employment, import/export, reporting, environmental, health and safety laws and regulations. While we are subject to a numberwide variety of government regulations,generally those most impactful to our
results of operations and capital expenditures are the environmental laws and regulations that impose limitations on the discharge of hazardous materials and pollutants and establish standards for the handling, transportation, distribution, treatment, storage and disposal of hazardous materials and solid and hazardous wastes. These regulations may require the investigation, assessment, cleanup or monitoring of, or compensation for, environmental impacts, including natural resource damages. We continually monitor our operations with respect to potential fines or penalties assessed for alleged breaches of such environmental lawsissues, including changes in legal requirements and regulations and to potential claims and litigation based upon such laws and regulations.
The U.S. Environmental Protection Agency (“USEPA”) issued an Endangerment Finding under the Clean Air Act, determining that emissions of carbon dioxide, methane and four other greenhouse gases (“GHGs”) threaten the public health and welfare of current corporate structure is summarized as follows:
Government Contracts
We are one of the ownership interestsfew remaining United States based aluminum semi-fabricated producers that supply the American defense industry. Although our products are used in a wide variety of military applications, including military aircraft, armored vehicles and ordnance, these products are typically sourced from us by a number of service centers and machine shops that are suppliers to the defense industry. As we generally sell to the chain of suppliers who either subcontract with direct contractors or directly contract with the government, we do not have significant direct government agreements.
Human Capital
At December 31, 2021, we employed approximately 3,957people, of which approximately 3,887 were employed in our manufacturing, sales and support office locations and approximately 70 were employed in our corporate office in Foothill Ranch, California.
Governance and Culture
Our talented workforce is a key factor underlying our success. We strive to be the employer of choice by providing equal employment and a non‑discriminatory workplace, protecting the health and safety of our employees, providing training programs and maintaining a positive and constructive relationship with labor unions of which our employees are members. Our values support and serve as the foundation for our strategic initiatives and are intended to reflect the company’s “tone at the top” which we believe sustains our culture; a culture that continues to drive our behavior. Additionally, the goal of being a valued corporate citizen guides our environmental, social and governance decisions. We are, as a result, committed to being socially responsible and active members of our industry and the communities in which we operate and our employees and their families live.
Consistent with our corporate values, we promote fair business practices and a culture of accountability, responsibility and ethical behavior through:
• | strong emphasis on the importance of integrity and competence; |
• | conducting annual governance surveys to assess our culture and the effectiveness of our training; |
• | adopting and enforcing our policies, including Corporate Governance Guidelines, Code of Business Conduct and Ethics, Human Rights Policy and Diversity, Equity and Inclusion Policy and compliance with applicable laws and regulations; and |
• | encouraging the reporting of illegal or unethical behavior, including the use of In-Touch, a third party compliance feedback program. |
We believe respecting human rights is a fundamental part of our values and corporate responsibility. We strive to respect and promote human rights in our relationships with our employees, suppliers, customers and stakeholders and are guided by the principles of the International Bill of Human Rights (the Universal Declaration of Human Rights and the two international covenants) and the International Labor Organization’s Declaration on the Fundamental Principles and Rights at Work. Our Human Rights Policy is communicated to our employees as part of their annual code of conduct training, and we expect our employees to uphold this policy.
Diversity, Equity, Inclusion and Belonging
We are committed to diversity, equity, inclusion and belonging and strive to be the preferred employer by, among other things: (i) attracting, developing and retaining people from all cultures and segments of the population based on ability; (ii) treating all employees with dignity and respect; (iii) providing an environment of diversity, inclusion, belonging, empowerment, responsibility and accountability; and (iv) offering competitive and equal pay and benefits that attract and retain employees. We focus on: (i) continuing to consider ethnic and gender diversity as we identify training cohorts and opportunities; (ii) leveraging the views and perspectives of our diverse employees and leaders; (iii) developing meaningful metrics and benchmarks by location and job function to measure the effectiveness of our efforts; (iv) fostering relationships with educational institutions, employment agencies and professional groups to expand the pool of potential candidates and employees to achieve a more diverse workforce; (v) focusing on diverse candidates for internships, entry-level positions and scholarships; and (vi) actively recruiting from military bases for military and veteran hiring. In 2021, we enhanced our Human Rights Policy and formalized our diversity, equity, inclusion and belonging (“DEIB”) efforts by adopting a Diversity, Equity and Inclusion Policy, which align with our corporate values and Code of Business Conduct and Ethics and is overseen by our Board of Directors and senior leadership team.
Labor Practices and Policies
Safety. We believe employee safety begins with a strong and consistent tone at the top through our executive leadership with oversight provided by our Corporate Health and Safety team, led by our Chief Legal and Compliance Officer. To help us achieve and maintain a strong safety culture, we have robust compliance and assessment programs such as annual safety planning, monthly safety calls, routine performance reviews against targets and routine audits. Additionally, we partner with the United Steelworkers and various industry groups, including the Aluminum Association, to share and identify best practices. We use both internal and external resources, including the American National Standards Institute (“ANSI”) and International Organization for Standardization (“ISO”), to assess our compliance with regulatory and internal standards, providing training, performing risk assessments, audits and loss control inspections and developing mitigation strategies with particular emphasis on risks with a greater potential for severe injury. We stress risk awareness and job safe practices and engage our employees in conversations about safety and safety training using a variety of communication channels, including one-on-one communications.
We also believe that having a culture of health and safety involves every employee at every level throughout the organization assuming responsibility to guard against workplace injuries by recognizing risks and taking other actions to minimize injury risk and severity. Risk reduction is a key initiative at each of:of our facilities and part of our annual planning process and we are committed to nurturing a culture consistent with being a preferred employer. We monitor our progress through routine reviews of our safety process and performance. We utilize both leading and trailing indicators to monitor our progress. While trailing indicators, such as total case incident rate (“TCIR”), lost- time case incident rate (“LTIR”) and days away, restricted and transfer (“DART”) rate, help us monitor our safety performance, leading indicators, such as significant injury and fatality (“SIF”) potential and actual incident rate, near-misses, timely correction action of internal and external audit findings, on-time safety plan execution information and safety culture risk, help us monitor and assess risks and the effectiveness of our safety plans and processes. Plant safety metrics are integrated into our monthly quality, production and financial reports and are reviewed by the senior leadership team every month. In addition, TCIR and LTIR safety modifiers are included in each of our short-term incentive compensation plans, including the corporate plan applicable to each of our executive officers and members of senior management.
Health. Over the years, we have implemented programs on a Company-wide basis to increase awareness of the importance of employee wellness. We have continued to introduce programs to educate and assist employees to make healthy lifestyle choices and have offered incentives and discounts to encourage participation across the organization, including:
• | annual onsite health biometric screenings; |
• | on-site flu shots and COVID-19 vaccination; |
• | employee assistance program, providing confidential assistance with healthcare issues and the healthcare system, including crisis and emergency help; |
• | smoking/tobacco cessation program; |
• | internal, as well as third-party, online wellness workshops, including workshops on nutrition and fitness; and |
• | wellness coaching. |
Labor Union Affiliations. We believe in freedom of association and respect our employees’ choice to be represented or not represented, by a union in accordance with the laws of the states and countries where we operate, without fear of reprisal, intimidation or harassment. Approximately 66% of our employees are represented by labor unions under labor contracts with varying durations and expiration dates. The following table shows each manufacturing location, the primary union affiliation, if any, and the expiration date for the current union contracts as of December 31, 2021. As indicated in the table, union affiliations are with the United Steel, Paper and Forestry, Rubber, Manufacturing, Energy, Allied Industrial and Service Workers International Union, AFL-CIO, CLC (“USW”), International Association of Machinists (“IAM”) and International Brotherhood of Teamsters (“Teamsters”). See Note 17 of Notes to Consolidated Financial Statements included in this Report for additional information about concentration of labor subject to collective bargaining agreements.
Contract | ||||
Location | Union | Expiration Date | ||
Chandler, Arizona (Extrusion) | Non-union | — | ||
Chandler, Arizona (Tube) | USW | Apr 2024 | ||
Columbia, New Jersey | Non-union | — | ||
Florence, Alabama | USW | Mar 2026 | ||
Jackson, Tennessee | Non-union | — | ||
Kalamazoo, Michigan | USW | Feb 2026 | ||
London, Ontario (Canada) | USW Canada | Feb 2022 | ||
Los Angeles, California | Teamsters | Apr 2022 | ||
Newark, Ohio | USW | Sep 2025 | ||
Newburgh, Indiana (Warrick) | USW | May 2023 | ||
Richland, Washington | Non-union | — | ||
Richmond, Virginia (Bellwood) | USW/IAM | Nov 2026/Nov 2026 | ||
Sherman, Texas | IAM | May 2022 | ||
Spokane, Washington (Trentwood) | USW | Sep 2025 |
Recruiting, Training, Development and Retention
Recruiting. We are committed to recruiting a workforce that reflects people from all cultures and segments of the population based on ability. Our initiatives, which go beyond legal compliance, include: (i) identifying and recruiting diverse talent, including military veterans; (ii) fostering relationships with universities, employment agencies and professional groups that work with more diverse populations; (iii) leveraging inclusive job-posting sites; and (iv) concentrating on diverse candidates for internships, entry‑level positions and scholarships. We have a well-established talent review process that includes operations and functional leaders that are key in the early identification of high performing and high potential employees. We also track and review the gender and ethnic diversity of job applicants and new hires to evaluate the diversity of our organization. The ESG committee of our board oversees, among other things, the succession planning for our executive officers and the leadership, progression and development of key employees.
Training, Development and Retention. Kaiser Aluminum Fabricated Products, LLC,is committed to the development of our employees through a Delaware limited liabilitybroad mix of internal and external program resources incorporating on-the-job training and development through the Kaiser Leadership Program, the Front Line Leader Development Program, Kaiser University, the Tuition Assistance Program, the Metallurgy Excellence and Technical Strength Program. We continue to expand our talent management initiatives to pursue the significant long-term potential for our continued success. Our success is dependent on the knowledge, skills and abilities of our current and future leaders.
The Kaiser Leadership Program is a full year program that accelerates the readiness of key talent and combines personalized leadership development and Kaiser-management system focused curriculum with a unique opportunity to build relationships with an internal network of leaders across locations and functions. The mission of the Kaiser Leadership Program is to strengthen performance, develop bench strength and accelerate the readiness of key talent across our company. The program blends classroom, online modules and live web events using a cohort model to deliver a flexible, convenient learning environment and includes training and coaching conducted by Thayer Leadership at West Point.
The Front Line Leader Development Program is a six-month program that strengthens organizational performance through ethical, effective and sustaining tactical leadership for both new and experienced frontline supervisors. The program uses a cohort model to encourage collaboration and team-building and to ensure accountability, facilitated group discussions and effective best practice sharing.
Kaiser University is our web-based learning and development platform offering a catalog of thousands of on-demand courses to employees across a broad range of topics including compliance, maintenance, health and safety, Lean Six Sigma, communication skills, business skills, computer skills, cybersecurity, discrimination and harassment prevention and our processes and policies.
The Metallurgy Excellence and Technical Strength Program provides professional development for our talented metallurgical professionals in order to facilitate their ability to develop and implement process control systems and identify new technologies that can benefit the company. This program provides mentorship opportunities with company which directly holds the assetsleaders and liabilities associated withexperts as well as participation in career enhancing training to ensure our manufacturing operations (excluding those assets and liabilities associated with our Columbia, New Jersey and London, Ontario facilitiescompetitive advantage.
The Tuition Assistance Program provides tuition reimbursement for salaried employees and certain represented employees as stipulated by the collective bargaining agreement. The mission of this program is to support our workforce in completing a degree that benefits both our employees and our company.
Rewards
All of our employees, including hourly and salaried employees at our production facilities, participate in short-term incentive compensation plans, which are based on attainment of performance metrics that drive and support our best-in-class commitment. We also provide stock-based compensation to executive officers, members of senior management throughout the assetscompany and liabilities associated withother key employees, as well as a deferred compensation plan for certain employees. All of our operations in the State of Washington)U.S. employees have access to 401(k) savings plans and owns 100% of the ownership interest of:
Information Security
We employ information systems to support our business. As is the case for the primary purposeother manufacturing companies of engaging in market developmentcomparable size and commercialization and distributionscope, we, from time to time, experience attempted cyber-attacks on our information system. We also face risks associated with other potential significant failures or disruptions of our products in Europe;information technology networks. We utilize a risk-based, multi-layered information security approach following the National Institute of Standards and
Our information security performance and recent cybersecurity industry trends are reviewed by management, including our Chief Information Officer at least monthly and are reported to and reviewed by each of the assetsaudit committee and liabilities associated withthe full board of directors throughout the year (but no less than once a year). Our entire board of directors is responsible for overseeing management’s risk assessment and risk management processes designed to monitor and mitigate information security risks, including cyber risk and related insurance policies.
We regularly engage independent third parties to test our Columbia, New Jersey facility.
To date, no attempted cyber-attack or other attempted intrusion on our information technology networks has resulted in a material adverse impact on our operations or financial results, or in any penalties or settlements. In the event an attack or other intrusion were to be successful, we have a response team of internal and external resources engaged and prepared to respond.
Item 1A.
Risk FactorsIn addition to the factors discussed elsewhere in this Report, the risks described below are those that we believe are material to our company. The occurrence of any of the events discussed below could significantly and adversely affect our business, prospects, financial position, results of operations and cash flows as well as the trading price of our securities.
RISKS RELATED TO CHANGES IN DEMAND FOR OUR PRODUCTS.
The COVID-19 pandemic has impacted and could in the future materially and adversely affect our business.
The novel strain of the coronavirus identified in late 2019 has impacted and is expected to continue to impact our operations. The full nature and extent of the impact is highly uncertain. Among other things, uncertainties relating to the COVID-19 pandemic include the duration of the pandemic and the actions, or perception of actions that may be taken, to contain or treat its impact by governments and others, including declarations of states of emergency, business closures, manufacturing restrictions and prolonged periods of travel, vaccine mandates, commercial and/or other similar restrictions and limitations.
Furthermore, as a result of the COVID-19 pandemic and the measures implemented to contain its spread, our customers have been, and could continue to be, negatively impacted as a result of disruption in demand, which has and could in the future negatively impact our sales and have a material adverse effect on our business, results of operations and financial condition. Similarly, as a result of the COVID‑19 pandemic and measures implemented to contain its spread, our suppliers may not have the materials, capacity or capability to enable the manufacture of our products according to our schedule and specifications. These disruptions include those resulting from the supply demand imbalances in the magnesium and silicon market. Because of impacts to suppliers’ supply chain or other operations, we may need to seek alternate suppliers, which may be more expensive, may not be available or may result in delays in shipments to us and subsequently to our customers, each of which would affect our results of operations.
The COVID-19 pandemic has also disrupted our internal operations by heightening the risk that a significant portion of our workforce will suffer illness or otherwise not be permitted or be unable to work and exposing us to cyber security and other risks associated with a large number of our employees working remotely. Certain of our facilities have experienced temporary work disruptions as a result of the COVID-19 pandemic, and we cannot predict whether our facilities will experience more significant or frequent disruptions in the future.
The impact of the COVID-19 pandemic continues to evolve, and its duration and ultimate disruption to our customers, supply chains and our workforce, and related financial impact to us, cannot be estimated at this time. Should such disruption continue for an extended period of time, the impact could have a more severe adverse effect on our business, results of operations and financial condition. Additionally, weaker economic conditions generally could result in impairment in value of our tangible or intangible assets, or our ability to raise additional capital, if needed.
The COVID-19 pandemic caused downturns in the commercial aerospace industry and other commercial disruptions, which have adversely affected our business, and could cause additional downturns in the automotive and ground transportation industries, which would further adversely affect our business.
We derive a significant portion of our revenue from products sold to the aerospace and automotive and ground transportation industries. Concerns regarding and measures implemented in response to pandemics of infectious disease, as well as disruptions to supply chains and other interruptions of international and regional commerce, have and could further cause changes in global travel and shipping patterns, negatively influencing demand for new commercial aircraft and other vehicles, resulting in cancellations or deferrals of orders and/or decreases in new deliveries. Moreover, because new automotive vehicle demand is tied closely to overall economic strength, economic uncertainty and/or increased unemployment that results from the COVID-19 pandemic or measures undertaken in response could lead to weak demand for, or lower production of, new cars, light trucks, SUVs and heavy duty vehicles and trailers, which, in turn, could adversely affect demand for our products. For example, several of our automotive customers have temporarily suspended operations in the past and could do so again in response to the COVID-19 pandemic and/or in accordance with governmental requirements. Despite existing backlogs, adverse developments resulting from the pandemic may lead to reduced demand for our products, which could adversely affect our financial position, results of operations and cash flows.
We operate in a highly competitive industry.
We compete with others in the fabricated products segment of the aluminum industry based upon quality, availability, price, customer service and delivery performance. Some of our competitors are substantially larger than we are, have greater financial resources than we do, operate more facilities than we do, are geographically closer to our customers than we are, employ more efficient or advanced technologies than we do or have other strategic advantages. Additionally, new parties may become capable of manufacturing similar products and qualifying them with our customers, which could lead to further competitive pressure. Competitors'Competitors’ facilities located in certain other countries may have a manufacturing cost advantage compared to our facilities, which are located in the United States and Canada. Such foreign competitors may sell products similar to our products at lower prices as a result of having lower manufacturing costs or due to currency exchange rates that periodically favor foreign competition. Some foreign competitors may also dump their products in the United States and Canada in violation of existing trade laws. We may not be able to compete by differentiating ourselves based on the quality, availability and delivery of our products or our customer service. Additionally, we may not be able to reduce our cost structure and our selling prices to be competitive with others, and tariffs introduced to protect manufacturers in the United States and Canada from foreign price competition may not be fully effective.
Increased competition could cause a reduction in demand for our products and our shipment volumes, our product pricing or both shipment volumes and product pricing, which could have an adverse effect on our financial position, results of operations and cash flows.
Reductions in demand for our products may be more severe than, and may occur prior to, reductions in demand for our customers'customers’ products.
Most of our products undergo further fabrication by other parties before being deployed in their end uses. In particular, our Aero/HS products undergo numerous stages of further fabrication or assembly by a number of parties in the supply chain, often over the course of many months. The lead time from when we sell our Aero/HS product to when the finished product is installed on an aircraft often exceeds a year. Due to this long lead time, demand for our products may increase prior to demand for our customers'customers’ products or may decrease when our customers experience or anticipate softening demand for their products. Our customers typically respond to reduced demand for their products by depleting their inventory until their inventory falls to a new desired level. This causes a greater reduction in demand for our products than our customers experience for their products. Further, the reduction in demand for our products can be exacerbated if our customers'customers’ inventory levels had been higher than normal, if production is delayed for specific commercial airframe models, if our customers previously had purchased products from us at committed sales contract volumes that exceeded their actual need or for other reasons. The amplified reduction in demand for our products while our customers consume their inventory to meet their business needs (destocking) may adversely affect our financial position, results of operations and cash flows.
Our customers may reduce their demand for aluminum products in favor of alternative materials.
Our products compete with other materials for use in various customer applications. For instance, the commercial aerospace industry has used and continues to evaluate the further use of titanium, composites and carbon fiber materials as alternatives to aluminum to reduce aircraft weight and increase fuel efficiency. Additionally, while the automotive industry has continued to increase use of aluminum in vehicle production to reduce vehicle weight and increase fuel efficiency, manufacturers may revert to steel or other materials for certain applications and rely on improved drivetrain technology, more efficient engines, aerodynamics or other measures to achieve fuel efficiency goals. Finally, the packaging industry has used and continues to use steel, tin, plastics, glass and paperboard as alternatives to aluminum for packaging and delivery of food and beverages. The packaging industry is heavily influenced by cost and recyclability of the packaging material. The willingness of customers to use materials other than
Our customers may reduce their demand for our products if the government relaxes fuel efficiency standards or if oil prices remain low for a protracted period of time.
Efficient use of fossil fuels partially drives demand for aluminum in transportation applications. The U.S. Environmental Protection Agency ("EPA"),USEPA, other federal regulatory agencies and regulatory agencies of certain states have generally sought to limit growth of fossil fuel usage by establishing stricter fuel efficiency standards. However,In addition, newly elected and/or changing administrations could accelerate efforts to not only limit, but reduce, fossil fuel usage and carbon emissions beyond what may be technologically possible for certain products and manufacturing processes and revisit or reverse the environmental agendas of priorprevious administrations could be reversed andwith respect to previously established fuel efficiency standards could be relaxed by administrations that place less emphasis on environmental issues.standards. Additionally, in periods of lower oil prices, the economic benefits of replacing older aircraft and automobiles with more fuel-efficient models are less compelling. A relaxation of fuel efficiency standards by the regulatory agencies or an extended period of moderate oil prices could reduce demand for new more efficient aircraft and automobiles, which could adversely affect the demand for our products and have an adverse effect on our financial position, results of operations and cash flows.
The commercial aerospace industry is cyclical and downturns in the commercial aerospace industry could adversely affect our business.
We derive a significant portion of our revenue from products sold to the aerospace industry. Notwithstanding a secular growth trend spanning nearly two decades, the aerospace industry has historically beenis highly cyclical. Numerous factors that influence demand for new commercial aircraft could result in cancellations or deferrals of aircraft orders and a global decrease in new commercial aircraft deliveries. These factors have recently included the impacts of the COVID-19 pandemic on global travel and supply chains, but also include but are not limited to: (i) declines or reduced growth trends in global travel and airline passenger traffic; (ii) the rate of replacement of older aircraft with more fuel efficient aircraft; (iii) changing airline strategies affecting preferences for single-aisle aircraft models as opposed to twin-aisle or jumbo aircraft models; (iv) airline industry profitability; (v) the state of regional and global economies; (vi) concerns regarding terrorism or the threat of terrorism; (vii) concerns regarding new pandemics of infectious disease; and (viii) safety concerns with newly introduced and existing aircraft. Despite existing backlogs, adverse developments in any one or more of these influencing factors may lead to reduced demand for new aircraft that utilize our products, which could adversely affect our financial position, results of operations and cash flows.
Reductions in defense spending for aerospace and non-aerospace military applications could adversely affect demand for our products.
Our products are used in a wide variety of military applications, including military aircraft, armored vehicles and ordnance. Certain military programs are used by the U.S. armed forces, as well as by the defense forces of our allied foreign powers. Military programs that currently use or in the future could use our products may be subject to changes in military strategy and government priorities. Further, while many of the U.S. government programs span several years, they are often funded annually, and funding is generally subject to congressional appropriations. When U.S. and foreign allied governments are faced with competing national priorities, such as addressing financial or spending crises or public health emergencies, there can be significant pressure to reduce defense spending, which could reduce the demand for our products and adversely affect our financial position, results of operations and cash flows.
Downturns in the automotive and ground transportation industries could adversely affect our business.
The demand for our Automotive Extrusions and many of our general engineering and other industrial products is dependent on the production of cars, light trucks, SUVs and heavy duty vehicles and trailers in North America. The automotive industry is highly cyclical, as new vehicle demand is dependent on consumer spending and is tied closely to the overall strength of the North American economy. Even with the automotive industry'sindustry’s growing use of aluminum to reduce vehicle weight, weak demand for, or lower production of, new cars, light trucks, SUVs and heavy duty vehicles and trailers could adversely affect the demand for our products and have an adverse effect on our financial position, results of operations and cash flows.
Changes in consumer demand for particular motor vehicles could adversely affect our business.
Sensitivity to fuel prices, an increased preference for environmentally friendly alternatives and other consumer preferences can influence consumer demand for motor vehicles that have a higher content of the aluminum Automotive Extrusions that we supply. The loss of business with respect to, or a lack of commercial success of, one or more particular vehicle models for which we are a significant supplier could have an adverse impact on our financial position, results of operations and cash flows.
Aluminum beverage and food packaging products are subject to competition from substitute products and decreases in demand, which could result in lower profits and reduced cash flows.
On March 31, 2021, we completed our acquisition of Warrick. Warrick expands our flat-rolled product offering to include aluminum coil produced for demanding end market applications in the beverage and food packaging industry in North America. Such product offerings are subject to substantial competition from producers of alternative packaging made from glass, paper, flexible materials, plastic and organic or compostable materials, which may compare favorably to aluminum with respect to preservation of food and beverage quality and/or sustainability. Changes in the volume of sales by our customers in the food and beverage markets and preferences for products and packaging by consumers of prepackaged food and beverage cans may significantly influence our sales and our ability to realize the benefits of the Warrick acquisition. Changes in packaging preferences by our customers may require us to re-tool manufacturing operations, which could require material expenditures. In addition, a decrease in the costs of, or a further increase in consumer demand for, alternative packaging could result in lower profits and reduced cash flows for us. For example, increases in the price of aluminum and decreases in the price of plastic resin, which is a petrochemical product and may fluctuate with prices in the oil and gas market, may increase substitution of plastic food and beverage containers for metal containers. Moreover, due to associated high percentage of fixed costs, we may be unable to maintain the gross margin of aluminum packaging products at past levels if we are not able to achieve high capacity utilization rates for our production equipment. In periods of low demand for aluminum packaging products or in situations where industry expansion created excess capacity, we may experience relatively low capacity utilization rates, which can lead to reduced margins during that period and can have an adverse effect on our business.
RISKS RELATED TO SALES-RELATED RISKS.
We depend on a core group of significant customers.
In 2019,2021, Silgan and Reliance and Boeing were our two largest customers, representing approximately 25%16% and 17%15%, respectively, of our net sales. Our five largest customers in total accounted for approximately 55%49% of our 20192021 net sales. Most of these customers have one or more sizable sales agreements with us. If one or more of these customers experienced a prolonged period of adverse demand, depressed business activity or financial distress, if any of these customers breached or sought relief from its contractual obligations under its sales agreements with us or if any of these customer relationships otherwise ended or materially deteriorated and such lost business was not successfully replaced, our financial position, results of operations and cash flows could be adversely affected.
We experience fluctuation in certain costs that we cannot pass through to our customers and face pressure from our customers on pricing.
We are unable to pass fluctuations of certain costs through to our customers, including the cost of energy, certain raw materials and freight. Further, cost cutting initiatives that many of our customers have adopted generally result in downward pressure on pricing. If we are unable to generate sufficient productivity improvements and cost savings in the future to offset reductions in our selling prices and increases in our costs that we cannot pass through to our customers, our financial position, results of operations and cash flows could be adversely affected.
We are exposed to risks related to our receivables supply chain financing arrangements.
We are party to several supply chain financing arrangements, in which we may sell certain of our customers’ trade accounts receivable without recourse to such customers’ financial institutions. To the extent that these arrangements are terminated, our financial condition, results of operations, cash flows and liquidity could be adversely affected by extended payment terms, delays or failures in collecting trade accounts receivables. The utility of certain supply chain financing arrangements also depends upon the London Interbank Offered Rate (“LIBOR”), as it is a component of the discount rate applicable to certain arrangements. If the LIBOR rate increases significantly, we may be negatively impacted as we may not be able to pass these added costs on to our customers, which could have a material and adverse effect upon our financial condition, results of operations and cash flows.
RISKS RELATED TO GEO-POLITICAL RISKS.
Our industry is very sensitive to foreign economic, regulatory and political factors that may adversely affect our business.
We import primary aluminum from, and manufacture fabricated products used in, foreign countries. Our financial position, results of operations and cash flows could be adversely affected by numerous factors in the politically and economically diverse jurisdictions: (i) from which our input materials are sourced; (ii) in which we operate; (iii) in which our customers operate; or (iv) in which our products are consumed or further fabricated. Such factors include but are not limited to:
• | the adoption of tariffs, duties and other forms of taxation; |
• | trade disputes; |
• | the implementation of controls on prices, exports and/or imports, including quotas; |
• | the implementation of other restrictions on supply chains in connection with global health pandemics; |
• | the imposition of currency restrictions; |
• | inflation relative to the United States and related fluctuations in currency and interest rates; |
• | government regulation in the countries in which we operate, service customers or purchase raw materials; |
• | acts or threats of war or terrorism; |
• | sanctions, including those in response to acts or threats of war or terrorism; |
• | civil unrest and labor problems; and |
• | the nationalization or appropriation of rights or other assets. |
RISKS RELATED TO PRODUCT AND MANUFACTURING-RELATED RISKS.
We may experience difficulties in the launch or production ramp-up of new products which could adversely affect our business.
As we ramp up manufacturing processes for newly introduced products, we may experience difficulties, including manufacturing disruptions, delays or other complications, which could adversely impact our ability to serve our customers, our reputation, our costs of production and, ultimately, our financial position, results of operations and cash flows.
Unplanned events may interrupt our production operations, which may adversely affect our business.
The production of fabricated aluminum products is subject to unplanned events such as explosions, fires, inclement weather, natural disasters, accidents, equipment failures, labor disruptions, transportation interruptions, public utilities interruptions and supply interruptions. Operational interruptions could significantly curtail the production capacity of a facility for a period of time. We have redundant capacity and capability to produce many of our extruded products within our manufacturing platform to mitigate our
our ability to meet our customers'customers’ needs. Delayed delivery of our products to customers who require on-time delivery from us may cause customers to purchase alternative products at a higher cost, reschedule their own production or incur other incremental costs. Customers may be able to pursue financial claims against us for their incremental costs, and we may incur costs to correct such problems in addition to any liability resulting from such claims. Interruptions may also harm our reputation among actual and potential customers, potentially resulting in a loss of business. To the extent these losses are not covered by insurance, our financial position, results of operations and cash flows could be adversely affected by such events.
We may face challenges to our intellectual property rights which could adversely affect our reputation, business and competitive position.
Our intellectual property plays an important role in maintaining our competitive position in a number of the markets that we serve. Our competitors may develop technologies that are similar or superior to our proprietary technologies or design around the patents we own or license. Despite our controls and safeguards, our technology may be misappropriated by our employees, our competitors or other third parties. The pursuit of remedies for any misappropriation of our intellectual property is expensive and the ultimate remedies may be deemed insufficient. Developments or assertions by or against us relating to intellectual property rights, and any inability to protect or enforce our rights sufficiently, could adversely affect our business and competitive position.
RISKS RELATED TO RISKS ASSOCIATED WITH OUR STRATEGIC TRANSACTIONS AND INITIATIVES.
We may not be able to successfully implement our productivity enhancement and cost reduction initiatives that are necessary to offset competitive price pressure.
Over time, we have experienced pricing pressure on many of our products and anticipate continued pricing pressure in the future. Ongoing and heightened competitive price pressure makes it increasingly important for us to be a low cost producer. Although we have undertaken and expect to continue to undertake productivity enhancement and cost reduction initiatives, including significant investments in our facilities to improve our manufacturing efficiency, cost and product quality, we cannot make assurances that we will complete all of these initiatives, that we will fully realize the estimated cost savings from such activities, that short-to-medium term improvements from new efficiencies and lower cost structure achieved will become permanent or that we will be able to continue to reduce cost and increase productivity over the long term.
Our investment and other expansion projects may not be completed, start up as scheduled or deliver the expected capacity and other benefits.
Our ability to complete our investment and expansion projects and the timing and costs of doing so are subject to various risks associated with all major construction projects, many of which are beyond our control, including technical or mechanical problems and economic conditions. Additionally, the start-up of operations after such projects have been completed can be complicated and costly. If we are unable to fully complete these projects, if the actual costs for these projects exceed our expectations, if the start-up phase after completion is more complicated than anticipated or if the capacity and other benefits of these projects are less than anticipated, our financial position, results of operations and cash flows could be adversely affected.
We may not realize the benefits of the Warrick rolling mill acquisition.
Our recent acquisition of the Warrick rolling mill could disrupt our business and/or dilute or adversely affect the price of our common stock. Risks associated with the Warrick rolling mill acquisition may include:
• | diversion of management’s time and attention from our existing business; |
• | challenges in managing the increased scope, geographic diversity and complexity of operations; |
• | difficulties integrating the financial, technological and management standards, processes, procedures and controls of the acquired business with those of our existing operations; |
• | liability for known or unknown environmental conditions or other contingent liabilities not covered by indemnification or insurance; |
• | greater than anticipated expenditures required for compliance with environmental or other regulatory standards or for investments to improve operating results; |
• | difficulties achieving anticipated operational improvements; and |
• | incurrence of indebtedness to finance other acquisitions or capital expenditures relating to acquired assets in the future. |
If we fail to successfully integrate the Warrick rolling mill, we may not realize the benefits expected from the transaction and/or it may have adverse effects on our financial position, results of operations and cash flows.
We are dependent upon Alcoa Corporation (“Alcoa”) for certain resources essential to the day-to-day operation of our business at Warrick.
We are dependent upon Alcoa for certain resources required for the day-to-day operation of our business at Warrick, which include molten aluminum and “support services” such as the provision of potable water, compressed air, laboratory services, electricity, steam and hot water. In order to transition Warrick from dependence upon the support services to independence as a facility with its own self-sufficient infrastructure, Alcoa has agreed to provide “transition services,” including providing infrastructure and equipment for the production of steam, hot water and compressed air and conveying the filtration plant currently utilized for the supply of potable water. In addition, Alcoa has agreed to pay for the development of infrastructure necessary for Warrick to obtain electricity from a third party power supplier, subject to certain conditions. Alcoa has agreed to provide the support services through a period to extend no later than June 30, 2024, by which date Alcoa must complete its transition services. A failure by Alcoa to provide molten aluminum and support services or transition services within the time frames and upon the terms agreed to, including quality and performance standards, could cause us to incur substantial costs to keep the Warrick rolling mill operational or result in the temporary or permanent shutdown of Warrick’s operations. In the event that production of Warrick is negatively impacted by Alcoa’s failure to provide molten aluminum, support or transition services, our operations, business, financial condition and results of operations could be adversely affected.
RISKS RELATED TO COMMODITY-RELATED PRICE FLUCTUATIONS.
Our business could be adversely affected by increases in the costpricing and availability of primary aluminum.
Our largest inputs to produce fabricated aluminum products are primary aluminum and recycled scrap aluminum. Primary aluminum pricing fluctuates in response to global supply and demand and also reflects the impact of duties and tariffs imposed by the United States and certain other countries. Recycled scrap aluminum is generally priced at a discount to primary aluminum that loosens and tightens in response to regional aluminum scrap supply and demand. The timing and magnitude of changes in market pricing for primary and scrap aluminum are largely unpredictable. Our pricing structures for fabricated aluminum products generally allow us to pass fluctuations in the price of primary aluminum through to our customers so that we can minimize our exposure to metal price risk. However, competitive dynamics for certain of our high value added products may limit the amount or delay the timing of selling price increases on our products to recover our increased aluminum costs, resulting in a time lag during which we may be partially exposed to metal price risk. If these events were to occur, they could have an adverse effect on our financial position, results of operations and cash flows. In addition, if the market price for primary aluminum were to remain high for an extended period of time, the corresponding increase in our selling price for our fabricated products may cause some of our customers to switch to other materials in lieu of our products, causing sales of our fabricated aluminum products to decrease, which could adversely affect our financial position, results of operations and cash flows.
Our business could be adversely affected by the pricing and availability of recycled scrap aluminum.
We can efficiently use certain forms of recycled scrap aluminum in lieu of primary aluminum and alloying metals in our operations because recycled scrap aluminum trades at a discount to primary aluminum. The size of the discount to primary aluminum depends on regional scrap aluminum supply and demand dynamics. Larger discounts, generally available in periods of ample regional scrap aluminum supply relative to demand, enhance the economic advantage to us of using recycled scrap aluminum in lieu of primary aluminum and alloying metals. The timing and magnitude of changes in scrap discounts relative to primary aluminum are largely unpredictable. If the availability of recycled scrap aluminum in our regional markets were to tighten, scrap discounts relative to primary aluminum could decline and the amount of recycled scrap aluminum we could procure for use in our operations could decline, either of which could have an adverse effect on our financial position, results of operations and cash flows.
Our business could be adversely affected by the pricing and availability of alloying metals.
We use certain alloying metals, such as copper, zinc, magnesium and silicon, in our operations in order to achieve required performance properties in our products. The availability of these alloys in some cases can be restricted due to limited suppliers, government regulations, energy and supply chain disruptions and/or general demand dynamics. When sudden restrictions of these materials occur we can be subject to rapid price increases and limited supplies, either of which could have an adverse effect on our financial position, results of operations and cash flows.
Reduced pricing for aluminum can reduce our borrowing availability and cause our liquidity to decline.
Lower aluminum prices reduce the market value of our inventory and generally cause a reduction in our accounts receivable as we pass through a lower underlying metalaluminum price to our customers. Because the amount we can borrow under our revolving credit facility with Wells Fargo Bank, National Association, as administrative agent, and the other financial institutions party thereto (“Revolving Credit Facility”) is determined by the value of our receivables and inventory, which serve as collateral for the facility, a
reduction in aluminum prices can reduce our borrowing availability and our liquidity, which could have an adverse effect on our financial position, results of operations and cash flows.
Our hedging programs have been and could continue to be adversely impacted by fluctuations as a result of the impacts of the COVID-19 pandemic.
We use forward contracts to protect against fluctuations in commodity price and currency exchange rate risks. The effectiveness of these hedges depends, in part, on our ability to accurately forecast future product demand and related cash flow. Due to the economic impacts of the COVID-19 pandemic and related governmental responses, our customers’ businesses are subject to many uncertainties and, as a result, we have experienced, and may continue to experience, unanticipated volatility in product demand and related cash flows. When we experience such volatility or are otherwise unable to make accurate predictions with respect to our forward swaps designated as cash flow or fair value hedges, such hedging activities may become ineffective. The early settlement, reclassification of cumulative losses and/or the periodic adjustment to fair value through Net (loss) income associated with ineffective hedging activities could have a material negative impact on our financial position, results of operations and cash flows.
Our hedging programs may limit the income and cash flows we would otherwise expect to receive if our hedging program were not in place and may otherwise affect our business.
In the ordinary course of business, we enter into hedging transactions to limit our exposure to risks relating to changes in the market prices of primary aluminum, certain alloying metals, natural gas and electricity, as well as fluctuations in foreign currency exchange rates. To the extent that market prices or exchange rates at the expiration of these hedging transactions would have been more favorable to us than the fixed prices or rates established by these hedging transactions, our income and cash flows will be lower than they otherwise would have been. Our liquidity could also be adversely affected to the extent we incur margin calls from our hedging counterparties due to the market price of the underlying commodity or the foreign currency exchange rates deviating adversely from fixed, floor or ceiling prices or rates established by our outstanding hedging transactions. Our failure to satisfy certain covenants in the underlying hedging documents or the occurrence of an event of default thereunder could also trigger margin calls that could adversely impact our liquidity, financial position, results of operations and cash flows. Our hedging programs also expose us to the creditworthiness of our hedging counterparties, which is inherently difficult to assess and can change quickly and dramatically. Non-performance by a hedging counterparty could have an adverse effect on our financial position, results of operations and cash flows.
RISKS RELATED TO OUR INDEBTEDNESS.
Covenants and events of default in our debt instruments could limit our ability to undertake certain types of transactions and adversely affect our liquidity.
Our revolving credit facilityRevolving Credit Facility and the indentureindentures governing our 4.625% Senior Notes due 2028 ("(“4.625% Senior Notes"Notes”) and 4.50% Senior Notes due 2031 (“4.50% Senior Notes”) contain a number of restrictive covenants that impose operating and financial restrictions on us and may limit our ability to engage in acts that may be in our long-term best interest, including restrictions on our ability to:
• | incur additional indebtedness and guarantee indebtedness; |
| pay dividends or make other distributions or repurchase or redeem capital stock; |
| prepay, redeem or repurchase certain debt; |
| issue certain preferred stock or similar equity securities; |
| make loans and investments; |
| sell assets; |
| incur liens; |
| enter into transactions with affiliates; |
| alter the businesses we conduct; |
| enter into agreements restricting our subsidiaries’ ability to pay dividends; and |
• | consolidate, merge or sell all or substantially all of our assets. |
In addition, restrictive covenants in our revolving credit facilityRevolving Credit Facility require us in certain circumstances to maintain specified financial ratios and satisfy other financial condition tests. Our ability to meet those financial ratios and tests can be affected by events beyond our control and we may be unable to meet them.
A breach of the covenants or restrictions under our revolving credit facilityRevolving Credit Facility or under the indentureindentures governing the 4.625% Senior Notes and 4.50% Senior Notes could result in an event of default under the applicable indebtedness. Such a default may allow the creditors to accelerate the related debt. A payment default or an acceleration following an event of default under our revolving credit facilityRevolving Credit Facility or our indentureindentures for our 4.625% Senior Notes and 4.50% Senior Notes could trigger an event of default under the other indebtedness obligation, as well as any other debt to which a cross-acceleration or cross-default provision applies, which could result in the principal of and the accrued and unpaid interest on all such debt becoming due and payable. In addition, an event of default under our revolving credit facilityRevolving Credit Facility could permit the lenders under our revolving credit facilityRevolving Credit Facility to terminate all commitments to extend further credit under that facility. Furthermore, if we were unable to repay any amounts due and payable under our revolving credit facility,Revolving Credit Facility, those lenders could proceed against the collateral granted to them to secure that indebtedness. In the event our lenders or noteholders accelerate the repayment of our borrowings, we and our subsidiaries may not have sufficient assets to repay that indebtedness.
As a result of these restrictions, we may be:
• | limited in how we conduct our business and grow in accordance with our strategy; |
| unable to raise additional debt or equity financing to operate during general economic or business downturns; or |
| unable to compete effectively or to take advantage of new business opportunities. |
In addition, our financial results, our level of indebtedness and our credit ratings could adversely affect the availability and terms of any additional or replacement financing.
More detailed descriptions of our revolving credit facilityRevolving Credit Facility and the indentureindentures governing our 4.625% Senior Notes and 4.50% Senior Notes are included in filings made by us with the SEC, along with the documents themselves, which provide the full text of these covenants.
Restrictive covenants in our debt instruments contain significant qualifications and exceptions.
While our revolving credit facilityRevolving Credit Facility and the indentureindentures governing the 4.625% Senior Notes and 4.50% Senior Notes place limitations on our ability to pay dividends or make other distributions, repurchase or redeem capital stock, make loans and investments and incur additional indebtedness, investors should be aware that these limitations are subject to significant qualifications and exceptions. The aggregate amount of payments made or incremental debt incurred in compliance with these limitations could be substantial.
As indicated above, more detailed descriptions of our revolving credit facilityRevolving Credit Facility and the indentureindentures governing our 4.625% Senior Notes and 4.50% Senior Notes are included in filings made by us with the SEC, along with the documents themselves, which provide the full text of these covenants.
Servicing our debt requires a significant amount of cash and we may not have sufficient cash flow from our business to pay our debt.
Our ability to make scheduled interest and principal payments on our debt obligations or to refinance such obligations depends on our financial condition and operating performance, which are subject to prevailing economic and competitive conditions and to certain financial, business, legislative, regulatory and other factors beyond our control. We may be unable to maintain a level of cash flows from operating activities sufficient to permit us to pay the interest, principal and premium, if any, on our indebtedness.
If our cash flows and capital resources are insufficient to fund our debt service obligations, we could face substantial liquidity problems and could be forced to reduce or delay investments and capital expenditures, dispose of material assets or operations, restructure or refinance our indebtedness or seek additional debt or equity capital. We may not be able to effect any such alternative measures, if necessary, on commercially reasonable terms or at all and, even if successful, those alternative actions may not allow us to meet our scheduled debt service obligations. Our revolving credit facilityRevolving Credit Facility and the indentureindentures governing the 4.625% Senior Notes and 4.50% Senior Notes restrict our ability to dispose of assets and use the proceeds from those dispositions and
If we cannot make scheduled payments on our debt, we will be in default and holders of the 4.625% Senior Notes and 4.50% Senior Notes could declare all outstanding principal and interest to be due and payable, the lenders under our revolving credit facilityRevolving Credit Facility could terminate their commitments to loan money, the lenders could foreclose against the assets securing their borrowings and we could be forced into bankruptcy or liquidation.
The interest rate used in certain of our debt agreements and our customers’ supply chain financing arrangements are priced using LIBOR and are subject to risks associated with the transition from LIBOR to an alternative reference rate.
Certain of our debt agreements and our customers’ supply chain financing arrangements use LIBOR as a reference rate for interest rate calculations. LIBOR has been the subject of recent proposals for international reform and it is anticipated that LIBOR will be discontinued or modified by June 2023. While no consensus currently exists as to which reference rate or rates or benchmarks may become acceptable alternatives to LIBOR, the Alternative Reference Rates Committee, a steering committee comprised of U.S. financial market participants, has identified the secured overnight financing rate, or SOFR, as the recommended alternative rate for all LIBOR. The consequences of adopting an alternative reference rate cannot be entirely predicted but could result in an increase in the cost of our variable rate borrowings. In addition, the method of transitioning to an alternative rate may be challenging, as this may require negotiation with the respective counterparty. If the LIBOR rate increases significantly, we may be negatively impacted as we may not be able to pass these added costs on to our customers, which could have a material and adverse effect upon our financial condition, results of operations and cash flows.
We are a holding company and depend on our subsidiaries for cash to meet our obligations and pay any dividends.
We are a holding company and conduct all of our operations through our subsidiaries, certain of which are not guarantors of our 4.625% Senior Notes, 4.50% Senior Notes or our revolving credit facility.Revolving Credit Facility. Accordingly, repayments of our 4.625% Senior Notes, 4.50% Senior Notes and amounts due under our revolving credit facilityRevolving Credit Facility are dependent on the generation of cash flow by our subsidiaries and their ability to make such cash available to us by dividend, loan, debt repayment or otherwise. Our subsidiaries that are not guarantors of our revolving credit facility4.625% Senior Notes, 4.50% Senior Notes or the 4.625% Senior NotesRevolving Credit Facility have no obligation to pay amounts due on the revolving credit facility4.625% Senior Notes, 4.50% Senior Notes or the 4.625% Senior NotesRevolving Credit Facility or to make funds available for that purpose. Our subsidiaries may not be able to, or may not be permitted to, make distributions to enable us to make payments in respect of our indebtedness. Each of our subsidiaries is a distinct legal entity and, under certain circumstances, legal and contractual restrictions may limit our ability to obtain cash from our subsidiaries. In the event that we do not receive distributions from our subsidiaries, we may be unable to make required interest and principal payments on our revolving credit facility, the 4.625% Senior Notes, the 4.50% Senior Notes or our Revolving Credit Facility, or other indebtedness.
Our inability to receive distributions from our subsidiaries, otherwise generate sufficient cash flows to satisfy our debt obligations or refinance our indebtedness on commercially reasonable terms, or at all, would adversely affect our financial position and results of operations.
RISKS RELATED TO OUR COLLECTIVE BARGAINING AGREEMENTS.
Our failure to maintain satisfactory labor relations could adversely affect our business.
At December 31, 2019,2021, approximately 62%66% of our employees were represented by labor unions under labor contracts with varying durations and expiration dates. Employees at our Trentwood and Newark, Ohio facilities are represented by the USW under a single contract that extends through September 2025. The USW also represents employees at fivesix other facilities, twoone of which have contractshas a contract expiring in 2020.2022. As part of any labor negotiation, the future wages, healthcare benefits and excise taxes that may result therefrom, and other benefits that we agree to, could adversely affect our future financial position, results of operations and cash flows. In addition, negotiations could divert management attention, result in unsatisfactory terms and conditions, fail in coming to any agreement at all or result in strikes, work stoppages or other union-initiated work actions, any of which could have an adverse effect on our financial position, results of operations and cash flows. Moreover, the existence of labor agreements may not prevent such union-initiated work actions.
Our participation in multi-employer union pension plans may have an adverse effect on our financial performance.
We participate in several multi-employer pension plans pursuant to our collective bargaining agreements. Our contribution amounts to these plans were established by collective bargaining and, along with benefit levels and related items, will be issues in our future collective bargaining negotiations. Based on the most recent information available to us, we believe some of these plans are underfunded and may require increased contributions from participating employers to fill the funding shortfall in the future. An employer that withdraws or partially withdraws from a multi-employer pension plan may incur a withdrawal liability for the portion of the plan'splan’s underfunding that is allocable to the withdrawing employer under very complex actuarial and allocation rules. The failure of a withdrawing employer to fund these obligations can increase the burden of the remaining participating employers to make up the funding shortfall, which could have an adverse effect on our financial position, results of operations and cash flows. The increase or decrease in our contributions to these multi-employer pension plans will depend on our future collective bargaining, actions taken by trustees who manage the plans, actions of other participating employers, government regulations and the actual return on assets held in the plans, among other factors.
An adverse decline in the liability discount rate, lower-than-expected investment return on pension assets and other factors could affect our business, financial condition, results of operations or amount of pension funding contributions in future periods.
Our results of operations may be negatively affected by the amount of expense we record for our pension and other postretirement benefit plans, reductions in the fair value of plan assets and other factors. We calculate income or expense for our plans using actuarial valuations in accordance with accounting principles generally accepted in the United States of America (“GAAP”).
These valuations reflect assumptions about financial market and other economic conditions, which may change based on changes in key economic indicators. The most significant year-end assumptions we use to estimate pension or other postretirement benefit income or expense for the following year are the discount rate applied to plan liabilities and the expected long-term rate of return on plan assets. In addition, we are required to make an annual measurement of plan assets and liabilities, which may result in a significant charge to stockholders’ equity. For more information, see Part II, Item 7. “Management’s Discussion and Analysis of Financial Condition” under caption “Critical Accounting Estimates and Policies – Pension and Other Postretirement Benefits” included in this Report, as well as Note 5 of Notes to Consolidated Financial Statements included in this Report. Although GAAP expense and pension funding contributions are impacted by different regulations and requirements, the key economic factors that affect GAAP expense would also likely affect the amount of cash we would contribute to the pension plans.
Potential pension contributions include both mandatory amounts required under federal law and discretionary contributions to improve the plans’ funded status. Higher than expected pension contributions due to a decline in the plans’ funded status as a result of declines in the discount rate or lower-than-expected investment returns on plan assets could have a material negative effect on our cash flows. Adverse capital market conditions could result in reductions in the fair value of plan assets and increase our liabilities related to such plans, adversely affecting our liquidity and results of operations.
The USW has director nomination rights through which it may influence us, and interests of the USW may not align with our interests or the interests of our stockholders, debt holders and other stakeholders.
Pursuant to agreements we have with the USW, the USW has the right, subject to certain limitations, to nominate candidates which, if elected, would constitute 40% of our Board of Directors through December 31, 2025. As a result, the directors
RISKS RELATED TO ENVIRONMENTAL-RELATED RISKS.
Environmental compliance, clean upcleanup and damage claims may decrease our cash flow and adversely affect our business.
We are subject to numerous environmental laws and regulations, including permitting and other administrative requirements, with respect to, among other things: (i) air and water emissions and discharges; (ii) the generation, storage, treatment, transportation and disposal of solid and hazardous waste;materials; and (iii) the release of hazardous or toxic substances, pollutants and contaminants into the environment. In addition to environmental laws and regulations, environmental activists, lobbyists and consumers have targeted corporationsmanufacturers for the purported impact of their operations on the environment. Compliance with theseexisting and new environmental laws and standards or the implications of any actions by third parties are and willmay continue to be costly.
We have accrued and will accrue for costs that are reasonably expected to be incurred based on available information with respect to permits, fines, penalties and expenses for alleged breaches of, and compliance activities associated with, environmental laws and regulations in connection with our existing operations and investigations and environmental clean upcleanup activities with respect to our continuing operations and certain of our former operations. However, actual costs could exceed accrued amounts, perhaps significantly, and such expenditures could occur sooner than anticipated, which could adversely affect our financial position, results of operations and cash flows.
Additionally, we may be subject to new claims from governmental authorities or third parties related to alleged injuries to the environment, human health or natural resources, including claims with respect to waste disposal sites, the clean upcleanup of sites currently or formerly used by us or exposure of individuals to hazardous materials. New laws or regulations or changes to existing laws and regulations may also be enacted including government mandated green initiatives and limitations on carbon emissions that increase the cost or complexity of compliance. Costs related to any new investigation, clean-upcleanup or other remediation, fines or penalties, resolution of third-party claims or compliance with new or amended laws and regulations, including enhanced permitting requirements, may be significant and could have an adverse effect on our financial position, results of operations and cash flows.
Governmental regulation relating to greenhouse gas emissions may subject us to significant new costs and restrictions on our operations and could impact our supply chain and cost of material.
Laws enacted by governments, including the U.S. Congress, or policies of regulators, including the EPAUSEPA, could regulate greenhouse gas emissions through cap-and-trade systems, carbon taxes or other programs under which emitters would be required to buy allowances to offset emissions of greenhouse gas, pay carbon based taxes, make significant capital investments, alter manufacturing practices or curtail production. In addition, several states, including the state of Washington, in which we have manufacturing operations, have consideredimplemented and continue to consider various greenhouse gas regulation and reduction programs through legislative proposals, executive orders and ballot initiatives. Certain of our manufacturing plants use significant amounts of electricity and natural gas and certain of our plants emit amounts of greenhouse gas above certain minimum thresholds that have or may be imposed. GreenhouseWhile certain of our operations, including the melting of aluminum, require the use of natural gas to achieve the required temperatures, greenhouse gas regulations could restrict our access to natural gas and limit our ability to use natural gas and increase the price we pay for natural gas and electricity, any one of which could significantly increase our costs, reduce our competitiveness in the global economy or otherwise adversely affect our business, operations or financial results.
Furthermore, regulations or other targets for greenhouse gas emissions could impact the availability and price of energy and raw materials, which could ultimately lead to supply demand imbalances, higher costs and supply chain disruptions. Prolonged shortages or slowdowns could negatively impact our cost of goods and result in delays or non-delivery of shipments of our products. The future impact of these or other changes could be regulatory or voluntary and could impact our operations directly or indirectly through our customers or our supply chain. These potential impacts could have an adverse effect on our operations, financial position, results of operations and cash flows.
RISKS RELATED TO CYBERSECURITY AND PRIVACY RISKS.
We are subject to risks relating to our information technology systems.
We rely on information technology networks and systems to process, transmit and store electronic information, operate our business and communicate among our locations and with our customers, suppliers and other interested parties. Such information technology systems are subject toto: (i) interruption or damage from power outages,outages; (ii) cyber security breaches and other types of unauthorized access and/or use,use; and (iii) cyberattacks in the form of computer viruses, worms, malicious computer programs, denial-of-servicedenial‑of‑service attacks and other illegal or illicit means. Cyberattack and security breach strategies and methods continue to evolve and become more sophisticated. Accordingly, preventing intrusions and detecting successful intrusions and defending against them continues to be more difficult and requires ever-increasing vigilance.
A breach in cyber security could result in manipulation and destruction of sensitive data, cause critical systems to malfunction, be damaged or shut down and lead to disruption of our operations and production downtimes, potentially for lengthy periods of time. Theft of personal or other confidential data and sensitive proprietary information could also occur as a result of a breach in cyber security, exposing us to costs and liabilities associated with privacy and data security laws in the
In addition, from time to time we may implement new technology systems or replace and/or upgrade our current information technology systems. These upgrades or replacements may not improve our productivity to the levels anticipated and may subject us to inherent costs and risks associated with implementing, replacing and updating these systems, including potential disruption of our internal control structure, substantial capital expenditures, demands on management time and other risks of delays or difficulties in transitioning to new systems or of integrating new systems into other existing systems. Our inability to prevent information technology system disruptions or to mitigate the impact of such disruptions could have an adverse effect on us.
RISKS RELATED TO TAX REGULATIONS.
We may not be able to utilize all of our net operating loss carryforwards.
Our ability to utilize our net operating loss carryforwards and other tax attributes could be limited to the extent they expire before we fully utilize them or if changes in federal or certain state tax laws reduce or eliminate our ability to use them to offset income taxes. Additionally, a change in our ownership, specifically a change in ownership of more than 50% during any period of 36 consecutive months ("(“ownership change"change”), as determined under the Internal Revenue Code of 1986 ("Code"(“Code”), could reduce our ability to fully use our net operating loss carryforwards and other significant tax attributes.
Furthermore, our tax returns for certain past years are still subject to examination by taxing authorities, and the use of net operating loss carryforwards in future periods could trigger a review of attributes and other tax matters in years that are not otherwise subject to examination. After our net operating loss carryforwards and other significant tax attributes are fully utilized or if they become unavailable to us before we fully utilize them, our future income will not be shielded from federal and state income taxation and the funds otherwise available for general corporate purposes would be reduced.
We could engage in or approve transactions involving our common shares that impair the use of our federal income tax attributes.
Section 382 of the Code affects our ability to use our federal income tax attributes, including our net operating loss carryforwards, following a more than 50% change in ownership during any period of 36 consecutive months, an ownership change, as determined under the Code. Certain transactions may be included in the calculation of an ownership change, including transactions involving our repurchase or issuance of our common shares. When we engage in or approve any transaction involving our common shares that may be included in the calculation of an ownership change, our practice is to first perform the calculations necessary to confirm that our ability to use our federal income tax attributes will not be affected. These calculations are complex and reflect certain necessary assumptions. Accordingly, it is possible that we could approve or engage in a transaction involving our common shares that causes an ownership change and inadvertently impairs the use of our federal income tax attributes. Furthermore, we may intentionally pursue a transaction that impairs the use of our federal income tax attributes if our strategy changes.
RISKS RELATED TO OUR COMMON STOCK.
Payment of dividends may not continue in the future and our payment of dividends and stock repurchases are subject to restrictions.
Our Board of Directors has declared a cash dividend for each quarter since the summer of 2007. In addition, our Board of Directors has authorized a stock repurchase program. The future declaration and payment of dividends and the purchase of our shares under the repurchase program, if any, are at the discretion of the Board of Directors and will depend on a number of factors, including our financial and operating results, financialliquidity position, and anticipated cash requirements.requirements and regulatory rules. Additionally, our revolving credit facilityRevolving Credit Facility and the indentureindentures for our 4.625% Senior Notes and 4.50% Senior Notes impose limitations on our ability to pay dividends and repurchase our common shares. We can give no assurance that dividends will be declared and paid, that dividends will not be reduced or that purchases of our shares pursuant to our repurchase program will occur in the future.
Delaware law and our governing documents may impede or discourage a takeover, which could adversely affect the value of our common stock.
Provisions of Delaware law and our certificate of incorporation and bylaws may discourage a change of control of our company or deter tender offers for our common stock. We are currently subject to anti-takeover provisions under Delaware law. These anti-takeoveranti‑takeover provisions impose various impediments to the ability of a third party to acquire control of us. Additionally, provisions of our certificate of incorporation and bylaws impose various procedural and other requirements, which could make it more difficult for stockholders to effect certain corporate actions. For example, our certificate of incorporation authorizes our Board of Directors to determine the rights, preferences and privileges and restrictions of unissued shares of preferred stock without any vote or action by our stockholders. As a result, our Board of Directors can authorize and issue shares of preferred stock with voting or conversion rights that could adversely affect the voting or other rights of holders of common stock. Our certificate of incorporation also divides our Board of Directors into three classes of directors who serve for staggered terms. A significant effect of a classified Board of Directors may be to deter hostile takeover attempts because an acquirer could experience delays in replacing a majority of directors. Moreover, stockholders are not permitted to call a special meeting.
RISKS RELATED TO A VARIETY OF OTHER RISKS AS A PUBLICLY TRADED U.S. MANUFACTURING COMPANY.
As a publicly traded U.S. manufacturing company, we are subject to a variety of other risks, each of which could adversely affect our financial position, results of operations or cash flows or the price of our common stock. These risks include but are not limited to:
• | the ability to attract and retain key management and other personnel and develop effective succession plans; |
• | skills shortages in engineering, manufacturing, technology, construction and maintenance contractors and other labor market inadequacies; |
• | regulations that subject us to additional capital or margin requirements or other restrictions that make it more difficult to hedge risks associated with our business or increase the cost of our hedging activities; |
• | compliance with a wide variety of employment, minimum wage, health and safety laws and regulations and changes to such laws and regulations; |
• | new or modified legislation related to health care; |
• | pursuing growth through acquisitions, including the ability to identify acceptable acquisition candidates, finance and consummate acquisitions on favorable terms and successfully integrate acquired assets or businesses; |
• | protection of intellectual property, including patents, trademarks, trade secrets and copyrights, from infringement by others and the potential defense of claims, whether meritorious or not, alleging the unauthorized use of the intellectual property of others; |
• | the exertion of influence over us, individually or collectively, by a few entities with concentrated ownership of our stock; |
• | failure to meet the expectations of investors, including recent environmental, sustainability and governance expectations and other factors that are beyond the control of an individual company; |
• | disputes, legal proceedings or investigations, whether meritorious or not, with respect to a variety of matters, including matters related to personal injury, employees, taxes, contracts and product liability; |
• | taxation by multiple jurisdictions and the impact of such taxation on effective tax rate and the amount of taxes paid; |
• | changes in tax laws and regulations; and |
• | compliance with Section 404 of the Sarbanes-Oxley Act of 2002, including the potential impact of compliance failures. |
Item 1B.
Unresolved Staff CommentsNone.
Item 2.
PropertiesThe following table provides information regarding the location, size and ownership of our principal production facilities as of December 31, 2019 is below:
Location | Square footage | Owned or Leased | ||||
Chandler, Arizona (Extrusion) | 103,000 | Leased1 | ||||
Chandler, Arizona (Tube) | 110,000 | Leased1 | ||||
Columbia, New Jersey | 33,000 | Owned | ||||
Florence, Alabama | 249,000 | Owned | ||||
Jackson, Tennessee | 306,000 | Owned | ||||
Kalamazoo, Michigan | 465,000 | Leased2 | ||||
London, Ontario (Canada) | 306,000 | Owned | ||||
Los Angeles, California | 174,000 | Owned | ||||
Newark, Ohio | 1,284,000 | Owned | ||||
Newburgh, Indiana (Warrick) | 3,822,000 | Owned/Leased3 | ||||
Richland, Washington | 63,000 | Leased4 | ||||
Richmond, Virginia (Bellwood) | 474,000 | Owned | ||||
Sherman, Texas | 300,000 | Owned | ||||
Spokane, Washington (Trentwood) | 2,886,000 | Owned/Leased | ||||
Total | 10,575,000 | |||||
1. | The Chandler, Arizona (Extrusion) and Chandler, Arizona (Tube) facilities are each subject to leases with terms that expire in 2023 and 2033, respectively, subject to certain extension rights held by us. |
2. | The Kalamazoo, Michigan facility is subject to a lease with a 2033 expiration date, subject to certain extension rights held by us. |
3. | The Warrick facility is owned by us, while the land where the rolling mill is located is subject to a lease with a 2081 expiration date and a renewal option subject to certain terms and conditions. |
4. | The Richland, Washington facility is subject to a lease with a |
5. | |
| The Trentwood facility consists of |
Production facilities and equipment are generally in good condition and suitable for their intended uses. For additional information regarding our production facilities, see the table under Item 1. Business "Business Operations“Resources - Manufacturing Processes"Processes” of this Report.
Item 3.
Legal ProceedingsNone.
Item 4.
Mine Safety DisclosuresNot applicable.
PART II
Item 5. Market for Registrant'sRegistrant’s Common Equity, Related Stockholder Matters and Issuer Purchases of Equity Securities
Market Information
Our outstanding common stock is traded under the ticker symbol "KALU"“KALU” on the Nasdaq Global Select Market.
Holders
As of February 14, 2020,22, 2022, there were approximately 493488 holders of record of our common stock.
Stock Performance Graph
The following graph compares the cumulative total shareholder return on our common stock with: (i) the S&P SmallCap 600 Index; (ii) the Russell 2000 Index; and (iii) the S&P SmallCap 600 Materials Index. We are a component of each of these indices. The graph assumes: (i) an initial investment of $100 as of December 31, 2014 2016and (ii) reinvestment of all dividends. The performance graph is not necessarily indicative of the future performance of our stock price.
COMPARISON OF 5 YEAR CUMULATIVE TOTAL RETURN
Among Kaiser Aluminum Corporation, the S&P SmallCap 600 Index,
the Russell 2000 Index and the S&P SmallCap 600 Materials Index

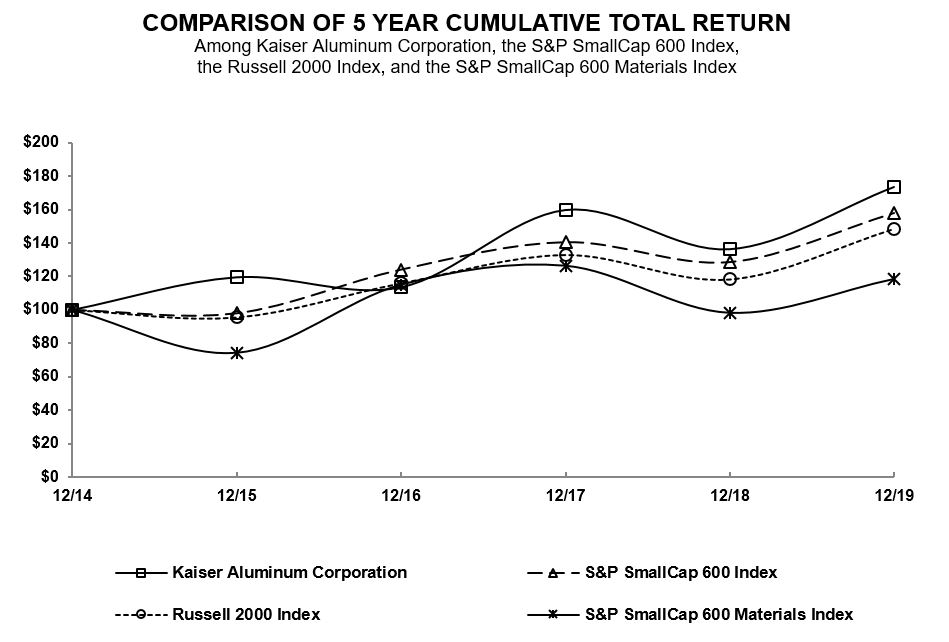
Issuer Repurchases of Equity Securities
The following table provides information regarding our repurchases of our common shares during the quarter ended December 31, 2019:2021:
|
| Equity Incentive Plans |
|
| Stock Repurchase Plan |
| ||||||||||||||
|
| Total Number of Shares Purchased1 |
|
| Average Price per Share |
|
| Total Number of Shares Purchased2 |
|
| Average Price per Share |
|
| Maximum Dollar Value of Shares that May Yet Be Purchased Under the Program (millions)2 |
| |||||
October 1, 2021 - October 31, 2021 |
|
| — |
|
| $ | — |
|
|
| — |
|
| $ | — |
|
| $ | 93.1 |
|
November 1, 2021 - November 30, 2021 |
|
| — |
|
|
| — |
|
|
| — |
|
|
| — |
|
| $ | 93.1 |
|
December 1, 2021 - December 31, 2021 |
|
| 1,186 |
|
|
| 93.55 |
|
|
| — |
|
|
| — |
|
| $ | 93.1 |
|
Total |
|
| 1,186 |
|
| $ | 93.55 |
|
|
| — |
|
| $ | — |
|
| n/a |
| |
| Equity Incentive Plans | Stock Repurchase Plan | |||||||||||||||||
Total Number of Shares Purchased1 | Average Price per Share | Total Number of Shares Purchased2 | Average Price per Share | Maximum Dollar Value of Shares that May Yet Be Purchased Under the Program (millions)2 | ||||||||||||||
| October 1, 2019 - October 31, 2019 | — | $ | — | 28,152 | $ | 98.63 | $ | 106.1 | ||||||||||
| November 1, 2019 - November 30, 2019 | — | — | 3,500 | 108.99 | $ | 105.7 | ||||||||||||
| December 1, 2019 - December 31, 2019 | — | — | 1,000 | 108.32 | $ | 105.6 | ||||||||||||
| Total | — | $ | — | 32,652 | $ | 100.04 | N/A | |||||||||||
1 | |
| Under our equity incentive |
2 | |
|
Item 6.
Item 7. "Management's Discussion and Analysis of Financial Condition and Results of Operations" and Item 8. "Financial Statements and Supplementary Data" of this Report (in millions of dollars, except shipments and per share amounts):
| Year Ended December 31, | ||||||||||||||||||||
| 2019 | 2018 | 2017 | 2016 | 2015 | ||||||||||||||||
| Shipments (mm lbs) | 625.0 | 652.4 | 625.7 | 614.3 | 615.4 | |||||||||||||||
| Net sales | $ | 1,514.1 | $ | 1,585.9 | $ | 1,397.5 | $ | 1,330.6 | $ | 1,391.9 | ||||||||||
Net income (loss)1 | $ | 62.0 | $ | 91.7 | $ | 45.4 | $ | 91.7 | $ | (236.6 | ) | |||||||||
| Net income (loss) per share - Basic | $ | 3.88 | $ | 5.53 | $ | 2.67 | $ | 5.15 | $ | (13.76 | ) | |||||||||
| Net income (loss) per share - Diluted | $ | 3.83 | $ | 5.43 | $ | 2.63 | $ | 5.09 | $ | (13.76 | ) | |||||||||
| Cash dividends declared per common share | $ | 2.40 | $ | 2.20 | $ | 2.00 | $ | 1.80 | $ | 1.60 | ||||||||||
| Capital expenditures | $ | 60.2 | $ | 74.1 | $ | 75.5 | $ | 76.1 | $ | 63.1 | ||||||||||
| Depreciation and amortization expense | $ | 49.1 | $ | 43.9 | $ | 39.7 | $ | 36.0 | $ | 32.4 | ||||||||||
| December 31, | ||||||||||||||||||||
| 2019 | 2018 | 2017 | 2016 | 2015 | ||||||||||||||||
| Assets: | ||||||||||||||||||||
Total assets1 | $ | 1,526.2 | $ | 1,419.3 | $ | 1,385.2 | $ | 1,443.5 | $ | 1,246.9 | ||||||||||
| Cash and short-term investments | $ | 343.0 | $ | 162.3 | $ | 234.8 | $ | 286.2 | $ | 102.5 | ||||||||||
| Long-term borrowings (at face value), including amounts due within one year | $ | 500.0 | $ | 375.0 | $ | 375.0 | $ | 375.0 | $ | 197.8 | ||||||||||
The following discussion and analysis of our financial condition and results of operations ("MD&A") is designed to provide a reader of our financial statements with a narrative from the perspective of our management on our financial condition, results of operations, liquidity and certain other factors that may affect our future results. Our MD&A is presented in the following sections:
Non-GAAP Financial Measures
This information contains certain non-GAAP financial measures. A non-GAAP financial measure is defined as a numerical measure of a company'scompany’s financial performance that excludes or includes amounts so as to be different than the most directly comparable measure calculated and presented in accordance with generally accepted accounting principles ("GAAP"(“GAAP”) in the statements of income, balance sheets or statements of cash flows of the company. We have provided a reconciliation of non-GAAP financial measures to the most directly comparable financial measure in the accompanying tables. We have also provided discussion of the reasons we believe that presentation of the non-GAAP financial measures provide useful information to investors, as well as any additional ways in which we use the non-GAAP financial measures. The non-GAAP financial measures used in the following discussions are value added revenue ("VAR"(“VAR”), earnings before interest, taxes, depreciation and amortization adjusted for non-run-rate items ("(“Adjusted EBITDA"EBITDA”) and ratios related thereto. These measures are presented because management uses this information to monitor and evaluate financial results and trends and believes this information to also be useful for investors.
In the discussion of operating results below, we refer to certain items as "non-run-rate“non-run-rate items."” For purposes of such discussion, non-run-rate items are items that, while they may recur from period-to-period: (i) are particularly material to results; (ii) affect costs primarily as a result of external market factors; and (iii) may not recur in future periods if the same level of underlying performance were to occur. Non-run-rate items are part of our business and operating environment but are worthy of being highlighted for the benefit of readers of our financial statements. Our intent is to allow users of the financial statements to consider our results both in light of and separately from such items. For a reconciliation of Adjusted EBITDA to Net (loss) income, see "Results“Results of Operations -
Metal Pricing Policies
Our pricing policies and hedging program are intended to significantly reduce or eliminate the impact on our profitability of fluctuations in the underlying metal price of primary and scrap, or recycled, aluminum, our main raw material, and alloys so that our earnings are predominantly associated with the conversion of aluminum to semi-fabricatedsemi‑fabricated mill products. To allow users of our financial statements to consider the impact of metalaluminum and alloy cost on our Net sales, we disclose Net sales as well as VAR, which is Net sales less the Hedged Cost of Alloyed Metal. As used in this discussion, "Hedged“Hedged Cost of Alloyed Metal"Metal” is the cost of our metal inputsaluminum at the average Midwest Transaction Price ("(“Midwest Price"Price”) of aluminum plus the cost of alloying elements and any realized gains and/or losses on settled hedges related to the metal sold in the referenced period. The average Midwest Price of aluminum reflects the primary aluminum supply/demand dynamics in North America. For a reconciliation of VAR to Net sales, see "Results“Results of Operations -
Management Review of 20192021 and Outlook for the Future
Review
This past year was transformational for the company, although one with a unique set of operational challenges. As we look ahead, we are confident in the processes and counter measures we have put in place to address the significant challenges experienced in 2021, setting the stage for stronger performance in 2022. We also achieved a number of major milestones that served to strengthen the strategic positioning of our company as we continue to manage our business for long-term growth and profitability, including our strategic acquisition of Alcoa Warrick LLC and certain assets comprising the aluminum casting and rolling mill facility located in Warrick County, Indiana (collectively, “Warrick”), providing non-cyclic end market diversification of our portfolio and re-entry into the resurging North American aluminum packaging market. In addition, we completed multiple multi-year contracts and extensions with key strategic aerospace and packaging partners securing additional long-term growth. With confidence in the continued strength of our markets and the expected long-term growth in our businesses, along with our commitment to continue creating value for our shareholders, in early 2022 we increased our quarterly dividend by 7% to $0.77 per share, an incremental increase from the 7.5% increase in early 2021.
Demand across our end markets was mixed creating inefficiencies as we adjusted to changing market conditions. While demand for general engineering applications (“GE products”) and beverage and food packaging products (“Packaging”) remained strong, demand for automotive applications (“Automotive Extrusions”) was muted throughout the year due to continued semiconductor chip shortages that significantly limited North American auto production. Recovery in demand for commercial aerospace applications continued to progress as anticipated but remained pressured, while demand for business jet and defense related applications remained strong. Our financial results for the full year 2021 reflected the impact of the demand environment, combined with rapidly rising costs, significant supply chain issues, labor constraints, continued market disruptions related to the Coronavirus Disease 2019 (“COVID‑19”) pandemic, the declaration of force majeure by one of the company’s largest magnesium suppliers and the complex integration of the Warrick acquisition.
Outlook
As we look forward, labor issues that hampered our ability to maximize the market opportunities during the year, have been addressed, as we are nearly fully staffed and expect the decline of COVID-19 pandemic-related staffing challenges and the impact of the Omicron virus continues to subside. Our commercial teams have been very successful passing through price increases and instituting contained metals and commodity surcharges to offset the majority of higher materials costs. Operating efficiencies across all facilities have begun to improve and the supply chain issues experienced during most of the year have either been mitigated, resolved or addressed, with the exception of challenges we continue to work through with our major magnesium supplier and the metal supply to our Warrick facility.
For the full year 2019, results were driven by increased aerospace and high strength products ("Aero/HS products") shipments and strong value added pricing, partially offset by lower general engineering ("GE products") and automotive ("Automotive Extrusions") shipments. Strong aerospace demand was driven by growing military airframe builds and restocking2022, we anticipate total VAR will be up 20% to 25% year-over-year with further strengthening in the commercial aerospace supply chain. The strong demand provided a favorable environment for non-contract pricing on our Aero/HS products and GE products. Results were negatively impacted by heat treat plate capacity constraints at our Spokane, Washington ("Trentwood") facility due to planned and unplanned downtime during the first half of 2019. Lower shipments of our GE products resulted primarily from allocating a portion of our heat treat plate capacity to meet the strong aerospace demand during the year. In addition, demand for general engineering and industrial applications began to slow in the second half of 2019, and supply chain destocking resulted in additional pressure on demand for our products. Automotive Extrusions shipments reflected lower build rates,products across all our major markets and the benefit of a significant number of automotive model changeovers and new program delays, in addition to the impact of the General Motors strike in the latter part of 2019.
• | Aerospace and high strength (“Aero/HS products”). We anticipate 15% to 20% year-over-year growth, primarily driven by declarations from major original equipment manufacturer (“OEMs”) customers, as well as continued strength in demand for business jet and defense applications. |
• | Packaging. We anticipate 35% to 40% year-over-year growth, primarily driven by continued strength in demand, a full year of shipments and improved pricing and mix. |
• | GE products. We anticipate 10% to 20% year-over-year growth, primarily driven by strong underlying demand, service center restocking and reshoring. |
• | Automotive Extrusions. We anticipate 10% to 20% year-over-year growth, primarily driven by strong demand for SUV’s, crossovers and light trucks, moderated by continued semiconductor chip shortages. |
Consolidated adjusted EBITDA margin (Adjusted EBITDA as a percentage of VAR) above 26%is expected to improve to the 17% to 20% level for the full year.
We are well positioned for continued long-term growth with a diversified portfolio and strong secular growth trends in each of our served end markets. Notwithstanding near-term challenges, the fundamentals of our Aero/HS products, order bookAutomotive Extrusions and GE products end markets are solid and we are increasingly optimistic in our ability to deliver significant margin expansion and long-term profitability for 2020 is strengthened by increased defense spendingour Packaging business where we have a significant market position. We remain confident around the timing of the recovery in commercial aerospace and demand for the F35 Joint Strike Fighter, the F/A-18 Super Hornet,we are optimistic that as semiconductor chip shortages are alleviated, automotive production will ramp back up and other military applications. For the full year 2020, we expect a single-digit reduction in Aero/HS products shipments and VAR compared to the full year 2019.our program launches will resume. We also anticipate North American
Results of Operations
Fiscal 20192021 Summary
• | The global COVID-19 pandemic significantly impacted all of our end market applications during the year ended December 31, 2021, most notably Aero/HS products, which experienced a 7% decline in shipments; |
• | In March 2021, we completed our $670.0 million purchase of the Warrick rolling mill from Alcoa Corporation; |
• | As of December 31, 2021, we had $670.5 millionof combined cash and cash equivalents and net borrowing availability under our revolving credit facility with Wells Fargo Bank, National Association, as administrative agent, and the other financial institutions party thereto (“Revolving Credit Facility”); |
• | In May 2021, we issued $550.0 million aggregate principal amounts of 4.50% unsecured senior notes due June 1, 2031 (“4.50% Senior Notes”) resulting in proceeds of $541.4 million, net of $8.6 millionof transaction fees; |
• | In May 2021, we redeemed all outstanding 6.50% unsecured senior notes due May 2025 (“6.50% Senior Notes”) using proceeds from our 4.50% Senior Notes offering, resulting in a cash outflow for principal, redemption premium and accrued interest of $382.2 million; and |
• | We |
Consolidated Selected Operational and Financial Information
The following data should be read in conjunction with our consolidated financial statements and the notes thereto included in Item 8. "Financial“Financial Statements and Supplementary Data"Data” of this Report.
Net Sales.
We reported Net sales forCost of Products Sold, Excluding Depreciation and Amortization and Other Items.
Cost of products sold, excluding depreciation and amortization and other items forDepreciation and Amortization.
Depreciation and amortization forSelling, General, Administrative, Research and Development ("(“SG&A and R&D"&D”).
Goodwill Impairment.
See Note 4 of Notes to Consolidated Financial Statements included in this Report for further details.Restructuring Costs. Interest Expense. Interest expense represents cash and non-cash interest expense incurred on our Revolving Credit Facility, our 4.625% Senior Notes and our 5.875% Senior Notes, net of capitalized interest. The 5.875% Senior Notes were redeemed on December 18, 2019 (see Note 9 of Notes to Consolidated Financial Statements included in this Report). Interest expense was $24.6 million and $22.7 million for 2019 and 2018, respectively, net of $1.6 million and $1.7 million of interest expense capitalized as part of construction-in-progress, respectively, for both periods.
Other Operating Charges (Income), Net. There were no Other operating charges (income), net, for the year ended December 31, 2021. Other operating charges (income), net, was $0.6 million of income for the year ended December 31, 2020. During the year ended December 31, 2020, we recognized $1.3 million of payroll subsidies received by our subsidiary Kaiser Aluminum Canada Limited under the Canada Emergency Wage Subsidy (“CEWS”) Program, which was partially offset by $0.5 million of
impairment charges related to property, plant and equipment (see Note 1 of Notes to Consolidated Financial Statements included in this Report for details of government grants received).
Interest Expense. Interest expense represents cash and non-cash interest expense incurred on our unsecured senior notes and our Revolving Credit Facility, net of capitalized interest. Interest expense was $49.5 million and $40.9 million for 2021 and 2020, respectively. See Note 9 of Notes to Consolidated Financial Statements included in this Report for a discussion of our debt and credit facilities that were in effect during each of the years 2021 and 2020 and Note 1 of Notes to Consolidated Financial Statements included in this Report for a discussion of our interest expense capitalized as part of construction in progress.
Other Expense, Net. Other expense, net for the year ended December 31, 2021 included a $35.9 million loss on extinguishment of debt related to the redemption of our 6.50% Senior Notes. See Note 9 and Note 13 of Notes to Consolidated Financial Statements included in this Report for details.
Income Tax Provision.
The income tax provision for 2020 was $10.0 million, resulting in an effective tax rate of 25.9%.There was no material difference between the effective tax rate and the projected blended statutory tax rate for 2020.
Selected Operational and Financial Information
The following data should be read in conjunction with our consolidated financial statements and the notes thereto included in Part II, Item 8. "Financial“Financial Statements and Supplementary Data"Data” of this Report.
The following table below provides selected operational and financial information for each period presented (in millions of dollars):
|
| Year Ended December 31, |
| |||||
|
| 2021 |
|
| 2020 |
| ||
Net (loss) income |
| $ | (18.5 | ) |
| $ | 28.8 |
|
Interest expense |
|
| 49.5 |
|
|
| 40.9 |
|
Other expense, net |
|
| 38.9 |
|
|
| 1.4 |
|
Income tax (benefit) provision |
|
| (5.5 | ) |
|
| 10.0 |
|
Depreciation and amortization |
|
| 91.5 |
|
|
| 52.2 |
|
Non-run-rate items: |
|
|
|
|
|
|
|
|
Restructuring (benefit) costs |
|
| (0.8 | ) |
|
| 7.5 |
|
Adjustments to plant-level LIFO1 |
|
| 7.8 |
|
|
| 2.4 |
|
Mark-to-market loss (gain) on derivative instruments2 |
|
| 1.4 |
|
|
| (2.6 | ) |
Workers' compensation cost due to discounting |
|
| — |
|
|
| 1.8 |
|
Non-cash asset impairment charges |
|
| — |
|
|
| 0.5 |
|
Net periodic post retirement service cost relating to Salaried VEBA |
|
| 0.1 |
|
|
| 0.1 |
|
Environmental expenses3 |
|
| 0.2 |
|
|
| 5.3 |
|
Acquisition costs4 |
|
| 28.0 |
|
|
| 5.5 |
|
Total non-run-rate items |
|
| 36.7 |
|
|
| 20.5 |
|
Adjusted EBITDA |
| $ | 192.6 |
|
| $ | 153.8 |
|
Year Ended December 31, | ||||||||
| 2019 | 2018 | |||||||
| Net income | $ | 62.0 | $ | 91.7 | ||||
| Interest expense | 24.6 | 22.7 | ||||||
| Other expense, net | 20.7 | 0.9 | ||||||
| Income tax provision | 18.4 | 28.3 | ||||||
| Depreciation and amortization | 49.1 | 43.9 | ||||||
| Non-run-rate items: | ||||||||
Adjustments to plant-level LIFO1 | 3.4 | (3.1 | ) | |||||
Mark-to-market loss on derivative instruments2 | 5.8 | 17.7 | ||||||
| Workers' compensation cost (benefit) due to discounting | 0.8 | (0.5 | ) | |||||
Goodwill impairment3 | 25.2 | — | ||||||
| Non-cash asset impairment charges | 0.9 | 1.4 | ||||||
| Net periodic post retirement service cost relating to Salaried VEBA | 0.1 | 0.1 | ||||||
Environmental expenses4 | 1.7 | 1.7 | ||||||
| Total non-run-rate items | 37.9 | 17.3 | ||||||
| Adjusted EBITDA | $ | 212.7 | $ | 204.8 | ||||
1. | We manage our business on a monthly last-in, first-out |
2. | Mark-to-market loss (gain) on derivative instruments for |
3. |
| Non-run-rate environmental expenses are related to legacy activities at operating facilities prior to July 6, 2006. See Note 10 of Notes to Consolidated Financial Statements included in this Report for additional information relating to the environmental expenses. |
4. | Acquisition costs are non-run-rate acquisition-related transaction costs, which include professional fees, as well as non‑cash hedging charges recorded in connection with our Warrick acquisition. The results for the year ended December 31, 2020 were adjusted to reflect $5.5 million now classified as Warrick acquisition-related costs. |
Adjusted EBITDA for 20192021 was $7.9$38.8 million higher than Adjusted EBITDA for 2018 due to strong aerospace demand for our products and higher pricing on our non-contract business,2020, which had the benefit of the additional $14.8 million of revenue as discussed in "Net Sales" above,“Net sales” above. Adjusted EBITDA for 2021 reflected the benefit of Packaging and improvement in our Automotive Extrusions and GE products, partially offset by the negative impact associated with: (i) both planned and unplanned downtime at our Trentwood facility during the quarters ended June 30, 2019 and March 31, 2019, respectively; (ii) the General Motors strike in the second half of 2019; and (iii)higher costs and related inefficiencies associated with transitioning our Automotive Extrusions from end-of-life to new program launches, as discussed in "Management Review of 2019“Consolidated Selected Operational and Outlook for the Future"Financial Information” above.
The following table below provides our shipment and VAR information (in millions of dollars, except shipments and VAR per pound) by end market applications for each period presented:applications:
|
| Year Ended December 31, |
| |||||||||||||
|
| 2021 |
|
| 2020 |
| ||||||||||
Aero/HS Products: |
|
|
|
|
|
|
|
|
|
|
|
|
|
|
|
|
Shipments (mmlbs) |
| 161.6 |
|
| 173.3 |
| ||||||||||
|
| $ |
|
| $ / lb |
|
| $ |
|
| $ / lb |
| ||||
Net sales |
| $ | 533.7 |
|
| $ | 3.30 |
|
| $ | 537.9 |
|
| $ | 3.10 |
|
Less: Hedged Cost of Alloyed Metal |
|
| (219.0 | ) |
|
| (1.35 | ) |
|
| (168.6 | ) |
|
| (0.97 | ) |
VAR |
| $ | 314.7 |
|
| $ | 1.95 |
|
| $ | 369.3 |
|
| $ | 2.13 |
|
|
|
|
|
|
|
|
|
|
|
|
|
|
|
|
|
|
Packaging: |
|
|
|
|
|
|
|
|
|
|
|
|
|
|
|
|
Shipments (mmlbs) |
| 541.7 |
|
| — |
| ||||||||||
|
| $ |
|
| $ / lb |
|
| $ |
|
| $ / lb |
| ||||
Net sales |
| $ | 1,119.3 |
|
| $ | 2.07 |
|
| $ | — |
|
| $ | — |
|
Less: Hedged Cost of Alloyed Metal |
|
| (730.0 | ) |
|
| (1.35 | ) |
|
| — |
|
|
| — |
|
VAR |
| $ | 389.3 |
|
| $ | 0.72 |
|
| $ | — |
|
| $ | — |
|
|
|
|
|
|
|
|
|
|
|
|
|
|
|
|
|
|
Automotive Extrusions: |
|
|
|
|
|
|
|
|
|
|
|
|
|
|
|
|
Shipments (mmlbs) |
| 94.0 |
|
| 84.1 |
| ||||||||||
|
| $ |
|
| $ / lb |
|
| $ |
|
| $ / lb |
| ||||
Net sales |
| $ | 225.0 |
|
| $ | 2.39 |
|
| $ | 161.4 |
|
| $ | 1.92 |
|
Less: Hedged Cost of Alloyed Metal |
|
| (128.4 | ) |
|
| (1.36 | ) |
|
| (78.4 | ) |
|
| (0.93 | ) |
VAR |
| $ | 96.6 |
|
| $ | 1.03 |
|
| $ | 83.0 |
|
| $ | 0.99 |
|
|
|
|
|
|
|
|
|
|
|
|
|
|
|
|
|
|
GE Products: |
|
|
|
|
|
|
|
|
|
|
|
|
|
|
|
|
Shipments (mmlbs) |
| 298.2 |
|
| 235.6 |
| ||||||||||
|
| $ |
|
| $ / lb |
|
| $ |
|
| $ / lb |
| ||||
Net sales |
| $ | 706.1 |
|
| $ | 2.37 |
|
| $ | 458.8 |
|
| $ | 1.95 |
|
Less: Hedged Cost of Alloyed Metal |
|
| (409.0 | ) |
|
| (1.37 | ) |
|
| (220.2 | ) |
|
| (0.94 | ) |
VAR |
| $ | 297.1 |
|
| $ | 1.00 |
|
| $ | 238.6 |
|
| $ | 1.01 |
|
|
|
|
|
|
|
|
|
|
|
|
|
|
|
|
|
|
Other Products: |
|
|
|
|
|
|
|
|
|
|
|
|
|
|
|
|
Shipments (mmlbs) |
| 26.1 |
|
| 9.4 |
| ||||||||||
|
| $ |
|
| $ / lb |
|
| $ |
|
| $ / lb |
| ||||
Net sales |
| $ | 37.9 |
|
| $ | 1.45 |
|
| $ | 14.6 |
|
| $ | 1.55 |
|
Less: Hedged Cost of Alloyed Metal |
|
| (24.4 | ) |
|
| (0.93 | ) |
|
| (8.4 | ) |
|
| (0.89 | ) |
VAR |
| $ | 13.5 |
|
| $ | 0.52 |
|
| $ | 6.2 |
|
| $ | 0.66 |
|
|
|
|
|
|
|
|
|
|
|
|
|
|
|
|
|
|
Total: |
|
|
|
|
|
|
|
|
|
|
|
|
|
|
|
|
Shipments (mmlbs) |
| 1,121.6 |
|
| 502.4 |
| ||||||||||
|
| $ |
|
| $ / lb |
|
| $ |
|
| $ / lb |
| ||||
Net sales |
| $ | 2,622.0 |
|
| $ | 2.34 |
|
| $ | 1,172.7 |
|
| $ | 2.33 |
|
Less: Hedged Cost of Alloyed Metal |
|
| (1,510.8 | ) |
|
| (1.35 | ) |
|
| (475.6 | ) |
|
| (0.94 | ) |
VAR |
| $ | 1,111.2 |
|
| $ | 0.99 |
|
| $ | 697.1 |
|
| $ | 1.39 |
|
| Year Ended December 31, | ||||||||||||||||
| 2019 | 2018 | |||||||||||||||
| Aero/HS Products: | ||||||||||||||||
| Shipments (mmlbs) | 273.6 | 248.8 | ||||||||||||||
| $ | $ / lb | $ | $ / lb | |||||||||||||
| Net sales | $ | 803.2 | $ | 2.94 | $ | 739.4 | $ | 2.97 | ||||||||
| Less: Hedged Cost of Alloyed Metal | (292.0 | ) | (1.07 | ) | (284.4 | ) | (1.14 | ) | ||||||||
| VAR | $ | 511.2 | $ | 1.87 | $ | 455.0 | $ | 1.83 | ||||||||
| Automotive Extrusions: | ||||||||||||||||
| Shipments (mmlbs) | 94.3 | 104.4 | ||||||||||||||
| $ | $ / lb | $ | $ / lb | |||||||||||||
| Net sales | $ | 190.5 | $ | 2.02 | $ | 239.3 | $ | 2.29 | ||||||||
| Less: Hedged Cost of Alloyed Metal | (97.2 | ) | (1.03 | ) | (122.6 | ) | (1.17 | ) | ||||||||
| VAR | $ | 93.3 | $ | 0.99 | $ | 116.7 | $ | 1.12 | ||||||||
| GE Products: | ||||||||||||||||
| Shipments (mmlbs) | 236.3 | 266.9 | ||||||||||||||
| $ | $ / lb | $ | $ / lb | |||||||||||||
| Net sales | $ | 480.1 | $ | 2.03 | $ | 546.0 | $ | 2.05 | ||||||||
| Less: Hedged Cost of Alloyed Metal | (248.1 | ) | (1.05 | ) | (313.5 | ) | (1.18 | ) | ||||||||
| VAR | $ | 232.0 | $ | 0.98 | $ | 232.5 | $ | 0.87 | ||||||||
| Other Products: | ||||||||||||||||
| Shipments (mmlbs) | 20.8 | 32.3 | ||||||||||||||
| $ | $ / lb | $ | $ / lb | |||||||||||||
| Net sales | $ | 40.3 | $ | 1.94 | $ | 61.2 | $ | 1.89 | ||||||||
| Less: Hedged Cost of Alloyed Metal | (21.3 | ) | (1.03 | ) | (37.5 | ) | (1.16 | ) | ||||||||
| VAR | $ | 19.0 | $ | 0.91 | $ | 23.7 | $ | 0.73 | ||||||||
| Total: | ||||||||||||||||
| Shipments (mmlbs) | 625.0 | 652.4 | ||||||||||||||
| $ | $ / lb | $ | $ / lb | |||||||||||||
| Net sales | $ | 1,514.1 | $ | 2.42 | $ | 1,585.9 | $ | 2.43 | ||||||||
| Less: Hedged Cost of Alloyed Metal | (658.6 | ) | (1.05 | ) | (758.0 | ) | (1.16 | ) | ||||||||
| VAR | $ | 855.5 | $ | 1.37 | $ | 827.9 | $ | 1.27 | ||||||||
Liquidity and Capital Resources
Summary
The following table summarizes our liquidity as of the periods presented (in millions of dollars):
|
| As of December 31, |
| |||||
|
| 2021 |
|
| 2020 |
| ||
Available cash and cash equivalents |
| $ | 303.2 |
|
| $ | 780.3 |
|
Borrowing availability under Revolving Credit Facility, net of letters of credit1 |
|
| 367.3 |
|
|
| 251.5 |
|
Total liquidity |
| $ | 670.5 |
|
| $ | 1,031.8 |
|
1. | Borrowing availability under the Revolving Credit Facility as determined by a borrowing base calculated as of December 31, 2021 and December 31, 2020. |
| December 31, 2019 | December 31, 2018 | ||||||
| Available cash and cash equivalents | $ | 264.3 | $ | 125.6 | |||
| Short-term investments | 78.7 | 36.7 | |||||
| Borrowing availability under Revolving Credit Facility, net of letters of credit | 352.9 | 292.0 | |||||
| Total liquidity | $ | 695.9 | $ | 454.3 | |||
We place our cash in bank deposits and money market funds with high credit quality financial institutions. Cash equivalents consist primarily of investment-grade commercial paper, money market accounts and investments which, when purchased, have a maturity of 90 days or less. Short-term investments represent holdings in investment-grade commercial paper with a maturity at the time of purchase of greater than 90 days.
See Note 1516 of Notes to Consolidated Financial Statements included in this Report).
We and certain of our subsidiaries have a Revolving Credit Facility with Wells Fargo Bank, National Association, as administrative agent, and the other financial institutions party thereto (see Note 9 of Notes to Consolidated Financial Statements included in this Report). There were no borrowings under our Revolving Credit Facility during the years ending or as of December 31, 20192021 or December 31, 2018.
Cash Flows
The following table summarizes our cash flows from operating, investing and financing activities for each period presented (in millions of dollars):
|
| Year Ended December 31, |
| |||||
|
| 2021 |
|
| 2020 |
| ||
Total cash provided by (used in): |
|
|
|
|
|
|
|
|
Operating activities |
| $ | 79.4 |
|
| $ | 206.9 |
|
Investing activities |
| $ | (665.8 | ) |
| $ | 26.9 |
|
Financing activities |
| $ | 109.1 |
|
| $ | 281.9 |
|
Year Ended December 31, | ||||||||
| 2019 | 2018 | |||||||
| Total cash provided by (used in): | ||||||||
| Operating activities | $ | 232.3 | $ | 150.2 | ||||
| Investing activities | $ | (101.8 | ) | $ | 31.1 | |||
| Financing activities | $ | 8.5 | $ | (106.0 | ) | |||
Cash provided by operating activities for the year ended December 31, 2019 included:2021 reflected results of business activity described within “Consolidated Selected Operational and Financial Information” above, as well as the following working capital changes: (i) a decreasean increase in inventoryaccounts payable of $37.5$112.5 million, to better align with operations;primarily driven by Warrick payables added during the year ended December 31, 2021 and higher metal cost; (ii) a decreasean increase in trade and other receivables of $20.2$90.3 million, primarily driven primarily by improved collection effortsWarrick receivables added during the year ended December 31, 2021 and a lowerthe remainder due to the timing and mix of sales and an increase in metal price;prices; and (iii) an increase in inventory of $43.5 million due primarily to higher inventory pounds to satisfy increased demand, as well as a decrease in accounts payable of $24.5 million driven by reductions in the quantity and price of metal purchases.
Cash provided by operating activities for the year ended December 31, 2018 included:2020 reflected results of business activity for the year ended December 31, 2020, as well as the following working capital changes: (i) an increasea decrease in accounts payable of $29.2 million driven predominantly by the timing of metal purchases and increase in metal price; (ii) a $21.9 million change in other non-cash changes in assets and liabilities due primarily to a $17.7 million unfavorable impact which reflected our adoption of ASU 2017-12 (see Note 1 of Notes to Consolidated Financial Statements included in this Report) as unrealized gain or loss on derivative instruments beginning January 1, 2018 was recognized within Other comprehensive income (loss), net of tax; (iii) an increase in tradeTrade and other receivables of $22.3$60.8 million driven primarily by lower Net sales; (ii) a decrease in Inventories of $25.6 million to better align with operations; and (iii) a reduction in Contract assets of $18.5 million driven primarily by timing and mixvolume of sales with extended terms and an increase in metal price; and (iv) an increase in inventory of $45.0 million due primarilyshipments related to higher inventory pounds to satisfy increased demand.
See Statements of Consolidated Cash Flows included in this Report for further details on our cash flows from operating, investing and financing activities for the years ended December 31, 20192021 and December 31, 2018.
Sources of Liquidity
We believe our available cash and cash equivalents, short-term investments, borrowing availability under the Revolving Credit Facility and funds generated from operations are our most significant sources of liquidity.liquidity, and that our Revolving Credit Facility and unsecured notes
have covenants that allow us to operate our business with limited restrictions and significant flexibility for the foreseeable future. While we believe these sources will be sufficient to finance our working capital requirements, planned capital expenditures, investments, debt service obligations and other cash requirements for at least the next twelve months, and while we also believe that alternative sources of liquidity will remain available in the event we seek to add liquidity for opportunistic or other reasons in the future, our ability to fund such cash requirements will depend upon our future operating performance (which will be affected by prevailing economic conditions) and financial, business and other factors, some of which are beyond our control.
| February 14, 2020 | December 31, 2019 | ||||||
| Revolving Credit Facility borrowing commitment | $ | 375.0 | $ | 375.0 | |||
| Borrowing base availability | $ | 331.1 | $ | 360.9 | |||
| Less: Outstanding borrowings under Revolving Credit Facility | — | — | |||||
| Less: Outstanding letters of credit under Revolving Credit Facility | (8.0 | ) | (8.0 | ) | |||
| Remaining borrowing availability | $ | 323.1 | $ | 352.9 | |||
Borrowing rate (if applicable)1 | 5.00 | % | 5.00 | % | |||
We do not believe that covenants contained in the Revolving Credit Facility are reasonably likely to limit our ability to raise additional debt or equity should we choose to do so during the next 12 months, nor do we believe it is likely that during the next 12 months we will trigger the availability threshold that would require measuring and maintaining a fixed charge coverage ratio.
See Note 9 of Notes to Consolidated Financial Statements included in this Report for a description of our Revolving Credit Facility.
Debt
See Note 9 of Notes to Consolidated Financial Statements included in this Report for further details with respect to the 4.50% Senior Notes and 4.625% Senior Notes due 2028 (“4.625% Senior Notes”) and the redemption of our 5.875%6.50% Senior Notes.
We do not believe that covenants in the indenture governing the 4.50% Senior Notes and 4.625% Senior Notes are reasonably likely to limit our ability to obtain additional debt or equity financing should we choose to do so during the next 12 months.
Capital Expenditures and Investments
We strive to strengthen our competitive position across our end markets through strategic capital investment. Significant investments over the past decade have positioned us well with increased capacity and expanded manufacturing capabilities while more recent capital projects have focused on further enhancing manufacturing cost efficiency, improving product quality and promoting operational security, which we believe are critical to maintaining and strengthening our position in an increasingly competitive market environment.
Our capital investment plans remain focused on supporting demand growth in 2018 and beyond. The remainder ofthrough capacity expansion, sustaining our capital spending for both years was allocated among our manufacturing locations on projects expected to reduce operating costs, improveoperations, enhancing product quality expand capacity or enhance operational security.
Capital investments will be funded using cash generated from operations, available cash and cash equivalents, short-termshort‑term investments, borrowings under the Revolving Credit Facility and/or other third-party financing arrangements. The level of anticipated capital expenditures may be adjusted from time to time depending on our business plans, our price outlook for fabricated aluminum products, our ability to maintain adequate liquidity and other factors. No assurance can be provided as to the timing of any such expenditures or the operational benefits expected therefrom.
Dividends
We have consistently paid a quarterly cash dividend since the second quarter of 2007 to holders of our common stock, including holders of restricted stock, and have increased the dividend in each year since 2011. Nevertheless, as in the past, the future declaration and payment of dividends, if any, will be at the discretion of our Board of Directors and will depend on a number of factors, including our financial and operating results, financial position and anticipated cash requirements and contractual restrictions under our Revolving Credit Facility, the indentureindentures for our 4.50% Senior Notes and 4.625% Senior Notes or other indebtedness we may incur in the future. We can give no assurance that dividends will be declared and paid in the future.
We also pay quarterly dividend equivalents to the holders of certain restricted stock units. Holders of performance shares are not paid a quarterly dividend equivalent, but instead are entitled to receive, in connection with the issuance of underlying shares of common stock for performance shares that ultimately vest, a one-time payment equal to the dividends such holder would have received if the number of such shares of common stock so issued had been held of record by such holder from the date of grant of such performance shares through the date of such issuance.
See our Statements of Consolidated Stockholders'Stockholders’ Equity and Note 18 of Notes to Consolidated Financial Statements included in this Report for information regarding dividends declared during 20192021 and 20182020 and subsequent to December 31, 2019.
Repurchases of Common Stock
We suspended share repurchases as of March 18, 2020. We will continue to assess share repurchases as a part of our capital allocation priorities and strategic investment opportunities identified to support further growth in our business. See our Statements of Consolidated Stockholders'Stockholders’ Equity included in this Report for information regardingregarding: (i) repurchases of common stock in 20192021 and 2018 and2020; (ii) the amounts authorized and available for future repurchases of common stock under our stock repurchase program.
Environmental Commitments and Contingencies
See Note 10 of Notes to Consolidated Financial Statements included in this Report for information regarding our environmental commitments and contingencies.
Contractual Obligations, Commercial Commitments and Off-Balance Sheet Arrangements
The following table and discussion provide a summary ofbelow summarizes our significant contractual obligations, and commercial commitments atand off-balance sheet arrangements as of December 31, 2019 (in millions of dollars):
| Payments Due by Period | ||||||||||||||||||||
| Total | Less than 1 year | 1-3 years | 3-5 years | More than 5 years | ||||||||||||||||
| On-Balance Sheet: | ||||||||||||||||||||
| Principal and interest on 4.625% Senior Notes | 691.1 | 17.7 | 46.2 | 46.2 | 581.0 | |||||||||||||||
| Standby letters of credit | 8.0 | 6.9 | 1.1 | — | — | |||||||||||||||
| Uncertain tax liabilities | 1.2 | — | — | — | — | |||||||||||||||
| Deferred compensation plan liability | 8.1 | — | — | — | — | |||||||||||||||
| Operating leases | 39.3 | 5.4 | 8.4 | 6.8 | 18.7 | |||||||||||||||
| Finance leases | 7.5 | 1.6 | 2.7 | 1.9 | 1.3 | |||||||||||||||
| Salaried VEBA variable contributions | 2.9 | 2.9 | — | — | — | |||||||||||||||
| Off-Balance Sheet: | ||||||||||||||||||||
| VEBA administrative fees | 1.8 | 0.3 | 0.6 | 0.6 | 0.3 | |||||||||||||||
| Purchase obligations | 274.3 | 227.5 | 46.7 | 0.1 | — | |||||||||||||||
| Commitment fees on Revolving Credit Facility | 4.5 | 0.9 | 1.8 | 1.8 | — | |||||||||||||||
| Total contractual obligations | $ | 1,038.7 | $ | 263.2 | $ | 107.5 | $ | 57.4 | $ | 601.3 | ||||||||||
Principal and Interest on 4.50% Senior Notes and 4.625% Senior Notes.
Standby Letters of Credit
.Employer Payroll Tax Deferrals. As of December 31, 2021, we had a remaining $3.8 million in employer payroll tax deferrals to be paid in 2022 under the Coronavirus Aid, Relief and Economic Security Act (“CARES Act”).
Uncertain Tax Liabilities. At December 31, 2019,2021, we had uncertain tax positions which ultimately could result in tax payments. As the amountSee Note 14 of ultimate tax payments beyond 2020 is contingent on the tax authorities' assessment, it is not practicalNotes to present annual paymentConsolidated Financial Statements included in this Report for information regarding further information.
Deferred Compensation Plan Liability
Operating Leases
. OperatingFinance Leases.
Finance leasePension and OPEB. See Note 5 of Notes to Consolidated Financial Statements included in this Report for additional information regarding the future net benefits we expect to pay with respect to our pension plans and our healthcare and life insurance postretirement benefit plan (“OPEB”).
Salaried VEBA Variable Contributions. See Note 5 of Notes to Consolidated Financial Statements included in this Report for additional information regarding our variable cash contributions to the voluntary employees'employees’ beneficiary association ("VEBA"(“VEBA”) that provides benefits for certain eligible retirees and their surviving spouses and eligible dependents ("(“Salaried VEBA"VEBA”).
VEBA administrative fees
. We are required to pay $0.3 million in annual administrative fees related to the VEBA that provides benefits for eligible retirees represented by certain unions and their surviving spouses and eligible dependents through September 2025. See Note 5 of Notes to Consolidated Financial Statements included in this Report for additional information.Purchase Obligations.
Cash outlays for purchase obligations consist primarily of commitments to purchase primary aluminum, recycled scrap aluminum, otherCommitment Fees on Revolving Credit Facility
. Future commitment fees on our Revolving Credit Facility are estimated based on the amount of unused credit under the facility at December 31,In addition to our off-balance sheet items discussed above:
• | See Note 6 of Notes to Consolidated Financial Statements included in this Report for information regarding our participation in multi-employer pension plans. |
• | See Note 7 of Notes to Consolidated Financial Statements included in this Report for information regarding our long-term employee incentive plans. Additional equity awards are expected to be made to employees and non-employee directors in 2022 and future years. |
Critical Accounting Estimates and Policies
Our consolidated financial statements are prepared in accordance with GAAP. In connection with the preparation of our financial statements, we are required to make assumptions and estimates about future events and apply judgments that affect the reported amounts of assets, liabilities, revenue and expenses and the related disclosures. We base our assumptions, estimates and judgments on historical experience, current trends and other factors that management believes to be relevant at the time our consolidated financial statements are prepared. On a regular basis, management reviews the accounting policies, assumptions, estimates and judgments to ensure that our financial statements are presented fairly and in accordance with GAAP. However, because future events and their effects cannot be determined with certainty, actual results could differ from our assumptions and estimates and such differences could be material.
In addition to the accounting estimates we discuss in Note 1 of Notes to Consolidated Financial Statements included in this Report, management believes that the following accounting estimates are critical to aid in fully understanding and evaluating our reported financial results and require management'smanagement’s most difficult, subjective or complex judgments, resulting from the need to make estimates about the effects of matters that are inherently uncertain. Management has reviewed these critical accounting estimates and related disclosures with the Audit Committee of our Board of Directors.
Description | ||||
Judgments and Uncertainties | Potential Effect If Actual Results Differ From Assumptions | |||
Revenue Recognition. | ||||
We decide at the outset of entering into contracts with customers whether our performance obligations as specified in these contracts are satisfied over time or at a point in time. To recognize revenue over time means that we will need to synchronize revenue recognition with progress toward completion of the performance obligation. If we have determined that revenue will be recognized over time for a specific customer order, the earliest point in our production process that we will recognize revenue will be the point that the product cannot be directed to another customer. In most cases, this happens at the time we begin to mold the ingot or billet, either by flat rolling the ingot or by extruding the billet through a die. For custom alloys, we would begin recognizing revenue over time at the point the custom alloy billet is cast. Approximately | We follow the input method of recognizing revenue over time. Under this approach, revenue is recognized on products in production based on the cost incurred to date plus a reasonable margin. Cost incurred to date is based on resources consumed, labor hours expended and other costs incurred relative to the total inputs expected in order to satisfy a performance obligation. Reasonable margins are estimated using an average margin of the respective production facility producing the product. For purposes of recognizing revenue over time on products that are in | Although we believe that the judgments and estimates around recognizing revenue over time discussed herein are reasonable, actual results could differ and we may be exposed to losses or gains that could be material. A change in our estimated average margins by 5% would have had an impact of approximately |
Description | ||||
Judgments and Uncertainties | Potential Effect If Actual Results Differ From Assumptions | |||
Income Tax. | ||||
We have tax attributes available to offset the impact of future income taxes. We have a process for determining the need for a valuation allowance with respect to these attributes. The process includes an extensive review of both positive and negative evidence including our earnings history, future earnings, adverse recent occurrences, carryforward periods, an assessment of the industry and the impact of the timing differences. We expect to record a full statutory tax provision in future periods and, therefore, the benefit of any tax attributes realized will only affect future balance sheets and statements of cash flows. Financial statements for interim periods include an income tax provision based on the effective tax rate expected to be incurred in the current year. | Inherent within the completion of our assessment of the need for a valuation allowance, we make significant judgments and estimates with respect to future operating results, timing of the reversal of deferred tax assets and current market and industry factors. In order to determine the effective tax rate to apply to interim periods, estimates and judgments are made (by taxable jurisdiction) as to the amount of taxable income that may be generated, the availability of deductions and credits expected and the availability of net operating loss carryforwards or other tax attributes to offset taxable income. Making such estimates and judgments is subject to inherent uncertainties given the difficulty of predicting future tax rates, market conditions, customer requirements, the cost for key inputs such as energy and primary aluminum, overall operating efficiency and other factors. However, if, among other things: (i) actual results vary from our forecasts due to one or more of the factors cited above or elsewhere in this Report; (ii) income is distributed differently than expected among tax jurisdictions; (iii) one or more material events or transactions occur which were not contemplated; or (iv) certain expected deductions, credits or carryforwards are not available, it is possible that the effective tax rate for a year could vary materially from the assessments used to prepare the interim consolidated financial statements. See Note | Although we believe that the judgments and estimates discussed herein are reasonable, actual results could differ and we may be exposed to losses or gains that could be material. A change in our effective tax rate by 1% would have had an impact of approximately | ||
| 2021. |
Description | ||||
Judgments and Uncertainties | Potential Effect If Actual Results Differ From Assumptions | |||
Acquisitions, Goodwill and Intangible Assets. | ||||
We account for acquisitions using the acquisition method of accounting, which requires the assets acquired and liabilities assumed to be recorded at the date of acquisition at their respective estimated fair values. We recognize goodwill as of the acquisition date as the excess over the fair values of the identifiable net assets acquired. Goodwill is tested for impairment on an annual basis as well as on an interim basis as events and changes in circumstances occur. Definite-lived intangible assets acquired are amortized over the estimated useful lives of the respective assets, to reflect the pattern in which the economic benefits of the intangible assets are consumed. In the event the pattern cannot be reliably determined, we use a straight-line amortization method. Whenever events or changes in circumstances indicate that the carrying amount of the intangible assets may not be recoverable, the intangible assets will be reviewed for impairment. | The judgments made in determining the estimated fair value assigned to each class of assets acquired and liabilities assumed, as well as asset lives, can significantly impact our results of operations. Fair values and useful lives of intangible assets are determined using the income approach valuation methodology, which is based on, among other factors, the expected future period of benefit of the asset, the various characteristics of the asset, long‑term forecasts of the business, projected cash flows and the rate used in discounting those cash flows. As the determination of an | We do not believe there is a reasonable likelihood that there will be a material change in the estimates or assumptions we use to estimate the fair value of goodwill and intangible assets. Additionally, as of December 31, |
Description | Judgments and Uncertainties | Potential Effect If Actual Results Differ From Assumptions | ||
Pension and Other Postretirement Benefits. | ||||
Liabilities and expenses for pension and other postretirement benefits are determined using actuarial methodologies and incorporate significant assumptions, including the interest rate used to discount the future estimated liability, the expected long-term rate of return (“LTRR”) on plan assets and several assumptions relating to the employee workforce (salary increases, health care cost trend rates, retirement age and mortality). The most significant assumptions used in determining the estimated year-end obligations include the assumed discount rate and the LTRR. In addition to the above assumptions used in the actuarial valuations, changes in plan provisions could also have a material impact on the net funded status of our pensions and other postretirement benefits. Additionally, our obligation to the Salaried VEBA is to pay an annual variable contribution amount based on the level of our cash flow. The funding status of the Salaried VEBA has no impact on our annual variable contribution amount. We have no control over any aspect of the plan. We rely on information provided to us by the Salaried VEBA administrator with respect to specific plan provisions such as annual benefits expected to be paid. See Note 5 of Notes to Consolidated Financial Statements included in this | ||||
| Report for additional information on our benefit plans. | Since the recorded obligation represents the present value of expected postretirement benefit payments over the life of the plans, decreases in the discount rate (used to compute the present value of the payments) would cause the estimated obligation to increase. Conversely, an increase in the discount rate would cause the estimated present value of the obligation to decline. | The impact on the combined pension and other postretirement liabilities of a change in the weighted average discount rate of ¼ of 1% would be approximately $5.1 million as of December 31, 2021 and either a charge or credit of approximately $0.5 million to pretax earnings in 2022. A change in the assumption for the weighted average expected long-term rate of return on plan assets of ¼ of 1% would impact pretax earnings by approximately $0.4 million for 2022. |
New Accounting Pronouncements
For a discussion of all recently adopted and recently issued but not yet adopted accounting pronouncements, see Note 1 of Notes to Consolidated Financial Statements included in this Report.
Item 7A.
Quantitative and Qualitative Disclosures About Market RiskThe following quantitative and qualitative disclosures about market risk should be read in conjunction with Note 8 and Note 11 of Notes to Consolidated Financial Statements included in this Report. Our operating results are sensitive to changes in the prices of primary aluminum, certain alloying metals, natural gas, electricity and electricity,foreign currency, and also depend to a significant degree upon the volume and mix of products sold to customers. As discussed more fully in Note 8 of Notes to Consolidated Financial Statements included in this Report, weWe have historically utilized hedging transactions to lock in a specified price or range of prices for certain products which we sell or consume in our production process, and to mitigate our exposure to changes in energy prices.
Aluminum
In 2021 and third-party hedging instruments.
Based on the aluminum derivative positions held by us to hedge firm-price customer sales agreements, we estimate that a $0.10 per pound decrease in the London Metal Exchange ("LME"(“LME”) market price of aluminum as of December 31, 20192021 and December 31, 2018,2020, with all other variables held constant, would have resulted in an unrealized mark-to-market loss of $10.4$8.0 million and $13.8$6.7 million, respectively, with corresponding changes to the net fair value of our aluminum derivative positions. Additionally, we estimate that a $0.01$0.05 per pound decrease in the Midwest premium for aluminum as of December 31, 20192021 and December 31, 2018,2020, with all other variables held constant, would have resulted in an unrealized mark-to-market loss of $0.9$4.0 million and $1.0$3.3 million, respectively, with corresponding changes to the net fair value of our aluminum derivative positions.
Alloying Metals
We are exposed to the risk of fluctuating prices of certain alloying metals, especially copper, zinc and zinc,magnesium, to the extent that changes in their prices do not highly correlate with price changes for aluminum. Copper, zinc, magnesium and certain other metals are used in our remelt operations to cast rolling ingot and extrusion billet with the proper chemistry for our products. From time to time, we enter into forward contract swaps and/or physical delivery commitments with third parties to mitigate our risk from fluctuations in the prices of copper and zinc ("Alloying Metals").these alloys. As of December 31, 2019,2021, we had forward swap contracts with settlement dates designed to align with the timing of scheduled purchases of Alloying Metalszinc and copper by our manufacturing facilities. See Note 8 of Notes to Consolidated Financial Statements included in this Report for additional information relating to these hedges. We estimate that a $0.10 per pound decrease in the LME market price of zinc as of December 31, 20192021 and December 31, 2018,2020, with all other variables held constant, would have resulted in an unrealized mark-to-market loss of $1.0$0.4 million and $0.6$0.3 million, respectively, with corresponding changes to the net fair value of our Alloying Metals hedges.zinc-related derivative positions. We estimate that a $0.10 per pound decrease in the Commodity Exchange, Inc.COMEX market price of copper, as of December 31, 2019 and December 31, 2018, with all other variables held constant, would have resulted in an unrealized mark-to-market loss of $0.6$0.2 million and $0.3 million as of December 31, 2021 and December 31, 2020, respectively, with corresponding changes to the net fair value of our Alloying Metals hedges.
Energy
We are exposed to risk of fluctuating prices for natural gas and electricity. We, from time to time, in the ordinary course of business, enter into hedging transactions and/or physical delivery commitments with firm prices with third parties to mitigate our risk from fluctuations in natural gas and electricity prices. See Note 8 of Notes to Consolidated Financial Statements included in this Report for information regarding the volume of our derivative and physical delivery commitments with energy companies in place to cover our exposure to fluctuations in natural gas and electricity prices as of December 31, 2019.
We estimate that a $1.00 per mmbtu decrease in natural gas prices as of December 31, 2019 and December 31, 2018 would have resulted in an unrealized mark-to-market loss of $8.6$5.2 million and $4.0$6.6 million as of December 31, 2021 and December 31, 2020, respectively, with corresponding changes to the net fair value of our natural gas derivative positions. We estimate that a $5.00 per Mwh decrease in electricity prices as of December 31, 20192021 and December 31, 2018,2020, would have resulted in an unrealized mark-to-market loss of $2.4$1.1 millionand $1.1$2.4 million, respectively, with corresponding changes to the net fair value of our electricity derivative positions.
Foreign Currency
As of December 31, 2021, we hedged certain lease transactions denominated in euros using forward swap contracts with settlement dates through March 2023. We estimate that a 10% decrease in the December 31, 2021 exchange rate of euros to US dollars would have resulted in an immaterial unrealized mark-to-market loss with corresponding changes to the net fair value of our foreign currency derivative positions.
Our primary foreign exchange exposure is the operating costs of our London, Ontario facility. We estimate that a 10% change in the Canadian dollar exchange rate as of December 31, 20192021 and December 31, 20182020 would have resulted in an annual operating cost impact of $1.8 $2.2million and $1.9$1.7 million, respectively.respectively
KAISER ALUMINUM CORPORATION AND SUBSIDIARY COMPANIES
Item 8.
Financial Statements and Supplementary DataReport of Independent Registered Public Accounting Firm (PCAOB ID:34) | 46 |
50 | |
51 | |
52 | |
Statements of Consolidated | 53 |
54 | |
55 |
REPORT OF INDEPENDENT REGISTERED PUBLIC ACCOUNTING FIRM
To the Stockholders and the Board of Directors of
Kaiser Aluminum Corporation
Foothill Ranch, California
Opinions on the Consolidated Financial Statements and Internal Control over Financial Reporting
We have audited the accompanying consolidated balance sheets of Kaiser Aluminum Corporation and Subsidiary Companiessubsidiaries (the “Company”) as of December 31, 20192021 and 2018,2020, the related consolidated statements of (loss) income, comprehensive (loss) income, stockholders’ equity, and cash flows for each of the three years in the period ended December 31, 2019,2021, and the related notes (collectively referred to as the “consolidated financial“financial statements”). We also have audited the Company’s internal control over financial reporting as of December 31, 2019,2021, based on criteria established in
In our opinion, the consolidated financial statements referred to above present fairly, in all material respects, the financial position of the Company as of December 31, 20192021 and 2018,2020, and the results of its operations and its cash flows for each of the three years in the period ended December 31, 2019,2021, in conformity with accounting principles generally accepted in the United States of America. Also, in our opinion, the Company maintained, in all material respects, effective internal control over financial reporting as of December 31, 2019,2021, based on criteria established in
As described in Accounting Principle
Basis for Opinions
The Company’s management is responsible for these consolidated financial statements, for maintaining effective internal control over financial reporting, and for its assessment of the effectiveness of internal control over financial reporting, included in the accompanying Management’s Annual Report on Internal Control Over Financial Reporting. Our responsibility is to express an opinion on these consolidated financial statements and an opinion on the Company’s internal control over financial reporting based on our audits. We are a public accounting firm registered with the Public Company Accounting Oversight Board (United States) (PCAOB) and are required to be independent with respect to the Company in accordance with the U.S. federal securities laws and the applicable rules and regulations of the Securities and Exchange Commission and the PCAOB.
We conducted our audits in accordance with the standards of the PCAOB. Those standards require that we plan and perform the audits to obtain reasonable assurance about whether the consolidated financial statements are free of material misstatement, whether due to error or fraud, and whether effective internal control over financial reporting was maintained in all material respects.
Our audits of the consolidated financial statements included performing procedures to assess the risks of material misstatement of the consolidated financial statements, whether due to error or fraud, and performing procedures to respond to those risks. Such procedures included examining, on a test basis, evidence regarding the amounts and disclosures in the consolidated financial statements. Our audits also included evaluating the accounting principles used and significant estimates made by management, as well as evaluating the overall presentation of the consolidated financial statements. Our audit of internal control over financial reporting included obtaining an understanding of internal control over financial reporting, assessing the risk that a material weakness exists, and testing and evaluating the design and operating effectiveness of internal control based on the assessed risk. Our audits also included performing such other procedures as we considered necessary in the circumstances. We believe that our audits provide a reasonable basis for our opinions.
Definition and Limitations of Internal Control over Financial Reporting
A company’s internal control over financial reporting is a process designed to provide reasonable assurance regarding the reliability of financial reporting and the preparation of consolidated financial statements for external purposes in accordance
REPORT OF INDEPENDENT REGISTERED PUBLIC ACCOUNTING FIRM (CONTINUED)
prevention or timely detection of unauthorized acquisition, use, or disposition of the company’s assets that could have a material effect on the consolidated financial statements.
Because of its inherent limitations, internal control over financial reporting may not prevent or detect misstatements. Also, projections of any evaluation of effectiveness to future periods are subject to the risk that controls may become inadequate because of changes in conditions, or that the degree of compliance with the policies or procedures may deteriorate.
Critical Audit Matters
The critical audit matters communicated below are matters arising from the current-period audit of the consolidated financial statements that were communicated or required to be communicated to the audit committee and that (1) relate to accounts or disclosures that are material to the consolidated financial statements and (2) involved our especially challenging, subjective, or complex judgments. The communication of critical audit matters does not alter in any way our opinion on the consolidated financial statements, taken as a whole, and we are not, by communicating the critical audit matters below, providing separate opinions on the critical audit matters or on the accounts or disclosures to which they relate.
Revenue Recognition–Recognition—Refer to Note 1 to the consolidated financial statements
Critical Audit Matter Description
The Company recognizes revenue as it fulfills their performance obligations and transfers control of products to its customers. For products that have no alternative use and for which the Company has an enforceable right to payment (including a reasonable profit) throughout the production process, revenue is recognized over time. In general, a majority of the Company’s revenue for Aero/HS products and Automotive Extrusions are recognized over time, with the revenue for the remainder of its products recognized at a point in time. For contracts recognized over time, control transfer occurs incrementally during the Company’s production process as progress is made on fulfilling the performance obligation. The Company uses the input method of determining the progress, capturing direct costs beginning at the point that billet or cast ingot is introduced into production at either the extrusion phase or the rolling phase, respectively. For products in production, the Company recognizes revenue using the cost incurred to date plus an estimate of reasonable margin. As of December 31, 2019,2021, net sales were $1,514.1$2,622.0 million, of which $647.2$554.1 million was recognized over time.
Given the volume of contracts that are recognized over time and the complexity of the determination of over time revenue, we identified revenue for over time contracts as a critical audit matter.
How the Critical Audit Matter Was Addressed in the Audit
Our audit procedures related to revenue recognized over time, included the following, among others:
• | We tested management’s controls over revenue recognized over time, including those over cost incurred to date and estimates of reasonable margin. |
• | We tested the mathematical accuracy of management’s calculation of revenue recognized over time. |
• | We selected a sample of contracts with customers and performed the following: |
o | We evaluated whether the contracts were properly included in management’s calculation of revenue recognized over time based on the terms and conditions of each contract. |
o | We tested that control transfer occurred as progress was made toward fulfilling the performance obligation. |
• | |
We evaluated the estimates of reasonable margin by developing a range of independent estimates and comparing our estimates to those used by management. |
• | We evaluated management’s ability to accurately estimate reasonable margins by comparing actual margins to management’s historical estimates. |
Environmental Contingencies–Contingencies—Refer to Notes 1 and 10 to the consolidated financial statements
Critical Audit Matter Description
The Company is subject to a number of environmental laws and regulations, to potential fines or penalties assessed for alleged breaches of such laws and regulations and to potential claims based upon such laws and regulations. The Company records an environmental loss contingency whenever a contingency is probable and reasonably estimable.
REPORT OF INDEPENDENT REGISTERED PUBLIC ACCOUNTING FIRM (CONTINUED)
$16.8 million accrual for expected environmental costs is included in other accrued liabilities and long-term liabilities and represents the Company’s undiscounted estimate of costs reasonably expected to be incurred based on presently enacted laws and regulations, existing requirements, currently available facts, existing technology and its assessment of the likely remediation actions to be taken.
We identified environmental contingencies as a critical audit matter because auditing management’s estimate of the costs reasonably expected to be incurred for environmental contingencies involved especially subjective judgment and an increased extent of audit procedures, including the need to involve environmental specialists.
How the Critical Audit Matter Was Addressed in the Audit
Our audit procedures related to management’s estimate of the costs reasonably expected to be incurred for environmental contingencies included the following, among others:
• | We tested management’s controls over environmental contingencies, including controls over the estimates of costs expected to be incurred. |
• | We evaluated management’s ability to accurately estimate the costs expected to be incurred by comparing actual costs incurred to historical estimates. |
• | With the assistance of our environmental specialists, we evaluated the reasonableness of management’s estimates of costs reasonably expected to be incurred by comparing the estimates to: |
o | Information obtained directly from the Company’s external environmental specialists. |
o | Communications and feasibility studies the Company received from its regulators and other environmental associations, including Washington State Department of Ecology and Ohio Environmental Protection Agency. |
o | Information obtained directly from public domain searches. |
o | Actual costs incurred to date and the progress of management’s remediation activities. |
Business Combinations, Goodwill and Tool Co. (“IMT”) Reporting Unit–Intangible Assets — Refer to Notes 1 and 4 to the consolidated financial statements
Critical Audit Matter Description
On March 31, 2021, the Company acquired Alcoa Warrick LLC and certain assets comprising the aluminum casting and rolling mill facility located in Warrick County, Indiana (collectively, “Warrick”) for the purchase price of goodwill for impairment involves the comparison of the fair value of each reporting unit to its carrying value.$670.0 million. The Company usedaccounted for the market approachacquisitions under the acquisition method of accounting for business combinations. Accordingly, the purchase price was allocated to the assets acquired and discounted cash flow model to estimateliabilities assumed based on their respective fair value, which requires management to make significant estimatesvalues, resulting in intangible assets of $50.0 million and assumptions related to discount rates and forecastsgoodwill of future revenues and operating margins. Changes in these assumptions could have a significant impact on either the fair value, the amount of any goodwill impairment charge, or both. During the fourth quarter of fiscal 2019, the Company determined that$20.5 million. Management estimated the fair value of the IMT reporting unit, acquiredintangible assets using the income approach valuation methodology, which was based on September 19, 2018, was lower than its carrying value, which resulted in a write-offthe Company’s best estimates of the total $25.2 million goodwill balance forexpected future period of benefit of the year ended December 31, 2019.
We identified the assumptions related to estimating the amount and timing of expected future cash flows and discount rates to be a critical audit matter given the inherent judgment involved in estimating these amounts. Performing audit procedures to evaluate the reasonableness of management’sthese estimates and assumptions related to the selection of the discount rate and forecasts of future revenue and operating margins of IMT required a high degree of auditor judgment and an increased extent of effort, including the need to involve our fair value specialists.
How the Critical Audit Matter Was Addressed in the Audit
Our audit procedures applied to the amount and timing of expected future cash flows and the selection of the discount rate and forecasts of future revenue and operating margins used by management to estimate the fair value of IMTrates for intangibles included the following, among others:
• | We tested the effectiveness of controls over the valuation of intangibles, including management’s controls over the amount and timing of expected future cash flows and the selection of discount rates. |
REPORT OF INDEPENDENT REGISTERED PUBLIC ACCOUNTING FIRM (CONTINUED)
• | We assessed the reasonableness of management’s forecasts of future cash flows by performing inquiries of appropriate individuals outside of the finance organization, comparing the projections to historical results, contractual agreements, certain peer companies, third-party industry forecasts, and internal communications to management and board of directors. |
• | With the assistance of our fair value specialists, we evaluated the reasonableness of (1) the valuation methodology and (2) the discount rates utilized, including testing the source information underlying the determination of the discount rates, testing the mathematical accuracy of the calculation, and developing a range of independent estimates and comparing those to the discount rates selected by management. |
• | We evaluated whether the estimated future cash flows were consistent with evidence obtained in other areas of the audit. |
/s/ Deloitte & Touche LLP
Costa Mesa, California
We have served as the Company'sCompany’s auditor since 2002
KAISER ALUMINUM CORPORATION AND SUBSIDIARY COMPANIES
CONSOLIDATED BALANCE SHEETS
|
| As of December 31, |
| |||||
|
| 2021 |
|
| 2020 |
| ||
|
| (In millions of dollars, except share and per share amounts) |
| |||||
ASSETS |
|
|
|
|
|
|
|
|
Current assets: |
|
|
|
|
|
|
|
|
Cash and cash equivalents |
| $ | 303.2 |
|
| $ | 780.3 |
|
Receivables: |
|
|
|
|
|
|
|
|
Trade receivables, net |
|
| 332.7 |
|
|
| 112.8 |
|
Other |
|
| 53.0 |
|
|
| 11.6 |
|
Contract assets |
|
| 63.2 |
|
|
| 36.1 |
|
Inventories |
|
| 404.6 |
|
|
| 152.0 |
|
Prepaid expenses and other current assets |
|
| 48.7 |
|
|
| 28.6 |
|
Total current assets |
|
| 1,205.4 |
|
|
| 1,121.4 |
|
Property, plant and equipment, net |
|
| 955.2 |
|
|
| 627.2 |
|
Operating lease assets |
|
| 46.2 |
|
|
| 26.5 |
|
Deferred tax assets, net |
|
| 3.4 |
|
|
| — |
|
Intangible assets, net |
|
| 67.7 |
|
|
| 26.7 |
|
Goodwill |
|
| 39.3 |
|
|
| 18.8 |
|
Other assets |
|
| 105.2 |
|
|
| 44.1 |
|
Total |
| $ | 2,422.4 |
|
| $ | 1,864.7 |
|
LIABILITIES AND STOCKHOLDERS’ EQUITY |
|
|
|
|
|
|
|
|
Current liabilities: |
|
|
|
|
|
|
|
|
Accounts payable |
| $ | 351.4 |
|
| $ | 86.1 |
|
Accrued salaries, wages and related expenses |
|
| 46.9 |
|
|
| 30.8 |
|
Other accrued liabilities |
|
| 58.4 |
|
|
| 41.4 |
|
Total current liabilities |
|
| 456.7 |
|
|
| 158.3 |
|
Long-term portion of operating lease liabilities |
|
| 40.8 |
|
|
| 25.6 |
|
Pension and other postretirement benefits |
|
| 92.5 |
|
|
| 1.3 |
|
Net liabilities of Salaried VEBA |
|
| 20.6 |
|
|
| 17.8 |
|
Deferred tax liabilities |
|
| 10.5 |
|
|
| 13.9 |
|
Long-term liabilities |
|
| 72.5 |
|
|
| 77.3 |
|
Long-term debt |
|
| 1,036.3 |
|
|
| 838.1 |
|
Total liabilities |
|
| 1,729.9 |
|
|
| 1,132.3 |
|
Commitments and contingencies – Note 10 |
|
|
|
|
|
|
|
|
Stockholders’ equity: |
|
|
|
|
|
|
|
|
Preferred stock, 5,000,000 shares authorized at both December 31, 2021 and December 31, 2020; 0 shares were issued and outstanding at December 31, 2021 and December 31, 2020 |
|
| — |
|
|
| — |
|
Common stock, par value $0.01, 90,000,000 shares authorized at both December 31, 2021 and December 31, 2020; 22,700,404 shares issued and 15,865,118 shares outstanding at December 31, 2021; 22,647,455 shares issued and 15,812,169 shares outstanding at December 31, 2020 |
|
| 0.2 |
|
|
| 0.2 |
|
Additional paid in capital |
|
| 1,078.9 |
|
|
| 1,068.6 |
|
Retained earnings |
|
| 93.0 |
|
|
| 158.2 |
|
Treasury stock, at cost, 6,835,286 shares at both December 31, 2021 and December 31, 2020 |
|
| (475.9 | ) |
|
| (475.9 | ) |
Accumulated other comprehensive loss |
|
| (3.7 | ) |
|
| (18.7 | ) |
Total stockholders’ equity |
|
| 692.5 |
|
|
| 732.4 |
|
Total |
| $ | 2,422.4 |
|
| $ | 1,864.7 |
|
| December 31, 2019 | December 31, 2018 | |||||||
| (In millions of dollars, except share and per share amounts) | ||||||||
| ASSETS | ||||||||
| Current assets: | ||||||||
| Cash and cash equivalents | $ | 264.3 | $ | 125.6 | ||||
| Short-term investments | 78.7 | 36.7 | ||||||
| Receivables: | ||||||||
| Trade receivables, net | 167.1 | 179.8 | ||||||
| Other | 18.1 | 25.6 | ||||||
| Contract assets | 54.6 | 54.9 | ||||||
| Inventories | 177.6 | 215.1 | ||||||
| Prepaid expenses and other current assets | 19.4 | 18.9 | ||||||
| Total current assets | 779.8 | 656.6 | ||||||
| Property, plant and equipment, net | 622.0 | 611.8 | ||||||
| Operating lease assets | 25.8 | — | ||||||
| Deferred tax assets, net | 11.8 | 35.9 | ||||||
| Intangible assets, net | 29.6 | 32.4 | ||||||
| Goodwill | 18.8 | 44.0 | ||||||
| Other assets | 38.4 | 38.6 | ||||||
| Total | $ | 1,526.2 | $ | 1,419.3 | ||||
| LIABILITIES AND STOCKHOLDERS' EQUITY | ||||||||
| Current liabilities: | ||||||||
| Accounts payable | $ | 92.0 | $ | 121.4 | ||||
| Accrued salaries, wages and related expenses | 34.4 | 40.1 | ||||||
| Other accrued liabilities | 44.0 | 44.0 | ||||||
| Total current liabilities | 170.4 | 205.5 | ||||||
| Long-term portion of operating lease liabilities | 25.2 | — | ||||||
| Net liabilities of Salaried VEBA | 32.6 | 32.4 | ||||||
| Deferred tax liabilities | 4.5 | 4.2 | ||||||
| Long-term liabilities | 67.0 | 66.4 | ||||||
| Long-term debt | 492.6 | 370.4 | ||||||
| Total liabilities | 792.3 | 678.9 | ||||||
| Commitments and contingencies – Note 10 | ||||||||
| Stockholders' equity: | ||||||||
| Preferred stock, 5,000,000 shares authorized at both December 31, 2019 and December 31, 2018; no shares were issued and outstanding at December 31, 2019 and December 31, 2018 | — | — | ||||||
| Common stock, par value $0.01, 90,000,000 shares authorized at both December 31, 2019 and December 31, 2018; 22,550,827 shares issued and 15,868,304 shares outstanding at December 31, 2019; 22,471,705 shares issued and 16,234,603 shares outstanding at December 31, 2018 | 0.2 | 0.2 | ||||||
| Additional paid in capital | 1,062.9 | 1,059.3 | ||||||
| Retained earnings | 172.8 | 150.2 | ||||||
| Treasury stock, at cost, 6,682,523 shares at December 31, 2019 and 6,237,102 shares at December 31, 2018 | (463.4 | ) | (420.5 | ) | ||||
| Accumulated other comprehensive loss | (38.6 | ) | (48.8 | ) | ||||
| Total stockholders' equity | 733.9 | 740.4 | ||||||
| Total | $ | 1,526.2 | $ | 1,419.3 | ||||
The accompanying notes to consolidated financial statements are an integral part of these statements.
KAISER ALUMINUM CORPORATION AND SUBSIDIARY COMPANIES
STATEMENTS OF CONSOLIDATED (LOSS) INCOME
|
| Year Ended December 31, |
| |||||||||
|
| 2021 |
|
| 2020 |
|
| 2019 |
| |||
|
| (In millions of dollars, except share and per share amounts) |
| |||||||||
Net sales |
| $ | 2,622.0 |
|
| $ | 1,172.7 |
|
| $ | 1,514.1 |
|
Costs and expenses: |
|
|
|
|
|
|
|
|
|
|
|
|
Cost of products sold, excluding depreciation and amortization and other items |
|
| 2,348.1 |
|
|
| 941.3 |
|
|
| 1,215.2 |
|
Depreciation and amortization |
|
| 91.5 |
|
|
| 52.2 |
|
|
| 49.1 |
|
Selling, general, administrative, research and development |
|
| 118.8 |
|
|
| 91.2 |
|
|
| 98.0 |
|
Goodwill impairment |
|
| — |
|
|
| — |
|
|
| 25.2 |
|
Restructuring (benefit) costs |
|
| (0.8 | ) |
|
| 7.5 |
|
|
| — |
|
Other operating charges (income), net |
|
| — |
|
|
| (0.6 | ) |
|
| 0.9 |
|
Total costs and expenses |
|
| 2,557.6 |
|
|
| 1,091.6 |
|
|
| 1,388.4 |
|
Operating income |
|
| 64.4 |
|
|
| 81.1 |
|
|
| 125.7 |
|
Other expense: |
|
|
|
|
|
|
|
|
|
|
|
|
Interest expense |
|
| (49.5 | ) |
|
| (40.9 | ) |
|
| (24.6 | ) |
Other expense, net – Notes 9 and 13 |
|
| (38.9 | ) |
|
| (1.4 | ) |
|
| (20.7 | ) |
(Loss) income before income taxes |
|
| (24.0 | ) |
|
| 38.8 |
|
|
| 80.4 |
|
Income tax benefit (provision) |
|
| 5.5 |
|
|
| (10.0 | ) |
|
| (18.4 | ) |
Net (loss) income |
| $ | (18.5 | ) |
| $ | 28.8 |
|
| $ | 62.0 |
|
Net (loss) income per common share: |
|
|
|
|
|
|
|
|
|
|
|
|
Basic |
| $ | (1.17 | ) |
| $ | 1.82 |
|
| $ | 3.88 |
|
Diluted |
| $ | (1.17 | ) |
| $ | 1.81 |
|
| $ | 3.83 |
|
Weighted-average number of common shares outstanding (in thousands): |
|
|
|
|
|
|
|
|
|
|
|
|
Basic |
|
| 15,836 |
|
|
| 15,802 |
|
|
| 15,997 |
|
Diluted |
|
| 15,836 |
|
|
| 15,913 |
|
|
| 16,203 |
|
| Year Ended December 31, | ||||||||||||
| 2019 | 2018 | 2017 | ||||||||||
| (In millions of dollars, except share and per share amounts) | ||||||||||||
| Net sales | $ | 1,514.1 | $ | 1,585.9 | $ | 1,397.5 | ||||||
| Costs and expenses: | ||||||||||||
Cost of products sold, excluding depreciation and amortization and other items1 | 1,215.2 | 1,300.7 | 1,085.9 | |||||||||
| Depreciation and amortization | 49.1 | 43.9 | 39.7 | |||||||||
| Selling, general, administrative, research and development | 98.0 | 96.3 | 97.5 | |||||||||
| Goodwill impairment | 25.2 | — | 18.4 | |||||||||
| Other operating charges, net | 0.9 | 1.4 | 0.8 | |||||||||
| Total costs and expenses | 1,388.4 | 1,442.3 | 1,242.3 | |||||||||
| Operating income | 125.7 | 143.6 | 155.2 | |||||||||
| Other expense: | ||||||||||||
| Interest expense | (24.6 | ) | (22.7 | ) | (22.2 | ) | ||||||
| Other expense, net – Note 12 | (20.7 | ) | (0.9 | ) | — | |||||||
| Income before income taxes | 80.4 | 120.0 | 133.0 | |||||||||
| Income tax provision | (18.4 | ) | (28.3 | ) | (87.6 | ) | ||||||
| Net income | $ | 62.0 | $ | 91.7 | $ | 45.4 | ||||||
| Net income per common share: | ||||||||||||
| Basic | $ | 3.88 | $ | 5.53 | $ | 2.67 | ||||||
| Diluted | $ | 3.83 | $ | 5.43 | $ | 2.63 | ||||||
| Weighted-average number of common shares outstanding (in thousands): | ||||||||||||
| Basic | 15,997 | 16,585 | 16,996 | |||||||||
| Diluted | 16,203 | 16,874 | 17,259 | |||||||||
The accompanying notes to consolidated financial statements are an integral part of these statements.
KAISER ALUMINUM CORPORATION AND SUBSIDIARY COMPANIES
STATEMENTS OF CONSOLIDATED COMPREHENSIVE (LOSS) INCOME
|
| Year Ended December 31, |
| |||||||||
|
| 2021 |
|
| 2020 |
|
| 2019 |
| |||
|
| (In millions of dollars) |
| |||||||||
Net (loss) income |
| $ | (18.5 | ) |
| $ | 28.8 |
|
| $ | 62.0 |
|
Other comprehensive (loss) income, net of tax – Note 11: |
|
|
|
|
|
|
|
|
|
|
|
|
Defined benefit pension plan and Salaried VEBA |
|
| (1.6 | ) |
|
| 13.4 |
|
|
| 2.4 |
|
Available for sale securities |
|
| — |
|
|
| (0.3 | ) |
|
| — |
|
Cash flow hedges |
|
| 16.6 |
|
|
| 6.7 |
|
|
| 7.8 |
|
Foreign currency translation |
|
| — |
|
|
| 0.1 |
|
|
| — |
|
Other comprehensive income, net of tax |
|
| 15.0 |
|
|
| 19.9 |
|
|
| 10.2 |
|
Comprehensive (loss) income |
| $ | (3.5 | ) |
| $ | 48.7 |
|
| $ | 72.2 |
|
| Year Ended December 31, | ||||||||||||
| 2019 | 2018 | 2017 | ||||||||||
| (In millions of dollars) | ||||||||||||
| Net income | $ | 62.0 | $ | 91.7 | $ | 45.4 | ||||||
| Other comprehensive income (loss), net of tax – Note 11: | ||||||||||||
| Defined benefit pension plan and Salaried VEBA | 2.4 | 2.9 | (1.4 | ) | ||||||||
| Available for sale securities | — | (0.6 | ) | 0.5 | ||||||||
| Cash flow hedges | 7.8 | (13.9 | ) | 0.7 | ||||||||
| Foreign currency translation | — | (0.1 | ) | 0.2 | ||||||||
| Other comprehensive income (loss), net of tax | 10.2 | (11.7 | ) | — | ||||||||
| Comprehensive income | $ | 72.2 | $ | 80.0 | $ | 45.4 | ||||||
The accompanying notes to consolidated financial statements are an integral part of these statements.
KAISER ALUMINUM CORPORATION AND SUBSIDIARY COMPANIES
STATEMENTS OF CONSOLIDATED STOCKHOLDERS'STOCKHOLDERS’ EQUITY
|
| Common Shares Outstanding |
|
| Common Stock |
|
| Additional Paid In Capital |
|
| Retained Earnings |
|
| Treasury Stock |
|
| Accumulated Other Comprehensive Loss |
|
| Total |
| |||||||
|
| (In millions of dollars, except share and per share amounts) |
| |||||||||||||||||||||||||
BALANCE, December 31, 2018 |
|
| 16,234,603 |
|
| $ | 0.2 |
|
| $ | 1,059.3 |
|
| $ | 150.2 |
|
| $ | (420.5 | ) |
| $ | (48.8 | ) |
| $ | 740.4 |
|
Net income |
|
| — |
|
|
| — |
|
|
| — |
|
|
| 62.0 |
|
|
| — |
|
|
| — |
|
|
| 62.0 |
|
Other comprehensive income, net of tax |
|
| — |
|
|
| — |
|
|
| — |
|
|
| — |
|
|
| — |
|
|
| 10.2 |
|
|
| 10.2 |
|
Common shares issued (including impacts from Long-Term Incentive programs) |
|
| 137,905 |
|
|
| — |
|
|
| 0.3 |
|
|
| — |
|
|
| — |
|
|
| — |
|
|
| 0.3 |
|
Cancellation of shares to cover employees' tax withholdings upon vesting of non-vested shares |
|
| (58,783 | ) |
|
| — |
|
|
| (6.2 | ) |
|
| — |
|
|
| — |
|
|
| — |
|
|
| (6.2 | ) |
Repurchase of common stock1 |
|
| (445,421 | ) |
|
| — |
|
|
| — |
|
|
| — |
|
|
| (42.9 | ) |
|
| — |
|
|
| (42.9 | ) |
Cash dividends declared2 |
|
| — |
|
|
| — |
|
|
| — |
|
|
| (39.4 | ) |
|
| — |
|
|
| — |
|
|
| (39.4 | ) |
Amortization of unearned equity compensation |
|
| — |
|
|
| — |
|
|
| 9.5 |
|
|
| — |
|
|
| — |
|
|
| — |
|
|
| 9.5 |
|
BALANCE, December 31, 2019 |
|
| 15,868,304 |
|
| $ | 0.2 |
|
| $ | 1,062.9 |
|
| $ | 172.8 |
|
| $ | (463.4 | ) |
| $ | (38.6 | ) |
| $ | 733.9 |
|
Net income |
|
| — |
|
|
| — |
|
|
| — |
|
|
| 28.8 |
|
|
| — |
|
|
| — |
|
|
| 28.8 |
|
Other comprehensive income, net of tax |
|
| — |
|
|
| — |
|
|
| — |
|
|
| — |
|
|
| — |
|
|
| 19.9 |
|
|
| 19.9 |
|
Common shares issued (including impacts from Long-Term Incentive programs) |
|
| 142,173 |
|
|
| — |
|
|
| 0.4 |
|
|
| — |
|
|
| — |
|
|
| — |
|
|
| 0.4 |
|
Cancellation of shares to cover employees' tax withholdings upon vesting of non-vested shares |
|
| (45,545 | ) |
|
| — |
|
|
| (4.3 | ) |
|
| — |
|
|
| — |
|
|
| — |
|
|
| (4.3 | ) |
Repurchase of common stock1 |
|
| (152,763 | ) |
|
| — |
|
|
| — |
|
|
| — |
|
|
| (12.5 | ) |
|
| — |
|
|
| (12.5 | ) |
Cash dividends declared2 |
|
| — |
|
|
| — |
|
|
| — |
|
|
| (43.4 | ) |
|
| — |
|
|
| — |
|
|
| (43.4 | ) |
Amortization of unearned equity compensation |
|
| — |
|
|
| — |
|
|
| 9.6 |
|
|
| — |
|
|
| — |
|
|
| — |
|
|
| 9.6 |
|
BALANCE, December 31, 2020 |
|
| 15,812,169 |
|
| $ | 0.2 |
|
| $ | 1,068.6 |
|
| $ | 158.2 |
|
| $ | (475.9 | ) |
| $ | (18.7 | ) |
| $ | 732.4 |
|
Net loss |
|
| — |
|
|
| — |
|
|
| — |
|
|
| (18.5 | ) |
|
| — |
|
|
| — |
|
|
| (18.5 | ) |
Other comprehensive income, net of tax |
|
| — |
|
|
| — |
|
|
| — |
|
|
| — |
|
|
| — |
|
|
| 15.0 |
|
|
| 15.0 |
|
Common shares issued (including impacts from Long-Term Incentive programs) |
|
| 75,748 |
|
|
| — |
|
|
| 0.3 |
|
|
| — |
|
|
| — |
|
|
| — |
|
|
| 0.3 |
|
Cancellation of shares to cover employees' tax withholdings upon vesting of non-vested shares |
|
| (22,799 | ) |
|
| — |
|
|
| (2.6 | ) |
|
| — |
|
|
| — |
|
|
| — |
|
|
| (2.6 | ) |
Cash dividends declared2 |
|
| — |
|
|
| — |
|
|
| — |
|
|
| (46.7 | ) |
|
| — |
|
|
| — |
|
|
| (46.7 | ) |
Amortization of unearned equity compensation |
|
| — |
|
|
| — |
|
|
| 12.6 |
|
|
| — |
|
|
| — |
|
|
| — |
|
|
| 12.6 |
|
BALANCE, December 31, 2021 |
|
| 15,865,118 |
|
| $ | 0.2 |
|
| $ | 1,078.9 |
|
| $ | 93.0 |
|
| $ | (475.9 | ) |
| $ | (3.7 | ) |
| $ | 692.5 |
|
Common Shares Outstanding | Common Stock | Additional Paid In Capital | Retained Earnings | Treasury Stock | Accumulated Other Comprehensive Loss | Total | |||||||||||||||||||||
| (In millions of dollars, except share and per share amounts) | |||||||||||||||||||||||||||
| BALANCE, December 31, 2016 | 17,651,461 | $ | 0.2 | $ | 1,047.4 | $ | 75.2 | $ | (281.4 | ) | $ | (36.7 | ) | $ | 804.7 | ||||||||||||
| Net income | — | $ | — | $ | — | $ | 45.4 | $ | — | $ | — | $ | 45.4 | ||||||||||||||
| Common shares issued (including impacts from Long-Term Incentive programs) | 117,751 | — | 0.2 | — | — | — | 0.2 | ||||||||||||||||||||
| Cancellation of employee non-vested shares | (451 | ) | — | — | — | — | — | — | |||||||||||||||||||
| Cancellation of shares to cover employees' tax withholdings upon vesting of non-vested shares | (56,495 | ) | — | (4.5 | ) | — | — | — | (4.5 | ) | |||||||||||||||||
| Tax effect of cumulative-effect adjustment related to prior year adoption of ASU 2016-09 | — | — | — | 0.3 | — | — | 0.3 | ||||||||||||||||||||
Repurchase of common stock1 | (938,680 | ) | — | — | — | (77.8 | ) | — | (77.8 | ) | |||||||||||||||||
| Cancellation of treasury stock | — | — | (0.2 | ) | (0.4 | ) | 0.6 | — | — | ||||||||||||||||||
Cash dividends declared2 | — | — | — | (35.0 | ) | — | — | (35.0 | ) | ||||||||||||||||||
| Amortization of unearned equity compensation | — | — | 13.0 | — | — | — | 13.0 | ||||||||||||||||||||
| BALANCE, December 31, 2017 | 16,773,586 | $ | 0.2 | $ | 1,055.9 | $ | 85.5 | $ | (358.6 | ) | $ | (36.7 | ) | $ | 746.3 | ||||||||||||
Cumulative-effect adjustment3 | — | — | — | 10.7 | — | (0.4 | ) | 10.3 | |||||||||||||||||||
| BALANCE, January 1, 2018 | 16,773,586 | $ | 0.2 | $ | 1,055.9 | $ | 96.2 | $ | (358.6 | ) | $ | (37.1 | ) | $ | 756.6 | ||||||||||||
| Net income | — | $ | — | $ | — | 91.7 | — | — | 91.7 | ||||||||||||||||||
| Other comprehensive loss, net of tax | — | — | — | — | — | (11.7 | ) | (11.7 | ) | ||||||||||||||||||
| Common shares issued (including impacts from Long-Term Incentive programs) | 146,363 | — | 0.2 | — | — | — | 0.2 | ||||||||||||||||||||
| Cancellation of shares to cover employees' tax withholdings upon vesting of non-vested shares | (68,195 | ) | — | (6.9 | ) | — | — | — | (6.9 | ) | |||||||||||||||||
Repurchase of common stock1 | (617,151 | ) | — | — | — | (61.9 | ) | — | (61.9 | ) | |||||||||||||||||
Cash dividends declared2 | — | — | — | (37.7 | ) | — | — | (37.7 | ) | ||||||||||||||||||
| Amortization of unearned equity compensation | — | — | 10.1 | — | — | — | 10.1 | ||||||||||||||||||||
| BALANCE, December 31, 2018 | 16,234,603 | $ | 0.2 | $ | 1,059.3 | $ | 150.2 | $ | (420.5 | ) | $ | (48.8 | ) | $ | 740.4 | ||||||||||||
| Net income | — | — | — | 62.0 | — | — | 62.0 | ||||||||||||||||||||
| Other comprehensive income, net of tax | — | — | — | — | — | 10.2 | 10.2 | ||||||||||||||||||||
| Common shares issued (including impacts from Long-Term Incentive programs) | 137,905 | — | 0.3 | — | — | — | 0.3 | ||||||||||||||||||||
| Cancellation of shares to cover employees' tax withholdings upon vesting of non-vested shares | (58,783 | ) | — | (6.2 | ) | — | — | — | (6.2 | ) | |||||||||||||||||
Repurchase of common stock1 | (445,421 | ) | — | — | — | (42.9 | ) | — | (42.9 | ) | |||||||||||||||||
Cash dividends declared2 | — | — | — | (39.4 | ) | — | — | (39.4 | ) | ||||||||||||||||||
| Amortization of unearned equity compensation | — | — | 9.5 | — | — | — | 9.5 | ||||||||||||||||||||
| BALANCE, December 31, 2019 | 15,868,304 | $ | 0.2 | $ | 1,062.9 | $ | 172.8 | $ | (463.4 | ) | $ | (38.6 | ) | $ | 733.9 | ||||||||||||
1. | Weighted-average repurchase price (dollars per share) was $81.94 for the |
2. | |
| Dividends declared per common share were $2.88, $2.68 and $2.40 |
The accompanying notes to consolidated financial statements are an integral part of these statements.
KAISER ALUMINUM CORPORATION AND SUBSIDIARY COMPANIES
STATEMENTS OF CONSOLIDATED CASH FLOWS
|
| Year Ended December 31, |
| |||||||||
|
| 2021 |
|
| 2020 |
|
| 2019 |
| |||
|
| (In millions of dollars) |
| |||||||||
Cash flows from operating activities: |
|
|
|
|
|
|
|
|
|
|
|
|
Net (loss) income |
| $ | (18.5 | ) |
| $ | 28.8 |
|
| $ | 62.0 |
|
Adjustments to reconcile net (loss) income to net cash provided by operating activities: |
|
|
|
|
|
|
|
|
|
|
|
|
Depreciation of property, plant and equipment |
|
| 82.5 |
|
|
| 49.3 |
|
|
| 46.3 |
|
Amortization of definite-lived intangible assets |
|
| 9.0 |
|
|
| 2.9 |
|
|
| 2.8 |
|
Amortization of debt premium and debt issuance costs |
|
| 2.1 |
|
|
| 2.0 |
|
|
| 1.2 |
|
Deferred income taxes |
|
| (11.4 | ) |
|
| 15.2 |
|
|
| 21.1 |
|
Non-cash equity compensation |
|
| 12.9 |
|
|
| 10.0 |
|
|
| 9.8 |
|
Non-cash asset impairment charges |
|
| — |
|
|
| 0.5 |
|
|
| 26.1 |
|
Loss on extinguishment of debt |
|
| 35.9 |
|
|
| — |
|
|
| 20.3 |
|
(Gain) loss on disposition of property, plant and equipment |
|
| (0.5 | ) |
|
| 0.2 |
|
|
| — |
|
Loss (gain) on disposition of short-term investments |
|
| — |
|
|
| (0.7 | ) |
|
| (0.9 | ) |
Non-cash defined benefit net periodic postretirement benefit cost |
|
| 9.4 |
|
|
| 5.2 |
|
|
| 7.0 |
|
Changes in operating assets and liabilities, net of effects of acquisition: |
|
|
|
|
|
|
|
|
|
|
|
|
Trade and other receivables |
|
| (90.3 | ) |
|
| 60.8 |
|
|
| 20.2 |
|
Contract assets |
|
| (27.1 | ) |
|
| 18.5 |
|
|
| 0.3 |
|
Inventories |
|
| (43.5 | ) |
|
| 25.6 |
|
|
| 37.5 |
|
Prepaid expenses and other current assets |
|
| (0.9 | ) |
|
| (6.8 | ) |
|
| 4.2 |
|
Accounts payable |
|
| 112.5 |
|
|
| (5.9 | ) |
|
| (24.5 | ) |
Accrued liabilities |
|
| 17.3 |
|
|
| (0.6 | ) |
|
| (5.0 | ) |
Annual variable cash contributions to Salaried VEBA |
|
| (1.7 | ) |
|
| (2.9 | ) |
|
| (2.1 | ) |
Long-term assets and liabilities, net |
|
| (8.3 | ) |
|
| 4.8 |
|
|
| 6.0 |
|
Net cash provided by operating activities |
|
| 79.4 |
|
|
| 206.9 |
|
|
| 232.3 |
|
Cash flows from investing activities1: |
|
|
|
|
|
|
|
|
|
|
|
|
Capital expenditures |
|
| (58.0 | ) |
|
| (51.9 | ) |
|
| (60.2 | ) |
Purchase of short-term investments |
|
| — |
|
|
| (39.1 | ) |
|
| (132.2 | ) |
Purchase of equity securities |
|
| (0.4 | ) |
|
| (0.5 | ) |
|
| (0.7 | ) |
Proceeds from disposition of short-term investments |
|
| — |
|
|
| 118.1 |
|
|
| 91.1 |
|
Cash payment for acquisition of Warrick, net of cash received – Note 4 |
|
| (609.2 | ) |
|
| — |
|
|
| — |
|
Proceeds from disposal of property, plant and equipment |
|
| 1.8 |
|
|
| 0.3 |
|
|
| 0.2 |
|
Net cash (used in) provided by investing activities |
|
| (665.8 | ) |
|
| 26.9 |
|
|
| (101.8 | ) |
Cash flows from financing activities1: |
|
|
|
|
|
|
|
|
|
|
|
|
Repayment of principal and redemption premium of 6.50% Senior Notes |
|
| (380.9 | ) |
|
| — |
|
|
| — |
|
Repayment of principal and redemption premium of 5.875% Senior Notes |
|
| — |
|
|
| — |
|
|
| (391.5 | ) |
Issuance of 4.50% Senior Notes |
|
| 550.0 |
|
|
| — |
|
|
| — |
|
Issuance of 4.625% Senior Notes |
|
| — |
|
|
| — |
|
|
| 500.0 |
|
Issuance of 6.50% Senior Notes |
|
| — |
|
|
| 350.0 |
|
|
| — |
|
Cash paid for debt issuance costs |
|
| (8.6 | ) |
|
| (6.2 | ) |
|
| (8.8 | ) |
Repayment of finance lease |
|
| (2.1 | ) |
|
| (1.7 | ) |
|
| (1.4 | ) |
Cancellation of shares to cover employees' tax withholdings upon vesting of non-vested shares |
|
| (2.6 | ) |
|
| (4.3 | ) |
|
| (6.2 | ) |
Repurchase of common stock |
|
| — |
|
|
| (12.5 | ) |
|
| (44.2 | ) |
Cash dividends and dividend equivalents paid |
|
| (46.7 | ) |
|
| (43.4 | ) |
|
| (39.4 | ) |
Net cash provided by financing activities |
|
| 109.1 |
|
|
| 281.9 |
|
|
| 8.5 |
|
Net (decrease) increase in cash, cash equivalents and restricted cash during the period |
|
| (477.3 | ) |
|
| 515.7 |
|
|
| 139.0 |
|
Cash, cash equivalents and restricted cash at beginning of period |
|
| 794.3 |
|
|
| 278.6 |
|
|
| 139.6 |
|
Cash, cash equivalents and restricted cash at end of period |
| $ | 317.0 |
|
| $ | 794.3 |
|
| $ | 278.6 |
|
1 | See Note 16 for supplemental disclosure of cash flow information. |
| Year Ended December 31, | ||||||||||||
| 2019 | 2018 | 2017 | ||||||||||
| (In millions of dollars) | ||||||||||||
| Cash flows from operating activities: | ||||||||||||
| Net income | $ | 62.0 | $ | 91.7 | $ | 45.4 | ||||||
| Adjustments to reconcile net income to net cash provided by operating activities: | ||||||||||||
| Depreciation of property, plant and equipment | 46.3 | 42.1 | 38.3 | |||||||||
| Amortization of definite-lived intangible assets | 2.8 | 1.8 | 1.4 | |||||||||
| Amortization of debt discount and debt issuance costs | 1.2 | 1.0 | 1.2 | |||||||||
| Deferred income taxes | 21.1 | 36.7 | 89.0 | |||||||||
| Non-cash equity compensation | 9.8 | 10.3 | 13.3 | |||||||||
| Non-cash asset impairment charges | 26.1 | 1.4 | 19.2 | |||||||||
| Loss on extinguishment of debt | 20.3 | — | — | |||||||||
| Gain on disposition of property, plant and equipment | — | (0.2 | ) | (0.5 | ) | |||||||
| Gain on disposition of short-term investments | (0.9 | ) | (2.9 | ) | (2.3 | ) | ||||||
| Non-cash defined benefit net periodic postretirement benefit cost | 7.0 | 6.6 | 4.8 | |||||||||
| Other non-cash changes in assets and liabilities | 8.6 | 21.9 | (15.5 | ) | ||||||||
| Changes in operating assets and liabilities: | ||||||||||||
| Trade and other receivables | 20.2 | (22.3 | ) | (30.9 | ) | |||||||
| Contract assets | 0.3 | 0.7 | — | |||||||||
| Inventories | 37.5 | (45.0 | ) | (6.3 | ) | |||||||
| Prepaid expenses and other current assets | (1.7 | ) | (0.4 | ) | (1.7 | ) | ||||||
| Accounts payable | (24.5 | ) | 29.2 | 13.0 | ||||||||
| Accrued liabilities | (7.5 | ) | (2.6 | ) | (4.7 | ) | ||||||
| Annual variable cash contributions to VEBAs | (2.1 | ) | (15.7 | ) | (20.0 | ) | ||||||
| Long-term assets and liabilities, net | 5.8 | (4.1 | ) | (2.2 | ) | |||||||
| Net cash provided by operating activities | 232.3 | 150.2 | 141.5 | |||||||||
Cash flows from investing activities1: | ||||||||||||
| Capital expenditures | (60.2 | ) | (74.1 | ) | (75.5 | ) | ||||||
| Purchase of short-term investments | (132.2 | ) | (135.2 | ) | (247.5 | ) | ||||||
| Purchase of equity securities | (0.7 | ) | (0.9 | ) | — | |||||||
| Proceeds from disposition of short-term investments | 91.1 | 283.9 | 296.9 | |||||||||
| Cash payment for acquisition of Imperial Machine & Tool Co., net of cash received | — | (43.2 | ) | — | ||||||||
| Proceeds from disposal of property, plant and equipment | 0.2 | 0.6 | 0.6 | |||||||||
| Net cash (used in) provided by investing activities | (101.8 | ) | 31.1 | (25.5 | ) | |||||||
Cash flows from financing activities1: | ||||||||||||
| Repayment of principal and redemption premium of 5.875% Senior Notes | (391.5 | ) | — | — | ||||||||
| Issuance of 4.625% Senior Notes | 500.0 | — | — | |||||||||
| Cash paid for debt issuance costs | (8.8 | ) | — | — | ||||||||
| Repayment of finance lease | (1.4 | ) | (0.7 | ) | (0.4 | ) | ||||||
| Cancellation of shares to cover employees' tax withholdings upon vesting of non-vested shares | (6.2 | ) | (6.9 | ) | (4.5 | ) | ||||||
| Repurchase of common stock | (44.2 | ) | (60.7 | ) | (79.5 | ) | ||||||
| Cash dividends and dividend equivalents paid | (39.4 | ) | (37.7 | ) | (35.0 | ) | ||||||
| Net cash provided by (used in) financing activities | 8.5 | (106.0 | ) | (119.4 | ) | |||||||
| Net increase (decrease) in cash, cash equivalents and restricted cash during the period | 139.0 | 75.3 | (3.4 | ) | ||||||||
| Cash, cash equivalents and restricted cash at beginning of period | 139.6 | 64.3 | 67.7 | |||||||||
| Cash, cash equivalents and restricted cash at end of period | $ | 278.6 | $ | 139.6 | $ | 64.3 | ||||||
The accompanying notes to consolidated financial statements are an integral part of these statements.
54
KAISER ALUMINUM CORPORATION AND SUBSIDIARY COMPANIES
NOTES TO CONSOLIDATED FINANCIAL STATEMENTS
NOTES INDEX
56 | |||
62 | |||
62 | |||
63 | |||
66 | |||
71 | |||
72 | |||
Derivatives, Hedging Programs and Other Financial Instruments | 75 | ||
78 | |||
81 | |||
84 | |||
85 | |||
Note 13 | 85 | ||
Note 14 | Income Tax Matters | 86 | |
Note 15 | Net (Loss) Income Per Share | 88 | |
Note 16 | Supplemental Cash Flow Information | 89 | |
Note 17 | Business, Product and Geographical Area Information and Concentration of Risk | 89 | |
90 | |||
55
KAISER ALUMINUM CORPORATION AND SUBSIDIARY COMPANIES
NOTES TO CONSOLIDATED FINANCIAL STATEMENTS
1. Summary of Significant Accounting Policies
In this Annual Report on Form 10-K (this "Report"“Report”), unless the context otherwise requires, references in these notes to consolidated financial statements to "Kaiser“Kaiser Aluminum Corporation," "we," "us," "our," "the Company"” “Kaiser,” “we,” “us,” “our,” “the Company” and "our Company"“our Company” refer collectively to Kaiser Aluminum Corporation and its subsidiaries.
Organization and Nature of Operations.
Kaiser Aluminum Corporation specializes in the production of semi-fabricated specialty aluminum mill products, such as aluminum plate and sheet, bare and coated coil and extruded and drawn products, for the following end market applications: (i) aerospace and high strengthPrinciples of Consolidation and Basis of Presentation.
Use of Estimates in the Preparation of Financial Statements.
The preparation of financial statements in accordance with GAAP requires the use of estimates and assumptions that affect the reported amounts of assets and liabilities, disclosure of contingent assets and liabilities known to exist as of the date the financial statements are published and the reported amounts of revenues and expenses during the reporting period. Uncertainties with respect to such estimates and assumptions are inherent in the preparation of our consolidated financial statements; accordingly, it is possible that the actual results could differ from these estimates and assumptions, which could have a material effect on the reported amounts of our consolidated financial position and results of operations. The severity, magnitude and duration, as well as the economic consequences of the Coronavirus Disease 2019 (“COVID-19”) pandemic, are uncertain, rapidly changing and difficult to predict. Therefore, our accounting estimates and assumptions may change over time in response to the COVID-19 pandemic and may change materially in future periods.Supply Chain Financing. Upon our acquisition of Warrick (as defined in Note 4 below), we became party to several supply chain financing arrangements, in which we may sell certain of our customers’ trade accounts receivable to such customers’ financial institutions without recourse. We sell our undivided interests in certain of these receivables at our discretion when we determine that the cost of these arrangements is less than the cost of servicing our receivables with existing debt. Under the terms of the agreements, we retain no rights or interest, have no obligations with respect to the sold receivables and do not service the receivables after the sale. As such, these transactions are being accounted for as a sale. During 2021, we sold trade accounts receivable totaling $1,102.8 million, related to these supply chain financing arrangements, of which our customers’ financial institutions applied discount fees totaling $6.2 million. To the extent discount fees related to the sale of trade accounts receivable under supply chain financing arrangements are not reimbursed by our customers, they are included in Other expense, net. As of December 31, 2021, we had been and/or expected to be fully reimbursed by our customers for these discount fees.
Fair Value Measurements. We apply the fair value hierarchy established by GAAP for the recognition and measurement of certain financial assets and liabilities. An asset or liability'sliability’s fair value classification within the hierarchy is determined based on the lowest level input that is significant to the fair value measurement. In determining fair value, we utilize valuation techniques that maximize the use of observable inputs and minimize the use of unobservable inputs to the extent possible and consider counterparty risk in our assessment of fair value.
Financial assets and liabilities that we measure at fair value each period include our derivative instruments and equity investments related to our deferred compensation plan and debt investment securities classified as available for sale securities (see Note 5 and Note 8). Prior to our adoption of Accounting Standards Update ("ASU") No. 2016-01, Financial Instruments - Overall (Subtopic 825-10): Recognition and Measurement of Financial Assets and Financial Liabilities ("ASU 2016-01"), equity investments related to our deferred compensation plan were accounted for as available for sale securities. Subsequent to our adoption of ASU 2016-01 on January 1, 2018, changes in the fair value of these equity investments are recorded within Other expense, net (see Note 5 and Note 12). Additionally, we measure at fair value once each year at December 31 the plan assets of our Canadian defined benefit pension plan and the plan assets ofpostretirement plans including the Salaried VEBA (defined in Note 5). In determining the fair value of the plan assets at an annual period end, we utilize primarily the results of valuations supplied by the investment advisors responsible for managing the assets of each plan, which we independently review for reasonableness. We record our remaining financial assets and liabilities at carrying value.
Goodwill is tested for impairment during the fourth quarter on an annual basis, as well as on an interim basis, as warranted, at the time of relevant events and changes in circumstances. Intangible asset fair values and useful lives are determined using the income approach valuation methodology, which is based on, among other factors, the expected future period of benefit of the asset, the various characteristics of the asset, long‑term forecasts of the business, market prices, projected cash flows and the rate used in discounting those cash flows. Intangible assets with definite lives are initially recognized at fair value and subsequently amortized over the estimated useful lives to reflect the pattern in which the economic benefits of the intangible assets are consumed. In the event the pattern cannot be reliably determined, we use a straight-line amortization method. Whenever events or changes in circumstances indicate that the carrying amount of the intangible assets may not be recoverable, the intangible assets are reviewed for impairment. See Note 4 for a discussion of our business acquisition in 20182021 and the goodwill impairment charges we recorded during 2019 and 2017.
56
KAISER ALUMINUM CORPORATION AND SUBSIDIARY COMPANIES
NOTES TO CONSOLIDATED FINANCIAL STATEMENTS
For a majority of our remaining non-financial assets and liabilities, which include inventories, debt issuance costs and property, plant and equipment, we are not required to measure their fair value on a recurring basis. However, if certain triggering events occur, an evaluation of the affected non-financial asset or liability will be required, which could result in a reduction to the carrying amount of such asset or liability. See "
Government Grants. From time-to-time, we receive grants from certain governmental agencies such as states and municipalities. We recognize government grants when we have reasonable assurance that we will comply with any conditions attached to the grant and the grant will be received. Government grants related to property, plant and equipment are presented as a reduction to the related asset’s carrying amount. Grants related to compensation for costs already incurred or for immediate financial support, with no future related costs, are recognized as income in the period in which they are receivable. During 2020, our subsidiary Kaiser Aluminum Canada Limited received $1.3 million of payroll subsidies under the Canada Emergency Wage Subsidy Program. These subsidies were recorded within Other operating charges (income), net.
Cash and Cash Equivalents.
We consider only those short-term, highly liquid investments which, when purchased, have maturities of 90 days or less to be cash equivalents. Our cash equivalents consist primarily of funds inRestricted Cash.
We are required to keep on deposit certain amounts that are pledged or held as collateral relating toAvailable for Sale Securities.
WeTrade Receivables and Allowance for Doubtful Accounts.
Inventories.
Inventories are stated at the lower of cost or market value. Finished products, work-in-process and raw material inventories are stated on the last-in, first-outReplacement Parts.
Replacement parts consist of preventative maintenance and capital spare parts, which are stated on the57
KAISER ALUMINUM CORPORATION AND SUBSIDIARY COMPANIES
NOTES TO CONSOLIDATED FINANCIAL STATEMENTS
Property, Plant and Equipment, Net. Property, plant and equipment, net, is recorded at cost and includes construction in progress (see Note 2). Property, plant and equipment acquired in the Warrick acquisition was recorded at fair value as of the date of acquisition (see Note 4). Interest related to the construction of qualifying assets is capitalized as part of the construction costs. The amount of interest expense capitalized as construction in progress was $1.2 million, $1.0 million and $1.6 million $1.7 millionduring 2021, 2020 and $2.2 million during 2019, 2018 and 2017, respectively.
Depreciation is computed using the straight-line method at rates based on the estimated useful lives of the various classes of assets. FinanceDepreciable finance lease assets and leasehold improvements are depreciatedamortized on a straight-line basis over the shorter of the estimated useful lives of the assets or the lease term. The estimated useful lives are as follows:
Range (in years) | ||
Land improvements | 1-25 | |
Buildings and leasehold improvements | 2-45 | |
Machinery and equipment | 1-22 | |
Depreciable finance lease assets | 2-120 |
| Range (in years) | |||
| Land improvements | 3 | - | 25 |
| Buildings and leasehold improvements | 5 | - | 45 |
| Machinery and equipment | 1 | - | 22 |
| Finance lease assets | 2 | - | 15 |
Depreciation expense is not included in Cost of products sold, but is included in Depreciation and amortization.
Property, plant and equipment are reviewed for impairment whenever events or changes in circumstances indicate that the carrying amount of the asset or group of assets may not be recoverable. We regularly assess whether events and circumstances with the potential to trigger impairment have occurred and rely on a number of factors, including operating results, business plans, economic projections and anticipated future cash flow, to make such assessments. We use an estimate of the future undiscounted cash flows of the related asset or asset group over the estimated remaining life of such asset(s) in measuring whether the asset(s) are recoverable.
There were 0 impairment charges recorded in 2021. We recorded impairment charges of $0.5 million and $0.9 million $1.4 millionin 2020 and $0.8 million in 2019, 2018 and 2017, respectively, to reflect the scrap value of idled assets we determined not to deploy for future use. Asset impairment charges are included in Other operating charges (income), net, in theour Statements of Consolidated (Loss) Income.
We classify assets as held for sale only when an asset is being actively marketed and expected to sell within 12 months. Assets held for sale are initially measured at the lesser of the assets'assets’ carrying amount and the fair value less costs to sell.
Cloud Computing Implementation Costs. We defer implementation costs associated with a software hosting arrangement that is a service contract. We recognized $1.1 million and $0.4 million as of December 31, 2021 and December 31, 2020, respectively, within Prepaid expenses and other current assets and $6.7 million and $2.7 million as of December 31, 2021 and December 31, 2020, respectively, within Other assets related to hosted cloud‑computing software for our enterprise resource planning system refresh project. We began amortizing the deferred implementation costs associated with this project in December 2021 and will amortize the development costs within Selling, general, administrative, research and development over nine years. We recorded amortization expense associated with this project of $0.1 million in 2021 and 0 amortization expense in 2020.
Leases. We determine whether an agreement is a lease at inception. We have operating and finance leases for equipment and real estate that primarily have fixed lease payments. For purposes of calculating lease liabilities, options to extend or terminate a lease are included within the lease term when it is reasonably certain that we will exercise such options. Short-term leases with an initial term of 12 months or less are not recorded on our Consolidated Balance Sheets.
As most of our leases do not provide an implicit rate, we use information available at the lease commencement date in determining an incremental borrowing rate when calculating our right-of-use lease assets and liabilities. In determining the inputs to the incremental borrowing rate calculation, we make judgments about the value of the leased asset, our credit rating and the lease term, including the probability of our exercising options to extend or terminate the underlying lease. Additionally, we make judgments around contractual asset substitution rights in determining whether a contract contains a lease.
We have lease agreements with lease and non-lease components, which are generally accounted for separately. These non-lease components include items such as common area maintenance, taxes and insurance for our real estate leases, as well as maintenance charges related to our equipment leases. We have, however, applied the practical expedient within Accounting Standards Update (“ASU”) No. 2016-02, Leases (Topic 842): Amendments to the Financial Accounting Standards Board Accounting Standards Codification (“ASU 2016-02”), to not separate lease and non-lease components to our embedded supply system equipment leases and have therefore accounted for both lease and non‑lease components in determining the lease assets and liabilities.
58
KAISER ALUMINUM CORPORATION AND SUBSIDIARY COMPANIES
NOTES TO CONSOLIDATED FINANCIAL STATEMENTS
Many of our equipment leases contain clauses that require us to return the equipment with certain functionality intact. We account for these costs as residual value guarantees when the guarantee becomes probable of being owed. Our lease agreements do not contain any material restrictive covenants.
Derivative Financial Instruments. Consistent with guidelines established by management and approved by our Board of Directors, we use derivative financial instruments to mitigate our exposure to changes in the market price of aluminum, certain alloying metals, energy and, to a lesser extent, foreign currency exchange rates. We do not use derivative financial instruments for trading or other speculative purposes. Hedging transactions are executed centrally on behalf of all of our operations to minimize transaction costs, monitor consolidated net exposures and allow for increased responsiveness to changes in market factors.
We reflect the fair value of all of our derivative instruments on our Consolidated Balance Sheets (see Note 8).Sheets. The fair value of hedges settling within one year is included in Prepaid expenses and other current assets or Other accrued liabilities. The fair value of hedges settling beyond one year is included in Other assets or Long-term liabilities. Cash flows related to all of our derivative instruments are reported in theour Statements of Consolidated Cash Flows within the same category as the items being hedged.
Self Insurance of Workers'Workers’ Compensation and Employee Healthcare Liabilities
Debt Issuance Costs.
Costs incurred in connection with debt financing are deferred and amortized over the estimated term of the related borrowing. Such amortization is included in Interest expense and may be capitalized as part of construction in progress (see Note 9).Conditional Asset Retirement Obligations (“CAROs"”CAROs"). We have CAROs at several of our manufacturing facilities. Our CAROs can be separated into two primary categories: (i) legal obligations related to the removal and disposal of asbestos and (ii) asset retirement obligations related to future lease terminations. The majority of our CAROs relate to the first category and consist of incremental costs that would be associated with the removal and disposal of asbestos (all of which is believed to be fully contained and encapsulated within walls, floors, roof, piping or equipment insulation) of certain of our older facilities if such facilities were to undergo major renovation or be demolished. We estimate incremental costs for special handling, removal and disposal costs of materials that may or will give rise to CAROs and then discount the expected costs back to the current year using a credit-adjusted, risk-free rate. When it is unclear when or if CAROs will be triggered, we use probability weighting for possible timing scenarios to determine the probability-weighted liability amounts that should be recognized in our consolidated financial statements (see Note 10).
Environmental Contingencies.
With respect to environmental loss contingencies, we record a loss contingency whenever a contingency is probable and reasonably estimable (see Note 10). Accruals for estimated losses from environmental remediation obligations are generally recognized no later than the completion of the remedial feasibility study. Such accruals are adjusted as information develops or circumstances change. Costs of future expenditures for environmental remediation obligations are not discounted to their present value. Accruals for expected environmental costs are included in Other accrued liabilities or Long-term liabilities, as appropriate (see Note 2). Environmental expense relating to continuing operations is included in Cost of products sold excluding depreciation and amortization and other items (“Cost of products sold” or “COGS”) inRevenue Recognition.
WeFor the majority of our business, contracts with customers begin when we acknowledge a purchase order for a specific customer order of product to be delivered in the near term. These purchase orders are short term in nature, although they may reference a longer
59
KAISER ALUMINUM CORPORATION AND SUBSIDIARY COMPANIES
NOTES TO CONSOLIDATED FINANCIAL STATEMENTS
term "blanket“blanket purchase order"order” or a "terms“terms and conditions"conditions” agreement, both of which may span multiple years. For revenue recognized at a point in time, transfer of control usually occurs upon shipment or upon customer receipt of the product, depending on shipping terms. For contracts recognized over time, control transfer occurs incrementally during our production process as progress is made on fulfilling the performance obligation. We use the input method of determining our progress, capturing direct costs beginning at the point that billet or cast ingot is introduced into production at either the extrusion phase or the rolling phase, respectively. We believe the input method more accurately reflects the transfer of control as it represents the best information available of work completed to date for which we have an enforceable right to payment. For products in production, we recognize revenue using estimates of the cost incurred to date plus a reasonable margin. As the duration of our contracts for accounting purposes is typically less than one year, we do not present quantitative information about the aggregate transaction price allocated to unsatisfied performance obligations at the end of the reporting period.
We adjust the amount of revenue recognized on all products, regardless of timing of revenue recognition, for variable price consideration, which could include metal market price adjustments, volume rebates and sales discounts. We estimate rebate and discount values based on forecasted order data and historical payment trends for specific customers, adjusted as necessary at each reporting period. Accounts receivable is recorded when our right to consideration becomes unconditional. Payment terms for a majority of our domestic customers are 30 days after invoice date. To accommodate shipping time to overseas locations, payment terms for foreign customers are typically several weeks longer than domestic terms. As such, we do not adjust the promised amount of consideration for the effects of a significant financing component as we do not expect the period between the transfer of control of products to our customers and receipt of payment will be greater than one year.
Contract assets primarily relate to our enforceable right to consideration for work completed but not billed at the reporting date on contracts for products recognized over time. Contract assets also include amounts related to our contractual right to consideration for finished goods recognized over time that were in transit as of period end.
Incremental Costs of Obtaining a Contract
. We expense the costs of obtaining a contract as incurred as the amortization period of the asset that we otherwise would have recognized is one year or less.Shipping and Handling Activities.
We account for shipping and handling activities that occur after the customer has obtained control of a product as fulfillment activities (i.e., an expense) rather than as a promised service (i.e., a revenue element).Advertising Costs.
Advertising costs, which are included in SG&A and R&D, are expensed as incurred. Advertising costs for 2021, 2020 and 2019Research and Development Costs.
Research and development costs, which are included in SG&A and R&D, are expensed as incurred. Research and development costs for 2021, 2020 and 2019Major Maintenance Activities.
All major maintenance costs are accounted for using the direct expensing method.Stock-Based Compensation.
Stock-based compensation in the form of service-based awards is provided to executive officers, certain employees and non-employee directors and is accounted for at fair value. We measure the cost of services received in exchange for an award of equity instruments based on the grant-date fair value of the award and the number of awards expected to ultimately vest. The grant-date fair value is determined based on the stock price on the date of grant, adjusted for expected dividends or dividend equivalents to be paid during the vesting period.We also grant performance-based awards to executive officers and other key employees. The methodology used to value these performance-based awards is based on the nature of the performance conditions within those awards. Awards that are subject to performance conditions pertaining to total shareholder return (market-based awards) are valued on the date of grant using a Monte Carlo valuation model. The key assumptions in applying this model are an expected volatility and a risk-free interest rate. Awards with certain other performance conditions pertaining to our cost performance and awards with performance conditions pertaining to our economic value added performance(non-market-based awards) are valued based on our stock price at the date of grant. Our non‑market-based awards have performance conditions pertaining to our cost performance and adjusted EBITDA margin performance, which is measured by our adjusted earnings before interest, taxes, depreciation and amortization (“Adjusted EBITDA”) as a percentage of value added revenue. Holders of performance-based awards receive a one-time payment at the time of issuance of vested shares based on the total dividends they would have received if the vested shares had been held of record from the date of grant through the date of issuance. For more information on our stock-based compensation see(see Note 7.
The cost of service-based awards, including time-vested restricted stock and performance shares, is recognized as an expense over the requisite service period of the award on a straight-line basis. Adjustments to expense related to forfeitures are recorded in the period in which they occur. For performance shares with performance conditions pertaining to our cost performance and economic value addedAdjusted EBITDA margin performance, the related expense is updated quarterly by adjusting the estimated number of shares expected to vest based on the most probable outcome of the performance condition (see Note 7).
60
KAISER ALUMINUM CORPORATION AND SUBSIDIARY COMPANIES
NOTES TO CONSOLIDATED FINANCIAL STATEMENTS
Adoption of January 1, 2019, rather than the beginning of the earliest period presented. We elected the package of practical expedients, which permitted us to: (i) not reassess whether any of our contracts contained leases; (ii) carry forward the historical lease classification of our existing leases; and (iii) not reassess initial direct costs for our existing leases. We did not elect to apply the hindsight practical expedient when determining lease term and assessing impairment of right-of-use assets. Due to our adoption of ASC 842, we recorded an operating lease right-of-use asset of $29.0 million, a current operating lease liability of $4.1 million and a long-term operating lease liability of $27.4 million on our Consolidated Balance Sheets as of January 1, 2019. There was 0 cumulative-effect adjustment to Retained earnings required. The standard did not materially impact our consolidated net earnings and had no impact on cash flows. Comparative information in this Report has not been adjusted and continues to be reported under the previous lease accounting rules. See Note 3 for details of the significant changes and quantitative impacts of the changes, as well as other required disclosures related to our adoption of ASC 842.
ASU No. 2019-12,
Simplifying the Accounting for Income TaxesASU No. 2021-08, Business Combinations (Topic 805): Accounting for Contract Assets and Contract Liabilities from Contracts with Customers (“ASU 2021-08”) was issued in October 2021. Under ASU 2021-08, we are required to recognize and measure contract assets and contract liabilities acquired in a business combination in accordance with ASU No. 2014-09, Revenue from Contracts with Customers (Topic 606). We early adopted ASU 2021-08 during the quarter ended December 31, 2021 and applied the amendments retrospectively to the beginning of the year. Our adoption of ASU 2021-08 did not result in a material impact on our consolidated financial statements.
Accounting Pronouncements Issued But Not Yet Adopted
In March 2020, the Financial Accounting Standards Board issued ASU 2020-04, Reference Rate Reform (Topic 848): Facilitation of the Effects of Reference Rate Reform on Financial Reporting (“ASU 2020-04”) and also issued subsequent amendments to the initial guidance (collectively, “Topic 848”). Topic 848 is effective for all entities as of March 12, 2020 through December 31, 2022 and provides optional guidance for contract modifications and certain hedging relationships associated with the transition from reference rates that are expected to be discontinued. We will adopt Topic 848 when our relevant contracts are modified upon transition to alternative reference rates. We do not expect our adoption of Topic 848 to have a material impact on our consolidated financial statements.
ASU No. 2021-10, Government Assistance (Topic 832): Disclosures by Business Entities about Government Assistance (“ASU 2021-10”) was issued in November 2021. Under ASU 2021-10, the accounting entities with transactions with a government that are accounted for by analogy to a grant or contribution accounting model are required to annually disclose certain information regarding the transaction including: (i) nature and related accounting policy used; (ii) line items on the balance sheet and income statement affected by the transactions; (iii) amounts applicable to each line item; and (iv) significant terms and conditions. We are currently in the process of evaluating the impact of adopting ASU 2019-12 in 2021,2021-10 using a prospective approach, but do not expect it to have a material impact on our consolidated financial statements.
| December 31, 2019 | December 31, 2018 | |||||||
| (In millions of dollars) | ||||||||
| Cash and Cash Equivalents | ||||||||
| Cash and money market funds | $ | 28.2 | $ | 22.9 | ||||
| Commercial paper | 236.1 | 102.7 | ||||||
| Total | $ | 264.3 | $ | 125.6 | ||||
61
KAISER ALUMINUM CORPORATION AND SUBSIDIARY COMPANIES
NOTES TO CONSOLIDATED FINANCIAL STATEMENTS
2. Supplemental Balance Sheet Information
|
| As of December 31, |
| |||||
|
| 2021 |
|
| 2020 |
| ||
|
| (In millions of dollars) |
| |||||
Trade Receivables, net |
|
|
|
|
|
|
|
|
Billed trade receivables |
| $ | 333.5 |
|
| $ | 113.6 |
|
Allowance for doubtful receivables |
|
| (0.8 | ) |
|
| (0.8 | ) |
Trade receivables, net |
| $ | 332.7 |
|
| $ | 112.8 |
|
|
|
|
|
|
|
|
|
|
Inventories |
|
|
|
|
|
|
|
|
Finished products |
| $ | 90.3 |
|
| $ | 37.2 |
|
Work-in-process |
|
| 162.2 |
|
|
| 46.0 |
|
Raw materials |
|
| 143.0 |
|
|
| 62.3 |
|
Operating supplies |
|
| 9.1 |
|
|
| 6.5 |
|
Total |
| $ | 404.6 |
|
| $ | 152.0 |
|
|
|
|
|
|
|
|
|
|
Property, Plant and Equipment, net |
|
|
|
|
|
|
|
|
Land and improvements |
| $ | 26.0 |
|
| $ | 21.5 |
|
Buildings and leasehold improvements |
|
| 179.0 |
|
|
| 117.2 |
|
Machinery and equipment |
|
| 1,151.5 |
|
|
| 847.4 |
|
Construction in progress1 |
|
| 75.3 |
|
|
| 37.8 |
|
Property, plant and equipment, gross |
|
| 1,431.8 |
|
|
| 1,023.9 |
|
Accumulated depreciation and amortization |
|
| (480.4 | ) |
|
| (398.4 | ) |
Assets held for sale |
|
| 3.8 |
|
|
| 1.7 |
|
Property, plant and equipment, net |
| $ | 955.2 |
|
| $ | 627.2 |
|
|
|
|
|
|
|
|
|
|
Other Accrued Liabilities |
|
|
|
|
|
|
|
|
Uncleared cash disbursements |
| $ | 10.9 |
|
| $ | 2.1 |
|
Accrued income taxes and other taxes payable |
|
| 9.5 |
|
|
| 5.2 |
|
Accrued annual contribution to Salaried VEBA – Note 5 |
|
| — |
|
|
| 1.7 |
|
Accrued interest |
|
| 9.9 |
|
|
| 11.6 |
|
Short-term environmental accrual – Note 10 |
|
| 2.6 |
|
|
| 3.7 |
|
Other – Note 3 and Note 8 |
|
| 25.5 |
|
|
| 17.1 |
|
Total |
| $ | 58.4 |
|
| $ | 41.4 |
|
|
|
|
|
|
|
|
|
|
Long-Term Liabilities |
|
|
|
|
|
|
|
|
Workers' compensation accruals |
| $ | 31.9 |
|
| $ | 30.6 |
|
Long-term environmental accrual – Note 10 |
|
| 14.2 |
|
|
| 15.1 |
|
Other long-term liabilities |
|
| 26.4 |
|
|
| 31.6 |
|
Total |
| $ | 72.5 |
|
| $ | 77.3 |
|
1 | Based on market conditions, we temporarily idled projects within Construction in progress totaling $24.9 million and $20.0 million as of December 31, 2021 and December 31, 2020, respectively, all of which are expected to resume at a future date. |
| December 31, 2019 | December 31, 2018 | |||||||
| (In millions of dollars) | ||||||||
| Trade Receivables, net | ||||||||
| Billed trade receivables | $ | 168.5 | $ | 179.5 | ||||
| Unbilled trade receivables | — | 1.1 | ||||||
| Trade receivables, gross | 168.5 | 180.6 | ||||||
| Allowance for doubtful receivables | (1.4 | ) | (0.8 | ) | ||||
| Trade receivables, net | $ | 167.1 | $ | 179.8 | ||||
| Inventories | ||||||||
| Finished products | $ | 42.6 | $ | 48.0 | ||||
| Work-in-process | 63.5 | 85.6 | ||||||
| Raw materials | 65.0 | 75.0 | ||||||
| Operating supplies | 6.5 | 6.5 | ||||||
| Total | $ | 177.6 | $ | 215.1 | ||||
| Property, Plant and Equipment, net | ||||||||
| Land and improvements | $ | 21.4 | $ | 21.4 | ||||
| Buildings and leasehold improvements | 104.5 | 97.0 | ||||||
| Machinery and equipment | 813.5 | 755.6 | ||||||
| Construction in progress | 33.2 | 43.6 | ||||||
| Property, plant and equipment, gross | 972.6 | 917.6 | ||||||
| Accumulated depreciation | (352.2 | ) | (307.4 | ) | ||||
| Assets held for sale | 1.6 | 1.6 | ||||||
| Property, plant and equipment, net | $ | 622.0 | $ | 611.8 | ||||
| Other Accrued Liabilities | ||||||||
| Uncleared cash disbursements | $ | 4.2 | $ | 4.8 | ||||
| Accrued income taxes and other taxes payable | 6.2 | 6.5 | ||||||
| Accrued annual contribution to VEBAs – Note 5 | 2.9 | 2.1 | ||||||
| Accrued interest | 2.3 | 2.9 | ||||||
| Short-term environmental accrual – Note 10 | 5.5 | 2.6 | ||||||
| Other – Note 3 and Note 8 | 22.9 | 25.1 | ||||||
| Total | $ | 44.0 | $ | 44.0 | ||||
| Long-Term Liabilities | ||||||||
| Workers' compensation accruals | $ | 27.7 | $ | 24.6 | ||||
| Long-term environmental accrual – Note 10 | 11.5 | 14.3 | ||||||
| Other long-term liabilities | 27.8 | 27.5 | ||||||
| Total | $ | 67.0 | $ | 66.4 | ||||
3. Leases
Our leases have remaining lease terms of approximately one to 1460 years, some of which may include options to extend the lease for up to 2060 years, and some of which may include options to terminate the
The following table presents lease terms and discount rates as of December 31, 2019:2021:
|
| Finance Leases |
|
| Operating Leases |
| ||
Weighted-average lease term (in years) |
|
| 26.1 |
|
|
| 7.4 |
|
Weighted-average discount rate |
|
| 3.4 | % |
|
| 3.8 | % |
| Finance Leases | Operating Leases | |||||
| Weighted-average lease term (in years): | 5.8 | 10.4 | ||||
| Weighted-average discount rate: | 4.5 | % | 5.8 | % | ||
62
KAISER ALUMINUM CORPORATION AND SUBSIDIARY COMPANIES
NOTES TO CONSOLIDATED FINANCIAL STATEMENTS
The following table summarizes the classification of lease assets and lease liabilities on our Consolidated Balance Sheet as of the period presentedSheets (in millions of dollars):
|
|
| As of December 31, |
| ||||||||||||
| Leases | Classification | December 31, 2019 |
| Classification |
| 2021 |
|
| 2020 |
| ||||||
| Assets |
|
|
|
|
|
|
|
|
|
| ||||||
| Operating lease assets | Operating lease assets | $ | 25.8 |
| Operating lease assets |
| $ | 46.2 |
|
| $ | 26.5 |
| |||
| Finance lease assets | Property, plant and equipment, net | 6.6 |
| Property, plant and equipment, net |
|
| 8.2 |
|
|
| 8.1 |
| ||||
| Total lease assets | $ | 32.4 |
|
|
| $ | 54.4 |
|
| $ | 34.6 |
| ||||
| Liabilities |
|
|
|
|
|
|
|
|
|
| ||||||
| Current: |
|
|
|
|
|
|
|
|
|
| ||||||
| Operating lease liabilities | Other accrued liabilities | $ | 3.9 |
| Other accrued liabilities |
| $ | 9.0 |
|
| $ | 4.4 |
| |||
| Finance lease liabilities | Other accrued liabilities | 1.2 |
| Other accrued liabilities |
|
| 2.1 |
|
|
| 1.9 |
| ||||
| Non-current: |
|
|
|
|
|
|
|
|
|
| ||||||
| Operating lease liabilities | Long-term portion of operating lease liabilities | 25.2 |
| Long-term portion of operating lease liabilities |
|
| 40.8 |
|
|
| 25.6 |
| ||||
| Finance lease liabilities | Long-term liabilities | 5.4 |
| Long-term liabilities |
|
| 6.1 |
|
|
| 6.2 |
| ||||
| Total lease liabilities | $ | 35.7 |
|
|
| $ | 58.0 |
|
| $ | 38.1 |
| ||||
The following table summarizes the components of lease cost on our Statements of Consolidated (Loss) Income for the period presented (in millions of dollars):
|
| Year Ended December 31, |
| |||||||||
|
| 2021 |
|
| 2020 |
|
| 2019 |
| |||
Operating lease cost |
| $ | 11.0 |
|
| $ | 6.8 |
|
| $ | 7.5 |
|
Short-term lease cost |
|
| 3.2 |
|
|
| 1.6 |
|
|
| 1.2 |
|
Finance lease cost: |
|
|
|
|
|
|
|
|
|
|
|
|
Amortization of leased assets |
|
| 2.1 |
|
|
| 1.6 |
|
|
| 1.5 |
|
Interest on lease liabilities |
|
| 0.3 |
|
|
| 0.3 |
|
|
| 0.3 |
|
Total lease cost |
| $ | 16.6 |
|
| $ | 10.3 |
|
| $ | 10.5 |
|
| Lease Cost | December 31, 2019 | |||
| Operating lease cost | $ | 7.5 | ||
| Short-term lease cost | 1.2 | |||
| Finance lease cost: | ||||
| Amortization of leased assets | 1.5 | |||
| Interest on lease liabilities | 0.3 | |||
| Total lease cost | $ | 10.5 | ||
The following table presents the maturity of our lease liabilities as of December 31, 20192021 (in millions of dollars):
|
| Finance Leases |
|
| Operating Leases |
| ||
2022 |
| $ | 2.3 |
|
| $ | 9.4 |
|
2023 |
|
| 2.0 |
|
|
| 9.8 |
|
2024 |
|
| 1.4 |
|
|
| 9.1 |
|
2025 |
|
| 1.0 |
|
|
| 5.9 |
|
2026 |
|
| 0.7 |
|
|
| 4.0 |
|
Thereafter |
|
| 5.7 |
|
|
| 20.7 |
|
Total minimum lease payments |
| $ | 13.1 |
|
| $ | 58.9 |
|
Less: interest |
|
| (4.9 | ) |
|
| (9.1 | ) |
Present value |
| $ | 8.2 |
|
| $ | 49.8 |
|
| Maturity of Lease Liabilities | Finance Leases | Operating Leases | ||||||
| 2020 | $ | 1.6 | $ | 5.4 | ||||
| 2021 | 1.4 | 4.6 | ||||||
| 2022 | 1.3 | 3.8 | ||||||
| 2023 | 1.2 | 3.5 | ||||||
| 2024 | 0.7 | 3.3 | ||||||
| 2025 and thereafter | 1.3 | 18.7 | ||||||
| Total minimum lease payments | $ | 7.5 | $ | 39.3 | ||||
| Less: interest | (0.9 | ) | (10.2 | ) | ||||
| Present value | $ | 6.6 | $ | 29.1 | ||||
| Year Ended December 31, | Finance Leases | Operating Leases | ||||||
| 2019 | $ | 1.7 | $ | 6.1 | ||||
| 2020 | 1.4 | 3.7 | ||||||
| 2021 | 1.2 | 2.8 | ||||||
| 2022 | 1.1 | 2.4 | ||||||
| 2023 | 1.0 | 2.2 | ||||||
| 2024 and thereafter | 1.8 | 20.8 | ||||||
| Total minimum lease payments | $ | 8.2 | $ | 38.0 | ||||
| Less: interest | (1.2 | ) | ||||||
Present value1 | $ | 7.0 | ||||||
4. Business Combinations, Goodwill and Intangible Assets
Warrick Rolling Mill Acquisition. On September 19,March 31, 2021, we acquired Alcoa Warrick LLC and certain assets comprising the aluminum casting and rolling mill facility located in Warrick County, Indiana (collectively, “Warrick”) for a purchase price of $670.0 million. Warrick is a leading producer of bare and coated aluminum coil used for can stock applications in the beverage and food packaging industry in North America. The transaction provides us with non-cyclical end market diversification and re-entry into the packaging end market. Acquisition-related costs incurred and expensed during the years ended December 31, 2021 and December 31, 2020 were $16.7 million and $5.5 million, respectively,primarily related to professional fees and included within SG&A and R&D.
63
KAISER ALUMINUM CORPORATION AND SUBSIDIARY COMPANIES
NOTES TO CONSOLIDATED FINANCIAL STATEMENTS
The following table presents the purchase consideration to allocate (in millions of dollars):
Contract purchase price |
| $ | 670.0 |
|
Working capital adjustment |
|
| 31.0 |
|
Initial outstanding indebtedness – Other postretirement benefits liabilities |
|
| (83.5 | ) |
Cash paid at acquisition close on March 31, 2021 |
|
| 617.5 |
|
Estimated post-close adjustments |
|
| (12.7 | ) |
Preliminary purchase consideration to allocate |
|
| 604.8 |
|
Revision to estimated post-close adjustments |
|
| 4.4 |
|
Final purchase consideration to allocate |
| $ | 609.2 |
|
We accounted for the acquisition using the acquisition method of accounting, which requires the assets acquired and liabilities assumed to be recorded at the date of acquisition at their respective estimated fair values. We prepared the purchase consideration as of the acquisition date based on our understanding of the fair value of the acquired assets and assumed liabilities. During the year ended December 31, 2021, we finalized the valuation and completed the purchase price allocation, which included the adjustments listed below. The following table summarizes the finalized fair values of assets acquired and liabilities assumed (in millions of dollars):
|
| Initial Allocation |
|
| Adjustments |
|
| Final Allocation |
| |||
Trade receivables |
| $ | 162.4 |
|
| $ | (2.4 | ) |
| $ | 160.0 |
|
Other receivables |
|
| 6.2 |
|
|
| 4.8 |
|
|
| 11.0 |
|
Inventories |
|
| 209.0 |
|
|
| 0.1 |
|
|
| 209.1 |
|
Prepaid expenses and other current assets |
|
| — |
|
|
| 0.3 |
|
|
| 0.3 |
|
Property, plant and equipment |
|
| 385.4 |
|
|
| (41.7 | ) |
|
| 343.7 |
|
Operating lease assets |
|
| 12.3 |
|
|
| — |
|
|
| 12.3 |
|
Intangible assets |
|
| 56.5 |
|
|
| (6.5 | ) |
|
| 50.0 |
|
Goodwill1 |
|
| 27.4 |
|
|
| (6.9 | ) |
|
| 20.5 |
|
Other Assets2 |
|
| — |
|
|
| 56.8 |
|
|
| 56.8 |
|
Accounts payable |
|
| (143.0 | ) |
|
| (0.2 | ) |
|
| (143.2 | ) |
Accrued salaries, wages and related expenses |
|
| (5.9 | ) |
|
| (1.0 | ) |
|
| (6.9 | ) |
Other accrued liabilities |
|
| (11.5 | ) |
|
| 0.9 |
|
|
| (10.6 | ) |
Long-term portion of operating lease liabilities |
|
| (8.7 | ) |
|
| — |
|
|
| (8.7 | ) |
Pension and other postretirement benefits |
|
| (83.7 | ) |
|
| 0.2 |
|
|
| (83.5 | ) |
Long-term liabilities |
|
| (1.6 | ) |
|
| — |
|
|
| (1.6 | ) |
Total allocated purchase consideration |
| $ | 604.8 |
|
| $ | 4.4 |
|
| $ | 609.2 |
|
1 | Goodwill is primarily attributable to the assembled workforce and is expected to be deductible for income tax purposes. |
2 | Other assets represents assets to be purchased or constructed by Alcoa Corporation (“Alcoa”) following the close of the acquisition and subsequently conveyed to us in connection with separating the rolling mill from the other businesses retained by Alcoa. |
For the period from April 1, 2021 through December 31, 2021, Warrick contributed $1,141.2 million of net sales from continuing operations included in our Statements of Consolidated (Loss) Income for the year ended December 31, 2021. Net (loss) income for the nine months ended December 31, 2021 is not provided as the Warrick results have been fully integrated and discrete financial information cannot be obtained without unreasonable effort.
The following unaudited pro forma financial information presents results assuming Warrick had been acquired on January 1, 2020. The unaudited pro forma information includes adjustments and consequential tax effects related to: (i) amortization and depreciation for intangible assets and property, plant and equipment acquired; (ii) the effects of certain reclassifications and conforming accounting policies; and (iii) acquisition-related transaction costs. The unaudited pro forma information presented below is for informational purposes only and is not necessarily indicative of our consolidated results of operations of the consolidated business had the acquisition occurred at the beginning of fiscal year 2020 or of the results of our future operations of the consolidated business.
|
| Year Ended December 31, |
| |||||
|
| 2021 |
|
| 2020 |
| ||
Net sales |
| $ | 2,936.8 |
|
| $ | 2,256.3 |
|
Net income (loss) |
| $ | 0.8 |
|
| $ | (35.7 | ) |
64
KAISER ALUMINUM CORPORATION AND SUBSIDIARY COMPANIES
NOTES TO CONSOLIDATED FINANCIAL STATEMENTS
The Warrick rolling mill has historically purchased molten aluminum and electrical power from Alcoa’s smelter and power plant in Warrick County, Indiana. Alcoa’s Warrick smelter historically sold the molten aluminum to the Warrick rolling mill at smelter cost and electrical power from Alcoa’s power plant at negotiated prices between the parties.
As part of the acquisition of Warrick, we negotiated pricing for molten aluminum and electrical power with Alcoa at alternative rates which more closely align with market pricing. The table above does not reflect the cost of molten aluminum and electrical power under these negotiated rates.
Goodwill. The following table presents the changes in the carrying value of our goodwill (in millions of dollars):
|
| As of December 31, |
| |||||
|
| 2021 |
|
| 2020 |
| ||
Gross carrying value: |
|
|
|
|
|
|
|
|
Beginning balance |
| $ | 37.2 |
|
| $ | 37.2 |
|
Warrick acquisition |
|
| 20.5 |
|
|
| 0 |
|
Ending balance |
|
| 57.7 |
|
|
| 37.2 |
|
Accumulated impairment loss |
|
| (18.4 | ) |
|
| (18.4 | ) |
Net carrying value |
| $ | 39.3 |
|
| $ | 18.8 |
|
In conjunction with our 2018 we acquiredacquisition of Imperial Machine & Tool Co. ("IMT"Co (“IMT”), located in Columbia, New Jersey, for $43.2 million in cash, net of cash received. IMT specializes in multi-material advanced manufacturing methods and techniques, which include multi-axis computer numerical control ("CNC") machining, additive manufacturing ("3D Printing"), welding and fabrication for demanding aerospace and defense, automotive, high tech and general industrial applications. The acquisition enhances our ability to address customer needs by broadening our capability to provide innovative solutions for demanding applications.
| December 31, 2018 | Add: Impairment of IMT Goodwill | December 31, 2019 | |||||||||
| Goodwill | $ | 62.4 | $ | — | $ | 62.4 | |||||
| Accumulated impairment loss | (18.4 | ) | (25.2 | ) | (43.6 | ) | |||||
| Carrying value | $ | 44.0 | $ | (25.2 | ) | $ | 18.8 | ||||
| December 31, 2017 | Add: Goodwill from IMT Acquisition | December 31, 2018 | |||||||||
| Goodwill | $ | 37.2 | $ | 25.2 | $ | 62.4 | |||||
| Accumulated impairment loss | (18.4 | ) | — | (18.4 | ) | ||||||
| Carrying value | $ | 18.8 | $ | 25.2 | $ | 44.0 | |||||
Intangible Assets.
|
| Weighted- Average Amortization Period (in years) |
|
| Gross Amount |
|
| Accumulated Amortization |
|
| Intangible Assets, Net |
| ||||
As of December 31, 2021 |
|
|
|
|
|
|
|
|
|
|
|
|
|
|
|
|
Customer relationships1 |
|
| 19 |
|
| $ | 68.1 |
|
| $ | (17.8 | ) |
| $ | 50.3 |
|
Trade name |
|
| 10 |
|
|
| 2.4 |
|
|
| (0.8 | ) |
|
| 1.6 |
|
Non-compete agreement |
|
| 5 |
|
|
| 5.4 |
|
|
| (3.5 | ) |
|
| 1.9 |
|
Favorable commodity contracts2 |
|
| 2 |
|
|
| 11.0 |
|
|
| (4.1 | ) |
|
| 6.9 |
|
Favorable lease contracts2 |
|
| 120 |
|
|
| 7.0 |
|
|
| — |
|
|
| 7.0 |
|
Total |
|
|
|
|
| $ | 93.9 |
|
| $ | (26.2 | ) |
| $ | 67.7 |
|
As of December 31, 2020 |
|
|
|
|
|
|
|
|
|
|
|
|
|
|
|
|
Customer relationships |
|
| 24 |
|
| $ | 36.1 |
|
| $ | (14.2 | ) |
| $ | 21.9 |
|
Trade name |
|
| 10 |
|
|
| 2.4 |
|
|
| (0.6 | ) |
|
| 1.8 |
|
Non-compete agreement |
|
| 5 |
|
|
| 5.4 |
|
|
| (2.4 | ) |
|
| 3.0 |
|
Total |
|
|
|
|
| $ | 43.9 |
|
| $ | (17.2 | ) |
| $ | 26.7 |
|
1 | Of the total acquired customer relationships, $32.0 million was purchased in conjunction with the Warrick acquisition and had a weighted average amortization period of 12 years. |
Weighted-Average Amortization Period (in years) | Gross Amount | Accumulated Amortization | Intangible Assets, Net | |||||||||||
| December 31, 2019 | ||||||||||||||
| Customer relationships | 24 | $ | 36.1 | $ | (12.7 | ) | $ | 23.4 | ||||||
| Trade name | 10 | 2.4 | (0.3 | ) | 2.1 | |||||||||
| Non-compete agreement | 5 | 5.4 | (1.3 | ) | 4.1 | |||||||||
| Total | $ | 43.9 | $ | (14.3 | ) | $ | 29.6 | |||||||
| December 31, 2018 | ||||||||||||||
| Customer relationships | 24 | $ | 36.1 | $ | (11.1 | ) | $ | 25.0 | ||||||
| Trade name | 10 | 2.4 | (0.1 | ) | 2.3 | |||||||||
| Non-compete agreement | 5 | 5.4 | (0.3 | ) | 5.1 | |||||||||
| Total | $ | 43.9 | $ | (11.5 | ) | $ | 32.4 | |||||||
2 | The favorable lease and commodity contracts were purchased in conjunction with the Warrick acquisition. |
We identified no0 indicators of impairment associated with our intangible assets during the years ended December 31, 2019,2021, December 31, 20182020 or December 31, 2017.
65
KAISER ALUMINUM CORPORATION AND SUBSIDIARY COMPANIES
NOTES TO CONSOLIDATED FINANCIAL STATEMENTS
Amortization expense relating to definite-lived intangible assets was $9.0 million, $2.9 million and $2.8 million for 2021, 2020 and 2019, $1.8 million for 2018, and $1.4 million for 2017.respectively. The following table presents the expected amortization of intangible assets for each of the next five calendar years isand thereafter as followsof December 31, 2021 (in millions of dollars):
2022 |
| $ | 12.4 |
|
2023 |
|
| 5.3 |
|
2024 |
|
| 4.5 |
|
2025 |
|
| 4.5 |
|
2026 |
|
| 4.5 |
|
Thereafter |
|
| 36.5 |
|
Total |
| $ | 67.7 |
|
| 2020 | $ | 2.8 | |
| 2021 | 2.8 | ||
| 2022 | 2.8 | ||
| 2023 | 2.6 | ||
| 2024 | 1.8 | ||
| Thereafter | 16.8 | ||
| Total | $ | 29.6 | |
5. Employee Benefits
Defined Contribution Plans
We sponsor defined contribution 401(k) savings planplans for certain hourly bargaining unit employees at 9and salaried employees. Employees may contribute a portion of our production facilities based ontheir compensation to the specific collective bargaining agreement at each facility. For active bargaining unit employees at 3plans and we match a specified percentage of these production facilities,contributions in equivalent form of the investments elected by the employee. Additionally, we are required to make fixed rate contributions. For active bargaining unitannual contributions for certain hourly and salaried employees at 1 of these production facilities, we are required to match certain employee contributions. For active bargaining unit employees at 3 of these production facilities, we are required to make both fixed rate contributions and concurrent matches. For active bargaining unit employees at 2 remaining production facilities, we are not required to make any contributions. Fixed rate contributions either: (i) range from (in whole dollars) $800 to $2,400 per employee per year,in varying amounts depending on the employee's age, or (ii) vary between 2% to 10%hire date.
Deferred Compensation Plan
We sponsor a non-qualified, unfunded, unsecured plan of deferred compensation for certain employees who would otherwise suffer a loss of benefits under our defined contribution plan as a result of the employees' compensation depending on their age and yearslimitations imposed by the Internal Revenue Code of service for employees hired prior to January 1, 2004 or is a fixed 2% annual contribution for employees hired on or after January 1, 2004.
Other Benefits We provide other benefits for |
Defined Benefit Plans
Pension. We sponsor defined benefit pension plans for certain hourly bargaining unit employees and salaried employees. Pension benefits generally depend on length of service, job grade and remuneration. Substantially all benefits are paid through pension trusts that are sufficiently funded to ensure that all plans can pay benefits to retirees as they become due. We use a December 31 measurement date for our pension plans.
OPEB. We sponsor a healthcare and life insurance postretirement benefit plan (“OPEB”) covering certain eligible retirees. Generally, the medical plans are unfunded and pay a percentage of medical expenses, reduced by deductibles and other coverage. Life benefits are generally provided by insurance contracts. We use a December 31 measurement date for our OPEB plan.
Salaried VEBA Postretirement Obligation. Certain retirees who retired prior to 2004 and certain employees who were hired prior to February 2002 and have subsequently retired or will retire with the requisite age and service, along with their surviving spouses and eligible dependents, are eligible to participate in a voluntary employees'employees’ beneficiary association ("VEBA"(“VEBA”) that provides healthcare cost, medical cost and long-term care insurance cost reimbursement benefits ("(“Salaried VEBA"VEBA”). The accumulated postretirement benefit obligation (“APBO”) for the Salaried VEBA was computed based on the level of benefits being provided. Since the Salaried VEBA pays out a fixed annual amount to its participants, no future cost trend rate increase was assumed in computing the APBO for the Salaried VEBA.
66
KAISER ALUMINUM CORPORATION AND SUBSIDIARY COMPANIES
NOTES TO CONSOLIDATED FINANCIAL STATEMENTS
We have an ongoing obligation with no express termination date to make variable cash contributions up to a maximum of $2.9 million to the Salaried VEBA. We determined that in the first quarter of 2020, we will pay approximately
| Canadian Pension Plan | Salaried VEBA | |||||||||||
| December 31, 2019 | December 31, 2018 | December 31, 2019 | December 31, 2018 | |||||||||
| Discount rate | 3.10 | % | 3.90 | % | 2.95 | % | 3.90 | % | ||||
| Expected long-term return on plan assets | 4.45 | % | 4.45 | % | 5.50 | % | 5.50 | % | ||||
| Rate of compensation increase | 3.00 | % | 3.00 | % | — | — | ||||||
Key Assumptions. The following table presents the Salaried VEBA was paying a fixed annual amountweighted average assumptions used to its participants at both December 31, 2019 and December 31, 2018, no future cost trend rate increase has been assumed in computingdetermine benefit obligations:
|
| Pension1 |
|
| OPEB |
| Salaried VEBA |
| ||||||||||||||
|
| As of December 31, |
|
| As of December 31, |
| As of December 31, |
| ||||||||||||||
|
| 2021 |
|
| 2020 |
|
| 2021 |
|
| 2020 |
| 2021 |
|
| 2020 |
| |||||
Discount rate |
|
| 2.90 | % |
|
| 2.50 | % |
|
| 2.64 | % |
| n/a |
|
| 2.49 | % |
|
| 2.05 | % |
Rate of compensation increase |
|
| 2.74 | % |
|
| 3.00 | % |
|
| — | % |
| n/a |
|
| — | % |
|
| — | % |
1. | Beginning in 2021, the Warrick pension assumptions were weighted with the Canadian pension assumptions based on the total benefit obligations of each. |
The following table presents the APBO for the Salaried VEBA.
|
| Pension1 |
|
| OPEB |
| Salaried VEBA |
| ||||||||||||||||||||||||
|
| Year Ended December 31, |
|
| Year Ended December 31, |
| Year Ended December 31, |
| ||||||||||||||||||||||||
|
| 2021 |
|
| 2020 |
|
| 2019 |
|
| 2021 |
|
| 2020 |
| 2019 |
| 2021 |
|
| 2020 |
|
| 2019 |
| |||||||
Discount rate |
|
| 2.89 | % |
|
| 3.10 | % |
|
| 3.90 | % |
|
| 2.97 | % |
| n/a |
| n/a |
|
| 2.05 | % |
|
| 2.95 | % |
|
| 3.90 | % |
Expected long-term return on plan assets2 |
|
| 5.78 | % |
|
| 4.45 | % |
|
| 4.45 | % |
|
| — | % |
| n/a |
| n/a |
|
| 5.50 | % |
|
| 5.50 | % |
|
| 5.50 | % |
Rate of compensation increase |
|
| 2.74 | % |
|
| 3.00 | % |
|
| 3.00 | % |
|
| — | % |
| n/a |
| n/a |
|
| — | % |
|
| — | % |
|
| — | % |
| Canadian Pension Plan | Salaried VEBA | |||||||||||||||||
| 2019 | 2018 | 2017 | 2019 | 2018 | 2017 | |||||||||||||
| Discount rate | 3.90 | % | 3.40 | % | 3.80 | % | 3.90 | % | 3.20 | % | 3.60 | % | ||||||
Expected long-term return on plan assets1 | 4.45 | % | 4.45 | % | 4.45 | % | 5.50 | % | 5.50 | % | 7.75 | % | ||||||
| Rate of compensation increase | 3.00 | % | 3.00 | % | 3.00 | % | — | — | — | |||||||||
1. | Beginning in 2021, the Warrick pension assumptions were weighted with the Canadian pension assumptions based on the total benefit obligations of each. |
2. | The expected long-term rate of return assumption for the Salaried VEBA is based on the targeted investment portfolios provided to us by the trustee of the Salaried VEBA. |
67
KAISER ALUMINUM CORPORATION AND SUBSIDIARY COMPANIES
NOTES TO CONSOLIDATED FINANCIAL STATEMENTS
Benefit Obligations and Funded Status.
The following table presents the benefit obligations and funded status of our
|
| Pension |
|
| OPEB |
| Salaried VEBA |
| ||||||||||||||
|
| As of December 31, |
|
| As of December 31, |
| As of December 31, |
| ||||||||||||||
|
| 2021 |
|
| 2020 |
|
| 2021 |
|
| 2020 |
| 2021 |
|
| 2020 |
| |||||
Change in benefit obligation: |
|
|
|
|
|
|
|
|
|
|
|
|
|
|
|
|
|
|
|
|
|
|
Obligation at beginning of year |
| $ | 10.0 |
|
| $ | 8.8 |
|
| $ | — |
|
| n/a |
| $ | 78.3 |
|
| $ | 90.2 |
|
Obligation assumed through acquisition of Warrick |
|
| 6.5 |
|
|
| — |
|
|
| 78.1 |
|
| n/a |
|
| — |
|
|
| — |
|
Foreign currency translation adjustment |
|
| — |
|
|
| 0.3 |
|
|
| — |
|
| n/a |
|
| — |
|
|
| — |
|
Service cost |
|
| 4.1 |
|
|
| 0.3 |
|
|
| 1.1 |
|
| n/a |
|
| 0.1 |
|
|
| 0.1 |
|
Interest cost |
|
| 0.5 |
|
|
| 0.3 |
|
|
| 1.7 |
|
| n/a |
|
| 1.5 |
|
|
| 2.5 |
|
Prior service cost (credit)1 |
|
| — |
|
|
| — |
|
|
| — |
|
| n/a |
|
| 14.0 |
|
|
| (12.3 | ) |
Actuarial (gain) loss2 |
|
| (0.3 | ) |
|
| 0.6 |
|
|
| 2.6 |
|
| n/a |
|
| (6.9 | ) |
|
| 4.7 |
|
Benefits paid |
|
| (0.5 | ) |
|
| (0.3 | ) |
|
| — |
|
| n/a |
|
| (7.2 | ) |
|
| (6.9 | ) |
Obligation at end of year3 |
|
| 20.3 |
|
|
| 10.0 |
|
|
| 83.5 |
|
| n/a |
|
| 79.8 |
|
|
| 78.3 |
|
Change in plan assets: |
|
|
|
|
|
|
|
|
|
|
|
|
|
|
|
|
|
|
|
|
|
|
Fair market value of plan assets at beginning of year |
|
| 8.7 |
|
|
| 7.8 |
|
|
| — |
|
| n/a |
|
| 60.5 |
|
|
| 57.6 |
|
Foreign currency translation adjustment |
|
| — |
|
|
| 0.2 |
|
|
| — |
|
| n/a |
|
| — |
|
|
| — |
|
Actual return on assets |
|
| 1.1 |
|
|
| 0.7 |
|
|
| — |
|
| n/a |
|
| 5.9 |
|
|
| 8.1 |
|
Company contributions |
|
| 0.5 |
|
|
| 0.3 |
|
|
| — |
|
| n/a |
|
| — |
|
|
| 1.7 |
|
Benefits paid |
|
| (0.5 | ) |
|
| (0.3 | ) |
|
| — |
|
| n/a |
|
| (7.2 | ) |
|
| (6.9 | ) |
Fair market value of plan assets at end of year |
|
| 9.8 |
|
|
| 8.7 |
|
|
| — |
|
| n/a |
|
| 59.2 |
|
|
| 60.5 |
|
Net funded status4 |
| $ | (10.5 | ) |
| $ | (1.3 | ) |
| $ | (83.5 | ) |
| n/a |
| $ | (20.6 | ) |
| $ | (17.8 | ) |
Cumulative loss recognized in Accumulated Other Comprehensive: |
|
|
|
|
|
|
|
|
|
|
|
|
|
|
|
|
|
|
|
|
|
|
Accumulated net actuarial loss |
| $ | (1.0 | ) |
| $ | (2.1 | ) |
| $ | (2.6 | ) |
| n/a |
| $ | (1.2 | ) |
| $ | (11.2 | ) |
Prior service cost |
|
| — |
|
|
| — |
|
|
| — |
|
| n/a |
|
| (34.6 | ) |
|
| (24.1 | ) |
Total |
| $ | (1.0 | ) |
| $ | (2.1 | ) |
| $ | (2.6 | ) |
| n/a |
| $ | (35.8 | ) |
| $ | (35.3 | ) |
| Canadian Pension Plan | Salaried VEBA | |||||||||||||||
| 2019 | 2018 | 2019 | 2018 | |||||||||||||
| Change in benefit obligation: | ||||||||||||||||
| Obligation at beginning of year | $ | 7.3 | $ | 8.5 | $ | 85.6 | $ | 90.0 | ||||||||
| Foreign currency translation adjustment | 0.3 | (0.7 | ) | — | — | |||||||||||
| Service cost | 0.3 | 0.3 | 0.1 | 0.1 | ||||||||||||
| Interest cost | 0.3 | 0.3 | 3.2 | 2.7 | ||||||||||||
Prior service cost1 | — | — | 2.5 | 6.9 | ||||||||||||
Actuarial loss (gain)2 | 1.1 | (0.6 | ) | 6.4 | (6.8 | ) | ||||||||||
| Plan participants contributions | — | 0.1 | — | — | ||||||||||||
| Benefits paid by Company | (0.5 | ) | (0.6 | ) | — | — | ||||||||||
| Benefits paid by Salaried VEBA | — | — | (7.6 | ) | (7.3 | ) | ||||||||||
Obligation at end of year3 | 8.8 | 7.3 | 90.2 | 85.6 | ||||||||||||
| Change in plan assets: | ||||||||||||||||
| Fair market value of plan assets at beginning of year | 6.5 | 7.3 | 53.2 | 58.1 | ||||||||||||
| Foreign currency translation adjustment | 0.3 | (0.6 | ) | — | — | |||||||||||
| Actual return on assets | 1.0 | (0.2 | ) | 9.1 | 0.3 | |||||||||||
| Plan participants contributions | — | 0.1 | — | — | ||||||||||||
| Company contributions | 0.5 | 0.5 | 2.9 | 2.1 | ||||||||||||
| Benefits paid by Company | (0.5 | ) | (0.6 | ) | — | — | ||||||||||
| Benefits paid by Salaried VEBA | — | — | (7.6 | ) | (7.3 | ) | ||||||||||
| Fair market value of plan assets at end of year | 7.8 | 6.5 | 57.6 | 53.2 | ||||||||||||
Net funded status4 | $ | (1.0 | ) | $ | (0.8 | ) | $ | (32.6 | ) | $ | (32.4 | ) | ||||
1. | The prior service cost (credit) relating to the Salaried VEBA in both |
2. | The actuarial gain relating to the Salaried VEBA in |
3. | For the |
4. | Net funded status relating to the pension plans and Salaried VEBA at December 31, |
The accumulated benefit obligation for the Canadian pension planplans was $7.6$19.3 millionand $6.4$9.2 million at December 31, 20192021 and December 31, 2018,2020, respectively. We expect to contribute $0.5$8.6 millionto the Canadian pension planplans in 2020.
The following table presents the net benefits expected to be paid in each of the next five fiscal years and in the aggregate for the five fiscal years thereafter are as follows (in millions of dollars):
| Year Ended December 31, |
| |||||||||||||||||||||||||||||||||||||||||||||
| 2022 |
|
| 2023 |
|
| 2024 |
|
| 2025 |
|
| 2026 |
|
| 2027-2031 |
| ||||||||||||||||||||||||||||||
| Benefit Payments Due by Period | |||||||||||||||||||||||||||||||||||||||||||||||
| 2020 | 2021 | 2022 | 2023 | 2024 | 2025-2029 | ||||||||||||||||||||||||||||||||||||||||||
| Canadian pension plan benefit payments | $ | 0.3 | $ | 0.3 | $ | 0.3 | $ | 0.3 | $ | 0.3 | $ | 2.0 | |||||||||||||||||||||||||||||||||||
Pension benefit payments |
| $ | 0.5 |
|
| $ | 0.6 |
|
| $ | 0.8 |
|
| $ | 0.9 |
|
| $ | 1.0 |
|
| $ | 7.8 |
| |||||||||||||||||||||||
Salaried VEBA benefit payments1 | 7.9 | 7.6 | 7.4 | 7.1 | 6.8 | 29.1 |
|
| 7.4 |
|
|
| 7.1 |
|
|
| 6.7 |
|
|
| 6.4 |
|
|
| 6.0 |
|
|
| 25.4 |
| |||||||||||||||||
OPEB payments |
|
| 1.6 |
|
|
| 2.4 |
|
|
| 3.1 |
|
|
| 3.7 |
|
|
| 4.3 |
|
|
| 30.0 |
| |||||||||||||||||||||||
| Total net benefits | $ | 8.2 | $ | 7.9 | $ | 7.7 | $ | 7.4 | $ | 7.1 | $ | 31.1 |
| $ | 9.5 |
|
| $ | 10.1 |
|
| $ | 10.6 |
|
| $ | 11.0 |
|
| $ | 11.3 |
|
| $ | 63.2 |
| |||||||||||
68
KAISER ALUMINUM CORPORATION AND SUBSIDIARY COMPANIES
NOTES TO CONSOLIDATED FINANCIAL STATEMENTS
1. | Such amounts are based on benefit amounts and certain key assumptions obtained from the Salaried |
Plan Assets. The amount of loss included infollowing table presents the Consolidated Balance Sheets (within Accumulated other comprehensive loss) associated withasset class allocation per our Canadian pension plan investment policy and the Salaried VEBA (before tax) that had not yet been reflected in net periodic postretirement benefit cost was as followsweighted average asset allocation at December 31, (in millions of dollars):2021:
Asset class | Policy range | As of December 31, 2021 | |||
Equities | 54% - 60% | 66% | |||
Fixed income | 35% - 40% | 28% | |||
Other investments | 5% - 6% | 6% |
| Canadian Pension Plan | Salaried VEBA | |||||||||||||||
| 2019 | 2018 | 2019 | 2018 | |||||||||||||
| Accumulated net actuarial loss | $ | (1.9 | ) | $ | (1.5 | ) | $ | (12.1 | ) | $ | (12.5 | ) | ||||
| Prior service cost | — | — | (41.1 | ) | (44.2 | ) | ||||||||||
| Cumulative loss reflected in Accumulated other comprehensive loss | $ | (1.9 | ) | $ | (1.5 | ) | $ | (53.2 | ) | $ | (56.7 | ) | ||||
Fair Value of Plan Assets.
The plan assets of ourCertain Salaried VEBA plan assets are valued based upon unadjusted quoted market prices in active markets that are accessible at the measurement date for identical, unrestricted assets (e.g., liquid securities listed on an exchange). Such assets are classified within Level 1 of the fair value hierarchy. Valuation of other Salaried VEBAplan invested plan assets isare based on significant observable inputs (e.g., valuations derived from actual market transactions, broker-dealer supplied valuations or correlations between a given U.S. market and a non-U.S. security). Valuation model inputs can generally be verified and valuation techniques do not involve significant judgment. The fair values of such financial instruments are classified within Level 2 of the fair value hierarchy.
69
KAISER ALUMINUM CORPORATION AND SUBSIDIARY COMPANIES
NOTES TO CONSOLIDATED FINANCIAL STATEMENTS
The following table presents the fair value of plan assets, classified under the appropriate level of the fair value hierarchy as of the periods presented (in millions of dollars):
|
| Level 1 |
|
| Level 2 |
|
| Level 3 |
|
| Total |
| ||||
As of December 31, 2021: |
|
|
|
|
|
|
|
|
|
|
|
|
|
|
|
|
Plan Assets in the Fair Value Hierarchy: |
|
|
|
|
|
|
|
|
|
|
|
|
|
|
|
|
Salaried VEBA – Equity investment funds in registered investment companies1 |
| $ | 38.6 |
|
| $ | — |
|
| $ | — |
|
| $ | 38.6 |
|
Salaried VEBA – Fixed income investment funds in registered investment companies2 |
|
| 20.6 |
|
|
| — |
|
|
| — |
|
|
| 20.6 |
|
Deferred compensation program – Diversified investment funds in registered investment companies3 |
|
| 10.5 |
|
|
| — |
|
|
| — |
|
|
| 10.5 |
|
Total plan assets in the fair value hierarchy |
| $ | 69.7 |
|
| $ | — |
|
| $ | — |
|
| $ | 69.7 |
|
Plan Assets Measured at NAV4: |
|
|
|
|
|
|
|
|
|
|
|
|
|
|
|
|
Pension plans – Equity investment funds in registered investment companies1 |
|
|
|
|
|
|
|
|
|
|
|
|
| $ | 0.1 |
|
Pension plans – Fixed income investment funds in registered investment companies2 |
|
|
|
|
|
|
|
|
|
|
|
|
|
| 0.1 |
|
Pension plans – Diversified investment funds in registered investment companies3 |
|
|
|
|
|
|
|
|
|
|
|
|
|
| 9.6 |
|
Total plan assets at fair value |
|
|
|
|
|
|
|
|
|
|
|
|
| $ | 79.5 |
|
|
|
|
|
|
|
|
|
|
|
|
|
|
|
|
|
|
As of December 31, 2020: |
|
|
|
|
|
|
|
|
|
|
|
|
|
|
|
|
Plan Assets in the Fair Value Hierarchy: |
|
|
|
|
|
|
|
|
|
|
|
|
|
|
|
|
Salaried VEBA – Cash and money market investments |
| $ | 1.4 |
|
| $ | — |
|
| $ | — |
|
| $ | 1.4 |
|
Deferred compensation program – Diversified investment funds in registered investment companies3 |
|
| — |
|
|
| 9.6 |
|
|
| — |
|
|
| 9.6 |
|
Total plan assets in the fair value hierarchy |
| $ | 1.4 |
|
| $ | 9.6 |
|
| $ | — |
|
| $ | 11.0 |
|
Plan Assets Measured at NAV4: |
|
|
|
|
|
|
|
|
|
|
|
|
|
|
|
|
Salaried VEBA – Equity investment funds in registered investment companies1 |
|
|
|
|
|
|
|
|
|
|
|
|
| $ | 34.7 |
|
Salaried VEBA – Fixed income investment funds in registered investment companies2 |
|
|
|
|
|
|
|
|
|
|
|
|
|
| 22.7 |
|
Pension plans – Diversified investment funds in registered investment companies3 |
|
|
|
|
|
|
|
|
|
|
|
|
|
| 8.7 |
|
Total plan assets at fair value |
|
|
|
|
|
|
|
|
|
|
|
|
| $ | 77.1 |
|
| Level 1 | Level 2 | Level 3 | Total | ||||||||||||
| December 31, 2019: | |||||||||||||||
| Plan Assets in the Fair Value Hierarchy: | |||||||||||||||
| Salaried VEBA – | |||||||||||||||
| Cash and money market investments | $ | 0.9 | $ | — | $ | — | $ | 0.9 | |||||||
Diversified investment funds in registered investment companies1 | 7.1 | — | — | 7.1 | |||||||||||
| Total Salaried VEBA assets in the fair value hierarchy | 8.0 | — | — | 8.0 | |||||||||||
Deferred compensation program – Diversified investment funds in registered investment companies1 | — | 8.1 | — | 8.1 | |||||||||||
| Total plan assets in the fair value hierarchy | $ | 8.0 | $ | 8.1 | $ | — | $ | 16.1 | |||||||
Plan Assets Measured at NAV 2: | |||||||||||||||
Salaried VEBA – Fixed income investment funds in registered investment companies3 | $ | 21.9 | |||||||||||||
Salaried VEBA – Equity investment funds in registered investment companies4 | 24.8 | ||||||||||||||
Canadian pension plan – Diversified investment funds in registered investment companies1 | 7.8 | ||||||||||||||
| Total plan assets at fair value | $ | 70.6 | |||||||||||||
| December 31, 2018: | |||||||||||||||
| Plan Assets in the Fair Value Hierarchy: | |||||||||||||||
| Salaried VEBA – | |||||||||||||||
| Cash and money market investments | $ | 0.9 | $ | — | $ | — | $ | 0.9 | |||||||
Diversified investment funds in registered investment companies1 | 8.7 | — | — | 8.7 | |||||||||||
| Total Salaried VEBA assets in the fair value hierarchy | 9.6 | — | — | 9.6 | |||||||||||
Deferred compensation program – Diversified investment funds in registered investment companies1 | — | 10.5 | — | 10.5 | |||||||||||
| Total plan assets in the fair value hierarchy | $ | 9.6 | $ | 10.5 | $ | — | $ | 20.1 | |||||||
Plan Assets Measured at NAV 2: | |||||||||||||||
Salaried VEBA – Fixed income investment funds in registered investment companies3 | $ | 21.2 | |||||||||||||
Salaried VEBA – Equity investment funds in registered investment companies4 | 20.3 | ||||||||||||||
Canadian pension plan – Diversified investment funds in registered investment companies1 | 6.5 | ||||||||||||||
| Total plan assets at fair value | $ | 68.1 | |||||||||||||
1. | Equity investment funds in registered investment companies. This category represents investments in equity funds that invest in portfolios comprised primarily of equity and equity-related securities of U.S. and non-U.S. issuers across all market capitalizations. |
2. | Fixed income investment funds in registered investment companies. This category represents investments in various fixed income funds with multiple registered investment companies. Such funds invest primarily in bonds, debentures, notes, securities with equity and fixed-income characteristics, cash equivalents, securities backed by mortgages and other assets, loans, pooled or collective investment vehicles made up of fixed‑income securities and other fixed-income obligations of banks, corporations and governmental authorities. |
3. | Diversified investment funds in registered investment companies. The plan assets are invested in investment funds that hold a diversified portfolio of: (i) U.S. and international debt and equity securities; (ii) fixed income securities such as corporate bonds and government bonds; (iii) mortgage-related securities; and (iv) cash and cash equivalents. |
4. | |
| NAV. The market value of these funds has not been categorized in the fair value hierarchy and is being presented in the table above to permit a reconciliation of the fair value hierarchy to |
70
KAISER ALUMINUM CORPORATION AND SUBSIDIARY COMPANIES
NOTES TO CONSOLIDATED FINANCIAL STATEMENTS
The following tables presenttable presents the total expense related to all benefit plans for the periods presented (in millions of dollars):
|
| Year Ended December 31, |
| |||||||||
|
| 2021 |
|
| 2020 |
|
| 2019 |
| |||
Defined contribution plans1 |
| $ | 13.9 |
|
| $ | 8.3 |
|
| $ | 8.8 |
|
Deferred compensation plan2 |
|
| 0.7 |
|
|
| 1.5 |
|
|
| 1.6 |
|
Multiemployer pension plans1,3 |
|
| 5.0 |
|
|
| 4.9 |
|
|
| 5.0 |
|
Net periodic postretirement benefit cost relating to Salaried VEBA2,3 |
|
| 2.3 |
|
|
| 4.8 |
|
|
| 6.6 |
|
Net periodic postretirement benefit cost relating to pension plans4 |
|
| 4.3 |
|
|
| 0.4 |
|
|
| 0.4 |
|
Net periodic postretirement benefit cost relating to OPEB4 |
|
| 2.8 |
|
| n/a |
|
| n/a |
| ||
Total |
| $ | 29.0 |
|
| $ | 19.9 |
|
| $ | 22.4 |
|
| Year Ended December 31, | ||||||||||||
| 2019 | 2018 | 2017 | ||||||||||
Canadian pension plan1 | $ | 0.4 | $ | 0.4 | $ | 0.3 | ||||||
Defined contribution plans1 | 8.8 | 8.8 | 8.9 | |||||||||
Deferred compensation plan1 | 1.6 | 1.0 | 1.8 | |||||||||
Multiemployer pension plans2 | 5.0 | 4.7 | 4.6 | |||||||||
Net periodic postretirement benefit cost relating to Salaried VEBA3 | 6.6 | 6.1 | 4.5 | |||||||||
| Total | $ | 22.4 | $ | 21.0 | $ | 20.1 | ||||||
1. | Substantially all of these charges related to employee benefits are in Cost of products sold with the remaining balance in SG&A and R&D. |
2. |
|
3. | See Note 6 for more information on our multiemployer defined benefit pension plans. |
4. | The current service cost component of Net periodic postretirement benefit cost relating to both the pension plans and the OPEB plan are included within our Statements of Consolidated (Loss) Income in COGS for all periods presented. All other components of Net periodic postretirement benefit cost relating to both the pension plans and the OPEB plan are included within Other expense, net, on our Statements of Consolidated (Loss) Income. |
Components of Net Periodic Postretirement Benefit Cost. Our results of operations included the following impacts associated with our Canadian pension plans, OPEB plan and the Salaried VEBA: (i) a charge for service rendered by employees; (ii) a charge for accretion of interest; (iii) a benefit for the return on plan assets; and (iv) amortization of prior service costs associated with plan amendments; and (v) amortization of net actuarial differences.
The following table presents the components of Net periodic postretirement benefit cost forrelating to our pension plans, OPEB plan and the years ended December 31Salaried VEBA (in millions of dollars):
|
| Pension1 |
|
| OPEB |
| Salaried VEBA |
| ||||||||||||||||||||||||
|
| Year Ended December 31, |
|
| Year Ended December 31, |
| Year Ended December 31, |
| ||||||||||||||||||||||||
|
| 2021 |
|
| 2020 |
|
| 2019 |
|
| 2021 |
|
| 2020 |
| 2019 |
| 2021 |
|
| 2020 |
|
| 2019 |
| |||||||
Service cost |
| $ | 4.1 |
|
| $ | 0.3 |
|
| $ | 0.3 |
|
| $ | 1.1 |
|
| n/a |
| n/a |
| $ | 0.1 |
|
| $ | 0.1 |
|
| $ | 0.1 |
|
Interest cost |
|
| 0.5 |
|
|
| 0.3 |
|
|
| 0.3 |
|
|
| 1.7 |
|
| n/a |
| n/a |
|
| 1.5 |
|
|
| 2.5 |
|
|
| 3.2 |
|
Expected return on plan assets |
|
| (0.4 | ) |
|
| (0.3 | ) |
|
| (0.3 | ) |
|
| — |
|
| n/a |
| n/a |
|
| (3.1 | ) |
|
| (2.8 | ) |
|
| (2.7 | ) |
Amortization of prior service cost2 |
|
| — |
|
|
| — |
|
|
| — |
|
|
| — |
|
| n/a |
| n/a |
|
| 3.5 |
|
|
| 4.7 |
|
|
| 5.6 |
|
Amortization of net actuarial loss |
|
| 0.1 |
|
|
| 0.1 |
|
|
| 0.1 |
|
|
| — |
|
| n/a |
| n/a |
|
| 0.3 |
|
|
| 0.3 |
|
|
| 0.4 |
|
Net periodic postretirement benefit cost |
| $ | 4.3 |
|
| $ | 0.4 |
|
| $ | 0.4 |
|
| $ | 2.8 |
|
| n/a |
| n/a |
| $ | 2.3 |
|
| $ | 4.8 |
|
| $ | 6.6 |
|
| Canadian Pension Plan | Salaried VEBA | |||||||||||||||||||||||
| 2019 | 2018 | 2017 | 2019 | 2018 | 2017 | |||||||||||||||||||
| Service cost | $ | 0.3 | $ | 0.3 | $ | 0.3 | $ | 0.1 | $ | 0.1 | $ | — | ||||||||||||
| Interest cost | 0.3 | 0.3 | 0.3 | 3.2 | 2.7 | 3.0 | ||||||||||||||||||
| Expected return on plan assets | (0.3 | ) | (0.3 | ) | (0.3 | ) | (2.7 | ) | (2.9 | ) | (4.1 | ) | ||||||||||||
Amortization of prior service cost1 | — | — | — | 5.6 | 5.4 | 4.7 | ||||||||||||||||||
| Amortization of net actuarial loss | 0.1 | 0.1 | — | 0.4 | 0.8 | 0.9 | ||||||||||||||||||
| Net periodic postretirement benefit cost | $ | 0.4 | $ | 0.4 | $ | 0.3 | $ | 6.6 | $ | 6.1 | $ | 4.5 | ||||||||||||
1. | Net periodic postretirement benefit cost for 2019 and 2020 included only the Canadian pension plan. Net periodic postretirement benefit cost for the Warrick pension plan was included in 2021 from the acquisition date of March 31, 2021 through December 31 2021. |
2. | We amortize prior service cost on a straight-line basis over the average remaining years of service to full eligibility for benefits of the active plan participants. |
6. Multiemployer Pension Plans
Overview.
We contribute to multiemployer defined benefit pension plans under the terms of collective bargaining agreements that cover our union-represented employees at certain facilities. At December 31,The risks of participating in these multiemployer plans are different from single-employer plans in the following aspects:
71
KAISER ALUMINUM CORPORATION AND SUBSIDIARY COMPANIES
NOTES TO CONSOLIDATED FINANCIAL STATEMENTS
• | Assets contributed to the multiemployer plan by one employer may be used to provide benefits to employees of other participating employers. |
• | If a participating employer stops contributing to the plan, the unfunded obligations of the plan may be borne by the remaining participating employers. |
• | If we choose to stop participating in any of our multiemployer plans, we may be required to pay those plans an amount based on the underfunded status of the plan, referred to as a withdrawal liability. |
The following table presents information about multiemployer pension plans for the year ended December 31, 2019 is outlined in the table below:which we participate:
|
|
|
| Pension |
| FIP/RP Status |
| Contributions of |
|
|
|
|
|
|
| |||||||||||
|
| Employer |
| Protection Act |
| Pending/ |
| the Company |
|
| Surcharge |
| Expiration Date | |||||||||||||
|
| Identification |
| Zone Status1 |
| Implemented |
| Year Ended December 31, |
|
| Imposed |
| of Collective- | |||||||||||||
Pension Fund |
| Number |
| 2021 |
| 2020 |
| in 20212 |
| 2021 |
|
| 2020 |
|
| 2019 |
|
| in 2021 |
| Bargaining Agreements | |||||
|
|
|
|
|
|
|
|
|
| (in millions of dollars) |
|
|
|
|
|
|
| |||||||||
Steelworkers Pension Trust (USW)3 |
| 23-6648508 |
| Green |
| Green |
| No |
| $ | 3.6 |
|
| $ | 3.8 |
|
| $ | 3.8 |
|
| No |
| Sep 2025 - Nov 2026 | ||
Other Funds4 |
|
|
|
|
|
|
|
|
|
| 1.4 |
|
|
| 1.1 |
|
|
| 1.2 |
|
|
|
|
|
|
|
|
|
|
|
|
|
|
|
|
| $ | 5.0 |
|
| $ | 4.9 |
|
| $ | 5.0 |
|
|
|
|
|
|
|
| Pension Fund | Employer Identification Number | Pension Protection Act Zone Status1 | FIP/RP Status Pending/Implemented in 20192 | Contributions of the Company | Surcharge Imposed in 2019 | Expiration Date of Collective-Bargaining Agreements | ||||||||||||||||||||
| 2019 | 2018 | 2017 | ||||||||||||||||||||||||
| 2019 | 2018 | (in millions of dollars) | ||||||||||||||||||||||||
Steelworkers Pension Trust (USW)3 | 23-6648508 | Green | Green | No | $ | 3.8 | $ | 3.6 | $ | 3.5 | No | Mar 2020 | - | Sep 2025 | ||||||||||||
Other Funds4 | 1.2 | 1.1 | 1.1 | |||||||||||||||||||||||
| $ | 5.0 | $ | 4.7 | $ | 4.6 | |||||||||||||||||||||
1. | The zone status is based on information that we received from the plan and is certified by the |
2. | The |
3. | We are party to 3 collective bargaining agreements with the United Steel, Paper and Forestry, Rubber, Manufacturing, Energy, Allied Industrial and Service Workers International Union, AFL-CIO, CLC |
4. | Other Funds consists of plans that are not individually significant. |
We were not listed in any of the plans'plans’ Forms 5500 or the Canada-Wide Industrial Pension Plan financial statements as providing more than 5% of the total contributions for any of the plan years disclosed. At December 31, 2019,2021, financial statements and Forms 5500 were not available for the plan yearsyear ending in 2019.2021. Further, there were no significant changes to the number of employees covered by our multiemployer plans that would affect the period-to-period comparability of the contributions for the years presented.
7. Employee Incentive Plans
Short-Term Incentive Plans ("(“STI Plans"Plans”)
We have annual short-term incentive compensation plans for senior management and certain other employees payable at our election in cash, shares of common stock or a combination of cash and shares of common stock. Amounts earned under STI Plans are based on our adjusted earnings before interest, taxes, depreciation and amortization ("Adjusted EBITDA"),EBITDA, modified for certain safety, quality, delivery, cost and individual performance factors. The Adjusted EBITDA targets are determined based on the return on adjusted net assets. Most of our production facilities have similar programs for both hourly and salaried employees. As of December 31, 2019,2021, we had a liability of $8.5$9.3 million recorded within Accrued salaries, wages and related expenses for estimated probable future payments relating to the 12-month performance period of our 20192021 STI Plans.
72
KAISER ALUMINUM CORPORATION AND SUBSIDIARY COMPANIES
NOTES TO CONSOLIDATED FINANCIAL STATEMENTS
Long-Term Incentive Programs ("(“LTI Programs"Programs”)
General
. Executive officers and other key employees of the Company, as well as non-employee directors of the Company, are eligible to participate in the Kaiser Aluminum CorporationNon-Vested Common Shares and Restricted Stock Units.
We grant non-vested common sharesThe following table presents a summary of thesummarizes activity with respectrelating to RSAs and RSUs for the year ended December 31, 2019:2021:
|
| Shares |
|
| Weighted- Average Grant-Date Fair Value per Share |
| ||
Outstanding at December 31, 2020 |
|
| 249,731 |
|
| $ | 72.22 |
|
Granted |
|
| 121,827 |
|
|
| 107.24 |
|
Vested |
|
| (58,451 | ) |
|
| 90.36 |
|
Forfeited |
|
| (2,434 | ) |
|
| 103.91 |
|
Outstanding at December 31, 2021 |
|
| 310,673 |
|
| $ | 91.05 |
|
| Shares | Weighted-Average Grant-Date Fair Value per Share | |||||
| Outstanding at December 31, 2018 | 219,513 | $ | 80.99 | |||
| Granted | 65,731 | 97.52 | ||||
| Vested | (78,712 | ) | 89.22 | |||
| Forfeited | (8,530 | ) | 93.78 | |||
| Outstanding at December 31, 2019 | 198,002 | $ | 95.28 | |||
Performance Shares.
We grant performance shares to executive officers and other key employees that vest upon the achievement of specified market or internal performance goals. Performance goals can include: (i) our achieving a total shareholder returnThe following table presents the weighted average inputs and assumptions used in the Monte Carlo simulations to calculate the fair value at grant date of our TSR-Based Performance Shares were as follows:Shares:
|
| Year Ended December 31, |
| |||||||||
|
| 2021 |
|
| 2020 |
|
| 2019 |
| |||
Grant date fair value |
| $ | 151.98 |
|
| $ | 105.88 |
|
| $ | 134.72 |
|
Grant date stock price |
| $ | 114.71 |
|
| $ | 91.22 |
|
| $ | 108.79 |
|
Expected volatility of Kaiser Aluminum1 |
|
| 45.71 | % |
|
| 27.40 | % |
|
| 27.35 | % |
Expected volatility of peer companies1 |
|
| 50.69 | % |
|
| 36.94 | % |
|
| 39.08 | % |
Risk-free interest rate |
|
| 0.29 | % |
|
| 0.58 | % |
|
| 2.51 | % |
Dividend yield |
|
| 2.51 | % |
|
| 2.96 | % |
|
| 2.21 | % |
| Year Ended December 31, | |||||||||||
| 2019 | 2018 | 2017 | |||||||||
| Grant date fair value | $ | 134.72 | $ | 127.41 | $ | 97.88 | |||||
| Grant date stock price | $ | 108.79 | $ | 101.66 | $ | 79.69 | |||||
Expected volatility of Kaiser Aluminum1 | 27.35 | % | 24.86 | % | 22.74 | % | |||||
Expected volatility of peer companies1 | 39.08 | % | 44.74 | % | 44.19 | % | |||||
| Risk-free interest rate | 2.51 | % | 2.37 | % | 1.54 | % | |||||
| Dividend yield | 2.21 | % | 2.16 | % | 2.50 | % | |||||
1. | Weighted average expected volatility based on 2.8 years of daily closing share prices from the valuation date to the end of the performance period. |
73
KAISER ALUMINUM CORPORATION AND SUBSIDIARY COMPANIES
NOTES TO CONSOLIDATED FINANCIAL STATEMENTS
The following table presents a summary of thesummarizes activity with respectrelating to performance shares for the year ended December 31, 2019:2021:
|
| Shares |
|
| Weighted- Average Grant-Date Fair Value per Share |
| ||
Outstanding at December 31, 2020 |
|
| 364,658 |
|
| $ | 102.32 |
|
Granted 1 |
|
| 104,246 |
|
|
| 137.06 |
|
Vested |
|
| (23,497 | ) |
|
| 125.67 |
|
Forfeited 1 |
|
| (2,080 | ) |
|
| 121.17 |
|
Canceled 1 |
|
| (92,947 | ) |
|
| 101.62 |
|
Outstanding at December 31, 2021 |
|
| 350,380 |
|
| $ | 118.56 |
|
| Shares | Weighted-Average Grant-Date Fair Value per Share | |||||
| Outstanding at December 31, 2018 | 426,360 | $ | 93.72 | |||
Granted 1 | 118,808 | 124.10 | ||||
| Vested | (77,606 | ) | 87.87 | |||
Forfeited 1 | (11,679 | ) | 102.61 | |||
Canceled 1 | (75,870 | ) | 87.87 | |||
| Outstanding at December 31, 2019 | 380,013 | $ | 100.69 | |||
1. | The number of shares granted and forfeited are presented at their maximum payout; and the number of shares canceled includes the number of shares that did not vest due to performance results falling below those required for maximum payout. |
Non-Cash Compensation Expense. Non-cash compensation expense relating to all awards is included in SG&A and R&D. The following table presents non-cash compensation expense by type of award under LTI Programs for the periods presented (in millions of dollars):
|
| Year Ended December 31, |
| |||||||||
|
| 2021 |
|
| 2020 |
|
| 2019 |
| |||
RSAs and RSUs |
| $ | 8.1 |
|
| $ | 6.1 |
|
| $ | 6.1 |
|
Performance shares |
|
| 4.5 |
|
|
| 3.5 |
|
|
| 3.6 |
|
Total non-cash compensation expense |
| $ | 12.6 |
|
| $ | 9.6 |
|
| $ | 9.7 |
|
| Year Ended December 31, | |||||||||||
| 2019 | 2018 | 2017 | |||||||||
| RSAs and RSUs | $ | 6.1 | $ | 5.8 | $ | 5.4 | |||||
| Performance shares | 3.6 | 4.3 | 7.7 | ||||||||
| Total non-cash compensation expense | $ | 9.7 | $ | 10.1 | $ | 13.1 | |||||
Recognized tax benefits relating to the non-cash compensation expense presented in the table above were $3.0 million, $2.3 million and $2.4 million $2.5 millionfor 2021, 2020 and $4.9 million for 2019, 2018 and 2017, respectively.
The aggregate fair value of awards that vested was $9.7 million, $12.4 million and $16.4 million $19.4 millionfor 2021, 2020 and $12.0 million for 2019, 2018 and 2017, respectively, which represents the market value of our common stock on the date that the awards vested.
Unrecognized Gross Compensation Cost Data.
The following table presents unrecognized gross compensation
|
| Unrecognized Gross Compensation Costs (in millions of dollars) |
|
| Expected Period (in years) Over Which the Remaining Gross Compensation Costs Will Be Recognized |
| ||
RSAs and RSUs |
| $ | 14.3 |
|
|
| 2.4 |
|
Performance shares |
| $ | 6.4 |
|
|
| 1.8 |
|
| Unrecognized Gross Compensation Costs (in millions of dollars) | Expected Period (in years) Over Which the Remaining Gross Compensation Costs Will Be Recognized | ||||
| RSAs and RSUs | $ | 8.4 | 2.3 | ||
| Performance shares | $ | 5.4 | 1.9 | ||
The following table presents the weighted-average grant-date fair value per share for shares granted by type of award was as follows for the periods presented:award:
|
| Year Ended December 31, |
| |||||||||
|
| 2021 |
|
| 2020 |
|
| 2019 |
| |||
RSAs and RSUs |
| $ | 107.24 |
|
| $ | 71.75 |
|
| $ | 97.52 |
|
Performance shares |
| $ | 137.06 |
|
| $ | 99.87 |
|
| $ | 124.10 |
|
| Year Ended December 31, | |||||||||||
| 2019 | 2018 | 2017 | |||||||||
| RSAs and RSUs | $ | 97.52 | $ | 96.40 | $ | 77.35 | |||||
| Performance shares | $ | 124.10 | $ | 109.38 | $ | 86.97 | |||||
74
KAISER ALUMINUM CORPORATION AND SUBSIDIARY COMPANIES
NOTES TO CONSOLIDATED FINANCIAL STATEMENTS
Participants may elect to have us withhold common shares to satisfy minimum statutory tax withholding obligations arising in connection with the vesting of RSAs, RSUs and performance shares. We cancel any such shares withheld on the applicable vesting dates or earlier dates when service requirements are satisfied, which correspond to the times at which income to the employee is recognized. When we withhold these common shares, we are required to remit to the appropriate taxing authorities the fair value of the shares withheld as of the vesting date. The withholding of common shares by us could be deemed a purchase of the common shares.
8. Derivatives, Hedging Programs and Other Financial Instruments
Overview
. In conducting our business, we enter into derivative transactions, including forward contracts and options, to limit our exposure to: (i) metal price risk related to our sale of fabricated aluminum products and the purchase of metal, including primary and scrap, or recycled, aluminum, our main raw material, and certain alloys used as raw material for our fabrication operations; (ii) energy price risk relating to fluctuating prices of natural gas and electricity used in our production processes; and (iii) foreign currency requirements with respect toOur derivative activities are overseen by a committee ("(“Hedging Committee"Committee”), which is composed of our chief executive officer, chief operating officer, chief financial officer, chief accounting officer, vice president of metal management, treasurertreasury, risk and procurement and other officers and employees selected by the chief executive officer.The Hedging Committee meets regularly to review commodity price exposure, derivative positions and strategy. Management reviews the scope of the Hedging Committee'sCommittee’s activities with our Board of Directors.
We are exposed to counterparty credit risk on all of our derivative instruments, which we manage by monitoring the credit quality of our counterparties, and allocating our hedging positions among multiple counterparties to limit exposure to any single entity.entity, and using options as part of the hedging strategy. Our counterparties are major investment grade financial institutions or trading companies. Hedgingcompanies and our hedging transactions are governed by negotiated reciprocal credit lines, which generally require collateral to be posted above specified credit thresholds. Wethresholds which may adjust up or down, depending on our liquidity. As a result, we believe the risk of loss is remote and contained due to counterparty credit quality, our diversification practice and collateral requirements.
Additionally, our firm-price customer sales commitments create incremental customer credit risk related to metal price movements. Under certain circumstances, we mitigate this risk by periodically requiring cash collateral from them, which we classify as deferred revenue and include as a component of Other accrued liabilities. At December 31, 2019, weWe had $0.2 million0 cash collateral posted from our customers.customers at December 31, 2021. For more information about concentration risks concerning customers and suppliers, see Note 16.
Cash Flow Hedges
We designate as cash flow hedges forward swap contracts for aluminum, energy and, from time-to-time, zinc and copper (“Alloying Metals”) used in our fabrication operations and foreign currency forward contracts for supplies and services for which payments are due in foreign currency. Unrealized gains and losses associated with our cash flow hedges are deferred in Other comprehensive (loss) income, net of tax, and reclassified to COGS when such hedges settle or when it is probable that the original forecasted transactions will not occur by the end of the originally specified time period. See Note 11 for the total amount of gain or loss on derivative instruments designated and qualifying as cash flow hedging instruments and fair value hedging instruments that was reported in Accumulated other comprehensive loss (“AOCI”), as well as the related reclassifications into earnings and tax effects. Cumulative gains and losses related to cash flow hedges are reclassified out of AOCI and recorded within COGS when the associated hedged commodity purchases impact earnings.
Aluminum Hedges
. Our pricing of fabricated aluminum products is generally intended to lock in a conversion margin (representing the value added from the fabrication process(es)) and to pass through75
KAISER ALUMINUM CORPORATION AND SUBSIDIARY COMPANIES
NOTES TO CONSOLIDATED FINANCIAL STATEMENTS
Alloying Metals Hedges. We are exposed to risk of fluctuating prices for Alloying Metalsalloying metals used as raw materials in our fabrication operations. We, from time to time, in the ordinary course of business, use third-partyenter into hedging instrumentstransactions and/or physical delivery commitments with third parties to mitigate our risk from price fluctuations in Alloying Metals.alloying metals prices that are not passed through pursuant to the terms of our customer contracts.
Energy Hedges
. We are exposed to risk of fluctuating prices for natural gas and electricity. We, from time to time, in the ordinary course of business, enter into hedging transactions and/or physical delivery commitments with third parties to mitigate our risk from fluctuations in natural gas and electricityThe following table summarizes the percentage of our expected variable priced purchases of metal alloys and energy for which we have executed derivative and/or physical delivery commitments in place to reduce price fluctuations for the next five years as of December 31, 2021:
|
| 2022 |
|
| 2023 |
|
| 2024 |
|
| 2025 |
|
| 2026 |
| ||||
Zinc |
| 61% |
|
|
| — |
|
|
| — |
|
|
| — |
|
|
| — |
|
Copper |
| 64% |
|
|
| — |
|
|
| — |
|
|
| — |
|
|
| — |
|
Magnesium1 |
| 100% |
|
|
| — |
|
|
| — |
|
|
| — |
|
|
| — |
|
Silicon |
| 100% |
|
|
| — |
|
|
| — |
|
|
| — |
|
|
| — |
|
Natural Gas |
| 48% |
|
| 47% |
|
| 45% |
|
| 25% |
|
| 20% |
| ||||
Electricity |
| 74% |
|
| 43% |
|
|
| — |
|
|
| — |
|
|
| — |
| |
1. | We have contracts in place to cover the noted percentage of our requirements at a firm or predetermined price, however our primary supplier of magnesium declared force majeure and is supplying less than the full volume contracted and our magnesium cost will fluctuate for any shortfalls until our supplier’s capacity is fully restored. |
Foreign Currency Hedges. We are exposed to foreign currency exchange risk related to certain supply and service agreements with vendors for which payments are due in foreign currency. We, from time to time, in the ordinary course of business, use foreign currency forward contracts in order to mitigate the exposure to currency exchange rate fluctuations related to these purchases.
Fair Value Hedges
We are exposed to foreign currency exchange risk related to firm-price commitments for equipment purchases from foreign manufacturers. We, from time to time, in the ordinary course of business, use third-party hedging instruments to mitigate our exposure to currency exchange rate fluctuations on these purchases and designate such hedging instruments as fair value hedges. Gain or loss related to components excluded from the assessment of effectiveness from these fair value hedges is first recognized in AOCI and subsequently reclassified to Depreciation and amortization on a straight-line basis over the term of the hedge. Gain or loss on the hedged item (e.g., equipment purchase firm commitments) and the remaining gain or loss on the fair value hedge is recorded within Depreciation and amortization in the period that the gain or loss occurs. Any difference between the change in the fair value of the excluded component and amounts recognized in income on a straight-line basis over the term of the hedge is recognized in AOCI.
Non-Designated Hedges of Operational Risks
From time-to-time, we enter into commodity contracts that are not designated as hedging instruments to mitigate certain short‑term commodity impacts, as identified. The gain or loss on these derivatives is recognized within COGS.
Notional Amount of Derivative Contracts
The following table summarizes our derivative positions at December 31, 2019:
Aluminum | ||||||
Maturity Period (month/year) | Notional Amount of Contracts (mmlbs) | |||||
Fixed price purchase contracts | 1/ | 80.3 | ||||
Midwest premium swap contracts 1 | 1/ | 80.2 | ||||
Alloying Metals | Maturity Period (month/year) | Notional Amount of Contracts (mmlbs) | ||||
Fixed price purchase contracts | 1/ | 6.3 | ||||
76
KAISER ALUMINUM CORPORATION AND SUBSIDIARY COMPANIES
NOTES TO CONSOLIDATED FINANCIAL STATEMENTS
Natural Gas | Maturity Period (month/year) | Notional Amount of Contracts (mmbtu) | ||||
Fixed price purchase contracts | 1/ | 5,160,000 | ||||
Electricity | ||||||
Maturity Period (month/year) | Notional Amount of Contracts (Mwh) | |||||
Fixed price purchase contracts | 1/ | 219,000 | ||||
Euro | ||||||
Maturity Period (month/year) | Notional Amount of Contracts (euro) | |||||
Fixed price | 3/22 through 3/23 | 173,400 | ||||
1. | Regional premiums represent the premium over the London Metal Exchange price for primary aluminum which is incurred on our purchases of primary aluminum. |
(Gain) Loss The following table summarizes the |
|
| Year Ended December 31, |
|
| Statements of Consolidated | |||||||||
|
| 2021 |
|
| 2020 |
|
| 2019 |
|
| (Loss) Income Classification | |||
Total of income and expense line items presented in our Statements of Consolidated (Loss) Income in which the effects of hedges are recorded: |
|
|
|
|
|
|
|
|
|
|
|
|
|
|
Cash flow hedges |
| $ | 2,348.1 |
|
| $ | 941.3 |
|
| $ | 1,215.2 |
|
| Cost of products sold |
Fair value hedges |
| n/a |
|
| $ | 52.2 |
|
| n/a |
|
| Depreciation and amortization | ||
Fair value hedges |
| n/a |
|
| $ | 1.4 |
|
| n/a |
|
| Other expense, net | ||
|
|
|
|
|
|
|
|
|
|
|
|
|
|
|
(Gain) loss recognized in our Statements of Consolidated (Loss) Income related to cash flow hedges: |
|
|
|
|
|
|
|
|
|
|
|
|
|
|
Aluminum |
| $ | (35.2 | ) |
| $ | 13.7 |
|
| $ | 18.4 |
|
| Cost of products sold |
Alloying Metals (effective hedges) |
|
| 0.1 |
|
|
| 1.4 |
|
|
| 1.1 |
|
| Cost of products sold |
Alloying Metals (reclassification from AOCI due to forecasted transactions no longer probable of occurring) |
|
| — |
|
|
| 0.8 |
|
|
| — |
|
| Cost of products sold |
Natural gas |
|
| (2.1 | ) |
|
| 1.3 |
|
|
| 0.2 |
|
| Cost of products sold |
Electricity |
|
| (4.7 | ) |
|
| 0.5 |
|
|
| — |
|
| Cost of products sold |
Total (gain) loss recognized in our Statements of Consolidated (Loss) Income related to cash flow hedges |
| $ | (41.9 | ) |
| $ | 17.7 |
|
| $ | 19.7 |
|
|
|
|
|
|
|
|
|
|
|
|
|
|
|
|
|
|
Loss (gain) recognized in our Statements of Consolidated (Loss) Income related to fair value hedges: |
|
|
|
|
|
|
|
|
|
|
|
|
|
|
Foreign exchange contracts |
| $ | — |
|
| $ | (0.1 | ) |
| $ | — |
|
| Depreciation and amortization |
Hedged item |
|
| — |
|
|
| 0.1 |
|
|
| — |
|
| Depreciation and amortization |
Excluded component amortized from AOCI |
|
| — |
|
|
| 0.4 |
|
|
| — |
|
| Depreciation and amortization |
Reclassification from AOCI related to early termination of firm commitment |
|
| — |
|
|
| 0.6 |
|
|
| — |
|
| Other expense, net |
Net settlement related to early termination of forward contracts |
|
| — |
|
|
| (0.7 | ) |
|
| — |
|
| Other expense, net |
Total loss recognized in our Statements of Consolidated (Loss) Income related to fair value hedges |
| $ | — |
|
| $ | 0.3 |
|
| $ | — |
|
|
|
|
|
|
|
|
|
|
|
|
|
|
|
|
|
|
(Gain) loss recognized in our Statements of Consolidated (Loss) Income related to non-designated hedges: |
|
|
|
|
|
|
|
|
|
|
|
|
|
|
Alloying Metals – Realized (gain) loss |
| $ | (5.0 | ) |
| $ | 0.2 |
|
| $ | — |
|
| Cost of products sold |
Alloying Metals – Unrealized loss (gain) |
|
| 1.2 |
|
|
| (3.5 | ) |
|
| — |
|
| Cost of products sold |
Total (gain) loss recognized in our Statements of Consolidated (Loss) Income related to non-designated hedges: |
| $ | (3.8 | ) |
| $ | (3.3 | ) |
| $ | — |
|
|
|
| Year Ended December 31, | |||||||||||||||
| 2019 | 2018 | 2017 | |||||||||||||
Cost of products sold1 | Cost of products sold1 | Cost of products sold1 | Unrealized (gain) loss on derivative instruments | ||||||||||||
| Total amounts of income and expense line items presented in the Statements of Consolidated Income in which the effects of hedges are recorded | $ | 1,215.2 | $ | 1,300.7 | $ | 1,105.3 | $ | (19.4 | ) | ||||||
| Loss (gain) recognized in income related to cash flow hedges: | |||||||||||||||
| Aluminum | $ | 18.4 | $ | 2.1 | $ | — | $ | — | |||||||
| Alloying Metals | 1.1 | 1.0 | (0.9 | ) | — | ||||||||||
| Natural gas | 0.2 | (0.3 | ) | — | — | ||||||||||
| Total loss (gain) recognized in income related to cash flow hedges | $ | 19.7 | $ | 2.8 | $ | (0.9 | ) | $ | — | ||||||
| (Gain) loss recognized in income related to non-designated hedges: | |||||||||||||||
| Aluminum | $ | — | $ | — | $ | (20.4 | ) | $ | (20.9 | ) | |||||
| Natural gas | — | — | 0.7 | 1.4 | |||||||||||
| Foreign exchange | — | — | (0.1 | ) | — | ||||||||||
| Electricity | — | — | — | 0.1 | |||||||||||
| Total gain recognized in income related to non-designated hedges | $ | — | $ | — | $ | (19.8 | ) | $ | (19.4 | ) | |||||
77
KAISER ALUMINUM CORPORATION AND SUBSIDIARY COMPANIES
NOTES TO CONSOLIDATED FINANCIAL STATEMENTS
Fair Values of Derivative Contracts
The fair values of our derivative contracts are based upon trades in liquid markets. Valuation model inputs can be verified, and valuation techniques do not involve significant judgment. The fair values of such financial instruments are classified within Level 21 of the fair value hierarchy.
All of our derivative contracts with counterparties are subject to enforceable master netting arrangements. We reflect the fair value of our derivative contracts on a gross basis on theour Consolidated Balance Sheets. The following table presents the fair value of our derivative financial instruments as of the periods presented (in millions of dollars):
|
| As of December 31, 2021 |
|
| As of December 31, 2020 |
| ||||||||||||||||||
|
| Assets |
|
| Liabilities |
|
| Net Amount |
|
| Assets |
|
| Liabilities |
|
| Net Amount |
| ||||||
Cash Flow Hedges: |
|
|
|
|
|
|
|
|
|
|
|
|
|
|
|
|
|
|
|
|
|
|
|
|
Aluminum – |
|
|
|
|
|
|
|
|
|
|
|
|
|
|
|
|
|
|
|
|
|
|
|
|
Fixed price purchase contracts |
| $ | 12.2 |
|
| $ | (1.1 | ) |
| $ | 11.1 |
|
| $ | 4.6 |
|
| $ | (0.1 | ) |
| $ | 4.5 |
|
Midwest premium swap contracts |
|
| 5.5 |
|
|
| (0.1 | ) |
|
| 5.4 |
|
|
| 0.2 |
|
|
| (1.2 | ) |
|
| (1.0 | ) |
Natural gas – Fixed price purchase contracts |
|
| 3.0 |
|
|
| (0.1 | ) |
|
| 2.9 |
|
|
| 0.2 |
|
|
| (1.5 | ) |
|
| (1.3 | ) |
Electricity – Fixed price purchase contracts |
|
| 4.4 |
|
|
| (0.6 | ) |
|
| 3.8 |
|
|
| 2.0 |
|
|
| (2.5 | ) |
|
| (0.5 | ) |
Total cash flow hedges |
|
| 25.1 |
|
|
| (1.9 | ) |
|
| 23.2 |
|
|
| 7.0 |
|
|
| (5.3 | ) |
|
| 1.7 |
|
|
|
|
|
|
|
|
|
|
|
|
|
|
|
|
|
|
|
|
|
|
|
|
|
|
Non-Designated Hedges: |
|
|
|
|
|
|
|
|
|
|
|
|
|
|
|
|
|
|
|
|
|
|
|
|
Alloying Metals – |
|
|
|
|
|
|
|
|
|
|
|
|
|
|
|
|
|
|
|
|
|
|
|
|
Fixed price purchase contracts |
|
| 1.6 |
|
|
| (0.1 | ) |
|
| 1.5 |
|
|
| 3.9 |
|
|
| 0 |
|
|
| 3.9 |
|
Fixed price sales contracts |
|
| 0 |
|
|
| 0 |
|
|
| 0 |
|
|
| 0 |
|
|
| (1.3 | ) |
|
| (1.3 | ) |
Total non-designated hedges |
|
| 1.6 |
|
|
| (0.1 | ) |
|
| 1.5 |
|
|
| 3.9 |
|
|
| (1.3 | ) |
|
| 2.6 |
|
|
|
|
|
|
|
|
|
|
|
|
|
|
|
|
|
|
|
|
|
|
|
|
|
|
Total |
| $ | 26.7 |
|
| $ | (2.0 | ) |
| $ | 24.7 |
|
| $ | 10.9 |
|
| $ | (6.6 | ) |
| $ | 4.3 |
|
| December 31, 2019 | December 31, 2018 | ||||||||||||||||||||||
| Derivative Assets | Derivative Liabilities | Net Amount | Derivative Assets | Derivative Liabilities | Net Amount | ||||||||||||||||||
| Cash Flow Hedges: | |||||||||||||||||||||||
| Aluminum – | |||||||||||||||||||||||
| Fixed price purchase contracts | $ | 1.0 | $ | (4.1 | ) | $ | (3.1 | ) | $ | 0.1 | $ | (13.2 | ) | $ | (13.1 | ) | |||||||
| Fixed price sales contracts | — | — | — | 0.1 | — | 0.1 | |||||||||||||||||
| Midwest premium swap contracts | — | (1.2 | ) | (1.2 | ) | 3.2 | (0.5 | ) | 2.7 | ||||||||||||||
Alloying Metals – Fixed price purchase contracts | 0.4 | (1.5 | ) | (1.1 | ) | — | (1.7 | ) | (1.7 | ) | |||||||||||||
Natural gas – Fixed price purchase contracts | — | (2.8 | ) | (2.8 | ) | 0.2 | (0.5 | ) | (0.3 | ) | |||||||||||||
Electricity – Fixed price purchase contracts | 2.6 | (1.6 | ) | 1.0 | 0.7 | — | 0.7 | ||||||||||||||||
| Total | $ | 4.0 | $ | (11.2 | ) | $ | (7.2 | ) | $ | 4.3 | $ | (15.9 | ) | $ | (11.6 | ) | |||||||
The following table presents the total amounts of derivative assets and liabilities on our Consolidated Balance Sheets as of the periods presented (in millions of dollars):
|
| As of December 31, |
| |||||
|
| 2021 |
|
| 2020 |
| ||
Derivative assets: |
|
|
|
|
|
|
|
|
Prepaid expenses and other current assets |
| $ | 25.0 |
|
| $ | 8.4 |
|
Other assets |
|
| 1.7 |
|
|
| 2.5 |
|
Total derivative assets |
| $ | 26.7 |
|
| $ | 10.9 |
|
Derivative liabilities: |
|
|
|
|
|
|
|
|
Other accrued liabilities |
| $ | (1.9 | ) |
| $ | (3.8 | ) |
Long-term liabilities |
|
| (0.1 | ) |
|
| (2.8 | ) |
Total derivative liabilities |
| $ | (2.0 | ) |
| $ | (6.6 | ) |
| December 31, 2019 | December 31, 2018 | ||||||
| Derivative assets: | |||||||
| Prepaid expenses and other current assets | $ | 2.1 | $ | 3.4 | |||
| Other assets | 1.9 | 0.9 | |||||
| Total derivative assets | $ | 4.0 | $ | 4.3 | |||
| Derivative liabilities: | |||||||
| Other accrued liabilities | $ | (7.6 | ) | $ | (13.2 | ) | |
| Long-term liabilities | (3.6 | ) | (2.7 | ) | |||
| Total derivative liabilities | $ | (11.2 | ) | $ | (15.9 | ) | |
Fair Value of Other Financial Instruments
| Level 1 | Level 2 | Level 3 | Total | ||||||||||||
| Cash and cash equivalents | $ | 28.2 | $ | 236.1 | $ | — | $ | 264.3 | |||||||
| Short-term investments | — | 78.7 | — | 78.7 | |||||||||||
| Total | $ | 28.2 | $ | 314.8 | $ | — | $ | 343.0 | |||||||
| Level 1 | Level 2 | Level 3 | Total | ||||||||||||
| Cash and cash equivalents | $ | 22.9 | $ | 102.7 | $ | — | $ | 125.6 | |||||||
| Short-term investments | — | 36.7 | — | 36.7 | |||||||||||
| Total | $ | 22.9 | $ | 139.4 | $ | — | $ | 162.3 | |||||||
All Other Financial Assets and Liabilities.
We believe that the fair values of our accounts receivable, contract assets, accounts payable and accrued liabilities approximate their respective carrying values due to their short maturities and nominal credit risk.9. Debt and Credit Facility
Senior Notes
4.50% Senior Notes.
In78
KAISER ALUMINUM CORPORATION AND SUBSIDIARY COMPANIES
NOTES TO CONSOLIDATED FINANCIAL STATEMENTS
The 4.625%4.50% Senior Notes were offered and sold in transactions not required to be registered under the Securities Act of 1933 and are not entitled to any registration rights. The fair value of the outstanding 4.625%4.50% Senior Notes, which are Level 1 liabilities calculated based on pricing from trades around the balance sheet date, was approximately $513.5$542.6 million at December 31, 2019.
The 4.50% Senior Notes are unsecured obligations and are guaranteed by each of our existing and future domestic subsidiaries that is a borrower or guarantor under the revolving credit facility (see Revolving Credit Facility below).
We may redeem the 4.50% Senior Notes at our option in whole or part at any time on or after June 1, 2026 at a redemption price (expressed as a percentage of principal amount) of 102.25%, declining to 101.50%, 100.75% and 100% on or after June 1, 2027, June 1, 2028 and June 1, 2029, respectively, in each case plus any accrued and unpaid interest. At any time prior to June 1, 2026, we may also redeem some or all of the 4.50% Senior Notes at a redemption price equal to 100% of the principal amount of the 4.50% Senior Notes redeemed, plus the “applicable premium” (as defined in the indenture) as of the redemption date and any accrued and unpaid interest thereon. In addition, subject to the conditions set forth in the indenture, at any time prior to June 1, 2026, we may also redeem up to 40% of the 4.50% Senior Notes using the net proceeds from certain equity offerings at a redemption price equal to 104.50% of the principal amount plus any accrued and unpaid interest.
Holders of the 4.50% Senior Notes have the right to require us to repurchase the 4.50% Senior Notes at a price in cash equal to 101% of the aggregate principal amount plus any accrued and unpaid interest following the occurrence of both: (i) a change of control and (ii) a “ratings decline” (as defined in the indenture). A change of control includes: (i) the sale, lease or transfer of all or substantially all of our assets; (ii) certain ownership changes; (iii) certain recapitalizations, mergers and dispositions; and (iv) stockholder approval of any plan or proposal for the liquidation or dissolution of us. We may also be required to offer to repurchase the 4.50% Senior Notes at 100% of the principal amount, plus any accrued and unpaid interest, with the net proceeds of certain asset sales.
6.50% Senior Notes. In April 2020 and May 2020, we issued $300.0 million and $50.0 million, respectively, aggregate principal amounts of our 6.50% unsecured senior notes due May 1, 2025 at 100% and 101%, respectively, of the principal amounts (“6.50% Senior Notes”). On May 21, 2021, we redeemed in full $350.0 million in aggregate principal amount of our 6.50% Senior Notes at a redemption price of 108.83% of the principal amount plus $1.3 million of accrued and unpaid interest for a total net cash outflow of $382.2 million. Upon redemption of the 6.50% Senior Notes, we recorded a loss on extinguishment of debt of $35.9 millionwithin Other expense, net, on our Statements of Consolidated (Loss) Income, which included the premium payment of $30.9 million and a write-off of the remaining unamortized premium and debt issuance costs of $5.0 million(See Note 13 for details). The effective interest rate of the 6.50% Senior Notes was approximately 6.8% per annum, taking into account the amortization of premium and debt issuance costs. Interest expense, including amortization of debt issuance costs, relating to the 6.50% Senior Notes was $9.2 million and $16.2 million for the years ended December 31, 2021 and December 31, 2020, respectively. The fair value of the outstanding 6.50% Senior Notes, which are Level 1 liabilities calculated based on pricing from trades around the balance sheet date, was approximately $376.8 million at December 31, 2020.
4.625% Senior Notes. In November 2019, we issued $500.0 million principal amount of 4.625% unsecured senior notes due March 1, 2028 at 100% of the principal amount. The unamortized amount of debt issuance costs as of December 31, 2021 was $5.6 million. Interest expense, including amortization of debt issuance costs, relating to the 4.625% Senior Notes was $24.0 million for both years ended December 31, 2021 and December 31, 2020. The effective interest rate of the 4.625% Senior Notes was approximately 4.8% per annum, taking into account the amortization of debt issuance costs. The fair value of the outstanding 4.625% Senior Notes, which are Level 1 liabilities, was approximately $506.9 millionand $521.3 million at December 31, 2021 and December 31, 2020, respectively.
The 4.625% Senior Notes are unsecured obligations and are guaranteed by each of our existing and future domestic subsidiaries that is a borrower or guarantor under the revolving credit facility (see Revolving Credit Facility below).
We may redeem the 4.625% Senior Notes at our option in whole or part at any time on or after March 1, 2023 at redemption prices (expressed as percentages of principal amount) of 102.313%, declining to 101.156% and 100% on or after March 1, 2024 and March 1, 2025, respectively, in each case plus any accrued and unpaid interest to the applicable redemption date. At any time prior to March 1, 2023, we may also redeem some or all of the 4.625% Senior Notes at a redemption price equal to 100% of the principal amount of the 4.625% Senior Notes redeemed, plus the "applicable premium"“applicable premium” (as defined in the indenture) as of the redemption date and any accrued and unpaid interest thereon. In addition, subject to the conditions set forth in the indenture,
79
KAISER ALUMINUM CORPORATION AND SUBSIDIARY COMPANIES
NOTES TO CONSOLIDATED FINANCIAL STATEMENTS
Holders of the 4.625% Senior Notes have the right to require us to repurchase the 4.625% Senior Notes at a price in cash equal to 101% of the aggregate principal amount plus any accrued and unpaid interest following the occurrence of both: (i) a change of control and (ii) a "ratings decline"“ratings decline” (as defined in the indenture). A change of control includes: (i) the sale, lease or transfer of all or substantially all of our assets; (ii) certain ownership changes; (iii) certain recapitalizations, mergers and dispositions; and (iv) stockholder approval of any plan or proposal for the liquidation or dissolution of us. We may also be required to offer to repurchase the 4.625% Senior Notes at 100% of the principal amount, plus any accrued and unpaid interest, with the net proceeds of certain asset sales.
The indenture governing the 4.625% Senior Notes (“indenture”) places limitations on our and our restricted subsidiaries’ ability to, among other things: (i) incur liens; (ii) consolidate, merge or sell all or substantially all of our and our restricted subsidiaries’ assets; (iii) incur or guarantee additional indebtedness; (iv) enter into transactions with affiliates; and (v) make “restricted payments” (as defined in the indenture to include certain loans, investments, dividend payments, share repurchases and prepayments, redemptions and repurchases of certain indebtedness). Certain types and amounts of restricted payments are allowed by various provisions of the indenture. In particular, the indenture provisions permit us to make restricted payments in any amount if, after giving effect to such restricted payments, our “consolidated net debt ratio” (as defined in the indenture) equals or is less than 2.75:1.00.
5.875% Senior Notes.
In May 2016, we issued $375.0 millionRevolving Credit Facility
In October 2019, we entered into a revolving credit facility with Wells Fargo Bank, National Association, as administrative agent, and the other financial institutions party thereto ("(“Revolving Credit Facility"Facility”). The Revolving Credit Facility provides us with a $375.0 million funding commitment through October 30, 2024. Joining us as borrowers ("Co-Borrowers"(“Co-Borrowers”) under the Revolving Credit Facility are threefour of our wholly owned domestic operating subsidiaries: (i) Kaiser Aluminum Investments Company,Company; (ii) Kaiser Aluminum Fabricated Products, LLC andLLC; (iii) Kaiser Aluminum Washington, LLC; and (iv) Kaiser Aluminum Warrick, LLC. The Revolving Credit Facility replaces the previously existing facility that was due to mature in December 2020.
The Revolving Credit Facility is secured by a first priority lien on substantially all of the Co-borrowers'Co-borrowers’ accounts receivable, inventory, cash or cash equivalents and certain other related assets and proceeds, as well as certain machinery and equipment. Under the Revolving Credit Facility, we are able to borrow from time to time an aggregate amount equal to the lesser of $375.0 million and a borrowing base comprised of: (i) 90% of eligible accounts receivable in which the account debtor is an investment-grade domestic account debtor; (ii) 85% of eligible accounts receivable in which the account debtor is a domestic account debtor, but not an investment-grade domestic account debtor; (iii) the lesser of (a) 85% of eligible accounts receivable in which the account debtor is not a domestic account debtor and (b) an amount equal to 25% of the lesser of (a) the maximum revolver amount or (b) the borrowing base; (iv) the lesser of (a) the product of 75% multiplied by the value of eligible inventory and (b) the product of 85% multiplied by the net recovery percentage identified in the most recent acceptable appraisal of inventory, multiplied by the value of eligible inventory; (v) certain eligible machinery and equipment supporting up to $71.5 million of borrowing availability; and (vi) at our option, 100% of eligible cash, reduced by certain reserves, all as specified in the Revolving Credit Facility. Up to a maximum of $20.0$40.0 million of availability under the Revolving Credit Facility may be utilized for letters of credit.
At maturity, all principal amounts outstanding under the Revolving Credit Facility will be due and payable. Borrowings under the Revolving Credit Facility bear interest at a rate equal to either a base prime rate, as defined in the Revolving Credit Facility or LIBOR,the London Interbank Offered Rate (“LIBOR”), plus, in each case, a specified variable percentage determined by reference to the then-remaining borrowing availability under the Revolving Credit Facility. The initialApplicable Margin for Base Rate Loans is 25 basis points, while the Applicable Margin for LIBOR applicable marginRate Loans is 125 basis points. We will also pay a monthly commitment fee equal to 0.25% per annum multiplied by the result of the aggregate amount of revolver commitments, less the average revolver usage during the immediately preceding month. The Revolving Credit Facility may, subject to certain conditions and the agreement of lenders thereunder, be increased up to $575.0 million, subject to certain conditions and the agreement of lenders thereunder.
80
KAISER ALUMINUM CORPORATION AND SUBSIDIARY COMPANIES
NOTES TO CONSOLIDATED FINANCIAL STATEMENTS
Amounts owed under the Revolving Credit Facility may be accelerated upon the occurrence of various events of default, including, without limitation, the failure to make principal or interest payments when due and breaches of covenants, representations and warranties set forth therein. The Revolving Credit Facility places limitations on our ability and the ability of certain of our subsidiaries to, among other things,things: (i) grant liens,liens; (ii) engage in mergers,mergers; (iii) sell assets,assets; (iv) incur debt,debt; (v) enter into sale and leaseback transactions,transactions; (vi) make investments,investments; (vii) undertake transactions with affiliates,affiliates; (viii) prepay certain debt,debt; (ix) pay dividendsdividends; and (x) repurchase shares. We are allowed to prepay debt, pay dividends and repurchase shares in any amount if, in accordance with terms as defined in the Revolving Credit Facility, no "default"“default” or "event“event of default"default” has occurred and is continuing or would result after giving effect to such action and, after giving effect to such proposed action, "excess availability"“excess availability” calculated on a pro forma basis is greater than a defined minimum level. A lower minimum level applies if the "fixed“fixed charge coverage ratio,"” calculated on a pro forma basis after giving effect to such proposed action for the period of four consecutive fiscal quarters ending on the last day of the most recently ended fiscal quarter for which financial statements have been delivered, is greater than 1.10:1.0.
In addition, we are required to maintain a fixed charge coverage ratio on a consolidated basis at or above 1.0:1.0 if borrowing availability under the Revolving Credit Facility is less than a defined minimum level. At December 31, 2019,2021, we were in compliance with all covenants contained in the Revolving Credit Facility.
The following table summarizes availability and usage of our Revolving Credit Facility as determined by a borrowing base calculated as of December 31, 2021 (in millions of dollars):
Revolving Credit Facility borrowing commitment |
| $ | 375.0 |
|
Borrowing base availability |
| $ | 375.0 |
|
Less: Outstanding borrowings under Revolving Credit Facility |
|
| 0 |
|
Less: Outstanding letters of credit under Revolving Credit Facility |
|
| (7.7 | ) |
Remaining borrowing availability |
| $ | 367.3 |
|
10. Commitments and Contingencies
Commitments.
We have a variety of financial commitments, includingCAROs.
The inputs in estimating the fair value of CAROs include: (i) the timing of when any such CARO cash flows may be incurred; (ii) incremental costs associated with special handling or treatment of CARO materials; and (iii) the credit-adjusted risk-free rate applicable at the time additional CARO cash flows are estimated; all of these are considered Level 3 inputs as they involve significant judgment from us.The following table summarizes the activity relating to our CARO liabilities (in millions of dollars):
|
| Year Ended December 31, |
| |||||||||
|
| 2021 |
|
| 2020 |
|
| 2019 |
| |||
Beginning balance |
| $ | 6.7 |
|
| $ | 6.5 |
|
| $ | 6.3 |
|
Liabilities settled during the period |
|
| (0.1 | ) |
|
| (0.1 | ) |
|
| (0.2 | ) |
Accretion expense |
|
| 0.6 |
|
|
| 0.5 |
|
|
| 0.5 |
|
Adjustment to accretion expense due to revisions to estimated cash flow and timing of expenditure1 |
|
| — |
|
|
| (0.2 | ) |
|
| (0.1 | ) |
Ending balance |
| $ | 7.2 |
|
| $ | 6.7 |
|
| $ | 6.5 |
|
| Year Ended December 31, | ||||||||||||
| 2019 | 2018 | 2017 | ||||||||||
| Beginning balance | $ | 6.3 | $ | 5.9 | $ | 5.5 | ||||||
| Liabilities settled during the period | (0.2 | ) | — | — | ||||||||
| Accretion expense | 0.5 | 0.4 | 0.4 | |||||||||
Adjustment to accretion expense due to revisions to estimated cash flow and timing of expenditure1 | (0.1 | ) | — | — | ||||||||
| Ending balance | $ | 6.5 | $ | 6.3 | $ | 5.9 | ||||||
1. | The adjustments |
The estimated fair value of CARO liabilities were based upon the application of a weighted-average credit-adjusted risk-free rate of 8.7% at both December 31, 20192021 and December 31, 2018.2020. CAROs are included in Other accrued liabilities or Long-term liabilities, as appropriate.
81
KAISER ALUMINUM CORPORATION AND SUBSIDIARY COMPANIES
NOTES TO CONSOLIDATED FINANCIAL STATEMENTS
Warrick Rolling Mill Potential CARO Liability. We identified potential CAROs related to the future removal and disposal of asbestos that is contained within the Warrick rolling mill facility. We believe that the asbestos is appropriately contained in accordance with current environmental regulations. If the facility were demolished or subject to renovation activities that disturb the asbestos, certain environmental regulations are in place which specify the manner in which the asbestos must be handled and disposed. We are required to record the fair value of CAROs if they can be reasonably estimated. As of December 31, 2021, we are in the process of evaluating and determining the fair value of a potential CARO, if any, acquired as part of the Warrick acquisition. NaN liability has been recorded on our accompanying Consolidated Balance Sheets as the liability is currently indeterminable. We may conclude at a future date that a CARO exists and we could be required to record a liability for the related obligations in amounts that are material to our consolidated financial statements. While we do not currently expect that the CARO liability will be material to our consolidated financial statements, there can be no assurance as to the existence of a CARO obligation and corresponding liabilities that we may be required to record in the future.
Environmental Contingencies. We are subject to a number of environmental laws and regulations, to potential fines or penalties assessed for alleged breaches of such laws and regulations and to potential claims based upon such laws and regulations. We are also subject to legacy environmental contingencies related to activities that occurred at operating facilities prior to July 6, 2006, which represent the majority of our environmental accruals. The status of these environmental
We continue to pursue remediation activities, primarily to address the historical use of oils containing polychlorinated biphenyls ("PCBs"(“PCBs”) at our Trentwood facility. Our remediation efforts are in collaboration with the Washington State Department of Ecology ("Washington State Ecology"(“Ecology”), to which we submitted a feasibility study in 2012 of remediation alternatives and from which we received permission to begin certain remediation activities pursuant to a signed work order. As weWe have finishedcompleted a number of sections of the work plan weand have received satisfactory completion approval from Washington State Ecology on satisfactory completion of those sections. Additionally, inIn cooperation with Washington State Ecology, we constructed an experimental treatment facility to determine the treatability and evaluate the feasibility of removing PCBs from ground water under ourthe Trentwood facility,facility. In 2015, we constructed an experimental treatment facility and began treatment operations involving a walnut shell filtration system, which we optimized for maximum PCB capture during 2020. Furthermore, based on advancements in 2016.technology, we signed an Amended Agreed Order with Ecology in 2020 to evaluate and implement new technologies for PCB removal from groundwater on a pilot basis. The primary technology we are evaluating is Ultraviolet Light Advanced Oxidation Process. As the long-term success of the new methodology cannot be reasonably determined at this time, it is possible we may need to make upward adjustments to our related accruals and cost estimates as the long-termlong term results become available.
Pursuant to a consent agreement with the Ohio Environmental Protection Agency ("OEPA"(“OEPA”), we initiated an investigational study of our Newark facility related to historical on-site waste disposal. Incontamination. During the fourth quarter ofended December 31, 2018, we submitted our remedial investigation study to the OEPA which is subject to theirfor review and approval. FollowingThe final remedial investigation report was approved by the OEPA approval ofduring the remedial investigational study, we will then preparequarter ended December 31, 2020. We are currently preparing the finalrequired feasibility study, and update estimateswhich we expect to submit to the OEPA for probable and estimable remediation, if any.review during the quarter ending September 30, 2022. The actual and final remediation cost for remediationestimates will not be fully determinable until a finalthe feasibility study is submitted andhas been accepted by the OEPA and the selected remediation design work plans are prepared,completed, which is expectedwe expect to occur in the next six20 to 1226 months.
The following table presents the changes in our environmental accrual, which was primarily included in Long-term liabilities (in millions of dollars):
|
| Year Ended December 31, |
| |||||||||
|
| 2021 |
|
| 2020 |
|
| 2019 |
| |||
Beginning balance |
| $ | 18.7 |
|
| $ | 17.0 |
|
| $ | 16.9 |
|
Additional accruals |
|
| 0.1 |
|
|
| 5.2 |
|
|
| 1.8 |
|
Less: expenditures |
|
| (2.0 | ) |
|
| (3.5 | ) |
|
| (1.7 | ) |
Ending balance |
| $ | 16.8 |
|
| $ | 18.7 |
|
| $ | 17.0 |
|
| Year Ended December 31, | ||||||||||||
| 2019 | 2018 | 2017 | ||||||||||
| Beginning balance | $ | 16.9 | $ | 16.6 | $ | 17.2 | ||||||
| Additional accruals | 1.8 | 1.7 | 0.3 | |||||||||
| Less: expenditures | (1.7 | ) | (1.4 | ) | (0.9 | ) | ||||||
| Ending balance | $ | 17.0 | $ | 16.9 | $ | 16.6 | ||||||
At December 31, 2019,2021, our environmental accrual of $17.0$16.8 million represented our estimate of the incremental remediation cost based on: (i) proposed alternatives in the final feasibility study related to the Trentwood facility; (ii) currently available facts with respect to our Newark facility; and (iii) facts related to certain other locations owned or formerly owned by us. In accordance with approved and proposed remediation action plans, we expect that the implementation and ongoing monitoring could occur over a period of 30 or more years.
82
KAISER ALUMINUM CORPORATION AND SUBSIDIARY COMPANIES
NOTES TO CONSOLIDATED FINANCIAL STATEMENTS
As additional facts are developed, feasibility studies are completed, remediation plans are modified, necessary regulatory approvals for the implementation of remediation are obtained, alternative technologies are developed and/or other factors change, there may be revisions to management'smanagement’s estimates and actual costs may exceed the current environmental accruals. We believe at this time that it is reasonably possible that undiscounted costs associated with these environmental matters may exceed current accruals by amounts that could be, in the aggregate, up to an estimated $11.6 million over the remediation period. It is reasonably possible that our recorded estimate will change in the next 12 months.
Other Contingencies.
We are party to various lawsuits, claims, investigations and administrative proceedings that arise in connection with past and current operations. We evaluate such matters on a case-by-case basis and our policy is to vigorously contest any such claims we believe are without merit. We accrue for a legal liability when it is both probable that a liability has been incurred and the amount of the loss is reasonably estimable. Quarterly, in addition to when changes in facts and circumstances require it, we review and adjust these accruals to reflect the impacts of negotiations, settlements, rulings, advice of legal counsel and other information and events pertaining to a particular case. While uncertainties are inherent in the final outcome of such matters and it is presently impossible to determine the actual cost that may ultimately be incurred, we believe that we have sufficiently accrued for such matters and that the ultimate resolution of pending matters will not have a material impact on our consolidated financial position, operating results or liquidity.83
KAISER ALUMINUM CORPORATION AND SUBSIDIARY COMPANIES
NOTES TO CONSOLIDATED FINANCIAL STATEMENTS
11. Accumulated Other Comprehensive (Loss) Income
The following table presents the changes in the accumulated balances for each component of AOCI for the periods presented (in millions of dollars):
| Year Ended December 31, |
| ||||||||||
|
| 2021 |
|
| 2020 |
|
| 2019 |
| |||
Pension and Other Postretirement Benefits: |
|
|
|
|
|
|
|
|
|
|
|
|
Beginning balance |
| $ | (19.8 | ) |
| $ | (33.2 | ) |
| $ | (35.6 | ) |
Actuarial gain (loss) arising during the period |
|
| 8.0 |
|
|
| 0.4 |
|
|
| (0.4 | ) |
Less: income tax (expense) benefit |
|
| (1.9 | ) |
|
| (0.1 | ) |
|
| 0.1 |
|
Net actuarial gain (loss) arising during the period |
|
| 6.1 |
|
|
| 0.3 |
|
|
| (0.3 | ) |
Prior service (cost) credit arising during the period |
|
| (14.0 | ) |
|
| 12.3 |
|
|
| (2.5 | ) |
Less: income tax benefit (expense) |
|
| 3.3 |
|
|
| (3.0 | ) |
|
| 0.6 |
|
Net prior service (cost) credit arising during the period |
|
| (10.7 | ) |
|
| 9.3 |
|
|
| (1.9 | ) |
Amortization of net actuarial loss1 |
|
| 0.4 |
|
|
| 0.4 |
|
|
| 0.5 |
|
Amortization of prior service cost1 |
|
| 3.5 |
|
|
| 4.7 |
|
|
| 5.6 |
|
Less: income tax expense2 |
|
| (0.9 | ) |
|
| (1.2 | ) |
|
| (1.4 | ) |
Net amortization reclassified from AOCI to Net (loss) income |
|
| 3.0 |
|
|
| 3.9 |
|
|
| 4.7 |
|
Translation impact on Canadian pension plan AOCI balance |
|
| — |
|
|
| (0.1 | ) |
|
| (0.1 | ) |
Other comprehensive (loss) income, net of tax |
|
| (1.6 | ) |
|
| 13.4 |
|
|
| 2.4 |
|
Ending balance |
| $ | (21.4 | ) |
| $ | (19.8 | ) |
| $ | (33.2 | ) |
|
|
|
|
|
|
|
|
|
|
|
|
|
Available for Sale Securities: |
|
|
|
|
|
|
|
|
|
|
|
|
Beginning balance |
| $ | — |
|
| $ | 0.3 |
|
| $ | 0.3 |
|
Unrealized gain on available for sale securities |
|
| — |
|
|
| 1.3 |
|
|
| 4.4 |
|
Less: income tax benefit (expense) |
|
| — |
|
|
| (0.7 | ) |
|
| (1.1 | ) |
Net unrealized gain on available for sale securities |
|
| — |
|
|
| 0.6 |
|
|
| 3.3 |
|
Reclassification of unrealized loss (gain) upon sale of available for sale securities3 |
|
| — |
|
|
| (2.0 | ) |
|
| (4.4 | ) |
Less: income tax benefit2 |
|
| — |
|
|
| 1.1 |
|
|
| 1.1 |
|
Net loss (gain) reclassified from AOCI to Net (loss) income |
|
| — |
|
|
| (0.9 | ) |
|
| (3.3 | ) |
Other comprehensive income (loss), net of tax |
|
| — |
|
|
| (0.3 | ) |
|
| — |
|
Ending balance |
| $ | — |
|
| $ | — |
|
| $ | 0.3 |
|
|
|
|
|
|
|
|
|
|
|
|
|
|
Cash Flow Hedges: |
|
|
|
|
|
|
|
|
|
|
|
|
Beginning balance |
| $ | 1.1 |
|
| $ | (5.6 | ) |
| $ | (13.4 | ) |
Unrealized gain (loss) on cash flow hedges |
|
| 63.6 |
|
|
| (9.4 | ) |
|
| (9.5 | ) |
Less: income tax (expense) benefit |
|
| (15.0 | ) |
|
| 2.3 |
|
|
| 2.3 |
|
Net unrealized gain (loss) on cash flow hedges |
|
| 48.6 |
|
|
| (7.1 | ) |
|
| (7.2 | ) |
Reclassification of unrealized (gain) loss upon settlement of cash flow hedges |
|
| (41.9 | ) |
|
| 17.4 |
|
|
| 19.7 |
|
Reclassification due to forecasted transactions no longer probable of occurring |
|
| — |
|
|
| 0.8 |
|
|
| — |
|
Less: income tax benefit (expense)2 |
|
| 9.9 |
|
|
| (4.4 | ) |
|
| (4.7 | ) |
Net (gain) loss reclassified from AOCI to Net (loss) income |
|
| (32.0 | ) |
|
| 13.8 |
|
|
| 15.0 |
|
Other comprehensive income, net of tax |
|
| 16.6 |
|
|
| 6.7 |
|
|
| 7.8 |
|
Ending balance4 |
| $ | 17.7 |
|
| $ | 1.1 |
|
| $ | (5.6 | ) |
|
|
|
|
|
|
|
|
|
|
|
|
|
Fair Value Hedges: |
|
|
|
|
|
|
|
|
|
|
|
|
Beginning balance |
| $ | — |
|
| $ | — |
|
| $ | — |
|
Unrealized gain (loss) on fair value hedges |
|
| — |
|
|
| (1.0 | ) |
|
| — |
|
Less: income tax benefit |
|
| — |
|
|
| 0.2 |
|
|
| — |
|
Net unrealized gain (loss) on fair value hedges |
|
| — |
|
|
| (0.8 | ) |
|
| — |
|
Excluded component amortized from OCI to Net (loss) income |
|
| — |
|
|
| 0.4 |
|
|
| — |
|
Reclassification due to cancellation of firm commitment |
|
| — |
|
|
| 0.6 |
|
|
| — |
|
Less: income tax benefit (expense)2 |
|
| — |
|
|
| (0.2 | ) |
|
| — |
|
Net loss reclassified from AOCI to Net (loss) income |
|
| — |
|
|
| 0.8 |
|
|
| — |
|
Other comprehensive income, net of tax |
|
| — |
|
|
| — |
|
|
| — |
|
Ending balance |
| $ | — |
|
| $ | — |
|
| $ | — |
|
|
|
|
|
|
|
|
|
|
|
|
|
|
Foreign Currency Translation: |
|
|
|
|
|
|
|
|
|
|
|
|
Beginning balance |
| $ | — |
|
| $ | (0.1 | ) |
| $ | (0.1 | ) |
Other comprehensive income, net of tax |
|
| — |
|
|
| 0.1 |
|
|
| — |
|
Ending balance |
| $ | — |
|
| $ | — |
|
| $ | (0.1 | ) |
Total AOCI ending balance |
| $ | (3.7 | ) |
| $ | (18.7 | ) |
| $ | (38.6 | ) |
| Year Ended December 31, | ||||||||||||
| 2019 | 2018 | 2017 | ||||||||||
| Defined Benefit Pension Plan and VEBAs: | ||||||||||||
| Beginning balance | $ | (35.6 | ) | $ | (38.5 | ) | $ | (37.1 | ) | |||
| Actuarial (loss) gain arising during the period | (0.4 | ) | 4.4 | (0.3 | ) | |||||||
| Less: income tax benefit (expense) | 0.1 | (1.1 | ) | 0.1 | ||||||||
| Net actuarial (loss) gain arising during the period | (0.3 | ) | 3.3 | (0.2 | ) | |||||||
| Prior service cost arising during the period | (2.5 | ) | (6.9 | ) | (7.3 | ) | ||||||
| Less: income tax benefit | 0.6 | 1.7 | 2.7 | |||||||||
| Net prior service cost arising during the period | (1.9 | ) | (5.2 | ) | (4.6 | ) | ||||||
Amortization of net actuarial loss1 | 0.5 | 0.9 | 0.9 | |||||||||
Amortization of prior service cost1 | 5.6 | 5.4 | 4.7 | |||||||||
Less: income tax expense2 | (1.4 | ) | (1.5 | ) | (2.1 | ) | ||||||
| Net amortization and reclassification from AOCI to Net income | 4.7 | 4.8 | 3.5 | |||||||||
| Translation impact on Canadian pension plan AOCI balance | (0.1 | ) | — | (0.1 | ) | |||||||
| Other comprehensive income (loss), net of tax | 2.4 | 2.9 | (1.4 | ) | ||||||||
| Ending balance | $ | (33.2 | ) | $ | (35.6 | ) | $ | (38.5 | ) | |||
| Available for Sale Securities: | ||||||||||||
Beginning balance3 | $ | 0.3 | $ | 0.9 | $ | 0.8 | ||||||
| Unrealized gain on available for sale securities | 4.4 | 4.7 | 4.0 | |||||||||
| Less: income tax expense | (1.1 | ) | (1.1 | ) | (1.5 | ) | ||||||
| Net unrealized gain on available for sale securities | 3.3 | 3.6 | 2.5 | |||||||||
Reclassification of unrealized gain upon sale of available for sale securities4 | (4.4 | ) | (5.4 | ) | (3.2 | ) | ||||||
Less: income tax benefit2 | 1.1 | 1.2 | 1.2 | |||||||||
| Net gain reclassified from AOCI to Net income | (3.3 | ) | (4.2 | ) | (2.0 | ) | ||||||
| Other comprehensive (loss) income, net of tax | — | (0.6 | ) | 0.5 | ||||||||
| Ending balance | $ | 0.3 | $ | 0.3 | $ | 1.3 | ||||||
84
KAISER ALUMINUM CORPORATION AND SUBSIDIARY COMPANIES
NOTES TO CONSOLIDATED FINANCIAL STATEMENTS
| Year Ended December 31, | ||||||||||||
| 2019 | 2018 | 2017 | ||||||||||
| Cash Flow Hedges: | ||||||||||||
| Beginning balance | $ | (13.4 | ) | $ | 0.5 | $ | (0.2 | ) | ||||
| Unrealized (loss) gain on cash flow hedges | (9.5 | ) | (21.2 | ) | 1.8 | |||||||
| Less: income tax benefit (expense) | 2.3 | 5.3 | (0.7 | ) | ||||||||
| Net unrealized (loss) gain on cash flow hedges | (7.2 | ) | (15.9 | ) | 1.1 | |||||||
Reclassification of unrealized loss (gain) upon settlement of cash flow hedges5 | 19.7 | 2.7 | (0.6 | ) | ||||||||
Less: income tax (expense) benefit2 | (4.7 | ) | (0.7 | ) | 0.2 | |||||||
| Net loss (gain) reclassified from AOCI to Net income | 15.0 | 2.0 | (0.4 | ) | ||||||||
| Other comprehensive income (loss), net of tax | 7.8 | (13.9 | ) | 0.7 | ||||||||
| Ending balance | $ | (5.6 | ) | $ | (13.4 | ) | $ | 0.5 | ||||
| Foreign Currency Translation: | ||||||||||||
| Beginning balance | $ | (0.1 | ) | $ | — | $ | (0.2 | ) | ||||
| Other comprehensive (loss) income, net of tax | — | (0.1 | ) | 0.2 | ||||||||
| Ending balance | $ | (0.1 | ) | $ | (0.1 | ) | $ | — | ||||
| Total AOCI ending balance | $ | (38.6 | ) | $ | (48.8 | ) | $ | (36.7 | ) | |||
1. | Amounts amortized out of AOCI |
2. | Income tax amounts reclassified out of AOCI were included as a component of Income tax |
3. |
| Amounts reclassified out of AOCI relating to sales of available for sale securities were included as a component of Other expense, net. We use the specific identification method to determine the amount reclassified out of AOCI. |
4. | |
|
12. Restructuring
2020 Plan. In order to align our projected operational requirements with reduced short and mid-term commercial aerospace demand as a result of the COVID-19 pandemic, we initiated a restructuring plan during the quarter ended June 30, 2020, which consisted primarily of reduction in force measures (“2020 Plan”).
Employee costs related to the 2020 Plan were included within Restructuring (benefit) costs in our Statements of Consolidated (Loss) Income and consisted of severance, voluntary buyout packages, outplacement services, estimated medical costs and associated payroll costs. Substantially all of the costs associated with the restructuring efforts initiated under the 2020 Plan were incurred and expensed as of December 31, 2020. As of December 31, 2021, we completed the 2020 Plan and do not anticipate incurring restructuring charges in connection with this plan in future periods.
We have incurred total restructuring costs of $6.7 million under the 2020 Plan through December 31, 2021.
The following table summarizes activity relating to restructuring plan liabilities (in millions of dollars):
|
| Year Ended December 31, |
| |||||
|
| 2021 |
|
| 2020 |
| ||
Beginning balance |
| $ | 1.4 |
|
| $ | — |
|
Restructuring costs |
|
| — |
|
|
| 12.4 |
|
Cash payments |
|
| (0.6 | ) |
|
| (6.1 | ) |
Other adjustments1 |
|
| (0.8 | ) |
|
| (4.9 | ) |
Ending balance |
| $ | — |
|
| $ | 1.4 |
|
1 | In December 2020, March 2021 and May 2021, we revised our production forecasts, thereby reducing the estimated number of headcount reductions necessary as compared with our initial restructuring plan. These reductions to accommodate the revised headcount requirements are included in Other adjustments with an offset to Restructuring (benefit) costs. |
13. Other Expense, Net
Other expense, net, consisted of the following for the periods presented (in millions of dollars):
|
| Year Ended December 31, |
| |||||||||
|
| 2021 |
|
| 2020 |
|
| 2019 |
| |||
Interest income |
| $ | 0.2 |
|
| $ | 0.6 |
|
| $ | 0.6 |
|
Net periodic postretirement benefit cost |
|
| (4.1 | ) |
|
| (4.7 | ) |
|
| (6.5 | ) |
Realized gain on available for sale securities |
|
| — |
|
|
| 2.0 |
|
|
| 4.4 |
|
Unrealized (loss) gain on equity securities |
|
| (0.2 | ) |
|
| 0.7 |
|
|
| 0.7 |
|
(Loss) gain on extinguishment of debt – Note 9 |
|
| (35.9 | ) |
|
| — |
|
|
| (20.3 | ) |
All other, net |
|
| 1.1 |
|
|
| — |
|
|
| 0.4 |
|
Other expense, net |
| $ | (38.9 | ) |
| $ | (1.4 | ) |
| $ | (20.7 | ) |
| Year Ended December 31, | |||||||||||
| 2019 | 2018 | 2017 | |||||||||
| Interest income | $ | 0.6 | $ | 0.3 | $ | 0.2 | |||||
| Net periodic postretirement benefit cost relating to Salaried VEBA | (6.5 | ) | (6.0 | ) | (4.5 | ) | |||||
Realized gain on available for sale securities1 | 4.4 | 5.4 | 3.2 | ||||||||
| Unrealized gain (loss) on equity securities | 0.7 | (1.0 | ) | — | |||||||
| Loss on extinguishment of debt | (20.3 | ) | — | — | |||||||
| All other, net | 0.4 | 0.4 | 1.1 | ||||||||
| Other expense, net | $ | (20.7 | ) | $ | (0.9 | ) | $ | — | |||
85
KAISER ALUMINUM CORPORATION AND SUBSIDIARY COMPANIES
NOTES TO CONSOLIDATED FINANCIAL STATEMENTS
14. Income Tax Matters
The following table presents Income(Loss) income before income taxes by geographic area for the periods presented (in millions of dollars):
|
| Year Ended December 31, |
| |||||||||
|
| 2021 |
|
| 2020 |
|
| 2019 |
| |||
Domestic |
| $ | (30.2 | ) |
| $ | 35.2 |
|
| $ | 76.3 |
|
Foreign |
|
| 6.2 |
|
|
| 3.6 |
|
|
| 4.1 |
|
(Loss) income before income taxes |
| $ | (24.0 | ) |
| $ | 38.8 |
|
| $ | 80.4 |
|
| Year Ended December 31, | |||||||||||
| 2019 | 2018 | 2017 | |||||||||
| Domestic | $ | 76.3 | $ | 114.6 | $ | 127.9 | |||||
| Foreign | 4.1 | 5.4 | 5.1 | ||||||||
| Income before income taxes | $ | 80.4 | $ | 120.0 | $ | 133.0 | |||||
Tax Provision
Income tax provisionbenefit (provision) consisted of the following for the periods presented (in millions of dollars):
|
| Federal |
|
| Foreign |
|
| State |
|
| Total |
| ||||
Year Ended December 31, 2021 |
|
|
|
|
|
|
|
|
|
|
|
|
|
|
|
|
Current |
| $ | — |
|
| $ | (2.4 | ) |
| $ | (3.5 | ) |
| $ | (5.9 | ) |
Deferred |
|
| 2.1 |
|
|
| 0.5 |
|
|
| 4.2 |
|
|
| 6.8 |
|
Benefit applied to decrease Other comprehensive income |
|
| 3.7 |
|
|
| 0.3 |
|
|
| 0.6 |
|
|
| 4.6 |
|
Income tax benefit (provision) |
| $ | 5.8 |
|
| $ | (1.6 | ) |
| $ | 1.3 |
|
| $ | 5.5 |
|
Year Ended December 31, 2020 |
|
|
|
|
|
|
|
|
|
|
|
|
|
|
|
|
Current |
| $ | 6.1 |
|
| $ | (0.4 | ) |
| $ | (0.6 | ) |
| $ | 5.1 |
|
Deferred |
|
| (18.8 | ) |
|
| (0.1 | ) |
|
| (2.3 | ) |
|
| (21.2 | ) |
Benefit (expense) applied to decrease (increase) Other comprehensive income |
|
| 5.1 |
|
|
| (0.1 | ) |
|
| 1.1 |
|
|
| 6.1 |
|
Income tax provision |
| $ | (7.6 | ) |
| $ | (0.6 | ) |
| $ | (1.8 | ) |
| $ | (10.0 | ) |
Year Ended December 31, 2019 |
|
|
|
|
|
|
|
|
|
|
|
|
|
|
|
|
Current |
| $ | 5.7 |
|
| $ | (1.1 | ) |
| $ | (1.8 | ) |
| $ | 2.8 |
|
Deferred |
|
| (19.6 | ) |
|
| (0.3 | ) |
|
| (4.5 | ) |
|
| (24.4 | ) |
Benefit (expense) applied to decrease (increase) Other comprehensive income |
|
| 2.7 |
|
|
| (0.1 | ) |
|
| 0.6 |
|
|
| 3.2 |
|
Income tax provision |
| $ | (11.2 | ) |
| $ | (1.5 | ) |
| $ | (5.7 | ) |
| $ | (18.4 | ) |
| Federal | Foreign | State | Total | ||||||||||||
| Year Ended December 31, 2019 | |||||||||||||||
| Current | $ | 5.7 | $ | (1.1 | ) | $ | (1.8 | ) | $ | 2.8 | |||||
| Deferred | (19.6 | ) | (0.3 | ) | (4.5 | ) | (24.4 | ) | |||||||
| Benefit (expense) applied to decrease (increase) Retained earnings/Other comprehensive income | 2.7 | (0.1 | ) | 0.6 | 3.2 | ||||||||||
| Income tax provision | $ | (11.2 | ) | $ | (1.5 | ) | $ | (5.7 | ) | $ | (18.4 | ) | |||
| Year Ended December 31, 2018 | |||||||||||||||
| Current | $ | 11.9 | $ | (1.9 | ) | $ | (1.5 | ) | $ | 8.5 | |||||
| Deferred | (34.7 | ) | 0.1 | (1.4 | ) | (36.0 | ) | ||||||||
| Expense applied to increase Retained earnings/ Other comprehensive loss | (0.7 | ) | — | (0.1 | ) | (0.8 | ) | ||||||||
| Income tax provision | $ | (23.5 | ) | $ | (1.8 | ) | $ | (3.0 | ) | $ | (28.3 | ) | |||
| Year Ended December 31, 2017 | |||||||||||||||
| Current | $ | 3.1 | $ | (0.8 | ) | $ | (1.0 | ) | $ | 1.3 | |||||
| Deferred | (82.0 | ) | (1.0 | ) | (5.7 | ) | (88.7 | ) | |||||||
| Expense applied to increase Retained earnings/Other comprehensive income | (0.1 | ) | (0.1 | ) | — | (0.2 | ) | ||||||||
| Income tax provision | $ | (79.0 | ) | $ | (1.9 | ) | $ | (6.7 | ) | $ | (87.6 | ) | |||
The following table presents a reconciliation between the provisionbenefit (provision) for income taxes and the amount computed by applying the federal statutory income tax rate to Income(Loss) income before income taxes for the periods presented (in millions of dollars):
|
| Year Ended December 31, |
| |||||||||
|
| 2021 |
|
| 2020 |
|
| 2019 |
| |||
Amount of federal income tax benefit (provision) based on the statutory rate |
| $ | 5.0 |
|
| $ | (8.1 | ) |
| $ | (16.9 | ) |
Decrease (increase) in federal valuation allowances |
|
| 0.2 |
|
|
| 0 |
|
|
| (0.1 | ) |
Non-deductible compensation expense |
|
| (0.5 | ) |
|
| (1.1 | ) |
|
| (1.7 | ) |
Non-deductible (expense) benefit |
|
| (0.2 | ) |
|
| 0.4 |
|
|
| 0.1 |
|
State income tax benefit (provision), net of federal benefit 1 |
|
| 1.0 |
|
|
| (1.5 | ) |
|
| (4.5 | ) |
Research and development credit |
|
| 0.6 |
|
|
| 0.4 |
|
|
| 7.7 |
|
Gross decreases (increases) for tax positions from current year |
|
| 0 |
|
|
| 0 |
|
|
| (0.3 | ) |
Gross decreases (increases) for tax positions from prior years |
|
| 0 |
|
|
| 0.4 |
|
|
| (2.4 | ) |
Foreign income tax expense |
|
| (0.3 | ) |
|
| (0.4 | ) |
|
| (0.1 | ) |
Foreign undistributed earnings |
|
| (0.3 | ) |
|
| (0.1 | ) |
|
| (0.2 | ) |
Income tax benefit (provision) |
| $ | 5.5 |
|
| $ | (10.0 | ) |
| $ | (18.4 | ) |
| Year Ended December 31, | |||||||||||
| 2019 | 2018 | 2017 | |||||||||
| Amount of federal income tax provision based on the statutory rate | $ | (16.9 | ) | $ | (25.2 | ) | $ | (46.5 | ) | ||
| (Increase) decrease in federal valuation allowances | (0.1 | ) | 1.7 | 0.5 | |||||||
| Non-deductible compensation expense | (1.7 | ) | (0.6 | ) | (2.3 | ) | |||||
| Non-deductible benefit (expense) | 0.1 | (1.5 | ) | — | |||||||
State income tax provision, net of federal benefit 1 | (4.5 | ) | (2.5 | ) | (4.3 | ) | |||||
| Research and development credit | 7.7 | — | — | ||||||||
| Gross increases for tax positions from current year | (0.3 | ) | — | — | |||||||
| Gross increases for tax positions from prior years | (2.4 | ) | — | — | |||||||
| Foreign income tax expense | (0.1 | ) | (0.5 | ) | (0.1 | ) | |||||
| Foreign undistributed (earnings) loss | (0.2 | ) | 0.4 | (5.9 | ) | ||||||
| Tax rate change | — | (0.1 | ) | (29.0 | ) | ||||||
| Income tax provision | $ | (18.4 | ) | $ | (28.3 | ) | $ | (87.6 | ) | ||
1. | The state income |
86
KAISER ALUMINUM CORPORATION AND SUBSIDIARY COMPANIES
NOTES TO CONSOLIDATED FINANCIAL STATEMENTS
reflecting a decrease of $0.7 million due to lower tax rate true-ups in various states, partially offset by an increase of $1.4 million due to a change in the valuation allowance relating to certain state net operating losses. |
Deferred Income Taxes. Deferred income taxes reflect the net tax effects of temporary differences between the carrying amounts of assets and liabilities for financial reporting purposes and amounts used for income tax purposes. The following table presents the components of our net deferred income tax assets as of the periods presentedliabilities (in millions of dollars):
|
| As of December 31, |
| |||||
|
| 2021 |
|
| 2020 |
| ||
Deferred income tax assets: |
|
|
|
|
|
|
|
|
Loss and credit carryforwards |
| $ | 51.5 |
|
| $ | 33.4 |
|
Pension Benefits |
|
| 7.1 |
|
|
| 4.8 |
|
Other assets |
|
| 29.0 |
|
|
| 29.4 |
|
Leased assets |
|
| 11.7 |
|
|
| 7.3 |
|
Inventories |
|
| 50.4 |
|
|
| 6.9 |
|
Valuation allowances |
|
| (4.6 | ) |
|
| (6.4 | ) |
Total deferred income tax assets |
|
| 145.1 |
|
|
| 75.4 |
|
Deferred income tax liabilities: |
|
|
|
|
|
|
|
|
Property, plant and equipment |
|
| (138.9 | ) |
|
| (80.8 | ) |
Leased liability |
|
| (10.9 | ) |
|
| (6.4 | ) |
Undistributed foreign earnings |
|
| (2.4 | ) |
|
| (2.1 | ) |
Total deferred income tax liabilities |
|
| (152.2 | ) |
|
| (89.3 | ) |
Net deferred income tax liabilities |
| $ | (7.1 | ) |
| $ | (13.9 | ) |
| December 31, | |||||||
| 2019 | 2018 | ||||||
| Deferred income tax assets: | |||||||
| Loss and credit carryforwards | $ | 48.7 | $ | 48.7 | |||
| Salaried VEBA (see Note 5) | 8.7 | 8.0 | |||||
| Other assets | 30.1 | 27.2 | |||||
| Leased asset | 7.1 | — | |||||
| Inventories | 9.4 | 20.0 | |||||
| Valuation allowances | (9.9 | ) | (8.4 | ) | |||
| Total deferred income tax assets | 94.1 | 95.5 | |||||
| Deferred income tax liabilities: | |||||||
| Property, plant and equipment | (78.5 | ) | (62.0 | ) | |||
| Leased liability | (6.3 | ) | — | ||||
| Undistributed foreign earnings | (2.0 | ) | (1.8 | ) | |||
| Total deferred income tax liabilities | (86.8 | ) | (63.8 | ) | |||
Net deferred income tax assets 1 | $ | 7.3 | $ | 31.7 | |||
Tax Attributes.
At December 31,In addition, we had $7.7$8.8 million of federal research and development ("(“R&D"&D”) credit carryforwards to offset regular federal income tax requirements. Our R&D credit carryforwards expire periodically through 2039.
In assessing the realizability of deferred tax assets, management considers whether it is "more“more likely than not"not” that some portion or all of the deferred tax assets will not be realized. The ultimate realization of deferred tax assets is dependent upon the generation of future taxable income during the periods in which those temporary differences become deductible. Management considers taxable income in carryback years, the scheduled reversal of deferred tax liabilities, tax planning strategies and projected future taxable income in making this assessment. Due to uncertainties surrounding the realization of some of our deferred tax assets, primarily including state NOL carryforwards sustained during the prior years and expiring tax benefits, we have a valuation allowance against our deferred tax assets. When recognized, the tax benefits relating to any reversal of this valuation allowance will be recorded as a reduction of income tax expense. There was a decreasein the valuation allowance of $1.8 million in 2021, a decrease in the valuation allowance of $3.5 million in 2020 and an increase in the valuation allowance of $1.5 million in 2019. There
The decreasein the valuation allowance for 2021 was aprimarily due to the expiration of state NOL carryforwards and the related reversal of their valuation allowances. The decrease in the valuation allowance for 2020 was primarily due to the expiration of $4.6 millionstate NOL carryforwards and $2.7 million in 2018 and 2017, respectively.
Other
. We and our subsidiaries file income tax returns in the U.S. federal jurisdiction and various states and foreign jurisdictions.87
KAISER ALUMINUM CORPORATION AND SUBSIDIARY COMPANIES
NOTES TO CONSOLIDATED FINANCIAL STATEMENTS
Our tax returns for certain past years are still subject to examination by taxing authorities and the use of NOL carryforwards in future periods could trigger a review of attributes and other tax matters in years that are not otherwise subject to examination.
We have gross unrecognized benefits relating to uncertain tax positions. The following table presents a reconciliation of changes in the gross unrecognized tax benefits for the periods presented (in millions of dollars):
|
| Year Ended December 31, |
| |||||||||
|
| 2021 |
|
| 2020 |
|
| 2019 |
| |||
Gross unrecognized tax benefits at beginning of period |
| $ | 3.8 |
|
| $ | 4.1 |
|
| $ | 1.5 |
|
Gross increases for tax positions of current year |
|
| 0.3 |
|
|
| 0.1 |
|
|
| 0.3 |
|
Gross increases for tax positions of prior years |
|
| 0.4 |
|
|
| 0 |
|
|
| 2.3 |
|
Gross decreases for tax positions of prior years |
|
| (0.3 | ) |
|
| (0.4 | ) |
|
| 0 |
|
Settlements |
|
| (0.1 | ) |
|
| 0 |
|
|
| 0 |
|
Gross unrecognized tax benefits at end of period |
| $ | 4.1 |
|
| $ | 3.8 |
|
| $ | 4.1 |
|
| Year Ended December 31, | ||||||||||||
| 2019 | 2018 | 2017 | ||||||||||
| Gross unrecognized tax benefits at beginning of period | $ | 1.5 | $ | 1.5 | $ | 1.8 | ||||||
| Gross increases for tax positions of current year | 0.3 | — | — | |||||||||
| Gross increases for tax positions of prior years | 2.3 | — | — | |||||||||
| Gross decreases for tax positions of prior years | — | — | (0.3 | ) | ||||||||
| Gross unrecognized tax benefits at end of period | $ | 4.1 | $ | 1.5 | $ | 1.5 | ||||||
If and when the $4.1 million of gross unrecognized tax benefits at December 31, 20192021 are recognized, $0.9$4.1 million will be reflected in our income tax provision and thus affect the effective tax rate in future periods.
In addition, we recognize interest and penalties related to unrecognized tax benefits in the income tax provision. We had $0.3$0.2 millionand $0.2 $0.3million accrued for interest and penalties at December 31, 20192021 and December 31, 2018,2020, respectively. Of these amounts, NaN0ne were considered current and, as such, were included in Long-term liabilities on theour Consolidated Balance Sheets as of December 31, 20192021 and December 31, 2018.2020. We recognized an increase in interest and penalty of $0.1 million in our tax provision in 2019. We recognized an increase in interest and penalty of $0.1 million in our tax provision in 2018. We recognized a decrease in interest and penalty of $0.1 million in our tax provision in 2017.
We do not expect our gross unrecognized tax benefits to significantly change within the next 12 months.
15. Net (Loss) Income Per Share
Basic net (loss) income per share is computed by dividing distributed and undistributed net (loss) income allocable to common shares by the weighted-average number of common shares outstanding during the applicable period. The basic weighted-average number of common shares outstanding during the period excludes non-vested share-based payment awards. Diluted net (loss) income per share was calculated under the treasury stock method for 2019, 20182021, 2020 and 2017,2019, which in all years was more dilutive than the two-classtwo‑class method.
The following table sets forth the computation of basic and diluted net (loss) income per share for the periods presented (in millions of dollars, except share and per share amounts):
|
| Year Ended December 31, |
| |||||||||
|
| 2021 |
|
| 2020 |
|
| 2019 |
| |||
Numerator: |
|
|
|
|
|
|
|
|
|
|
|
|
Net (loss) income |
| $ | (18.5 | ) |
| $ | 28.8 |
|
| $ | 62.0 |
|
Denominator – Weighted-average common shares outstanding (in thousands): |
|
|
|
|
|
|
|
|
|
|
|
|
Basic |
|
| 15,836 |
|
|
| 15,802 |
|
|
| 15,997 |
|
Add: dilutive effect of non-vested common shares, restricted stock units and performance shares1 |
|
| — |
|
|
| 111 |
|
|
| 206 |
|
Diluted |
|
| 15,836 |
|
|
| 15,913 |
|
|
| 16,203 |
|
|
|
|
|
|
|
|
|
|
|
|
|
|
Net (loss) income per common share, Basic: |
| $ | (1.17 | ) |
| $ | 1.82 |
|
| $ | 3.88 |
|
Net (loss) income per common share, Diluted: |
| $ | (1.17 | ) |
| $ | 1.81 |
|
| $ | 3.83 |
|
| Year Ended December 31, | ||||||||||||
| 2019 | 2018 | 2017 | ||||||||||
| Numerator: | ||||||||||||
| Net income | $ | 62.0 | $ | 91.7 | $ | 45.4 | ||||||
| Denominator – Weighted-average common shares outstanding (in thousands): | ||||||||||||
| Basic | 15,997 | 16,585 | 16,996 | |||||||||
Add: dilutive effect of non-vested common shares, restricted stock units and performance shares1 | 206 | 289 | 263 | |||||||||
| Diluted | 16,203 | 16,874 | 17,259 | |||||||||
| Net income per common share, Basic: | $ | 3.88 | $ | 5.53 | $ | 2.67 | ||||||
| Net income per common share, Diluted: | $ | 3.83 | $ | 5.43 | $ | 2.63 | ||||||
1. | Quantities in the following discussion are denoted in whole shares. For the year ended December 31, 2021, approximately 213,000 potentially dilutive shares were excluded from the computation of net loss per share as their effect would have been anti‑dilutive. A total of |
88
KAISER ALUMINUM CORPORATION AND SUBSIDIARY COMPANIES
NOTES TO CONSOLIDATED FINANCIAL STATEMENTS
16. Supplemental Cash Flow Information
|
| Year Ended December 31, |
| |||||||||
|
| 2021 |
|
| 2020 |
|
| 2019 |
| |||
|
| (in millions of dollars) |
| |||||||||
Interest paid |
| $ | 48.7 |
|
| $ | 29.4 |
|
| $ | 23.6 |
|
Non-cash investing and financing activities (included in Accounts payable): |
|
|
|
|
|
|
|
|
|
|
|
|
Unpaid purchases of property and equipment |
| $ | 14.0 |
|
| $ | 4.5 |
|
| $ | 4.5 |
|
|
|
|
|
|
|
|
|
|
|
|
|
|
Supplemental lease disclosures: |
|
|
|
|
|
|
|
|
|
|
|
|
Operating lease liabilities arising from obtaining operating lease assets |
| $ | 27.8 |
|
| $ | 5.4 |
|
| $ | 1.8 |
|
Cash paid for amounts included in the measurement of operating lease liabilities |
| $ | 8.2 |
|
| $ | 4.5 |
|
| $ | 3.8 |
|
Finance lease liabilities arising from obtaining finance lease assets |
| $ | 2.2 |
|
| $ | 3.2 |
|
| $ | 1.0 |
|
|
|
|
|
|
|
|
|
|
|
|
|
|
|
| As of December 31, |
| |||||||||
|
| 2021 |
|
| 2020 |
|
| 2019 |
| |||
Components of cash, cash equivalents and restricted cash: |
|
|
|
|
|
|
|
|
|
|
|
|
Cash and cash equivalents |
| $ | 303.2 |
|
| $ | 780.3 |
|
| $ | 264.3 |
|
Restricted cash included in Prepaid expenses and other current assets |
|
| — |
|
|
| — |
|
|
| 0.3 |
|
Restricted cash included in Other assets |
|
| 13.8 |
|
|
| 14.0 |
|
|
| 14.0 |
|
Total cash, cash equivalents and restricted cash shown in our Statements of Consolidated Cash Flows |
| $ | 317.0 |
|
| $ | 794.3 |
|
| $ | 278.6 |
|
| Year Ended December 31, | |||||||||||
| 2019 | 2018 | 2017 | |||||||||
| (in millions of dollars) | |||||||||||
| Interest paid | $ | 23.6 | $ | 21.6 | $ | 21.1 | |||||
| Non-cash investing and financing activities (included in Accounts payable): | |||||||||||
| Unpaid purchases of property and equipment | $ | 4.5 | $ | 7.0 | $ | 7.4 | |||||
| Stock repurchases not yet settled | $ | — | $ | 1.3 | $ | 0.1 | |||||
| Supplemental lease disclosures: | |||||||||||
| Operating lease liabilities arising from obtaining operating lease assets | $ | 1.8 | n/a | n/a | |||||||
| Cash paid for amounts included in the measurement of operating lease liabilities | $ | 3.8 | n/a | n/a | |||||||
| Finance lease liabilities arising from obtaining finance lease assets | $ | 1.0 | $ | 6.5 | $ | 1.2 | |||||
| December 31, | |||||||||||
| 2019 | 2018 | 2017 | |||||||||
| Components of cash, cash equivalents and restricted cash: | |||||||||||
| Cash and cash equivalents | $ | 264.3 | $ | 125.6 | $ | 51.1 | |||||
| Restricted cash included in Prepaid expenses and other current assets | 0.3 | 0.3 | 0.3 | ||||||||
| Restricted cash included in Other assets | 14.0 | 13.7 | 12.9 | ||||||||
| Total cash, cash equivalents and restricted cash shown in the Statements of Consolidated Cash Flows | $ | 278.6 | $ | 139.6 | $ | 64.3 | |||||
17. Business, Product and Geographical Area Information and Concentration of Risk
Our primary line of business is the production of semi-fabricated specialty aluminum mill products, such as aluminumbare and coated coils, plate and sheet and extruded and drawn products, for the following end market applications:primarily used in our Aero/HS products, Packaging, Automotive Extrusions, GE products and Other products.products end markets. We operate 1213 focused production facilities in the United States and 1 in Canada. Our chief operating decision maker reviews and evaluates our business as a single operating segment. At December 31, 2019,2021, approximately 62%66% of our employees were covered by collective bargaining agreements and 8%15% of those employees were covered by collective bargaining agreements with expiration dates occurring within one year from December 31, 2019.
The following table presents Net sales by end market applications and by timing of control transfer for the periods presented (in millions of dollars):
| Year Ended December 31, |
| ||||||||||
|
| 2021 |
|
| 2020 |
|
| 2019 |
| |||
Net sales: |
|
|
|
|
|
|
|
|
|
|
|
|
Aero/HS products |
| $ | 533.7 |
|
| $ | 537.9 |
|
| $ | 803.2 |
|
Packaging |
|
| 1,119.3 |
|
|
| — |
|
|
| — |
|
Automotive Extrusions |
|
| 225.0 |
|
|
| 161.4 |
|
|
| 190.5 |
|
GE products |
|
| 706.1 |
|
|
| 458.8 |
|
|
| 480.1 |
|
Other products |
|
| 37.9 |
|
|
| 14.6 |
|
|
| 40.3 |
|
Total net sales |
| $ | 2,622.0 |
|
| $ | 1,172.7 |
|
| $ | 1,514.1 |
|
Timing of revenue recognition: |
|
|
|
|
|
|
|
|
|
|
|
|
Products transferred at a point in time |
| $ | 2,067.9 |
|
| $ | 690.9 |
|
| $ | 866.9 |
|
Products transferred over time |
|
| 554.1 |
|
|
| 481.8 |
|
|
| 647.2 |
|
Total net sales |
| $ | 2,622.0 |
|
| $ | 1,172.7 |
|
| $ | 1,514.1 |
|
| Year Ended December 31, | |||||||||||
| 2019 | 2018 | 2017 | |||||||||
| Net sales: | |||||||||||
| Aero/HS products | $ | 803.2 | $ | 739.4 | $ | 653.7 | |||||
| Automotive Extrusions | 190.5 | 239.3 | 217.3 | ||||||||
| GE products | 480.1 | 546.0 | 476.2 | ||||||||
| Other products | 40.3 | 61.2 | 50.3 | ||||||||
| Total net sales | $ | 1,514.1 | $ | 1,585.9 | $ | 1,397.5 | |||||
| Timing of revenue recognition: | |||||||||||
| Products transferred at a point in time | $ | 866.9 | $ | 912.7 | 1 | n/a | |||||
| Products transferred over time | 647.2 | 673.2 | 1 | n/a | |||||||
| Total net sales | $ | 1,514.1 | $ | 1,585.9 | |||||||
89
KAISER ALUMINUM CORPORATION AND SUBSIDIARY COMPANIES
NOTES TO CONSOLIDATED FINANCIAL STATEMENTS
The following table presents geographic information for net sales based on country of origin, income taxes paid and long-lived assets for the periods presented (in millions of dollars):
|
| Year Ended December 31, |
| |||||||||
|
| 2021 |
|
| 2020 |
|
| 2019 |
| |||
Net sales to unaffiliated customers: |
|
|
|
|
|
|
|
|
|
|
|
|
Domestic |
| $ | 2,545.0 |
|
| $ | 1,126.8 |
|
| $ | 1,461.4 |
|
Foreign1 |
|
| 77.0 |
|
|
| 45.9 |
|
|
| 52.7 |
|
Total net sales |
| $ | 2,622.0 |
|
| $ | 1,172.7 |
|
| $ | 1,514.1 |
|
Income taxes paid: |
|
|
|
|
|
|
|
|
|
|
|
|
Domestic |
| $ | 4.5 |
|
| $ | 0.7 |
|
| $ | 3.5 |
|
Foreign |
|
| 1.1 |
|
|
| 0.3 |
|
|
| 2.0 |
|
Total income taxes paid |
| $ | 5.6 |
|
| $ | 1.0 |
|
| $ | 5.5 |
|
|
| As of December 31, |
| |||||||||
|
| 2021 |
|
| 2020 |
|
| 2019 |
| |||
Long-lived assets:2 |
|
|
|
|
|
|
|
|
|
|
|
|
Domestic |
| $ | 925.3 |
|
| $ | 597.5 |
|
| $ | 592.9 |
|
Foreign1 |
|
| 29.9 |
|
|
| 29.7 |
|
|
| 29.1 |
|
Total long-lived assets |
| $ | 955.2 |
|
| $ | 627.2 |
|
| $ | 622.0 |
|
| Year Ended December 31, | |||||||||||
| 2019 | 2018 | 2017 | |||||||||
| Net sales to unaffiliated customers: | |||||||||||
| Domestic | $ | 1,461.4 | $ | 1,509.6 | $ | 1,337.3 | |||||
Foreign1 | 52.7 | 76.3 | 60.2 | ||||||||
| Total net sales | $ | 1,514.1 | $ | 1,585.9 | $ | 1,397.5 | |||||
| Income taxes paid: | |||||||||||
| Domestic | $ | 3.5 | $ | 1.6 | $ | 1.2 | |||||
| Foreign | 2.0 | 2.0 | 0.1 | ||||||||
| Total income taxes paid | $ | 5.5 | $ | 3.6 | $ | 1.3 | |||||
| December 31, | |||||||||||
| 2019 | 2018 | 2017 | |||||||||
Long-lived assets:2 | |||||||||||
| Domestic | $ | 592.9 | $ | 581.7 | $ | 541.2 | |||||
Foreign1 | 29.1 | 30.1 | 30.2 | ||||||||
| Total long-lived assets | $ | 622.0 | $ | 611.8 | $ | 571.4 | |||||
1. | Foreign reflects our London, Ontario production facility. |
2. | Long-lived assets represent Property, plant and equipment, net. |
The aggregate foreign currency transaction gain (loss) included in determining net (loss) income were immaterial for 2019, 20182021, 2020 and 2017.
Concentrations.
For the years ended December 31,One individual customer accounted for 41% and another16%, a second individual customer accounted for 10% of the accounts receivable balance at December 31, 2019. One individual customer accounted for 31%13% and anothera third individual customer accounted for 11% of the accounts receivable balance at December 31, 2018.
The following table presents information about export sales and primary aluminum supply from our major suppliers for the periods presented:suppliers:
|
| Year Ended December 31, |
| |||||||||
|
| 2021 |
|
| 2020 |
|
| 2019 |
| |||
Percentage of Net sales: |
|
|
|
|
|
|
|
|
|
|
|
|
Export sales |
|
| 10 | % |
|
| 10 | % |
|
| 14 | % |
|
|
|
|
|
|
|
|
|
|
|
|
|
Percentage of total annual primary aluminum supply (lbs): |
|
|
|
|
|
|
|
|
|
|
|
|
Supply from our top five major suppliers |
|
| 78 | % |
|
| 72 | % |
|
| 74 | % |
Supply from our largest supplier |
|
| 47 | % |
|
| 21 | % |
|
| 22 | % |
Supply from our second and third largest suppliers combined |
|
| 20 | % |
|
| 32 | % |
|
| 32 | % |
| Year Ended December 31, | ||||||||
| 2019 | 2018 | 2017 | ||||||
| Percentage of Net sales: | ||||||||
| Export sales | 14 | % | 15 | % | 18 | % | ||
| Percentage of total annual primary aluminum supply (lbs): | ||||||||
| Supply from our top five major suppliers | 74 | % | 81 | % | 85 | % | ||
| Supply from our largest supplier | 22 | % | 22 | % | 36 | % | ||
| Supply from our second and third largest suppliers combined | 32 | % | 38 | % | 33 | % | ||
Quarter Ended 31-Mar | Quarter Ended 30-Jun | Quarter Ended 30-Sep | Quarter Ended 31-Dec | |||||||||||||
| 2019 | ||||||||||||||||
| Net sales | $ | 395.2 | $ | 375.3 | $ | 374.9 | $ | 368.7 | ||||||||
| Cost of products sold | $ | 315.1 | $ | 303.5 | $ | 298.6 | $ | 298.0 | ||||||||
| Gross profit | $ | 80.1 | $ | 71.8 | $ | 76.3 | $ | 70.7 | ||||||||
| Operating income | $ | 43.0 | $ | 32.4 | $ | 40.7 | $ | 9.6 | ||||||||
Net income (loss)1 | $ | 28.0 | $ | 19.2 | $ | 25.4 | $ | (10.6 | ) | |||||||
| Net income (loss) per common share, Basic | $ | 1.74 | $ | 1.19 | $ | 1.59 | $ | (0.66 | ) | |||||||
| Net income (loss) per common share, Diluted | $ | 1.71 | $ | 1.18 | $ | 1.57 | $ | (0.66 | ) | |||||||
| Dividends declared per common share | $ | 0.60 | $ | 0.60 | $ | 0.60 | $ | 0.60 | ||||||||
Quarter Ended 31-Mar | Quarter Ended 30-Jun | Quarter Ended 30-Sep | Quarter Ended 31-Dec | |||||||||||||
| 2018 | ||||||||||||||||
| Net sales | $ | 388.0 | $ | 415.4 | $ | 393.1 | $ | 389.4 | ||||||||
| Cost of products sold | $ | 316.7 | $ | 343.4 | $ | 323.3 | $ | 317.3 | ||||||||
| Gross profit | $ | 71.3 | $ | 72.0 | $ | 69.8 | $ | 72.1 | ||||||||
| Operating income | $ | 37.1 | $ | 34.7 | $ | 34.9 | $ | 36.9 | ||||||||
| Net income | $ | 25.7 | $ | 20.7 | $ | 21.7 | $ | 23.6 | ||||||||
| Net income per common share, Basic | $ | 1.54 | $ | 1.24 | $ | 1.31 | $ | 1.44 | ||||||||
| Net income per common share, Diluted | $ | 1.51 | $ | 1.22 | $ | 1.29 | $ | 1.41 | ||||||||
| Dividends declared per common share | $ | 0.55 | $ | 0.55 | $ | 0.55 | $ | 0.55 | ||||||||
18. Subsequent Events
Dividend Declaration
. On JanuaryItem 9.
Changes in and Disagreements with Accountants on Accounting and Financial DisclosureNone.
Item 9A.
Controls and ProceduresEvaluation of Disclosure Controls and Procedures.
We maintain disclosure controls and procedures that are designed to ensure that information required to be disclosed in our reports under the Securities Exchange Act of 1934 is processed, recorded, summarized and reported within the time periods specified in theManagement’s Annual Report on Internal Control Over Financial Reporting.
Our management is responsible for establishing and maintaining adequate internal control over financial reporting as defined in Rule 13a-15(f) under the Securities Exchange Act of 1934. Our internal control over financial reporting is designed under the supervision of our principal executive officer and principal financial officer and effected by our Board of Directors, management and other personnel, to provide reasonable assurance regarding the reliability of financial reporting and the preparation of financial statements for external purposes in accordance with accounting principles generally accepted in the United States and include those policies and procedures that:(1) | Pertain to the maintenance of records that in reasonable detail accurately and fairly reflect our transactions and the dispositions of our assets; |
(2) | Provide reasonable assurance that our transactions are recorded as necessary to permit preparation of financial statements in accordance with accounting principles generally accepted in the United States and that our receipts and expenditures are being made only in accordance with authorizations of our management and Board of Directors; and |
(3) | Provide reasonable assurance regarding prevention or timely detection of unauthorized acquisition, use or disposition of our assets that could have a material effect on our financial statements. |
Because of inherent limitations, internal control over financial reporting may not prevent or detect misstatements. Therefore, even those systems determined to be effective can provide only reasonable assurance with respect to financial statement preparation and presentation.
Under the supervision and with the participation of our management, including our principal executive officer and principal financial officer, we assessed the effectiveness of our internal control over financial reporting as of December 31, 2019,2021, using the criteria set forth by the Committee of Sponsoring Organizations of the Treadway Commission in Internal Control -– Integrated Framework as established in 2013. Based on that evaluation, our principal executive officer and principal financial officer concluded that our internal control over financial reporting was effective as of December 31, 2019.
We acquired Warrick on March 31, 2021. In accordance with the SEC Staff guidance permitting a company to exclude an acquired business from management’s assessment of the effectiveness of internal control over financial reporting for the year in which the acquisition was completed, management has excluded Warrick’s internal control over financial reporting from its assessment of the effectiveness of our internal control over financial reporting as of December 31, 2021. Warrick’s total assets and total revenues constitute 34% and 44%, respectively, of the consolidated financial statement amounts as of and for the year ended December 31, 2021.
Deloitte & Touche LLP, the independent registered public accounting firm that audited our consolidated financial statements for the year ended December 31, 20192021 included in Item 8. "Financial“Financial Statements and Supplementary Data"Data” of this Report, has issued an attestation report on the effectiveness of our internal control over financial reporting.
Changes in Internal ControlsControl Over Financial Reporting
or are reasonably likely to materially affect, our internal control over financial reporting.reporting, other than changes resulting from the acquisition and integration of Warrick.
Item 9B. Other Information
None.
Item 9C.Disclosure Regarding Foreign Jurisdictions that Prevent Inspections
Not Applicable.
Part III
Item 10.
Directors, Executive Officers and Corporate GovernanceThe information required by this item is incorporated by reference to the information included under the captions "Executive“Executive Officers," "Proposals” “Proposals Requiring Your Vote – Proposal 1 – Election of Directors"Directors” and "Corporate Governance"“Corporate Governance” in our proxy statement for the 20202022 annual meeting of stockholders.
Item 11.
Executive CompensationThe information required by this item is incorporated by reference to the information included under the captions "Executive“Executive Compensation," "Director Compensation"” “Director Compensation” and "Corporate“Corporate Governance – Board Committees – Compensation Committee – Compensation Committee Interlocks and Insider Participation"Participation” in our proxy statement for the 20202022 annual meeting of stockholders.
Item 12.
Security Ownership of Certain Beneficial Owners and Management and Related Stockholder MattersThe information required by this item is incorporated by reference to the information included under the captions "Equity“Equity Compensation Plan Information"Information” and "Principal“Principal Stockholders and Management Ownership"Ownership” in our proxy statement for the 20202022 annual meeting of stockholders.
Item 13.
Certain Relationships and Related Transactions and Director IndependenceThe information required by this item is incorporated by reference to the information included under the captions "Certain“Certain Relationships and Related Transactions"Transactions” and "Corporate“Corporate Governance – Director Independence"Independence” in our proxy statement for the 20202022 annual meeting of stockholders.
Item 14.
Principal Accountant Fees and ServicesThe information required by this item is incorporated by reference to the information included under the caption "Independent“Independent Public Accountants"Accountants” in our proxy statement for the 20202022 annual meeting of stockholders.
PART IV
Item 15.
Exhibits and Financial Statement Schedules1. Financial Statements
The following are contained in this 2019Annual Report on Form 10-K Report:
2. Financial Statement Schedules
All schedules are omitted because they are either inapplicable or the required information is included in theour Consolidated Financial Statements or the notes thereto included in Item 8. "Financial“Financial Statements and Supplementary Data"Data” and incorporated herein by reference.
3. Exhibits
IndexExhibit |
|
|
| Provided |
| Incorporated by Reference | ||||||
No. |
| Exhibit Description |
| Herewith |
| Form |
| File Number |
| Exhibit |
| Filing Date |
2.1 |
|
|
|
| 8-K |
| 001-09447 |
| 2.1 |
| November 30, 2020 | |
|
|
|
|
|
|
|
|
|
|
|
|
|
3.1 |
| Amended and Restated Certificate of Incorporation of the Company |
|
|
| 8-A |
| 000-52105 |
| 3.1 |
| July 6, 2006 |
|
|
|
|
|
|
|
|
|
|
|
|
|
3.2 |
|
|
|
| 10-Q |
| 000-52105 |
| 3.2 |
| August 7, 2008 | |
|
|
|
|
|
|
|
|
|
|
|
|
|
3.3 |
|
|
|
| 8-K |
| 000-52105 |
| 3.1 |
| June 8, 2015 | |
|
|
|
|
|
|
|
|
|
|
|
|
|
3.4 |
|
|
|
| 8-K |
| 001-09447 |
| 3.1 |
| May 26, 2016 | |
|
|
|
|
|
|
|
|
|
|
|
|
|
3.5 |
|
|
|
| 8-K |
| 000-52105 |
| 3.1 |
| April 8, 2016 | |
|
|
|
|
|
|
|
|
|
|
|
|
|
3.6 |
|
|
|
| 8-K |
| 001-09447 |
| 3.1 |
| June 22, 2020 | |
|
|
|
|
|
|
|
|
|
|
|
|
|
4.1 |
|
|
|
| 8-K |
| 001-09447 |
| 4.1 |
| November 26, 2019 | |
|
|
|
|
|
|
|
|
|
|
|
|
|
Exhibit |
|
|
| Provided |
| Incorporated by Reference | ||||||
No. |
| Exhibit Description |
| Herewith |
| Form |
| File Number |
| Exhibit |
| Filing Date |
4.2 |
| Form of 4.625% Senior Notes due 2028 (included in Exhibit 4.1) |
|
|
| 8-K |
| 001-09447 |
| 4.2 |
| November 26, 2019 |
|
|
|
|
|
|
|
|
|
|
|
|
|
4.3 |
| Description of Securities Registered under Section 12 of the Securities Exchange Act of 1934 |
|
|
| 10-K |
| 001-09447 |
| 4.3 |
| February 25, 2020 |
|
|
|
|
|
|
|
|
|
|
|
|
|
4.4 |
|
|
|
| 8-K |
| 001-09447 |
| 4.1 |
| May 20, 2021 | |
|
|
|
|
|
|
|
|
|
|
|
|
|
4.5 |
| Form of 4.50% Senior Note due 2031 (included in Exhibit 4.1) |
|
|
| 8-K |
| 001-09447 |
| 4.2 |
| May 20, 2021 |
|
|
|
|
|
|
|
|
|
|
|
|
|
10.1 |
|
|
|
| 8-K |
| 001-09447 |
| 10.1 |
| November 4, 2019 | |
|
|
|
|
|
|
|
|
|
|
|
|
|
10.2 |
|
|
|
| 10-Q |
| 001-09447 |
| 10.1 |
| July 28, 2020 | |
|
|
|
|
|
|
|
|
|
|
|
|
|
*10.3 |
| Offer Letter dated June 22, 2020, between the Company and Keith A. Harvey |
|
|
| 8-K |
| 001-09447 |
| 10.1 |
| June 22, 2020 |
|
|
|
|
|
|
|
|
|
|
|
|
|
*10.4 |
| Amended and Restated Severance Agreement dated July 31, 2020 between the Company and Keith A. Harvey |
|
|
| 8-K |
| 001-09447 |
| 10.1 |
| July 31, 2020 |
|
|
|
|
|
|
|
|
|
|
|
|
|
*10.5 |
|
|
|
| 8-K |
| 001-09447 |
| 10.8 |
| July 6, 2006 | |
|
|
|
|
|
|
|
|
|
|
|
|
|
*10.6 |
|
|
|
| 8-K |
| 001-09447 |
| 10.9 |
| July 6, 2006 | |
|
|
|
|
|
|
|
|
|
|
|
|
|
*10.7 |
|
|
|
| 8-K |
| 001-09447 |
| 10.10 |
| July 6, 2006 | |
|
|
|
|
|
|
|
|
|
|
|
|
|
*10.8 |
|
|
|
| 8-K |
| 001-09447 |
| 10.14 |
| July 6, 2006 | |
|
|
|
|
|
|
|
|
|
|
|
|
|
*10.9 |
| Amendment to the Kaiser Aluminum Fabricated Products Restoration Plan |
|
|
| 8-K |
| 000-52105 |
| 10.4 |
| December 31, 2008 |
|
|
|
|
|
|
|
|
|
|
|
|
|
10.10 |
| Form of Non-Employee Director Restricted Stock Award Agreement |
|
|
| 10-Q |
| 001-09447 |
| 10.2 |
| July 27, 2016 |
|
|
|
|
|
|
|
|
|
|
|
|
|
*10.11 |
| 2019 Form of Executive Officer Restricted Stock Unit Award Agreement |
|
|
| 8-K |
| 001-09447 |
| 10.2 |
| March 5, 2019 |
|
|
|
|
|
|
|
|
|
|
|
|
|
*10.12 |
| 2019 Form of Executive Officer Performance Shares Award Agreement |
|
|
| 8-K |
| 001-09447 |
| 10.3 |
| March 5, 2019 |
|
|
|
|
|
|
|
|
|
|
|
|
|
*10.13 |
|
|
|
| 8-K |
| 001-09447 |
| 10.4 |
| March 5, 2019 | |
|
|
|
|
|
|
|
|
|
|
|
|
|
*10.14 |
| 2020 Form of Executive Officer Restricted Stock Units Award Agreement |
|
|
| 8-K |
| 001-09447 |
| 10.2 |
| March 10, 2020 |
|
|
|
|
|
|
|
|
|
|
|
|
|
*10.15 |
| 2020 Form of Executive Officer Performance Shares Award Agreement |
|
|
| 8-K |
| 001-09447 |
| 10.3 |
| March 10, 2020 |
|
|
|
|
|
|
|
|
|
|
|
|
|
Exhibit |
|
|
| Provided |
| Incorporated by Reference | ||||||
No. |
| Exhibit Description |
| Herewith |
| Form |
| File Number |
| Exhibit |
| Filing Date |
*10.16 |
|
|
|
| 8-K |
| 001-09447 |
| 10.4 |
| March 10, 2020 | |
|
|
|
|
|
|
|
|
|
|
|
|
|
*10.17 |
| Amended and Restated Severance Agreement dated March 5, 2021 between the Company and John M. Donnan |
|
|
| 8-K |
| 001-09447 |
| 10.1 |
| March 11, 2021 |
|
|
|
|
|
|
|
|
|
|
|
|
|
*10.18
|
| Kaiser Aluminum Fabricated Products 2021 Short-Term Incentive Plan For Key Managers Summary |
|
|
| 8-K |
| 001-09447 |
| 10.2 |
| March 11, 2021 |
|
|
|
|
|
|
|
|
|
|
|
|
|
*10.19
|
| Kaiser Aluminum Fabricated Products 2021-2023 Long-Term Incentive Plan For Key Managers Summary |
|
|
| 8-K |
| 001-09447 |
| 10.3 |
| March 11, 2021 |
|
|
|
|
|
|
|
|
|
|
|
|
|
10.20 |
|
|
|
| 8-K |
| 001-09447 |
| 10.1 |
| April 1, 2021 | |
|
|
|
|
|
|
|
|
|
|
|
|
|
*10.21 |
| Kaiser Aluminum Corporation 2021 Equity and Incentive Compensation Plan |
|
|
| 8-K |
| 001-09447 |
| 10.1 |
| June 3, 2021 |
|
|
|
|
|
|
|
|
|
|
|
|
|
*10.22 |
| Amended and Restated Director Designation Agreement dated September 3, 2021 |
|
|
| 8-K |
| 001-09447 |
| 10.1 |
| September 7, 2021 |
|
|
|
|
|
|
|
|
|
|
|
|
|
21.1 |
|
| X |
|
|
|
|
|
|
|
| |
|
|
|
|
|
|
|
|
|
|
|
|
|
23.1 |
|
| X |
|
|
|
|
|
|
|
| |
|
|
|
|
|
|
|
|
|
|
|
|
|
31.1 |
| Certification of Keith A. Harvey pursuant to Section 302 of the Sarbanes-Oxley Act of 2002 |
| X |
|
|
|
|
|
|
|
|
|
|
|
|
|
|
|
|
|
|
|
|
|
31.2 |
| Certification of Neal E. West pursuant to Section 302 of the Sarbanes-Oxley Act of 2002 |
| X |
|
|
|
|
|
|
|
|
|
|
|
|
|
|
|
|
|
|
|
|
|
32.1 |
| Certification of Keith A. Harvey pursuant to Section 906 of the Sarbanes-Oxley Act of 2002 |
| X |
|
|
|
|
|
|
|
|
|
|
|
|
|
|
|
|
|
|
|
|
|
32.2 |
| Certification of Neal E. West pursuant to Section 906 of the Sarbanes-Oxley Act of 2002 |
| X |
|
|
|
|
|
|
|
|
|
|
|
|
|
|
|
|
|
|
|
|
|
101.INS |
| Inline XBRL Instance Document – the instance document does not appear in the Interactive Data File because its XBRL tags are embedded within the Inline XBRL document |
|
|
|
|
|
|
|
|
|
|
|
|
|
|
|
|
|
|
|
|
|
|
|
101.SCH |
| Inline XBRL Taxonomy Extension Schema |
| X |
|
|
|
|
|
|
|
|
|
|
|
|
|
|
|
|
|
|
|
|
|
101.CAL |
| Inline XBRL Taxonomy Extension Calculation |
| X |
|
|
|
|
|
|
|
|
|
|
|
|
|
|
|
|
|
|
|
|
|
101.DEF |
| Inline XBRL Taxonomy Extension Definition |
| X |
|
|
|
|
|
|
|
|
|
|
|
|
|
|
|
|
|
|
|
|
|
101.LAB |
| Inline XBRL Taxonomy Extension Label |
| X |
|
|
|
|
|
|
|
|
|
|
|
|
|
|
|
|
|
|
|
|
|
101.PRE |
| Inline XBRL Taxonomy Extension Presentation |
| X |
|
|
|
|
|
|
|
|
|
|
|
|
|
|
|
|
|
|
|
|
|
104 |
| Cover Page Interactive Data File (formatted as Inline XBRL and contained in Exhibit 101) |
| X |
|
|
|
|
|
|
|
|
* | ||
Management contract or compensatory plan or arrangement required to be filed as an exhibit to this Annual Report on Form | ||
Item 16.
Form 10-K SummaryNone.
SIGNATURES
Pursuant to the requirements of Section 13 or 15(d) of the Securities Exchange Act of 1934, the registrant has duly caused this report to be signed on its behalf by the undersigned, thereunto duly authorized.
KAISER ALUMINUM CORPORATION | ||||
/s/ Keith A. | ||||
Keith A. Harvey | ||||
President and Chief Executive Officer | ||||
Date: March 1, 2022 | ||||
Pursuant to the requirements of the Securities Exchange Act of 1934, this report has been signed below by the following persons on behalf of the registrant and in the capacities and on the dates indicated.
/s/ | President, Chief Executive Officer (Principal Executive Officer) | Date: | ||
Keith A. | ||||
/s/ Neal E. West | Executive Vice President and Chief Financial Officer (Principal Financial Officer) | Date: | ||
Neal E. West | ||||
/s/ Jennifer Huey | Vice President and Chief Accounting Officer (Principal Accounting Officer) | Date: | ||
Jennifer Huey | ||||
Director | ||||
Michael C. Arnold | ||||
Director | ||||
David Foster | ||||
Director | ||||
Leo W. Gerard | ||||
Executive Chairman of the Board | ||||
Jack A. Hockema | ||||
/s/ Emily Liggett | Director | Date: | ||
Emily Liggett | ||||
/s/ Lauralee E. Martin | Director | Date: | ||
Lauralee E. Martin | ||||
Director | ||||
Alfred E. Osborne, Jr., Ph.D. | ||||
/s/ Teresa M. Sebastian | Director | Date: | ||
Teresa M. Sebastian | ||||
Director | ||||
Donald J. Stebbins | ||||
/s/ Thomas M. Van Leeuwen | Director | Date: | ||
Thomas M. Van Leeuwen | ||||
/s/ Brett | Director | Date: | ||
Brett | ||||
/s/ Kevin W. Williams | Director | Date: March 1, 2022 | ||
Kevin W. Williams | ||||
98