SECURITIES AND EXCHANGE COMMISSION
Washington, D.C. 20549
FORM 10-K
[X] ANNUAL REPORT PURSUANT TO SECTION 13 OR 15(d) OF THE
SECURITIES EXCHANGE ACT OF 1934
For the fiscal year ended December 31, 20132015
OR
[ ] TRANSITION REPORT PURSUANT TO SECTION 13 OR 15(d) OF THE
SECURITIES EXCHANGE ACT OF 1934
Commission File Number 1-9804
PULTEGROUP, INC.
(Exact name of registrant as specified in its charter)
|
| | |
| MICHIGAN | | 38-2766606 |
(State or other jurisdiction of incorporation or organization) | | (I.R.S. Employer Identification No.) |
100 Bloomfield Hills Parkway,3350 Peachtree Road NE, Suite 300150
Bloomfield Hills, Michigan 48304Atlanta, Georgia 30326
(Address of principal executive offices) (Zip Code)
Registrant’s telephone number, including area code: (248) 647-2750(404) 978-6400
Securities registered pursuant to Section 12(b) of the Act:
|
| | |
| Title of each class | | Name of each exchange on which registered |
| Common Stock, par value $0.01 | | New York Stock Exchange |
PulteGroup, Inc. 7.375% Senior Notes due 2046 | | New York Stock Exchange |
Securities registered pursuant to Section 12(g) of the Act:
NONE
Indicate by check mark if the registrant is a well-known seasoned issuer, as defined in Rule 405 of the Securities Act. YES [X] NO [ ]
Indicate by check mark if the registrant is not required to file reports pursuant to Section 13 or Section 15(d) of the Act. YES [ ] NO [X]
Indicate by check mark whether the registrant (1) has filed all reports required to be filed by Section 13 or 15(d) of the Securities Exchange Act of 1934 during the preceding 12 months (or for such shorter period that the registrant was required to file such reports), and (2) has been subject to such filing requirements for the past 90 days. YES [X] NO [ ]
Indicate by check mark whether the registrant has submitted electronically and posted on its corporate Web site, if any, every Interactive Data File required to be submitted and posted pursuant to Rule 405 of Regulation S-T (§ 232.405 of this chapter) during the preceding 12 months (or for such shorter period that the registrant was required to submit and post such files). Act. YES [X] NO [ ]
Indicate by check mark if disclosure of delinquent filers pursuant to Item 405 of Regulation S-K (§ 229.405 of this chapter) is not contained herein, and will not be contained, to the best of registrant’s knowledge, in definitive proxy or information statements incorporated by reference in Part III of this Form 10-K or any amendment to this Form 10-K. [X][ ]
Indicate by check mark whether the registrant is a large accelerated filer, an accelerated filer, a non-accelerated filer, or a smaller reporting company. See the definitions of “large accelerated filer”, “accelerated filer”, and “smaller reporting company” in Rule 12b-2 of the Exchange Act. (Check one):
Large accelerated filer [X] Accelerated filer [ ] Non-accelerated filer [ ] Smaller reporting company [ ]
Indicate by check mark whether the registrant is a shell company (as defined in Rule 12b-2 of the Act). YES [ ] NO [X]
The aggregate market value of the registrant’s voting stock held by nonaffiliates of the registrant as of June 30, 20132015, based on the closing sale price per share as reported by the New York Stock Exchange on such date, was $7,299,008,8717,084,534,862.
As of February 1, 20142016, the registrant had 381,299,600349,148,351 shares of common stock outstanding.
Documents Incorporated by Reference
Applicable portions of the Proxy Statement for the 20142016 Annual Meeting of Shareholders are incorporated by reference in Part III of this Form.
PULTEGROUP, INC.
TABLE OF CONTENTS
| | Item No. | | Page No. | | Page No. |
| | | | | |
| | | |
| 1 | | | | |
| | | |
| 1A | | | | |
| | | |
| 1B | | | | |
| | | |
| 2 | | | | |
| | | |
| 3 | | | | |
| | | |
| 4 | | | | |
| | | |
| 4A | | | | |
| | | |
| | | | | |
| | | |
| 5 | | | | |
| | | |
| 6 | | | | |
| | | |
| 7 | | | | |
| | | |
| 7A | | | | |
| | | |
| 8 | | | | |
| | | |
| 9 | | | | |
| | | |
| 9A | | | | |
| | | |
| 9B | | | | |
| | | |
| | | | | |
| | | |
| 10 | | | | |
| | | |
| 11 | | | | |
| | | |
| 12 | | | | |
| | | |
| 13 | | | | |
| | | |
| 14 | | | | |
| | | |
| | | | | |
| | | |
| 15 | | | | |
| | | |
| | | | | |
PART I
ITEM I. BUSINESS
PulteGroup, Inc.
PulteGroup, Inc. is a Michigan corporation organized in 1956. We are one of the largest homebuilders in the United States ("U.S."), and our common stock trades on the New York Stock Exchange under the ticker symbol “PHM”. Unless the context otherwise requires, the terms "PulteGroup", the "Company", "we", "us", and "our" used herein refer to PulteGroup, Inc. and its subsidiaries. While our subsidiaries engage primarily in the homebuilding business, we also have mortgage banking operations, conducted principally through Pulte Mortgage LLC (“Pulte Mortgage”), and title operations.
Homebuilding, our core business, includes the acquisition and development of land primarily for residential purposes within the U.S. and the construction of housing on such land. Homebuilding offers a broad product line to meet the needs of home buyershomebuyers in our targeted markets. Through our brands, which include Pulte Homes, Del Webb, and Centex, (acquired through our merger with Centex Corporation ("Centex") in 2009), we offer a wide variety of home designs, including single-family detached, townhouses, condominiums, and duplexes at different prices and with varying levels of options and amenities to our major customer groups: entry-level,first-time, move-up, and active adult. Over our history, we have delivered over 625,000655,000 homes.
As of December 31, 20132015, we conducted our operations in 4850 markets located throughout 2726 states. For reporting purposes, our Homebuilding operations are aggregated into six reportable segments:
|
| | |
| Northeast: | | Connecticut, Delaware, Maryland, Massachusetts, New Jersey, New York, Pennsylvania,
Rhode Island, Virginia |
| Southeast: | | Georgia, North Carolina, South Carolina, Tennessee |
| Florida: | | Florida |
| Midwest: | | Illinois, Indiana, Kentucky, Michigan, Minnesota, Missouri, Ohio |
| Texas: | | Texas |
North: | | Illinois, Indiana, Michigan, Minnesota, Missouri, Northern California, Ohio, Oregon, Washington |
Southwest:West: | | Arizona, California, Nevada, New Mexico, Southern CaliforniaWashington |
We also have a reportable segment for our financial services operations, which consist principally of mortgage banking and title operations. Our Financial Services segment operates generally in the same geographic markets as our Homebuilding segments.
Financial information for each of our reportable business segments is included in Note 54 to our Consolidated Financial Statements.
Available information
Our internet website address is www.pultegroupinc.com. Our annual reports on Form 10-K, quarterly reports on Form 10-Q, current reports on Form 8-K, and amendments to those reports filed or furnished pursuant to Section 13(a) or 15(d) of the Exchange Act are available free of charge through our website as soon as reasonably practicable after we electronically file them with or furnish them to the Securities and Exchange Commission. Our code of ethics for principal officers, our code of ethical business conduct, our corporate governance guidelines, and the charters of the Audit, Compensation and Management Development, Nominating and Governance, and Finance and Investment committeesCommittees of our Board of Directors are also posted on our website and are available in print, free of charge, upon request.
Homebuilding Operations
| | | | Years Ended December 31, ($000’s omitted) | Years Ended December 31, ($000’s omitted) |
| | 2013 | | 2012 | | 2011 | | 2010 | | 2009 | 2015 | | 2014 | | 2013 | | 2012 | | 2011 |
| Home sale revenues | $ | 5,424,309 |
| | $ | 4,552,412 |
| | $ | 3,950,743 |
| | $ | 4,419,812 |
| | $ | 3,869,297 |
| $ | 5,792,675 |
| | $ | 5,662,171 |
| | $ | 5,424,309 |
| | $ | 4,552,412 |
| | $ | 3,950,743 |
|
| Home closings | 17,766 |
| | 16,505 |
| | 15,275 |
| | 17,095 |
| | 15,013 |
| 17,127 |
| | 17,196 |
| | 17,766 |
| | 16,505 |
| | 15,275 |
|
Beginning in 2006 and continuing through 2011, the U.S. housing market experienced a significant decline in the demand for new homes as well as a sharp decline in overall residential real estate values. U.S. new home sales in 2011 were the lowest since 1962. As a result of this industry-wide downturn, we suffered net losses in each year between 2007 - 2011 from a combination of reduced operational profitability and significant asset impairments. In response to these market conditions, we restructured our operations, including making significant reductions in employee headcount and overhead costs, and managed our business to generate cash, including curtailing our investments in inventory. We used this positive cash flow to, among other things, increase our cash reserves as well as retire outstanding debt.
In 2012, new home sales in the U.S. increased for the first time since 2005. In 2013, thisThis trend continued in 2015 as new home sales in the U.S. rose 16%15% to approximately 428,000501,000 homes, an approximate 40%64% increase from the bottom of the housing cycle in 2011. Additionally, mortgage interest rates remain near historic lows and the overall inventory of homes available for sale, especially new homes, remains low. Although current industry volume remains low compared with historical levels, the improved environment and the actions we have taken contributed to our return to profitability in 2012 and a significant increaseincreases in our profitabilityincome before income taxes each year in 2013.the period 2013 - 2015. In the long term, we continue to believe that the national publicly-traded builders will have a competitive advantage over local builders through their ability to leverage economies of scale, access to more reliable and lower cost financing through the capital markets, ability to control and entitle large land positions, and greater geographic and product diversification. Among the national publicly-traded peer group, we believe that builders with broad geographic and product diversity, and sustainable capital positions will benefit as market conditions recover. In the short-term, we expect that overall market conditions will continue to improve but that improvements will occur unevenly across our markets. Our strategy to enhance shareholder value is centered around the following operational objectives:
Improving our inventory turns;
More effectivelyEffectively allocating the capital we invest in our business using a risk-based portfolio approach;
Maximizing our inventory turns while maintaining an adequate supply of house and land inventory;
Enhancing revenues by: establishing clear product offerings for each of our brands based on systematic, consumer-driven input, optimizing our pricing through the expanded use of options and lot premiums, and lesseninglimiting our reliance on speculative home sales;
Reducing our house costs through common house plan management, value-engineering our house plans, and working with suppliers to reduce costs; and
Maintaining an efficient overhead structure.
Our Homebuilding operations are geographically diverse within the U.S. As of December 31, 2013,2015, we had 577620 active communities.communities spanning 50 markets across 26 states. Sales prices of unit closings during 20132015 ranged from less than $100,000$100,000 to greater than $1,200,000,$1,500,000, with 86%85% falling within the range of $100,000$150,000 to $450,000.$500,000. The average unit selling price in 20132015 was $305,000,$338,000, compared with $276,000$329,000 in 2012, $259,0002014, $305,000 in 2011, $259,0002013, $276,000 in 2010,2012, and $258,000$259,000 in 2009.2011. The increase in average selling price in recent years resulted from a number of factors, including improved market conditions and a shift in our sales mix toward move-up and active adult homebuyers.
Sales of single-family detached homes, as a percentage of total unit sales, were 86% in 2015, compared with 86% in 2014, 85% in 2013, compared with 81% in 2012, and 79% in 2011, 79% in 2010, and 77% in 2009. The increase in the percentage of single-family detached homes can be attributed to a weakened demand for townhouses, condominiums, and other attached housing, as prices forshift in our business toward the move-up buyer, who tends to prefer detached new homes have become more affordable for entry-level and active adult homebuyers.homes.
Ending backlog, which represents orders for homes that have not yet closed, was $1.9$2.5 billion (5,772 (6,731 units) at December 31, 20132015 and $1.9 billion (6,4585,850 units) at December 31, 20122014. For each orderorders in backlog, we have received a signed customer contract and customer deposit, which is refundable in certain instances. Of the orders in backlog at December 31, 20132015, substantially all are scheduled to be closed during 20142016, though all orders are subject to potential cancellation by or final negotiations with the customer. In the event of cancellation, the majority of our sales contracts stipulate that we have the right to retain the customer’s deposit, though we may choose to refund the deposit in certain instances.
Land acquisition and development
We acquire land primarily for the construction of homes for sale to homebuyers. We select locations for development of homebuilding communities after completing a feasibility study, which includes, among other things, soil tests, independent environmental studies and other engineering work, an evaluation of necessary zoning and other governmental entitlements, and extensive market research that enables us to match the location with our product offering to targeted consumer groups. We consider factors such as proximity to developed areas, population and job growth patterns, and, if applicable, estimated development costs. We frequently manage a portion of the risk of controlling our land positions through the use of land option contracts, which enable us to defer acquiring portions of properties owned by land sellers until we have determined whether and when to exercise our option. Our use of land option agreements reduces ourthe financial risksrisk associated with long-term land holdings. We typically acquire land with the intent to complete sales of housing units within 24 to 36 months from the date of opening a community, except in the case of certain Del Webb active adult developments and other large master-planned projects for which the completion of community build-out requires a longer time period. While our overall supply of controlled land is in excess of our short-term needs in many of our markets, some of our controlled land consists of long-term positions that will not be converted to home sales in the near term. Accordingly, we remain active in our pursuit of new land investment. We may also periodically sell select parcels of land to third parties for commercial or other development. Additionally,development if we may determine that certain land assets no longerthey do not fit into our strategic operating plans.
Land is generally purchased after it is properly zoned and developed, or is ready for development.development for our intended use. In the normal course of business, we dispose of owned land not required by our homebuilding operations through sales to appropriate end users.sales. Where we develop land, we engage directly in many phases of the development process, including: land and site planning; obtaining environmental and other regulatory approvals; and constructing roads, sewers, water and drainage facilities, and community amenities, such as parks, pools, and clubhouses. We use our staff and the services of independent engineers and consultants for land development activities. Land development work is performed primarily by independent contractors and local government authorities who construct sewer and water systems in some areas. At December 31, 2013,2015, we controlled 123,478138,079 lots, of which 95,21295,919 were owned and 28,26642,160 were under land option agreements.
Sales and marketing
We are dedicated to improving the quality and value of our homes through innovative architectural and community designs. Analyzing various qualitative and quantitative data obtained through extensive market research, we stratify our potential customers into well-defined buyer groups. Such stratification provides a method for understanding the business opportunities and risks across the full spectrum of consumer groups in each market. Once the demands of potential buyers are understood, we link our home design and community development efforts to the specific lifestyle of each targeted consumer group. Through our portfolioevaluation of brands, each serving unique consumer groups, we are able to provide a distinct experience to potential customers:
|
| | | |
| | Centex | Pulte Homes | Del Webb |
| Targeted consumer group | Entry-level buyers | Move-up buyers | Active adults |
| Portion of 2013 home closings | 25% | 46% | 29% |
|
| | | |
| | First-Time | Move-Up | Active Adult |
| Portion of home closings: | | | |
| 2015 | 32% | 37% | 31% |
| 2011 | 40% | 29% | 31% |
The move-upOur homes targeted to first-time buyers in our Pulte Homes communitiestend to be smaller with product offerings geared toward lower average selling prices or higher density. Move-up buyers tend to place more of a premium on location and amenities. These communities typically offer larger homes at higher price points. Our Centex brand is targeted to entry-level buyers, and these homes tend to be smaller with product offerings geared toward lower average selling prices. Through our Del Webb brand, we are better able to address the needs of active adults. Our Del Webb brand offersadults, to whom we offer both destination communities and “in place” communities, for those buyers who prefer to remain in their current geographic area. TheseMany of these communities are highly amenitized, communities offeroffering a variety of features, including golf courses, recreational centers, and educational classes, to the age fifty-five and over buyer to maintain an active lifestyle. In order to make the cost of these highly amenitized communities affordable to the individual homeowner, Del Webb communities tend to be larger than entry-levelfirst-time or move-up buyer communities. As illustrated in the above table, our sales mix has shifted toward the move-up buyer in recent years. This has occurred primarily due to financial challenges facing the first-time buyer, including a recovering U.S. economy, the overhang of consumer debt, especially student loans related to higher education, and a more restrictive mortgage lending environment.
We market our homes to prospective buyers through media advertising, illustrated brochures, Internetinternet listings and link placements, mobile applications, and other advertising displays. We have made significant enhancements in our tools and business practices to adapt our selling efforts to today's mobile customers. In addition, our websites, www.pulte.com,
www.delwebb.com, and www.centex.com, provide tools to help users find a home that meets their needs, investigate financing alternatives, communicate moving plans, maintain a home, learn more about us, and communicate directly with us. There were approximately 9.29.6 million unique visits to our websites during 20132015, compared with approximately 8.010.4 million in 2012.2014.
To meet the demands of our various customers, we have established design expertise for a wide array of product lines. We believe that we are an innovator in consumer-inspired home design, and we view our design capabilities as an integral aspect of our marketing strategy. Our in-house architectural services teams and management, supplemented by outside consultants, createfollow a 12-step product development process to introduce new features and technologies based on customer-validated data. Following this disciplined process results in distinctive design features, both in exterior facades and interior options and features. We typically offer a variety of potential options and upgrades, such as different flooring, countertop, and appliance choices, and design our base house and option packages to meet the needs of our customers as defined through rigorous market research. Energy efficiency represents an important source of value for new homes compared with existing homes and represents a key area of focus for our home designs, including high efficiency HVAC systems and insulation, low-emissivity windows, solar power in certain geographies, and other energy-efficient features.
Typically, our sales teams, in some cases together with outside sales brokers, are responsible for guiding the customer through the sales process. We are committed to industry-leading customer service through a variety of quality initiatives, including our customer care program, which ensures that homeowners are comfortable at every stage of the building process. Fully furnished and landscaped model homes physically located in our communities are generally used to showcase our homes and their distinctive design features.
Construction
The construction of our homes is conducted under the supervision of our on-site construction field managers. Substantially all of our construction work is performed by independent subcontractors under contracts that, in many instances, cover both labor and materials on a fixed-price basis. Using a selective process, we have teamed up with what we believe are premier subcontractors and suppliers to deliver all aspects of the house construction process.
Continuous improvement in our house construction process is a key area of focus. We seek to maintain efficient construction operations by using standard materials and components from a variety of sources and by utilizing standard construction practices. Beginning in 2011, we implemented an intensive effort to improveWe are improving our product offerings and production processes through the following programs:
A 12-step product development process to introduce new features and technologies based on customer-validated data;
Common management of house plans in order to focus on building those house designs that customers value the most and that can be built at the highest quality and at an efficient cost;
Value engineering our house plans to optimize house designs in terms of material content and ease of construction while still providing a clear value to the customer (value engineering eliminates items that add cost but that have little to no value to the customer);
Improving our usage of Pulte Construction Standards, a proprietary system of internally required construction practices, through development of new or revised standards, training of our field leadership and construction personnel, communication with our suppliers, and auditing our compliance; and
Working with our suppliers to establish the "should cost", a data driven, collaborative effort to reduce construction costs to what the associated construction activities or materials “should cost” in the market.
The availability of labor and materials at reasonable prices is becominghas become an increasingincreased concern for certain trades and building materials in some markets as the supply chain respondsadjusts to uneven industry growth. Additionally, the cost of certain building materials, especially lumber, steel, concrete, copper, and petroleum-based materials, is influenced by changes in global commodity prices. To minimize the effects of changes in construction costs, the contracting and purchasing of building supplies and materials generally is negotiated at or near the time when related sales contracts are signed with customers. In addition, we leverage our size by actively negotiating for certain materials on a national or regional basis to minimize production component cost. We are also working to establish a more integrated system that can effectively link suppliers, contractors, and the production schedule. However, we cannot determine the extent to which necessary building materials and labor will be available at reasonable prices in the future.
Competition
The housing industry in the U.S. is fragmented and highly competitive. While we are one of the largest homebuilders in the U.S., our national market share represented only approximately 4%3% of U.S. new home sales in 20132015. In each of our local markets, there are numerous national, regional, and local homebuilders with whom we compete. Additionally, new home sales have traditionally represented less than 15% of overall U.S. home sales (new and existing homes). Therefore, we also compete with sales of existing house inventory and any provider of housing units, for sale or to rent,rental housing units, including apartment operators, may be considered a competitor. Conversion of apartments to condominiums further provides an alternative to traditional housing, as does manufactured housing.operators. We compete primarily on the basis of location, price, quality, reputation, design, community amenities, and our customers' overall sales and homeownership experiences.
Seasonality
OurAlthough significant changes in market conditions have impacted our seasonal patterns in the past and could do so again, we historically experience variability in our quarterly results from operations due to the seasonal nature of the homebuilding operating cycle historically reflected increasedindustry. We generally experience increases in revenues profitability, and cash flow from operations during the fourth quarter based on the timing of home closings. WhileThis seasonal activity increases our working capital requirements in our third and fourth quarters to support our home production and loan origination volumes. As a result of the challenging market conditions experienced in recent years lessened the seasonal variationsseasonality of our operations, our quarterly results we have experienced a return to a more traditional demand pattern as new orders were higher in the first halfof operations are not necessarily indicative of the year and home closings increased in each quarter throughoutresults that may be expected for the full year. If and when the homebuilding industry more fully recovers from the recent downturn, we believe these traditional seasonal patterns will continue.
Regulation and environmental matters
Our operations are subject to extensive regulations imposed and enforced by various federal, state, and local governing authorities. These regulations are complex and include building codes, land zoning and other entitlement restrictions, health and safety regulations, labor practices, marketing and sales practices, environmental regulations, rules and regulations relating to mortgage financing and title operations, and various other laws, rules, and regulations. Collectively, these regulations have a significant impact on the site selection and development of our communities, our house design and construction techniques, our relationships with customers, employees, and suppliers / subcontractors, and many other aspects of our business. The applicable governing authorities frequently have broad discretion in administering these regulations, including inspections of our homes prior to closing with the customer in the majority of municipalities in which we operate.
Financial Services Operations
We conduct our financial services business, which includes mortgage and title operations, through Pulte Mortgage and other subsidiaries. Pulte Mortgage arranges financing through the origination of mortgage loans primarily for the benefit of our homebuyers. We are a lender approved by the FHA and VA and are a seller/servicer approved by Government National Mortgage Association ("Ginnie Mae"), Federal National Mortgage Association ("Fannie Mae"), Federal Home Loan Mortgage Corporation ("Freddie Mac"), and other investors. In our conventional mortgage lending activities, we follow underwriting guidelines established by Fannie Mae, Freddie Mac, and private investors. We believe that our customers’ use of our in-house mortgage and title operations provides us with a competitive advantage by enabling more control over the quality of the overall home buying process for our customers while also helping us align the timing of the house construction process with our customers’ financing needs.
Operating as a captive business model primarily targeted to supporting our Homebuilding operations, the business levels of our Financial Services operations are highly correlated to Homebuilding. During 2013, 2012,2015, 2014, and 2011,2013, we originated mortgage loans for 64%65%, 67%61%, and 61%64%, respectively, of the homes we sold. Such originations represented substantially all of our total originations in each of those years. Our capture rate, which we define as loan originations from our homebuilding business as a percentage of total loan opportunities from our homebuilding business excluding cash settlements, was 82.9% in 2015, 80.2% in 2014, 80.2% in 2013, 81.9% in 2012,, and 78.5% in 2011.2011.
In originating mortgage loans, we initially use our own funds, including funds available pursuant to credit agreements with third parties, and subsequently sell such mortgage loans to third party investors in the secondary market. Substantially all of the loans we originate are sold in the secondary market within a short period of time after origination, generally within 30 days. We also sell the servicing rights for the loans we originate through fixed price servicing sales contracts to reduce the risks and costs inherent in servicing loans. This strategy results in owning the loans and related servicing rights for only a short period of time.
The mortgage industry in the U.S. is highly competitive. We compete with other mortgage companies and financial institutions to provide attractive mortgage financing to our homebuyers. We utilize a centralized fulfillment center staffed with loan consultants to performfor our mortgage operations that performs underwriting, processing, and closing functions. We believe centralizing both the fulfillment and origination of our loans improves the speed, efficiency, and quality of our mortgage operations, improving our profitability and allowing us to focus on providing attractive mortgage financing opportunities for our customers.
In originating and servicing mortgage loans, we are subject to the rules and regulations of the government-sponsored investors and other investors that purchase the loans we originate, as well as to those of other government agencies that have oversight of the government-sponsored investors or consumer lending rules in the U.S. In addition to being affected by changes in these programs, our mortgage banking business is also affected by many of the same factors that impact our homebuilding business.
Our mortgage operations may be responsible for losses associated with mortgage loans originated and sold to investors in the event of errors or omissions relating to representations and warranties made by us that the loans met certain requirements, including representations as to underwriting standards, the existence of primary mortgage insurance, and the validity of certain borrower representations in connection with the loan. If a loan is determined to be faulty, we either repurchase the loan from the investors or reimburse the investors' losses (a "make-whole" payment). Historically, our overall losses related to this risk were not significant. Beginning in 2009, however, we experienced a significant increase in losses as a result of the high level of loan defaults and related losses in the mortgage industry and increasing aggressiveness by investors in presenting such claims to us. To date, the significant majority of these losses relates to loans originated in 2006 and 2007, during which period inherently riskier loan products became more common in the mortgage origination market. Given the volatility in the mortgage industry and the uncertainty regarding the ultimate resolution of these claims, actual costs could differ from our current estimates.
Our subsidiary title insurance companies serve as title insurance agents and underwriters in select markets by providing title insurance policies and examination and closing services to buyers of homes we sell. Historically, we have not experienced significant claims related to our title operations.
Financial Information About Geographic Areas
Substantially all of our operations are located within the U.S. However, weWe have some non-operating foreign subsidiaries and affiliates, which are insignificant to our consolidated financial results.
Organization/Employees
All subsidiaries and operating units operate independently with respect to daily operations. Homebuilding real estate purchases and other significant homebuilding, mortgage banking, financing activities, and similar operating decisions must be approved by the business unit’s management and/or corporate senior management.
At December 31, 20132015, we employed 3,8434,542 people, of which 709749 people were employed in our Financial Services operations. Except for a small group of employees in our St. Louis homebuilding division, our employees are not represented by any union. Contracted work, however, may be performed by union contractors. Our local and corporate management personnel are paid incentive compensation based on a combination of individual performance and the performance of the applicable business unit or the Company. Each business unit is given a level of autonomy regarding employment of personnel, althoughsubject to adherence to our established policies and procedures, and our senior corporate management acts in an advisory capacity in the employment of subsidiary officers. We consider our employee and contractor relations to be satisfactory.
ITEM 1A. RISK FACTORS
Discussion of our business and operations included in this annual report on Form 10-K should be read together with the risk factors set forth below. They describe various risks and uncertainties to which we are, or may become, subject. These risks and uncertainties, together with other factors described elsewhere in this report, have the potential to affect our business, financial condition, results of operations, cash flows, strategies, or prospects in a material and adverse manner.
Downward changes in general economic, real estate construction, or other business conditions could adversely affect our business or our financial results.
The residential homebuilding industry is sensitive to changes in economic conditions and other factors, such as the level of employment, consumer confidence, consumer income, availability of financing, and interest rate levels. Adverse changes in any of these conditions generally, or in the markets where we operate, could decrease demand and pricing for new homes in these areas or result in customer cancellations of pending contracts, which could adversely affect the number of home deliveries we make or reduce the prices we can charge for homes, either of which could result in a decrease in our revenues and earnings and would adversely affect our financial condition.
The homebuilding industry experienced a significant downturn in recent years.from 2006 through 2011. Although industry conditions improved duringbeginning in 2012, and 2013, the overall U.S. economy, while improving, remains challenged and consumer demand in the industry remains volatile. A deterioration in industry conditions could adversely affect our business and results of operations.
Beginning in 2006 and continuing through 2011, the U.S. housing market was unfavorably impacted by severe weakness in new home sales attributable to, among other factors, weak consumer confidence, tightened mortgage standards, significant foreclosure activity, a more challenging appraisal environment, higher than normal unemployment levels, and significant uncertainty in the global economy. These conditions contributed to sharply weakened demand for new homes and heightened pricing pressures on new and existing home sales. As a result of these factors, we experienced significant decreases in our revenues and profitability during the period 2007 - 2011. We also incurred substantial impairments of our land inventory and certain other assets during this period. During 2012 and 2013,Since 2011, overall industry new home sales have increased, and we returned to profitability. However, the overall demand for new homes remains below historical levels. Accordingly, we can provide no assurances that the adjustments we have made in our operating strategy will be successful.
If the market value of our land and homes drops significantly, our profits could decrease.
The market value of land, building lots, and housing inventories can fluctuate significantly as a result of changing market conditions, and the measures we employ to manage inventory risk may not be adequate to insulate our operations from a severe drop in inventory values. We acquire land for expansion into new markets and for replacement of land inventory and expansion within our current markets. If housing demand decreases below what we anticipated when we acquired our inventory, we may not be able to make profits similar to what we have made in the past, we may experience less than anticipated profits, and/or we may not be able to recover our costs when we sell and build homes. When market conditions are such that land values are not appreciating, option arrangements previously entered into may become less desirable, at which time we may elect to forego deposits and pre-acquisition costs and terminate the agreement. In the face of adverse market conditions, we may have substantial inventory carrying costs, we may have to write down our inventory to its fair value, and/or we may have to sell land or homes at a loss.
Supply shortages and other risks related to the demand for skilled labor and building materials could increase costs and delay deliveries.
The homebuilding industry is highly competitive for skilled labor and materials. Labor shortages in certain of our markets have become more acute in recent quarters as the supply chain adjusts to uneven industry growth. Additionally, the cost of certain building materials, especially lumber, steel, concrete, copper, and petroleum-based materials, is influenced by changes in local and global commodity prices. Increased costs or shortages of skilled labor and/or materials could cause increases in construction costs and / or construction delays. We may not be able to pass on increases in construction costs to customers and generally are unable to pass on any such increases to customers who have already entered into sales contracts as those sales contracts generally fix the price of the home at the time the contract is signed, which may be well in advance of the construction of the home. Sustained increases in construction costs may, over time, erode our margins, and pricing competition may restrict our ability to pass on any such additional costs, thereby decreasing our margins.
Our success depends on our ability to acquire land suitable for residential homebuilding at reasonable prices, in accordance with our land investment criteria.
The homebuilding industry is highly competitive for suitable land. The availability of finished and partially finished developed lots and undeveloped land for purchase that meet our internal criteria depends on a number of factors outside our control, including land availability in general, competition with other homebuilders and land buyers for desirable property, inflation in land prices, zoning, allowable housing density, and other regulatory requirements. Should suitable lots or land become less available, the number of homes we may be able to build and sell could be reduced, and the cost of land could be increased, perhaps substantially, which could adversely impact our results of operations.
Our long-term ability to build homes depends on our acquiring land suitable for residential building at reasonable prices in locations where we want to build. In the past, we experienced significant competition for suitable land as a result of land constraints in many of our markets. As competition for suitable land increases, and as available land is developed, the cost of acquiring suitable remaining land could rise, and the availability of suitable land at acceptable prices may decline. Any land shortages or any decrease in the supply of suitable land at reasonable prices could limit our ability to develop new communities or result in increased land costs. We may not be able to pass through to our customers any increased land costs, which could adversely impact our revenues, earnings, and margins.
We are subject to claims related to mortgage loans we sold in the secondary mortgage market that may be significant.
Our mortgage operations may be responsible for losses associated with mortgage loans originated and sold to investors in the event of errors or omissions relating to certain representations and warranties made by us that the loans met certain requirements, including representations as to underwriting standards, the type of collateral, the existence of primary mortgage insurance, and the validity of certain borrower representations in connection with the loan. To date, the significant majority of these losses relate to loans originated in 2006 and 2007, during which period inherently riskier loan products became more common in the origination market. We may also be required to indemnify underwriters that purchased and securitized loans originated by a former subsidiary of Centex for losses incurred by investors in those securitized loans based on similar breaches of representations and warranties.
To date, the significant majority of these losses relate to loans originated in 2006 and 2007, during which period inherently riskier loan products became more common in the origination market. In 2006 and 2007, we originated $39.5 billion of loans, excluding loans originated by Centex's former subprime loan business sold by Centex in 2006.
In addition, we entered into an agreement in conjunction with the wind down of Centex’s mortgage operations, which ceased loan origination activities in December 2009, that provides a guaranty for one major investor of loans originated by Centex. This guaranty provides that we will honor the potential repurchase obligations of Centex’s mortgage operations related to breaches of similar representations in the origination of a certain pool of loans.
The resolution of claims related to alleged breaches of these representations and warranties and repurchase claims could have a material adverse effect on our financial condition, cash flows and results of operations, and could exceed existing estimates and accruals. The repurchase liability we have recorded is estimated based on several factors, includingoperations. Given the level of current unresolved repurchase requests, the volume of estimated probable future repurchase requests, our ability to cure the defects identifiedongoing volatility in the repurchase requests, and the severitymortgage industry, changes in values of the estimated loss upon repurchase. The factors referred to above are subject to change in light of market developments, the economic environment,underlying collateral over time, and other circumstances, someuncertainties regarding the ultimate resolution of which are beyondthese claims, actual costs could differ from our control.current estimates. Accordingly, there can be no assurance that such reserves will not need to be increased in the future.
Future increases in interest rates, reductions in mortgage availability, or other increases in the effective costs of owning a home could prevent potential customers from buying our homes and adversely affect our business and financial results.
A large majority of our customers finance their home purchases through mortgage loans, many through our mortgage bank. Interest rates have been near historical lows for several years, which has made new homes more affordable. Increases in interest rates or decreases in the availability of mortgage financing however, could adversely affect the market for new homes. Potential homebuyers may be less willing or able to pay the increased monthly costs or to obtain mortgage financing. Lenders may increase the qualifications needed for mortgages or adjust their terms to address any increased credit risk. Even if potential customers do not need financing, changes in interest rates and mortgage availability could make it harder for them to sell their current homes to potential buyers who need financing. These factors could adversely affect the sales or pricing of our homes and could also reduce the volume or margins in our financial services business. Our financial services business could also be impacted to the extent we are unable to match interest rates and amounts on loans we have committed to originate through the various hedging strategies we employ. These developments have had, and may continue to have, a material adverse effect on the overall demand for new housing and thereby on the results of operations for our homebuilding business.
We also believe that the availability of FHA and VA mortgage financing is an important factor in marketing some of our homes. The FHA has and may continue to impose stricter loan qualification standards, raise minimum down payment requirements, impose higher mortgage insurance premiums and other costs, and/or limit the number of mortgages it insures. The liquidity provided by Fannie Mae and Freddie Mac to the mortgage industry is also critical to the housing market. The impact of the federal government’s conservatorship of Fannie Mae and Freddie Mac on the short-term and long-term demand for new housing remains unclear. Any limitations or restrictions on the availability of financing by these agencies could adversely affect interest rates, mortgage financing, and our sales of new homes and mortgage loans.
Significant costs of homeownership include mortgageMortgage interest expense and real estate taxes represent significant costs of homeownership, both of which are generally deductible for an individual’s federal and, in some cases, state income taxes. Any changes to income tax laws by the
federal government or a state government to eliminate or substantially reduce these income tax deductions, as has been considered from time to time, would increase the after-tax cost of owning a home. Increases in real estate taxes by local governmental authorities also increase the cost of homeownership. Any such increases to the cost of homeownership could adversely impact the demand for and sales prices of new homes.
Adverse capital and credit market conditions may significantly affect our access to capital and cost of capital.
The capital and credit markets have experiencedcan experience significant volatility in recent years. In many cases, the markets have exerted downward pressure on the availability of liquidity and credit capacity for issuers.volatility. We may need credit-related liquidity for the future growth and development of our business. Without sufficient liquidity, we may not be able to purchase additional land or develop land, which could adversely affect our financial results. At December 31, 2013,2015, we had cash and equivalents of $1.6 billion as well as$754.2 million, restricted cash totaling $72.7$21.3 million,. and $308.7 million available under our revolving credit facility, net of outstanding letters of credit. However, our internal sources of liquidity may prove to be insufficient, and in such case, we may not be able to successfully obtain additional financing on terms acceptable to us, or at all.
Another source of liquidity includes our ability to use letters of credit and surety bonds pursuant to certain performance-related obligations and as security for certain land option agreements and under various insurance programs. The majority of these letters of credit and surety bonds are in support of our land development and construction obligations to various municipalities, other government agencies, and utility companies related to the construction of roads, sewers, and other infrastructure. At December 31, 20132015, we had outstanding letters of credit and surety bonds totaling $183.1$191.3 million and $958.3 million,$1.0 billion, respectively. Of these amounts outstanding, $58.7 million of theThese letters of credit were subject to cash-collateralized agreements while the remaining letters ofare issued via our unsecured revolving credit facility, which contains certain financial covenants and surety bonds were unsecured.other limitations. If we are unable to obtain letters of credit or surety bonds when required, or the conditions imposed by issuers increase significantly, our financial condition and results of operations could be adversely affected.
Competition for homebuyers could reduce our deliveries or decrease our profitability.
The U.S. housing industry in the U.S. is highly competitive. We compete primarily on the basis of location, price, quality, reputation, design, community amenities, and our customers' overall sales and homeownership experiences. We compete in each of our markets with numerous national, regional, and local homebuilders. This competition with other homebuilders could reduce the number of homes we deliver or cause us to accept reduced margins in order to maintain sales volume.
We also compete with resales of existing or foreclosed homes, housing speculators, and available rental housing. Increased competitive conditions in the residential resale or rental market in the regions where we operate could decrease demand for new homes or unfavorably impact pricing for new homes.
Supply shortages and other risks related to the demand for skilled labor and building materials could increase costs and delay deliveries.
The homebuilding industry is highly competitive for skilled labor and materials. Additionally, the cost of certain building materials, especially lumber, steel, concrete, copper, and petroleum-based materials, is influenced by changes in global commodity prices. Increased costs or shortages of skilled labor and/or materials could cause increases in construction costs and construction delays. We may not be able to pass on increases in construction costs to customers and generally are unable to pass on any such increases to customers who have already entered into sales contracts as those sales contracts generally fix the price of the home at the time the contract is signed, which may be well in advance of the construction of the home. Sustained increases in construction costs may, over time, erode our margins, and pricing competition may restrict our ability to pass on any such additional costs, thereby decreasing our margins.
Our income tax provision and tax reserves may be insufficient if a taxing authority is successful in asserting positions that are contrary to our interpretations and related reserves, if any.
Significant judgment is required in determining our provision for income taxes and our reserves for federal, state, and local taxes. In the ordinary course of business, there may be matters for which the ultimate outcome is uncertain. Our evaluation of our tax matters is based on a number of factors, including changes in facts or circumstances, changes in tax law, correspondence with tax authorities during the course of audits, and effective settlement of audit issues. Although we believe our approach to determining the tax treatment for such items is appropriate, no assurance can be given that the final tax authority review will not be materially different than that which is reflected in our income tax provision and related tax reserves. Such differences could have a material adverse effect on our income tax provision in the period in which such determination is made and, consequently, on our financial position, cash flows, or net income for such period.
We are periodically audited by various federal, state, and local authorities regarding tax matters. Our current audits are in various stages of completion; however, no outcome for a particular audit can be determined with certainty prior to the conclusion of the audit, appeal, and, in some cases, litigation process. As each audit is concluded, adjustments, if any, are recorded in our financial statements in the period determined. To provide for potential tax exposures, we maintain tax reserves based on reasonable estimatesconsider a variety of potentialfactors, including changes in facts or circumstances, changes in law, correspondence with taxing authorities, and effective settlement of audit results.issues. If these reserves are insufficient upon completion of an audit, there could be an adverse impact on our financial position, cash flows, and results of operations.
We may not realize our deferred income tax assets.
As of December 31, 20132015, we had deferred income tax assets, net of deferred tax liabilities, of $2.2$1.5 billion, against which we provided a valuation allowance of $157.3 million.$109.1 million. The ultimate realization of our deferred income tax assets is dependent upon generating future taxable income and executing tax planning strategies. While we have recorded valuation allowances against certain of our deferred income tax assets, the valuation allowances are subject to change as facts and circumstances change.
Our ability to utilize net operating losses (“NOLs”), built-in losses (“BILs”), and tax credit carryforwards to offset our future taxable income would be limited if we were to undergo an “ownership change” within the meaning of Section 382 of the Internal Revenue Code (the “IRC”). In general, an “ownership change” occurs whenever the percentage of the stock of a corporation owned by “5-percent shareholders” (within the meaning of Section 382 of the IRC) increases by more than 50 percentage points over the lowest percentage of the stock of such corporation owned by such “5-percent shareholders” at any time over the testing period.
An ownership change under Section 382 of the IRC would establish an annual limitation to the amount of NOLs, BILs, and tax credit carryforwards we could utilize to offset our taxable income in any single year. The application of these limitations might prevent full utilization of the deferred tax assets attributable to our NOLs, BILs, and tax credit carryforwards. We have not experienced an ownership change as defined by Section 382. To preserve our ability to utilize NOLs, BILs, and other tax benefits in the future without a Section 382 limitation, we adopted a shareholder rights plan, which is triggered upon certain transfers of our securities, and amended our by-laws to prohibit certain transfers of our securities. Our shareholder rights plan expires June 1, 2016, unless our board of directors and shareholders approve an amendment to extend the term prior thereto. Notwithstanding the foregoing measures, there can be no assurance that we will not undergo an ownership change within the meaning of Section 382.
As a result of theour merger with Centex in August 2009, our ability to use certain of Centex’s pre-ownership change NOLs, BILs, and deductions is limited under Section 382 of the Internal Revenue Code. The applicable Section 382 limitation is approximately $67.4 million per year for NOLs, losses realized on built-in loss assets that are sold within 60 months of the ownership change (i.e. before August 2014), and certain deductions.IRC. We do not believe that the Section 382 limitation will prevent the Companyus from using Centex's pre-ownership change NOL carryforwards and built-in lossesfederal NOLs, BILs, or deductions.deductions, however, no assurance can be given that any such limitation will not occur, which could be material.
The value of our deferred tax assets is also dependent upon the tax rates expected to be in effect at the time taxable income is expected to be generated. A decrease in enacted corporate tax rates in our major jurisdictions, especially the U.S. federal corporate tax rate, would decrease the value of our deferred tax assets, which could be material.
We have significant intangible assets. If these assets become impaired, then our profits and shareholders’ equity may be reduced.
We have significant intangible assets related to prior business combinations. We evaluate the recoverability of intangible assets whenever facts and circumstances indicate the carrying amount may not be recoverable. If the carrying value of intangible assets is deemed impaired, the carrying value is written down to fair value. This would result in a charge to our operating earnings. If management’s expectations of future results and cash flows decrease significantly, impairments of the remaining intangible assets may occur.
Government regulations could increase the cost and limit the availability of our development and homebuilding projects or affect our related financial services operations and adversely affect our business or financial results.
Our operations are subject to building, environmental, and other regulations imposed and enforced by various federal, state, and local governing authorities. New housing developments may also be subject to various assessments for schools, parks, streets, and other public improvements. These can cause an increase in the effective cost of our homes.
We also are subject to a variety of local, state, and federal laws and regulations concerning protection of health, safety, and the environment. The impact of environmental laws varies depending upon the prior uses of the building site or adjoining properties and may be greater in areas with less supply where undeveloped land or desirable alternatives are less available. These matters may result in delays, may cause us to incur substantial compliance, remediation and other costs, and can prohibit or severely restrict development and homebuilding activity in environmentally sensitive regions or areas. More stringent requirements could be imposed in the future on homebuilders and developers, thereby increasing the cost of compliance.
Our financial services operations are also subject to numerous federal, state, and local laws and regulations. These include eligibility requirements for participation in federal loan programs and compliance with consumer lending and similar
requirements such as disclosure requirements, prohibitions against discrimination, and real estate settlement procedures. They also subject our operations to examination by applicable agencies, pursuant to which those agencies may limit our ability to provide mortgage financing or title services to potential purchasers of our homes. For our homes to qualify for FHA or VA mortgages, we must satisfy valuation standards and site, material, and construction requirements of those agencies.
In January 2013, the Consumer Financial Protection Bureau ("CFPB") adopted new rules regarding the origination of mortgages, including the criteria for “qualified mortgages”, rules for lender practices regarding assessing borrowers’ ability to repay, and limitations on certain fees and incentive arrangements. Such rules went into effect in January 2014. The CFPB also issued the TILA-RESPA Integrated Disclosure ("TRID") rules, which combined the mortgage disclosures consumers receive under the Truth in Lending Act ("TILA") and the Real Estate Settlement and Procedures Act ("RESPA"). Such rules went into effect in October 2015. While we have adjusted our operations to comply with the new rules, the impact such rules will have on our business remains unclear. Additionally, manycertain other rules required by the Dodd-Frank Act of 2010 have not yet been completed or implemented, which has created uncertainty in the overall U.S. financial services and mortgage industries as to their long-term impact.
Homebuilding is subject to warranty and other claims in the ordinary course of business that can be significant.
As a homebuilder, we are subject to home warranty, construction defect, and other claims arising in the ordinary course of business. We record warranty and other reserves for the homes we sell based on historical experience in our markets and our judgment of the qualitative risks associated with the types of homes built. We have, and require our subcontractors to have, general liability, property, errors and omissions, workers compensation, and other business insurance. These insurance policies protect us against a portion of our risk of loss from claims, subject to certain self-insured per occurrence and aggregate retentions, deductibles, and available policy limits. In certain instances, we may offer our subcontractors the opportunity to purchase insurance through one of our captive insurance subsidiaries or participate in a project-specific insurance program provided by us. Policies issued by our captive insurance subsidiaries represent self-insurance of these risks by us. We reserve for costs to cover our self-insured and deductible amounts under these policies and for any costs of claims and lawsuits based on an analysis of our historical claims, which includes an estimate of claims incurred but not yet reported. Because of the uncertainties inherent in these matters, we cannot provide assurance that our insurance coverage, our subcontractor arrangements, and our reserves will be adequate to address all our warranty and construction defect claims in the future. Contractual indemnities can be difficult to enforce, we may be responsible for applicable self-insured retentions, and some types of claims may not be covered by insurance or may exceed applicable coverage limits. Additionally, the coverage offered by and the availability of general liability insurance for construction defects are currently costly and limited. We have responded to increases in insurance costs and coverage limitations by increasing our self-insured retentions and claim reserves. There can be no assurance that coverage will not be further restricted andor become more costly. Additionally, we are exposed to counterparty default risk related to our subcontractors, and our insurance carriers, and our subcontractors’ insurance carriers.
Natural disasters and severe weather conditions could delay deliveries, increase costs, and decrease demand for new homes in affected areas.
Our homebuilding operations are located in many areas that are subject to natural disasters and severe weather. The occurrence of natural disasters or severe weather conditions can delay new home deliveries, increase costs by damaging inventories, reduce the availability of materials, and negatively impact the demand for new homes in affected areas. Furthermore, if our insurance does not fully cover business interruptions or losses resulting from these events, our earnings, liquidity, or capital resources could be adversely affected.
Inflation may result in increased costs that we may not be able to recoup.
Inflation can have a long-term impact on us because increasing costs of land, materials, and labor may require us to increase the sales prices of homes in order to maintain satisfactory margins. However, we may not be able to raise home prices sufficiently to keep up with the rate of inflation and our margins could decrease. In addition, inflation is often accompanied by higher interest rates, which could have a negative impact on housing demand.
Information technology failures or data security breaches could harm our business.
We use information technology and other computer resources to carry out important operational activities and to maintain our business records. Our computer systems, including our back-up systems, are subject to damage or interruption from power outages, computer and telecommunications failures, computer viruses, security breaches (through cyber-attackscyberattacks from computer hackers and sophisticated organizations), catastrophic events such as fires, tornadoes and hurricanes, and usage
errors by our associates. If our computer systems and our back-up systems are damaged, breached, or cease to function properly, we could suffer interruptions in our operations or unintentionally allow misappropriation of proprietary or confidential information (including information about our homebuyers and business partners), which could require us to incur significant costs to remediate or otherwise resolve these issues.
Future terrorist attacks against the U.S. or increased domestic and international instability could have an adverse effect on our operations.
A future terrorist attack against the U.S. could cause a sharp decrease in the number of new contracts signed for homes and an increase in the cancellation of existing contracts. Accordingly, adverse developments in the war on terrorism, future terrorist attacks against the U.S., or increased domestic and international instability could adversely affect our business.
ITEM 1B. UNRESOLVED STAFF COMMENTS
None.
ITEM 2. PROPERTIES
Our homebuilding and corporate headquarters are located in leased office facilities at 100 Bloomfield Hills Parkway, Bloomfield Hills, Michigan 48304.3350 Peachtree Road NE, Suite 150, Atlanta, GA 30326. Pulte Mortgage leases its primary office facilities in Englewood, Colorado. We also maintain various support functions in leased facilities near Phoenix,in Tempe, Arizona and Atlanta, Georgia.Bloomfield Hills, Michigan. Our homebuilding divisions and financial services branches lease office space in the geographic locations in which they conduct their day-to-day operations.
Because of the nature of our homebuilding operations, significant amounts of property are held as inventory in the ordinary course. Such properties are not included in response to this Item.
ITEM 3. LEGAL PROCEEDINGS
We are involved in various legal and governmental proceedings incidental to our continuing business operations, many involving claims related to certain construction defects. The consequences of these matters are not presently determinable but, in our opinion, after consulting with legal counsel and taking into account insurance and reserves, the ultimate liability is not expected to have a material adverse impact on our results of operations, financial position, or cash flows. However, to the extent the liability arising from the ultimate resolution of any matter exceeds our estimates reflected in the recorded reserves relating to such matter, we could incur additional charges that could be significant.
ITEM 4. MINE SAFETY DISCLOSURES
This Item is not applicable.
ITEM 4A. EXECUTIVE OFFICERS OF THE REGISTRANT
Set forth below is certain information with respect to our executive officers.
| | | Name | | Age | | Position | | Year Became An Executive Officer | | Age | | Position | | Year Became An Executive Officer |
| Richard J. Dugas, Jr. | | 48 | | Chairman, President and Chief Executive Officer | | 2002 | | 50 | | Chairman, President and Chief Executive Officer | | 2002 |
| Robert T. O'Shaughnessy | | 48 | | Executive Vice President and Chief Financial Officer | | 2011 | | 50 | | Executive Vice President and Chief Financial Officer | | 2011 |
| James R. Ellinghausen | | | 57 | | Executive Vice President, Human Resources | | 2005 |
| Harmon D. Smith | | 50 | | Executive Vice President - Homebuilding Operations and Area President, Texas | | 2011 | | 52 | | Executive Vice President, Field Operations | | 2011 |
| James R. Ellinghausen | | 55 | | Executive Vice President, Human Resources | | 2005 | |
| Ryan R. Marshall | | | 41 | | Executive Vice President, Homebuilding Operations | | 2012 |
| Steven M. Cook | | 55 | | Senior Vice President, General Counsel and Secretary | | 2006 | | 57 | | Executive Vice President, Chief Legal Officer and Corporate Secretary | | 2006 |
| Stephen P. Schlageter | | 43 | | Area President, Northeast | | 2012 | |
| Ryan R. Marshall | | 39 | | Area President, Southeast | | 2012 | |
| Patrick J. Beirne | | 50 | | Area President, Central | | 2011 | |
| John J. Chadwick | | 52 | | Area President, Southwest | | 2012 | |
| James L. Ossowski | | 45 | | Vice President, Finance and Controller | | 2013 | | 47 | | Vice President, Finance and Controller | | 2013 |
The following is a brief account of the business experience of each officer during the past five years:
Mr. Dugas was appointed Chairman in August 2009 and President and Chief Executive Officer in July 2003. Previously, he was appointed Chief Operating Officer in May 2002 and Executive Vice President in December 2002. Since joining our company in 1994, he has served in a variety of management positions.
Mr. O'Shaughnessy was appointed Executive Vice President and Chief Financial Officer in May 2011. Prior to joining our company, he held a number of financial roles at Penske Automotive Group from 1997 to 2011, most recently as Executive Vice President and Chief Financial Officer.
Mr. Ellinghausen was appointed Executive Vice President, Human Resources in December 2006.
Mr. Smith was appointed Executive Vice President, -Field Operations in May 2014 and previously held the position of Executive Vice President, Homebuilding Operations and Area President, Texas insince May 2012, and previously held the position of Area President, Gulf Coast since 2008.2012. He has served as an Area President over various geographical markets since 2006.
Mr. EllinghausenMarshall was appointed Executive Vice President, Human ResourcesHomebuilding Operations in December 2006.
Mr. Cook was appointed Senior Vice President, General Counsel and Secretary in December 2008 and previously held the position of Vice President, General Counsel and Secretary since February 2006.
Mr. Schlageter was appointed Area President, Northeast in November 2012 and previouslyMay 2014. Previously he held the positions of Vice President, Strategic Planning since October 2010 and Division President, Raleigh since November 2003.
Mr. Marshall was appointed Area President, Southeast insince November 2012, and previously held the positions of Area President, Florida since May 2012, and Division President, South Florida since 2006.
Mr. BeirneCook was appointed AreaExecutive Vice President, CentralChief Legal Officer and Corporate Secretary in 2012 and has served as an Area President over various geographical markets since 2006.
Mr. Chadwick was appointed Area President, Southwest in 2012September 2015 and previously served as Division President, Arizona. Since 2006, Mr. Chadwick has held the positionpositions of AreaSenior Vice President, or DivisionGeneral Counsel and Secretary since December 2008 and Vice President, over various geographical markets.General Counsel and Secretary since February 2006.
Mr. Ossowski was appointed Vice President, Finance and Controller in February 2013 and previously held the position of Vice President, Finance - Homebuilding Operations since August 2010. Since 2002, Mr. Ossowski has held various finance positions of increasing responsibility with the Company.our company.
There is no family relationship between any of the officers. Each officer serves at the pleasure of the Board of Directors.
PART II
| |
| ITEM 5. | MARKET FOR THE REGISTRANT’S COMMON EQUITY, RELATED STOCKHOLDER MATTERS AND ISSUER PURCHASES OF EQUITY SECURITIES |
Our common shares are listed on the New York Stock Exchange (Symbol: PHM).
Related Stockholder Matters
The table below sets forth, for the quarterly periods indicated, the range of high and low closingintraday sales prices for our common shares and dividend per share information:
| | | | December 31, 2013 | | December 31, 2012 | December 31, 2015 | | December 31, 2014 |
| | High | | Low | | Declared
Dividend | | High | | Low | | Declared
Dividend | High | | Low | | Declared
Dividend | | High | | Low | | Declared
Dividend |
| 1st Quarter | $ | 21.67 |
| | $ | 18.02 |
| | $ | — |
| | $ | 9.61 |
| | $ | 6.52 |
| | $ | — |
| $ | 23.24 |
| | $ | 20.56 |
| | $ | 0.08 |
| | $ | 21.65 |
| | $ | 18.21 |
| | $ | 0.05 |
|
| 2nd Quarter | 24.25 |
| | 17.54 |
| | — |
| | 10.70 |
| | 7.69 |
| | — |
| 22.78 |
| | 18.85 |
| | 0.08 |
| | 20.47 |
| | 18.01 |
| | 0.05 |
|
| 3rd Quarter | 20.39 |
| | 15.11 |
| | 0.10 |
| | 16.98 |
| | 10.02 |
| | — |
| 22.02 |
| | 18.72 |
| | 0.08 |
| | 20.64 |
| | 17.47 |
| | 0.05 |
|
| 4th Quarter | 20.37 |
| | 15.54 |
| | 0.05 |
| | 18.61 |
| | 15.24 |
| | — |
| 20.21 |
| | 17.18 |
| | 0.09 |
| | 22.03 |
| | 16.56 |
| | 0.08 |
|
At February 1, 20142016, there were 2,8682,617 shareholders of record.
Issuer Purchases of Equity Securities
|
| | | | | | | | | | | | | | |
| | (a) Total number of shares purchased (1) | | (b) Average price paid per share (1) | | (c) Total number of shares purchased as part of publicly announced plans or programs | | (d) Approximate dollar value of shares that may yet be purchased under the plans or programs ($000’s omitted) | |
| October 1, 2013 to October 31, 2013 | — |
| | $ | — |
| | — |
| | $ | 269,321 |
| (2) |
| November 1, 2013 to November 30, 2013 | 894,286 |
| | 16.77 |
| | 886,509 |
| | $ | 254,467 |
| (2) |
| December 1, 2013 to December 31, 2013 | 1,238,872 |
| | 18.34 |
| | 1,100,000 |
| | $ | 234,290 |
| (2) |
| Total | 2,133,158 |
| | $ | 17.68 |
| | 1,986,509 |
| | | |
|
| | | | | | | | | | | | | | |
| | (a) Total number of shares purchased | | (b) Average price paid per share | | (c) Total number of shares purchased as part of publicly announced plans or programs | | (d) Approximate dollar value of shares that may yet be purchased under the plans or programs ($000’s omitted) | |
| October 1, 2015 to October 31, 2015 | — |
| | $ | — |
| | — |
| | $ | 304,765 |
| (1) |
| November 1, 2015 to November 30, 2015 | — |
| | — |
| | — |
| | $ | 304,765 |
| (1) |
| December 1, 2015 to December 31, 2015 | — |
| | — |
| | — |
| | $ | 604,765 |
| (1) |
| Total | — |
| | $ | — |
| | — |
| | | |
| |
| (1) | During the fourth quarter of 2013, a total of 146,649 shares were surrendered by employees for payment of minimum tax obligations upon the vesting or exercise of previously granted stock-based compensation awards. Such shares were not repurchased as part of our publicly-announced stock repurchase programs. |
| |
(2) | Pursuant to the two $100 million share repurchase programs authorized and announced by ourThe Board of Directors in October 2002 and October 2005, the $200 million share repurchase authorized and announced in February 2006, and the $250 million share repurchase authorized and announced in July 2013 (for a total share repurchase authorization of $650 million), we have repurchased a total of 16,925,409 shares for a total of $415.8 million. We have fully utilized the authorizations provided by the 2002, 2005, and 2006approved share repurchase authorizations totaling $750.0 million and will no longer conduct share repurchases under these programs. The July 2013 share repurchase authorization has $234.3$300.0 million remainingin October 2014 and December 2015, respectively, of which $604.8 million remained available as of December 31, 2013.2015. There isare no expiration datedates for this program.these programs. During 2015, we repurchased 21.2 million shares under these programs. |
The information required by this item with respect to equity compensation plans is set forth under Item 12 of this annual report on Form 10-K and is incorporated herein by reference.
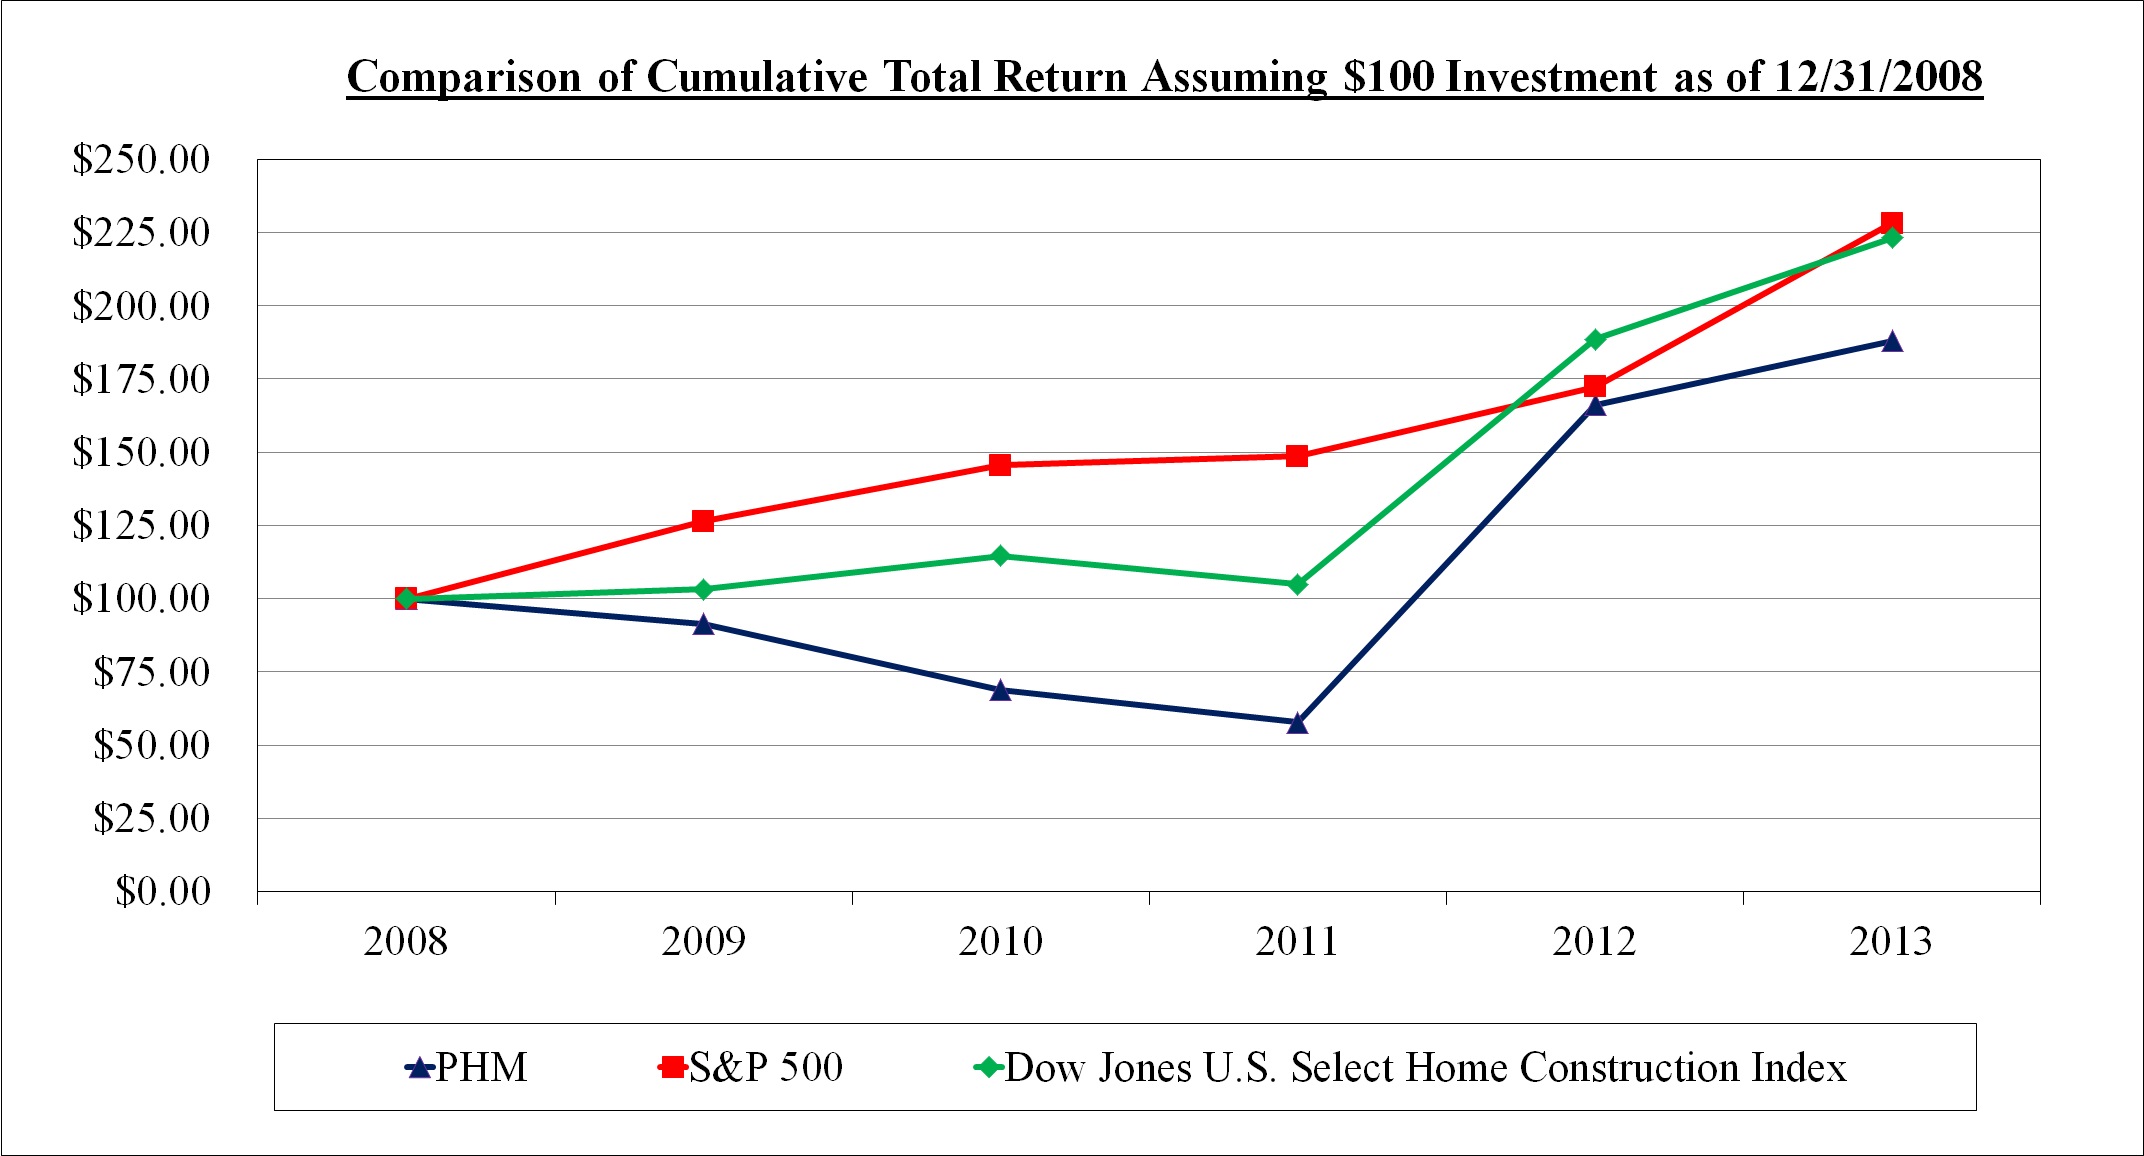
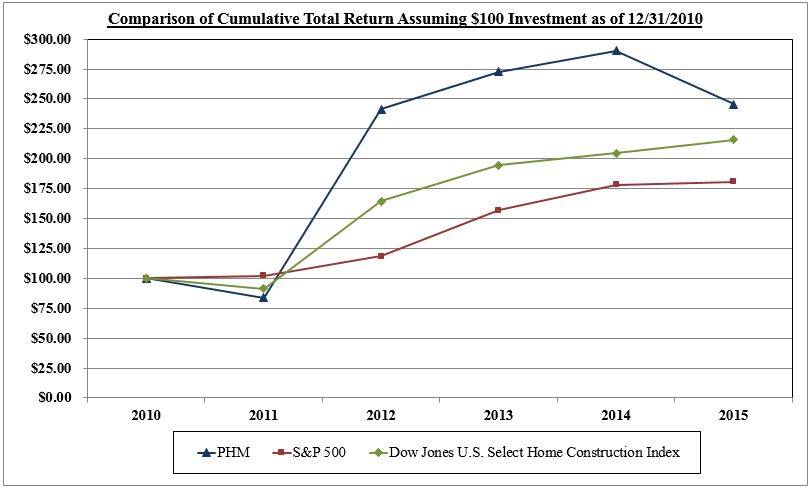
Performance Graph
The following line graph compares for the fiscal years ended December 31, 2009, 2010, 2011, 2012, 2013, 2014, and 20132015 (a) the yearly cumulative total shareholder return (i.e., the change in share price plus the cumulative amount of dividends, assuming dividend reinvestment, divided by the initial share price, expressed as a percentage) on PulteGroup’s common shares, with (b) the cumulative total return of the Standard & Poor’s 500 Stock Index, and with (c) the Dow Jones U.S. Select Home Construction Index. The Dow Jones U.S. Select Home Construction Index is a widely-recognized index comprised primarily of large national homebuilders. We believe comparison of our shareholder return to this index represents a meaningful analysis for investors.
COMPARISON OF FIVE YEAR CUMULATIVE TOTAL RETURN*
AMONG PULTEGROUP, INC., S&P 500 INDEX, AND PEER INDEX
Fiscal Year Ended December 31, 20132015
| | | | | 2008 | | 2009 | | 2010 | | 2011 | | 2012 | | 2013 | | 2010 | | 2011 | | 2012 | | 2013 | | 2014 | | 2015 |
| PULTEGROUP, INC. | | 100.00 |
| | 91.49 |
| | 68.80 |
| | 57.73 |
| | 166.15 |
| | 187.99 |
| | 100.00 |
| | 83.91 |
| | 241.49 |
| | 272.87 |
| | 290.55 |
| | 245.74 |
|
| S&P 500 Index - Total Return | | 100.00 |
| | 126.47 |
| | 145.52 |
| | 148.59 |
| | 172.37 |
| | 228.17 |
| | 100.00 |
| | 102.11 |
| | 118.45 |
| | 156.82 |
| | 178.28 |
| | 180.75 |
|
Dow Jones U.S. Select Home Construction Index | | 100.00 |
| | 103.13 |
| | 114.65 |
| | 104.90 |
| | 188.49 |
| | 223.18 |
| | 100.00 |
| | 91.50 |
| | 164.40 |
| | 194.66 |
| | 204.68 |
| | 215.83 |
|
* Assumes $100 invested on December 31, 20082010, and the reinvestment of dividends.
ITEM 6. SELECTED FINANCIAL DATA
Set forth below is selected consolidated financial data for each of the past five fiscal years. The selected financial data should be read in conjunction with Management’s Discussion and Analysis of Financial Condition and Results of Operations and our Consolidated Financial Statements and Notes thereto included elsewhere in this report.
| | | | Years Ended December 31,
(000’s omitted, except per share data) | Years Ended December 31,
(000’s omitted, except per share data) |
| | 2013 | | 2012 | | 2011 | | 2010 | | 2009 (a) | 2015 | | 2014 | | 2013 | | 2012 | | 2011 |
| OPERATING DATA: | | | | | | | | | | | | | | | | | | |
| Homebuilding: | | | | | | | | | | | | | | | | | | |
| Revenues | $ | 5,538,644 |
| | $ | 4,659,110 |
| | $ | 4,033,596 |
| | $ | 4,447,627 |
| | $ | 3,966,589 |
| $ | 5,841,211 |
| | $ | 5,696,725 |
| | $ | 5,538,644 |
| | $ | 4,659,110 |
| | $ | 4,033,596 |
|
| Income (loss) before income taxes | $ | 479,113 |
| | $ | 157,991 |
| | $ | (275,830 | ) | | $ | (1,240,155 | ) | | $ | (1,920,081 | ) | $ | 757,317 |
| | $ | 635,177 |
| | $ | 479,113 |
| | $ | 157,991 |
| | $ | (275,830 | ) |
| Financial Services: | | | | | | | | | | | | | | | | | | |
| Revenues | $ | 140,951 |
| | $ | 160,888 |
| | $ | 103,094 |
| | $ | 121,663 |
| | $ | 117,800 |
| $ | 140,753 |
| | $ | 125,638 |
| | $ | 140,951 |
| | $ | 160,888 |
| | $ | 103,094 |
|
| Income (loss) before income taxes | $ | 48,709 |
| | $ | 25,563 |
| | $ | (34,470 | ) | | $ | 5,609 |
| | $ | (55,038 | ) | $ | 58,706 |
| | $ | 54,581 |
| | $ | 48,709 |
| | $ | 25,563 |
| | $ | (34,470 | ) |
| | | | | | | | | | | | | | | | | | | |
| Consolidated results: | | | | | | | | | | | | | | | | | | |
| Revenues | $ | 5,679,595 |
| | $ | 4,819,998 |
| | $ | 4,136,690 |
| | $ | 4,569,290 |
| | $ | 4,084,389 |
| $ | 5,981,964 |
| | $ | 5,822,363 |
| | $ | 5,679,595 |
| | $ | 4,819,998 |
| | $ | 4,136,690 |
|
| | | | | | | | | | | | | | | | | | | |
| Income (loss) before income taxes | $ | 527,822 |
| | $ | 183,554 |
| | $ | (310,300 | ) | | $ | (1,234,546 | ) | | $ | (1,975,119 | ) | $ | 816,023 |
| | $ | 689,758 |
| | $ | 527,822 |
| | $ | 183,554 |
| | $ | (310,300 | ) |
| Income tax expense (benefit) | (2,092,294 | ) | | (22,591 | ) | | (99,912 | ) | | (137,817 | ) | | (792,552 | ) | 321,933 |
| | 215,420 |
| | (2,092,294 | ) | | (22,591 | ) | | (99,912 | ) |
| Net income (loss) | $ | 2,620,116 |
| | $ | 206,145 |
| | $ | (210,388 | ) | | $ | (1,096,729 | ) | | $ | (1,182,567 | ) | $ | 494,090 |
| | $ | 474,338 |
| | $ | 2,620,116 |
| | $ | 206,145 |
| | $ | (210,388 | ) |
| | | | | | | | | | | | | | | | | | | |
| PER SHARE DATA: | | | | | | | | | | | | | | | | | | |
| Net income (loss) per share: | | | | | | | | | | | | | | | | | | |
| Basic | $ | 6.79 |
| | $ | 0.54 |
| | $ | (0.55 | ) | | $ | (2.90 | ) | | $ | (3.94 | ) | $ | 1.38 |
| | $ | 1.27 |
| | $ | 6.79 |
| | $ | 0.54 |
| | $ | (0.55 | ) |
| Diluted | $ | 6.72 |
| | $ | 0.54 |
| | $ | (0.55 | ) | | $ | (2.90 | ) | | $ | (3.94 | ) | $ | 1.36 |
| | $ | 1.26 |
| | $ | 6.72 |
| | $ | 0.54 |
| | $ | (0.55 | ) |
| Number of shares used in calculation: | | | | | | | | | | | | | | | | | | |
| Basic | 383,077 |
| | 381,562 |
| | 379,877 |
| | 378,585 |
| | 300,179 |
| 356,576 |
| | 370,377 |
| | 383,077 |
| | 381,562 |
| | 379,877 |
|
| Effect of dilutive securities | 3,789 |
| | 3,002 |
| | — |
| | — |
| | — |
| 3,217 |
| | 3,725 |
| | 3,789 |
| | 3,002 |
| | — |
|
| Diluted | 386,866 |
| | 384,564 |
| | 379,877 |
| | 378,585 |
| | 300,179 |
| 359,793 |
| | 374,102 |
| | 386,866 |
| | 384,564 |
| | 379,877 |
|
| Shareholders’ equity | $ | 12.19 |
| | $ | 5.66 |
| | $ | 5.07 |
| | $ | 5.59 |
| | $ | 8.39 |
| $ | 13.63 |
| | $ | 13.01 |
| | $ | 12.19 |
| | $ | 5.66 |
| | $ | 5.07 |
|
| Cash dividends declared | $ | 0.15 |
| | $ | — |
| | $ | — |
| | $ | — |
| | $ | — |
| $ | 0.33 |
| | $ | 0.23 |
| | $ | 0.15 |
| | $ | — |
| | $ | — |
|
| |
(a) | Includes operations of Centex since August 18, 2009.
|
| | | | December 31, ($000’s omitted) | December 31, ($000’s omitted) |
| | 2013 | | 2012 | | 2011 | | 2010 | | 2009 (a) | 2015 | | 2014 | | 2013 | | 2012 | | 2011 |
| BALANCE SHEET DATA: | | | | | | | | | | | | | | | | | | |
| House and land inventory | $ | 3,978,561 |
| | $ | 4,214,046 |
| | $ | 4,636,468 |
| | $ | 4,781,813 |
| | $ | 4,940,358 |
| $ | 5,450,058 |
| | $ | 4,392,100 |
| | $ | 3,978,561 |
| | $ | 4,214,046 |
| | $ | 4,636,468 |
|
| Total assets | 8,734,143 |
| | 6,734,409 |
| | 6,885,620 |
| | 7,699,376 |
| | 10,051,222 |
| 8,967,160 |
| | 8,569,410 |
| | 8,734,143 |
| | 6,734,409 |
| | 6,885,620 |
|
| Senior notes | 2,058,168 |
| | 2,509,613 |
| | 3,088,344 |
| | 3,391,668 |
| | 4,281,532 |
| |
| Senior notes and term loan | | 2,084,769 |
| | 1,818,561 |
| | 2,058,168 |
| | 2,509,613 |
| | 3,088,344 |
|
| Shareholders’ equity | 4,648,952 |
| | 2,189,616 |
| | 1,938,615 |
| | 2,135,167 |
| | 3,194,440 |
| 4,759,325 |
| | 4,804,954 |
| | 4,648,952 |
| | 2,189,616 |
| | 1,938,615 |
|
| | | | | | | | | | | | | | | | | | | |
| | Years Ended December 31, | Years Ended December 31, |
| | 2013 | | 2012 | | 2011 | | 2010 | | 2009 (a) | 2015 | | 2014 | | 2013 | | 2012 | | 2011 |
| OTHER DATA: | | | | | | | | | | | | | | | | | | |
| Markets, at year-end | 48 |
| | 58 |
| | 61 |
| | 67 |
| | 69 |
| 50 |
| | 49 |
| | 48 |
| | 58 |
| | 61 |
|
| Active communities, at year-end | 577 |
| | 670 |
| | 700 |
| | 786 |
| | 882 |
| 620 |
| | 598 |
| | 577 |
| | 670 |
| | 700 |
|
| Closings (units) | 17,766 |
| | 16,505 |
| | 15,275 |
| | 17,095 |
| | 15,013 |
| 17,127 |
| | 17,196 |
| | 17,766 |
| | 16,505 |
| | 15,275 |
|
| Net new orders (units) | 17,080 |
| | 19,039 |
| | 15,215 |
| | 15,148 |
| | 14,185 |
| 18,008 |
| | 16,652 |
| | 17,080 |
| | 19,039 |
| | 15,215 |
|
| Backlog (units), at year-end | 5,772 |
| | 6,458 |
| | 3,924 |
| | 3,984 |
| | 5,931 |
| 6,731 |
| | 5,850 |
| | 5,772 |
| | 6,458 |
| | 3,924 |
|
| Average selling price (per unit) | $ | 305,000 |
| | $ | 276,000 |
| | $ | 259,000 |
| | $ | 259,000 |
| | $ | 258,000 |
| $ | 338,000 |
| | $ | 329,000 |
| | $ | 305,000 |
| | $ | 276,000 |
| | $ | 259,000 |
|
Gross margin from home sales (b)(a) | 20.5 | % | | 15.8 | % | | 12.8 | % | | 9.4 | % | | (10.5 | )% | 23.3 | % | | 23.3 | % | | 20.5 | % | | 15.8 | % | | 12.8 | % |
| |
| (a) | Includes operations of Centex Corporation since August 18, 2009.
|
| |
(b) | Homebuilding interest expense, which represents the amortization of capitalized interest, and land impairment charges are included in home sale cost of revenues. |
| |
| ITEM 7. | MANAGEMENT’S DISCUSSION AND ANALYSIS OF FINANCIAL CONDITION AND RESULTS OF OPERATIONS |
Overview
The underlyingImproved demand conditions in the overall U.S. housing market continued through 2015. While heightened global economic concerns have created greater volatility in financial markets, the positive trends in the U.S. housing point toward an ongoing multi-year recovery supported by favorableregarding jobs, demographics an improving economy, mortgageand household formations, low interest rates, near historic lows, and limited suppliesa generally balanced inventory of homes available for sale support our expectations that housing demand continues to move higher at a measured pace for a number of years. These conditions have helped keep monthly mortgage payments affordable relative to historical levels and the rental market. This environment contributed to our experiencing relatively stable overall demand in 2015, including 8% growth in net new orders, a 2% increase in home sale revenues to $5.8 billion, and maintaining gross margins at 23.3%, among the highest annual gross margins reported in the Company's history.
The nature of the homebuilding industry results in a lag between when investments made in land acquisition and development yield new community openings and related home closings. During 2015, we opened approximately 200 new communities across our existing local markets, which represented a sizable increase compared with recent years as a result of increased land investment over the last few years. These new communities generally replaced older communities that closed out in 2015 as our overall active community count increased 4%. While we have experience opening new communities, this volume of new community openings presents a challenge in today's environment where entitlement and existing home inventories. Our resultsland development delays are common. The difficult weather conditions in 2013 showed significant improvement incertain parts of the majority of our key operating metricsU.S. in the first half of the year, while demand conditions slowed for us2015 contributed to that challenge. Additionally, labor constraints in the second half of the year as consumers adjustedconstruction industry have led to higherdelays in home prices and a moderate rise in mortgage interest rates. For the full year 2013, the overall improvement in market conditions, in concert with our own tactical actions,closings, which contributed to our seventh consecutive profitable quarter. Home closings, revenues, average selling price, inventory turns, gross margin, overhead leverage, and income before income taxes all improved in 2013closing volume being flat compared with 2012.
Our net new orders declined 10% in 2013 compared with 2012. A lowerthe prior year. Leveraging our increased land investments, we expect to open an even higher number of active communities contributed to the decline in net new orders as we maintained 14% fewer active communities in 2013 compared with 2012. The lower active community count resulted from the close-out of a number of long-term projects and is consistent with2016 than we did in 2015, which we expect will help our more disciplined land investment strategy.volume to grow in 2016. In addition, demand slowedwe acquired substantially all of the assets of JW Homes, including the brand John Wieland Homes and Neighborhoods, in the second half of 2013 in responseJanuary 2016, which will also contribute to higher home prices and a rise in mortgage interest rates. We will continue to calibrate sales pace in each community to improve our gross margins and maximize returns on invested capital. We expect that this approach will continue to result in a moderation in our net new order volume in the short-term relative to overall growth in the U.S. homebuilding industry and relative to certain of our competitors. While we believe higher mortgage interest rates are inevitable and may have a moderating effect on demand and pricing, we believe this impact will be outweighed in the long-term by other factors driving increased sales volume as overall new home sales in the U.S. remain low compared with historical levels.2016.
The significant improvements reported for 2013 also allowed us to continue to enhance our financial position. We generated significant positive cash flow from operations in each of the last two years via a combination of improved profitability and inventory management. Our improved financial position provided additional flexibility to retire debt early and increase our planned future investments in newfuture communities while also paying a dividendreturning funds to shareholders through dividends and selectively repurchasing our common shares.expanded share repurchases. Specifically, we accomplished the following during 2013:in 2015:
Increased our total cash balance to $1.7 billion;
Proactively reduced our outstanding debt by $461.4 million;
Increased our existing share repurchase authorization by $250.0 million and retired $127.7 million of shares;
Reinstated a quarterly dividend;
Increased our land investment spending by 30% to support future growth;
Repurchased $433.7 million of shares under our share repurchase plan and authorized an additional $300.0 million for future repurchases;
LoweredRaised our ratioquarterly dividend from $0.08 to $0.09 per share;
Maintained one of the lowest ratios of debt to total capitalization from 53.4%in the homebuilding industry at 30.5%; and
Ended the year with a cash balance of $754.2 million with no borrowings outstanding under our unsecured revolving credit agreement.
Industry-wide new home sales continue to 30.7%,pace well below historical averages, so we remain optimistic that demand can continue to increase in part due to the reversalcoming years. We believe the positive factors of a valuation allowance against our deferred tax assets.
In the short-term, wean improving economy with rising employment, continued low mortgage rates, and beneficial long-term demographic trends will continue to focussupport a slow and sustained housing recovery. Within this environment, we remain focused on maximizing our operating margins, despite the possibility of rising house cost pressures from materialdriving additional gains in construction and labor prices, by using our existing land assets more effectively, allocating capital more effectively, and aggressively controlling unsold "spec" inventory to enhance our balance sheet. We believe we have positioned ourselvesasset efficiency to deliver improved long-term returns. In planning for the longer term, we continue to maintain confidence that we are in the early stages of a broad, sustainable recovery in the U.S. new home market. While the U.S. macroeconomic environment continues to face challenges and each local market will experience varying results, we are continuing to pursue strategic land positions that meet our underwriting requirements in well-positioned submarkets and believe that sustained execution of our strategy will continue to result in increased profits and improvedhigher returns on invested capital. Consistent with our positive market view and long-term business strategy, we expect to use our capital over the housing cycle.
to support future growth while consistently returning funds to shareholders.
The following is a summary of our operating results by line of business ($000's omitted, except per share data):
| | | | Years Ended December 31, | Years Ended December 31, |
| | 2013 | | 2012 | | 2011 | 2015 | | 2014 | | 2013 |
| Income (loss) before income taxes: | | | | | | |
| Income before income taxes: | | | | | | |
| Homebuilding | $ | 479,113 |
| | $ | 157,991 |
| | $ | (275,830 | ) | $ | 757,317 |
| | $ | 635,177 |
| | $ | 479,113 |
|
| Financial Services | 48,709 |
| | 25,563 |
| | (34,470 | ) | 58,706 |
| | 54,581 |
| | 48,709 |
|
| Income (loss) from continuing operations before income taxes | 527,822 |
| | 183,554 |
| | (310,300 | ) | |
| Income before income taxes | | 816,023 |
| | 689,758 |
| | 527,822 |
|
| Income tax expense (benefit) | (2,092,294 | ) | | (22,591 | ) | | (99,912 | ) | 321,933 |
| | 215,420 |
| | (2,092,294 | ) |
| Net income (loss) | $ | 2,620,116 |
| | $ | 206,145 |
| | $ | (210,388 | ) | |
| Net income | | $ | 494,090 |
| | $ | 474,338 |
| | $ | 2,620,116 |
|
| Per share data - assuming dilution: | | | | | | | | | | |
| Net income (loss) | $ | 6.72 |
| | $ | 0.54 |
| | $ | (0.55 | ) | |
| Net income | | $ | 1.36 |
| | $ | 1.26 |
| | $ | 6.72 |
|
The Homebuilding income (loss) before income taxes included charges relatedimproved each year from 2013 to 2015, primarily as the result of higher gross margins and revenues. Homebuilding income before income taxes also reflected the following significant expense (income) items ($000's omitted):
|
| | | | | | | | | | | |
| | 2013 | | 2012 | | 2011 |
Land-related charges (see Note 4) | $ | 9,672 |
| | $ | 17,195 |
| | $ | 35,786 |
|
Loss on debt retirements (see Note 7) | 26,930 |
| | 32,071 |
| | 5,638 |
|
Settlement of contractual dispute at a closed-out community (see Note 13) | 41,170 |
| | — |
| | — |
|
Goodwill impairments (see Note 2) | — |
| | — |
| | 240,541 |
|
| | $ | 77,772 |
| | $ | 49,266 |
| | $ | 281,965 |
|
|
| | | | | | | | | | | |
| | 2015 | | 2014 | | 2013 |
Corporate office relocation (see Note 2) | $ | 4,369 |
| | $ | 16,344 |
| | $ | 15,376 |
|
Land-related charges (see Note 3) | 11,467 |
| | 11,168 |
| | 9,672 |
|
Loss on debt retirements (see Note 6) | — |
| | 8,584 |
| | 26,930 |
|
| 20,000 |
| | — |
| | — |
|
Settlement of contractual dispute at a closed-out community (see Note 12) | — |
| | — |
| | 41,170 |
|
Insurance reserve adjustments (see Note 12) | (62,183 | ) | | 69,267 |
| | — |
|
| | $ | (26,347 | ) | | $ | 105,363 |
| | $ | 93,148 |
|
For additional information on each of the above, see the applicable Notes to the Consolidated Financial Statements.
Our Homebuilding operatingThe acquisition of certain real estate assets from Dominion Homes in August 2014 (see Note 1) was not material to our results in 2013 and 2012 improved significantly from the loss experienced in 2011 due to higher revenues and gross margins, improved overhead leverage, and lower charges, as listed in the above table.of operations or financial condition.
| |
| • | The increase in Financial Services income in 20132015 compared with 20122014 and 20112013 was primarily due to loweran increase in mortgage originations. Additionally, we reduced loan loss reserves. There were no suchreserves by $11.4 million in 2015 versus a reduction of $18.6 million in 2014. In 2013, loss reserves in 2013 compared with $49.0 million in 2012 and $59.3 million in 2011 (seeremained unchanged. See Note 1312 to the Consolidated Financial Statements). Additionally, loan origination volume increased in 2013 compared with 2012 and 2011, primarily as the result of increased Homebuilding closings. These favorable factors were partially offset in 2013 by margin compression caused by heightened competition in the mortgage industry compared with 2012. |
| |
| • | The incomeOur effective tax benefit in rate was 39.5%, 31.2% and (396.4)% for 2015, 2014, and 2013, includes $2.1 billion related to the reversal respectively. Income tax expense (benefit) reflects provisions and (reversals) of substantially all of the valuation allowance previously recorded against our deferred tax assets.asset valuation allowances totaling $3.1 million, $(45.6) million, and $(2.1) billion in 2015, 2014, and 2013, respectively. See Note 109to the Condensed Consolidated Financial Statements for additional information. The income tax benefits in 2012 and 2011 were attributable primarily to the favorable resolution of certain federal and state income tax matters.. |
Homebuilding Operations
The following is a summary of income (loss) before income taxes for our Homebuilding operations ($000’s omitted):
| | | | Years Ended December 31, | Years Ended December 31, |
| | 2013 | | FY 2013 vs. FY 2012 | | 2012 | | FY 2012 vs. FY 2011 | | 2011 | 2015 | | FY 2015 vs. FY 2014 | | 2014 | | FY 2014 vs. FY 2013 | | 2013 |
| Home sale revenues | $ | 5,424,309 |
| | 19 | % | | $ | 4,552,412 |
| | 15 | % | | $ | 3,950,743 |
| $ | 5,792,675 |
| | 2 | % | | $ | 5,662,171 |
| | 4 | % | | $ | 5,424,309 |
|
| Land sale revenues | 114,335 |
| | 7 | % | | 106,698 |
| | 29 | % | | 82,853 |
| 48,536 |
| | 40 | % | | 34,554 |
| | (70 | )% | | 114,335 |
|
| Total Homebuilding revenues | 5,538,644 |
| | 19 | % | | 4,659,110 |
| | 16 | % | | 4,033,596 |
| 5,841,211 |
| | 3 | % | | 5,696,725 |
| | 3 | % | | 5,538,644 |
|
Home sale cost of revenues (a) | 4,310,528 |
| | 12 | % | | 3,833,451 |
| | 11 | % | | 3,444,398 |
| 4,440,893 |
| | 2 | % | | 4,343,249 |
| | 1 | % | | 4,310,528 |
|
Land sale cost of revenues (b) | 104,426 |
| | 10 | % | | 94,880 |
| | 60 | % | | 59,279 |
| 35,858 |
| | 51 | % | | 23,748 |
| | (77 | )% | | 104,426 |
|
Selling, general, and administrative expenses ("SG&A") (c)(b) | 568,500 |
| | 11 | % | | 514,457 |
| | (1 | )% | | 519,583 |
| 589,780 |
| | (12 | )% | | 667,815 |
| | 17 | % | | 568,500 |
|
| Equity in (earnings) loss of unconsolidated entities | (993 | ) | | (74 | )% | | (3,873 | ) | | 21 | % | | (3,194 | ) | |
Other expense, net (d) | 80,753 |
| | 22 | % | | 66,298 |
| | (77 | )% | | 293,102 |
| |
| Interest income, net | (3,683 | ) | | (10 | )% | | (4,094 | ) | | 9 | % | | (3,742 | ) | |
| Income (loss) before income taxes | $ | 479,113 |
| | 203 | % | | $ | 157,991 |
| | 157 | % | | $ | (275,830 | ) | |
Other expense, net (c) | | 17,363 |
| | (35 | )% | | 26,736 |
| | (65 | )% | | 76,077 |
|
| Income before income taxes | | $ | 757,317 |
| | 19 | % | | $ | 635,177 |
| | 33 | % | | $ | 479,113 |
|
| Supplemental data: | | | | | | | | | | | | | |
|
| | | |
|
|
| Gross margin from home sales | 20.5 | % | | 470 bps |
| | 15.8 | % | | 300 bps |
| | 12.8 | % | 23.3 | % | | 0 bps |
| | 23.3 | % | | 280 bps |
| | 20.5 | % |
| SG&A as a percentage of home sale revenues | 10.5 | % | | (80) bps |
| | 11.3 | % | | (190) bps |
| | 13.2 | % | 10.2 | % | | 160 bps |
| | 11.8 | % | | 130 bps |
| | 10.5 | % |
| Closings (units) | 17,766 |
| | 8 | % | | 16,505 |
| | 8 | % | | 15,275 |
| 17,127 |
| | — | % | | 17,196 |
| | (3 | )% | | 17,766 |
|
| Average selling price | $ | 305 |
| | 11 | % | | $ | 276 |
| | 7 | % | | $ | 259 |
| $ | 338 |
| | 3 | % | | $ | 329 |
| | 8 | % | | $ | 305 |
|
Net new orders: | | | | | | | | | | | | | | | | | | |
| Units | 17,080 |
| | (10 | )% | | 19,039 |
| | 25 | % | | 15,215 |
| 18,008 |
| | 8 | % | | 16,652 |
| | (3 | )% | | 17,080 |
|
Dollars (e) | $ | 5,394,566 |
| | (1 | )% | | $ | 5,424,300 |
| | 37 | % | | $ | 3,953,829 |
| |
Dollars (d) | | $ | 6,305,380 |
| | 13 | % | | $ | 5,558,937 |
| | 3 | % | | $ | 5,394,566 |
|
| Cancellation rate | 15 | % | | | | 15 | % | | | | 19 | % | 14 | % | | | | 15 | % | | | | 15 | % |
| Active communities at December 31 | 577 |
| | (14 | )% | | 670 |
| | (4 | )% | | 700 |
| 620 |
| | 4 | % | | 598 |
| | 4 | % | | 577 |
|
| Backlog at December 31: | | | | | | | | | | | | | | | | | | |
| Units | 5,772 |
| | (11 | )% | | 6,458 |
| | 65 | % | | 3,924 |
| 6,731 |
| | 15 | % | | 5,850 |
| | 1 | % | | 5,772 |
|
| Dollars | $ | 1,901,796 |
| | (2 | )% | | $ | 1,931,538 |
| | 82 | % | | $ | 1,059,649 |
| $ | 2,456,565 |
| | 26 | % | | $ | 1,943,861 |
| | 2 | % | | $ | 1,901,796 |
|
| |
| (a) | Includes the amortization of capitalized interest. Home sale cost of revenues also includes land impairments of $2.9 million, $13.4 million, and $15.9 million for 2013, 2012, and 2011, respectively. |
| |
| (b) | Includes net realizable value adjustments for land held for sale of $3.6 million, $1.5 million, and $9.8 million for 2013, 2012, and 2011, respectively.
|
| |
(c) | SG&A includes costs associated with the relocation of our corporate headquarters totaling $2.0 million, $7.6 million, and $15.0 million in 2013.2015, 2014, and 2013, respectively (see Note 2), and adjustments to general liability insurance reserves relating to a reversal of $62.2 million in 2015 and a charge of $69.3 million in 2014 (see Note 12). |
| |
(d)(c) | Includes the write-off of deposits and pre-acquisition costs for land option contracts we elected not to pursue of $3.1 million, $2.3 million, and $10.0 million in 2013, 2012, and 2011, respectively, and net losses related to the redemption of debt totaling $26.9$8.6 million, $32.1 and $26.9 million, in 2014 and $5.6 million in 2013,, 2012, and 2011, respectively. Also includes lease exit charges of $2.3 million and $8.7 million in 2015 and 2014, respectively, resulting from the relocation of our corporate headquarters (see Note 2), a charge of $20.0 million in 2015 resulting from the Applecross matter (see Note 12), and charges totaling $41.2 million in 2013 resulting from a contractual dispute related to a previously completed luxury community totaling(see Note 12$41.2 million in 2013 and goodwill impairment charges of $240.5 million in 2011). |
| |
(e)(d) | Net new order dollars represent a composite of new order dollars combined with other movements of the dollars in backlog related to cancellations and change orders. |
Home sale revenues
Home sale revenues for 20132015 were higher than 20122014 by $871.9$130.5 million,, or 19%2%. The increase was attributable to a 3% increase in the average selling price while closings remained relatively flat. The increase in average selling price reflects an ongoing shift in our revenue mix toward move-up buyers. Closing volume was flat as higher net new orders were offset by production delays in certain communities caused by a number of factors, including tight labor resources and adverse weather conditions.
Home sale revenues for 2014 were higher than 2013 by $237.9 million, or 4%. The increase was attributable to an 11%8% increase in the average selling price combined with an 8% increaseoffset by a 3% decrease in closings. The increase in average selling price occurred in substantially all of our local markets and reflects an ongoingreflected a shift in our revenue mix toward move-up and active adult buyers andalong with improved market conditions that have allowed for increased sale prices, including higher levels of house options and lot premiums. The increasedecrease in closings reflected improved consumer demand forresulted from the lower net new homesorder volume in the majority of our local markets.
Home sale revenues for 2012 were higher than 2011 by $601.7 million, or 15%. The increase was attributable to a 7% increase in the average selling price2014 combined with an 8% increasethe lower beginning of the year backlog in closings. The increase in average selling price reflected a shift in our revenue mix toward move-up and active adult buyers and improved market conditions. The increase in closings was concentrated primarily in our North and Southwest segments.2014 compared with the beginning of the year 2013.
Home sale gross margins
Home sale gross margins were 20.5%23.3% in 2013,2015, compared with 15.8%23.3% in 20122014 and 12.8%20.5% in 2011.2013. Gross margins during 2013remain strong relative to historical levels and2012 benefited from lower land impairments of $2.9 million and $13.4 million, respectively, compared with $15.9 million in 2011. Excluding the impact of land impairments and capitalized interest amortization, adjusted home sale gross margins improved to 25.2% in 2013 from 20.9% in 2012 and 17.9% in 2011 (see the Non-GAAP Financial Measures section for a reconciliation of adjusted home sale gross margins). The gross margin improvement was broad-based as substantially all of our operating divisions experienced higher gross margins in 2013 compared with the prior year periods. These improved gross margins reflect a combination of factors, including anshifts in community mix, relatively stable pricing conditions in 2015 following improved pricing environment, shiftsconditions in 2014, and lower amortized interest costs (2.4%, 3.4%, and 4.7% of home sale revenues in 2015, 2014, and 2013, respectively), offset by higher house construction and land costs. The lower amortized interest costs resulted from the product mixreduction in our outstanding debt in recent years. Gross margins during 2015 and 2014 were also affected by higher land impairments of homes closed toward move-up$7.3 million and active adult buyers, better alignment of our product offering$3.9 million, respectively, compared with consumer demand, and contributions from our strategic pricing and house cost reduction initiatives.$2.9 million in 2013.
Land sales
We periodically elect to sell parcels of land to third parties in the event such assets no longer fit into our strategic operating plans or are zoned for commercial or other development. Land sale revenues and their related gains or losses vary between periods, depending on the timing of land sales and our strategic operating decisions. Land sales had margin contributions of $9.9$12.7 million,, $11.8 $10.8 million,, and $23.6$9.9 million in 2013, 2012,2015, 2014, and 2011,2013, respectively. These margin contributions included net realizable value adjustments related to land held for sale totaling $3.6 million, $1.5 million, and $9.8 million in 2013, 2012, and 2011, respectively.
SG&A
SG&A as a percentage of home sale revenues dropped to 10.5% in 2013 from 11.3% in 2012was 10.2%, 11.8%, and 13.2%10.5% in 2011.2015, 2014, and 2013, respectively. The gross dollar amount of our SG&A increased $54.0decreased $78.0 million,, or 11%12%, in 20132015 compared with 2012.2014. SG&A includes $15.0included adjustments to general liability insurance reserves relating to a reversal of $62.2 million in 2015 and a charge of $69.3 million in 2014 (see Note 12). Additionally, we incurred $2.0 million and $7.6 million in 2015 and 2014, respectively, of employee severance, retention, relocation, and related costs attributable to the relocation of our previously announcedcorporate headquarters. Excluding each of these items, SG&A in both dollars and as a percentage of home sale revenues increased for 2015 compared with 2014. This increase in gross overhead dollars in 2015 was primarily due to investments in increased headcount and information systems along with higher costs in conjunction with the opening of approximately 200 new communities.
The gross dollar amount of our SG&A increased $99.3 million, or 17%, in 2014 compared with 2013. SG&A included charges totaling $69.3 million to increase general liability insurance reserves in 2014. Additionally, we incurred $7.6 million and $15.0 million in 2014 and 2013, respectively, of employee severance, retention, relocation, and related costs attributable to the relocation of our corporate headquarters. The remaining increasesremainder of the increase in gross overhead dollars in 2014 compared with 2013 were primarily due to variable costs related to the higher revenue volume combined with higher incentive compensation accruals resulting from the Company's improved operating performance.
The gross dollar amount of our SG&A decreased $5.1 million, or 1%, in 2012 compared with 2011 due to improved overhead leverage, partially offset by higher incentive compensation resulting from our improved operating results.
Equity in (earnings) loss of unconsolidated entities
Equity in (earnings) loss of unconsolidated entities was $(1.0) million, $(3.9) million, and $(3.2) million for 2013, 2012, and 2011, respectively. The majority of our unconsolidated entities represent land development joint ventures. As a result, the timing of income and losses varies between periods depending on the timing of transactions and circumstances specific to each entity.
volume.
Other expense, net
Other expense, net includes the following ($000’s omitted):
| | | | 2013 | | 2012 | | 2011 | 2015 | | 2014 | | 2013 |
Write-offs of deposits and pre-acquisition costs (Note 4) | $ | 3,122 |
| | $ | 2,278 |
| | $ | 10,002 |
| |
| 26,930 |
| | 32,071 |
| | 5,638 |
| |
Write-offs of deposits and pre-acquisition costs (Note 3) | | $ | 5,021 |
| | $ | 6,099 |
| | $ | 3,122 |
|
| | — |
| | 8,584 |
| | 26,930 |
|
| Lease exit and related costs | 2,778 |
| | 7,306 |
| | 9,900 |
| 2,463 |
| | 9,609 |
| | 2,778 |
|
Amortization of intangible assets (Note 1) | 13,100 |
| | 13,100 |
| | 13,100 |
| 12,900 |
| | 13,033 |
| | 13,100 |
|
| — |
| | — |
| | 240,541 |
| |
| Interest income | | (3,107 | ) | | (4,632 | ) | | (4,395 | ) |
| Interest expense | | 788 |
| | 849 |
| | 712 |
|
Equity in (earnings) loss of unconsolidated entities (Note 5) | | (7,355 | ) | | (8,226 | ) | | (993 | ) |
| Miscellaneous expense, net | 34,823 |
| | 11,543 |
| | 13,921 |
| 6,653 |
| | 1,420 |
| | 34,823 |
|
| | $ | 80,753 |
| | $ | 66,298 |
| | $ | 293,102 |
| $ | 17,363 |
| | $ | 26,736 |
| | $ | 76,077 |
|
For additional information on each of the above, see the applicable Notes to the Consolidated Financial Statements. Miscellaneous expense, net includes a charge of $20.0 million resulting from the Applecross matter (see Note 12) in 2015 and charges of $41.2$41.2 million in 2013 resulting from a contractual dispute related to a previously completed luxury community, and community.$5.1 million in 2012 and $17.1 million in 2011 related to the write-down of notes receivable.
Interest income, net
Interest income, net for 2013 decreased from the prior year based on the level of invested cash balances and low returns on invested cash available in the current interest rate environment.
Net new orders
Net new orders decreased 10%increased 8% in 20132015 compared with 2012 primarily due to2014. The increase resulted from improved sales per community combined with selling from 14% fewera larger number of active communities, in 2013 (577which increased 4% to 620 at December 31, 2013) combined with slowed demand in the second half of 2013 in response to higher home prices and a rise in mortgage interest rates.2015. The cancellation rate (canceled orders for the period divided by gross new orders for the period) was unchangeddecreased slightly in 2015 from 2012 to 20132014 at 14% and 15%., respectively. Ending backlog units, which represent orders for homes that have not yet closed, decreased 11%increased 15% at December 31, 20132015 compared with December 31, 2012, due to the decrease2014 as measured in net new orders but only decreasedunits and increased by 2%26% over the prior year period as measured in dollars. The higher backlog resulted from the higher net new order volume, especially in the fourth quarter, combined with production delays in certain communities in 2015 caused by a number of factors, including tight labor resources and adverse weather conditions. The higher average sales price also contributed to the higher backlog dollars.
Net new orders decreased 3% in 2014 compared with 2013, primarily as the result of fewer active communities throughout the majority of 2014. The number of active communities increased slightly in 2014 compared with 2013 (up 4% to 598 active communities at December 31, 2014), though this was primarily due to our acquisition of certain real estate assets from Dominion Homes in August 2014 (see Note 1). Excluding such assets, our active community count actually declined in 2014 as our pace of new community openings lagged the number of community close-outs. The cancellation rate was unchanged from 2013 to 2014 at 15%. Ending backlog units increased 1% at December 31, 2014 compared with December 31, 2013 and increased 2% as measured in dollars due to the increase in our average selling price.
Net new order levels increased 25% in 2012 compared with 2011 while selling from 4% fewer active communities in 2012 (we had 670 active communities at December 31, 2012). The cancellation rate was 15% in 2012 compared with 19% in 2011. Ending backlog units increased 65% at December 31, 2012 compared with December 31, 2011 due to the decrease in net new orders.
Homes in production
The following is a summary of our homes in production at December 31, 20132015 and 20122014:
| | | | | 2013 | | 2012 | | 2015 | | 2014 |
| Sold | | 3,723 |
| | 4,162 |
| | 4,573 |
| | 3,761 |
|
| Unsold | | | | | | | | |
| Under construction | | 813 |
| | 753 |
| | 1,450 |
| | 815 |
|
| Completed | | 338 |
| | 503 |
| | 471 |
| | 483 |
|
| | | 1,151 |
| | 1,256 |
| | 1,921 |
| | 1,298 |
|
| Models | | 1,034 |
| | 1,119 |
| | 1,024 |
| | 981 |
|
| Total | | 5,908 |
| | 6,537 |
| | 7,518 |
| | 6,040 |
|
The number of homes in production at December 31, 20132015 was 10% lower than at 24% higher compared to December 31, 2012.2014. The reduced levelincrease in homes under production was due to a combination of factors, including a 4% increase in active communities, a 15% increase in ending backlog units, and a conscious decision to moderately increase the number of unsold homes under construction ("spec homes") at the end of the year. The increase in production is consistent with our lower active community count and our inventory management strategies. Reducing our reliance on sales of spec homes isreflects our intentions to achieve a component of our strategic pricing and inventory turns objectives, so we have focused on reducing the level of our spec home inventory, especially our completed specs ("final specs").more even
flow production cycle over the course of 2016 compared with 2015. As part of our inventory management strategy, we will continue to maintain reasonable inventory levels relative to demand in each of our markets. We continue to focus on maintaining a low level of completed specs ("final specs"), though inventory levels tend to fluctuate throughout the year.
Controlled lots
The following is a summary of our lots under control at December 31, 20132015 and 20122014:
| | | | | December 31, 2013 | | December 31, 2012 | | December 31, 2015 | | December 31, 2014 |
| | | Owned | | Optioned | | Controlled | | Owned | | Optioned | | Controlled | | Owned | | Optioned | | Controlled | | Owned | | Optioned | | Controlled |
| Northeast | | 7,423 |
| | 2,762 |
| | 10,185 |
| | 9,211 |
| | 2,655 |
| | 11,866 |
| | 6,361 |
| | 4,114 |
| | 10,475 |
| | 6,389 |
| | 4,185 |
| | 10,574 |
|
| Southeast | | 12,702 |
| | 4,296 |
| | 16,998 |
| | 13,372 |
| | 2,756 |
| | 16,128 |
| | 11,161 |
| | 7,933 |
| | 19,094 |
| | 11,195 |
| | 4,785 |
| | 15,980 |
|
| Florida | | 21,805 |
| | 6,956 |
| | 28,761 |
| | 23,906 |
| | 3,689 |
| | 27,595 |
| | 21,230 |
| | 9,636 |
| | 30,866 |
| | 20,511 |
| | 7,119 |
| | 27,630 |
|
| Midwest | | | 13,093 |
| | 6,985 |
| | 20,078 |
| | 14,571 |
| | 5,714 |
| | 20,285 |
|
| Texas | | 12,038 |
| | 3,860 |
| | 15,898 |
| | 12,218 |
| | 3,685 |
| | 15,903 |
| | 13,308 |
| | 7,052 |
| | 20,360 |
| | 11,847 |
| | 7,435 |
| | 19,282 |
|
| North | | 11,785 |
| | 7,952 |
| | 19,737 |
| | 12,946 |
| | 2,603 |
| | 15,549 |
| |
| Southwest | | 29,459 |
| | 2,440 |
| | 31,899 |
| | 31,407 |
| | 1,427 |
| | 32,834 |
| |
| West | | | 30,766 |
| | 6,440 |
| | 37,206 |
| | 31,707 |
| | 5,335 |
| | 37,042 |
|
| Total | | 95,212 |
| | 28,266 |
| | 123,478 |
| | 103,060 |
| | 16,815 |
| | 119,875 |
| | 95,919 |
| | 42,160 |
| | 138,079 |
| | 96,220 |
| | 34,573 |
| | 130,793 |
|
| | | | | | | | | | | | | | | | | | | | | | | | | |
| Developed (%) | | 24 | % | | 18 | % | | 23 | % | | 27 | % | | 34 | % | | 28 | % | | 28 | % | | 12 | % | | 23 | % | | 25 | % | | 23 | % | | 25 | % |
Of our controlled lots, 95,21295,919 and 103,06096,220 were owned and 28,26642,160 and 16,81534,573 were under land option agreements at December 31, 20132015 and 2012,2014, respectively. While competition for well-positioned land has increased,is robust, we
continue to pursue strategic land positions that meet our underwriting requirements while also using our existing land assets more effectively.
drive appropriate returns on invested capital. The remaining purchase price under our land option agreements totaled $1.4$2.0 billion at December 31, 2013.2015. These land option agreements, which generally may be canceled at our discretion and in certain cases extend over several years, are secured by deposits and pre-acquisition costs totaling $91.0$162.1 million,, of which only $4.5$10.5 million is refundable.
Non-GAAP Financial Measures
This report contains information about our home sale gross margins reflecting certain adjustments. This measure is considered a non-GAAP financial measure under the SEC's rules and should be considered in addition to, rather than as a substitute for, the comparable GAAP financial measure as a measure of our operating performance. Management and our local divisions use this measure in evaluating the operating performance of each community and in making strategic decisions regarding sales pricing, construction and development pace, product mix, and other daily operating decisions. We believe it is a relevant and useful measures to investors for evaluating our performance through gross profit generated on homes delivered during a given period and for comparing our operating performance to other companies in the homebuilding industry. Although other companies in the homebuilding industry report similar information, the methods used may differ. We urge investors to understand the methods used by other companies in the homebuilding industry to calculate gross margins and any adjustments thereto before comparing our measure to that of such other companies.
The following table sets forth a reconciliation of this non-GAAP financial measure to the GAAP financial measure that management believes to be most directly comparable ($000's omitted):
|
| | | | | | | | | | | |
| Adjusted home sale gross margin | | | | | |
| | Years Ended December 31, |
| | 2013 | | 2012 | | 2011 |
| Home sale revenues | $ | 5,424,309 |
| | $ | 4,552,412 |
| | $ | 3,950,743 |
|
| Home sale cost of revenues | 4,310,528 |
| | 3,833,451 |
| | 3,444,398 |
|
| Home sale gross margin | 1,113,781 |
| | 718,961 |
| | 506,345 |
|
| Add: | | | | | |
Land impairments (a) | — |
| | 6,969 |
| | 10,498 |
|
Capitalized interest amortization (a) | 255,065 |
| | 224,291 |
| | 189,382 |
|
| Adjusted home sale gross margin | $ | 1,368,846 |
| | $ | 950,221 |
| | $ | 706,225 |
|
| | | | | | |
| Home sale gross margin as a percentage of home sale revenues | 20.5 | % | | 15.8 | % | | 12.8 | % |
| Adjusted home sale gross margin as a percentage of home sale revenues | 25.2 | % | | 20.9 | % | | 17.9 | % |
| |
(a) | Write-offs of capitalized interest related to land impairments are reflected in capitalized interest amortization. |
Homebuilding Segment Operations
Our homebuilding operations represent our core business. Homebuilding offers a broad product line to meet the needs of homebuyers in our targeted markets. As of December 31, 20132015, we conducted our operations in 4850 markets located throughout 2726 states. For reporting purposes, our Homebuilding operations are aggregated into six reportable segments:segments. For 2015, we realigned our organizational structure and reportable segment presentation. Accordingly, the segment information provided in this note has been reclassified to conform to the current presentation for all periods presented.
|
| | |
| Northeast: | | Connecticut, Delaware, Maryland, Massachusetts, New Jersey, New York, Pennsylvania,
Rhode Island, Virginia |
| Southeast: | | Georgia, North Carolina, South Carolina, Tennessee |
| Florida: | | Florida |
| Midwest: | | Illinois, Indiana, Kentucky, Michigan, Minnesota, Missouri, Ohio |
| Texas: | | Texas |
North: | | Illinois, Indiana, Michigan, Minnesota, Missouri, Northern California, Ohio, Oregon, Washington |
Southwest:West: | | Arizona, California, Nevada, New Mexico, Southern CaliforniaWashington |
We also have a reportable segment for our financial services operations, which consist principally of mortgage banking and title operations. The Financial Services segment operates generally in the same markets as the Homebuilding segments.
The following table presents selected financial information for our reportable Homebuilding segments:
| | | | Operating Data by Segment ($000's omitted) | Operating Data by Segment ($000's omitted) |
| | Years Ended December 31, | Years Ended December 31, |
| | 2013 | | FY 2013 vs. FY 2012 | | 2012 | | FY 2012 vs. FY 2011 | | 2011 | 2015 | | FY 2015 vs. FY 2014 | | 2014 | | FY 2014 vs. FY 2013 | | 2013 |
| Home sale revenues: | | | | | | | | | | | | | | | | | | |
| Northeast | $ | 784,087 |
| | 8 | % | | $ | 722,691 |
| | 1 | % | | $ | 714,609 |
| $ | 679,082 |
| | (4 | )% | | $ | 708,465 |
| | (10 | )% | | $ | 784,087 |
|
| Southeast | 842,856 |
| | 22 | % | | 689,163 |
| | 2 | % | | 675,124 |
| 1,058,055 |
| | 11 | % | | 949,134 |
| | 13 | % | | 842,856 |
|
| Florida | 800,331 |
| | 29 | % | | 620,156 |
| | 11 | % | | 557,865 |
| 1,012,391 |
| | 11 | % | | 913,758 |
| | 14 | % | | 800,331 |
|
| Midwest | | 1,012,460 |
| | 16 | % | | 869,271 |
| | 10 | % | | 786,930 |
|
| Texas | 804,806 |
| | 21 | % | | 666,759 |
| | 8 | % | | 615,319 |
| 840,766 |
| | (2 | )% | | 856,613 |
| | 6 | % | | 804,806 |
|
| North | 1,214,332 |
| | 23 | % | | 989,510 |
| | 36 | % | | 727,085 |
| |
| Southwest | 977,898 |
| | 13 | % | | 864,133 |
| | 31 | % | | 660,741 |
| |
| West | | 1,189,921 |
| | (13 | )% | | 1,364,930 |
| | (3 | )% | | 1,405,299 |
|
| | $ | 5,424,309 |
| | 19 | % | | $ | 4,552,412 |
| | 15 | % | | $ | 3,950,743 |
| $ | 5,792,675 |
| | 2 | % | | $ | 5,662,171 |
| | 4 | % | | $ | 5,424,309 |
|
| Income (loss) before income taxes: | | | | | | | | | | |
| Income before income taxes: | | | | | | | | | | |
| Northeast | $ | 110,246 |
| | 50 | % | | $ | 73,345 |
| | 150 | % | | $ | 29,320 |
| $ | 82,616 |
| | (20 | )% | | $ | 103,865 |
| | (6 | )% | | $ | 110,246 |
|
| Southeast | 121,055 |
| | 87 | % | | 64,678 |
| | 44 | % | | 45,060 |
| 172,330 |
| | 10 | % | | 156,513 |
| | 29 | % | | 121,055 |
|
| Florida | 139,673 |
| | 90 | % | | 73,472 |
| | 63 | % | | 44,946 |
| 196,525 |
| | 3 | % | | 190,441 |
| | 36 | % | | 139,673 |
|
| Midwest | | 91,745 |
| | 16 | % | | 78,863 |
| | (7 | )% | | 84,551 |
|
| Texas | 111,431 |
| | 83 | % | | 60,979 |
| | 83 | % | | 33,329 |
| 121,329 |
| | (9 | )% | | 133,005 |
| | 19 | % | | 111,431 |
|
| North | 164,348 |
| | 94 | % | | 84,597 |
| | (b) |
| | (12,376 | ) | |
| Southwest | 179,163 |
| | 124 | % | | 79,887 |
| | 118 | % | | 36,647 |
| |
| West | | 169,394 |
| | (33 | )% | | 254,724 |
| | (2 | )% | | 258,960 |
|
Other homebuilding (a) | (346,803 | ) | | (24 | )% | | (278,967 | ) | | 38 | % | | (452,756 | ) | (76,622 | ) | | 73 | % | | (282,234 | ) | | 19 | % | | (346,803 | ) |
| | $ | 479,113 |
| | 203 | % | | $ | 157,991 |
| | 157 | % | | $ | (275,830 | ) | $ | 757,317 |
| | 19 | % | | $ | 635,177 |
| | 33 | % | | $ | 479,113 |
|
| Closings (units): | | | | | | | | | | | | | | | | | | |
| Northeast | 1,835 |
| | 2 | % | | 1,800 |
| | (4 | )% | | 1,880 |
| 1,496 |
| | (5 | )% | | 1,568 |
| | (15 | )% | | 1,835 |
|
| Southeast | 3,022 |
| | 10 | % | | 2,757 |
| | (1 | )% | | 2,771 |
| 3,276 |
| | 4 | % | | 3,160 |
| | 5 | % | | 3,022 |
|
| Florida | 2,747 |
| | 17 | % | | 2,340 |
| | 4 | % | | 2,251 |
| 2,896 |
| | 5 | % | | 2,752 |
| | — | % | | 2,747 |
|
| Midwest | | 2,961 |
| | 15 | % | | 2,581 |
| | 10 | % | | 2,352 |
|
| Texas | 3,768 |
| | 8 | % | | 3,487 |
| | 5 | % | | 3,327 |
| 3,357 |
| | (10 | )% | | 3,750 |
| | — | % | | 3,768 |
|
| North | 3,401 |
| | 10 | % | | 3,103 |
| | 20 | % | | 2,579 |
| |
| Southwest | 2,993 |
| | (1 | )% | | 3,018 |
| | 22 | % | | 2,467 |
| |
| West | | 3,141 |
| | (7 | )% | | 3,385 |
| | (16 | )% | | 4,042 |
|
| | 17,766 |
| | 8 | % | | $ | 16,505 |
| | 8 | % | | 15,275 |
| 17,127 |
| | — | % | | $ | 17,196 |
| | (3 | )% | | 17,766 |
|
| Average selling price: | | | | | | | | | | | | | | | | | | |
| Northeast | $ | 427 |
| | 6 | % | | $ | 401 |
| | 6 | % | | $ | 380 |
| $ | 454 |
| | — | % | | $ | 452 |
| | 6 | % | | $ | 427 |
|
| Southeast | 279 |
| | 12 | % | | 250 |
| | 2 | % | | 244 |
| 323 |
| | 8 | % | | 300 |
| | 8 | % | | 279 |
|
| Florida | 291 |
| | 10 | % | | 265 |
| | 7 | % | | 248 |
| 350 |
| | 5 | % | | 332 |
| | 14 | % | | 291 |
|
| Midwest | | 342 |
| | 2 | % | | 337 |
| | 1 | % | | 335 |
|
| Texas | 214 |
| | 12 | % | | 191 |
| | 3 | % | | 185 |
| 250 |
| | 10 | % | | 228 |
| | 7 | % | | 214 |
|
| North | 357 |
| | 12 | % | | 319 |
| | 13 | % | | 282 |
| |
| Southwest | 327 |
| | 14 | % | | 286 |
| | 7 | % | | 268 |
| |
| West | | 379 |
| | (6 | )% | | 403 |
| | 16 | % | | 348 |
|
| | $ | 305 |
| | 11 | % | | $ | 276 |
| | 7 | % | | $ | 259 |
| $ | 338 |
| | 3 | % | | $ | 329 |
| | 8 | % | | $ | 305 |
|
| |
| (a) | Other homebuilding includes the amortization of intangible assets, amortization of capitalized interest, and other items not allocated to the operating segments. Other homebuilding also includes:segments, in addition to: losses on debt retirements totalingof $8.6 million and $26.9 million $32.1 million,in 2014 and $5.62013, respectively (see Note 6); adjustments to general liability insurance reserves relating to a reversal of $62.2 million in 2013, 2012,2015 and 2011, respectively;a charge of $69.3 million in 2014 (see Note 12); costs associated with the previously announced relocation of our corporate headquarters totaling $15.4$4.4 million, $16.3 million, and $15.4 million in 2013;2015, 2014, and 2013, respectively (see Note 2); and charges of $41.2 million in 2013 resulting from a contractual dispute related to a previously completed luxury community totaling $41.2 million in 2013. |
| |
(b) | Percentage not meaningful.(see Note 12). |
The following tables present additional selected financial information for our reportable Homebuilding segments:
| | | | | Operating Data by Segment ($000's omitted) | | Operating Data by Segment ($000's omitted) |
| | | Years Ended December 31, | | Years Ended December 31, |
| | | 2013 | | FY 2013 vs. FY 2012 | | 2012 | | FY 2012 vs. FY 2011 | | 2011 | | 2015 | | FY 2015 vs. FY 2014 | | 2014 | | FY 2014 vs. FY 2013 | | 2013 |
| Net new orders - units: | | | | | | | | | | | | | | | | | | | | |
| Northeast | | 1,834 |
| | (8 | )% | | 1,997 |
| | 14 | % | | 1,749 |
| | 1,479 |
| | 5 | % | | 1,408 |
| | (23 | )% | | 1,834 |
|
| Southeast | | 3,164 |
| | 3 | % | | 3,066 |
| | 16 | % | | 2,642 |
| | 3,454 |
| | 12 | % | | 3,075 |
| | (3 | )% | | 3,164 |
|
| Florida | | 2,595 |
| | (6 | )% | | 2,747 |
| | 19 | % | | 2,314 |
| | 3,168 |
| | 12 | % | | 2,841 |
| | 9 | % | | 2,595 |
|
| Midwest | | | 2,862 |
| | 23 | % | | 2,329 |
| | (1 | )% | | 2,361 |
|
| Texas | | 3,563 |
| | (13 | )% | | 4,117 |
| | 26 | % | | 3,278 |
| | 3,429 |
| | (9 | )% | | 3,773 |
| | 6 | % | | 3,563 |
|
| North | | 3,347 |
| | (9 | )% | | 3,661 |
| | 39 | % | | 2,635 |
| |
| Southwest | | 2,577 |
| | (25 | )% | | 3,451 |
| | 33 | % | | 2,597 |
| |
| West | | | 3,616 |
| | 12 | % | | 3,226 |
| | (9 | )% | | 3,563 |
|
| | | 17,080 |
| | (10 | )% | | 19,039 |
| | 25 | % | | 15,215 |
| | 18,008 |
| | 8 | % | | 16,652 |
| | (3 | )% | | 17,080 |
|
| Net new orders - dollars: | | | | | | | | | | | | | | | | | | | | |
| Northeast | | $ | 782,474 |
| | (5 | )% | | $ | 820,609 |
| | 22 | % | | $ | 674,134 |
| | $ | 674,637 |
| | 4 | % | | $ | 649,202 |
| | (17 | )% | | $ | 782,474 |
|
| Southeast | | 895,800 |
| | 14 | % | | 787,286 |
| | 22 | % | | 645,993 |
| | 1,160,590 |
| | 23 | % | | 944,567 |
| | 5 | % | | 895,800 |
|
| Florida | | 820,032 |
| | 12 | % | | 735,250 |
| | 26 | % | | 581,778 |
| | 1,152,705 |
| | 21 | % | | 954,892 |
| | 16 | % | | 820,032 |
|
| Midwest | | | 1,024,784 |
| | 26 | % | | 815,968 |
| | 5 | % | | 778,485 |
|
| Texas | | 796,377 |
| | (1 | )% | | 807,455 |
| | 33 | % | | 606,239 |
| | 905,003 |
| | 3 | % | | 881,843 |
| | 11 | % | | 796,377 |
|
| North | | 1,233,071 |
| | — | % | | 1,228,743 |
| | 64 | % | | 748,089 |
| |
| Southwest | | 866,812 |
| | (17 | )% | | 1,044,957 |
| | 50 | % | | 697,596 |
| |
| West | | | 1,387,661 |
| | 6 | % | | 1,312,465 |
| | (1 | )% | | 1,321,398 |
|
| | | $ | 5,394,566 |
| | (1 | )% | | $ | 5,424,300 |
| | 37 | % | | $ | 3,953,829 |
| | $ | 6,305,380 |
| | 13 | % | | $ | 5,558,937 |
| | 3 | % | | $ | 5,394,566 |
|
| Cancellation rates: | | | | | | | | | | | | | | | | | | | | |
| Northeast | | 13 | % | | | | 12 | % | | | | 14 | % | | 12 | % | | | | 12 | % | | | | 13 | % |
| Southeast | | 12 | % | | | | 13 | % | | | | 16 | % | | 10 | % | | | | 12 | % | | | | 12 | % |
| Florida | | 13 | % | | | | 12 | % | | | | 13 | % | | 11 | % | | | | 10 | % | | | | 13 | % |
| Midwest | | | 13 | % | | | | 13 | % | | | | 10 | % |
| Texas | | 22 | % | | | | 22 | % | | | | 28 | % | | 19 | % | | | | 19 | % | | | | 22 | % |
| North | | 11 | % | | | | 13 | % | | | | 17 | % | |
| Southwest | | 19 | % | | | | 15 | % | | | | 19 | % | |
| West | | | 18 | % | | | | 18 | % | | | | 17 | % |
| | | 15 | % | | | | 15 | % | | | | 19 | % | | 14 | % | | | | 15 | % | | | | 15 | % |
| Unit backlog: | | | | | | | | | | | | | | | | | | | | |
| Northeast | | 621 |
| | — | % | | 622 |
| | 46 | % | | 425 |
| | 444 |
| | (4 | )% | | 461 |
| | (26 | )% | | 621 |
|
| Southeast | | 1,053 |
| | 16 | % | | 911 |
| | 51 | % | | 602 |
| | 1,146 |
| | 18 | % | | 968 |
| | (8 | )% | | 1,053 |
|
| Florida | | 913 |
| | (14 | )% | | 1,065 |
| | 62 | % | | 658 |
| | 1,274 |
| | 27 | % | | 1,002 |
| | 10 | % | | 913 |
|
| Midwest | | | 1,089 |
| | (8 | )% | | 1,188 |
| | 45 | % | | 818 |
|
| Texas | | 1,250 |
| | (14 | )% | | 1,455 |
| | 76 | % | | 825 |
| | 1,345 |
| | 6 | % | | 1,273 |
| | 2 | % | | 1,250 |
|
| North | | 1,213 |
| | (4 | )% | | 1,267 |
| | 79 | % | | 709 |
| |
| Southwest | | 722 |
| | (37 | )% | | 1,138 |
| | 61 | % | | 705 |
| |
| West | | | 1,433 |
| | 50 | % | | 958 |
| | (14 | )% | | 1,117 |
|
| | | 5,772 |
| | (11 | )% | | 6,458 |
| | 65 | % | | 3,924 |
| | 6,731 |
| | 15 | % | | 5,850 |
| | 1 | % | | 5,772 |
|
| Backlog dollars: | | | | | | | | | | | | | | | | | | | | |
| Northeast | | $ | 275,239 |
| | (1 | )% | | $ | 276,851 |
| | 55 | % | | $ | 178,934 |
| | $ | 211,532 |
| | (2 | )% | | $ | 215,977 |
| | (22 | )% | | $ | 275,239 |
|
| Southeast | | 305,600 |
| | 21 | % | | 252,656 |
| | 63 | % | | 154,533 |
| | 403,568 |
| | 34 | % | | 301,033 |
| | (1 | )% | | 305,600 |
|
| Florida | | 308,834 |
| | 7 | % | | 289,133 |
| | 66 | % | | 174,039 |
| | 490,282 |
| | 40 | % | | 349,968 |
| | 13 | % | | 308,834 |
|
| Midwest | | | 382,360 |
| | 3 | % | | 370,036 |
| | 33 | % | | 278,040 |
|
| Texas | | 286,195 |
| | (3 | )% | | 294,623 |
| | 91 | % | | 153,927 |
| | 375,660 |
| | 21 | % | | 311,424 |
| | 9 | % | | 286,195 |
|
| North | | 465,480 |
| | 4 | % | | 446,741 |
| | 115 | % | | 207,507 |
| |
| Southwest | | 260,448 |
| | (30 | )% | | 371,534 |
| | 95 | % | �� | 190,709 |
| |
| West | | | 593,163 |
| | 50 | % | | 395,423 |
| | (12 | )% | | 447,888 |
|
| | | $ | 1,901,796 |
| | (2 | )% | | $ | 1,931,538 |
| | 82 | % | | $ | 1,059,649 |
| | $ | 2,456,565 |
| | 26 | % | | $ | 1,943,861 |
| | 2 | % | | $ | 1,901,796 |
|
The following table presents additional selected financial information for our reportable Homebuilding segments:
| | | | | Operating Data by Segment ($000's omitted) | | Operating Data by Segment ($000's omitted) |
| | | Years Ended December 31, | | Years Ended December 31, |
| | | 2013 | | FY 2013 vs. FY 2012 | | 2012 | | FY 2012 vs. FY 2011 | | 2011 | | 2015 | | FY 2015 vs. FY 2014 | | 2014 | | FY 2014 vs. FY 2013 | | 2013 |
| Land-related charges*: | | | | | | | | | | | | | | | | | | | | |
| Northeast | | $ | 557 |
| | (69 | )% | | $ | 1,794 |
| | (64 | )% | | $ | 4,958 |
| | $ | 3,301 |
| | 17 | % | | $ | 2,824 |
| | 407 | % | | $ | 557 |
|
| Southeast | | 998 |
| | (27 | )% | | 1,363 |
| | (44 | )% | | 2,429 |
| | 3,022 |
| | 65 | % | | 1,826 |
| | 83 | % | | 998 |
|
| Florida | | 1,076 |
| | 403 | % | | 214 |
| | (95 | )% | | 3,999 |
| | 4,555 |
| | 835 | % | | 487 |
| | (55 | )% | | 1,076 |
|
| Midwest | | | 2,319 |
| | (1 | )% | | 2,347 |
| | 25 | % | | 1,883 |
|
| Texas | | 191 |
| | (66 | )% | | 556 |
| | (33 | )% | | 828 |
| | 295 |
| | (8 | )% | | 321 |
| | 68 | % | | 191 |
|
| North | | 3,434 |
| | (24 | )% | | 4,546 |
| | (69 | )% | | 14,867 |
| |
| Southwest | | 472 |
| | (79 | )% | | 2,254 |
| | (31 | )% | | 3,263 |
| |
| West | | | (2,615 | ) | | (254 | )% | | 1,696 |
| | (16 | )% | | 2,023 |
|
| Other homebuilding | | 2,944 |
| | (54 | )% | | 6,468 |
| | 19 | % | | 5,442 |
| | 590 |
| | (65 | )% | | 1,667 |
| | (43 | )% | | 2,944 |
|
| | | $ | 9,672 |
| | (44 | )% | | $ | 17,195 |
| | (52 | )% | | $ | 35,786 |
| | $ | 11,467 |
| | 3 | % | | $ | 11,168 |
| | 15 | % | | $ | 9,672 |
|
| |
| * | Land-related charges include land impairments, net realizable value adjustments for land held for sale, and write-offs of deposits and pre-acquisition costs for land option contracts we elected not to pursue.costs. Other homebuilding consists primarily of write-offs of capitalized interest resulting from land-related charges. See Notes 4 3and 54 to the Consolidated Financial Statements for additional discussion of these charges. |
Northeast:
For 2013,2015, Northeast home sale revenues increased 8%decreased 4% compared with 20122014 due to a 5% decrease in closings. Average selling price remained flat over 2014. The decrease in closings occurred in Mid-Atlantic and New England and contributed
to the lower income before income taxes. However, the decreased income before income taxes resulted primarily from a charge of $20.0 million resulting from the Applecross matter (see Note 12). Net new orders increased 5%, primarily due to increased order levels in the Northeast Corridor.
For 2014, Northeast home sale revenues decreased 10% compared with 2013 due to a 15% decrease in closings offset by a 6% increase in the average selling price. The decrease in closings occurred across all divisions. The increase in the average selling price occurred primarily in New England and the Mid-Atlantic. The decreased income before income taxes resulted from lower revenue and gross margins combined and increased overhead. Net new orders decreased 23%, reflecting lower order levels across all divisions due in part to a lower active community count.
Southeast:
For 2015, Southeast home sale revenues increased 11% compared with 2014 due to an 8% increase in the average selling price combined with a 2%4% increase in closings. The increase in the average selling price occurred primarily in New England and Mid-Atlantic.closings were broad-based, though Tennessee experienced declines. The increasedincreased income before income taxes was due toresulted primarily from higher revenues and improved gross margins and overhead leverage. Net new orders decreased 8%, mainly due to lower order levels in the Mid-Atlantic due to fewer active communities, offset in part by an increase in orders in New England.
For 2012, Northeast home sale revenues increased 1% compared with 2011 due to a 6% increase in the average selling price, offset in part by a 4% decrease in closings. The increase in average selling price occurred primarily in the Northeast Corridor and Mid-Atlantic, while the decrease in closings was concentrated in the Northeast Corridor and was due to a significant decrease in active communities. The significant increase in income before income taxes was due to moderately improved gross margins and $21.9 million of expense in 2011 related to the write-down of a note receivable and unfavorable resolution of certain contingencies.revenues. Net new orders increased 14%, led12% in 2015 mainly due to increased order levels in Raleigh and Georgia, partially offset by our operationsa decline in New England.Tennessee.
Southeast:
For 2013,2014, Southeast home sale revenues increased 22%13% compared with 20122013 due to a 12%an 8% increase in the average selling price combined with a 10%5% increase in closings. The increase in the average selling price was concentrated in Raleigh and Tennessee.due to increases across all divisions. The increase in closing volumes was primarily due to increases in CharlotteGeorgia and Raleigh.the Coastal Carolinas. The increased income before income taxes was due to theresulted from higher revenues and moderatelycombined with improved gross margins. Net new orders increased decreased 3% in 2013 led by our operations2014 mainly due to lower order levels in Raleigh.Tennessee, Charlotte, and the Coastal Carolinas.
Florida:
For 2012, Southeast2015, Florida home sale revenues increased 2%11% compared with 20112014 due to a 2%5% increase in the average selling price partially offset bycombined with a 1% decrease in closings. The increase in average selling price was concentrated in Georgia and Tennessee. The decrease in closing volumes was primarily due to a moderate decrease in Raleigh. The increased income before income taxes was due to moderately improved gross margins. Net new orders increased 16% in 2012 and reflected increases across all divisions.
Florida:
For 2013, Florida home sale revenues increased 29% compared with 2012 due to a 10% increase in the average selling price and a 17%5% increase in closings. The increase in closings was concentrated in North Florida while the increase in average
selling price occurred in both North and South Florida. The increased income before income taxes for 20132015 resulted primarily from higher revenues. Net new orders increased by 12% in 2015 due primarily to an increase in active communities in North and West Florida.
For 2014, Florida home sale revenues increased 14% compared with 2013 due to a 14% increase in the average selling price. The increase in the average selling price occurred in both North and South Florida. Closings remained flat compared with the prior year as an increase in closings in South Florida was offset by a decrease in closings in North Florida. The increased income before income taxes for 2014 resulted from higher revenues combined with improved gross margins and overhead leverage. Net new orders decreased by 6% in 2013 due to fewer active communities in North Florida.
For 2012, Florida home sale revenues increased 11% compared with 2011 due to a 7% increase in the average selling price and a 4% increase in closings. The increase in income before income taxes for 2012 was attributable to significantly improved gross margins and overhead leverage, as well as lower land-related charges.margins. Net new orders increased by 19%9% in 2012 evenly across North and2014 due to an increase in active communities in South Florida.Florida
Texas:Midwest:
For 2013, Texas2015, Midwest home sale revenues increased 21%16% compared with the prior year period due to an 8%a 15% increase in closings combined with a 12%2% increase in the average selling price. The increase in closing volumes was driven by our acquisition of certain real estate assets from Dominion Homes in August 2014. Partially offsetting this were lower closings in Illinois-St Louis. The increased income before income taxes was most significantdue primarily to higher revenues. Net new orders increased by 23% in Houston2015 compared with 2014, mainly due to the acquisition of certain real estate assets from Dominion Homes combined with higher orders in Indianapolis-Cleveland and Central Texas, whileMinnesota.
For 2014, Midwest home sale revenues increased 10% compared with the prior year period due to a 10% increase in closings and a 1% increase in the average selling price. The increase in closing volumes was primarily due to the acquisition of certain real estate assets from Dominion Homes in August 2014, combined with increases in both Michigan and Indianapolis-Cleveland. The decreased income before income taxes resulted from higher overhead. Net new orders decreased by 1% in 2014 compared with 2013, mainly due to decreases in Illinois-St. Louis and Minnesota, partially offset by an increase due to the acquisition of certain real estate assets from Dominion Homes.
Texas:
For 2015, Texas home sale revenues decreased by 2% compared with the prior year period due to a 10% decrease in closings, partially offset by a 10% increase in the average selling price. These trends were broad-based, though Houston's closings were down 16%, in part due to the impact of lower oil prices on the local economy. In other markets, the lower closings resulted primarily from tight labor resources combined with delays in opening new communities, in part due to challenging weather conditions earlier in the year. The lower revenues led to the decreased income before income taxes for 2015. Net new orders decreased by 9% for 2015 led by a 19% decline in Houston.
For 2014, Texas home sale revenues increased 6% compared with the prior year period due to a 7% increase in the average selling price. The increase in the average selling price was led by our operations in Central Texas and Dallas.San Antonio. Closings were consistent with the prior year as the increases in Dallas, Houston, and San Antonio were offset by a decrease in closings in Central Texas. The increased income before income taxes for 20132014 resulted from the higher revenues combined with improved gross margins and overhead leverage.margins. Net new orders decreasedincreased by 13%6% for 2013 driven mainly by fewer2014 while the number of active communities.communities remained consistent with the prior year.
West:
For 2012, Texas2015, West home sale revenues increased 8%decreased 13% compared with the prior year period due to a 5% increase7% decrease in closings combined with a 3% increase6% decrease in the average selling price. The increase indecreased closings was experienced across all markets, but was concentrated in Houston and San Antonio. The increase indecreased average selling price was concentratedwere driven primarily by the Pacific Northwest, Northern California, and Southern California as the result of the timing of our community openings combined with a shift in Central Texas and Dallas.the mix of closings toward lower priced communities. The significant increase indecreased income before income taxes for 2012 was attributable to moderately improvedresulted from lower revenues, lower gross margins, and higher overhead leverage.as we invested in new communities. Net new orders increased by 26% for 2012 and reflected increases12% in 2015 compared with 2014 due to higher order levels across all divisions.divisions except the Pacific Northwest and Southern California.
North:
For 2013, North2014, West home sale revenues increased 23%decreased 3% compared with the prior year period due to a 10% increase16% decrease in closings, andoffset by a 12%16% increase in average selling price. The increase in closing volumes was primarily due to significant increases in Michigan and Northern California. The increase in average selling price was due to increases across all divisions. The increase in income before income taxes resulted fromBoth the higher revenues combined with improved gross margins in every division. Net new orders decreased by 9% in 2013 compared with 2012, mainly due to a decrease in Northern California, as we purposely slowed sales pace in a number of communities by raising prices and limiting lot releases.
For 2012, North home sale revenues increased 36% compared with the prior year period due to a 20% increase in closings and a 13%the increase in average selling price. The increase in closing volumes was broad-based across all divisions, with the largest increases coming from our Michigan and Indianapolis operations. The increase in average selling price occurred at all divisions except Michigan, with the most significant increases in Minnesota and the Pacific Northwest. The substantial increase in income before income taxes, as compared with the loss experienced in 2011, was due to the higher revenues, significantly improved gross margins and overhead leverage, a significant reduction in land-related charges, and gains related to land sale transactions. Net new orders increased by 39% in 2012 compared with 2011, and reflected moderate to significant increases across all divisions, with the largest increases in Michigan and Northern California.
Southwest:
For 2013, Southwest home sale revenues increased 13% compared with the prior year period due to a 14% increase in average selling price offset by a 1% decrease in closings. The increase in average selling price occurred across all divisions. The decrease in closings was mainly due to decreases in Southern California and Las Vegas. The significant increase indecreased income before income taxes was due to higher revenues and gross margins.resulted from lower revenues. Net new orders decreased by 25%9% in 20132014 compared with 20122013 primarily due to fewer active communities.
For 2012, Southwest home sale revenues increased 31% Demand in Northern California in particular slowed in 2014 compared with the prior year period due to a 22% increasestrong demand experienced in closings and a 7% increase in average selling price. The increase in average selling price occurred across all divisions. The significant increase in income before income taxes was due to the higher revenues, moderately improved gross margins, and better overhead leverage. In 2011, the Southwest also benefited from land sale gains totaling $15.5 million. Net new orders increased by 33% in 2012 compared with 2011 with significant increases across all divisions, except Colorado.2013.
Financial Services Operations
We conduct our Financial Services operations, which include mortgage and title operations, through Pulte Mortgage and other subsidiaries. In originating mortgage loans, we initially use our own funds, including funds available pursuant to credit agreements with either third parties or with the Company.parties. Substantially all of the loans we originate are sold in the secondary market within a short period of time after origination, generally within 30 days. We also sell the servicing rights for the loans we originate through fixed price servicing sales contracts to reduce the risks and costs inherent in servicing loans. This strategy results in owning the loans and related servicing rights for only a short period of time. Operating as a captive business model primarily targeted to supporting our Homebuilding operations, the business levels of our Financial Services operations are highly correlated to Homebuilding. Our Homebuilding customers continue to account for substantially all loan production. We believe that our capture rate, which represents loan originations from our Homebuilding operations as a percentage of total loan opportunities from our Homebuilding operations, excluding cash closings, is an important metric in evaluating the effectiveness of our captive mortgage business model. The following table presents selected financial information for our Financial Services operations ($000’s omitted):
| | | | Years Ended December 31, | Years Ended December 31, |
| | 2013 | | FY 2013 vs. FY 2012 | | 2012 | | FY 2012 vs. FY 2011 | | 2011 | 2015 | | FY 2015 vs. FY 2014 | | 2014 | | FY 2014 vs. FY 2013 | | 2013 |
| Mortgage operations revenues | $ | 113,552 |
| | (17 | )% | | $ | 137,443 |
| | 65 | % | | $ | 83,260 |
| $ | 111,810 |
| | 14 | % | | $ | 97,787 |
| | (14 | )% | | $ | 113,552 |
|
| Title services revenues | 27,399 |
| | 17 | % | | 23,445 |
| | 18 | % | | 19,834 |
| 28,943 |
| | 4 | % | | 27,851 |
| | 2 | % | | 27,399 |
|
| Total Financial Services revenues | 140,951 |
| | (12 | )% | | 160,888 |
| | 56 | % | | 103,094 |
| 140,753 |
| | 12 | % | | 125,638 |
| | (11 | )% | | 140,951 |
|
Expenses | 92,379 |
| | (32 | )% | | 135,511 |
| | (2 | )% | | 137,666 |
| 82,047 |
| | 15 | % | | 71,057 |
| | (23 | )% | | 92,242 |
|
Equity in (earnings) loss of unconsolidated entities | (137 | ) | | (26 | )% | | (186 | ) | | 82 | % | | (102 | ) | |
| Income (loss) before income taxes | $ | 48,709 |
| | (91 | )% | | $ | 25,563 |
| | (174 | )% | | $ | (34,470 | ) | |
| Income before income taxes | | $ | 58,706 |
| | 8 | % | | $ | 54,581 |
| | 12 | % | | $ | 48,709 |
|
| Total originations: | | | | | | | | | | | | | | | | | | |
| Loans | 11,818 |
| | 4 | % | | 11,322 |
| | 19 | % | | 9,482 |
| 11,435 |
| | 6 | % | | 10,805 |
| | (9 | )% | | 11,818 |
|
| Principal | $ | 2,765,509 |
| | 10 | % | | $ | 2,509,928 |
| | 26 | % | | $ | 1,986,225 |
| $ | 2,929,531 |
| | 10 | % | | $ | 2,656,683 |
| | (4 | )% | | $ | 2,765,509 |
|
(a) Includes loan origination reserve releases of $11.4 million and $18.6 million in 2015 and 2014, respectively.
| | | | Years Ended December 31, | Years Ended December 31, |
| | 2013 | | 2012 | | 2011 | 2015 | | 2014 | | 2013 |
| Supplemental data: | | | | | | | | | | |
| Capture rate | 80.2 | % | | 81.9 | % | | 78.5 | % | 82.9 | % | | 80.2 | % | | 80.2 | % |
| Average FICO score | 746 |
| | 743 |
| | 748 |
| 749 |
| | 749 |
| | 746 |
|
| Loan application backlog | $ | 984,754 |
| | $ | 1,178,321 |
| | $ | 583,472 |
| $ | 1,310,173 |
| | $ | 980,863 |
| | $ | 984,754 |
|
| Funded origination breakdown: | | | | | | | | | | |
| FHA | 16 | % | | 22 | % | | 28 | % | 11 | % | | 10 | % | | 16 | % |
| VA | 11 | % | | 12 | % | | 13 | % | 13 | % | | 12 | % | | 11 | % |
| USDA | 3 | % | | 3 | % | | 2 | % | 1 | % | | 2 | % | | 3 | % |
| Other agency | 67 | % | | 61 | % | | 56 | % | 69 | % | | 70 | % | | 67 | % |
| Total agency | 97 | % | | 98 | % | | 99 | % | 94 | % | | 94 | % | | 97 | % |
| Non-agency | 3 | % | | 2 | % | | 1 | % | 6 | % | | 6 | % | | 3 | % |
| Total funded originations | 100 | % | | 100 | % | | 100 | % | 100 | % | | 100 | % | | 100 | % |
Revenues
Total Financial Services revenues during 2015 increased 12% compared with 2014. The increase resulted from a higher capture rate and higher revenues per loan, which were attributable to a higher average loan size combined with a modest improvement in loan pricing. The improvement in loan pricing resulted primarily from a spike in mortgage industry refinancing volume in early 2015, which reduced competitive pricing pressures for new originations. Loan pricing came under more pressure in more recent months as industry refinancing volume receded. However, the overall pricing environment for new originations remains favorable.
Total Financial Services revenues during 20132014 decreased 12%11% compared with 20122013. The decrease was primarily attributable to lower origination volume resulting from lower home closings in our Homebuilding operations, combined with lower revenues per loan resulting from the increased competitiveness in the mortgage industry that occurredbegan in 2013. The decline in revenues per loan more than offset the higher loan origination volume. Interest income, which is included in mortgage operations revenues, was moderately higher in 2013 than in 2012 due to the increase in loan originations.
Total Financial Services revenues during 2012 increased 56% compared with 2011 due to a 19% increase in loan origination volumes, an increase in average loan size, and improved loan pricing. The increase in loan origination volumes was due to a higher capture rate, higher Homebuilding closing volumes, and fewer cash sales. Interest income, which is included in mortgage operations revenues, was moderately higher in 2012 than in 2011 due to the increase in loan originations.
In recent years,Since 2007, the mortgage industry has experienced a significant overall tightening of lending standards and a shift toward agency production and fixed rate loans versus adjustableproduction. Adjustable rate mortgages (“ARMs”) and unconventional loans. The substantial majorityaccounted for 6% of funded loan production during 2013, 2012,in 2015 compared with 11% and 2011 consisted of5% in 2014 and 2013, respectively. The shifts in ARM volume contributed to the higher revenue per loan in 2015 and lower revenue per loan in 2014 as ARMs generally contain lower margins. Additionally, fixed rate loans, the majority of which are prime, conforming loans. The shift toward agency fixed-rate loans has contributedmortgages tend to profitability as such loans generally result in higher profitability due tohave higher servicing values and structured guidelines that allow for expense efficiencies when processing the loan. Additionally, historically low interest rates and the challenging regulatory environment has contributed to profitability by reducing the overall level of pricing competition in the market. Recently, however, competition has increased in the industry, partially as the result of the mortgage industry's lower refinancing volume. We expect this increased level of competition, and more challenging pricing environment, to continue for the foreseeable future.values.
Loan origination liabilities
Our mortgage operations may be responsible for losses associated with mortgage loans originated and sold to investors in the event of errors or omissions relating to representations and warranties made by us that the loans sold met certain requirements, including representations as to underwriting standards, the existence of primary mortgage insurance, and the validity of certain borrower representations in connection with the loan. If a loan is determined to be faulty, we either repurchase the loanloans from the investors or reimburse the investors' losses (a “make-whole” payment).
In recent years,During 2015 and 2014, we experienced a significant increase in losses as a result of the high level of loan defaults and related losses in the mortgage industry and increasing aggressiveness by investors in presenting such claims to us. To date, the significant majority of these losses relates to loans originated in 2006 and 2007, during which period inherently riskier loan products became more common in the mortgage origination market. During 2012 and 2011, we recorded additional provisions for losses as a change in estimate primarily to reflect projected claim volumes in excess of previous estimates. Losses related toreduced our loan origination liabilities totaled $49.0by $11.4 million and $59.3$18.6 million in 2012 and 2011, respectively, based on probable settlements of various repurchase requests and current conditions. Non-cash changes in reserve levels are reflected in Financial Services expenses. There were no such losses in 2013. Given the ongoing volatility in the mortgage industry, changes in values of underlying collateral over time, and the uncertaintyother uncertainties regarding the ultimate resolution of these claims, actual costs could differ from our current estimates. See our Critical Accounting Policies and Estimates and Note 1312 toin the Consolidated Financial Statements for additional discussion.
We entered into an agreement in conjunction with the wind down of Centex's mortgage operations, which ceased loan origination activities in December 2009, that provides a guaranty for one major investor of loans originated by Centex. This guaranty provides that we will honor the potential repurchase obligations of Centex's mortgage operations related to breaches of representations and warranties in the origination of a certain pool of loans. Other than with respect to this pool of loans, our contractual repurchase obligations are limited to our mortgage subsidiaries, which are included in non-guarantor subsidiaries (see Note 14 for a discussion of non-guarantor subsidiaries).
The mortgage subsidiary of Centex also sold loans to a bank for inclusion in residential mortgage-backed securities (“RMBSs”) issued by the bank. In connection with these sales, Centex's mortgage subsidiary entered into agreements pursuant to which it may be required to indemnify the bank for losses incurred by investors in the RMBSs arising out of material errors or omissions in certain information provided by the mortgage subsidiary relating to the loans and loan origination process. In 2011, the bank notified us that it has been named defendant in two lawsuits alleging various violations of federal and state securities laws asserting that untrue statements of material fact were included in the registration statements used to market the sale of two RMBS transactions which included $162 million of loans originated by Centex's mortgage subsidiary. Neither Centex's mortgage subsidiary nor the Company is named as a defendant in these actions. We cannot yet quantify Centex's mortgage subsidiary's potential liability as a result of these indemnification obligations. We do not believe, however, that these matters will have a material adverse impact on the results of operations, financial position, or cash flows of the Company. We are aware of six other RMBS transactions with similar indemnity provisions that include an aggregate $116 million of loans, and we are not aware of any current or threatened legal proceedings regarding those transactions.Statements.
Income before income taxes
The increased income before income taxes for 2015 as compared with 2014 is due to higher origination volume and an increase in revenue per loan. The increase in expenses over the prior period is largely a result of an increase in headcount caused by the higher origination volume, combined with the impact of changes in loan loss reserves discussed above.
The increased income before income taxes for 20132014 as compared with 20122013 was due to higher origination volumes andresulted from the lower loss reserves related to loans originated in previous years,2014 discussed above, partially offset by less favorable loan pricing.
The income before income taxes for 2012 as compared with the loss before income taxes in the prior year period was due to higher origination volumes, improved loan pricing, and lower loss reserves related to loans originated in previous years.
Income Taxes
Our effective tax rate is affected by a number of factors,was 39.5%, 31.2% and (396.4)% for 2015, 2014, and 2013 respectively. The 2015 effective tax rate exceeds the most significant of which are thefederal statutory rate, primarily due to state taxes including changes in valuation allowance recorded against ouron state deferred tax assets and revaluation of deferred tax assets due to state law changes in our unrecognized tax benefits. Due to the effects of these factors, ourand business operations. The 2014 effective tax rates in 2013, 2012, and 2011 are not correlatedrate is less than the federal statutory rate primarily due to the amountreversal of a portion of our income or loss before income taxes. Thevaluation allowance related to certain state deferred tax assets, along with the favorable resolution of certain federal and state income tax benefit for matters. The 2013 resulted effective tax rate differed from the federal statutory rate primarily due to the reversal of substantially all of the valuation allowance related to our federal and certain state deferred tax assets.
Income tax expense (benefit) reflects provisions and (reversals) related to changes to our deferred tax asset valuation allowances totaling $3.1 million, $(45.6) million, and $(2.1) billion in 2015, 2014, and 2013, respectively. The 2015 and 2014 adjustments related primarily to certain of our state deferred tax assets whileas the result of changes in expected future taxable income tax benefits for 2012 and 2011 resulted primarily from the favorable resolution ofin certain federal and state income tax matters.jurisdictions.
We evaluate our deferred tax assets each period to determine if a valuation allowance is required based on whether it is "more likely than not" that some portion of the deferred tax assets would not be realized. The ultimate realization of these deferred tax assets is dependent upon the generation of sufficient taxable income during future periods. We conduct our evaluation by considering all available positive and negative evidence.
Our income tax benefit for 2013 includes $2.1 billion related to the reversal of substantially all of the valuation allowance previously recorded against our deferred tax assets. In the third quarter of 2013, we evaluated the need for a valuation allowance against our deferred tax assets and determined that the valuation allowance against substantially all of our federal deferred tax assets and a significant portion of our state deferred tax assets was no longer required. When a change in valuation allowance is recognized in an interim period, a portion of the valuation allowance to be reversed must be allocated to the remaining interim periods. Accordingly, a portion of the remaining valuation allowance was reversed in the fourth quarter of 2013. The components of the valuation allowance remaining at December 31, 2013 relate primarily to state net operating losses that have not met the "more likely than not" realization threshold.
The principal positive evidence that led to the reversal of the valuation allowance in 2013 included: (1) our emergence from a three-year cumulative loss in 2013; (2) the significant positive income we generated during 2012 and 2013, including seven consecutive quarters of pretax income as of December 31, 2013; (3) continued improvements in 2013 over recent years in other key operating metrics, including revenues, gross margin, and overhead leverage; (4) our forecasted future profitability; (5) improvement in our financial position; and (6) significant evidence that conditions in the U.S. housing industry arewere more favorable than in recent years and our belief that conditions willwould continue to be favorable over the long-term. The following provides a further summary of the principal evidence considered in 2013:
Recent operating results: We generated significant pretax income in 2012 and 2013. This included generating pretax income in seven consecutive quarters. Excluding asset impairments, we have been profitable in nine out of the last ten quarters. As a result of this improved profitability, we exited a three-year cumulative loss position in 2013, which had been a significant piece of negative evidence prior to 2013.
Future operating results: We have a strong backlog of orders that, combined with other factors, provides evidence of our ability to continue to be profitable for 2014 and beyond. Based on detailed projections from each of our business units, we expect pretax earnings growth in the future, even if sales volumes remain at existing levels.
Financial position: We continue to generate significant cash flow from operations and had $1.6 billion of unrestricted cash and equivalents at December 31, 2013. We have used our capital to both invest in our business and reduce our financial leverage. During 2013, we increased our authorized investments in new communities via land acquisition and development, retired significant amounts of debt prior to the stated maturity dates, increased our authorized and actual common share repurchases, and reinstated a common share dividend.
Recovery period for deferred tax assets: For federal income tax purposes, we are allowed to carryforward net operating losses for 20 years and apply such losses to future taxable income to realize our federal deferred tax assets. We believe that we will realize all of our federal net operating losses and will be able to absorb substantially all federal deductible temporary differences as they reverse in future years.
Operating actions taken: We have taken specific actions in recent years to improve our homebuilding operations, including: restructuring our overhead costs to align with current and projected volumes; improving inventory turns, including significant reductions in speculative home inventory; implementation of a robust risk-based portfolio approach to land acquisition approvals; monetization of under performing land assets; enhancing revenues through more strategic pricing, including establishing clear product offerings for each of our targeted consumer groups based on consumer-driven input, expanding the use of house options and lot premiums, and lessening our reliance on speculative home sales; and reducing our house construction costs through common house plan management, value-engineering house plans, and "should costing" our construction costs with our suppliers.
Risk of future asset impairments: The frequency and magnitude of asset impairments has decreased dramatically in recent years as assets have been written-down or sold and as industry conditions have improved. While we remain at risk of future impairments if industry conditions worsen or if our strategy related to certain assets changes, we believe it unlikely that any future asset impairments would be at levels similar to those experienced during the U.S. housing industry downturn.
Sales trends: Our home closings and home sale revenues increased 8% and 19%, respectively, in 2013 compared with 2012. We also have a strong backlog of orders that is amongst the highest in the U.S. homebuilding industry at $1.9 billion as of December 31, 2013. Additionally, the gross margin of orders within our backlog improved significantly from 2012 to 2013. While our net new order units declined 10% in 2013 compared with 2012, this resulted primarily from an expected reduction in the number of our active communities, which are down 14% at December 31, 2013 from December 31, 2012. The reduction in active communities and the lower level of net new orders is consistent with our expectations.
U.S. housing industry outlook: Various housing indices have shown significant improvement in recent periods. U.S. single family new home sales of 306,000 in 2011 were at the lowest level since 1962, a drop of 76% from the 2005 cyclical peak of 1.3 million. In 2013 and 2012, U.S. new home sales increased 16% and 20%, respectively, over the prior year periods. The general consensus among industry analysts is that new home sales will increase significantly in each of the next several years. These forecasts are generally consistent with the 25-year average of approximately 735,000 annual new home sales. New home sales experienced volatility in the second half of 2013 period as consumers adjusted to higher home prices and an increase in mortgage interest rates. While we believe that higher interest rates are inevitable and may have a moderating effect on demand and pricing, we believe this impact will be outweighed by the other factors driving increased sales activity as overall new home sales remain low compared with historical levels. Ultimately, we believe that any sustained rise in interest rates will be indicative of a stronger macroeconomic environment that will support a continued recovery in the homebuilding industry.
After careful evaluation of all available positive and negative evidence, and giving more weight to objectively verifiable evidence over more subjective evidence, we concluded as of September 30, 2013 and again as of December 31, 2013, that it was "more likely than not" that substantially all of our federal deferred tax assets and a significant portion of our state deferred tax assets would be realized. Even if industry conditions weaken from current levels, we believe we will be able to adjust our operations to sustain long-term profitability.future.
Liquidity and Capital Resources
We finance our land acquisition, development, and construction activities and financial services operations by using internally-generated funds supplemented by credit arrangements with third parties and capital market financing. We routinely monitor current and expected operational requirements and financial market conditions to evaluate accessing other available financing sources, including revolving bank credit and securities offerings. Based on our current financial condition and credit relationships, we believe that our operations and borrowing resources are sufficient to provide for our current and foreseeable capital requirements. However, we continue to evaluate the impact of market conditions on our liquidityofferings and may determine that modifications to our financing are appropriate.
At December 31, 20132015, we had unrestricted cash and equivalents of $1.6 billion754.2 million and, senior notes of $2.11.6 billion., and borrowings of $500.0 million under a term loan. We also had restricted cash balances of $72.7 million, the substantial majority of which related to cash serving as collateral under certain letter of credit facilities. Other financing sources include various letter of credit facilities and surety bond arrangements.
$21.3 million. We follow a diversified investment approach for our cash and equivalents by maintaining such funds with a diversifiedbroad portfolio of banks within our group of relationship banks in high quality, highly liquid, short-term investments, generally money market fundsdeposits and federal government or agency securities.investments. We monitor our investments with each bank and do not believe our cash and equivalents are exposed to any material risk of loss. However, there can be no assurances that losses of principal balance on our cash and equivalents will not occur.
Our ratio of debt to total capitalization, excluding our Financial Services debt, was 30.7%30.5% at December 31, 2013, and 8.0% net of cash and equivalents, including restricted cash.2015.
During We retired $238.0 million, $245.7 million, and $461.4 million of senior notes during 2015, 2014, and 2013,, we retired respectively. The 2014 and 2013 retirements occurred prior to their scheduledthe stated maturity dates $461.4and resulted in losses totaling $8.6 million of senior notes. We recorded losses related to these transactions totaling $26.9 and $26.9 million. Losses on these transactions included the write-off of unamortized discounts, premiums, in 2014 and transaction fees and are reflected in other expense, net. During 2012 and 2011, we retired senior notes totaling $592.4 million and $323.9 million,2013, respectively.
Credit agreementsRevolving credit facility
We maintain separate cash-collateralized letter of credit agreements withIn July 2014, we entered into a number of financial institutions. Letters of credit totaling $58.7 million were outstanding under these agreements at December 31, 2013. Under these agreements, we are required to maintain deposits with these financial institutions in amounts approximating the letters of credit outstanding. Such deposits are included in restricted cash.
We also maintain ansenior unsecured letter ofrevolving credit facility (the “Revolving Credit Facility”) maturing in July 2017. The Revolving Credit Facility provides for maximum borrowings of $500.0 million and contains an uncommitted accordion feature that expires in September 2014. This facility permitscould increase the size of the Revolving Credit Facility to $1.0 billion, subject to certain conditions and availability of additional bank commitments. The Revolving Credit Facility also provides for the issuance of up to $150.0 million of letters of credit for general corporate purposesthat reduce available borrowing capacity under the Revolving Credit Facility and may total no more than the greater of: (i) 50% of the size of the facility or (ii) $300.0 million in supportthe aggregate. The interest rate on borrowings under the Revolving Credit Facility may be based on either the London Interbank Offered Rate or Base Rate plus an applicable margin, as defined. At December 31, 2015, we had no borrowings outstanding and $191.3 million of any wholly-owned subsidiary. Lettersletters of credit totaling $124.4 million were outstandingissued under this facility at the Revolving Credit Facility.
The Revolving Credit Facility contains financial covenants that require us to maintain a minimum Tangible Net Worth, a minimum Interest Coverage Ratio, and a maximum Debt-to-Capitalization Ratio (as each term is defined in the Revolving Credit Facility). As of December 31, 20132015, we were in compliance with all covenants. Outstanding balances under the Revolving Credit Facility are guaranteed by certain of our wholly-owned subsidiaries.
Term loan
On September 30, 2015, we entered into a senior unsecured $500.0 million term loan agreement (the “Term Loan”) with an initial maturity date of January 3, 2017, which can be extended at our option up to 12 months. The interest rate on the Term Loan may be based on either LIBOR or a base rate plus an applicable margin, as defined. Borrowings are guaranteed by certain of our wholly-owned subsidiaries, and the Term Loan contains customary affirmative and negative covenants for loans of this type, including the same financial covenants as under the Revolving Credit Facility. As of December 31, 2015, we were in compliance with all covenants.
Limited recourse notes payable
Certain of our local homebuilding operations maintain limited recourse collateralized notes payable with third parties totaling $35.3 million at December 31, 2015. These notes have maturities ranging up to six years, are collateralized by the applicable land positions to which they relate, have no recourse to any other assets, and are classified within accrued and other liabilities. The stated interest rates on these notes range up to 5.00%.
Pulte Mortgage
Pulte Mortgage provides mortgage financing for the majority of our home closings by utilizing its own funds and funds made available pursuant to credit agreements with third parties or through intercompany borrowings.parties. Pulte Mortgage uses these resources to finance its lending activities until the mortgage loans are sold in the secondary market, which generally occurs within 30 days.
Pulte Mortgage maintains a master repurchase agreement (the “Repurchase Agreement”) with third party lenders that expires in lenders. In September 2014. Effective January 2014,2015, Pulte Mortgage voluntarily reducedentered into an amendment to the Repurchase Agreement that extended the effective date to September 2016. The Repurchase Agreement was subsequently amended in December 2015 to increase the borrowing capacity underto $310.0 million. The capacity decreased to $175.0 million on January 19, 2016, and increases to $200.0 million on July 29, 2016. The purpose for the Repurchase Agreement from $150.0 million to $99.8 million subject to certain sublimits. We reducedchanges in capacity during the borrowing capacity in orderterm of the agreement is to lower associated fees during seasonally lowlower volume periods when the additional capacity is unnecessary.of mortgage origination activity. Borrowings under the Repurchase Agreement are secured by residential mortgage loans available-for-sale. The Repurchase Agreement contains various affirmative and negative covenants applicable to Pulte Mortgage, including quantitative thresholds related to net worth, net income, and liquidity. At December 31, 2013, Pulte Mortgage had $105.7$267.9 million and $140.2 million outstanding under the Repurchase Agreement at December 31, 2015, and 2014, respectively, and was in compliance with all of its covenants and requirements. While there can be no assurances that the Repurchase Agreement can be renewed or replaced on commercially reasonable terms upon its expiration, we believe we have adequate liquidity to meet Pulte Mortgage's anticipated financing needs.requirements as of such dates.
Stock repurchase programs
In July 2013, we increasedprevious years, our commonBoard of Directors authorized and announced a share repurchase program. In October 2014, our Board of Directors approved an increase of $750.0 million to such authorization, to $352.3and a further increase of $300.0 million of common shares. In 2013, we in December 2015. We repurchased 21.2 million, 12.9 million, and 7.2 million shares under the repurchase authorizationin 2015, 2014, and 2013, respectively, for a total of $118.1$433.7 million,. There were no repurchases under these programs during 2012 or 2011. Such repurchases are reflected as a reduction of common stock $245.8 million, and retained earnings.$118.1 million in 2015, 2014, and 2013, respectively. At December 31, 2013,2015, we had remaining authorization to purchase $234.3repurchase $604.8 million of common shares.
Dividends
We reinstated our quarterly cash dividend in July 2013. During 2013 weand subsequently raised the quarterly dividend in both 2014 and 2015. Our declared threequarterly cash dividends of $0.05 per common share each.totaled $117.9 million, $86.4 million, and $57.5 million in 2015, 2014, and 2013, respectively.
Cash flows
Operating activities
Our net cash used in operating activities in 2015 was $348.1 million, compared with cash provided by operating activities of $309.2 million and $881.1 million in 2013 was $881.1 million, compared with $760.1 million2014 and $17.3 million in 2012 and 2011,2013, respectively. Generally, the primary drivers of our cash flow from operations are profitability and changes in inventory levels. Our negative cash flow from operations for 2015 was primarily due to an increase in inventories of $927.8 million as the result of a significant increase in land acquisition and development investment combined with a moderate increase in house inventory due to the higher order backlog and an increase in the number of spec homes consistent with our intentions to achieve a more even flow production cycle over the course of 2016 compared with 2015. The increased inventory was offset by our income before income taxes of $816.0 million. Additionally, residential mortgage loans available-for-sale increased $104.6 million as the result of an increase in home closings in the month of December compared with the prior year.
Our positive cash flow from operations for 2014 was primarily due to our income before income taxes of $689.8 million. These cash flows were partially offset in 2014 by a net increase in inventories of $346.6 million and an increase in residential mortgage loans available-for-sale of $53.7 million.
Our positive cash flow from operations for 2013 was primarily due to our income before income taxes of $527.8$527.8 million, combined with a net decrease in inventories of $265.1$265.1 million and a reduction of $28.4$28.4 million in residential mortgage loans available-for-sale. The inventory decrease resulted from a reduction in homes in production and lower land inventory consistent with the decline in the number of our active communities.
Our positive cash flow from operations for 2012 was primarily due to our net income of $206.1 million combined with a netcommunities, while the decrease in inventories of $455.2 million. The inventory decreaseresidential mortgage loans available-for-sale resulted from lower reinvestment in land inventory combined with a significant reduction in spec homes in production, partially offset by an increase in sold homes in production.
The net losses for 2011 were largely the result of non-cash asset impairments and insurance reserve adjustments, so the cash flows from operations primarily related to changes in working capital. Our positive cash flow from operations in 2011 was primarily the result of a net decrease in inventories combinedthe home closings in the month of December compared with income tax refunds, net of payments, of $62.2 million offset by financing Pulte Mortgage's lending operations, which reduced cash flows from operations by $52.8 million in 2011.the prior year.
Investing activities
Investing activities are generally not a significant source or use of cash for us. Net cash used in investing activities totaled $46.0$30.9 million in 2013,2015, compared with net$67.6 million in 2014 and $46.0 million in 2013. The use of cash provided byfrom investing activities in 2015 was primarily due to capital expenditures as the result of new community openings.
$9.7 million in 2012 and net cash used in investing activities of $93.6 million in 2011. The use of cash from investing activities in 20132014 was primarily due to the acquisition of certain real estate assets from Dominion Homes (see Note 1) and $48.8 million of capital expenditures related primarily to new community openings and the relocation of our corporate headquarters. These cash outflows were partially offset by a $55.0 million reduction in the restricted cash related to letters of credit as a result of the Revolving Credit Facility entered into in July 2014.
The use of cash from investing activities in 2013 was primarily due to $28.9 million of capital expenditures, a $12.3 million increase in residential mortgage loans held for investment, and a $4.2$4.2 million increase in the restricted cash we arewere required to maintain under our letter of credit facilities.
The positive cash flow from investing activities in 2012 was primarily due to a $28.7 million decrease in the restricted cash we are required to maintain under our letter of credit facilities, which resulted from a reduction in letters of credit outstanding, offset by capital expenditures and investments in unconsolidated entities.
The use of cash from investing activities for 2011 was due to $83.2 million of restricted cash we were required to maintain related to our letter of credit facilities, partially offset by proceeds from the sale of property and equipment related to the consolidation of certain facilities.
Financing activities
Net cash used in financing activities was $159.7 million in 2015, compared with $529.1 million and $659.6 million in 2014 and 2013, compared withrespectively. The net cash used in financing activities for 2015 resulted primarily from the repurchase of $448.221.2 million common shares for $433.7 million under our repurchase authorization, payment of $239.2 million to retire senior notes at their scheduled maturity date, and $324.0payment of $116.0 million in 2012cash dividends. These cash outflows were offset by $500.0 million of proceeds from the Term Loan executed in September 2015 and net borrowings of $127.6 million under the Repurchase Agreement to fund the increase in mortgage loans available-for-sale.2011, respectively.
During the last three years, we significantly reduced our outstanding senior notes through a variety of transactions, including scheduled maturities, open market repurchases, early redemptions as provided within indenture agreements, and tender offers. Completion of these transactions required the use of $479.8$239.2 million,, $618.8 $250.6 million,, and $321.1$479.8 million of cash in 2013, 2012,2015, 2014, and 2011,2013, respectively. During 2013, we also repaid $33.1 million of borrowings under the Repurchase Agreement due to the lower balance of mortgages available-for-sale. We borrowed $138.8an incremental $34.6 million under the Repurchase Agreement during 2014, and repaid $33.1 million in 2012, the year in which it was put in place. During 2011, we used internal funds to finance Pulte Mortgage's operations, the effects of which are reflected in cash flows from operating activities.2013. Cash used in financing activities for 20132014 also reflects funds used todividend payments of $75.6 million and the repurchase of common shares and pay dividends,under our share repurchase authorization for $253.0 million, partially offset by funds provided by the issuance of common shares in connection with employee stock option exercises.
Inflation
We, and the homebuilding industry in general, may be adversely affected during periods of inflation because of higher land and construction costs. Inflation may also increase our financing costs. In addition, higher mortgage interest rates affect the affordability of our products to prospective homebuyers. While we attempt to pass on to our customers increases in our costs through increased sales prices, market forces may limit our ability to do so. If we are unable to raise sales prices enough to compensate for higher costs, or if mortgage interest rates increase significantly, our revenues, gross margins, and net income could be adversely affected.
Seasonality
WeAlthough significant changes in market conditions have impacted our seasonal patterns in the past and could do so again, we historically experience variability in our quarterly results from operations due to the seasonal nature of the homebuilding industry. Historically, we have experiencedWe generally experience increases in revenues and cash flow from operations during the fourth quarter based on the timing of home closings.closings. This seasonal activity increases our working capital requirements in our third and fourth quarters to support our home production and loan origination volumes. As a result of the seasonality of our operations, our quarterly results of operations are not necessarily indicative of the results that may be expected for the full year.
Contractual Obligations and Commercial Commitments
The following table summarizes our payments under contractual obligations as of December 31, 20132015:
| | | | Payments Due by Period
($000’s omitted) | Payments Due by Period
($000’s omitted) |
| | Total | | 2014 | | 2015-2016 | | 2017-2018 | | After 2018 | Total | | 2016 | | 2017-2018 | | 2019-2020 | | After 2020 |
| Contractual obligations: | | | | | | | | | | | | | | | | | | |
Long-term debt (a) | $ | 3,892,070 |
| | $ | 135,275 |
| | $ | 1,028,120 |
| | $ | 132,378 |
| | $ | 2,596,297 |
| $ | 3,317,336 |
| | $ | 564,392 |
| | $ | 767,256 |
| | $ | 134,250 |
| | $ | 1,851,438 |
|
| Operating lease obligations | 160,808 |
| | 28,116 |
| | 48,050 |
| | 28,407 |
| | 56,235 |
| 128,129 |
| | 28,561 |
| | 39,673 |
| | 24,921 |
| | 34,974 |
|
Other long-term liabilities (b) | 7,553 |
| | 1,999 |
| | 3,294 |
| | 2,260 |
| | — |
| 38,261 |
| | 23,410 |
| | 6,173 |
| | 8,678 |
| | — |
|
Total contractual obligations (c) | $ | 4,060,431 |
| | $ | 165,390 |
| | $ | 1,079,464 |
| | $ | 163,045 |
| | $ | 2,652,532 |
| $ | 3,483,726 |
| | $ | 616,363 |
| | $ | 813,102 |
| | $ | 167,849 |
| | $ | 1,886,412 |
|
| |
| (a) | Represents principal and interest payments related to our senior notes.notes and term loan. |
| |
| (b) | Represents limited recourse collateralized financing arrangements and related interest payments. |
| |
| (c) | We do not have any payments due in connection with capital lease or long-term purchase obligations. |
We are subject to certain obligations associated with entering into contracts (including land option contracts) for the purchase, development, and sale of real estate in the routine conduct of our business. Option contracts for the purchase of land enable us to defer acquiring portions of properties owned by third parties and unconsolidated entities until we have determined whether to exercise our option, which may serve to reduce our financial risks associated with long-term land holdings. At December 31, 2013,2015, we had $91.0$162.1 million of deposits and pre-acquisition costs, of which $10.5 million is refundable, relating to option agreements to acquire 28,266 homesites42,160 lots with a remaining purchase price of $1.42.0 billion. We expect to acquire the majority of these lotssuch land within the next two years and the remainder thereafter.
At December 31, 2013,2015, we had $173.3$39.0 million of gross unrecognized tax benefits and $33.1$17.2 million of related accrued interest and penalties. We are currently under examination by various taxing jurisdictions and anticipate finalizing the examinations with certain jurisdictions within the next twelve months. However, the final outcome of these examinations is not yet determinable. The statute of limitations for our major tax jurisdictions remains open for examination for tax years 20032005 - 2013.2015.
The following table summarizes our other commercial commitments as of December 31, 2013:2015:
| | | | Amount of Commitment Expiration by Period
($000’s omitted) | Amount of Commitment Expiration by Period
($000’s omitted) |
| | Total | | 2014 | | 2015-2016 | | 2017-2018 | | After 2018 | Total | | 2016 | | 2017-2018 | | 2019-2020 | | After 2020 |
| Other commercial commitments: | | | | | | | | | | | | | | | | | | |
Guarantor credit facilities (a) | $ | 208,699 |
| | $ | 208,699 |
| | $ | — |
| | $ | — |
| | $ | — |
| $ | 500,000 |
| | $ | — |
| | $ | 500,000 |
| | $ | — |
| | $ | — |
|
Non-guarantor credit facilities (b) | 150,000 |
| | 150,000 |
| | — |
| | — |
| | — |
| 310,000 |
| | 310,000 |
| | — |
| | — |
| | — |
|
Total commercial commitments (c) | $ | 358,699 |
| | $ | 358,699 |
| | $ | — |
| | $ | — |
| | $ | — |
| $ | 810,000 |
| | $ | 310,000 |
| | $ | 500,000 |
| | $ | — |
| | $ | — |
|
| |
| (a) | $150.0 million of the $208.7The $500.0 million in 20142016-2017 represents the capacity of our unsecured letter ofrevolving credit facility, ofunder which $124.4no borrowings were outstanding and $191.3 million was outstanding at December 31, 2013, while the remaining $58.7 million in 2014 represents of letters of credit outstanding under our cash-collateralized letter of credit agreements.
were issued at December 31, 2015. |
| |
| (b) | Represents the capacity of the Repurchase Agreement, of which $105.7$267.9 million was outstanding at December 31, 2013,2015, and which expires in September 2014. Effective2016. The capacity decreased to $175.0 million on January 2014, we voluntarily reduced the capacity from $15019, 2016, and increases to $200.0 million to $99.8 million. on July 29, 2016. |
| |
| (c) | The above table excludes an aggregate $958.3 million$1.0 billion of surety bonds, which typically do not have stated expiration dates. |
Off-Balance Sheet Arrangements
We use letters of credit and surety bonds to guarantee our performance under various contracts, principally in connection with the development of our homebuilding projects. The expiration dates of the letter of credit contracts coincide with the expected completion date of the related homebuilding projects. If the obligations related to a project are ongoing, annual extensions of the letters of credit are typically granted on a year-to-year basis. At December 31, 20132015, we had outstanding letters of credit of $183.1 million.$191.3 million. Our surety bonds generally do not have stated expiration dates; rather, we are released from the bonds as the contractual performance is completed. These bonds, which approximated $1.0 billion at December 31, 20132015, are typically outstanding over a period of approximately three to five years. Because significant construction and development work has been performed related to the applicable projects but has not yet received final acceptance by the respective counterparties, the aggregate amount of surety bonds outstanding is in excess of the projected cost of the remaining work to be performed.
In the ordinary course of business, we enter into land option agreements in order to procure land for the construction of houses in the future. At December 31, 20132015, these agreements had an aggregate remaining purchase price of $1.42.0 billion. Pursuant to these land option agreements, we provide a deposit to the seller as consideration for the right to purchase land at different times in the future, usually at predetermined prices. In certain instances, we are required to record the land under option as if we own it. At December 31, 2013, we recorded assets of $24.0 million as land, not owned, under option agreements.
At December 31, 20132015, aggregate outstanding debt of unconsolidated joint ventures was $12.416.4 million, of which our proportionate share was $4.47.0 million. Of this amount, we provided limited recourse guaranties for $0.8$0.2 million at December 31, 20132015. See Note 65 to the Consolidated Financial Statements for additional information.
Critical Accounting Policies and Estimates
The accompanying consolidated financial statements were prepared in conformity with U.S. generally accepted accounting principles. When more than one accounting principle, or the method of its application, is generally accepted, we select the principle or method that is appropriate in our specific circumstances (see Note 1 of our Consolidated Financial Statements). Application of these accounting principles requires us to make estimates about the future resolution of existing uncertainties; as a result, actual results could differ from these estimates. In preparing these consolidated financial statements, we have made our best estimates and judgments of the amounts and disclosures included in the consolidated financial statements, giving due regard to materiality.
Revenue recognition
Homebuilding – Homebuilding revenue and related profit are generally recognized when title to and possession of the property are transferred to the buyer. In situations where the buyer’s financing is originated by Pulte Mortgage, our wholly-owned mortgage subsidiary, and the buyer has not made an adequate initial or continuing investment, the profit on such sale is deferred until the sale of the related mortgage loan to a third-party investor has been completed. If there is a loss on the sale of the property, the loss on such sale is recognized at the time of closing.
Financial Services – Mortgage servicing fees represent fees earned for servicing loans for various investors. Servicing fees are based on a contractual percentage of the outstanding principal balance, or a contracted set fee in the case of certain sub-servicing arrangements, and are credited to income when related mortgage payments are received or the sub-servicing fees are earned. Loan origination fees, commitment fees, and certain direct loan origination costs are recognized as incurred. Expected gains and losses from the sale of residential mortgage loans and their related servicing rights are included in the measurement of written loan commitments that are accounted for at fair value through Financial Services revenues at the time of commitment. Subsequent changes in the fair value of these loans are reflected in Financial Services revenues as they occur. Interest income is accrued from the date a mortgage loan is originated until the loan is sold. Loans are placed on non-accrual status once they become greater than 90 days past due their contractual terms. Subsequent payments received are applied according to the contractual terms of the loan.
Inventory and cost of revenues
Inventory is stated at cost unless the carrying value is determined to not be recoverable, in which case the affected inventory is written down to fair value. Cost includes land acquisition, land development, and home construction costs, including interest, real estate taxes, and certain direct and indirect overhead costs related to development and construction. For those communities for which construction and development activities have been idled, applicable interest and real estate taxes are expensed as incurred. Land acquisition and development costs are allocated to individual lots using an average lot cost determined based on the total expected land acquisition and development costs and the total expected home closings for the community. The specific identification method is used to accumulate home construction costs.
We capitalize interest cost into homebuilding inventories. Each layer of capitalized interest is amortized over a period that approximates the average life of communities under development. Interest expense is allocated over the period based on the timing of home closings.
Cost of revenues includes the construction cost, average lot cost, estimated warranty costs, and commissions and closing costs applicable to the home. The construction cost of the home includes amounts paid through the closing date of the home, plus an appropriate accrual for costs incurred but not yet paid, based on an analysis of budgeted construction costs. This accrual is reviewed for accuracy based on actual payments made after closing compared with the amount accrued, and adjustments are made if needed. Total community land acquisition and development costs are based on an analysis of budgeted costs compared with actual costs incurred to date and estimates to complete. The development cycles for our communities range from under one year to in excess of ten years for certain master planned communities. Adjustments to estimated total land acquisition and development costs for the community affect the amounts costed for the community’s remaining lots.
We record valuation adjustments on land inventory when events and circumstances indicate that they may be impaired and when the cash flows estimated to be generated by those assets are less than their carrying amounts. For communities that demonstrate indicators of impairment, we compare the expected undiscounted cash flows for these communities to their carrying value. For those communities whose carrying values exceed the expected undiscounted cash flows, we calculate the fair value of the community. Impairment charges are required to be recorded if the fair value of the community’s inventory is less than its carrying value.
We generally determine the fair value of each community’s inventory using a combination of discounted cash flow models and market comparable transactions, where available. These estimated cash flows are significantly impacted by estimates related to expected average selling prices and sale incentives, expected sales paces and cancellation rates, expected land development and construction timelines, and anticipated land development, construction, and overhead costs. Such estimates must be made for each individual community and may vary significantly between communities. Due to uncertainties in the estimation process, the significant volatility in demand for new housing, and the long life cycles of many communities, actual results could differ significantly from such estimates.
Residential mortgage loans available-for-sale
In accordance with ASC 825, “Financial Instruments” (“ASC 825”), we use the fair value option for our residential mortgage loans available-for-sale. Election of the fair value option for residential mortgage loans available-for-sale allows a better offset of the changes in fair values of the loans and the derivative instruments used to economically hedge them without having to apply complex hedge accounting provisions. Changes in the fair value of these loans are reflected in revenues as they occur.
Loan origination liabilities
Our mortgage operations may be responsible for losses associated with mortgage loans originated and sold to investors in the event of errors or omissions relating to representations and warranties made by us that the loans met certain requirements, including representations as to underwriting standards, the existence of primary mortgage insurance, and the validity of certain borrower representations in connection with the loan. If a loan is determined to be faulty, we either repurchase the loan from the investors or reimburse the investors' losses (a “make-whole” payment).
In recent years, we experienced a significant increase inEstimating the required liability for these potential losses related to repurchase requests as a result of the high level of loan defaults and related losses in the mortgage industry and increasing aggressiveness by investors in presenting such claims to us. To date, the significant majority of these losses relates to loans originated in 2006 and 2007, during which period inherently riskier loan products became more common in the mortgage origination market. In 2006 and 2007, we originated $39.5 billion of loans, excluding loans originated by Centex's former subprime loan business sold by Centex in 2006. Because we generally do not retain the servicing rights to the loans we originate, information regarding the current and historical performance, credit quality, and outstanding balances of such loans is limited. Estimating these loan origination liabilities is further complicated by uncertainties surrounding numerous external factors, such as various macroeconomic factors (including unemployment rates and changes in home prices), actions taken by third parties, including the parties servicing the loans, and the U.S. federal government in its dual capacity as regulator of the U.S. mortgage industry and conservator of the government-sponsored enterprises commonly known as Fannie Mae and Freddie Mac, which own or guarantee the majority of mortgage loans in the U.S.
Most requests received to date relate to make-whole payments on loans that have been foreclosed. Requests undergo extensive analysis to confirm the exposure, attempt to cure any identified defect, and, when necessary, determine our liability. We establish liabilities for such anticipated losses based upon, among other things, the level of current unresolved repurchase requests, the volume of estimated probable future repurchase requests, our ability to cure the defects identified in the repurchase requests, and the severity of the estimated loss upon repurchase. Determining these estimates and the resulting liability requires a significant level of management judgment. WeDuring 2015 and 2014, we reduced our loan origination liabilities by $11.4 million and $18.6 million, respectively, based on probable settlements of various repurchase requests and current conditions. Reserves provided (released) are generally able to cure or refute over 60% of the requests received from investors such that we do not believe repurchases or make-whole payments will ultimately be required. For those requests that we believe will resultreflected in repurchases or make-whole payments, actual loss severities are expected to approximate 50% of the outstanding principal balance.
During 2012 and 2011, we recorded provisions for losses as a change in estimate primarily to reflect projected claim volumes in excess of previous estimates.Financial Services expenses. Given the ongoing volatility in the mortgage industry, our lack of visibility into the current status of the review process of loans by investors, the claim volumes we continue to experience, changes in values of underlying collateral over time, and other uncertainties regarding the ultimate resolution of these claims, actual costs could differ from our current estimates. For example, if the total number of loans we are required to repurchase is ultimately 10% lower or higher than our current estimates, the amount of future losses could decrease or increase by approximately $13.0 million.
Intangible assets
We have recorded intangible assets related to tradenames acquired with the Centex merger completed in 2009 and the Del Webb merger completed in 2001, which are being amortized over their estimated useful lives. The carrying values and ultimate realization of these assets are dependent upon estimates of future earningscash flows and benefits that we expect to generate from their use. If we determine that the carrying values of intangible assets may not be recoverable based upon the existence of one or more indicators of impairment, we use a projected undiscounted cash flow method to determine if impairment exists. If the carrying values of the intangible assets exceed the expected undiscounted cash flows, then we measure impairment as the difference between the fair value of the asset and the recorded carrying value. To date, no impairments relating to tradenames have been recorded. However, if our expectations of future results and cash flows decrease significantly, or if our strategy related to the use of the intangible assets changes, the related intangible assets may become impaired.
Allowance for warranties
Home purchasers are provided with a limited warranty against certain building defects, including a one-year comprehensive limited warranty and coverage for certain other aspects of the home’s construction and operating systems for periods of up to ten years. We estimate the costs to be incurred under these warranties and record a liability in the amount of such costs at the time product revenue is recognized. Factors that affect our warranty liability include the number of homes sold, historical and anticipated rates of warranty claims, and the cost per claim. We periodically assess the adequacy of our recorded warranty liability for each geographic market in which we operate and adjust the amounts as necessary. Actual warranty costs in the future could differ from our estimates.
Self-insured risks
We maintain, and require our subcontractors to maintain, general liability insurance coverage. We also maintain builders' risk, property, errors and omissions, workers compensation, and other business insurance coverage. These insurance policies protect us against a portion of the risk of loss from claims. However, we retain a significant portion of the overall risk for such claims either through policies issued by our captive insurance subsidiaries or through our own self-insured per occurrence and aggregate retentions, deductibles, and claims in excess of available insurance policy limits.
Our general liability insurance includes coverage for certain construction defects. While construction defect claims can relate to a variety of circumstances, the majority of our claims relate to alleged problems with siding, plumbing, foundations and other concrete work, windows, roofing, and heating, ventilation and air conditioning systems. The availability of general liability insurance for the homebuilding industry and its subcontractors has become increasingly limited, and the insurance policies available require companies to maintain higher per occurrence and aggregate retention levels. In certain instances, we may offer our subcontractors the opportunity to purchase insurance through one of our captive insurance subsidiaries or to participate in a project-specific insurance program provided by the Company. Policies issued by the captive insurance subsidiaries represent self-insurance of these risks by the Company. This self-insured exposure is limited by reinsurance policies that we purchase. General liability coverage for the homebuilding industry is complex, and our coverage varies from policy year to policy year. Our insurance coverage requires a per occurrence deductible up to an overall aggregate retention level. Beginning with the first dollar, amounts paid on insured claims satisfy our per occurrence and aggregate retention obligations. Any amounts incurred in excess of the occurrence or aggregate retention levels are covered by insurance up to our purchased coverage levels. Our insurance policies, including the captive insurance subsidiaries' reinsurance policies, are maintained with highly-rated underwriters for whom we believe counterparty default risk is not significant.
At any point in time, we are managing over 1,000 individual claims related to general liability, property, errors and omission, workers compensation, and other business insurance coverage. We reserve for costs associated with such claims (including expected claims management expenses) on an undiscounted basis at the time product revenue is recognized for each home closing and evaluate the recorded liabilities based on actuarial analyses of our historical claims. The actuarial analyses calculate an estimate of the ultimate net cost of all unpaid losses, including estimates for incurred but not reported losses ("IBNR"). IBNR represents losses related to claims incurred but not yet reported plus development on reported claims. These estimates are subject to a high degree of uncertainty due to a variety of factors, including changes in claims reporting and resolution patterns, third party recoveries, insurance industry practices, the regulatory environment, and legal precedent. State regulations vary, but construction defect claims are reported and resolved over an extended period often exceeding ten years. In certain instances, we have the ability to recover a portion of our costs under various insurance policies or from our subcontractors or other third parties. Estimates of such amounts are recorded when recovery is considered probable.
The recorded reserves include loss estimates related to both (i) existing claims and related claim expenses and (ii) IBNR and related claim expenses. Liabilities related to IBNR and related claim expenses represented approximately 78% and 74% of the total general liability reserves, which represent the vast majority of the total recorded reserves, at December 31, 2013 and 2012, respectively. The actuarial analyses that determine the IBNR portion of reserves consider a variety of factors, including the frequency and severity of losses, which are based on our historical claims experience supplemented by industry data. The actuarial analyses of the reserves also consider historical third party recovery rates and claims management expenses.
Adjustments to estimated reserves are recorded in the period in which the change in estimate occurs. Because the majority of our recorded reserves relates to IBNR, adjustments to reserve amounts for individual existing claims generally do not impact the recorded reserves materially. However, changes in the frequency and timing of reported claims and the estimates of specific claim values can impact the underlying inputs and trends utilized in the actuarial analyses, which could have a material impact on the recorded reserves.
Our recorded reserves for all such claims totaled $668.1 million and $721.3 million at December 31, 2013 and 2012, respectively, the vast majority of which relate to general liability claims. Because of the inherent uncertainty in estimating future losses related to these claims, actual costs could differ significantly from estimated costs. Based on the actuarial analyses performed, we believe the range of reasonably possible losses related to these claims is $600 million to $750 million. While this range represents our best estimate of our ultimate liability related to these claims, due to a variety of factors, including those factors described above, there can be no assurance that the ultimate costs realized by us will fall within this range.
Income taxes
The provision for income taxes is calculated using the asset and liability method, under which deferred tax assets and liabilities are recognized by identifying the temporary differences arising from the different treatment of items for tax and accounting purposes. In assessing the realizability of deferred tax assets, we consider whether it is more likely than not that some portion or all of the deferred tax assets will not be realized. The ultimate realization of deferred tax assets is primarily dependent upon the generation of future taxable income during the periods in which those temporary differences become deductible. In determining the future tax consequences of events that have been recognized in the financial statements or tax returns, judgment
is required. Differences between the anticipated and actual outcomes of these future tax consequences could have a material impact on the consolidated results of operations or financial position.
Unrecognized tax benefits represent the difference between tax positions taken or expected to be taken in a tax return and the benefits recognized for financial statement purposes. We follow the provisions of ASC 740, “Income Taxes” (“ASC 740”), which prescribes a minimum recognition threshold a tax position is required to meet before being recognized in the financial statements. Significant judgment is required to evaluate uncertain tax positions. Our evaluations of tax positions consider a variety of factors, including changes in facts or circumstances, changes in law, correspondence with taxing authorities, and effective settlements of audit issues. Changes in the recognition or measurement of uncertain tax positions could result in material increases or decreases in income tax expense (benefit) in the period in which the change is made. Interest and penalties related to unrecognized tax benefits are recognized as a component of income tax expense (benefit).
Self-insured risks
At any point in time, we are managing over 1,000 individual claims related to general liability, property, errors and omission, workers compensation, and other business insurance coverage. We reserve for costs associated with such claims (including expected claims management expenses) on an undiscounted basis at the time product revenue is recognized for each home closing and periodically evaluate the recorded liabilities based on actuarial analyses of our historical claims. The actuarial analyses calculate an estimate of the ultimate net cost of all unpaid losses, including estimates for incurred but not reported losses ("IBNR"). IBNR represents losses related to claims incurred but not yet reported plus development on reported claims. In certain instances, we have the ability to recover a portion of our costs under various insurance policies or from our subcontractors or other third parties. Estimates of such amounts are recorded when recovery is considered probable.
Housing market conditions have been volatile across most of our markets over the past ten years, and we believe such conditions can affect the frequency and cost of construction defect claims. Additionally, IBNR estimates comprise the majority of our liability and are subject to a high degree of uncertainty due to a variety of factors, including changes in claims reporting and resolution patterns, third party recoveries, insurance industry practices, the regulatory environment, and legal precedent. State regulations vary, but construction defect claims are reported and resolved over an extended period often exceeding ten years. Changes in the frequency and timing of reported claims and estimates of specific claim values can impact the underlying inputs and trends utilized in the actuarial analyses, which could have a material impact on the recorded reserves. Additionally, the amount of insurance coverage available for each policy period also impacts our recorded reserves. Because of the inherent uncertainty in estimating future losses and the timing of such losses related to these claims, actual costs could differ significantly from estimated costs.
Adjustments to reserves are recorded in the period in which the change in estimate occurs. During 2015, we recorded general liability reserve reversals of $32.6 million resulting from a legal settlement and $29.6 million related to changes in our actuarial estimates resulting from favorable claims experience relative to previous actuarial projections. During 2014, we increased general liability insurance reserves by $69.3 million, which was primarily driven by estimated costs associated with siding repairs in certain previously completed communities that, in turn, impacted actuarial estimates for potential future claims.
Our recorded reserves for all such claims totaled $692.1 million and $710.2 million at December 31, 2015 and 2014, respectively, the vast majority of which relate to general liability claims. The recorded reserves include loss estimates related to both (i) existing claims and related claim expenses and (ii) IBNR and related claim expenses. Liabilities related to IBNR and related claim expenses represented approximately 65% and 72% of the total general liability reserves at December 31, 2015 and 2014, respectively. The actuarial analyses that determine the IBNR portion of reserves consider a variety of factors, including the frequency and severity of losses, which are based on our historical claims experience supplemented by industry data. The actuarial analyses of the reserves also consider historical third party recovery rates and claims management expenses. Because of the inherent uncertainty in estimating future losses related to these claims, actual costs could differ significantly from estimated costs. Based on the actuarial analyses performed, we believe the range of reasonably possible losses related to these claims is $625 million to $800 million. While this range represents our best estimate of our ultimate liability related to these claims, due to a variety of factors, including those factors described above, there can be no assurance that the ultimate costs realized by us will fall within this range.
ITEM 7A. QUANTITATIVE AND QUALITATIVE DISCLOSURES ABOUT MARKET RISK
We are subject to market risk on our debt instruments primarily due to fluctuations in interest rates. We utilize both fixed-rate and variable-rate debt. For fixed-rate debt, changes in interest rates generally affect the fair value of the debt instrument but not our earnings or cash flows. Conversely, for variable-rate debt, changes in interest rates generally do not affect the fair value of the debt instrument but could affect our earnings and cash flows. Except in very limited circumstances, we do not have an obligation to prepay fixed-rate debt prior to maturity. As a result, interest rate risk and changes in fair value should not have a significant impact on our rate-sensitive financingsfixed-rate debt until we are required or elect to the extent long-term rates decline. refinance or repurchase such debt.
The following tables set forth as of December 31, 2013 and 2012, our rate-sensitive financing obligations,the principal cash flows by scheduled maturity, weighted-average interest rates, and estimated fair value of our debt obligations as of December 31, 2015 and 2014 ($000’s omitted).
| | | | As of December 31, 2013 for the
Years ending December 31, | As of December 31, 2015 for the
Years ending December 31, |
| | 2014 | | 2015 | | 2016 | | 2017 | | 2018 | | Thereafter | | Total | | Fair
Value | 2016 | | 2017 | | 2018 | | 2019 | | 2020 | | Thereafter | | Total | | Fair
Value |
| Rate-sensitive liabilities: | | | | | | | | | | | | | | | | | | | | | | | | | | | | | | |
| Fixed interest rate debt: | | | | | | | | | | | | | | | | |
| Senior notes | $ | — |
| | $ | 333,647 |
| | $ | 465,245 |
| | $ | 123,000 |
| | $ | — |
| | $ | 1,150,000 |
| | $ | 2,071,892 |
| | $ | 2,070,744 |
| |
| Fixed rate debt | | $ | 487,485 |
| | $ | 128,296 |
| | $ | — |
| | $ | 3,900 |
| | $ | 3,900 |
| | $ | 1,000,000 |
| | $ | 1,623,581 |
| | $ | 1,678,987 |
|
| Average interest rate | | 6.24 | % | | 7.00 | % | | — | % | | 5.00 | % | | 5.00 | % | | 6.71 | % | | 6.57 | % | | |
| | | | | | | | | | | | | | | | | |
Variable rate debt (a) | | $ | 267,877 |
| | $ | 500,000 |
| | $ | — |
| | $ | — |
| | $ | — |
| | $ | — |
| | $ | 767,877 |
| | $ | 767,877 |
|
| Average interest rate | — | % | | 5.24 | % | | 6.50 | % | | 7.63 | % | | — | % | | 6.80 | % | | 6.53 | % | | | 2.65 | % | | 1.42 | % | | — | % | | — | % | | — | % | | — | % | | 1.85 | % | | |
| | | | | | | | | | | | | | | | | | | | | | | | | | | | | | | |
| | As of December 31, 2012 for the
Years ending December 31, | As of December 31, 2014 for the
Years ending December 31, |
| | 2013 | | 2014 | | 2015 | | 2016 | | 2017 | | Thereafter | | Total | | Fair
Value | 2015 | | 2016 | | 2017 | | 2018 | | 2019 | | Thereafter | | Total | | Fair
Value |
| Rate-sensitive liabilities: | | | | | | | | | | | | | | | | | | | | | | | | | | | | | | |
| Fixed interest rate debt: | | | | | | | | | | | | | | | | |
| Senior notes | $ | — |
| | $ | 398,852 |
| | $ | 369,222 |
| | $ | 465,245 |
| | $ | 150,000 |
| | $ | 1,150,000 |
| | $ | 2,533,319 |
| | $ | 2,663,451 |
| |
| Fixed rate debt | | $ | 239,203 |
| | $ | 488,610 |
| | $ | 129,433 |
| | $ | — |
| | $ | 3,900 |
| | $ | 1,003,900 |
| | $ | 1,865,046 |
| | $ | 1,975,029 |
|
| Average interest rate | — | % | | 5.49 | % | | 5.24 | % | | 6.50 | % | | 7.63 | % | | 6.80 | % | | 6.36 | % | | | 5.22 | % | | 6.24 | % | | 7.44 | % | | — | % | | 5.00 | % | | 6.71 | % | | 6.44 | % | | |
| | | | | | | | | | | | | | | | | |
Variable rate debt (a) | | $ | 140,241 |
| | $ | — |
| | $ | — |
| | $ | — |
| | $ | — |
| | $ | — |
| | $ | 140,241 |
| | $ | 140,241 |
|
| Average interest rate | | 2.70 | % | | — | % | | — | % | | — | % | | — | % | | — | % | | 2.70 | % | | |
(a) Includes the Pulte Mortgage Repurchase Agreement and the Term Loan. Does not include our Revolving Credit Facility, under which there were no borrowings outstanding at either December 31, 2015 or 2014.
Derivative instruments and hedging activities
Pulte Mortgage is exposed to market risks from commitments to lend, movements in interest rates, and canceled or modified commitments to lend. A commitment to lend at a specific interest rate (an interest rate lock commitment) is a derivative financial instrument (interest rate is locked to the borrower). The interest rate risk continues through the loan closing and until the loan is sold to an investor. We are generally not exposed to variability in cash flows of derivative instruments for more than approximately 75 days. In periods of rising interest rates, the length of exposure will generally increase due to customers locking in an interest rate sooner as opposed to letting the interest rate float. In periods of low or decreasing interest rates, the length of exposure will also generally increase as customers desire to lock before the possibility of rising rates.
In order to reduce these risks, we use other derivative financial instruments, principally cash forward placement contracts on mortgage-backed securities and whole loan investor commitments, to economically hedge the interest rate lock commitment. We generally enter into one of the aforementioned derivative financial instruments upon accepting interest rate lock commitments. Changes in the fair value of interest rate lock commitments and the other derivative financial instruments are recognized in Financial Services revenues. We do not use any derivative financial instruments for trading purposes.
At December 31, 2015 and 2014, residential mortgage loans available-for-sale had an aggregate fair value of $442.7 million and $339.5 million, respectively. At December 31, 2015 and 2014, we had aggregate interest rate lock commitments of $208.2 million and $146.1 million, respectively, which were originated at interest rates prevailing at the date of commitment. Unexpired forward contracts totaled $525.0 million and $371.0 million at December 31, 2015 and 2014, respectively, and
whole loan investor commitments totaled $77.6 million and $63.5 million, respectively, at such dates. Hypothetical changes in the fair values of our financial instruments arising from immediate parallel shifts in long-term mortgage rates of 50, 100, and 150 basis points would not be material to our financial results.results due to the offsetting nature in the movements in fair value of our financial instruments.
SPECIAL NOTES CONCERNING FORWARD-LOOKING STATEMENTS
As a cautionary note, except for the historical information contained herein, certain matters discussed in Item 7, Management's Discussion and Analysis of Financial Condition and Results of Operations, and Item 7a, Quantitative and Qualitative Disclosures About Market Risk, are “forward-looking” statements within the meaning of the Private Securities Litigation Reform Act of 1995. Such forward-looking statements are subject to a number of risks, uncertainties and other factors that could cause our actual results, performance, prospects or opportunities, as well as those of the markets we serve or intend to serve, to differ materially from those expressed in, or implied by, these statements. You can identify these statements by the fact that they do not relate to matters of a strictly factual or historical nature and generally discuss or relate to forecasts, estimates or other expectations regarding future events. Generally, the words “believe,” “expect,” “intend,” “estimate,” “anticipate,” “project,” “may,” “can,” “could,” “might,” “will” and similar expressions identify forward-looking statements, including statements related to expected operating and performing results, planned transactions, planned objectives of management, future developments or conditions in the industries in which we participate and other trends, developments and uncertainties that may affect our business in the future.
Such risks, uncertainties and other factors include, among other things: interest rate changes and the availability of mortgage financing; continued volatility in the debt and equity markets; competition within the industries in which we operate; the availability and cost of land and other raw materials used by us in our homebuilding operations; the impact of any changes to our strategy in responding to the cyclical nature of the industry, including any changes regarding our land positions; the availability and cost of insurance covering risks associated with our businesses; shortages and the cost of labor; weather related slowdowns; slow growth initiatives and/or local building moratoria; governmental regulation directed at or affecting the housing market, the homebuilding industry or construction activities; uncertainty in the mortgage lending industry, including revisions to underwriting standards and repurchase requirements associated with the sale of mortgage loans; the interpretation of or changes to tax, labor and environmental laws; economic changes nationally or in our local markets, including inflation, deflation, changes in consumer confidence and preferences and the state of the market for homes in general; legal or regulatory proceedings or claims; our ability to generate sufficient cash flow in order to successfully implement our capital allocation priorities; required accounting changes; terrorist acts and other acts of war; and other factors of national, regional and global scale, including those of a political, economic, business and competitive nature. See Item 1A – Risk Factors for a further discussion of these and other risks and uncertainties applicable to our businesses. We undertake no duty to update any forward-looking statement, whether as a result of new information, future events or changes in our expectations.
ITEM 8. FINANCIAL STATEMENTS AND SUPPLEMENTARY DATA
PULTEGROUP, INC.
CONSOLIDATED BALANCE SHEETS
December 31, 20132015 and 20122014
($000’s omitted, except per share data)
| | | | 2013 | | 2012 | 2015 | | 2014 |
| ASSETS | | | | | | |
| Cash and equivalents | $ | 1,580,329 |
| | $ | 1,404,760 |
| $ | 754,161 |
| | $ | 1,292,862 |
|
| Restricted cash | 72,715 |
| | 71,950 |
| 21,274 |
| | 16,358 |
|
| House and land inventory | 3,978,561 |
| | 4,214,046 |
| 5,450,058 |
| | 4,392,100 |
|
| Land held for sale | 61,735 |
| | 91,104 |
| 81,492 |
| | 101,190 |
|
| Land, not owned, under option agreements | 24,024 |
| | 31,066 |
| |
| Residential mortgage loans available-for-sale | 287,933 |
| | 318,931 |
| 442,715 |
| | 339,531 |
|
| Investments in unconsolidated entities | 45,323 |
| | 45,629 |
| 41,267 |
| | 40,368 |
|
| Other assets | 460,621 |
| | 407,675 |
| 671,099 |
| | 543,218 |
|
| Intangible assets | 136,148 |
| | 149,248 |
| 110,215 |
| | 123,115 |
|
| Deferred tax assets, net | 2,086,754 |
| | — |
| 1,394,879 |
| | 1,720,668 |
|
| | $ | 8,734,143 |
| | $ | 6,734,409 |
| $ | 8,967,160 |
| | $ | 8,569,410 |
|
| LIABILITIES AND SHAREHOLDERS’ EQUITY | | | | | | |
| Liabilities: | | | | | | |
| Accounts payable, including book overdrafts of $35,827 and $42,053 in 2013 and 2012, respectively | $ | 202,736 |
| | $ | 178,274 |
| |
| Accounts payable, including book overdrafts of $60,547 and $32,586 in 2015 and 2014, respectively | | $ | 327,725 |
| | $ | 270,516 |
|
| Customer deposits | 134,858 |
| | 101,183 |
| 186,141 |
| | 142,642 |
|
| Accrued and other liabilities | 1,377,750 |
| | 1,418,063 |
| 1,284,273 |
| | 1,343,774 |
|
| Income tax liabilities | 206,015 |
| | 198,865 |
| 57,050 |
| | 48,722 |
|
| Financial Services debt | 105,664 |
| | 138,795 |
| 267,877 |
| | 140,241 |
|
| Term loan | | 500,000 |
| | — |
|
| Senior notes | 2,058,168 |
| | 2,509,613 |
| 1,584,769 |
| | 1,818,561 |
|
| Total liabilities | 4,085,191 |
| | 4,544,793 |
| 4,207,835 |
| | 3,764,456 |
|
| Shareholders’ equity: | | | | | | |
| Preferred stock, $0.01 par value; 25,000,000 shares authorized, none issued | $ | — |
| | $ | — |
| $ | — |
| | $ | — |
|
| Common stock, $0.01 par value; 500,000,000 shares authorized, 381,299,600 and 386,608,436 shares issued and outstanding at December 31, 2013 and 2012, respectively | 3,813 |
| | 3,866 |
| |
| Common stock, $0.01 par value; 500,000,000 shares authorized, 349,148,351 and 369,458,530 shares issued and outstanding at December 31, 2015 and 2014, respectively | | 3,491 |
| | 3,695 |
|
| Additional paid-in capital | 3,052,016 |
| | 3,030,889 |
| 3,093,802 |
| | 3,072,996 |
|
| Accumulated other comprehensive loss | (795 | ) | | (992 | ) | (609 | ) | | (690 | ) |
| Retained earnings (accumulated deficit) | 1,593,918 |
| | (844,147 | ) | |
| Retained earnings | | 1,662,641 |
| | 1,728,953 |
|
| Total shareholders’ equity | 4,648,952 |
| | 2,189,616 |
| 4,759,325 |
| | 4,804,954 |
|
| | $ | 8,734,143 |
| | $ | 6,734,409 |
| $ | 8,967,160 |
| | $ | 8,569,410 |
|
See Notes to Consolidated Financial Statements.
PULTEGROUP, INC.
CONSOLIDATED STATEMENTS OF OPERATIONS
For the years ended December 31, 20132015, 20122014, and 20112013
(000’s omitted, except per share data)
| | | | 2013 | | 2012 | | 2011 | 2015 | | 2014 | | 2013 |
| Revenues: | | | | | | | | | | |
| Homebuilding | | | | | | | | | | |
| Home sale revenues | $ | 5,424,309 |
| | $ | 4,552,412 |
| | $ | 3,950,743 |
| $ | 5,792,675 |
| | $ | 5,662,171 |
| | $ | 5,424,309 |
|
| Land sale revenues | 114,335 |
| | 106,698 |
| | 82,853 |
| 48,536 |
| | 34,554 |
| | 114,335 |
|
| | 5,538,644 |
| | 4,659,110 |
| | 4,033,596 |
| 5,841,211 |
| | 5,696,725 |
| | 5,538,644 |
|
| Financial Services | 140,951 |
| | 160,888 |
| | 103,094 |
| 140,753 |
| | 125,638 |
| | 140,951 |
|
| Total revenues | 5,679,595 |
| | 4,819,998 |
| | 4,136,690 |
| 5,981,964 |
| | 5,822,363 |
| | 5,679,595 |
|
| Homebuilding Cost of Revenues: | | | | | | | | | | |
| Home sale cost of revenues | 4,310,528 |
| | 3,833,451 |
| | 3,444,398 |
| 4,440,893 |
| | 4,343,249 |
| | 4,310,528 |
|
| Land sale cost of revenues | 104,426 |
| | 94,880 |
| | 59,279 |
| 35,858 |
| | 23,748 |
| | 104,426 |
|
| | 4,414,954 |
| | 3,928,331 |
| | 3,503,677 |
| 4,476,751 |
| | 4,366,997 |
| | 4,414,954 |
|
| Financial Services expenses | 92,379 |
| | 135,511 |
| | 137,666 |
| 82,047 |
| | 71,057 |
| | 92,242 |
|
| Selling, general, and administrative expenses | 568,500 |
| | 514,457 |
| | 519,583 |
| 589,780 |
| | 667,815 |
| | 568,500 |
|
| Other expense, net | 80,753 |
| | 66,298 |
| | 293,102 |
| 17,363 |
| | 26,736 |
| | 76,077 |
|
| Interest income | (4,395 | ) | | (4,913 | ) | | (5,055 | ) | |
| Interest expense | 712 |
| | 819 |
| | 1,313 |
| |
| Equity in earnings of unconsolidated entities | (1,130 | ) | | (4,059 | ) | | (3,296 | ) | |
| Income (loss) before income taxes | 527,822 |
| | 183,554 |
| | (310,300 | ) | |
| Income before income taxes | | 816,023 |
| | 689,758 |
| | 527,822 |
|
| Income tax expense (benefit) | (2,092,294 | ) | | (22,591 | ) | | (99,912 | ) | 321,933 |
| | 215,420 |
| | (2,092,294 | ) |
| Net income (loss) | $ | 2,620,116 |
| | $ | 206,145 |
| | $ | (210,388 | ) | |
| Net income | | $ | 494,090 |
| | $ | 474,338 |
| | $ | 2,620,116 |
|
| | | | | | |
| |
| |
|
| Net income (loss) per share: | | | | | | |
| Net income per share: | | | | | | |
| Basic | $ | 6.79 |
| | $ | 0.54 |
| | $ | (0.55 | ) | $ | 1.38 |
| | $ | 1.27 |
| | $ | 6.79 |
|
| Diluted | $ | 6.72 |
| | $ | 0.54 |
| | $ | (0.55 | ) | $ | 1.36 |
| | $ | 1.26 |
| | $ | 6.72 |
|
| Cash dividends declared | $ | 0.15 |
| | $ | — |
| | $ | — |
| $ | 0.33 |
| | $ | 0.23 |
| | $ | 0.15 |
|
| | | | | | | | | | | |
| Number of shares used in calculation: | | | | | | | | | | |
| Basic | 383,077 |
| | 381,562 |
| | 379,877 |
| 356,576 |
| | 370,377 |
| | 383,077 |
|
| Effect of dilutive securities | 3,789 |
| | 3,002 |
| | — |
| 3,217 |
| | 3,725 |
| | 3,789 |
|
| Diluted | 386,866 |
| | 384,564 |
| | 379,877 |
| 359,793 |
| | 374,102 |
| | 386,866 |
|
See Notes to Consolidated Financial Statements.
PULTEGROUP, INC.
CONSOLIDATED STATEMENTS OF COMPREHENSIVE INCOME (LOSS)
For the years ended December 31, 20132015, 20122014, and 20112013
(000’s omitted)
|
| | | | | | | | | | | |
| | 2013 | | 2012 | | 2011 |
| Net income (loss) | $ | 2,620,116 |
| | $ | 206,145 |
| | $ | (210,388 | ) |
| | | | | | |
| Other comprehensive income, net of tax: | | | | | |
| Change in fair value of derivatives | 197 |
| | 314 |
| | 213 |
|
| Other comprehensive income | 197 |
| | 314 |
| | 213 |
|
| | | | | | |
| Comprehensive income (loss) | $ | 2,620,313 |
| | $ | 206,459 |
| | $ | (210,175 | ) |
|
| | | | | | | | | | | |
| | 2015 | | 2014 | | 2013 |
| Net income | $ | 494,090 |
| | $ | 474,338 |
| | $ | 2,620,116 |
|
| | | | | | |
| Other comprehensive income, net of tax: | | | | | |
| Change in value of derivatives | 81 |
| | 105 |
| | 197 |
|
| Other comprehensive income | 81 |
| | 105 |
| | 197 |
|
| | | | | | |
| Comprehensive income | $ | 494,171 |
| | $ | 474,443 |
| | $ | 2,620,313 |
|
See Notes to Consolidated Financial Statements.
PULTEGROUP, INC.
CONSOLIDATED STATEMENTS OF SHAREHOLDERS’ EQUITY
For the years ended December 31, 20132015, 20122014, and 20112013
(000’s omitted, except per share data)
|
| | | | | | | | | | | | | | | | | | | | | | |
| | Common Stock | | Additional Paid-in Capital | | Accumulated Other Comprehensive Income (Loss) | | Retained Earnings (Accumulated Deficit) | | Total |
| Shares | | $ | |
| Shareholders' Equity, January 1, 2011 | 382,028 |
| | $ | 3,820 |
| | $ | 2,972,919 |
| | $ | (1,519 | ) | | $ | (840,053 | ) | | $ | 2,135,167 |
|
| Stock option exercises |
|
| |
|
| |
|
| | — |
| | — |
| | — |
|
| Stock awards, net of cancellations | 944 |
| | 10 |
| | (10 | ) | | — |
| | — |
| | — |
|
| Stock repurchases | (364 | ) | | (4 | ) | | (3,128 | ) | | — |
| | 296 |
| | (2,836 | ) |
| Stock-based compensation | — |
| | — |
| | 16,459 |
| | — |
| | — |
| | 16,459 |
|
| Net income (loss) | — |
| | — |
| | — |
| | — |
| | (210,388 | ) | | (210,388 | ) |
| Other comprehensive income | — |
| | — |
| | — |
| | 213 |
| | — |
| | 213 |
|
| Shareholders' Equity, December 31, 2011 | 382,608 |
| | $ | 3,826 |
| | $ | 2,986,240 |
| | $ | (1,306 | ) | | $ | (1,050,145 | ) | | $ | 1,938,615 |
|
| Stock option exercises | 2,877 |
| | 29 |
| | 32,780 |
| | — |
| | — |
| | 32,809 |
|
| Stock awards, net of cancellations | 1,228 |
| | 12 |
| | (12 | ) | | — |
| | — |
| | — |
|
| Stock repurchases | (105 | ) | | (1 | ) | | (813 | ) | | — |
| | (147 | ) | | (961 | ) |
| Stock-based compensation | — |
| | — |
| | 12,694 |
| | — |
| | — |
| | 12,694 |
|
| Net income (loss) | — |
| | — |
| | — |
| | — |
| | 206,145 |
| | 206,145 |
|
| Other comprehensive income | — |
| | — |
| | — |
| | 314 |
| | — |
| | 314 |
|
| Shareholders' Equity, December 31, 2012 | 386,608 |
| | $ | 3,866 |
| | $ | 3,030,889 |
| | $ | (992 | ) | | $ | (844,147 | ) | | $ | 2,189,616 |
|
| Stock option exercises | 1,432 |
| | 14 |
| | 19,397 |
| | — |
| | — |
| | 19,411 |
|
| Stock awards, net of cancellations | 1,002 |
| | 10 |
| | (10 | ) | | — |
| | — |
| | — |
|
| Dividends declared | — |
| | — |
| | — |
| | — |
| | (57,530 | ) | | (57,530 | ) |
| Stock repurchases | (7,742 | ) | | (77 | ) | | (3,063 | ) | | — |
| | (124,521 | ) | | (127,661 | ) |
| Stock-based compensation | — |
| |
|
| | 14,474 |
| | — |
| | — |
| | 14,474 |
|
| Excess tax benefits (deficiencies) from stock-based compensation |
| |
| | (9,671 | ) | |
| |
| | (9,671 | ) |
| Net income (loss) | — |
| | — |
| | — |
| | — |
| | 2,620,116 |
| | 2,620,116 |
|
| Other comprehensive income | — |
| | — |
| | — |
| | 197 |
| | — |
| | 197 |
|
| Shareholders' Equity, December 31, 2013 | 381,300 |
| | $ | 3,813 |
| | $ | 3,052,016 |
| | $ | (795 | ) | | $ | 1,593,918 |
| | $ | 4,648,952 |
|
|
| | | | | | | | | | | | | | | | | | | | | | |
| | Common Stock | | Additional Paid-in Capital | | Accumulated Other Comprehensive Income (Loss) | | Retained Earnings (Accumulated Deficit) | | Total |
| Shares | | $ | |
| Shareholders' Equity, January 1, 2013 | 386,608 |
| | $ | 3,866 |
| | $ | 3,030,889 |
| | $ | (992 | ) | | $ | (844,147 | ) | | $ | 2,189,616 |
|
| Stock option exercises | 1,432 |
| | 14 |
| | 19,397 |
| | — |
| | — |
| | 19,411 |
|
| Share issuances, net of cancellations | 1,002 |
| | 10 |
| | (10 | ) | | — |
| | — |
| | — |
|
| Dividends declared | — |
| | — |
| | — |
| | — |
| | (57,530 | ) | | (57,530 | ) |
| Share repurchases | (7,742 | ) | | (77 | ) | | (3,063 | ) | | — |
| | (124,521 | ) | | (127,661 | ) |
| Share-based compensation | — |
| | — |
| | 14,474 |
| | — |
| | — |
| | 14,474 |
|
| Excess tax benefits (deficiencies) from share-based compensation | — |
| | — |
| | (9,671 | ) | | — |
| | — |
| | (9,671 | ) |
| Net income | — |
| | — |
| | — |
| | — |
| | 2,620,116 |
| | 2,620,116 |
|
| Other comprehensive income | — |
| | — |
| | — |
| | 197 |
| | — |
| | 197 |
|
| Shareholders' Equity, December 31, 2013 | 381,300 |
| | $ | 3,813 |
| | $ | 3,052,016 |
| | $ | (795 | ) | | $ | 1,593,918 |
| | $ | 4,648,952 |
|
| Stock option exercises | 1,422 |
| | 14 |
| | 15,613 |
| | — |
| | — |
| | 15,627 |
|
| Share issuances, net of cancellations | (43 | ) | | — |
| | — |
| | — |
| | — |
| | — |
|
| Dividends declared | — |
| | — |
| | 72 |
| | — |
| | (86,442 | ) | | (86,370 | ) |
| Share repurchases | (13,220 | ) | | (132 | ) | | — |
| | — |
| | (252,887 | ) | | (253,019 | ) |
| Share-based compensation | — |
| | — |
| | 13,786 |
| | — |
| | 26 |
| | 13,812 |
|
| Excess tax benefits (deficiencies) from share-based compensation | — |
| | — |
| | (8,491 | ) | | — |
| | — |
| | (8,491 | ) |
| Net income | — |
| | — |
| | — |
| | — |
| | 474,338 |
| | 474,338 |
|
| Other comprehensive income | — |
| | — |
| | — |
| | 105 |
| | — |
| | 105 |
|
| Shareholders' Equity, December 31, 2014 | 369,459 |
| | $ | 3,695 |
| | $ | 3,072,996 |
| | $ | (690 | ) | | $ | 1,728,953 |
| | $ | 4,804,954 |
|
| Stock option exercises | 904 |
| | 9 |
| | 10,525 |
| | — |
| | — |
| | 10,534 |
|
| Share issuances, net of cancellations | 428 |
| | 4 |
| | 7,420 |
| | — |
| |
|
| | 7,424 |
|
| Dividends declared | — |
| | — |
| | 8 |
| | — |
| | (117,881 | ) | | (117,873 | ) |
| Share repurchases | (21,642 | ) | | (217 | ) | | — |
| | — |
| | (442,521 | ) | | (442,738 | ) |
| Share-based compensation | — |
| | — |
| | 16,888 |
| | — |
| | — |
| | 16,888 |
|
| Excess tax benefits (deficiencies) from share-based compensation | — |
| | — |
| | (14,035 | ) | | — |
| | — |
| | (14,035 | ) |
| Net income | — |
| | — |
| | — |
| | — |
| | 494,090 |
| | 494,090 |
|
| Other comprehensive income | — |
| | — |
| | — |
| | 81 |
| | — |
| | 81 |
|
| Shareholders' Equity, December 31, 2015 | 349,149 |
| | $ | 3,491 |
| | $ | 3,093,802 |
| | $ | (609 | ) | | $ | 1,662,641 |
| | $ | 4,759,325 |
|
See Notes to Consolidated Financial Statements.
PULTEGROUP, INC.
CONSOLIDATED STATEMENTS OF CASH FLOWS
For the years ended December 31, 20132015, 20122014, and 20112013
($000’s omitted)
| | | | 2013 | | 2012 | | 2011 | 2015 | | 2014 | | 2013 |
| Cash flows from operating activities: | | | | | | | | | | |
| Net income (loss) | $ | 2,620,116 |
| | $ | 206,145 |
| | $ | (210,388 | ) | |
Adjustments to reconcile net income (loss) to net cash flows provided by (used in) operating activities: | | | | | | |
| Deferred income taxes | (2,096,425 | ) | | — |
| | — |
| |
| Net income | | $ | 494,090 |
| | $ | 474,338 |
| | $ | 2,620,116 |
|
| Adjustments to reconcile net income to net cash from operating activities: | | | | | | |
| Deferred income tax expense (benefit) | | 311,699 |
| | 223,769 |
| | (2,096,425 | ) |
| Write-down of land and deposits and pre-acquisition costs | 9,672 |
| | 17,195 |
| | 35,786 |
| 11,467 |
| | 11,168 |
| | 9,672 |
|
| Goodwill impairments | — |
| | — |
| | 240,541 |
| |
| Depreciation and amortization | 31,587 |
| | 30,027 |
| | 32,098 |
| 46,222 |
| | 39,864 |
| | 31,587 |
|
| Stock-based compensation expense | 30,480 |
| | 22,897 |
| | 16,970 |
| |
| Share-based compensation expense | | 24,752 |
| | 29,292 |
| | 30,480 |
|
| Loss on debt retirements | 26,930 |
| | 32,071 |
| | 5,638 |
| — |
| | 8,584 |
| | 26,930 |
|
| Equity in earnings of unconsolidated entities | (1,130 | ) | | (4,059 | ) | | (3,296 | ) | |
| Distributions of earnings from unconsolidated entities | 2,049 |
| | 7,488 |
| | 7,083 |
| |
| Other non-cash, net | 9,375 |
| | 10,356 |
| | 12,188 |
| |
| Other, net | | 5,605 |
| | 6,091 |
| | 10,294 |
|
| Increase (decrease) in cash due to: | | | | | | | | | | |
| Restricted cash | 3,387 |
| | 1,257 |
| | 5,940 |
| (8,626 | ) | | 1,368 |
| | 3,387 |
|
| Inventories | 265,064 |
| | 455,223 |
| | 54,891 |
| (927,768 | ) | | (346,596 | ) | | 265,064 |
|
| Residential mortgage loans available-for-sale | 28,448 |
| | (60,828 | ) | | (82,113 | ) | (104,609 | ) | | (53,734 | ) | | 28,448 |
|
| Other assets | (38,190 | ) | | 26,014 |
| | 182,471 |
| (177,063 | ) | | (46,249 | ) | | (38,190 | ) |
| Accounts payable, accrued and other liabilities | (17,377 | ) | | 20,802 |
| | (189,435 | ) | (23,898 | ) | | (38,646 | ) | | (10,227 | ) |
| Income tax liabilities | 7,150 |
| | (4,448 | ) | | (91,095 | ) | |
| Net cash provided by (used in) operating activities | 881,136 |
| | 760,140 |
| | 17,279 |
| (348,129 | ) | | 309,249 |
| | 881,136 |
|
| Cash flows from investing activities: | | | | | | | | | | |
| Distributions from unconsolidated entities | 1,001 |
| | 3,029 |
| | 4,531 |
| |
| Investments in unconsolidated entities | (1,677 | ) | | (16,456 | ) | | (4,603 | ) | |
| Net change in loans held for investment | (12,265 | ) | | 836 |
| | 325 |
| 8,664 |
| | 335 |
| | (12,265 | ) |
| Change in restricted cash related to letters of credit | (4,152 | ) | | 28,653 |
| | (83,199 | ) | 3,710 |
| | 54,989 |
| | (4,152 | ) |
| Proceeds from the sale of property and equipment | 15 |
| | 7,586 |
| | 10,555 |
| |
| Capital expenditures | (28,899 | ) | | (13,942 | ) | | (21,238 | ) | (45,440 | ) | | (48,790 | ) | | (28,899 | ) |
| Net cash provided by (used in) investing activities | (45,977 | ) | | 9,706 |
| | (93,629 | ) | |
| Cash used for business acquisition | | — |
| | (82,419 | ) | | — |
|
| Other investing activities, net | | 2,212 |
| | 8,261 |
| | (661 | ) |
| Net cash used in investing activities | | (30,854 | ) | | (67,624 | ) | | (45,977 | ) |
| Cash flows from financing activities: | | | | | | | | | | |
| Proceeds from debt issuance | | 500,000 |
| | — |
| | — |
|
Repayments of debt
| | (239,193 | ) | | (250,631 | ) | | (479,827 | ) |
| Borrowings under revolving credit facility | | 125,000 |
| | — |
| | — |
|
| Repayments under revolving credit facility | | (125,000 | ) | | — |
| | — |
|
| Financial Services borrowings (repayments) | (33,131 | ) | | 138,795 |
| | — |
| 127,636 |
| | 34,577 |
| | (33,131 | ) |
| Other borrowings (repayments) | (479,827 | ) | | (618,800 | ) | | (321,133 | ) | |
| Stock option exercises | 19,411 |
| | 32,809 |
| | — |
| 10,535 |
| | 15,627 |
| | 19,411 |
|
| Stock repurchases | (127,661 | ) | | (961 | ) | | (2,836 | ) | |
| Share repurchases | | (442,738 | ) | | (253,019 | ) | | (127,661 | ) |
| Dividends paid | (38,382 | ) | | — |
| | — |
| (115,958 | ) | | (75,646 | ) | | (38,382 | ) |
| Net cash provided by (used in) financing activities | (659,590 | ) | | (448,157 | ) | | (323,969 | ) | |
| Net cash used in financing activities | | (159,718 | ) | | (529,092 | ) | | (659,590 | ) |
| Net increase (decrease) in cash and equivalents | 175,569 |
| | 321,689 |
| | (400,319 | ) | (538,701 | ) | | (287,467 | ) | | 175,569 |
|
| Cash and equivalents at beginning of period | 1,404,760 |
| | 1,083,071 |
| | 1,483,390 |
| 1,292,862 |
| | 1,580,329 |
| | 1,404,760 |
|
| Cash and equivalents at end of period | $ | 1,580,329 |
| | $ | 1,404,760 |
| | $ | 1,083,071 |
| $ | 754,161 |
| | $ | 1,292,862 |
| | $ | 1,580,329 |
|
| Supplemental Cash Flow Information: | | | | | | | | | | |
| Interest paid (capitalized), net | $ | (171 | ) | | $ | (1,470 | ) | | $ | (9,623 | ) | $ | (4,193 | ) | | $ | (4,561 | ) | | $ | (171 | ) |
| Income taxes paid (refunded), net | $ | 373 |
| | $ | (13,322 | ) | | $ | (62,167 | ) | $ | (5,654 | ) | | $ | 1,030 |
| | $ | 373 |
|
See Notes to Consolidated Financial Statements.
PULTEGROUP, INC.
NOTES TO CONSOLIDATED FINANCIAL STATEMENTS
1. Summary of significant accounting policies
Basis of presentation
PulteGroup, Inc. is one of the largest homebuilders in the U.S., and our common stock trades on the New York Stock Exchange under the ticker symbol “PHM”. Unless the context otherwise requires, the terms "PulteGroup", the "Company", "we", "us", and "our" used herein refer to PulteGroup, Inc. and its subsidiaries. While our subsidiaries engage primarily in the homebuilding business, we also have mortgage banking operations, conducted principally through Pulte Mortgage LLC (“Pulte Mortgage”), and title operations.
The consolidated financial statements have been prepared in accordance with U.S. generally accepted accounting principles and include the accounts of PulteGroup, Inc. and all of its direct and indirect subsidiaries and variable interest entities in which PulteGroup, Inc. is deemed to be the primary beneficiary. All significant intercompany accounts, transactions, and balances have been eliminated in consolidation.
Business acquisitions
We acquired certain real estate assets from Dominion Homes in August 2014 for $82.4 million in cash and the assumption of certain payables related to such assets. The net assets acquired were located primarily in Columbus, Ohio, and Louisville, Kentucky, and included approximately 8,200 lots, including approximately 400 homes in inventory and control of approximately 900 lots through land option contracts. We also assumed a sales order backlog of 622 homes. The acquired net assets were recorded at their estimated fair values. The acquisition of these assets was not material to our results of operations or financial condition.
We acquired substantially all of the assets of JW Homes, including the brand John Wieland Homes and Neighborhoods, in a series of transactions in January 2016 for approximately $430.0 million in cash (of which approximately $13.0 million is expected to be paid subsequent to January 2016) and the assumption of certain payables related to such assets. The net assets acquired were located primarily in Atlanta, Charleston, Charlotte, Nashville, and Raleigh and included approximately 7,000 lots, including approximately 400 homes in inventory and control of approximately 1,300 lots through land option contracts. We also assumed a sales order backlog of approximately 300 homes. The acquired net assets will be recorded at their estimated fair values. The acquisition of these assets is not expected to have a material impact on our results of operations or financial condition.
Use of estimates
The preparation of financial statements in conformity with U.S. generally accepted accounting principles requires management to make estimates and assumptions that affect the amounts reported in the financial statements and accompanying notes. Actual results could differ from those estimates.
Reclassifications
Certain prior period amounts have been reclassified to conform to the current year presentation.
Subsequent events
We evaluated subsequent events up until the time the financial statements were filed with the Securities and Exchange Commission ("SEC").
Cash and equivalents
Cash and equivalents include institutional money market investments and time deposits with a maturity of three months or less when acquired. Cash and equivalents at December 31, 20132015 and 20122014 also included $3.7$27.5 million and $8.15.1 million, respectively, of cash from home closings held in escrow for our benefit, typically for less than five days, which are considered deposits in-transit.
PULTEGROUP, INC.
NOTES TO CONSOLIDATED FINANCIAL STATEMENTS (continued)
Restricted cash
We maintain certain cash balances that are restricted as to their use. Restricted cash consists primarily of deposits maintained with financial institutions under certain cash-collateralized letter of credit agreements (see Note 7). The remaining balances relate to certain other accounts with restrictions,use, including customer deposits on home sales that are temporarily restricted by regulatory requirements until title transfers to the homebuyer.
Investments in unconsolidated entities
We have investments in a number of unconsolidated entities, including joint ventures, with independent third parties. Some of these unconsolidated entities purchase, develop, and/or sell land and homes. The equity method of accounting is used for unconsolidated entities over which we have significant influence; generally this represents ownership interests of at least 20% and not more than 50%. Under the equity method of accounting, we recognize our proportionate share of the profitsearnings and losses of these entities. Certain of these entities sell land to us. In these situations, weWe defer the recognition of profits from such activities until the time we ultimately sell the related homes are sold. The cost method of accounting is used for investments in which we have less than a 20% ownership interest and do not have the ability to exercise significant influence.land.
PULTEGROUP, INC.
NOTES TO CONSOLIDATED FINANCIAL STATEMENTS (continued)
We evaluate our investments in unconsolidated entities for recoverability in accordance with Accounting Standards Codification (“ASC”) 323, “Investments – Equity Method and Joint Ventures” (“ASC 323”). If we determine that a loss in the value of the investment is other than temporary, we write down the investment to its estimated fair value. Any such losses are recorded to equity in (earnings) loss of unconsolidated entities in the Consolidated Statements of Operations. Additionally, each unconsolidated entity evaluates its long-lived assets, such as inventory, for recoverability in accordance with ASC 360-10, “Property, Plant, and Equipment – Impairment or Disposal of Long-Lived Assets” (“ASC 360-10”). Our proportionate share of any such impairments is also recorded to equity in (earnings) loss of unconsolidated entities in the Consolidated Statements of Operations. Evaluations of recoverability under both ASC 323 and ASC 360-10 are primarily based on projected cash flows.entities. Due to uncertainties in the estimation process and the significant volatility in demand for new housing, actual results could differ significantly from such estimates. See Note 65.
Notes receivable
In certain instances, we may accept consideration for land sales or other transactions in the form of a note receivable. Such receivables are reported net of allowance for credit losses within other assets. The following represents our notes receivable and related allowance for credit losses ($000’s omitted):
|
| | | | | | | |
| | December 31, 2013 | | December 31, 2012 |
| Notes receivable, gross | $ | 59,995 |
| | $ | 57,841 |
|
| Allowance for credit losses | (27,051 | ) | | (26,865 | ) |
| Notes receivable, net | $ | 32,944 |
| | $ | 30,976 |
|
We also record other receivables from various parties in the normal course of business, including amounts due from municipalities, insurance companies, and vendors. Such receivables are generally reported in other assets. See Residential mortgage loans available-for-sale in Note 1 for a discussion of our receivables related to mortgage operations.
Intangible assets
Intangible assets consist of tradenames acquired in connection with the 2009 acquisition of Centex Corporation ("Centex") and the 2001 acquisition of Del Webb Corporation ("Del Webb"). These intangible assets were valued at the acquisition date and are being amortized over 20-year lives. The acquired cost and accumulated amortization of our intangible assets were $259.0$259.0 million and $122.9$148.8 million,, respectively, at December 31, 2013,2015, and $259.0$259.0 million and $109.8$135.9 million,, respectively, at December 31, 2012.2014. Amortization expense totaled $13.1$12.9 million, $13.0 million and $13.1 million in 2013, 2012,2015, 2014 and 20112013, respectively, and is expected to be $13.1$12.9 million in each of the next five years.
The ultimate realization of these assets is dependent upon estimates of future earningscash flows and benefits that we expect to generate from their use. If we determine that the carrying values of intangible assets may not be recoverable based upon the existence of one or more indicators of impairment, we use a projected undiscounted cash flow method to determine if impairment exists. If the carrying values of the intangible assets exceed the expected undiscounted cash flows, then we measure impairment as the difference between the fair value of the asset and the recorded carrying value. There were no impairments of tradenames during 20132015, 20122014, or 20112013.
Property and equipment, net, and depreciation
Property and equipment are recorded at cost. Maintenance and repair costs are expensed as incurred. Depreciation is computed by the straight-line method based upon estimated useful lives as follows: model home furniture - two years; office furniture and equipment - three to ten years; and leasehold improvements - life of the lease. Property and equipment are included in other assets and totaled $53.1$86.3 million net of accumulated depreciation of $182.0$185.8 million at December 31, 20132015 and $44.2$75.2 million net of accumulated depreciation of $190.1$192.2 million at December 31, 2012.2014. Depreciation expense totaled $18.5$33.3 million,, $16.9 $26.8 million,, and $19.0$18.5 million in 2013, 2012,2015, 2014, and 2011,2013, respectively.
Advertising costs
Advertising costs are expensed to selling, general, and administrative expense as incurred and totaled $42.4$45.3 million,, $45.8 $41.8 million,, and $55.1$42.4 million,, in 2013, 2012,2015, 2014, and 2011,2013, respectively.
PULTEGROUP, INC.
NOTES TO CONSOLIDATED FINANCIAL STATEMENTS (continued)
Employee benefits
We maintain defined contribution retirement plans that cover substantially all of our employees. Company contributions to these plans were suspended during 2011 but reinstated in 2012. Company contributions pursuant to the plans totaled $11.0$12.6 million, $12.1 million, and $9.4$11.0 million in 20132015, 2014, and 20122013, respectively.
PULTEGROUP, INC.
NOTES TO CONSOLIDATED FINANCIAL STATEMENTS (continued)
Other expense, net
Other expense, net consists of the following ($000’s omitted):
|
| | | | | | | | | | | |
| | 2013 | | 2012 | | 2011 |
Write-offs of deposits and pre-acquisition costs (Note 4) | $ | 3,122 |
| | $ | 2,278 |
| | $ | 10,002 |
|
| 26,930 |
| | 32,071 |
| | 5,638 |
|
| Lease exit and related costs | 2,778 |
| | 7,306 |
| | 9,900 |
|
Amortization of intangible assets (Note 1) | 13,100 |
| | 13,100 |
| | 13,100 |
|
| — |
| | — |
| | 240,541 |
|
Miscellaneous expense (income), net (a) | 34,823 |
| | 11,543 |
| | 13,921 |
|
| | $ | 80,753 |
| | $ | 66,298 |
| | $ | 293,102 |
|
|
| | | | | | | | | | | |
| | 2015 | | 2014 | | 2013 |
Write-offs of deposits and pre-acquisition costs (Note 3) | $ | 5,021 |
| | $ | 6,099 |
| | $ | 3,122 |
|
| — |
| | 8,584 |
| | 26,930 |
|
| Lease exit and related costs | 2,463 |
| | 9,609 |
| | 2,778 |
|
Amortization of intangible assets (Note 1) | 12,900 |
| | 13,033 |
| | 13,100 |
|
Equity in (earnings) loss of unconsolidated entities (Note 5) | (7,355 | ) | | (8,226 | ) | | (993 | ) |
| Interest income | (3,107 | ) | | (4,632 | ) | | (4,395 | ) |
| Interest expense | 788 |
| | 849 |
| | 712 |
|
Miscellaneous, net (a) | 6,653 |
| | 1,420 |
| | 34,823 |
|
| | $ | 17,363 |
| | $ | 26,736 |
| | $ | 76,077 |
|
| |
| (a) | IncludesMiscellaneous, net includes a charge of $20.0 million in 2015 resulting from the Applecross matter (see Note 12) and charges of $41.2totaling $41.2 million in 2013 resulting from a contractual dispute related to a previously completed luxury community (see Note 1312) and $5.1 million in 2012 and $17.1 million in 2011 related to the write-down of notes receivable.. |
Earnings per share
Basic earnings per share is computed by dividing income (loss) available to common shareholders (the “Numerator”) by the weighted-average number of common shares, adjusted for unvested shares, of restricted stock (the “Denominator”) for the period. Computing diluted earnings per share is similar to computing basic earnings per share, except that the Denominator is increased to include the dilutive effects of stock options, unvested restricted stock,shares and restricted share units, and other potentially dilutive instruments. Any stock options that have an exercise price greater than the average market price of our common shares are considered to be anti-dilutive and are excluded from the diluted earnings per share calculation. Our earnings per share excludes excluded 3.9 million, 6.6 million, and 9.6 million and 16.6 million stock options and other potentially dilutive instruments, in 2013 and 2012, respectively. Allincluding stock options, unvested restricted stock,shares, and other potentially dilutive instruments were excluded from the calculation during 2011 due to the net loss recorded during the period.unvested restricted share units, in 2015, 2014, and 2013, respectively.
In accordance with ASC 260 "Earnings Per Share" ("ASC 260"), the two-class method determines earnings per share for each class of common stock and participating securities according to an earnings allocation formula that adjusts the Numerator for dividends or dividend equivalents and participation rights in undistributed earnings. Unvested share-based payment awards that contain non-forfeitable rights to dividends or dividend equivalents are participating securities and, therefore, are included in computing earnings per share pursuant to the two-class method. The Company'sOur outstanding restricted stockshare awards, restricted share units, and deferred shares are considered participating securities. The following table presents the earnings per share of common stock ($000's omitted, except per share data):
PULTEGROUP, INC.
NOTES TO CONSOLIDATED FINANCIAL STATEMENTS (continued)
The following table presents the earnings per common share (000's omitted, except per share data):
| | | | December 31, 2013 | | December 31, 2012 | | December 31, 2011 | December 31, 2015 | | December 31, 2014 | | December 31, 2013 |
| Numerator: | | | | | | | | | | |
| Net income | $ | 2,620,116 |
| | $ | 206,145 |
| | $ | (210,388 | ) | $ | 494,090 |
| | $ | 474,338 |
| | $ | 2,620,116 |
|
| Less: earnings distributed to participating securities | (407 | ) | | — |
| | — |
| (755 | ) | | (583 | ) | | (407 | ) |
| Less: undistributed earnings allocated to participating securities | (19,201 | ) | | — |
| | — |
| (2,448 | ) | | (2,668 | ) | | (19,201 | ) |
| Numerator for basic earnings per share | $ | 2,600,508 |
| | $ | 206,145 |
| | $ | (210,388 | ) | $ | 490,887 |
| | $ | 471,087 |
| | $ | 2,600,508 |
|
| Add back: undistributed earnings allocated to participating securities | 19,201 |
| | — |
| | — |
| 2,448 |
| | 2,668 |
| | 19,201 |
|
| Less: undistributed earnings reallocated to participating securities | (18,845 | ) | | — |
| | — |
| (2,429 | ) | | (2,643 | ) | | (18,845 | ) |
| Numerator for diluted earnings per share | $ | 2,600,864 |
| | $ | 206,145 |
| | $ | (210,388 | ) | $ | 490,906 |
| | $ | 471,112 |
| | $ | 2,600,864 |
|
| | | | | | | | | | | |
| Denominator: | | | | | | | | | | |
| Basic shares outstanding | 383,077 |
| | 381,562 |
| | 379,877 |
| 356,576 |
| | 370,377 |
| | 383,077 |
|
| Effect of dilutive securities | 3,789 |
| | 3,002 |
| | — |
| 3,217 |
| | 3,725 |
| | 3,789 |
|
| Diluted shares outstanding | 386,866 |
| | 384,564 |
| | 379,877 |
| 359,793 |
| | 374,102 |
| | 386,866 |
|
| | | | | | | | | | | |
| Earnings per share: | | | | | | | | | | |
| Basic | $ | 6.79 |
| | $ | 0.54 |
| | $ | (0.55 | ) | $ | 1.38 |
| | $ | 1.27 |
| | $ | 6.79 |
|
| Diluted | $ | 6.72 |
| | $ | 0.54 |
| | $ | (0.55 | ) | $ | 1.36 |
| | $ | 1.26 |
| | $ | 6.72 |
|
Stock-basedShare-based compensation
We measure compensation cost for restricted stockshares and restricted stockshare units at fair value on the grant date. Fair value is determined based on the quoted price of our common stockshares on the grant date. We recognize compensation expense for restricted stockshares and restricted stockshare units, the majority of which cliff vest at the end of three years, ratably over the vesting period. For share-based awards containing performance conditions, we recognize compensation expense ratably over the vesting period when it is probable that the stated performance targets will be achieved and record cumulative adjustments in the period in which estimates change. We measure compensation cost for stock options at fair value on the grant date and recognize compensation expense on the graded vesting method over the vesting period. The graded vesting method provides for vesting of portions of the overall awards at interim dates and results in greater expense in earlier years than the straight-line method. The fair value of our stock options is determined using the Black-Scholes valuation model. Compensation expense related to our share-based awards is included in selling, general, and administrative expense, except for a small portion recognized in Financial Services expenses. See Note 98.
Income taxes
The provision for income taxes is calculated using the asset and liability method, under which deferred tax assets and liabilities are recognized by identifying the temporary differences arising from the different treatment of items for tax and accounting purposes. In assessing the realizability of deferred tax assets, we consider whether it is more likely than not that some portion or all of the deferred tax assets will not be realized. The ultimate realization of deferred tax assets is primarily dependent upon the generation of future taxable income during the periods in which those temporary differences become deductible.income. In determining the future tax consequences of events that have been recognized in the financial statements or tax returns, judgment is required. Differences between the anticipated and actual outcomes of these future tax consequences could have a material impact on theour consolidated results of operations or financial position.
PULTEGROUP, INC.
NOTES TO CONSOLIDATED FINANCIAL STATEMENTS (continued)
Unrecognized tax benefits represent the difference between tax positions taken or expected to be taken in a tax return and the benefits recognized for financial statement purposes. We follow the provisions of ASC 740, “Income Taxes” (“ASC 740”), which prescribes a minimum recognition threshold a tax position is required to meet before being recognized in the financial statements. Significant judgment is required to evaluate uncertain tax positions. Our evaluations of tax positions consider a variety of factors, including changes in facts or circumstances, changes in law, correspondence with taxing authorities, and effective settlements of audit issues. Changes in the recognition or measurement of uncertain tax positions could result in material increases or decreases in income tax expense (benefit) in the period in which the change is made. Interest and penalties related to unrecognized tax benefits are recognized as a component of income tax expense (benefit). See Note 109.
Homebuilding revenue recognition
Homebuilding revenue and related profit are generally recognized when title to and possession of the property are transferred to the buyer. In situations where the buyer’s financing is originated by Pulte Mortgage and the buyer has not made an adequate initial or continuing investment, the profit on such sale is deferred until the sale of the related mortgage loan to a third-party investor has been completed. If there is a loss on the sale of the property, the loss on such sale is recognized at the time of closing. The amount of such deferred profits were not material at either December 31, 20132015 or December 31, 20122014.
Sales incentives
When sales incentives involve a discount on the selling price of the home, we record the discount as a reduction of revenue at the time of house closing. If the sales incentive requires us to provide a free product or service to the customer, the cost of the free product or service is recorded as cost of revenues at the time of house closing. This includes the cost related to optional upgrades and seller-paid financing costs, closing costs, homeowners’ association fees, or merchandise.
Inventory and cost of revenues
Inventory is stated at cost unless the carrying value is determined to not be recoverable, in which case the affected inventory is written down to fair value. Cost includes land acquisition, land development, and home construction costs, including interest, real estate taxes, and certain direct and indirect overhead costs related to development and construction. For those communities for which construction and development activities have been idled, applicable interest and real estate taxes are expensed as incurred. Land acquisition and development costs are allocated to individual lots using an average lot cost determined based on the total expected land acquisition and development costs and the total expected home closings for the community. The specific identification method is used to accumulate home construction costs.
We capitalize interest cost into homebuilding inventories. Each layer of capitalized interest is amortized over a period that approximates the average life of communities under development. Interest expense is allocated over the period based on the timing of home closings.
Cost of revenues includes the construction cost, average lot cost, estimated warranty costs, and commissions and closing costs applicable to the home. The construction cost of the home includes amounts paid through the closing date of the home, plus an appropriate accrual for costs incurred but not yet paid, based on an analysis of budgeted construction costs. This accrual is reviewed for accuracy based on actual payments made after closing compared with the amount accrued, and adjustments are made if needed.paid. Total community land acquisition and development costs are based on an analysis of budgeted costs compared with actual costs incurred to date and estimates to complete. The development cycles for our communities range from under one year to in excess of ten years for certain master planned communities. Adjustments to estimated total land acquisition and development costs for the community affect the amounts costed for the community’s remaining lots.
PULTEGROUP, INC.
NOTES TO CONSOLIDATED FINANCIAL STATEMENTS (continued)
We record valuation adjustments on land inventory when events and circumstances indicate that the related community may be impaired and when the cash flows estimated to be generated by the community are less than its carrying amount. Such indicators include gross marginmargins or sales paces significantly below expectations, construction costs or land development costs significantly in excess of budgeted amounts, significant delays or changes in the planned development for the community, and other known qualitative factors. Communities that demonstrate potential impairment indicators are tested for impairment by comparing the expected undiscounted cash flows for the community to its carrying value. For those communities whose carrying values exceed the expected undiscounted cash flows, we estimate the fair value of the community. Impairment charges are recorded if the fair value of the community's inventory is less than its carrying value. We determine the fair value of a community's inventory using a combination of market comparable land
PULTEGROUP, INC.
NOTES TO CONSOLIDATED FINANCIAL STATEMENTS (continued)
transactions, where available, and discounted cash flow models. These estimated cash flows are significantly impacted by estimates related to expected average selling prices, expected sales paces, expected land development and construction timelines, and anticipated land development, construction, and overhead costs. The assumptions used in the discounted cash flow models are specific to each community. Our evaluations for impairments are based on our best estimates of the future cash flows for our communities. Due to uncertainties in the estimation process, the significant volatility in demand for new housing, and the long life cycles of many communities, and potential changes in our strategy related to certain communities, actual results could differ significantly from such estimates. See Note 43.
Land held for sale
We periodically elect to sell parcels of land to third parties in the event such assets no longer fit into our strategic operating plans or are zoned for commercial or other development. Land held for sale is recorded at the lower of cost or fair value less costs to sell. In determining the value of land held for sale, we consider recent offers received, prices for land in recent comparable sales transactions, and other factors. We record net realizable value adjustments for land held for sale within Homebuilding land sale cost of revenues. See Note 43.
Land option agreements
In the ordinary course of business, weWe enter into land option agreements in order to procure land for the construction of homes in the future. Pursuant to these land option agreements, we generally provide a deposit to the seller as consideration for the right to purchase land at different times in the future, usually at predetermined prices. Such contracts enable us to defer acquiring portions of properties owned by third parties or unconsolidated entities until we have determined whether and when to exercise our option, which reduces our financial risks associated with long-term land holdings. Option deposits and pre-acquisition costs (such as environmental testing, surveys, engineering, and entitlement costs) are capitalized if the costs are directly identifiable with the land under option, the costs would be capitalized if we owned the land, and acquisition of the property is probable. Such costs are reflected in other assets and are reclassified to inventory upon taking title to the land. We write off deposits and pre-acquisition costs when it becomes probable that we will not go forward with the project or recover the capitalized costs. Such decisions take into consideration changes in local market conditions, the timing of required land purchases, the availability and best use of necessary incremental capital, and other factors. We record any such write-offs of deposits and pre-acquisition costs within other expense, net. See Note 43.
If thean entity holding the land under option is a variable interest entity (“VIE”), our deposit represents a variable interest in that entity. IfNo VIEs required consolidation at either December 31, 2015 or December 31, 2014 because we are determined to bethat we were not the primary beneficiary of the VIE, we are required to consolidate the VIE. Certain of our land option agreements are with entities considered VIEs. In evaluating whether we are required to consolidate a VIE, we take into consideration that the VIE is generally protected from the first dollar of loss under our land option agreement due to our deposit. Likewise, the VIE's gains are generally capped based on the purchase price within the land option agreement. However, we generally have little control or influence over the operations of these VIEs due to our lack of an equity interest in them. Additionally, creditors of the VIE typically have no recourse against us, and we do not provide financial or other support to these VIEs other than as stipulated in the land option agreements.beneficiary. Our maximum exposure to loss related to these VIEs is generally limited to our deposits and pre-acquisition costs under the applicable land option agreements. Historically, cancellations of land option agreements have resulted in write-offs of the related deposits and pre-acquisition costs but have not exposed us to the overall risks or losses of the applicable VIEs. No VIEs required consolidation at either December 31, 2013 or December 31, 2012.
PULTEGROUP, INC.
NOTES TO CONSOLIDATED FINANCIAL STATEMENTS (continued)
Separately, certain land option agreements represent financing arrangements even though we generally have no obligation to pay these future amounts. As a result, we recorded $24.0 million and $31.1 million at December 31, 2013 and December 31, 2012, respectively, to land, not owned, under option agreements with a corresponding increase to accrued and other liabilities. Such amounts represent the remaining purchase price under the land option agreements, some of which are with VIEs, in the event we exercise the purchase rights under the agreements.
The following provides a summary of our interests in land option agreements ($000’s omitted):
| | | | December 31, 2013 | | December 31, 2012 | December 31, 2015 | | December 31, 2014 |
| | Deposits and
Pre-acquisition
Costs | | Remaining Purchase
Price | | Land, Not
Owned,
Under
Option
Agreements | | Deposits and
Pre-acquisition
Costs | | Remaining Purchase
Price | | Land, Not
Owned,
Under
Option
Agreements | Deposits and
Pre-acquisition
Costs | | Remaining Purchase
Price | | Deposits and
Pre-acquisition
Costs | | Remaining Purchase
Price |
| Land options with VIEs | $ | 40,486 |
| | $ | 661,158 |
| | $ | 8,167 |
| | $ | 29,294 |
| | $ | 369,085 |
| | $ | 8,590 |
| $ | 77,641 |
| | $ | 1,064,506 |
| | $ | 56,039 |
| | $ | 891,506 |
|
| Other land options | 50,548 |
| | 729,128 |
| | 15,857 |
| | 40,822 |
| | 554,307 |
| | 22,476 |
| 84,478 |
| | 981,687 |
| | 71,241 |
| | 999,079 |
|
| | $ | 91,034 |
| | $ | 1,390,286 |
| | $ | 24,024 |
| | $ | 70,116 |
| | $ | 923,392 |
| | $ | 31,066 |
| $ | 162,119 |
| | $ | 2,046,193 |
| | $ | 127,280 |
| | $ | 1,890,585 |
|
Start-up costs
Costs and expenses associated with opening new communities are expensed whento selling, general, and administrative expenses as incurred.
PULTEGROUP, INC.
NOTES TO CONSOLIDATED FINANCIAL STATEMENTS (continued)
Allowance for warranties
Home purchasers are provided with a limited warranty against certain building defects.defects, including a one-year comprehensive limited warranty and coverage for certain other aspects of the home's construction and operating systems for periods of up to 10 years. We estimate the costs to be incurred under these warranties and record a liability in the amount of such costs at the time the product revenue is recognized.recognized for each home closing.
Self-insured risks
We maintain, and require the majority of our subcontractors to maintain, general liability insurance coverage, including coverage for certain construction defects. We also maintain builders' risk, property, errors and omissions, workers compensation, and other business insurance coverage. These insurance policies protect us against a portion of the risk of loss from claims, subject to certain self-insured per occurrence and aggregate retentions, deductibles, and available policy limits. However, we retain a significant portion of the overall risk for such claims. We reserve for these costs on an undiscounted basis at the time product revenue is recognized for each home closing and evaluate the recorded liabilities based on actuarial analyses of our historical claims, which include estimates of claims incurred but not yet reported. Adjustments to estimated reserves are recorded in the period in which the change in estimate occurs. In certain instances, we have the ability to recover a portion of our costs under various insurance policies or from our subcontractors or other third parties. Estimates of such amounts are recorded when recovery is considered probable. See Note 1312.
Residential mortgage loans available-for-sale
Substantially all of the loans originated by us and their related servicing rights are sold in the secondary mortgage market within a short period of time after origination, generally within 30 days. In accordance with ASC 825, “Financial Instruments” (“ASC 825”), we use the fair value option to record residential mortgage loans available-for-sale. Election of the fair value option for these loans allows a better offset of the changes in fair values of the loans and the derivative instruments used to economically hedge them without having to apply complex hedge accounting provisions. We do not designate any derivative instruments as hedges or apply the hedge accounting provisions of ASC 815, “Derivatives and Hedging.” See Note 1312 for discussion of the risks retained related to mortgage loan originations.
PULTEGROUP, INC.
NOTES TO CONSOLIDATED FINANCIAL STATEMENTS (continued)
Expected gains and losses from the sale of residential mortgage loans and their related servicing rights are included in the measurement of written loan commitments that are accounted for at fair value through Financial Services revenues at the time of commitment. Subsequent changes in the fair value of these loans are reflected in Financial Services revenues as they occur. At December 31, 20132015 and 2012,2014, residential mortgage loans available-for-sale had an aggregate fair value of $287.9$442.7 million and $318.9$339.5 million,, respectively, and an aggregate outstanding principal balance of $278.1$429.6 million and $305.3$327.4 million,, respectively. The net gain (loss) resulting from changes in fair value of these loans totaled $(1.2)$(0.3) million and $(0.2)$1.7 million for the years ended December 31, 20132015 and 2012,2014, respectively. These changes in fair value were substantially offset by changes in fair value of the corresponding hedging instruments. Net gains from the sale of mortgages during 2013, 2012,2015, 2014, and 20112013 were $80.3$80.8 million,, $109.2 $67.2 million,, and $59.1$80.3 million,, respectively, and have been included in Financial Services revenues.
Mortgage servicing rights
We sell the servicing rights for the loans we originate through fixed price servicing sales contracts to reduce the risks and costs inherent in servicing loans. This strategy results in owning the servicing rights for only a short period of time. We recognize the fair value of our rights to service a mortgage loan as revenue at the time of entering into an interest rate lock commitment with a borrower. Due to the short period of time the servicing rights are held, we do not amortize the servicing asset. The servicing sales contracts provide for the reimbursement of payments made by the purchaser if loans prepay within specified periods of time, generally within 90 to 120 days after sale. We establish reserves for this liability at the time the sale is recorded. Such reserves were immaterial at December 31, 20132015 and 20122014 and are included in accrued and other liabilities.
Loans held for investment
We maintain a portfolio of loans that either have been repurchased from investors or were not saleable upon closing. We have the intent and ability to hold these loans for the foreseeable future or until maturity or payoff. These loans are carried at cost and are
PULTEGROUP, INC.
NOTES TO CONSOLIDATED FINANCIAL STATEMENTS (continued)
reviewed annually for impairment, or when recoverability becomes doubtful. Loans held for investment are included in other assets and totaled $11.0$7.6 million and $1.312.5 million at December 31, 20132015 and 20122014, respectively.
Interest income on mortgage loans
Interest income on mortgage loans is recorded in Financial Services revenues, accrued from the date a mortgage loan is originated until the loan is sold, and totaled $7.56.9 million, $6.07.2 million, and $5.07.5 million in 20132015, 20122014, and 20112013, respectively. Loans are placed on non-accrual status once they become greater than 90 days past due their contractual terms. Subsequent payments received are applied according to the contractual terms of the loan. Mortgage discounts are not amortized as interest income due to the short period the loans are held until sale to third party investors.
Mortgage servicing, origination, and commitment fees
Mortgage servicing fees represent fees earned for servicing loans for various investors. Servicing fees are based on a contractual percentage of the outstanding principal balance, or a contracted set fee in the case of certain sub-servicing arrangements, and are credited to income when related mortgage payments are received or the sub-servicing fees are earned. Loan origination costs related to residential mortgage loans available-for-sale are recognized as incurred in Financial Services expenses while the associated mortgage origination fees are recognized in Financial Services revenues as earned, generally upon loan closing.
Title services
Revenues associated with our title operations are recognized within Financial Services revenues as closing services are rendered and title insurance policies are issued, both of which generally occur as each home is closed.
PULTEGROUP, INC.
NOTES TO CONSOLIDATED FINANCIAL STATEMENTS (continued)
Derivative instruments and hedging activities
We are exposed to market risks from commitments to lend, movements in interest rates, and canceled or modified commitments to lend. A commitment to lend at a specific interest rate (an interest rate lock commitment) is a derivative financial instrument (interest rate is locked to the borrower). In order to reduce these risks, we use other derivative financial instruments, principally cash forward placement contracts on mortgage-backed securities and whole loan investor commitments, to economically hedge the interest rate lock commitment. We enter into these derivative financial instruments based upon our portfolio of interest rate lock commitments and closed loans. We do not use any derivative financial instruments for trading purposes.
At December 31, 20132015 and 20122014, we had aggregate interest rate lock commitments of $175.7$208.2 million and $161.6146.1 million, respectively, which were originated at interest rates prevailing at the date of commitment. Since we can terminate a loan commitment if the borrower does not comply with the terms of the contract, and some loan commitments may expire without being drawn upon, these commitments do not necessarily represent future cash requirements. We evaluate the creditworthiness of these transactions through our normal credit policies.
In order to reduce risks associated with our loan origination activities, we use other derivative financial instruments, principally cash forward placement contracts on mortgage-backed securities and whole loan investor commitments, to economically hedge the interest rate lock commitment. We enter into these derivative financial instruments based upon our portfolio of interest rate lock commitments and closed loans. We do not enter into any derivative financial instruments for trading purposes.
Forward contracts on mortgage-backed securities are commitments to either purchase or sell a specified financial instrument at a specified future date for a specified price that may be settled in cash, by offsetting the position, or through the delivery of the financial instrument. Forward contracts on mortgage-backed securities are the predominant derivative financial instruments we use to minimize market risk during the period from the time we extend an interest rate lock to a loan applicant until the time the loan is sold to an investor. We also use whole loan investor commitments, which are obligations of the investor to buy loans at a specified price within a specified time period. At December 31, 20132015 and 20122014, we had unexpired forward contracts of $381.5$525.0 million and $428.0$371.0 million,, respectively, and whole loan investor commitments of $31.7$77.6 million and $4.7$63.5 million,, respectively. Changes in the fair value of interest rate lock commitments and other derivative financial instruments are recognized in Financial Services revenues, and the fair values are reflected in other assets or other liabilities, as applicable.
There are no credit-risk-related contingent features within our derivative agreements, and counterparty risk is considered minimal. Gains and losses on interest rate lock commitments are substantially offset by corresponding gains or losses on forward contracts on mortgage-backed securities and whole loan investor commitments. We are generally not exposed to variability in cash flows of derivative instruments for more than approximately 75 days.
PULTEGROUP, INC.
NOTES TO CONSOLIDATED FINANCIAL STATEMENTS (continued)
The fair values of derivative instruments and their location in the Consolidated Balance Sheets isare summarized below ($000’s omitted):
| | | | December 31, 2013 | | December 31, 2012 | December 31, 2015 | | December 31, 2014 |
| | Other Assets | | Other Liabilities | | Other Assets | | Other Liabilities | Other Assets | | Other Liabilities | | Other Assets | | Other Liabilities |
| Interest rate lock commitments | $ | 3,628 |
| | $ | 489 |
| | $ | 6,045 |
| | $ | 24 |
| $ | 5,854 |
| | $ | 280 |
| | $ | 4,313 |
| | $ | 65 |
|
| Forward contracts | 4,374 |
| | 34 |
| | 245 |
| | 891 |
| 1,178 |
| | 840 |
| | 79 |
| | 3,653 |
|
| Whole loan commitments | 189 |
| | 84 |
| | 30 |
| | 85 |
| 358 |
| | 345 |
| | 31 |
| | 619 |
|
| | $ | 8,191 |
| | $ | 607 |
| | $ | 6,320 |
| | $ | 1,000 |
| $ | 7,390 |
| | $ | 1,465 |
| | $ | 4,423 |
| | $ | 4,337 |
|
New accounting pronouncements
In May 2014, the FASB issued Accounting Standards Update No. 2014-09, "Revenue from Contracts with Customers" ("ASU 2014-09"). The standard is a comprehensive new revenue recognition model that requires revenue to be recognized in a manner to depict the transfer of goods or services to a customer at an amount that reflects the consideration expected to be received in exchange for those goods or services. In August 2015, the FASB issued ASU 2015-14, "Revenue from Contracts with Customers (Topic 606): Deferral of the Effective Date", which delayed the effective date by one year. As a result, the standard is effective for us for annual and interim periods beginning January 1, 2018 and allows for full retrospective or modified retrospective methods of adoption. We are currently evaluating the impact that the standard will have on our financial statements.
In August 2014, the FASB issued Accounting Standards Update No. 2014-15, “Disclosure of Uncertainties About an Entity’s Ability to Continue as a Going Concern” (“ASU 2014-15”), which requires management to evaluate, at each annual and interim reporting period, whether there are conditions or events that raise substantial doubt about the entity’s ability to continue as a going concern and provide related disclosures. ASU 2014-15 is effective for annual and interim reporting periods beginning January 1, 2017 and is not expected to have a material impact on our financial statements.
In April 2015, the FASB issued ASU 2015-03, “Simplifying the Presentation of Debt Issuance Costs” ("ASU 2015-03"), which requires debt issuance costs to be presented in the balance sheet as a direct deduction from the carrying value of the associated debt, consistent with the presentation of a debt discount. The guidance is effective for us beginning January 1, 2016. We currently present deferred financing costs within Other assets. Accordingly, the adoption of the new guidance will result in the reclassification of debt issuance costs as an offset to the related debt on the balance sheet, which we do not expect to be material to our financial statements.
2. Corporate office relocation
In May 2013, we announced our plan to relocate our corporate offices to Atlanta, Georgia, from the previous location in Bloomfield Hills, Michigan. The relocation of operations is occurring in phases over time and is expected to be substantially complete in 2016. We recorded employee severance, retention, relocation, and related expenses of $2.0 million, $7.6 million, and $15.0 million in 2015, 2014, and 2013, respectively. We also recorded lease exit and asset impairment expenses totaling $2.3 million, $8.7 million, and $0.4 million in 2015, 2014, and 2013, respectively. Severance, retention, relocation, and related expenses are recorded within selling, general, and administrative expense, while lease exit and asset impairment expenses are included in other expense, net. We expect the remaining expenses to total less than $10.0 million.
PULTEGROUP, INC.
NOTES TO CONSOLIDATED FINANCIAL STATEMENTS (continued)
2. Goodwill
Goodwill was recorded in connection with various acquisitions but was written-off as of December 31, 2011. We evaluated the recoverability of goodwill by comparing the carrying value of our reporting units to their fair value. Fair value was determined using discounted cash flows supplemented by market-based assessments of fair value, and impairment was measured as the difference between the resulting implied fair value of goodwill and its recorded carrying value. The determination of fair value was significantly impacted by estimates related to current market valuations, current and future economic conditions in each of our geographical markets, and our strategic plans within each of our markets.
In the third quarter of 2011, we performed an event-driven assessment of the recoverability of goodwill. This assessment was necessary primarily due to sustained declines in our market capitalization. In performing the goodwill impairment analysis, we used management's estimates of the future cash flows for each reporting unit, which were required to consider the decrease in our market capitalization. The results of this analysis determined that a goodwill impairment charge of $240.5 million in the third quarter of 2011 was required.
3. Corporate office relocation
On May 31, 2013, we announced our plan to relocate our corporate offices to Atlanta, Georgia, from its current location in Bloomfield Hills, Michigan, in 2014. The decision to relocate reflects long-term growth trends for both us and the homebuilding industry and is intended to bring our corporate offices closer to our customers and a larger portion of our investment portfolio. The relocation of operations will occur in phases over time but is expected to be substantially complete no later than early 2015. We expect to incur the following approximate costs in connection with the relocation, the substantial majority of which represent future cash expenditures ($000's omitted):
|
| | | | | | | |
| Employee severance, retention, and relocation costs | $ | 21,000 |
| to | $ | 26,000 |
|
| Asset impairments | 355 |
| to | 500 |
|
| Lease termination and other exit costs | 27,000 |
| to | 32,000 |
|
During 2013, we recorded employee severance, retention, relocation, and related costs of $15.0 million and asset impairments of $0.4 million. Severance, retention, relocation, and related costs are recorded within selling, general, and administrative expense, while lease exit and asset impairments are included in other expense, net. We expect the remaining costs to be recognized in 2014 and 2015. We will also incur costs at the new location related to the recruitment and onboarding of new employees and certain redundant operating costs. The amount of such costs is not expected to be material.
PULTEGROUP, INC.
NOTES TO CONSOLIDATED FINANCIAL STATEMENTS (continued)
4. Inventory and land held for sale
Major components of inventory at December 31, 20132015 and 20122014 were ($000’s omitted):
| | | | 2013 | | 2012 | 2015 | | 2014 |
| Homes under construction | $ | 1,042,147 |
| | $ | 1,116,184 |
| $ | 1,408,260 |
| | $ | 1,084,137 |
|
| Land under development | 2,189,387 |
| | 2,435,378 |
| 3,259,066 |
| | 2,545,049 |
|
| Raw land | 747,027 |
| | 662,484 |
| 782,732 |
| | 762,914 |
|
| | $ | 3,978,561 |
| | $ | 4,214,046 |
| $ | 5,450,058 |
| | $ | 4,392,100 |
|
We capitalize interest cost into inventory during the active development and construction of our communities. Each layer of capitalized interest is amortized over a period that approximates the average life of communities under development. Interest expense is recorded based on the timing of home closings. In all periods presented, we capitalized all Homebuilding interest costs into inventory because the level of our active inventory exceeded our debt levels.
Information Activity related to interest capitalized into inventory is as follows ($000’s omitted):
| | | | Years Ended December 31, | Years Ended December 31, |
| | 2013 | | 2012 | | 2011 | 2015 | | 2014 | | 2013 |
| Interest in inventory, beginning of period | $ | 331,880 |
| | $ | 355,068 |
| | $ | 323,379 |
| $ | 167,638 |
| | $ | 230,922 |
| | $ | 331,880 |
|
| Interest capitalized | 154,107 |
| | 201,103 |
| | 221,071 |
| 120,001 |
| | 131,444 |
| | 154,107 |
|
Interest expensed (a) | (255,065 | ) | | (224,291 | ) | | (189,382 | ) | (138,141 | ) | | (194,728 | ) | | (255,065 | ) |
| Interest in inventory, end of period | $ | 230,922 |
| | $ | 331,880 |
| | $ | 355,068 |
| $ | 149,498 |
| | $ | 167,638 |
| | $ | 230,922 |
|
Interest incurred (b) | $ | 154,819 |
| | $ | 201,103 |
| | $ | 221,071 |
| |
| |
(a) | Interest expensed to Home sale cost of revenues for 2013, 2012, and 2011 included $2.9 million, $6.5 million, and $5.4 million, respectively, of capitalized interest write-offs related to land-related charges.
|
| |
(b) | Homebuilding interest incurred includes interest on senior debt and certain other financing arrangements. |
Land-related charges
We recorded the following land-related charges during the three years ended December 31, 2013:($000's omitted):
| | | | 2013 | | 2012 | | 2011 | 2015 | | 2014 | | 2013 |
| Land impairments | $ | 2,944 |
| | $ | 13,437 |
| | $ | 15,940 |
| $ | 7,347 |
| | $ | 3,911 |
| | $ | 2,944 |
|
| Net realizable value adjustments ("NRV") - land held for sale | 3,606 |
| | 1,480 |
| | 9,844 |
| (901 | ) | | 1,158 |
| | 3,606 |
|
| Write-off of deposits and pre-acquisition costs | 3,122 |
| | 2,278 |
| | 10,002 |
| |
| Write-offs of deposits and pre-acquisition costs | | 5,021 |
| | 6,099 |
| | 3,122 |
|
| Total land-related charges | $ | 9,672 |
| | $ | 17,195 |
| | $ | 35,786 |
| $ | 11,467 |
| | $ | 11,168 |
| | $ | 9,672 |
|
Land impairmentsheld for sale
We record land impairment valuation adjustments to our communities within Homebuilding homeLand held for sale cost of revenues. Our evaluations for impairments are based on our best estimates of the future cash flows for our communities. However, if conditions in our local markets worsen in the future or if our strategy related to certain communities changes, we may be required to evaluate our assets for further impairments or write-downs.at December 31, 2015 and 2014 was as follows ($000’s omitted):
|
| | | | | | | |
| | 2015 | | 2014 |
| Land held for sale, gross | $ | 86,913 |
| | $ | 108,725 |
|
| Net realizable value reserves | (5,421 | ) | | (7,535 | ) |
| Land held for sale, net | $ | 81,492 |
| | $ | 101,190 |
|
PULTEGROUP, INC.
NOTES TO CONSOLIDATED FINANCIAL STATEMENTS (continued)
Net realizable value adjustments – land held for sale
We record net realizable value adjustments to land held for sale within Homebuilding land sale cost of revenues. During 2013, the decrease in the gross land held for sale and net realizable value reserve balances resulted primarily from the sale of land parcels, certain of which were previously impaired. Land held for sale at December 31, 2013 and 2012 was as follows ($000’s omitted):
|
| | | | | | | |
| | 2013 | | 2012 |
| Land held for sale, gross | $ | 70,003 |
| | $ | 135,201 |
|
| Net realizable value reserves | (8,268 | ) | | (44,097 | ) |
| Land held for sale, net | $ | 61,735 |
| | $ | 91,104 |
|
Write-off of deposits and pre-acquisition costs
We write off deposits and pre-acquisition costs when it becomes probable that we will not go forward with the land option agreement or recover the capitalized costs. We record write-offs of deposits and pre-acquisition costs within other expense, net.
5.4. Segment information
Our Homebuilding operations are engaged in the acquisition and development of land primarily for residential purposes within the U.S. and the construction of housing on such land. Home sale revenues for detached and attached homes were $5.0 billion and $841.5 million in 2015, $4.8 billion and $885.8 million in 2014, and $4.5 billion and $939.0 million in 2013, $3.6 billion and $925.4 million in 2012, and $3.1 billion and $841.3 million in 2011, respectively. For reporting purposes, our Homebuilding operations are aggregated into six reportable segments:segments. For 2015, we realigned our organizational structure and reportable segment presentation. Accordingly, the segment information provided in this note has been reclassified to conform to the current presentation for all periods presented.
|
| | |
| Northeast: | | Connecticut, Delaware, Maryland, Massachusetts, New Jersey, New York, Pennsylvania,
Rhode Island, Virginia |
| Southeast: | | Georgia, North Carolina, South Carolina, Tennessee |
| Florida: | | Florida |
| Midwest: | | Illinois, Indiana, Kentucky, Michigan, Minnesota, Missouri, Ohio |
| Texas: | | Texas |
North: | | Illinois, Indiana, Michigan, Minnesota, Missouri, Northern California, Ohio, Oregon, Washington |
Southwest:West: | | Arizona, California, Nevada, New Mexico, Southern CaliforniaWashington |
We also have a reportable segment for our Financial Services operations, which consist principally of mortgage banking and title operations. The Financial Services segment operates generally in the same markets as the Homebuilding segments.
Evaluation of segment performance is generally based on income before income taxes. Each reportable segment generally follows the same accounting policies described in Note 1 "Summary of Significant Accounting Policies" to the consolidated financial statements..
PULTEGROUP, INC.
NOTES TO CONSOLIDATED FINANCIAL STATEMENTS (continued)
| | | | Operating Data by Segment ($000’s omitted) Years Ended December 31, | Operating Data by Segment ($000’s omitted) Years Ended December 31, |
| | 2013 | | 2012 | | 2011 | 2015 | | 2014 | | 2013 |
| Revenues: | | | | | | | | | | |
| Northeast | $ | 819,709 |
| | $ | 755,148 |
| | $ | 717,839 |
| $ | 682,112 |
| | $ | 710,859 |
| | $ | 819,709 |
|
| Southeast | 842,921 |
| | 691,113 |
| | 675,904 |
| 1,058,089 |
| | 949,635 |
| | 842,921 |
|
| Florida | 802,665 |
| | 628,997 |
| | 571,102 |
| 1,019,733 |
| | 917,956 |
| | 802,665 |
|
| Midwest | | 1,020,691 |
| | 872,241 |
| | 791,537 |
|
| Texas | 835,473 |
| | 682,929 |
| | 631,419 |
| 845,772 |
| | 859,165 |
| | 835,473 |
|
| North | 1,232,814 |
| | 1,022,633 |
| | 740,372 |
| |
| Southwest | 1,005,062 |
| | 878,290 |
| | 696,960 |
| |
| West | | 1,214,814 |
| | 1,386,869 |
| | 1,446,339 |
|
| | 5,538,644 |
| | 4,659,110 |
| | 4,033,596 |
| 5,841,211 |
| | 5,696,725 |
| | 5,538,644 |
|
| Financial Services | 140,951 |
| | 160,888 |
| | 103,094 |
| 140,753 |
| | 125,638 |
| | 140,951 |
|
| Consolidated revenues | $ | 5,679,595 |
| | $ | 4,819,998 |
| | $ | 4,136,690 |
| $ | 5,981,964 |
| | $ | 5,822,363 |
| | $ | 5,679,595 |
|
| | | | | | | | | | | |
| Income (loss) before income taxes: | | | | | | |
| Income before income taxes: | | | | | | |
Northeast | $ | 110,246 |
| | $ | 73,345 |
| | $ | 29,320 |
| $ | 82,616 |
| | $ | 103,865 |
| | $ | 110,246 |
|
| Southeast | 121,055 |
| | 64,678 |
| | 45,060 |
| 172,330 |
| | 156,513 |
| | 121,055 |
|
| Florida | 139,673 |
| | 73,472 |
| | 44,946 |
| 196,525 |
| | 190,441 |
| | 139,673 |
|
| Midwest | | 91,745 |
| | 78,863 |
| | 84,551 |
|
| Texas | 111,431 |
| | 60,979 |
| | 33,329 |
| 121,329 |
| | 133,005 |
| | 111,431 |
|
| North | 164,348 |
| | 84,597 |
| | (12,376 | ) | |
| Southwest | 179,163 |
| | 79,887 |
| | 36,647 |
| |
| West | | 169,394 |
| | 254,724 |
| | 258,960 |
|
Other homebuilding (a)(b) | (346,803 | ) | | (278,967 | ) | | (452,756 | ) | (76,622 | ) | | (282,234 | ) | | (346,803 | ) |
| | 479,113 |
| | 157,991 |
| | (275,830 | ) | 757,317 |
| | 635,177 |
| | 479,113 |
|
| Financial Services | 48,709 |
| | 25,563 |
| | (34,470 | ) | |
| Consolidated income (loss) before income taxes | $ | 527,822 |
| | $ | 183,554 |
| | $ | (310,300 | ) | |
Financial Services (c) | | 58,706 |
| | 54,581 |
| | 48,709 |
|
| Consolidated income before income taxes | | $ | 816,023 |
| | $ | 689,758 |
| | $ | 527,822 |
|
| |
| (a) | Northeast includes a charge of $20.0 million in 2015 resulting from the Applecross matter (see Note 12). |
| |
| (b) | Other homebuilding includes the amortization of intangible assets, goodwill impairment, amortization of capitalized interest, and other costsitems not allocated to the operating segments. Other homebuilding also included the following:segments, in addition to: losses on debt retirements of $8.6 million and $26.9 million $32.1 million,in 2014 and $5.6 million, for 2013, 2012, and 2011, respectively; costsrespectively (see Note 6); adjustments to general liability insurance reserves relating to a reversal of $15.4$62.2 million in 20132015 and a charge of $69.3 million in 2014 (see Note 12); costs associated with the relocation of our corporate headquarters;headquarters totaling $4.4 million, $16.3 million, and $15.4 million in 2015, 2014, and 2013, respectively (see Note 2); and charges of $41.2 million in 2013 resulting from a contractual dispute related to a previously completed luxury community.community (see Note 12). |
| |
| (c) | Financial Services included reductions in loan origination liabilities totaling $11.8 million and $18.6 million in 2015 and 2014, respectively. |
PULTEGROUP, INC.
NOTES TO CONSOLIDATED FINANCIAL STATEMENTS (continued)
| | | | Operating Data by Segment ($000's omitted)
Years Ended December 31, | Operating Data by Segment ($000's omitted)
Years Ended December 31, |
| | 2013 | | 2012 | | 2011 | 2015 | | 2014 | | 2013 |
| Land-related charges*: | | | | | | | | | | |
| Northeast | $ | 557 |
| | $ | 1,794 |
| | $ | 4,958 |
| $ | 3,301 |
| | $ | 2,824 |
| | $ | 557 |
|
| Southeast | 998 |
| | 1,363 |
| | 2,429 |
| 3,022 |
| | 1,826 |
| | 998 |
|
| Florida | 1,076 |
| | 214 |
| | 3,999 |
| 4,555 |
| | 487 |
| | 1,076 |
|
| Midwest | | 2,319 |
| | 2,347 |
| | 1,883 |
|
| Texas | 191 |
| | 556 |
| | 828 |
| 295 |
| | 321 |
| | 191 |
|
| North | 3,434 |
| | 4,546 |
| | 14,867 |
| |
| Southwest | 472 |
| | 2,254 |
| | 3,263 |
| |
| West | | (2,615 | ) | | 1,696 |
| | 2,023 |
|
| Other homebuilding | 2,944 |
| | 6,468 |
| | 5,442 |
| 590 |
| | 1,667 |
| | 2,944 |
|
| | $ | 9,672 |
| | $ | 17,195 |
| | $ | 35,786 |
| $ | 11,467 |
| | $ | 11,168 |
| | $ | 9,672 |
|
| |
| * | Land-related charges include land impairments, net realizable value adjustments for land held for sale, and write-offs of deposits and pre-acquisition costs for land option contracts we elected not to pursue. Other homebuilding consists primarily of write-offs of capitalized interest related to such land-related charges. See Note 41 for additional discussion of these charges. |
| | | | Operating Data by Segment ($000's omitted) Years Ended December 31, | Operating Data by Segment ($000's omitted) Years Ended December 31, |
| | 2013 | | 2012 | | 2011 | 2015 | | 2014 | | 2013 |
| Depreciation and amortization: | | | | | | | | | | |
| Northeast | $ | 1,987 |
| | $ | 1,790 |
| | $ | 1,820 |
| $ | 1,682 |
| | $ | 1,852 |
| | $ | 1,987 |
|
| Southeast | 1,647 |
| | 1,028 |
| | 1,414 |
| 3,492 |
| | 2,666 |
| | 1,647 |
|
| Florida | 1,334 |
| | 1,640 |
| | 2,045 |
| 3,536 |
| | 2,150 |
| | 1,334 |
|
| Midwest | | 5,019 |
| | 3,153 |
| | 1,644 |
|
| Texas | 1,784 |
| | 1,619 |
| | 2,002 |
| 2,928 |
| | 1,698 |
| | 1,784 |
|
| North | 2,265 |
| | 1,709 |
| | 1,614 |
| |
| Southwest | 2,969 |
| | 3,143 |
| | 3,076 |
| |
| West | | 5,995 |
| | 5,263 |
| | 3,590 |
|
Other homebuilding (a) | 16,248 |
| | 16,168 |
| | 17,329 |
| 20,254 |
| | 19,548 |
| | 16,248 |
|
| | 28,234 |
| | 27,097 |
| | 29,300 |
| 42,906 |
| | 36,330 |
| | 28,234 |
|
| Financial Services | 3,353 |
| | 2,930 |
| | 2,798 |
| 3,316 |
| | 3,534 |
| | 3,353 |
|
| | $ | 31,587 |
| | $ | 30,027 |
| | $ | 32,098 |
| $ | 46,222 |
| | $ | 39,864 |
| | $ | 31,587 |
|
| |
| (a) | Other homebuilding includes amortization of intangible assetsassets. |
| | | | Operating Data by Segment ($000's omitted) Years Ended December 31, | Operating Data by Segment ($000's omitted) Years Ended December 31, |
| | 2013 | | 2012 | | 2011 | 2015 | | 2014 | | 2013 |
| Equity in (earnings) loss of unconsolidated entities: | | | | | | | | | | |
| Northeast | $ | (58 | ) | | $ | (4 | ) | | $ | 15 |
| $ | 2 |
| | $ | (4,733 | ) | | $ | (58 | ) |
| Southeast | — |
| | — |
| | — |
| — |
| | — |
| | — |
|
| Florida | (4 | ) | | — |
| | — |
| 2 |
| | (7 | ) | | (4 | ) |
| Midwest | | (337 | ) | | (481 | ) | | 151 |
|
| Texas | — |
| | — |
| | — |
| — |
| | — |
| | — |
|
| North | (608 | ) | | (1,497 | ) | | (121 | ) | |
| Southwest | (678 | ) | | (1,137 | ) | | (2,561 | ) | |
| West | | (5,107 | ) | | (2,422 | ) | | (1,437 | ) |
| Other homebuilding | 355 |
| | (1,235 | ) | | (527 | ) | (1,915 | ) | | (583 | ) | | 355 |
|
| | (993 | ) | | (3,873 | ) | | (3,194 | ) | (7,355 | ) | | (8,226 | ) | | (993 | ) |
| Financial Services | (137 | ) | | (186 | ) | | (102 | ) | — |
| | (182 | ) | | (137 | ) |
| | $ | (1,130 | ) | | $ | (4,059 | ) | | $ | (3,296 | ) | $ | (7,355 | ) | | $ | (8,408 | ) | | $ | (1,130 | ) |
PULTEGROUP, INC.
NOTES TO CONSOLIDATED FINANCIAL STATEMENTS (continued)
| | | | Operating Data by Segment | Operating Data by Segment |
| | ($000's omitted) | ($000's omitted) |
| | December 31, 2013 | December 31, 2015 |
| | Homes Under
Construction | | Land Under
Development | | Raw Land | | Total
Inventory | | Total
Assets | Homes Under
Construction | | Land Under
Development | | Raw Land | | Total
Inventory | | Total
Assets |
| Northeast | $ | 212,611 |
| | $ | 325,241 |
| | $ | 106,681 |
| | $ | 644,533 |
| | $ | 731,259 |
| $ | 163,173 |
| | $ | 292,631 |
| | $ | 121,522 |
| | $ | 577,326 |
| | $ | 688,610 |
|
| Southeast | 139,484 |
| | 274,981 |
| | 146,617 |
| | 561,082 |
| | 599,271 |
| 196,456 |
| | 367,577 |
| | 139,246 |
| | 703,279 |
| | 765,933 |
|
| Florida | 140,366 |
| | 295,631 |
| | 104,766 |
| | 540,763 |
| | 618,449 |
| 227,910 |
| | 574,092 |
| | 97,185 |
| | 899,187 |
| | 1,013,543 |
|
| Midwest | | 197,738 |
| | 414,386 |
| | 68,918 |
| | 681,042 |
| | 734,834 |
|
| Texas | 130,398 |
| | 223,979 |
| | 57,480 |
| | 411,857 |
| | 466,198 |
| 191,424 |
| | 317,702 |
| | 107,737 |
| | 616,863 |
| | 691,342 |
|
| North | 227,537 |
| | 350,239 |
| | 78,945 |
| | 656,721 |
| | 716,239 |
| |
| Southwest | 159,350 |
| | 512,164 |
| | 201,659 |
| | 873,173 |
| | 940,462 |
| |
| West | | 413,208 |
| | 1,094,112 |
| | 222,920 |
| | 1,730,240 |
| | 1,924,958 |
|
Other homebuilding (a) | 32,401 |
| | 207,152 |
| | 50,879 |
| | 290,432 |
| | 4,334,591 |
| 18,351 |
| | 198,566 |
| | 25,204 |
| | 242,121 |
| | 2,638,951 |
|
| | 1,042,147 |
| | 2,189,387 |
| | 747,027 |
| | 3,978,561 |
| | 8,406,469 |
| 1,408,260 |
| | 3,259,066 |
| | 782,732 |
| | 5,450,058 |
| | 8,458,171 |
|
| Financial Services | — |
| | — |
| | — |
| | — |
| | 327,674 |
| — |
| | — |
| | — |
| | — |
| | 508,989 |
|
| | $ | 1,042,147 |
| | $ | 2,189,387 |
| | $ | 747,027 |
| | $ | 3,978,561 |
| | $ | 8,734,143 |
| $ | 1,408,260 |
| | $ | 3,259,066 |
| | $ | 782,732 |
| | $ | 5,450,058 |
| | $ | 8,967,160 |
|
| | | | | | | | | | | | | | | | | | | |
| | December 31, 2012 | December 31, 2014 |
| | Homes Under
Construction | | Land Under
Development | | Raw Land | | Total
Inventory | | Total
Assets | Homes Under
Construction | | Land Under
Development | | Raw Land | | Total
Inventory | | Total
Assets |
| Northeast | $ | 198,549 |
| | $ | 445,436 |
| | $ | 109,136 |
| | $ | 753,121 |
| | $ | 866,024 |
| $ | 184,974 |
| | $ | 266,229 |
| | $ | 106,077 |
| | $ | 557,280 |
| | $ | 659,224 |
|
| Southeast | 147,227 |
| | 286,210 |
| | 120,193 |
| | 553,630 |
| | 590,650 |
| 147,506 |
| | 304,762 |
| | 117,981 |
| | 570,249 |
| | 605,067 |
|
| Florida | 130,276 |
| | 310,625 |
| | 100,633 |
| | 541,534 |
| | 620,220 |
| 150,743 |
| | 350,016 |
| | 112,225 |
| | 612,984 |
| | 717,531 |
|
| Midwest | | 176,966 |
| | 326,549 |
| | 70,266 |
| | 573,781 |
| | 624,815 |
|
| Texas | 145,594 |
| | 256,704 |
| | 54,556 |
| | 456,854 |
| | 523,843 |
| 134,873 |
| | 250,102 |
| | 91,765 |
| | 476,740 |
| | 528,392 |
|
| North | 219,172 |
| | 369,144 |
| | 46,414 |
| | 634,730 |
| | 680,447 |
| |
| Southwest | 226,204 |
| | 496,488 |
| | 167,295 |
| | 889,987 |
| | 963,540 |
| |
| West | | 270,060 |
| | 850,629 |
| | 230,199 |
| | 1,350,888 |
| | 1,485,685 |
|
Other homebuilding (a) | 49,162 |
| | 270,771 |
| | 64,257 |
| | 384,190 |
| | 2,140,739 |
| 19,015 |
| | 196,762 |
| | 34,401 |
| | 250,178 |
| | 3,527,731 |
|
| | 1,116,184 |
| | 2,435,378 |
| | 662,484 |
| | 4,214,046 |
| | 6,385,463 |
| 1,084,137 |
| | 2,545,049 |
| | 762,914 |
| | 4,392,100 |
| | 8,148,445 |
|
| Financial Services | — |
| | — |
| | — |
| | — |
| | 348,946 |
| — |
| | — |
| | — |
| | — |
| | 420,965 |
|
| | $ | 1,116,184 |
| | $ | 2,435,378 |
| | $ | 662,484 |
| | $ | 4,214,046 |
| | $ | 6,734,409 |
| $ | 1,084,137 |
| | $ | 2,545,049 |
| | $ | 762,914 |
| | $ | 4,392,100 |
| | $ | 8,569,410 |
|
| | | | | | | | | | | | | | | | | | | |
| | December 31, 2011 | December 31, 2013 |
| | Homes Under
Construction | | Land Under
Development | | Raw Land | | Total
Inventory | | Total
Assets | Homes Under
Construction | | Land Under
Development | | Raw Land | | Total
Inventory | | Total
Assets |
| Northeast | $ | 237,722 |
| | $ | 457,010 |
| | $ | 119,549 |
| | $ | 814,281 |
| | $ | 957,844 |
| $ | 212,611 |
| | $ | 325,241 |
| | $ | 106,681 |
| | $ | 644,533 |
| | $ | 731,259 |
|
| Southeast | 166,302 |
| | 315,208 |
| | 123,209 |
| | 604,719 |
| | 626,506 |
| 139,484 |
| | 274,981 |
| | 146,617 |
| | 561,082 |
| | 599,271 |
|
| Florida | 137,900 |
| | 321,841 |
| | 110,040 |
| | 569,781 |
| | 637,418 |
| 140,366 |
| | 295,631 |
| | 104,766 |
| | 540,763 |
| | 618,449 |
|
| Midwest | | 109,251 |
| | 184,172 |
| | 23,092 |
| | 316,515 |
| | 346,851 |
|
| Texas | 136,325 |
| | 294,814 |
| | 77,125 |
| | 508,264 |
| | 568,974 |
| 130,398 |
| | 223,979 |
| | 57,480 |
| | 411,857 |
| | 466,198 |
|
| North | 268,011 |
| | 360,202 |
| | 91,260 |
| | 719,473 |
| | 803,174 |
| |
| Southwest | 216,067 |
| | 577,656 |
| | 216,554 |
| | 1,010,277 |
| | 1,099,058 |
| |
| West | | 277,636 |
| | 678,231 |
| | 257,512 |
| | 1,213,379 |
| | 1,309,850 |
|
Other homebuilding (a) | 48,390 |
| | 283,770 |
| | 77,513 |
| | 409,673 |
| | 1,904,847 |
| 32,401 |
| | 207,152 |
| | 50,879 |
| | 290,432 |
| | 4,334,591 |
|
| | 1,210,717 |
| | 2,610,501 |
| | 815,250 |
| | 4,636,468 |
| | 6,597,821 |
| 1,042,147 |
| | 2,189,387 |
| | 747,027 |
| | 3,978,561 |
| | 8,406,469 |
|
| Financial Services | — |
| | — |
| | — |
| | — |
| | 287,799 |
| — |
| | — |
| | — |
| | — |
| | 327,674 |
|
| | $ | 1,210,717 |
| | $ | 2,610,501 |
| | $ | 815,250 |
| | $ | 4,636,468 |
| | $ | 6,885,620 |
| $ | 1,042,147 |
| | $ | 2,189,387 |
| | $ | 747,027 |
| | $ | 3,978,561 |
| | $ | 8,734,143 |
|
| |
| (a) | Other homebuilding primarily includes cash and equivalents, capitalized interest, intangibles, deferred tax assets, and other corporate items that are not allocated to the operating segments. |
PULTEGROUP, INC.
NOTES TO CONSOLIDATED FINANCIAL STATEMENTS (continued)
6.5. Investments in unconsolidated entities
We participate in a number of joint ventures with independent third parties. Many of theseThese joint ventures generally purchase, develop, and/orand sell land, and homes.including selling land to us for use in our homebuilding operations. A summary of our joint ventures is presented below ($000’s omitted):
| | | | December 31, | December 31, |
| | 2013 | | 2012 | 2015 | | 2014 |
| Investments in joint ventures with debt non-recourse to PulteGroup | $ | 26,532 |
| | $ | 11,155 |
| $ | 23,236 |
| | $ | 26,488 |
|
| Investments in other active joint ventures | 18,791 |
| | 34,474 |
| 18,031 |
| | 13,880 |
|
| Total investments in unconsolidated entities | $ | 45,323 |
| | $ | 45,629 |
| $ | 41,267 |
| | $ | 40,368 |
|
| | | | | | | |
| Total joint venture debt | $ | 12,408 |
| | $ | 6,915 |
| $ | 16,369 |
| | $ | 25,849 |
|
| | | | | | | |
| PulteGroup proportionate share of joint venture debt: | | | | | | |
| Joint venture debt with limited recourse guaranties | $ | 750 |
| | $ | 769 |
| $ | 226 |
| | $ | 283 |
|
| Joint venture debt non-recourse to PulteGroup | 3,654 |
| | 826 |
| 6,744 |
| | 11,341 |
|
| PulteGroup's total proportionate share of joint venture debt | $ | 4,404 |
| | $ | 1,595 |
| $ | 6,970 |
| | $ | 11,624 |
|
In 20132015, 20122014, and 20112013, we recognized (income) expenseincome from unconsolidated joint ventures of $(1.1)$7.4 million,, $(4.1) $8.4 million,, and $(3.3)$1.1 million,, respectively. During 2013, 2012, respectively (of which $0.2 million and 2011, we$0.1 million for 2014 and 2013, respectively, related to Financial Services). We received distributions from our unconsolidated joint ventures of $6.0 million, $13.1 million, and $3.1 million, in 2015, 2014, and 2013, respectively, and made no significant capital contributions of $1.7 million, $16.5 million, and $4.6 million, respectively, and received capital and earnings distributions of $3.1 million, $10.5 million, and $11.6 million, respectively.during such periods.
The timing of cash obligations under theflows related to a joint venture and any related financing agreements varies by agreement. If additional capital contributions are required and approved by the joint venture, we would need to contribute our pro rata portion of those capital needs in order to not dilute our ownership in the joint ventures. While future capital contributions may be required, we believe the total amount of such contributions will be limited. Our maximum financial loss exposure related to joint ventures is unlikely to exceed the combined investment and limited recourse guaranty totals.
PULTEGROUP, INC.
NOTES TO CONSOLIDATED FINANCIAL STATEMENTS (continued)
7.6. Debt
Our senior notes are summarized as follows ($000’s omitted):
| | | | December 31, | December 31, |
| | 2013 | | 2012 | 2015 | | 2014 |
5.25% unsecured senior notes due January 2014 (a) | $ | — |
| | $ | 187,970 |
| |
5.70% unsecured senior notes due May 2014 (a) | — |
| | 208,274 |
| |
5.20% unsecured senior notes due February 2015 (a) | 95,633 |
| | 95,615 |
| |
5.25% unsecured senior notes due June 2015 (a) | 233,085 |
| | 264,058 |
| $ | — |
| | $ | 236,452 |
|
6.50% unsecured senior notes due May 2016 (a) | 459,581 |
| | 457,154 |
| 464,436 |
| | 462,009 |
|
7.625% unsecured senior notes due October 2017 (b) | 122,663 |
| | 149,481 |
| 122,841 |
| | 122,752 |
|
7.875% unsecured senior notes due June 2032 (a) | 299,196 |
| | 299,152 |
| 299,283 |
| | 299,239 |
|
6.375% unsecured senior notes due May 2033 (a) | 398,567 |
| | 398,492 |
| 398,714 |
| | 398,640 |
|
6.00% unsecured senior notes due February 2035 (a) | 299,443 |
| | 299,417 |
| 299,495 |
| | 299,469 |
|
7.375% unsecured senior notes due June 2046 (a) | 150,000 |
| | 150,000 |
| |
Total senior notes – carrying value (c) | $ | 2,058,168 |
| | $ | 2,509,613 |
| $ | 1,584,769 |
| | $ | 1,818,561 |
|
| Estimated fair value | $ | 2,070,744 |
| | $ | 2,663,451 |
| $ | 1,643,651 |
| | $ | 1,952,774 |
|
| |
| (a) | Redeemable prior to maturity; guaranteed on a senior basis by certain wholly-owned subsidiaries. |
| |
| (b) | Not redeemable prior to maturity; guaranteed on a senior basis by certain wholly-owned subsidiaries. |
| |
| (c) | The recorded carrying value reflects the impact of various discounts and premiums that are amortized to interest cost over the respective terms of the senior notes. |
Refer to Note 14 for supplemental consolidating financial information of the Company.61
PULTEGROUP, INC.
NOTES TO CONSOLIDATED FINANCIAL STATEMENTS (continued)
The indentures governing the senior notes impose certain restrictions on the incurrence of additional debt along with other limitations. At December 31, 20132015, we were in compliance with all of the covenants and requirements under the senior notes.
Total Our senior note principal maturities of $2.1 billion during the five years after 2013 and thereafter are as follows:2014 - $0.0 million; 2015 - $333.6 million; 2016 - $465.2 million; 2017 - $123.0 million; 2018 through 2020- $0.0 million; and thereafter - $1.21.0 billion. Refer to Note 13 for supplemental consolidating financial information of the Company.
Debt retirement
During the last three years, we significantly reduced ourWe retired outstanding senior notes through a variety of transactions, including scheduled maturities, open market repurchases, early redemptions as provided within indenture agreements,totaling $238.0 million, $245.7 million, and tender offers. As a result of these transactions, we reduced our outstanding senior notes by $461.4$461.4 million, $592.4 million, during 2015, 2014, and $323.9 million during 2013,, 2012, respectively. The 2014 and 2011, respectively,2013 retirements occurred prior to the stated maturity dates and recordedresulted in losses totaling $26.9$8.6 million, $32.1 and $26.9 million, in 2014 and $5.6 million in 2013, 2012 and 2011, respectively. Losses on thesedebt repurchase transactions include the write-off of unamortized discounts, premiums, and transaction fees related to the repurchased debt and are reflected in other expense (income), net.
Revolving credit facility
In July 2014, we entered into a senior unsecured revolving credit facility (the “Revolving Credit Facility”) maturing in July 2017. The Revolving Credit Facility provides for maximum borrowings of $500.0 million and contains an uncommitted accordion feature that could increase the size of the Revolving Credit Facility to $1.0 billion, subject to certain conditions and availability of additional bank commitments. The Revolving Credit Facility also provides for the issuance of letters of credit that reduce available borrowing capacity under the Revolving Credit Facility and may total no more than the greater of: (i) 50% of the size of the facility or (ii) $300.0 million in the aggregate. The interest rate on borrowings under the Revolving Credit Facility may be based on either the London Interbank Offered Rate or Base Rate plus an applicable margin, as defined. At December 31, 2015, we had no borrowings outstanding and $191.3 million of letters of credit issued under the Revolving Credit Facility.
The Revolving Credit Facility contains financial covenants that require us to maintain a minimum Tangible Net Worth, a minimum Interest Coverage Ratio, and a maximum Debt-to-Capitalization Ratio (as each term is defined in the Revolving Credit Facility). As of December 31, 2015, we were in compliance with all covenants. Outstanding balances under the Revolving Credit Facility are guaranteed by certain of our wholly-owned subsidiaries. Our available and unused borrowings under the Revolving Credit Facility, net of outstanding letters of credit, amounted to $308.7 million and $291.6 million as of December 31, 2015 and 2014, respectively.
Term loan
On September 30, 2015, we entered into a senior unsecured $500.0 million term loan agreement (the “Term Loan”) with an initial maturity date of January 3, 2017, which can be extended at our option up to 12 months. The interest rate on the Term Loan may be based on either LIBOR or a base rate plus an applicable margin, as defined, and was 1.5% at December 31, 2015. Borrowings are interest only with the principal being due at the maturity date and are guaranteed by certain of our wholly-owned subsidiaries. The Term Loan contains customary affirmative and negative covenants for loans of this type, including the same financial covenants as under the Revolving Credit Facility. As of December 31, 2015, we were in compliance with all covenants.
Limited recourse notes payable
Certain of our local homebuilding operations maintain limited recourse collateralized notes payable with third parties that totaled $35.3 million and $22.3 million at December 31, 2015 and 2014, respectively. These notes have maturities ranging up to six years, are collateralized by the applicable land positions to which they relate, have no recourse to any other assets, and are classified within accrued and other liabilities. The stated interest rates on these notes range up to 5.00%.
PULTEGROUP, INC.
NOTES TO CONSOLIDATED FINANCIAL STATEMENTS (continued)
Letter of credit facilities
We maintain separate cash-collateralized letter of credit agreements with a number of financial institutions. Letters of credit totaling $58.7 million and $54.5 million were outstanding under these agreements at December 31, 2013 and 2012, respectively. Under these agreements, we are required to maintain deposits with the respective financial institutions in amounts approximating the letters of credit outstanding. Such deposits are included in restricted cash.
We also maintain an unsecured letter of credit facility with a bank that expires in September 2014. This facility permits the issuance of up to $150.0 million of letters of credit for general corporate purposes in support of any wholly-owned subsidiary. Letters of credit totaling $124.4 million and $124.6 million were outstanding under this facility at December 31, 2013 and 2012, respectively.
Financial Services
Pulte Mortgage provides mortgage financing for the majority of our home closings utilizing its own funds and funds made available pursuant to credit agreements with third party lenders or through intercompany borrowings. Pulte Mortgage uses these resources to finance its lending activities until the mortgage loans are sold in the secondary market, which generally occurs within 30 days.
Pulte Mortgage maintains a master repurchase agreement (the “Repurchase Agreement”) with third party lenders that expires in lenders. In September 2014. Effective January 2014,2015, Pulte Mortgage voluntarily reducedentered into an amendment to the Repurchase Agreement that extended the effective date to September 2016. The Repurchase Agreement was subsequently amended in December 2015 to increase the borrowing capacity underto $310.0 million. The capacity decreased to $175.0 million on January 19, 2016, and increases to $200.0 million on July 29, 2016. The purpose for the Repurchase Agreement from $150.0 million to $99.8 million subject to certain sublimits. We reducedchanges in capacity during the borrowing capacity in orderterm of the agreement is to lower associated fees during seasonally lowlower volume periods when the additional capacity is unnecessary.of mortgage origination activity. Borrowings under the Repurchase Agreement are secured by residential mortgage loans available-for-sale. The Repurchase Agreement contains various affirmative and negative covenants applicable to Pulte Mortgage, including quantitative thresholds related to net worth, net income, and liquidity. At December 31, 2013, Pulte Mortgage had $105.7$267.9 million and $140.2 million outstanding under the Repurchase Agreement at December 31, 2015, and 2014, respectively, and was in compliance with all of its covenants and requirements. During 2011 and portionsrequirements as of 2012, Pulte Mortgage funded its operations using internal Company resources after allowing its previous third party credit arrangements to expire.such dates.
The following is aggregate borrowing information for our mortgage operations as of each year-end ($000’s omitted):
| | | | December 31, | December 31, | | |
| | 2013 | | 2012 | | 2011 | 2015 | | 2014 |
| Available credit lines | $ | 150,000 |
| | $ | 150,000 |
| | $ | 2,500 |
| $ | 310,000 |
| | $ | 150,000 |
|
| Unused credit lines | $ | 44,336 |
| | $ | 11,205 |
| | $ | 2,500 |
| $ | 42,123 |
| | $ | 9,759 |
|
| Weighted-average interest rate | 2.90 | % | | 3.00 | % | | 4.50 | % | 2.65 | % | | 2.70 | % |
8.
7. Shareholders’ equity
We reinstated our quarterly cash dividend in July 2013. During 2013 weand subsequently raised the quarterly dividend in both 2014 and 2015. Our declared threequarterly cash dividends of $0.05 per common share each.
In Julytotaled $117.9 million, $86.4 million, and $57.5 million in 2015, 2014, and 2013, we increased our commonrespectively. Under the share repurchase authorization to $352.3 millionprogram authorized by our Board of common shares. In 2013,Directors, we repurchased 7.221.2 million, 12.9 million, and $7.2 million shares under the repurchase authorizationin 2015, 2014, and 2013, respectively, for a total of $118.1433.7 million. There were no repurchases under these programs during 2012 or 2011., $245.8 million, and $118.1 million in 2015, 2014, and 2013, respectively. At December 31, 2013,2015, we had remaining authorization to purchase $234.3repurchase $604.8 million of common shares.
Under our stock-based compensation plans, we accept shares as payment under certain conditions related to stock option exercises and vesting of restricted stock, generally related to the payment of minimum tax obligations. During 20132015, 20122014, and 20112013, employees surrendered shares valued at $9.6$9.0 million, $1.0$7.2 million,, and $2.8$9.6 million, respectively, under these plans. Such share transactions are excluded from the above noted share repurchase authorization.
PULTEGROUP, INC.
NOTES TO CONSOLIDATED FINANCIAL STATEMENTS (continued)
9.8. Stock compensation plans
We maintain a stock award plan for both employees and for non-employee directors. The plan provides for the grant of a variety of equity awards, including options (generally non-qualified options), restricted stock,shares, performance shares, and restricted stockshare units ("RSUs") to key employees (as determined by the Compensation and Management Development Committee of the Board of Directors) for periods not exceedingto exceed ten years. Non-employee directors are entitled to an annual distribution of stock options, common shares, or RSUs. All options granted to non-employee directors vest immediately and are exercisable for ten years.years from the grant date. Options granted to employees generally vest incrementally over four years and are generally exercisable for ten years from the vest date. Restricted shares and RSUs generally cliff vest after three years. Restricted stock generally cliff vests after three years.share holders have voting rights during the vesting period and both restricted share and RSU holders receive cash dividends during the vesting period. Performance shares vest upon attainment of the stated performance targets and minimum service requirements and are converted into shares of common stockshares upon distribution. RSUs represent the right to receive an equal number of shares of common stockshares and are converted into shares of common stockshares upon distribution. As of December 31, 2013,2015, there were 22.025.1 million shares that remained available for grant under the plan.
Non-employee directors are entitled to an annual distribution of stock options, common stock, or restricted stock units. All options and RSUs granted to non-employee directors vest immediately and are exercisable on the grant date for ten years.
Our stock compensation expense for the three years ended December 31, 20132015, is presented below ($000's omitted):
| | | | 2013 | | 2012 | | 2011 | 2015 | | 2014 | | 2013 |
| Stock options | $ | 1,056 |
| | $ | 2,617 |
| | $ | 5,228 |
| $ | 37 |
| | $ | 121 |
| | $ | 1,056 |
|
| Restricted stock (including RSUs and performance shares) | 13,418 |
| | 10,077 |
| | 11,231 |
| |
| Restricted shares (including RSUs and performance shares) | | 16,852 |
| | 13,690 |
| | 13,418 |
|
| Long-term incentive plans | 16,006 |
| | 10,203 |
| | 511 |
| 7,863 |
| | 15,481 |
| | 16,006 |
|
| | $ | 30,480 |
| | $ | 22,897 |
| | $ | 16,970 |
| $ | 24,752 |
| | $ | 29,292 |
| | $ | 30,480 |
|
Stock options
A summary of stock option activity for the three years ended December 31, 20132015, is presented below (000’s omitted except per share data):
| | | | 2013 | | 2012 | | 2011 | 2015 | | 2014 | | 2013 |
| | Shares | | Weighted- Average Per Share Exercise Price | | Shares | | Weighted- Average Per Share Exercise Price | | Shares | | Weighted- Average Per Share Exercise Price | Shares | | Weighted- Average Per Share Exercise Price | | Shares | | Weighted- Average Per Share Exercise Price | | Shares | | Weighted- Average Per Share Exercise Price |
| Outstanding, beginning of year | 17,148 |
| | $ | 22 |
| | 21,641 |
| | $ | 21 |
| | 24,004 |
| | $ | 21 |
| 9,370 |
| | $ | 23 |
| | 12,887 |
| | $ | 23 |
| | 17,148 |
| | $ | 22 |
|
| Granted | — |
| | — |
| | — |
| | — |
| | 441 |
| | 8 |
| — |
| | — |
| | — |
| | — |
| | — |
| | — |
|
| Exercised | (1,432 | ) | | 14 |
| | (2,877 | ) | | 11 |
| | — |
| | — |
| (904 | ) | | 12 |
| | (1,422 | ) | | 11 |
| | (1,432 | ) | | 14 |
|
| Forfeited | (2,829 | ) | | 25 |
| | (1,616 | ) | | 27 |
| | (2,804 | ) | | 15 |
| (2,426 | ) | | 37 |
| | (2,095 | ) | | 29 |
| | (2,829 | ) | | 25 |
|
| Outstanding, end of year | 12,887 |
| | $ | 23 |
| | 17,148 |
| | $ | 22 |
| | 21,641 |
| | $ | 21 |
| 6,040 |
| | $ | 19 |
| | 9,370 |
| | $ | 23 |
| | 12,887 |
| | $ | 23 |
|
| Options exercisable at year end | 12,402 |
| | $ | 23 |
| | 15,719 |
| | $ | 23 |
| | 18,845 |
| | $ | 23 |
| 6,040 |
| | $ | 19 |
| | 9,265 |
| | $ | 23 |
| | 12,402 |
| | $ | 23 |
|
Weighted-average per share fair value of options granted during the year | $ | — |
| | | | $ | — |
| | | | $ | 4.46 |
| | | $ | — |
| | | | $ | — |
| | | | $ | — |
| | |
PULTEGROUP, INC.
NOTES TO CONSOLIDATED FINANCIAL STATEMENTS (continued)
The following table summarizes information about the weighted-average remaining contractual lives of stock options outstanding and exercisable at December 31, 20132015:
|
| | | | | | | | | | | | | | | |
| | Options Outstanding | | Options Exercisable |
| | Number Outstanding (000's omitted) | | Weighted- Average Remaining Contract Life (in years) | | Weighted- Average Per Share Exercise Price | | Number Exercisable (000's omitted) | | Weighted- Average Per Share Exercise Price |
| $0.01 to $11.00 | 1,665 |
| | 4.8 | | $ | 10 |
| | 1,444 |
| | $ | 10 |
|
| $11.01 to $18.00 | 4,659 |
| | 5.5 | | 12 |
| | 4,395 |
| | 12 |
|
| $18.01 to $25.00 | 480 |
| | 1.2 | | 23 |
| | 480 |
| | 23 |
|
| $25.01 to $35.00 | 3,894 |
| | 2.0 | | 31 |
| | 3,893 |
| | 31 |
|
| $35.01 to $60.00 | 2,189 |
| | 1.8 | | 41 |
| | 2,190 |
| | 41 |
|
| | 12,887 |
| | 3.6 | | $ | 23 |
| | 12,402 |
| | $ | 23 |
|
|
| | | | | | | | | | | | | | | |
| | Options Outstanding | | Options Exercisable |
| | Number Outstanding (000's omitted) | | Weighted- Average Remaining Contract Life (in years) | | Weighted- Average Per Share Exercise Price | | Number Exercisable (000's omitted) | | Weighted- Average Per Share Exercise Price |
| $0.01 to $10.00 | 326 |
| | 4.8 | | $ | 8 |
| | 326 |
| | $ | 8 |
|
| $10.01 to $20.00 | 3,697 |
| | 3.5 | | 12 |
| | 3,697 |
| | 12 |
|
| $20.01 to $30.00 | 152 |
| | 1.0 | | 28 |
| | 152 |
| | 28 |
|
| $30.01 to $40.00 | 1,865 |
| | 1.0 | | 34 |
| | 1,865 |
| | 34 |
|
| | 6,040 |
| | 2.7 | | $ | 19 |
| | 6,040 |
| | $ | 19 |
|
We did not issue any stock options during 20132015, 2014, or 2012. The fair value of each option grant issued in 2011 was estimated on the date of grant using primarily the Black-Scholes option pricing model with the following weighted-average assumptions:
|
| | | | | | |
| | Weighted-Average Assumptions Year Ended December 31, |
| | 2013 | | 2012 | | 2011 |
| Expected life of options in years | N/A | | N/A | | 6.2 |
|
| Expected stock price volatility | N/A | | N/A | | 58 | % |
| Expected dividend yield | N/A | | N/A | | 0.0 | % |
| Risk-free interest rate | N/A | | N/A | | 2.7 | % |
We estimate the expected life of stock options using employees’ historical exercise behavior and the contractual terms of the instruments. Volatility2013. As a result, there is estimated using historical volatility with consideration for implied volatility.
Totalno unrecognized compensation cost related to unvested stock option awards not yet recognized was $0.2 million at December 31, 20132015. These costs will be expensed over a weighted-average vesting period of approximately one year. The stock option participant agreements provide continued vesting for certain eligible employees who have achieved a predetermined level of service based on their combined age and years of service. We record the related compensation cost for these awards over the period through the date the employee first achieves the minimum level of service that would no longer require them to provide services to earn the award, which is reflected in the weighted-average vesting period.
The intrinsic value of a stock option is the amount by which the market value of the underlying stock exceeds the exercise price of the option. The aggregate intrinsic value of stock options that were exercised during 20132015, 20122014, and 20112013 was $10.89.4 million, $8.614.1 million, and $0.010.8 million, respectively. As of December 31, 20132015, options outstanding had an intrinsic value of $56.725.3 million, of which $51.625.3 million related to options exercisable.
PULTEGROUP, INC.
NOTES TO CONSOLIDATED FINANCIAL STATEMENTS (continued)
Restricted stockshares (including RSUs and performance shares)
A summary of restricted stockshare activity, including RSUs and performance shares, for the three years ended December 31, 20132015, is presented below (000’s omitted, except per share data):
| | | | 2013 | | 2012 | | 2011 | 2015 | | 2014 | | 2013 |
| | Shares | | Weighted- Average Per Share Grant Date Fair Value | | Shares | | Weighted- Average Per Share Grant Date Fair Value | | Shares | | Weighted- Average Per Share Grant Date Fair Value | Shares | | Weighted- Average Per Share Grant Date Fair Value | | Shares | | Weighted- Average Per Share Grant Date Fair Value | | Shares | | Weighted- Average Per Share Grant Date Fair Value |
Unvested at beginning of year | 3,822 |
| | $ | 9 |
| | 3,042 |
| | $ | 9 |
| | 2,915 |
| | $ | 12 |
| |
Outstanding, beginning of year | | 2,890 |
| | $ | 15 |
| | 3,211 |
| | $ | 11 |
| | 3,822 |
| | $ | 9 |
|
| Granted | 806 |
| | $ | 21 |
| | 1,461 |
| | $ | 10 |
| | 1,804 |
| | $ | 7 |
| 932 |
| | $ | 22 |
| | 974 |
| | $ | 19 |
| | 806 |
| | $ | 21 |
|
| Vested | (1,391 | ) | | $ | 11 |
| | (544 | ) | | $ | 11 |
| | (1,434 | ) | | $ | 12 |
| |
| Distributed | | (1,090 | ) | | $ | 10 |
| | (1,019 | ) | | $ | 10 |
| | (1,391 | ) | | $ | 11 |
|
| Forfeited | (26 | ) | | $ | 15 |
| | (137 | ) | | $ | 10 |
| | (243 | ) | | $ | 11 |
| (156 | ) | | $ | 19 |
| | (276 | ) | | $ | 15 |
| | (26 | ) | | $ | 15 |
|
| Unvested at end of year | 3,211 |
| | $ | 11 |
| | 3,822 |
| | $ | 9 |
| | 3,042 |
| | $ | 9 |
| |
| Outstanding, end of year | | 2,576 |
| | $ | 18 |
| | 2,890 |
| | $ | 15 |
| | 3,211 |
| | $ | 11 |
|
| Vested, end of year | 60 |
| | $ | 12 |
| | 51 |
| | $ | 10 |
| | 120 |
| | $ | 11 |
| 89 |
| | $ | 14 |
| | 75 |
| | $ | 13 |
| | 60 |
| | $ | 12 |
|
During 20132015, 20122014, and 20112013, the total fair value of shares vested during the year was $12.7$10.2 million,, $3.7 $8.1 million,, and $15.9$12.7 million,, respectively. Unamortized compensation cost related to restricted stockshare awards was $12.1$16.0 million at December 31, 2013.2015. These costs will be expensed over a weighted-average period of approximately 2 years.
During 2013, 2012, and 2011, we granted performance shares to certain individuals. The fair value of each performance share was calculated using the stock price on the grant date. We recognize expense when it becomes probable that the stated performance targets will be achieved. Unamortized compensation cost related to performance shares considered probable was $1.3 million at December 31, 2013 and will be expensed over a weighted-average period of approximately one year. Additionally, there were 59,70888,727 RSUs outstanding at December 31, 2015, that had vested but had not yet been paid out because the payout date had been deferred by the holder.
Long-term incentive plans
We maintain a long-term incentive plan for certain of our field employees that provides awards based on the achievement of stated performance targets over a three-year period. Awards are earned each year in the form of share units that are paid out in cash at the end of the performance period based upon the number of share units earned times the stockshare price at the end of the performance period. Accordingly, the liability associated with the awards is adjusted each reporting period based on movements in the stockshare price and totaled $12.6$2.7 million and $5.9$9.5 million at December 31, 20132015 and 2012,2014, respectively.
PULTEGROUP, INC.
NOTES TO CONSOLIDATED FINANCIAL STATEMENTS (continued)
During 2012, we implementedWe also maintain a long-term performance award plan for senior management that provides awards based on the achievement of stated performance targets over a three-yearthree-year period. Awards are earned based on our cumulative performance over the performance period and are stated in dollars but settled in common shares based on the stock price at the end of the performance period. If the stockshare price falls below a floor of $5.00$5.00 per share at the end of the performance period or we do not have a sufficient number of shares available under our stock incentive plans at the time of settlement, then a portion of each award will be paid in cash. We recognize expense for these awards based on the probability of achievement of the stated performance targets. The liability for these awards totaled $14.3$20.5 million and $26.2 million at December 31, 20132015. and
2014, respectively.
PULTEGROUP, INC.
NOTES TO CONSOLIDATED FINANCIAL STATEMENTS (continued)
10.9. Income taxes
Components of current and deferred income tax expense (benefit) are as follows ($000’s omitted):
| | | | 2013 | | 2012 | | 2011 | 2015 | | 2014 | | 2013 |
| Current provision (benefit) | | | | | | |
| Current expense (benefit) | | | | | | |
| Federal | $ | 5,725 |
| | $ | (8,523 | ) | | $ | (71,796 | ) | $ | 8,760 |
| | $ | 5,619 |
| | $ | 5,725 |
|
| State and other | (1,596 | ) | | (14,068 | ) | | (28,116 | ) | 1,474 |
| | (13,968 | ) | | (1,596 | ) |
| | $ | 4,129 |
| | $ | (22,591 | ) | | $ | (99,912 | ) | $ | 10,234 |
| | $ | (8,349 | ) | | $ | 4,129 |
|
| Deferred provision (benefit) | | | | | | |
| Deferred expense (benefit) | | | | | | |
| Federal | $ | (1,833,580 | ) | | $ | — |
| | $ | — |
| $ | 277,895 |
| | $ | 232,969 |
| | $ | (1,833,580 | ) |
| State and other | (262,843 | ) | | — |
| | — |
| 33,804 |
| | (9,200 | ) | | (262,843 | ) |
| | $ | (2,096,423 | ) | | $ | — |
| | $ | — |
| $ | 311,699 |
| | $ | 223,769 |
| | $ | (2,096,423 | ) |
| Income tax expense (benefit) | $ | (2,092,294 | ) | | $ | (22,591 | ) | | $ | (99,912 | ) | $ | 321,933 |
| | $ | 215,420 |
| | $ | (2,092,294 | ) |
The following table reconciles the statutory federal income tax rate to the effective income tax rate:
| | | | 2013 | | 2012 | | 2011 | 2015 | | 2014 | | 2013 |
| Income taxes at federal statutory rate | 35.0 | % | | 35.0 | % | | 35.0 | % | 35.0 | % | | 35.0 | % | | 35.0 | % |
| Effect of state and local income taxes, net of federal tax | 4.0 |
| | 3.0 |
| | 3.0 |
| |
| State and local income taxes, net of federal tax | | 2.8 |
| | 3.0 |
| | 4.0 |
|
| Deferred tax asset valuation allowance | (438.0 | ) | | (37.7 | ) | | (7.0 | ) | 0.4 |
| | (6.6 | ) | | (438.0 | ) |
| Tax contingencies | 0.3 |
| | (10.6 | ) | | 28.4 |
| 0.1 |
| | (1.4 | ) | | 0.3 |
|
| Goodwill impairment | — |
| | — |
| | (28.7 | ) | |
| Other | 2.3 |
| | (2.0 | ) | | 1.5 |
| 1.2 |
| | 1.2 |
| | 2.3 |
|
| Effective rate | (396.4 | )% | | (12.3 | )% | | 32.2 | % | 39.5 | % | | 31.2 | % | | (396.4 | )% |
Our effective tax rate was 39.5%, 31.2% and (396.4)% for 2015, 2014, and 2013 respectively. The 2015 effective tax rate exceeds the federal statutory rate, primarily due to state taxes including changes in valuation allowance on state deferred tax assets and revaluation of deferred tax assets due to state law changes and business operations. The 2014 effective tax rate is less than the federal statutory rate primarily due to reversal of a portion of our valuation allowance related to certain state deferred tax assets, along with the favorable resolution of certain federal and state income tax matters. The 2013 effective tax rate differed from the federal statutory rate primarily due to the reversal of substantially all of the valuation allowance related to our federal and certain state deferred tax assets.
PULTEGROUP, INC.
NOTES TO CONSOLIDATED FINANCIAL STATEMENTS (continued)
Deferred tax assets and liabilities reflect temporary differences arising from the different treatment of items for tax and accounting purposes. Components of our net deferred tax asset are as follows ($000’s omitted):
| | | | At December 31, | At December 31, |
| | 2013 | | 2012 | 2015 | | 2014 |
| Deferred tax assets: | | | | | | |
| Accrued insurance | | $ | 237,836 |
| | $ | 254,031 |
|
| Non-deductible reserves and other | $ | 475,730 |
| | $ | 486,990 |
| 155,488 |
| | 191,097 |
|
| Inventory valuation reserves | 770,566 |
| | 953,266 |
| 476,673 |
| | 599,763 |
|
| Net operating loss ("NOL") carryforwards: | | | | | | |
| Federal | 726,398 |
| | 785,302 |
| 367,302 |
| | 515,568 |
|
| State | 292,195 |
| | 320,831 |
| 274,686 |
| | 257,738 |
|
| Alternative minimum tax credits | 28,683 |
| | 25,338 |
| |
| Energy credit and charitable contribution carryforward | 39,978 |
| | 38,895 |
| |
| Alternative minimum tax credit carryforwards | | 44,161 |
| | 34,812 |
|
| Energy and other credit carryforwards | | 28,669 |
| | 27,858 |
|
| | 2,333,550 |
| | 2,610,622 |
| 1,584,815 |
| | 1,880,867 |
|
| Deferred tax liabilities: | | | | | | |
Capitalized items, including real estate basis differences, deducted for tax, net | (39,449 | ) | | (84,637 | ) | (39,220 | ) | | (31,584 | ) |
| Trademarks and tradenames | (50,047 | ) | | (56,714 | ) | (41,664 | ) | | (46,362 | ) |
| | (89,496 | ) | | (141,351 | ) | (80,884 | ) | | (77,946 | ) |
| Valuation allowance | (157,300 | ) | | (2,469,271 | ) | (109,052 | ) | | (82,253 | ) |
| Net deferred tax asset (liability) | $ | 2,086,754 |
| | $ | — |
| |
| Net deferred tax asset | | $ | 1,394,879 |
| | $ | 1,720,668 |
|
PULTEGROUP, INC.
NOTES TO CONSOLIDATED FINANCIAL STATEMENTS (continued)
Our effective tax rategross federal NOL carryforward is affected by a number of factors,approximately $1.0 billion and expires between 2028 and 2032. We also have significant state NOLs in various jurisdictions which may generally be carried forward from 5 to 20 years, depending on the most significant of which are the valuation allowance related to our deferred tax assets and changes in our unrecognized tax benefits. Due to the effects of these factors, our effective tax rates in 2013, 2012, and 2011 are not correlated to the amount of our income or loss before income taxes.jurisdiction. The income tax benefit for 2013 resulted from the reversal of substantially allstate NOL carryforwards expire at various dates as follows: of the valuation allowance relatedtotal state DTA, $32.2 million from 2016 to our deferred2020, $46.1 million from 2021 to 2025, and $196.4 million from 2026 to 2035. In addition, we have federal energy credit carryforwards expiring in 2026 to 2034 and alternative minimum tax assets while the income tax benefits for 2012 and 2011 resulted primarily from the favorable resolution of certain federal and state income tax matters.credits that can be carried forward indefinitely.
From 2007 to 2011, we generated significant deferred tax assets primarily from asset impairments combined with reduced operational profitability. We evaluate our deferred tax assets each period to determine if a valuation allowance is required based on whether it is "more likely than not" that some portion of the deferred tax assets would not be realized. The ultimate realization of these deferred tax assets is dependent upon the generation of sufficient taxable income during future periods. We conduct our evaluation by considering all available positive and negative evidence. This evaluation considers, among other factors, historical operating results, forecasts of future profitability, the duration of statutory carryforward periods, and the outlooks for the U.S. housing industry and broader economy.
As a result of the merger with Centex in 2009, our ability to use certain of Centex’s pre-ownership change NOL carryforwards and built-in losses or deductions is limited by Section 382 of the Internal Revenue Code. We do not believe that the Section 382 limitation will prevent the Company from using Centex’s pre-ownership change federal NOL carryforwards and built-in losses. We do believe that certain of our state NOL carryforwards will be limited due to Section 382.
The accounting for deferred taxes is based upon estimates of future results. Differences between estimated and actual results could result in changes in the valuation of our deferred tax assets that could have a material impact on our consolidated results of operations or financial position. Changes in existing tax laws could also affect actual tax results and the realization of deferred tax assets over time. In 2014, we recorded an income tax benefit of $45.6 million as the result of a reversal of valuation allowance related primarily to certain of our state deferred tax assets as the result of an increase in expected future taxable income in certain jurisdictions.
In 2013, we recorded an income tax benefit of $2.1 billion as the result of a reversal of valuation allowance. Based on our evaluation through June 30, 2013,previous evaluations, we had fully reserved our net deferred tax assets due to the uncertainty of their realization. One of the primary pieces of negative evidence we considered was the significant losses we had incurred in the recent years prior to 2013, including being in a three-year cumulative pre-tax loss position, which we exited in 2013. During 2013, we
Consistent with the above process, we evaluated the need for a valuation allowance against our deferred tax assets and, in the third quarter of 2013, PULTEGROUP, INC.
NOTES TO CONSOLIDATED FINANCIAL STATEMENTS (continued)
determined that the valuation allowance against substantially all of our federal deferred tax assets and a significant portion of our state deferred tax assets was no longer required. Accordingly, we reversed $2.1 billion of valuation allowance in the third quarter. When a change in valuation allowance is recognized in an interim period, a portion of the valuation allowance to be reversed must be allocated to the remaining interim periods. Accordingly, an additional $73.7 million of the remaining valuation allowance reversed in the fourth quarter of 2013, which was offset by a tax provision based on fourth quarter earnings. At December 31, 2013, the valuation allowance relates primarily to state net operating loss carryforwards that have not met the "more likely than not" realization threshold.allowance.
We conductedconduct our evaluationevaluations by considering all available positive and negative evidence. The principal positive evidence that led to the reversal of the valuation allowance in 2013 included: (1) our emergence from a three-year cumulative loss in 2013; (2) the significant positive income we generated during 2012 and 2013, including seven consecutive quarters of pretax income as of December 31, 2013; (3) continued improvements in 2013 over recent years in other key operating metrics, including revenues, gross margin, and overhead leverage; (4) our forecasted future profitability; (5) improvement in our financial position; and (6) significant evidence that conditions in the U.S. housing industry arewere more favorable than in recent years and our belief that conditions willwould continue to be favorable over the long-term. Even if industry conditions weaken from current levels, we believe we will be able to adjust our operations to sustain long-term profitability.
The accounting for deferred taxes is based upon estimatesAs a result of future results. Differences between estimated and actual results could result in changes incertain realization requirements of ASC 718, the valuation of our deferred tax assets that could have a material impact on our consolidated results of operations or financial position. Changes in existing tax laws could also affect actual tax results and the realizationtable of deferred tax assets over time. and liabilities does not include certain deferred tax assets as of December 31, 2015 and 2014, that arose directly from tax deductions related to equity compensation greater than compensation recognized for financial reporting. Equity will be increased by $19.4 million if and when such deferred tax assets are ultimately realized. We use the with-and-without approach when determining when excess tax benefits have been realized.
Our gross federal NOL carryforward is approximately $2.1 billion, a portion of which is subject to the provisions of Internal Revenue Code Section 382. We also have significant state NOLs in various tax jurisdictions. These NOLs may generally be carried forward from 5 to 20 years, depending on the tax jurisdiction, with NOLs expiring between 2014 and 2033.
As a result of our merger with Centex in 2009, our ability to use certain of Centex’s pre-ownership change NOL carryforwards and built-in losses or deductions is limited by Section 382 of the Internal Revenue Code. Our Section 382 limitation is approximately $67.4 million per year for NOLs, losses realized on built-in loss assets that are sold within 60 months of the ownership change, and certain deductions. We do not believe that the Section 382 limitation will prevent the Company from using Centex’s pre-ownership change federal NOL carryforwards and built-in losses or deductions.
PULTEGROUP, INC.
NOTES TO CONSOLIDATED FINANCIAL STATEMENTS (continued)
Unrecognized tax benefits represent the difference between tax positions taken or expected to be taken in a tax return and the benefits recognized for financial statement purposes. At December 31, 2013, weWe had $173.3$39.0 million and $32.9 million of gross unrecognized tax benefits of which $21.5at December 31, 2015 and 2014, respectively. Of these amounts, $39.0 million (net of federal benefit) and $32.9 million, respectively, would impact the effective tax rate if recognized. At Additionally, we had accrued interest and penalties of $17.2 million and $17.3 million at December 31, 2012, we had $170.4 million of gross unrecognized tax benefits, of which $166.3 million would impact the effective rate if recognized. 2015 and 2014, respectively.
It is reasonably possible within the next twelve months that our gross unrecognized tax benefits may decrease by up to $128.2$35.0 million,, excluding interest and penalties, primarily due to expirations of certain statutes of limitations and potential settlements. Additionally, we had accrued interestA reconciliation of the change in the unrecognized tax benefits is as follows ($000’s omitted):
|
| | | | | | | | | | | |
| | 2015 | | 2014 | | 2013 |
| Unrecognized tax benefits, beginning of period | $ | 32,911 |
| | $ | 173,310 |
| | $ | 170,425 |
|
| Increases related to tax positions taken during a prior period | 5,763 |
| | — |
| | 12,877 |
|
| Decreases related to tax positions taken during a prior period | — |
| | (133,883 | ) | | (7,502 | ) |
Increases related to tax positions taken during the current period | 318 |
| | 237 |
| | 381 |
|
| Decreases related to settlements with taxing authorities | — |
| | (6,753 | ) | | (1,434 | ) |
Reductions as a result of a lapse of the applicable statute of limitations | — |
| | — |
| | (1,437 | ) |
| Unrecognized tax benefits, end of period | $ | 38,992 |
| | $ | 32,911 |
| | $ | 173,310 |
|
We continue to participate in the Compliance Assurance Process (“CAP”) with the IRS as an alternative to the traditional IRS examination process. As a result of our participation in CAP, federal tax years 2013 and penaltiesprior are closed. Tax year 2014 is expected to close by the second quarter of $33.1 million2016, and $31.5 million at December 31, 2013 and 2012, respectively. Our net tax-related interest and penalties totaled expensetax year 2015 is expected to close by the second quarter of $3.0 million in 2013 and a benefit of $5.4 million in 2012.
2017. We are currently under examination by the IRS and various state taxing jurisdictions and anticipate finalizing certain of the examinations within the next twelve months. The final outcome of these examinations is not yet determinable. The statute of limitations for our major tax jurisdictions remains open for examination for tax years 20032005 to 2013.
A reconciliation of the change in the unrecognized tax benefits is as follows ($000’s omitted):
|
| | | | | | | | | | | |
| | 2013 | | 2012 | | 2011 |
| Unrecognized tax benefits, beginning of period | $ | 170,425 |
| | $ | 171,863 |
| | $ | 258,016 |
|
| Increases related to tax positions taken during a prior period | 12,877 |
| | 8,782 |
| | 2,699 |
|
| Decreases related to tax positions taken during a prior period | (7,502 | ) | | (9,373 | ) | | (79,719 | ) |
Increases related to tax positions taken during the current period | 381 |
| | 11,797 |
| | 1,620 |
|
| Decreases related to settlements with taxing authorities | (1,434 | ) | | — |
| | — |
|
Reductions as a result of a lapse of the applicable statute of limitations | (1,437 | ) | | (12,644 | ) | | (10,753 | ) |
| Unrecognized tax benefits, end of period | $ | 173,310 |
| | $ | 170,425 |
| | $ | 171,863 |
|
2015.
PULTEGROUP, INC.
NOTES TO CONSOLIDATED FINANCIAL STATEMENTS (continued)
11.10. Fair value disclosures
ASC 820, “Fair Value Measurements and Disclosures,” provides a framework for measuring fair value in generally accepted accounting principles and establishes a fair value hierarchy which requires an entity to maximize the use of observable inputs and minimize the use of unobservable inputs when measuring fair value. The fair value hierarchy can be summarized as follows:
|
| | |
| Level 1 | | Fair value determined based on quoted prices in active markets for identical assets or liabilities. |
| | |
| Level 2 | | Fair value determined using significant observable inputs, generally either quoted prices in active markets for similar assets or liabilities or quoted prices in markets that are not active. |
| | |
| Level 3 | | Fair value determined using significant unobservable inputs, such as pricing models, discounted cash flows, or similar techniques |
Our assets and liabilities measured or disclosed at fair value are summarized below ($000’s omitted):
| | | Financial Instrument | | Fair Value
Hierarchy | | Fair Value | | Fair Value
Hierarchy | | Fair Value |
December 31,
2013 | | December 31,
2012 | December 31,
2015 | | December 31,
2014 |
| | | | | | | | | | | | | |
| Measured at fair value on a recurring basis: | | | | | | | | |
| Residential mortgage loans available-for-sale | | Level 2 | | $ | 287,933 |
| | $ | 318,931 |
| | Level 2 | | $ | 442,715 |
| | $ | 339,531 |
|
| Interest rate lock commitments | | Level 2 | | 3,139 |
| | 6,021 |
| | Level 2 | | 5,574 |
| | 4,248 |
|
| Forward contracts | | Level 2 | | 4,340 |
| | (646 | ) | | Level 2 | | 338 |
| | (3,574 | ) |
| Whole loan commitments | | Level 2 | | 105 |
| | (55 | ) | | Level 2 | | 13 |
| | (588 | ) |
| | | | | | | | | |
| Measured at fair value on a non-recurring basis: | | | | | | | | |
| House and land inventory | | Level 3 | | $ | — |
| | $ | 11,243 |
| | Level 3 | | $ | 11,052 |
| | $ | 13,925 |
|
| | | | | | | | | |
| Disclosed at fair value: | | | | | | | | |
| Cash and equivalents (including restricted cash) | | Level 1 | | $ | 1,653,044 |
| | $ | 1,476,710 |
| | Level 1 | | $ | 775,435 |
| | $ | 1,309,220 |
|
| Financial Services debt | | Level 2 | | 105,664 |
| | 138,795 |
| | Level 2 | | 267,877 |
| | 140,241 |
|
| Term loan | | | Level 2 | | 500,000 |
| | — |
|
| Senior notes | | Level 2 | | 2,070,744 |
| | 2,663,451 |
| | Level 2 | | 1,643,651 |
| | 1,952,774 |
|
Fair values for agency residential mortgage loans available-for-sale are determined based on quoted market prices for comparable instruments. Fair values for non-agency residential mortgage loans available-for-sale are determined based on purchase commitments from whole loan investors and other relevant market information available to management. Fair values for interest rate lock commitments, including the value of servicing rights, are based on market prices for similar instruments. Forward contracts on mortgage-backed securities are valued based on market prices for similar instruments. Fair values for whole loan investor commitments are based on market prices for similar instruments from the specific whole loan investor.
Certain assets are required to be recorded at fair value on a non-recurring basis when events and circumstances indicate that the carrying value may not be recoverable. The non-recurring fair valuesvalue included in the above table above represent only those assets whose carrying values were adjusted to fair value as of the respective balance sheet dates. See Note 1 for a more detailed discussion of the valuation methods used for inventory.
The carrying amounts of cash and equivalents, and Financial Services debt, the Term Loan, and the Revolving Credit Facility approximate their fair values due to their short-term nature.nature and floating interest rate terms. The fair values of senior notes are based on quoted market prices, when available. If quoted market prices are not available, fair values are based on quoted market prices of similar issues. The carrying value of senior notes was $2.1$1.6 billion and $2.5$1.8 billion,, at December 31, 20132015 and 20122014, respectively.
PULTEGROUP, INC.
NOTES TO CONSOLIDATED FINANCIAL STATEMENTS (continued)
12.11. Other assets and accrued and other liabilities
Other assets are presented below ($000’s omitted):
| | | | December 31, | December 31, |
| | 2013 | | 2012 | 2015 | | 2014 |
| $ | 137,428 |
| | $ | 123,268 |
| |
| Accounts and notes receivable: | | | | |
| | $ | 130,170 |
| | $ | 60,598 |
|
| Notes receivable | | 28,288 |
| | 30,699 |
|
| Other receivables | | 83,177 |
| | 63,867 |
|
| | | 241,635 |
| | 155,164 |
|
| Prepaid expenses | 65,965 |
| | 74,737 |
| 109,113 |
| | 72,585 |
|
Deposits and pre-acquisition costs (Note 1) | 91,034 |
| | 70,116 |
| 162,119 |
| | 127,280 |
|
| 53,051 |
| | 44,183 |
| 86,312 |
| | 75,219 |
|
| Income taxes receivable | 35,437 |
| | 31,924 |
| |
| | 25,080 |
| | 21,330 |
|
| Other | 77,706 |
| | 63,447 |
| 46,840 |
| | 91,640 |
|
| | $ | 460,621 |
| | $ | 407,675 |
| $ | 671,099 |
| | $ | 543,218 |
|
We record receivables from various parties in the normal course of business, including amounts due from insurance companies (see Note 12), municipalities, and vendors. In certain instances, we may accept consideration for land sales or other transactions in the form of a note receivable.
Accrued and other liabilities are presented below ($000’s omitted):
|
| | | | | | | |
| | December 31, |
| | 2013 | | 2012 |
| $ | 668,100 |
| | $ | 721,284 |
|
| 124,956 |
| | 164,280 |
|
| Compensation-related | 171,686 |
| | 119,288 |
|
| 63,992 |
| | 64,098 |
|
Community development district obligations (Note 13) | 26,124 |
| | 33,119 |
|
Liability for land, not owned, under option agreements (Note 1) | 24,024 |
| | 31,066 |
|
| Accrued interest | 22,283 |
| | 28,713 |
|
| Other | 276,585 |
| | 256,215 |
|
| | $ | 1,377,750 |
| | $ | 1,418,063 |
|
|
| | | | | | | |
| | December 31, |
| | 2015 | | 2014 |
| $ | 692,053 |
| | $ | 710,245 |
|
| 46,381 |
| | 58,222 |
|
| Compensation-related | 124,798 |
| | 142,586 |
|
| 61,179 |
| | 65,389 |
|
Community development district obligations (Note 12) | 11,964 |
| | 17,122 |
|
| Accrued interest | 20,541 |
| | 20,446 |
|
| Limited recourse notes payable | 35,336 |
| | 22,255 |
|
| Dividends payable | 31,568 |
| | 29,682 |
|
| Other | 260,453 |
| | 277,827 |
|
| | $ | 1,284,273 |
| | $ | 1,343,774 |
|
13.
PULTEGROUP, INC.
NOTES TO CONSOLIDATED FINANCIAL STATEMENTS (continued)
12. Commitments and contingencies
Leases
We lease certain property and equipment under non-cancelable operating leases. The future minimum lease payments required under operating leases that have initial or remaining non-cancelable terms in excess of one year as of December 31, 20132015, are as follows ($000’s omitted):
| | | Years Ending December 31, | | |
| 2014 | $ | 28,116 |
| |
| 2015 | 25,835 |
| |
| 2016 | 22,215 |
| $ | 28,561 |
|
| 2017 | 15,374 |
| 21,353 |
|
| 2018 | 13,033 |
| 18,320 |
|
| 2019 | | 15,981 |
|
| 2020 | | 8,940 |
|
| Thereafter | 56,235 |
| 34,974 |
|
Total minimum lease payments (a) | $ | 160,808 |
| $ | 128,129 |
|
| |
| (a) | Minimum payments have not been reduced by minimum sublease rentals of $10.72.5 million due in the future under non-cancelable subleases. |
Net rental expense for 20132015, 20122014, and 20112013 was $23.027.7 million, $24.225.3 million, and $26.723.0 million, respectively. Certain leases contain renewal or purchase options and generally provide that we pay for insurance, taxes, and maintenance.
PULTEGROUP, INC.
NOTES TO CONSOLIDATED FINANCIAL STATEMENTS (continued)
Loan origination liabilities
Our mortgage operations may be responsible for losses associated with mortgage loans originated and sold to investors in the event of errors or omissions relating to representations and warranties made by us that the loans met certain requirements, including representations as to underwriting standards, the existence of primary mortgage insurance, and the validity of certain borrower representations in connection with the loan. If a loan is determined to be faulty, we either repurchase the loans from the investors or reimburse the investors' losses (a “make-whole” payment).
In recent years, we experienced a significant increase inEstimating the required liability for these potential losses related to repurchase requests as a result of the high level of loan defaults and related losses in the mortgage industry and increasing aggressiveness by investors in presenting such claims to us. To date, the significant majority of these losses relates to loans originated in 2006 and 2007, during which period inherently riskier loan products became more common in the mortgage origination market. In 2006 and 2007, we originated $39.5 billion of loans, excluding loans originated by Centex's former subprime loan business sold by Centex in 2006. Because we generally do not retain the servicing rights to the loans we originate, information regarding the current and historical performance, credit quality, and outstanding balances of such loans is limited. Estimating these loan origination liabilities is further complicated by uncertainties surrounding numerous external factors, such as various macroeconomic factors (including unemployment rates and changes in home prices), actions taken by third parties, including the parties servicing the loans, and the U.S. federal government in its dual capacity as regulator of the U.S. mortgage industry and conservator of the government-sponsored enterprises commonly known as Fannie Mae and Freddie Mac, which own or guarantee the majority of mortgage loans in the U.S.
Most requests received to date relate to make-whole payments on loans that have been foreclosed. Requests undergo extensive analysis to confirm the exposure, attempt to cure the identified defect, and, when necessary, determine our liability. We establish liabilities for such anticipated losses based upon, among other things, the level of current unresolved repurchase requests, the volume of estimated probable future repurchase requests, our ability to cure the defects identified in the repurchase requests, and the severity of the estimated loss upon repurchase. Determining these estimates and the resulting liability requires a significant level of management judgment. We are generally able to cure or refute over 60%During 2015 and 2014, we reduced our loan origination liabilities by net reserve releases of the$11.4 million and $18.6 million, respectively, based on probable settlements of various repurchase requests received from investors such that we do not believe repurchases or make-whole payments will ultimately be required. For those requests that we believe will result in repurchases or make-whole payments, actual loss severities are expected to approximate 50% of the outstanding principal balance.
During 2012and 2011, we recorded provisions for losses as a change in estimate primarily to reflect projected claim volumes in excess of previous estimates. Such provisions for lossescurrent conditions. Reserves provided (released) are reflected in Financial Services expenses. Given the ongoing volatility in the mortgage industry, our lack of visibility into the current status of the review process of loans by investors, the claim volumes we continue to experience, changes in values of underlying collateral over time, and other uncertainties regarding the ultimate resolution of these claims, actual costs could differ from our current estimates.
Changes in these liabilities were as follows ($000's omitted):
|
| | | | | | | | | | | |
| | 2013 | | 2012 | | 2011 |
| Liabilities, beginning of period | $ | 164,280 |
| | $ | 128,330 |
| | $ | 93,057 |
|
| Reserves provided | — |
| | 49,025 |
| | 59,349 |
|
| Payments | (39,324 | ) | | (13,075 | ) | | (24,076 | ) |
| Liabilities, end of period | $ | 124,956 |
| | $ | 164,280 |
| | $ | 128,330 |
|
We entered into an agreement in conjunction with the wind down of Centex's mortgage operations, which ceased loan origination activities in December 2009, that provides a guaranty for one major investor of loans originated by Centex. This guaranty provides that we will honor the potential repurchase obligations of Centex's mortgage operations related to breaches of representations and warranties in the origination of a certain pool of loans. Other than with respect to this pool of loans, our contractual repurchase obligations are limited to our mortgage subsidiaries, which are included in non-guarantor subsidiaries (see Note 14 for a discussion of non-guarantor subsidiaries). |
| | | | | | | | | | | |
| | 2015 | | 2014 | | 2013 |
| Liabilities, beginning of period | $ | 58,222 |
| | $ | 124,956 |
| | $ | 164,280 |
|
| Reserves provided (released), net | (11,433 | ) | | (18,604 | ) | | — |
|
| Payments | (408 | ) | | (48,130 | ) | | (39,324 | ) |
| Liabilities, end of period | $ | 46,381 |
| | $ | 58,222 |
| | $ | 124,956 |
|
PULTEGROUP, INC.
NOTES TO CONSOLIDATED FINANCIAL STATEMENTS (continued)
The mortgage subsidiary of Centex also sold loans to a bank for inclusion in residential mortgage-backed securities (“RMBSs”) issued by the bank. In connection with these sales, Centex's mortgage subsidiary entered into agreements pursuant to which it may be required to indemnify the bank for losses incurred by investors in the RMBSs arising out of material errors or omissions in certain information provided by the mortgage subsidiary relating to the loans and loan origination process. In 2011, the bank notified us that it has been named defendant in two lawsuits alleging various violations of federal and state securities laws asserting that untrue statements of material fact were included in the registration statements used to market the sale of two RMBS transactions which included $162 million of loans originated by Centex's mortgage subsidiary. The plaintiffs seek unspecified compensatory and/or rescissory damages on behalf of persons who purchased the securities. Neither Centex's mortgage subsidiary nor the Company is named as a defendant in these actions. We cannot yet quantify Centex's mortgage subsidiary's potential liability as a result of these indemnification obligations. We do not believe, however, that these matters will have a material adverse impact on the results of operations, financial position, or cash flows of the Company. We are aware of six other RMBS transactions with similar indemnity provisions that include an aggregate $116 million of loans originated by Centex's mortgage subsidiary, and we are not aware of any current or threatened legal proceedings regarding those transactions.
Community development and other special district obligations
A community development district or similar development authority (“CDD”) is a unit of local government created under various state statutes that utilizes the proceeds from the sale of bonds to finance the construction or acquisition of infrastructure assets of a development. A portion of the liability associated with the bonds, including principal and interest, is assigned to each parcel of land within the development. This debt is typically paid by subsequent special assessments levied by the CDD on the landowners. Generally, we are only responsible for paying the special assessments for the period during which we are the landowner of the applicable parcels. However, in certain limited instances we record a liability for future assessments if the assessments are fixed or determinable for a fixed or determinable period.assessments. At December 31, 20132015 and 20122014, we had recorded $26.112.0 million and $33.117.1 million, respectively, in accrued liabilities for outstanding CDD obligations.
Letters of credit and surety bonds
In the normal course of business, we post letters of credit and surety bonds pursuant to certain performance-related obligations, as security for certain land option agreements, and under various insurance programs. The majority of these letters of credit and surety bonds are in support of our land development and construction obligations to various municipalities, other government agencies, and utility companies related to the construction of roads, sewers, and other infrastructure. We had outstanding letters of credit and surety bonds totaling $183.1$191.3 million and $958.3 million,$1.0 billion, respectively, at December 31, 2013,2015, and $179.2$212.1 million and $1.0$1.0 billion,, respectively, at December 31, 2012.2014. In the event any such letter of credit or surety bonds are called,is drawn, we would be obligated to reimburse the issuer of the letter of credit or surety bond. We do not believe that a material amount, if any, of the letters of credit or surety bonds will be called.drawn. Our surety bonds generally do not have stated expiration dates; rather we are released from the surety bonds as the underlying contractual performance is completed. Because significant construction and development work has been performed related to the applicable projects but has not yet received final acceptance by the respective counterparties, the aggregate amount of surety bonds outstanding is in excess of the projected cost of the remaining work to be performed.
Litigation and regulatory matters
We are involved in various litigation and legal claims in the normal course of our business operations, including actions brought on behalf of various classes of claimants. We are also subject to a variety of local, state, and federal laws and regulations related to land development activities, house construction standards, sales practices, mortgage lending operations, employment practices, and protection of the environment. As a result, we are subject to periodic examination or inquiry by various governmental agencies that administer these laws and regulations.
PULTEGROUP, INC.
NOTES TO CONSOLIDATED FINANCIAL STATEMENTS (continued)
We establish liabilities for legal claims and regulatory matters when such matters are both probable of occurring and any potential loss is reasonably estimable. We accrue for such matters based on the facts and circumstances specific to each matter and revise these estimates as the matters evolve. In such cases, there may exist an exposure to loss in excess of any amounts currently accrued. In view of the inherent difficulty of predicting the outcome of these legal and regulatory matters, we generally cannot predict the ultimate resolution of the pending matters, the related timing, or the eventual loss. While the outcome of such contingencies cannot be predicted with certainty, we do not believe that the resolution of such matters will have a material adverse impact on our results of operations, financial position, or cash flows. However, to the extent the liability arising from the ultimate resolution of any matter exceeds the estimates reflected in the recorded reserves relating to such matter, we could incur additional charges that could be significant.
In September 2012, Applecross Club Operations ("Applecross") filed a complaint for breach of contract and promissory estoppel in Applecross v. Pulte Homes of PA, et al. The complaint alleged that we induced Applecross to purchase a golf course from us in 2010 by promising to build over 1,000 residential units in a planned community located outside Philadelphia, Pennsylvania. In September 2015, the jury in the case found in favor of Applecross and awarded damages in the amount of $20.0 million. We believe we have meritorious defenses and have filed post-trial motions seeking to, among other things, overturn the jury verdict. If unsuccessful, we plan to appeal the award. However, in light of the jury’s verdict, we recorded a reserve of $20.0 million in 2015, which is reflected in other expense, net
During 2013, we settled a number of claims related to a previously completed luxury community in a market we have since exited. The claims related to a contractual dispute with certain homeowners. Substantially all of these claims have been resolved. As thea result of these settlements, we recorded charges of $41.2$41.2 million during 2013,. We believe that the final resolution of all matters related to these claims will not vary materially from our current estimates. which are reflected in other expense, net.
PULTEGROUP, INC.
NOTES TO CONSOLIDATED FINANCIAL STATEMENTS (continued)
Allowance for warranties
Home purchasers are provided with a limited warranty against certain building defects, including a one-year comprehensive limited warranty and coverage for certain other aspects of the home’s construction and operating systems for periods of up to 10 years. We estimate the costs to be incurred under these warranties and record liabilities in the amount of such costs at the time product revenue is recognized. Factors that affect our warranty liabilities include the number of homes sold, historical and anticipated rates of warranty claims, and the cost per claim. We periodically assess the adequacy of the warranty liabilities for each geographic market in which we operate and adjust the amounts as necessary. Actual warranty costs in the future could differ from the current estimates. Changes to warranty liabilities were as follows ($000’s omitted):
| | | | 2013 | | 2012 | | 2011 | 2015 | | 2014 | | 2013 |
| Warranty liabilities, beginning of period | $ | 64,098 |
| | $ | 68,025 |
| | $ | 80,195 |
| $ | 65,389 |
| | $ | 63,992 |
| | $ | 64,098 |
|
| Reserves provided | 49,399 |
| | 45,705 |
| | 43,875 |
| 52,684 |
| | 51,348 |
| | 49,399 |
|
| Payments | (44,925 | ) | | (45,365 | ) | | (54,766 | ) | (60,968 | ) | | (47,968 | ) | | (44,925 | ) |
| Other adjustments | (4,580 | ) | | (4,267 | ) | | (1,279 | ) | 4,074 |
| | (1,983 | ) | | (4,580 | ) |
| Warranty liabilities, end of period | $ | 63,992 |
| | $ | 64,098 |
| | $ | 68,025 |
| $ | 61,179 |
| | $ | 65,389 |
| | $ | 63,992 |
|
Self-insured risks
We maintain, and require our subcontractors to maintain, general liability insurance coverage. We also maintain builders' risk, property, errors and omissions, workers compensation, and other business insurance coverage. These insurance policies protect us against a portion of the risk of loss from claims. However, we retain a significant portion of the overall risk for such claims either through policies issued by our captive insurance subsidiaries or through our own self-insured per occurrence and aggregate retentions, deductibles, and claims in excess of available insurance policy limits.
Our general liability insurance includes coverage for certain construction defects. While construction defect claims can relate to a variety of circumstances, the majority of our claims relate to alleged problems with siding, plumbing, foundations and other concrete work, windows, roofing, and heating, ventilation and air conditioning systems. The availability of general liability insurance for the homebuilding industry and its subcontractors has become increasingly limited, and the insurance policies available require companies to maintain significant per occurrence and aggregate retention levels. In certain instances, we may offer our subcontractors the opportunity to purchase insurance through one of our captive insurance subsidiaries or to participate in a project-specific insurance program provided by the Company.us. Policies issued by the captive insurance subsidiaries represent self-insurance of these risks by the Company.us. This self-insured exposure is limited by reinsurance policies that we purchase. General liability coverage for the homebuilding industry is complex, and our coverage varies from policy year to policy year. Our insurance coverage requires a per occurrence deductible up to an overall aggregate retention level. Beginning with the first dollar, amounts paid onto satisfy insured claims satisfyapply to our per occurrence and aggregate retention obligations. Any amounts incurred in excess of the occurrence or aggregate retention levels are covered by insurance up to our purchased coverage levels. Our insurance policies, including the captive insurance subsidiaries' reinsurance policies, are maintained with highly-rated underwriters for whom we believe counterparty default risk is not significant.
PULTEGROUP, INC.
NOTES TO CONSOLIDATED FINANCIAL STATEMENTS (continued)
At any point in time, we are managing over 1,000 individual claims related to general liability, property, errors and omission, workers compensation, and other business insurance coverage. We reserve for costs associated with such claims (including expected claims management expenses) on an undiscounted basis at the time revenue is recognized for each home closing and evaluate the recorded liabilities based on actuarial analyses of our historical claims. The actuarial analyses calculate estimates of the ultimate net cost of all unpaid losses, including estimates for incurred but not reported losses ("IBNR"). IBNR represents losses related to claims incurred but not yet reported plus development on reported claims. These
Our recorded reserves for all such claims totaled $692.1 million and $710.2 million at December 31, 2015 and 2014, respectively, the vast majority of which relates to general liability claims. The recorded reserves include loss estimates related to both (i) existing claims and related claim expenses and (ii) IBNR and related claim expenses. Liabilities related to IBNR and related claim expenses represented approximately 65% and 72% of the total general liability reserves at December 31, 2015 and 2014, respectively. The actuarial analyses that determine the IBNR portion of reserves consider a variety of factors, including the frequency and severity of losses, which are based on our historical claims experience
PULTEGROUP, INC.
NOTES TO CONSOLIDATED FINANCIAL STATEMENTS (continued)
supplemented by industry data. The actuarial analyses of the reserves also consider historical third party recovery rates and claims management expenses.
Housing market conditions have been volatile across most of our markets over the past ten years, and we believe such conditions can affect the frequency and cost of construction defect claims. Additionally, IBNR estimates comprise a significant portionthe majority of our liability and are subject to a high degree of uncertainty due to a variety of factors, including changes in claims reporting and resolution patterns, third party recoveries, insurance industry practices, the regulatory environment, and legal precedent. State regulations vary, but construction defect claims are reported and resolved over an extended period often exceeding ten years. In certain instances, we have the ability to recover a portion of our costs under various insurance policies or from subcontractors or other third parties. Estimates of such amounts are recorded when recovery is considered probable.
Our recorded reserves for all such claims totaled $668.1 million and $721.3 million at December 31, 2013 and 2012, respectively, the vast majority of which relates to general liability claims. The recorded reserves include loss estimates related to both (i) existing claims and related claim expenses and (ii) IBNR and related claim expenses. Liabilities related to IBNR and related claim expenses represented approximately 78% and 74% of the total general liability reserves at December 31, 2013 and 2012, respectively. The actuarial analyses that determine the IBNR portion of reserves consider a variety of factors, including the frequency and severity of losses, which are based on our historical claims experience supplemented by industry data. The actuarial analyses of the reserves also consider historical third party recovery rates and claims management expenses.
Adjustments to reserves are recorded in the period in which the change in estimate occurs. Because the majority of our reserves relate to IBNR, adjustments to reserve amounts for individual existing claims generally do not impact the recorded reserves materially. However, changesChanges in the frequency and timing of reported claims and estimates of specific claim values can impact the underlying inputs and trends utilized in the actuarial analyses, which could have a material impact on the recorded reserves. Additionally, the amount of insurance coverage available for each policy period also impacts our recorded reserves. Because of the inherent uncertainty in estimating future losses related and the timing of such losses related to these claims, actual costs could differ significantly from estimated costs.
Adjustments to reserves are recorded in the period in which the change in estimate occurs. During 2015, we recorded general liability reserve reversals of $32.6 million resulting from a legal settlement and $29.6 million related to changes in our actuarial estimates resulting from favorable claims experience relative to previous actuarial projections. During 2014, we increased general liability insurance reserves by $69.3 million, which was primarily driven by estimated costs associated with siding repairs in certain previously completed communities that, in turn, impacted actuarial estimates for potential future claims. Such adjustments are reflected in "Reserves provided, net" in the below table.
Costs associated with our insurance programs are classified within selling, general, and administrative expenses. Changes in these liabilities were as follows ($000's omitted):
| | | | 2013 | | 2012 | | 2011 | 2015 | | 2014 | | 2013 |
| Balance, beginning of period | $ | 721,284 |
| | $ | 739,029 |
| | $ | 787,918 |
| $ | 710,245 |
| | $ | 668,100 |
| | $ | 721,284 |
|
| Reserves provided | 64,737 |
| | 54,262 |
| | 48,359 |
| |
| Reserves provided, net | | 16,085 |
| | 141,790 |
| | 64,737 |
|
| Payments | (117,921 | ) | | (72,007 | ) | | (97,248 | ) | (34,277 | ) | | (99,645 | ) | | (117,921 | ) |
| Balance, end of period | $ | 668,100 |
| | $ | 721,284 |
| | $ | 739,029 |
| $ | 692,053 |
| | $ | 710,245 |
| | $ | 668,100 |
|
The reserves providedIn certain instances, we have the ability to recover a portion of our costs under various insurance policies or from subcontractors or other third parties. Estimates of such amounts are recorded when recovery is considered probable. As reflected in Note 11, our receivables from insurance carriers totaled $130.2 million and $60.6 million at December 31, 2015 and 2014, respectively. The increase in insurance receivables resulted from the continued progression of insured construction defect claims. Given the complexity inherent with resolving construction defect claims in the homebuilding industry as described above, tablethere generally exists a significant lag between our payment of claims and our reimbursements from applicable insurance carriers. Additionally, we are classified within selling, general,the plaintiff in litigation with certain of our insurance carriers relating to a large portion of the insurance receivables balance. We believe collection of these insurance receivables is probable based on the legal merits of our positions, favorable legal rulings received to date, and administrative expenses.our long history of collecting significant amounts of insurance reimbursements under similar insurance policies related to similar claims. While the outcome of these matters cannot be predicted with certainty, we do not believe that the resolution of such matters will have a material adverse impact on our results of operations, financial position, or cash flows.
14.13. Supplemental Guarantor information
All of our senior notes are guaranteed jointly and severally on a senior basis by eachcertain of the Company'sour wholly-owned Homebuilding subsidiaries and certain other wholly-owned subsidiaries (collectively, the “Guarantors”). Such guaranties are full and unconditional. SupplementalOur subsidiaries comprising the Financial Services segment along with certain other subsidiaries (collectively, the "Non-Guarantor Subsidiaries") do not guarantee the senior notes. In accordance with Rule 3-10 of Regulation S-X, supplemental consolidating financial information of the Company, including such information for the Guarantors, is presented below. Investments in subsidiaries are presented using the equity method of accounting. Separate financial statements of the Guarantors are not provided as the consolidating financial information contained herein provides a more meaningful disclosure to allow investors to determine the nature of the assets held by, and the operations of, the combined groups.
PULTEGROUP, INC.
NOTES TO CONSOLIDATED FINANCIAL STATEMENTS (continued)
CONSOLIDATING BALANCE SHEET
DECEMBER 31, 20132015
($000’s omitted)
| | | | Unconsolidated | | Eliminating
Entries | | Consolidated
PulteGroup,
Inc. | Unconsolidated | | Eliminating
Entries | | Consolidated
PulteGroup,
Inc. |
| | PulteGroup,
Inc. | | Guarantor
Subsidiaries | | Non-Guarantor
Subsidiaries | | PulteGroup,
Inc. | | Guarantor
Subsidiaries | | Non-Guarantor
Subsidiaries | |
| ASSETS | | | | | | | | | | | | | | | | | | |
| Cash and equivalents | $ | 262,364 |
| | $ | 1,188,999 |
| | $ | 128,966 |
| | $ | — |
| | $ | 1,580,329 |
| $ | — |
| | $ | 638,602 |
| | $ | 115,559 |
| | $ | — |
| | $ | 754,161 |
|
| Restricted cash | 58,699 |
| | 2,635 |
| | 11,381 |
| | — |
| | 72,715 |
| — |
| | 20,274 |
| | 1,000 |
| | — |
| | 21,274 |
|
| House and land inventory | — |
| | 3,977,851 |
| | 710 |
| | — |
| | 3,978,561 |
| — |
| | 5,450,058 |
| | — |
| | — |
| | 5,450,058 |
|
| Land held for sale | — |
| | 60,701 |
| | 1,034 |
| | — |
| | 61,735 |
| — |
| | 80,458 |
| | 1,034 |
| | — |
| | 81,492 |
|
Land, not owned, under option agreements | — |
| | 24,024 |
| | — |
| | — |
| | 24,024 |
| |
Residential mortgage loans available- for-sale | — |
| | — |
| | 287,933 |
| | — |
| | 287,933 |
| — |
| | — |
| | 442,715 |
| | — |
| | 442,715 |
|
| Investments in unconsolidated entities | 68 |
| | 41,319 |
| | 3,936 |
| | — |
| | 45,323 |
| 93 |
| | 36,499 |
| | 4,675 |
| | — |
| | 41,267 |
|
| Other assets | 50,251 |
| | 359,228 |
| | 51,142 |
| | — |
| | 460,621 |
| 49,255 |
| | 531,120 |
| | 90,724 |
| |
|
| | 671,099 |
|
| Intangible assets | — |
| | 136,148 |
| | — |
| | — |
| | 136,148 |
| — |
| | 110,215 |
| | — |
| | — |
| | 110,215 |
|
| Deferred tax assets, net | 2,074,137 |
| | 17 |
| | 12,600 |
| | — |
| | 2,086,754 |
| 1,392,251 |
| | 11 |
| | 2,617 |
| | — |
| | 1,394,879 |
|
Investments in subsidiaries and intercompany accounts, net | 4,532,950 |
| | (16,513 | ) | | 5,939,784 |
| | (10,456,221 | ) | | — |
| 5,529,606 |
| | 465,644 |
| | 6,293,018 |
| | (12,288,268 | ) | | — |
|
| | $ | 6,978,469 |
| | $ | 5,774,409 |
| | $ | 6,437,486 |
| | $ | (10,456,221 | ) | | $ | 8,734,143 |
| $ | 6,971,205 |
| | $ | 7,332,881 |
| | $ | 6,951,342 |
| | $ | (12,288,268 | ) | | $ | 8,967,160 |
|
| LIABILITIES AND SHAREHOLDERS' EQUITY | | | | | | | | | | | | | | | | | | |
| Liabilities: | | | | | | | | | | | | | | | | | | |
Accounts payable, customer deposits, accrued and other liabilities | $ | 65,334 |
| | $ | 1,413,752 |
| | $ | 236,258 |
| | $ | — |
| | $ | 1,715,344 |
| $ | 70,061 |
| | $ | 1,558,885 |
| | $ | 169,193 |
| | $ | — |
| | $ | 1,798,139 |
|
| Income tax liabilities | 206,015 |
| | — |
| | — |
| | — |
| | 206,015 |
| 57,050 |
| | — |
| | — |
| | — |
| | 57,050 |
|
| Financial Services debt | — |
| | — |
| | 105,664 |
| | — |
| | 105,664 |
| — |
| | — |
| | 267,877 |
| | — |
| | 267,877 |
|
| Term loan | | 500,000 |
| | — |
| | — |
| | — |
| | 500,000 |
|
| Senior notes | 2,058,168 |
| | — |
| | — |
| | — |
| | 2,058,168 |
| 1,584,769 |
| | — |
| | — |
| | — |
| | 1,584,769 |
|
| Total liabilities | 2,329,517 |
| | 1,413,752 |
| | 341,922 |
| | — |
| | 4,085,191 |
| 2,211,880 |
| | 1,558,885 |
| | 437,070 |
| | — |
| | 4,207,835 |
|
| Total shareholders’ equity | 4,648,952 |
| | 4,360,657 |
| | 6,095,564 |
| | (10,456,221 | ) | | 4,648,952 |
| 4,759,325 |
| | 5,773,996 |
| | 6,514,272 |
| | (12,288,268 | ) | | 4,759,325 |
|
| | $ | 6,978,469 |
| | $ | 5,774,409 |
| | $ | 6,437,486 |
| | $ | (10,456,221 | ) | | $ | 8,734,143 |
| $ | 6,971,205 |
| | $ | 7,332,881 |
| | $ | 6,951,342 |
| | $ | (12,288,268 | ) | | $ | 8,967,160 |
|
PULTEGROUP, INC.
NOTES TO CONSOLIDATED FINANCIAL STATEMENTS (continued)
CONSOLIDATING BALANCE SHEET
DECEMBER 31, 20122014
($000’s omitted)
| | | | Unconsolidated | | Eliminating
Entries | | Consolidated
PulteGroup,
Inc. | Unconsolidated | | Eliminating
Entries | | Consolidated
PulteGroup,
Inc. |
| | PulteGroup,
Inc. | | Guarantor
Subsidiaries | | Non-Guarantor
Subsidiaries | | PulteGroup,
Inc. | | Guarantor
Subsidiaries | | Non-Guarantor
Subsidiaries | |
| ASSETS | | |
| |
| | | | | | |
| |
| | | | |
| Cash and equivalents | $ | 146,168 |
| | $ | 1,063,943 |
| | $ | 194,649 |
| | $ | — |
| | $ | 1,404,760 |
| $ | 7,454 |
| | $ | 1,157,307 |
| | $ | 128,101 |
| | $ | — |
| | $ | 1,292,862 |
|
| Restricted cash | 54,546 |
| | 3,365 |
| | 14,039 |
| | — |
| | 71,950 |
| 3,710 |
| | 1,513 |
| | 11,135 |
| | — |
| | 16,358 |
|
| House and land inventory | — |
| | 4,210,201 |
| | 3,845 |
| | — |
| | 4,214,046 |
| — |
| | 4,391,445 |
| | 655 |
| | — |
| | 4,392,100 |
|
| Land held for sale | — |
| | 91,104 |
| | — |
| | — |
| | 91,104 |
| — |
| | 100,156 |
| | 1,034 |
| | — |
| | 101,190 |
|
Land, not owned, under option agreements | — |
| | 31,066 |
| | — |
| | — |
| | 31,066 |
| |
Residential mortgage loans available- for-sale | — |
| | — |
| | 318,931 |
| | — |
| | 318,931 |
| — |
| | — |
| | 339,531 |
| | — |
| | 339,531 |
|
| Securities purchased under agreements to resell | | 22,000 |
| | — |
| | (22,000 | ) | | — |
| | — |
|
| Investments in unconsolidated entities | 1,528 |
| | 40,973 |
| | 3,128 |
| | — |
| | 45,629 |
| 74 |
| | 36,126 |
| | 4,168 |
| | — |
| | 40,368 |
|
| Other assets | 28,951 |
| | 324,109 |
| | 54,615 |
| | — |
| | 407,675 |
| 34,214 |
| | 451,331 |
| | 57,673 |
| | — |
| | 543,218 |
|
| Intangible assets | — |
| | 149,248 |
| | — |
| | — |
| | 149,248 |
| — |
| | 123,115 |
| | — |
| | — |
| | 123,115 |
|
Investments in subsidiaries and �� intercompany accounts, net | 4,723,466 |
| | 7,198,710 |
| | 6,296,915 |
| | (18,219,091 | ) | | — |
| |
| Deferred tax assets, net | | 1,712,853 |
| | 15 |
| | 7,800 |
| | — |
| | 1,720,668 |
|
Investments in subsidiaries and intercompany accounts, net | | 4,963,831 |
| | 967,032 |
| | 6,359,441 |
| | (12,290,304 | ) | | — |
|
| | $ | 4,954,659 |
| | $ | 13,112,719 |
| | $ | 6,886,122 |
| | $ | (18,219,091 | ) | | $ | 6,734,409 |
| $ | 6,744,136 |
| | $ | 7,228,040 |
| | $ | 6,887,538 |
| | $ | (12,290,304 | ) | | $ | 8,569,410 |
|
| LIABILITIES AND SHAREHOLDERS' EQUITY | | | | | | | | | | | | | | | | | | |
| Liabilities: | | | | | | | | | | | | | | | | | | |
Accounts payable, customer deposits, accrued and other liabilities | $ | 56,565 |
| | $ | 1,343,653 |
| | $ | 297,302 |
| | $ | — |
| | $ | 1,697,520 |
| $ | 71,874 |
| | $ | 1,514,954 |
| | $ | 170,104 |
| | $ | — |
| | $ | 1,756,932 |
|
| Income tax liabilities | 198,865 |
| | — |
| | — |
| | — |
| | 198,865 |
| 48,747 |
| | (25 | ) | | — |
| | — |
| | 48,722 |
|
| Financial Services debt | — |
| | — |
| | 138,795 |
| | — |
| | 138,795 |
| — |
| | — |
| | 140,241 |
| | — |
| | 140,241 |
|
| Senior notes | 2,509,613 |
| | — |
| | — |
| | — |
| | 2,509,613 |
| 1,818,561 |
| | — |
| | — |
| | — |
| | 1,818,561 |
|
| Total liabilities | 2,765,043 |
| | 1,343,653 |
| | 436,097 |
| | — |
| | 4,544,793 |
| 1,939,182 |
| | 1,514,929 |
| | 310,345 |
| | — |
| | 3,764,456 |
|
| Total shareholders’ equity | 2,189,616 |
| | 11,769,066 |
| | 6,450,025 |
| | (18,219,091 | ) | | 2,189,616 |
| 4,804,954 |
| | 5,713,111 |
| | 6,577,193 |
| | (12,290,304 | ) | | 4,804,954 |
|
| | $ | 4,954,659 |
| | $ | 13,112,719 |
| | $ | 6,886,122 |
| | $ | (18,219,091 | ) | | $ | 6,734,409 |
| $ | 6,744,136 |
| | $ | 7,228,040 |
| | $ | 6,887,538 |
| | $ | (12,290,304 | ) | | $ | 8,569,410 |
|
PULTEGROUP, INC.
NOTES TO CONSOLIDATED FINANCIAL STATEMENTS (continued)
CONSOLIDATING STATEMENT OF OPERATIONS AND COMPREHENSIVE INCOME (LOSS)
For the year ended December 31, 2015
($000’s omitted)
|
| | | | | | | | | | | | | | | | | | | |
| | Unconsolidated | | | | Consolidated
PulteGroup,
Inc. |
| | PulteGroup,
Inc. | | Guarantor
Subsidiaries | | Non-Guarantor
Subsidiaries | | Eliminating
Entries | |
| Revenues: | | | | | | | | | |
| Homebuilding | | | | | | | | | |
| Home sale revenues | $ | — |
| | $ | 5,792,675 |
| | $ | — |
| | $ | — |
| | $ | 5,792,675 |
|
| Land sale revenues | — |
| | 48,536 |
| | — |
| | — |
| | 48,536 |
|
| | — |
| | 5,841,211 |
| | — |
| | — |
| | 5,841,211 |
|
| Financial Services | — |
| | 1 |
| | 140,752 |
| | — |
| | 140,753 |
|
| | — |
| | 5,841,212 |
| | 140,752 |
| | — |
| | 5,981,964 |
|
| Homebuilding Cost of Revenues: | | | | | | | | | |
| Home sale cost of revenues | — |
| | 4,440,893 |
| | — |
| | — |
| | 4,440,893 |
|
| Land sale cost of revenues | — |
| | 35,858 |
| | — |
| | — |
| | 35,858 |
|
| | — |
| | 4,476,751 |
| | — |
| | — |
| | 4,476,751 |
|
| Financial Services expenses | 313 |
| | (276 | ) | | 82,010 |
| | — |
| | 82,047 |
|
Selling, general, and administrative expenses | 3 |
| | 585,870 |
| | 3,907 |
| | — |
| | 589,780 |
|
| Other expense, net | 760 |
| | 17,424 |
| | (821 | ) | | — |
| | 17,363 |
|
| Intercompany interest | 2,110 |
| | 7,922 |
| | (10,032 | ) | | — |
| | — |
|
Income (loss) before income taxes and equity in income (loss) of subsidiaries | (3,186 | ) | | 753,521 |
| | 65,688 |
| | — |
| | 816,023 |
|
| Income tax expense (benefit) | (1,210 | ) | | 297,485 |
| | 25,658 |
| | — |
| | 321,933 |
|
Income (loss) before equity in income (loss) of subsidiaries | (1,976 | ) | | 456,036 |
| | 40,030 |
| | — |
| | 494,090 |
|
| Equity in income (loss) of subsidiaries | 496,066 |
| | 40,484 |
| | 411,699 |
| | (948,249 | ) | | — |
|
| Net income (loss) | 494,090 |
| | 496,520 |
| | 451,729 |
| | (948,249 | ) | | 494,090 |
|
| Other comprehensive income (loss) | 81 |
| | — |
| | — |
| | — |
| | 81 |
|
| Comprehensive income (loss) | $ | 494,171 |
| | $ | 496,520 |
| | $ | 451,729 |
| | $ | (948,249 | ) | | $ | 494,171 |
|
PULTEGROUP, INC.
NOTES TO CONSOLIDATED FINANCIAL STATEMENTS (continued)
CONSOLIDATING STATEMENT OF OPERATIONS AND COMPREHENSIVE INCOME (LOSS)
For the year ended December 31, 2014
($000’s omitted)
|
| | | | | | | | | | | | | | | | | | | |
| | Unconsolidated | | | | Consolidated
PulteGroup,
Inc. |
| | PulteGroup,
Inc. | | Guarantor
Subsidiaries | | Non-Guarantor
Subsidiaries | | Eliminating
Entries | |
| Revenues: | | | | | | | | | |
| Homebuilding | | | | | | | | | |
| Home sale revenues | $ | — |
| | $ | 5,662,171 |
| | $ | — |
| | $ | — |
| | $ | 5,662,171 |
|
| Land sale revenues | — |
| | 34,554 |
| | — |
| | — |
| | 34,554 |
|
| | — |
| | 5,696,725 |
| | — |
| | — |
| | 5,696,725 |
|
| Financial Services | — |
| | 889 |
| | 124,749 |
| | — |
| | 125,638 |
|
| | — |
| | 5,697,614 |
| | 124,749 |
| | — |
| | 5,822,363 |
|
| Homebuilding Cost of Revenues: | | | | | | | | | |
| Home sale cost of revenues | — |
| | 4,343,249 |
| | — |
| | — |
| | 4,343,249 |
|
| Land sale cost of revenues | — |
| | 23,748 |
| | — |
| | — |
| | 23,748 |
|
| | — |
| | 4,366,997 |
| | — |
| | — |
| | 4,366,997 |
|
| Financial Services expenses | 784 |
| | (130 | ) | | 70,403 |
| | — |
| | 71,057 |
|
Selling, general, and administrative expenses | — |
| | 661,308 |
| | 6,507 |
| | — |
| | 667,815 |
|
| Other expense, net | 9,026 |
| | 16,847 |
| | 863 |
| | — |
| | 26,736 |
|
| Intercompany interest | 9,800 |
| | (90 | ) | | (9,710 | ) | | — |
| | — |
|
Income (loss) before income taxes and equity in income (loss) of subsidiaries | (19,610 | ) | | 652,682 |
| | 56,686 |
| | — |
| | 689,758 |
|
| Income tax expense (benefit) | (7,473 | ) | | 201,332 |
| | 21,561 |
| | — |
| | 215,420 |
|
Income (loss) before equity in income (loss) of subsidiaries | (12,137 | ) | | 451,350 |
| | 35,125 |
| | — |
| | 474,338 |
|
| Equity in income (loss) of subsidiaries | 486,475 |
| | 38,534 |
| | 403,505 |
| | (928,514 | ) | | — |
|
| Net income (loss) | 474,338 |
| | 489,884 |
| | 438,630 |
| | (928,514 | ) | | 474,338 |
|
| Other comprehensive income (loss) | 105 |
| | — |
| | — |
| | — |
| | 105 |
|
| Comprehensive income (loss) | $ | 474,443 |
| | $ | 489,884 |
| | $ | 438,630 |
| | $ | (928,514 | ) | | $ | 474,443 |
|
PULTEGROUP, INC.
NOTES TO CONSOLIDATED FINANCIAL STATEMENTS (continued)
CONSOLIDATING STATEMENT OF OPERATIONS AND COMPREHENSIVE INCOME (LOSS)
For the year ended December 31, 2013
($000’s omitted)
| | | | Unconsolidated | | | | Consolidated
PulteGroup,
Inc. | Unconsolidated | | Eliminating
Entries | | Consolidated
PulteGroup,
Inc. |
| | PulteGroup,
Inc. | | Guarantor
Subsidiaries | | Non-Guarantor
Subsidiaries | | Eliminating
Entries | | PulteGroup,
Inc. | | Guarantor
Subsidiaries | | Non-Guarantor
Subsidiaries | |
| Revenues: | | | | | | | | | | | | | | | | | | |
| Homebuilding | | | | | | | | | | | | | | | | | | |
| Home sale revenues | $ | — |
| | $ | 5,424,309 |
| | $ | — |
| | $ | — |
| | $ | 5,424,309 |
| $ | — |
| | $ | 5,424,309 |
| | $ | — |
| | $ | — |
| | $ | 5,424,309 |
|
| Land sale revenues | — |
| | 114,335 |
| | — |
| | — |
| | 114,335 |
| — |
| | 114,335 |
| | — |
| | — |
| | 114,335 |
|
| | — |
| | 5,538,644 |
| | — |
| | — |
| | 5,538,644 |
| — |
| | 5,538,644 |
| | — |
| | — |
| | 5,538,644 |
|
| Financial Services | — |
| | 2,353 |
| | 138,598 |
| | — |
| | 140,951 |
| — |
| | 2,353 |
| | 138,598 |
| | — |
| | 140,951 |
|
| | — |
| | 5,540,997 |
| | 138,598 |
| | — |
| | 5,679,595 |
| — |
| | 5,540,997 |
| | 138,598 |
| | — |
| | 5,679,595 |
|
| Homebuilding Cost of Revenues: | | | | | | | | | | | | | | | | | | |
| Home sale cost of revenues | — |
| | 4,310,528 |
| | — |
| | — |
| | 4,310,528 |
| — |
| | 4,310,528 |
| | — |
| | — |
| | 4,310,528 |
|
| Land sale cost of revenues | — |
| | 104,426 |
| | — |
| | — |
| | 104,426 |
| — |
| | 104,426 |
| | — |
| | — |
| | 104,426 |
|
| | — |
| | 4,414,954 |
| | — |
| | — |
| | 4,414,954 |
| — |
| | 4,414,954 |
| | — |
| | — |
| | 4,414,954 |
|
| Financial Services expenses | 832 |
| | 970 |
| | 90,577 |
| | — |
| | 92,379 |
| 832 |
| | 970 |
| | 90,440 |
| | — |
| | 92,242 |
|
Selling, general, and administrative expenses | — |
| | 573,904 |
| | (5,404 | ) | | — |
| | 568,500 |
| — |
| | 573,904 |
| | (5,404 | ) | | — |
| | 568,500 |
|
| Other expense, net | 26,870 |
| | 49,681 |
| | 4,202 |
| | — |
| | 80,753 |
| |
| Interest income | (349 | ) | | (3,954 | ) | | (92 | ) | | — |
| | (4,395 | ) | |
| Interest expense | 712 |
| | — |
| | — |
| | — |
| | 712 |
| |
| Other expense (income), net | | 28,694 |
| | 43,944 |
| | 3,439 |
| | — |
| | 76,077 |
|
| Intercompany interest | 17,518 |
| | (8,260 | ) | | (9,258 | ) | | — |
| | — |
| 17,518 |
| | (8,260 | ) | | (9,258 | ) | | — |
| | — |
|
Equity in (earnings) loss of unconsolidated entities | 1,461 |
| | (1,783 | ) | | (808 | ) | | — |
| | (1,130 | ) | |
Income (loss) before income taxes and equity in income (loss) of subsidiaries | (47,044 | ) | | 515,485 |
| | 59,381 |
| | — |
| | 527,822 |
| (47,044 | ) | | 515,485 |
| | 59,381 |
| | — |
| | 527,822 |
|
| Income tax expense (benefit) | (2,113,827 | ) | | (799 | ) | | 22,332 |
| | — |
| | (2,092,294 | ) | (2,113,827 | ) | | (799 | ) | | 22,332 |
| | — |
| | (2,092,294 | ) |
Income (loss) before equity in income �� (loss) of subsidiaries | 2,066,783 |
| | 516,284 |
| | 37,049 |
| | — |
| | 2,620,116 |
| |
Income (loss) before equity in income (loss) of subsidiaries | | 2,066,783 |
| | 516,284 |
| | 37,049 |
| | — |
| | 2,620,116 |
|
| Equity in income (loss) of subsidiaries | 553,333 |
| | 35,086 |
| | 485,400 |
| | (1,073,819 | ) | | — |
| 553,333 |
| | 35,086 |
| | 485,400 |
| | (1,073,819 | ) | | — |
|
| Net income (loss) | 2,620,116 |
| | 551,370 |
| | 522,449 |
| | (1,073,819 | ) | | 2,620,116 |
| 2,620,116 |
| | 551,370 |
| | 522,449 |
| | (1,073,819 | ) | | 2,620,116 |
|
| Other comprehensive income (loss) | 197 |
| | — |
| | — |
| | — |
| | 197 |
| 197 |
| | — |
| | — |
| | — |
| | 197 |
|
| Comprehensive income (loss) | $ | 2,620,313 |
| | $ | 551,370 |
| | $ | 522,449 |
| | $ | (1,073,819 | ) | | $ | 2,620,313 |
| $ | 2,620,313 |
| | $ | 551,370 |
| | $ | 522,449 |
| | $ | (1,073,819 | ) | | $ | 2,620,313 |
|
PULTEGROUP, INC.
NOTES TO CONSOLIDATED FINANCIAL STATEMENTS (continued)
CONSOLIDATING STATEMENT OF OPERATIONS AND COMPREHENSIVE INCOME (LOSS)CASH FLOWS
For the year ended December 31, 20122015
($000’s omitted)
|
| | | | | | | | | | | | | | | | | | | |
| | Unconsolidated | | | | Consolidated
PulteGroup,
Inc. |
| | PulteGroup,
Inc. | | Guarantor
Subsidiaries | | Non-Guarantor
Subsidiaries | | Eliminating
Entries | |
| Revenues: | | | | | | | | | |
| Homebuilding | | | | | | | | | |
| Home sale revenues | $ | — |
| | $ | 4,552,412 |
| | $ | — |
| | $ | — |
| | $ | 4,552,412 |
|
| Land sale revenues | — |
| | 106,698 |
| | — |
| | — |
| | 106,698 |
|
| | — |
| | 4,659,110 |
| | — |
| | — |
| | 4,659,110 |
|
| Financial Services | — |
| | 2,082 |
| | 158,806 |
| | — |
| | 160,888 |
|
| | — |
| | 4,661,192 |
| | 158,806 |
| | — |
| | 4,819,998 |
|
| Homebuilding Cost of Revenues: | | | | | | | | | |
| Home sale cost of revenues | — |
| | 3,833,451 |
| | — |
| | — |
| | 3,833,451 |
|
| Land sale cost of revenues | — |
| | 94,880 |
| | — |
| | — |
| | 94,880 |
|
| | — |
| | 3,928,331 |
| | — |
| | — |
| | 3,928,331 |
|
| Financial Services expenses | 379 |
| | 567 |
| | 134,565 |
| | — |
| | 135,511 |
|
Selling, general, and administrative expenses | — |
| | 515,283 |
| | (826 | ) | | — |
| | 514,457 |
|
| Other expense, net | 32,027 |
| | 33,506 |
| | 765 |
| | — |
| | 66,298 |
|
| Interest income | (229 | ) | | (4,597 | ) | | (87 | ) | | — |
| | (4,913 | ) |
| Interest expense | 819 |
| | — |
| | — |
| | — |
| | 819 |
|
| Intercompany interest | 587,281 |
| | (573,852 | ) | | (13,429 | ) | | — |
| | — |
|
Equity in (earnings) loss of unconsolidated entities | (1 | ) | | (3,555 | ) | | (503 | ) | | — |
| | (4,059 | ) |
Income (loss) before income taxes and equity in income (loss) of subsidiaries | (620,276 | ) | | 765,509 |
| | 38,321 |
| | — |
| | 183,554 |
|
| Income tax expense (benefit) | 426 |
| | (22,299 | ) | | (718 | ) | | — |
| | (22,591 | ) |
Income (loss) before equity in income (loss) of subsidiaries | (620,702 | ) | | 787,808 |
| | 39,039 |
| | — |
| | 206,145 |
|
| Equity in income (loss) of subsidiaries | 826,847 |
| | 34,596 |
| | 476,806 |
| | (1,338,249 | ) | | — |
|
| Net income (loss) | 206,145 |
| | 822,404 |
| | 515,845 |
| | (1,338,249 | ) | | 206,145 |
|
| Other comprehensive income (loss) | 314 |
| | — |
| | — |
| | — |
| | 314 |
|
| Comprehensive income (loss) | $ | 206,459 |
| | $ | 822,404 |
| | $ | 515,845 |
| | $ | (1,338,249 | ) | | $ | 206,459 |
|
|
| | | | | | | | | | | | | | | | | | | |
| | Unconsolidated | | | | Consolidated
PulteGroup, Inc. |
| | PulteGroup,
Inc. | | Guarantor
Subsidiaries | | Non-Guarantor
Subsidiaries | | Eliminating
Entries | |
Net cash provided by (used in) operating activities | $ | 184,033 |
| | $ | (449,701 | ) | | $ | (82,461 | ) | | $ | — |
| | $ | (348,129 | ) |
| Cash flows from investing activities: | | | | | | | | | |
| Net change in loans held for investment | — |
| | — |
| | 8,664 |
| | — |
| | 8,664 |
|
Change in restricted cash related to letters of credit | 3,710 |
| | — |
| | — |
| | — |
| | 3,710 |
|
| Capital expenditures | — |
| | (41,857 | ) | | (3,583 | ) | | — |
| | (45,440 | ) |
| Other investing activities, net | — |
| | 1,937 |
| | 275 |
| | — |
| | 2,212 |
|
Net cash provided by (used in) investing activities | 3,710 |
| | (39,920 | ) | | 5,356 |
| | — |
| | (30,854 | ) |
| Cash flows from financing activities: | | | | | | | | | |
Financial Services borrowings (repayments) | — |
| | — |
| | 127,636 |
| | — |
| | 127,636 |
|
| Proceeds from debt issuance | 500,000 |
| | — |
| | — |
| | | | 500,000 |
|
| Repayments of debt | (237,995 | ) | | (1,198 | ) | | — |
| | — |
| | (239,193 | ) |
| Borrowings under revolving credit facility | 125,000 |
| | — |
| | — |
| | — |
| | 125,000 |
|
| Repayments under revolving credit facility | (125,000 | ) | | — |
| | — |
| | — |
| | (125,000 | ) |
| Stock option exercises | 10,535 |
| | — |
| | — |
| | — |
| | 10,535 |
|
| Share repurchases | (442,738 | ) | | — |
| | — |
| | — |
| | (442,738 | ) |
| Dividends paid | (115,958 | ) | | — |
| | — |
| | — |
| | (115,958 | ) |
| Intercompany activities, net | 90,959 |
| | (27,886 | ) | | (63,073 | ) | | — |
| | — |
|
Net cash provided by (used in) financing activities | (195,197 | ) | | (29,084 | ) | | 64,563 |
| | — |
| | (159,718 | ) |
Net increase (decrease) in cash and equivalents | (7,454 | ) | | (518,705 | ) | | (12,542 | ) | | — |
| | (538,701 | ) |
| Cash and equivalents at beginning of year | 7,454 |
| | 1,157,307 |
| | 128,101 |
| | — |
| | 1,292,862 |
|
| Cash and equivalents at end of year | $ | — |
| | $ | 638,602 |
| | $ | 115,559 |
| | $ | — |
| | $ | 754,161 |
|
PULTEGROUP, INC.
NOTES TO CONSOLIDATED FINANCIAL STATEMENTS (continued)
CONSOLIDATING STATEMENT OF OPERATIONS AND COMPREHENSIVE INCOME (LOSS)CASH FLOWS
For the year ended December 31, 20112014
($000’s omitted)
|
| | | | | | | | | | | | | | | | | | | |
| | Unconsolidated | | Eliminating
Entries | | Consolidated
PulteGroup,
Inc. |
| | PulteGroup,
Inc. | | Guarantor
Subsidiaries | | Non-Guarantor
Subsidiaries | |
| Revenues: | | | | | | | | | |
| Homebuilding | | | | | | | | | |
| Home sale revenues | $ | — |
| | $ | 3,950,743 |
| | $ | — |
| | $ | — |
| | $ | 3,950,743 |
|
| Land sale revenues | — |
| | 82,853 |
| | — |
| | — |
| | 82,853 |
|
| | — |
| | 4,033,596 |
| | — |
| | — |
| | 4,033,596 |
|
| Financial Services | — |
| | 1,367 |
| | 101,727 |
| | — |
| | 103,094 |
|
| | — |
| | 4,034,963 |
| | 101,727 |
| | — |
| | 4,136,690 |
|
| Homebuilding Cost of Revenues: | | | | | | | | | |
| Home sale cost of revenues | — |
| | 3,444,398 |
| | — |
| | — |
| | 3,444,398 |
|
| Land sale cost of revenues | — |
| | 59,279 |
| | — |
| | — |
| | 59,279 |
|
| | — |
| | 3,503,677 |
| | — |
| | — |
| | 3,503,677 |
|
| Financial Services expenses | 343 |
| | 448 |
| | 136,875 |
| | — |
| | 137,666 |
|
Selling, general, and administrative expenses | 33,144 |
| | 488,746 |
| | (2,307 | ) | | — |
| | 519,583 |
|
| Other expense (income), net | 5,581 |
| | 288,298 |
| | (777 | ) | | — |
| | 293,102 |
|
| Interest income | (253 | ) | | (4,443 | ) | | (359 | ) | | — |
| | (5,055 | ) |
| Interest expense | 1,313 |
| | — |
| | — |
| | — |
| | 1,313 |
|
| Intercompany interest | 39,060 |
| | (27,572 | ) | | (11,488 | ) | | — |
| | — |
|
Equity in (earnings) loss of unconsolidated entities | (5 | ) | | (3,196 | ) | | (95 | ) | | — |
| | (3,296 | ) |
Income (loss) before income taxes and equity in income (loss) of subsidiaries | (79,183 | ) | | (210,995 | ) | | (20,122 | ) | | — |
| | (310,300 | ) |
| Income tax expense (benefit) | (2,623 | ) | | (99,635 | ) | | 2,346 |
| | — |
| | (99,912 | ) |
Income (loss) before equity in income (loss) of subsidiaries | (76,560 | ) | | (111,360 | ) | | (22,468 | ) | | — |
| | (210,388 | ) |
| Equity in income (loss) of subsidiaries | (133,828 | ) | | (25,427 | ) | | (88,998 | ) | | 248,253 |
| | — |
|
| Net income (loss) | (210,388 | ) | | (136,787 | ) | | (111,466 | ) | | 248,253 |
| | (210,388 | ) |
| Other comprehensive income (loss) | 213 |
| | — |
| | — |
| | — |
| | 213 |
|
| Comprehensive income (loss) | $ | (210,175 | ) | | $ | (136,787 | ) | | $ | (111,466 | ) | | $ | 248,253 |
| | $ | (210,175 | ) |
|
| | | | | | | | | | | | | | | | | | | |
| | Unconsolidated | | | | Consolidated
PulteGroup, Inc. |
| | PulteGroup,
Inc. | | Guarantor
Subsidiaries | | Non-Guarantor
Subsidiaries | | Eliminating
Entries | |
Net cash provided by (used in) operating activities | $ | 206,485 |
| | $ | 175,415 |
| | $ | (72,651 | ) | | $ | — |
| | $ | 309,249 |
|
| Cash flows from investing activities: | | | | | | | | | |
| Net change in loans held for investment | — |
| | — |
| | 335 |
| | — |
| | 335 |
|
Change in restricted cash related to letters of credit | 54,989 |
| | — |
| | — |
| | — |
| | 54,989 |
|
| Capital expenditures | — |
| | (44,956 | ) | | (3,834 | ) | | — |
| | (48,790 | ) |
| Cash used for business acquisitions | — |
| | (82,419 | ) | | — |
| | — |
| | (82,419 | ) |
| Other investing activities, net | — |
| | 8,274 |
| | (13 | ) | | — |
| | 8,261 |
|
Net cash provided by (used in) investing activities | 54,989 |
| | (119,101 | ) | | (3,512 | ) | | — |
| | (67,624 | ) |
| Cash flows from financing activities: | | | | | | | | | |
Financial Services borrowings (repayments) | — |
| | — |
| | 34,577 |
| | — |
| | 34,577 |
|
| Repayments of debt | (249,765 | ) | | (866 | ) | | — |
| | — |
| | (250,631 | ) |
| Stock option exercises | 15,627 |
| | — |
| | — |
| | — |
| | 15,627 |
|
| Share repurchases | (253,019 | ) | | — |
| | — |
| | — |
| | (253,019 | ) |
| Dividends paid | (75,646 | ) | | — |
| | — |
| | — |
| | (75,646 | ) |
| Intercompany activities, net | 46,419 |
| | (87,140 | ) | | 40,721 |
| | — |
| | — |
|
Net cash provided by (used in) financing activities | (516,384 | ) | | (88,006 | ) | | 75,298 |
| | — |
| | (529,092 | ) |
Net increase (decrease) in cash and equivalents | (254,910 | ) | | (31,692 | ) | | (865 | ) | | — |
| | (287,467 | ) |
| Cash and equivalents at beginning of year | 262,364 |
| | 1,188,999 |
| | 128,966 |
| | — |
| | 1,580,329 |
|
| Cash and equivalents at end of year | $ | 7,454 |
| | $ | 1,157,307 |
| | $ | 128,101 |
| | $ | — |
| | $ | 1,292,862 |
|
PULTEGROUP, INC.
NOTES TO CONSOLIDATED FINANCIAL STATEMENTS (continued)
CONSOLIDATING STATEMENT OF CASH FLOWS
For the year ended December 31, 2013
($000’s omitted)
| | | | Unconsolidated | | | | Consolidated
PulteGroup, Inc. | Unconsolidated | | | | Consolidated
PulteGroup,
Inc. |
| | PulteGroup,
Inc. | | Guarantor
Subsidiaries | | Non-Guarantor
Subsidiaries | | Eliminating
Entries | | PulteGroup,
Inc. | | Guarantor
Subsidiaries | | Non-Guarantor
Subsidiaries | | Eliminating
Entries | |
Net cash provided by (used in) operating activities | $ | (41 | ) | | $ | 865,267 |
| | $ | 15,910 |
| | $ | — |
| | $ | 881,136 |
| $ | (41 | ) | | $ | 865,267 |
| | $ | 15,910 |
| | $ | — |
| | $ | 881,136 |
|
| Cash flows from investing activities: | | | | | | | | | | | | | | | | | | |
Distributions from unconsolidated entities | — |
| | 1,001 |
| | — |
| | — |
| | 1,001 |
| |
| Investments in unconsolidated entities | — |
| | (1,677 | ) | | — |
| | — |
| | (1,677 | ) | |
| Net change in loans held for investment | — |
| | — |
| | (12,265 | ) | | — |
| | (12,265 | ) | — |
| | — |
| | (12,265 | ) | | — |
| | (12,265 | ) |
Change in restricted cash related to letters of credit | (4,152 | ) | | — |
| | — |
| | — |
| | (4,152 | ) | (4,152 | ) | | — |
| | — |
| | — |
| | (4,152 | ) |
Proceeds from the sale of property and equipment | — |
| | 15 |
| | — |
| | — |
| | 15 |
| |
| Capital expenditures | — |
| | (26,472 | ) | | (2,427 | ) | | — |
| | (28,899 | ) | — |
| | (26,472 | ) | | (2,427 | ) | | — |
| | (28,899 | ) |
| Other investing activities, net | | — |
| | (661 | ) | | — |
| | — |
| | (661 | ) |
Net cash provided by (used in) investing activities | (4,152 | ) | | (27,133 | ) | | (14,692 | ) | | — |
| | (45,977 | ) | (4,152 | ) | | (27,133 | ) | | (14,692 | ) | | — |
| | (45,977 | ) |
| Cash flows from financing activities: | | | | | | | | | | | | | | | | | | |
Financial Services borrowings (repayments) | — |
| | — |
| | (33,131 | ) | |
| | (33,131 | ) | — |
| | — |
| | (33,131 | ) | | — |
| | (33,131 | ) |
| Other borrowings (repayments) | (485,048 | ) | | 5,221 |
| |
|
| |
| | (479,827 | ) | |
| Repayments of debt | | (485,048 | ) | | 5,221 |
| |
|
| | — |
| | (479,827 | ) |
| Stock option exercises | 19,411 |
| | — |
| | — |
| | — |
| | 19,411 |
| 19,411 |
| | — |
| | — |
| | — |
| | 19,411 |
|
| Stock repurchases | (127,661 | ) | | — |
| | — |
| | — |
| | (127,661 | ) | |
| Share repurchases | | (127,661 | ) | | — |
| | — |
| | — |
| | (127,661 | ) |
| Dividends paid | (38,382 | ) | | — |
| | — |
| | — |
| | (38,382 | ) | (38,382 | ) | | — |
| | — |
| | — |
| | (38,382 | ) |
| Intercompany activities, net | 752,069 |
| | (718,299 | ) | | (33,770 | ) | | — |
| | — |
| 752,069 |
| | (718,299 | ) | | (33,770 | ) | | — |
| | — |
|
Net cash provided by (used in) financing activities | 120,389 |
| | (713,078 | ) | | (66,901 | ) | | — |
| | (659,590 | ) | 120,389 |
| | (713,078 | ) | | (66,901 | ) | | — |
| | (659,590 | ) |
Net increase (decrease) in cash and equivalents | 116,196 |
| | 125,056 |
| | (65,683 | ) | | — |
| | 175,569 |
| 116,196 |
| | 125,056 |
| | (65,683 | ) | | — |
| | 175,569 |
|
| Cash and equivalents at beginning of year | 146,168 |
| | 1,063,943 |
| | 194,649 |
| | — |
| | 1,404,760 |
| 146,168 |
| | 1,063,943 |
| | 194,649 |
| | — |
| | 1,404,760 |
|
| Cash and equivalents at end of year | $ | 262,364 |
| | $ | 1,188,999 |
| | $ | 128,966 |
| | $ | — |
| | $ | 1,580,329 |
| $ | 262,364 |
| | $ | 1,188,999 |
| | $ | 128,966 |
| | $ | — |
| | $ | 1,580,329 |
|
PULTEGROUP, INC.
NOTES TO CONSOLIDATED FINANCIAL STATEMENTS (continued)
CONSOLIDATING STATEMENT OF CASH FLOWS
For the year ended December 31, 2012
($000’s omitted)
|
| | | | | | | | | | | | | | | | | | | |
| | Unconsolidated | | | | Consolidated
PulteGroup, Inc. |
| | PulteGroup,
Inc. | | Guarantor
Subsidiaries | | Non-Guarantor
Subsidiaries | | Eliminating
Entries | |
Net cash provided by (used in) operating activities | $ | (582,762 | ) | | $ | 1,332,342 |
| | $ | 10,560 |
| | $ | — |
| | $ | 760,140 |
|
| Cash flows from investing activities: | | | | | | | | | |
Distributions from unconsolidated entities | — |
| | 3,029 |
| | — |
| | — |
| | 3,029 |
|
| Investments in unconsolidated entities | — |
| | (16,456 | ) | | — |
| | — |
| | (16,456 | ) |
| Net change in loans held for investment | — |
| | — |
| | 836 |
| | — |
| | 836 |
|
Change in restricted cash related to letters of credit | 28,653 |
| | — |
| | — |
| | — |
| | 28,653 |
|
Proceeds from the sale of property and equipment | — |
| | 7,586 |
| | — |
| | — |
| | 7,586 |
|
| Capital expenditures | — |
| | (10,831 | ) | | (3,111 | ) | | — |
| | (13,942 | ) |
Net cash provided by (used in) investing activities | 28,653 |
| | (16,672 | ) | | (2,275 | ) | | — |
| | 9,706 |
|
| Cash flows from financing activities: | | | | | | | | | |
Financial Services borrowings (repayments) | — |
| | — |
| | 138,795 |
| | — |
| | 138,795 |
|
| Other borrowings (repayments) | (620,700 | ) | | 1,900 |
| | — |
| | — |
| | (618,800 | ) |
| Stock option exercises | 32,809 |
| | — |
| | — |
| | — |
| | 32,809 |
|
| Stock repurchases | (961 | ) | | — |
| | — |
| | — |
| | (961 | ) |
| Intercompany activities, net | 1,169,842 |
| | (1,129,188 | ) | | (40,654 | ) | | — |
| | — |
|
Net cash provided by (used in) financing activities | 580,990 |
| | (1,127,288 | ) | | 98,141 |
| | — |
| | (448,157 | ) |
Net increase (decrease) in cash and equivalents | 26,881 |
| | 188,382 |
| | 106,426 |
| | — |
| | 321,689 |
|
| Cash and equivalents at beginning of year | 119,287 |
| | 875,561 |
| | 88,223 |
| | — |
| | 1,083,071 |
|
| Cash and equivalents at end of year | $ | 146,168 |
| | $ | 1,063,943 |
| | $ | 194,649 |
| | $ | — |
| | $ | 1,404,760 |
|
PULTEGROUP, INC.
NOTES TO CONSOLIDATED FINANCIAL STATEMENTS (continued)
CONSOLIDATING STATEMENT OF CASH FLOWS
For the year ended December 31, 2011
($000’s omitted)
|
| | | | | | | | | | | | | | | | | | | |
| | Unconsolidated | | | | Consolidated
PulteGroup,
Inc. |
| | PulteGroup,
Inc. | | Guarantor
Subsidiaries | | Non-Guarantor
Subsidiaries | | Eliminating
Entries | |
Net cash provided by (used in) operating activities | $ | (86,000 | ) | | $ | 520,024 |
| | $ | (416,745 | ) | | $ | — |
| | $ | 17,279 |
|
| Cash flows from investing activities: | | | | | | | | | |
Distributions from unconsolidated entities | — |
| | 4,531 |
| | — |
| | — |
| | 4,531 |
|
| Investments in unconsolidated entities | — |
| | (4,603 | ) | | — |
| | — |
| | (4,603 | ) |
Net change in loans held for investment | — |
| | — |
| | 325 |
| | — |
| | 325 |
|
Change in restricted cash related to letters of credit | (83,199 | ) | | — |
| | — |
| | — |
| | (83,199 | ) |
Proceeds from the sale of property and equipment | — |
| | 10,555 |
| | — |
| | — |
| | 10,555 |
|
| Capital expenditures | — |
| | (18,331 | ) | | (2,907 | ) | | — |
| | (21,238 | ) |
Net cash provided by (used in) investing activities | (83,199 | ) | | (7,848 | ) | | (2,582 | ) | | — |
| | (93,629 | ) |
| Cash flows from financing activities: | | | | | | | | | |
| Other borrowings (repayments) | (320,973 | ) | | (160 | ) | | — |
| | — |
| | (321,133 | ) |
| Stock repurchases | (2,836 | ) | | — |
| | — |
| | — |
| | (2,836 | ) |
| Intercompany activities, net | 602,295 |
| | (743,078 | ) | | 140,783 |
| | — |
| | — |
|
Net cash provided by (used in) financing activities | 278,486 |
| | (743,238 | ) | | 140,783 |
| | — |
| | (323,969 | ) |
Net increase (decrease) in cash and equivalents | 109,287 |
| | (231,062 | ) | | (278,544 | ) | | — |
| | (400,319 | ) |
Cash and equivalents at beginning of year | 10,000 |
| | 1,106,623 |
| | 366,767 |
| | — |
| | 1,483,390 |
|
| Cash and equivalents at end of year | $ | 119,287 |
| | $ | 875,561 |
| | $ | 88,223 |
| | $ | — |
| | $ | 1,083,071 |
|
PULTEGROUP, INC.
NOTES TO CONSOLIDATED FINANCIAL STATEMENTS (continued)
15.14. Quarterly results (unaudited)
UNAUDITED QUARTERLY INFORMATION
(000’s omitted, except per share data)
| | | | 1st
Quarter | | 2nd
Quarter | | 3rd
Quarter | | 4th
Quarter | | Total (b) | 1st
Quarter | | 2nd
Quarter | | 3rd
Quarter | | 4th
Quarter | | Total (a) |
| 2013 | | | | | | | | | | |
| 2015 | | | | | | | | | | |
| Homebuilding: | | | | | | | | | | | | | | | | | | |
| Revenues | $ | 1,125,883 |
| | $ | 1,240,060 |
| | $ | 1,547,742 |
| | $ | 1,624,959 |
| | $ | 5,538,644 |
| $ | 1,105,700 |
| | $ | 1,249,537 |
| | $ | 1,467,780 |
| | $ | 2,018,194 |
| | $ | 5,841,211 |
|
| Cost of revenues | 923,488 |
| | 1,011,528 |
| | 1,230,070 |
| | 1,249,868 |
| | 4,414,954 |
| 854,523 |
| | 958,592 |
| | 1,122,175 |
| | 1,541,461 |
| | 4,476,751 |
|
Income before income taxes (a)(b) | 68,037 |
| | 21,971 |
| | 163,594 |
| | 225,511 |
| | 479,113 |
| 90,748 |
| | 157,640 |
| | 164,911 |
| | 344,019 |
| | 757,317 |
|
| Financial Services: | | | | | | | | | | | | | | | | | | |
| Revenues | $ | 36,873 |
| | $ | 39,362 |
| | $ | 34,336 |
| | $ | 30,380 |
| | $ | 140,951 |
| $ | 27,598 |
| | $ | 30,754 |
| | $ | 38,967 |
| | $ | 43,434 |
| | $ | 140,753 |
|
Income before income taxes | 14,313 |
| | 16,359 |
| | 11,128 |
| | 6,909 |
| | 48,709 |
| 5,057 |
| | 9,987 |
| | 14,365 |
| | 29,297 |
| | 58,706 |
|
| Consolidated results: | | | | | | | | | | | | | | | | | | |
| Revenues | $ | 1,162,756 |
| | $ | 1,279,422 |
| | $ | 1,582,078 |
| | $ | 1,655,339 |
| | $ | 5,679,595 |
| $ | 1,133,298 |
| | $ | 1,280,291 |
| | $ | 1,506,747 |
| | $ | 2,061,628 |
| | $ | 5,981,964 |
|
| Income before income taxes | 82,350 |
| | 38,330 |
| | 174,722 |
| | 232,420 |
| | 527,822 |
| 95,805 |
| | 167,627 |
| | 179,276 |
| | 373,315 |
| | 816,023 |
|
Income tax expense (benefit) (c) | 588 |
| | 1,913 |
| | (2,107,162 | ) | | 12,367 |
| | (2,092,294 | ) | |
| Income tax expense | | 40,834 |
| | 64,303 |
| | 71,507 |
| | 145,288 |
| | 321,933 |
|
| Net income | $ | 81,762 |
| | $ | 36,417 |
| | $ | 2,281,884 |
| | $ | 220,053 |
| | $ | 2,620,116 |
| $ | 54,971 |
| | $ | 103,324 |
| | $ | 107,769 |
| | $ | 228,027 |
| | $ | 494,090 |
|
| Net income per share: | | | | | | | | | | | | | | | | | | |
| Basic | $ | 0.21 |
| | $ | 0.09 |
| | $ | 5.92 |
| | $ | 0.58 |
| | $ | 6.79 |
| $ | 0.15 |
| | $ | 0.28 |
| | $ | 0.31 |
| | $ | 0.65 |
| | $ | 1.38 |
|
| Diluted | $ | 0.21 |
| | $ | 0.09 |
| | $ | 5.87 |
| | $ | 0.57 |
| | $ | 6.72 |
| $ | 0.15 |
| | $ | 0.28 |
| | $ | 0.30 |
| | $ | 0.64 |
| | $ | 1.36 |
|
| Number of shares used in calculation: | | | | | | | | | | | | | | | | | | |
| Basic | 384,228 |
| | 385,389 |
| | 382,883 |
| | 379,879 |
| | 383,077 |
| 366,748 |
| | 361,009 |
| | 350,147 |
| | 348,699 |
| | 356,576 |
|
| Effect of dilutive securities | 6,093 |
| | 5,791 |
| | 3,220 |
| | 3,845 |
| | 3,789 |
| 3,362 |
| | 3,232 |
| | 3,225 |
| | 3,047 |
| | 3,217 |
|
| Diluted | 390,321 |
| | 391,180 |
| | 386,103 |
| | 383,724 |
| | 386,866 |
| 370,110 |
| | 364,241 |
| | 353,372 |
| | 351,746 |
| | 359,793 |
|
| |
| (a) | Homebuilding income before income taxes in the 2nd Quarter includes charges totaling $66.6 million consisting of losses on debt retirements, costs associated with the relocation of our corporate headquarters, and a contractual dispute related to a previously completed luxury community. |
| |
(b) | Due to rounding, the sum of quarterly results may not equal the total for the year. Additionally, quarterly and year-to-date computations of per share amounts are made independently. |
| |
(c) | Income tax expense (benefit) in the 3rd Quarter includes a benefit of $2.1 billionrelated to the reversal of substantially all of the valuation allowance previously recorded against our deferred tax assets.
|
PULTEGROUP, INC.
NOTES TO CONSOLIDATED FINANCIAL STATEMENTS (continued)
UNAUDITED QUARTERLY INFORMATION
(000’s omitted, except per share data)
|
| | | | | | | | | | | | | | | | | | | |
| | 1st
Quarter | | 2nd
Quarter | | 3rd
Quarter | | 4th
Quarter | | Total (c) |
| 2012 | | | | | | | | | |
| Homebuilding: | | | | | | | | | |
| Revenues | $ | 852,184 |
| | $ | 1,033,154 |
| | $ | 1,255,327 |
| | $ | 1,518,445 |
| | $ | 4,659,110 |
|
| Cost of revenues | 745,563 |
| | 876,990 |
| | 1,044,765 |
| | 1,261,012 |
| | 3,928,331 |
|
Income (loss) before income taxes (a) | (20,352 | ) | | 23,939 |
| | 79,179 |
| | 75,225 |
| | 157,991 |
|
| Financial Services: | | | | | | | | | |
| Revenues | $ | 28,852 |
| | $ | 36,251 |
| | $ | 47,264 |
| | $ | 48,521 |
| | $ | 160,888 |
|
Income (loss) before income taxes (b) | 6,861 |
| | 15,987 |
| | 26,727 |
| | (24,012 | ) | | 25,563 |
|
| Consolidated results: | | | | | | | | | |
| Revenues | $ | 881,036 |
| | $ | 1,069,405 |
| | $ | 1,302,591 |
| | $ | 1,566,966 |
| | $ | 4,819,998 |
|
| Income (loss) before income taxes | (13,491 | ) | | 39,926 |
| | 105,906 |
| | 51,213 |
| | 183,554 |
|
| Income tax expense (benefit) | (1,825 | ) | | (2,510 | ) | | (10,727 | ) | | (7,529 | ) | | (22,591 | ) |
| Net income (loss) | $ | (11,666 | ) | | $ | 42,436 |
| | $ | 116,633 |
| | $ | 58,742 |
| | $ | 206,145 |
|
| Net income (loss) per share: | | | | | | | | | |
| Basic | $ | (0.03 | ) | | $ | 0.11 |
| | $ | 0.31 |
| | $ | 0.15 |
| | $ | 0.54 |
|
| Diluted | $ | (0.03 | ) | | $ | 0.11 |
| | $ | 0.30 |
| | $ | 0.15 |
| | $ | 0.54 |
|
| Number of shares used in calculation: | | | | | | | | | |
| Basic | 380,502 |
| | 380,655 |
| | 381,355 |
| | 383,404 |
| | 381,562 |
|
| Effect of dilutive securities | — |
| | 1,548 |
| | 3,215 |
| | 5,900 |
| | 3,002 |
|
| Diluted | 380,502 |
| | 382,203 |
| | 384,570 |
| | 389,304 |
| | 384,564 |
|
| |
(a) | Homebuilding income (loss) before income taxes includes losses on debt retirements of $32.1 million in the 4th Quarter.
|
| |
(b) | Financial Services income (loss) before income taxes includes additional loan origination reserves of $49.0 million in the 4th Quarter.
|
| |
(c) | Due to rounding, the sum of quarterly results may not equal the total for the year. Additionally, quarterly and year-to-date computations of per share amounts are made independently. |
| |
| (b) | Homebuilding income before income taxes includes reserve reversals resulting from a legal settlement (see Note 12)of $26.9 million and $5.7 million in the 2nd and 3rd Quarters, respectively; a charge of $20.0 million in the 3rd Quarter related to the Applecross matter (see Note 12); and $29.6 million relating to decreased general liability insurance reserves in the 4th Quarter. |
| |
| (c) | Financial Services expenses in the 4th Quarter includes a reduction in loan origination liabilities totaling $11.8 million.. |
PULTEGROUP, INC.
NOTES TO CONSOLIDATED FINANCIAL STATEMENTS (continued)
UNAUDITED QUARTERLY INFORMATION
(000’s omitted, except per share data)
|
| | | | | | | | | | | | | | | | | | | |
| | 1st
Quarter | | 2nd
Quarter | | 3rd
Quarter | | 4th
Quarter | | Total (a) |
| 2014 | | | | | | | | | |
| Homebuilding: | | | | | | | | | |
| Revenues | $ | 1,093,999 |
| | $ | 1,254,989 |
| | $ | 1,561,273 |
| | $ | 1,786,464 |
| | $ | 5,696,725 |
|
| Cost of revenues | 833,614 |
| | 959,524 |
| | 1,198,908 |
| | 1,374,951 |
| | 4,366,997 |
|
Income before income taxes (b) | 108,435 |
| | 58,573 |
| | 214,051 |
| | 254,118 |
| | 635,177 |
|
| Financial Services: | | | | | | | | | |
| Revenues | $ | 24,895 |
| | $ | 31,198 |
| | $ | 33,452 |
| | $ | 36,093 |
| | $ | 125,638 |
|
Income before income taxes (c) | 21,594 |
| | 9,108 |
| | 10,877 |
| | 13,002 |
| | 54,581 |
|
| Consolidated results: | | | | | | | | | |
| Revenues | $ | 1,118,894 |
| | $ | 1,286,187 |
| | $ | 1,594,725 |
| | $ | 1,822,557 |
| | $ | 5,822,363 |
|
| Income before income taxes | 130,029 |
| | 67,681 |
| | 224,928 |
| | 267,120 |
| | 689,758 |
|
Income tax expense (benefit) (d) | 55,210 |
| | 25,801 |
| | 84,383 |
| | 50,025 |
| | 215,420 |
|
| Net income | $ | 74,819 |
| | $ | 41,880 |
| | $ | 140,545 |
| | $ | 217,095 |
| | $ | 474,338 |
|
| Net income per share: | | | | | | | | | |
| Basic | $ | 0.19 |
| | $ | 0.11 |
| | $ | 0.37 |
| | $ | 0.58 |
| | $ | 1.27 |
|
| Diluted | $ | 0.19 |
| | $ | 0.11 |
| | $ | 0.37 |
| | $ | 0.58 |
| | $ | 1.26 |
|
| Number of shares used in calculation: | | | | | | | | | |
| Basic | 383,991 |
| | 376,072 |
| | 373,531 |
| | 369,533 |
| | 370,377 |
|
| Effect of dilutive securities | 3,815 |
| | 3,592 |
| | 3,761 |
| | 3,734 |
| | 3,725 |
|
| Diluted | 387,806 |
| | 379,664 |
| | 377,292 |
| | 373,267 |
| | 374,102 |
|
| |
| (a) | Due to rounding, the sum of quarterly results may not equal the total for the year. Additionally, quarterly and year-to-date computations of per share amounts are made independently. |
| |
| (a) | Homebuilding income before income taxes includes losses on debt retirement of $8.6 millionin the 1st Quarter; charges of $84.5 million to increase general liability insurance reserves in the 2nd Quarter; and costs associated with the relocation of our corporate headquarters of $8.7 million, offset by favorable adjustments of $15.2 million to decrease general liability insurance reserves in the 4th Quarter. |
| |
| (b) | Financial Services expenses in the 1st Quarter includes a reduction in loan origination liabilities totaling $18.6 million. |
| |
| (c) | Income tax expense in the 4th Quarter includes a benefit of $49.6 million related to the resolution of certain tax matters and the reversal of valuation allowance related to certain state deferred tax assets. |
Report of Independent Registered Public Accounting Firm
The Board of Directors and Shareholders of PulteGroup, Inc.
We have audited the accompanying consolidated balance sheets of PulteGroup, Inc. (the “Company”) as of December 31, 20132015 and 20122014, and the related consolidated statements of operations, comprehensive income, (loss), shareholders’ equity, and cash flows for each of the three years in the period ended December 31, 20132015. These financial statements are the responsibility of the Company’s management. Our responsibility is to express an opinion on these financial statements based on our audits.
We conducted our audits in accordance with the standards of the Public Company Accounting Oversight Board (United States). Those standards require that we plan and perform the audit to obtain reasonable assurance about whether the financial statements are free of material misstatement. An audit includes examining, on a test basis, evidence supporting the amounts and disclosures in the financial statements. An audit also includes assessing the accounting principles used and significant estimates made by management, as well as evaluating the overall financial statement presentation. We believe that our audits provide a reasonable basis for our opinion.
In our opinion, the financial statements referred to above present fairly, in all material respects, the consolidated financial position of PulteGroup, Inc. at December 31, 20132015 and 20122014, and the consolidated results of its operations and its cash flows for each of the three years in the period ended December 31, 20132015, in conformity with U.S. generally accepted accounting principles.
We also have audited, in accordance with the standards of the Public Company Accounting Oversight Board (United States), PulteGroup, Inc.’s internal control over financial reporting as of December 31, 20132015, based on criteria established in Internal Control-Integrated Framework issued by the Committee of Sponsoring Organizations of the Treadway Commission (1992(2013 Framework) and our report dated February 5, 20148, 2016 expressed an unqualified opinion thereon.
/s/ Ernst & Young LLP
Detroit, MichiganAtlanta, Georgia
February 5, 20148, 2016
| |
| ITEM 9. | CHANGES IN AND DISAGREEMENTS WITH ACCOUNTANTS ON ACCOUNTING AND FINANCIAL DISCLOSURE |
This Item is not applicable.
ITEM 9A. CONTROLS AND PROCEDURES
Disclosure Controls and Procedures
Management, including our Chairman, President and Chief Executive Officer and Executive Vice President and Chief Financial Officer, evaluated the effectiveness of the design and operation of our disclosure controls and procedures as of December 31, 20132015. Based upon, and as of the date of that evaluation, our Chairman, President and Chief Executive Officer and Executive Vice President and Chief Financial Officer concluded that the disclosure controls and procedures were effective as of December 31, 20132015.
Internal Control Over Financial Reporting
| |
| (a) | Management’s Annual Report on Internal Control Over Financial Reporting |
Management is responsible for the preparation and fair presentation of the consolidated financial statements included in this annual report. The consolidated financial statements have been prepared in conformity with U.S. generally accepted accounting principles and reflect management’s judgments and estimates concerning events and transactions that are accounted for or disclosed.
Management is also responsible for establishing and maintaining effective internal control over financial reporting, as such term is defined in Exchange Act Rule 13a-15(f). Management recognizes that there are inherent limitations in the effectiveness of any internal control and effective internal control over financial reporting can provide only reasonable assurance with respect to financial statement preparation. Additionally, because of changes in conditions, the effectiveness of internal control over financial reporting may vary over time.
In order to ensure that the Company’s internal control over financial reporting is effective, management regularly assesses such controls and did so most recently for its financial reporting as of December 31, 20132015. Management’s assessment was based on criteria for effective internal control over financial reporting described in Internal Control – Integrated Framework issued by the Committee of Sponsoring Organizations of the Treadway Commission (1992(2013 Framework). Based on this assessment, management asserts that the Company has maintained effective internal control over financial reporting as of December 31, 20132015.
Ernst & Young LLP, the independent registered public accounting firm that audited the Company’s consolidated financial statements included in this annual report, has issued its report on the effectiveness of the Company’s internal control over financial reporting as of December 31, 20132015.
| |
| (b) | Report of Independent Registered Public Accounting Firm |
The Board of Directors and Shareholders of PulteGroup, Inc.
We have audited PulteGroup, Inc.’s internal control over financial reporting as of December 31, 20132015, based on criteria established in Internal Control—Integrated Framework issued by the Committee of Sponsoring Organizations of the Treadway Commission (1992(2013 Framework) (the COSO criteria). PulteGroup, Inc.’s management is responsible for maintaining effective internal control over financial reporting, and for its assessment of the effectiveness of internal control over financial reporting included in the accompanying Management’s Annual Report on Internal Control Over Financial Reporting. Our responsibility is to express an opinion on the company’s internal control over financial reporting based on our audit.
We conducted our audit in accordance with the standards of the Public Company Accounting Oversight Board (United States). Those standards require that we plan and perform the audit to obtain reasonable assurance about whether effective internal control over financial reporting was maintained in all material respects. Our audit included obtaining an understanding of internal control over financial reporting, assessing the risk that a material weakness exists, testing and evaluating the design and operating effectiveness of internal control based on the assessed risk, and performing such other procedures as we considered necessary in the circumstances. We believe that our audit provides a reasonable basis for our opinion.
A company’s internal control over financial reporting is a process designed to provide reasonable assurance regarding the reliability of financial reporting and the preparation of financial statements for external purposes in accordance with generally accepted accounting principles. A company’s internal control over financial reporting includes those policies and procedures that (1) pertain to the maintenance of records that, in reasonable detail, accurately and fairly reflect the transactions and dispositions of the assets of the company; (2) provide reasonable assurance that transactions are recorded as necessary to permit preparation of financial statements in accordance with generally accepted accounting principles, and that receipts and expenditures of the company are being made only in accordance with authorizations of management and directors of the company; and (3) provide reasonable assurance regarding prevention or timely detection of unauthorized acquisition, use or disposition of the company’s assets that could have a material effect on the financial statements.
Because of its inherent limitations, internal control over financial reporting may not prevent or detect misstatements. Also, projections of any evaluation of effectiveness to future periods are subject to the risk that controls may become inadequate because of changes in conditions, or that the degree of compliance with the policies or procedures may deteriorate.
In our opinion, PulteGroup, Inc. maintained, in all material respects, effective internal control over financial reporting as of December 31, 2013,2015, based on the COSO criteria.
We also have audited, in accordance with the standards of the Public Company Accounting Oversight Board (United States), the consolidated balance sheets of PulteGroup, Inc. as of December 31, 20132015 and 20122014, and the related consolidated statements of operations, comprehensive income, (loss), shareholders’ equity, and cash flows for each of the three years in the period ended December 31, 20132015 and our report dated February��5, 2014February 8, 2016 expressed an unqualified opinion thereon.
/s/ Ernst & Young LLP
Detroit, MichiganAtlanta, Georgia
February 5, 20148, 2016
| |
| (c) | Changes in Internal Control Over Financial Reporting |
There has been no change in our internal control over financial reporting during the quarter ended December 31, 20132015 that has materially affected, or is reasonably likely to materially affect, our internal control over financial reporting.
ITEM 9B. OTHER INFORMATION
This Item is not applicable.
PART III
ITEM 10. DIRECTORS, EXECUTIVE OFFICERS AND CORPORATE GOVERNANCE
Information required by this Item with respect to our executive officers is set forth in Item 4A of this Annual Report on Form 10-K. Information required by this Item with respect to members of our Board of Directors and with respect to our audit committee will be contained in the Proxy Statement for the 20142016 Annual Meeting of Shareholders (“20142016 Proxy Statement”) under the captions “Election of Directors” and “Committees of the Board of Directors - Audit Committee” and in the chart disclosing Audit Committee membership and is incorporated herein by this reference. Information required by this Item with respect to compliance with Section 16(a) of the Securities Exchange Act of 1934 will be contained in the 20142016 Proxy Statement under the caption “Beneficial Security Ownership - Section 16(a) Beneficial Ownership Reporting Compliance,” and is incorporated herein by this reference. Information required by this Item with respect to our code of ethics will be contained in the 20142016 Proxy Statement under the caption “Corporate Governance - Governance Guidelines; Code of Ethical Business Conduct; Code of Ethics” and is incorporated herein by this reference.
Our code of ethics for principal officers, our code of ethical business conduct, our corporate governance guidelines, and the charters of the Audit, Compensation and Management Development, Nominating and Governance, and Finance and Investment committees of our Board of Directors are also posted on our website and are available in print, free of charge, upon request.
| |
| ITEM 11. | EXECUTIVE COMPENSATION |
Information required by this Item will be contained in the 20142016 Proxy Statement under the captions “20132015 Executive Compensation” and “20132015 Director Compensation” and is incorporated herein by this reference, provided that the Compensation and Management Development Committee Report shall not be deemed to be “filed” with this Annual Report on Form 10-K.
| |
| ITEM 12. | SECURITY OWNERSHIP OF CERTAIN BENEFICIAL OWNERS AND MANAGEMENT AND RELATED STOCKHOLER MATTERS |
Information required by this Item will be contained in the 20142016 Proxy Statement under the captions “Beneficial Security Ownership” and “Equity Compensation Plan Information” and is incorporated herein by this reference.
| |
| ITEM 13. | CERTAIN RELATIONSHIPS AND RELATED TRANSACTIONS AND DIRECTOR INDEPENDENCE |
Information required by this Item will be contained in the 20142016 Proxy Statement under the captions “Certain Relationships and Related Transactions” and “Election of Directors - Independence” and is incorporated herein by this reference.
ITEM 14. PRINCIPAL ACCOUNTANT FEES AND SERVICES
Information required by this Item will be contained in the 20142016 Proxy Statement under the captions “Audit and Non-Audit Fees” and “Audit Committee Preapproval Policies” and is incorporated herein by reference.
PART IV
| |
| ITEM 15. | EXHIBITS AND FINANCIAL STATEMENT SCHEDULES |
| |
| (a) | The following documents are filed as part of this Annual Report on Form 10-K: |
(1) Financial Statements
| |
| (2) | Financial Statement Schedules |
All schedules are omitted because the required information is not present, is not present in amounts sufficient to require submission of the schedule, or because the required information is included in the financial statements or notes thereto.
The following exhibits are filed with this Annual Report on Form 10-K or are incorporated herein by reference:
Exhibit Number and Description
|
| | | | |
| (2) | | (a) | | Asset Purchase Agreement, dated as of December 15, 2015, by and among JW Homes, LLC, JW Land
Investment, LLC and PulteGroup, Inc (Incorporated by reference to Exhibit 2.1 of our Current Report on Form 8-K filed with the SEC on December 17, 2015) |
| | | | |
| (3) | | (a) | | Restated Articles of Incorporation, of PulteGroup, Inc. (Incorporated by reference to Exhibit 3.1 of our Current Report on Form 8-K, filed with the SEC on August 18, 2009) |
| | | | | |
| | | (b) | | Certificate of Amendment to the Articles of Incorporation, dated March 18, 2010 (Incorporated by reference to Exhibit 3(b) of our Quarterly Report on Form 10-Q for the quarter ended March 31, 2010) |
| | | | | |
| | | (c) | | Certificate of Amendment to the Articles of Incorporation, dated May 21, 2010 (Incorporated by reference to Exhibit 3(c) of our Quarterly Report on Form 10-Q for the quarter ended September 30, 2010) |
| | | | | |
| | | (d) | | By-laws, as amended, of PulteGroup, Inc. (Incorporated by reference to Exhibit 3.1 of our Current Report on Form 8-K, filed with the SEC on April 8, 2009) |
| | | | | |
| | | (e) | | Certificate of Designation of Series A Junior Participating Preferred Shares, dated August 6, 2009 (Incorporated by reference to Exhibit 3(b) of our Registration Statement on Form 8-A, filed with the SEC on August 18, 2009) |
| | | | | |
| (4) | | (a) | | Any instrument with respect to long-term debt, where the securities authorized thereunder do not exceed 10% of the total assets of PulteGroup, Inc. and its subsidiaries, has not been filed. The Company agrees to furnish a copy of such instruments to the SEC upon request. |
| | | | | |
| | | (b) | | Amended and Restated Section 382 Rights Agreement, dated as of March 18, 2010, between PulteGroup, Inc. and Computershare Trust Company, N.A., as rights agent, which includes the Form of Rights Certificate as Exhibit B thereto (Incorporated by reference to Exhibit 4 of PulteGroup, Inc.’s Registration Statement on Form 8-A/A filed with the SEC on March 23, 2010) |
| | | | | |
| | | (c) | | First Amendment to Amended and Restated Section 382 Rights Agreement, dated as of March 14, 2013, between PulteGroup, Inc. and Computershare Trust Company, N.A., as rights agent (Incorporated by reference to Exhibit 4-1 of our Current Report on Form 8-K, filed with the SEC on March 15, 2013) |
| | | | | |
| (10) | | (a) | | 1995 Stock Incentive Plan for Key Employees (Incorporated by reference to our Proxy Statement dated March 31, 1995, and as Exhibit 4.1 of our Registration Statement on Form S-8, Registration No. 33-99218) |
| | | | |
| | (b) | | PulteGroup, Inc. 401(k) Plan (Incorporated by reference to Exhibit 4.3 of our Registration Statement on Form S-8, No. 333-115570) |
| | | | |
|
| | | | |
| | | (c) | | Facility Agreement dated as of June 23, 2009 among PulteGroup, Inc., Various Financial Institutions, and Deutsche Bank AG, New York Branch (Incorporated by reference to Exhibit 10.1 of our Current Report on Form 8-K, filed with the SEC on June 26, 2009) |
| | | | |
| | | (d) | | PulteGroup, Inc. 2000 Stock Incentive Plan for Key Employees (Incorporated by reference to Exhibit 4.3 of our Registration Statement on Form S-8, Registration No. 333-66284) |
| | | | |
| | (e) | | PulteGroup, Inc. 2000 Stock Plan for Nonemployee Directors (Incorporated by reference to Exhibit 4.3 of our Registration Statement on Form S-8, Registration No. 333-66284) |
| | | | |
| | (f)(b) | | PulteGroup, Inc. 2002 Stock Incentive Plan (Incorporated by reference to our Proxy Statement dated April 3, 2002 and as Exhibit 4.3 of our Registration Statement on Form S-8, No. 333-123223) |
| | | | | |
| | | (g)(c) | | PulteGroup, Inc. 2008 Senior Management Incentive Plan (Incorporated by reference to our Proxy Statement dated April 7, 2008) |
| | | | | |
| | | (h)(d) | | PulteGroup, Inc. 2013 Senior Management Incentive Plan (Incorporated by reference to Exhibit 10.2 of our Current Report on Form 8-K, filed with the SEC on May 13, 2013) |
| | | | | |
| | | (i)(e) | | PulteGroup, Inc. Long-Term Incentive Program (Incorporated by reference to Exhibit 10.2 of our Current Report on Form 8-K, filed with the SEC on May 20, 2008) |
| | | | | |
| | | (j)(f) | | Form of PulteGroup, Inc. Long Term Incentive Award Agreement (Incorporated by reference to Exhibit 10.3 of our Current Report on Form 8-K, filed with the SEC on May 20, 2008) |
| | | | | |
| | | (k)(g) | | Form of PulteGroup, Inc. 2008-2010 Grant Acceptance Agreement - Company Performance Measures (Incorporated by reference to Exhibit 10.4 of our Current Report on Form 8-K, filed with the SEC on May 20, 2008) |
| | | | | |
| | | (l)(h) | | Form of PulteGroup, Inc. 2008-2010 Grant Acceptance Agreement - Individual Performance Measures (Incorporated by reference to Exhibit 10.5 of our Current Report on Form 8-K, filed with the SEC on May 20, 2008) |
| | | | | |
| | | (m)(i) | | PulteGroup, Inc. 2013 Stock Incentive Plan (Incorporated by reference to Exhibit 10.1 of our Current Report on Form 8-K, filed with the SEC on May 13, 2013) |
| | | | | |
| | | (n)(j) | | PulteGroup, Inc. 2004 Stock Incentive Plan (as Amended and Restated as of July 9, 2009) (Incorporated by reference to Exhibit 10(a) of our Quarterly Report on Form 10-Q for the quarter ended September 30, 2009) |
| | | | | |
| | | (o)(k) | | Form of Restricted Stock Unit Award Agreement under PulteGroup, Inc. 2013 Stock Incentive Plan (Incorporated by reference to Exhibit 10(c) of our Quarterly Report on Form 10-Q for the quarter ended March 31, 2014) |
| | | | |
| | (l) | | Form of Restricted Stock Award Agreement (as amended) under PulteGroup, Inc. 2004 Stock Incentive Plan (Incorporated by reference to Exhibit 10(a) of our Quarterly Report on Form 10-Q for the quarter ended March 31, 2010) |
| | | | | |
| | | (p)(m) | | Form of Restricted Stock Award Agreement (as amended) under PulteGroup, Inc. 2004 Stock Incentive Plan (Filed herewith)(Incorporated by reference to Exhibit 10(p) of our Annual Report on Form 10-K for the year ended December 31, 2013) |
| | | | | |
| | | (q)(n) | | Form of Restricted Stock Award Agreement (as amended) under PulteGroup, Inc. 2000 Stock Incentive Plan for Key Employees ( Incorporated(Incorporated by reference to Exhibit 10(b) of our Quarterly Report on Form 10-Q for the quarter ended March 31, 2010) |
| | | | | |
| | | (r)(o) | | Form of Stock Option Agreement under PulteGroup, Inc. 2002 and 2004 Stock Incentive Plans (Incorporated by reference to Exhibit 10(s) of our Annual Report on Form 10-K for the year ended December 31, 2007) |
| | | | | |
| | | (s)(p) | | Form of Stock Option Agreement (as amended) under PulteGroup, Inc. 2002 and 2004 Stock Incentive Plans (Incorporated by reference to Exhibit 10(t) of our Annual Report on Form 10-K for the year ended December 31, 2007) |
| | | | | |
| | | (t)(q) | | Form of Performance Share Award Agreement under PulteGroup, Inc. 2004 Stock Incentive Plan (Incorporated by reference to Exhibit 10(w) of our Annual Report on Form 10-K for the year ended December 31, 2011 ) |
| | | | | |
| | | (u) | | Centex Corporation Amended and Restated 1987 Stock Option Plan (Amended and Restated Effective February 11, 2009) (Incorporated by reference to Exhibit 10.4 of Centex’s Current Report on Form 8-K, filed with the SEC on February 13, 2009) |
| | | | |
| | (v) | | Amended and Restated Centex Corporation 2001 Stock Plan (Amended and Restated Effective February 11, 2009) (Incorporated by reference to Exhibit 10.2 of Centex’s Current Report on Form 8-K, filed with the SEC on February 13, 2009) |
| | | | |
|
| | | | |
| | (w) | | Form of stock option agreement for the Amended and Restated Centex Corporation 2001 Stock Plan (Incorporated by reference to Exhibit 10.5 of Centex’s Current Report on Form 8-K, filed with the SEC on May 13, 2008) |
| | | | |
| | (x) | | Centex Corporation 2003 Equity Incentive Plan (Amended and Restated Effective February 11, 2009) (Incorporated by reference to Exhibit 10.1 of Centex’s Current Report on Form 8-K, filed with the SEC on February 13, 2009) |
| | | | |
| | (y) | | Form of stock option agreement for the Centex Corporation 2003 Equity Incentive Plan (Incorporated by reference to Exhibit 10.6 of Centex’s Current Report on Form 8-K, filed with the SEC on May 13, 2008) |
| | | | |
| | (z)(r) | | PulteGroup, Inc. Long Term Compensation Deferral Plan (As Amended and Restated Effective January 1, 2004) (Incorporated by reference to Exhibit 10(a) of our Quarterly Report on Form 10-Q for the quarter ended March 31, 2006) |
| | | | | |
| | | (aa)(s) | | PulteGroup, Inc. Deferred Compensation Plan for Non-Employee Directors (as Amended and Restated Effective December 8, 2009) (Incorporated by reference to Exhibit 10(al) of our Annual Report on Form 10-K for the year ended December 31, 2009) |
| | | | | |
| | | (ab)(t) | | Assignment and Assumption Agreement dated as of August 18, 2009 between PulteGroup, Inc. and Centex Corporation (Incorporated by reference to Exhibit 10.2 of our Current Report on Form 8-K, filed with the SEC on August 20, 2009) |
| | | | | |
|
| | | | |
| | | (ac)(u) | | Form of Performance Award Agreement under PulteGroup, Inc. 2008 Senior Management Incentive Plan (Incorporated by reference to Exhibit 10(a) of our Quarterly Report on Form 10-Q for the quarter ended March 31, 2012) |
| | | | | |
| | | (ad)(v) | | PulteGroup, Inc. Executive Severance Policy (Incorporated by reference to Exhibit 10.1 of our Current Report on Form 8-K, filed with the SEC on February 12, 2013) |
| | | | | |
| | | (ae)(w) | | PulteGroup, Inc. Amended Retirement Policy (Incorporated by reference to Exhibit 10.210(a) of our CurrentQuarterly Report on Form 8-K, filed with10-Q for the SEC on February 12, 2013)quarter ended June 30, 2015) |
| | | | | |
| | | (af)(x) | | Master RepurchaseCredit Agreement dated as of July 23, 2014 among PulteGroup, Inc., as Borrower, Bank of America,
N.A., as Administrative Agent, Swing Line Lender and an L/C Issuer, and the Other Lenders Party
Hereto (Incorporated by reference to Exhibit 10(a) of our Quarterly Report on Form 10-Q for the quarter
ended June 30, 2014) |
| | | | |
| | (y) | | Term Loan Agreement, dated as of September 28, 201230, 2015, among Comericathe Company, Bank of America, N.A., as Agentadministrative agent, and a Buyer, the other Buyers party hereto and Pulte Mortgage LLC, as Sellerlenders listed therein (Incorporated by reference to Exhibit 10.1 of our Current Report on Form 8-K, filed with the SEC on October 2, 2012)5, 2015) |
| | | | | |
| | | (ag)(z) | | First Amendment toAmended and Restated Master Repurchase Agreement dated as of September 13, 20134, 2015, among Comerica Bank, as Agent, Lead Arranger and a Buyer, the other Buyers party hereto and Pulte Mortgage LLC, as Seller (Incorporated by reference to Exhibit 10.1 of our Current Report on Form 8-K, filed with the SEC on September 18, 2013)8, 2015 |
| | | | | |
| | | (ah)(aa) | | SecondFirst Amendment to Master Repurchase Agreement dated as of January 9, 2014December 10, 2015 among Comerica Bank, as Agent and a Buyer, the other Buyers party heretothereto and Pulte Mortgage LLC, as Seller (Incorporated by reference to Exhibit 10.1 of our Current Report on Form 8-K filed with the SEC on January 13, 2014) |
| | | | |
| | (ai) | | Third Amendment to Master Repurchase Agreement dated as of September 13, 2013 among Comerica Bank, as Agent and a Buyer, the other Buyers party hereto and Pulte Mortgage LLC, as Seller (filed herewith) |
| | | | |
| | (aj) | | Separation Agreement dated as of November 30, 2012, between PulteGroup, Inc. and John B. Bertero III (Incorporated by referenced to Exhibit 10.1 of our Current Report on Form 8-K filed with the SEC on December 4, 2012) |
| | | | 14, 2015) |
| | | | | |
| (12) | | | | Ratio of Earnings to Fixed Charges at December 31, 20132015 (Filed herewith) |
| | | | | |
| (21) | | | | Subsidiaries of the Registrant (Filed herewith) |
| | | | | |
| (23) | | | | Consent of Independent Registered Public Accounting Firm (Filed herewith) |
| | | | |
| (24) | | | | Power of Attorney (filed herewith) |
| | | | | |
| (31) | | (a) | | Rule 13a-14(a) Certification by Richard J. Dugas, Jr., Chairman, President, and Chief Executive Officer (Filed herewith) |
| | | | | |
| | | (b) | | Rule 13a-14(a) Certification by Robert T. O'Shaughnessy, Executive Vice President and Chief Financial Officer (Filed herewith) |
| | | | | |
| (32) | | | | Certification Pursuant to 18 United States Code § 1350 and Rule 13a-14(b) of the Securities Exchange Act of 1934 (Filed herewith) |
| | | | | |
| 101.INS | | | | XBRL Instance Document |
|
| | | | |
| | | | | |
| 101.SCH | | | | XBRL Taxonomy Extension Schema Document |
| | | | | |
| 101.CAL | | | | XBRL Taxonomy Extension Calculation Linkbase Document |
| | | | | |
| 101.DEF | | | | XBRL Taxonomy Extension Definition Linkbase Document |
| | | | | |
| 101.LAB | | | | XBRL Taxonomy Extension Label Linkbase Document |
| | | | | |
| 101.PRE | | | | XBRL Taxonomy Extension Presentation Linkbase Document |
SIGNATURES
Pursuant to the requirements of Section 13 or 15(d) of the Securities Exchange Act of 1934, the Registrant has duly caused this report to be signed on its behalf by the undersigned, thereunto duly authorized.
PULTEGROUP, INC.
(Registrant)
|
| | | |
February 5, 20148, 2016 | By: | | /s/ Robert T. O'Shaughnessy |
| | | | Robert T. O'Shaughnessy |
| | | | Executive Vice President |
| | | | and Chief Financial Officer |
Pursuant to the requirements of the Securities Exchange Act of 1934, this report has been signed below by the following persons on behalf of the Registrant and in the capabilitiescapacities and on the datesdate indicated:
|
| | | | | | | |
Signature | February 8, 2016 | | Title | | Date | | |
| | | | | | | | |
| /s/ Richard J. Dugas, Jr. | | | /s/ Robert T. O'Shaughnessy | | | /s/ James L. Ossowski |
| Richard J. Dugas, Jr. | | | Robert T. O'Shaughnessy | | | James L. Ossowski |
| | Chairman of the Board of Directors, President, and Chief Executive Officer (Principal Executive Officer) | | February 5, 2014 |
Richard J. Dugas, Jr.Executive Vice President and
Chief Financial Officer
(Principal Financial Officer) | | | Vice President, Finance and Controller
(Principal Accounting Officer) |
| |
| | | | |
/s/ Robert T. O'Shaughnessy | | Executive Vice President and
Chief Financial Officer
(Principal Financial Officer)
| | February 5, 2014 |
Robert T. O'Shaughnessy | | | |
| | | |
/s/ James L. Ossowski | | Vice President, Finance and Controller
(Principal Accounting Officer)
| | February 5, 2014 |
James L. Ossowski | | | |
| | | |
/s/ Brian P. Anderson | | Member of Board of Directors | | February 5, 2014 |
Brian P. Anderson | | | |
| | | |
/s/ Bryce Blair | | Member of Board of Directors | | February 5, 2014 |
Bryce Blair | | | |
| | | |
/s/ Thomas J. Folliard | | Member of Board of Directors | | February 5, 2014 |
Thomas J. Folliard | | | |
| | | |
/s/ Cheryl W. Grisé | | Member of Board of Directors | | February 5, 2014 |
Cheryl W. Grisé | | | |
| | | | | | | | |
/s/ André J. Hawaux | Brian P. Anderson | | | Member of Board of Directors | | February 5, 2014 |
André J. Hawaux | } | | |
| | | | | | | | |
/s/ Debra J. Kelly-Ennis | Bryce Blair | | | Member of Board of Directors | | February 5, 2014 |
Debra J. Kelly-Ennis | } | | |
| | | | | | | | |
/s/ Patrick J. O’Leary | Richard W. Dreiling | | | Member of Board of Directors | | February 5, 2014 |
Patrick J. O’Leary | } | | |
| | | | | | | | |
/s/ James | Thomas J. PostlFolliard | | | Member of Board of Directors | } | February 5, 2014 | /s/ Robert T. O'Shaughnessy |
James J. Postl | | | | | | |
| Cheryl W. Grisé | | | Member of Board of Directors | } | | Robert T. O'Shaughnessy |
| | | | | | | |
| James Grosfeld | | | Member of Board of Directors | } | | Executive Vice President and
Chief Financial Officer |
| | | | | | |
| André J. Hawaux | | | Member of Board of Directors | } | | |
| | | | | | | | |
| Debra J. Kelly-Ennis | | | Member of Board of Directors | } | | |
| | | | | | | |
| Patrick J. O’Leary | | | Member of Board of Directors | } | | |
| | | | | | | |
| James J. Postl | | | Member of Board of Directors | } | | |
| | | | | | | |