UNITED STATES SECURITIES AND EXCHANGE COMMISSION
Washington, D.C. 20549
Form 10-K
|
| | | | | | | | | | |
þ☑ | | ANNUAL REPORT PURSUANT TO SECTION 13 OR 15(d) OF THE SECURITIES EXCHANGE ACT OF 1934 |
| | For the fiscal year ended | August 31, 20192020 |
| or |
o☐ | | TRANSITION REPORT PURSUANT TO SECTION 13 OR 15(d) OF THE SECURITIES EXCHANGE ACT OF 1934 |
| | For the transition period from to . |
Commission file number: 001-36079
CHS Inc.
(Exact name of Registrant as specified in its charter)
| | | | | | | | | | | | | | | | | | | | |
| Minnesota | | 41-0251095 |
(State or other jurisdiction of
incorporation or organization) | | (I.R.S. Employer
Identification Number) |
| | 5500 Cenex Drive | |
| | |
Minnesota
(State or other jurisdiction of
incorporation or organization)
| | 41-0251095
(I.R.S. Employer
Identification Number)
|
5500 Cenex Drive | | |
Inver Grove Heights, | Minnesota | 55077 (Address
| | |
| (Address of principal executive offices, including zip code) |
| | (651) | 355-6000 (Registrant’s
| | | |
| (Registrant’s telephone number, including area code) |
Securities registered pursuant to Section 12(b) of the Act:
|
| | | | | | | |
| Title of each class | Trading Symbol(s) | Name of each exchange on which registered |
| 8% Cumulative Redeemable Preferred Stock | CHSCP | The Nasdaq Stock Market LLC |
| Class B Cumulative Redeemable Preferred Stock, Series 1 | CHSCO | The Nasdaq Stock Market LLC |
| Class B Reset Rate Cumulative Redeemable Preferred Stock, Series 2 | CHSCN | The Nasdaq Stock Market LLC |
| Class B Reset Rate Cumulative Redeemable Preferred Stock, Series 3 | CHSCM | The Nasdaq Stock Market LLC |
| Class B Cumulative Redeemable Preferred Stock, Series 4 | CHSCL | The Nasdaq Stock Market LLC |
SECURITIES REGISTERED PURSUANT TO SECTION 12(g) OF THE ACT: NONE
Indicate by check mark if the Registrant is a well-known seasoned issuer, as defined in Rule 405 of the Securities Act.
YES o NO þYes ☐ No ☑
Indicate by check mark if the Registrant is not required to file reports pursuant to Section 13 or Section 15(d) of the Act.
YES o NO þYes ☐ No ☑
Indicate by check mark whether the Registrant (1) has filed all reports required to be filed by Section 13 or 15(d) of the Securities Exchange Act of 1934 during the preceding 12 months (or for such shorter period that the Registrant was required to file such reports), and (2) has been subject to such filing requirements for the past 90 days.
YES þ NO oYes ☑ No ☐
Indicate by check mark whether the Registrant has submitted electronically every Interactive Data File required to be submitted pursuant to Rule 405 of Regulation S-T (§232.405 of this chapter) during the preceding 12 months (or for such shorter period that the Registrant was required to submit such files).
YES þ NO oYes ☑ No ☐
Indicate by check mark whether the Registrant is a large accelerated filer, an accelerated filer, a non-accelerated filer, a smaller reporting company, or an emerging growth company. See the definitions of "large accelerated filer," "accelerated filer," "smaller reporting company," and "emerging growth company" in Rule 12b-2 of the Exchange Act.
|
| | | | | | | | | | | | | | | | | | | | | | | | | | | | |
Large accelerated filero | ☐ | Accelerated filero | ☐ | Non-accelerated filerþ | þ | Smaller reporting companyo | ☐ | Emerging growth companyo | ☐ |
If an emerging growth company, indicate by check mark if the Registrant has elected not to use the extended transition period for complying with any new or revised financial accounting standards provided pursuant to Section 13(a) of the Exchange Act.o
Indicate by check mark whether the Registrant has filed a report on and attestation to its management's assessment of the effectiveness of its internal control over financial reporting under Section 404(b) of the Sarbanes-Oxley Act (15 U.S.C. 7262(b)) by the registered public accounting firm that prepared or issued its audit report. o
Indicate by check mark whether the Registrant is a shell company (as defined in Rule 12b-2 of the Act).
YES o NO þYes ☐ No ☑
State the aggregate market value of the voting and non-voting common equity held by non-affiliates computed by reference to the price at which the common equity was last sold, or the average bid and asked price of such common equity, as of the last business day of the Registrant’s most recently completed second fiscal quarter:
The Registrant has no voting or non-voting common equity (the Registrant is a member cooperative).
Indicate the number of shares outstanding of each of the Registrant’sRegistrant's classes of common stock, as of the latest practicable date:
The Registrant has no common stock outstanding.
DOCUMENTS INCORPORATED BY REFERENCE
None.
INDEX
PART I
ITEM 1. BUSINESS
THE COMPANY
CHS Inc. (referred to herein as "CHS," "we," "us" or "our") is the nation’s leading integrated agricultural cooperative, providing grain, foods and energy resources to businesses and consumers on a global basis. As a cooperative, we are owned by farmers and ranchers and their member cooperatives (referred to herein as "members") across the United States. We also have preferred shareholders that own shares of our five series of preferred stock, which are each listed and traded on the Nasdaq Global Select Market.Market of The Nasdaq Stock Market LLC ("The Nasdaq"). We buy commodities from and provide products and services to individual agricultural producers, local cooperatives and other companies (including our members and other non-membernonmember customers), both domestically and internationally. We provide a wide variety of products and services, ranging from initial agricultural inputs such as fuels, farm supplies, crop nutrients and crop protection products to agricultural outputs that include grains and oilseeds, grainprocessed grains and oilseed processing,oilseeds, renewable fuels and food products. A portion of our operations are conducted through equity investments and joint ventures whose operating results are not fully consolidated with our results; rather, a proportionate share of the income or loss from those equity investments and joint ventures is included as a component of our net income using the equity method of accounting. For the year ended August 31, 2019,2020, our total revenues were $31.9$28.4 billion and net income attributable to CHS Inc. was $829.9$422.4 million.
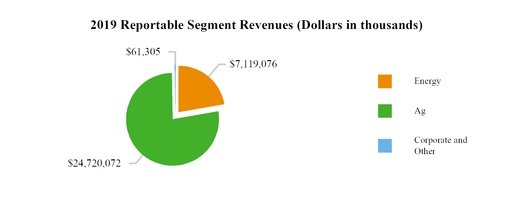
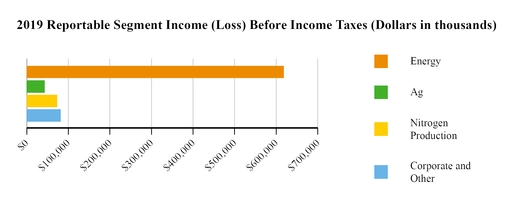
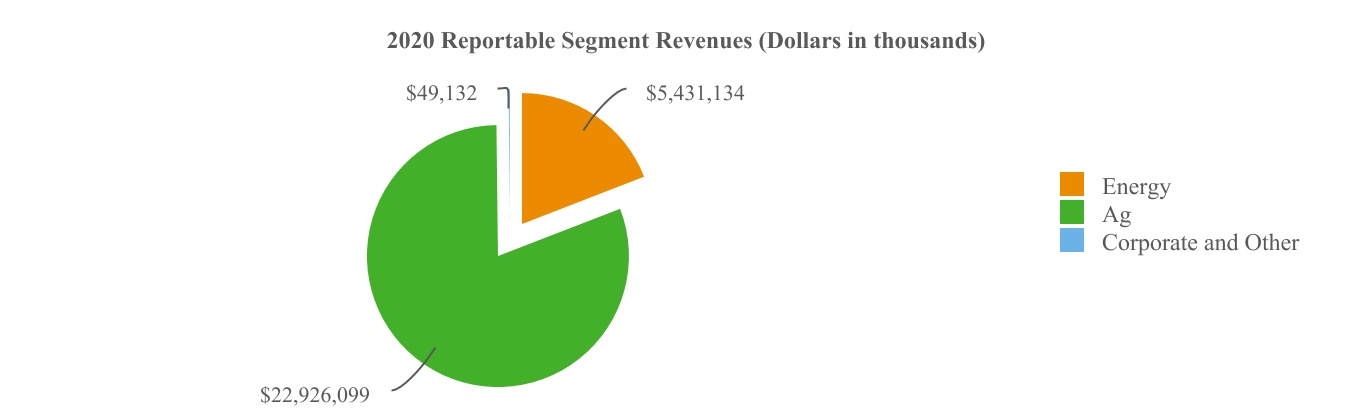
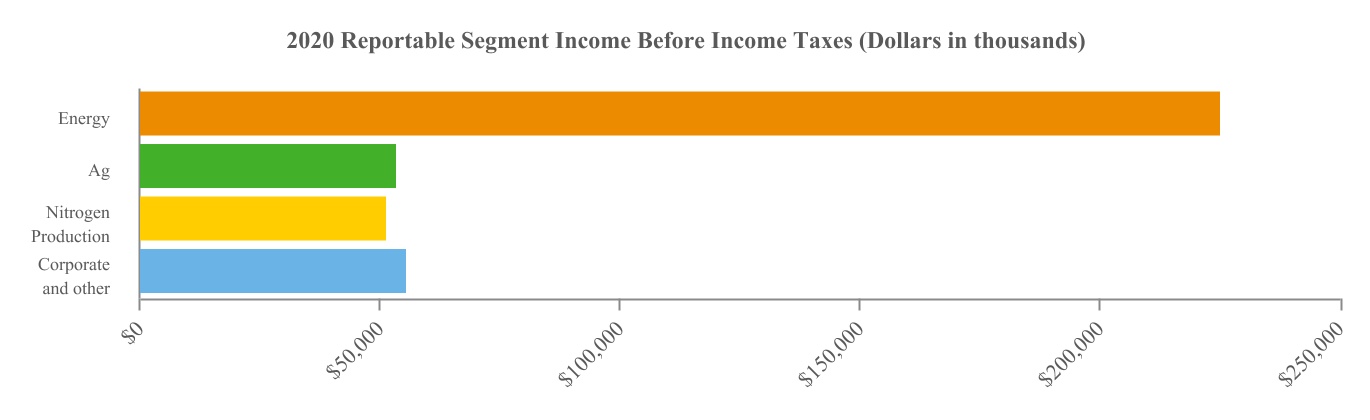
We have aligned our segments based on an assessment of how our businesses operate and the products and services they sell. Our Energy segment derives its revenues through refining, wholesaling and retailing of petroleum products. Our Ag segment derives its revenues through origination and marketing of grain, including service activities conducted at export terminals; through wholesale agronomy sales of crop nutrient and crop protection products; from sales of soybean meal, soybean refined oil and soyflour products; through the production and marketing of renewable fuels; and through retail sales of petroleum and agronomy products, processed sunflowers, feed and farm supplies. Our Ag segment also records equity income from our grain export joint venture and other investments. Our Nitrogen Production segment consists solely of our equity method investment in CF Industries Nitrogen, LLC ("CF Nitrogen"). Our other business operations, primarily our financing and hedging businesses, are included in Corporate and Other because of the nature of their products and services, as well as the relative amount of revenues forfrom those businesses. Prior to its sale on May 4, 2018, our insurance business was also included in Corporate and Other. In addition, our non-consolidatednonconsolidated wheat milling and food production and distribution joint ventures are included in Corporate and Other.
Our earnings from cooperative business are allocated to members (and to a limited extent to non-membersnonmembers with which we have agreed to do business on a patronage basis) based on the volume of business they do with us. We allocate these earnings to our patrons in the form of patronage refunds (which are also called patronage dividends), which may be in cash, patrons’ equities (in the form of capital equity certificates) or both. Patrons' equities may be redeemed over time solely at the discretion of our Board of Directors. Earnings derived from non-members,nonmembers, which are not treated as patronage, are taxed at federal and state statutory corporate rates and are retained by us as unallocated capital reserves. We also receive patronage refunds from the cooperatives in which we are a member, if those cooperatives have earnings to distribute and if we qualify for patronage refunds from them.
Our origins date back to the early 1930s with the founding of our predecessor companies, Cenex, Inc. and Harvest States Cooperatives. CHS Inc. emerged as the result of the merger of those two entities in 1998 and is headquartered in Inver Grove Heights, Minnesota.
Our internet address is www.chsinc.com. The information contained on our website is not part of, and is not incorporated in, this Annual Report on Form 10-K or any other report we file with or furnish to the SEC.
ENERGY
Overview
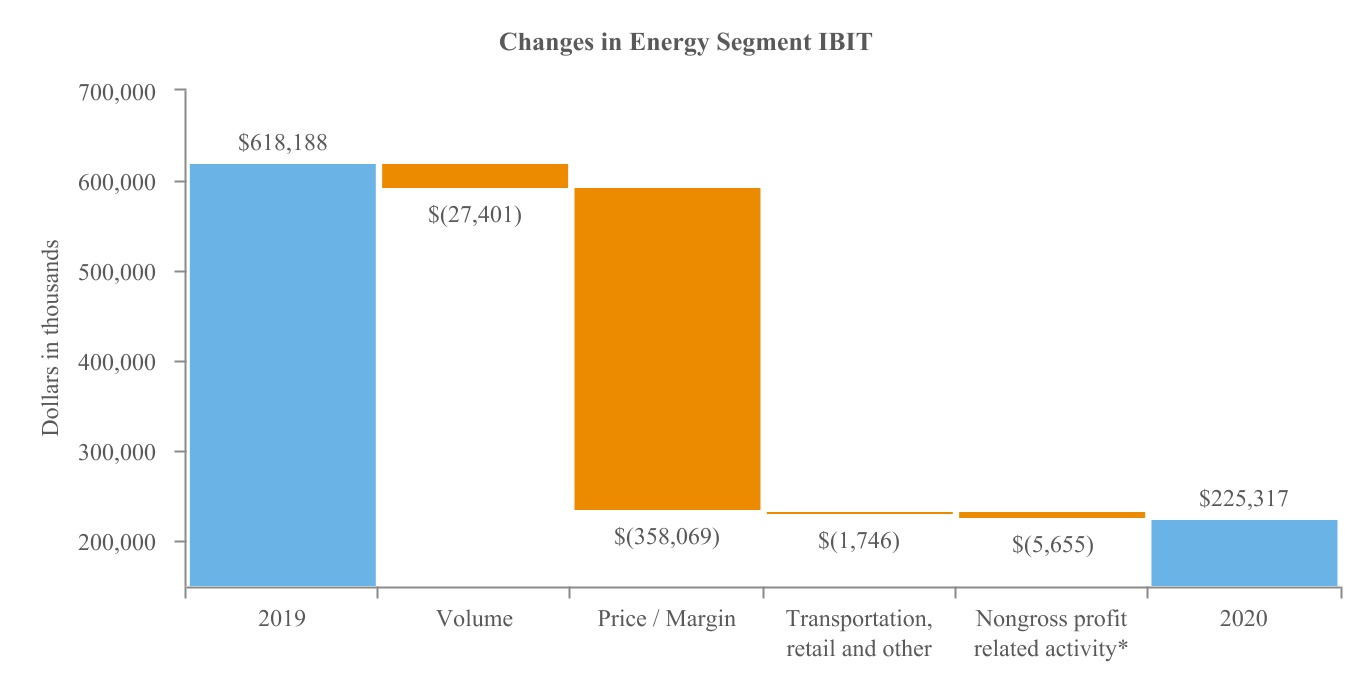
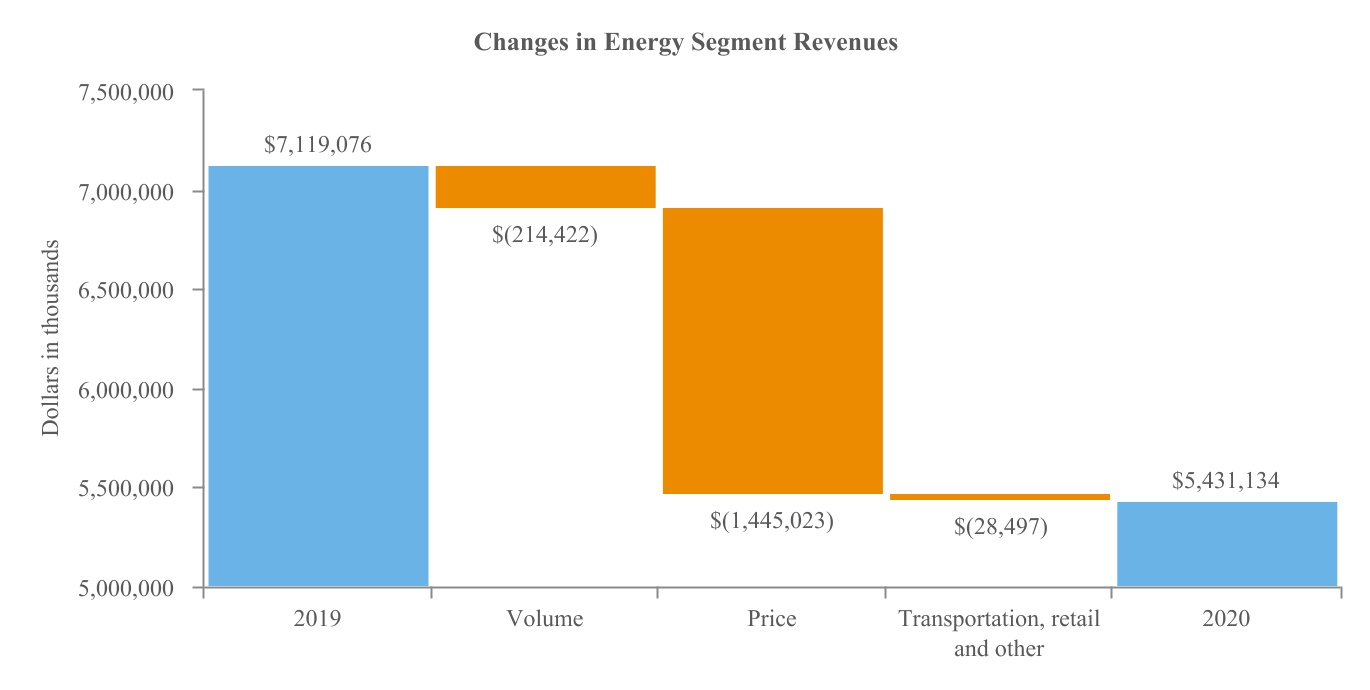
We are the nation's largest cooperative energy company based on revenues and identifiable assets, with operations that include petroleum refining and pipelines; supply, marketing and distribution of refined fuels (gasoline, diesel fuel and other energy products); blending, sale and distribution of lubricants; and wholesale supply of propane and other natural gas liquids. Our Energy segment processes crude oil into refined petroleum products at our refineries in Laurel, Montana, and McPherson, Kansas, and sells those products under the Cenex® brand to member cooperatives and other independent retailers through a network of nearly 1,500 sites, the majority of which are convenience stores marketing Cenex branded fuels and owned by our member cooperatives. For fiscal 2019,2020, our Energy revenues, after elimination of intersegment revenues, were $7.1$5.4 billion and were primarily from gasoline, diesel fuel and diesel fuel.propane.
Operations
Laurel refinery. Our Laurel, Montana, refinery processes medium- and high-sulfur crude oil into refined petroleum products that primarily include gasoline, diesel fuel, asphalt and petroleum coke and asphalt.coke. Our Laurel refinery sources approximately 93%95% of its crude oil supply from Canada, with the remaining balance obtained from domestic sources, and we have access to Canadian and northwest Montana crude oil through our wholly-owned Front Range Pipeline, LLC, and other common carrier pipelines. Our Laurel refinery also has access to Wyoming crude oil via common carrier pipelines from the south.
Our Laurel refinery processes approximately 61,00055,500 barrels of crude oil per day to produce refined products that consist of approximately 43%42% gasoline, 41%40% diesel fuel and other distillates, 8%10% asphalt, 7% petroleum coke and 1% other products. Refined fuels produced at our Laurel refinery are available via rail cars and via the Yellowstone Pipeline to western Montana terminals and to Spokane, Washington; south via common carrier pipelines to Wyoming terminals and Denver, Colorado; and east via our wholly-owned Cenex Pipeline, LLC, to Glendive, Montana, and Minot, Prosper and Fargo, North Dakota.
McPherson refinery. Our McPherson, Kansas, refinery processes approximately 61%64% low- and medium-sulfur crude oil and approximately 39%36% heavy-sulfur crude oil into gasoline, diesel fuel and other distillates, propane and other products. The refinery sources its crude oil through its own pipelines, as well as common carrier pipelines. Low- and medium-sulfur crude oil is sourced from Kansas, Colorado, North Dakota, Oklahoma and Texas, and heavy-sulfur crude oil is sourced from Canada and Wyoming.
Our McPherson refinery processes approximately 110,000 barrels of crude oil per day to produce refined products that consist of approximately 52%53% gasoline, 42%41% diesel fuel and other distillates, 2% propane and 4% other products. These products are loaded into trucks at the McPherson refinery or shipped via common carrier pipelines to other markets.
Other energy operations. We operate six propane terminals, four asphalt terminals, seven refined product terminals and three lubricants blending and packaging facilities. We also own and lease a fleet of liquid and pressure trailers and tractors, which transport refined fuels, propane, anhydrous ammonia and other products.
Products and Services
Our Energy segment produces and sells (primarily wholesale) gasoline, diesel fuel, propane, asphalt, lubricants and other related products, and also provides transportation services. In addition to selling products refined at our Laurel and McPherson refineries, we purchase refined petroleum products from third parties. For fiscal 2019,2020, we obtained approximately 70%76% of the refined petroleum products we sold from our Laurel and McPherson refineries and approximately 30%24% from third parties.
Sales and Marketing; Customers
We market approximately 80% of our refined fuel products to members, with the balance sold to non-members.nonmembers. Sales are made wholesale to member cooperatives and through a network of independent retailers that operate convenience stores under the Cenex brand. We sold approximately 1.51.4 billion gallons of gasoline and approximately 1.7 billion gallons of diesel fuel in fiscal 2019.2020. We also blend, package and wholesale auto and farm machinery lubricants to both members and non-members.nonmembers. We are one of the nation’snation's largest propane wholesalers based on revenues. Most of the propane sold in rural areas is for heating and agricultural usage. Annual sales volumes of propane vary greatly depending on weather patterns and crop conditions.
Industry; Competition
The petroleum business is highly cyclical. Demand for crude oil and energy products is driven by the condition of local and worldwide economies, local and regional weather patterns and taxation relative to other energy sources, which can significantly affect the price of refined fuel products. Our Energy segment generally experiences higher volumes and profitability in certain operating areas, such as refined products in the spring, summer and early fall when gasoline and diesel fuel usage by our agricultural customers is highest and is subject to domestic supply and demand forces. Other energy products, such as propane, generally experience higher volumes and profitability during the winter heating and crop-drying seasons. More fuel-efficient equipment, reduced crop tillage, depressed prices for crops, weather conditions and government programs that encourage idle acres may all reduce demand for our energy products.
Regulation. Governmental regulations and policies, particularly in the areas of taxation, energy and the environment, have a significant impact on our Energy segment. Our Energy segment’s operations are subject to laws and related regulations and rules designed to protect the environment that are administered by the U.S. Environmental Protection Agency ("EPA"), the Department of Transportation ("DOT"), the U.S. Department of Transportation Pipeline and Hazardous Materials Safety Administration, the Federal Energy Regulatory Commission and similar government agencies. These laws, regulations and rules govern, among other things, discharge of materials into the environment, including air and water; reporting storage of hazardous wastes and other hazardous materials; transportation, handling and disposal of wastes and other materials; labeling of pesticides and similar substances; and investigation and remediation of releases of hazardous materials. Failure to comply with these laws, regulations and rules could subject us to administrative penalties, injunctive relief, civil remedies and possible recalls of products. Our hedging transactions and activities are subject to the rules and regulations of the exchanges we use and governing bodies, such as the Chicago Mercantile Exchange ("CME"), the New York Mercantile Exchange ("NYMEX") and the U.S. Commodity Futures Trading Commission ("CFTC").
Competition. The petroleum refining and wholesale fuels business is very competitive. Among our competitors are some of the world’s largest integrated petroleum companies, which have their own crude oil supplies and distribution and marketing systems. We also compete with smaller domestic refiners and marketers in the midwestern and northwestern United States, with foreign refiners who import products into the United States and with producers and marketers in other industries supplying other forms of energy and fuels to consumers. Given the commodity nature of the end products, profitability in the industry depends largely on margins, as well as operating efficiency, product mix and costs of product distribution and transportation. The retail gasoline market is highly competitive, with competitors that are much larger than us and that have greater brand recognition and distribution outlets throughout the country and the world than we do. We are also experiencing increased competition from regional and unbranded retailers. Our owned and non-ownednonowned retail outlets are located primarily in the northwestern, midwestern and southern United States.
We market refined fuel products in five principal geographic areas. The first area includes the Midwest and Northern Plains. Competition at the wholesale level in this area includes major oil companies, as well as independent refiners and wholesale brokers/suppliers. This area has a robust spot market and is influenced by the large refinery center along the Gulf Coast.
To the east of the Midwest and Northern Plains is another unique marketing area. This area centers near Chicago, Illinois, and includes eastern Wisconsin, Illinois and Indiana. In this area, we principally compete with the major oil companies, as well as independent refiners and wholesale brokers/suppliers.
Another market area includes Arkansas, Missouri and the northern part of Texas. Competition in this area includes the major oil companies and independent refiners. This area is principally supplied from the Gulf Coast refinery center and is also driven by a strong spot market that reacts quickly to changes in the international and national supply balance.
Another geographic area includes Montana, western North Dakota, Wyoming, Utah, Idaho, Colorado and western South Dakota. Competition at the wholesale level in this area includes the major oil companies and independent refiners.
The last area includes much of Washington and Oregon. We compete with the major oil companies in this area. This area is known for volatile prices and an active spot market.
AG
Overview
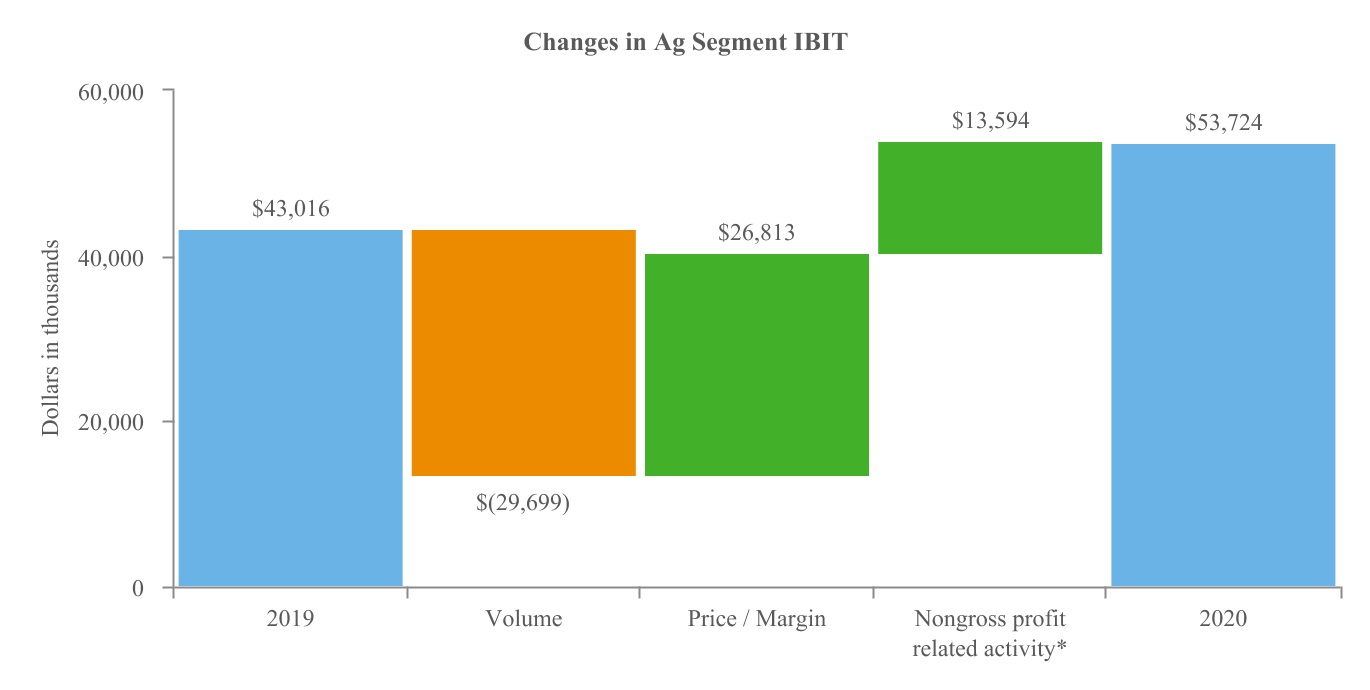
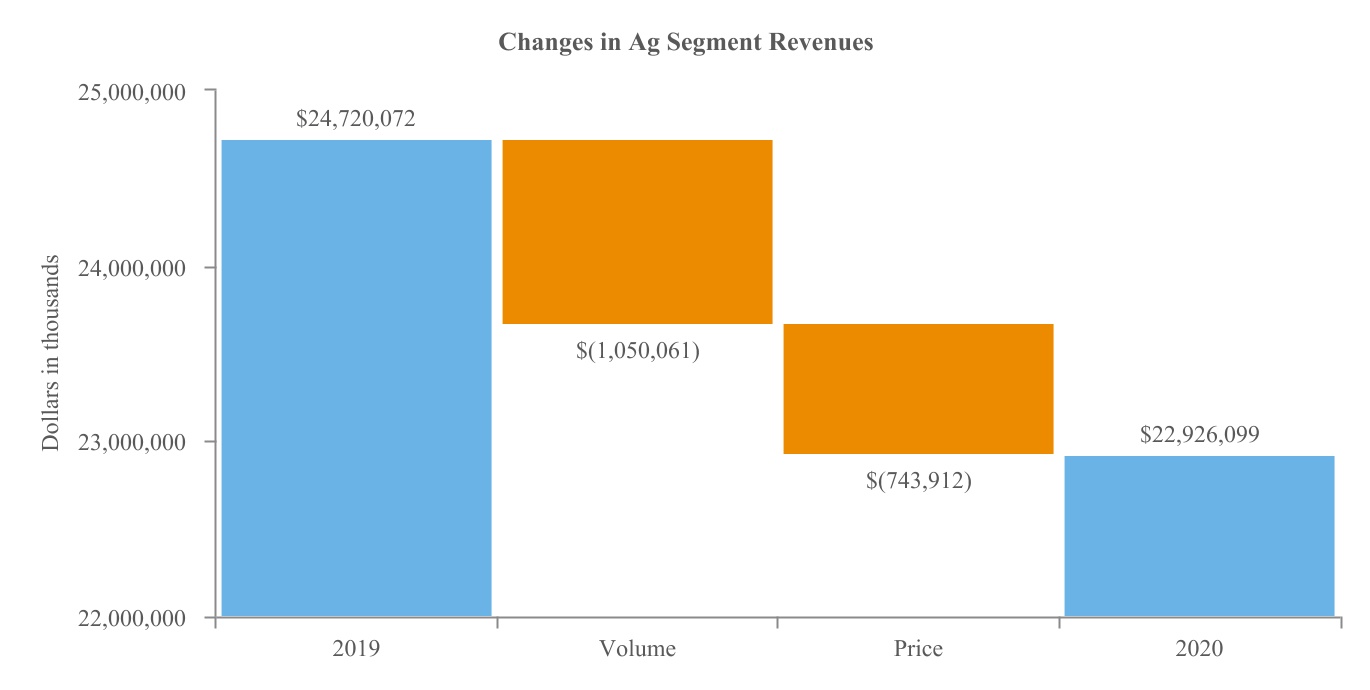
Our Ag segment includes our global grain marketing, country operations, wholesale agronomy, processing and food ingredients and renewable fuels businesses. These businesses work together to facilitate the production, purchase, sale and eventual use of grain and other agricultural products within the United States, as well as internationally. In fiscal 2019,2020, revenues in our Ag segment were $24.7$22.9 billion after elimination of intersegment revenues, consisting principally of grain sales.
Operations
Global grain marketing. We are the nation’s largest cooperative marketer of grain and oilseed based on grain sales. Our global grain marketing operations purchase grain directly from agricultural producers and elevator operators primarily in the midwestern and western United States and indirectly through our country operations business. The purchased grain is typically contracted for sale for future delivery at a specified location, and we are responsible for handling the grain and either arranging for or facilitation offacilitating its transportation to that location. We own and operate export terminals, river terminals and elevators throughout the United States to handle and transport grain and grain products. We also maintain locations in Europe, the Middle East, the Pacific Rim and South America for the marketing, merchandising and/or sourcing of grains and crop nutrients. We primarily conduct our global grain marketing operations directly, but do conduct some of our operations through joint ventures, including TEMCO, LLC, a 50% owned joint venture with Cargill, Incorporated ("Cargill"), focused on exports, primarily to Asia.
Country operations. Our country operations business operates 470487 agri-operations locations through 4342 business units dispersed throughout the midwestern and western United States. Most of these locations purchase grain from farmers and sell agronomy, energy, feed and seed products to those same producers and others, although not all locations provide every product and service. We also manufacture animal feed through eight owned plants and threefour limited liability companies.
Wholesale agronomy. Our wholesale agronomy business includes our wholesale crop nutrients and wholesale crop protection businesses. Our wholesale crop nutrients business delivers products directly to our customers and our country operations business from the manufacturer or through our 18 inland and river17 warehouse terminals and other non-ownednonowned storage facilities located throughout the United States. To supplement what is purchased domestically, our Galveston, Texas, deep-water port and terminal receives fertilizer by vessel from origins such as Asia and the Caribbean Basin where significant volumes of urea are produced. The fertilizer is then shipped by rail to destinations within crop-producing regions of the United States. Our wholesale crop protection business operates out of our network of 3229 warehouses from which we deliver products directly to our member cooperatives and independent retailers. We also operate a bulk chemical rail terminal in Brooten, Minnesota, where we handle and store bulk crop protection products for some of the crop protection industry’s largest chemical manufacturers. This facility has approximately 6 million gallons of chemical storage capacity.
Processing and food ingredients. Our processing and food ingredients operations are conducted at facilities that can crush approximately 128115 million bushels of oilseeds on an annual basis, producing approximately 2.82.6 million short tons of meal/flour and 1.51.6 billion pounds of edible oil annually. We purchase our oilseeds from members, other CHS businesses and third parties that have tightly integrated connections with our global grain marketing operations and country operations business.
Renewable fuels. Our renewable fuels business produces 266257 million gallons of fuel gradefuel-grade ethanol, 60 million pounds of inedible corn oil and 662636 thousand tons of dried distillers grains with solubles ("DDGS") annually. Renewable fuels produced by our production plants are marketed by our global grain marketing business, along with more than 520450 million gallons of ethanol and 4.53 million tons of DDGS annually under marketing agreements with ethanol production plants.
Products and Services
Our Ag segment provides local cooperatives and farmers with the inputs and services they need to produce grain and raise livestock. These include seed, crop nutrients, crop protection products, animal feed, animal health products, refined fuels and propane. We also buy and merchandise grain in both domestic and international markets. With a portion of the grain we purchase, we produce renewable fuels, including ethanol and DDGS. We also produce refined oils, meal and soyflour at our processing facilities.
Sales and Marketing; Customers
Our Ag segment provides products and services to a wide range of customers, primarily in the United States. These customers include member and non-membernonmember producers, local cooperatives, elevators, grain dealers, grain processors and crop nutrient retailers. We sell our edible oils and soyflour to food companies. The meal we produce is sold to integrated livestock producers and feed mills. The ethanol and DDGS we produce are sold throughout the United States and to various international locations.customers.
Industry; Competition
Many of the business activities in our Ag segment are highly seasonal and, consequently, the operating results for our Ag segment will typically vary throughout the year. For example, our country operations business generally experiences higher volumes and income during the fall harvest and spring planting seasons and our agronomy business generally experiences higher volumes and income during the spring planting season. In addition, our Ag segment operations may be adversely affected by relative levels of supply and demand, both domestic and international, commodity price levels and transportation costs and conditions. Supply is affected by weather conditions, plant disease, insect damage, acreage planted and government regulations and policies. Demand may be affected by foreign governments and their programs, relationships of foreign countries with the United States, affluence of foreign countries, acts of war, currency exchange fluctuations and substitution of commodities. Demand may also be affected by changes in eating habits, population growth, per capita consumption of some products and renewable fuels production levels.
Regulation. Our Ag operations are subject to laws and related regulations and rules designed to protect the environment that areis administered by the EPA, the DOT and similar government agencies. These laws, regulations and rules govern, among other things, discharge of materials into the environment, including air and water; reporting storage of hazardous wastes and other hazardous materials; transportation, handling and disposal of wastes and other materials; labeling of pesticides and similar substances; and investigation and remediation of releases of hazardous materials. In addition, environmental laws impose a liability on owners and operators for investigation and remediation of contaminated property and on a party who sends hazardous materials to those contaminated properties for treatment, storage, disposal or recycling. In some instances, that liability exists regardless of fault. Our global grain marketing operations, country operations business, processing and food ingredient operations and renewable fuel operations are also subject to laws and related regulations and rules administered by the U.S. Department of Agriculture, ("USDA"), the U.S. Food and Drug Administration ("FDA") and other federal, state, local and foreign governmental agencies that govern processing, packaging, storage, distribution, advertising, labeling, quality and safety of feed and grain products. Failure to comply with these laws, regulations and rules could subject us to administrative penalties, injunctive relief, civil remedies and possible recalls of products. The hedging transactions and activities of our global grain marketing, country operations, processing and food ingredient and renewable fuels businesses are subject to the rules and regulations of the exchanges we use and governing bodies, such as the CME, the Chicago Board of Trade ("CBOT"), the Minneapolis Grain Exchange ("MGEX") and the CFTC.
Competition. In our Ag segment, we have significant competition in the businesses in which we operate based principally on price, services, quality, patronage and alternative products. Our businesses depend on relationships with local cooperatives and private retailers, proximity to customers and producers, competitive pricing and competitive pricing.safety of food, feed and grain products. We compete with other large distributors of agricultural products, as well as other regional or local distributors, local cooperatives, retailers and manufacturers.
NITROGEN PRODUCTION
Overview
Our Nitrogen Production segment consists solely of our approximate 10% membership interest (based on product tons) in CF Nitrogen, our strategic venture with CF Industries Holdings, Inc. ("CF Industries"). In February 2016, in connection with our investment in CF Nitrogen, we entered into an 80-yeara supply agreement with CF Nitrogen that entitles us to purchase up to 1.1 million tons of granular urea and 580,000 tons of urea ammonium nitrate ("UAN") annually for ratable delivery.delivery through fiscal 2096. We account for our CF Nitrogen investment using the hypothetical liquidation at book value method and on August 31, 2019,2020, our investment was approximately $2.7 billion. See Note 6, Investments, of the notes to the consolidated financial statements that are included in this Annual Report on Form 10-K for additional information.
Our investment in CF Nitrogen positions us and our members for long-term dependable fertilizer supply, supply chain efficiency and production economics. In addition, the ability to source product from CF Nitrogen production facilities under our supply agreement benefits our members and customers through strategically positioned access to essential fertilizer products.
Operations
CF Nitrogen has four production facilities located in Donaldsonville, Louisiana,Louisiana; Port Neal, Iowa,Iowa; Yazoo City, Mississippi,Mississippi; and Woodward, Oklahoma. Natural gas is the principal raw material and primary fuel source used in the ammonia production process. CF Nitrogen has access to competitively priced natural gas through a reliable network of pipelines connected to major natural gas trading hubs near its production facilities.
Products and Services
CF Nitrogen produces nitrogen-based products, including methanol, UAN, and urea and related products.
Sales and Marketing; Customers
CF Nitrogen has three customers, including CHS and two consolidated subsidiaries of CF Industries.
Industry; Competition
Regulation. CF Nitrogen is subject to laws and related regulations and rules designed to protect the environment that are administered by the EPA and similar government agencies. These laws, regulations and rules govern, among other things, discharge of materials into the environment, including air and water; reporting storage of hazardous wastes and other hazardous materials; handling and disposal of wastes and other materials; and investigation and remediation of releases of hazardous materials. In addition, environmental laws impose a liability on owners and operators for investigation and remediation of contaminated property and on a party whothat sends hazardous materials to those contaminated properties for treatment, storage, disposal or recycling. In some instances, that liability exists regardless of fault.
Competition. CF Nitrogen competes primarily on delivered price and, to a lesser extent, on customer service and product quality. CF Nitrogen competes domestically with a variety of large companies in the fertilizer industry. There is also significant competition from products sourced from other regions of the world.
CORPORATE AND OTHER
CHS Capital. Our wholly-owned financing subsidiary, CHS Capital, LLC ("CHS Capital"), provides cooperative associationslocal cooperatives with a variety of loans that meet commercial agriculture needs. These loans include operating, term, revolving and other short- and long-term options. CHS Capital also provides loans to individual producers for crop inputs, feed and hedging-related margin calls. Producer operating loans are also offered in strategic geographic regions.
CHS Hedging. Our wholly-owned commodity brokerage subsidiary, CHS Hedging, LLC ("CHS Hedging"), is a registered, CFTC-regulated futures commission merchant ("FCM") and a clearing member of the CBOT, the CME, NYMEX and the MGEX. CHS Hedging provides consulting services and commodity risk management services primarily in the grains, oilseeds, fertilizer, livestock, dairy and energy markets. CHS Hedging is also the FCM for the majority of our commodity futures trading.
Wheat milling. Ardent Mills, LLC ("Ardent Mills"), the largest flour miller in the United States, was formed asis a joint venture with CHS, Cargill and ConAgra Foods,Conagra Brands, Inc., which combined the North American flour milling operations of its three parent companies, including assets from our existing joint venture milling operations Horizon Milling, LLC, Horizon Milling, ULC, and CHS-owned mills. ("Conagra"). In connection with the formation of Ardent Mills the joint venture, parties entered intoCHS, Cargill and Conagra have various ancillary and non-competenoncompete agreements including, among other things, an agreement for us to supply Ardent Mills with certain wheat and durum products. We hold a 12% interest in Ardent Mills and account for our investment as an equity method investment due to our ability to exercise significant influence through our ability to appoint a member of the Board of Shareholders and Board of Managers.Managers of Ardent Mills. On August 31, 2019,2020, our investment in Ardent Mills was $209.0$208.9 million. See Note 6, Investments, of the notes to the consolidated financial statements that are included in this Annual Report on Form 10-K for additional information.
Foods. Ventura Foods, LLC ("Ventura Foods"), is a joint venture between CHS and Wilsey Foods, Inc., a majority-owned subsidiary of MBK USA Holdings, Inc., with each parent company owning a 50% interest.interests. Ventura Foods produces vegetable oil-based products, such as packaged frying oils, margarine, mayonnaise,margarines, mayonnaises, sauces, salad dressings and other food products, and currently has 16 manufacturing and distribution locations across the United States and Canada. Ventura Foods sources its raw materials, which consist primarily of soybean oil, canola oil, palm/coconut oil, peanut oil and other ingredients and supplies, from various domestic and overseas suppliers, including our oilseed processing operations. We account for our investment in Ventura Foods using the equity method of accounting and, on August 31, 2019,2020, our investment was $374.5$381.4 million. See Note 6, Investments, of the notes to the consolidated financial statements that are included in this Annual Report on Form 10-K for additional information.
EMPLOYEES
On August 31, 2019,2020, we had 10,70310,493 full-time, part-time, temporary and seasonal employees. Of that total, 2,5222,439 were employed in our Energy segment, 7,4187,211 were employed in our Ag segment and 763843 were employed in Corporate and Other. In addition to those individuals directly employed by us, many individuals work for our joint ventures, in which we have a 50% or less ownership interest, including employees of CF Nitrogen and Ventura Foods in our Nitrogen Production segment and Ventura Foods and Ardent Mills in our Corporate and Other categories, respectively,category, and are not included in these totals.
Labor Relations
As of August 31, 2019,2020, we had 12 collective bargaining agreements with unions covering approximately 8% of our employees in the United States. These collective bargaining agreementsStates, which expire on various dates through November 1, 2023, except for one collective bargaining agreement covering 24 pipeline employees, which renews automatically every September 1, unless 60 days’ notice of termination is given.May 31, 2024.
CHS AUTHORIZED CAPITAL
We are an agricultural membership cooperative organized under Minnesota cooperative law to do business with member and non-membernonmember patrons.
ITEM 1A.RISK FACTORS
CAUTIONARY STATEMENT FOR PURPOSES OF THE SAFE HARBOR PROVISIONS
OF THE PRIVATE SECURITIES LITIGATION REFORM ACT OF 1995
This Annual Report on Form 10-K contains and our other publicly available documents may contain, and our officers, directors and other representatives may from time to time make, "forward-looking statements" within the meaning of the safe harbor provisions of the U.S. Private Securities Litigation Reform Act of 1995. Forward-looking statements can be identified by words such as "anticipate," "intend," "plan," "goal," "seek," "believe," "project," "estimate," "expect," "strategy," "future," "likely," "may," "should," "will" and similar references to future periods. Forward-looking statements are neither historical facts nor assurances of future performance. Instead, they are based only on our current beliefs, expectations and assumptions regarding the future of our businesses, financial condition and results of operations, future plans and strategies, projections, anticipated events and trends, the economy and other future conditions. Because forward-looking statements relate to the future, they are subject to inherent uncertainties, risks and changes in circumstances that are difficult to predict and many of which are outside of our control. Our actual results and financial condition may differ materially from those indicated in the forward-looking statements. Therefore, you should not place undue reliance on any forward-looking statements. Important factors that could cause our actual results and financial condition to differ materially from those indicated in the forward-looking statements are discussed or identified in our public filings made with the U.S. Securities and Exchange Commission, including in this "Risk Factors" discussion. Any forward-looking statements made by us in this Annual Report on Form 10-K are based only on information currently available to us and speak only as of the date on which the statement is made. We undertake no obligation to publicly update any forward-looking statement, whether written or oral, that may be made from time to time, whether as a result of new information, future developments or otherwise, except as required by applicable law.
Reference to this ("Cautionary StatementStatement") in the context of a forward-looking statement shall be deemed to be a statement that any one or more of the following factors may cause actual results to differ materially from those indicated in the forward-looking statement.
The following risk factors are in addition to any other cautionary statements, written or oral, which may be made or referred to in connection with any particular forward-looking statement. The following risk factors should not be construed as exhaustive.
Risks Related to Operating Our Business
Our revenues, results of operations and cash flows could be materially and adversely affected by changes in commodity prices.
Our revenues, results of operations and cash flows are affected by market prices for commodities such as crude oil, natural gas, ethanol, fertilizer, grain, oilseed, flour, and crude and refined vegetable oils. Commodity prices generally are affected by a wide range of factors beyond our control, including weather, plant disease, insect damage, drought, availability and adequacy of supply, availability of a reliable rail and river transportation network, outbreaks of disease, government regulation and policies, global trade disputes, and general political and economic conditions. We are also exposed to fluctuating
commodity prices as the result of our inventories of commodities, typically grain, fertilizer and petroleum products, and purchase and sale contracts at fixed or partially fixed prices. At any time, our inventory levels and unfulfilled fixed or partially fixed price contract obligations may be substantial. We have processes in place to monitor exposures to these risks and engage in strategies, such as hedging, to manage these risks. If these controls and strategies are not successful in mitigating our exposure to these fluctuations, we could be materially and adversely affected. Changes in market prices for commodities that we purchase without a corresponding change in the selling prices of those products can affect revenues and operating earnings. Similarly, increased or decreased sales volumes without a corresponding change in the purchase and selling prices of those products can affect revenues and operating earnings.
For example, in our energy operations, profitability depends largely on the margin between the cost of crude oil that we refine and the selling prices that we obtain for our refined products. The prices for crude oil and for gasoline, diesel fuel and other refined petroleum products fluctuate widely. Factors influencing these prices, many of which are beyond our control, include:
•levels of worldwide and domestic supplies;
•capacities of domestic and foreign refineries;
•ability of members of the Organization of Petroleum Exporting Countries ("OPEC")and other countries that are significant producers of oil to agree to and maintain oil price and production controls, and the price and level of imports;
•disruption in supply;
•political instability or conflict in oil-producing regions;
•level of demand from consumers, agricultural producers and other customers;
•price and availability of alternative fuels;
•availability of pipeline capacity; and
•domestic and foreign governmental regulations and taxes.
Many of these factors resulted in significant volatility in crude oil, refined petroleum products and natural gas supplies and prices during the period of the COVID-19 pandemic prior to August 31, 2020. Additional volatility is expected to occur during the remainder of the pandemic and that volatility may be significant. The long-term effects of thesethis volatility and other conditions on the prices of crude oil, and refined petroleum products and natural gas are uncertain and ever-changing. Increases in crude oil prices without a corresponding increase in the prices of our refined petroleum products, and decreases in crude oil prices with larger corresponding decreases in the prices of our refined petroleum products, would reduce our net income. Accordingly, we expect our margins and the profitability of our energy business to fluctuate, possibly significantly, over time.
We are subject to political, economic, legal and other risks of doing business globally.
We are a global business and are exposed to risks associated with having global operations. These risks include, but are not limited to, risks relating to terrorism, war, civil unrest, changes in a country's or region's social, economic or political conditions, changes in local labor conditions and regulations, changes in safety and environmental regulations, changes in regulatory or legal environments, restrictions on currency exchange activities, currency exchange fluctuations, price controls on commodities, taxes, doing business in countries or regions with inadequate infrastructure and logistics challenges. In particular, some countries where we operate lack well-developed legal systems or have not adopted clear legal and regulatory frameworks. This lack of legal certainty exposes our operations to increased risks, including increased difficulty in enforcing our agreements in those jurisdictions and increased risk of adverse actions by local government authorities, such as unilateral or forced renegotiation, modification or nullification of existing agreements or expropriations.
Our business and operations and demand for our products are highly dependent on certain global and regional factors that are outside our control and that could adversely impact our business.
The level of demand for our products is affected by global and regional demographics and macroeconomic conditions, including population growth rates and changes in standards of living. A significant downturn in global economic growth or recessionary conditions in major geographic regions, including what have been experienced as a result of the COVID-19
pandemic, may lead to a reduced demand for our products and services, which could have a material adverse effect on our business, financial condition, liquidity, results of operations and prospects. Weak global economic conditions and adverse conditions in financial and capital markets may adversely impact the financial condition and liquidity of some of our customers, suppliers and other counterparties, which could have a material adverse effect on our customers' ability to pay for our products and on our business, financial condition, liquidity, results of operations and prospects.
Additionally, planted acreage and consequently the volume of fertilizer and crop protection products applied, is partially dependent on government programs, grain prices and the perception held by producers of demand for production, all of which are outside our control. Moreover, our business and operations may be affected by weather conditions, including those due to climate change, that are outside our control. For example:
•Weather conditions during the spring planting season and early summer crop nutrient and crop protection application season affect agronomy product volumes and profitability.
•Adverse weather conditions, such as heavy snow or rainfall and any flooding as a result thereof, may cause transportation delays and increased transportation costs, or damage physical assets, especially facilities in low-lying areas near coasts and river banks or situated in hurricane-prone and rain-susceptible regions.
•Changes in weather patterns may shift periods of demand for products or regions in which our products are produced or distributed, which could require us to evolve our procurement and distribution processes.
•Significant changes in water levels (up or down, as a result of flooding, drought or otherwise) may cause changes in agricultural activity, which could require changes to our operating and distribution activities, as well as significant capital improvements to our facilities.
•Climate change may cause changes in weather patterns and conditions, including changes in rainfall and storm patterns and intensities, water shortages, changes in sea levels and changes in temperature levels, all of which could adversely impact our costs and business operations, the location, cost and competitiveness of commodity agricultural production, related storage and processing facilities, or demand for agricultural commodities. These effects could significantly reduce demand for the products we sell to or buy from agricultural producers and local cooperatives, and therefore could adversely impact our results of operations, liquidity or capital resources.
•We may experience increased insurance premiums and deductibles, or decreases in available coverage, for our assets in areas subject to adverse weather conditions.
Emerging sustainability and other environmental priorities outside our control could also affect agricultural practices and future demand for agronomy products applied to crops and the volume of any such application. Accordingly, factors outside our control could materially and adversely affect our revenues, results of operations and cash flows.
Our business and operations have been and may continue to be adversely affected by the ongoing COVID-19 outbreak or other similar outbreaks.
Outbreaks of contagious diseases, including the ongoing COVID-19 outbreak and pandemic, and other adverse public health developments in countries and states where we operate, have had and are expected to continue to have an adverse effect on our business, financial condition and results of operations. These effects include a potential negative impact on the availability of our key personnel; temporary closures of our facilities or facilities of our members, business partners, customers, suppliers, third-party service providers or other vendors; and interruption of domestic and global supply chains, distribution channels, liquidity and capital or financial markets. In particular, we are actively monitoring COVID-19 impacts on our supply chain and distribution channels. Restrictions on or disruptions of transportation, port closures or increased border controls or closures, or other impacts on domestic and global supply chains or distribution channels, could increase our costs for raw materials and commodity costs, increase demand for raw materials and commodities from competing purchasers, limit our ability to meet customer demand or otherwise have a material adverse effect on our business, financial condition, results of operation or cash flows. In addition, we have taken and will continue to take temporary precautionary measures intended to help minimize the risk of COVID-19 to our employees, including requiring administrative and other groups of our employees to work remotely, suspending nonessential travel and restricting attendance at industry events and in-person work-related meetings, which could negatively affect our business. Some of these precautionary measures, and similar precautionary measures that we may take in the future, may result in additional costs. Further, COVID-19 has resulted in a widespread health crisis that has affected and is expected to continue to adversely affect the economies and financial markets of many countries and most areas of the United States, which may affect our ability to obtain additional financing for our businesses and demand
for our products and services, such as the declines in demand experienced during the third and fourth quarters of our fiscal year 2020 by our refined fuels, renewable fuels, and processing and food ingredients businesses and Ventura Foods. The declines in demand experienced by our refined fuels, renewable fuels, and processing and food ingredients businesses and Ventura Foods have and may continue to have an adverse effect on our business and our financial results. The impact of the COVID-19 pandemic may also exacerbate the other risks discussed in this Item 1A, any of which could have a material effect on us. The extent to which COVID-19 will impact our business and our financial results in the future will depend on future developments, which are highly uncertain and cannot be predicted. Such developments may include the ongoing spread of the virus, the severity of the disease, the duration of the outbreak, the extent of any reoccurrence of the coronavirus or any evolutions or mutations thereof, the development of vaccines or therapeutic treatments that can restore consumer and business economic confidence, and the type and duration of actions that may be taken by various governmental authorities in response to the outbreak and the impact on the U.S. and the global economy, including whether the agricultural industry continues to be designated an essential infrastructure industry and may continue to operate if future lockdowns occur. As a result, at the time of this filing, it is not possible to predict the overall future impact of COVID-19 on our business, liquidity, capital resources and financial results.
We participate in highly competitive business markets and we may not be able to continue to compete successfully, which could have a material adverse effect on us.
We operate in several highly competitive business segments and our competitors may succeed in developing new or enhanced products that are better than ours, may be more successful in marketing and selling their products than we are, or may have more effective supply chain capability than we have. Competitive factors include price, service level, proximity to markets, access to transportation, product quality, marketing and risk management. In our business segments, we compete with certain companies that are larger and better known than we are and that have greater marketing, financial, personnel and other resources than we do. As a result, we may not be able to continue to compete successfully, which could have a material adverse effect on our business, financial condition, liquidity, results of operations and prospects.
Our revenues, margins, results of operations and cash flows could be materially and adversely affected if our members were to do business with others rather than with us.
We do not have an exclusive relationship with our members and our members are not obligated to supply us with their products or purchase products from us. Our members often have a variety of distribution outlets and product sources available to them. If our members were to sell their products to other purchasers or purchase products from other sellers, our revenues and margins would decline and our results of operations and cash flows could be materially and adversely affected.
If our customers choose alternatives to our refined petroleum products, our revenues, results of operations and cash flows could be materially and adversely affected.
Numerous alternative energy sources currently under development could serve as alternatives to our gasoline, diesel fuel and other refined petroleum products. If any of these alternative products become more economically viable or preferable to our customers for environmental or other reasons, demand for our energy products would decline. Declining demand for our energy products, particularly diesel fuel sold for farming applications, could materially and adversely affect our revenues, results of operations and cash flows.
Consolidation among the producers of products we purchase and customers for products we sell could materially and adversely affect our revenues, results of operations and cash flows.
Consolidation has occurred among the individual producers and manufacturers of products we sell and purchase, including crude oil, fertilizer and grain, and it is highly likely that this consolidation will continue in the future. Consolidation could allow producers to negotiate pricing, supply availability and other contract terms that are less favorable to us. In addition, consolidation also may increase the likelihood that consumers or end users of these products enter into supply relationships with a smaller number of producers, resulting in potentially higher prices for the products we purchase.
Consolidation has also occurred among local cooperatives that are the primary wholesale customers of our products, which has resulted in a smaller wholesale and retail customer base for our products and has intensified the competition for these customers. It is highly likely that this consolidation will continue in the future. Ongoing consolidation among distributors and brokers of food products and food retailers has altered the buying patterns of these businesses, as they have increasingly elected to work with product suppliers who can meet their needs nationwide rather than just regionally or locally. If these cooperatives, distributors, brokers and retailers elect not to purchase our products, our revenues, results of operations and cash flows could be materially and adversely affected.
In addition, in the seed, fertilizer and crop protection markets, consolidation at both the producer and wholesale customer level has increased the potential for direct sales from the respective input manufacturer to cooperative customers and/or individual agricultural producers, which would remove us from the supply chain and could have a material and adverse effect on our revenues, results of operations and cash flows.
We are exposed to risk of nonperformance and nonpayment by counterparties.
We are exposed to risk of nonperformance and nonpayment by counterparties, whether pursuant to contracts or otherwise. Risk of nonperformance and nonpayment by counterparties includes inability or refusal of a counterparty to pay us, inability or refusal to perform because of a counterparty's financial condition and liquidity or for any other reason, and risk that the counterparty will refuse to perform a contract during a period of price fluctuations where contract prices are significantly different than current market prices. In the event we experience significant nonperformance or nonpayment by counterparties, our financial condition, results of operations and cash flows could be materially and adversely affected. For example, we store inventory in third-party warehouses, and the operators of these warehouses may not adequately store or secure our inventory, or they may improperly sell that inventory to someone else, which could expose us to a loss of the value of that inventory. In the event we experience any such nonperformance by a third-party warehouse operator, our financial condition, results of operations and cash flows could be materially and adversely affected.
Our business, profitability and liquidity may be adversely affected by deterioration in the credit quality of, or defaults by, third parties who owe us money.
We extend credit to, make loans to and engage in other financing arrangements with individual producers, local cooperatives and other third parties around the world.We incur credit risk and the risk of losses if our borrowers and others to which we extend credit do not repay their loans or perform their obligations to pay us the money they owe. These parties may default on their obligations to us due to bankruptcy, lack of liquidity, operational failure or for other reasons. If these counterparties do not pay us back, such that we experience significant defaults on their payment obligations to us, our financial condition, results of operations or cash flows could be materially and adversely affected.
We are also subject to the risk that our rights against borrowers and other third parties that owe us money may not be enforceable in all circumstances. For example, a borrower or third party may declare bankruptcy. In addition, due to implications of the overall agricultural sector's extended period of depressed commodity prices and margins, the COVID-19 pandemic and changing weather conditions, including those due to climate change, among other factors, the credit quality of borrowers and other third parties whose obligations we hold could deteriorate, including a deterioration in the value of collateral posted by those parties to secure their obligations to us pursuant to purchase contracts, loan agreements or other contracts. If that deterioration occurs, the material adverse effects of third parties not performing their repayment obligations may be exacerbated if the collateral held by us cannot be realized or is liquidated at prices not sufficient to recover the full amount owed to us. For example, certain loans and other financing arrangements we undertake with agricultural producers are typically secured by the counterparty's crops that are planted in the current year. There is a risk that the value of the crop will not be sufficient to satisfy the counterparty’s repayment obligations under the financing arrangement as a result of weather, crop growing conditions, other factors that influence the price, supply and demand for agricultural commodities or for other reasons.
In addition, disputes may arise as to the amount of collateral we are entitled to receive and the value of pledged assets. Termination of contracts and foreclosure on collateral may subject us to claims for improper exercise of our rights. Default rates, downgrades and disputes with counterparties as to the valuation of collateral increase significantly in times of market stress and illiquidity.
In respect to our lending activity, we evaluate collectability of both commercial and producer loans on a specific identification basis, based on the amount and quality of the collateral obtained, and record specific loan loss reserves when appropriate. Consistent with accounting principles generally accepted in the United States ("U.S. GAAP"), a general reserve is also maintained based on historical loss experience and various qualitative factors. For other forms of credit, we establish reserves as appropriate and consistent with U.S. GAAP. The reserves represent our best estimate based on current facts and circumstances. Future developments or changes in assumptions may cause us to record adjustments to the reserves that could materially and adversely affect our results of operations.
Our risk management strategies may not be effective.
Our business is affected by fluctuations in commodity prices, transportation costs, energy prices, foreign currency exchange rates and interest rates. We monitor position limits, account receivables and other exposures and engage in other strategies and controls to manage these risks. Our monitoring efforts may not be effective at detecting a significant risk
exposure and our controls and strategies may not be effective in adequately managing against the occurrence of a significant loss relating to a risk exposure. If our controls and strategies are not successful in mitigating or preventing our financial exposure to losses due to the fluctuations or failures mentioned above, it could significantly and adversely affect our operating results.
Actual or perceived quality, safety or health risks associated with our products could subject us to significant liability and damage our business and reputation.
If any of our food or animal feed products were to become adulterated or misbranded, we would need to recall those items and could experience product liability claims if either consumers' or customers' livestock were injured or were claimed to be injured as a result. A widespread product recall or a significant product liability judgment could cause our products to be unavailable for a period of time or could cause a loss of consumer or customer confidence in our products. Even if a product liability claim were unsuccessful or were not fully pursued, the negative publicity surrounding any assertion that our products caused illness or injury could adversely affect our business and reputation with existing and potential consumers and customers and our corporate and brand image. Moreover, claims or liabilities of this sort might not be covered by our insurance or by any rights of indemnity or contribution that we may have against others. In addition, general public perceptions regarding the quality, safety or health risks associated with particular food or animal feed products, such as concerns regarding genetically modified crops, could reduce demand and prices for some of the products associated with our businesses. To the extent that consumer preferences evolve away from products that our members or we produce for health or other reasons, such as the growing demand for organic food products, and we are unable to develop or procure products that satisfy new consumer preferences, there will be a decreased demand for our products, which could have a material adverse effect on our business, financial condition, liquidity, results of operations and prospects.
Our operations are subject to business interruptions and casualty losses; we do not insure against all potential losses and could be seriously harmed by unanticipated liabilities.
Our operations are subject to business interruptions due to unanticipated events such as explosions, fires, pipeline interruptions, transportation delays, equipment failures, crude oil or refined product spills, adverse weather conditions and labor disputes. For example:
•Our oil refineries and other facilities are potential targets for terrorist attacks that could halt or discontinue production.
•Our inability to negotiate acceptable contracts with unionized workers in our operations could result in strikes or work stoppages.
•Our corporate headquarters, the facilities we own or the significant inventories we carry could be damaged or destroyed by catastrophic events, adverse weather conditions or contamination.
•Someone may accidentally or intentionally introduce a computer virus to our information technology systems or breach our computer systems or other cyber resources.
•An occurrence of a pandemic or epidemic disease, such as the COVID-19 pandemic, affecting a substantial part of our workforce or our customers could cause an interruption in our business operations.
The effects of any of these events could be significant. We maintain insurance coverage against many, but not all, potential losses or liabilities arising from these operating hazards, but uninsured losses or losses above our coverage limits are possible. Uninsured losses and liabilities arising from operating hazards could have a material adverse effect on us. In addition, if we experience insurable events, our insurance premiums could increase or insurance relating thereto may become unavailable to us.
We are subject to workforce factors that could adversely affect our business and financial condition.
Like most companies in the agricultural industry, we are continuously challenged to hire, develop and retain a sufficient number of employees to operate our businesses throughout our operating geographies. We may have difficulty recruiting and retaining new employees with adequate qualifications and experience. The challenge of hiring new employees is exacerbated by the rural nature of our business, which provides for a smaller pool of skilled employee candidates. To hire new employees, we may be forced to pay higher wages or offer other benefits that might impact our cost of labor. Furthermore, when we do hire new employees, we may be unable to successfully transfer our other employees' institutional knowledge and
skills to them. These or other employee workforce factors could negatively impact our business, financial condition or results of operations.
Technological improvements could decrease the demand for our agronomy and energy products.
Technological advances in agriculture could decrease the demand for crop nutrients, energy and other crop input products and services we provide. Genetically engineered seeds that resist disease and insects, or that meet certain nutritional requirements, could affect the demand for our crop nutrients and crop protection products. Demand for fuel that we sell could decline as technology allows for more efficient usage of equipment. Declining demand for our products could materially and adversely affect our revenues, results of operations and cash flows.
We utilize information technology systems to support our business. The ongoing multiyear implementation of an enterprisewide resource planning system, reliance upon multiple legacy business systems, security breaches or other disruptions to our information technology systems or assets could interfere with our operations, compromise security of our customers' or suppliers' information and expose us to liability that could adversely impact our business and reputation.
Our operations rely on certain key information technology ("IT") systems, many of which are legacy in nature or may depend on third-party services to provide critical connections of data, information and services for internal and external users.
Over the past several years, we have been implementing a new enterprise resource planning system ("ERP"), and we expect this ERP implementation to continue for the next several years. This ERP implementation has and will continue to require significant capital and human resources to deploy. Changes we have experienced in the implementation timeline and the scope of the implementation likely have impacted the capital and operating expense amounts required to complete the implementation and there can be no assurance that the actual costs for completing the ERP implementation will not exceed our current estimates or that the ERP will not take longer to implement than we currently expect. In addition, potential flaws in implementing the ERP or in the failure of any portion/module of the ERP to meet our needs or provide appropriate controls may pose risks to our ability to operate successfully and efficiently and with an effective system of internal controls.
There may be other challenges and risks to both our aging and current IT systems over time due to any number of causes, such as catastrophic events, availability of resources, power outages, security breaches or cyber-based attacks, as we upgrade and standardize our ERP system on a worldwide basis. These challenges and risks could result in legal claims or proceedings, liability or penalties, disruption in operations, loss of valuable data, increased costs and damage to our reputation, all of which could adversely affect our business. Our ongoing IT investments include those relating to cybersecurity, including technology, hired expertise and cybersecurity risk mitigation actions. However, in connection with the COVID-19 pandemic, a number of our employees have transitioned to working remotely. As a result, more of our employees are working from locations where our cybersecurity programs may be less effective and robust. In addition, we have experienced an increase in the number of attempts by external parties to access our networks and our data without authorization, and these attempts have become increasingly sophisticated. We have experienced insignificant data security incidents in the past and any security incident or breach that may occur could adversely impact our business and reputation.
We are also subject to laws and regulations in the United States and other jurisdictions regarding privacy, data protection and data security, including those related to the collection, storage, handling, use, disclosure, transfer and security of personal data. These laws and regulations pose increasingly complex compliance challenges and will require us to incur costs to achieve and maintain compliance; some of those costs may be significant. Any violation of such laws and regulations, including as a result of a security or privacy breach, could subject us to legal claims, regulatory penalties and damage to our reputation.
Increasing scrutiny and changing expectations from stakeholders with respect to our environmental, social and governance practices may expose us to new or additional risks.
Companies across all industries are facing increasing scrutiny from stakeholders related to their environmental, social and governance ("ESG") practices. Investor advocacy groups, certain institutional investors, lenders, investment funds and other influential investors are also increasingly focused on ESG practices and in recent years have placed increasing importance on the implications and social cost of their investments. Regardless of the industry, investors' and other stakeholders' increased focus and activism related to ESG and similar matters may hinder access to capital or financing, as investors or lenders may determine to reallocate capital or not commit capital as a result of their assessment of a company's ESG practices. If we do not adapt or comply with investor, lender or stakeholder ESG expectations and standards, which are evolving, or if we are perceived to have not responded appropriately to the growing focus on ESG issues, regardless of whether there is a legal
requirement to do so, we may suffer from reputational damage and our business or financial condition could be materially and adversely affected.
Acquisitions, strategic alliances, joint ventures, divestitures and other nonordinary course-of-business events resulting from portfolio management actions and other evolving business strategies could affect future results.
Wemonitor our business portfolio and organizational structure and have made and may continue to make acquisitions,strategic alliances, joint ventures, divestitures and changes to our organizational structure. With respect to acquisitions, future results will be affected by our ability to identify suitable acquisition candidates, to adequately finance any acquisitions and to integrate acquired businesses quickly and obtain the anticipated financial returns, including synergies. Our ability to successfully complete a divestiture will depend on, among other things, our ability to identify buyers that are prepared to acquire such assets or businesses on acceptable terms and to adjust and optimize our retained businesses following the divestiture. Additionally, we may fail to consummate proposed acquisitions, divestitures, joint ventures or strategic alliances after incurring expenses and devoting substantial resources, including management time, to such transactions.
Several parts of our business, including in particular our nitrogen production business, our foods business and portions of our global grain marketing and wheat milling operations, are operated through joint ventures with third parties where we do not have majority control of the venture. By operating a business through a joint venture, we have less control over business decisions than we have in our subsidiaries and limited liability companies in which we have a controlling interest. In particular, we generally cannot act on major business initiatives in our joint ventures without the consent of the other party or parties in those ventures. Investments in joint ventures may, under certain circumstances, involve risks not present when a third party is not involved, including the possibility that co-venturers might experience business or financial stresses that impact their ability to effectively operate the joint venture, or might become bankrupt or fail to fund their share of the business, in which case the joint venture may be unable to access needed growth capital without funding from us and/or any other remaining co-venturers. Co-venturers may have economic, tax or other business interests or goals that are inconsistent with our business interests or goals and may be in a position to take actions contrary to our policies or objectives. Our co-venturers may take actions that are not within our control, which may expose our investments in joint ventures to the risk of lower values or returns. Joint venture investments may also lead to impasses. Disputes between us and co-venturers may result in litigation or arbitration that would increase our expenses and prevent our officers and/or directors from focusing their time and effort on our day-to-day business. In addition, we may in certain circumstances be liable for the actions of our co-venturers. Each of these matters could have a material adverse effect on us.
We made certain assumptions and projections regarding the future of the markets served by our joint venture investments, which included projected raw materiality availability and pricing, production costs, market pricing and demand for the joint venture's products. These assumptions were an integral part of the economics used to evaluate these joint venture investment opportunities prior to consummation. To the extent that actual market performance varies from our models, our ability to achieve projected returns on our joint venture investments may be impacted in a materially adverse manner. For example, assumptions we made in connection with our investment in CF Nitrogen may not align with future demand for nitrogen-based products or the cost or availability of natural gas, the primary feedstock utilized for CF Nitrogen's nitrogen-based products.
Risks Related to Laws and Regulations
Government policies, mandates, regulations and trade agreements could adversely affect our operations and profitability.
Our business is subject to numerous government policies, mandates and regulations that could have an adverse effect on our operations or profitability. For example, government policies, mandates and regulations related to genetically modified organisms, traceability standards, product safety and labeling, and renewable and low carbonlow-carbon fuels could have an adverse effect on our operations or profitability by, among other things, influencing planting of certain crops, location and size of crop production, trade of processed and unprocessed commodity products, volumes and types of imports and exports, the availability and competitiveness of feedstocks as raw materials, and viability and volume of certain of our products. In our Energy segment, government policies, mandates and regulations designed to stop or impede the development or production of oil, such as those limiting or banning use of hydraulic fracturing, drilling or oilsands production, could adversely affect our operations and profitability.
In addition, changes in international trade agreements and trade disputes can adversely affect commodity trade flows by limiting or disrupting trade between countries or regions. In many countries around the world, historical free trade relationships are being challenged. For example, the U.S. government has imposed tariffs on certain products imported into the
United States, which has resulted in reciprocal tariffs from other countries, including countries where we operate and/or into which we import products, such as imports of U.S. soybeans into China. In addition, the U.S. government has indicated its intent to renegotiate or potentially terminate certain existing international trade agreements and it is unclear what changes, if any, will be made to international trade agreements that are relevant to our business activities. These actions have created uncertainty between the United States and other nations, including countries where we operate, and have led to significant volatility in commodity prices, disruptions in historical trade flows and shifts in planting patterns in the United States and South America, all of which have resulted in reduced volumes of grain exports overall and have presented challenges and uncertainties for our business. Changes in trade policy, withdrawals from or material modifications to relevant international trade agreements and continued uncertainty could depress economic activity and restrict our access to suppliers and customers.customers and we cannot predict the effects of future trade policies, disputes or agreements on our business. Tariffs and trade restrictions that are implemented on products that we buy and/or sell could increase the cost of those products or adversely affect the availability of market access. These cost increases and market changes could adversely affect demand for our products and reduce margins, which could have a material adverse effect on our business and our earnings. In addition, the U.S. government can prevent or restrict us from doing business in or with other countries. These restrictions and those of other governments could limit our ability to gain access to business opportunities in various countries.
We are subject to political, economic, legal and other risks of doing business globally.
We are a global business and are exposed to risks associated with having global operations. These risks include, but are not limited to, risks relating to terrorism, war, civil unrest, changes in a country's or region's social, economic or political conditions, changes in local labor conditions and regulations, changes in safety and environmental regulations, changes in regulatory or legal environments, restrictions on currency exchange activities, currency exchange fluctuations, price controls on commodities, taxes and doing business in countries or regions with inadequate infrastructure and logistics challenges. In particular, some countries where we operate lack well-developed legal systems or have not adopted clear legal and regulatory frameworks. This lack of legal certainty exposes our operations to increased risks, including increased difficulty in enforcing
our agreements in those jurisdictions and increased risk of adverse actions by local government authorities, such as unilateral or forced renegotiation, modification or nullification of existing agreements or expropriations.
Our business and operations and demand for our products are highly dependent on certain global and regional factors that are outside our control and that could adversely impact our business.
The level of demand for our products is affected by global and regional demographics and macroeconomic conditions, including population growth rates and changes in standards of living. A significant downturn in global economic growth or recessionary conditions in major geographic regions may lead to a reduced demand for agricultural commodities, which could have a material adverse effect on our business, financial condition, liquidity, results of operations and prospects. Weak global economic conditions and adverse conditions in financial and capital markets may adversely impact the financial condition and liquidity of some of our customers, suppliers and other counterparties, which could have a material adverse effect on our customers' ability to pay for our products and on our business, financial condition, liquidity, results of operations and prospects.
Additionally, planted acreage and consequently the volume of fertilizer and crop protection products applied, is partially dependent on government programs, grain prices and the perception held by producers of demand for production, all of which are outside our control. Moreover, our business and operations may be affected by weather conditions that are outside our control. For example:
Weather conditions during the spring planting season and early summer crop nutrient and crop protection application season affect agronomy product volumes and profitability.
Adverse weather conditions, such as heavy snow or rainfall and any flooding as a result thereof, may cause transportation delays and increased transportation costs, or damage physical assets, especially facilities in low-lying areas near coasts and river banks or situated in hurricane-prone and rain-susceptible regions.
Changes in weather patterns may shift periods of demand for products or even regions in which our products are produced or distributed, which could require us to evolve our procurement and distribution processes.
Significant changes in water levels (up or down, as a result of flooding, drought or otherwise) may cause changes in agricultural activity, which could require changes to our operating and distribution activities, as well as significant capital improvements to our facilities.
We may experience increased insurance premiums and deductibles, or decreases in available coverage, for our assets in areas subject to adverse weather conditions.
Emerging sustainability and other environmental priorities outside our control could also affect agricultural practices and future demand for agronomy products applied to crops and the volume of any such application. Accordingly, factors outside our control could materially and adversely affect our revenues, results of operations and cash flows.
Our revenues, margins, results of operations and cash flows could be materially and adversely affected if our members were to do business with others rather than with us.
We do not have an exclusive relationship with our members and our members are not obligated to supply us with their products or purchase products from us. Our members often have a variety of distribution outlets and product sources available to them. If our members were to sell their products to other purchasers or purchase products from other sellers, our revenues and margins would decline and our results of operations and cash flows could be materially and adversely affected.
We are exposed to risk of nonperformance and nonpayment by counterparties.
We are exposed to risk of nonperformance and nonpayment by counterparties, whether pursuant to contracts or otherwise. Risk of nonperformance and nonpayment by counterparties includes inability or refusal of a counterparty to pay us, inability or refusal to perform because of a counterparty's financial condition and liquidity or for any other reason, and risk that the counterparty will refuse to perform a contract during a period of price fluctuations where contract prices are significantly different than current market prices. In the event we experience significant nonperformance or nonpayment by counterparties, our financial condition, results of operations and cash flows could be materially and adversely affected. For example, we store inventory in third-party warehouses, and the operators of these warehouses may not adequately store or secure our inventory, or they may improperly sell that inventory to someone else, which could expose us to a loss of the value of that inventory. In the
event we experience any such nonperformance by a third-party warehouse operator, our financial condition, results of operations and cash flows could be materially and adversely affected.
We participate in highly competitive business markets and we may not be able to continue to compete successfully, which could have a material adverse effect on us.
We operate in several highly competitive business segments and our competitors may succeed in developing new or enhanced products that are better than ours, may be more successful in marketing and selling their products than we are, or may have more effective supply chain capability than we have. Competitive factors include price, service level, proximity to markets, access to transportation, product quality and marketing. In our business segments, we compete with certain companies that are larger and better known than we are and that have greater marketing, financial, personnel and other resources than we do. As a result, we may not be able to continue to compete successfully, which could have a material adverse effect on our business, financial condition, liquidity, results of operations and prospects.
Our business, profitability and liquidity may be adversely affected by the deterioration in the credit quality of, or defaults by, third parties who owe us money.
We extend credit to, make loans to and engage in other financing arrangements with individual producers, local cooperatives and other third parties around the world.We incur credit risk and the risk of losses if our borrowers and others to which we extend credit do not repay their loans or perform their obligations to pay us the money they owe. These parties may default on their obligations to us due to bankruptcy, lack of liquidity, operational failure or for other reasons. If these counterparties do not pay us back, such that we experience significant defaults on their payment obligations to us, our financial condition, results of operations or cash flows could be materially and adversely affected.
We are also subject to the risk that our rights against borrowers and other third parties that owe us money may not be enforceable in all circumstances. For example, a borrower or third party may declare bankruptcy. In addition, due to implications of the overall agricultural sector's extended period of depressed commodity prices and margins and weather-related impacts on production in 2019, among other factors, the credit quality of borrowers and other third parties whose obligations we hold could deteriorate, including a deterioration in the value of collateral posted by those parties to secure their obligations to us pursuant to purchase contracts, loan agreements or other contracts. If that deterioration occurs, the material adverse effects of third parties not performing their repayment obligations may be exacerbated if the collateral held by us cannot be realized or is liquidated at prices not sufficient to recover the full amount owed to us. For example, certain loans and other financing arrangements we undertake with agricultural producers are typically secured by the counterparty's crops that are planted in the current year. There is a risk that the value of the crop will not be sufficient to satisfy the counterparty’s repayment obligations under the financing arrangement as a result of weather, crop growing conditions, other factors that influence the price, supply and demand for agricultural commodities or for other reasons.
In addition, disputes may arise as to the amount of collateral we are entitled to receive and the value of pledged assets. Termination of contracts and foreclosure on collateral may subject us to claims for improper exercise of our rights. Default rates, downgrades and disputes with counterparties as to the valuation of collateral increase significantly in times of market stress and illiquidity.
In respect to our lending activity, we evaluate collectability of both commercial and producer loans on a specific identification basis, based on the amount and quality of the collateral obtained, and record specific loan loss reserves when appropriate. Consistent with accounting principles generally accepted in the United States ("U.S. GAAP"), a general reserve is also maintained based on historical loss experience and various qualitative factors. For other forms of credit, we establish reserves as appropriate and consistent with U.S. GAAP. The reserves represent our best estimate based on current facts and circumstances. Future developments or changes in assumptions may cause us to record adjustments to the reserves that could materially and adversely affect our results of operations.
Changes in federal income tax laws or in our tax status could increase our tax liability and reduce our net income significantly.
Current federal income tax laws, regulations and interpretations regarding the taxation of cooperatives allow us to exclude income generated through business with or for a member (patronage(patronage-sourced income) from our taxable income.income to the extent it is distributed back to our members. If any changes are made to such federal income tax laws, regulations or interpretations, or if in the future we were not eligible to be taxed as a cooperative, our tax liability would significantly increase and our net income would significantly decrease.
We incur significant costs in complying with applicable laws and regulations. Any failure to comply with these laws and regulations, or make capital or other investments necessary to comply with these laws and regulations, could expose us to unanticipated expenditures and liabilities.
We are subject to numerous federal, state and local provisions regulating our business and operations. We incur and expect to incur significant capital and operating expenses to comply with these laws and regulations. We may be unable to pass on those expenses to customers without experiencing volume and margin losses. For example, the compliance burden and impact on our operations and profitability as a result of the enactment of the Dodd-Frank Wall Street Reform and Consumer Protection Act ("Dodd-Frank") and related regulations continue to evolve, as federal agencies have implemented and continue to implement its many provisions through regulation. These efforts to change the regulation of financial markets subject users of derivatives, such as CHS, to extensive oversight and regulation by the CFTC. Such initiatives have imposed and may continue to impose additional costs on us, including operating and compliance costs, and the cost of fines or penalties in the event we do not comply, and could materially affect the availability, as well as the cost and terms, of certain transactions. Certain federal regulations, studies and reports addressing Dodd-Frank, including the regulation of swaps and derivatives, are still being implemented and others are being finalized. We will continue to monitor these developments. Any of these matters could have a material adverse effect on our business, financial condition, liquidity, results of operations and prospects.
We establish reserves for the future cost of known compliance obligations, such as remediation of identified environmental issues. However, these reserves may prove inadequate to meet our actual liability. Moreover, amended, new or more stringent requirements, stricter interpretations of existing requirements or the future discovery of currently unknown compliance issues may require us to make material expenditures or subject us to liabilities that we currently do not anticipate. Furthermore, our failure to comply with applicable laws and regulations could subject us to administrative penalties and injunctive relief, civil remedies, including fines and injunctions, criminal fines and penalties, and recalls of our products. For example, we regularly maintain hedges to manage the price risks associated with our commercial operations. These transactions typically take place on exchanges such as the CME. Our hedging transactions and activities are subject to the rules and regulations of the exchanges we use and governing bodies, including the CME, the NYMEX, the CBOT, the MGEX and the CFTC. All exchanges have broad powers to review required records, to investigate and enforce compliance and to punish noncompliance by entities subject to their jurisdiction. Failure to comply with such rules and regulations could lead to restrictions on our trading activities or subject us to enforcement action by the CFTC or a disciplinary action by the exchanges, which could lead to substantial fines or penalties or limitations on our related operations. In addition, any investigation or proceeding by an exchange or the CFTC, whether successful or unsuccessful, could result in substantial costs, diversion of resources, including management time, and potential harm to our reputation, all of which could have a material adverse effect on our business financial condition, liquidity, results of operations and prospects.
The consequences of any U.S. Securities and Exchange Commission ("SEC") or other governmental authority's investigation with respect to certain rail freight contracts purchased in connection with our North American grain marketing operations could have a material adverse effect on our business.
In connection with the preparation of our Annual Report on Form 10-K for the year ended August 31, 2018, our management noted potentially excessive valuations in net derivative asset valuations relating to certain rail freight contracts purchased in connection with our North American grain marketing operations. Following the identification of these potentially excessive valuations, we engaged external counsel, which engaged forensic accountants to work with our management under the oversight of the Audit Committee of our Board of Directors to conduct an investigation. The investigation concluded there were misstatements in the consolidated financial statements included in certain of our filings with the SEC that were due to intentional misconduct by a former employee in our rail freight trading operations, and due to rail freight contracts and certain non-railnonrail freight contracts not meeting technical accounting requirements to qualify as derivative financial instruments. The misconduct consisted of the former employee manipulating the mark-to-market valuation of railcars that were the subject of rail freight purchase contracts and manipulating the quantity of railcars included in the monthly mark-to-market valuation. In addition, the investigation revealed intentional misstatements that were made by the former employee to our external auditor in connection with its audit of our consolidated financial statements for the year ended August 31, 2017. During the course of, and as a result of, the investigation, we terminated the employee. The Audit Committee of our Board of Directors and our legal counsel reported the findings of the investigation to our Board of Directors and to our independent registered public accounting firm and have discussed evidence uncovered and conclusions reached in the investigation with the staff of the Division of Enforcement of the SEC. Although we are not aware that any formal investigation or inquiry has been commenced, weWe are cooperating, and will continue to fully cooperate with, the staff of the Division of Enforcement of the SEC in any ongoing review of these matters. We are unable at this time to predict when the SEC Division of Enforcement's review of these matters will be completed or what regulatory or other outcomes may result. If the SEC or any other governmental authority determines that violations of certain laws or regulations occurred, we could be exposed to a broad range of civil and criminal sanctions. Although we are currently unable to predict what actions the SEC or any other governmental authority might take, or what the
likely outcome of any such actions might be, or estimate the range of reasonably possible fines or penalties, such actions, fines and/or penalties could be material, resulting in a material adverse effect on our business, prospects, reputation, financial condition, results of operations or cash flows. Even if an inquiry or investigation does not result in an adverse determination, our business, prospects, reputation, financial condition, results of operations or cash flows could be adversely impacted. In addition, the expenses incurred in connection with the ongoing review or any investigationother review by the SEC or any other governmental authority, and the diversion of the attention of our management that could occur as a result thereof, could adversely affect our business, financial condition, results of operations or cash flows.
We are subject to the Foreign Corrupt Practices Act of 1977 and other similarextensive anti-corruption, anti-bribery, anti-kickback and anti-kickbacktrade laws and regulations, and any noncompliance with those laws and regulations by us or others acting on our behalf could have a material adverse effect on our business, financial condition and results of operations.
We operate on a global basis and are subject to anti-corruption, anti-bribery and anti-kickback laws and regulations, including the Foreign Corrupt Practices Act of 1977, as amended ("FCPA"). The FCPA and other similar anti-corruption, anti-bribery and anti-kickback laws and regulations in other jurisdictions generally prohibit companies and their intermediaries or agents from making improper payments to government officials or any other persons for the purpose of obtaining or retaining business. We operate and sell our products in many parts of the world that have experienced governmental corruption to some degree and in certain circumstances strict compliance with anti-corruption, anti-bribery and anti-kickback laws and regulations may conflict with local customs and practices. In addition, in certain countries, we engage third-party agents or intermediaries to act on our behalf and/or conduct all or a portion of our operations through joint venture partners, including in those countries with a high risk for corruption. If any of these third parties violate applicable anti-corruption, anti-bribery or anti-kickback laws or regulations, we may be liable for those violations. We have policies in place prohibiting employees from making or authorizing improper payments,payments; we train our employees regarding compliance with anti-corruption, anti-bribery and anti-kickback laws and regulations,regulations; and we utilize procedures to identify and mitigate risks of such misconduct by our employees, third-party agents, intermediaries and joint venture partners. However, we cannot provide assurances that our employees, third-party agents, intermediaries or joint venture partners will comply with those policies, laws and regulations. If we are found liable for violations of the FCPA or other similar anti-corruption, anti-bribery or anti-kickback laws or regulations, either due to our own acts or out of inadvertence or due to the acts or inadvertence of others, we could suffer criminal or civil fines or penalties or other repercussions, including reputational harm, which could have a material adverse effect on our business, financial condition and results of operations.
In the fourth quarter of fiscal 2018, we contacted the U.S. Department of Justice ("DOJ") and SEC to voluntarily self-disclose potential violations of the FCPA in connection with a small number of reimbursements made to Mexican customs agents in the 2014-2015 time period for payments customs agents made to Mexican customs officials in connection with inspections of grain crossing the U.S.-Mexican border by railcar. We are fully cooperatingIn connection with their review of this matter, we have cooperated with the government, with the assistanceDOJ's and SEC's evaluation of legal counsel, which includes investigating other areas of potential interest relating to the government.FCPA. On February 25, 2020,
we received a letter from the DOJ stating that it had closed its inquiry into each of these matters without taking any action against us and acknowledging its appreciation of our cooperation. We are unable atstill fully cooperating with the SEC's ongoing evaluation of these FCPA-related matters. At this time, the SEC has not taken a position on these FCPA-related matters and we are unable to predict when our or the government agencies'SEC's review of these matters will be completed or what regulatory or other outcomes may result.
Due to the international scope of our operations, we are also subject to a complex system of import- and export-related laws and regulations, including U.S. regulations issued by Customs and Border Protection, the Bureau of Industry and Security, the Office of Antiboycott Compliance, the Directorate of Defense Trade Controls and the Office of Foreign Assets Control, as well as the counterparts of these agencies in other countries. Any alleged or actual violation of these laws or regulations by us or our employees may subject us to government scrutiny, investigation and civil and criminal penalties, and may limit our import and export abilities. Furthermore, embargoes and sanctions imposed by the United States and other governments restricting or prohibiting sales to specific persons or countries or based on product classification may expose us to potential criminal or civil sanctions. We cannot predict the nature, scope or effect of future regulatory requirements to which our operations might be subject or the way existing laws and regulations might be administered or interpreted.
Environmental and energy laws and regulations may result in increased operating costs and capital expenditures and may have a material and adverse effect on us.
New and current environmental and energy laws and regulations, including regulations relating to alternative energy sources and the risk of global climate change, new interpretations of existing environmental and energy laws and regulations, increased governmental enforcement of environmental and energy laws and regulations or other developments in these areas could require us to make additional unforeseen expenditures on technologies and/or other assets to continue our operations or unforeseen changes to our operations, either of which could adversely affect us. For example, it is possible that some form of regulation will be forthcoming at the federal or state level in the United States with respect to emissions of greenhouse gases ("GHGs"), such as carbon dioxide, methane and nitrous oxides.oxide. New federal legislation or regulatory programs that restrict emissions of GHGs or comparable new state legislation or programs or customer requirements in areas where we or our customers conduct business could adversely affect our operations and the demand for our energy products, which could have a material adverse effect on our business, financial condition, liquidity, results of operations and prospects. In addition, new legislation, or regulatory programs, or customer or other stakeholder expectations could require substantial expenditures for installation and operation of systems and equipment or for substantial modifications to existing equipment.
Also, pursuant to the Energy Independence and Security Act of 2007, the EPA has promulgated the Renewable Fuel Standard ("RFS"), which requires refiners to blend renewable fuels, such as ethanol and biodiesel, with their petroleum fuels or to purchase renewable energy credits, known as Renewable Identification Numbers ("RINs"), in lieu of blending. The EPA generally establishes new annual renewable fuel percentage standards for each compliance year in the preceding year. We generate RINs in our marketing operations under the RFS; however, it may not be enough to meet the needs of our refining
capacity and, if so, RINs must be purchased on the open market. In recent years, the price of RINs has been extremely volatile. As a result, the purchase of RINs could have a negative impact on our future refined fuels margins, the impact of which we are unable to estimate.
During fiscal 2019, the EPA granted our Laurel, Montana, refinery an extension of the small refinery exemption under the RFS as provided for under the Clean Air Act for 2018 ("small refinery exemption"). This action provided our Laurel refinery an exemption from its renewable fuel volume obligations under the RFS program for compliance year 2018. In granting this exemption, the EPA considered a number of factors and concluded the Laurel refinery qualified for the exemption as prescribed under the standard. As with other competitors who received the exemption in the same geographic area as our Laurel refinery, the small refinery exemption lowers our cost to operate and has a positive impact on our earnings. Since the small refinery exemption is granted on a year-to-year basis, we are unable to predict whether we will receive this exemption in the future.
Environmental liabilities could have a material adverse effect on us.
Many of our current and former facilities have been in operation for many years and over that time we and other operators of those facilities have generated, used, stored and disposed of substances or wastes that are or might be considered hazardous under applicable or future enacted environmental laws, including liquid fertilizers, chemicals and fuels stored in underground and above-groundaboveground tanks. Any past or future actions in violation of applicable environmental laws could subject us to administrative penalties, fines, injunctions or other costs, such as capital expenditures. In addition, an owner or operator of contaminated property, and a party who sends hazardous materials to such site for treatment, storage, disposal or recycling can be liable for the cost of investigation and remediation under environmental laws. In some instances, such liability exists regardless of fault. Moreover, future or unknown past releases of hazardous substances could subject us to private lawsuits claiming damages, including for bodily injury or property damage, and to adverse publicity, which could have a material adverse effect on us. Liabilities, including legal costs, related to remediation of contaminated properties are not recognized by us until the related costs are considered probable and can be reasonably estimated.
Actual or perceived quality, safety or health risks associated with our products could subject us to significant liability and damage our business and reputation.
If any of our food or animal feed products were to become adulterated or misbranded, we would need to recall those items and could experience product liability claims if either consumers or customers' livestock were injured or were claimed to be injured as a result. A widespread product recall or a significant product liability judgment could cause our products to be unavailable for a period of time or could cause a loss of consumer or customer confidence in our products. Even if a product liability claim were unsuccessful or were not fully pursued, the negative publicity surrounding any assertion that our products caused illness or injury could adversely affect our business and reputation with existing and potential consumers and customers and our corporate and brand image. Moreover, claims or liabilities of this sort might not be covered by our insurance or by any rights of indemnity or contribution that we may have against others. In addition, general public perceptions regarding the quality, safety or health risks associated with particular food or animal feed products, such as concerns regarding genetically modified crops, could reduce demand and prices for some of the products associated with our businesses. To the extent that consumer preferences evolve away from products that our members or we produce for health or other reasons, such as the growing demand for organic food products, and we are unable to develop or procure products that satisfy new consumer preferences, there will be a decreased demand for our products, which could have a material adverse effect on our business, financial condition, liquidity, results of operations and prospects.
We have identified material weaknesses in our internal control over financial reporting. If these material weaknesses persist or if we fail to establish and maintain effective internal controls over financial reporting, our ability to accurately report our results could be adversely affected.
Maintaining effective internal control over financial reporting is necessary for us to produce reliable financial statements. We have concluded that material weaknesses in our internal control over financial reporting exist and those material weaknesses are discussed further in Item 9A, Controls and Procedures, of this Annual Report on Form 10-K. The existence of one or more material weaknesses precludes a conclusion by management that a corporation's internal control over financial reporting is effective.
In response to the identified material weaknesses, our management, with the oversight of the Audit Committee of our Board of Directors, has dedicated significant resources, including involvement of outside advisors, and has undertaken significant efforts to improve our internal control over financial reporting and to remediate the material weaknesses identified. Although certain remedial actions have been completed, others are still in process, and we continue to actively plan for and
Risks Related to our Financial Position and Financing Our Business
implement additional control procedures. If we fail to remediate the identified material weaknesses or fail to otherwise maintain effective control over financial reporting in the future, it could result in a material misstatement of our financial statements that would not be prevented or detected on a timely basis. Our management and Board of Directors continue to devote significant time and attention to remediating and overseeing the remediation of the identified material weaknesses and improving our internal control over financial reporting, and we expect to continue to incur costs associated with remediating such material weaknesses and implementing appropriate processes, including fees for additional audit, legal and consulting services, which could negatively affect our financial condition and operating results.
Our financial results are susceptible to seasonality.
Many of our business activities are highly seasonal and operating results vary throughout the year. Our revenue and income areis generally lowest during the second and fourth fiscal quarters and highest during the first and third fiscal quarters. For example, in our Ag segment, our country operations business generally experiences higher volumes and income during the spring planting season and during the fall harvest season and our agronomy business generally experiences higher volumes and income during the spring planting season. Our global grain marketing operations are also subject to fluctuations in volume and income based on producer harvests, world grain prices and demand, and international trade relationships. Our Energy segment generally experiences higher volumes and income in certain operating areas, such as refined products, in the spring, summer and early fall when gasoline and diesel fuel usageuse by our customers and members is highest and is subject to global supply and demand forces. Other energy products, such as propane, generally experience higher volumes and income during the winter heating and crop-drying seasons. The COVID-19 pandemic may impact seasonal trends that typically characterize our revenue and operating results.
Our operations are subject to business interruptions and casualty losses;If any of our long-lived assets become impaired, we do not insure against all potential losses and could be seriously harmed by unanticipated liabilities.required to record a significant impairment charge, which would negatively impact our results of operations.
Our operations are subject to business interruptions due to unanticipated events such as explosions, fires, pipeline interruptions, transportation delays,All our long-lived assets, including property, plant and equipment, failures, crude oil or refined product spills, adverse weather conditions and labor disputes. For example:
Our oil refineriesgoodwill, investments in unconsolidated affiliates and other facilitiesidentifiable intangibles, are potential targetsevaluated for terrorist attacks that could haltimpairment in accordance with U.S. GAAP, at least annually for goodwill, and whenever events or discontinue production.
Our inability to negotiate acceptable contracts with unionized workerschanges in our operations could result in strikes or work stoppages.
Our corporate headquarters,circumstances indicate the facilities we own or the significant inventories we carry could be damaged or destroyed by catastrophic events, adverse weather conditions or contamination.
Someone may accidentally or intentionally introduce a computer virus to our information technology systems or breach our computer systems or other cyber resources.
An occurrencecarrying amount of a pandemiclong-lived asset or epidemic disease affecting a substantial part of our workforce or our customers could cause an interruption in our business operations.
The effects of any of these events could be significant. We maintain insurance coverage against many, but not all, potential losses or liabilities arising from these operating hazards, but uninsured losses or losses above our coverage limits are possible. Uninsured losses and liabilities arising from operating hazards could have a material adverse effect on us.
Our risk management strategiesasset group may not be effective.
Our business is affected by fluctuations in commodity prices, transportation costs, energy prices, foreign currency exchange rates and interest rates. We monitor position limits, account receivablesrecoverable. For example, the COVID-19 pandemic and other exposuresfactors resulted in substantial reductions in demand and engagesharp price declines in certain industries in which we operate during the third quarter of fiscal 2020, particularly with respect to the production of renewable fuels and other strategiesenergy products. Accordingly, based on these deteriorated macroeconomic and controlsindustry conditions, we considered the impacts on each of our businesses and determined that we needed to manage these risks. Our monitoring effortsperform interim impairment assessments of goodwill and asset groups during the third quarter of fiscal 2020 for a reporting unit within our Ag segment that operates in the renewable fuels industry. Although no impairment was recorded as a result of the impairment assessment during the third quarter of fiscal 2020, or as a result of our annual goodwill impairment tests as of July 31, 2020, we are continuing to monitor our results and projected cash flows to assess whether any impairment may not be effective at detectingnecessary in the future. Any such future impairment, or any other future impairment of our long-lived assets, could require us to record a significant risk exposure and our controls and strategies may not be effective in adequately managing against the occurrence of a significant loss relating to a risk exposure. If our controls and strategies are not successful in mitigating or preventing our financial exposure to losses due to the fluctuations or failures mentioned above, it could significantly and adversely affect our operating results.
We are subject to workforce factors that could adversely affect our business and financial condition.
Like most companies in the agricultural industry, we are continuously challenged to hire, develop and retain a sufficient number of employees to operate our businesses throughout our operating geographies. We may have difficulty recruiting and retaining new employees with adequate qualifications and experience. The challenge of hiring new employees is exacerbated by the rural nature of our business,impairment charge, which provides for a smaller pool of skilled employee candidates. To hire new employees, we may be forced to pay higher wages or offer other benefits that might impact our cost of labor. Furthermore, when we do hire new employees, we may be unable to successfully transfer our other employees' institutional knowledge and skills to them. These or other employee workforce factors couldwould negatively impact our business, financial condition or results of operations.
Our business is capital-intensive and we rely on cash generated from our operations and external financing to fund our strategies and ongoing capital needs.
We require significant capital, including access to credit markets from time to time, to operate our businessbusinesses and fund our strategies. Our working capital requirements are directly affected by the price of commodities, which may fluctuate significantly and quickly. We also require substantial capital to maintain and upgrade our extensive network of facilities to keep pace with competitive developments, technological advances, regulationsregulatory changes and changing safety standards. In addition, the expansion of our business and pursuit of acquisitions or other business opportunities has required, and may in the future require, significant amounts of capital. If we are unable to generate sufficient cash flow or maintain access to adequate external financing, including as a result of significant disruptions in the global credit markets, it could restrict our current operations and our growth opportunities, which could adversely affect our operating results and restrict our ability to repay our existing debts.
Our cooperative structure limits our ability to access equity capital.
As a cooperative, we may not sell common stock in our company. In addition, existing laws and our articles of incorporation and bylaws limit dividends on any preferred stock we may issue to 8% per annum. These limitations may restrict our ability to raise equity capital and may adversely affect our ability to compete with enterprises that do not face similar restrictions.
Changes in the method of determining the London Interbank Offered Rate ("LIBOR") or the replacement of LIBOR with an alternative reference rate may adversely affect interest rates under our credit facilities and dividend rates with respect to our Class B Series 2 Preferred Stock and Class B Series 3 Preferred Stock.
LIBOR is the basic rate of interest widely used as a global reference for setting interest rates on loans. Some of our credit facilities, including our five-year revolving credit facility and our 10-year term loan facility, use LIBOR as the reference rate. In addition, the terms of our Class B Reset Rate Cumulative Redeemable Preferred Stock, Series 2 ("Class B Series 2
Preferred Stock"), and our Class B Reset Rate Cumulative Redeemable Preferred Stock, Series 3 ("Class B Series 3 Preferred Stock"), provide that, beginning on March 24, 2024, in the case of our Class B Series 2 Preferred Stock, or on September 30, 2024, in the case of our Class B Series 3 Preferred Stock ("Initial Reset Date"), dividends on such preferred stock will accumulate at a rate equal to three-month LIBOR plus an applicable spread, not to exceed 8% per annum.
In 2017, the United Kingdom's Financial Conduct Authority, which regulates LIBOR, announced that it intends to phase out LIBOR by the end of 2021. It is unclear if LIBOR will cease to exist at that time, if new methods of calculating LIBOR will be established such that it continues to exist after 2021 or whether different reference rates used to price indebtedness will develop.develop or become widely accepted. It is impossible to predict the effect these developments, any discontinuance, modification or other reforms to LIBOR or the establishment or acceptance of alternative reference rates may have on LIBOR, other benchmark rates or floating rate debt instruments. Although certain of our credit facilities, including our five-year revolving credit facility and our 10-year term loan facility, contain LIBOR alternative provisions, use of alternative reference rates, new methods of calculating LIBOR or other reforms could cause the interest rates on our borrowings to be materially different than expected, which could have an adverse effect on our financial position, results of operations and liquidity and cause us to attempt to renegotiate such credit facilities. Similarly, although the rate at which dividends accumulate on our Class B Series 2 Preferred Stock and Class B Series 3 Preferred Stock may not exceed 8% per annum, there is uncertainty regarding the calculation of such rate following the applicable Initial Reset Date in the event that LIBOR ceases to exist, and the use of alternative reference rates, new methods of calculating LIBOR or other reforms could cause the dividends we pay on our Class B Series 2 Preferred Stock and Class B Series 3 Preferred Stock following the applicable Initial Reset Date to be materially different than expected, which could have an adverse effect on our financial position, results of operations and liquidity and cause us to attempt to amend the terms of our Class B Series 2 Preferred Stock and Class B Series 3 Preferred Stock, including by seeking shareholder approval of any such
amendment. In addition, the overall financial market may be disrupted as a result of the phase-outphaseout or replacement of LIBOR. Disruption in the financial market could have an adverse effect on our financial position, results of operations and liquidity.
Consolidation among the producers of products we purchase and customers for products we sell could materially and adversely affect our revenues, results of operations and cash flows.
Consolidation has occurred among the individual producers of products we sell and purchase, including crude oil, fertilizer and grain, and it is highly likely to continue in the future. Consolidation could allow producers to negotiate pricing, supply availability and other contract terms that are less favorable to us. Consolidation also may increase the likelihood that consumers of these products enter into supply relationships with a smaller number of producers, resulting in potentially higher prices for the products we purchase.
Consolidation has also occurred among cooperative associations that are the primary wholesale customers of our products, which has resulted in a smaller wholesale and retail customer base for our products and has intensified the competition for these customers. This consolidation is likely to continue in the future. Ongoing consolidation among distributors and brokers of food products and food retailers has altered the buying patterns of these businesses, as they have increasingly elected to work with product suppliers who can meet their needs nationwide rather than just regionally or locally. If these cooperatives, distributors, brokers and retailers elect not to purchase our products, our revenues, results of operations and cash flows could be materially and adversely affected.
In addition, in the seed, fertilizer and crop protection markets, consolidation at both the producer and wholesale customer level has increased the potential for direct sales from the respective input manufacturer to the cooperative customers and/or the individual agricultural producer, which would remove us from the supply chain and could have a material and adverse effect on our revenues, results of operations and cash flows.
If our customers choose alternatives to our refined petroleum products, our revenues, results of operations and cash flows could be materially and adversely affected.
Numerous alternative energy sources currently under development could serve as alternatives to our gasoline, diesel fuel and other refined petroleum products. If any of these alternative products become more economically viable or preferable to our customers for environmental or other reasons, demand for our energy products would decline. Declining demand for our energy products, particularly diesel fuel sold for farming applications, could materially and adversely affect our revenues, results of operations and cash flows.
Technological improvements could decrease the demand for our agronomy and energy products.
Technological advances in agriculture could decrease the demand for crop nutrients, energy and other crop input products and services we provide. Genetically engineered seeds that resist disease and insects, or that meet certain nutritional requirements, could affect the demand for our crop nutrients and crop protection products. Demand for fuel that we sell could decline as technology allows for more efficient usage of equipment. Declining demand for our products could materially and adversely affect our revenues, results of operations and cash flows.
Acquisitions, strategic alliances, joint ventures, divestitures and other non-ordinary course-of business events resulting from portfolio management actions and other evolving business strategies could affect future results.
Wemonitor our business portfolio and organizational structure and have made and may continue to make acquisitions,strategic alliances, joint ventures, divestitures and changes to our organizational structure. With respect to acquisitions, future results will be affected by our ability to identify suitable acquisition candidates, to adequately finance any acquisitions and to integrate acquired businesses quickly and obtain the anticipated financial returns, including synergies. Our ability to successfully complete a divestiture will depend on, among other things, our ability to identify buyers that are prepared to acquire such assets or businesses on acceptable terms and to adjust and optimize our retained businesses following the divestiture. Additionally, we may fail to consummate proposed acquisitions, divestitures, joint ventures or strategic alliances after incurring expenses and devoting substantial resources, including management time, to such transactions.
Several parts of our business, including in particular our nitrogen production business, our foods business and portions of our global grain marketing and wheat milling operations, are operated through joint ventures with third parties where we do not have majority control of the venture. By operating a business through a joint venture, we have less control over business decisions than we have in our subsidiaries and limited liability companies in which we have a controlling interest. In particular, we generally cannot act on major business initiatives in our joint ventures without the consent of the other party or parties in
those ventures. Investments in joint ventures may, under certain circumstances, involve risks not present when a third party is not involved, including the possibility that co-venturers might become bankrupt or fail to fund their share of required capital contributions, in which case the joint venture may be unable to access needed growth capital (if the co-venturer is solely responsible for capital contributions) or we and any other remaining co-venturers would generally be liable for the joint venture’s liabilities. Co-venturers may have economic, tax or other business interests or goals that are inconsistent with our business interests or goals, and may be in a position to take actions contrary to our policies or objectives. Our co-venturers may take actions that are not within our control, which may expose our investments in joint ventures to the risk of lower values or returns. Joint venture investments may also lead to impasses. Disputes between us and co-venturers may result in litigation or arbitration that would increase our expenses and prevent our officers and/or directors from focusing their time and effort on our day-to-day business. In addition, we may in certain circumstances be liable for the actions of our co-venturers. Each of these matters could have a material adverse effect on us.
We made certain assumptions and projections regarding the future of the markets served by our joint venture investments, which included projected market pricing and demand for their products. These assumptions were an integral part of the economics used to evaluate these joint venture investment opportunities prior to consummation. To the extent that actual market performance varies from our models, our ability to achieve projected returns on our joint venture investments may be impacted in a materially adverse manner.
We utilize information technology systems to support our business. The ongoing multiyear implementation of an enterprise-wide resource planning system, reliance upon multiple legacy business systems, security breaches or other disruptions to our information technology systems or assets could interfere with our operations, compromise security of our customers' or suppliers' information and expose us to liability that could adversely impact our business and reputation.
Our operations rely on certain key information technology ("IT") systems, many of which are legacy in nature or may depend on third-party services to provide critical connections of data, information and services for internal and external users. Over the next several years, we expect to continue implementing a new enterprise resource planning system ("ERP"), which has and will continue to require significant capital and human resources to deploy. There can be no assurance that the actual costs for the ERP will not exceed our current estimates or that the ERP will not take longer to implement than we currently expect. In addition, potential flaws in implementing the ERP or in the failure of any portion/module of the ERP to meet our needs or provide appropriate controls may pose risks to our ability to operate successfully and efficiently and with an effective system of internal controls. There may be other challenges and risks to both our aging and current IT systems over time due to any number of causes, such as catastrophic events, availability of resources, power outages, security breaches or cyber-based attacks, as we upgrade and standardize our ERP system on a worldwide basis. These challenges and risks could result in legal claims or proceedings, liability or penalties, disruption in operations, loss of valuable data, increased costs and damage to our reputation, all of which could adversely affect our business. Our ongoing IT investments include those relating to cybersecurity, including technology, hired expertise and cybersecurity risk mitigation actions. However, an incident or breach may occur and subject us to an adverse impact on our business and reputation. Further, we are subject to laws and regulations in the United States and other jurisdictions regarding privacy, data protection and data security, including those related to the collection, storage, handling, use, disclosure, transfer and security of personal data. These laws and regulations pose increasingly complex compliance challenges and may require us to incur significant additional compliance costs. Any violation of such laws and regulations, including as a result of a security or privacy breach, could subject us to legal claims, regulatory penalties and damage to our reputation.
ITEM 1B. UNRESOLVED STAFF COMMENTS
As of the date hereof, there were no unresolved comments from the SEC staff regarding our periodic or current reports.
ITEM 2. PROPERTIES
We own or lease energy, agronomy, grain-handling and processing facilities and other real estate throughout the United States and internationally. Below is a summary of these locations by segment and related business. All facilities are owned except where indicated as leased.
|
| | | | |
| Description | Location(s) |
| Energy | |
| Refineries | Laurel, Montana, and McPherson, Kansas |
| Propane terminals | Biddeford, Maine;11 locations in Iowa, Maine, Minnesota, Missouri, North Dakota, Washington and Wisconsin; the locations in Glenwood, Minnesota, Hannaford, North Dakota, and Nooksack and Yakima, Washington, are owned by CHS; the location in Rockville, Minnesota, (Rockville is 50% owned by CHS); Hannaford, North Dakota; Ross, North Dakota; and Hixton, WisconsinCHS; all other locations are either fully or partially leased |
| Transportation terminals/repair facilities | 12 locations in Iowa, Kansas, Minnesota, Montana, North Dakota, South Dakota, Washington and Wisconsin |
| Petroleum and asphalt terminals/storage facilities | 11 locations in Montana, North Dakota and Wisconsin |
| Pipelines: | |
| Cenex Pipeline, LLC | Laurel, Montana, to Fargo, North Dakota |
| Front Range Pipeline, LLC | Canadian border to Laurel, Montana |
| Jayhawk Pipeline, LLC | Throughout Kansas, with branches in Nebraska, Oklahoma and Texas |
| Conway Pipeline | McPherson, Kansas, to Conway, Kansas |
| Kaw Pipe Line Company | Locations throughout Kansas |
| Osage Pipe Line Company, LLC | Oklahoma to Kansas (50% owned by CHS McPherson Refinery Inc. ("CHS McPherson")) | Oklahoma to KansasCHS) |
| Convenience stores/gas stations | 36 locations in Minnesota, Montana, North Dakota, South Dakota and Wyoming, six of which are leased |
| Lubricant plants/warehouses | Inver Grove Heights, Minnesota; Kenton, Ohio; and Amarillo, Texas; the location in Inver Grove Heights is leased |
| Ag | |
| Global Grain Marketing | |
| Grain terminals | 18 locations in Illinois, Iowa, Louisiana, Minnesota, Wisconsin, Argentina, Brazil, Hungary, Romania and Ukraine |
| Fertilizer terminal | Argentina |
| Grain marketing offices | 3435 locations in Iowa, Minnesota, Nebraska, Argentina, Brazil, Bulgaria, Canada, China, Hungary, Italy, Jordan, Mexico, Paraguay, Romania, Serbia, Singapore, South Korea, Spain, Switzerland, Taiwan, Ukraine and Uruguay; all locations are leased other than the offices in Davenport, Iowa, and Winona, Minnesota, which we own |
| Country Operations | |
| Agri-operations facilities | Approximately 470487 community locations (of which some(some of the facilities are on leased land) located in Colorado, Idaho, Illinois, Iowa, Kansas, Michigan, Minnesota, Montana, Nebraska, North Dakota, Oklahoma, Oregon, South Dakota, Texas, Washington and Wisconsin |
| Feed manufacturing facilities | 8 locations in Montana, North Dakota, Oregon and South Dakota |
| Wholesale Agronomy | |
Deep waterDeep-water port | Galveston, Texas |
| Terminals | 1817 locations in Arkansas, Idaho, Illinois, Iowa, Kentucky, Louisiana, Minnesota, Mississippi, South Dakota, Tennessee and Texas; facilities in Little Rock, Arkansas; Owensboro, Kentucky; and Galveston, Texas, are on leased land |
| Bulk chemical rail terminal facility | Brooten, Minnesota |
|
| | | | |
| Description | Location(s) |
| Distribution warehouses | 3229 locations in Arkansas, Iowa, Idaho, Illinois, Iowa, Kansas, Michigan, Minnesota, Missouri, Montana, Nebraska, North Dakota, Nebraska, Oklahoma, South Dakota, Texas, Washington and Wisconsin; all facilities are leased except those in Willmar, Minnesota (two locations); Fargo and Minot, North Dakota; and Black River Falls, Wisconsin |
| Processing and Food Ingredients | |
| Oilseed facilities | Fairmont, Hallock Fairmont and Mankato, Minnesota |
| Sunflower processing plants | GrandinFargo and Fargo,Grandin, North Dakota |
| Storage and warehouse facilities | Hazel, Minnesota; Joliette, North Dakota; and a leased facility in Winkler, Canada |
| Renewable Fuels | |
| Ethanol plants | Annawan and Rochelle, and Annawan, Illinois |
| Corporate and Other | |
| Corporate headquarters | We lease a 24-acre campus in Inver Grove Heights, Minnesota, consisting of one building with approximately 320,000 square feet of office space and own an additional nine acres of land adjacent to the leased property on which we have two smaller buildings with approximately 13,400 and 9,000 square feet of space |
| Office facilities | Leased facilities in Eagan and St. Paul, Minnesota; Kansas City, Missouri; Huron, South Dakota; and Washington, D.C.District of Columbia |
| Agricultural land and related improvements | We own approximately 3,500179 acres of agricultural land and related improvements in central Michigan |
ITEM 3. LEGAL PROCEEDINGS
We are involved as a defendant in various lawsuits, claims and disputes, which are in the normal course of our business. The resolution of any such matters may affect consolidated net income for any fiscal period; however, our management believes any resulting liabilities, individually or in the aggregate, will not have a material effect on our consolidated financial position, results of operations or cash flows during any fiscal year.
ITEM 4. MINE SAFETY DISCLOSURES
Not applicable.
PART II
ITEM 5. MARKET FOR REGISTRANT'S COMMON EQUITY, RELATED STOCKHOLDER MATTERS AND ISSUER PURCHASES OF EQUITY SECURITIES
As a cooperative, we do not have common stock that is traded or otherwise. We have not sold any equity securities during the three years ended August 31, 2019,2020, that were not registered under the Securities Act of 1933.
ITEM 6. SELECTED FINANCIAL DATA
The following table sets forth our selected historical consolidated financial information for each of the five periods indicated. This information should be read in conjunction with Management's Discussion and Analysis of Financial Condition and Results of Operations in Item 7 of this Annual Report on Form 10-K and with our consolidated financial statements and notes thereto included elsewhere in this Annual Report on Form 10-K.
Our consolidated financial statements are prepared in U.S. dollars and in accordance with U.S. GAAP. The selected income statement data for the years ended August 31, 2020, 2019, 2018, 2017 and 2016, and balance sheet data as of August 31, 2020, 2019, 2018 and 2017, are derived from our audited consolidated financial statements and related notes. The selected income statement data for the year ended August 31, 2015, and balance sheet data as of August 31, 2016, and 2015, areis derived from unaudited consolidated financial information not included in this Annual Report on Form 10-K. Certain prior period amounts have been revised as follows:
Income statement data for the year ended August 31, 2015, and balanceBalance sheet data as of August 31, 2016, and 2015, werewas restated in our Annual Report on Form 10-K for the year ended August 31, 2018, to correct certain amounts that had been previously misstated.
For all periods presented, income statement information has been revised to reflect the impact of adopting Accounting Standards Update ("ASU") No. 2017-07, Compensation - Retirement Benefits (Topic 715): Improving the Presentation of Net Periodic Pension Costs and Net Postretirement Benefit Cost during fiscal 2019. As a result of the adoption of this ASU, the non-service cost components of net periodic benefit costs have been reclassified from cost of goods sold ("COGS") and marketing, general and administrative expenses to outside of operating income within other (income) loss. | | | | | | | | | | | | | | | | | | | | | | | | | | | | | |
| Selected Consolidated Financial Data |
| 2020 | | 2019 | | 2018 | | 2017 | | 2016 |
Income Statement Data
(years ended August 31): | (Dollars in thousands) |
| Revenues | $ | 28,406,365 | | | $ | 31,900,453 | | | $ | 32,683,347 | | | $ | 32,037,426 | | | $ | 30,355,260 | |
| Cost of goods sold | 27,424,558 | | | 30,516,120 | | | 31,591,227 | | | 31,143,549 | | | 29,383,459 | |
| Gross profit | 981,807 | | | 1,384,333 | | | 1,092,120 | | | 893,877 | | | 971,801 | |
| Operating earnings (loss) | 277,265 | | | 659,602 | | | 452,364 | | | (173,878) | | | 299,234 | |
| Income (loss) before income taxes | 386,878 | | | 815,601 | | | 671,230 | | | (110,166) | | | 402,125 | |
| Net income | 423,609 | | | 828,057 | | | 775,306 | | | 70,958 | | | 383,026 | |
| Net income (loss) attributable to noncontrolling interests | 1,170 | | | (1,823) | | | (601) | | | (634) | | | (223) | |
| Net income attributable to CHS Inc. | 422,439 | | | 829,880 | | | 775,907 | | | 71,592 | | | 383,249 | |
| | | | | | | | | |
| Balance Sheet Data (as of August 31): | | | | | | | | | |
| Working capital | $ | 1,346,506 | | | $ | 1,078,888 | | | $ | 759,034 | | | $ | 148,565 | | | $ | 338,446 | |
| Net property, plant and equipment | 4,957,938 | | | 5,088,708 | | | 5,141,719 | | | 5,356,434 | | | 5,488,323 | |
| Total assets | 15,993,947 | | | 16,447,494 | | | 16,381,178 | | | 15,818,922 | | | 17,149,639 | |
| Long-term debt, including current maturities | 1,791,123 | | | 1,789,111 | | | 1,930,255 | | | 2,179,793 | | | 2,297,205 | |
| Total equities | 8,819,173 | | | 8,617,530 | | | 8,165,028 | | | 7,705,640 | | | 7,759,157 | |
|
| | | | | | | | | | | | | | | | | | | |
| | Selected Consolidated Financial Data |
| | 2019 | | 2018 | | 2017 | | 2016 | | 2015 |
| Income Statement Data (for the years ended August 31): | (Dollars in thousands) |
| Revenues | $ | 31,900,453 |
| | $ | 32,683,347 |
| | $ | 32,037,426 |
| | $ | 30,355,260 |
| | $ | 34,517,452 |
|
| Cost of goods sold | 30,516,120 |
| | 31,591,227 |
| | 31,143,549 |
| | 29,383,459 |
| | 33,099,074 |
|
| Gross profit | 1,384,333 |
| | 1,092,120 |
| | 893,877 |
| | 971,801 |
| | 1,418,378 |
|
| Marketing, general and administrative expenses | 737,636 |
| | 677,465 |
| | 611,076 |
| | 597,531 |
| | 640,306 |
|
| Reserve and impairment charges (recoveries), net | (12,905 | ) | | (37,709 | ) | | 456,679 |
| | 75,036 |
| | 158,771 |
|
| Operating earnings (loss) | 659,602 |
| | 452,364 |
| | (173,878 | ) | | 299,234 |
| | 619,301 |
|
| (Gain) loss on disposal of business | (3,886 | ) | | (131,816 | ) | | 2,190 |
| | — |
| | — |
|
| Interest expense | 167,065 |
| | 149,202 |
| | 171,239 |
| | 113,704 |
| | 70,659 |
|
| Other (income) loss | (82,423 | ) | | (82,737 | ) | | (99,803 | ) | | (40,818 | ) | | (43,868 | ) |
| Equity (income) loss from investments | (236,755 | ) | | (153,515 | ) | | (137,338 | ) | | (175,777 | ) | | (107,850 | ) |
| Income (loss) before income taxes | 815,601 |
| | 671,230 |
| | (110,166 | ) | | 402,125 |
| | 700,360 |
|
| Income tax expense (benefit) | (12,456 | ) | | (104,076 | ) | | (181,124 | ) | | 19,099 |
| | (4,900 | ) |
| Net income (loss) | 828,057 |
| | 775,306 |
| | 70,958 |
| | 383,026 |
| | 705,260 |
|
| Net income (loss) attributable to noncontrolling interests | (1,823 | ) | | (601 | ) | | (634 | ) | | (223 | ) | | (816 | ) |
| Net income (loss) attributable to CHS Inc. | $ | 829,880 |
| | $ | 775,907 |
| | $ | 71,592 |
| | $ | 383,249 |
| | $ | 706,076 |
|
| Balance Sheet Data (as of August 31): | |
| | |
| | |
| | |
| | |
| Working capital | $ | 1,078,888 |
| | $ | 759,034 |
| | $ | 148,565 |
| | $ | 338,446 |
| | $ | 2,650,637 |
|
| Net property, plant and equipment | 5,088,708 |
| | 5,141,719 |
| | 5,356,434 |
| | 5,488,323 |
| | 5,192,927 |
|
| Total assets | 16,447,494 |
| | 16,381,178 |
| | 15,818,922 |
| | 17,149,639 |
| | 15,101,216 |
|
| Long-term debt, including current maturities | 1,789,111 |
| | 1,930,255 |
| | 2,179,793 |
| | 2,297,205 |
| | 1,478,930 |
|
| Total equities | 8,617,530 |
| | 8,165,028 |
| | 7,705,640 |
| | 7,759,157 |
| | 7,551,439 |
|
ITEM 7. MANAGEMENT'S DISCUSSION AND ANALYSIS OF FINANCIAL CONDITION AND RESULTS OF OPERATIONS
This Management's Discussion and Analysis of Financial Condition and Results of Operations ("MD&A") is intended to provide a reader of our financial statements with a narrative from the perspective of management on our financial condition and results of operations, liquidity and certain other factors that may affect our future results. Our MD&A is presented in the following sections:
•Overview
•Business Strategy
Fiscal 2019 Highlights
•Fiscal 2020 PrioritiesHighlights
•Fiscal 20202021 Outlook
•Operating Metrics
•Results of Operations
•Liquidity and Capital Resources
•Off-Balance Sheet Financing Arrangements
•Contractual Obligations
•Critical Accounting Policies and Estimates
Effect of Inflation and Foreign Currency Transactions
•Recent Accounting Pronouncements
Our MD&A should be read in conjunction with the accompanying audited financial statements and notes to those financial statements and the Cautionary Statement regarding forward-looking statements found in Part I, Item 1A of this Annual Report on Form 10-K.
Overview
CHS Inc. is a diversified company that provides grain, food, agronomy and energy resources to businesses and consumers on a global scale. As a cooperative, we are owned by farmers, ranchers and member cooperatives across the United States. We also have preferred shareholders thatwho own our five series of preferred stock, all of which are listed and traded on the Nasdaq Global Select Market.Market of The Nasdaq Stock Market LLC ("The Nasdaq"). We operate in the following three reportable segments:
•Energy. Produces and provides primarily for the wholesale distribution and transportation of petroleum products.
•Ag. Purchases and further processes or resells grains and oilseeds originated by our country operations business, by our member cooperatives and by third parties; also serves as a wholesaler and retailer of agronomy products.
•Nitrogen Production. Consists solely of our equity method investment in CF Industries Nitrogen, LLC ("CF Nitrogen"), and produces and distributes nitrogen fertilizer, a commodity chemical.
fertilizer.
In addition, our financing and hedging businesses, along with our non-consolidatednonconsolidated wheat milling and food production and distribution joint ventures, have been aggregated within Corporate and Other. Prior to its sale on May 4, 2018, our insurance operations were also included within Corporate and Other.
The consolidated financial statements include the accounts of CHS and all subsidiaries and limited liability companies in which we have a controlling interest. The effects of all significant intercompany transactions have been eliminated.
Corporate administrative expenses and interest are allocated to each reporting segment, along with Corporate and Other, based on direct usage foruse of services, such as information technology and legal, and other factors or considerations relevant to the costs incurred.
Management's Focus. When evaluating our operating performance, management focuses on gross profit and income (loss) before income taxes ("IBIT"). As a company that operates heavily in global commodities, there is significant unpredictability and volatility in pricing, costs and global trade volumes. Consequently, we focus on managing the margin we can earn and the resulting income before income taxes.IBIT. Management also focuses on ensuring the strength of the balance sheet strength through appropriate management of financial liquidity, leverage, capital allocation and cash flow optimization.
Seasonality. Many of our business activities are highly seasonal and our operating results vary throughout the year. Our revenues and income generally trend lower during the second and fourth fiscal quarters and higher during the first and third fiscal quarters; however, our IBIT does not necessarily follow the same trend due to weather orand other events maythat can impact this trend, particularly for IBIT.profitability. For example, in our Ag segment, our country operations business generally experiences higher volumes and income during the fall harvest and spring
planting seasons, which generally correspond to our first and third fiscal quarters,
respectively. Additionally, our agronomy business generally experiences higher volumes and income during the spring planting season. Our global grain marketing operations are subject to fluctuations in volume and earningsincome based on producer harvests, world grain prices, demand and global trade volumes. Our Energy segment generally experiences higher volumes and profitability in certain operating areas, such as refined products, in the spring, summer and early fall when gasoline and diesel fuel usageuse by our agricultural producers is highest and is subject to global supply and demand forces. Other energy products, such as propane, generally experience higher volumes and profitability during the winter heating and fall crop-drying seasons. The graphs below depict the seasonality inherent in our business, particularly revenue trends that are not impacted as significantly by other events.businesses.
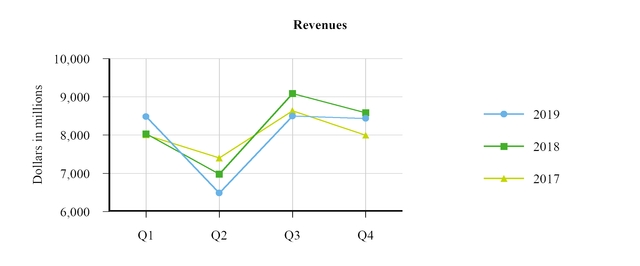
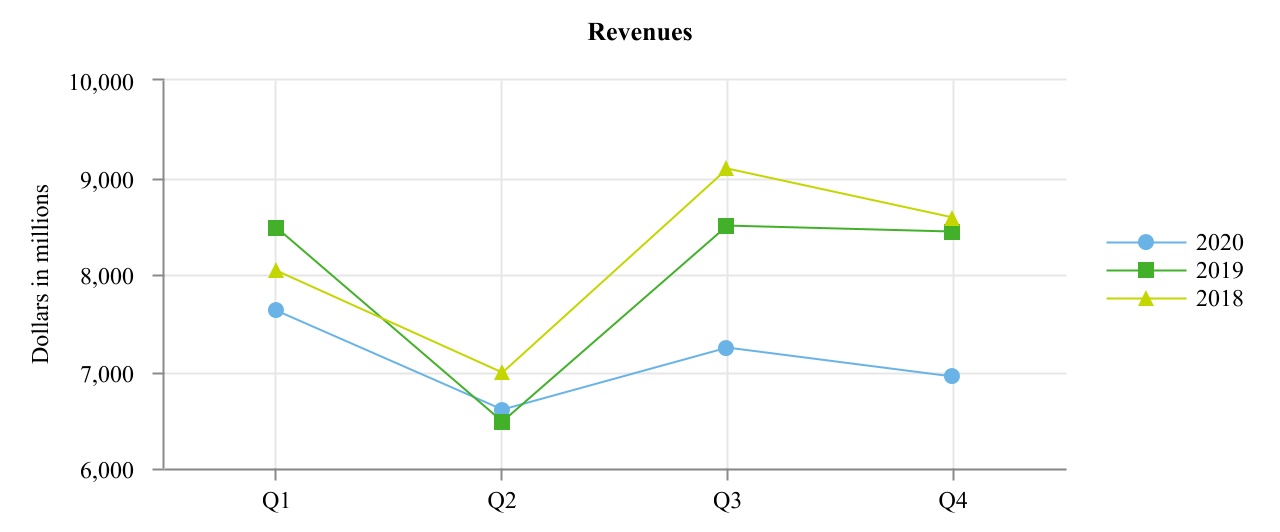
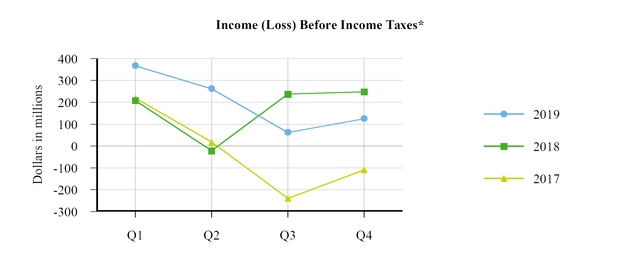
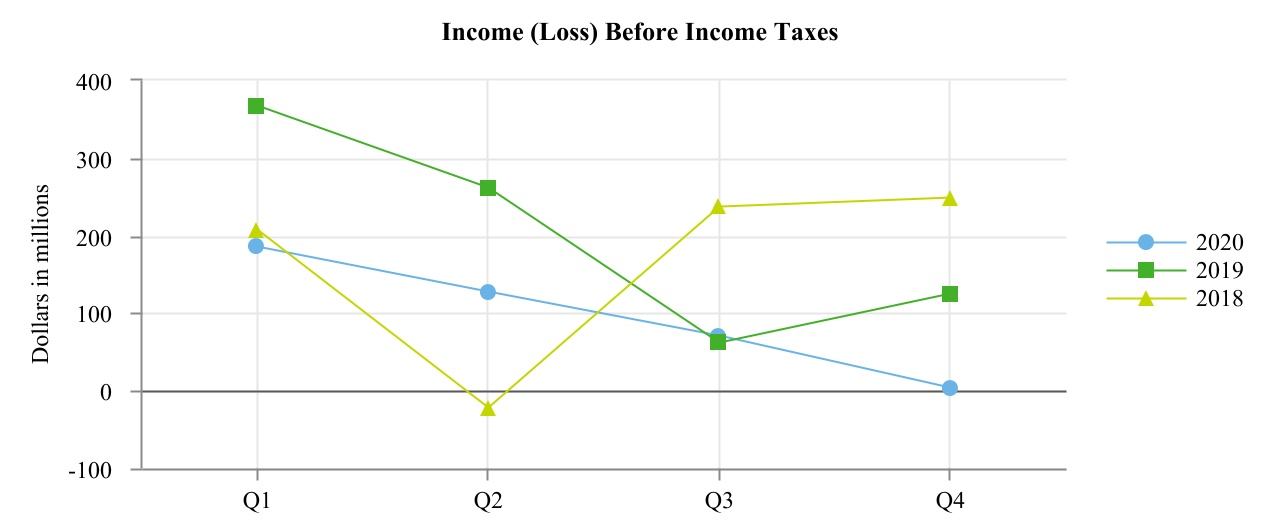
* Income (loss) before income taxes experienced deviations from historical trends during fiscal 2017 through fiscal 2019 as a result of material charges incurred, gains on sales of non-core assets and a combination of factors described in the Fiscal 2019 Highlights and the Results of Operations sections below.
Pricing and Volumes. Our revenues, assets and cash flows can be significantly affected by global market prices and sales volumes of commodities such as petroleum products, natural gas, grains, oilseed products and agronomy products. Changes in market prices for commodities we purchase without a corresponding change in the selling prices of those products can affect revenues and operating earnings. Similarly, increased or decreased sales volumes without a corresponding change in the purchase and selling prices of those products can affect revenues and operating earnings. Commodity prices and sales volumes are affected by a wide range of factors beyond our control, including weather, crop damage due to plant disease or insects, drought, availability/adequacy of supply of the relateda commodity, availability of a reliable rail and river transportation network, outbreaks of disease, government regulations/policies, world events, global trade disputes and general political/economic conditions.
Business Strategy
Our business strategies focus on an enterprise-wideenterprisewide effort to create an experience that empowers customers to make CHS their first choice, expands market access to add value for our owners, and transforms and evolves our core businesses by
capitalizing on changing market dynamics. To execute uponon these strategies, we are focused on the implementation and use ofimplementing agile, efficient and sustainable new technology platforms; building robust and efficient supply chains; hiring, developing and retaining high-performing, diverse and passionate teams; achieving operational excellence and continuous improvement; and maintaining a strong balance sheet.
Fiscal 20192020 Highlights
Margins were higher in our Energy segment•Improved weather conditions during the spring planting season compared to the prior year'syear drove increased earnings across much of our Ag segment during the second half of fiscal 2020.
•Strong supply chain performance in our propane business driven by efficiently sourcing propane for our customers during a period of significant propane demand for crop drying and home heating positively contributed to our results, dueparticularly in the first half of fiscal 2020.
•Less advantageous market conditions in our refined fuels business, driven primarily by the COVID-19 pandemic and other factors, resulted in volume and price declines that significantly reduced earnings compared to favorable pricing of heavy Canadian crude oil, which is processed bythe prior year.
•Poor weather conditions during fiscal 2019 negatively impacted our refineries, experienced primarilyAg segment's operations during the first half of fiscal 2019.
We continued to experience significant pressure on2020, including lower crop yields and poor grain volume and margins due to slow movement of grainquality following a late harvest, as well as lower crop nutrient sales that has resulted from unresolved trade issues between the United States and its trading partners.
Poor weather conditions, including heavy snowtraditionally occur during the spring and significant rainfall during the summer of 2019 negatively impacted our Ag segment operations. Severe flooding resulting from the heavy snow and rainfall contributed to railroad delays and prevented or delayed planting, which resulted in increased costs, reduced volumes and fewer planted acres. Further, navigable waterways experienced high, swift water conditions that impeded barge traffic, severely affecting our ability to economically supply fertilizer and grains to their associated buyers.fall.
Through various efforts and mechanisms, we recovered a net $12.9 million of previously recorded reserve and impairment charges. This consisted of recoveries of approximately $109.4 million in fiscal 2019, partially offset by additional reserves and impairment charges of $96.5 million as more fully described in Results of Operations.
Manufacturing changes within our Energy business have allowed us to benefit from certain federal excise tax credits. Following the resolution of the underlying gain contingencies associated with tax credits during fiscal 2019, a gain of $80.8 million was recognized as a reduction of COGS in our Consolidated Statements of Operations. We are uncertain whether similar gains may reoccur in the future.
On March 1, 2019, we completed the acquisition of the remaining 75% ownership interest in West Central Distribution, LLC ("WCD"), a full-service wholesale distributor of agronomy products that was not previously owned by us.
Earnings from our equity method investments in CF Nitrogen and Ventura Foods remained strong compared to the prior year.
•As more fully described in Item 9A, Controls and Procedures, of this Annual Report on Form 10-K, we continued dedicating significant internal and external resources, as well as management and Board focus, on improving our internal control environment resulting in remediation of threethe last remaining material weaknesses identified in our fiscal 2018 Annual Report on Form 10-K.
•We responded to the COVID-19 pandemic by implementing remote working arrangements for approximately half our global employees, increasing hygiene and infection control processes at all our facilities, increasing use of personal protective equipment and developing risk mitigation and exposure policies applicable to our enterprise. The costs of these activities have not been and are not expected to be material in future periods. In addition, our operations were deemed to be essential infrastructure industries by federal and state governments, which allowed us to continue operating all our facilities and operations.
Fiscal 2020 Priorities
Identify and execute on opportunities to deliver sustainable cost savings across the enterprise.
Successfully achieve milestones for implementation of our new ERP system to drive efficiency and growth.
Manage and leverage information to enable business growth and drive competitive advantage through data-driven decisions and insight.
Continue to strengthen and improve our internal control environment with an emphasis on operational excellence and continuous improvement.
Fiscal 20202021 Outlook
Our Energy and Ag segments operate in cyclical environments. environments in which unforeseen market conditions can have a significant positive or negative impact. As with virtually all other companies in the United States, we are dealing with the effects of COVID-19. In fiscal 2021, we will focus on navigating COVID-19 to ensure the well-being of our people and business, including a detailed plan to return safely from remote work. Most of our operations are considered to be essential; however, periods of depressed demand and pricing within the U.S. ethanol production, refined fuels or other industries in which we operate could result in decreased profitability and the need to assess certain assets for potential impairments.
The energy industry experienced favorablesignificant volume and price swings as a result of the COVID-19 pandemic in fiscal 2020 that will likely continue to negatively impact profitability in fiscal 2021. We are unable to predict how long the current environment will last or the severity of the financial and operational impacts; however, we expect the uncertain and volatile market conditions during the first half of fiscal 2019 that led to higher margins and improved earnings in fiscal 2019; however, the favorable conditions returned to lower, more normalized levels during the second half of fiscal 2019. Although unforeseen market conditions could positively or negatively impact the energy industry we expect the normalized market conditions experienced by our Energy segment during the second half ofto continue into fiscal 20192021, which will continue to remain throughout fiscal 2020. put pressure on associated asset valuations.
The agricultural industry continues to operate in a challenging environment that has been characterized by generally lower margins, reduced liquidity and increased leverage that have resulted from a period of reduced commodity prices. In addition,More favorable weather conditions during the fiscal 2020 spring planting season and the beginning of the fiscal 2021 harvest season compared to the prior year could provide an opportunity for increased volumes and improved earnings across much of our Ag segment during fiscal 2021. However, trade relations between the United States and foreign trade partners, particularly those that purchase large quantities of agricultural commodities, while improving, are strained, resultingstill not normalized, which could continue to result in unpredictable impacts to agricultural commodity prices and volumes sold within the agricultural industry.as we move into fiscal 2021. We are unable to predict how long the current environment will last or how severe the effects will ultimately be.be on our pricing and volumes. In addition to global supply and demand impacts, regional factors includingsuch as unpredictable weather conditions could continue to impact our operations. As a result,Although we expect improved revenues, margins and cash flows from our core operations in our Ag segment, additional or continued challenges experienced in the agricultural market are expected to continue to be under pressure during fiscal 2020, which will put pressure on the associated asset valuations.valuations during fiscal 2021.
In addition to market conditions that impact our businesses, we continue to identify opportunities to sustainably reduce costs and improve cash management strategies to protect our financial health while continuing to deliver on our enterprise resource planning ("ERP") system implementation and advance toward our targeted operating model. Implementation of our ERP system is expected to occur in phases over the next several years and will require continued significant capital investment.
Results of Operations
Consolidated Statements of Operations
|
| | | | | | | | | | | | | |
| | For the Years Ended August 31, |
| | 2019 | | 2018 |
| | Dollars | | % of Revenues* | | Dollars | | % of Revenues* |
| | (In thousands) | | | | (In thousands) | | |
| Revenues | $ | 31,900,453 |
| | 100.0 | % | | $ | 32,683,347 |
| | 100.0 | % |
| Cost of goods sold | 30,516,120 |
| | 95.7 |
| | 31,591,227 |
| | 96.7 |
|
| Gross profit | 1,384,333 |
| | 4.3 |
| | 1,092,120 |
| | 3.3 |
|
| Marketing, general and administrative expenses | 737,636 |
| | 2.3 |
| | 677,465 |
| | 2.1 |
|
| Reserve and impairment charges (recoveries), net | (12,905 | ) | | — |
| | (37,709 | ) | | (0.1 | ) |
| Operating earnings (loss) | 659,602 |
| | 2.1 |
| | 452,364 |
| | 1.4 |
|
| (Gain) loss on disposal of business | (3,886 | ) | | — |
| | (131,816 | ) | | (0.4 | ) |
| Interest expense | 167,065 |
| | 0.5 |
| | 149,202 |
| | 0.5 |
|
| Other (income) loss | (82,423 | ) | | (0.3 | ) | | (82,737 | ) | | (0.3 | ) |
| Equity (income) loss from investments | (236,755 | ) | | (0.7 | ) | | (153,515 | ) | | (0.5 | ) |
| Income (loss) before income taxes | 815,601 |
| | 2.6 |
| | 671,230 |
| | 2.1 |
|
| Income tax expense (benefit) | (12,456 | ) | | — |
| | (104,076 | ) | | (0.3 | ) |
| Net income (loss) | 828,057 |
| | 2.6 |
| | 775,306 |
| | 2.4 |
|
| Net income (loss) attributable to noncontrolling interests | (1,823 | ) | | — |
| | (601 | ) | | — |
|
| Net income (loss) attributable to CHS Inc. | $ | 829,880 |
| | 2.6 | % | | $ | 775,907 |
| | 2.4 | % |
*Amounts less than 0.1% are shown as zero percent.
The charts below detail revenues, net of intersegment revenues, and IBIT by reportable segment for fiscal 2019. Our Nitrogen Production reportable segment represents an equity method investment that records earnings and allocated expenses, but not revenue.
Energy Segment Operating Metrics
Energy
Our Energy segment operations primarily include our Laurel, Montana, and McPherson, Kansas, refineries, which process crude oil to produce refined products, including gasoline, distillates and other products. The following tables providetable provides information about our consolidated refinery operations.
| | | | | | | | | | | |
| Years Ended August 31, |
| 2020 | | 2019 |
| Refinery throughput volumes | (Barrels per day) |
| Heavy, high-sulfur crude oil | 92,298 | | | 92,047 | |
| All other crude oil | 70,255 | | | 58,366 | |
| Other feedstocks and blendstocks | 13,179 | | | 10,724 | |
| Total refinery throughput volumes | 175,732 | | | 161,137 | |
| Refined fuel yields | | | |
| Gasolines | 86,615 | | | 76,563 | |
| Distillates | 71,410 | | | 66,661 | |
|
| | | | | |
| | For the Years Ended August 31, |
| | 2019 | | 2018 |
| Refinery throughput volumes | (Barrels per day) |
| Heavy, high-sulfur crude oil | 92,047 |
| | 84,339 |
|
| All other crude oil | 58,366 |
| | 66,785 |
|
| Other feedstocks and blendstocks | 10,724 |
| | 17,713 |
|
| Total refinery throughput volumes | 161,137 |
| | 168,837 |
|
| Refined fuel yields | | | |
| Gasolines | 76,563 |
| | 86,115 |
|
| Distillates | 66,661 |
| | 65,060 |
|
We are subject to the Renewable Fuels Standard, ("RFS"), which requires refiners to blend renewable fuels (e.g., ethanol, biodiesel) into their finished transportation fuels or purchase renewable energy credits, known as Renewable Identification Numbers ("RINs"), in lieu of blending. The U.S. Environmental Protection Agency generally establishes new annual renewable fuel percentage standards for each compliance year in the preceding year. We generate RINs under the RFS in our renewable fuels operations and through our blending activities, at our terminals, but we cannot generate enough RINs to meet the needs of our refining capacity and RINs must be purchased on the open market. The price of RINs can be volatile and can impact profitability.
In addition to our internal operational reliability, the profitability of our Energy segment is largely driven by crack spreads (i.e., the price differential between refined products and inputs such as crude oil) and Western Canadian Select ("WCS") crude oil differentials (i.e., the price differential between West Texas Intermediate ("WTI") crude oil and WCS crude oil), which are driven by the supply and demand of refined product markets. Crack spreads remained relatively stableand WCS crude oil differentials decreased significantly during fiscal 20192020 compared to the prior fiscal year; however, WCS crude oil differentials improved during fiscal 2019 compared to the prior fiscal year, specifically during the first half of fiscal 2019.year. The table below provides information about the average market reference prices and differentials that impact our Energy segment.
| | | | For the Years Ended August 31, | | Years Ended August 31, |
| | 2019 | | 2018 | | 2020 | | 2019 |
| Market indicators | | Market indicators | | | |
| WTI crude oil (dollars per barrel) | $58.59 | | $62.23 | WTI crude oil (dollars per barrel) | $ | 44.45 | | | $ | 58.59 | |
| WTI - WCS crude oil differential (dollars per barrel) | $20.23 | | $17.92 | WTI - WCS crude oil differential (dollars per barrel) | $ | 14.31 | | | $ | 20.23 | |
| Group 3 2:1:1 crack spread (dollars per barrel)* | $18.74 | | $19.08 | Group 3 2:1:1 crack spread (dollars per barrel)* | $ | 12.36 | | | $ | 18.74 | |
| Group 3 5:3:2 crack spread (dollars per barrel)* | $17.67 | | $18.46 | Group 3 5:3:2 crack spread (dollars per barrel)* | $ | 11.60 | | | $ | 17.67 | |
| D6 ethanol RIN (dollars per RIN) | $0.1713 | | $0.5280 | D6 ethanol RIN (dollars per RIN) | $ | 0.2903 | | | $ | 0.1713 | |
| D4 ethanol RIN (dollars per RIN) | $0.4273 | | $0.7221 | D4 ethanol RIN (dollars per RIN) | $ | 0.5344 | | | $ | 0.4273 | |
*Group 3 refers to the oil refining and distribution system serving the Midwest markets from the Gulf Coast through the Plains states.
Ag
Our Ag segment operations work together to facilitate the production, purchase, sale and eventual use of grain and other agricultural commodities within the United States, as well as internationally. Profitability in our Ag segment is largely driven by throughput and production volumes, as well as commodity price spreads; however, revenues and cost of goods sold ("COGS") are largely affected by market-driven commodity prices that are outside our control. The table below provides information about average market prices for agricultural commodities and our sales/throughput volumes that impacted our Ag segment for the years ended August 31, 2020 and 2019.
| | | | | | | | | | | | | | | | | |
| | | Years Ended August 31, |
| Market Source* | | 2020 | | 2019 |
| Commodity prices | | | | | |
| Corn (dollars per bushel) | Chicago Board of Trade | | $3.55 | | $3.76 |
| Soybeans (dollars per bushel) | Chicago Board of Trade | | $8.92 | | $8.75 |
| Wheat (dollars per bushel) | Chicago Board of Trade | | $5.32 | | $5.47 |
| Urea (dollars per ton) | Green Markets NOLA | | $226.00 | | $265.00 |
| Urea Ammonium Nitrate ("UAN") (dollars per ton) | Green Markets NOLA | | $137.60 | | $182.72 |
| Ethanol (dollars per gallon) | Chicago Platts | | $1.30 | | $1.34 |
| | | | | |
| Volumes | | | | | |
| Grain and oilseed (thousands of bushels) | | 2,531,023 | | | 2,636,084 | |
| North American grain and oilseed port throughput (thousands of bushels) | | 564,563 | | | 581,175 | |
| Wholesale crop nutrients (thousands of tons) | | 7,561 | | | 6,931 | |
| Ethanol (thousands of gallons) | | 846,159 | | | 935,115 | |
*Market source information represents the average month-end price during the period.
Results of Operations
Consolidated Statements of Operations
| | | | | | | | | | | | | | | | | | | | | | | |
| Years Ended August 31, |
| 2020 | | 2019 |
| Dollars | | % of Revenues* | | Dollars | | % of Revenues* |
| (In thousands) | | | | (In thousands) | | |
| Revenues | $ | 28,406,365 | | | 100.0 | % | | $ | 31,900,453 | | | 100.0 | % |
| Cost of goods sold | 27,424,558 | | | 96.5 | | | 30,516,120 | | | 95.7 | |
| Gross profit | 981,807 | | | 3.5 | | | 1,384,333 | | | 4.3 | |
| Marketing, general and administrative expenses | 704,542 | | | 2.5 | | | 724,731 | | | 2.3 | |
| Operating earnings | 277,265 | | | 1.0 | | | 659,602 | | | 2.1 | |
| Gain on disposal of business | (1,450) | | | — | | | (3,886) | | | — | |
| Interest expense | 116,977 | | | 0.4 | | | 167,065 | | | 0.5 | |
| Other income | (38,425) | | | (0.1) | | | (82,423) | | | (0.3) | |
| Equity income from investments | (186,715) | | | (0.7) | | | (236,755) | | | (0.7) | |
| Income before income taxes | 386,878 | | | 1.4 | | | 815,601 | | | 2.6 | |
| Income tax benefit | (36,731) | | | (0.1) | | | (12,456) | | | — | |
| Net income | 423,609 | | | 1.5 | | | 828,057 | | | 2.6 | |
| Net income (loss) attributable to noncontrolling interests | 1,170 | | | — | | | (1,823) | | | — | |
| Net income attributable to CHS Inc. | $ | 422,439 | | | 1.5 | % | | $ | 829,880 | | | 2.6 | % |
*Amounts less than 0.1% are shown as zero percent. Percentage subtotals may differ due to rounding.
The charts below detail revenues, net of intersegment revenues, and IBIT by reportable segment for fiscal 2020. Our Nitrogen Production reportable segment represents an equity method investment that records earnings and allocated expenses, but not revenues.
Income (Loss) Before Income Taxes by Segment
Energy
| | | | | | | | | | | | | | | | | | | | | | | |
| Years Ended August 31, | | Change |
| 2020 | | 2019 | | Dollars | | Percent |
| | (Dollars in thousands) | | | | |
| Income before income taxes | $ | 225,317 | | | $ | 618,188 | | | $ | (392,871) | | | (63.6) | % |
|
| | | | | | | | | | | | | | |
| | For the Years Ended August 31, | | Change |
| | 2019 | | 2018 | | Dollars | | Percent |
| | (Dollars in thousands) | | | | |
| Income (loss) before income taxes | $ | 618,188 |
| | $ | 452,108 |
| | $ | 166,080 |
| | 36.7 | % |
The following tablewaterfall analysis and commentary present the primary reasons forpresents changes in IBIT for our Energy segment IBIT for the year ended August 31, 2019,2020, compared to the prior year:year.
|
| | | | |
| | | 2019 vs. 2018 |
| | | (Dollars in thousands) |
| Volume | | $ | (10,369 | ) |
| Price | | 298,979 |
|
| Transportation, retail and other | | (30,976 | ) |
Non-gross profit related activity+ | | (91,554 | ) |
| Total change in Energy IBIT | | $ | 166,080 |
|
+*See commentary related to these changes in the marketing, general and administrative expenses, reserve and impairment charges (recoveries), net, (gain) loss on disposal of business, interest expense, other income (loss) and equity (income) lossincome from investments sections of this Results of Operations.
The $166.1 million increasechange in Energy segment IBIT for fiscal 20192020 reflects the following:
Improved•Significantly less advantageous market conditions in our refined fuels business primarilycompared to the prior year drove lower margins and volumes. These market conditions were driven by favorable pricingthe negative demand shock associated with COVID-19that resulted in a combination of decreased WCS crude oil differentials experienced on heavy Canadian crude oil, which is processed by our refineries. Favorable crude oil pricing, as well as hedging gainsrefineries, and decreased renewable energy credit costs during fiscal 2019, contributed to a $215.7crack spreads.
•An $80.8 million IBIT increase.
Manufacturing changes within our Energy business have allowed us to benefit fromgain recognized that was associated with certain federal excise tax credits. Following resolution of the underlying gain contingencies associated with the tax credits during fiscal 2019, a gain of $80.8 million was recognized as a reduction of COGS in our Consolidated Statements of Operations.during fiscal 2019 that did not reoccur during fiscal 2020.
•The increaseddecreased IBIT resulting from improved market conditionsdue to lower margins and volumes in our refined fuels business was partially offset by increased propane volumes and improved propane margins due to unrealized hedging gains, increased fixed-price contracts and significant demand for crop drying and home heating, particularly during the turnaround at our McPherson refinery during April and May 2019. The decreased IBIT related to the McPherson refinery turnaroundfirst quarter of fiscal 2020.
•A lower of cost or market charge of $42.0 million was partially offset by increased IBIT at our Laurel refinery following a turnaround during May 2018 that did not reoccur during fiscal 2019.
Increases to IBIT were also partially offset by gains totaling $65.9 million recorded in other income in connection withCOGS to reduce the salecarrying value of certain assets during fiscal 2018, includingour energy inventories to their market value as of May 31, 2020. Based upon market prices observed as of August 31, 2020, the salelower of 34 Zip Trip stores located in the Pacific Northwest and salecost or market reserve was decreased by approximately $34.0 million as prices improved while inventories were sold.
Ag
| | | | | | | | | | | | | | | | | | | | | | | |
| Years Ended August 31, | | Change |
| 2020 | | 2019 | | Dollars | | Percent |
| | (Dollars in thousands) | | | | |
| Income before income taxes | $ | 53,724 | | | $ | 43,016 | | | $ | 10,708 | | | 24.9 | % |
|
| | | | | | | | | | | | | | |
| | For the Years Ended August 31, | | Change |
| | 2019 | | 2018 | | Dollars | | Percent |
| | (Dollars in thousands) | | | | |
| Income (loss) before income taxes | $ | 43,016 |
| | $ | 74,258 |
| | $ | (31,242 | ) | | (42.1 | )% |
The following tablewaterfall analysis and commentary present the primary reasons forpresents changes in IBIT for our Ag segment IBIT for the year ended August 31, 2019,2020, compared to the prior year:year.
|
| | | | |
| | | 2019 vs. 2018 |
| | | (Dollars in thousands) |
| Volume | | $ | 59,344 |
|
| Price | | (31,648 | ) |
Non-gross profit related activity+ | | (58,938 | ) |
| Total change in Ag IBIT | | $ | (31,242 | ) |
+*See commentary related to these changes in the marketing, general and administrative expenses, reserve and impairment charges (recoveries), net, (gain) loss on disposal of business, interest expense, other income (loss) and equity (income) lossincome from investments sections of this Results of Operations.
The $31.2 million decreasechange in Ag segment IBIT for fiscal 20192020 reflects the following:
A•Improved margins across certain Ag segment businesses, including feed and farm supplies, grain and oilseed and renewable fuels resulted from a combination of higher non-gross-profit-related expenses contributed to a $58.9 million IBIT decrease, primarily related to increased reserve and impairment charges in connection with certain loan loss reserves associated with the challenging agricultural environment in our country operations business, including the impact of an out-of-period adjustment recorded during the period increasing reserve and impairment charges (recoveries), net by $25.5 million. Decreased interest income and increased interest expense also contributed to the IBIT decrease; however, the impacts of these changes were mostly offset by a $19.1 million gain recognized in connection with our acquisition of the remaining 75% ownership interest in WCD that we did not previously own during fiscal 2019.
Poor weather conditions, including heavy snow during the spring and heavy rainfall during the summer of 2019 in the agricultural regions ofoptimism for improved trade relations between the United States and continuingforeign trade partners and favorable weather conditions for spring planting during the year ended August 31, 2020. These improved margins were partially offset by reduced margins related to agronomy products due to oversupply in the market and processing and food ingredients, which experienced decreased margins as a result of the COVID-19 pandemic.
•Decreased volumes across much of the Ag segment were due to the impacts of poor weather conditions in fiscal 2019 that led to a smaller harvest in fiscal 2020, impacts of the COVID-19 pandemic on our processing and food ingredients business and global trade tensions between the United States and foreign trading partners, resultedparticularly during the first half of fiscal 2020. These volume decreases were partially offset by increased volumes associated with agronomy products that were primarily attributable to our acquisition of the remaining 75% ownership interest in generallyWest Central Distribution, LLC ("WCD"), that we did not previously own on March 1, 2019, the results of which were not included in the entire comparable period of the prior year.
All Other Segments
| | | | | | | | | | | | | | | | | | | | | | | |
| Years Ended August 31, | | Change |
| 2020 | | 2019 | | Dollars | | Percent |
| | (Dollars in thousands) | | | | |
| Nitrogen Production IBIT* | $ | 51,837 | | | $ | 72,870 | | | $ | (21,033) | | | (28.9) | % |
| Corporate and Other IBIT | $ | 56,000 | | | $ | 81,527 | | | $ | (25,527) | | | (31.3) | % |
*See Note 6, Investments, of the notes to the consolidated financial statements that are included in this Annual Report on Form 10-K for additional information.
Our Nitrogen Production segment IBIT decreased marginsas a result of lower equity method income attributed to reduced sale prices of urea and UAN, which are produced and sold by CF Nitrogen. Corporate and Other IBIT decreased primarily as a result of lower earnings from our investment in Ventura Foods, LLC ("Ventura Foods"), which experienced a significant reduction in demand due to COVID-19, and decreased or flat volumes across mostincome from our financing business due to lower interest rates during the year ended August 31, 2020, compared to the year ended August 31, 2019.
Revenues by Segment
Energy
| | | | | | | | | | | | | | | | | | | | | | | |
| Years Ended August 31, | | Change |
| 2020 | | 2019 | | Dollars | | Percent |
| | (Dollars in thousands) | | | | |
| Revenues | $ | 5,431,134 | | | $ | 7,119,076 | | | $ | (1,687,942) | | | (23.7) | % |
The following waterfall analysis and commentary presents changes in our AgEnergy segment during fiscal 2019.revenues for the year ended August 31, 2020, compared to the prior year.
The decreased IBITchange in Energy segment revenues for fiscal 2020 reflects the following:
•Decreased selling prices for refined fuels and propane were driven by global market conditions, including the impact of the demand shocks occurring during the COVID-19 pandemic, as well as product mix, which contributed to $1.3 billion and $135.5 million decreases in revenues, respectively.
•A 4% decrease of refined fuels volumes contributed to a $235.7 million decrease in revenues, which was partially offset by a 3% increase of propane volumes that contributed to a $22.6 million increase in revenues. Decreased volumes of refined fuels were attributable primarily to lower demand resulting from demand shock in the transportation sector that followed the COVID-19 pandemic and during the fall 2019 harvest as a result of poor weather conditions and a smaller crop across much of the agricultural region of the United States in which we operate. Increased volumes of propane resulted from significant propane demand for crop drying and home heating, particularly during the first half of fiscal 2020.
Ag
| | | | | | | | | | | | | | | | | | | | | | | |
| Years Ended August 31, | | Change |
| 2020 | | 2019 | | Dollars | | Percent |
| | (Dollars in thousands) | | | | |
| Revenues | $ | 22,926,099 | | | $ | 24,720,072 | | | $ | (1,793,973) | | | (7.3) | % |
The following waterfall analysis and commentary presents changes in our Ag segment wasrevenues for the year ended August 31, 2020, compared to the prior year.
The change in Ag segment revenues for fiscal 2020 reflects the following:
•Lower grain and oilseed and feed and farm supply volumes contributed to $671.6 million and $629.3 million decreases in revenues, respectively. These decreases resulted from poor spring weather conditions during fiscal 2019 that led to lower crop yields and fewer acres harvested during fall of fiscal 2020 and the impact of global trade tensions between the United States and foreign trading partners, particularly during the first half of fiscal 2020.
•Lower renewable fuels and processing and food ingredients volumes contributed to $119.5 million and $117.3 million decreases in revenues, respectively. These decreases resulted from reduced demand for renewable fuels and processing and food ingredient products as a result of the COVID-19 pandemic.
•The volume decreases were partially offset by increased rebates and increased volumes associated with certain agronomy products which was attributabledue to a $12.9 millionheightened spring 2020 demand and the increase of IBITin revenues that resulted from the March 1, 2019, acquisition of the remaining 75% ownership interest in WCD that we did not previously own, the results of which were not included in the entire comparable period of the prior fiscal year.
•Decreased pricing driven by global market conditions and product mix contributed to $584.7 million and $578.6 million decreases in revenues for agronomy and grain and oilseed, respectively. However, these price decreases were partially offset by market-driven price increases for other products, including feed and farm supplies, that increased revenues by $433.7 million.
All Other SegmentsSegments*
|
| | | | | | | | | | | | | | |
| | For the Years Ended August 31, | | Change |
| | 2019 | | 2018 | | Dollars | | Percent |
| | (Dollars in thousands) | | | | |
| Nitrogen Production IBIT* | $ | 72,870 |
| | $ | 38,838 |
| | $ | 34,032 |
| | 87.6 | % |
| Corporate and Other IBIT | $ | 81,527 |
| | $ | 106,026 |
| | $ | (24,499 | ) | | (23.1 | )% |
| | | | | | | | | | | | | | | | | | | | | | | |
| Years Ended August 31, | | Change |
| 2020 | | 2019 | | Dollars | | Percent |
| | (Dollars in thousands) | | | | |
| | | | | | | |
| | | | | | | |
| Corporate and Other revenues | $ | 49,132 | | | $ | 61,305 | | | $ | (12,173) | | | (19.9) | % |
*See Note 5, Investments, of the notes to the consolidated financial statements that are included in this Annual Report on Form 10-K for additional information.
Our Nitrogen Production reportable segment IBIT increased as a result of significantly higherrepresents an equity method income throughout fiscal 2019 attributed to increased sale prices of ureainvestment that records earnings and UAN, which are produced and sold by CF Nitrogen. allocated expenses, but not revenues.
Corporate and Other IBITrevenues decreased during the year ended August 31, 2020, compared to the year ended August 31, 2019, primarily due to lower revenues in our financing business due to market-driven interest rate reductions.
Cost of Goods Sold by Segment
Energy
| | | | | | | | | | | | | | | | | | | | | | | |
| Years Ended August 31, | | Change |
| 2020 | | 2019 | | Dollars | | Percent |
| | (Dollars in thousands) | | | | |
| Cost of goods sold | $ | 5,002,597 | | | $ | 6,303,323 | | | $ | (1,300,726) | | | (20.6) | % |
The following waterfall analysis and commentary presents changes in our Energy segment COGS for the year ended August 31, 2020, compared to the prior year.
The change in Energy segment COGS for fiscal 2020 reflects the following:
•Decreased costs and a 4% volume decrease for refined fuels driven by global market conditions, including the demand shock in the transportation sector that followed the COVID-19 pandemic and product mix, which contributed to decreases in COGS of $914.6 million and $207.6 million, respectively.
•Decreased costs for propane driven by global market conditions and unrealized hedging gains contributed to a $249.8 million decrease in COGS. The decreased costs were partially offset by a 3% volume increase that contributed to a $21.6 million increase in COGS, which was driven by significant propane demand for crop drying and home heating during the first half of fiscal 2020 during a period of poor weather conditions.
•The cost decrease was partially offset by the recognition of an $80.8 million gain associated with certain federal excise tax credits as a resultreduction of a $58.2 million gain in Corporate and Other associated withCOGS during the salesecond quarter of CHS Insurance during fiscal 20182019 that did not reoccur during fiscal 2019. That gain was partially offset by higher earnings from our investment in Ventura Foods and from our financing business.2020.
Revenues by Segment
Energy
|
| | | | | | | | | | | | | | |
| | For the Years Ended August 31, | | Change |
| | 2019 | | 2018 | | Dollars | | Percent |
| | (Dollars in thousands) | | | | |
| Revenues | $ | 7,119,076 |
| | $ | 7,589,119 |
| | $ | (470,043 | ) | | (6.2 | )% |
| | | | | | | | | | | | | | | | | | | | | | | |
| Years Ended August 31, | | Change |
| 2020 | | 2019 | | Dollars | | Percent |
| | (Dollars in thousands) | | | | |
| Cost of goods sold | $ | 22,424,661 | | | $ | 24,215,749 | | | $ | (1,791,088) | | | (7.4) | % |
The following
tablewaterfall analysis and commentary
present the primary reasons forpresents changes in
revenues, net of intersegment revenues, for our
EnergyAg segment
COGS for the year ended August 31,
2019,2020, compared to the prior
year:year. |
| | | | |
| | | 2019 vs. 2018 |
| | | (Dollars in thousands) |
| Volume | | $ | (25,223 | ) |
| Price | | (317,622 | ) |
| Transportation, retail and other | | (127,198 | ) |
| Total change in Energy revenues | | $ | (470,043 | ) |
The $470.0 million decreasechange in EnergyAg segment revenuesCOGS for fiscal 20192020 reflects the following:
The net impact of price•Lower grain and volume changes associated with other energy products, including decreased refined fuelsoilseed and propane selling prices,feed and farm supply volumes contributed to revenue decreases of $180.7$669.3 million and $142.5$570.8 million decreases in COGS, respectively. Decreased volumes of refined fuels and lubricants also contributed to $64.7 million and $19.2 million revenueThese decreases respectively. The decreased volumes were attributed primarily toresulted from poor spring weather conditions during fiscal 2019 that preventedled to lower crop yields and delayed spring planting of crops across much of the agricultural region of the United States, lowering demand for our diesel fuel products. These decreases were partially offset by increased propane volumes that contributed to a $58.7 million increase of revenues.
Transportation, retail and other revenues decreased as a result of the sale of 34 Zip Trip stores located in the Pacific Northwestfewer acres harvested during the third quarterfall of fiscal 2018. Revenues for these stores were included in our Energy segment results of operations during most of fiscal 2018, but were not present in fiscal 2019.
Transportation, retail2020 and other revenues also decreased as a result of the impact of applying new revenue recognition guidance under Accounting Standards Codification ("ASC") Topic 606 during fiscal 2019 compared to previous guidance during the prior fiscal year, which resulted in a $52.1 million decrease of revenues due to certain contracts being recognized on a net basis rather than a gross basis.
Ag
|
| | | | | | | | | | | | | | |
| | For the Years Ended August 31, | | Change |
| | 2019 | | 2018 | | Dollars | | Percent |
| | (Dollars in thousands) | | | | |
| Revenues | $ | 24,720,072 |
| | $ | 25,037,481 |
| | $ | (317,409 | ) | | (1.3 | )% |
The following table and commentary present the primary reasons for changes in revenues, net of intersegment revenues, for our Ag segment for the year ended August 31, 2019, compared to the prior year:
|
| | | | |
| | | 2019 vs. 2018 |
| | | (Dollars in thousands) |
| Volume | | $ | (29,341 | ) |
| Price | | (288,068 | ) |
| Total change in Ag revenues | | $ | (317,409 | ) |
The $317.4 million decrease in Ag segment revenues for fiscal 2019 reflects the following:
Decreased volumes associated with grain and oilseed contributed to a $600.9 million decrease of revenues. The decreased volumes resulted primarily from continuing global trade tensions between the United States and foreign trading partners.partners, particularly during the first half of fiscal 2020.
Decreased prices associated with grain and oilseed, feed and farm supplies,•Lower renewable fuels and processing and food ingredients allvolumes contributed to decreased revenues, the largest of which were attributable to decreased renewable fuel and grain and oilseed prices, which decreased revenues by $261.9$119.5 million and $134.9$110.2 million decreases in COGS, respectively. Although ethanol demand has remained relatively stable in North America, margins and underlying prices remained under pressure for most of fiscal 2019 as ethanol production and inventory supplies remained at high levels. The decreased prices alsoThese decreases resulted from the poor weather conditions during the spring of 2019 in the agricultural regionreduced demand for renewable fuels and processing and food ingredient products as a result of the United States that prevented and delayed planting of crops (impacting the mix and timing of products sold) and continuing global trade tensions between the United States and foreign trading partners.COVID-19 pandemic.
•The decreased revenues across much of the Ag segmentvolume decreases were partially offset by increased pricing and volumes associated with certain agronomy products, including increased pricing of crop nutrient products due to global supply andheightened spring 2020 demand and a $456.2 millionthe increase ofin revenues that resulted from the March 1, 2019, acquisition of the remaining 75% ownership interest in WCD that we did not previously own, and the results of which were not included in the prior fiscal year.
All Other Segments*
|
| | | | | | | | | | | | | | |
| | For the Years Ended August 31, | | Change |
| | 2019 | | 2018 | | Dollars | | Percent |
| | (Dollars in thousands) | | | | |
| Corporate and Other revenues | $ | 61,305 |
| | $ | 56,747 |
| | $ | 4,558 |
| | 8.0 | % |
*Our Nitrogen Production reportable segment represents an equity method investment that records earnings and allocated expenses, but not revenues.
There were no significant changes in Corporate and Other revenues during fiscal 2019; however, the increase resulted from higher revenues associated with our financing and hedging businesses, which was partially offset by a decrease of insurance revenues due to the sale of CHS Insurance during the third quarter of fiscal 2018.
Cost of Goods Sold by Segment
Energy
|
| | | | | | | | | | | | | | |
| | For the Years Ended August 31, | | Change |
| | 2019 | | 2018 | | Dollars | | Percent |
| | (Dollars in thousands) | | | | |
| Cost of goods sold | $ | 6,303,323 |
| | $ | 7,031,000 |
| | $ | (727,677 | ) | | (10.3 | )% |
The following table and commentary present the primary reasons for changes in COGS for our Energy segment, net of intercompany COGS, for the year ended August 31, 2019, compared to the prior year:
|
| | | | |
| | | 2019 vs. 2018 |
| | | (Dollars in thousands) |
| Volume | | $ | (14,855 | ) |
| Price | | (616,600 | ) |
| Transportation, retail and other | | (96,222 | ) |
| Total change in Energy COGS | | $ | (727,677 | ) |
The $727.7 million decrease in Energy segment COGS for fiscal 2019 reflects the following:
Decreased refined fuels costs and volumes contributed to $396.4 million and $59.8 million decreases of COGS, respectively. Decreased costs for refined fuels was driven primarily by favorable pricing on heavy Canadian crude oil, which is processed by our refineries, as well as decreased renewable energy credit costs. The decreased volumes were attributed primarily to poor weather conditions that prevented and delayed spring planting of crops across much of the agricultural region of the United States, lowering demand for our diesel fuel products.
Decreased propane costs contributed to a $147.7 million decrease of COGS; however, the decrease was partially offset by an 8% increase in propane volumes, which contributed to a $60.2 million increase of COGS.
A gain of $80.8 million recognized as a reduction of COGS in our Consolidated Statements of Operations during fiscal 2019, which resulted from manufacturing changes in our Energy business that allowed us to benefit from certain federal excise tax credits.
Transportation, retail and other COGS decreased primarily as a result of the sale of 34 Zip Trip stores located in the Pacific Northwest that were sold during the third quarter of fiscal 2018. Costs associated with these stores were included in our Energy segment results of operations during most of fiscal 2018, but were not present in fiscal 2019.
Other COGS also decreased as a result of the impact of applying new revenue recognition guidance under ASC Topic 606 during fiscal 2019 compared to previous guidance during theentire comparable period of the prior fiscal year, which resulted in a $52.1year.
•Lower pricing driven by global market conditions and product mix contributed to $627.0 million decrease of COGS due to certain contracts being recognized on a net basis rather than a gross basis.
Ag
|
| | | | | | | | | | | | | | |
| | For the Years Ended August 31, | | Change |
| | 2019 | | 2018 | | Dollars | | Percent |
| | (Dollars in thousands) | | | | |
| Cost of goods sold | $ | 24,215,749 |
| | $ | 24,560,854 |
| | $ | (345,105 | ) | | (1.4 | )% |
The following table and commentary present the primary reasons for changes$533.1 million decreases in COGS for our Ag segment, net of intercompany COGS, for the year ended August 31, 2019, compared to the prior year:
|
| | | | |
| | | 2019 vs. 2018 |
| | | (Dollars in thousands) |
| Volume | | $ | (89,447 | ) |
| Price | | (255,658 | ) |
| Total change in Ag COGS | | $ | (345,105 | ) |
The $345.1 million decrease in Ag segment COGS for fiscal 2019 reflects the following:
Decreased volumes associated with grain and oilseed contributed to a $595.8 million decrease of COGS. The decreased volumes resulted primarily from continuing global trade tensions between the United States and foreign trading partners.
Decreased costs associated with grain and oilseed,agronomy, respectively. However, these price decreases were partially offset by market-driven price increases for other products, including feed and farm supplies renewable fuels and processing and food ingredients contributed to decreased COGS, the largest of which were attributable to decreased renewable fuel and feed and farm supply costs, which decreasedthat increased COGS by $223.5 million and $182.5 million, respectively. Although ethanol demand has remained relatively stable in North America, margins remained under pressure for most of fiscal 2019 as ethanol production and inventory supplies remained at high levels. The decreased costs also resulted from the poor weather conditions, including heavy snow and rainfall, during the spring of 2019 in the agricultural region of the United States that prevented and delayed planting of crops (impacting the mix and timing of products sold) and continuing global trade tensions between the United States and foreign trading partners.$357.4 million.
The decreased COGS across much of the Ag segment was partially offset by increased volumes and costs associated with certain agronomy products and processing and food ingredients, most of which was attributable to an increase of COGS that resulted from our acquisition of the remaining 75% ownership interest in WCD that we did not previously own on March 1, 2019, the results of which were not included in the comparable period of the prior fiscal year.
All Other Segments
| | | | | | | | | | | | | | | | | | | | | | | |
| Years Ended August 31, | | Change |
| 2020 | | 2019 | | Dollars | | Percent |
| | (Dollars in thousands) | | | | |
| Nitrogen Production COGS | $ | 2,397 | | | $ | 2,879 | | | $ | (482) | | | (16.7)% |
| | | | | | | |
| Corporate and Other COGS | $ | (5,097) | | | $ | (5,831) | | | $ | 734 | | | 12.6% |
|
| | | | | | | | | | | | | |
| | For the Years Ended August 31, | | Change |
| | 2019 | | 2018 | | Dollars | | Percent |
| | (Dollars in thousands) | | | | |
| Nitrogen Production COGS | $ | 2,879 |
| | $ | 1,340 |
| | $ | 1,539 |
| | NM* |
| Corporate and Other COGS | $ | (5,831 | ) | | $ | (3,307 | ) | | $ | (2,524 | ) | | NM* |
*NM - not meaningful
There were no significant changes to COGS for our Nitrogen Production segment or Corporate and Other during fiscal 2019.2020.
Marketing, General and Administrative Expenses
| | | | | | | | | | | | | | | | | | | | | | | |
| Years Ended August 31, | | Change |
| 2020 | | 2019 | | Dollars | | Percent |
| | (Dollars in thousands) | | | | |
| Marketing, general and administrative expenses | $ | 704,542 | | | $ | 724,731 | | | $ | (20,189) | | | (2.8) | % |
|
| | | | | | | | | | | | | | |
| | For the Years Ended August 31, | | Change |
| | 2019 | | 2018 | | Dollars | | Percent |
| | (Dollars in thousands) | | | | |
| Marketing, general and administrative expenses | $ | 737,636 |
| | $ | 677,465 |
| | $ | 60,171 |
| | 8.9 | % |
The $60.2 million increasedecrease in marketing, general and administrative expenses for fiscal 2019 relates2020 was primarily to increased annual incentive compensation resulting from improved earnings during fiscal 2019, increased consulting and outside service fees associated with ongoing internal controls strengthening efforts in response to prior material weakness determinations and increased repairs and maintenance expense at our facilities.
Reserve and Impairment Charges (Recoveries), Net
|
| | | | | | | | | | | | | | |
| | For the Years Ended August 31, | | Change |
| | 2019 | | 2018 | | Dollars | | Percent |
| | (Dollars in thousands) | | | | |
| Reserve and impairment charges (recoveries), net | $ | (12,905 | ) | | $ | (37,709 | ) | | $ | 24,804 |
| | 65.8 | % |
The $24.8 million decrease in recoveries of reserve and impairment charges relates primarilydue to the impact of reserveloan loss reserves and impairment chargesimpairments recorded during fiscal 2019 that did not reoccur and decreased incentive-based compensation during fiscal 2020. The decrease was partially offset recoveries. Recoveriesby decreased recoveries of amounts reserved and impaired, during previous years totaled approximately $109.4 million during fiscal 2019; however, these recoveries were offset by approximately $96.5 million of reserve and impairment charges recorded during fiscal 2019 that resulted from the challenging agricultural environment that continues to negatively impact our Ag segment. The reserve and impairment charges recorded during fiscal 2019 relate primarily to increased loan loss reserves of $48.4 million in our country operations business, including the impact of a $25.5 million out-of-period adjustment, as well as a $27.4 million impairment of goodwillmaintenance expenses associated with a reporting unitour information technology platforms and increased payroll expenses due to the employees who joined CHS following our acquisition of the remaining 75% ownership interest in our Ag segment andWCD, which were not included in the impairmententire comparable period of other long-lived assets.the prior year.
Gain (Loss) on Disposal of Business
| | | | | | | | | | | | | | | | | | | | | | | |
| Years Ended August 31, | | Change |
| 2020 | | 2019 | | Dollars | | Percent |
| | (Dollars in thousands) | | | | |
| Gain on disposal of business | $ | 1,450 | | | $ | 3,886 | | | $ | (2,436) | | | (62.7) | % |
|
| | | | | | | | | | | | | |
| | For the Years Ended August 31, | | Change |
| | 2019 | | 2018 | | Dollars | | Percent |
| | (Dollars in thousands) | | | | |
| Gain (loss) on disposal of business | $ | 3,886 |
| | $ | 131,816 |
| | $ | (127,930 | ) | | NM* |
*NM - not meaningful
The decrease in gain (loss) Gain on disposal of business isdid not change significantly during fiscal 2020.
Interest Expense
| | | | | | | | | | | | | | | | | | | | | | | |
| Years Ended August 31, | | Change |
| 2020 | | 2019 | | Dollars | | Percent |
| | (Dollars in thousands) | | | | |
| Interest expense | $ | 116,977 | | | $ | 167,065 | | | $ | (50,088) | | | (30.0) | % |
Interest expense decreased during fiscal 2020 as a result of lower interest rates and decreased average outstanding debt balances compared to the prior year.
Other Income
| | | | | | | | | | | | | | | | | | | | | | | |
| Years Ended August 31, | | Change |
| 2020 | | 2019 | | Dollars | | Percent |
| | (Dollars in thousands) | | | | |
| Other income | $ | 38,425 | | | $ | 82,423 | | | $ | (43,998) | | | (53.4) | % |
Other income decreased primarily attributable toas a result of nonoperating gains recognized on the sale of certain assets during fiscal 20182019 that did not reoccur during fiscal 2019,2020, including a $65.9$19.1 million gain recognized in our Energy segment associatedconnection with the sale of 34 Zip Trip stores located in the Pacific Northwest and saleacquisition of the Council Bluffs pipeline and refined fuels terminalremaining 75% ownership in Council Bluffs, Iowa, and a $58.2 million gain in Corporate and Other associated with the sale of CHS Insurance.
Interest Expense
|
| | | | | | | | | | | | | | |
| | For the Years Ended August 31, | | Change |
| | 2019 | | 2018 | | Dollars | | Percent |
| | (Dollars in thousands) | | | | |
| Interest expense | $ | 167,065 |
| | $ | 149,202 |
| | $ | 17,863 |
| | 12.0 | % |
The $17.9 million increase inWCD. Additionally, decreased interest expense for fiscal 2019 was due to higher outstanding debt balances associated with our unsecured revolving credit facility and higherincome resulting from lower interest rates during fiscal 2019.adversely impacted other income.
Other Income (Loss)
|
| | | | | | | | | | | | | | |
| | For the Years Ended August 31, | | Change |
| | 2019 | | 2018 | | Dollars | | Percent |
| | (Dollars in thousands) | | | | |
| Other income (loss) | $ | 82,423 |
| | $ | 82,737 |
| | $ | (314 | ) | | (0.4 | )% |
There were no significant changes to other income (loss) during fiscal 2019.
Equity Income (Loss) from Investments
|
| | | | | | | | | | | | | | |
| | For the Years Ended August 31, | | Change |
| | 2019 | | 2018 | | Dollars | | Percent |
| | (Dollars in thousands) | | | | |
| Equity income (loss) from investments* | $ | 236,755 |
| | $ | 153,515 |
| | $ | 83,240 |
| | 54.2 | % |
| | | | | | | | | | | | | | | | | | | | | | | |
| Years Ended August 31, | | Change |
| 2020 | | 2019 | | Dollars | | Percent |
| | (Dollars in thousands) | | | | |
| Equity income from investments* | $ | 186,715 | | | $ | 236,755 | | | $ | (50,040) | | | (21.1) | % |
*See Note 5,6, Investments, of the notes to the consolidated financial statements that are included in this Annual Report on Form 10-K for additional information.
The $83.2 million increase ofdecreased equity income (loss) from investments for fiscal 20192020 was primarily due to higherlower equity income recognized from our equity method investments in CF Nitrogen and Ventura Foods, which increaseddecreased by $53.5$32.4 million and $26.8$17.6 million, respectively. The increasesdecreases were driven by improvedreduced urea and UAN pricing for CF Nitrogen and improved product margins and volumes forthe significantly reduced demand in the foodservice industry during the COVID-19 pandemic experienced by Ventura Foods.
Income Tax Benefit (Expense)
| | | | | | | | | | | | | | | | | | | | | | | |
| Years Ended August 31, | | Change |
| 2020 | | 2019 | | Dollars | | Percent |
| | (Dollars in thousands) | | | | |
| Income tax benefit | $ | 36,731 | | | $ | 12,456 | | | $ | 24,275 | | | 194.9 | % |
|
| | | | | | | | | | | | | | |
| | For the Years Ended August 31, | | Change |
| | 2019 | | 2018 | | Dollars | | Percent |
| | (Dollars in thousands) | | | | |
| Income tax benefit (expense) | $ | 12,456 |
| | $ | 104,076 |
| | $ | (91,620 | ) | | (88.0 | )% |
The decrease in Increased income tax benefit was primarily due to incremental tax benefits recognized during fiscal 2018 that did not reoccur during2020 primarily reflects a tax benefit related to the settlement of a U.S. federal audit resulting in additional tax credit carryovers, as well as equity management assumptions used in fiscal 2019, including revaluation of our net deferred tax liability resulting from the Tax Cuts and Jobs Act enacted on December 22, 2017,2020 and the intercompany transfer of a businessassociated impact on December 1, 2017. The federalincome taxes. Federal and state
statutory raterates applied to nonpatronage business activity waswere 24.9% and 24.7% and 29.3% for the years ended August 31, 20192020 and 2018,2019, respectively. Income taxes and effective tax rates vary each year based upon profitability and nonpatronage business activity.
Comparisonactivity, which resulted in effective tax rates of results of operations(9.5)% and (1.5)% for the years ended August 31, 20182020 and 20172019, respectively.
Comparison of Results of Operations for the Years Ended August 31, 2019 and 2018
For a discussion of results of operations for fiscal 20182019 compared to fiscal 2017,2018, please refer to Part II, Item 7, Management's Discussion and Analysis of Financial Condition and Results of Operations in our Annual Report on Form 10-K for the year ended August 31, 2018,2019, filed with the SEC on December 3, 2018.November 6, 2019.
Liquidity and Capital Resources
Summary
In assessing our financial condition, we consider factors such as working capital and internal benchmarking related to our applicable covenants and other financial criteria. We fund our operations primarily through a combination of cash flows from operations supplemented with short-term borrowings underthrough our revolving credit facilities. We fund our capital expenditures and growth primarily through cash, operating cash flow and long-term debt financing.
On August 31, 20192020 and 2018,2019, we had working capital, defined as current assets less current liabilities, of $1.1$1.3 billion and $759.0 million,$1.1 billion, respectively. The increase in working capital was driven primarily by reductions in our notes payable and debt and increases in our accounts receivable and inventory that resulted from our acquisition of the remaining 75% ownership interest in WCD that we did not previously own.payable. Our current ratio, defined as current assets divided by current liabilities, was 1.21.3 and 1.11.2 as of August 31, 20192020 and 2018,2019, respectively. Working capital and the current ratio may not be computed the same as similarly titled measures used by other companies. We believe this information is meaningful to investors as a measure of operational efficiency and short-term financial health.
As of August 31, 2019,2020, we had cash and cash equivalents of $211.2$140.9 million, total equities of $8.6$8.8 billion, long-term debt (including current maturities) of $1.8 billion and notes payable of $2.2$1.6 billion. Our capital allocation priorities include maintaining the safety and compliance of our operations, paying interest on debt and preferred stock dividends, returning cash to our member-owners in the form of cash patronage and equity redemptions maintaining the safety and compliance of our operations, and taking advantage of strategic opportunities that benefit our owners. We will continue to consider opportunities to further diversify and enhance our sources and amounts of liquidity. We believe cash generated by operating and investing activities, along with available borrowing capacity under our credit facilities, will be sufficient to support our operations for the foreseeable future and we expect to remain in compliance with our loan covenants.
As we continue to navigate the impact of COVID-19 on our business and operations, we have strengthened our liquidity through a variety of means, including curtailing certain spending and reprioritizing capital expenditures. We are actively managing our short-term and long-term liquidity needs.
Fiscal 20192020 and 20182019 Activity
During fiscal 2019,On August 14, 2020, we completedentered into the acquisition of the remaining 75% ownership interest in WCD that we did not previously own by paying $106.7Note Purchase Agreement to borrow $375.0 million of which net cash flows were reduced by $8.0 million of cash acquired. WCD is now included in our Ag segment and deepens our presencedebt in the agronomy products market. Seeform of notes. The notes under this Note 18, Acquisitions, Purchase Agreement are structured in four series with maturities ranging from 7 to 15 years and interest accruing at rates ranging from 3.24% to 3.73%, subject to certain adjustments depending on our ratio of consolidated funded debt to consolidated cash flow and whether the notes have an investment grade rating from a nationally recognized statistical rating organization. The funding of these notes took place on November 2, 2020, and will be used to our consolidated financial statements includedrefinance upcoming debt maturities in this Annual Report on Form 10-K for additional information.fiscal 2021 and add liquidity.
Also during fiscal 2019, our McPherson refinery finished its planned major maintenance. Total cash spend associated with the project was $223.4 million for the year ended August 31, 2019.
On June 27, 2019, we extended our existingWe have a receivables and loans securitization facility ("Securitization Facility") with certain unaffiliated financial institutions ("Purchasers"). Under the Securitization Facility, we and certain of our subsidiaries ("Originators") sell trade accounts and notes receivable ("Receivables") to Cofina Funding, LLC ("Cofina"), a wholly-owned bankruptcy-remote indirect subsidiary of CHS. Cofina in turn transfers the Receivables to the Purchasers whichand this arrangement is accounted for as a secured borrowing. During the period from July 2017 through a previous amendment of the Securitization Facility in June 2018, CHS accounted for Receivables sold under the Securitization Facility as a sale of financial assets pursuant to ASC 860, Transfers and Servicing, and the Receivables sold were derecognized from our Consolidated Balance Sheets. We use the proceeds from the sale of Receivables under the Securitization Facility for general corporate purposes and settlements are made on a monthly basis. The Securitization Facility is scheduled to terminate on June 26, 2020, but may be extended.
The amount available under the Securitization Facility fluctuates over time based on the total amount of eligible Receivables generated during the normal course of business, with maximum availability of $700.0 million.business. As of August 31,
2019 and 2018, the 2020, total availability under the Securitization Facility was $632.0$423.0 million, and $645.0 million, respectively, all of which had been utilized.
On September 4, 2018, we entered into We also have a repurchase facility (the "Repurchase("Repurchase Facility") related to the Securitization Facility. Under the Repurchase Facility, we are able tocan borrow up to $150.0 million, collateralized by a subordinated note issued by Cofina in favor of the Originators and representing a portion of the outstanding balance of the Receivables sold by the Originators to Cofina under the Securitization Facility. As of August 31, 2020 and 2019, the outstanding balance under the Repurchase Facility was $150.0 million.
Cash FlowsOn June 26, 2020, we amended our existing Securitization Facility and Repurchase Facility. As a result of the amendment, the maximum availability of the Securitization Facility was decreased from $700.0 million to $500.0 million. On September 24, 2020, the Securitization Facility and Repurchase Facility were further amended, increasing the maximum availability under the Securitization Facility to $600.0 million from $500.0 million and extending their respective termination dates to July 30, 2021.
|
| | | | | | | | | | | | | | |
| | For the Years Ended August 31, | | Change |
| | 2019 | | 2018 | | Dollars | | Percent |
| | (Dollars in thousands) | | | | |
| Net cash provided by (used in) operating activities | $ | 1,139,931 |
| | $ | 1,074,497 |
| | $ | 65,434 |
| | 6.1 | % |
| Net cash provided by (used in) investing activities | (661,283 | ) | | (79,524 | ) | | (581,759 | ) | | (731.6 | )% |
| Net cash provided by (used in) financing activities | (725,646 | ) | | (732,170 | ) | | 6,524 |
| | 0.9 | % |
| Effect of exchange rate changes on cash and cash equivalents | 2,733 |
| | 8,864 |
| | (6,131 | ) | | (69.2 | )% |
| Net increase (decrease) in cash and cash equivalents | $ | (244,265 | ) | | $ | 271,667 |
| | $ | (515,932 | ) | | (189.9 | )% |
The $65.4 million increase in cash provided by operating activities primarily reflects increased net income duringDuring fiscal 2019, compared towe completed the prior fiscal year. A combinationacquisition of factors contributed to various other offsetting changes within operating cash flow activities, including decreased revenues that resulted from global trade tensions between the United States and its foreign trading partners, as well as poor weather conditions during the spring of 2019 in the agricultural region of the United States that prevented and delayed planting of crops.
The $581.8 million increase in cash used in investing activities for fiscal 2019 primarily reflects the following:
Cash outflows of approximately $223.4 million for planned major maintenance at our McPherson refinery during fiscal 2019.
Proceeds of $230.0 million from the sale of certain North American businesses/assets during fiscal 2018 that did not reoccur during fiscal 2019.
In March 2019, we acquired the remaining 75% ownership interest in WCD that we did not previously own forby paying $106.7 million, of whichmillion; net cash flows were reduced by $8.0 million of cash acquired. WCD is now included in our Ag segment and deepens our presence in the agronomy products market. See Note 20, Acquisitions, of the notes to our consolidated financial statements included in this Annual Report on Form 10-K for additional information.
Increased acquisitions
We also completed planned major maintenance activities during fiscal 2020 and 2019, which contributed to cash outflows of property, plant$14.5 million and equipment$232.1 million for selective growth capital investments.the years ended August 31, 2020 and 2019, respectively.
Cash Flows
| | | | | | | | | | | | | | | | | | | | | | | |
| Years Ended August 31, | | Change |
| 2020 | | 2019 | | Dollars | | Percent |
| | (Dollars in thousands) | | | | |
| Net cash provided by operating activities | $ | 1,087,229 | | | $ | 1,139,931 | | | $ | (52,702) | | | (4.6) | % |
| Net cash used in investing activities | (243,705) | | | (661,283) | | | 417,578 | | | 63.1 | % |
| Net cash used in financing activities | (931,148) | | | (725,646) | | | (205,502) | | | (28.3) | % |
| Effect of exchange rate changes on cash and cash equivalents | 4,942 | | | 2,733 | | | 2,209 | | | 80.8 | % |
| Net decrease in cash and cash equivalents and restricted cash | $ | (82,682) | | | $ | (244,265) | | | $ | 161,583 | | | 66.2 | % |
Cash flows from operating activities can fluctuate significantly from period to period as a result of various factors, including seasonality and timing differences associated with purchases, sales, taxes and other business decisions. The increased uses of$52.7 million decrease in cash referenced above wereprovided by operating activities reflects decreased net income during fiscal 2020 compared to the prior fiscal year, which was partially offset by certain otherworking capital decreases, primarily associated with decreased receivables.
The $417.6 million decrease in cash used in investing activities includingprimarily reflects increased payments from customer financingcollections of $130.5 million, decreased expenditures for major maintenance, CHS Capital, LLC ("CHS Capital") notes receivable and decreased investments redeemed.acquisition of the remaining 75% ownership interest in WCD in fiscal 2019, which did not reoccur in fiscal 2020.
CashThe $205.5 million increase in cash used in financing activities decreased by $6.5 million for fiscal 2019, primarily due to the following:
Decreasedreflects increased net cash outflows associated with our notes payable and long-term borrowings.
The decrease was partially offset by payment ofdebt facilities, an increase in cash patronage of $75.8 million during fiscal 2019paid and increasedan increase in equity redemption paymentspayments.
Future Uses of Cash
We expect to utilize cash and cash equivalents, along with cash generated by operating activities and cash raised through the Note Purchase Agreement to fund capital expenditures, major repairs,maintenance, debt and interest payments, preferred stock dividends, patronage and equity redemptions. The following is a summary of our primary cash requirements for fiscal 2020:2021:
•Capital expenditures. We expect total capital expenditures for fiscal 20202021 to be approximately $524.8$486.8 million, compared to capital expenditures of $443.2$418.4 million in fiscal 2019. Included in that amount2020. Excluded from the capital expenditures for fiscal 20202021 is approximately $105.0$56.0 million for the acquisition of property, plant and equipmentmajor maintenance at our Laurel and McPherson refineries.
refinery.•Debt and interest. We expect to repay approximately $39.2$189.3 million of long-term debt and capitalfinance lease obligations and incur interest payments related to long-term debt of approximately $76.2$74.6 million during fiscal 2020.
2021.•Preferred stock dividends. We had approximately $2.3 billion of preferred stock outstanding as of August 31, 2019.2020. We expect to pay dividends on our preferred stock of approximately $168.7 million during fiscal 2020.
2021.
•Patronage. Our Board of Directors authorized approximately $90.0$30.0 million of our fiscal 2019 patronage sourced2020 patronage-sourced earnings to be paid to our member ownersmember-owners during fiscal 2020.
2021.•Equity redemptions. Our Board of Directors has authorized and we expect totalequity redemptions of approximately $90.0$33.0 million to be distributed in fiscal 2020 and2021 in the form of redemptions of qualified and non-qualifiednonqualified equity owned by individual producer members and association members.
The Board of Directors will continue to periodically evaluate the level of equity redemption activity throughout fiscal 2021 in respect to the amounts it has authorized for redemption during the fiscal year.
Future Sources of Cash
We fund our current operations primarily through a combination of cash flows from operations and committed and uncommitted revolving credit facilities, including our Securitization Facility and Repurchase Facility. We believe these sources will provide adequate liquidity to meet our working capital needs. We fund certain of our long-term capital needs, primarily those related to acquisitions of property, plant and equipment, with cash flows from operations and by issuing privately placed long-term debt and term loans. On August 14, 2020, we entered into the Note Purchase Agreement to borrow $375.0 million of long-term debt in the form of notes that was funded on November 2, 2020. This funding will be used to refinance maturing long-term debt as well as add liquidity. In addition, our wholly-owned subsidiary, CHS Capital, makes loans to member cooperatives, businesses and individual producers of agricultural products included in our cash flows from investing activities and has financing sources as detailed below in CHS"CHS Capital Financing.Financing."
Working Capital Financing
We finance our working capital needs through committed and uncommitted lines of credit with domestic and international banks. We believe our current cash balances and available capacity on our committed lines of credit will provide adequate liquidity to meet our working capital needs. The following table summarizes our primary lines of credit as of August 31, 20192020 and 2018:2019:
| | | | | | | | | | | | | | | | | | | | | | | | | | | | | | | | |
| Primary Revolving Credit Facilities | | Fiscal Year
of Maturity | | Total Capacity | | Borrowings Outstanding | | Interest Rates |
| | | | 2020 | | 2020 | | 2019 | | |
| | | | (Dollars in thousands) | | |
| Committed five-year unsecured facility | | 2024 | | $ | 2,750,000 | | | $ | 345,000 | | | $ | 335,000 | | | LIBOR or base rate +0.00% to 1.55% |
| Uncommitted bilateral facilities* | | 2021 | | 300,000 | | | 0 | | | 430,000 | | | LIBOR or base rate + applicable margin |
|
| | | | | | | | | | | | | | | | |
| Primary Revolving Credit Facilities | | Maturity | | Total Capacity | | Borrowings Outstanding | | Interest Rates |
| | | | | 2019 | | 2019 | | 2018 | | |
| | | | | (Dollars in thousands) | | |
| Committed five-year unsecured facility | | 2024 | | $ | 2,750,000 |
| | $ | 335,000 |
| | $ | — |
| | LIBOR or base rate +0.00% to 1.45% |
| Uncommitted bilateral facilities | | 2020 | | 630,000 |
| | 430,000 |
| | 515,000 |
| | LIBOR or base rate +0.00% to 1.20% |
On July 16, 2019, we amended and restated our Our primary line of credit which is a five-year, unsecured revolving credit facility with a syndicate of domestic and international banks. The credit facility provides a committed amount of $2.75 billion that expires on July 16, 2024. We also maintain certain uncommitted bilateral facilities to support our working capital needs.
In addition to our primary revolving lines of credit, we have a three-year $315.0 million committed revolving pre-export credit facility for CHS Agronegocio Industria e Comercio Ltda ("CHS Agronegocio"), our wholly-owned subsidiary, to provide financing for its working capital needs arising from its purchases and sales of grains, fertilizers and other agricultural products and that expires in April 2020. As of August 31, 2019, no amounts were outstanding under the facility.
In addition to our uncommitted bilateral facilities above, our wholly-owned subsidiaries CHS Europe S.a.r.lS.a.r.l. and CHS Agronegocio Industria e Comercio Ltda had uncommitted lines of credit with $342.7$318.4 million outstanding as of August 31, 2019.2020. In addition, our other international subsidiaries had total lines of credit outstanding of $155.8$69.7 million as of August 31, 2019, of which $13.8 million was collateralized.2020.
Long-termLong-Term Debt Financing
The following table presents summarized long-term Long-term debt including current maturities for the years ended August 31, 2019 and 2018.
|
| | | | | | | |
| | For the Years Ended August 31, |
| | 2019 | | 2018 |
| | (Dollars in thousands) |
| Private placement debt | $ | 1,379,840 |
| | $ | 1,510,547 |
|
| Bank financing | 366,000 |
| | 366,000 |
|
| Capital lease obligations | 28,239 |
| | 25,280 |
|
| Other notes and contract payable | 18,601 |
| | 32,607 |
|
| Deferred financing costs | (3,569 | ) | | (4,179 | ) |
| | $ | 1,789,111 |
| | $ | 1,930,255 |
|
Long-term debt outstandingwas $1.8 billion as of August 31, 2019, has aggregate2020 and 2019. During the year ended August 31, 2020, we repaid approximately $25.4 million of long-term debt consisting of scheduled debt maturities excluding fair value adjustments and capital leases, as follows:
|
| | | |
| | (Dollars in thousands) |
| 2020 | $ | 32,812 |
|
| 2021 | 180,663 |
|
| 2022 | 66 |
|
| 2023 | 282,066 |
|
| 2024 | 2,620 |
|
| Thereafter | 1,256,525 |
|
| | $ | 1,754,752 |
|
optional prepayments. On August 14, 2020, we entered into the Note Purchase Agreement to borrow $375.0 million of long-term debt in the form of notes that was funded on November 2, 2020. See Note 8, 9, Notes Payable and Long-Term Debt, of the notes to the consolidated financial statements that are included in this Annual Report on Form 10-K for additional information.information, including tables with summarized long-term debt outstanding.
CHS Capital Financing
For a description of the Securitization Facility and the Repurchase Facility, see above in Fiscal"Fiscal 2020 and 2019 and 2018 activity.Activity."
CHS Capital has available credit under a master participation agreement with one counterparty. Borrowings under this agreement are accounted for as secured borrowings and bear interest at 4.19% as of August 31, 2019. As of August 31, 2019, the total funding commitment under this agreement was $5.0 million, of which $2.3 million was borrowed.
CHS Capital sells loan commitments it has originated to Compeer Financial, PCA, d/b/a ProPartners Financial on a recourse basis. Total outstanding commitments under the program were $65.8$150.0 million as of August 31, 2019,2020, of which $42.3$133.3 million was borrowed with an interest rate of 3.36%1.45%.
CHS Capital borrows funds under short-term notes issued as part of a surplus funds program. Borrowings under this program are unsecured and bear interest at variable rates ranging from 0.35% to 1.40% as of August 31, 2019,2020, and are due upon demand. Borrowings under these notes totaled $63.8$134.9 million as of August 31, 2019.2020.
CovenantsOn September 30, 2019, CHS Capital entered into a credit agreement with a revolving note. Under this agreement, CHS Capital had available capacity of $100.0 million of which no amount was outstanding as of August 31, 2020. This agreement matured subsequent to August 31, 2020, and was not renewed.
Covenants
Our long-term debt is mostly unsecured; however, restrictive covenants under various debt agreements require the maintenance of minimum consolidated net worth and other financial ratios. We were in compliance with all debt covenants and restrictions as of August 31, 2019.2020. Based on our current 20202021 projections, we expect continued covenant compliance.
All outstanding private placement notes conform to financial covenants applicable to those of our amended and restated five-year unsecured revolving credit facility. The notes provide that if our ratio of consolidated funded debt to
consolidated cash flow is greater than 3.0 to 1.0, the interest rate on all outstanding notes will be increased bybetween 0.25% and 1.00%, depending on the related note series, the actual ratio and/or whether the notes have an investment grade rating from a nationally recognized statistical rating organization, until the ratio becomes 3.0 to 1.0, or less. During both fiscal 20192020 and 2018,2019, our ratio of consolidated funded debt to consolidated cash flow remained below 3.0 to 1.0.
Patronage and Equity Redemptions
In accordance with our bylaws and by action of our Board of Directors, annual net earnings from patronage sources are distributed to consenting patrons following the close of each fiscal year and are based on amounts using financial statement earnings. The cash portion of the qualified patronage distribution, if any, is determined annually by our Board of Directors, with the balance issued in the form of qualified and/or non-qualifiednonqualified capital equity certificates. Total patronage distributions for fiscal 20192020 are estimated to be $562.4$242.0 million, with the qualified cash portion estimated to be $90.0$30.0 million and non-qualifiednonqualified equity distributions of $472.4$212.0 million. NoNaN portion of annual net earnings for fiscal 20192020 will be issued in the form of qualified capital equity certificates. Patronage distributions for fiscal 2018 were $428.8 million, with a $75.8 million cash portion. Actual patronage distributions and cash portion for fiscal 2017 and 2016 were $128.8 million (with no cash portion) and $257.5 million ($103.9 million in cash), respectively.
The following table presents estimated patronage datadistributions for the year ending August 31, 2020,2021, and actual patronage datadistributions for the years ended August 31, 2020, 2019 2018 and 2017:2018:
| | | | | | | | | | | | | | | | | | | | | | | |
| 2021 | | 2020 | | 2019 | | 2018 |
| | (Dollars in millions) |
| Patronage distributed in cash | $ | 30.0 | | | $ | 90.1 | | | $ | 75.8 | | | $ | — | |
| Patronage distributed in equity | 212.0 | | | 474.4 | | | 353.0 | | | 128.8 | |
| Total patronage distributed | $ | 242.0 | | | $ | 564.5 | | | $ | 428.8 | | | $ | 128.8 | |
|
| | | | | | | | | | | | | | | |
| | 2020 | | 2019 | | 2018 | | 2017 |
| | (Dollars in millions) |
| Patronage distributed in cash | $ | 90.0 |
| | $ | 75.8 |
| | $ | — |
| | $ | 103.9 |
|
| Patronage distributed in equity | 472.4 |
| | 353.0 |
| | 128.8 |
| | 153.6 |
|
| Total patronage distributed | $ | 562.4 |
| | $ | 428.8 |
| | $ | 128.8 |
| | $ | 257.5 |
|
In accordance with authorization from ourOur Board of Directors we expect totalhas authorized equity redemptions relatedof $33.0 million to the year ended August 31, 2019, andbe distributed in fiscal 2020 to be approximately $90.0 million.2021 in the form of redemptions of qualified and nonqualified equity owned by individual producer members and association members. These redemptions are classified as a current liability on the August 31, 2019,2020, Consolidated Balance Sheet. The Board of Directors will continue to periodically evaluate the level of equity redemption activity throughout fiscal 2021 in respect to the amounts it has authorized for redemption during the fiscal year.
Other Financing
See Note 10, 12, Equities, of the notes to the consolidated financial statements that are included in this Annual Report on Form 10-K for a summary of our outstanding preferred stock as of August 31, 2019,2020, each series of which is listed and traded on the Global Select Market of Nasdaq.The Nasdaq Stock Market LLC.
Off-Balance Sheet Financing Arrangements
Guarantees
We are a guarantor for lines of credit and performance obligations of related, non-consolidatednonconsolidated companies. Our bank covenants allow maximum guarantees of $1.0 billion, of which $196.0$127.9 million were outstanding on August 31, 2019.2020. We have collateral for a portion of these contingent obligations. We have not recorded a liability related to the contingent obligations as we do not expect to pay out cash related to them and the fair values are considered immaterial. The underlying loans to the counterparties for which we provide guarantees were current as of August 31, 2019.2020.
Operating Leases
Future minimum lease payments required under noncancelable operating leases as of August 31, 2019, were $342.0 million.
Debt
There is no material off-balance sheet debt.
Loan Participations
We engage in off-balance sheet arrangements through certain loan participation agreements. Refer to further details about these arrangements in Note 3, Receivables, of the notes to the consolidated financial statements that are included in this Annual Report on Form 10-K.
Contractual Obligations
We had certain contractual obligations as of August 31, 2019,2020, which require the following payments to be made:
| | | | Payments Due by Period | | Payments Due by Period |
| | Total | | Less than 1 Year | | 1 - 3 Years | | 3 - 5 Years | | More than 5 Years | | Total | | Less than
1 Year | | 1 - 3
Years | | 3 - 5
Years | | More than
5 Years |
| | (Dollars in thousands) | | (Dollars in thousands) |
Long-term debt obligations (1) | $ | 1,754,752 |
| | $ | 32,812 |
| | $ | 180,729 |
| | $ | 284,686 |
| | $ | 1,256,525 |
| Long-term debt obligations (1) | $ | 1,750,947 | | | $ | 181,628 | | | $ | 313,656 | | | $ | 697,560 | | | $ | 558,103 | |
Interest payments (2) | 575,305 |
| | 76,217 |
| | 142,227 |
| | 122,001 |
| | 234,860 |
| Interest payments (2) | 498,157 | | | 74,573 | | | 134,426 | | | 108,726 | | | 180,432 | |
Capital lease obligations (3) | 31,684 |
| | 6,761 |
| | 11,220 |
| | 7,186 |
| | 6,517 |
| |
Finance lease obligations (3) | | Finance lease obligations (3) | 35,337 | | | 8,845 | | | 13,070 | | | 5,489 | | | 7,933 | |
| Operating lease obligations | 341,988 |
| | 87,168 |
| | 101,046 |
| | 61,121 |
| | 92,653 |
| Operating lease obligations | 305,828 | | | 64,379 | | | 90,667 | | | 55,229 | | | 95,553 | |
Purchase obligations (4) | 7,094,073 |
| | 5,696,389 |
| | 719,274 |
| | 256,480 |
| | 421,930 |
| Purchase obligations (4) | 6,555,832 | | | 5,587,252 | | | 440,551 | | | 217,226 | | | 310,803 | |
Other liabilities (5) | 496,356 |
| | — |
| | 35,355 |
| | 17,143 |
| | 443,858 |
| Other liabilities (5) | 449,206 | | | — | | | 32,082 | | | 14,846 | | | 402,278 | |
| Total obligations | $ | 10,294,158 |
| | $ | 5,899,347 |
| | $ | 1,189,851 |
| | $ | 748,617 |
| | $ | 2,456,343 |
| Total obligations | $ | 9,595,307 | | | $ | 5,916,677 | | | $ | 1,024,452 | | | $ | 1,099,076 | | | $ | 1,555,102 | |
(1) Excludes fair value adjustments to the long-term debt reported on our Consolidated Balance Sheet as of August 31, 2019,2020, resulting from fair value interest rate swaps and related hedge accounting.
(2) Based on interest rates and long-term debt balances as of August 31, 2019.
2020.
(3) Future minimum lease payments under capitalfinance leases include amounts related to bargain purchase options and residual value guarantees, which represent economic obligations as opposed to contractual payment obligations.
(4) Purchase obligations are legally binding and enforceable agreements to purchase goods or services that specify all significant terms, including fixed or minimum quantities; fixed, minimum or variable price provisions; and approximate time of the transactions. In the ordinary course of business, we enter into a significant number of forward purchase commitments for agricultural and energy commodities and related freight. The purchase obligation amounts shown above include both short- and long-term obligations and are based on a) fixed or minimum quantities to be purchased and b) fixed or estimated prices to be paid at the time of settlement. Current estimates are based on
assumptions about future market conditions that will exist at the time of settlement. Consequently, actual amounts paid under these contracts may differ due to the variable pricing provisions. Market risk related to the variability of our forward purchase commitments is economically hedged by offsetting forward sale contracts that are not included in the amounts above.
(5) Other liabilities include the long-term portion of deferred compensation, deferred tax liabilities and contractual redemptions. Of the total other liabilities and deferred tax liabilities of $496.4$652.9 million on our Consolidated Balance Sheet as of August 31, 2019,2020, the timing of the payments of $431.8$394.6 million of such liabilities cannot be determined.determined and $203.7 million relate to long-term operating lease liabilities.
Critical Accounting Policies and Estimates
Our consolidated financial statements are prepared in conformity with accounting principles generally accepted in the United States ("U.S. GAAP.GAAP"). Preparation of these consolidated financial statements requires use of estimates, as well as management’s judgments and assumptions regarding matters that are subjective, uncertain or involve a high degree of complexity, all of which affect the results of operations and financial condition for the periods presented. We believe the following significant accounting policies are critical to our consolidated financial statements and may involve a higher degree of estimates, judgments and complexity.
Inventory Valuation and Reserves
Grain, processed grain, oilseed and processed oilseed inventories are stated at net realizable value. All other inventories are stated at the lower of cost or net realizable value. The costs of certain energy inventories (wholesale refined products, crude oil and asphalt) are determined on the last-in, first-out ("LIFO") method; all other inventories of non-grainnongrain products purchased for resale are valued on the first-in, first-out ("FIFO") and average cost methods. Estimates are used in determining the net realizable values of grain and oilseed and processed grains and oilseeds inventories. These estimates include measurement of grain in bins and other storage facilities, which uses formulas in addition to actual measurements taken to arrive at appropriate quantities. Other determinations made by management include quality of inventory and estimates for
freight. Grain shrink reserves and other reserves that account for spoilage also affect inventory valuations. If estimates regarding the valuation of inventories, or the adequacy of reserves, are less favorable than management’s assumptions, then additional reserves or write-downs of inventories may be required.
Derivative Financial Instruments
We enter into exchange-traded commodity futures and options contracts to hedge our exposure to price fluctuations on energy, grain and oilseed transactions to the extent considered practicable for minimizing risk. Futures and options contracts used for hedging are purchased and sold through regulated commodity exchanges. We also use over-the-counter instruments to hedge our exposure on fixed-price contracts. Fluctuations in inventory valuations, however, may not be completely hedged, due in part to the absence of satisfactory hedging facilities for certain commodities and geographical areas and in part to our assessment of our exposure from expected price fluctuations. We also manage our risks by entering into fixed-price purchase contracts with preapproved producers and establishing appropriate limits for individual suppliers. Fixed-price sales contracts are entered into with customers of acceptable creditworthiness, as internally evaluated. The fair values of futures and options contracts are determined primarily from quotes listed on regulated commodity exchanges. Fixed-price purchase and sales contracts are with various counterparties, and the fair values of such contracts are determined from the market price of the underlying product. We are exposed to loss in the event of nonperformance by the counterparties to the contracts and, therefore, contract values are reviewed and adjusted to reflect potential nonperformance. Risk of nonperformance by counterparties includes the inability to perform because of a counterparty’s financial condition and a risk that the counterparty will refuse to perform on a contract during periods of price fluctuations where contract prices are significantly different than the current market prices.
Pension and Other Postretirement Benefits
Pension and other postretirement benefits costs and obligations depend on assumptions used in calculating such amounts. These assumptions include discount rates, health care cost trend rates, benefits earned, interest costs, expected return on plan assets, mortality rates and other factors. In accordance with U.S. GAAP, actual results that differ from the assumptions are accumulated and amortized over future periods and, therefore, generally affect recognized expenses and the recorded obligations in future periods. While our management believes the assumptions used are appropriate, differences in actual experience or changes in assumptions may affect our pension and other postretirement obligations and future expenses.
Deferred Tax Assets and Uncertain Tax Positions
We assess whether a valuation allowance is necessary to reduce our deferred tax assets to the amount we believe is more likely than not to be realized. While we have considered future taxable income, as well as other factors, in assessing the need for the valuation allowance, in the event that we were to determine that we would not be able to realize all or part of our net deferred tax assets in the future, an adjustment to our deferred tax assets would be charged to income in the period such determination was made. We are also significantly impacted by the utilization of tax credits, some of which were passed to us from the McPherson refinery, related to refinery upgrades that enable us to produce ultra-low-sulfur fuels. Our tax credit carryforwards are available to offset future federal and state tax liabilities with the tax credits becoming unavailable to us if not used by their expiration date. Our net operating loss carryforwards for tax purposes are available to offset future taxable income. If our loss carryforwards are not used, these loss carryforwards will expire.
Tax benefits related to uncertain tax positions are recognized in our financial statements if it is more likely than not that the position would be sustained upon examination by a tax authority that has full knowledge of all relevant information. The benefits are measured using a cumulative probability approach. Under this approach, we record in our financial statements the greatest amount of tax benefits that have a more than 50% probability of being realized upon final settlement with the tax authorities. In determining these tax benefits, we assign probabilities to a range of outcomes that we feel we could ultimately settle on with the tax authorities using all relevant facts and information available at the reporting date. Due to the complexity of these uncertainties, the ultimate resolution may result in a benefit that is materially different than our current estimate.
Long-Lived Assets
Property, plant and equipment is depreciated or amortized over the expected useful lives of individual or groups of assets based on the straight-line method. Economic circumstances or other factors may cause management’s estimates of expected useful lives to differ from actual.actual useful lives.
All long-lived assets, including property, plant and equipment, goodwill, investments in unconsolidated affiliates and other identifiable intangibles, are evaluated for impairment in accordance with U.S. GAAP, at least annually for goodwill, and
whenever events or changes in circumstances indicate the carrying amount of a long-lived asset or asset group may not be recoverable. For goodwill, our annual impairment testing occurs in our fourth quarter. An impaired asset is written down to its estimated fair value based on the best information available. Fair value is generally measured by discounting estimated future cash flows. Considerable management judgment is necessary to estimate discounted future cash flows and our estimates may differ from actual.actual results.
We have asset retirement obligations with respect to certain of our refineries and other assets due to various legal obligations to clean and/or dispose of the component parts at the time they are retired. In most cases, these assets can be used for extended and indeterminate periods of time, as long as they are properly maintained and/or upgraded. It is our practice and current intent to maintain refineries and related assets and to continue making improvements to those assets based on technological advances. As a result, we believe our refineries and related assets have indeterminate lives for purposes of estimating asset retirement obligations because dates or ranges of dates upon which we would retire a refinery and related assets cannot reasonably be estimated at this time. When a date or range of dates can reasonably be estimated for the retirement of any component part of a refinery or other asset, we will estimate the cost of performing the retirement activities and record a liability for the fair value of that future cost.
We have other assets that we may be obligated to dismantle at the end of corresponding lease terms subject to lessor discretion for which we have recorded asset retirement obligations. Based on our estimates of the timing, cost and probability of removal, these obligations are not material.
Effect of Inflation and Foreign Currency Transactions
We believe inflation and foreign currency fluctuations have not had a significant effect on our operations during the three years ended August 31, 2019, since we conduct a significant portion of our business in U.S. dollars.
Recent Accounting Pronouncements
See Note 1, Organization, Basis of Presentation and Significant Accounting Policies, of the notes to the consolidated financial statements that are included in this Annual Report on Form 10-K for information concerning new accounting standards and the impact of the implementation of those standards on our financial statements.
ITEM 7A. QUANTITATIVE AND QUALITATIVE DISCLOSURES ABOUT MARKET RISK
COMMODITY PRICE RISKCommodity Price Risk
When we enter into a commodity purchase or sales commitment, we incur risks related to price changes and performance including delivery, quality, quantity and shipment period. In the event that market prices decrease, we are exposed to risk of loss for the market value of inventory and purchase contracts with fixed or partially fixed prices. Conversely, we are exposed to risk of loss on our fixed or partially fixed price sales contracts in the event that market prices increase.
Our use of hedging reduces exposure to price volatility by protecting against adverse short-term price movements, but also limits the benefits of favorable short-term price movements. To reduce the price risk associated with fixed price commitments, we generally enter into commodity derivative contracts, to the extent practical, to achieve a net commodity position within the formal position limits we have established and deemed prudent for each commodity. These contracts are primarily transacted through our FCM on regulated commodity futures exchanges, but may include over-the-counter derivative instruments when deemed appropriate. These contracts are recorded at fair values based on quotes listed on regulated commodity exchanges or the market prices of the underlying products listed on the exchanges, except that certain contracts that are accounted for as normal purchase and normal sales transactions. For commodities where there is no liquid derivative contract, risk is managed through the use of forward sales contracts, other pricing arrangements and, to some extent, futures contracts in highly correlated commodities. These contracts are economic hedges of price risk, but are not designated as hedging instruments for accounting purposes. The contracts are recorded on our Consolidated Balance Sheets at fair values based on quotes listed on regulated commodity exchanges or the market prices of the underlying products listed on the exchanges, except that fertilizer and propane contracts are accounted for as normal purchase and normal sales transactions. Unrealized gains and losses on these contracts are recognized in cost of goods sold in our Consolidated Statements of Operations.
When a futures position is established, initial margin must be deposited with the applicable exchange or broker. The amount of margin required varies by commodity and is set by the applicable exchange at its sole discretion. If the market price relative to a short futures position increases, an additional margin deposit would be required. Similarly, a margin deposit would be required if the market price relative to a long futures position decreases. Conversely, if the market price increases relative to a long futures position or decreases relative to a short futures position, margin deposits may be returned by the applicable exchange or broker.
Our policy is to manage our commodity price risk exposure according to internal policespolicies and in alignment with our tolerance for risk. It is our policy that our profitability should come from operations, primarily derived from margins on products sold and grain merchandised, not from hedging transactions. At any one time, inventory and purchase contracts for delivery to us may be substantial. We have risk management policies and procedures that include established net physical position limits. These limits are defined for each commodity and business unit, and business units may include both trader and management limits as appropriate. The limits policy is overseen at a high level by our corporate compliance team, with day-to-day monitoring procedures being implemented within each individual business unit to ensure any limits overage is explained and exposures reduced, or a temporary limit increase is established if needed. The position limits are reviewed at least annually with our senior leadership and Board of Directors. We monitor current market conditions and may expand or reduce our net position limits or procedures in response to changes in those conditions.
The use of hedging instruments does not protect against nonperformance by counterparties to cash contracts. We evaluate counterparty exposure by reviewing contracts and adjusting the values to reflect potential nonperformance. Risk of nonperformance by counterparties includes the inability to perform because of a counterparty's financial condition and the risk that the counterparty will refuse to perform on a contract during periods of price fluctuations where contract prices are significantly different than the current market prices. We manage these risks by entering into fixed price purchase and sales contracts with preapproved producers and by establishing appropriate limits for individual suppliers. Fixed price contracts are entered into with customers of acceptable creditworthiness, as internally evaluated. Regarding our use of derivatives, we primarily transact in exchange traded instruments or enter into over-the-counter derivatives that primarily clear through a designated clearing organization,our FCM, which limits our counterparty exposure relative to hedging activities. Historically, we have not experienced significant events of nonperformance on open contracts. Accordingly, we only adjust the estimated fair values of specifically identified contracts for nonperformance. Although we have established policies and procedures, we make no assurances that historical nonperformance experience will carry forward to future periods.
A 10% adverse change in market prices would not materially affect our results of operations, since we use commodity futures and forward contracts asof economic hedges of price risk and since our operations have effective economic hedging requirements as a general business practice.
Factors that could impact the effectiveness of our hedging activities include the accuracy of our forecasts, the volatility of the commodity markets and the availability of hedging instruments. The utilization of derivatives and hedging activities is described more fully in Note 15, Derivative Financial Instruments and Hedging Activities, and Note 16, Fair Value Measurements, of the notes to our consolidated financial statements included in this Annual Report on Form 10-K.
Interest Rate Risk
INTEREST RATE RISK
Debt used to finance inventories and receivables is represented by short-term notes payable, so our blended interest rate for all such notes approximates current market rates. We have outstanding interest rate swaps with an aggregate notional amount of $365.0 million designated as fair value hedges of portions of our fixed-rate debt. Our objective is to offset changes in the fair value of the debt associated with the risk of variability in the three-month U.S. dollar LIBOR interest rate, in essence converting the fixed-rate debt to variable-rate debt. Offsetting changes in the fair values of both the swap instruments and hedged debt are recorded contemporaneously each period and only create an impact to earnings to the extent that the hedge is ineffective. During fiscal 2019, we recorded offsetting fair value adjustments of $21.2 million, with no ineffectiveness recorded in earnings.
The table below provides information about our outstanding debt and derivative financial instruments that areis sensitive to changes in interest rates. For debt obligations, theThe table presents scheduled contractual principal payments and related weighted average interest rates for the fiscal years presented. For interest rate swaps, the table presents notional amounts for payments to be exchanged by expected contractual maturity dates for the fiscal years presented and interest rates noted in the table.
| | | | | | | | | | | | | | | | | | | | Expected Maturity Date | | Total | | Fair Value
Asset (Liability) |
| Expected Maturity Date | |
| | 2020 | | 2021 | | 2022 | | 2023 | | 2024 | | Thereafter | | Total | | Fair Value Asset (Liability) | | 2021 | | 2022 | | 2023 | | 2024 | | 2025 | | Thereafter | | Total | | Fair Value
Asset (Liability) |
| | (Dollars in thousands) | | (Dollars in thousands) |
| Liabilities: | |
| | |
| | |
| | |
| | |
| | |
| | |
| | |
| Liabilities: | | | | | | | | | | | | | | | |
Variable rate miscellaneous short-term notes payable | $ | 1,330,550 |
| | $ | — |
| | $ | — |
| | $ | — |
| | $ | — |
| | $ | — |
| | $ | 1,330,550 |
| | $ | (1,330,550 | ) | Variable rate miscellaneous
short-term notes payable | $ | 763,215 | | | $ | — | | | $ | — | | | $ | — | | | $ | — | | | $ | — | | | $ | 763,215 | | | $ | (763,215) | |
| Average interest rate | 3.4 | % | | — |
| | — |
| | — |
| | — |
| | — |
| | 3.4 | % | | — |
| Average interest rate | 2.0 | % | | — | | | — | | | — | | | — | | | — | | | 2.0 | % | | — | |
| Variable rate CHS Capital short-term notes payable | $ | 825,558 |
| | $ | — |
| | $ | — |
| | $ | — |
| | $ | — |
| | $ | — |
| | $ | 825,558 |
| | $ | (825,558 | ) | Variable rate CHS Capital short-term notes payable | $ | 812,276 | | | $ | — | | | $ | — | | | $ | — | | | $ | — | | | $ | — | | | $ | 812,276 | | | $ | (812,276) | |
| Average interest rate | 2.9 | % | | — |
| | — |
| | — |
| | — |
| | — |
| | 2.9 | % | | — |
| Average interest rate | 1.3 | % | | — | | | — | | | — | | | — | | | — | | | 1.3 | % | | — | |
| Fixed rate long-term debt | $ | 32,812 |
| | $ | 180,663 |
| | $ | 66 |
| | $ | 282,066 |
| | $ | 2,620 |
| | $ | 890,525 |
| | $ | 1,388,752 |
| | $ | (1,505,213 | ) | Fixed rate long-term debt | $ | 181,628 | | | $ | 30,828 | | | $ | 282,828 | | | $ | 780 | | | $ | 330,780 | | | $ | 558,103 | | | $ | 1,384,947 | | | $ | (1,497,526) | |
| Average interest rate | 4.4 | % | | 4.5 | % | | 5.1 | % | | 4.5 | % | | 5.1 | % | | 4.6 | % | | 4.4 | % | | — |
| Average interest rate | 4.5 | % | | 3.2 | % | | 3.2 | % | | 4.5 | % | | 3.2 | % | | 4.9 | % | | 3.9 | % | | — | |
| Variable rate long-term debt | $ | — |
| | $ | — |
| | $ | — |
| | $ | — |
| | $ | — |
| | $ | 366,000 |
| | $ | 366,000 |
| | $ | (372,489 | ) | Variable rate long-term debt | $ | — | | | $ | — | | | $ | — | | | $ | — | | | $ | 366,000 | | | $ | — | | | $ | 366,000 | | | $ | (384,364) | |
Average interest rate (a) | — |
| | — |
| | — |
| | — |
| | — |
| | range |
| | range |
| | — |
| Average interest rate (a) | — | | | — | | | — | | | — | | | range | | — | | | range | | — | |
| Interest Rate Derivatives: | |
| | |
| | |
| | |
| | |
| | |
| | |
| | |
| |
| Fixed to variable long-term debt interest rate swaps | $ | — |
| | $ | 160,000 |
| | $ | — |
| | $ | 130,000 |
| | $ | — |
| | $ | 75,000 |
| | $ | 365,000 |
| | $ | 9,841 |
| |
Average pay rate (b) | — |
| | range |
| | — |
| | range |
| | — |
| | range |
| | range |
| | — |
| |
Average receive rate (c) | — |
| | range |
| | — |
| | range |
| | — |
| | range |
| | range |
| | — |
| |
(a) Borrowings under the agreement bear interest at a base rate (or LIBOR) plus an applicable margin, or at a fixed rate of interest determined and quoted by the administrative agent under the agreement in its sole and absolute discretion from time to time. The applicable margin is based on our leverage ratio and ranges between 1.50% and 2.00% for LIBOR-based loans and between 0.50% and 1.00% for base rate loans.
(b) Five swaps with notional amounts of $365.0 million with fixed rates from 4.52% to 4.67%.Foreign Currency Risk
(c) Average three-month U.S. dollar LIBOR plus spreads ranging from 2.009% to 2.74%.
FOREIGN CURRENCY RISK
We were exposed to risk regarding foreign currency fluctuations during fiscal 20192020 and in prior years even though a substantial amount of our international sales were denominated in U.S. dollars. In addition to specific transactional exposure, foreign currency fluctuations can impact the ability of foreign buyers to purchase U.S. agricultural products and the competitiveness of U.S. agricultural products compared to the same products offered by alternative sources of world supply. From time to time, we enter into foreign currency hedge contracts to minimize the impact of currency fluctuations on our transactional exposures. The notional amounts of our foreign exchange derivative contracts were $894.7 million$1.2 billion and $988.8$894.7 million as of August 31, 20192020 and 2018,2019, respectively.
ITEM 8. FINANCIAL STATEMENTS AND SUPPLEMENTARY DATA
The financial statements listed in Item 15(a)(1) of this Annual Report on Form 10-K are set forth beginning on page F-1. Financial statement schedules are included in Schedule II in Item 15(a)(2) of this Annual Report on Form 10-K. Supplementary financial information required by Item 302 of Regulation S-K promulgated by the SEC for each quarter during the years ended August 31, 20192020 and 2018,2019, is presented below.
| | | | | | | | | | | | | | | | | | | | | | | |
| Three Months Ended |
| August 31,
2020 | | May 31,
2020 | | February 29,
2020 | | November 30,
2019 |
| (Unaudited)
(Dollars in thousands) |
| Revenues | $ | 6,945,623 | | | $ | 7,241,031 | | | $ | 6,598,226 | | | $ | 7,621,485 | |
| Gross profit | 122,850 | | | 218,359 | | | 315,055 | | | 325,543 | |
| Income before income taxes | 3,204 | | | 70,449 | | | 127,824 | | | 185,401 | |
| Net income | 21,677 | | | 97,501 | | | 125,694 | | | 178,737 | |
| Net income attributable to CHS Inc. | 21,462 | | | 97,648 | | | 125,447 | | | 177,882 | |
| | | | | | | | | | | | | | | | | | | | | | | |
| Three Months Ended |
| August 31,
2019 | | May 31,
2019 | | February 28,
2019 | | November 30,
2018 |
| (Unaudited)
(Dollars in thousands) |
| Revenues | $ | 8,434,684 | | | $ | 8,497,941 | | | $ | 6,483,539 | | | $ | 8,484,289 | |
| Gross profit | 262,508 | | | 223,771 | | | 427,413 | | | 470,641 | |
| Income before income taxes | 124,935 | | | 61,579 | | | 261,855 | | | 367,232 | |
| Net income | 177,925 | | | 54,713 | | | 248,304 | | | 347,115 | |
| Net income attributable to CHS Inc. | 178,990 | | | 54,620 | | | 248,766 | | | 347,504 | |
Regulation S-X promulgated by the SEC also requires separate financial statements of significant equity method investment to be filed with this Annual Report on Form 10-K when the equity income attributable to a significant equity method investments exceeds 20% of income before income taxes for any of our fiscal years for which financial statements are required to be presented in this Annual Report on Form 10-K. As equity income from our investment in CF Nitrogen exceeded 20% of our income before income taxes for the fiscal year ended August 31, 2020, separate financial statements for CF Nitrogen will be filed as an amendment to this Annual Report on Form 10-K within 90 days after CF Nitrogen's fiscal year ended on December 31, 2020.
|
| | | | | | | | | | | | | | | |
| | For the Three Months Ended |
| | August 31,
2019 | | May 31,
2019 | | February 28,
2019 | | November 30,
2018 |
| | (Unaudited) (Dollars in thousands) |
| Revenues | $ | 8,434,684 |
| | $ | 8,497,941 |
| | $ | 6,483,539 |
| | $ | 8,484,289 |
|
| Gross profit | 262,508 |
| | 223,771 |
| | 427,413 |
| | 470,641 |
|
| Income (loss) before income taxes | 124,935 |
| | 61,579 |
| | 261,855 |
| | 367,232 |
|
| Net income (loss) | 177,925 |
| | 54,713 |
| | 248,304 |
| | 347,115 |
|
| Net income (loss) attributable to CHS Inc. | 178,990 |
| | 54,620 |
| | 248,766 |
| | 347,504 |
|
|
| | | | | | | | | | | | | | | |
| | For the Three Months Ended |
| | August 31,
2018 | | May 31,
2018 | | February 28,
2018 | | November 30,
2017 |
| | (Unaudited) (Dollars in thousands) |
| Revenues | $ | 8,583,982 |
| | $ | 9,087,328 |
| | $ | 6,980,153 |
| | $ | 8,031,884 |
|
| Gross profit | 391,027 |
| | 245,632 |
| | 134,969 |
| | 320,492 |
|
| Income (loss) before income taxes | 248,332 |
| | 236,839 |
| | (21,729 | ) | | 207,788 |
|
| Net income (loss) | 240,545 |
| | 181,620 |
| | 165,959 |
| | 187,182 |
|
| Net income (loss) attributable to CHS Inc. | 240,447 |
| | 181,807 |
| | 166,007 |
| | 187,646 |
|
ITEM 9. CHANGES IN AND DISAGREEMENTS WITH ACCOUNTANTS ON ACCOUNTING AND FINANCIAL DISCLOSURE
None.
ITEM 9A. CONTROLS AND PROCEDURES
Disclosure Controls and Procedures:Procedures
Under the supervision and with the participation of our management, including our Chief Executive Officer and Chief Financial Officer, we evaluated the effectiveness of our disclosure controls and procedures (as defined in Rule 13a-15(e) under the Securities Exchange Act of 1934, as amended ("Exchange Act")), as of August 31, 2019.2020. Based on that evaluation, our Chief Executive Officer and Chief Financial Officer concluded that, as of that date, our disclosure controls and procedures were not effective because of the material weaknesses in our internal control over financial reporting disclosed within effective.
Management's Annual Report on Internal Control Over Financial Reporting in this Item 9A.
Management’s Annual Report on Internal Control Over Financial Reporting:
Our management is responsible for establishing and maintaining adequate internal control over financial reporting.
Our internal control system is a process designed to provide reasonable assurance regarding the reliability of financial reporting and the preparation of financial statements for external purposes in accordance with generally accepted accounting principles. Because of its inherent limitations, internal control over financial reporting may not prevent or detect misstatements. Also, projecting any evaluation of effectiveness to future periods is subject to the risk that controls may become inadequate because of changes in conditions or that the degree of compliance with the policies or procedures may deteriorate.
A material weakness is a deficiency, or a combination of deficiencies, in internal control over financial reporting, such that there is a reasonable possibility that a material misstatement of our annual or interim financial statements will not be prevented or detected on a timely basis.
Management assessed the effectiveness of our internal control over financial reporting using the criteria set forth by the Committee of Sponsoring Organizations of the Treadway Commission in Internal Control - Integrated Framework (2013). Based on management’s assessment using this framework, management concluded that, as of August 31, 2019, we did not maintain effective2020, our internal control over financial reporting due to the fact that there were material weaknesses inwas effective.
This Annual Report on Form 10-K does not include an attestation report of our independent registered public accounting firm regarding internal control over financial reporting. Management's report was not subject to attestation by our independent registered public accounting firm pursuant to the Financial Reform Bill passed in July 2010 that permits us to provide only management’s report in this Annual Report on Form 10-K.
Remediation of Previously Identified Material Weaknesses
We previously identified and disclosed in our Annual Report on Form 10-K for the year ended August 31, 2018,2019, the following material weaknesses in our internal control over financial reporting, that continue to existeach of which has been remediated, as of August 31, 2019:described below:
•We did not design and consistently maintain effective monitoring controls related to the design and operating effectiveness of our internal controls. Specifically, we did not implement and reinforce an adequate process for monitoring the proper functioning of internal controlcontrols to verify that our accounting policies and procedures are consistently and adequately being performed, as relevant, by a sufficient number of resources with the appropriate knowledge and training.
•We did not design and maintain effective controls over certain information technology ("IT") general controls for information systems relevant to the preparation of our financial statements. Specifically, we did not design and maintain sufficient (i) testing and approval controls for program development to ensure the implementation of a new ERP system was aligned with business and IT requirements, or (ii) user access controls to ensure appropriate segregation of duties, or that adequately restrict user and privileged access to certain financial applications, programs and data to appropriate personnel. These control deficiencies resulted in misstatements to the inventory and COGS and related disclosures for the third quarter of fiscal 2018. Additionally, the deficiencies, when aggregated, could impact the maintenance of effective segregation of duties, as well as the effectiveness of IT-dependentIT dependent controls (such as automated controls that address the risk of material misstatement to one or more assertions, along with the IT controls and underlying data that support the effectiveness of system-generated data and reports) that could result in misstatements potentially impacting all financial statement accounts and disclosures that would not be prevented or detected. Accordingly, our management has determined that these control deficiencies constitute material weaknesses.
These material weaknesses resulted in the restatement of our consolidated financial statements for fiscal years 2016 and 2017, the restatement of each of the interim periods in fiscal years 2017 and 2018 and the correction of misstatements identified during fiscal year 2018.
Additionally, each of the above material weaknesses could result in a misstatement of the aforementioned account balances or disclosures that would result in a material misstatement to the annual or interim consolidated financial statements that would not be prevented or detected.
This Annual Report on Form 10-K does not include an attestation report of our independent registered public accounting firm regarding internal control over financial reporting. Management's report was not subject to attestation by our independent registered public accounting firm pursuant to the Financial Reform Bill passed in July 2010 that permits us to provide only management’s report in this Annual Report on Form 10-K.
Remediation of Previously Identified Material Weaknesses
We previously identified and disclosed in our Annual Report on Form 10-K for the year ended August 31, 2018, the following material weaknesses in our internal control over financial reporting, each of which has been remediated, as described below:
We did not design and maintain effective controls over the review of journal entries and account reconciliations in our grain marketing operations. Specifically, we did not design and maintain effective controls to ensure journal entries and account reconciliations were (i) properly prepared with sufficient supporting documentation or (ii) reviewed and approved to ensure accuracy and completeness of the resulting journal entries.
We did not design and maintain effective internal controls over the accounting for intercompany transactions. Specifically, we did not design and maintain effective controls to ensure intercompany transactions are completely and accurately identified, reconciled, evaluated and eliminated.
We did not design and maintain effective controls over the accounting for freight contracts in our grain marketing operations. Specifically, we did not design and maintain effective controls to verify (i) review over the accounting for freight contracts was being performed by appropriate individuals with the requisite level of knowledge,
training and skill to ensure freight contracts met the criteria to be accounted for as a derivative or (ii) the accuracy, existence and valuation of freight contracts.
During the first three quarters of fiscal 2019,2020 we substantially completed the comprehensive risk assessment of the design of existing controlsprojects designed and implemented new controls as needed to remediate the above previously identified material weaknesses. However, as we had yet to complete the testing and evaluation of the operating effectiveness of controls, the above previously identified material weaknesses remained unremediated as of the end of the third quarter of fiscal 2019. During the quarter ended August 31, 2019, we completed the testing and evaluation of the operating effectiveness of the controls and concluded that the above previously identified material weaknesses have been remediated as of August 31, 2019.
Status of Remediation Actions
As it relates to the material weaknesses that existed as of August 31, 2019, the following remediation actions were taken during the quarter ended August 31, 2019:
Held bi-weekly steering committee meetings consisting of senior finance, legal, IT, operational and human resources leaders to oversee the design and implementation of remediation plans.
Continued developing, executing and monitoring of detailed remediation plans in response to each of the remaining previously identified material weaknesses.
We are continuing to enhance our overall financial control environment through the following:
Continued execution of our plans designed to remediate the two remaining previously identified material weaknesses, including (1) establishing appropriate roles and responsibilities within the organization, implementing formal programs for finance, accounting, operations and IT personnel, and reinforcing an adequate process for monitoring proper functioning of internal controls to verify that our accounting policies and procedures are consistently and adequately being performed, as relevant, by a sufficient number of resources with the appropriate knowledge and training and (2) designing and maintaining effectiveimplementing controls over certain IT general controls for information systems that are relevant to the preparation of our financial statements . During the quarter ended August 31, 2020, we completed the testing and testingevaluation of the operating effectiveness of the remediated controls.controls and concluded that the previously identified material weaknesses have been remediated as of August 31, 2020.
Continued hiring for our teams in functional areas as necessary to ensure the size and skill set of those teams is adequate given the size, scale and complexity of our organization, industry and required internal controls over financial reporting.
Changes in Internal Control Over Financial Reporting
There have been no changes in internal control over financial reporting (as defined in Rule 13a-15(f) under the Exchange Act) during the quarter ended August 31, 2019,2020, that have materially affected, or are reasonably likely to materially affect, our internal control over financial reporting.
ITEM 9B. OTHER INFORMATION
We have announced the appointment of Angela OlsonawskiOn November 5, 2020, we and Mr. Debertin entered into an amendment ("Employment Agreement Amendment") to the position of interim chief financial officer, effective November 7, 2019. In this capacity, Ms. Olsonawski will serve as our principal financial officer. Ms. Olsonawski will also continue in her role as senior vice president and corporate treasurer.
Since 2018, Ms. Olsonawski has served as our senior vice president and corporate treasurer. From 2013, Ms. Olsonawski served as a vice president in our energy marketing, trading risk management and operations areas in our energy operations area, where she also held a variety of positions prior to 2013.
There is no arrangement or understanding between Ms. Olsonawski and any other personemployment agreement we entered into with Mr. Debertin on May 22, 2017 ("Employment Agreement"), pursuant to which shethe term of the Employment Agreement was appointedextended to August 31, 2023, provided that, pursuant to the terms of the Employment Agreement, beginning on August 31, 2023, and on each August 31 thereafter, the Employment Agreement will automatically renew for an additional one-year period, unless either party notifies the other in writing, at least 120 days in advance of the renewal date, of its intent not to renew the agreement for an additional one-year period.
The foregoing description of the Employment Agreement Amendment does not purport to be complete and is qualified in its entirety by reference to the Employment Agreement Amendment, which is filed as interim chief financial officer, norExhibit 10.1A to this Annual Report on Form 10-K and is there any family relationship between Ms. Olsonawski and any of our directors or other executive officers. There are no transactions in which Ms. Olsonawski has an interest requiring disclosure under Item 404(a) of Regulation S-K promulgatedincorporated herein by the SEC. Ms. Olsonawski is 41 years old.
reference.
PART III
ITEM 10. DIRECTORS, EXECUTIVE OFFICERS AND CORPORATE GOVERNANCE
BOARD OF DIRECTORS
The table below provides certain information regarding each of our directors, as of August 31, 2019.2020.
| | | | | | | | | | | | | | | | | | | | |
| Name | | Age | | Director
Region | | Director Since |
| David Beckman | | 60 | | 8 | | 2018 |
| Clinton J. Blew | | 43 | | 8 | | 2010 |
| Hal Clemensen | | 60 | | 4 | | 2019 |
| Scott Cordes | | 59 | | 1 | | 2017 |
| Jon Erickson | | 60 | | 3 | | 2011 |
| Mark Farrell | | 61 | | 5 | | 2016 |
| Steve Fritel | | 65 | | 3 | | 2003 |
| Alan Holm | | 60 | | 1 | | 2013 |
| David Johnsrud | | 66 | | 1 | | 2012 |
| Tracy Jones | | 57 | | 5 | | 2017 |
| David Kayser | | 61 | | 4 | | 2006 |
| Russell Kehl | | 45 | | 6 | | 2017 |
| Edward Malesich | | 67 | | 2 | | 2011 |
| Perry Meyer | | 66 | | 1 | | 2014 |
| Steve Riegel | | 68 | | 8 | | 2006 |
| Daniel Schurr | | 55 | | 7 | | 2006 |
| Kevin Throener | | 48 | | 3 | | 2019 |
|
| | | | | | |
| Name | | Age | | Director Region | | Director Since |
| David Beckman | | 59 | | 8 | | 2018 |
| Clinton J. Blew | | 42 | | 8 | | 2010 |
| Dennis Carlson | | 58 | | 3 | | 2001 |
| Scott Cordes | | 58 | | 1 | | 2017 |
| Jon Erickson | | 59 | | 3 | | 2011 |
| Mark Farrell | | 60 | | 5 | | 2016 |
| Steve Fritel | | 64 | | 3 | | 2003 |
| Alan Holm | | 59 | | 1 | | 2013 |
| David Johnsrud | | 65 | | 1 | | 2012 |
| Tracy Jones | | 56 | | 5 | | 2017 |
| David Kayser | | 60 | | 4 | | 2006 |
| Russell Kehl | | 44 | | 6 | | 2017 |
| Randy Knecht | | 69 | | 4 | | 2001 |
| Edward Malesich | | 66 | | 2 | | 2011 |
| Perry Meyer | | 65 | | 1 | | 2014 |
| Steve Riegel | | 67 | | 8 | | 2006 |
| Daniel Schurr | | 54 | | 7 | | 2006 |
As a cooperative, members of our Board of Directors are nominated and elected by our members as required by our bylaws. As described below under "Director Elections and Voting," to ensure geographic representation of our members, the Board of Directors represents eight regions in which our members are located. The members in each region nominate and elect the number of directors for that region as set forth in our bylaws. Neither management nor the incumbent directors have any control over the nominating process for directors. As described below under "Director Elections and Voting," to be eligible for service as a director, a nominee must, among other things, (i) be an active farmer or rancher whose primary occupation is that of a farmer or rancher, (ii) be a Class A individual member of CHS or a member of a cooperative association member and (iii) reside in the geographic region from which he or she is nominated. In general, our directors operate large commercial agricultural enterprises, which require expertise in all areas of management, including financial management and oversight. They also have experience serving on local cooperative association boards and participate in a variety of agricultural and community organizations. Some directors also have experience serving on boards of directors for financial and other institutions and businesses. Our directors complete the National Association of Corporate Directors Comprehensivecomprehensive Director Professionalism course and earn the Certificate of Director Education, and also participate in ongoing director development and education through various organizations and programs.Education.
David Beckman has been a member of the CHS Board of Directors since 2018. He is a memberserves as vice chair of the Government Relations Committee and is a member of the Corporate Risk Committee. He serves as board chair for Central Valley Ag Cooperative in York, Nebraska, and secretary of the Nebraska Cooperative Council. He holds a bachelor's degree in agronomy from the University of Nebraska-Lincoln. Mr. Beckman's principal occupation has been farming for more than five years, and, inyears. In partnership with his family, he raises irrigated corn and soybeans and operates a custom hog-feeding operation near Elgin, Nebraska. He also owns a trucking business.
Clinton J. Blew, First Vice Chair, has been a member of the CHS Board of Directors since 2010. Since 2017, Mr. Blew has served as first vice chair of the Executive CommitteeBoard and a member of the Board of Directors.Executive Committee. He also serves on the Audit Committee and Corporate Risk Committee.Capital committees. He is a member of the board of directors of Mid Kansas Coop, Moundridge, Kansas, and is a member of the Hutchinson Community College Ag Advisory Board, Kansas Livestock Association, Texas Cattle Feeders Association and Red Angus Association of America. He holds an applied science degree in farm and ranch management from Hutchinson (Kansas) Community College. Mr. Blew's principal occupation has been farming for more than five years, and he farms and ranches in a family partnership in south-central Kansas.
Dennis Carlson Hal Clemensen has been a member of the CHS Board of Directors since 2001.2019. He serves as chair of the Capital Committee and asis a member of the Governance Committee.Government Relations and Corporate Risk committees. He serves on the Agtegra Cooperative board. He also serves on the board of trustees for Presentation College and the Avera Rural Cancer Advisory Board. Previously, he served as a director of the South Dakota Value Added Agriculture Development Center, South Dakota Soybean Association and Redfield Farmers Union Oil Company. He holds a bachelor's degree in agricultural economics and agricultural business from South Dakota State University. Mr. Carlson'sClemensen’s principal occupation has been farming for more than five years,years. He and he raiseshis wife raise corn, soybeans and wheat sunflowersin Brown and soybeans near Mandan, NorthSpink counties in South Dakota.
Scott Cordes has been a member of the CHS Board of Directors since 2017. He serves onas vice chair of the Government RelationsAudit Committee and vice chair of the Corporate Risk Committee. He serves as a director and past chair of Security State Bank of Wanamingo, (Minnesota).Minnesota. He also serves as a member of the board for the Cooperative Network. Previously, he served as director of the Minneapolis Grain ExchangeMGEX and National Futures Association. He holds a bachelor's degree in agricultural economics from the University of Minnesota. Mr. Cordes’Cordes' principal occupation has been farming for more than threefour years. In 1995,Prior to his current occupation, he joined CHS and most recently served as thewas president of CHS Hedging, LLC, a commodities brokerage subsidiary of CHS Inc., until 2016. He operates a corn and soybean farm near Wanamingo, Minnesota.Wanamingo.
Jon Erickson, Second Vice Chair, has been a member of the CHS Board of Directors since 2011. Since 2017, he has been second vice chair of the Executive Committee of the BoardBoard. He also serves as chair of Directors. He isthe Capital Committee and as a member of the Audit Committee and Capital Committee. He is a member of the North Dakota Farmers Union and North Dakota Stockmen's Association. He holds a bachelor’sbachelor's degree in agricultural economics from North Dakota State University. Mr. Erickson’sErickson's principal occupation has been farming for more than five years, and heyears. He raises grains and oilseeds and operates a commercial Hereford-Angus cow-calf business near Minot, North Dakota.
Mark Farrell has been a member of the CHS Board of Directors since 2016. He serves as vice chair of the CHS Foundation Board of Trustees and as a member of the Audit Committee. Previously, he served as a director and president of the Premier Cooperative board and as a director of Mount Horeb Farmers Co-op and United Ethanol. He graduated from the University of Wisconsin-Madison Agricultural & Life Sciences Farm & Industry Short Course. Mr. Farrell's principal occupation has been farming for more than five years. He raises corn, soybeans and wheat in Dane County, Wisconsin.
Steve Fritel has been a member of the CHS Board of Directors since 2003. He serves as vice chair of the Corporate Risk Committee and as a member of the Audit Committee. He earned an associate degree from North Dakota State College of Science. Mr. Fritel's principal occupation has been farming for more than five years. He raises spring wheat, soybeans, edible beans, corn and canola near Rugby, North Dakota. He also runs a family business providing on-farm grain storage equipment.equipment and sells some of his edible beans to local family-owned restaurants.
Alan Holm has been a member of the CHS Board of Directors since 2013. He is chair of the Corporate Risk Committee and viceserves as chair of the Government Relations Committee and is a member of the Corporate Risk Committee. He also serves on the board for Citizens Bank of Minnesota. Mr. Holm holds an associate degree in machine tool technology from Mankato Technical College. Mr. Holm's principal occupation has been farming for more than five years. He raises corn, soybeans, sweet corn, peas and hay and operates a cow-calf herd near Sleepy Eye, Minnesota.
David Johnsrud Secretary-Treasurer, has been a member of the CHS Board of Directors since 2012. Since 2017, he has been secretary-treasurer of the Executive Committee of the Board of Directors. He serves as a member of the Government Relations and Capital Committee and Governance Committee.committees. He also serves as a member of the board for the Cooperative Network.
Previously, he served as board chair of AgCountry Farm Credit Services and on the boards of the Minnesota Farm Credit Legislative Committee, Farmers Union Oil, CHS Prairie Lakes, Mid-Minnesota Association and Minnesota State Co-op Directors Association. Mr. Johnsrud'sJohnsrud’s principal occupation has been farming for more than five years, and heyears. He raises corn and soybeans near Starbuck, Minnesota.
Tracy Jones has been a member of the CHS Board of Directors since 2017. He is a member of the Governance and Capital committees. He serves on the Governance Committee andDeKalb County board. Previously, he served on the CHS Foundation Board of Trustees. He is a producer board memberboards of CHS Elburn, (Illinois)DeKalb Kane Cattlemen's Association and was the board chair of the Elburn Cooperative between 2011 and its merger into CHSDeKalb County Corn Growers. He earned an associate degree in 2016.farm management from Kishwaukee College in Malta, Illinois. Mr. Jones' primaryprincipal occupation has been farming for more than five years. He operates a fourth-generation family farm near Kirkland, Illinois, that raises corn, soybeans and wheat and feeds cattle.
David Kayser has been a member of the CHS Board of Directors since 2006. He isserves as chair of the CHS Foundation Board of Trustees and vice chairas a member of the AuditGovernance Committee. Mr. Kayser is a member of the Mitchell (South Dakota) Technical Institute Foundation Board.Board and a previous director and chair of CHS Farmers Alliance and South Dakota Association of Cooperatives. Mr. Kayser's principal occupation has been farming for more than five years. He raises corn, soybeans and hay near Alexandria, South Dakota, and operates a cow-calf and feeder-calf business.
Russell Kehl, Secretary-Treasurer,has been a member of the CHS Board of Directors since 2017. Since 2019, Mr. Kehl has served as secretary-treasurer of the Board and a member of the Executive Committee. He also serves onas vice chair of the Capital Committee and vice chair of the Governance Committee and Capital Committee. He previously served as a member of the producer board of CHS SunBasin Growers and vice chair of the Columbia Basin Seed Association. Mr. Kehl's primary occupation has been farming for more than five years. He and his wife operate a farm near Quincy, Washington, that produces crops, primarily potatoes and dry beans, and includes a cow-calf herd. His family also owns a dry bean processing facility, runs a custom farming business, and owns and operates a trucking and logistics company.
Randy Knecht has been a member of the CHS Board of Directors since 2001. He is chair of the Government Relations Committee and vice chair of the Capital Committee. He holds a bachelor's degree in agriculture from South Dakota State University. Mr. Knecht's principal occupation has been farming for more than five years, and he operates a diversified family farm operation near Houghton, South Dakota, raising corn, soybeans, alfalfa and beef cattle.
Edward Malesich has been a member of the CHS Board of Directors since 2011. He chairsserves as chair of the Governance Committee and serves onas a member of the Capital Committee.CHS Foundation Board of Trustees. He is a member of Montana Stock Growers Association, Montana Grain Growers Association, Montana Farm Bureau Federation, Montana Farmers Union and Montana Council of Co-ops. He holds a bachelor’sbachelor's degree in agricultural production from Montana State University. Mr. Malesich's principal occupation has been farming for more than five years, and heyears. He raises Angus cattle, wheat, malt barley and hay near Dillon, Montana.
Perry Meyer has been a member of the CHS Board of Directors since 2014. He isserves as chair of the Audit Committee and serves onis a member of the Corporate Risk Committee. He serves as director of Heartland Corn Products Cooperative and is a member of United Farmers Co-op, Central Region Cooperative, Minnesota Farm Bureau, Minnesota and Nicollet County corn growers associations, and Minnesota Pork Producers Association. He serves as a director of Steamboat Pork Cooperative, chair of the board of NU-TelecomNuvera Communications, Inc. and director of Minnesota Valley Lutheran School Foundation. He holds an agricultural mechanics degree from Alexandria (Minnesota) Technical School. Mr. Meyer’sMeyer's principal occupation has been farming for more than five years, and heyears. He operates a family farm, raising corn, soybeanssoybean and hogs near New Ulm, Minnesota.
Steve Riegel, Assistant Secretary-Treasurer,has been a member of the CHS Board of Directors since 2006. HeMr. Riegel serves as the assistant secretary-treasurer of the Executive Committee of the Board of Directors. He is viceand chair of the Executive Committee. He is also a member of the Governance Committee and serves on the CHS Foundation Board of Trustees.Capital committees. He serves asis an advisory director of Bucklin (Kansas) National Bank. He attended Fort Hays (Kansas) State University, majoring in agriculture, business and animal science. Mr. Riegel's principal occupation has been farming for more than five years, and heyears. He raises irrigated corn, soybeans, alfalfa, dryland wheat and milo and operates a cow-calf operation near Ford, Kansas.
Daniel Schurr, Chair, has been a member of the CHS Board of Directors since 2006. Since 2017, Mr. Schurr has served as chair of the Executive CommitteeBoard and chair of the Board of Directors.Executive Committee. He serves on the Blackhawk Bank and Trust board and audit and loan committees and on the Silos and Smokestacks National Heritage Area board. He holds a bachelor's degree in agricultural business with a minor in economics from Iowa State University. Mr. Schurr’sSchurr's principal occupation has been farming for more than five years. He raises corn and soybeans near LeClaire, Iowa, and operates a commercial trucking business.
Kevin Throenerhas been a member of the CHS Board of Directors since 2019. He is a member of the Governance Committee and the CHS Foundation Board of Trustees. He serves as a CHS Dakota Plains director and is active in the North Dakota Farmers Union, the North Dakota Stockmen's Association and Knights of Columbus. He attended North Dakota State University, majoring in agricultural systems management. Mr. Throener's principal occupation has been farming for more than five years. Mr. Throener and his wife raise corn, soybeans, alfalfa and cattle near Cogswell, North Dakota.
Director Elections and Voting
Director elections are for three-year terms and are open to any qualified candidate. Qualifications for the office of director are as follows:
•At the time of declaration of candidacy, the individual (except in the case of an incumbent) must have the written endorsement of a locally elected producer board that is part of the CHS system and located within the region from which the individual is to be a candidate.
•At the time of the election, the individual must be less than 68 years old.
The remaining qualifications set forth below must be met at all times commencing six months prior to the time of election and while the individual holds office:
•The individual must be a Class A individual member of CHS or a member of a cooperative association member.
•The individual must reside in the region from which he or she is to be elected.
•The individual must be an active farmer or rancher. "Active farmer or rancher" means an individual whose primary occupation is that of a farmer or rancher, excluding anyone who is an employee of CHS or of a cooperative association member.
The following positions on the Board of Directors will be up for election at the 20192020 Annual Meeting of Members:
|
| | | | | | | |
| Region | | Incumbent |
| Region 1 (Minnesota) | Alan Holm | Scott Cordes |
| Region 1 (Minnesota) | | Perry Meyer |
| Region 2 (Montana, Wyoming) | | Open Seat |
| Region 3 (North Dakota) | Open Seat | Jon Erickson |
Region 4 (South Dakota) | Open Seat |
| Region 5 (Connecticut, Delaware, Illinois, Indiana, Kentucky, Ohio, Maine, Maryland, Massachusetts, Michigan, New Hampshire, New Jersey, New York, Pennsylvania, Rhode Island, Vermont, Virginia, West Virginia, Wisconsin) | Mark Farrell | Tracy Jones |
| Region 7 (Alabama, Arkansas, Florida, Georgia, Iowa, Louisiana, Mississippi, Missouri, North Carolina, South Carolina, Tennessee) | | Daniel Schurr |
Region 8 (Colorado, Kansas, Nebraska, Kansas, New Mexico, Oklahoma, Texas) | Steve Riegel | Clinton J. Blew |
Voting rights, including those in regard to director elections, arise by virtue of membership in CHS, not because of ownership of any equity or debt instruments; therefore, our preferred stockholdersshareholders cannot recommend nominees to our Board of Directors nor vote in regard to director elections unless they are Class A or Class C members of CHS.
EXECUTIVE OFFICERS
The table below lists our executive officers as appointed by the CHS Board of Directors as of August 31, 2019.
|
| | | | | | | | | | | | | |
| Name | Age | Age | | Position |
| Jay Debertin | 59 | 60 | | President and Chief Executive Officer |
| Richard Dusek | 55 | 56 | | Executive Vice President, CHS Country Operations |
| Darin Hunhoff | 49 | 50 | | Executive Vice President, Energy and Processing |
Timothy SkidmoreOlivia Nelligan | 58 | 45 | | Executive Vice President and Chief Financial Officer |
| James Zappa | 55 | 56 | | Executive Vice President and General Counsel |
| David Black | 53 | 54 | | Senior Vice President, Enterprise Strategy and Chief Information Officer |
| John Griffith | 50 | 51 | | Senior Vice President, CHS Global Grain Marketing and CHS Renewable FuelsHedging, LLC |
| Gary Halvorson | 46 | 47 | | Senior Vice President, CHS Agronomy |
| Mary Kaul-Hottinger | 55 | 56 | | Senior Vice President, Human Resources |
Jay Debertin has beenpresident and chief executive officer ("CEO") for CHS since May 2017. He leads the strategic leadership team in strengthening CHS by advancing operational excellence, accelerating its focus on results and delivering products and services that help the cooperative's owners grow their businesses. Mr. Debertin joined CHS in 1984 in the petroleum division and held a variety of positions in its energy marketing operations before being named vice president of crude oil supply in 1998. In 2001, his responsibilities expanded to include crude oil supply, refining, pipelines and terminals, trading and risk management, and transportation.From 2005 to 2010, Mr. Debertin was executive vice president and chief operating officer for processing at CHS. From 2010 to 2017, he served as executive vice president and chief operating officer of Energy and Foods where he led energy, transportation and processing and food ingredients at CHS. Mr. Debertin serves as board chairmanchair for Ventura Foods and serves on the board of directors for Securian Financial. He earned a bachelor’sbachelor's degree in economics from the University of North Dakota and a master of business administration degree from the University of Wisconsin - Madison.
Richard Dusek has been executive vice president, CHS Country Operations since November 2017. He is responsibleleading the CHS retail platform as a critical distribution channel for the divisionour core businesses, aligning an enterprise supply chain to drive efficiencies in delivering agriculturalcrop inputs, energy products, grain marketing,fuels, animal nutrition and other farm supplies to producers through retail businesses in 16 states.and marketing the grain produced by farmer owners. Mr. Dusek serves on the board of directors for The Fertilizer Institute.Institute and is a past board member of the MGEX. He joined CHS 30 years agoin 1988 as a wheat trader. He has also been the director of merchandising,Prior to leading our retail business, Mr. Dusek held vice president ofroles in our grain marketing and vice president of agronomy at CHS.divisions. He earned a bachelor'sbachelor of science degree in agricultural economics from North Dakota State University and completedhe is a graduate of the Harvard Business School Advanced Management Program.
Darin Hunhoff has been executive vice president, Energy and Processing since May 2017. He leads CHS energy operations including refineries, pipelines and terminals, refined fuels, propane, lubricants and transportation. He also leads processing and food ingredients at CHS, which includes our soybean and canola oilseed crushing and refining operations, ethanol production platform and sunflower business. In addition, he oversees the CHS Cooperative Resources group, which provides leadership development and strategic planning services to local cooperatives. Mr. Hunhoff serves on the board of directors for Ardent Mills. He joined CHS more than 25 years ago as a petroleum specialist. He has also been chief strategy
officer for CHS and has spent several years in energy leadership roles, including time as senior vice president of refined fuels and vice president of propane. He earned a bachelor’sbachelor's degree in marketing and business management from Southwest Minnesota State University.
Timothy Skidmore has been Olivia Nelligan is the executive vice president and chief financial officer sincefor CHS, joining CHSthe organization in August 2013. HeJanuary 2020. She is responsible for accounting, treasury, credit and finance activities across CHS. Mr. Skidmore chairsCHS and was recently appointed as chair of the CHS Retirement Plan Committee and serves as a trustee for the Science Museum of Minnesota, where he serves on its Audit and Finance Committee. He also serves as a founding member of World 50's Finance Officer community, a peer forum for top finance executives. Before joining CHS, he servedMs. Nelligan held executive positions in multiple organizations as vice president of finance and strategy for Campbell North America. He joined Campbellwell as assistant treasurer in 2001 and held numerous leadership positions, including various business unit chief financial officer roles. Prior to that, Mr. Skidmore spent 15 years at DuPont, holdingacting as a variety of financial leadership positions. He holds a bachelor's degree in risk management from the University of Georgia and a master of business administration in finance from Widener University. Mr. Skidmore will retire from CHS on December 31,consultant. From June 2019 and cease to serveuntil her appointment as our executive vice president and chief financial officer, Ms. Nelligan served as chief executive officer of CHSInish Enterprises, a strategic advisory firm that she founded. Prior to that, Ms. Nelligan served as chief financial officer and subsequently as chief executive officer of Nasco, LLC, a private equity-owned company that provides specialty products for education, healthcare, laboratory testing and agriculture. After serving as Nasco's CEO, she served as nonexecutive chair of its board. Prior to Nasco, Ms. Nelligan spent many years with Kerry Group plc and was most recently the day after we file this Annual Report on Form 10-K.global chief financial and strategic planning officer of its Taste and Nutrition division. She holds a bachelor's degree in civil law and a higher diploma in business and financial information systems from University College Cork, Ireland, and a master of business administration degree from the University of Wisconsin – Madison. She is a Fellow Chartered Accountant and an associate member of the Institute of Taxation in Ireland.
James Zappa has been executive vice president and general counsel for CHS since April 2015. He provides counsel to CHS leadership and the Board of Directors on company strategy, government affairs, corporate governance, corporate compliance, federal securities reporting and compliance, and disclosure and investor communications. Mr. Zappa also oversees CHS internal audit, CHS enterprise sustainability initiatives, and the CHS Foundation and CHS Community Giving functions. Mr. Zappa serves as a director for Ventura Foods. Mr. Zappa has informed CHS that as part of his career transition planning, he will transition from his current role as executive vice president and general counsel to another leadership role at CHS, effective with the appointment of a new general counsel. He previously worked at 3M Company for 15 years in various legal and leadership roles including vice president, associate general counsel and chief compliance officer, and vice president, associate general counsel, international operations. Prior to joining 3M, he worked for UnitedHealth Group and for the law firm Dorsey & Whitney. He earned a juris doctor degree from the University of Minnesota Law School, a master's degree in communication arts and sciences from the University of Southern California, and a bachelor’s degree from Drake University.
David Black has been senior vice president, enterprise strategy, and chief information officer for CHS since April 2018. He leads enterprise strategy, CHS global information technology, marketing and communications, and facilities. He is responsible for the strategy, implementation, delivery and operation of information technology for all CHS businesses worldwide. He also serves as a director for Ventura Foods. He joined CHS fivesix years ago. He previously worked at Monsanto Company where he served as vice president, information technology, overseeing all aspects of information technology for its global commercial businesses. During his 20 years with Monsanto, he also served as vice president, corporate strategy, and president, Monsanto Agro-Services, LLC. Mr. Black earned a bachelor’sbachelor's degree in computer science from Tarkio College.
John Griffith has been senior vice president, CHS Global Grain Marketing and CHS Renewable FuelsHedging since April 2018. He leads CHS global grain marketing operations and renewable fuels trading, supply chain management and risk management, including freight, currency, execution and trade finance. Mr. Griffith serves on the Minneapolis Grain ExchangeMGEX and the North American Export Grain Association boards. He also serves as the board chairmanchair for CHS Hedging, a commodities brokerage subsidiary of CHS. He worked for CHS early in his career as a grain merchandiser and rejoined CHS at a leadership level in January 2013. Since that time, he has held various leadership roles within global grain marketing including vice president, grain marketing North America. He earned a bachelor’s degree from St. John’sJohn's University and a master of business administration degree from Rockhurst University.
Gary Halvorson has been senior vice president, CHS Agronomy since April 2018. He leads CHSthe our agronomy including allbusiness and its comprehensive supply chain encompassing diverse assets and capabilities to distribute commodity and specialty fertilizers, seed, crop protection and precision ag technology and services.services to agricultural retailers. Mr. Halvorson servesis on the board of CF Nitrogen and has served on the Agricultural Retailers Association board of directors and the National FFA Sponsors board and represents CHS on the United Prairie board of directors.board. He joined CHS more than 20 years ago and held various leadership roles with CHS at locations in North Dakota before becoming general manager for CHS Ag Services in Warren, Minnesota. Mr. Halvorson also served as vice president of farm supply infor CHS Country Operations. He earned a bachelor's degree in business from Concordia University.
Mary Kaul-Hottinger has been senior vice president, human resources, for CHS since September 2018. Ms. Kaul-Hottinger sets direction and strategy for human resources with a focus on helping us attract, develop and retain high-performing and diverse employees. Prior to joining CHS, she was vice president, human resources, for Ecolab's global businesses and supported business units with more than 30,000 employees. She previously served in human resourceresources leadership roles at General Mills and Pillsbury. Ms. Kaul-Hottinger has a bachelor’sbachelor's degree in business administration from the University of St. Thomas.
DELINQUENT SECTION 16(a) REPORTS
Section 16(a) of the Exchange Act requires our executive officers, directors and persons who beneficially own more than 10% of any class of our preferred stock to file initial reports of ownership and reports of changes in ownership with the SEC. Such executive officers, directors and greater than 10% beneficial owners are required by the regulations of the SEC to furnish us with copies of all Section 16(a) reports they file.
Based solely upon a review of copies of reports on Forms 3 and 4 and amendments thereto filed electronically with the SEC during, and reports on Form 5 and amendments thereto filed electronically with the SEC with respect to the fiscal year ended August 31, 2019,2020, and based further upon written representations received by us with respect to the need to file reports on Form 5, the followingno persons filed late reports required by Section 16(a) of the Exchange Act: Mr. Riegel did not timely file one Form 4 relating to three transactions in December 2018 and Mr. Fritel did not timely file one Form 4 relating to two transactions in December 2018.Act during fiscal 2020.
CODE OF ETHICS
We have adopted a code of ethics within the meaning of Item 406(b) of Regulation S-K promulgated by the SEC. This code of ethics applies to all of our directors, officers and employees, including our principal executive officer, principal financial officer and principal accounting officer. This code of ethics is part of our broader CHS Code of Conduct, which is posted on our website. The internet address for our website is www.chsinc.com and the CHS Code of Conduct may be found on the "Compliance and Integrity"integrity" web page, which can be accessed from the "About CHS" web page, which can be accessed from our main web page. We intend to disclose any amendment to, or waiver from, a provision of the code of ethics that applies to our principal executive officer, principal financial officer or principal accounting officer on the "Compliance and Integrity"integrity" web page of our website. The information contained on our website is not part of, and is not incorporated in, this report or any other report we file with or furnish to the SEC.
AUDIT COMMITTEE MATTERS
The Board of Directors has a separately designated standing Audit Committee for the purpose of overseeing our accounting and financial reporting processes and audits of our financial statements. In Fiscal Year 2019,fiscal 2020, the Audit Committee was comprised of Mr. Blew, Mr. Cordes, Mr. Erickson, Mr. Farrell, Mr. Fritel Mr. Kayser and Mr. Meyer (Chair)(chair), each of whom is an independent director. The Audit Committee has oversight responsibility to our member-owners relating to our financial statements and the financial reporting process, preparation of the financial reports and other financial information provided by us to any governmental or regulatory body, the systems of internal accounting and financial controls, the internal audit function and the annual independent audit of our financial statements. The Audit Committee assures that the corporate information gathering and reporting systems developed by management represent a good faith attempt to provide senior management and the Board of Directors with information regarding material acts, events and conditions within CHS. In addition, the Audit Committee is directly responsible for the appointment, compensation and oversight of the independent registered public accounting firm.
We do not believe any member of the Audit Committee is an "audit committee financial expert" as defined in the Sarbanes-Oxley Act of 2002 and the rules and regulations thereunder. As a cooperative, members of our Board of Directors are nominated and elected by our members. To ensure geographic representation of our members, the Board of Directors represents eight regions in which our members are located. The voting members in each region nominate and elect the number of directors for that region as set forth in our bylaws. To be eligible for service as a director, a nominee must among other things, (i) be an active farmer or rancher, whose primary occupation is that of a farmer or rancher, (ii) be a Class A individual member of CHS or a member of any cooperative association member and (iii) reside in the geographic region from which he or she is nominated. Neither management nor the incumbent directors have any control over the nominating process for directors. Because of the nomination procedure and the election process, we cannot ensure that an elected director serving on our Audit Committee will be an audit committee financial expert. However, many of our directors, including all of the Audit Committee members, are financially sophisticated and have experience or background in which they have had significant financial management or oversight responsibilities. The current Audit Committee includes directors who have served as presidents or chairs of local cooperative association boards. Members of the Board of Directors, including the Audit Committee, also operate large commercial enterprises requiring expertise in all areas of management, including financial oversight.
ITEM 11. EXECUTIVE COMPENSATION
Compensation Discussion and Analysis
Executive Compensation
Overview
This Compensation Discussion and Analysis describes the material elements of compensation awarded to each of the following executive officers ("Named Executive Officers") for fiscal 2019,2020, which ran from September 1, 2018,2019, through August 31, 2019:
|
| | | | | | | |
| Name | | Position |
| Jay Debertin | | President and Chief Executive Officer |
Timothy SkidmoreOlivia Nelligan | | Executive Vice President and Chief Financial Officer |
| Darin Hunhoff | | Executive Vice President, Energy and Processing |
| James Zappa | | Executive Vice President and General Counsel |
| Richard Dusek | | Executive Vice President, CHS Country Operations |
| Angela Olsonawski | | Senior Vice President, Corporate Treasurer and Former Interim Chief Financial Officer |
| Timothy Skidmore | | Former Executive Vice President and Chief Financial Officer |
Other than Changes in Named Executive Officers during fiscal 2020 include the removalretirement of Shirley Cunningham,Timothy Skidmore, our former executive vice president ag business and enterprise strategy,chief financial officer, who retired from CHS on May 4, 2018, there were no changes to our Named Executive Officers during fiscal 2019. Timothy Skidmore will retire from CHS on December 31, 2019, and ceasewho ceased to serve as our executive vice president and chief financial officer effective on the day after we file this Annual Report on Form 10-K. We are conducting a search process for Mr. Skidmore's successor. Prior to appointing such a successor,November 7, 2019. Angela Olsonawski, our senior vice president and corporate treasurer, will serveserved as our interim chief financial officer and principal financial officer. Refer to Item 9B, Other Information, of this Annual Reportofficer from November 7, 2019, until Olivia Nelligan became our executive vice president and chief financial officer on Form 10-K for further details.January 29, 2020.
CHS is an organization that exists to create connections to empower agriculture, for the benefit of our producer and local cooperative owners and the communities in which our owners and we live and operate. CHS compensation programs are designed to attract, retain and reward the executives who carry out this purpose and align them around attainment of CHS short-term and long-term strategies and short-term priorities.
This section outlines the compensation and benefit programs as well as the materials and factors used to assist us in making compensation decisions. In this Compensation Discussion and Analysis, the related compensation tables and the accompanying narratives, all references to a given year refer to our fiscal year ending on August 31 of that year.
Compensation Philosophy and Objectives
The Governance Committee of our Board of Directors("Governance Committee") oversees the administration of, and the fundamental changes to, our executive compensation and benefits programs. The primary principles and objectives in compensating our executive officers include:
•Attract and retain exceptional talent who meet our leadership expectations and are engaged and committed to the long-term success of CHS by providing market-competitive compensation and benefit programs;
•Align executive rewards to quantifiable annual and long-term performance goals that drive enterprise results and provide competitive returns to our member-owners;
•Emphasize pay for performance by providing a total direct compensation mix of fixed and variable pay that is primarily weighted on annual and long-term incentives to reward annual and sustained performance over the long term; and
•Ensure compliance with government mandates and regulations.
There are no material changes anticipated to our compensation philosophy or objectives for fiscal 2020.2021.
Components of Executive Compensation and Benefits
Our executive compensation programs are designed to attract and retain highly qualified executives and to motivate them to optimize member-owner returns and to achieve our long-term strategies by achieving specified goals. The
compensation program links executive compensation directly to our annual and long-term financial performance. A significant
portion of each executive's compensation depends on meeting financial goals and a smaller portion is linked to individual performance objectives.
The Governance Committee of our Board of Directors reviews our executive compensation policies each year with respect to the correlation between executive compensation and the creation of member-owner value, as well as the competitiveness of our executive compensation programs. The ExecutiveGovernance Committee, with input from a third-party consultant if necessary, determines what, if any, changes are appropriate to our executive compensation programs, including the incentive plan goals applicable to our Named Executive Officers under the incentive compensation plans to which they and other employees are eligible. A third-party consultant is chosen and hired directly by the Executive Committee to provide guidance regarding market competitivemarket-competitive levels of base pay, annual variable pay and long-term incentive pay, as well as market competitivemarket-competitive allocations between base pay, annual variable pay and long-term incentive pay for our CEO. The data is shared with our Board of Directors, which makes final decisions regarding our CEO's base pay, annual incentive pay and long-term incentive pay, as well as the allocation of compensation between base pay, annual incentive pay and long-term incentive pay. There are no formal policies for allocation between long-term and short-term compensation, other than the intention to be competitive with the external compensation market for comparable positions and to be consistent with our compensation philosophy and objectives. The Executive Committee recommends to our Board of Directors salary actions relative to our CEO and approves annual and long-term incentive awards for theour CEO based on performance of CHS compared to the financial targetsgoals and, as applicable, individual performance. In turn, our Board of Directors communicates this pay information to our CEO. Our CEO is not involved with the selection of the third-party consultant and does not participate in or observe Executive Committee meetings that concern CEO compensation matters. Based on a review of compensation market data provided by our human resources department (survey sources and pricing methodology are explained below under "Components of Compensation"), with input from a third-party consultant if necessary, our CEO decides base compensation levels for the other Named Executive Officers, recommends for Board of Directors approval the annual and long-term incentive pay plan performance goals applicable to the other Named Executive Officers (and other employees) and communicates base and incentive compensation pay to the other Named Executive Officers. The day-to-day design and administration of compensation and benefit plans are managed by our human resources, finance and legal departments.
Components of Compensation
Our executive compensation and benefits program consists of seven components. Each component is designed to be competitive within the executive compensation market. In determining competitive compensation levels, we analyze information from independent compensation surveys, which includesurvey information, regardingincluding comparable industries, markets, revenues and companies that compete with us for executive talent. The surveys used for this analysis inIn fiscal 2019 included a combination of2020, the following sources: Mercer Benchmark Database Executive Compensation Survey and Towers Watson CDB Executive Compensation Survey Report. TheReport was used for this analysis, and the survey data extracted from these surveys includesincluded median market rates for base salary, annual incentive, total cash compensation and total direct compensation. Companies included in the surveyssurvey vary by industry, revenue and number of employees, and represent both public and private ownership, as well as non-profit,nonprofit, government and mutual organizations. Compensation paid by a comparator group of industry specific companies, which includes 16 private, public and cooperative organizations in the agronomy, energy, food and grain industries, is also considered when making compensation decisions.
The following companies comprised the 20192020 comparator group:
|
| | | | | | | | | | |
| Comparator Group |
Archer Daniels MidlandArcher-Daniels-Midland | ConAgraConagra Brands | Kinder Morgan | Mosaic |
| Bunge | ConocoPhillips | Koch Industries | Nutrien |
| CF Industries | Dean Foods | Land O'Lakes | Valero Energy |
| Cargill | HollyFrontier | Marathon Petroleum | Williams Companies |
The emphasis of our executive compensation package is weighted more on variable pay through annual variable pay and long-term incentive awards. This is consistent with our compensation philosophy of emphasizing a strong link between pay, employee performance and business goals to foster a clear line of sight and strong commitment to CHSour short-term and long-term success and also aligns our programs with general market practices. The goal is to provide our executives with an overall compensation package that is competitive in comparable industries, companies and markets. We target the market median compensation for base pay, target total cash and target total direct compensation, and the 75th percentile for total direct compensation when we achieve above market performance.
For fiscal 2019,2020, base pay was belowslightly above the market median, total cash compensation was abovegenerally consistent with the market median and total direct compensation was above the market median. The total cash compensation was generally consistent with the market median because, although actual earned annual variable pay awards were below target performance, this was offset by the payments made with respect to the 2017 Retention Awards, as described in greater detail below. If the payments with respect to the 2017 Retention Awards had not been made in fiscal 2020, total cash compensation would have
been below the market median. The above market median total cashdirect compensation occurred because actual earned annual variable paylong-term incentive awards exceeded target performance.for the fiscal 2018-2020 performance period were achieved at the superior level of performance, and because of the payments with respect to the 2017 Retention Award. Even if the payments with respect to the 2017 Retention Award had not been made in fiscal 2020, total direct compensation would still have been above the market median.
The following table presents a more detailed breakout of each compensation element:
|
| | | | | | | | | | | | | |
| Pay Element | | Definition of Pay Element | | Purpose of Pay Element |
| Base Pay | | Competitive base level of compensation provided relative to skills, experience, knowledge and contributions | | • Provides the fundamental element of compensation for carrying out duties of the job |
| Annual Variable Pay | | Broad-based employee short-term performance-based variable pay incentive for achieving predetermined annual financial and individual performance goals | | • Provides a direct link between pay and annual business objectives
• Pay for performance to motivate and encourage the achievement of critical business initiatives
• Encourages proper expense control and containment
|
| Profit Sharing | Broad-based | Selective employee short-term performance-based variable pay incentive for achieving predetermined annual financial goals | | • Provides a direct link between employee pay and CHSour profitability
|
| Long-Term Incentive Plans | | Long-term performance-based incentive for senior management to achieve predetermined triennial Return on Adjusted Equity ("ROAE") performance or Return on Invested Capital ("ROIC") goals | | • Provides a direct link between senior management pay and long-term strategic business objectives
• Aligns management and member-owner interests
• Encourages retention of key management
|
| Retirement Benefits | | Retirement benefits under the qualified retirement plans are identical to broad-based retirement plans generally available to all full-time employees | | • These benefits are a part of our broad-based employee total rewards program designed to attract and retain quality employees |
| | The supplemental plans include non-qualifiednonqualified retirement benefits that restore qualified benefits contained in our broad-based plans for employees whose retirement benefits are limited by salary caps under the Internal Revenue Code of 1986, as amended ("Internal Revenue Code"). In; in addition, the plans allow participants to voluntarily defer receipt of a portion of their income | | • These benefits are provided to attract and retain senior managers with total rewards programs that are competitive with comparable companies |
| Health & Welfare Benefits | | Medical, dental, vision, life insurance and short-term disability benefits generally available to all full-time employees. Certain officers, including our Named Executive Officers, also are eligible for executive long-term disability benefits | | • With the exception of executive long-term disability benefits, these benefits are a part of our broad-based employee total rewards program designed to attract and retain quality employees |
| Additional Benefits | | Additional benefits provided to certain officers, including our Named Executive Officers | | • These benefits are provided as part of an overall total rewards package that strives to be competitive with comparable companies and retain individuals who are critical to CHSus |
Explanation of Ratio of Salary and Bonus to Total Compensation
The structure of our executive compensation package is focused on a suitable mix of base pay, annual variable pay and long-term incentive awards to encourage executive officers and employees to strive to achieve goals that benefit our member-owners’member-owners' interests over the long term and to better align our programs with general market practices.
Fiscal 20192020 Executive Compensation Mix at Target
The charts below illustrate the mix of base salary, annual variable pay at target performance (2019(2020 Plan) and long-term incentive compensation at target performance (2017-2019(2018-2020 Plan) for fiscal 20192020 for our CEO and the other Named Executive Officers as a group.
Base Pay
Base salaries of our Named Executive Officers represent a fixed form of compensation paid on a semi-monthly basis. The base salaries are generally set at the median level of market data collected through our benchmarking process against other equivalent positions of comparable companies. The individual's actual salary relative to the market median is based on a number of factors, which include, but are not limited to, scope of responsibilities and individual experience.
Base salaries for our Named Executive Officers are reviewed on an annual basis or at the time of significant changes in scope and level of responsibilities. Changes in base salaries are determined through review of competitive market data, as well as individual performance and contribution. Changes are not governed by pre-established weighting factors or merit metrics.
The
Our CEO is responsible for this process for the other Named Executive Officers. In fiscal 2019,2020, the Executive Committee was responsible for this process for theour CEO.
Mr. Debertin received a 5.0%3.0% base salary increase effective January 1, 2019.2020. Our Board of Directors approved the increase to maintain a competitive pay position to market. Mr. Skidmore, Mr. Hunhoff, Mr. Zappa, and Mr. Dusek and Ms. Olsonawski also received base salary increases of 2.0%3.0%, 5.0%3.0%, 5.0%2.0% and 5.0%3.0%, respectively, in fiscal 20192020 to ensure their base salaries were commensurate with their responsibilities, skills, contributions and competitive pay range. Mr. Skidmore did not receive an increase to base salary in fiscal 2020.
In light of the COVID-19 pandemic and its potential impact on our business and industry, and the economy in general, and to respond to changing conditions resulting from the COVID-19 pandemic, based upon the recommendation of the Executive Committee and the request of Mr. Debertin, our Board of Directors approved a decision that neither Mr. Debertin nor any of the other Named Executive Officers would receive a base salary increase for calendar year 2021. This decision aligns with our decision to not implement merit increases to base salaries in calendar year 2021 for any of our salaried employees.
Annual Variable Pay
Named Executive Officers are covered by the same broad-based CHS Annual Variable Pay Plan ("Annual Variable Pay Plan" or "AVP") as other employees and, based on the plan provisions, when they are hired or retire they receive awards prorated to the period of time eligible. Each Named Executive Officer was eligible to participate in the AVP for fiscal 2019.2020. Target AVP award levels were set with reference to competitive market compensation levels and were intended to motivate our executives by providing annual variable pay awards for the achievement of predetermined goals. Our AVP program for fiscal 20192020 was based on enterprise-level financial performance and specific management business objectives with actual payout dependent on achieving predetermined enterprise-level financial performance targetsgoals and individual performance goals. The financial performance components included ROIC and Return on Assets ("ROA") targetsgoals for CHS at the enterprise level.The threshold, target and maximum ROIC and ROA targets goals
for fiscal 20192020 are set forth in the table below. The management business objectives include individual performance against specific goals relating to subjects such as business profitability, execution of strategic initiatives or talent acquisition, development and retention. In conjunction with the annual performance appraisal process for our CEO, our Board of Directors reviews the individual goals and, in turn, determines and approves this portion of the annual variable pay award based upon completion or partial completion of the previously specified goals and principal
accountabilities for our CEO. Likewise, our CEO uses the same process for determining individual goal attainment for the other Named Executive Officers.
CHS financial performance goals and award opportunities under our fiscal 20192020 Annual Variable Pay Plan were as follows:
|
| | | | | | | | | | | | | | | | |
| Performance Level | | CHS Company
Performance Goal
| | CHS Company Performance Goal | | Percent of Target Award |
| Maximum | | 6.9% ROIC | | 6.9% ROA | | 200% |
| Target | | 5.9% ROIC | | 6.1% ROA | | 100% |
| Threshold | | 4.9% ROIC | | 5.2% ROA | | 50% |
| Below threshold | | <4.9% ROIC | | <5.2% ROA | | 0% |
ROIC and ROA areis not defined under U.S. GAAP. Therefore, theyit should not be considered a substitute for other measures prepared in accordance with U.S. GAAP and may not be comparable to similarly titled measures used by other companies.
ROIC is a measurement of how efficiently we use capital and the level of returns on that capital, and is calculated by dividing adjusted net operating profit after tax by funded debt plus equity. We define adjusted net operating profit after tax as earnings before tax plus interest, net, and the sum is multiplied by the effective tax rate. WeFor purposes of the fiscal 2020 AVP, we define funded debt as the average of long-term debt, including the funded debtcurrent portion thereof, plus any guarantees thereof, as of the end of July 20182019 and 2019,2020, respectively, and equity at the end of July 2018.2019.
ROA is a measurement of how well we use our assets to generate earnings and maximize returns on our owner equity and assets and is calculated by dividing adjusted operating income by net assets. We define adjusted operating income as earnings before income taxes plus interest, net, plus corporate indirect allocations. We define net assets as total assets minus working capital liabilities, where working capital liabilities means current liabilities excluding current portions of debt or financing liabilities, and is measured as of the end of July 2018.
Our Board of Directors approved the ROIC and ROA performance targetsgoals for the fiscal 20192020 AVP and determined our CEO's individual goals. The weighting of our CEO’sCEO's goals for fiscal 20192020 was 60%70% CHS total company ROIC 10% CHS total company ROA and 30% principal accountabilities and individual goals. Our CEO determined individual goals for the other Named Executive Officers. The weighting of goals for the other Named Executive Officers for fiscal 20192020 was 60%70% CHS total company ROIC 10% CHS total company ROA and 30% individual goals. ROIC results were 9.6%5.1% for fiscal 2020.
In connection with Ms. Nelligan's appointment as our executive vice president and ROA results were 8.6%chief financial officer, we entered into a letter agreement with her on January 7, 2020 (the "Nelligan Letter Agreement"). The Nelligan Letter Agreement, among other things, requires that we give Ms. Nelligan a full year of credit for fiscal 2019. Effective forthe fiscal 2020 the weighting of our CEO's goals will be 70% ROIC and 30% principal accountabilities and individual goals, and the weighting of goalsAVP, rather than prorate her award for the other Named Executive Officers will be 70% ROIC and 30% individual goals.time that she was employed by us during fiscal 2020.
In connection with Mr. Skidmore's retirement from CHS on December 31, 2019, we entered into a letter agreement with Mr. Skidmorehim on July 26, 2019 ("Skidmore Letter Agreement"). The Skidmore Letter Agreement, provides, among other things, thatprovided for the individual goals componentpayment to Mr. Skidmore of a pro rata portion of his annual variable pay award under the fiscal 2019 Annual Variable Pay Plan will be paid to Mr. Skidmorefor 2020, based on the number of days he was employed by us during fiscal 2020, calculated at the target level.level for both the enterprise-level financial performance goals and individual performance goals components of the fiscal 2020 AVP.
Annual variable pay awards that will be or have been paid under the Annual Variable Pay Plan for fiscal 20192020 for the Named Executive Officers are as follows: |
| | | |
| Name | Variable Pay |
| | (Dollars) |
| Jay Debertin | $ | 3,713,064 |
|
| Timothy Skidmore | 1,212,064 |
|
| Darin Hunhoff | 1,279,950 |
|
| James Zappa | 1,207,500 |
|
| Richard Dusek | 1,110,515 |
|
| | | | | | | | |
| Name | | Variable Pay |
| | (Dollars) |
| Jay Debertin | | $ | 1,173,439 | |
| Olivia Nelligan | | 402,248 | |
| Darin Hunhoff | | 404,503 | |
| James Zappa | | 381,606 | |
| Richard Dusek | | 375,729 | |
| Angela Olsonawski | | 121,741 | |
| Timothy Skidmore | | 236,709 | |
Profit Sharing
Each Named Executive Officer is(other than Mr. Skidmore) was eligible to participate in our Profit Sharing Plan applicable to other employees. The purpose of the Profit Sharing Plan is to provide a direct link between employee pay and our profitability. Annual profit sharing contributions are calculated as a percent of base pay and annual variable pay (total earnings) and are made to the CHS Inc. 401(k) Plan ("401(k) Plan") account and CHS Inc. Deferred Compensation Plan ("Deferred Compensation Plan") account of each Named Executive Officer. The levels of fiscal 2020 profit sharing awards vary in relation to the level of CHS ROIC achieved and are displayed in the following table: | | | | | | | | |
| ROIC | | Profit Sharing Award |
| 6.9% | | 5% |
| 6.4% | | 4% |
| 5.9% | | 3% |
| 5.4% | | 2% |
| 4.9% | | 1% |
In fiscal 20192020 ROIC results were 9.6%5.1%. Accordingly, each Named Executive Officer (other than Mr. Skidmore) earned a 5%1.5% award under the Profit Sharing Plan. Profit Sharing Plan goals will continue to be based on an ROIC performance metric for fiscal 2020.
Long-Term Incentive Plans
Each Named Executive Officer is(other than Mr. Skidmore) was eligible to participate in our Long-Term Incentive Plan ("LTIP"). The purpose of the LTIP is to align long-term results with long-term performance goals, encourage our Named Executive Officers to maximize long-term value for our member-owners and retain key executives. The LTIP consists of three-year performance periods to ensure consideration is made for our long-term financial performance and strategic execution, with a new performance period beginning every year. Our Board of Directors approves the LTIP goals for each three-year period.
Awards from the LTIP are contributed to the Deferred Compensation Plan after the end of each performance period. These awards vest over an additional 28-month period following the performance period end date. The extended earning and vesting provisions of the LTIP are designed to help us retain key executives. Participants who leave CHS prior to retirement for reasons other than death or disability forfeit all unearned and unvested LTIP award balances. Participants who meet retirement criteria, die or become disabled receive prorated awards following the LTIP rules. Like the Annual Variable Pay Plan, award levels for the LTIP are set with regard to competitive considerations. Beginning with the fiscal 2018-2020 LTIP performance period, theThe target level LTIP award levels increased from 70% tolevel was 115% of base salary for Named Executive Officers, excluding Mr. Debertin, to improve our competitive position to market.
For the 3-year LTIP period ending in fiscal 2019,2020, the LTIP performance measure was based upon our ROAEROIC during the period. ROAEAs stated above, ROIC is a measurement of our profitabilityhow efficiently we use capital and the level of returns on that capital, and is calculated by dividing adjusted net income (earnings)operating profit after tax by adjustedfunded debt plus equity. To determine the equity and earnings adjustments, we subtract preferred stock dividends (paid on beginningFor purposes of the fiscal year preferred stock) from earnings and reduce equity by2018-2020 performance period, we define funded debt as the beginningaverage of long-term debt, including the current portion thereof, plus any guarantees thereof, as of the fiscal year preferred stock onend of July 2017, 2018, 2019 and 2020, respectively, and equity at the balance sheet. Earnings are subject to one-time exclusions or inclusions in any given fiscal year. ROAEend of July 2017, 2018 and 2019, respectively.
As also stated above, ROIC is not defined under U.S. GAAP. Therefore, it should not be considered a substitute for other measures prepared in accordance with U.S. GAAP and may not be comparable to similarly titled measures used by other companies.
Award opportunities for the fiscal 2017-20192018-2020 LTIP are expressed as a percentage of a participant’sparticipant's average base salary as of August 31 for each of the three years in the performance period. We must meet a three-year period threshold level of ROAEROIC performance for any participant to earn an award payout under the 2017-20192018-2020 LTIP. As indicated in the below table, the threshold, target, maximum and superior performance maximum ROAEROIC goals for the fiscal 2017-20192018-2020 performance period were 5.5%, 7%, 9% and 20%, respectively.are as follows:
| | | | | | | | | | | | | | |
| Performance Level | | CHS Three Year-ROIC | | Percent of Target Award |
| Superior performance maximum | | 6.7% | | 400% |
| Maximum | | 5.7% | | 200% |
| Target | | 4.7% | | 100% |
| Threshold | | 3.7% | | 50% |
| Below threshold | | <3.7% | | 0% |
|
| | | | |
| Performance Level | | CHS Three Year-ROAE | | Percent of Target Award |
| Superior performance maximum | | 20% | | 400% |
| Maximum | | 9% | | 200% |
| Target | | 7% | | 100% |
| Threshold | | 5.5% | | 50% |
| Below threshold | | <5.5% | | 0% |
Actual ROAEROIC performance for the fiscal 2017-20192018-2020 performance period was 6.8%was 7.9%. LTIP payments for the fiscal 2017-20192018-2020 LTIP for the Named Executive Officers are as follows:
| | | | | | | | |
| Name | | LTIP Payments |
| | (Dollars) |
| Jay Debertin | | $ | 6,152,095 | |
| Olivia Nelligan | | 509,832 | |
| Darin Hunhoff | | 2,544,868 | |
| James Zappa | | 2,400,820 | |
| Richard Dusek | | 2,379,008 | |
| Angela Olsonawski | | 770,664 | |
| Timothy Skidmore | | — | |
|
| | | |
| Name | LTIP Payments |
| | (Dollars) |
| Jay Debertin | $ | 1,692,275 |
|
| Timothy Skidmore | 403,187 |
|
| Darin Hunhoff | 351,304 |
|
| James Zappa | 331,220 |
|
| Richard Dusek | 250,413 |
|
Details for the fiscal 20192020 awards associated with the fiscal 2019-20212020-2022 LTIP performance period are provided in the "2019"2020 Grants of Plan-Based Awards" table.
Beginning with the fiscal 2018-2020 performance period, the LTIP ROAE performance metric was replaced with an ROIC performance metric, which is defined in the same manner as for AVP (see "Annual Variable Pay" above). ROIC will continue to be used as the LTIP performance metric for the fiscal 2020-2022 performance period.
Because Mr. Skidmore’s retirement will occur prior to him achieving ten years of service, he will not be eligible to vest in and will forfeit his LTIP payment for the fiscal 2017-2019 LTIP. In addition, because Mr. Skidmore's employment will endended prior to the end of each of the fiscal 2018-2020 and fiscal 2019-2021 performance periods, he was not eligible to earn any compensation under the 2018-2020 LTIP and will not be eligible to earn any compensation under either the 2018-2020 LTIP or the 2019-2021 LTIP. For a description of the payment that will be made to Mr. Skidmore under the Letter Agreement in recognition of, among other things, earned but unvested long-term incentive compensation that will be forfeited due to the end of Mr. Skidmore's employment prior to vesting, please see "Post Employment" below.
Other Compensation
To preserve key leadership continuity and bench strength, as well as a total direct compensation opportunity amount that is competitive to market, in April 2019, ourNovember 2017, the Board of Directors approved a potential retention incentive award (the "Retention("2017 Retention Award") for certain of our senior officers, including each of the Named Executive Officers who were both active participants in the 2015-2017 LTIP and active employees on the date the 2017 Retention Award was approved. The potential award value was the percentage of base salary used for the 2015-2017 LTIP awards at the threshold level, based on the participant’s job level as of the date the 2017 Retention Award was granted, and was earned only if the participant continued active employment through January 1, 2020, or met the limited pro ration criteria provided in the 2017 Retention Award.
Payments for the 2017 Retention Award for the Named Executive Officers are as follows:
| | | | | | | | |
| Name | | Retention Award Payment |
| | (Dollars) |
| Jay Debertin | | $ | 862,500 | |
| Darin Hunhoff | | 287,500 | |
| James Zappa | | 270,710 | |
| Richard Dusek | | 58,570 | |
| Angela Olsonawski | | 50,250 | |
| Timothy Skidmore | | 340,975 | |
Because Ms. Nelligan was not an active participant in the 2015-2017 LTIP or actively employed by us on the date the 2017 Retention Award was approved, she was not granted a 2017 Retention Award.
In addition, for the same reasons that our Board of Directors approved the 2017 Retention Award, in April 2019, our Board of Directors approved another potential retention incentive award ("2018 Retention Award") for certain of our senior officers, including each of the Named Executive Officers who were both active participants in the 2016-2018 LTIP and who were active employees on the date the 2018 Retention Award was approved. The potential award value is equal to the percentage of base salary used for the 2016-2018 LTIP awards at the target level, based on the participant'sparticipant’s job level as of August 31, 2018, multiplied by the participant'sparticipant’s base salary as of August 31, 2018. Pursuant to its original terms, the 2018 and, subject to the following sentence, willRetention Award would only be earned only if athe applicable participant continuescontinued active employment through January 1, 2021, or meetsmet the limited pro ration criteria provided in the 2018 Retention Award. However, in light of the COVID-19 pandemic and its potential impact on our fiscal 2021 business and financial performance, and the economy in general, and based upon the recommendation of the Governance Committee and the request of Messrs. Debertin, Dusek, Hunhoff, Zappa and our other eligible senior officers, in November 2020, our Board of Directors modified the terms of the Strategic Leadership Team 2018 Retention Award to provide that it will only be earned if the applicable participant continues active employment through January 1, 2022, except that, if the applicable participant’s employment ends voluntarily or involuntarily for a reason unrelated to misconduct between January 1,
2021, and January 1, 2022, the participant will earn and be paid the 2018Retention Award. Notwithstanding the foregoing, pursuant to the Skidmore Letter Agreement, provides that Mr. Skidmore will receivereceived a pro rata portion of the 2018 Retention Award in the amount of $170,191 within 60 days of his retirement on December 31, 2019.
Because Ms. Nelligan was not an active participant in the 2016-2018 LTIP or actively employed by us on the date the 2018 Retention Award was approved, she was not granted a 2018 Retention Award.
Retirement Benefits
We provide the following retirement and deferral programs to Named Executive Officers:
•CHS Inc. Pension Plan
•CHS Inc. 401(k) Plan
•CHS Inc. Supplemental Executive Retirement Plan
•CHS Inc. Deferred Compensation Plan
CHS Inc. Pension Plan
CHS Inc. 401(k) Plan
CHS Inc. Supplemental Executive Retirement Plan
CHS Inc. Deferred Compensation Plan
CHS Inc. Pension Plan
The CHS Inc. Pension Plan ("Pension Plan") is a tax-qualified defined benefit pension plan. All Named Executive Officers participate in the Pension Plan. A Named Executive Officer is fully vested in the Pension Plan after three years of vesting service. The Pension Plan provides for a lump sum payment of the participant’s account balance once the Named Executive Officer reaches normal retirement age (or, alternatively, for a monthly annuity for the Named Executive Officer's lifetime if elected by the Named Executive Officer). The normal form of benefit for a single Named Executive Officer is a life annuity and for a married Named Executive Officer the normal form of benefit is a 50% joint and survivor annuity. Other
annuity forms are also available on an actuarial equivalent basis. Compensation and benefits are limited based on limits imposed by the Internal Revenue Code.
A Named Executive Officer's benefit under the Pension Plan depends on pay credits to his or her account, which are based on the Named Executive Officer’sOfficer's total salary and annual variable pay for each year of employment, date of hire, age at date of hire and the length of service, and investment credits, which are computed using the interest crediting rate and the Named Executive Officer’sOfficer's account balance at the beginning of the plan year.
The amount of pay credits added to a Named Executive Officer's account each year is a percentage of the Named Executive Officer’s base salary and annual variable pay plus compensation reduction pursuant to the 401(k) Plan and any pretax contribution to any of our welfare benefit plans, paid vacations, paid leaves of absence and pay received if away from work due to a sickness or injury. The pay credits percentage received is determined on a yearly basis, based on the years of benefit service completed as of December 31 of each year. A Named Executive Officer receives one year of benefit service for every calendar year of employment in which the Named Executive Officer completed at least 1,000 hours of service.
Pay credits are earned according to the following schedules:
Regular Pay Credits
| | | | | | | | | | | | | | |
| | Regular Pay Credit |
| Years of Benefit Service | | Pay Below Social Security Taxable Wage Base | | Pay Above Social Security Taxable Wage Base |
| 1 - 3 years | | 3% | | 6% |
| 4 - 7 years | | 4% | | 8% |
| 8 - 11 years | | 5% | | 10% |
| 12 - 15 years | | 6% | | 12% |
| 16 years or more | | 7% | | 14% |
Mid-Career Pay Credits
Employees hired after age 40 qualify for the following minimum pay credit:
| | | | | | | | | | | | | | |
| | | Minimum Pay Credit |
| Age at Date of Hire | | Pay Below Social Security Taxable Wage Base | | Pay Above Social Security Taxable Wage Base |
| Age 40 - 44 | | 4% | | 8% |
| Age 45 - 49 | | 5% | | 10% |
| Age 50 or more | | 6% | | 12% |
Investment Credits
We credit a Named Executive Officer's account at the end of the calendar year with an investment credit based on the balance at the beginning of the year. The investment credit is based on the average return for one-year U.S. Treasury bills for the preceding 12-month period. The minimum interest rate under the Pension Plan is 4.65% and the maximum is 10%.
CHS Inc. 401(k) Plan
The 401(k) Plan is a tax-qualified defined contribution retirement plan. Most full-time, non-unionnonunion CHS employees are eligible to participate in the 401(k) Plan, including each Named Executive Officer. Participants may contribute between 1% and 50% of their pay on a pretax basis. We match 100% of the first 1% and 50% of the next 5% of pay contributed each year (maximum 3.5%). Our Board of Directors may elect to reduce or eliminate matching contributions for any year or any portion thereof. Participants are 100% vested in their own contributions and are fully vested after two years of service in matching contributions made on the participant’s behalf by us.
Non-participants Nonparticipants are automatically enrolled in the plan at a 3% contribution rate and, effective each January 1, the participant’sparticipant's contribution will be automatically increased by 1%. This escalation will stop once the participant’s contribution reaches 10%. The participant may elect to cancel or change these automatic deductions at any time.
CHS Inc. Supplemental Executive Retirement Plan and CHS Inc. Deferred Compensation Plan
Because the Internal Revenue Code limits the benefits that may be paid from the Pension Plan and the 401(k) Plan, the CHS Inc. Supplemental Executive Retirement Plan ("SERP") and the Deferred Compensation Plan were established to provide certain employees participating in the qualified plans with supplemental benefits such that, in the aggregate, they equal the benefits they would have been entitled to receive under the qualified plan had these limits not been in effect. The SERP also includes compensation deferred under the Deferred Compensation Plan that is excluded under the qualified retirement plan. All Named Executive Officers participate in the SERP. Participants in the plans are select management or highly compensated employees who have been designated as eligible by our CEO to participate.
Compensation includes total salary and annual variable pay without regard to limitations on compensation imposed by the Internal Revenue Code. Company contributions under the Pension Plan and 401(k) Plan are not eligible for pay credits.
Certain Named Executive Officers may have accumulated non-qualifiednonqualified plan balances or benefits that have been carried over from predecessor companies as a result of past mergers and acquisitions. Benefits from the SERP are primarily funded in a rabbi trust, with a balance at August 31, 2019,2020, of $31.3$33.6 million. Benefits from the plan do not qualify for special tax treatment under the Internal Revenue Code.
The Deferred Compensation Plan allows eligible Named Executive Officers to voluntarily defer receipt of up to 75% of their base salary and up to 100% of their annual variable pay. The election must occur prior to the beginning of the calendar year in which the compensation will be earned. During the year ended August 31, 2019,2020, all of the Named Executive Officers were eligible to participate in the Deferred Compensation Plan. Mr. Debertin, Mr. Skidmore,Ms. Nelligan, Mr. Zappa, Mr. Dusek, Ms. Olsonawski and Mr. DusekSkidmore participated in the elective portion of the Deferred Compensation Plan.
Benefits from the Deferred Compensation Plan are primarily funded in a rabbi trust, with a balance as of August 31, 2019,2020, of $125.8$136.1 million. Benefits from the plan do not qualify for special tax treatment under the Internal Revenue Code.
Health & Welfare Benefits
Like our other employees, each of the Named Executive Officers is entitled to receive benefits under our comprehensive health and welfare program. Like non-executivenonexecutive full-time employees, participation in the individual benefit plans is based on each Named Executive Officer’sOfficer's annual benefit elections and varies by individual.
Medical Plans
Named Executive Officers and their dependents may participate in our medical plan on the same basis as other eligible full-time employees. The plan provides each Named Executive Officer an opportunity to choose a level of coverage and coverage options with varying deductibles and co-pays to pay for hospitalization, physician and prescription drug expenses. The cost of this coverage is shared by us and the covered Named Executive Officer.
Dental, Vision and Hearing Plan
Named Executive Officers and their dependents may participate in our dental, vision and hearing plan on the same basis as other eligible full-time employees. The plan provides coverage for basic dental, vision and hearing expenses. The cost of this coverage is shared by us and the covered Named Executive Officer.
Life, AD&D and Dependent Life Insurance
Named Executive Officers and their dependents may participate in our basic life, optional life, accidental death and dismemberment ("AD&D") and dependent life plans on the same basis as other eligible full-time employees. The plans allow Named Executive Officers an opportunity to purchase group life insurance on the same basis as other eligible full-time employees. Basic life insurance equal to one times eligible compensation will be provided at our expense on the same basis as other eligible full-time employees. Named Executive Officers can choose various coverage levels of optional life insurance at their own expense on the same basis as other eligible full-time employees.
Short- and Long-term Disability
Named Executive Officers participate in our Short-Term Disability Plan ("STD") on the same basis as other eligible full-time employees. The Named Executive Officers also participate in an executive Long-Term Disability Plan ("LTD"). These plans replace a portion of income in the event that a Named Executive Officer is disabled under the terms of the plan and is unable to work full-time. The cost of STD and LTD coverage is paid by us.
Flexible Spending Accounts/Health Savings Accounts/Health Reimbursement Accounts
Named Executive Officers may participate in our Flexible Spending Account ("FSA") or Health Savings Account ("HSA") on the same basis as other eligible full-time employees. The FSA and HSA provide Named Executive Officers an opportunity to pay for certain eligible medical expenses on a pretax basis. Contributions to the FSA and HSA are made by the Named Executive Officer.
Travel Assistance Program and Identity Theft Protection
Like other non-executivenonexecutive full-time employees, each of the Named Executive Officers is covered by our travel assistance program and identity theft protection program. The travel assistance program provides AD&D protection should a covered injury or death occur while on a business trip. The identity theft protection program provides credit monitoring and restoration services to protect against identity theft.
Additional Benefits
Certain benefits such as executive physical examinations and limited financial planning assistance are available to our Named Executive Officers. These are provided as part of an overall total rewards package that strives to be competitive with comparable companies and retain individuals who are critical to us.
Incentive Compensation Recovery Policy
In July 2019, our Board of Directors adopted We have an Incentive Compensation Recovery Policy ("Recovery Policy") that applies to our current and former employees who are or were identified by us as an "officer" pursuant to Rule 16a-1(f) under the Securities Exchange Act of 1934 and theThe Nasdaq Stock Market listing standards ("Covered Employee").
The Recovery Policy provides that, in the event of a required revision of our previously issued financial statements to reflect the correction of one or more errors that are material to those financial statements, our Board of Directorswe will require reimbursement or forfeiture of any excess incentive compensation received by any Covered Employee during the three completed fiscal years immediately preceding the date on which we determine that we are required to prepare an accounting restatement. The amount of excess incentive compensation will be equal to the amount by which the Covered Employee’sEmployee's incentive compensation for the relevant period exceeded the amount that would have been earned or awarded based on the restated financial results, as determined by our Board of Directors. The method used to recover the applicable excess incentive compensation will be determined by our Board of Directors, in its sole discretion, and may include requiring reimbursement of cash incentive compensation that was previously paid, forfeiting any incentive compensation contribution made under the Deferred Compensation Plan, offsetting the recovered amount from any compensation or incentive compensation that may be earned or awarded in the future or taking any other remedial or recovery action permitted by law.
The Recovery Policy also provides that, in the event our Board of Directors determines in good faith that a Covered Employee has engaged in detrimental conduct, we may require the Covered Employee to reimburse or forfeit all or a portion of the incentive compensation earned by or awarded to the Covered Employee, or in which the Covered Employee has become vested under the terms of the Deferred Compensation Plan. For purposes of the Recovery Policy, detrimental conduct includes:
•deliberate and continued failure by a Covered Employee to substantially perform his or her duties and responsibilities in a manner that has an adverse effect on us;
•knowing and willful violation of any law, government regulation or company code of conduct or policy;
•fraud or dishonesty resulting or intended to result in personal enrichment at our expense; and/or
•gross misconduct in the performance of duties that results in economic harm to us.
Under the Recovery Policy, incentive compensation includes annual cash incentive awards granted pursuant to either the Annual Variable Pay Plan or an individual cash incentive plan, annual cash awards earned under the Profit Sharing Plan and cash-based performance awards granted pursuant to the LTIP or any successor plan; in each case, provided that such compensation is granted, earned or vested based wholly or in part on the attainment of a financial performance measure.
Agreements with Named Executive Officers
Mr. Debertin
On May 22, 2017, Mr. Debertin was elected as our President and CEO, and in connection therewith entered into an employment agreementthe Employment Agreement with us on that date ("Employment Agreement"). Thedate. On November 5, 2020, we entered into the Employment Agreement has an initialAmendment with Mr. Debertin, pursuant to which the term of three years ending onthe Employment Agreement was extended to August 31, 2020,2023, provided that, pursuant to the terms of the Employment Agreement, beginning on August 31, 2020,2023, and on each anniversary dateAugust 31 thereafter, the termEmployment Agreement will be automatically renewedrenew for an additional one-year period, unless either party notifies the other in writing, at least 120 days in advance of the relevant anniversaryrenewal date, of its intent not to renew the agreement for the additional one-year period. Pursuant to the terms of the Employment Agreement, Mr. Debertin is entitled to, among other things:
•An annual base salary of $1,150,000, subject to increase by our Board of Directors from time to time;
•A target annual incentive compensation award of 150% of his base salary with a maximum potential annual incentive compensation award of 300% of his base salary, based on achievement of performance targetsgoals set by our Board of Directors; and
•A target long-term incentive compensation award of 150% of his average base salary during the three-year performance period applicable to that award opportunity, with a maximum superior performance potential long-term incentive compensation award of 500% of his average base salary during the three-year performance period applicable to that award.
The Employment Agreement provides that in the event of a restatement of our financial results due to material noncompliance with financial reporting requirements, if our Board of Directors determines in good faith that any compensation paid (or payable but not yet paid) to Mr. Debertin was awarded or determined based on that material noncompliance, then we are entitled to recover from him (or to reduce compensation determined but not yet paid) all compensation based on the erroneous financial data in excess of what would have been paid or been payable to him under the restatement.
The severance pay and benefits to which Mr. Debertin would be entitled if we terminated his employment without cause or, if he terminated his employment for "good reason" are described below under "Post Employment."
Ms. Nelligan
Ms. Nelligan's compensation is set forth in the Nelligan Letter Agreement. The Nelligan Letter Agreement provides Ms. Nelligan with an initial annual base salary of $570,000 and a hiring bonus of $200,000 (which bonus amount is the amount to be paid to Ms. Nelligan, after applicable tax withholding), $100,000 of which was paid as a lump sum within 30 days of January 29, 2020 (the "First Hiring Bonus Payment"), and $100,000 of which will be paid as a lump sum within 30 days following one year of employment with us (the "Second Hiring Bonus Payment"). In the event Ms. Nelligan voluntarily terminates, resigns or otherwise ends her relationship with us without good reason within one year of her start date, the Nelligan Letter Agreement provides that she will reimburse us at the rate of 1/12th of the First Hiring Bonus Payment for each uncompleted month in such first year of employment. Similarly, in the event Ms. Nelligan voluntarily terminates, resigns or otherwise ends her relationship with us without good reason during the second year of her employment with us, the Nelligan Letter Agreement provides that she will reimburse us at the rate of 1/12th of the total amount of the Second Hiring Bonus Payment for each uncompleted month in such second year of employment.
The Nelligan Letter Agreement provides that Ms. Nelligan's target award for purposes of the Annual Variable Pay Plan will be equal to 115% of her annual base salary on August 31 of each year, and, as stated above, requires us to give Ms. Nelligan a full year of credit for the fiscal 2020 Annual Variable Pay Plan, rather than prorate her award for the time that she was employed by us during fiscal 2020.
The severance pay and benefits to which Ms. Nelligan would be entitled if we terminated her employment without cause or if she terminated her employment for "good reason" are described below under "Post Employment."
Mr. Skidmore
In connection with Mr. Skidmore's retirement from CHS on December 31, 2019, we entered into the Skidmore Letter Agreement with Mr. Skidmore. The Skidmore Letter Agreement, as well as the payments to which Mr. Skidmore will bewas entitled to thereunder in connection with his retirement, are described below under "Post Employment."
Mr. Zappa, our executive vice president and general counsel, joined us in April 2015 and the terms of his employment provided for certain payments to him in respect of compensation earned from his former employer during past periods but forfeited in order to accept employment with us due to vesting requirements and other restrictions. Specifically, Mr. Zappa was entitled to receive three payments on the following schedule: $101,667 in April 2015; $101,667 in April 2016; and $101,667 in April 2017.
Tax Considerations
Section 162(m) of the Internal Revenue Code ("Section 162(m)") generally limits us to a deduction for federal income tax purposes of no more than $1 million of compensation paid to certain current and former executive officers in a taxable year. However, historically, the $1 million deduction limit did not apply to compensation that satisfied Section 162(m) requirements for qualified performance-based compensation. Accordingly, we historically attempted to preserve deductibility under the Internal Revenue Code of compensation paid to our executive officers while maintaining compensation programs to attract and retain highly qualified executives in a competitive environment. However, effective for tax years beginning after December 31, 2017, the exemption for qualified performance-based compensation from the $1 million deduction limitation contained in Section 162(m) was repealed, unless certain transition relief for certain compensation arrangements in place as of November 2, 2017, is available. As such, certain compensation paid in excess of $1 million, which was historically deductible by us for federal tax purposes, is no longer deductible.
We believe that Section 162(m) is only one of several relevant considerations in setting compensation. We also believe that Section 162(m) should not be permitted to compromise our ability to design and maintain executive compensation
arrangements that, among other things, are intended to attract and retain highly qualified executives in a competitive environment. As a result, we retain the flexibility to provide compensation that we determine to be in our best interests and the best interests of our member-owners, even if that compensation ultimately is not deductible for tax purposes.
Shareholder Advisory Votes on Executive Compensation
We are not required to, and do not, conduct shareholder advisory votes on executive compensation under Section 14A of the Securities Exchange Act of 1934.
Summary Compensation Table
| | | Name and Principal Position | | Year | | Salary (1)(2) | | Bonus (2)(3)(4)(5) | | Non-Equity
Incentive Plan Compensation (1)(2)(6) | | Change in Pension
Value and
Nonqualified
Deferred
Compensation Earnings (2)(7) | | All Other
Compensation (2)(8-14) | | Total (2) | Name and Principal Position | | Year | | Salary
(1)(2) | | Bonus
(1)(3)(4) | | Non-Equity
Incentive Plan
Compensation (1)(5) | | Change in Pension
Value and
Nonqualified
Deferred
Compensation
Earnings
(1)(6) | | All Other
Compensation (1)(7-12) | | Total
(1) |
| | | (Dollars) | | | | | (Dollars) |
Jay Debertin President and Chief Executive Officer | | 2019 | | $ | 1,218,042 |
| | $ | — |
| | $ | 5,405,339 |
| | $ | 1,307,488 |
| | $ | 410,651 |
| | $ | 8,341,520 |
| Jay Debertin
President and Chief Executive Officer | | 2020 | | $ | 1,262,442 | | | $ | — | | | $ | 8,188,034 | | | $ | 1,267,791 | | | $ | 435,790 | | | $ | 11,154,057 | |
| | 2018 | | 1,169,167 |
| | — |
| | 3,473,839 |
| | 372,721 |
| | 90,579 |
| | 5,106,306 |
| | 2019 | | 1,218,042 | | | — | | | 5,405,339 | | | 1,307,488 | | | 410,651 | | | 8,341,520 | |
| | 2017 | | 815,365 |
| | — |
| | 862,500 |
| | 293,497 |
| | 41,611 |
| | 2,012,973 |
| | 2018 | | 1,169,167 | | | — | | | 3,473,839 | | | 372,721 | | | 90,579 | | | 5,106,306 | |
Timothy Skidmore Executive Vice President and Chief Financial Officer | | 2019 | | 615,929 |
| | — |
| | 1,615,251 |
| | 316,033 |
| | 151,172 |
| | 2,698,385 |
| |
| | 2018 | | 602,883 |
| | — |
| | 1,115,086 |
| | 106,115 |
| | 44,133 |
| | 1,868,217 |
| |
| | 2017 | | 523,500 |
| | 100,000 |
| | 207,550 |
| | 95,952 |
| | 30,114 |
| | 957,116 |
| |
Olivia Nelligan
Executive Vice President and Chief Financial Officer | | Olivia Nelligan
Executive Vice President and Chief Financial Officer | | 2020 | | 339,076 | | | 100,000 | | | 912,080 | | | 37,620 | | | 90,511 | | | 1,479,287 | |
| Darin Hunhoff Executive Vice President, Energy and Processing | | 2019 | | 547,667 |
| | — |
| | 1,631,254 |
| | 611,133 |
| | 160,989 |
| | 2,951,043 |
| Darin Hunhoff
Executive Vice President, Energy and Processing | | 2020 | | 567,630 | | | — | | | 3,236,871 | | | 563,056 | | | 167,292 | | | 4,534,849 | |
| | 2018 | | 520,000 |
| | — |
| | 1,219,000 |
| | 56,050 |
| | 38,457 |
| | 1,833,507 |
| | 2019 | | 547,667 | | | — | | | 1,631,254 | | | 611,133 | | | 160,989 | | | 2,951,043 | |
| | 2017 | | 443,670 |
| | 100,000 |
| | 175,000 |
| | 75,198 |
| | 18,030 |
| | 811,898 |
| | 2018 | | 520,000 | | | — | | | 1,219,000 | | | 56,050 | | | 38,457 | | | 1,833,507 | |
| James Zappa Executive Vice President and General Counsel | | 2019 | | 516,667 |
| | — |
| | 1,538,720 |
| | 285,992 |
| | 141,526 |
| | 2,482,905 |
| James Zappa Executive Vice President and General Counsel | | 2020 | | 535,500 | | | — | | | 3,053,136 | | | 305,866 | | | 153,021 | | | 4,047,523 | |
| | 2018 | | 490,267 |
| | — |
| | 1,086,591 |
| | 68,928 |
| | 42,646 |
| | 1,688,432 |
| | 2019 | | 516,667 | | | — | | | 1,538,720 | | | 285,992 | | | 141,526 | | | 2,482,905 | |
| | 2017 | | 467,223 |
| | 201,667 |
| | 164,780 |
| | 69,638 |
| | 23,142 |
| | 926,450 |
| | 2018 | | 490,267 | | | — | | | 1,086,591 | | | 68,928 | | | 42,646 | | | 1,688,432 | |
| Richard Dusek Executive Vice President, CHS Country Operations | | 2019 | | 513,696 |
| | — |
| | 1,360,928 |
| | 465,830 |
| | 142,030 |
| | 2,482,484 |
| Richard Dusek Executive Vice President, CHS Country Operations | | 2020 | | 528,941 | | | — | | | 2,813,307 | | | 415,431 | | | 149,864 | | | 3,907,543 | |
| | 2018 | | 468,012 |
| | — |
| | 1,137,174 |
| | 20,449 |
| | 39,089 |
| | 1,664,724 |
| | 2019 | | 513,696 | | | — | | | 1,360,928 | | | 465,830 | | | 142,030 | | | 2,482,484 | |
| | | | | | | | | | | | | | | 2018 | | 468,012 | | | — | | | 1,137,174 | | | 20,449 | | | 39,089 | | | 1,664,724 | |
Angela Olsonawski
Senior Vice President, Corporate Treasurer and Former Interim Chief Financial Officer | | Angela Olsonawski
Senior Vice President, Corporate Treasurer and Former Interim Chief Financial Officer | | 2020 | | 357,204 | | | 25,000 | | | 942,655 | | | 296,788 | | | 69,996 | | | 1,691,643 | |
| Timothy Skidmore
Former Executive Vice President and Chief Financial Officer | | Timothy Skidmore
Former Executive Vice President and Chief Financial Officer | | 2020 | | 278,196 | | | — | | | 577,684 | | | 153,815 | | | 945,910 | | | 1,955,605 | |
| | 2019 | | 615,929 | | | — | | | 1,615,251 | | | 316,033 | | | 151,172 | | | 2,698,385 | |
| | 2018 | | 602,883 | | | — | | | 1,115,086 | | | 106,115 | | | 44,133 | | | 1,868,217 | |
(1) Amounts reflect the gross salary and non-equity incentive plan compensation, as applicable, and include any applicable deferrals. Mr. Debertin deferred $3,493,832 in fiscal 2019, $157,167 in fiscal 2018 and $0 in fiscal 2017; Mr. Skidmore deferred $722,060 in fiscal 2019, $303,483 in fiscal 2018 and $52,350 in fiscal 2017; Mr. Zappa deferred $543,295 in fiscal 2019 and $82,390 in fiscal 2018; and Mr. Dusek deferred $227,435 in fiscal 2019 and $0 in fiscal 2018 (Mr. Dusek was not a Named Executive Officer in fiscal 2017).
(2) Information on Mr. DusekMs. Nelligan and Ms. Olsonawski includes compensation beginning in fiscal 2018,2020, the first year in which hethey became a Named Executive Officer.Officers.
(2) Salary for Mr. Skidmore includes base pay and accrued paid time off that was paid upon his departure.
(3) Includes paymentshiring bonus payment to Mr. SkidmoreMs. Nelligan of $100,000 in fiscal 2017 for providing additional strong leadership and significant time commitment to the ongoing management of multiple business and financial challenges in addition to performing his regular executive vice president and chief financial officer role.$100,000.
(4) Includes payments$25,000 recognition bonus paid to Mr. ZappaMs. Olsonawski for performing the role of $201,667interim chief financial officer.
(5) Amounts include 2017 Retention Awards earned in fiscal 2017, $100,000 of which was for providing additional strong leadership of and significant time commitment to the ongoing management of multiple business and governance challenges in addition to performing his regular executive vice president and general counsel role, and $101,667 of which covered earned and forfeited compensation from previous employment.
(5) Includes payment to Mr. Hunhoff of $100,000 in fiscal 2017 for taking on additional leadership roles in addition to performing his new role as executive vice president, Energy and Foods.
(6) Amounts include2020, annual variable pay awards and long-term incentive awards.
The actual 2017 Retention Award value was as follows in fiscal 2020: Mr. Debertin, $862,500; Mr. Hunhoff, $287,500; Mr. Zappa, $270,710; Mr. Dusek, $58,570; Ms. Olsonawski, $50,250; and Mr. Skidmore, $340,975.
The actual annual variable pay award value was as follows in fiscal 2020, 2019 2018 and 2017,2018, respectively: Mr. Debertin, $1,173,439, $3,713,064 $3,473,839 and $862,500; Mr. Skidmore, $1,202,064, $1,115,086 and $207,550; Mr. Hunhoff, $1,279,950, $1,219,000 and $175,000; Mr. Zappa, $1,207,500, $1,086,591 and $164,780; Mr. Dusek, $1,110,515 and $1,137,174 (Mr. Dusek$3,473,839; Ms. Nelligan, $402,248 (Ms. Nelligan was not a Named Executive Officer in fiscal 2017).2018 or 2019); Mr. Hunhoff, $404,503, $1,279,950 and $1,219,000; Mr. Zappa, $381,606, $1,207,500 and $1,086,591; Mr. Dusek, $375,729, $1,110,515 and $1,137,174; Ms. Olsonawski, $121,741 (Ms. Olsonawski was not a Named Executive Officer in fiscal 2018 or 2019); and Mr. Skidmore, $236,709 (per the Skidmore Letter Agreement), $1,202,064 and $1,115,085.
These annual variable pay award values exclude awards in the following amounts with respect to fiscal 2018 that our Board of Directors reduced at the voluntary request of the Named Executive Officers in connection with our restated financial statements: Mr. Debertin, $62,411; Mr. Skidmore, $73,213; Mr. Zappa, $63,410; Mr. Dusek, $6,213; and Mr. Dusek, $6,213.Skidmore, $73,213.
The actual long-term incentive award value was as follows in fiscal 2020, 2019 2018 and 2017,2018, respectively: Mr. Debertin, $6,152,095, $1,692,275 $0 and $0; Mr. Skidmore, $403,187, $0 and $0; Mr. Hunhoff, $351,304, $0 and $0; Mr. Zappa, $331,220, $0 and $0; Mr. Dusek, $250,413 and $0 (Mr. DusekMs. Nelligan $509,832 (Ms. Nelligan was not a Named Executive Officer in fiscal 2017).
2018 or 2019); Mr. Hunhoff, $2,544,868, $351,304 and $0; Mr. Zappa, $2,400,820, $331,220 and $0; Mr. Dusek, $2,379,008, $250,413 and $0; Ms. Olsonawski $770,664 (Ms. Olsonawski was not a Named Executive Officer in fiscal 2018 or 2019); and Mr. Skidmore, $0, $403,187 and $0.
Because Mr. Skidmore's retirement will occuroccurred prior to him achieving ten10 years of service, he willwas not be eligible to vest in and will forfeitforfeited his LTIP payment for the fiscal 2017-2019 LTIP. In addition, because Mr. Skidmore's employment ended prior to the end of the fiscal 2018-2020 performance period, he was not eligible to earn any compensation under the fiscal 2018-2020 LTIP. For a description of the payment that will be made to Mr. Skidmore under the Skidmore Letter Agreement in recognition of, among other things, earned but unvested long-term incentive compensation that will behas been forfeited due to the end of Mr. Skidmore's employment prior to vesting, please see "Post Employment" below.
(7)(6) This column represents both changes in pension value and above-market earnings on deferred compensation. Change in pension value is the aggregate change in the actuarial present value of the Named Executive Officer's benefit under his or her retirement program and nonqualified earnings, if applicable.
The aggregate change in the actuarial present value was as follows in fiscal 2020, 2019 2018 and 2017,2018, respectively: Mr. Debertin, $1,245,229, $267,017$1,086,570, 1,245,229 and $175,298; Mr. Skidmore, $305,723, $89,520 and $79,807; Mr. Hunhoff, $607,801, $49,824 and $68,620; Mr. Zappa, $285,992, $68,928 and $69,638; and Mr. Dusek, $460,972 and $12,951 (Mr. Dusek$267,017; Ms. Nelligan, $37,484 (Ms. Nelligan was not a Named Executive Officer in fiscal 2017).2018 or 2019); Mr. Hunhoff, $552,962, $607,801 and $49,824; Mr. Zappa, $305,866, $285,992 and $68,928; Mr. Dusek, $394,289, $460,972 and $12,951; Ms. Olsonawski, $287,689 (Ms. Olsonawski was not a Named Executive Officer in fiscal 2018 or 2019); and Mr. Skidmore, $132,576, $305,723 and $89,520.
Above-market earnings on deferred compensation represent earnings exceeding 120% of the Federal Reserve long-term rate as determined by the Internal Revenue Service ("IRS") on applicable funds and was as follows in fiscal 2020, 2019 2018 and 2017,2018, respectively: Mr. Debertin, $181,221, $62,259 $105,704 and $118,199; Mr. Skidmore, $10,310, $16,595 and $16,145; Mr. Hunhoff, $3,332, $6,226 and $6,578; Mr. Zappa, $0, $0 and $0; and Mr. Dusek, $4,858 and $7,498 (Mr. Dusek$105,704; Ms. Nelligan, $136 (Ms. Nelligan was not a Named Executive Officer in fiscal 2017).2018 or 2019); Mr. Hunhoff, $10,094, $3,332 and $6,226; Mr. Zappa, $0, $0 and $0; Mr. Dusek, $21,142, $4,858 and $7,498; Ms. Olsonawski, $9,099 (Ms. Olsonawski was not a Named Executive Officer in fiscal 2018 or 2019); and Mr. Skidmore, 21,239$, $10,310 and $16,595.
(8) Amounts may include executive LTD paid by us, travel accident insurance, executive physical, contributions by us during each fiscal year to qualified and non-qualified defined contribution plans, spousal travel and financial planning.
(9)(7) Includes fiscal 2019 executive LTD of $3,221 for all Named Executive Officers.
(10) Includes fiscal 20192020 employer contributions to the Deferred Compensation Plan: Mr. Debertin, $371,407; Mr. Skidmore, $127,290;$405,414; Mr. Hunhoff, $128,810;$140,698; Mr. Zappa, $115,134;$131,863; Mr. Dusek, $123,362; and Ms. Olsonawski, $47,111.
(8) For fiscal 2020, includes executive LTD, travel accident insurance, executive physical, financial planning and health assessment for Mr. Debertin.
(9) For fiscal 2020, includes executive LTD, travel accident insurance, executive physical and financial planning for Mr. Hunhoff and Mr. Dusek, $118,989.Dusek.
(11)(10) Includes fiscal 20192020 employer contribution to the 401(k) Plan: Mr. Debertin, $15,271;$15,692; Ms. Nelligan, $3,800; Mr. Hunhoff $15,875; Mr. Zappa, $15,750; Mr. Dusek, $14,103; Ms. Olsonawski, $18,502; and Mr. Skidmore $15,284; Mr. Hunhoff $15,375; Mr. Zappa, $15,300;$1,845.
(11) For fiscal 2020, includes moving and Mr. Dusek, $12,894.relocation expenses, a legal fee reimbursement and aggregate gross-ups for taxes of $64,124, in each case, in accordance with the Nelligan Letter Agreement, as well as a nonqualified 401(k) and Pension Match Make-up contribution, executive LTD, travel accident insurance and health assessment for Ms. Nelligan.
(12) IncludesFor fiscal 20192020, includes $152,004 nonqualified 401(k) Match Make-up and Profit Sharing payment, $790,173 in payments pursuant to the Skidmore Letter Agreement, executive physical examinations for the following Named Executive Officers: Mr. Debertin, $3,870; and Mr. Hunhoff, $7,488.
(13) Includes fiscal 2019 executiveLTD, financial planning for the following Named Executive Officers: Mr. Debertin, $6,740; Mr. Skidmore, $1,035; Mr. Hunhoff, $905; Mr. Zappa, $2,810; and Mr. Dusek, $1,815.
(14) Includes fiscal 2019 spousal travel accident insurance for Mr. Debertin of $745.Skidmore.
Agreements with Named Executive Officers
On May 22, 2017, we entered an Employment Agreement with Mr. Debertin, our President and Chief Executive Officer.Officer, which was amended by the Employment Agreement Amendment on November 5, 2020. The Employment Agreement, as amended by the Employment Agreement Amendment, supersedes all previous agreements we had with Mr. Debertin. The Employment Agreement was entered into in order to clearly define the obligations of the parties thereto with respect to employment matters, as well as the compensation and benefits to be provided to Mr. Debertin upon termination of employment. Other details of the Employment Agreement, as amended by the Employment Agreement Amendment, and Mr. Debertin’s Employment ArrangementDebertin's employment arrangement with us are described in "Compensation Discussion and Analysis" above.
In connection with Mr. Skidmore's retirement from CHS on December 31, 2019, we entered into the Letter Agreement with Mr. Skidmore. Details of the Letter Agreement are described below under the heading "Post Employment." In addition, the severance payments to which Mr. Skidmore would be entitled under his employment term sheet with us if we terminated his employment without cause or if he terminated his employment for "good reason" are also described below under the heading "Post Employment."
The severance payments to which Mr. Zappa would be entitled under his employment term sheet with us if we terminated his employment without cause or if he terminated his employment for "good reason" are described below under the heading "Post Employment." Other details of Mr. Zappa's employment arrangement with us are described in "Compensation Discussion and Analysis" above.
The severance payments to which Ms. Nelligan would be entitled under the Nelligan Letter Agreement if we terminated her employment without cause or if she terminated her employment for "good reason" are described below under the heading "Post Employment." Other details of the Nelligan Letter Agreement and Ms. Nelligan's employment arrangement with us are described in "Compensation Discussion and Analysis" above.
In connection with Mr. Skidmore's retirement from CHS on December 31, 2019, we entered into the Skidmore Letter Agreement with Mr. Skidmore. Details of the Skidmore Letter Agreement are described below under the heading "Post Employment."
20192020 Grants of Plan-Based Awards
| | | | | Estimated Future Payouts Under Non-Equity Incentive Plan Awards | | Estimated Future Payouts Under
Nonequity Incentive Plan Awards |
| Name | | Grant Date | | Threshold | | Target | | Maximum | Name | | Grant Date | | Threshold | | Target | | Maximum |
| | | (Dollars) | | | | | (Dollars) |
| Jay Debertin | | 9/6/2018(1) | | $ | 884,063 |
| | $ | 1,768,125 |
| | $ | 3,536,250 |
| Jay Debertin | | 9/5/2019(1) | | $ | 928,266 | | | $ | 1,856,532 | | | $ | 3,713,064 | |
| | | 9/6/2018(2) | | 884,063 |
| | 1,768,125 |
| | 5,893,750 |
| | 9/5/2019(2) | | 928,266 | | | 1,856,532 | | | 6,188,440 | |
| | | 4/3/2019(3) | | — |
| | 1,768,125 |
| | — |
| |
| Timothy Skidmore | | 9/6/2018(1) | | 349,499 |
| | 698,999 |
| | 1,397,998 |
| |
| | | 9/6/2018(2) | | 349,499 |
| | 698,999 |
| | 2,795,995 |
| |
| Olivia Nelligan | | Olivia Nelligan | | 1/29/2020(1) | | 327,750 | | | 655,500 | | | 1,311,000 | |
| | | 4/3/2019(3) | | — |
| | 425,478 |
| | — |
| | 1/29/2020(2) | | 327,750 | | | 655,500 | | | 2,622,000 | |
| Darin Hunhoff | | 9/6/2018(1) | | 304,750 |
| | 609,500 |
| | 1,219,000 |
| Darin Hunhoff | | 9/5/2019(1) | | 325,738 | | | 651,475 | | | 1,302,950 | |
| | | 9/6/2018(2) | | 304,750 |
| | 609,500 |
| | 2,438,000 |
| | 9/5/2019(2) | | 325,738 | | | 651,475 | | | 2,605,900 | |
| | | 4/3/2019(3) | | — |
| | 371,000 |
| | — |
| |
| James Zappa | | 9/6/2018(1) | | 287,500 |
| | 575,000 |
| | 1,150,000 |
| James Zappa | | 9/5/2019(1) | | 301,875 | | | 603,750 | | | 1,207,500 | |
| | | 9/6/2018(2) | | 287,500 |
| | 575,000 |
| | 2,300,000 |
| |
| | | 4/3/2019(3) | | — |
| | 350,000 |
| | — |
| | 9/5/2019(2) | | 301,875 | | | 603,750 | | | 2,415,000 | |
| Richard Dusek | | 9/6/2018(1) | | 285,847 |
| | 571,694 |
| | 1,143,388 |
| Richard Dusek | | 9/5/2019(1) | | 300,139 | | | 600,278 | | | 1,200,556 | |
| | | 9/6/2018(2) | | 285,847 |
| | 571,694 |
| | 2,286,775 |
| | 9/5/2019(2) | | 300,139 | | | 600,278 | | | 2,401,113 | |
| Angela Olsonawski | | Angela Olsonawski | | 9/5/2019(1) | | 122,570 | | | 245,140 | | | 490,280 | |
| | | 4/3/2019(3) | | — |
| | 347,988 |
| | — |
| | 9/5/2019(2) | | 122,570 | | | 245,140 | | | 980,560 | |
| Timothy Skidmore | | Timothy Skidmore | | 9/5/2019(1) | | 356,490 | | | 356,490 | | | 1,425,959 | |
(1) Represents range of possible awards under our fiscal 20192020 Annual Variable Pay Plan.
Pursuant to Mr. Skidmore's letter agreement, a prorated portion of his annual variable pay award under the Annual Variable Pay Plan for 2020, based on the number of days he was employed by us during fiscal 2020, and calculated at the target level, was paid to Mr. Skidmore.
(2) Represents range of possible awards under our LTIP for the fiscal 2019-20212020-2022 performance period. Goals are based on achieving a three-year ROIC of 4.9% threshold, 5.9% target and 6.9% maximum plus a potential award for 7.9% superior ROIC performance. Values displayed in the maximum column reflect 7.9% superior ROIC performance award potential. The 5.7% maximum performance award values are not listed in this table. Awards are earnedmeasured over a three-year period and vest over an additional 28-month period.
Because Mr. Skidmore's employment will end prior to the end of fiscal 2019-2021 performance period, he will not be eligible to earn any compensation under the 2019-2021 LTIP.
(3) Represents the maximum potential award opportunity with respect to the Retention Award. Subject to the following sentence, the Retention Award is earned only if a participant continues active employment through January 1, 2021, or meets the limited pro rata criteria provided in the award. For a description of the Award that will be made to Mr. Skidmore under the Letter Agreement please see "Post Employment" below.
The material terms of annual variable pay and long-term incentive awards that are disclosed in this table, including the vesting schedule, are described under "Compensation Discussion and Analysis" above.
20192020 Pension Benefits
| | | Name | | Plan Name | | Number of Years of Credited Service | | Actuarial Present Value of Accumulated Benefits | Name | | Plan Name | | Number of Years of Credited Service | | Present Value of Accumulated Benefits | | Payments During Last Fiscal Year |
| | | | | (Years) | | (Dollars) | | | | | (Years) | | (Dollars) | | (Dollars) |
Jay Debertin(1) | | Pension Plan | | 35.2500 | | $ | 1,104,675 |
| Jay Debertin(1) | | Pension Plan | | 36.2500 | | $ | 1,192,910 | | | $ | — | |
| | | SERP | | 35.2500 | | 3,977,697 |
| | | SERP | | 36.2500 | | 4,976,032 | | | — | |
| Timothy Skidmore | | Pension Plan | | 6.0000 | | 182,996 |
| |
| Olivia Nelligan | | Olivia Nelligan | | Pension Plan | | 0.5833 | | — | | | — | |
| | | SERP | | 6.0000 | | 653,225 |
| | SERP | | 0.5833 | | 37,484 | | | — | |
| Darin Hunhoff | | Pension Plan | | 27.2500 | | 769,510 |
| Darin Hunhoff | | Pension Plan | | 28.2500 | | 880,370 | | | — | |
| | | SERP | | 27.2500 | | 827,260 |
| | | SERP | | 28.2500 | | 1,269,362 | | | — | |
| James Zappa | | Pension Plan | | 3.3333 | | 124,074 |
| James Zappa | | Pension Plan | | 4.3333 | | 162,726 | | | — | |
| | | SERP | | 3.3333 | | 454,168 |
| | | SERP | | 4.3333 | | 721,382 | | | — | |
| Richard Dusek | | Pension Plan | | 31.0833 | | 898,434 |
| |
Richard Dusek(1) | | Richard Dusek(1) | | Pension Plan | | 32.0833 | | 993,404 | | | — | |
| | | SERP | | 31.0833 | | 617,051 |
| | SERP | | 32.0833 | | 916,370 | | | — | |
| Angela Olsonawski | | Angela Olsonawski | | Pension Plan | | 18.0000 | | 516,387 | | | — | |
| | | SERP | | 18.0000 | | 349,303 | | | — | |
| Timothy Skidmore | | Timothy Skidmore | | Pension Plan | | 7.0000 | | 192,170 | | | — | |
| | | SERP | | 7.0000 | | 776,627 | | | 776,627 | |
(1) Mr. Debertin isand Mr. Dusek are eligible for early retirement in both the Pension Plan and the SERP.
The above table shows the present value of accumulated retirement benefits that Named Executive Officers are entitled to under the Pension Plan and the SERP.
For a discussion of the material terms and conditions of the Pension Plan and the SERP, see "Compensation Discussion and Analysis" above.
The present value of accumulated benefits is determined in accordance with the same assumptions outlined in Note 11, 13, Benefit Plans, of the notes to the consolidated financial statements that are included in this Annual Report on Form 10-K:
•Discount rate of 3.03%2.63% for the Pension Plan and 2.53%1.88% for the SERP;
RP 2014 Mortality Table with a fully generational projection reflecting scale MP 2017 from 2006;
•Each Named Executive Officer is assumed to retire at the earliest retirement age at which unreduced benefits are available (age 65). The early retirement benefit under the cash balance plan formula is equal to the participant’s account balance; and
•Payments under the cash balance formula of the Pension Plan assume a lump sum payment. SERP benefits are payable as a lump sum.
The normal form of benefit for a single Named Executive Officer is a life only annuity, and for a married Named Executive Officer the normal form of benefit is a 50% joint and survivor annuity. Other annuity forms are also available on an actuarial equivalent basis. A lump sum option is also available.
All Named Executive Officers' retirement benefits at normal retirement age will be equal to their accumulated benefits under the Pension Plan and the SERP, as described under "Compensation Discussion and Analysis" above.
20192020 Nonqualified Deferred Compensation
| | | | | | | | | | | | | | | | | | | | | | | | | | | | | | | | |
| Name | | Executive
Contributions in
Last Fiscal Year (1) | | Registrant
Contributions in
Last Fiscal Year (2) | | Aggregate
Earnings in Last Fiscal Year (3) | | Aggregate
Withdrawals/
Distributions | | Aggregate Balance
at Last Fiscal Year End (2)(4) |
| | (Dollars) |
| Jay Debertin | | $ | 3,809,109 | | | $ | 2,088,162 | | | $ | 634,615 | | | $ | 3,463,777 | | | $ | 16,458,322 | |
| Olivia Nelligan | | 66,500 | | | — | | | 3,962 | | | — | | | 70,462 | |
| Darin Hunhoff | | — | | | 488,696 | | | 338,275 | | | 255,331 | | | 3,260,422 | |
| James Zappa | | 603,750 | | | 459,984 | | | 283,232 | | | — | | | 2,921,221 | |
| Richard Dusek | | 333,155 | | | 371,364 | | | 68,751 | | | — | | | 1,979,744 | |
| Angela Olsonawski | | 311,095 | | | 164,751 | | | 121,517 | | | — | | | 1,787,839 | |
| Timothy Skidmore | | 652,531 | | | — | | | 141,009 | | | 5,274,488 | | | — | |
|
| | | | | | | | | | | | | | | | | | | | |
| Name | | Executive Contributions in Last Fiscal Year (1) | | Registrant
Contributions in Last Fiscal Year (2) | | Aggregate Earnings in Last Fiscal Year (3) | | Aggregate
Withdrawals/ Distributions | | Aggregate Balance
at Last Fiscal Year End (2)(4) |
| | | (Dollars) |
| Jay Debertin | | $ | 3,493,832 |
| | $ | 371,407 |
| | $ | 506,870 |
| | $ | 1,876,339 |
| | $ | 13,390,214 |
|
| Timothy Skidmore | | 722,060 |
| | 127,290 |
| | 149,635 |
| | — |
| | 4,480,949 |
|
| Darin Hunhoff | | — |
| | 128,810 |
| | 61,884 |
| | — |
| | 2,688,783 |
|
| James Zappa | | 543,295 |
| | 115,134 |
| | 90,090 |
| | — |
| | 1,574,256 |
|
| Richard Dusek | | 227,435 |
| | 118,989 |
| | 41,653 |
| | — |
| | 1,206,474 |
|
(1) Includes amountscontributions into the Deferred Compensation Plan by the Named Executive Officers representing deferred from salary and deferred annual incentive pay reflectedpay. A portion of the contributions reported in this column are included within the amount reported as fiscal 2020 salary in the “Salary” column of the Summary Compensation Table. The specific amounts reported as fiscal 2020 salary in the Summary Compensation Table are: Mr. Debertin, $467,351; Ms. Nelligan, $66,500; Mr. Zappa, $0; Mr. Dusek, $0; Ms. Olsonawski, $118,485; and Mr. Skidmore, $46,499. Another portion of the contributions reported in this column are included within the amount reported as 2019 nonequity incentive plan compensation in the “Nonequity Incentive Plan Compensation” column of the Summary Compensation Table. Those contributions were made in early fiscal 2020 based on fiscal 2019 results. The specific amounts reported as 2019 nonequity incentive plan compensation in the Summary Compensation Table are: Mr. Debertin, $3,341,758; Ms. Nelligan, $0; Mr. Hunhoff, $0; Mr. Zappa, $603,750; Mr. Dusek, $333,155; Ms. Olsonawski, $192,610; and Mr. Skidmore, $606,032.
(2) Contributions are made by us into the Deferred Compensation Plan on behalf of Named Executive Officers. Amounts include LTIP contribution made in early fiscal 2020 based on fiscal 2017-2019 results, those contributions are also included in the amounts reported in the 2019 “Nonequity” column of the Summary Compensation Table: Mr. Debertin, $1,692,275; Mr. Hunhoff, $351,304; Mr. Zappa, $331,220; Mr. Dusek, $250,413; and Ms. Olsonawski, $118,507. Also included are retirement contributions made in early fiscal 2020 based on fiscal 2019 results for Profit Sharing and 401(k) match on amounts exceeding IRS compensation limits, Profit Sharinglimits. Those contributions, and 401(k) match. The amounts reported were made in early fiscal 2019 based on fiscal 2018 results. These resultsapplicable tax withholding, are also included in amounts reported in the 2020 All Other Compensation column of the Summary Compensation Table: Mr. Debertin, $380,345; Mr. Skidmore, $131,322;$395,887; Mr. Hunhoff, $133,540;$137,392; Mr. Zappa, $119,735; and$128,764; Mr. Dusek, $123,790.$120,951; and Ms. Olsonawski, $46,247.
(3) The amounts in this column include the change in value of the balance, not including contributions made by or on behalf of the Named Executive Officer. Amounts include the following above market earnings in fiscal 20192020 that are also reflected in the "Change in Pension Value and Nonqualified Deferred Compensation Earnings" column of the Summary Compensation Table: Mr. Debertin, $62,259; Mr. Skidmore, $10,310;$176,541; Ms. Nelligan, $136; Mr. Hunhoff, $3,332;$10,094; Mr. Zappa, $0; Mr. Dusek, $21,142; Ms. Olsonawski, $9,099; and Mr. Dusek, $4,858.Skidmore, $21,239.
(4) Amounts vary in accordance with individual pension plan provisions and voluntary employee deferrals and withdrawals. TheseAmounts reported in this column include amounts previously reported in CHS’s Summary Compensation Table in previous fiscal years when earned if the Named Executive Officer's compensation was required to be disclosed in a previous fiscal year. Amounts previously reported in such fiscal years include earned, but deferred, salary and annual incentive pay; LTIP contributions, retirement contributions on amounts exceeding IRS compensation limits, Profit Sharing contributions and 401(k) match contributions made by us on behalf of the Named Executive Officer; and above-market earnings on deferred compensation. Amounts reported in this column also include rollovers, voluntary salary and voluntary incentive plan contributions from predecessor plans with predecessor employers that have increased in value over the course of the executive'sNamed Executive Officer's career. Named Executive Officers may defer up to 75% of their base salary and up to 100% of their annual variable pay to the Deferred Compensation Plan. Earnings on amounts deferred under the Deferred Compensation Plan are determined based on the investment election made by the Named Executive Officer from five market-based notional investments with a varying level of risk selected by us and a fixed rate fund. The notional investment returns for fiscal 20192020 were as follows: Vanguard Prime Money Market, 2.36%1.15%; Vanguard Life Strategy Income, 8.61%7.16%; Vanguard Life Strategy Conservative Growth, 6.30%9.70%; Vanguard Life Strategy Moderate Growth, 3.96%12.03%; Vanguard Life Strategy Growth, 1.59%14.25%; and Fixed Rate, 4.00%.
Named Executive Officers may change their investment election daily. Payments of amounts deferred are made in accordance with elections by the Named Executive Officer and in accordance with Section 409A under the Internal Revenue Code. Payments under the Deferred Compensation Plan may be made at a specified date elected by the Named Executive Officer or deferred until retirement, disability, or death. Such payments would be made in a lump sum. In the event of retirement, the Named Executive Officer can elect to receive payments either in a lump sum or annual installments up to ten10 years.
For a discussion of the material terms and conditions of the Deferred Compensation Plan, see "Compensation Discussion and Analysis" above.
Post Employment
Pursuant to the terms of his Employment Agreement, Mr. Debertin, our President and CEO, is entitled to severance in the event that his employment is terminated by us without cause or by him with "good reason." Specifically, severance under the Employment Agreement would consist of:
•The annual incentive compensation Mr. Debertin would have been entitled to receive for the year in which his termination occurred as if he had continued until the end of that fiscal year, determined based on our actual performance for that fiscal year relative to the performance goals applicable to Mr. Debertin (with that portion of the annual incentive compensation based on completion or partial completion of previously specified personal goals equal to 30% of the target annual incentive), prorated for the number of days in the fiscal year through Mr. Debertin’s termination date and generally payable in a cash lump sum at the time that incentive awards are payable to other participants;
•Two times Mr. Debertin's base salary plus two times his target annual incentive compensation, payable in three equal installments with the first installment payable 60 days following termination and the second and third installments payable on the first and second anniversary dates of termination, respectively; and
•Welfare benefit continuation for two years following termination.
The Nelligan Letter Agreement provides for severance in the event Ms. Nelligan's employment is terminated by us without cause or by her with "good reason," in the amount of one year of base pay and prorated annual variable pay, payable as a lump sum. In addition, the Nelligan Letter Agreement provides that we will reimburse Ms. Nelligan’s reasonable, documented repatriation expenses to the Lake Geneva, Wisconsin, area in the event her employment is terminated by us without cause or by her with "good reason" within the first 36 months of her employment.
Mr. Skidmore'sZappa's employment term sheet with us provides for severance in the event his employment is terminated by us without cause or by him with "good reason,"reason" in the amount of one year of base pay and prorated annual variable pay, payable inas a lump sum.
In addition, in connection with Mr. Skidmore's retirement from CHS on December 31, 2019, we entered into the Skidmore Letter Agreement with Mr. Skidmore. The Skidmore Letter Agreement includes confidentiality, cooperation, non-disparagementnondisparagement and other customary provisions, as well as one-year covenants regarding non-solicitationnonsolicitation and non-competition.noncompetition. The Skidmore Letter Agreement also provides for certain payments to Mr. Skidmore, including the following:
If, no earlier than his separation from employment on December 31, 2019, Mr. Skidmore signs a general release of claims in the form attached to the Letter Agreement and does not subsequently rescind that general release within 14 days after its execution ("Rescission Deadline"), then we will make a•A lump sum payment to him in an amount equal to one year of his currentMr. Skidmore's base salary, which amount iswas $619,982, as well as aplus the pro rata portion of annual variable compensation earned by Mr. Skidmore for fiscal 2020, which pro rata portion will be calculated based on Mr. Skidmore's target level opportunity of 115% of his current base salary;
•A $340,975 payment representing a Novemberthe 2017 retention awardRetention Award grant that will fully vestvested on January 1, 2020;
•A pro rata portion of the 2018 Retention Award in the amount of $170,191, to bewhich was paid within 60 days of Mr. Skidmore's retirement on December 31, 2019;
•Payment for 30 days of paid time off; and
•$700,000 in recognition of earned but unvested long-term incentive compensation that will bewas forfeited due to the end of Mr. Skidmore's employment prior to vesting, to offset medical and dental benefits coverage for 12 months and one year of financial planning expense reimbursement, and for agreeing to be subject to the one-year non-competitionnoncompetition and non-solicitationnonsolicitation covenants following his departure from employment. Payment of this amount will be made within 30 days after December 31, 2020. This payment is subject to Mr. Skidmore's ongoing compliance with obligations that continue under the Skidmore Letter Agreement including, without limitation, the non-competitionnoncompetition and non-solicitationnonsolicitation covenants.
Mr. Zappa's employment term sheet with us provides for severance in the event his employment is terminated by us without cause, or by him with "good reason," in the amount of one year of base pay and prorated annual variable pay, payable as a lump sum.
Mr. Hunhoff, and Mr. Dusek and Ms. Olsonawski are covered by a broad-based employee severance program that provides a lump sum payment of two weeks of pay per year of service with a 12-month cap.
The severance pay that the Named Executive Officers (other than Mr. Skidmore, whose actual severance payments pursuant to the Skidmore Letter Agreement are described above) would have been entitled to had they been terminated by us
without cause or terminated their employment for "good reason," in each case, as of the last business day of fiscal 20192020 is as follows:
|
| | | |
| Name | Amount |
| | (Dollars) |
Jay Debertin (1)(2) | $ | 8,098,228 |
|
Timothy Skidmore (3)(4) | 1,332,961 |
|
| Darin Hunhoff | 556,500 |
|
James Zappa (3) | 1,128,750 |
|
| Richard Dusek | 521,981 |
|
| | | | | | | | |
| Name | | Amount |
| | (Dollars) |
Jay Debertin (1)(2) | | $ | 8,339,196 | |
Olivia Nelligan (3)(4) | | 1,325,500 | |
| Darin Hunhoff | | 573,195 | |
James Zappa (3) | | 1,162,613 | |
| Richard Dusek | | 532,421 | |
| Angela Olsonawski | | 360,706 | |
(1) Includes the value of health and welfare insurance based on current monthly rates.
(2) For purposes of calculating the prorated portion of Mr. Debertin's unpaid annual variable pay award for the fiscal year in which the termination occurred, assumes an annual variable pay award at target performance for the entire fiscal year.
(3) Assumes an annual variable pay award at target performance for the entire fiscal year.
(4) Represents severance paymentsAssumes that Ms. Nelligan would incur an estimated $100,000 of repatriation expenses to the Lake Geneva, Wisconsin, area that we would be made pursuantrequired to Mr. Skidmore's employment term sheet with us. Details ofreimburse under the payments to be made pursuant to Mr. Skidmore'sNelligan Letter Agreement are set forth above.Agreement.
There are no other severance benefits offered to our Named Executive Officers, except for up to $10,000 of outplacement assistance, which would be included as imputed income, and government mandated benefits such as COBRA. Except as otherwise set forth above, the method of payment would be a lump sum. Named Executive Officers not covered by the Skidmore Letter Agreement or employment agreements are not offered any special postretirement health and welfare benefits that are not offered to other similarly situated (i.e., age and service) salaried employees.
Pay Ratio
The following pay ratio and supporting information compares the annual total compensation of our employees other than our CEO (including full-time, part-time, seasonal and temporary employees) and the annual total compensation of our CEO, as required by Section 953(b) of the Dodd-Frank Act.Dodd-Frank. The pay ratio is a reasonable estimate calculated in a manner consistent with Item 402(u) of Regulation S-K promulgated by the SEC.
For fiscal 2019,2020, our last completed fiscal year:
•The median of the annual total compensation of all our employees (other than the CEO) was $75,561; and $75,345; and
•The annual total compensation of our CEO, as reported in the Summary Compensation Table set forth above, was $8,341,520.$11,154,057.
Based on this information, the ratio of the annual total compensation of our CEO to the median of the annual total compensation of all other employees was 110:was 148:1.
To determine the pay ratio, we took the following steps:
•We determined that as of June 1, 2019,2020, the determination date, our employee population consisted of approximately 10,03910,402 individuals, 9,5029,878 of which were located in the United States and 537524 of which were located outside of the United States. This population consisted of our full-time, part-time, temporary and seasonal employees. From this population, we excluded 282516 individuals who were located in the following countries: Argentina (51)(48), Brazil (234), Bulgaria (4), Canada (8), China (38)(37), Hungary (8)(12), Jordan (1), Paraguay (14)(13), Republic of Korea (3), Romania (55)(60), Russia (2), Serbia (4)(5), Singapore (17)(18), Spain (9)(13), Switzerland (18)(20), Taiwan (3), Ukraine (38)(35) and Uruguay (9)(8). Excluding these employees, our employee population that was used to calculate the pay ratio consisted of 9,7579,886 individuals.
•To identify the median employee, we compared regular, bonus and overtime wages (or their equivalents). We then applied a statistical sampling methodology to produce a sample of employees who were paid within a 5% range of the median regular, bonus and overtime wages (or their equivalents) and selected an employee from within that group as our median employee.
•Once we identified our median employee, we calculated that employee's annual total compensation for fiscal 20192020 in accordance with the requirements of Item 402(c)(2)(x) of Regulation S-K promulgated by the SEC, resulting in annual total compensation of $75,561.$75,345.
•With respect to our CEO, we used the amount reported as total compensation in the Summary Compensation Table set forth above.
In adopting the pay ratio rule, the SEC expressly sought to provide flexibility to each company to determine the methodology that best suits its own facts and circumstances. Our pay ratio should not be compared to other companies’ pay ratios, because it is based on a methodology specific to us and certain material assumptions, adjustments and estimates have been made in the calculation of the ratio.
Director Compensation
Overview
Our Board of Directors met 11eight times during the fiscal year ended August 31, 2019.2020. Each director (other than the chair of the Board) is a member of two Board Committees. At a minimum, each Board Committee meets during each of the Board’s six regular meetings. Through August 31, 2019,For fiscal 2020, each director was provided annual compensation of $69,000,$85,000, paid in 12 monthly payments, plus actual expenses and travel allowance, with the chair of the Board receiving additional annual compensation of $18,000,$24,000, the first vice chair and the secretary-treasurer each receiving additional annual compensation of $3,600 and$6,000, all Board
committee chairs receiving additional annual compensation of $6,000.$9,000 and members of the Executive Committee who are not eligible for other premiums receiving additional annual compensation of $3,000. These amounts, as well as the minimum retirement plan account contribution for the fiscal years 2020-2022 performance period under the Deferred Compensation Plan, were determined after taking into account the analysis included in the market study of director compensation conducted for the Governance Committee by Mercer (US), a global compensation consulting firm, in fiscal 2019. Each director also receives a per diem of $500 plus actual expenses and travel allowance for each day spent at meetings other than regular Board meetings and the CHS Annual Meeting.Meeting and a per diem of $250 for conference calls other than regular Board meetings. The number of days per diem for days spent at meetings other than regular Board meetings and the CHS Annual Meeting may not exceed 55 days annually, except that the chair of the Board is exempt from this limit. There is no cap on per diems permitted for conference calls.
Further, directors are eligible to participate in the Deferred Compensation Plan through a retirement plan account. Other than direct contributions, contributions to the retirement plan account in the Deferred Compensation Plan have historically been made based on our ROAE performance during specific three-year periods. However, beginning in fiscal 2020, for the 2018-2020 three-year cycle, contributions to each director’s retirement plan account in the Deferred Compensation Plan will beare made based on our ROIC performance during specific three-year periods, with ROIC defined in the same manner as for executive compensation (see "Long Term Incentive Compensation" above).the LTIP. We believe that using the ROAE and ROIC performance metrics for this purpose aligns the interests of our directors with the interests of our management and member-owners. The ROAE and ROIC performance targetgoal levels are established and approved by our Board of Directors prior to each three-year performance period. Deferred Compensation Plan credits are based on ROAE or ROIC performance results, as applicable, as detailed on the following pages.
We previously restated our consolidated financial statements for the fiscal years ended August 31, 2017 and 2016, and our unaudited financial information for the fiscal years ended August 31, 2015 and 2014. Each of our current directors, other than Messrs. Beckman, Cordes, Farrell, Jones, and Kehl (none of whom was a director during those years), had previously credited to their retirement plan account under the Deferred Compensation Plan $1,432 in excess of what would have been credited to such account under the restated financial statements and information. Accordingly, each affected director voluntarily declined that excess contribution and voluntarily agreed that we should remove such amount from the director’s retirement plan account under the Deferred Compensation Plan (and such amounts were so removed during fiscal 2019), with the exception of Mr. Kayser, who instead voluntarily provided that same offset by foregoing $1,432 in annual compensation during fiscal 2019.
During fiscal 2019, the Governance Committee of our Board of Directors retained Mercer (US) ("Mercer"), a global compensation consulting firm, to conduct a market study of CHS director compensation. The last comprehensive director market study we conducted was completed in 2013. The fiscal 2019 study conducted by Mercer included an analysis of director compensation levels and practices compared to peer companies and cross-industry data, an assessment of time spent on Board of Directors and Board committee meetings and other director responsibilities, and a summary of recent market trends specific to certain components of board member compensation. In order to better align our director compensation with the market based on the Mercer study, our Board of Directors approved the following changes to director compensation for fiscal 2020:
Increase annual cash retainer to $85,000.
Increase annual Board chair additional compensation to $24,000.
Increase annual first vice chair and secretary-treasurer additional compensation to $6,000.
Increase annual Board Committee chair additional compensation to $9,000.
Provide each other member of the Executive Committee of our Board of Directors with annual additional compensation of $3,000.
Provide a minimum retirement plan account contribution of $25,000 under the Deferred Compensation Plan as described in greater detail below under "Components of Compensation."
Director Retirement and Health Care Benefits
Members of our Board of Directors are eligible for certain retirement and health care benefits. The director retirement plan is a defined benefit plan and provides for a monthly benefit for the director's lifetime, beginning at age 60. Benefits are immediately vested and the monthly benefit is determined according to the following formula: $250 times years of service on the Board (up to a maximum of 15 years). Under no event will the benefit payment be payable for less than 120 months. Payment shall be made to the retired director's beneficiary in the event of the director's death before 120 payments are made. Prior to 2005, directors could elect to receive their benefit as an actuarial equivalent lump sum. To comply with IRS requirements, directors were required in 2005 to make a one-time irrevocable election whether to receive their accrued benefit in a lump sum or a monthly annuity upon retirement. If the lump sum was elected, the director would commence benefits upon expiration of his or her Board term.
Effective August 31, 2011, future accruals under the director retirement plan were frozen. Directors elected after that date are not eligible for benefits under that plan.
Retirement benefits are funded by a rabbi trust, with a balance at August 31, 2019,2020, of $8.6$8.3 million.
Directors serving as of September 1, 2005, and their eligible dependents, are eligible to participate in our medical, life, dental, vision and hearing plans. We will pay 100% of the medical premium for the director and their eligible dependents while active on the Board. Term life insurance cost is paid by the director. Retired directors and their dependents are eligible to
continue medical and dental insurance with the premiums paid by us after they leave the Board, until they are eligible for Medicare. In the event a director's coverage ends due to death or Medicare eligibility, we will pay 100% of the premium for the eligible spouse and eligible dependents until the spouse reaches Medicare age or upon death, if earlier.
New directors elected on or after December 1, 2006, and their eligible dependents, are eligible to participate in our medical, dental, vision and hearing plans. We will pay 100% of the premium for the director and eligible dependents while active on the Board. In the event a director leaves the Board prior to Medicare eligibility, premiums will be shared based on the following schedule:
| | | | | | | | | | | | | | |
| Years of Service | | Director | | CHS |
| Up to 3 | | 100% | | 0% |
| 3 to 6 | | 50% | | 50% |
| 6+ | | 0% | | 100% |
In the event a director's coverage ends due to death or Medicare eligibility, premiums for the eligible spouse and eligible dependents will be shared based on the same schedule until the spouse reaches Medicare age or upon death, if earlier.
Deferred Compensation Plan
Directors are eligible to participate in the Deferred Compensation Plan. Each participating director may elect to defer up to 100% of his or her monthly director fees into the Deferred Compensation Plan. This must be done prior to the beginning of the calendar year in which the fees will be earned, or in the case of newly-electednewly elected directors, upon election to the Board. During fiscal year 2019,2020, the following directors deferred Board fees pursuant to the Deferred Compensation Plan: Mr. Erickson, Mr. Fritel, Mr. Johnsrud, Mr. Kehl, Mr. Knecht, Mr. MalesichMeyer and Mr. Meyer.Riegel.
Benefits are funded in a rabbi trust. The Deferred Compensation Plan rabbi trust balance reported elsewhere in this Annual Report on Form 10-K includes amounts deferred by the directors.
Each year we will credit an amount to each director’sdirector's retirement plan account under the Deferred Compensation Plan. The fiscal year 20192020 credit to each director’s retirement plan account iswas based on ROAEthe following ROIC performance goals for fiscal years 2017-2019 of 5.5%, 7%, 9%2018-2020:
| | | | | | | | |
| Amount Credited* | | ROIC Performance |
| $100,000 (Superior performance) | | 6.7% ROIC |
| $50,000 (Maximum) | | 5.7% ROIC |
| $25,000 (Target) | | 4.7% ROIC |
| $12,500 (Minimum) | | 3.7% ROIC |
*The amount credited for the fiscal years 2018-2020 performance period was required to be mathematically interpolated if results occurred between the superior performance, maximum, target and 20%, respectively. minimum ROIC performance levels. If results had been less than the minimum ROIC performance level, the amount credited would have been $12,500.
The actual ROAEROIC performance for the fiscal years 2017-20192018-2020 performance period was 6.8%7.9% and, is reflected in the Director Compensation Table.
Beginning in fiscal year 2020, for the fiscal years 2018-2020 three-year cycle, the amount that will beaccordingly, $100,000 was credited to each director's retirement plan account under the Deferred Compensation Plan using ROIC measurement, as previously discussed, is as follows:
|
| |
Amount Credited* | ROIC Performance |
$100,000 (Superior performance) | 6.7% ROIC |
$50,000 (Maximum) | 5.7% ROIC |
$25,000 (Target) | 4.7% ROIC |
$12,500 (Minimum) | 3.7% ROIC |
*The amountexcept $75,000 was credited for any performance period will be mathematically interpolated when results occur betweennewly elected directors, Mr. Clemensen and Mr. Throener. This amount is reflected in the superior performance, maximum, target and minimum ROIC performance levels.
Director Compensation Table.
Beginning in fiscal year 2022, for For the fiscal years 2020-2022 three-year cycle, the amount that will be credited to each director's retirement plan account under the Deferred Compensation Plan using ROIC measurement, as previously discussed, iswill be as follows: |
| | | | | | | |
| Amount Credited* | | ROIC Performance |
| $100,000 (Superior performance) | | 7.9% ROIC |
| $50,000 (Maximum) | | 6.9% ROIC |
| $25,000 (Target, minimum contribution amount) | | 5.9% ROIC |
*The amount credited for anythe fiscal years 2020-2022 performance period will be mathematically interpolated when results occur between the superior performance, maximum and target ROIC performance levels. If results are less than the target ROIC performance level, the amount credited will be $25,000.
For the fiscal years 2021-2023 three-year cycle, the amount that will be credited to each director's retirement plan account under the Deferred Compensation Plan will be as follows:
| | | | | | | | |
| Amount Credited* | | ROIC Performance |
| $100,000 (Superior performance) | | 7.5% ROIC |
| $50,000 (Maximum) | | 6.5% ROIC |
| $25,000 (Target, minimum contribution amount) | | 5.5% ROIC |
*The amount credited for the fiscal years 2021-2023 performance period will be mathematically interpolated when results occur between the superior performance, maximum and target ROIC performance levels. If results are less than the target ROIC performance level, the amount credited will be $25,000.
Upon leaving our Board of Directors during the fiscal year, a director’sdirector's credit for that partial fiscal year will be the target amount ($25,000) prorated through the end of the month in which the director departs. Directors who join our Board of Directors during the fiscal year receive credit for that partial fiscal year based on the actual ROAE or ROIC as applicable, for that fiscal year, prorated from the first of the month following the month in which the director joins our Board of Directors to the end of the fiscal year.
Director Incentive Compensation Recovery Policy
In September 2019, our Board of Directors adoptedWe have an Incentive Compensation Recovery Policy ("Director Recovery Policy") that applies to our current and former directors ("Covered Director").
The Director Recovery Policy provides that, in the event of a required revision of our previously issued financial statements to reflect the correction of one or more errors that are material to those financial statements, our Board of Directorswe will require reimbursement or forfeiture of any excess covered deferred compensation received by any Covered Director during the three completed fiscal years immediately preceding the date on which we determine that we are required to prepare an accounting restatement. For purposes of the Director Recovery Policy, covered deferred compensation includes contributions made to a Covered Director's retirement plan account under the Deferred Compensation Plan, or any successor plan, provided that such contributions are made based wholly or in part on the attainment of a financial performance measure. The amount of excess retirement plan account contribution will be equal to the amount by which the Covered Director's retirement account contribution for the relevant period exceeded the amount that would have been contributed based on the restated financial results, as determined by our Board of Directors. The method used to recover the applicable excess contribution will be determined by our Board of Directors, in its sole discretion, and may include forfeiting any deferred compensation contribution made under the Deferred Compensation Plan or taking any other remedial or recovery action permitted by law.
20192020 Director Compensation | | | Name | | Fees Earned or Paid in Cash (1)(2) | | Change in Pension Value and Nonqualified Deferred Compensation Earnings (3) | | All Other Compensation (4)(5) | | Total | Name | | Fees Earned or
Paid in Cash (1) | | Change in Pension Value and Nonqualified Deferred Compensation Earnings (2) | | All Other
Compensation (3) | | Total |
| | | (Dollars) | | | (Dollars) |
| Donald Anthony | | $ | 23,500 |
| | $ | 19,827 |
| | $ | 22,624 |
| | $ | 65,951 |
| |
| David Beckman | | 60,500 |
| | — |
| | 30,001 |
| | 90,501 |
| David Beckman | | $ | 92,000 | | | $ | 195 | | | $ | 118,694 | | | $ | 210,889 | |
| Clinton J. Blew | | 102,100 |
| | 9,355 |
| | 50,459 |
| | 161,914 |
| Clinton J. Blew | | 115,500 | | | 5,946 | | | 127,927 | | | 249,373 | |
Dennis Carlson (6) | | 95,000 |
| | 68,525 |
| | 42,175 |
| | 205,700 |
| |
Dennis Carlson (4) | | Dennis Carlson (4) | | 36,083 | | | 18,649 | | | 28,102 | | | 82,834 | |
| Hal Clemensen | | Hal Clemensen | | 64,417 | | | 22 | | | 85,758 | | | 150,197 | |
| Scott Cordes | | 93,250 |
| | 5,122 |
| | 24,035 |
| | 122,407 |
| Scott Cordes | | 100,500 | | | 9,107 | | | 100,310 | | | 209,917 | |
| Jon Erickson | | 96,000 |
| | 1,580 |
| | 39,807 |
| | 137,387 |
| Jon Erickson | | 105,250 | | | 3,956 | | | 116,217 | | | 225,423 | |
| Mark Farrell | | 88,750 |
| | — |
| | 25,427 |
| | 114,177 |
| Mark Farrell | | 94,750 | | | 259 | | | 101,504 | | | 196,513 | |
| Steve Fritel | | 93,750 |
| | 40,698 |
| | 38,691 |
| | 173,139 |
| Steve Fritel | | 104,500 | | | 118 | | | 115,302 | | | 219,920 | |
| Alan Holm | | 97,250 |
| | 269 |
| | 38,691 |
| | 136,210 |
| Alan Holm | | 110,750 | | | 895 | | | 115,742 | | | 227,387 | |
| David Johnsrud | | 101,100 |
| | 507 |
| | 38,691 |
| | 140,298 |
| David Johnsrud | | 106,500 | | | 1,323 | | | 115,742 | | | 223,565 | |
| Tracy Jones | | 88,250 |
| | — |
| | 42,175 |
| | 130,425 |
| Tracy Jones | | 92,250 | | | 259 | | | 119,406 | | | 211,915 | |
| David Kayser | | 91,568 |
| | 36,587 |
| | 49,641 |
| | 177,796 |
| David Kayser | | 102,500 | | | 4,964 | | | 124,329 | | | 231,793 | |
| Russell Kehl | | 96,500 |
| | — |
| | 45,059 |
| | 141,559 |
| Russell Kehl | | 102,000 | | | — | | | 122,210 | | | 224,210 | |
| Randy Knecht | | 88,250 |
| | 38,503 |
| | 38,691 |
| | 165,444 |
| Randy Knecht | | 31,333 | | | 5,495 | | | 32,920 | | | 69,748 | |
| Edward Malesich | | 90,250 |
| | 2,696 |
| | 38,691 |
| | 131,637 |
| Edward Malesich | | 106,500 | | | 8,073 | | | 115,742 | | | 230,315 | |
| Perry Meyer | | 95,500 |
| | 365 |
| | 38,291 |
| | 134,156 |
| Perry Meyer | | 113,750 | | | 868 | | | 115,606 | | | 230,224 | |
| Steve Riegel | | 87,750 |
| | 20,921 |
| | 38,691 |
| | 147,362 |
| Steve Riegel | | 98,500 | | | 1,896 | | | 115,742 | | | 216,138 | |
| Daniel Schurr | | 110,000 |
| | 50,635 |
| | 45,643 |
| | 206,278 |
| Daniel Schurr | | 128,250 | | | 15,414 | | | 121,988 | | | 265,652 | |
| Kevin Throener | | Kevin Throener | | 63,917 | | | — | | | 93,687 | | | 157,604 | |
(1) Of this amount, the following directors deferred the succeeding amounts to the Deferred Compensation Plan: Mr. Clemensen, $14,000; Mr. Erickson, $9,000;$3,000; Mr. Fritel, $44,850; Mr. Johnsrud, $24,000; Mr. Kehl, $12,545;$18,333; Mr. Knecht, $20,000;$10,000; Mr. Malesich $10,000;Meyer, $6,000; Mr. Riegel, $16,000; and Mr. Meyer, $4,000.Throener, $3,818.
(2) Excludes $1,432 of annual compensation that was voluntarily declined by Mr. Kayser in connection with our restated financial statements.
(3) This column represents both changes in pension value and above-market earnings on deferred compensation. Change in pension value is the aggregate change in the actuarial present value of the director’s benefit under his retirement program, and nonqualified earnings, if applicable. The change in pension value will vary by director based on several factors including age, service, pension benefit elected (lump sum or annuity, see above)annuity), discount rate and mortality factor used to calculate the benefit due. Future accruals under the plan were frozen as of August 31, 2011, as stated above.
Above-market earnings represent earnings exceeding 120% of the Federal Reserve long-term rate as determined by the IRS on applicable funds. The following directors had above market earnings during fiscal 2019: Mr. Anthony, $1,941;2020: Mr. Beckman, $0;$195; Mr. Blew, $1,118;$2,913; Mr. Carlson, $1,972;$4,740; Mr. Clemensen, $22; Mr. Cordes, $5,122;$9,107; Mr. Erickson, $1,580;$3,956; Mr. Farrell, $0;$259; Mr. Fritel, $90;$118; Mr. Holm, $269;$895; Mr. Johnsrud, $507;$1,323; Mr. Jones, $0;$259; Mr. Kayser, $1,977;$4,964; Mr. Kehl, $0; Mr. Knecht, $1,788;$5,495; Mr. Malesich, $2,696;$8,073; Mr. Meyer, $365;$868; Mr. Riegel, $764;$1,896; Mr. Schurr, $1,487; and Mr. Schurr, $1,002.Throener, $0.
(4)(3) All other compensation includes health insurance premiums, conference and registration fees, meals and related spousal expenses for trips made with a director on CHS business. Total amounts vary primarily due to the variations in health insurance premiums, which are due to the number of dependents covered.
Health care The health insurance premiums paid were less than $25,000 for directors: Mr. Anthony, $4,688; Mr. Farrell, $1,392; Mr. Beckman, $12,000; Mr. Meyer, $14,256; Mr. Fritel, Mr. Holm, Mr. Johnsrud, Mr. Knecht, Mr. Malesich and Mr. Riegel, $14,656; Mr. Carlson and Mr. Jones, $18,140; Mr. Erickson, $15,772; Mr. Kehl, $21,024; Mr. Schurr, $21,608;each director, other than Mr. Blew, $26,424; and Mr. Cordes, $0.for whom we paid health insurance premiums of $27,824.
(5) All other compensation also includes fiscal 20192020 director retirement plan Deferred Compensation Plan contributions of $23,725$100,000 for each director except for newly elected director,directors, Mr. Beckman, $17,794Clemensen and Mr. Throener, $75,000; and for former directordirectors Mr. Anthony,Carlson and Mr. Knecht, $8,333.
(6)(4) Made a one-time irrevocable retirement election in 2005 to receive a lump sum benefit under the director retirement plan. All other directors that were first elected on or prior to August 31, 2011, will receive a monthly annuity upon retirement. The director retirement plan benefit was frozen as of August 31, 2011. Accordingly, directors who are first elected after that date are not eligible for benefits under that plan.
Compensation Committee Interlocks and Insider Participation
Our Board of Directors does not have a compensation committee. The Executive Committee of our Board of Directors recommends to the entire Board of Directors salary actions relative to our CEO. The entire Board of Directors determines the compensation and the terms of the employment agreement with our CEO. Our CEO decides base compensation levels for the other Named Executive Officers with input from a third-party consultant if necessary, and recommends for our Board of Directors' approval the annual and long-term incentive plan performance goals applicable to the other Named Executive Officers.
Prior to January 2019, the Governance Committee of our Board of Directors performed the equivalent functions of a compensation committee. Beginning in January 2019, the Executive Committee of our Board of Directors began performingperforms the equivalent functions of a compensation committee with respect to our CEO and the Governance Committee of our Board of Directors continued to performperforms the equivalent functions of a compensation committee, other than with respect to our CEO.
During fiscal 2019,2020, the members of the Executive Committee were Messrs. Schurr (chair), Blew (vice chair), Johnsrud, Erickson, Kehl and Riegel, and the members of the Governance Committee were Messrs. Malesich (chair), Kehl (vice chair), Carlson, Johnsrud, Jones, Kayser, Riegel and Riegel.Throener. During fiscal 2019,2020, no executive officer of CHS served on the compensation committee (or other board committee performing equivalent functions) or board of directors of any other entity that had any executive officer who also served on ourthe Executive Committee, the Governance Committee or our Board of Directors. None of the directors who served as a member of the Executive Committee or Governance Committee during fiscal 20192020 are, or have been, officers or employees of CHS.
See Item 13, Certain Relationships and Related Transactions, and Director Independence, of this Annual Report on Form 10-K for directors, including Messrs. Erickson, Jones, Kayser, Kehl Carlson, Johnsrud and Jones,Throener, who were a party to related-person transactions.
Compensation Committee Report
The Executive Committee (the committee of our Board of Directors that performs the equivalent functions of a compensation committee with respect to our CEO) and the Governance Committee (the committee of our Board of Directors that performs the equivalent functions of a compensation committee, other than with respect to our CEO) have each reviewed and discussed the Compensation Discussion and Analysis required by Item 402(b) of Regulation S-K promulgated by the SEC with management and, based on such review and discussion,discussions, each of the Executive Committee and the Governance Committee recommended to our Board of Directors that the Compensation Discussion and Analysis be included in this Annual Report on Form 10-K.
Respectfully submitted,
Executive Committee
Daniel Schurr, Chair
Clinton J. Blew
Jon Erickson
David JunsrudRussell Kehl
Steve Riegel
Governance Committee
Edward Malesich, Chair
Dennis CarlsonTracy Jones
David Johnsrud
Tracy JonesKayser
Russell Kehl
Steve Riegel
Kevin Throener
ITEM 12. SECURITY OWNERSHIP OF CERTAIN BENEFICIAL OWNERS AND MANAGEMENT AND RELATED STOCKHOLDER MATTERS
Beneficial ownership of our equity securities by each member of our Board of Directors, each of our Named Executive Officers and all members of our Board of Directors and executive officers as a group as of October 18, 2019,2020, is shown below. Except as indicated in the footnotes to the following table, each person has sole voting and investment power with respect to all shares attributable to such person.
| | | | | Title of Class | | Title of Class |
| | | 8% Cumulative Redeemable Preferred Stock | | Class B Cumulative Redeemable Preferred Stock | | 8% Cumulative Redeemable
Preferred Stock | | Class B Cumulative Redeemable Preferred Stock |
| Name of Beneficial Owner | | Amount of
Beneficial Ownership | | % of Class (1) | | Amount of
Beneficial Ownership | | % of Class (2) | Name of Beneficial Owner | | Amount of
Beneficial Ownership | | % of Class (1) | | Amount of
Beneficial Ownership | | % of Class (2) |
| Directors: | | (Shares) | | | | (Shares) | | Directors: | | (Shares) | | | | (Shares) | | |
| David Beckman | | — |
| | * | | — |
| | * | David Beckman | | — | | | * | | — | | | * |
| Clinton J. Blew | | — |
| | * | | — |
| | * | Clinton J. Blew | | — | | | * | | — | | | * |
| Dennis Carlson | | 60 |
| | * | | — |
| | * | |
| Hal Clemensen | | Hal Clemensen | | — | | | * | | — | | | * |
Scott Cordes (3) | | 200 |
| | * | | 11,400 |
| | * | Scott Cordes (3) | | 200 | | | * | | 11,750 | | | * |
| Jon Erickson | | 300 |
| | * | | 1,508 |
| | * | Jon Erickson | | 300 | | | * | | 1,508 | | | * |
| Mark Farrell | | 6,000 |
| | * | | — |
| | * | Mark Farrell | | 6,000 | | | * | | — | | | * |
| Steven Fritel | | — |
| | * | | — |
| | * | Steven Fritel | | — | | | * | | — | | | * |
| Alan Holm | | — |
| | * | | — |
| | * | Alan Holm | | — | | | * | | — | | | * |
| David Johnsrud | | — |
| | * | | 1,650 |
| | * | David Johnsrud | | — | | | * | | 1,650 | | | * |
| Tracy Jones | | — |
| | * | | — |
| | * | Tracy Jones | | — | | | * | | — | | | * |
| David Kayser | | — |
| | * | | 630 |
| | * | David Kayser | | — | | | * | | 630 | | | * |
| Russell Kehl | | — |
| | * | | — |
| | * | Russell Kehl | | — | | | * | | — | | | * |
Randy Knecht (3) | | 1,027 |
| | * | | 229 |
| | * | |
| Edward Malesich | | — |
| | * | | — |
| | * | Edward Malesich | | — | | | * | | — | | | * |
Perry Meyer (3) | | 120 |
| | * | | — |
| | * | Perry Meyer (3) | | 120 | | | * | | — | | | * |
| Steve Riegel | | 245 |
| | * | | 1,460 |
| | * | Steve Riegel | | 245 | | | * | | 1,460 | | | * |
| Daniel Schurr | | — |
| | * | | — |
| | * | Daniel Schurr | | — | | | * | | — | | | * |
| Kevin Throener | | Kevin Throener | | — | | | * | | — | | | * |
| Named Executive Officers: | | | | | | | | Named Executive Officers: | | | |
Jay Debertin (3) | | 1,200 |
| | * | | — |
| | * | Jay Debertin (3) | | 1,200 | | | * | | — | | | * |
| Richard Dusek | | — |
| | * | | — |
| | * | Richard Dusek | | — | | | * | | — | | | * |
| Darin Hunhoff | | 596 |
| | * | | — |
| | * | Darin Hunhoff | | 596 | | | * | | — | | | * |
| Olivia Nelligan | | Olivia Nelligan | | — | | | * | | — | | | * |
| Angela Olsonawski | | Angela Olsonawski | | — | | | * | | — | | | * |
Timothy Skidmore (3) | | — |
| | * | | 16,002 |
| | * | Timothy Skidmore (3) | | — | | | * | | 16,002 | | | * |
| James Zappa | | — |
| | * | | — |
| | * | James Zappa | | — | | | * | | — | | | * |
| All other executive officers | | — |
| | * | | 400 |
| | * | All other executive officers | | — | | | * | | 400 | | | * |
| Directors and executive officers as a group | | 9,748 |
| | * | | 33,279 |
| | * | Directors and executive officers as a group | | 8,661 | | | * | | 33,400 | | | * |
*Less than 1%.
(1) As of October 18, 2019,2020, there were 12,272,003 shares of 8% Cumulative Redeemable Preferred Stock outstanding.
(2) As of October 18, 2019,2020, there were 78,659,066 shares of Class B Cumulative Redeemable Preferred Stock outstanding with 21,459,066, 16,800,000, 19,700,000 and 20,700,000 attributed to Series 1, Series 2, Series 3 and Series 4, respectively.
(3) Includes shares held by spouse, children and Individual Retirement Accounts.
We have no compensation plans under which our equity securities are authorized for issuance.
To our knowledge, there is no person or group who is a beneficial owner of more than 5% of any class or series of our preferred stock.
ITEM 13. CERTAIN RELATIONSHIPS AND RELATED TRANSACTIONS, AND DIRECTOR INDEPENDENCE
Because our directors must be active patrons of CHS or of an affiliated association, transactions between us and our directors are customary and expected. Transactions include the sales of commodities to us and the purchases of products and services from us, as well as patronage refunds and equity redemptions received from us. During the year ended August 31, 2019,2020, the value of those transactions between a particular director (and any immediate family member of a director, which includes any child, stepchild, parent, stepparent, spouse, sibling, mother-in-law, father-in-law, son-in-law, daughter-in-law, brother-in-law or sister-in-law and any person (other than a tenant or employee) sharing the household of such director) and us in which the total amount involved exceeded $120,000 is shown below.
| | | | | | | | | | | | | | |
| | Transaction Type |
| Name | | Transactions with CHS | | Cash Patronage Dividends |
| | (Dollars) |
| Scott Cordes | | $ | 145,298 | | | $ | 44 | |
| Jon Erickson | | 573,033 | | | 3,228 | |
| Steve Fritel | | 830,346 | | | 774 | |
| David Johnsrud | | 2,298,775 | | | 3,973 | |
| Tracy Jones | | 2,844,406 | | | 891 | |
| David Kayser | | 750,299 | | | 2,049 | |
| Russell Kehl | | 3,558,329 | | | 12,867 | |
| Kevin Throener | | 1,025,420 | | | 2,602 | |
|
| | | | | | | | |
| | | Transaction Type |
| Name | | Purchases from CHS | | Patronage Dividends |
| | | (Dollars) |
| Dennis Carlson | | $ | 407,905 |
| | $ | 198 |
|
| Jon Erickson | | 678,090 |
| | 1,715 |
|
| Steve Fritel | | 411,703 |
| | 1,176 |
|
| David Johnsrud | | 2,056,295 |
| | 7,779 |
|
| Tracy Jones | | 1,937,656 |
| | 4,528 |
|
| David Kayser | | 521,090 |
| | 3,999 |
|
| Russell Kehl | | 3,727,877 |
| | 12,951 |
|
Additionally, Kehl Farms, LLC, which is owned by our director Russell Kehl, entered into a 20192020 crop inputs loan with CHS Capital for the purchase of crop inputs, seeds, supplies and fuel in April 2019March 2020 ("Kehl Loan"). The Kehl Loan bears interest at the rate of 7.25%6.50% per annum, which is payable upon maturity in January 2020.February 2021. The largest aggregate amount of principal outstanding under the Kehl Loan during the year ended August 31, 2019,2020, and the balance on August 31, 2019,2020, was $1,591,049.$688,975. During the year ended August 31, 2019,2020, no principal or interest was paid on the Kehl Loan. Also, in December 20182019 our director David Kayser entered into a 20192020 crop inputs loan with CHS Capital for the purchase of crop inputs ("Kayser Loan") with a maturity date in December 2019.2020. No interest accrues or is payable under the Kayser Loan. The largest aggregate amount of principal outstanding under the Kayser Loan during the year ended August 31, 2019, was $135,7002020, and the balance on August 31, 2019,2020, was $23,649.$87,500. During the year ended August 31, 2019,2020, no principal or interest was paid on the Kayser Loan was $112,051.Loan. The terms of these financing arrangements were provided pursuant to financing programs widely available to our qualified customerscustomers.
Review, Approval or Ratification of Related Party Transactions
Pursuant to its amended and restated charter, our Audit Committee has responsibility for the review and approval of all transactions between CHS and any related parties or affiliates of CHS, including its officers and directors, other than transactions in the ordinary course of business and on market terms as described above.terms.
Related persons can include any of our directors or executive officers and any of their immediate family members, as defined by the SEC. In evaluating related person transactions, the committee members apply the same standards they apply to their general responsibilities as members of the Audit Committee. The committee will approve a related person transaction when, in its good faith judgment, the transaction is in the best interest of CHS. To identify related person transactions, each year we require our directors and officers to complete a questionnaire identifying any transactions with CHS in which the officer or director or their immediate family members have an interest. We also review our business records to identify potentially qualifying transactions between a related party and us. In addition, we have a written policy addressing related persons (included in our Code of Conduct) that describes our expectation that all directors, officers and employees who may have a potential or apparent conflict of interest will notify our legal department of any such transactions.
Director Independence
We are a Minnesota cooperative corporation managed by a Board of Directors made up of 17 members. Nomination and election of the directors is done by eight separate regions. In addition to meeting other requirements for directorship, candidates must reside in the region from which they are elected. Directors are elected for three-year terms. The terms of directors are staggered and no more than seven director positions are elected at an annual meeting of members. Nominations for director elections are made by the voting members at each region caucus held during our annual meeting of members.
Neither
Neither the Board of Directors nor management of CHS participates in the nomination process. Accordingly, we have no nominating committee.
The following directors satisfy the definition of director independence set forth in the rules of the Nasdaq Stock Market LLC ("Nasdaq"):
|
| | | | | | | |
| Independent Directors |
| David Beckman | Mark Farrell | Randy KnechtEdward Malesich |
| Clinton J. Blew | Steve Fritel | Edward MalesichPerry Meyer |
Dennis CarlsonHal Clemensen | Alan Holm | Perry MeyerSteve Riegel |
| Scott Cordes | David Kayser | Steve RiegelDaniel Schurr |
JohnJon Erickson | Russell Kehl | Daniel SchurrKevin Throener |
Further, although we do not need to rely upon an exemption for the Board of Directors as a whole, we are exempt pursuant to theThe Nasdaq rules from theThe Nasdaq director independence requirements as they relate to the makeup of the Board of Directors as a whole and the makeup of the committee performing the functions of a compensation committee. The Nasdaq exemption applies to cooperatives that are structured to comply with relevant state law and federal tax law and that do not have a publicly traded class of common stock. All of the members of our Audit Committee are independent. All of the members of our Governance Committee and Executive Committee (the committees of our Board of Directors that perform the equivalent functions of a compensation committee) are independent other than Mr. Johnsrud and Mr. Jones.
Independence of CEO and Board Chair Positions
Our bylaws prohibit any employee of CHS from serving on the Board of Directors. Accordingly, our CEO may not serve as chair of the Board or in any CHS Board capacity. We believe this leadership structure creates independence between the Board and management and is an important feature of appropriate checks and balances in the governance of CHS.
Board of Directors Role in Risk Oversight
It is senior management's responsibility to identify, assess and manage our exposures to risk. Our Board of Directors plays an important and significant role in overseeing the overall risk management approach, including the review and, where appropriate, approval of guidelines and policies that govern our risk management process. Our management and Board of Directors have jointly identified multiple broad categories of risk exposure, each of which could impact operations and affect results at an enterprise level. Each such significant enterprise level risk is reviewed periodically by management with the Board of Directors and/or a committee of the Board as appropriate. The review includes an analysis by management of the continued applicability of the risk, our performance in managing or mitigating the risk, and possible additional or emerging risks to consider. As additional areas of risk are identified, our Board of Directors and/or a committee of the Board provides review and oversight of management's actions to identify, assess and manage that risk. We continue to develop a formal enterprise risk management program intended to support integration of the risk assessment and management discipline and controls into major decision makingdecision-making and business processes. The Corporate Risk Committee is involved in reviewing and approving the enterprise risk management framework and is responsible for overseeing its effectiveness on an ongoing basis. When appropriate, the Corporate Risk Committee meets jointly with the Audit Committee to discuss common financial or other risks across CHS that may have potential material impact to our financial statements.
ITEM 14. PRINCIPAL ACCOUNTANT FEES AND SERVICES
The following table shows the aggregate fees billed to us by PricewaterhouseCoopers LLP for services rendered during the years ended August 31, 20192020 and 2018:2019:
| | | | 2019 | | 2018 | | 2020 | | 2019 |
| | (Dollars in thousands) | | (Dollars in thousands) |
Audit fees (1) | $ | 6,368 |
| | $ | 6,985 |
| Audit fees (1) | $ | 6,374 | | | $ | 6,368 | |
Audit-related fees (2) | 13 |
| | 294 |
| Audit-related fees (2) | — | | | 13 | |
Tax fees (3) | 115 |
| | 53 |
| Tax fees (3) | 349 | | | 115 | |
All other fees (4) | 76 |
| | 218 |
| All other fees (4) | 241 | | | 76 | |
| Total | $ | 6,572 |
| | $ | 7,550 |
| Total | $ | 6,964 | | | $ | 6,572 | |
(1) Includes fees for audit of annual financial statements and reviews of the related quarterly financial statements and certain statutory audits and work related to filings of registration statements.audits.
(2) Includes fees for employee benefit plan audits, due diligence on acquisitions and internal control and system audit procedures.
(3) Includes fees related to tax compliance, tax advice and tax planning.
(4) Includes fees related to other professional services performed.
In accordance with the CHS Inc. Audit Committee Charter, as amended, our Audit Committee adopted the following policies and procedures for the approval of the engagement of an independent registered public accounting firm for audit, review or attest services and for pre-approval of certain permissible non-auditnonaudit services, all to ensure auditor independence.
Our independent registered public accounting firm will provide audit, review and attest services only at the direction of, and pursuant to engagement fees and terms approved by our Audit Committee. Our Audit Committee approves, in advance, all non-auditnonaudit services to be performed by the independent auditors and the fees and compensation to be paid to the independent auditors. Our Audit Committee approved 100% of the services listed above in advance.
PART IV
ITEM 15. EXHIBITS EXHIBIT AND FINANCIAL STATEMENT SCHEDULES
(a)(1) FINANCIAL STATEMENTS
The following financial statements are filed as part of this Annual Report on Form 10-K.
Regulation S-X promulgated by the SEC also requires separate financial statements of significant equity method investments to be filed with this Annual Report on Form 10-K when the equity income attributable to a significant equity method investment exceeds 20% of income before income taxes for any of our fiscal years for which financial statements are required to be presented in this Annual Report on Form 10-K. As equity income from our investment in CF Nitrogen exceeded 20% of our income before income taxes for the fiscal year ended August 31, 2020, separate financial statements for CF Nitrogen will be filed as an amendment to this Annual Report on Form 10-K within 90 days after CF Nitrogen’s fiscal year end on December 31, 2020.
(a)(2) FINANCIAL STATEMENT SCHEDULES
SCHEDULE II — VALUATION AND QUALIFYING ACCOUNTS AND RESERVES
| | | | | Balance at Beginning of Year | | Additions: Charged to Costs and Expenses* | | Deductions: Write-offs, Net of Recoveries | | Balance at End of Year | | Balance at
Beginning
of Year | | Additions:
Charged to Costs
and Expenses* | | Deductions:
Write-offs, Net
of Recoveries | | Balance at
End
of Year |
| | | (Dollars in thousands) | | | (Dollars in thousands) |
| Allowances for doubtful accounts | | |
| | |
| | |
| | |
| Allowances for doubtful accounts | | | | | | | | |
| 2020 | | 2020 | | $ | 176,805 | | | $ | 3,089 | | | $ | (14,354) | | | $ | 165,540 | |
| 2019 | | $ | 221,813 |
| | $ | 57,380 |
| | $ | (102,388 | ) | | $ | 176,805 |
| 2019 | | 221,813 | | | 57,380 | | | (102,388) | | | 176,805 | |
| 2018 | | 225,726 |
| | 2,748 |
| | (6,661 | ) | | 221,813 |
| 2018 | | 225,726 | | | 2,748 | | | (6,661) | | | 221,813 | |
| 2017 | | 163,644 |
| | 191,581 |
| | (129,499 | ) | | 225,726 |
| |
| | | | | | | | | | |
| Valuation allowance for deferred tax assets | | | | | | | | | Valuation allowance for deferred tax assets | |
| 2020 | | 2020 | | $ | 246,344 | | | $ | 5,206 | | | $ | (31,659) | | | $ | 219,891 | |
| 2019 | | $ | 230,374 |
| | $ | 41,260 |
| | $ | (25,290 | ) | | $ | 246,344 |
| 2019 | | 230,374 | | | 41,260 | | | (25,290) | | | 246,344 | |
| 2018 | | 289,083 |
| | 61,854 |
| | (120,563 | ) | | 230,374 |
| 2018 | | 289,083 | | | 61,854 | | | (120,563) | | | 230,374 | |
| 2017 | | 213,583 |
| | 115,893 |
| | (40,393 | ) | | 289,083 |
| |
| | | | | | | | | | |
| Reserve for supplier advance payments | |
|
| | | | | |
|
| Reserve for supplier advance payments | |
| 2020 | | 2020 | | $ | 65,885 | | | $ | 0 | | | $ | 0 | | | $ | 65,885 | |
| 2019 | | $ | 110,613 |
| | $ | — |
| | $ | (44,728 | ) | | $ | 65,885 |
| 2019 | | 110,613 | | | 0 | | | (44,728) | | | 65,885 | |
| 2018 | | 130,705 |
| | — |
| | (20,092 | ) | | 110,613 |
| 2018 | | 130,705 | | | 0 | | | (20,092) | | | 110,613 | |
*Net of reserve adjustments
(a)(3) EXHIBITS
EXHIBIT INDEX
|
| |
2.1 | |
3.1 | |
3.2 | |
4.1 | |
4.2 | |
4.3 | |
4.4 | |
4.5 | |
4.6 | |
4.7 | |
4.8 | |
4.9 | |
4.10 | |
4.11 | |
4.12 | |
4.13 | |
4.14 | |
4.15 | |
10.1 | |
10.2 | |
10.2A | |
|
| |
10.2B | |
10.3 | |
10.3A | |
10.4 | |
10.4A | |
10.4B | |
10.5 | |
10.5A | |
10.5B | |
10.6 | |
10.7 | |
10.8 | |
10.8A | |
10.9 | |
10.9A | |
10.9B | |
10.10 | |
10.10A | |
10.10B | |
10.10C | |
10.10D | |
10.10E | |
10.10F | |
10.11 | |
10.12 | |
10.12A | |
|
| |
10.12B | |
10.13 | |
10.14 | |
10.15 | |
10.16 | |
10.17 | |
10.17A | |
10.17B | |
10.18 | Agreement Regarding Distribution of Assets, by and among CHS Inc., United Country Brands, LLC, Land O’Lakes, Inc. and Winfield Solutions, LLC, made as of September 4, 2007. (Incorporated by reference to our Form 10-K for the year ended August 31, 2007, filed November 20, 2007). |
10.19 | |
10.19A | |
10.19B | |
10.19C | |
10.19D | |
10.19E | Fifth Amendment and Waiver, dated as of September 4, 2015, to that certain Credit Agreement (10-Year Term Loan), dated as of December 12, 2007, by and between CHS Inc., CoBank, ACB, as a syndication party and as the administrative agent for the benefit of all present and future syndication parties, and the other syndication parties party thereto. (Incorporated by reference to our Current Report on Form 8-K, filed September 11, 2015). |
10.20 | |
10.20A | |
10.20B | |
10.20C | |
10.20D | |
10.21 | |
|
| |
10.22 | |
10.23 | |
10.24 | |
10.24A | |
10.25 | |
10.25A | |
10.25B | |
10.25C | |
10.25D | |
10.25E | |
10.26 | |
10.27 | Pre-Export Credit Agreement dated as of September 24, 2013 between CHS Agronegocio Industria e Comercio Ltda., as borrower, CHS Inc., as guarantor, and Credit Agricole Corporate and Investment Bank (Credit Agricole), as administrative agent, Credit Agricole and Merrill Lynch, Pierce, Fenner & Smith Incorporated, as joint lead arrangers and joint bookrunners, and the other syndication parties thereto from time to time. (Incorporated by reference to our Current Report on Form 8-K, filed October 4, 2013). |
10.27A | First Amendment to Pre-Export Credit Agreement dated as of October 9, 2015, among CHS Agronegocio Industria e Comercio Ltda., as borrower, CHS Inc., as guarantor, Credit Agricole Corporate and Investment Bank, as administrative agent, and the lenders party thereto. (Incorporated by reference to our Form 10-K for the year ended August 31, 2015, filed November 23, 2015). |
10.28 | |
10.29 | 2019 Amended and Restated Credit Agreement (5-Year Revolving Loan), dated as of July 16, 2019, by and between CHS Inc., CoBank, ACB, for its own benefit as a syndication party and as the administrative agent for the benefit of the present and future syndication parties, Coöperatieve Rabobank U.A., New York Branch and Sumitomo Mitsui Banking Corporation, for their own benefit as syndication parties and as syndication agents, and the other syndication parties party thereto (Incorporated by reference to our Current Report on Form 8-K, filed July 19, 2019). |
10.30 | |
10.30A | Amendment No. 1 to 2015 Credit Agreement. (10-Year Term Loan), dated as of June 30, 2016, by and between CHS Inc., CoBank, ACB, as a syndication party and as the administrative agent for the benefit of all present and future syndication parties, and the other syndication parties thereto. (Incorporated by reference to our Form 10-Q for the quarterly period ended May 31, 2016, filed July 7, 2016). |
10.30B | |
10.31 | |
|
| |
10.32 | |
10.32A | Omnibus Amendment No. 1, dated as of February 14, 2017, by and among Cofina Funding, LLC, as seller, CHS Inc., as servicer and as an originator, CHS Capital, LLC, as an originator, the conduit purchasers, committed purchasers and purchaser agents set forth on the signature pages thereto, the Bank of Tokyo-Mitsubishi UFJ, Ltd., New York Branch, as administrative agent, and U.S. Bank National Association, as custodian. (Incorporated by reference to our Current Report on 8-K, filed February 15, 2017). |
10.32B | Omnibus Amendment No. 2, dated as of July 18, 2017, by and among Cofina Funding, LLC, as seller, CHS Inc., as servicer and as an originator, CHS Capital, LLC, as an originator, the conduit purchasers, committed purchasers and purchaser agents set forth on the signature pages thereto, the Bank of Tokyo-Mitsubishi UFJ, Ltd., New York Branch, as administrative agent, and U.S. Bank National Association, as custodian. (Incorporated by reference to our Form 10-K for the year ended August 31, 2017, filed November 9, 2017). |
10.32C | Omnibus Amendment No. 3, dated as of September 4, 2018, by and among Cofina Funding, LLC, as seller, CHS Inc., as servicer and as an originator, CHS Capital, LLC, as an originator, the conduit purchasers, committed purchasers and purchaser agents set forth on the signature pages thereto, the Bank of Tokyo-Mitsubishi UFJ, Ltd., New York Branch, as administrative agent, and U.S. Bank National Association, as custodian (Incorporated by reference to our Form 10-K for the year ended August 31, 2018, filed December 3, 2018). |
10.32D | Omnibus Amendment No. 5, dated as of June 27, 2019, by and among Cofina Funding, LLC, as seller, CHS Inc., as servicer and as an originator, CHS Capital, LLC, as an originator, PNC Bank, National Association, as an alternate purchaser and as a purchaser agent, each of the other conduit purchasers, committed purchasers and purchaser agents set forth on the signature pages thereto and MUFG Bank Ltd. f/k/a The Bank of Tokyo-Mitsubishi UFJ, Ltd., New York Branch, as administrative agent. (*) |
10.33 | Receivables Financing Agreement dated July 22, 2016, by and among CHS Inc., individually and as a Servicer, Cofina Funding, LLC, as Seller, Victory Receivables Corporation and Nieuw Amsterdam Receivables Corporation B.V., as Conduit Purchasers, Coöperatieve Rabobank U.A., as a Committed Purchaser, Coöperatieve Rabobank U.A., New York Branch, as Purchaser Agent, and the Bank of Tokyo-Mitsubishi UFJ, Ltd., New York Branch, as a Committed Purchaser, Purchaser Agent and as Administrative Agent. (Incorporated by reference to our Form 10-K for the year ended August 31, 2016, filed November 3, 2016). |
10.33A | Amended and Restated Receivables Purchase Agreement dated July 18, 2017, by and among CHS Inc., individually and as a Servicer, Cofina Funding, LLC, as Seller, Victory Receivables Corporation and Nieuw Amsterdam Receivables Corporation B.V., as Conduit Purchasers, Coöperatieve Rabobank U.A., as a Committed Purchaser, Coöperatieve Rabobank U.A., New York Branch, as Purchaser Agent, and the Bank of Tokyo-Mitsubishi UFJ, Ltd., New York Branch, as a Committed Purchaser, Purchaser Agent and as Administrative Agent. (Incorporated by reference to our Form 10-K for the year ended August 31, 2017, filed November 9, 2017). |
10.33B | First Amendment to Amended and Restated Receivables Purchase Agreement, dated as of June 28, 2018, by and among Cofina Funding, LLC, as Seller, CHS Inc., as Servicer, the Conduit Purchasers, Committed Purchasers and Purchaser Agents set forth on the signature pages thereto and MUFG Bank Ltd. (f/k/a The Bank of Tokyo-Mitsubishi UFJ, Ltd.), as Administrative Agent. (Incorporated by reference to our Current Report on Form 8-K, filed July 5, 2018). |
10.34 | Reaffirmation of Performance Guaranty dated July 18, 2017, by and among CHS Inc., individually and as a Servicer, Cofina Funding, LLC, as Seller, Victory Receivables Corporation and Nieuw Amsterdam Receivables Corporation B.V., as Conduit Purchasers, Coöperatieve Rabobank U.A., as a Committed Purchaser, Coöperatieve Rabobank U.A., New York Branch, as Purchaser Agent, and the Bank of Tokyo-Mitsubishi UFJ, Ltd., New York Branch, as a Committed Purchaser, Purchaser Agent and as Administrative Agent. (Incorporated by reference to our Form 10-K for the year ended August 31, 2017, filed November 9, 2017). |
10.35 | Master Framework Agreement, dated as of September 4, 2018 (the “Framework Agreement”), by and among, MUFG Bank, Ltd. (f/k/a The Bank of Tokyo-Mitsubishi UFJ, Ltd.) and each other financial institution from time to time party thereto, as MFA Buyers, MUFG Bank, Ltd., as agent for the MFA Buyers, CHS Inc. and CHS Capital, LLC, as sellers, and CHS Inc., as agent for the sellers (Incorporated by reference to our Form 10-K for the year ended August 31, 2018, filed December 3, 2018). |
10.36 | |
10.37 | |
10.38 | |
10.39 | |
|
| |
10.40 | |
21.1 | |
23.1 | |
24.1 | |
31.1 | |
31.2 | |
32.1 | |
32.2 | |
101 | The following financial information from CHS Inc.’s Annual Report on Form 10-K for the year ended August 31, 2019, formatted in Extensible Business Reporting Language (XBRL): (i) the Consolidated Statements of Operations, (ii) the Consolidated Statements of Comprehensive Income, (iii) the Consolidated Balance Sheets, (iv) the Consolidated Statements of Changes in Equity, (v) the Consolidated Statements of Cash Flows and (vi) the Notes to the Consolidated Financial Statements. (*) |
(*) Filed herewith.
(**) Schedules have been omitted pursuant to Item 601(a)(5) of Regulation S-K. CHS hereby undertakes to furnish supplemental copies of any of the omitted schedules to the U.S. Securities and Exchange Commission upon request.
(***) Portions of Exhibits 2.1 and 10.28 have been omitted pursuant to a confidential treatment order under the Exchange Act.
(+) Indicates management contract or compensatory plan or agreement.
(b) EXHIBITS
The exhibits shown in Item 15(a)(3) of this Annual Report on Form 10-K are being filed herewith.
(c) SCHEDULES
None.
ITEM 16. FORM 10-K SUMMARY
None.
(a)(3) EXHIBITS
EXHIBIT INDEX
| | | | | |
| 2.1 | |
| 3.1 | |
| 3.2 | |
| 4.1 | |
| 4.2 | |
| 4.3 | |
| 4.4 | |
| 4.5 | |
| 4.6 | |
| 4.7 | |
| 4.8 | |
| 4.9 | |
| 4.10 | |
| 4.11 | |
| 4.12 | |
| 4.13 | |
| 4.14 | |
| 4.15 | |
| 10.1 | |
| 10.1A | |
| 10.2 | |
| | | | | |
| 10.2A | |
| 10.2B | |
| 10.3 | |
| 10.3A | |
| 10.4 | |
| 10.4A | |
| 10.4B | |
| 10.5 | |
| 10.5A | |
| 10.5B | |
| 10.6 | |
| 10.7 | |
| 10.7A | |
| 10.7B | |
| 10.7C | |
| 10.7D | |
| 10.7E | |
| 10.7F | |
| 10.8 | |
| 10.8A | |
| 10.8B | |
| 10.8C | |
| 10.9 | |
| 10.10 | |
| 10.11 | Agreement Regarding Distribution of Assets, by and among CHS Inc., United Country Brands, LLC, Land O'Lakes, Inc. and Winfield Solutions, LLC, made as of September 4, 2007. (Incorporated by reference to our Form 10-K for the year ended August 31, 2007, filed November 20, 2007). |
| 10.12 | |
| | | | | |
| 10.12A | |
| 10.12B | |
| 10.12C | |
| 10.12D | |
| 10.13 | |
| 10.14 | |
| 10.14A | |
| 10.15 | |
| 10.15A | |
| 10.15B | |
| 10.15C | |
| 10.15D | |
| 10.15E | |
| 10.16 | |
| 10.17 | |
| 10.18 | 2019 Amended and Restated Credit Agreement (5-Year Revolving Loan), dated as of July 16, 2019, by and between CHS Inc., CoBank, ACB, for its own benefit as a syndication party and as the administrative agent for the benefit of the present and future syndication parties, Coöperatieve Rabobank U.A., New York Branch and Sumitomo Mitsui Banking Corporation, for their own benefit as syndication parties and as syndication agents, and the other syndication parties party thereto. (Incorporated by reference to our Current Report on Form 8-K, filed July 19, 2019). |
| 10.19 | |
| 10.19A | Amendment No. 1 to 2015 Credit Agreement. (10-Year Term Loan), dated as of June 30, 2016, by and between CHS Inc., CoBank, ACB, as a syndication party and as the administrative agent for the benefit of all present and future syndication parties, and the other syndication parties thereto. (Incorporated by reference to our Form 10-Q for the quarterly period ended May 31, 2016, filed July 7, 2016). |
| 10.19B | |
| 10.20 | |
| | | | | |
| 10.21 |
|
| 10.22 | |
| 10.22A | Omnibus Amendment No. 1, dated as of February 14, 2017, by and among Cofina Funding, LLC, as seller, CHS Inc., as servicer and as an originator, CHS Capital, LLC, as an originator, the conduit purchasers, committed purchasers and purchaser agents set forth on the signature pages thereto, the Bank of Tokyo-Mitsubishi UFJ, Ltd., New York Branch, as administrative agent, and U.S. Bank National Association, as custodian. (Incorporated by reference to our Current Report on 8-K, filed February 15, 2017). |
| 10.22B | Omnibus Amendment No. 2, dated as of July 18, 2017, by and among Cofina Funding, LLC, as seller, CHS Inc., as servicer and as an originator, CHS Capital, LLC, as an originator, the conduit purchasers, committed purchasers and purchaser agents set forth on the signature pages thereto, the Bank of Tokyo-Mitsubishi UFJ, Ltd., New York Branch, as administrative agent, and U.S. Bank National Association, as custodian. (Incorporated by reference to our Form 10-K for the year ended August 31, 2017, filed November 9, 2017). |
| 10.22C | Omnibus Amendment No. 3, dated as of September 4, 2018, by and among Cofina Funding, LLC, as seller, CHS Inc., as servicer and as an originator, CHS Capital, LLC, as an originator, the conduit purchasers, committed purchasers and purchaser agents set forth on the signature pages thereto, the Bank of Tokyo-Mitsubishi UFJ, Ltd., New York Branch, as administrative agent, and U.S. Bank National Association, as custodian. (Incorporated by reference to our Form 10-K for the year ended August 31, 2018, filed December 3, 2018). |
| 10.22D | Omnibus Amendment No. 5, dated as of June 27, 2019, by and among Cofina Funding, LLC, as seller, CHS Inc., as servicer and as an originator, CHS Capital, LLC, as an originator, PNC Bank, National Association, as an alternate purchaser and as a purchaser agent, each of the other conduit purchasers, committed purchasers and purchaser agents set forth on the signature pages thereto and MUFG Bank Ltd. f/k/a The Bank of Tokyo-Mitsubishi UFJ, Ltd., New York Branch, as administrative agent. (Incorporated by reference to our Form 10-K for the year ended August 31, 2019, filed November 6, 2019). |
| 10.22E | Omnibus Amendment No. 6, dated as of May 1, 2020, by and among Cofina Funding, LLC, as seller, CHS Inc., as servicer and as an originator, CHS Capital, LLC, as an originator, each of the conduit purchasers, committed purchasers and purchaser agents set forth on the signature pages thereto and MUFG Bank Ltd. f/k/a The Bank of Tokyo-Mitsubishi UFJ, Ltd., New York Branch, as administrative agent. (Incorporated by reference to our Form 10-Q for the quarterly period ended May 31, 2020, filed July 7, 2020). |
| 10.22F | Omnibus Amendment No. 7, dated as of June 26, 2020, by and among Cofina Funding, LLC, as seller, CHS Inc., as servicer and as an originator, CHS Capital, LLC, as an originator, each of the conduit purchasers, committed purchasers and purchaser agents set forth on the signature pages thereto and MUFG Bank Ltd. f/k/a The Bank of Tokyo–Mitsubishi UFJ, Ltd., New York Branch, as administrative agent. (*) |
| 10.22G | Omnibus Amendment No. 8, dated as of September 24, 2020, by and among Cofina Funding, LLC, as seller, CHS Inc., as servicer and as an originator, CHS Capital, LLC, as an originator, each of the conduit purchasers, committed purchasers and purchaser agents set forth on the signature pages thereto and MUFG Bank Ltd. f/k/a The Bank of Tokyo–Mitsubishi UFJ, Ltd., New York Branch, as administrative agent. (*) |
| 10.23 | Receivables Financing Agreement dated July 22, 2016, by and among CHS Inc., individually and as a Servicer, Cofina Funding, LLC, as Seller, Victory Receivables Corporation and Nieuw Amsterdam Receivables Corporation B.V., as Conduit Purchasers, Coöperatieve Rabobank U.A., as a Committed Purchaser, Coöperatieve Rabobank U.A., New York Branch, as Purchaser Agent, and the Bank of Tokyo-Mitsubishi UFJ, Ltd., New York Branch, as a Committed Purchaser, Purchaser Agent and as Administrative Agent. (Incorporated by reference to our Form 10-K for the year ended August 31, 2016, filed November 3, 2016). |
| 10.23A | Amended and Restated Receivables Purchase Agreement dated July 18, 2017, by and among CHS Inc., individually and as a Servicer, Cofina Funding, LLC, as Seller, Victory Receivables Corporation and Nieuw Amsterdam Receivables Corporation B.V., as Conduit Purchasers, Coöperatieve Rabobank U.A., as a Committed Purchaser, Coöperatieve Rabobank U.A., New York Branch, as Purchaser Agent, and the Bank of Tokyo-Mitsubishi UFJ, Ltd., New York Branch, as a Committed Purchaser, Purchaser Agent and as Administrative Agent. (Incorporated by reference to our Form 10-K for the year ended August 31, 2017, filed November 9, 2017). |
| 10.23B | First Amendment to Amended and Restated Receivables Purchase Agreement, dated as of June 28, 2018, by and among Cofina Funding, LLC, as Seller, CHS Inc., as Servicer, the Conduit Purchasers, Committed Purchasers and Purchaser Agents set forth on the signature pages thereto and MUFG Bank Ltd. (f/k/a The Bank of Tokyo-Mitsubishi UFJ, Ltd.), as Administrative Agent. (Incorporated by reference to our Current Report on Form 8-K, filed July 5, 2018). |
| 10.24 | |
| | | | | |
| 10.24A | Reaffirmation of Performance Guaranty dated July 18, 2017, by and among CHS Inc., individually and as a Servicer, Cofina Funding, LLC, as Seller, Victory Receivables Corporation and Nieuw Amsterdam Receivables Corporation B.V., as Conduit Purchasers, Coöperatieve Rabobank U.A., as a Committed Purchaser, Coöperatieve Rabobank U.A., New York Branch, as Purchaser Agent, and the Bank of Tokyo-Mitsubishi UFJ, Ltd., New York Branch, as a Committed Purchaser, Purchaser Agent and as Administrative Agent. (Incorporated by reference to our Form 10-K for the year ended August 31, 2017, filed November 9, 2017). |
| 10.25 | Master Framework Agreement, dated as of September 4, 2018 (the "Framework Agreement"), by and among, MUFG Bank, Ltd. (f/k/a The Bank of Tokyo-Mitsubishi UFJ, Ltd.) and each other financial institution from time to time party thereto, as MFA Buyers, MUFG Bank, Ltd., as agent for the MFA Buyers, CHS Inc. and CHS Capital, LLC, as sellers, and CHS Inc., as agent for the sellers (Incorporated by reference to our Form 10-K for the year ended August 31, 2018, filed December 3, 2018). |
| 10.25A | |
| 10.25B | |
| 10.25C | |
| 10.25D | |
| 10.26 | |
| 10.26A | |
| 10.27 | |
| 10.27A | |
| 10.28 | |
| 10.40 | |
| 10.40A | |
| 10.41 | |
| 10.42 | |
| 21.1 | |
| 23.1 | |
| 24.1 | |
| 31.1 | |
| 31.2 | |
| 32.1 | |
| 32.2 | |
| 101.INS | XBRL Instance Document (the instance document does not appear in the Interactive Data File because its XBRL tags are embedded within the Inline XBRL document). |
| 101.SCH | XBRL Taxonomy Extension Schema Document. (*) |
| 101.CAL | XBRL Taxonomy Extension Calculation Linkbase Document. (*) |
| 101.DEF | XBRL Taxonomy Extension Definition Linkbase Document. (*) |
| 101.LAB | XBRL Taxonomy Extension Labels Linkbase Document. (*) |
| 101.PRE | XBRL Taxonomy Extension Presentation Linkbase Document. (*) |
| 104 | Cover Page Interactive Data File (Formatted as Inline XBRL and contained in Exhibit 101). |
(*) Filed herewith.
(**) Portions of Exhibits 2.1 and 10.17 have been omitted pursuant to a confidential treatment order under the Exchange Act.
(+) Indicates management contract or compensatory plan or agreement.
(b) EXHIBITS
The exhibits shown in Item 15(a)(3) of this Annual Report on Form 10-K are being filed herewith.
(c) SCHEDULES
None.
SIGNATURES
Pursuant to the requirements of Section 13 or 15(d) of the Securities Exchange Act of 1934, the registrant has duly caused this report to be signed on its behalf by the undersigned, thereunto duly authorized, on November 6, 2019.5, 2020.
CHS INC.
|
| | | | | | | |
| By: | /s/ Jay D. Debertin |
| | Jay D. Debertin |
| | President and Chief Executive Officer |
Pursuant to the requirements of the Securities Exchange Act of 1934, this report has been signed below by the following persons on behalf of the registrant and in the capacities indicated on November 6, 2019:
| | | | | | | | |
| Signature | | Title |
| | |
| /s/ Jay D. Debertin | | President and Chief Executive Officer
(principal executive officer) |
| Jay D. Debertin | |
| | |
Signature | | Title |
| | |
/s/ Jay D. DebertinOlivia Nelligan | | President and Chief Executive Officer
(principal executive officer)
|
Jay D. Debertin | |
| | |
/s/ Timothy Skidmore | | Executive Vice President and Chief Financial Officer (principal financial officer) |
Timothy SkidmoreOlivia Nelligan | |
| | |
/s/ Daniel Lehmann | | Vice President Finance, Corporate Controller
and Chief Accounting Officer
(principal accounting officer)
|
Daniel Lehmann | |
| | |
* | | Chair of the Board of Directors |
Daniel Schurr | |
| | |
* | | Director |
David Beckman | |
| | |
* | | Director |
Clinton J. Blew | |
| | |
* | | Director |
Dennis Carlson | |
| | |
* | | Director |
Scott Cordes | |
| | |
* | | Director |
Jon Erickson | |
| | |
* | | Director |
Mark Farrell | |
| | |
* | | Director |
Steve Fritel | |
| | |
* | | Director |
Alan Holm | |
|
| | |
| /s/ Daniel Lehmann | | Vice President Finance, Corporate Controller
and Chief Accounting Officer
(principal accounting officer) |
*Daniel Lehmann | | Director |
David Johnsrud | |
| | |
* | | Director |
Tracy Jones | |
| | |
* | | Director |
David Kayser | |
| | |
* | | Director |
Russell Kehl | |
| | |
* | | Director |
Randy Knecht | |
| | |
* | | Director |
Edward Malesich | |
| | |
* | | Director |
Perry Meyer | |
| | |
* | | Director |
Steve Riegel | |
| | |
|
| | |
| * | | Chair of the Board of Directors |
| Daniel Schurr | |
| | |
| * | | Director |
| David Beckman | |
| | |
| * | | Director |
| Clinton J. Blew | |
| | |
| * | | Director |
| Hal Clemensen | |
| | |
| * | | Director |
| Scott A. Cordes | |
| | |
| * | | Director |
| Jon Erickson | |
| | |
| * | | Director |
| Mark Farrell | |
| | |
| * | | Director |
| Steve Fritel | |
| | |
| * | | Director |
| Alan Holm | |
| | |
| | | | | | | | |
| * | | Director |
| David Johnsrud | |
| | |
| * | | Director |
| Tracy G. Jones | |
| | |
| * | | Director |
| David R. Kayser | |
| | |
| * | | Director |
| Russell A. Kehl | |
| | |
| * | | Director |
| Edward Malesich | |
| | |
| * | | Director |
| Perry Meyer | |
| | |
| * | | Director |
| Steve Riegel | |
| | |
| * | | Director |
| Kevin Throener | |
| | |
| | | | | | | | |
| *By | /s/ Jay D. Debertin | |
| Jay D. Debertin Attorney-in-fact | |
REPORT OF INDEPENDENT REGISTERED PUBLIC ACCOUNTING FIRM
To the Board of Directors, Members and Patrons of CHS Inc.:
Opinion on the Financial Statements
We have audited the accompanying consolidated balance sheets of CHS Inc. and its subsidiaries (the "Company") as of August 31, 20192020 and 2018,2019, and the related consolidated statements of operations, comprehensive income, changes in equities and cash flows for each of the three years in the period ended August 31, 2019,2020, including the related notes and schedule of valuation and qualifying accounts and reserves for each of the three years in the period ended August 31, 2019,2020, appearing under Item 15(a)(2) (collectively referred to as the "consolidated financial statements"). In our opinion, the consolidated financial statements present fairly, in all material respects, the financial position of the Company as of August 31, 20192020 and 2018,2019, and the results of its operations and its cash flows for each of the three years in the period ended August 31, 2019,2020, in conformity with accounting principles generally accepted in the United States of America.
Change in Accounting Principle
As discussed in Note 1 to the consolidated financial statements, the Company changed the manner in which it accounts for leases as of September 1, 2019.
Basis for Opinion
These consolidated financial statements are the responsibility of the Company's management. Our responsibility is to express an opinion on the Company's consolidated financial statements based on our audits. We are a public accounting firm registered with the Public Company Accounting Oversight Board (United States) (PCAOB) and are required to be independent with respect to the Company in accordance with the U.S. federal securities laws and the applicable rules and regulations of the Securities and Exchange Commission and the PCAOB.
We conducted our audits of these consolidated financial statements in accordance with the standards of the PCAOB. Those standards require that we plan and perform the audit to obtain reasonable assurance about whether the consolidated financial statements are free of material misstatement, whether due to error or fraud. The Company is not required to have, nor were we engaged to perform, an audit of its internal control over financial reporting. As part of our audits we are required to obtain an understanding of internal control over financial reporting but not for the purpose of expressing an opinion on the effectiveness of the Company's internal control over financial reporting. Accordingly, we express no such opinion.
Our audits included performing procedures to assess the risks of material misstatement of the consolidated financial statements, whether due to error or fraud, and performing procedures that respond to those risks. Such procedures included examining, on a test basis, evidence regarding the amounts and disclosures in the consolidated financial statements. Our audits also included evaluating the accounting principles used and significant estimates made by management, as well as evaluating the overall presentation of the consolidated financial statements. We believe that our audits provide a reasonable basis for our opinion.
/s/ PricewaterhouseCoopers LLP
Minneapolis, Minnesota
November 6, 20195, 2020
We have served as the Company's auditor since 1998.
CHS INC. AND SUBSIDIARIES
CONSOLIDATED BALANCE SHEETS
| | | | | | | | | | | |
| | August 31, |
| | 2020 | | 2019 |
| | (Dollars in thousands) |
| ASSETS | | | |
| Current assets: | | | |
| Cash and cash equivalents | $ | 140,874 | | | $ | 211,179 | |
| Receivables | 2,366,047 | | | 2,731,209 | |
| Inventories | 2,742,138 | | | 2,854,288 | |
| Other current assets | 1,017,488 | | | 865,919 | |
| Total current assets | 6,266,547 | | | 6,662,595 | |
| Investments | 3,630,033 | | | 3,683,996 | |
| Property, plant and equipment | 4,957,938 | | | 5,088,708 | |
| Other assets | 1,139,429 | | | 1,012,195 | |
| Total assets | $ | 15,993,947 | | | $ | 16,447,494 | |
| LIABILITIES AND EQUITIES | | | |
| Current liabilities: | | | |
| Notes payable | $ | 1,575,491 | | | $ | 2,156,108 | |
| Current portion of long-term debt | 189,287 | | | 39,210 | |
| Accounts payable | 1,724,516 | | | 1,931,415 | |
| Accrued expenses | 501,904 | | | 555,323 | |
| Other current liabilities | 928,843 | | | 901,651 | |
| Total current liabilities | 4,920,041 | | | 5,583,707 | |
| Long-term debt | 1,601,836 | | | 1,749,901 | |
| Other liabilities | 652,897 | | | 496,356 | |
| Commitments and contingencies (Note 17) | | | |
| Equities: | | | |
| Preferred stock | 2,264,038 | | | 2,264,038 | |
| Equity certificates | 5,161,610 | | | 4,988,877 | |
| Accumulated other comprehensive loss | (233,924) | | | (226,933) | |
| Capital reserves | 1,618,147 | | | 1,584,158 | |
| Total CHS Inc. equities | 8,809,871 | | | 8,610,140 | |
| Noncontrolling interests | 9,302 | | | 7,390 | |
| Total equities | 8,819,173 | | | 8,617,530 | |
| Total liabilities and equities | $ | 15,993,947 | | | $ | 16,447,494 | |
|
| | | | | | | |
| | August 31, |
| | 2019 | | 2018 |
| | (Dollars in thousands) |
| ASSETS | | | |
| Current assets: | |
| |
|
|
| Cash and cash equivalents | $ | 211,179 |
| | $ | 450,617 |
|
| Receivables | 2,731,209 |
| | 2,460,401 |
|
| Inventories | 2,854,288 |
| | 2,768,649 |
|
| Derivative assets | 253,341 |
| | 329,757 |
|
| Margin and related deposits | 155,306 |
| | 151,150 |
|
| Supplier advance payments | 197,290 |
| | 288,423 |
|
| Other current assets | 259,982 |
| | 244,208 |
|
| Total current assets | 6,662,595 |
| | 6,693,205 |
|
| Investments | 3,683,996 |
| | 3,711,925 |
|
| Property, plant and equipment | 5,088,708 |
| | 5,141,719 |
|
| Other assets | 1,012,195 |
| | 834,329 |
|
| Total assets | $ | 16,447,494 |
| | $ | 16,381,178 |
|
| LIABILITIES AND EQUITIES | | | |
| Current liabilities: | |
| | |
|
| Notes payable | $ | 2,156,108 |
| | $ | 2,272,196 |
|
| Current portion of long-term debt | 39,210 |
| | 167,565 |
|
| Customer margin deposits and credit balances | 143,049 |
| | 137,395 |
|
| Customer advance payments | 336,645 |
| | 409,088 |
|
| Accounts payable | 1,931,415 |
| | 1,844,489 |
|
| Derivative liabilities | 241,957 |
| | 438,465 |
|
| Accrued expenses | 555,323 |
| | 511,032 |
|
| Dividends and equities payable | 180,000 |
| | 153,941 |
|
| Total current liabilities | 5,583,707 |
| | 5,934,171 |
|
| Long-term debt | 1,749,901 |
| | 1,762,690 |
|
| Long-term deferred tax liabilities | 143,061 |
| | 182,770 |
|
| Other liabilities | 353,295 |
| | 336,519 |
|
| Commitments and contingencies (Note 15) |
|
| |
|
|
| Equities: | |
| | |
|
| Preferred stock | 2,264,038 |
| | 2,264,038 |
|
| Equity certificates | 4,988,877 |
| | 4,609,456 |
|
| Accumulated other comprehensive loss | (226,933 | ) | | (199,915 | ) |
| Capital reserves | 1,584,158 |
| | 1,482,003 |
|
| Total CHS Inc. equities | 8,610,140 |
| | 8,155,582 |
|
| Noncontrolling interests | 7,390 |
| | 9,446 |
|
| Total equities | 8,617,530 |
| | 8,165,028 |
|
| Total liabilities and equities | $ | 16,447,494 |
| | $ | 16,381,178 |
|
The accompanying notes are an integral part of the consolidated financial statements.
CHS INC. AND SUBSIDIARIES
CONSOLIDATED STATEMENTS OF OPERATIONS
| | | | | | | | | | | | | | | | | |
| | Years Ended August 31, |
| | 2020 | | 2019 | | 2018 |
| | (Dollars in thousands) |
| Revenues | $ | 28,406,365 | | | $ | 31,900,453 | | | $ | 32,683,347 | |
| Cost of goods sold | 27,424,558 | | | 30,516,120 | | | 31,591,227 | |
| Gross profit | 981,807 | | | 1,384,333 | | | 1,092,120 | |
| Marketing, general and administrative expenses | 704,542 | | | 724,731 | | | 639,756 | |
| Operating earnings | 277,265 | | | 659,602 | | | 452,364 | |
| Gain on disposal of business | (1,450) | | | (3,886) | | | (131,816) | |
| Interest expense | 116,977 | | | 167,065 | | | 149,202 | |
| Other income | (38,425) | | | (82,423) | | | (82,737) | |
| Equity income from investments | (186,715) | | | (236,755) | | | (153,515) | |
| Income before income taxes | 386,878 | | | 815,601 | | | 671,230 | |
| Income tax benefit | (36,731) | | | (12,456) | | | (104,076) | |
| Net income | 423,609 | | | 828,057 | | | 775,306 | |
| Net income (loss) attributable to noncontrolling interests | 1,170 | | | (1,823) | | | (601) | |
| Net income attributable to CHS Inc. | $ | 422,439 | | | $ | 829,880 | | | $ | 775,907 | |
|
| | | | | | | | | | | |
| | For the Years Ended August 31, |
| | 2019 | | 2018 | | 2017 |
| | (Dollars in thousands) |
| Revenues | $ | 31,900,453 |
| | $ | 32,683,347 |
| | $ | 32,037,426 |
|
| Cost of goods sold | 30,516,120 |
| | 31,591,227 |
| | 31,143,549 |
|
| Gross profit | 1,384,333 |
| | 1,092,120 |
| | 893,877 |
|
| Marketing, general and administrative expenses | 737,636 |
| | 677,465 |
| | 611,076 |
|
| Reserve and impairment charges (recoveries), net | (12,905 | ) | | (37,709 | ) | | 456,679 |
|
| Operating earnings (loss) | 659,602 |
| | 452,364 |
| | (173,878 | ) |
| (Gain) loss on disposal of business | (3,886 | ) | | (131,816 | ) | | 2,190 |
|
| Interest expense | 167,065 |
| | 149,202 |
| | 171,239 |
|
| Other (income) loss | (82,423 | ) | | (82,737 | ) | | (99,803 | ) |
| Equity (income) loss from investments | (236,755 | ) | | (153,515 | ) | | (137,338 | ) |
| Income (loss) before income taxes | 815,601 |
| | 671,230 |
| | (110,166 | ) |
| Income tax expense (benefit) | (12,456 | ) | | (104,076 | ) | | (181,124 | ) |
| Net income (loss) | 828,057 |
| | 775,306 |
| | 70,958 |
|
| Net income (loss) attributable to noncontrolling interests | (1,823 | ) | | (601 | ) | | (634 | ) |
| Net income (loss) attributable to CHS Inc. | $ | 829,880 |
| | $ | 775,907 |
| | $ | 71,592 |
|
The accompanying notes are an integral part of the consolidated financial statements.
CHS INC. AND SUBSIDIARIES
CONSOLIDATED STATEMENTS OF COMPREHENSIVE INCOME
| | | | | | | | | | | | | | | | | |
| Years Ended August 31, |
| 2020 | | 2019 | | 2018 |
| | (Dollars in thousands) |
| Net income | $ | 423,609 | | | $ | 828,057 | | | $ | 775,306 | |
| Other comprehensive income (loss), net of tax: | | | | | |
| Pension and other postretirement benefits | 12,798 | | | (32,559) | | | 20,066 | |
| Unrealized net loss on available-for-sale investments | 0 | | | 0 | | | (3,148) | |
| Cash flow hedges | (4,411) | | | 20,196 | | | 2,540 | |
| Foreign currency translation adjustment | (15,378) | | | (9,949) | | | (12,021) | |
| Other comprehensive (loss) income, net of tax | (6,991) | | | (22,312) | | | 7,437 | |
| Comprehensive income | 416,618 | | | 805,745 | | | 782,743 | |
| Comprehensive income (loss) attributable to noncontrolling interests | 1,170 | | | (1,823) | | | (601) | |
| Comprehensive income attributable to CHS Inc. | $ | 415,448 | | | $ | 807,568 | | | $ | 783,344 | |
|
| | | | | | | | | | | |
| | For the Years Ended August 31, |
| | 2019 | | 2018 | | 2017 |
| | (Dollars in thousands) |
| Net income (loss) | $ | 828,057 |
| | $ | 775,306 |
| | $ | 70,958 |
|
| Other comprehensive income (loss), net of tax: | | | | | |
| Pension and other postretirement benefits | (32,559 | ) | | 20,066 |
| | 32,702 |
|
| Unrealized net gain (loss) on available for sale investments | — |
| | (3,148 | ) | | 4,385 |
|
| Cash flow hedges | 20,196 |
| | 2,540 |
| | 2,242 |
|
| Foreign currency translation adjustment | (9,949 | ) | | (12,021 | ) | | (8,159 | ) |
| Other comprehensive income (loss), net of tax | (22,312 | ) | | 7,437 |
| | 31,170 |
|
| Comprehensive income | 805,745 |
| | 782,743 |
| | 102,128 |
|
| Comprehensive income (loss) attributable to noncontrolling interests | (1,823 | ) | | (601 | ) | | (634 | ) |
| Comprehensive income attributable to CHS Inc. | $ | 807,568 |
| | $ | 783,344 |
| | $ | 102,762 |
|
The accompanying notes are an integral part of the consolidated financial statements.
CHS INC. AND SUBSIDIARIES
CONSOLIDATED STATEMENTS OF CHANGES IN EQUITIES
| | | | | | | | | | | | | | | | | | | | | | | | | | | | | | | | | | | | | | | | | | | | | | | | | |
| Years Ended August 31, 2020, 2019 and 2018 |
| | Equity Certificates | | | | Accumulated
Other
Comprehensive
Loss | | | | | | | | |
| Capital
Equity
Certificates | | Nonpatronage
Equity
Certificates | | Nonqualified Equity Certificates | | Preferred
Stock | | | | | Capital
Reserves | | Noncontrolling
Interests | | Total
Equities |
| | (Dollars in thousands) |
| Balances, August 31, 2017 | $ | 3,906,426 | | | $ | 29,836 | | | $ | 405,387 | | | $ | 2,264,038 | | | $ | (180,360) | | | | | $ | 1,267,808 | | | $ | 12,505 | | | $ | 7,705,640 | |
| Reversal of prior year patronage and redemption estimates | 6,058 | | | — | | | (126,333) | | | — | | | — | | | | | 126,333 | | | — | | | 6,058 | |
| Distribution of 2017 patronage refunds | — | | | — | | | 128,831 | | | — | | | — | | | | | (128,831) | | | — | | | — | |
| Redemptions of equities | (6,064) | | | (185) | | | (476) | | | — | | | — | | | | | — | | | — | | | (6,725) | |
| | | | | | | | | | | | | | | | | |
| | | | | | | | | | | | | | | | | |
| Preferred stock dividends | — | | | — | | | — | | | — | | | — | | | | | (168,668) | | | — | | | (168,668) | |
| Other, net | (3,840) | | | (153) | | | (361) | | | — | | | — | | | | | 2,792 | | | (2,458) | | | (4,020) | |
| Net income (loss) | — | | | — | | | — | | | — | | | — | | | | | 775,907 | | | (601) | | | 775,306 | |
| Other comprehensive income, net of tax | — | | | — | | | — | | | — | | | 7,437 | | | | | — | | | — | | | 7,437 | |
| Reclassification of tax effects to capital reserves | — | | | — | | | — | | | — | | | (26,992) | | | | | 26,992 | | | — | | | — | |
| Estimated 2018 patronage refunds | — | | | — | | | 345,330 | | | — | | | — | | | | | (420,330) | | | — | | | (75,000) | |
| Estimated 2018 equity redemptions | (65,000) | | | — | | | (10,000) | | | — | | | — | | | | | — | | | — | | | (75,000) | |
| Balances, August 31, 2018 | 3,837,580 | | | 29,498 | | | 742,378 | | | 2,264,038 | | | (199,915) | | | | | 1,482,003 | | | 9,446 | | | 8,165,028 | |
| Reversal of prior year patronage and redemption estimates | 78,941 | | | — | | | (345,330) | | | — | | | — | | | | | 420,330 | | | — | | | 153,941 | |
| Distribution of 2018 patronage refunds | — | | | — | | | 352,980 | | | — | | | — | | | | | (428,756) | | | — | | | (75,776) | |
| Redemptions of equities | (70,859) | | | (409) | | | (14,272) | | | — | | | — | | | | | — | | | — | | | (85,540) | |
| | | | | | | | | | | | | | | | | |
| | | | | | | | | | | | | | | | | |
| Preferred stock dividends | — | | | — | | | — | | | — | | | — | | | | | (168,668) | | | — | | | (168,668) | |
| Other, net | (2,169) | | | (15) | | | (1,844) | | | — | | | — | | | | | 7,061 | | | (233) | | | 2,800 | |
| Net income (loss) | — | | | — | | | — | | | — | | | — | | | | | 829,880 | | | (1,823) | | | 828,057 | |
| Other comprehensive loss, net of tax | — | | | — | | | — | | | — | | | (22,312) | | | | | — | | | — | | | (22,312) | |
| Reclassification of tax effects to capital reserves | — | | | — | | | — | | | — | | | (4,706) | | | | | 4,706 | | | — | | | — | |
| Estimated 2019 patronage refunds | — | | | — | | | 472,398 | | | — | | | — | | | | | (562,398) | | | — | | | (90,000) | |
| Estimated 2019 equity redemptions | (90,000) | | | — | | | 0 | | | — | | | — | | | | | — | | | — | | | (90,000) | |
| Balances, August 31, 2019 | 3,753,493 | | | 29,074 | | | 1,206,310 | | | 2,264,038 | | | (226,933) | | | | | 1,584,158 | | | 7,390 | | | 8,617,530 | |
| Reversal of prior year patronage and redemption estimates | 80,000 | | | — | | | (462,398) | | | — | | | — | | | | | 562,398 | | | — | | | 180,000 | |
| Distribution of 2019 patronage refunds | — | | | — | | | 474,407 | | | — | | | — | | | | | (564,522) | | | — | | | (90,115) | |
| Redemptions of equities | (80,133) | | | (340) | | | (15,965) | | | — | | | — | | | | | — | | | — | | | (96,438) | |
| Preferred stock dividends | — | | | — | | | — | | | — | | | — | | | | | (168,668) | | | — | | | (168,668) | |
| ASC Topic 842 cumulative-effect adjustment | — | | | — | | | — | | | — | | | 0 | | | | | 25,320 | | | — | | | 25,320 | |
| Other, net | (1,173) | | | (7) | | | (628) | | | — | | | — | | | | | (1,008) | | | 742 | | | (2,074) | |
| Net income | — | | | — | | | — | | | — | | | — | | | | | 422,439 | | | 1,170 | | | 423,609 | |
| Other comprehensive loss, net of tax | — | | | — | | | — | | | — | | | (6,991) | | | | | — | | | — | | | (6,991) | |
| Estimated 2020 patronage refunds | — | | | — | | | 211,970 | | | — | | | — | | | | | (241,970) | | | — | | | (30,000) | |
| Estimated 2020 equity redemptions | (28,000) | | | — | | | (5,000) | | | — | | | — | | | | | — | | | — | | | (33,000) | |
| Balances, August 31, 2020 | $ | 3,724,187 | | | $ | 28,727 | | | $ | 1,408,696 | | | $ | 2,264,038 | | | $ | (233,924) | | | | | $ | 1,618,147 | | | $ | 9,302 | | | $ | 8,819,173 | |
|
| | | | | | | | | | | | | | | | | | | | | | | | | | | | | | | |
| | For the Years Ended August 31, 2019, 2018 and 2017 |
| | Equity Certificates | | | | Accumulated
Other
Comprehensive
Loss | | | | | | |
| Capital
Equity
Certificates | | Nonpatronage
Equity
Certificates | | Nonqualified Equity Certificates | | Preferred
Stock | | | Capital
Reserves | | Noncontrolling
Interests | | Total
Equities |
| | (Dollars in thousands) |
| Balances, August 31, 2016 | $ | 3,918,711 |
| | $ | 22,894 |
| | $ | 281,767 |
| | $ | 2,244,132 |
| | $ | (211,530 | ) | | $ | 1,488,999 |
| | $ | 14,186 |
| | $ | 7,759,159 |
|
| Reversal of prior year patronage and redemption estimates | (95,019 | ) |
| — |
|
| — |
|
| — |
|
| — |
| | 257,458 |
|
| — |
|
| 162,439 |
|
| Distribution of 2016 patronage refunds | 153,589 |
|
| — |
|
| — |
|
| — |
|
| — |
| | (257,468 | ) |
| — |
|
| (103,879 | ) |
| Redemptions of equities | (35,041 | ) |
| (389 | ) |
| (1,960 | ) |
| — |
|
| — |
| | — |
|
| — |
|
| (37,390 | ) |
| Equities issued | 3,194 |
|
| — |
|
| — |
|
| — |
|
| — |
| | — |
|
| — |
|
| 3,194 |
|
| Capital equity certificates exchanged for preferred stock | (19,985 | ) | | — |
| | — |
| | 19,960 |
| | — |
| | 25 |
| | — |
| | — |
|
| Preferred stock dividends | — |
|
| — |
|
| — |
|
| — |
|
| — |
| | (167,643 | ) |
| — |
|
| (167,643 | ) |
| Other, net | (9,023 | ) |
| 7,331 |
|
| (753 | ) |
| (54 | ) |
| — |
| | 1,178 |
|
| (1,047 | ) |
| (2,368 | ) |
| Net income (loss) | — |
|
| — |
|
| — |
|
| — |
|
| — |
| | 71,592 |
|
| (634 | ) |
| 70,958 |
|
| Other comprehensive income (loss), net of tax | — |
|
| — |
|
| — |
|
| — |
|
| 31,170 |
| | — |
|
| — |
|
| 31,170 |
|
| Estimated 2017 patronage refunds | — |
|
| — |
|
| 126,333 |
|
| — |
|
| — |
| | (126,333 | ) |
| — |
|
| — |
|
| Estimated 2017 equity redemptions | (10,000 | ) |
| — |
|
| — |
|
| — |
|
| — |
| | — |
|
| — |
|
| (10,000 | ) |
| Balances, August 31, 2017 | 3,906,426 |
|
| 29,836 |
|
| 405,387 |
|
| 2,264,038 |
|
| (180,360 | ) | | 1,267,808 |
|
| 12,505 |
|
| 7,705,640 |
|
| Reversal of prior year patronage and redemption estimates | 6,058 |
|
| — |
|
| (126,333 | ) |
| — |
|
| — |
| | 126,333 |
|
| — |
|
| 6,058 |
|
| Distribution of 2017 patronage refunds | — |
|
| — |
|
| 128,831 |
|
| — |
|
| — |
| | (128,831 | ) |
| — |
|
| — |
|
| Redemptions of equities | (6,064 | ) |
| (185 | ) |
| (476 | ) |
| — |
|
| — |
| | — |
|
| — |
|
| (6,725 | ) |
| Preferred stock dividends | — |
|
| — |
|
| — |
|
| — |
|
| — |
| | (168,668 | ) |
| — |
|
| (168,668 | ) |
| Other, net | (3,840 | ) | | (153 | ) | | (361 | ) | | — |
| | — |
| | 2,792 |
| | (2,458 | ) | | (4,020 | ) |
| Net income (loss) | — |
| | — |
| | — |
| | — |
| | — |
| | 775,907 |
| | (601 | ) | | 775,306 |
|
| Other comprehensive income (loss), net of tax | — |
|
| — |
|
| — |
|
| — |
|
| 7,437 |
| | — |
|
| — |
|
| 7,437 |
|
| Reclassification of tax effects to capital reserves | — |
| | — |
| | — |
| | — |
| | (26,992 | ) | | 26,992 |
| | — |
| | — |
|
| Estimated 2018 patronage refunds | — |
|
| — |
|
| 345,330 |
|
| — |
|
| — |
| | (420,330 | ) |
| — |
|
| (75,000 | ) |
| Estimated 2018 equity redemptions | (65,000 | ) |
| — |
|
| (10,000 | ) |
| — |
|
| — |
| | — |
|
| — |
|
| (75,000 | ) |
| Balances, August 31, 2018 | 3,837,580 |
|
| 29,498 |
|
| 742,378 |
|
| 2,264,038 |
|
| (199,915 | ) | | 1,482,003 |
|
| 9,446 |
|
| 8,165,028 |
|
| Reversal of prior year patronage and redemption estimates | 78,941 |
|
| — |
|
| (345,330 | ) |
| — |
|
| — |
| | 420,330 |
|
| — |
|
| 153,941 |
|
| Distribution of 2018 patronage refunds | — |
|
| — |
|
| 352,980 |
|
| — |
|
| — |
| | (428,756 | ) |
| — |
|
| (75,776 | ) |
| Redemptions of equities | (70,859 | ) |
| (409 | ) |
| (14,272 | ) |
| — |
|
| — |
| | — |
|
| — |
|
| (85,540 | ) |
| Preferred stock dividends | — |
|
| — |
|
| — |
|
| — |
|
| — |
| | (168,668 | ) |
| — |
|
| (168,668 | ) |
| Other, net | (2,169 | ) | | (15 | ) | | (1,844 | ) | | — |
| | — |
| | 7,061 |
| | (233 | ) | | 2,800 |
|
| Net income (loss) | — |
|
| — |
|
| — |
|
| — |
|
| — |
| | 829,880 |
|
| (1,823 | ) |
| 828,057 |
|
| Other comprehensive income (loss), net of tax | — |
|
| — |
|
| — |
|
| — |
|
| (22,312 | ) | | — |
|
| — |
|
| (22,312 | ) |
| Reclassification of tax effects to capital reserves | — |
| | — |
| | — |
| | — |
| | (4,706 | ) | | 4,706 |
| | — |
| | — |
|
| Estimated 2019 patronage refunds | — |
|
| — |
|
| 472,398 |
|
| — |
|
| — |
| | (562,398 | ) |
| — |
|
| (90,000 | ) |
| Estimated 2019 equity redemptions | (90,000 | ) |
| — |
|
| — |
|
| — |
|
| — |
| | — |
|
| — |
|
| (90,000 | ) |
| Balances, August 31, 2019 | $ | 3,753,493 |
|
| $ | 29,074 |
|
| $ | 1,206,310 |
|
| $ | 2,264,038 |
|
| $ | (226,933 | ) | | $ | 1,584,158 |
|
| $ | 7,390 |
|
| $ | 8,617,530 |
|
The accompanying notes are an integral part of the consolidated financial statements.
CHS INC. AND SUBSIDIARIES
CONSOLIDATED STATEMENTS OF CASH FLOWS
| | | | | | | | | | | | | | | | | |
| | Years Ended August 31, |
| | 2020 | | 2019 | | 2018 |
| | (Dollars in thousands) |
| Cash flows from operating activities: | | | | | |
| Net income | $ | 423,609 | | | $ | 828,057 | | | $ | 775,306 | |
| Adjustments to reconcile net income to net cash provided by (used in) operating activities: | | | | | |
| Depreciation and amortization, including amortization of deferred major maintenance | 550,251 | | | 541,507 | | | 539,736 | |
| Equity (income) loss from investments, net of distributions received | 49,130 | | | 12,560 | | | 36,782 | |
| Provision for doubtful accounts | 3,418 | | | 57,745 | | | 2,085 | |
| Gain/recovery on disposal of business | (1,450) | | | (3,886) | | | (131,816) | |
| Deferred taxes | (32,761) | | | (13,852) | | | (146,961) | |
| Other, net | (1,642) | | | 6,094 | | | (3,699) | |
| Changes in operating assets and liabilities, net of acquisitions: | | | | | |
| Receivables | 308,399 | | | (218,192) | | | 210,775 | |
| Inventories | 104,884 | | | 284,694 | | | (169,581) | |
| Accounts payable and accrued expenses | (330,949) | | | (38,229) | | | (78,388) | |
| Other, net | 14,340 | | | (316,567) | | | 40,258 | |
| Net cash provided by operating activities | 1,087,229 | | | 1,139,931 | | | 1,074,497 | |
| Cash flows from investing activities: | | | | | |
| Acquisition of property, plant and equipment | (418,359) | | | (443,216) | | | (355,412) | |
| Proceeds from disposition of property, plant and equipment | 32,670 | | | 53,974 | | | 91,153 | |
| Proceeds from sale of business | 1,139 | | | 5,044 | | | 234,914 | |
| Expenditures for major maintenance | (14,496) | | | (232,094) | | | (80,514) | |
| Changes in CHS Capital notes receivable, net | 119,591 | | | (10,903) | | | 25,335 | |
| Financing extended to customers | (6,386) | | | (12,210) | | | (74,402) | |
| Payments from customer financing | 35,791 | | | 90,193 | | | 52,453 | |
| Business acquisitions, net of cash acquired | 231 | | | (119,421) | | | 0 | |
| Other investing activities, net | 6,114 | | | 7,350 | | | 26,949 | |
| Net cash used in investing activities | (243,705) | | | (661,283) | | | (79,524) | |
| Cash flows from financing activities: | | | | | |
| Proceeds from notes payable and long-term borrowings | 24,343,870 | | | 29,071,363 | | | 36,040,240 | |
| Payments on notes payable, long-term debt and finance lease obligations | (24,948,926) | | | (29,450,339) | | | (36,525,136) | |
| Preferred stock dividends paid | (168,668) | | | (168,668) | | | (168,668) | |
| Redemptions of equities | (96,438) | | | (85,540) | | | (8,847) | |
| Cash patronage dividends paid | (90,115) | | | (75,776) | | | 0 | |
| Other financing activities, net | 29,129 | | | (16,686) | | | (69,759) | |
| Net cash used in financing activities | (931,148) | | | (725,646) | | | (732,170) | |
| Effect of exchange rate changes on cash and cash equivalents | 4,942 | | | 2,733 | | | 8,864 | |
| Net (decrease) increase in cash and cash equivalents and restricted cash | (82,682) | | | (244,265) | | | 271,667 | |
| Cash and cash equivalents and restricted cash at beginning of period | 299,675 | | | 543,940 | | | 272,273 | |
| Cash and cash equivalents and restricted cash at end of period | $ | 216,993 | | | $ | 299,675 | | | $ | 543,940 | |
| Supplemental cash flow information: | | | | | |
| Cash paid for interest | $ | 119,354 | | | $ | 172,259 | | | $ | 148,874 | |
| Cash paid for income taxes, net of refunds | 6,840 | | | 19,918 | | | 13,410 | |
| Other significant noncash investing and financing transactions: | | | | | |
| Notes receivable reacquired under securitization facility | 0 | | | 0 | | | 615,089 | |
| Trade receivables reacquired under securitization facility | 0 | | | 0 | | | 402,421 | |
| Securitized debt reacquired under securitization facility | 0 | | | 0 | | | 634,000 | |
| Deferred purchase price receivable extinguished under securitization facility | 0 | | | 0 | | | 386,900 | |
| Capital expenditures and major maintenance incurred but not yet paid | 14,906 | | | 28,478 | | | 53,453 | |
| Finance lease obligations incurred | 11,190 | | | 7,351 | | | 396 | |
| Accrual of dividends and equities payable | 63,000 | | | 180,000 | | | 153,941 | |
| Assets contributed to joint venture | 0 | | | 7,353 | | | — | |
|
| | | | | | | | | | | |
| | For the Years Ended August 31, |
| | 2019 | | 2018 | | 2017 |
| | (Dollars in thousands) |
| Cash flows from operating activities: | |
| | |
| | |
|
| Net income (loss) | $ | 828,057 |
| | $ | 775,306 |
| | $ | 70,958 |
|
| Adjustments to reconcile net income to net cash provided by (used in) operating activities: | |
| | |
| | |
|
| Depreciation and amortization | 473,211 |
| | 478,050 |
| | 480,223 |
|
| Amortization of deferred major maintenance costs | 68,296 |
| | 61,686 |
| | 67,058 |
|
| Equity (income) loss from investments | (236,755 | ) | | (153,515 | ) | | (137,338 | ) |
| Distributions from equity investments | 249,315 |
| | 190,297 |
| | 213,352 |
|
| Provision for doubtful accounts | 57,745 |
| | 2,085 |
| | 177,969 |
|
| (Gain/recovery) loss on disposal of business | (3,886 | ) | | (131,816 | ) | | 2,190 |
|
| Unrealized (gain) loss on crack spread contingent liability | — |
| | — |
| | (15,051 | ) |
| Long-lived asset impairment, net of recoveries | 40,340 |
| | (10,352 | ) | | 145,042 |
|
| Reserve against supplier advance payments | — |
| | — |
| | 130,705 |
|
| Deferred taxes | (13,852 | ) | | (146,961 | ) | | (194,467 | ) |
| Other, net | (34,246 | ) | | 6,653 |
| | 20,173 |
|
| Changes in operating assets and liabilities, net of acquisitions: | |
| | |
| | |
|
| Receivables | (218,192 | ) | | 210,775 |
| | 146,788 |
|
| Inventories | 284,694 |
| | (169,581 | ) | | (333,479 | ) |
| Derivative assets | 105,708 |
| | (102,368 | ) | | 114,023 |
|
| Margin and related deposits | (4,188 | ) | | 54,912 |
| | 97,804 |
|
| Supplier advance payments | 42,659 |
| | (39,189 | ) | | (33,952 | ) |
| Other current assets and other assets | (25,442 | ) | | (11,021 | ) | | (15,147 | ) |
| Customer margin deposits and credit balances | 945 |
| | (20,518 | ) | | (50,920 | ) |
| Customer advance payments | (211,761 | ) | | (14,682 | ) | | (1,329 | ) |
| Accounts payable and accrued expenses | (38,229 | ) | | (78,388 | ) | | 227,967 |
|
| Derivative liabilities | (203,383 | ) | | 132,495 |
| | (132,423 | ) |
| Other liabilities | (21,105 | ) | | 40,629 |
| | (25,446 | ) |
| Net cash provided by (used in) operating activities | 1,139,931 |
| | 1,074,497 |
| | 954,700 |
|
| Cash flows from investing activities: | |
| | |
| | |
|
| Acquisition of property, plant and equipment | (443,216 | ) | | (355,412 | ) | | (444,397 | ) |
| Proceeds from disposition of property, plant and equipment | 53,974 |
| | 91,153 |
| | 19,541 |
|
| Proceeds from sale of business | 5,044 |
| | 234,914 |
| | — |
|
| Expenditures for major maintenance | (232,094 | ) | | (80,514 | ) | | (2,340 | ) |
| Investments redeemed | (5,086 | ) | | (21,679 | ) | | (16,645 | ) |
| Changes in CHS Capital notes receivable, net | (10,903 | ) | | 25,335 |
| | 322 |
|
| Financing extended to customers | (12,210 | ) | | (74,402 | ) | | (67,225 | ) |
| Payments from customer financing | 90,193 |
| | 52,453 |
| | 88,154 |
|
| Business acquisitions, net of cash acquired | (119,421 | ) | | — |
| | — |
|
| Other investing activities, net | 12,436 |
| | 48,628 |
| | 17,549 |
|
| Net cash provided by (used in) investing activities | (661,283 | ) | | (79,524 | ) | | (405,041 | ) |
| Cash flows from financing activities: | |
| | |
| | |
|
| Proceeds from notes payable and long-term borrowings | 29,071,363 |
| | 36,040,240 |
| | 37,295,236 |
|
| Payments on notes payable, long-term debt and capital lease obligations | (29,450,339 | ) | | (36,525,136 | ) | | (37,584,011 | ) |
| Preferred stock dividends paid | (168,668 | ) | | (168,668 | ) | | (167,642 | ) |
| Redemptions of equities | (85,540 | ) | | (8,847 | ) | | (35,268 | ) |
| Cash patronage dividends paid | (75,776 | ) | | — |
| | (103,879 | ) |
| Other financing activities, net | (16,686 | ) | | (69,759 | ) | | (22,694 | ) |
| Net cash provided by (used in) financing activities | (725,646 | ) | | (732,170 | ) | | (618,258 | ) |
| Effect of exchange rate changes on cash and cash equivalents | 2,733 |
| | 8,864 |
| | (4,713 | ) |
| Net increase (decrease) in cash and cash equivalents and restricted cash | (244,265 | ) | | 271,667 |
| | (73,312 | ) |
| Cash and cash equivalents and restricted cash at beginning of period | 543,940 |
| | 272,273 |
| | 345,584 |
|
| Cash and cash equivalents and restricted cash at end of period | $ | 299,675 |
| | $ | 543,940 |
| | $ | 272,273 |
|
The accompanying notes are an integral part of the consolidated financial statements.
NOTES TO CONSOLIDATED FINANCIAL STATEMENTS
Note 1 Organization, Basis of Presentation and Significant Accounting Policies
Organization
CHS Inc. (referred to herein as "CHS," "we," "us" or "our") is the nation’s leading integrated agricultural cooperative. As a cooperative, CHS is owned by farmers and ranchers and their member cooperatives ("members") across the United States. We also have preferred shareholders that own shares of our various series of preferred stock, which are each listed and traded on the Global Select Market of theThe Nasdaq Stock Market LLC ("The Nasdaq"). See Note 10, 12, Equities, for more detailed information.
We buy commodities from and provide products and services to individual agricultural producers, local cooperatives and other companies (including member and other non-membernonmember customers), both domestic and international. Those products and services include initial agricultural inputs such as fuels, farm supplies, crop nutrients and crop protection products; as well as agricultural outputs that include grains and oilseeds, grain and oilseed processing and food products, and ethanol production and marketing. A portion of our operations are conducted through equity investments and joint ventures whose operating results are not fully consolidated with our results; rather, a proportionate share of the income or loss from those entities is included as a component in our net income under the equity method of accounting.
Basis of Presentation
The consolidated financial statements include the accounts of CHS and all our subsidiaries and limited liability companies in which we have a controlling interest. The effects of all significant intercompany transactions have been eliminated.
The notes to our consolidated financial statements refer to our Energy, Ag and Nitrogen Production reportable segments, as well as our Corporate and Other category, which represents an aggregation of individually immaterial operating segments. The Nitrogen Production reportable segment resultedresults from our investment in CF Industries Nitrogen, LLC ("CF Nitrogen"). See Note 12, 14, Segment Reporting, for more information.
Certain captions within the Consolidated Balance Sheets, Consolidated Statements of Operations and Consolidated Statements of Cash Flows have been combined within other captions as allowed by Securities and Exchange Commission financial statement reporting requirements under Regulation S-X. Prior year information has been updated to conform with the current presentation.
Use of Estimates
The preparation of financial statements in conformity with U.S. GAAP requires management to make estimates and assumptions that affect the reported amounts of assets and liabilities and disclosure of contingent assets and liabilities at the date of the financial statements and the reported amounts of revenues and expenses during the reporting period. We base our estimates on assumptions that are believed to be reasonable, the results of which form the basis for making judgments about the carrying values of assets and liabilities. Due to the inherent uncertainty involved in making estimates, actual results could differ from those estimates. We evaluate our estimates and assumptions on an ongoing basis.
Significant Accounting Policies
Significant accounting policies are summarized below or within the related notes to our consolidated financial statements.
Cash and Cash Equivalents and Restricted Cash
Cash equivalents include short-term, highly liquid investments with original maturities of three months or less at the date of acquisition. The fair value of cash and cash equivalents approximates the carrying value due to the short-term nature of the instruments.
Restricted Cash
Restricted cash is included in our Consolidated Balance Sheets within other current assets (current portion) and other assets (non-current(noncurrent portion), as appropriate, and primarily relates to customer deposits for futures and option contracts associated with regulated commodities held in separate accounts as required under federal and other regulations. Pursuant to the
requirements of the Commodity Exchange Act, such funds must be carried in separate accounts that are designated as segregated customer accounts, as applicable. Restricted cash also includes funds held in escrow pursuant to applicable regulations limiting their usage.
The following table provides a reconciliation of cash and cash equivalents and restricted cash as reported within our Consolidated Balance Sheets that aggregates to the amount presented in our Consolidated Statements of Cash Flows. During
| | | | | | | | | | | | | | | | | |
| August 31, |
| 2020 | | 2019 | | 2018 |
| (Dollars in thousands) |
| Cash and cash equivalents | $ | 140,874 | | | $ | 211,179 | | | $ | 450,617 | |
| Restricted cash included in other current assets | 76,119 | | | 88,496 | | | 90,193 | |
| Restricted cash included in other assets | 0 | | | 0 | | | 3,130 | |
| Total cash and cash equivalents and restricted cash | $ | 216,993 | | | $ | 299,675 | | | $ | 543,940 | |
Recent Accounting Pronouncements
Except for the years ended August 31, 2019, 2018 and 2017, we updated the presentation of our Consolidated Statements of Cash Flowsrecent accounting pronouncements described below, other recent accounting pronouncements are not expected to include restricted cash with cash and cash equivalents when reconciling the beginning-of-period and end-of-period total amounts shownhave a material impact on our Consolidated Statements of Cash Flows.condensed consolidated financial statements.
|
| | | | | | | | | | | |
| | For the year ended August 31, |
| | 2019 | | 2018 | | 2017 |
| | (Dollars in thousands) |
| Cash and cash equivalents | $ | 211,179 |
| | $ | 450,617 |
| | $ | 181,379 |
|
| Restricted cash included in other current assets | 88,496 |
| | 90,193 |
| | 83,561 |
|
| Restricted cash included in other assets | — |
| | 3,130 |
| | 7,333 |
|
| Total cash and cash equivalents and restricted cash | $ | 299,675 |
| | $ | 543,940 |
| | $ | 272,273 |
|
Inventories
Grain, processed grain, oilseed, processed oilseed and other minimally processed soy-based inventories are stated at net realizable value. These inventories are agricultural commodity inventories that are readily convertible to cash because of their commodity characteristics, widely available markets and international pricing mechanisms. Agricultural commodity inventories have quoted market prices in active markets, may be sold without significant further processing and have predictable and insignificant disposal costs. Changes in the net realizable value of merchandisable agricultural commodities inventories are recognized in earnings as a component of cost of goods sold.
All other inventories are stated at the lower of cost or net realizable value. Costs for inventories produced or modified by us through a manufacturing process include fixed and variable production and raw material costs, and in-bound freight costs for raw materials. Costs for inventories purchased for resale include the cost of products and freight incurred to place the products at our points of sale. The costs of certain energy inventories (wholesale refined products, crude oil and asphalt) are determined on the last-in, first-out ("LIFO") method; all other inventories of non-grain products purchased for resale are valued on the first-in, first-out ("FIFO") and average cost methods.
Derivative Financial Instruments and Hedging Activities
We enter into various derivative instruments to manage our exposure to movements primarily associated with agricultural and energy commodity prices and, to a lesser degree, foreign currency exchange rates and interest rates. Except for certain interest rate swap and certain pay-fixed, receive-variable, cash-settled swaps related to future crude oil purchases, which are accounted for as fair value hedges and cash flow hedges, respectively, our derivative instruments represent economic hedges of price risk for which hedge accounting underadopted Accounting Standards Codification ("ASC") Topic 815, Derivatives and Hedging, is not applied. Rather, the derivative instruments are recorded on our Consolidated Balance Sheets at fair value with changes in fair value being recorded directly to earnings, primarily within cost of goods sold in our Consolidated Statements of Operations. See Note 13, Derivative Financial Instruments and Hedging Activities, and Note 14, Fair Value Measurements, for additional information.
Although we have certain netting arrangements for our exchange-traded futures and options contracts and certain over-the-counter842, Leases ("OTC") contracts, we have elected to report our derivative instruments on a gross basis on our Consolidated Balance Sheets under ASC Topic 210-20, Balance Sheet - Offsetting.
Margin842"), as of September 1, 2019, using the modified retrospective approach. In addition, we used the additional optional transition method and Related Deposits
Manypackage of our derivative contracts with futures and options brokers require us to make margin deposits of cash or other assets. Subsequent margin deposits may also be necessary when changespractical expedients in commodity prices result in a loss on the contract value to comply with applicable regulations. Our margin and related deposit assets are generally held by external brokers in segregated accounts to support the associated derivative contracts and may be used to fund or partially fund the settlement of those contracts as they expire. Similar to our derivative financial instruments, margin and related deposits are reported on a gross basis.
Supplier Advance Payments and Rebates
Supplier advance payments are typically for periods less than 12 months and primarily include amounts paid for grain purchases from suppliers and amounts paid to crop nutrient and crop protection product suppliers to lock in future supply and pricing.
We receive volume-based rebates from certain vendors during the year. These vendor rebates are accounted for in accordance with ASC 705, Cost of Sales and Services, based on the terms of the volume rebate program. For rebates thatmeet the definition of a binding arrangement and are both probable and estimable, we estimate the amount of the rebate we will receive and accrue it as a reduction of the cost of inventory and cost of goods sold over the period in whichof adoption without retrospective adjustment to previous periods presented, although we elected not to apply the rebate is earned.
Investments
As described inhindsight practical expedient available under the "Recent Accounting Pronouncements" section below, we adopted Accounting Standards Update ("ASU") No. 2016-01, Recognition and Measurement of Financial Assets and Financial Liabilities, which was effective for us September 1, 2018.standard. As a result all equity securities that do not result in consolidation and are not accounted for under the equity method are measured at fair value with changes therein reflected in net income. We have elected to utilize the measurement alternative for equity investments that do not have readily determinable fair values and measure these investments at cost less impairment plus or minus observable price changes in orderly transactions. Our equity in the income or loss of these equity method investments is recorded within equity (income) loss from investments in the Consolidated Statements of Operations. We account for our investment in CF Nitrogen using the hypothetical liquidation at book valuemodified retrospective method, which is discussed further inNote 5, Investments.
Investments in other cooperatives areprior periods have not been restated, and a $25.3 million cumulative-effect adjustment, including the deferred income tax impact, was recorded in a manner similar to equity investments without readily determinable fair values, plus patronage dividends received inincrease the formopening balance of capital stock and other equities. Patronage dividends are recordedreserves as a reduction to cost of goods sold at the time qualified written notices of allocation are received. Investments in debt and equity instruments are carried at amounts that approximate fair values.
Property, Plant and Equipment
Property, plant and equipment are stated at cost less accumulated depreciation and amortization. Depreciation and amortization are provided on the straight-line method by charges to operations at rates based on the expected useful lives of individual or groups of assets (generally 15 to 20 years for land improvements; 20 to 40 years for buildings; 5 to 20 years for machinery and equipment; and 3 to 10 years for office equipment and other). Expenditures for maintenance and minor repairs and renewals are expensed, while the costs for major maintenance activities are capitalized and amortized on a straight-line basis over the period estimated to lapse until the next major maintenance activity occurs. We also capitalize and amortize eligible costs to acquire or develop internal-use software that are incurred during the application development stage. When assets are sold or otherwise disposed of the cost andadoption date related accumulated depreciation and amortization are removed fromto recognition of previously deferred gains associated with the related accounts and resulting gains or losses are reflected in operations.
Property, plant and equipment and other long-lived assets are reviewed for impairment when events or changes in circumstances indicate that the carrying amounts may not be recoverable. This evaluation of recoverability is based on various indicators, including the nature, future economic benefits and geographic locations of the assets, historical or future profitability measures and other external market conditions. If these indicators suggest the carrying amounts of an asset or asset group may not be recoverable, potential impairment is evaluated using undiscounted estimated future cash flows. Should the sum of the expected future net cash flows be less than the carrying value, an impairment loss would be recognized. An impairment loss would be measured as the amount by which the carrying value of the asset or asset group exceeds its fair value.
We have asset retirement obligations with respect to certainsale-leaseback of our refineries and other assets due to various legal obligations to clean and/or dispose of the component parts at the time they are retired. In most cases, these assets can be used for extended and indeterminate periods of time if they are properly maintained and/or upgraded. It is our practice and current intent to maintain refineries and related assets and to continue making improvements to those assets based on technological advances. As a result, we believe our refineries and related assets have indeterminate lives for purposes of estimating asset retirement obligations because dates or ranges of dates upon which we would retire a refinery and related assets cannot reasonably be estimated at this time. When a date or range of dates can reasonably be estimated for the retirement of any component part of a refinery or other asset, we estimate the cost of performing the retirement activities and record a liability for the fair value of that future cost.
We have other assets that we may be obligated to dismantle at the end of corresponding lease terms subject to lessor discretion for which we have recorded asset retirement obligations. Based on our estimates of timing, cost and probability of removal, these obligations are not material.
Major Maintenance Activities
Within our Energy segment, major maintenance activities (“turnarounds”) are performed at our Laurel, Montana, and McPherson, Kansas, refineries regularly. Turnarounds are the planned and required shutdowns of refinery processing units, which include replacement or overhaul of equipment that has experienced decreased efficiencyprimary corporate office building located in resource conversion. Because turnarounds are performed to extend the life, increase the capacity and/or improve the safety or efficiency of refinery processing assets, we follow the deferral method of accounting for turnarounds. Expenditures for turnarounds are capitalized (deferred) when incurred and amortized on a straight-line basis over a period of 2 to 5 years, which is the estimated time lapse between turnarounds. Should the estimated period between turnarounds change, we may be required to amortize the remaining cost of the turnaround over a shorter period, which would result in higher depreciation and amortization costs. Capitalized turnaround costs are included in other assets (long-term) on our Consolidated Balance Sheets and amortization expense related to the capitalized turnaround costs is included in cost of goods sold in our Consolidated Statements of Operations.
Selection of the deferral method, as opposed to expensing turnaround costs when incurred, results in deferring recognition of turnaround expenditures. The deferral method also results in classification of related cash outflows as investing activities in our Consolidated Statements of Cash Flows, whereas expensing these costs as incurred would result in classifying the cash outflows as operating activities. Repair, maintenance and related labor costs are expensed as incurred and are included in operating cash flows.
Goodwill and Other Intangible Assets
Goodwill and other intangible assets are included in other assets (long-term) on our Consolidated Balance Sheets. Goodwill represents the excess of cost over the fair value of identifiable assets acquired. Goodwill is tested for impairment on an annual basis as of July 31 or more frequently if triggering events or other circumstances occur that could indicate impairment. Goodwill is tested for impairment at the reporting unit level, which has been determined to be our operating segments or one level below our operating segments in certain instances.
Other intangible assets consist primarily of customer lists, trademarks and non-compete agreements. Intangible assets subject to amortization are expensed over their respective useful lives, which generally range from 2 to 30 years. We have no material intangible assets with indefinite useful lives. See Note 7, Other Assets, for more information on goodwill and other intangible assets.
Revenue Recognition
We provide a wide variety of products and services, ranging from agricultural inputs, such as fuels, farm supplies and agronomy products, to agricultural outputs that include grain and oilseed, processed grains and oilseeds and food products, and ethanol production and marketing. Revenue is recognized when performance obligations under the terms of a contract with a customer are satisfied, which generally occurs when control of the goods has transferred to the customer. For the majority of our contracts with customers, control transfers to customers at a point-in-time when the goods/services have been delivered, as that is generally when legal title, physical possession and risks and rewards of goods/services transfer to the customer. In limited arrangements, control transfers over time as the customer simultaneously receives and consumes the benefits of the service as we complete the performance obligation(s). Shipping and handling amounts billed to a customer as part of a sales transaction are included in revenues, and the related costs are included in cost of goods sold.
Revenue is recognized at the transaction price that we expect to be entitled to in exchange for transferring goods or services to a customer, excluding amounts collected on behalf of third parties. We follow a policy of recognizing revenue at the point-in-time or over the period of time we satisfy our performance obligation by transferring control over a product or service to a customer in accordance with the underlying contract. For physically settled derivative sales contracts that are outside the scope of the revenue guidance, we recognize revenue when control of the inventory is transferred within the meaningInver Grove Heights, Minnesota. Additionally, adoption of ASC Topic 606. See Note 2, Revenues, for more information on revenue recognition.
Environmental Expenditures
We are subject to various federal, state, and local environmental laws and regulations. Environmental expenditures are expensed or capitalized depending on their future economic benefit. Liabilities, including legal costs, related to remediation of contaminated properties are recognized when the related costs are considered probable and can be reasonably estimated. Estimates of environmental costs are based on current available facts, existing technology, undiscounted site-specific costs and currently enacted laws and regulations. Recoveries, if any, are recorded842 resulted in the period in which recovery is received. Liabilities are monitored and adjusted as new facts or changes in law or technology occur.
Income Taxes
CHS is a nonexempt agricultural cooperative and files a consolidated federal income tax return within our tax return period. We are subject to tax on income from nonpatronage sources, non-qualified patronage distributions and undistributed patronage-sourced income. Income tax expense is primarily the current tax payable for the period and the change during the period in certain deferred taxrecognition of operating lease right-of-use assets and liabilities. Deferred income taxes reflect the impactassociated lease liabilities of temporary differences between the amounts$268.4 million and $267.0 million, respectively, as of assets and liabilities recognized for financial reporting purposes and such amounts recognized for federal and state income tax purposes, based on enacted tax laws and statutory tax rates applicable to the periods in which the differences are expected to affect taxable income. Valuation allowances are established, when necessary, to reduce deferred tax assets to the amount expected to be realized. Reserves are recorded against unrecognized tax benefits when we believe certain fully supportable tax return positions are likely to be challenged and we may or may not prevail. If we determine that a tax position is more likely than not to be sustained upon audit, based on the technical merits of the position, we recognize the benefit by measuring the amount that is greater than 50% likely of being realized. We reevaluate the technical merits of our tax positions and recognize an uncertain tax benefit, or derecognize a previously recorded tax benefit, when there is (i) a completion of a tax audit, (ii) effective settlement of an issue, (iii) a change in applicable tax law including a tax case or legislative guidance, or (iv) expiration of the applicable statute of limitations. Significant judgment is required in accounting for tax reserves.
Recent Accounting Pronouncements
Adopted
In March 2017, the Financial Accounting Standards Board (the "FASB") issued ASU No. 2017-07, Compensation - Retirement Benefits (Topic 715): Improving the Presentation of Net Periodic Pension Costs and Net Postretirement Benefit Cost. This ASU changes the presentation of net periodic pension cost and net periodic postretirement benefit cost in the Consolidated Statements of Operations. This ASU provides that the service cost component should be included in the same income statement line item as other compensation costs arising from services rendered by the employees during the period. The other components of net periodic benefit cost (such as interest, expected return on plan assets, prior service cost amortization and actuarial gain/loss amortization) are required to be presented in the Consolidated Statements of Operations separately outside of operating income. Additionally, only service cost may be capitalized in assets. This ASU was effective for us beginning September 1, 2018, for our fiscal year 2019 and for interim periods within that fiscal year. The guidance on the presentation2019. Adoption of the components of net periodic benefit cost in the Consolidated Statements of Operations has been applied retrospectively, and the guidance regarding the capitalization of the service cost component in assets has been applied prospectively. The adoption of this guidance had no impact on previously reported income (loss) before income taxes or net income attributable to CHS; however, non-service cost components of net periodic benefit costs in prior periods have been reclassified from cost of goods sold and marketing, general and administrative expenses, and are now reported outside of operating income within other (income) loss. The amounts of the retrospective reclassification adjustments recorded as a result of adoption of this guidance are shown in the table below.
|
| | | | | | | | | | | | | | | | | | | | | | | |
| | For the year ended August 31, 2018 | | For the year ended August 31, 2017 |
| | As Previously Reported | | Accounting Change | | As Presented | | As Previously Reported | | Accounting Change | | As Presented |
| | (Dollars in thousands) |
| Cost of goods sold | $ | 31,589,887 |
| | $ | 1,340 |
| | $ | 31,591,227 |
| | $ | 31,142,766 |
| | $ | 783 |
| | $ | 31,143,549 |
|
| Gross profit | 1,093,460 |
| | (1,340 | ) | | 1,092,120 |
| | 894,660 |
| | (783 | ) | | 893,877 |
|
| Marketing, general and administrative expenses | 674,083 |
| | 3,382 |
| | 677,465 |
| | 612,007 |
| | (931 | ) | | 611,076 |
|
| Operating earnings (loss) | 457,086 |
| | (4,722 | ) | | 452,364 |
| | (174,026 | ) | | 148 |
| | (173,878 | ) |
| Other (income) loss | (78,015 | ) | | (4,722 | ) | | (82,737 | ) | | (99,951 | ) | | 148 |
| | (99,803 | ) |
In January 2017, the FASB issued ASU No. 2017-01, Business Combinations (ASC Topic 805): Clarifying the Definition of a Business. The amendments within this ASU narrow the existing definition of a business and provide a more robust framework for evaluating whether a transaction should be accounted for as an acquisition (or disposal) of assets or a business. The definition of a business impacts various areas of accounting, including acquisitions, disposals and goodwill. Under the new guidance, fewer acquisitions are expected to be considered businesses. This ASU was effective for us beginning September 1, 2018, for our fiscal year 2019 and for interim periods within that fiscal year. The guidance has been applied prospectively. The adoption of this amended guidance did not have a material impact on our consolidated financial statements.
In November 2016, the FASB issued ASU No. 2016-18, Statement of Cash Flows (Topic 230): Restricted Cash. This ASU requires restricted cash and restricted cash equivalents to be included with cash and cash equivalents when reconciling the beginning-of-period and end-of-period total amounts shown on the Consolidated Statements of Cash Flows, as well as disclosure about the nature of restrictions on cash, cash equivalents and amounts generally described as restricted cash. Additionally, the guidance requires disclosure of the total amount of cash, cash equivalents and restricted cash for each comparative period for which a Consolidated Balance Sheet is presented. This ASU was effective for us beginning September 1, 2018, for our fiscal year 2019 and for interim periods within that fiscal year. The amendments in this ASU were applied retrospectively to all periods presented. Refer to the additional disclosures pertaining to restricted cash within the Restricted Cash significant accounting policy above. The adoption of this amended guidance842 did not have a material impact on our Consolidated Statements of Cash Flows.
In August 2016, the FASB issued ASU No. 2016-15, Statement of Cash Flows (Topic 230): Classification of Certain Cash Receipts and Cash Payments. This ASU is intended to reduce existing diversity in practice in how certain cash receipts and payments are presented and classified in theOperations or Consolidated Statements of Cash Flows. This ASU was effective for us beginning September 1, 2018, for our fiscal year 2019Additional information and for interim periods within that fiscal year. The adoption of this amended guidance did not have a material impact on our Consolidated Statements of Cash Flows.
In January 2016, the FASB issued ASU No. 2016-01, Recognition and Measurement of Financial Assets and Financial Liabilities, which requires equity investments (except those accounted for under the equity method of accounting or those that result in consolidation of the investee) to be measured at fair value, with changes in fair value recognized in net income. This guidance eliminates the previous cost method of accounting for certain equity securities that did not have readily determinable fair values. This guidance also simplifies the impairment assessment and allows for a fair value measurement alternative for equity investments without readily determinable fair values and includes presentation and disclosure changes. This ASU was effective for us beginning September 1, 2018, for our fiscal year 2019 and for interim periods within that fiscal year and was applied following a prospective basis. We have elected to utilize the measurement alternative for equity investments that do not have readily determinable fair values and measure these investments at cost less impairment plus or minus observable price changes in orderly transactions. As a result of the adoption of this amended guidance, we reclassified approximately $4.7 million from accumulated other comprehensive loss to the opening balance of capital reserves within our Consolidated Balance Sheet as of September 1, 2018, which did not have a material impact on our consolidated financial statements.
In May 2014, the FASB issued ASU No. 2014-09, Revenue from Contracts withCustomers (Topic 606). The amendments within this ASU, as well as within the additional clarifying ASUs issued by the FASB, provide a single comprehensive model to be used to determine the measurement of revenue and timing of recognition for revenue arising from contracts with customers. The core principle of the amended guidance is that an entity should recognize revenue to depict the transfer of promised goods or services to customers in an amount that reflects consideration to which the entity expects to be entitled in exchange for those goods or services. The new revenue recognition guidance includes a five-step model for the recognition of revenue, including (1) identifying the contract with a customer, (2) identifying the performance obligations in the contract, (3) determining the transaction price, (4) allocating the transaction price to the performance obligations, and (5) recognizing revenue when (or as) an entity satisfies a performance obligation. This ASU was effective for us beginning September 1, 2018, for our fiscal year 2019 and for interim periods within that fiscal year, and we elected to apply the modified retrospective method of adoption to all contracts as of the date of initial application. The majority of our revenues are attributable to forward commodity sales contracts, which are considered to be physically settled derivatives under ASC 815, Derivatives and Hedging (Topic 815). Revenues arising from derivative contracts accounted for under ASC Topic 815 are specifically outside the scope of ASC Topic 606 and therefore not subject to the provisions of the new revenue recognition guidance. As such, the impact of adoption of the new revenue guidance has only been assessed for our revenue contracts that are not accounted for as derivative arrangements. The primary impact of adoption was changes to the timing of revenue recognition for certain revenue streams that had an immaterial impact. Following the modified retrospective method of adoption, we determined the cumulative effect of adoption for all contracts with customers that had not been completed as of the adoption date was less than $1.0 million. Additionally, the impact of applying ASC Topic 606 compared to previous guidance during the year ended August 31, 2019, was an overall decrease to revenues and cost of goods sold of $52.1 million.
Other financial statement impactsfurther disclosures related to our adoption of ASC Topic 606 were not material. Our revenue recognition accounting policyleases and additional information related to our revenue streams and related performance obligations required to be satisfied to recognize revenue can be found within the Significant Accounting Policies section above andlease-related financial statement amounts are included within Note 2, Revenues.19, Leases.
Not Yet Adopted
In August 2018, the FASB issued ASU No. 2018-15, Intangibles - Goodwill and Other - Internal-Use Software: Customer’s Accounting for Implementation Costs Incurred in a Cloud Computing Arrangement That Is a Service Contract. This ASU reduces the complexity of accounting for implementation, setup and other upfront costs incurred in a cloud computing service arrangement that is hosted by a vendor. This ASU aligns accounting for implementation costs of hosting arrangements, irrespective of whether the arrangements convey a license to the hosted software. This ASU permits either a prospective or retrospective transition approach. This ASU is effective for us beginning September 1, 2020, for our fiscal year 2021 and for interim periods within that fiscal year, with early adoption permitted. Adoption of this amended guidance is not expected to have a material impact on our consolidated financial statements.
In August 2018, the FASB issued ASU No. 2018-14, Disclosure Framework - Changes to the Disclosure Requirements for Defined Benefit Plans, which amends ASC 715-20, Compensation - Retirement Benefits - Defined Benefit Plans - General. This ASU modifies the disclosure requirements for employers that sponsor defined benefit pension or other postretirement plans by removing and adding certain disclosures for these plans. The eliminated disclosures include (a) the amounts in accumulated other comprehensive income expected to be recognized in net periodic benefit costs over the next fiscal year and (b) the effects of a one-percentage-point change in assumed health care cost trend rates on the net periodic benefit costs and the benefit obligation for postretirement health care benefits. The new disclosures include the interest crediting rates for cash balance plans and an explanation of significant gains and losses related to changes in benefit obligations. This ASU is effective for us beginning September 1, 2021, for our fiscal year 2022 and for interim periods within that fiscal year, with early adoption permitted. Adoption of this amended guidance is not expected to have a material impact on our consolidated financial statements.
In August 2018, the FASB issued ASU No. 2018-13, Disclosure Framework - Changes to the Disclosure Requirements for Fair Value Measurement, which amends ASC 820, Fair Value Measurement. This ASU modifies the disclosure requirements for fair value measurements by removing, modifying and adding certain disclosures. Specifically, the guidance removes the requirement to disclose the amount and reasons for any transfers between Level 1 and Level 2 of the fair value hierarchy and removes the requirement to disclose a description of the valuation processes used to value Level 3 fair value measurements. The guidance also requires additional disclosures surrounding Level 3 changes in unrealized gains/losses included in other comprehensive income, as well as the range and weighted average of significant unobservable inputs calculation. This ASU is effective for us beginning September 1, 2020, for our fiscal year 2021 and for interim periods within that fiscal year. Early adoption is permitted. We elected to remove the disclosures permitted by ASU No. 2018-13 during the fourth quarter of fiscal 2018, but have not early adopted the new required additional disclosures, which is permitted by the guidance. Adoption of this amended guidance is not expected to have a material impact on our consolidated financial statements.
In June 2016, the FASBFinancial Accounting Standards Board ("FASB") issued ASUAccounting Standards Update ("ASU") No. 2016-13, Financial Instruments - Credit Losses (Topic 326) ("ASC Topic 326"): Measurement of Credit Losses on Financial Instruments. The amendments in this ASU introduce a new approach, based on expected losses, to estimate credit losses on certain types of financial instruments. This ASU is intended to provide financial statement users with more decision-useful information about the expected credit losses associated with most financial assets measured at amortized cost and certain other instruments, including trade and other receivables, loans, held-to-maturity debt securities, net investments in leases and off-balance sheetoff-balance-sheet credit exposures. Entities are required to apply the provisions of this ASU as a cumulative-effect adjustment to the opening balance of capital reserves as of the beginning of the first reporting period in which the guidance is adopted. This ASU is effective for us beginning September 1, 2020, for our fiscal year 2021 and for interim periods within that fiscal year. We are currently evaluatingBased on various data-gathering activities, development of a credit losses model, data analyses and accounting policy election determinations, the impact the adoption will have on our consolidated financial statements.
In February 2016, the FASB issued ASU No. 2016-02, Leases (Topic 842), which replaces the existing guidance within ASC 840, Leases. The amendments within this ASU, as well as within additional clarifying ASUs issued by the FASB, introduce a lessee model requiring entities to recognize assets and liabilities for most leases, but continue recognizing the associated expenses in a manner similar to existing accounting guidance. In July 2018, the FASB issued ASU No. 2018-10, Codification Improvements to Topic 842, Leases, which amends ASU No. 2016-02, Leases. This ASU is effective for us beginning September 1, 2019, for our fiscal year 2020 and for interim periods within that fiscal year. In conjunction with our implementation of the new lease guidance, we have completed detailed lease contract reviews and considered expanded disclosure requirements, in addition to initiating the implementation of a new lease software system to improve collection,
maintenance, and aggregation of lease data necessary for the expanded reporting and disclosure requirements under the new lease standard. We will adopt and implement the new guidance utilizing the additional optional transition method and package of practical expedients in the period of adoption without retrospective adjustment to previous periods presented, although we have elected not to apply the hindsight practical expedient available under the standard. It is expected that the primary impact upon adoption will be the recognition, on a discounted basis, of our minimum commitments under noncancelable operating leases as right of use assets and liabilities on our Consolidated Balance Sheets, and we expect to record approximately $240.0 million to $280.0 million of lease assets and lease liabilities related to our operating leases and an immaterial adjustment to capital reserves related to transition upon adoption of this ASU. We will provide expanded disclosures upon adoption of ASU No. 2016-02 as required under the guidance, and it is not expected that adoption of this standard willto have a material impact on our consolidated results of operations.financial statements.
Note 2 Revenues
Adoption of New Revenue Guidance
As described in Note 1, Organization, Basis of Presentation and Significant Accounting Policies, we adopted the guidance within ASU 2014-09 as of September 1, 2018, using the modified retrospective transition approach. Consistent with other companies that actively trade commodities, a majority of our revenues are attributable to forward commodity sales contracts that are considered to be physically settled derivatives under ASC Topic 815 and therefore fall outside the scope of ASC Topic 606. As a result, these revenues are not subject to provisions of the new revenue guidance and the impact of adoption is limited to our revenue streams that fall within the scope of the new revenue guidance.
The majority of our revenue streams that fall within the scope of the new revenue guidance are recognized at a point-in-time; however, adoption of ASU 2014-09 resulted in a minimal number of changes to the timing of revenue recognition for certain revenue streams. Under the modified retrospective method of adoption, we determined the cumulative effect of adoption for all contracts with customers that had not been completed as of the adoption date and recognized an adjustment of less than $1.0 million to the opening capital reserves balance within the Consolidated Balance Sheet as of September 1, 2018. Additionally, the impact of applying ASC Topic 606 compared to previous guidance during the year ended August 31, 2019, was an overall decrease to revenues and cost of goods sold of $52.1 million, which was primarily related to the change in revenue recognition for certain contracts from a gross basis to a net basis.
Other changes in accounting for revenue recognition under ASU 2014-09 did not have a material impact on our Consolidated Statements of Operations for the year ended August 31, 2019, or Consolidated Balance Sheet as of August 31, 2019.
Revenue Recognition Accounting Policy and Performance Obligations
We provide a wide variety of products and services, from agricultural inputs such as fuels, farm supplies and agronomy products, to agricultural outputs that include grain and oilseed, processed grains and oilseeds and food products, and ethanolrenewable fuels production and marketing. We primarily conduct our operations and derive revenues within our Energy and Ag businesses.segments. Our Energy businesssegment derives its revenues through refining, wholesaling and retailing of petroleum products. Our Ag businesssegment derives its revenues through origination and marketing of grain, including service activities conducted at export terminals; through wholesale sales of agronomy products and processed sunflowers; from sales of soybean meal, soybean refined oil and soyflour products; through production and marketing of renewable fuels; and through retail sales of petroleum
and agronomy products, and feed and farm supplies. Corporate and Other primarily consists of our financing and hedging businesses.
Revenue is recognized when performance obligations under the terms of a contract with a customer are satisfied, which generally occurs when control of the goods has transferred to customers.customers in accordance with the underlying contract. For the majority of our contracts with customers, control transfers to customers at a point-in-timepoint in time when goods/services have been delivered, as that is generally when legal title, physical possession and risks and rewards of ownership of the goods/services transfer to the customer. In limited arrangements, control transfers over time as the customer simultaneously receives and consumes the benefits of the service as we complete our performance obligation(s).
Revenue is recognized as the transaction price we expect to be entitled to in exchange for transferring goods or services to a customer, excluding amounts collected on behalf of third parties. We follow a policy of recognizing revenue at the point-in-time or over the period of time that we satisfy our performance obligation by transferring control of a product or service to a customer in accordance with the underlying contract. For physically settled derivative sales contracts that are outside the scope of the revenue guidance, we recognize revenue when control of the inventory is transferred within the meaning of ASC Topic 606, Revenue from Contracts with Customers ("ASC Topic 606"). Revenues arising from our financing business are recognized in accordance with ASC Topic 470, Debt ("ASC Topic 470"), and fall outside the scope of ASC Topic 606.
The amount of revenues recognized during the year ended August 31, 2019, for performance obligations that were fully satisfied in previous periods was not material.
Shipping and Handling Costs
Shipping and handling amounts billed to a customer as part of a sales transaction are included in revenues, and the related costs are included in cost of goods sold. Shipping and handling is treated as a fulfillment activity rather than a promised service, and therefore is not considered a separate performance obligation.
Taxes Collected from Customers and Remitted to Governmental Authorities
Revenues are recorded net of taxes collected from customers that are remitted to governmental authorities, with the collected taxes recorded as current liabilities until remitted to the relevant government authority.
Contract Costs
Commissions related to contracts with a duration of less than one year are expensed as incurred. We recognize incremental costs of obtaining contracts as an expense when incurred if the amortization period of the assets we otherwise would have recognized is one year or less.
Disaggregation of Revenues
The following table presents revenues recognized under ASC Topic 606 disaggregated by reportable segment, as well as the amount of revenues recognized under ASC Topic 815, Derivatives and Hedging ("ASC Topic 815"), and other applicable accounting guidance for the year ended August 31, 2020 and 2019. Other applicable accounting guidance primarily includes revenues recognized under ASC Topic 840, Leases,842 and ASC Topic 470Debt, that fall outside the scope of ASC Topic 606.
| | | | | | | | | | | | Year Ended August 31, 2020 |
| Reportable Segment* | | ASC 606 | | ASC 815 | | Other Guidance | | Total Revenues | Reportable Segment* | | ASC Topic 606 | | ASC Topic 815 | | Other Guidance | | Total Revenues |
| | | (Dollars in thousands) | | | (Dollars in thousands) |
| Energy | | $ | 6,393,075 |
| | $ | 726,001 |
| | $ | — |
| | $ | 7,119,076 |
| Energy | | $ | 4,833,003 | | | $ | 598,131 | | | $ | 0 | | | $ | 5,431,134 | |
| Ag | | 6,319,304 |
| | 18,268,977 |
| | 131,791 |
| | 24,720,072 |
| Ag | | 5,963,198 | | | 16,901,258 | | | 61,643 | | | 22,926,099 | |
| Corporate and Other | | 20,262 |
| | — |
| | 41,043 |
| | 61,305 |
| Corporate and Other | | 22,903 | | | 0 | | | 26,229 | | | 49,132 | |
| Total revenues | | $ | 12,732,641 |
| | $ | 18,994,978 |
| | $ | 172,834 |
| | $ | 31,900,453 |
| Total revenues | | $ | 10,819,104 | | | $ | 17,499,389 | | | $ | 87,872 | | | $ | 28,406,365 | |
| | | | Year Ended August 31, 2019 |
| Reportable Segment* | | Reportable Segment* | | ASC Topic 606 | | ASC Topic 815 | | Other Guidance | | Total Revenues |
| | | | (Dollars in thousands) |
| Energy | | Energy | | $ | 6,393,075 | | | $ | 726,001 | | | $ | 0 | | | $ | 7,119,076 | |
| Ag | | Ag | | 6,319,304 | | | 18,268,977 | | | 131,791 | | | 24,720,072 | |
| Corporate and Other | | Corporate and Other | | 20,262 | | | 0 | | | 41,043 | | | 61,305 | |
| Total revenues | | Total revenues | | $ | 12,732,641 | | | $ | 18,994,978 | | | $ | 172,834 | | | $ | 31,900,453 | |
*Our Nitrogen Production reportable segment represents an equity method investment that records earnings and allocated expenses, but not revenues.
Less than 1% of revenues accounted for under ASC Topic 606 included within the table above are recorded over time and relate primarily to service contracts.
Our Energy segment derives its revenues through refining, wholesaling and retailing of petroleum products. Our Energy segment produces and sells (primarily wholesale) gasoline, diesel fuel, propane, asphalt, lubricants and other related products and provides transportation services. We are the nation's largest cooperative energy company, with operations that include petroleum refining and pipelines; supply, marketing and distribution of refined fuels (gasoline, diesel fuel and other energy products); blending, sale and distribution of lubricants; and wholesale supply of propane and other natural gas liquids. For the majority of revenues arising from sales to energy customers, we satisfy our performance obligation of providing energy products such as gasoline, diesel fuel, propane, asphalt, lubricants and other related products at the point-in-time that the finished petroleum product is delivered or made available to the wholesale or retail customer, at which point control is considered to have been transferred to the customer and revenue can be recognized, as there are no remaining performance obligations that we need to satisfy to be entitled to the agreed-upon transaction price as stated in the contract. For fixed and provisionally priced derivative sales contracts that are accounted for under the provisions of the derivative accounting guidance and are outside the scope of the revenue recognition guidance, we recognize revenue when control of the inventory is transferred within the meaning of ASC Topic 606.
Our Ag segment derives its revenues through origination and marketing of grain, including service activities conducted at export terminals; wholesale sales of agronomy products and processed sunflowers; sales of soybean meal, soybean refined oil and soyflour products; production and marketing of renewable fuels; and retail sales of petroleum and agronomy products, and feed and farm supplies. For the majority of revenues arising from sales to Ag customers, we satisfy our performance obligation of delivering a commodity or other agricultural end product to a customer at the point-in-time the commodity or other end product (wholesale grain, agronomy products, soybean products, ethanol or country operations retail
products) has been delivered or is made available to the customer, at which point control is considered to have been transferred to the customer and revenue can be recognized, as there are no remaining performance obligations that need to be satisfied to be entitled to the agreed-upon transaction price as stated in the contract. The amount of revenue recognized follows the contractually specified price, which may include freight or other contractually specified cost components. For fixed and provisionally priced derivative sales contracts that are accounted for under the provisions of the derivative accounting guidance and are outside the scope of the revenue recognition guidance, we recognize revenue when control of the inventory is transferred within the meaning of ASC Topic 606.
Corporate and Other primarily consists of our financing and hedging businesses, which are presented together due to the similar nature of their products and services, as well as the relatively lower amount of revenues for those businesses compared to our Ag and Energy businesses. Prior to its sale on May 4, 2018, our insurance business was also included in Corporate and Other. Revenues from our hedging business are primarily recognized at the point-in-time that the hedging transaction is completed after we have fully satisfied all performance obligations under the contract, and revenues arising from our financing business are recognized in accordance with ASC Topic 470, Debt, and fall outside the scope of ASC Topic 606.
Contract Assets and Contract Liabilities
Contract assets relate to unbilled amounts arising from goods that have already been transferred to the customer where the right to payment is not conditional on the passage of time. This results in the recognition of an asset, as the amount of revenue recognized at a certain point-in-timepoint in time exceeds the amount billed to the customer. Contract assets are recorded in accounts receivable within our Consolidated Balance Sheets and were immaterial as of August 31, 20192020 and 2018.2019.
Contract liabilities relate to advance payments from customers for goods and services that we have yet to provide. Contract liabilities of $207.5$139.1 million and $172.0$207.5 million as of August 31, 20192020 and 2018,2019, respectively, are recorded within customer advance paymentsother current liabilities on our Consolidated Balance Sheets. For the yearyears ended August 31, 2020 and 2019, we recognized revenues of $194.8 million and $170.7 million, respectively, which were included in the customer advance paymentsother current liabilities balance at the beginning of the period.
Practical Expedients
We applied ASC Topic 606 utilizing the following allowable exemptions or practical expedients:
Election to not disclose the unfulfilled performance obligation balance for contracts with an original duration of one year or less;
Recognition of the incremental costs of obtaining a contract as an expense when incurred if the amortization period of the asset that would otherwise have been recognized is one year or less;
Election to present revenues net of sales taxes and other similar taxes; and
Practical expedient to treat shipping and handling as a fulfillment activity rather than a promised service, resulting in the conclusion that shipping and handling is not a separate performance obligation.
Note 3 Receivables
Receivables as of August 31, 20192020 and 2018,2019, are as follows:
| | | | | | | | | | | |
| 2020 | | 2019 |
| | (Dollars in thousands) |
| Trade accounts receivable | $ | 1,476,585 | | | $ | 1,803,284 | |
| CHS Capital short-term notes receivable | 563,934 | | | 592,909 | |
| | | |
| Other | 491,068 | | | 511,821 | |
| Gross receivables | 2,531,587 | | | 2,908,014 | |
| Less allowances and reserves | 165,540 | | | 176,805 | |
| Total receivables | $ | 2,366,047 | | | $ | 2,731,209 | |
|
| | | | | | | |
| | 2019 | | 2018 |
| | (Dollars in thousands) |
| Trade accounts receivable | $ | 1,803,284 |
| | $ | 1,578,764 |
|
| CHS Capital short-term notes receivable | 592,909 |
| | 569,379 |
|
| Other | 511,821 |
| | 534,071 |
|
| Gross receivables | 2,908,014 |
| | 2,682,214 |
|
| Less allowances and reserves | 176,805 |
| | 221,813 |
|
| Total receivables | $ | 2,731,209 |
| | $ | 2,460,401 |
|
Trade Accounts Receivable
Trade accounts receivable are initially recorded at a selling price that approximates fair value upon the sale of goods or services to customers. Subsequently, trade accounts receivable are carried at net realizable value, which includes an allowance for estimated uncollectible amounts. We calculate this allowance based on our history of write-offs, level of past due accounts
and our relationships with and the economic status of our customers. Receivables from related parties are disclosed in Note 17, 18, Related Party Transactions. No third-party customer accounted for more than 10% of the total receivables balance as of August 31, 20192020 or 2018.2019.
CHS Capital Notes Receivable
Notes Receivable
CHS Capital, LLC ("CHS Capital"), our wholly-owned subsidiary, has short-term notes receivable from commercial and producer borrowers. The short-term notes receivable have maturity terms of 12 months or less and are reported at their outstanding unpaid principal balances, adjusted for the allowance of loan losses, as CHS Capital has the intent and ability to hold the applicable loans for the foreseeable future or until maturity or pay-off. The carrying value of CHS Capital short-term notes receivable approximates fair value given the notes' short-term duration and use of market pricing adjusted for risk.
Notes receivable from commercial borrowers are collateralized by various combinations of mortgages, personal property, accounts and notes receivable, inventories and assignments of certain regional cooperative's capital stock. These loans are primarily originated in the states of North Dakota and Minnesota. CHS Capital also has loans receivable from producer borrowers that are collateralized by various combinations of growing crops, livestock, inventories, accounts receivable, personal property and supplemental mortgages and are originated in the same states as the commercial notes.
In addition to the short-term balances included in the table above, CHS Capital had long-term notes receivable, with durations of generally not more than 10 years, totaling $180.0$101.5 million and $203.0$180.0 million at August 31, 20192020 and 2018,2019, respectively. The long-term notes receivable are included in other assets on our Consolidated Balance Sheets. As of August 31,
2020 and 2019, and 2018, commercial notes represented 41%33% and 40%41%, respectively, and producer notes represented 59%67% and 60%59%, respectively, of total CHS Capital notes receivable.
CHS Capital has commitments to extend credit to customers if there are no violations of any contractually established conditions. As of August 31, 2019,2020, CHS Capital customers had additional available credit of $650.6$714.5 million.
Allowance for Loan Losses and Impairments
CHS Capital maintains an allowance for loan losses that is an estimate of potential incurred losses inherent in the loans receivable portfolio. In accordance with FASB ASC 450-20, Accounting for Loss Contingencies, and ASC 310-10, Accounting by Creditors for Impairment of a Loan, the allowance for loan losses consists of general and specific components. The general component is based on historical loss experience and qualitative factors addressing operational risks and industry trends. The specific component relates to loans receivable that are classified as impaired. Additions to the allowance for loan losses are reflected within reservemarketing, general and impairment charges (recoveries), netadministrative expenses in the Consolidated Statements of Operations. The portion of loans receivable deemed uncollectible is charged off against the allowance. Recoveries of previously charged off amounts increase the allowance for loan losses. No significant amounts of CHS Capital notes were past due as of August 31, 20192020 or 2018,2019, and specific and general loan loss reserves related to CHS Capital notes were not0t material as of either date.
Interest Income
Interest income is recognized on the accrual basis using a method that computes simple interest on a daily basis. Accrual of interest on commercial loans receivable is discontinued at the time the receivable is 90 days past due unless the credit is well-collateralized and in process of collection. Past due status is based on contractual terms of the loan. Producer loans receivable are placed in non-accrualnonaccrual status based on estimates and analysis due to the annual debt service terms inherent to CHS Capital's producer loans. In all cases, loans are placed in non-accrualnonaccrual status or charged off at an earlier date if collection of principal or interest is considered doubtful.
Troubled Debt Restructurings
Restructuring of a loan constitutes a troubled debt restructuring, or restructured loan, if the creditor for economic reasons related to the debtor’sdebtor's financial difficulties grants a concession to the debtor that it would otherwise not consider. Concessions vary by program and borrower. Concessions may include interest rate reductions, term extensions, payment deferrals or the acceptance of additional collateral in lieu of payments. In limited circumstances, principal may be forgiven. When a restructured loan constitutes a troubled debt restructuring, CHS includes these loans within its impaired loans. CHS Capital had no significant troubled debt restructurings and no third-party borrowers that accounted for more than 10% of the total CHS Capital notes receivable or total receivables as of August 31, 20192020 or 2018.2019.
Loan Participations
During fiscal For the years ended August 31, 2020 and 2019, CHS Capital sold $70.6 million and $92.3 million of notes receivable, respectively, to numerousvarious counterparties under a master participation agreement. The sale resulted in the removal of notes receivable from the Consolidated Balance Sheet. CHS Capital has no retained interests in the transferred notes receivable, other than collection and administrative services. Proceeds from sales of notes receivable have been included in investing activities in the Consolidated StatementStatements of Cash Flows. Fees received related to the servicing of notes receivable are recorded in other income in the Consolidated Statements of Operations. We consider the fees received adequate compensation for services rendered and, accordingly, have recorded no servicing asset or liability.
Other Receivables
Other receivables are comprised of certain other amounts recorded in the normal course of business, including receivables related to vendor rebates, value-added taxes, certain financing receivables and pre-crop financing, primarily to Brazilian farmers, to finance a portion of supplier production costs. We receive volume-based rebates from certain vendors during the year. These vendor rebates are accounted for in accordance with ASC 705, Cost of Sales and Services, based on the terms of the volume rebate program. For rebates thatmeet the definition of a binding arrangement and are both probable and estimable, we estimate the amount of the rebate we will receive and accrue it as a reduction of the cost of inventory and cost of goods sold over the period in which the rebate is earned. For pre-crop financing arrangements, we do not bear costs or operational risks associated with the related growing crops, although our ability to be paid depends on the crops actually being produced. The financing is collateralized by future crops, land and physical assets of the suppliers, carries a local market
interest rate and settles when the farmer's crop is harvested and sold. No significant troubled debt restructurings occurred and no third-party customer or borrower accounted for more than 10% of the total receivables balance as of August 31, 20192020 or 2018.
We identified and recorded an out-of-period adjustment to correct an error related to multiple years that increased bad debt expense for other receivables by $25.5 million during the year ended August 31, 2019. We concluded that the error is not material to the previously reported financial statements and its correction is not material to the financial statements for the year ended August 31, 2019.
Note 4 Inventories
Inventories as of August 31, 20192020 and 2018,2019, are as follows:
| | | | | | | | | | | |
| 2020 | | 2019 |
| | (Dollars in thousands) |
| Grain and oilseed | $ | 1,064,079 | | | $ | 1,024,645 | |
| Energy | 696,858 | | | 717,378 | |
| Agronomy | 822,535 | | | 954,037 | |
| Processed grain and oilseed | 126,022 | | | 109,900 | |
| Other | 32,644 | | | 48,328 | |
| Total inventories | $ | 2,742,138 | | | $ | 2,854,288 | |
|
| | | | | | | |
| | 2019 | | 2018 |
| | (Dollars in thousands) |
| Grain and oilseed | $ | 1,024,645 |
| | $ | 1,298,522 |
|
| Energy | 717,378 |
| | 737,639 |
|
| Agronomy | 954,037 |
| | 560,675 |
|
| Processed grain and oilseed | 109,900 |
| | 99,426 |
|
| Other | 48,328 |
| | 72,387 |
|
| Total inventories | $ | 2,854,288 |
| | $ | 2,768,649 |
|
Grain, processed grain, oilseed, processed oilseed and other minimally processed soy-based inventories are stated at net realizable value. These inventories are agricultural commodity inventories that are readily convertible to cash because of their commodity characteristics, widely available markets and international pricing mechanisms. Agricultural commodity inventories have quoted market prices in active markets, may be sold without significant further processing and have predictable and insignificant disposal costs. Changes in the net realizable value of merchandisable agricultural commodities inventories are recognized in earnings as a component of cost of goods sold.
All other inventories are stated at the lower of cost or net realizable value. Costs for inventories produced or modified by us through a manufacturing process include fixed and variable production and raw material costs, and in-bound freight costs for raw materials. Costs for inventories purchased for resale include the cost of products and freight incurred to place the products at our points of sale. The costs of certain energy inventories (wholesale refined products, crude oil and asphalt) are determined on the last-in, first-out ("LIFO") method; all other inventories of nongrain products purchased for resale are valued on the first-in, first-out ("FIFO") and average cost methods.
As of August 31, 20192020 and 2018,2019, we valued approximately 16% of inventories, primarily crude oil and refined fuels within our Energy segment, using the lower of cost, determined on the LIFO method, or net realizable value. If the FIFO method of accounting had been used, inventories would have been higher than the reported amount by $215.0$93.5 million and $345.0$215.0 million as of August 31, 2020 and 2019, and 2018, respectively. Inventory previously classifiedDuring the third quarter of fiscal 2020, we experienced price declines in our energy inventories associated with the COVID-19 pandemic. As a result, we recorded a noncash, lower of cost or market charge of $42.0 million in cost of goods sold to reduce the carrying value of our energy inventories to their market value as feed and farm supplies inventory represented non-grain and oilseed inventories held at our country operations locations. During fiscal 2019, theseof May 31, 2020. Based upon market prices observed as of August 31, 2020, the lower of cost or market reserve was decreased by approximately $34.0 million as prices improved while inventories were reclassifiedsold.
Note 5 Other Current Assets
Other current assets as of August 31, 2020 and 2019, are as follows:
| | | | | | | | | | | |
| 2020 | | 2019 |
| | (Dollars in thousands) |
| Derivative assets (Note 15) | $ | 371,195 | | | $ | 253,341 | |
| Margin and related deposits | 194,097 | | | 155,306 | |
| Supplier advance payments | 198,699 | | | 197,290 | |
| Other | 253,497 | | | 259,982 | |
| Total other current assets | $ | 1,017,488 | | | $ | 865,919 | |
Margin and Related Deposits
Many of our derivative contracts with futures and options brokers require us to better alignmake margin deposits of cash or other assets. Subsequent margin deposits may also be necessary when changes in commodity prices result in a loss on the contract value to comply with their underlying inventory types, primarily agronomyapplicable regulations. Our margin and energy inventories. Prior year feed and farm supply inventory amounts have been reclassified as agronomy, energy and other inventoriesrelated deposit assets are generally held in the amounts of $314.4 million, $22.4 million and $55.1 million, respectively.
segregated accounts to
support the associated derivative contracts and may be used to fund or partially fund the settlement of those contracts as they expire. Similar to our derivative financial instruments, margin and related deposits are reported on a gross basis.
Supplier Advance Payments
Supplier advance payments are typically for periods less than 12 months and primarily include amounts paid for grain purchases from suppliers and amounts paid to crop nutrient and crop protection product suppliers to lock in future supply and pricing.
Note 56 Investments
Investments as of August 31, 20192020 and 2018,2019, are as follows:
| | | | | | | | | | | |
| 2020 | | 2019 |
| | (Dollars in thousands) |
| Equity method investments: | | | |
| CF Industries Nitrogen, LLC | $ | 2,662,618 | | | $ | 2,708,942 | |
| Ventura Foods, LLC | 381,351 | | | 374,516 | |
| Ardent Mills, LLC | 208,927 | | | 209,027 | |
| Other equity method investments | 253,182 | | | 267,247 | |
| Other investments | 123,955 | | | 124,264 | |
| Total investments | $ | 3,630,033 | | | $ | 3,683,996 | |
|
| | | | | | | |
| | 2019 | | 2018 |
| | (Dollars in thousands) |
| Equity method investments: | | | |
| CF Industries Nitrogen, LLC | $ | 2,708,942 |
| | $ | 2,735,073 |
|
| Ventura Foods, LLC | 374,516 |
| | 360,150 |
|
| Ardent Mills, LLC | 209,027 |
| | 205,898 |
|
| Other equity method investments | 267,247 |
| | 288,016 |
|
| Other investments | 124,264 |
| | 122,788 |
|
| Total investments | $ | 3,683,996 |
| | $ | 3,711,925 |
|
Joint ventures and other investments in which we have significant ownership and influence but not control, are accounted for in our consolidated financial statements using the equity method of accounting. Our significant equity method investments consist of CF Nitrogen, Ventura Foods, LLC ("Ventura Foods"), and Ardent Mills, LLC ("Ardent Mills"), which are summarized below. In addition to the recognition of our share of income from our equity method investments, our equity method investments are evaluated for indicators of other-than-temporary impairment on an ongoing basis in accordance with U.S. GAAP. We have approximately $383.0 million of cumulative undistributed earnings from our equity method investees included in the investments balance as of August 31, 2020.
All equity securities that do not result in consolidation and are not accounted for under the equity method are measured at fair value with changes therein reflected in net income. We have elected to utilize the measurement alternative for equity investments that do not have readily determinable fair values and measure these investments at cost less impairment plus or minus observable price changes in orderly transactions. Our share in the income or loss of these equity method investments is recorded within equity (income) loss from investments in the Consolidated Statements of Operations. Other investments consist primarily of investments in cooperatives without readily determinable fair values and are generally recorded at cost, unless an impairment or other observable market price change occurs requiring an adjustment. Investments in other cooperatives are recorded in a manner similar to equity investments without readily determinable fair values, plus patronage dividends received in the form of capital stock and other equities. Patronage dividends are recorded as a reduction to cost of goods sold at the time qualified written notices of allocation are received. Investments in debt and equity instruments are carried at amounts that approximate fair values.
CF Nitrogen
We have a $2.7 billion investment in CF Nitrogen, a strategic venture with CF Industries Holdings, Inc. ("CF Industries"). The investment consists of an approximate 10% membership interest (based on product tons) in CF Nitrogen. At the time we entered into the strategic venture, on February 1, 2016, we also entered into an 80-yeara supply agreement that entitles us to purchase up to 1.1 million tons of granular urea and 580,000 tons of urea ammonium nitrate ("UAN") annually from CF Nitrogen for ratable delivery.delivery through fiscal 2096. Our purchases under the supply agreement are based on prevailing market prices and we receive semi-annual cash distributions (in January and July of each year) from CF Nitrogen via our membership interest. These distributions are based on actual volumes purchased from CF Nitrogen under the strategic venture and will have the effect of reducing our investment to zero0 over 80 years on a straight-line basis. We account for this investment using the hypothetical liquidation at book value method, recognizing our share of the earnings and losses of CF Nitrogen as equity income from investments in our Nitrogen Production segment based on our contractual claims on the entity's net assets pursuant to the liquidation provisions of CF Nitrogen's Limited Liability Company Agreement, adjusted for the semi-annual cash distributions. For the years ended August 31, 2019 and 2018, equity earnings were $160.4 million and $106.9 million, respectively, and are included as equity income from investments in our Nitrogen Production segment.
Cash distributions received from CF Nitrogen for the years ended August 31, 2020 and 2019, were $174.3 million and 2018, were $186.5 million, and $127.9 million, respectively.
The following tables provide aggregate summarized financial information for CF Nitrogen for the balance sheets as of August 31, 20192020 and 2018,2019, and the statements of operations for the 12 months ended August 31, 2020, 2019 2018 and 2017:2018:
| | | | 2019 | | 2018 | | 2020 | | 2019 |
| | (Dollars in thousands) | | (Dollars in thousands) |
| Current assets | $ | 590,057 |
| | $ | 576,076 |
| Current assets | $ | 552,127 | | | $ | 590,057 | |
| Non-current assets | 7,028,766 |
| | 7,447,594 |
| |
| Noncurrent assets | | Noncurrent assets | 6,564,086 | | | 7,028,766 | |
| Current liabilities | 228,324 |
| | 215,104 |
| Current liabilities | 222,391 | | | 228,324 | |
| Non-current liabilities | 2,455 |
| | 71 |
| |
| Noncurrent liabilities | | Noncurrent liabilities | 3,036 | | | 2,455 | |
| | | | 2019 | | 2018 | | 2017 | | 2020 | | 2019 | | 2018 |
| | (Dollars in thousands) | | (Dollars in thousands) |
| Net sales | $ | 2,894,795 |
| | $ | 2,449,695 |
| | $ | 2,051,159 |
| Net sales | $ | 2,522,827 | | | $ | 2,894,795 | | | $ | 2,449,695 | |
| Gross profit | 737,168 |
| | 423,612 |
| | 195,142 |
| Gross profit | 570,901 | | | 737,168 | | | 423,612 | |
| Net earnings | 706,291 |
| | 401,295 |
| | 123,965 |
| Net earnings | 529,462 | | | 706,291 | | | 401,295 | |
| Earnings attributable to CHS Inc. | 160,373 |
| | 106,895 |
| | 66,530 |
| Earnings attributable to CHS Inc. | 127,954 | | | 160,373 | | | 106,895 | |
Ventura Foods and Ardent Mills
We have a 50% interest in Ventura Foods, which is a joint venture with Wilsey Foods, Inc., a majority-owned subsidiary of MBK USA Holdings, Inc., that produces and distributes primarily vegetable oil-basedvegetable-oil-based products, and we have a 12% interest in Ardent Mills, which is a joint venture with Cargill Incorporated and ConAgra Foods,Conagra Brands, Inc., which combinesand is the North Americanlargest flour milling operations ofmiller in the three parent companies.United States. We account for Ventura Foods and Ardent Mills as equity method investments included in Corporate and Other.
The following tables provide aggregate summarized financial information for our equity method investments in Ventura Foods and Ardent Mills for balance sheets as of August 31, 20192020 and 2018,2019, and statements of operations for the 12 months ended August 31, 2020, 2019 2018 and 2017:2018:
| | | | | | | | | | | |
| 2020 | | 2019 |
| | (Dollars in thousands) |
| Current assets | $ | 1,548,930 | | | $ | 1,469,003 | |
| Noncurrent assets | 2,461,886 | | | 2,327,217 | |
| Current liabilities | 628,440 | | | 535,579 | |
| Noncurrent liabilities | 895,620 | | | 790,401 | |
|
| | | | | | | |
| | 2019 | | 2018 |
| | (Dollars in thousands) |
| Current assets | $ | 1,469,003 |
| | $ | 1,462,590 |
|
| Non-current assets | 2,327,217 |
| | 2,331,295 |
|
| Current liabilities | 535,579 |
| | 671,928 |
|
| Non-current liabilities | 790,401 |
| | 693,360 |
|
| | | | | | | | | | | | | | | | | |
| 2020 | | 2019 | | 2018 |
| | (Dollars in thousands) |
| Net sales | $ | 5,440,143 | | | $ | 5,752,368 | | | $ | 5,882,035 | |
| Gross profit | 584,352 | | | 565,784 | | | 601,927 | |
| Net earnings | 181,049 | | | 248,303 | | | 226,776 | |
| Earnings attributable to CHS Inc. | 48,927 | | | 69,157 | | | 46,069 | |
|
| | | | | | | | | | | |
| | 2019 | | 2018 | | 2017 |
| | (Dollars in thousands) |
| Net sales | $ | 5,752,368 |
| | $ | 5,882,035 |
| | $ | 5,762,849 |
|
| Gross profit | 565,784 |
| | 601,927 |
| | 673,329 |
|
| Net earnings | 248,303 |
| | 226,776 |
| | 265,126 |
|
| Earnings attributable to CHS Inc. | 69,157 |
| | 46,069 |
| | 60,716 |
|
Our investments in other equity method investees are not significant in relation to our consolidated financial statements, either individually or in the aggregate.
Note 67 Property, Plant and Equipment
As of August 31, 20192020 and 2018,2019, major classes of property, plant and equipment, which include capitalfinance lease assets, consisted of the amounts in the table below.
| | | | | | | | | | | |
| 2020 | | 2019 |
| | (Dollars in thousands) |
| Land and land improvements | $ | 317,714 | | | $ | 319,452 | |
| Buildings | 1,110,490 | | | 1,079,073 | |
| Machinery and equipment | 7,559,437 | | | 7,392,767 | |
| Office equipment and other | 362,084 | | | 346,649 | |
| Construction in progress | 310,901 | | | 329,297 | |
| Gross property, plant and equipment | 9,660,626 | | | 9,467,238 | |
| Less accumulated depreciation and amortization | 4,702,688 | | | 4,378,530 | |
| Total property, plant and equipment | $ | 4,957,938 | | | $ | 5,088,708 | |
|
| | | | | | | |
| | 2019 | | 2018 |
| | (Dollars in thousands) |
| Land and land improvements | $ | 319,452 |
| | $ | 341,767 |
|
| Buildings | 1,079,073 |
| | 1,034,860 |
|
| Machinery and equipment | 7,392,767 |
| | 7,199,509 |
|
| Office equipment and other | 346,649 |
| | 316,946 |
|
| Construction in progress | 329,297 |
| | 204,207 |
|
| Gross property, plant and equipment | 9,467,238 |
| | 9,097,289 |
|
| Less accumulated depreciation and amortization | 4,378,530 |
| | 3,955,570 |
|
| Total property, plant and equipment | $ | 5,088,708 |
| | $ | 5,141,719 |
|
Property, plant and equipment are stated at cost less accumulated depreciation and amortization. Depreciation and amortization are provided on the straight-line method by charges to operations at rates based on the expected useful lives of individual or groups of assets (generally 15 to 20 years for land improvements; 20 to 40 years for buildings; five to 20 years for machinery and equipment; and three to 10 years for office equipment and other). Expenditures for maintenance and minor repairs and renewals are expensed. We also capitalize and amortize eligible costs to acquire or develop internal-use software that are incurred during the application development stage. When assets are sold or otherwise disposed of, the cost and related accumulated depreciation and amortization are removed from the related accounts and resulting gains or losses are reflected in operations.
We have various
Depreciation expense, including amortization of finance lease assets, under capital leases totaling $62.7 million and $50.0 million as offor the years ended August 31, 2020, 2019 and 2018, respectively. Accumulated amortization on assets under capital leases was $20.6$470.4 million, $495.3 million and $18.9$475.8 million, as of August 31, 2019 and 2018, respectively.
The following is a schedule by fiscal year of future minimum lease payments under capital leases together with the present value of the net minimum lease payments as of August 31, 2019:
|
| | | |
| | (Dollars in thousands) |
| 2020 | $ | 6,761 |
|
| 2021 | 6,199 |
|
| 2022 | 5,021 |
|
| 2023 | 4,548 |
|
| 2024 | 2,638 |
|
| Thereafter | 6,517 |
|
| Total minimum future lease payments | 31,684 |
|
| Less amount representing interest | 3,445 |
|
| Present value of net minimum lease payments | $ | 28,239 |
|
We continuously monitor our long-lived assets, including property,Property, plant and equipment and other long-lived assets are reviewed for potential indicators of impairment when events or changes in circumstances indicate that the carrying amounts may not be recoverable in accordance with U.S. GAAP. AsThis evaluation of recoverability is based on various indicators, including the nature, future economic benefits and geographic locations of the assets, historical or future profitability measures and other external market conditions. If these indicators suggest the carrying amounts of an asset or asset group may not be recoverable, potential impairment is evaluated using undiscounted estimated future cash flows. Should the sum of the expected future net cash flows be less than the carrying value, an impairment loss would be recognized. An impairment loss would be measured as the amount by which the carrying value of the asset or asset group exceeds its fair value. No significant impairments were identified during fiscal 2020; however, as a result of these monitoring activities, our Ag segment recorded impairment charges of approximately $12.2 million associated with certain non-strategicnonstrategic long-lived assets that ceased operation during fiscal 2019. During fiscal 2017 our Ag segment recorded an impairment charge of $30.4 million from the reduction in the fair value of agricultural assets held, which was determined using a market-based approach. In addition, our Energy segment recorded an impairment charge of $32.7 million associated with the cancellation of a capital project in fiscal 2017. These impairments were included in the reservemarketing, general and impairment charges (recoveries), net line ofadministrative expenses in the Consolidated Statements of Operations.
Depreciation expense, including amortization We have asset retirement obligations with respect to certain of capital leaseour refineries and other assets due to various legal obligations to clean and/or dispose of the component parts at the time they are retired. In most cases, these assets can be used for extended and indeterminate periods of time if they are properly maintained and/or upgraded. It is our practice and current intent to maintain refineries and related assets and to continue making improvements to those assets based on technological advances. As a result, we believe our refineries and related assets have indeterminate lives for purposes of estimating asset retirement obligations because dates or ranges of dates upon which we would retire a refinery and related assets cannot reasonably be estimated at this time. When a date or range of dates can reasonably be estimated for the years ended August 31, 2019, 2018retirement of any component part of a refinery or other asset, we estimate the cost of performing the retirement activities and 2017, was $495.3 million, $475.8 millionrecord a liability for the fair value of that future cost.
We have other assets that we may be obligated to dismantle at the end of corresponding lease terms subject to lessor discretion for which we have recorded asset retirement obligations. Based on our estimates of timing, cost and $475.9 million, respectively.probability of removal, these obligations are not material.
Note 78 Other Assets
Other assets as of August 31, 20192020 and 2018,2019, are as follows:
| | | | | | | | | | | |
| 2020 | | 2019 |
| | (Dollars in thousands) |
| Goodwill | $ | 172,404 | | | $ | 172,404 | |
| Customer lists, trademarks and other intangible assets | 65,025 | | | 71,206 | |
| Notes receivable | 109,145 | | | 189,045 | |
| Long-term derivative assets | 21,157 | | | 36,408 | |
| Prepaid pension and other benefits | 106,209 | | | 73,100 | |
| Capitalized major maintenance | 228,511 | | | 286,890 | |
| Cash value life insurance | 130,673 | | | 122,792 | |
| Operating lease right of use assets | 257,834 | | | — | |
| Other | 48,471 | | | 60,350 | |
| Total other assets | $ | 1,139,429 | | | $ | 1,012,195 | |
|
| | | | | | | |
| | 2019 | | 2018 |
| | (Dollars in thousands) |
| Goodwill | $ | 172,404 |
| | $ | 138,464 |
|
| Customer lists, trademarks and other intangible assets | 71,206 |
| | 29,338 |
|
| Notes receivable | 189,045 |
| | 211,986 |
|
| Long-term derivative assets | 36,408 |
| | 23,084 |
|
| Prepaid pension and other benefits | 73,100 |
| | 101,539 |
|
| Capitalized major maintenance | 286,890 |
| | 130,780 |
|
| Cash value life insurance | 122,792 |
| | 123,010 |
|
| Other | 60,350 |
| | 76,128 |
|
| Total other assets | $ | 1,012,195 |
| | $ | 834,329 |
|
Goodwill and Other Intangible Assets
Goodwill represents the excess of cost over the fair value of identifiable assets acquired. Goodwill is assessed for impairment on an annual basis as of July 31, either by first assessing qualitative factors to determine whether a quantitative goodwill impairment test is necessary or by proceeding directly to the quantitative test. The quantitative test may be required more frequently if triggering events or other circumstances occur that could indicate impairment. Goodwill is assessed for impairment at the reporting unit level, which has been determined to be our operating segments or one level below our operating segments in certain instances.
There were 0 changes in the net carrying amount of goodwill for the year ended August 31, 2020. Changes in the net carrying amount of goodwill for the yearsyear ended August 31, 2019, and 2018, by segment, are as follows:
| | | | | | | | | | | | | | | | | | | | | | | |
| Energy | | Ag | | Corporate
and Other | | Total |
| (Dollars in thousands) |
| Balances, August 31, 2018 | $ | 552 | | | $ | 127,338 | | | $ | 10,574 | | | $ | 138,464 | |
| Goodwill acquired during the period | 0 | | | 61,358 | | | 0 | | | 61,358 | |
| Impairment | — | | | (27,418) | | | — | | | (27,418) | |
| Balances, August 31, 2019 | 552 | | | 161,278 | | | 10,574 | | | 172,404 | |
|
| | | | | | | | | | | | | | | |
| | Energy | | Ag | | Corporate
and Other | | Total |
| | (Dollars in thousands) |
| Balances, August 31, 2017 | $ | 552 |
| | $ | 127,328 |
| | $ | 10,574 |
| | $ | 138,454 |
|
| Effect of foreign currency translation adjustments | — |
| | 10 |
| | — |
| | 10 |
|
| Balances, August 31, 2018 | 552 |
| | 127,338 |
| | 10,574 |
| | 138,464 |
|
| Goodwill acquired during the period | — |
| | 61,358 |
| | — |
| | 61,358 |
|
| Impairment | — |
| | (27,418 | ) | | — |
| | (27,418 | ) |
| Balances, August 31, 2019 | $ | 552 |
| | $ | 161,278 |
| | $ | 10,574 |
| | $ | 172,404 |
|
Goodwill of $61.4 million acquired during the third quarter of fiscal 2019 was related to our acquisition of the remaining 75% ownership in West Central Distribution, LLC ("WCD") that we did not previously own. See Note 18, 20, Acquisitions, for additional information related to the acquisition. NoNaN goodwill has been allocated to our Nitrogen Production segment, which consists of a single investment accounted for under the equity method.
All long-lived assets, including The outbreak and pandemic of the novel coronavirus known as COVID-19 and other factors resulted in substantial reductions in demand and sharp price declines in certain industries in which we operate during fiscal 2020, particularly with respect to the production of renewable fuels, other energy products and processing and food ingredients. Based on these deteriorated macroeconomic and industry conditions, management considered the impacts on each of our businesses and determined that we needed to perform interim impairment assessments of goodwill and asset groups, during our third quarter, for a reporting unit within our Ag segment that operates in the renewable fuels industry. Third-party price outlooks, projections of future volumes, expenses and other identifiable intangible assets,cash flows and a discount rate reflective of the relative risk of the cash flows were used to estimate fair value. Management believes the assumptions utilized in the assessment are evaluatedappropriate and reasonable for impairment in accordance with U.S. GAAP. Goodwill is evaluated for impairment annually asestimating fair value. The estimated fair value of July 31. All long-lived assets, including goodwill, are also evaluated for impairment whenever triggering events or other circumstances indicatethe reporting unit exceeded the carrying amount of an asset group or reporting unit may not be recoverable.by approximately 18%, and thus no impairment was recorded.
As a result of our annual goodwill impairment analyses performed as of July 31, 2019, we recorded a goodwill impairment charge of $27.4 million associated with a reporting unit in our Ag segment. The impairment charge primarily resulted from changing market dynamics that have reduced future profitability within the reporting unit, as well as strategy changes and the challenging economic environment in the agriculture industry. The impairment charge was recorded in the reservemarketing,
general and impairment charges (recoveries), net line itemadministrative expenses in the Consolidated StatementsStatement of Operations for the year ended August 31, 2019. NoNaN material impairments related to long-lived assets were recorded, and no0 goodwill impairments were identified as a result of CHS’sour annual goodwill analyses performed as of July 31, 2020 or 2018. Management will continue to monitor the results and projected cash flows for each of our businesses to assess whether any reserves or impairments may be necessary in the future, particularly for our businesses that have experienced or could experience substantial reductions in demand or price declines associated with the COVID-19 pandemic.
Intangible assets subject to amortization primarily include customer lists, trademarks and non-competenoncompete agreements, and are amortized over their respective useful lives (ranging from 2two to 30 years). We have no material intangible assets with indefinite useful lives. All long-lived assets, including other identifiable intangible assets, are also assessed for impairment in accordance with U.S. GAAP and evaluated for impairment whenever triggering events or other circumstances indicate the carrying amount of an asset group or reporting unit may not be recoverable. Intangible assets of $47.2 million were acquired during fiscal 2019 related to the acquisition of the remaining 75% ownership interest in WCD that we did not previously own. See Note 18, 20, Acquisitions, for additional information related to the acquisition. Information regarding intangible assets included in other assets on our Consolidated Balance Sheets is as follows:
| | | | August 31, 2019 | | August 31, 2018 | | August 31, 2020 | | August 31, 2019 |
| | Carrying Amount | | Accumulated Amortization | | Net | | Carrying Amount | | Accumulated Amortization | | Net | | Carrying Amount | | Accumulated Amortization | | Net | | Carrying Amount | | Accumulated Amortization | | Net |
| | (Dollars in thousands) | | (Dollars in thousands) |
| Customer lists | $ | 84,815 |
| | $ | (17,609 | ) | | $ | 67,206 |
| | $ | 40,815 |
| | $ | (13,082 | ) | | $ | 27,733 |
| Customer lists | $ | 84,895 | | | $ | (23,770) | | | $ | 61,125 | | | $ | 84,815 | | | $ | (17,609) | | | $ | 67,206 | |
| Trademarks and other intangible assets | 9,736 |
| | (5,736 | ) | | 4,000 |
| | 6,536 |
| | (4,931 | ) | | 1,605 |
| Trademarks and other intangible assets | 10,735 | | | (6,835) | | | 3,900 | | | 9,736 | | | (5,736) | | | 4,000 | |
| Total intangible assets | $ | 94,551 |
| | $ | (23,345 | ) | | $ | 71,206 |
| | $ | 47,351 |
| | $ | (18,013 | ) | | $ | 29,338 |
| Total intangible assets | $ | 95,630 | | | $ | (30,605) | | | $ | 65,025 | | | $ | 94,551 | | | $ | (23,345) | | | $ | 71,206 | |
Intangible asset amortization expense for the years ended August 31, 2020, 2019, 2018 and 2017,2018, was $7.3 million, $5.3 million $3.4 million and $4.3$3.4 million, respectively. The estimated annual amortization expense related to intangible assets subject to amortization for the next five years is as follows:
| | | | | |
| (Dollars in thousands) |
| 2021 | $ | 8,215 | |
| 2022 | 7,973 | |
| 2023 | 7,870 | |
| 2024 | 7,660 | |
| 2025 | 7,345 | |
| Thereafter | 25,866 | |
| Total | $ | 64,929 | |
|
| | | |
| | (Dollars in thousands) |
| 2020 | $ | 5,271 |
|
| 2021 | 4,874 |
|
| 2022 | 4,706 |
|
| 2023 | 4,576 |
|
| 2024 | 4,576 |
|
| Thereafter | 47,107 |
|
| Total | $ | 71,110 |
|
Capitalized Major Maintenance
Activity related to capitalized major maintenance costs at our refineries for the years ended August 31, 2020, 2019 2018 and 2017,2018, is summarized below:
| | | | | | | | | | | | | | | | | | | | | | | | | |
| Balance at
Beginning
of Year | | Cost
Deferred | | Amortization | | | | Balance at
End of Year |
| | (Dollars in thousands) |
| 2020 | $ | 286,890 | | | $ | 14,496 | | | $ | (72,875) | | | | | $ | 228,511 | |
| 2019 | 130,780 | | | 224,406 | | | (68,296) | | | | | 286,890 | |
| 2018 | 105,006 | | | 87,460 | | | (61,686) | | | | | 130,780 | |
|
| | | | | | | | | | | | | | | |
| | Balance at
Beginning
of Year | | Cost
Deferred | | Amortization | | Balance at
End of Year |
| | (Dollars in thousands) |
| 2019 | $ | 130,780 |
| | $ | 224,406 |
| | $ | (68,296 | ) | | $ | 286,890 |
|
| 2018 | 105,006 |
| | 87,460 |
| | (61,686 | ) | | 130,780 |
|
| 2017 | 169,054 |
| | 3,010 |
| | (67,058 | ) | | 105,006 |
|
Within our Energy segment, major maintenance activities are performed at our Laurel, Montana, and McPherson, Kansas, refineries regularly. Major maintenance activities are the planned and required shutdowns of refinery processing units, which include replacement or overhaul of equipment that has experienced decreased efficiency in resource conversion. Because major maintenance activities are performed to extend the life, increase the capacity and/or improve the safety or efficiency of refinery processing assets, we follow the deferral method of accounting for major maintenance activities. Expenditures for major maintenance activities are capitalized (deferred) when incurred and amortized on a straight-line basis over a period of two to five years, which is the estimated time lapse between major maintenance activities. Should the estimated period between
major maintenance activities change, we may be required to amortize the remaining cost of the major maintenance activities over a shorter period, which would result in higher depreciation and amortization costs. Amortization expense related to the capitalized major maintenance costs is included in cost of goods sold in our Consolidated Statements of Operations.
Selection of the deferral method, as opposed to expensing major maintenance activity costs when incurred, results in deferring recognition of major maintenance activity expenditures. The deferral method also results in classification of related cash outflows as investing activities in our Consolidated Statements of Cash Flows, whereas expensing these costs as incurred would result in classifying the cash outflows as operating activities. Repair, maintenance and related labor costs are expensed as incurred and are included in operating cash flows.
Note 89 Notes Payable and Long-Term Debt
Our notes payable and long-term debt are subject to various restrictive requirements for maintenance of minimum consolidated net worth and other financial ratios. We were in compliance with our debt covenants as of August 31, 2019.2020.
Notes Payable
Notes payable as of August 31, 20192020 and 2018,2019, consisted of the following:
| | | | | | | | | | | | | | | | | | | | | | | | | | |
| | Weighted-average Interest Rate | | | | |
| | 2020 | | 2019 | | 2020 | | 2019 |
| | | | | | | (Dollars in thousands) |
| Notes payable | | 1.96% | | 3.36% | | $ | 763,215 | | | $ | 1,330,550 | |
| CHS Capital notes payable | | 1.29% | | 2.90% | | 812,276 | | | 825,558 | |
| Total notes payable | | $ | 1,575,491 | | | $ | 2,156,108 | |
|
| | | | | | | | | | | | |
| | | Weighted-average Interest Rate | | | | |
| | | 2019 | | 2018 | | 2019 | | 2018 |
| | | | | | | (Dollars in thousands) |
| Notes payable | | 3.36% | | 3.50% | | $ | 1,330,550 |
| | $ | 1,437,264 |
|
| CHS Capital notes payable | | 2.90% | | 2.82% | | 825,558 |
| | 834,932 |
|
| Total notes payable | | $ | 2,156,108 |
| | $ | 2,272,196 |
|
On July 16, 2019, we amended and restated our Our primary line of credit which is a five-yearfive-year unsecured revolving credit facility with a syndicate of domestic and international banks. The credit facility provides a committed amount of $2.75 billion that expires on July 16, 2024.
We maintain a series of uncommitted bilateral facilities that are renewed annually. Amounts borrowed under these short-term credit facilities are used to fund our working capital. The following table summarizes our primary lines of credit as of August 31, 20192020 and 2018:2019:
| | | | | | | | | | | | | | | | | | | | | | | | | | | | | | | | |
| Primary Revolving Credit Facilities | | Fiscal Year
of Maturity | | Total Capacity | | Borrowings Outstanding | | Interest Rates |
| | | | 2020 | | 2020 | | 2019 | | |
| | | | (Dollars in thousands) | | |
| Committed five-year unsecured facility | | 2024 | | $ | 2,750,000 | | | $ | 345,000 | | | $ | 335,000 | | | LIBOR or base rate +0.00% to 1.55% |
| Uncommitted bilateral facilities* | | 2021 | | 300,000 | | | 0 | | | 430,000 | | | LIBOR or base rate + applicable margin |
|
| | | | | | | | | | | | | | | | |
| Primary Revolving Credit Facilities | | Fiscal Year of Maturity | | Total Capacity | | Borrowings Outstanding | | Interest Rates |
| | | | | 2019 | | 2019 | | 2018 | | |
| | | | | (Dollars in thousands) | | |
| Committed five-year unsecured facility | | 2024 | | $ | 2,750,000 |
| | $ | 335,000 |
| | $ | — |
| | LIBOR or base rate +0.00% to 1.45% |
| Uncommitted bilateral facilities | | 2020 | | 630,000 |
| | 430,000 |
| | 515,000 |
| | LIBOR or base rate +0.00% to 1.20% |
In addition to our primary revolving lines of credit, we have a three-year $315.0 million committed revolving pre-export credit facility for CHS Agronegocio Industria e Comercio Ltda ("CHS Agronegocio"), our wholly-owned subsidiary, to provide financing for its working capital needs arising from its purchases and sales of grains, fertilizers and other agricultural products that expires in April 2020. As of August 31, 2019, no amounts were outstanding under the facility.
In addition to our uncommitted bilateral facilities above, our wholly-owned subsidiaries, CHS Europe S.a.r.l. and CHS Agronegocio Industria e Comercio Ltda, had uncommitted lines of credit with $342.7$318.4 million outstanding as of August 31, 2019.2020. In addition, our other international subsidiaries had lines of credit with a totaloutstanding of $155.8$69.7 million outstanding as of August 31, 2019, of which $13.8 million was collateralized.2020.
CHS Capital Notes Payable
We have a receivables and loans securitization facility ("Securitization Facility") with certain unaffiliated financial institutions ("Purchasers"). Under the Securitization Facility, we and certain of our subsidiaries ("Originators") sell trade accounts and notes receivable ("Receivables") to Cofina Funding, LLC ("Cofina"), a wholly-owned bankruptcy-remote indirect subsidiary of CHS. Cofina in turn transfers the Receivables to the Purchasers, whichand this arrangement is accounted for as a secured borrowing. We use the proceeds from the sale of Receivables under the Securitization Facility for general corporate purposes and settlements are made on a monthly basis. The Securitization Facility was amended on June 27, 2019, to extend its termination date to June 26, 2020. The termination date may be extended.
During the period from July 2017 through an amendment of the Securitization Facility in June 2018, CHS accounted for Receivables soldamount available under the Securitization Facility as a salefluctuates over time based on the total amount of financial assets pursuant to ASC 860, Transfers and Servicing, andeligible Receivables generated during the Receivables sold were derecognized from our Consolidated Balance Sheets. The following table is a reconciliationnormal course of the beginning and ending balancesbusiness. As of the Deferred Purchase Price ("DPP") receivable, including the long-term portion included in other assets, for the year ended August 31, 2018.2020, total availability under the Securitization Facility was $423.0 million, all of which had been utilized.
|
| | | |
| | 2018 |
| | (Dollars in thousands) |
| Balance - beginning of year | $ | 548,602 |
|
| Cash collections on DPP receivable | (10,961 | ) |
| Transfer of receivables | (386,900 | ) |
| Monthly settlements, net | (169,827 | ) |
| Fair value adjustment | 19,086 |
|
| Balance - end of year | $ | — |
|
On September 4, 2018, we entered into We also have a repurchase facility ("Repurchase Facility") related to the Securitization Facility. Under the Repurchase Facility, we are able tocan borrow up to $150.0 million, collateralized by a subordinated note issued by Cofina in favor of the Originators and representing a portion of the outstanding balance of the Receivables sold by the Originators to Cofina under the Securitization Facility. As of August 31, 2020 and 2019, the outstanding balance under the Repurchase Facility was $150.0 million.
CHS Capital has available creditOn June 26, 2020, we amended our existing Securitization Facility and Repurchase Facility. As a result of the amendment, the maximum availability of the Securitization Facility was decreased from $700.0 million to $500.0 million. On September 24, 2020 the Securitization Facility and Repurchase Facility were further amended increasing the maximum availability under a master participation agreement with one counterparty. Borrowings under this agreement are accounted for as secured borrowingsthe Securitization Facility to $600.0 million from $500.0 million and bear interest at 4.19% as of August 31, 2019. As of August 31, 2019, the total funding commitment under this agreement was $5.0 million, of which $2.3 million was borrowed.extending their respective termination dates to July 30, 2021.
CHS Capital sells loan commitments it has originated to Compeer Financial, PCA, d/b/a ProPartners Financial on a recourse basis. The total outstanding commitments under the program were $65.8$150.0 million as of August 31, 2019,2020, of which $42.3$133.3 million was borrowed under these commitments with an interest rate of 3.36%1.45%.
CHS Capital borrows funds under short-term notes issued as part of a surplus funds program. Borrowings under this program are unsecured and bear interest at variable rates ranging from 0.35% to 1.40% as of August 31, 2019,2020, and are due upon demand. Borrowings under these notes totaled $63.8$134.9 million as of August 31, 2019.2020.
On September 30, 2019, CHS Capital entered into a credit agreement with a revolving note. Under this agreement, CHS Capital had available capacity of $100.0 million of which no amount was outstanding as of August 31, 2020. This agreement matured subsequent to August 31, 2020, and was not renewed.
Long-Term Debt
During the year ended August 31, 2019,2020, we repaid approximately $153.6$25.4 million of long-term debt consisting of scheduled debt maturities and optional prepayments. There were no new material borrowingsOn August 14, 2020, we entered into a Note Purchase Agreement to borrow $375.0 million of long-term debt during fiscal 2019.in the form of notes that was funded on November 2, 2020. Amounts included in long-term debt on our Consolidated Balance Sheets as of August 31, 20192020 and 2018,2019, are presented in the table below.
| | | | | 2019 | | 2018 | | 2020 | | 2019 |
| | | (Dollars in thousands) | | (Dollars in thousands) |
| 4.00% unsecured notes $100 million face amount, due in equal installments beginning in fiscal 2017 through fiscal 2021 | 4.00% unsecured notes $100 million face amount, due in equal installments beginning in fiscal 2017 through fiscal 2021 | | $ | 40,000 |
| | $ | 60,000 |
| 4.00% unsecured notes $100 million face amount, due in equal installments beginning in fiscal 2017 through fiscal 2021 | | $ | 20,000 | | | $ | 40,000 | |
4.08% unsecured notes $130 million face amount, due in fiscal 2019 (a) | | — |
| | 129,229 |
| |
4.52% unsecured notes $160 million face amount, due in fiscal 2021 (a) | | 161,978 |
| | 157,528 |
| |
4.67% unsecured notes $130 million face amount, due in fiscal 2023 (a) | | 136,086 |
| | 128,577 |
| |
| 4.52% unsecured notes $160 million face amount, due in fiscal 2021 | | 4.52% unsecured notes $160 million face amount, due in fiscal 2021 | | 162,090 | | | 161,978 | |
| 4.67% unsecured notes $130 million face amount, due in fiscal 2023 | | 4.67% unsecured notes $130 million face amount, due in fiscal 2023 | | 137,623 | | | 136,086 | |
| 4.39% unsecured notes $152 million face amount, due in fiscal 2023 | 4.39% unsecured notes $152 million face amount, due in fiscal 2023 | | 152,000 |
| | 152,000 |
| 4.39% unsecured notes $152 million face amount, due in fiscal 2023 | | 152,000 | | | 152,000 | |
| 3.85% unsecured notes $80 million face amount, due in fiscal 2025 | 3.85% unsecured notes $80 million face amount, due in fiscal 2025 | | 80,000 |
| | 80,000 |
| 3.85% unsecured notes $80 million face amount, due in fiscal 2025 | | 80,000 | | | 80,000 | |
| 3.80% unsecured notes $100 million face amount, due in fiscal 2025 | 3.80% unsecured notes $100 million face amount, due in fiscal 2025 | | 100,000 |
| | 100,000 |
| 3.80% unsecured notes $100 million face amount, due in fiscal 2025 | | 100,000 | | | 100,000 | |
| 4.58% unsecured notes $150 million face amount, due in fiscal 2025 | 4.58% unsecured notes $150 million face amount, due in fiscal 2025 | | 151,776 |
| | 145,213 |
| 4.58% unsecured notes $150 million face amount, due in fiscal 2025 | | 154,012 | | | 151,776 | |
| 4.82% unsecured notes $80 million face amount, due in fiscal 2026 | 4.82% unsecured notes $80 million face amount, due in fiscal 2026 | | 80,000 |
| | 80,000 |
| 4.82% unsecured notes $80 million face amount, due in fiscal 2026 | | 80,000 | | | 80,000 | |
| 4.69% unsecured notes $58 million face amount, due in fiscal 2027 | 4.69% unsecured notes $58 million face amount, due in fiscal 2027 | | 58,000 |
| | 58,000 |
| 4.69% unsecured notes $58 million face amount, due in fiscal 2027 | | 58,000 | | | 58,000 | |
| 4.74% unsecured notes $95 million face amount, due in fiscal 2028 | 4.74% unsecured notes $95 million face amount, due in fiscal 2028 | | 95,000 |
| | 95,000 |
| 4.74% unsecured notes $95 million face amount, due in fiscal 2028 | | 95,000 | | | 95,000 | |
| 4.89% unsecured notes $100 million face amount, due in fiscal 2031 | 4.89% unsecured notes $100 million face amount, due in fiscal 2031 | | 100,000 |
| | 100,000 |
| 4.89% unsecured notes $100 million face amount, due in fiscal 2031 | | 100,000 | | | 100,000 | |
| 4.71% unsecured notes $100 million face amount, due in fiscal 2033 | 4.71% unsecured notes $100 million face amount, due in fiscal 2033 | | 100,000 |
| | 100,000 |
| 4.71% unsecured notes $100 million face amount, due in fiscal 2033 | | 100,000 | | | 100,000 | |
| 5.40% unsecured notes $125 million face amount, due in fiscal 2036 | 5.40% unsecured notes $125 million face amount, due in fiscal 2036 | | 125,000 |
| | 125,000 |
| 5.40% unsecured notes $125 million face amount, due in fiscal 2036 | | 125,000 | | | 125,000 | |
| Private Placement debt | | 1,379,840 |
| | 1,510,547 |
| |
2.25% unsecured term loans from cooperative and other banks, due in fiscal 2025 (b) | | 366,000 |
| | 366,000 |
| |
| Private placement debt | | Private placement debt | | 1,363,725 | | | 1,379,840 | |
2.25% unsecured term loans from cooperative and other banks, due in fiscal 2025 (a) | | 2.25% unsecured term loans from cooperative and other banks, due in fiscal 2025 (a) | | 366,000 | | | 366,000 | |
| Bank financing | Bank financing | | 366,000 |
| | 366,000 |
| Bank financing | | 366,000 | | | 366,000 | |
| Capital lease obligations | | 28,239 |
| | 25,280 |
| |
| Other notes and contracts with interest rates from 1.30% to 15.25% | | 18,601 |
| | 32,607 |
| |
| Finance lease liabilities | | Finance lease liabilities | | 31,460 | | | 28,239 | |
| Other notes and contracts with interest rates from 0.0% to 10.0% | | Other notes and contracts with interest rates from 0.0% to 10.0% | | 34,709 | | | 18,601 | |
| Deferred financing costs | Deferred financing costs | | (3,569 | ) | | (4,179 | ) | Deferred financing costs | | (4,771) | | | (3,569) | |
| Total long-term debt | Total long-term debt | | 1,789,111 |
| | 1,930,255 |
| Total long-term debt | | 1,791,123 | | | 1,789,111 | |
| Less current portion | Less current portion | | 39,210 |
| | 167,565 |
| Less current portion | | 189,287 | | | 39,210 | |
| Long-term portion | Long-term portion | | $ | 1,749,901 |
| | $ | 1,762,690 |
| Long-term portion | | $ | 1,601,836 | | | $ | 1,749,901 | |
(a) We have entered into interest rate swaps designated as fair value hedging relationships with these notes. Changes in the fair value of the swaps are recorded each period with a corresponding adjustment to the carrying value of the debt. See Note 13, Derivative Financial Instruments and Hedging Activities, for more information.
(b) Borrowings are variable under the agreement and bear interest at a base rate (or LIBOR) plus an applicable margin.
As of August 31, 2019,2020, the carryingfair value of our long-term debt approximated its fair value, which is estimated to be $1.9 billion based on quoted market prices of similar debt (a Level 2 fair value measurement based on the classification hierarchy of ASC Topic 820, Fair Value Measurement). We have outstanding interest rate swaps designated as fair value hedges of select portions of our fixed-rate debt. During fiscal 2019, we recorded corresponding fair value adjustments of $21.2 million, which are included in the amounts in the table above. See Note 13, Derivative Financial Instruments and Hedging Activities, for additional information.
We have a 10-year term loan with a syndicate of banks. The agreement provides for committed term loans in an amount up to $600.0 million. As of August 31, 2019,2020, $236.0 million of term loans were outstanding under this agreement. The agreement includes a revolving feature, whereby we are able to pay down and re-advance an amount up to $300.0 million of the $600.0 million. During fiscal 2017, we re-advanced $130.0 million under the revolving provision of the loan. As of August 31, 2019,2020, $130.0 million of revolving loans were outstanding under this agreement. Principal on the outstanding balances is payable in full in September 2025.
Long-term debt outstanding as of August 31, 2019,2020, has aggregate maturities, excluding fair value adjustments and capitalfinance leases (see Note 6, Property, Plant and Equipment19, Leases,for a schedule of minimum future lease payments under capitalfinance leases), as follows:
| | | | | | (Dollars in thousands) |
| | (Dollars in thousands) | |
| 2020 | $ | 32,812 |
| |
| 2021 | 180,663 |
| 2021 | $ | 181,628 | |
| 2022 | 66 |
| 2022 | 30,828 | |
| 2023 | 282,066 |
| 2023 | 282,828 | |
| 2024 | 2,620 |
| 2024 | 780 | |
| 2025 | | 2025 | 696,780 | |
| Thereafter | 1,256,525 |
| Thereafter | 558,103 | |
| Total | $ | 1,754,752 |
| Total | $ | 1,750,947 | |
Interest expense for the years ended August 31, 2020, 2019 and 2018, and 2017, was $117.0 million, $167.1 million $149.2 million and $171.2$149.2 million, respectively, net of capitalized interest of $10.9 million, $9.4 million $6.7 million and $6.9$6.7 million, respectively.
Note 910 Other Current Liabilities
Other current liabilities as of August 31, 2020 and 2019, are as follows:
| | | | | | | | | | | |
| 2020 | | 2019 |
| (Dollars in thousands) |
| Customer margin deposits and credit balances | $ | 149,539 | | | $ | 143,049 | |
| Customer advance payments | 300,100 | | | 336,645 | |
| Derivative liabilities (Note 15) | 416,204 | | | 241,957 | |
| Dividends and equity payable | 63,000 | | | 180,000 | |
| Total other current liabilities | $ | 928,843 | | | $ | 901,651 | |
Note 11 Income Taxes
CHS is a nonexempt agricultural cooperative and files a consolidated federal income tax return within our tax return period. We are subject to tax on income from nonpatronage sources, nonqualified patronage distributions and undistributed patronage-sourced income. Income tax (benefit) expense is primarily the current tax payable for the period and the change during the period in certain deferred tax assets and liabilities. Deferred income taxes reflect the impact of temporary differences between the amounts of assets and liabilities recognized under U.S. GAAP and such amounts recognized for federal and state income tax purposes, based on enacted tax laws and statutory tax rates applicable to the periods in which the differences are expected to affect taxable income.
The (benefit from) provision for (benefit from) income taxes for the years ended August 31, 2020, 2019 2018 and 20172018 is as follows:
| | | | | | | | | | | | | | | | | |
| 2020 | | 2019 | | 2018 |
| | (Dollars in thousands) |
| Current: | | | | | |
| Federal | $ | 4,519 | | | $ | 211 | | | $ | 15,576 | |
| State | (2,231) | | | 3,815 | | | 7,041 | |
| Foreign | 2,748 | | | (2,630) | | | 20,268 | |
| Total Current | 5,036 | | | 1,396 | | | 42,885 | |
| Deferred: | | | | | |
| Federal | (36,231) | | | (4,923) | | | (146,780) | |
| State | (5,263) | | | (8,491) | | | (127) | |
| Foreign | (273) | | | (438) | | | (54) | |
| Total Deferred | (41,767) | | | (13,852) | | | (146,961) | |
| Total | $ | (36,731) | | | $ | (12,456) | | | $ | (104,076) | |
|
| | | | | | | | | | | |
| | 2019 | | 2018 | | 2017 |
| | (Dollars in thousands) |
| Current: | | | | | |
| Federal | $ | 211 |
| | $ | 15,576 |
| | $ | 8,394 |
|
| State | 3,815 |
| | 7,041 |
| | (1,787 | ) |
| Foreign | (2,630 | ) | | 20,268 |
| | 6,736 |
|
| Total Current | 1,396 |
| | 42,885 |
| | 13,343 |
|
| Deferred: | | | | | |
| Federal | (4,923 | ) | | (146,780 | ) | | (173,184 | ) |
| State | (8,491 | ) | | (127 | ) | | (13,244 | ) |
| Foreign | (438 | ) | | (54 | ) | | (8,039 | ) |
| Total Deferred | (13,852 | ) | | (146,961 | ) | | (194,467 | ) |
| Total | $ | (12,456 | ) | | $ | (104,076 | ) | | $ | (181,124 | ) |
Domestic income before income taxes was $324.4 million, $825.7 million $717.4 million and $158.5$717.4 million for the years ended August 31, 2020, 2019 2018 and 2017,2018, respectively. Foreign lossincome (loss) before income taxes was $3.1$62.5 million, $46.2($3.1) million and $268.7($46.2) million for the years ended August 31, 2020, 2019 2018 and 2017,2018, respectively.
Deferred taxes are comprised of basis differences related to investments, accrued liabilities and certain federal and state tax credits. Deferred tax assets and liabilities as of August 31, 2020 and 2019, are as follows:
| | | | | | | | | | | |
| 2020 | | 2019 |
| | (Dollars in thousands) |
| Deferred tax assets: | | | |
| Accrued expenses | $ | 51,560 | | | $ | 62,245 | |
| Postretirement health care and deferred compensation | 42,898 | | | 42,747 | |
| Tax credit carryforwards | 123,193 | | | 152,347 | |
| Loss carryforwards | 116,741 | | | 136,435 | |
| Nonqualified equity | 344,924 | | | 290,447 | |
| Lease obligations | 64,140 | | | — | |
| Other | 85,856 | | | 97,071 | |
| Deferred tax assets valuation reserve | (219,891) | | | (246,344) | |
| Total deferred tax assets | 609,421 | | | 534,948 | |
| Deferred tax liabilities: | | | |
| Pension | 17,131 | | | 11,237 | |
| Investments | 95,916 | | | 99,838 | |
| Major maintenance | 91 | | | 4,679 | |
| Property, plant and equipment | 556,160 | | | 560,334 | |
| Right of use asset | 64,140 | | | — | |
| Other | 15,326 | | | 1,760 | |
| Total deferred tax liabilities | 748,764 | | | 677,848 | |
| Net deferred tax liabilities | $ | 139,343 | | | $ | 142,900 | |
We have total gross loss carryforwards of $576.6 million, of which $366.9 million will expire over periods ranging from fiscal 2021 to fiscal 2041. The remainder will carry forward indefinitely. Based on estimates of future taxable profits and losses in certain foreign tax jurisdictions, as well as consideration of other factors, we assessed whether a valuation allowance was necessary to reduce specific foreign loss carryforwards to amounts we believe are more likely than not to be realized as of August 31, 2020. If our estimates prove inaccurate, adjustments to the valuation allowances may be required in the future with gains or losses being charged to income in the period such determination is made. McPherson refinery's gross state tax credit carryforwards for income tax were approximately $125.5 million and $123.3 million as of August 31, 2020 and 2019, respectively. McPherson refinery's valuation allowance on Kansas state credits is necessary due to the limited amount of taxable income generated in Kansas by the combined group on an annual basis.
On March 27, 2020, the Coronavirus Aid, Relief and Economic Security ("CARES") Act was signed into law. As a result, our alternative minimum tax credit became refundable and has been classified in other current assets on the Consolidated Balance Sheet as of August 31, 2020. Our general business credits of $59.1 million, comprised primarily of low-sulfur diesel credits, will begin to expire on August 31, 2027, and our state tax credits of $125.5 million began to expire on August 31, 2020.
The reconciliation of the statutory federal income tax rates to the effective tax rates for the years ended August 31, 2020, 2019 and 2018 is as follows:
| | | | | | | | | | | | | | | | | |
| 2020 | | 2019 | | 2018 |
| Statutory federal income tax rate | 21.0 | % | | 21.0 | % | | 25.7 | % |
| State and local income taxes, net of federal income tax benefit | (1.8) | | | (0.7) | | | 0.7 | |
| Patronage earnings | (13.1) | | | (14.3) | | | (13.6) | |
| Domestic production activities deduction | (19.0) | | | (9.9) | | | (8.4) | |
| Export activities at rates other than the U.S. statutory rate | 1.8 | | | (2.1) | | | 5.7 | |
| U.S. tax reform | 0 | | | 0 | | | (23.2) | |
| Intercompany transfer of business assets | (1.6) | | | 0 | | | (6.1) | |
| Increase in unrecognized tax benefits | 4.2 | | | 0.2 | | | 6.8 | |
| Valuation allowance | (1.0) | | | 2.6 | | | (3.0) | |
| Tax credits | 0.2 | | | 0.4 | | | 0.7 | |
| Other | (0.2) | | | 1.3 | | | (0.8) | |
| Effective tax rate | (9.5) | % | | (1.5) | % | | (15.5) | % |
On December 22, 2017, the Tax Cuts and Jobs Act ("Tax Act") was enacted into law. The Tax Act provides for significant U.S. tax law changes that reduced our federal corporate statutory tax rate from 35% to 21% as of January 1, 2018. As a fiscal year-end taxpayer, our annual statutory federal corporate tax rate applicable to fiscal 2018 was a blended rate of 25.7%. For fiscal 2020 and fiscal 2019, the annual statutory federal corporate tax rate was 21%.
The Tax Act initially repealedPrimary drivers of the fiscal 2020 income tax benefit were retaining the current Domestic Production Activities Deduction ("DPAD") benefit and enactedfrom the Deduction for Qualified Business Incomesettlement of Pass-Thru Entities ("QBI Deduction"); however, the Consolidated Appropriations Act, 2018 ("Appropriations Act") enacted into law on March 23, 2018, impacted these deductions. The Appropriations Act modifies the QBI Deduction under Section 199A of the Tax Act to reenact DPAD for agricultural and horticultural cooperatives as it existed prior to enactment of the Tax Act and modifies the QBI Deduction available to cooperative patrons as enacted by the Tax Act. All references to the Tax Act below include modifications introduced by the Appropriations Act.
Deferred taxes are comprised of basis differences related to investments, accrued liabilities and certaina U.S. federal and state tax credits. Deferred tax assets and liabilities as of August 31, 2019 and 2018, are as follows:
|
| | | | | | | |
| | 2019 | | 2018 |
| | (Dollars in thousands) |
| Deferred tax assets: | |
| | |
|
| Accrued expenses | $ | 62,245 |
| | $ | 138,417 |
|
| Postretirement health care and deferred compensation | 42,747 |
| | 41,797 |
|
| Tax credit carryforwards | 152,347 |
| | 154,240 |
|
| Loss carryforwards | 136,435 |
| | 104,519 |
|
| Nonqualified equity | 290,447 |
| | 178,046 |
|
| Major maintenance | — |
| | 5,484 |
|
| Other | 97,071 |
| | 83,580 |
|
| Deferred tax assets valuation reserve | (246,344 | ) | | (230,373 | ) |
| Total deferred tax assets | 534,948 |
| | 475,710 |
|
| Deferred tax liabilities: | |
| | |
|
| Pension | 11,237 |
| | 19,397 |
|
| Investments | 99,838 |
| | 98,608 |
|
| Major maintenance | 4,679 |
| | — |
|
| Property, plant and equipment | 560,334 |
| | 513,238 |
|
| Other | 1,760 |
| | 26,828 |
|
| Total deferred tax liabilities | 677,848 |
| | 658,071 |
|
| Net deferred tax liabilities | $ | 142,900 |
| | $ | 182,361 |
|
We have total gross loss carryforwards of $626.4 million, of which $363.6 million will expire over periods ranging from fiscal 2020 to fiscal 2041. The remainder will carry forward indefinitely. Based on estimates of future taxable profits and lossesaudit resulting in certain foreign tax jurisdictions, as well as consideration of other factors, we assessed whether a valuation allowance was necessary to reduce specific foreign loss carryforwards to amounts we believe are more likely than not to be realized as of August 31, 2019. If our estimates prove inaccurate, adjustments to the valuation allowances may be required in the future with gains or losses being charged to income in the period such determination is made. During fiscal 2019, valuation allowances related to foreign operations decreased by $15.1 million due to net operating loss carryforwards and other timing differences. McPherson refinery's gross stateadditional tax credit carryforwards for income taxcarryovers, which were approximately $123.3 million and $121.6 million as of August 31, 2019 and 2018, respectively. During the year ended August 31, 2019, the valuation allowance for the McPherson refinery increasedpartially offset by $0.8 million, net of federal tax, due to a changean increase in the amount of state tax credits that will be available for use and estimated to be utilized. McPherson refinery's valuation allowance on Kansas state credits is necessary due to the limited amount of taxable income generated in Kansas by the combined group on an annual basis.
Our foreign tax credit of $11.2 million was generated in fiscal 2018 and will expire in 10 years. Our alternative minimum tax credit of $14.1 million will not expire. Our general business credits of $79.3 million, comprised primarily of low-sulfur diesel credits, will begin to expire on August 31, 2027, and our state tax credits of $123.0 million began to expire on August 31, 2019.
As of August 31, 2019 and 2018, netunrecognized deferred tax assets of $0.1 million and $0.4 million, respectively, were included in other assets.
The reconciliation of the statutory federal income tax rates to the effective tax rates for the years ended August 31, 2019, 2018 and 2017 is as follows:
|
| | | | | | | | |
| | 2019 | | 2018 | | 2017 |
| Statutory federal income tax rate | 21.0 | % | | 25.7 | % | | 35.0 | % |
| State and local income taxes, net of federal income tax benefit | (0.7 | ) | | 0.7 |
| | 12.1 |
|
| Patronage earnings | (14.3 | ) | | (13.6 | ) | | 91.7 |
|
| Domestic production activities deduction | (9.9 | ) | | (8.4 | ) | | 30.5 |
|
| Export activities at rates other than the U.S. statutory rate | 0.2 |
| | 6.1 |
| | 51.6 |
|
| U.S. tax reform | — |
| | (23.2 | ) | | — |
|
| Intercompany transfer of business assets | — |
| | (6.1 | ) | | — |
|
| Increase in unrecognized tax benefits | 0.2 |
| | 6.8 |
| | — |
|
| Valuation allowance | 0.3 |
| | (3.4 | ) | | (77.1 | ) |
| Tax credits | 0.4 |
| | 0.7 |
| | 22.8 |
|
| Crack spread contingency | — |
| | — |
| | 4.8 |
|
| Other | 1.3 |
| | (0.8 | ) | | (7.0 | ) |
| Effective tax rate | (1.5 | )% | | (15.5 | )% | | 164.4 | % |
benefit. Primary drivers of the fiscal 2019 income tax benefit arewere retaining the current DPAD benefit and deducting previously disallowed DPAD available from the carryback of excise tax credits, which were partially offset by an increase in our unrecognized deferred tax benefit as described below. Primary drivers of the fiscal 2018 income tax benefit were recognition of deferred benefits from revaluation of our net deferred tax liability resulting from the Tax Act, an intercompany transfer of a business on December 1, 2017, and a current tax benefit from retaining a significant portion of the DPAD, which were partially offset by deferred tax expense from an increase in our unrecognized tax benefit as described below.
Components of the income tax benefit disclosed as a percentage of income (loss) before income taxes in the reconciliation of the statutory federal income tax rate for the year ended August 31, 2017, were magnified because our fiscal 2017 income tax benefit was unusually large in relation to our income (loss) before income taxes. Primary drivers of the fiscal 2017 income tax benefit were recognition of deferred tax benefits related to the issuance of non-qualified equity certificates for fiscal 2013 and 2014, which is disclosed within "Patronage earnings" and U.S. and Brazil deductions related to a Brazilian trading partner loss, which are disclosed within "Statutory federal income tax rate" and "Export activities at rates other than the U.S. statutory rate," respectively, as well as a current tax benefit from retaining a significant portion of the DPAD. A significant income tax expense within the fiscal 2017 income tax benefit is an increase in the valuation allowance against deferred tax assets generated in a Brazilian trading partner loss and Kansas state tax credits.
We file income tax returns in the U.S. federal jurisdiction, as well as various state and foreign jurisdictions. Our uncertain tax positions are affected by the tax years that are under audit or remain subject to examination by the relevant taxing authorities. In addition to the current year, fiscal 2007 through 20182019 remain subject to examination, at least for certain issues.
We account for our incomeReserves are recorded against unrecognized tax provisions in accordance with ASC Topic 740, Income Taxes, which prescribes a minimum thresholdbenefits when we believe certain fully supportable tax return positions are likely to be challenged and we may or may not prevail. If we determine that a tax provisionposition is required to meet before being recognized in our consolidated financial statements. This interpretation requires us to recognize in our consolidated financial statements tax positions determined more likely than not to be sustained upon examination,audit, based on the technical merits of the position.position, we recognize the benefit by measuring the amount that is greater than 50% likely of being realized. We reevaluate the technical merits of our tax positions and recognize an uncertain tax benefit, or derecognize a previously recorded tax benefit, when there is (i) a completion of a tax audit, (ii) effective settlement of an issue, (iii) a change in applicable tax law including a tax case or legislative guidance, or (iv) expiration of the applicable statute of limitations. Significant judgment is required in accounting for tax reserves. A reconciliation of the gross beginning and ending amounts of unrecognized tax benefits for the periods presented follows:
| | | | | | | | | | | | | | | | | |
| 2020 | | 2019 | | 2018 |
| | (Dollars in thousands) |
| Balance at beginning of period | $ | 101,128 | | | $ | 91,135 | | | $ | 37,830 | |
| Additions attributable to current year tax positions | 14,410 | | | 14,162 | | | 3,640 | |
| Additions attributable to prior year tax positions | 6,128 | | | 0 | | | 49,665 | |
| Reductions attributable to prior year tax positions | (2,516) | | | (4,169) | | | 0 | |
| Balance at end of period | $ | 119,150 | | | $ | 101,128 | | | $ | 91,135 | |
|
| | | | | | | | | | | |
| | 2019 | | 2018 | | 2017 |
| | (Dollars in thousands) |
| Balance at beginning of period | $ | 91,135 |
| | $ | 37,830 |
| | $ | 37,105 |
|
| Additions attributable to current year tax positions | 14,162 |
| | 3,640 |
| | 725 |
|
| Additions attributable to prior year tax positions | — |
| | 49,665 |
| | — |
|
| Reductions attributable to prior year tax positions | (4,169 | ) | | — |
| | — |
|
| Balance at end of period | $ | 101,128 |
| | $ | 91,135 |
| | $ | 37,830 |
|
During fiscal 2019, we increased our unrecognized tax benefits as a result of proposed tax regulations related to DPAD and decreased our unrecognized tax benefits for excise tax credits related to blending and sales of renewable fuels deducted from income taxes. During fiscal 2018, adverse judicial opinions received by other taxpayers with similar filing positions resulted in an increase to our unrecognized tax benefits primarily for excise tax credits related to blending and sales of renewable fuels deducted from income taxes. During fiscal 2017, we increased our unrecognized tax benefits for excise tax credits related to blending and sales of renewable fuels deducted from income taxes.
If we were to prevail on all positions taken in relation to uncertain tax positions, $93.3$111.3 million of the unrecognized tax benefits would ultimately benefit our effective tax rate. However, we do not believe itIt is reasonably possible that the total amount of unrecognized tax benefits willcould significantly increase or decrease withinchange in the next 12 months.
We recognize interest and penalties related to unrecognized tax benefits in our provision for income taxes. We recognized $1.0 million benefit and $1.7 million and $1.2 millionexpense for interest and penalties related to unrecognized tax benefits in our Consolidated Statement of Operations for the yearyears ended August 31, 20192020 and 2018,2019, respectively, and a related $2.9$1.0 million and $1.2$2.9 million interest payable on our Consolidated Balance Sheet as of August 31, 2020 and 2019, and 2018, respectively. NoNaN interest or penalties were recognized in our Consolidated Statements of Operations for the year ended August 31, 2017, and no interest payable was recorded on our Consolidated Balance Sheet as of August 31, 2017.2018.
Note 1012 Equities
Patronage and Equity Redemptions
In accordance with our bylaws and by action of the Board of Directors, annual net earnings from patronage sources are distributed to consenting patrons following the close of each fiscal year and are based on amounts using financial statement earnings. The cash portion of the qualified patronage distribution, if any, is determined annually by the Board of Directors, with the balance issued in the form of qualified and/or non-qualifiednonqualified capital equity certificates. Total patronage distributions for fiscal 20192020 are estimated to be $562.4$242.0 million, with the qualified cash portion estimated to be $90.0$30.0 million and non-qualifiednonqualified equity distributions of $472.4$212.0 million. NoNaN portion of annual net earnings for fiscal 20192020 will be issued in the form of qualified capital equity certificates. Patronage distributions for fiscalthe years ended August 31, 2019, 2018 and 2017 were $564.5 million (with a $90.1 million cash portion), $428.8 million with(with a $75.8 million cash portion. The actual patronage distributionsportion) and cash portion for fiscal 2017 and 2016 were $128.8 million (with no0 cash portion) and $257.5 million ($103.9 million in cash), respectively.
Annual net earnings from patronage or other sources may be added to the unallocated capital reserve or, upon action by the Board of Directors, may be allocated to members in the form of nonpatronage equity certificates. The Board of Directors authorized, in accordance with our bylaws, that 10% of the earnings from patronage business for fiscal 2020, 2019 2018 and 20172018 be added to our capital reserves.
Redemptions of outstanding equity are at the discretion of the Board of Directors. Redemptions of capital equity certificates approved by the Board of Directors are divided into two2 pools, one for non-individualsnonindividuals (primarily member cooperatives) who may participate in an annual redemption program for qualified equities held by them and another for individual members who are eligible for equity redemptions at age 70 or upon death. The CHS redemption policy includes a redemption program for individuals similar to the one that is available to non-individualnonindividual members, subject to CHS Board of Directors overall discretion whether to redeem outstanding equity. In accordance with authorization from the Board of Directors, we expect total redemptions related to the year ended August 31, 2019,2020, that will be distributed in fiscal 2020,2021, to be approximately $90.0$33.0 million. This amount is classified as a current liability on our August 31, 2019,2020, Consolidated Balance Sheet. During the years ended August 31, 2020, 2019 2018 and 2017,2018, we redeemed in cash, outstanding owners' equities in accordance with authorization from the Board of Directors, in the amounts of $96.4 million, $85.5 million $8.8 million and $35.3$8.8 million, respectively.
In March 2017, we redeemed approximately $20.0 million of patrons' equities by issuing 695,390 shares of Class B Cumulative Redeemable Preferred Stock, Series 1 ("Class B Series 1 Preferred Stock"), with a total redemption value of $17.4 million, excluding accumulated dividends. Each share of Class B Series 1 Preferred Stock was issued in redemption of $28.74 of patrons' equities in the form of capital equity certificates.
Preferred Stock
The following is a summary of our outstanding preferred stock as of August 31, 2019,2020, all shares of which are listed and traded on the Global Select Market ofThe Nasdaq:
| | | | | Nasdaq Symbol | | Issuance Date | | Shares Outstanding | | Redemption Value | | Net Proceeds (a) | | Dividend Rate (b) (c) | | Dividend Payment Frequency | | Redeemable Beginning (d) | | Nasdaq Symbol | | Issuance Date | | Shares Outstanding | | Redemption Value | | Net Proceeds (a) | | Dividend Rate
(b) (c) | | Dividend Payment Frequency | | Redeemable Beginning (d) |
| | | | | (Dollars in millions) | | | | | | | | | | | (Dollars in millions) | | | | | | |
| 8% Cumulative Redeemable | | CHSCP | | (e) | | 12,272,003 |
| | $ | 306.8 |
| | $ | 311.2 |
| | 8.00 | % | | Quarterly | | 7/18/2023 | 8% Cumulative Redeemable | | CHSCP | | (e) | | 12,272,003 | | | $ | 306.8 | | | $ | 311.2 | | | 8.00 | % | | Quarterly | | 7/18/2023 |
| Class B Cumulative Redeemable, Series 1 | | CHSCO | | (f) | | 21,459,066 |
| | 536.5 |
| | 569.3 |
| | 7.875 | % | | Quarterly | | 9/26/2023 | Class B Cumulative Redeemable, Series 1 | | CHSCO | | (f) | | 21,459,066 | | | 536.5 | | | 569.3 | | | 7.875 | % | | Quarterly | | 9/26/2023 |
| Class B Reset Rate Cumulative Redeemable, Series 2 | | CHSCN | | 3/11/2014 | | 16,800,000 |
| | 420.0 |
| | 406.2 |
| | 7.10 | % | | Quarterly | | 3/31/2024 | Class B Reset Rate Cumulative Redeemable, Series 2 | | CHSCN | | 3/11/2014 | | 16,800,000 | | | 420.0 | | | 406.2 | | | 7.10 | % | | Quarterly | | 3/31/2024 |
| Class B Reset Rate Cumulative Redeemable, Series 3 | | CHSCM | | 9/15/2014 | | 19,700,000 |
| | 492.5 |
| | 476.7 |
| | 6.75 | % | | Quarterly | | 9/30/2024 | Class B Reset Rate Cumulative Redeemable, Series 3 | | CHSCM | | 9/15/2014 | | 19,700,000 | | | 492.5 | | | 476.7 | | | 6.75 | % | | Quarterly | | 9/30/2024 |
| Class B Cumulative Redeemable, Series 4 | | CHSCL | | 1/21/2015 | | 20,700,000 |
| | 517.5 |
| | 501.0 |
| | 7.50 | % | | Quarterly | | 1/21/2025 | Class B Cumulative Redeemable, Series 4 | | CHSCL | | 1/21/2015 | | 20,700,000 | | | 517.5 | | | 501.0 | | | 7.50 | % | | Quarterly | | 1/21/2025 |
(a) Includes patrons' equities redeemed with preferred stock.
(b) The Class B Reset Rate Cumulative Redeemable Preferred Stock, Series 2 accumulates dividends at a rate of 7.10% per year until March 31, 2024, and then at a rate equal to the three-month LIBOR plus 4.298%, not to exceed 8.00% per annum, subsequent to March 31, 2024.
(c) The Class B Reset Rate Cumulative Redeemable Preferred Stock, Series 3 accumulates dividends at a rate of 6.75% per year until September 30, 2024, and then at a rate equal to the three-month LIBOR plus 4.155%, not to exceed 8.00% per annum, subsequent to September 30, 2024.
(d) Preferred stock is redeemable for cash at our option, in whole or in part, at a per share price equal to the per share liquidation preference of $25.00 per share, plus all dividends accumulated and unpaid on that share to and including the date of redemption, beginning on the dates set forth in this column.
(e) The 8% Cumulative Redeemable Preferred Stock was issued at various times from 2003 through 2010.
(f) Shares of Class B Cumulative Redeemable Preferred Stock, Series 1 were issued on September 26, 2013; August 25, 2014; March 31, 2016; and March 30, 2017.
Preferred Stock Dividends
We made dividend payments on our preferred stock of $168.7 million $168.7 million and $167.6 million, during each of the years ended August 31, 2020, 2019 2018 and 2017, respectively.2018. As of August 31, 2019,2020, we have no authorized but unissued shares of preferred stock.
The following is a summary of dividends per share by classseries of preferred stock for the years ended August 31, 20192020 and 2018.2019.
| | | | | | | | | | | | | | | | | |
| | | Years Ended August 31, |
| Nasdaq Symbol | | 2020 | | 2019 |
| | | (Dollars per share) |
| 8% Cumulative Redeemable | CHSCP | | $ | 2.00 | | | $ | 2.00 | |
| Class B Cumulative Redeemable, Series 1 | CHSCO | | 1.97 | | | 1.97 | |
| Class B Reset Rate Cumulative Redeemable, Series 2 | CHSCN | | 1.78 | | | 1.78 | |
| Class B Reset Rate Cumulative Redeemable, Series 3 | CHSCM | | 1.69 | | | 1.69 | |
| Class B Cumulative Redeemable, Series 4 | CHSCL | | 1.88 | | | 1.88 | |
|
| | | | | | | | | |
| | | | For the Years Ended August 31, |
| | Nasdaq Symbol | | 2019 | | 2018 |
| | | | (Dollars per share) |
| 8% Cumulative Redeemable | CHSCP | | $ | 2.00 |
| | $ | 2.00 |
|
| Class B Cumulative Redeemable, Series 1 | CHSCO | | 1.97 |
| | 1.97 |
|
| Class B Reset Rate Cumulative Redeemable, Series 2 | CHSCN | | 1.78 |
| | 1.78 |
|
| Class B Reset Rate Cumulative Redeemable, Series 3 | CHSCM | | 1.69 |
| | 1.69 |
|
| Class B Cumulative Redeemable, Series 4 | CHSCL | | 1.88 |
| | 1.88 |
|
Accumulated Other Comprehensive Loss
Changes in accumulated other comprehensive income (loss) by component, for the years ended August 31, 2020, 2019 2018 and 20172018 are as follows:
| | | | | | | | | | | | | | Pension and Other Postretirement Benefits | | Unrealized Net Gain (Loss) on Available for Sale Investments | | Cash Flow Hedges | | Foreign Currency Translation Adjustment | | Total |
| | Pension and Other Postretirement Benefits | | Unrealized Net Gain (Loss) on Available for Sale Investments | | Cash Flow Hedges | | Foreign Currency Translation Adjustment | | Total | | (Dollars in thousands) |
| | (Dollars in thousands) | |
| Balance as of August 31, 2016, net of tax | $ | (165,146 | ) | | $ | 5,656 |
| | $ | (9,196 | ) | | $ | (42,844 | ) | | $ | (211,530 | ) | |
| Other comprehensive income (loss), before tax: | | | | | | | | | | |
| Amounts before reclassifications | 25,216 |
| | 7,117 |
| | 1,892 |
| | (7,960 | ) | | 26,265 |
| |
| Amounts reclassified out | 26,174 |
| | — |
| | 1,742 |
| | 15 |
| | 27,931 |
| |
| Total other comprehensive income (loss), before tax | 51,390 |
| | 7,117 |
| | 3,634 |
| | (7,945 | ) | | 54,196 |
| |
| Tax effect | (18,688 | ) | | (2,732 | ) | | (1,392 | ) | | (214 | ) | | (23,026 | ) | |
| Other comprehensive income (loss), net of tax | 32,702 |
| | 4,385 |
| | 2,242 |
| | (8,159 | ) | | 31,170 |
| |
| Balance as of August 31, 2017, net of tax | (132,444 | ) | | 10,041 |
| | (6,954 | ) | | (51,003 | ) | | (180,360 | ) | Balance as of August 31, 2017, net of tax | $ | (132,444) | | | $ | 10,041 | | | $ | (6,954) | | | $ | (51,003) | | | $ | (180,360) | |
| Other comprehensive income (loss), before tax: | | | | | | | | | | Other comprehensive income (loss), before tax: | |
| Amounts before reclassifications | 7,633 |
| | 21,078 |
| | 1,031 |
| | (10,062 | ) | | 19,680 |
| Amounts before reclassifications | 7,633 | | | 21,078 | | | 1,031 | | | (10,062) | | | 19,680 | |
| Amounts reclassified out | 21,804 |
| | (25,534 | ) | | 1,704 |
| | (2,042 | ) | | (4,068 | ) | Amounts reclassified out | 21,804 | | | (25,534) | | | 1,704 | | | (2,042) | | | (4,068) | |
| Total other comprehensive income (loss), before tax | 29,437 |
| | (4,456 | ) | | 2,735 |
| | (12,104 | ) | | 15,612 |
| Total other comprehensive income (loss), before tax | 29,437 | | | (4,456) | | | 2,735 | | | (12,104) | | | 15,612 | |
| Tax effect | (9,371 | ) | | 1,308 |
| | (195 | ) | | 83 |
| | (8,175 | ) | Tax effect | (9,371) | | | 1,308 | | | (195) | | | 83 | | | (8,175) | |
| Other comprehensive income (loss), net of tax | 20,066 |
| | (3,148 | ) | | 2,540 |
| | (12,021 | ) | | 7,437 |
| Other comprehensive income (loss), net of tax | 20,066 | | | (3,148) | | | 2,540 | | | (12,021) | | | 7,437 | |
| Reclassification of tax effects to capital reserves | (27,957 | ) | | 1,968 |
| | (1,468 | ) | | 465 |
| | (26,992 | ) | Reclassification of tax effects to capital reserves | (27,957) | | | 1,968 | | | (1,468) | | | 465 | | | (26,992) | |
| Balance as of August 31, 2018, net of tax | (140,335 | ) | | 8,861 |
| | (5,882 | ) | | (62,559 | ) | | (199,915 | ) | Balance as of August 31, 2018, net of tax | (140,335) | | | 8,861 | | | (5,882) | | | (62,559) | | | (199,915) | |
| Other comprehensive income (loss), before tax: | | | | | | | | | | Other comprehensive income (loss), before tax: | |
| Amounts before reclassifications | (51,118 | ) | | — |
| | 37,709 |
| | (9,990 | ) | | (23,399 | ) | Amounts before reclassifications | (51,118) | | | 0 | | | 37,709 | | | (9,990) | | | (23,399) | |
| Amounts reclassified out | 10,279 |
| | — |
| | (9,843 | ) | | — |
| | 436 |
| Amounts reclassified out | 10,279 | | | 0 | | | (9,843) | | | 0 | | | 436 | |
| Total other comprehensive income (loss), before tax | (40,839 | ) | | — |
| | 27,866 |
| | (9,990 | ) | | (22,963 | ) | Total other comprehensive income (loss), before tax | (40,839) | | | 0 | | | 27,866 | | | (9,990) | | | (22,963) | |
| Tax effect | 8,280 |
| | — |
| | (7,670 | ) | | 41 |
| | 651 |
| Tax effect | 8,280 | | | 0 | | | (7,670) | | | 41 | | | 651 | |
| Other comprehensive income (loss), net of tax | (32,559 | ) | | — |
| | 20,196 |
| | (9,949 | ) | | (22,312 | ) | Other comprehensive income (loss), net of tax | (32,559) | | | 0 | | | 20,196 | | | (9,949) | | | (22,312) | |
| Reclassifications | 416 |
| | (8,861 | ) | | 983 |
| | 2,756 |
| | (4,706 | ) | Reclassifications | 416 | | | (8,861) | | | 983 | | | 2,756 | | | (4,706) | |
| Balance as of August 31, 2019, net of tax | $ | (172,478 | ) | | $ | — |
| | $ | 15,297 |
| | $ | (69,752 | ) | | $ | (226,933 | ) | Balance as of August 31, 2019, net of tax | (172,478) | | | 0 | | | 15,297 | | | (69,752) | | | (226,933) | |
| Other comprehensive income (loss), before tax: | | Other comprehensive income (loss), before tax: | |
| Amounts before reclassifications | | Amounts before reclassifications | (4,751) | | | 0 | | | 16,430 | | | (17,021) | | | (5,342) | |
| Amounts reclassified out | | Amounts reclassified out | 19,908 | | | 0 | | | (22,291) | | | 0 | | | (2,383) | |
| Total other comprehensive income (loss), before tax | | Total other comprehensive income (loss), before tax | 15,157 | | | 0 | | | (5,861) | | | (17,021) | | | (7,725) | |
| Tax effect | | Tax effect | (2,359) | | | 0 | | | 1,450 | | | 1,643 | | | 734 | |
| Other comprehensive income (loss), net of tax | | Other comprehensive income (loss), net of tax | 12,798 | | | 0 | | | (4,411) | | | (15,378) | | | (6,991) | |
| Balance as of August 31, 2020, net of tax | | Balance as of August 31, 2020, net of tax | $ | (159,680) | | | $ | 0 | | | $ | 10,886 | | | $ | (85,130) | | | $ | (233,924) | |
Amounts reclassified from accumulated other comprehensive income (loss) were related to pension and other postretirement benefits, cash flow hedges, available-for-sale investments and foreign currency translation adjustments. Pension and other postretirement reclassifications include amortization of net actuarial loss, prior service credit and transition amounts and are recorded as cost of goods sold and marketing, general and administrative expenses (see Note 11, 13, Benefit Plans, for further information). Gains or losses on the sale of available-for-sale investments are recorded to other income. Foreign currency translation reclassifications related to sales of businesses are recorded to other income.
Note 1113 Benefit Plans
We have various pension and other defined benefit as well as defined contribution plans in which substantially all employees may participate. We also have non-qualifiednonqualified supplemental executive and Board retirement plans.
We provide defined life insurance and health care benefits for certain retired employees and Board of Directors participants. The plan is contributory based on years of service and family status, with retiree contributions adjusted annually.
Financial information on changes in projected benefit obligation, plan assets funded and balance sheet status as of August 31, 20192020 and 2018,2019, is as follows:
| | | | | | | | | | | | | | | | | | | | | | | | | | | | | | | | | | | |
| Qualified
Pension Benefits | | Nonqualified
Pension Benefits | | Other Benefits |
| | 2020 | | 2019 | | 2020 | | 2019 | | 2020 | | 2019 |
| | (Dollars in thousands) |
| Change in benefit obligation: | | | | | | | | | | | |
| Projected benefit obligation at beginning of period | $ | 876,696 | | | $ | 767,184 | | | $ | 19,047 | | | $ | 20,755 | | | $ | 31,098 | | | $ | 29,790 | |
| Service cost | 42,151 | | | 38,592 | | | 405 | | | 311 | | | 1,050 | | | 1,053 | |
| Interest cost | 21,722 | | | 28,396 | | | 429 | | | 747 | | | 747 | | | 1,094 | |
| Actuarial loss (gain) | 6,265 | | | (9,606) | | | 1,382 | | | 76 | | | (2,286) | | | (2,596) | |
| Assumption change | 40,694 | | | 102,441 | | | 775 | | | 1,841 | | | 1,275 | | | 3,398 | |
| Plan amendments | 0 | | | 18 | | | 0 | | | 0 | | | 0 | | | 0 | |
| Settlements | 0 | | | (615) | | | (2,130) | | | (3,975) | | | 0 | | | 0 | |
| Benefits paid | (69,526) | | | (49,714) | | | (725) | | | (708) | | | (1,568) | | | (1,641) | |
| Projected benefit obligation at end of period | $ | 918,002 | | | $ | 876,696 | | | $ | 19,183 | | | $ | 19,047 | | | $ | 30,316 | | | $ | 31,098 | |
| Change in plan assets: | | | | | | | | | | | |
| Fair value of plan assets at beginning of period | $ | 909,427 | | | $ | 829,616 | | | $ | 0 | | | $ | 0 | | | $ | 0 | | | $ | 0 | |
| Actual gain on plan assets | 90,241 | | | 90,139 | | | 0 | | | 0 | | | 0 | | | 0 | |
| Company contributions | 46,400 | | | 40,001 | | | 2,855 | | | 4,683 | | | 1,568 | | | 1,641 | |
| Settlements | 0 | | | (615) | | | (2,130) | | | (3,975) | | | 0 | | | 0 | |
| Benefits paid | (69,526) | | | (49,714) | | | (725) | | | (708) | | | (1,568) | | | (1,641) | |
| Fair value of plan assets at end of period | $ | 976,542 | | | $ | 909,427 | | | $ | 0 | | | $ | 0 | | | $ | 0 | | | $ | 0 | |
| Funded status at end of period | $ | 58,540 | | | $ | 32,731 | | | $ | (19,183) | | | $ | (19,047) | | | $ | (30,316) | | | $ | (31,098) | |
| Amounts recognized on balance sheet: | | | | | | | | | | | |
| Noncurrent assets | $ | 58,540 | | | $ | 32,731 | | | $ | 0 | | | $ | 0 | | | $ | 0 | | | $ | 0 | |
| Accrued benefit cost: | | | | | | | | | | | |
| Current liabilities | 0 | | | 0 | | | (1,660) | | | (1,580) | | | (2,090) | | | (2,040) | |
| Noncurrent liabilities | 0 | | | 0 | | | (17,523) | | | (17,467) | | | (28,226) | | | (29,058) | |
| Ending balance | $ | 58,540 | | | $ | 32,731 | | | $ | (19,183) | | | $ | (19,047) | | | $ | (30,316) | | | $ | (31,098) | |
| Amounts recognized in accumulated other comprehensive loss (pretax): | | | | | | | | | | | |
| Prior service cost (credit) | $ | 938 | | | $ | 1,117 | | | $ | (502) | | | $ | (616) | | | $ | (2,715) | | | $ | (3,160) | |
| Net loss (gain) | 225,983 | | | 244,164 | | | 3,813 | | | 2,151 | | | (15,064) | | | (15,445) | |
| Ending balance | $ | 226,921 | | | $ | 245,281 | | | $ | 3,311 | | | $ | 1,535 | | | $ | (17,779) | | | $ | (18,605) | |
|
| | | | | | | | | | | | | | | | | | | | | | | |
| | Qualified Pension Benefits | | Non-Qualified Pension Benefits | | Other Benefits |
| | 2019 | | 2018 | | 2019 | | 2018 | | 2019 | | 2018 |
| | (Dollars in thousands) |
| Change in benefit obligation: | |
| | |
| | |
| | |
| | |
| | |
|
| Projected benefit obligation at beginning of period | $ | 767,184 |
| | $ | 806,174 |
| | $ | 20,755 |
| | $ | 25,599 |
| | $ | 29,790 |
| | $ | 31,836 |
|
| Service cost | 38,592 |
| | 39,677 |
| | 311 |
| | 548 |
| | 1,053 |
| | 943 |
|
| Interest cost | 28,396 |
| | 24,007 |
| | 747 |
| | 711 |
| | 1,094 |
| | 908 |
|
| Actuarial (gain) loss | (9,606 | ) | | 3,146 |
| | 76 |
| | 205 |
| | (2,596 | ) | | (623 | ) |
| Assumption change | 102,441 |
| | (36,515 | ) | | 1,841 |
| | (783 | ) | | 3,398 |
| | (1,612 | ) |
| Plan amendments | 18 |
| | 244 |
| | — |
| | — |
| | — |
| | — |
|
| Settlements | (615 | ) | | — |
| | (3,975 | ) | | (4,824 | ) | | — |
| | — |
|
| Benefits paid | (49,714 | ) | | (69,549 | ) | | (708 | ) | | (701 | ) | | (1,641 | ) | | (1,662 | ) |
| Projected benefit obligation at end of period | $ | 876,696 |
| | $ | 767,184 |
| | $ | 19,047 |
| | $ | 20,755 |
| | $ | 31,098 |
| | $ | 29,790 |
|
| Change in plan assets: | |
| | |
| | |
| | |
| | |
| | |
|
| Fair value of plan assets at beginning of period | $ | 829,616 |
| | $ | 875,820 |
| | $ | — |
| | $ | — |
| | $ | — |
| | $ | — |
|
| Actual gain (loss) on plan assets | 90,139 |
| | 23,345 |
| | — |
| | — |
| | — |
| | — |
|
| Company contributions | 40,001 |
| | — |
| | 4,683 |
| | 5,525 |
| | 1,641 |
| | 1,662 |
|
| Settlements | (615 | ) | | — |
| | (3,975 | ) | | (4,824 | ) | | — |
| | — |
|
| Benefits paid | (49,714 | ) | | (69,549 | ) | | (708 | ) | | (701 | ) | | (1,641 | ) | | (1,662 | ) |
| Fair value of plan assets at end of period | $ | 909,427 |
| | $ | 829,616 |
| | $ | — |
| | $ | — |
| | $ | — |
| | $ | — |
|
| Funded status at end of period | $ | 32,731 |
| | $ | 62,432 |
| | $ | (19,047 | ) | | $ | (20,755 | ) | | $ | (31,098 | ) | | $ | (29,790 | ) |
| Amounts recognized on balance sheet: | |
| | |
| | |
| | |
| | |
| | |
|
| Non-current assets | $ | 32,731 |
| | $ | 62,432 |
| | $ | — |
| | $ | — |
| | $ | — |
| | $ | — |
|
| Accrued benefit cost: | | | | | | | | | | | |
| Current liabilities | — |
| | — |
| | (1,580 | ) | | (1,780 | ) | | (2,040 | ) | | (2,040 | ) |
| Non-current liabilities | — |
| | — |
| | (17,467 | ) | | (18,975 | ) | | (29,058 | ) | | (27,750 | ) |
| Ending balance | $ | 32,731 |
| | $ | 62,432 |
| | $ | (19,047 | ) | | $ | (20,755 | ) | | $ | (31,098 | ) | | $ | (29,790 | ) |
| Amounts recognized in accumulated other comprehensive loss (pretax): | |
| | |
| | |
| | |
| | |
| | |
|
| Prior service cost (credit) | $ | 1,117 |
| | $ | 1,288 |
| | $ | (616 | ) | | $ | (691 | ) | | $ | (3,160 | ) | | $ | (3,716 | ) |
| Net (gain) loss | 244,164 |
| | 209,606 |
| | 2,151 |
| | 427 |
| | (15,445 | ) | | (17,875 | ) |
| Ending balance | $ | 245,281 |
| | $ | 210,894 |
| | $ | 1,535 |
| | $ | (264 | ) | | $ | (18,605 | ) | | $ | (21,591 | ) |
The accumulated benefit obligation of the qualified pension plans was $833.2$871.6 million and $736.2$833.2 million at August 31, 20192020 and 2018,2019, respectively. The accumulated benefit obligation of the non-qualifiednonqualified pension plans was $16.9$18.2 million and $18.6$16.9 million at August 31, 20192020 and 2018,2019, respectively.
Information for the pension plans with an accumulated benefit obligation in excess of plan assets is set forth below:
| | | | | | | | | | | |
| Years Ended August 31, |
| 2020 | | 2019 |
| (Dollars in thousands) |
| Projected benefit obligation | $ | 19,183 | | | $ | 19,047 | |
| Accumulated benefit obligation | 18,172 | | | 16,907 | |
| | | |
|
| | | | | | | |
| | For the Years Ended August 31, |
| | 2019 | | 2018 |
| | (Dollars in thousands) |
| Projected benefit obligation | $ | 19,047 |
| | $ | 20,755 |
|
| Accumulated benefit obligation | 16,907 |
| | 18,586 |
|
Components of net periodic benefit costs for the years ended August 31, 2020, 2019 and 2018, are as follows:
| | | | | | | | | | | | | | | | | | | | | | | | | | | | | | | | | | | | | | | | | | | | | | | | | | | | | |
| Qualified
Pension Benefits | | Nonqualified
Pension Benefits | | Other Benefits |
| | 2020 | | 2019 | | 2018 | | 2020 | | 2019 | | 2018 | | 2020 | | 2019 | | 2018 |
| | (Dollars in thousands) |
| Components of net periodic benefit costs: | | | | | | | | | | | | | | | | | |
| Service cost | $ | 42,151 | | | $ | 38,592 | | | $ | 39,677 | | | $ | 405 | | | $ | 311 | | | $ | 548 | | | $ | 1,050 | | | $ | 1,053 | | | $ | 943 | |
| Interest cost | 21,722 | | | 28,396 | | | 24,007 | | | 429 | | | 747 | | | 711 | | | 747 | | | 1,094 | | | 908 | |
| Expected return on assets | (46,684) | | | (44,968) | | | (48,159) | | | 0 | | | 0 | | | 0 | | | 0 | | | 0 | | | 0 | |
| Settlement of retiree obligations | 0 | | | 51 | | | 0 | | | 0 | | | 191 | | | (112) | | | 0 | | | 0 | | | 0 | |
| Prior service cost (credit) amortization | 178 | | | 190 | | | 1,437 | | | (114) | | | (75) | | | 30 | | | (445) | | | (556) | | | (565) | |
| Actuarial loss (gain) amortization | 21,583 | | | 12,348 | | | 18,073 | | | 98 | | | 2 | | | 61 | | | (1,392) | | | (1,627) | | | (1,224) | |
| | | | | | | | | | | | | | | | | |
| Net periodic benefit cost (benefit) | $ | 38,950 | | | $ | 34,609 | | | $ | 35,035 | | | $ | 818 | | | $ | 1,176 | | | $ | 1,238 | | | $ | (40) | | | $ | (36) | | | $ | 62 | |
| Weighted-average assumptions to determine the net periodic benefit cost: | | | | | | | | | | | | | | | | | |
| Discount rate | 3.06 | % | | 4.23 | % | | 3.80 | % | | 2.70 | % | | 4.09 | % | | 3.53 | % | | 2.89 | % | | 4.08 | % | | 3.56 | % |
| Expected return on plan assets | 5.50 | % | | 5.50 | % | | 5.75 | % | | N/A | | N/A | | N/A | | N/A | | N/A | | N/A |
| Rate of compensation increase | 5.28 | % | | 5.14 | % | | 5.08 | % | | 5.28 | % | | 5.14 | % | | 5.08 | % | | N/A | | N/A | | N/A |
| Weighted-average assumptions to determine the benefit obligations: | | | | | | | | | | | | | | | | | |
| Discount rate | 2.67 | % | | 3.06 | % | | 4.23 | % | | 2.15 | % | | 2.70 | % | | 4.09 | % | | 2.43 | % | | 2.89 | % | | 4.13 | % |
| Rate of compensation increase | 4.99 | % | | 5.28 | % | | 5.14 | % | | 4.99 | % | | 5.28 | % | | 5.14 | % | | N/A | | N/A | | N/A |
Components of net periodic benefit costs and amounts recognized in other comprehensive loss (income) for the years ended August 31, 2020, 2019 and 2018, are as follows:
| | | | | | | | | | | | | | | | | | | | | | | | | | | | | | | | | | | | | | | | | | | | | | | | | | | | | |
| Qualified
Pension Benefits | | Nonqualified
Pension Benefits | | Other Benefits |
| | 2020 | | 2019 | | 2018 | | 2020 | | 2019 | | 2018 | | 2020 | | 2019 | | 2018 |
| | (Dollars in thousands) |
| Other comprehensive loss (income): | | | | | | | | | | | | | | | | | |
| Prior service cost | $ | 0 | | | $ | 18 | | | $ | 244 | | | $ | 0 | | | $ | 0 | | | $ | 0 | | | $ | 0 | | | $ | 0 | | | $ | 0 | |
| Net actuarial loss (gain) | 3,401 | | | 47,556 | | | (8,553) | | | 2,157 | | | 1,917 | | | (578) | | | (1,011) | | | 801 | | | (2,234) | |
| Amortization of actuarial (gain) loss | (21,583) | | | (12,307) | | | (18,073) | | | (98) | | | (2) | | | (61) | | | 1,392 | | | 1,627 | | | 1,224 | |
| Amortization of prior service (credit) costs | (178) | | | (190) | | | (1,437) | | | 114 | | | 75 | | | (30) | | | 445 | | | 556 | | | 565 | |
| Settlement of retiree obligations (a) | 0 | | | 0 | | | 0 | | | (397) | | | (191) | | | 112 | | | 0 | | | 0 | | | 0 | |
| | | | | | | | | | | | | | | | | |
| Total recognized in other comprehensive loss (income) | $ | (18,360) | | | $ | 35,077 | | | $ | (27,819) | | | $ | 1,776 | | | $ | 1,799 | | | $ | (557) | | | $ | 826 | | | $ | 2,984 | | | $ | (445) | |
(a) Reflects amounts reclassified from accumulated other comprehensive loss (income) to net earnings.
Estimated amortization in fiscal 2021 from accumulated other comprehensive loss into net periodic benefit cost is as follows:
| | | | | | | | | | | | | | | | | |
| Qualified
Pension Benefits | | Nonqualified
Pension Benefits | | Other
Benefits |
| | (Dollars in thousands) |
| Amortization of prior service cost (credit) | $ | 178 | | | $ | (114) | | | $ | (445) | |
| Amortization of actuarial loss (gain) | 21,790 | | | 212 | | | (1,365) | |
A significant assumption for pension plan accountingcosts and obligations is the discount rate. We utilize a full-yield curve approach by applying the specific spot rates along the yield curve used in the determination of the benefit obligation to the relevant projected cash flows. The discount rate reflects the rate at which the associated benefits could be effectively settled as of the measurement date. In estimating this rate, we look at rates of return on fixed-income investments of similar duration to the liabilities in the plans that receive high investment-grade ratings by recognized ratings agencies.
Components of net periodic benefit costs for the years ended August 31, 2019, 2018 and 2017, are as follows:
|
| | | | | | | | | | | | | | | | | | | | | | | | | | | | | | | | | | | |
| | Qualified Pension Benefits | | Non-Qualified Pension Benefits | | Other Benefits |
| | 2019 | | 2018 | | 2017 | | 2019 | | 2018 | | 2017 | | 2019 | | 2018 | | 2017 |
| | (Dollars in thousands) |
| Components of net periodic benefit costs: | |
| | |
| | |
| | |
| | |
| | |
| | |
| | |
| | |
|
| Service cost | $ | 38,592 |
| | $ | 39,677 |
| | $ | 42,149 |
| | $ | 311 |
| | $ | 548 |
| | $ | 1,206 |
| | $ | 1,053 |
| | $ | 943 |
| | $ | 1,160 |
|
| Interest cost | 28,396 |
| | 24,007 |
| | 22,999 |
| | 747 |
| | 711 |
| | 843 |
| | 1,094 |
| | 908 |
| | 930 |
|
| Expected return on assets | (44,968 | ) | | (48,159 | ) | | (48,235 | ) | | — |
| | — |
| | — |
| | — |
| | — |
| | — |
|
| Settlement of retiree obligations | 51 |
| | — |
| | — |
| | 191 |
| | (112 | ) | | (30 | ) | | — |
| | — |
| | — |
|
| Prior service cost (credit) amortization | 190 |
| | 1,437 |
| | 1,540 |
| | (75 | ) | | 30 |
| | 19 |
| | (556 | ) | | (565 | ) | | (565 | ) |
| Actuarial loss (gain) amortization | 12,348 |
| | 18,073 |
| | 22,869 |
| | 2 |
| | 61 |
| | 546 |
| | (1,627 | ) | | (1,224 | ) | | (798 | ) |
| Net periodic benefit cost (benefit) | $ | 34,609 |
| | $ | 35,035 |
| | $ | 41,322 |
| | $ | 1,176 |
| | $ | 1,238 |
| | $ | 2,584 |
| | $ | (36 | ) | | $ | 62 |
| | $ | 727 |
|
| Weighted-average assumptions to determine the net periodic benefit cost: | |
| | |
| | |
| | |
| | |
| | |
| | |
| | |
| | |
|
| Discount rate | 4.23 | % | | 3.80 | % | | 3.60 | % | | 4.09 | % | | 3.53 | % | | 3.28 | % | | 4.08 | % | | 3.56 | % | | 3.30 | % |
| Expected return on plan assets | 5.50 | % | | 5.75 | % | | 5.75 | % | | N/A |
| | N/A |
| | N/A |
| | N/A |
| | N/A |
| | N/A |
|
| Rate of compensation increase | 5.14 | % | | 5.08 | % | | 5.60 | % | | 5.14 | % | | 5.08 | % | | 5.60 | % | | N/A |
| | N/A |
| | N/A |
|
| Weighted-average assumptions to determine the benefit obligations: | |
| | |
| | |
| | |
| | |
| | |
| | |
| | |
| | |
|
| Discount rate | 3.06 | % | | 4.23 | % | | 3.80 | % | | 2.70 | % | | 4.09 | % | | 3.53 | % | | 2.89 | % | | 4.13 | % | | 3.56 | % |
| Rate of compensation increase | 5.28 | % | | 5.14 | % | | 5.08 | % | | 5.28 | % | | 5.14 | % | | 5.08 | % | | N/A |
| | N/A |
| | N/A |
|
Components of net periodic benefit costs and amounts recognized in other comprehensive income (loss) for the years ended August 31, 2019, 2018 and 2017, are as follows:
|
| | | | | | | | | | | | | | | | | | | | | | | | | | | | | | | | | | | |
| | Qualified Pension Benefits | | Non-Qualified Pension Benefits | | Other Benefits |
| | 2019 | | 2018 | | 2017 | | 2019 | | 2018 | | 2017 | | 2019 | | 2018 | | 2017 |
| | (Dollars in thousands) |
| Other comprehensive income (loss): | |
| | |
| | |
| | |
| | |
| | |
| | |
| | |
| | |
|
| Prior service cost (credit) | $ | 18 |
| | $ | 244 |
| | $ | — |
| | $ | — |
| | $ | — |
| | $ | — |
| | $ | — |
| | $ | — |
| | $ | — |
|
| Net actuarial loss (gain) | 47,556 |
| | (8,553 | ) | | (16,044 | ) | | 1,917 |
| | (578 | ) | | (6,345 | ) | | 801 |
| | (2,234 | ) | | (5,427 | ) |
| Amortization of actuarial loss (gain) | (12,307 | ) | | (18,073 | ) | | (22,869 | ) | | (2 | ) | | (61 | ) | | (546 | ) | | 1,627 |
| | 1,224 |
| | 798 |
|
| Amortization of prior service costs (credit) | (190 | ) | | (1,437 | ) | | (1,540 | ) | | 75 |
| | (30 | ) | | (19 | ) | | 556 |
| | 565 |
| | 565 |
|
| Settlement of retiree obligations (a) | — |
| | — |
| | — |
| | (191 | ) | | 112 |
| | 30 |
| | — |
| | — |
| | — |
|
| Total recognized in other comprehensive income | $ | 35,077 |
| | $ | (27,819 | ) | | $ | (40,453 | ) | | $ | 1,799 |
| | $ | (557 | ) | | $ | (6,880 | ) | | $ | 2,984 |
| | $ | (445 | ) | | $ | (4,064 | ) |
(a) Reflects amounts reclassified from accumulated other comprehensive income (loss) to net earnings.
Estimated amortization in fiscal 2020 from accumulated other comprehensive loss into net periodic benefit cost is as follows:
|
| | | | | | | | | | | |
| | Qualified Pension Benefits | | Non-Qualified Pension Benefits | | Other Benefits |
| | (Dollars in thousands) |
| Amortization of prior service cost (credit) | $ | 178 |
| | $ | (114 | ) | | $ | (556 | ) |
| Amortization of actuarial (gain) loss | 21,583 |
| | 98 |
| | (1,392 | ) |
For measurement purposes, a 7.1% annual rate of increase in the per capita cost of covered health care benefits was assumed for the year ended August 31, 2019.2020. The rate was assumed to decrease gradually to 4.5% by 2027 and remain at that level thereafter.
An annual analysis of the risk versus the return of the investment portfolio is conducted to justify the expected long-term rate of return assumption. We generally use long-term historical return information for the targeted asset mix identified in asset and liability studies. Adjustments are made to the expected long-term rate of return assumption, when deemed necessary, based upon revised expectations of future investment performance of the overall investment markets.
Assumed health care cost trend rates have a significant effect on the amounts reported for the health care plans. A one-percentage-point change in the assumed health care cost trend rates would have the following effects:
| | | | | | | | | | | |
| 1% Increase | | 1% Decrease |
| | (Dollars in thousands) |
| Effect on total of service and interest cost components | $ | 200 | | | $ | (170) | |
| Effect on postretirement benefit obligation | 2,100 | | | (1,800) | |
|
| | | | | | | |
| | 1% Increase | | 1% Decrease |
| | (Dollars in thousands) |
| Effect on total of service and interest cost components | $ | 200 |
| | $ | (170 | ) |
| Effect on postretirement benefit obligation | 2,000 |
| | (1,700 | ) |
We provide defined life insurance and health care benefits for certain retired employees and Board of Directors participants. The plan is contributory based on years of service and family status, with retiree contributions adjusted annually.
Contributions depend primarily on market returns on the pension plan assets and minimum funding level requirements. During fiscal 2019,2020, we made a discretionary contribution of $40.0$46.4 million to the pension plans. Based on the funded status of the qualified pension plans as of August 31, 2019,2020, we do not believe we will be required to contribute to these plans in fiscal 2020,2021, although we may voluntarily elect to do so. We expect to pay $3.6$3.8 million to participants of the non-qualifiednonqualified pension and postretirement benefit plans during fiscal 2020.2021.
Our retiree benefit payments, which reflect expected future service, are anticipated to be paid as follows:
| | | | | | | | | | | | | | | | | | | |
| | Qualified
Pension Benefits | | Nonqualified
Pension Benefits | | Other Benefits | | |
| | (Dollars in thousands) |
| 2021 | $ | 75,700 | | | $ | 1,660 | | | $ | 2,090 | | | |
| 2022 | 65,900 | | | 1,840 | | | 2,280 | | | |
| 2023 | 63,500 | | | 1,840 | | | 2,470 | | | |
| 2024 | 64,700 | | | 1,620 | | | 2,450 | | | |
| 2025 | 65,300 | | | 1,820 | | | 2,450 | | | |
| 2026-2030 | 326,700 | | | 8,010 | | | 9,790 | | | |
|
| | | | | | | | | | | |
| | Qualified Pension Benefits | | Non-Qualified Pension Benefits | | Other Benefits |
| | (Dollars in thousands) |
| 2020 | $ | 72,600 |
| | $ | 1,580 |
| | $ | 2,040 |
|
| 2021 | 64,900 |
| | 1,370 |
| | 2,180 |
|
| 2022 | 61,900 |
| | 1,940 |
| | 2,410 |
|
| 2023 | 63,900 |
| | 1,950 |
| | 2,540 |
|
| 2024 | 65,000 |
| | 2,030 |
| | 2,520 |
|
| 2025-2029 | 326,100 |
| | 8,840 |
| | 11,110 |
|
We have trusts that hold the assets for the defined benefit plans. CHS has a qualified plan committee that sets investment guidelines with the assistance of external consultants. Investment objectives for the plans' assets are as follows:
optimization•Optimization of the long-term returns on plan assets at an acceptable level of risk;
maintenance•Maintenance of broad diversification across asset classes and among investment managers; and
focus•Focus on long-term return objectives.
Asset allocation targets promote optimal expected return and volatility characteristics given the long-term time horizon for fulfilling the obligations of the pension plans. The investment portfolio contains a diversified portfolio of investment categories, including equities, fixed-income securities and real estate. Securities are also diversified in terms of domestic and international securities, short- and long-term securities, growth and value equities, large and small cap stocks, as well as active and passive management styles. Our pension plans' investment policy strategy is such that liabilities match assets. This is being accomplished through the asset portfolio mix by reducing volatility and de-risking the plans. The plans' target allocation percentages range between 45% and 65% for fixed income securities and range between 35% and 55% for equity securities. An annual analysis of the risk versus the return of the investment portfolio is conducted to justify the expected long-term rate of return assumption. We generally use long-term historical return information for the targeted asset mix identified in asset and liability studies. Adjustments are made to the expected long-term rate of return assumption, when deemed necessary, based upon revised expectations of future investment performance of the overall investment markets.
The discount rate reflects the rate at which the associated benefits could be effectively settled as of the measurement date. In estimating this rate, we look at rates of return on fixed-income investments of similar duration to the liabilities in the plans that receive high investment-grade ratings by recognized ratings agencies.
The qualified plan committee believes that with prudent risk tolerance and asset diversification, the plans should be able to meet pension obligations in the future.
Our pension plans’plans' recurring fair value measurements by asset category at August 31, 20192020 and 2018,2019, are presented in the tables below:
| | | | | | | | | | | | | | | | | | | | | | | |
| | 2020 |
| | Level 1 | | Level 2 | | Level 3 | | Total |
| | (Dollars in thousands) |
| Cash and cash equivalents | $ | 57,801 | | | $ | 0 | | | $ | 0 | | | $ | 57,801 | |
| Equities: | | | | | | | |
| | | | | | | |
Common/collective trust at net asset value (1) | 0 | | | 0 | | | 0 | | | 219,050 | |
| Fixed income securities: | | | | | | | |
| | | | | | | |
Common/collective trust at net asset value (1) | 0 | | | 0 | | | 0 | | | 603,250 | |
Partnership and joint venture interests measured at net asset value (1) | 0 | | | 0 | | | 0 | | | 94,400 | |
Other assets measured at net asset value (1) | 0 | | | 0 | | | 0 | | | 2,041 | |
| Total | $ | 57,801 | | | $ | 0 | | | $ | 0 | | | $ | 976,542 | |
|
| | | | | | | | | | | | | | | |
| | 2019 |
| | Level 1 | | Level 2 | | Level 3 | | Total |
| | (Dollars in thousands) |
| Cash and cash equivalents | $ | 7,938 |
| | $ | — |
| | $ | — |
| | $ | 7,938 |
|
| Equities: | |
| | |
| | |
| | |
|
Common/collective trust at net asset value (1) | — |
| | — |
| | — |
| | 209,860 |
|
| Fixed income securities: | |
| | |
| | |
| | |
|
Common/collective trust at net asset value (1) | — |
| | — |
| | — |
| | 574,296 |
|
Partnership and joint venture interests measured at net asset value (1) | — |
| | — |
| | — |
| | 101,641 |
|
Other assets measured at net asset value (1) | — |
| | — |
| | — |
| | 15,692 |
|
| Total | $ | 7,938 |
| | $ | — |
| | $ | — |
| | $ | 909,427 |
|
| | | | | | | | | | | | | | | | | | | | | | | |
| | 2019 |
| | Level 1 | | Level 2 | | Level 3 | | Total |
| | (Dollars in thousands) |
| Cash and cash equivalents | $ | 7,938 | | | $ | 0 | | | $ | 0 | | | $ | 7,938 | |
| Equities: | | | | | | | |
Common/collective trust at net asset value (1) | 0 | | | 0 | | | 0 | | | 209,860 | |
| Fixed income securities: | | | | | | | |
| | | | | | | |
Common/collective trust at net asset value (1) | 0 | | | 0�� | | | 0 | | | 574,296 | |
Partnership and joint venture interests measured at net asset value (1) | 0 | | | 0 | | | 0 | | | 101,641 | |
Other assets measured at net asset value (1) | 0 | | | 0 | | | 0 | | | 15,692 | |
| Total | $ | 7,938 | | | $ | 0 | | | $ | 0 | | | $ | 909,427 | |
|
| | | | | | | | | | | | | | | |
| | 2018 |
| | Level 1 | | Level 2 | | Level 3 | | Total |
| | (Dollars in thousands) |
| Cash and cash equivalents | $ | 7,424 |
| | $ | — |
| | $ | — |
| | $ | 7,424 |
|
| Equities: | |
| | |
| | |
| | |
|
| Mutual funds | 692 |
| | — |
| | — |
| | 692 |
|
Common/collective trust at net asset value (1) | — |
| | — |
| | — |
| | 216,962 |
|
| Fixed income securities: | |
| | |
| | |
| | |
|
Common/collective trust at net asset value (1) | — |
| | — |
| | — |
| | 500,637 |
|
Partnership and joint venture interests measured at net asset value (1) | — |
| | — |
| | — |
| | 101,954 |
|
Other assets measured at net asset value (1) | — |
| | — |
| | — |
| | 1,947 |
|
| Total | $ | 8,116 |
| | $ | — |
| | $ | — |
| | $ | 829,616 |
|
(1)In accordance with ASC Topic 820-10, Fair Value Measurement, certain assets that are measured at fair value using the net asset value per share (or its equivalent) practical expedient have not been categorized in the fair value hierarchy. The fair value amounts presented in the tables above are intended to permit reconciliation of the fair value hierarchy to the amounts presented in the statement of net assets.
Definitions for valuation levels are found in Note 14, 16, Fair Value Measurements. We use the following valuation methodologies for assets measured at fair value.
Mutual funds. Valued at quoted market prices, which are based on the net asset value of shares held by the plan at year-end. Mutual funds traded in active markets are classified within Level 1 of the fair value hierarchy. Mutual funds measured at fair value using the net asset value per share practical expedient have not been categorized in the fair value hierarchy in accordance with ASC Topic 820-10, Fair Value Measurement.
Common/collective trusts. Common/collective trusts primarily consist of equity and fixed income funds and are valued using other significant observable inputs (including quoted prices for similar investments, interest rates, prepayment speeds, credit risks, referenced indices, quoted prices in inactive markets, adjusted quoted prices in active markets, adjusted quoted prices on foreign equity securities that were adjusted in accordance with pricing procedures approved by the trust, etc.). Common/collective trust investments can be redeemed daily and without restriction. Redemption of the entire investment balance generally requires a 45- to 60-day notice period. The equity funds provide exposure to large, mid and small cap U.S. equities, international large and small cap equities and emerging market equities. The fixed income funds provide exposure to U.S., international and emerging market debt securities.
Partnership and joint venture interests. Valued at the net asset value of shares held by the plan at year-end as a practical expedient for fair value. The net asset value is based on the fair value of the underlying assets owned by the trust, minus its liabilities, then divided by the number of units outstanding. Redemptions of these interests generally require a 45- to 60-day notice period.
Other assets. Other assets primarily include real estate funds and hedge funds held in the asset portfolio of our U.S. defined benefit pension plans.
We are one of approximately 400 employers that contribute to the Co-op Retirement Plan ("Co-op Plan"), which is a defined benefit plan constituting a "multiple employer plan" under the Internal Revenue Code of 1986, as amended, and a "multiemployer
"multiemployer plan" under the accounting standards. The risks of participating in these multiemployer plans are different from single-employer plans in the following aspects:
•Assets contributed to the multiemployer plan by one employer may be used to provide benefits to employees of other participating employers;
•If a participating employer stops contributing to the plan, the unfunded obligations of the plan may be borne by the remaining participating employers; and
•If we choose to stop participating in the multiemployer plan, we may be required to pay the plan an amount based on the underfunded status of the plan, referred to as a withdrawal liability. The withdrawal liability associated with the multiemployer plan was approximately $46.0 million as of August 31, 2020.
Our participation in the Co-op Plan for the years ended August 31, 2020, 2019, 2018 and 2017,2018, is outlined in the table below:
| | | | | | | | | | | | | | | | | | | | | | | | | | | | | | | | | | | | | | |
| | | | Contributions of CHS | | | | |
| | | | (Dollars in thousands) | | | | |
| Plan Name | | EIN/Plan Number | | 2020 | | 2019 | | 2018 | | Surcharge Imposed | | Expiration Date of Collective Bargaining Agreement |
| Co-op Retirement Plan | | 01-0689331 / 001 | | $ | 1,455 | | | $ | 1,712 | | | $ | 1,662 | | | N/A | | N/A |
|
| | | | | | | | | | | | | | | | | | |
| | | | | Contributions of CHS | | | | |
| | | | | (Dollars in thousands) | | | | |
| Plan Name | | EIN/Plan Number | | 2019 | | 2018 | | 2017 | | Surcharge Imposed | | Expiration Date of Collective Bargaining Agreement |
| Co-op Retirement Plan | | 01-0689331 / 001 | | $ | 1,712 |
| | $ | 1,662 |
| | $ | 1,653 |
| | N/A | | N/A |
Our contributions for the years stated above did not represent more than 5% of total contributions to the Co-op Plan as indicated in the Co-op Plan's most recently available annual report (Form 5500).
Provisions of the Pension Protection Act of 2006 ("PPA") do not apply to the Co-op Plan because there is a special exemption for cooperative plans if the plan is maintained by more than one employer and at least 85% of the employers are rural cooperatives or cooperative organizations owned by agricultural producers. In the Co-op Plan, a "zone status" determination is not required, and therefore not determined. In addition, the accumulated benefit obligations and plan assets are not determined or allocated separately by individual employers. The most recent financial statements available in 20192020 and 20182019 are for the Co-op Plan's year-end at March 31, 20192020 and 2018,2019, respectively. In total, the Co-op Plan was at least 80% funded on those dates based on the total plan assets and accumulated benefit obligations.
Because the provisions of the PPA do not apply to the Co-op Plan, funding improvement plans and surcharges are not applicable. Future contribution requirements are determined each year as part of the actuarial valuation of the plan and may change as a result of plan experience.
In addition to the contributions to the Co-op Plan listed above, total contributions to individually insignificant multi-employer pension plans were immaterial in fiscal 2020, 2019, 2018 and 2017.2018.
We have other contributory defined contribution plans covering substantially all employees. Total contributions by us to these plans were $34.5 million, $31.0 million $24.7 million and $19.9$24.7 million, for the years ended August 31, 2020, 2019 2018 and 2017,2018, respectively.
Note 1214 Segment Reporting
We are an integrated agricultural enterprise, providing grain, foods and energy resources to businesses and consumers on a global basis. We provide a wide variety of products and services, from initial agricultural inputs such as fuels, farm supplies, crop nutrients and crop protection products, to agricultural outputs that include grains and oilseeds, grain and oilseed processing and food products, and the production and marketing of ethanol. We define our operating segments in accordance with ASC Topic 280, Segment Reporting, to reflect the manner in which our chief operating decision maker, our Chief Executive Officer, evaluates performance and allocates resources in managing the business. We have aggregated those operating segments into three3 reportable segments: Energy, Ag and Nitrogen Production.
Our Energy segment produces and provides primarily for the wholesale distribution of petroleum products and transportation of those products. Our Ag segment purchases and further processes or resells grains and oilseeds originated by our country operations business, by our member cooperatives and by third parties; serves as a wholesaler and retailer of crop inputs; and produces and markets ethanol. Our Nitrogen Production segment consists solely of our equity method investment in CF Nitrogen, which entitles us, pursuant to a supply agreement that we entered with CF Nitrogen, to purchase up to a specified quantity of granular urea and UAN annually from CF Nitrogen. Corporate and Other represents our financing and hedging
businesses, which primarily consists of a U.S. Commodity Futures Trading Commission-regulated futures commission merchant for commodities hedging, financial services related to crop production, and insurance which was disposed of in May 2018. Our non-consolidatednonconsolidated investments in Ventura Foods and Ardent Mills are also included in our Corporate and Other category.
Corporate administrative expenses and interest are allocated to each businessreportable segment, andalong with Corporate and Other, based on direct usageuse for services, that can be tracked, such as information technology and legal, and other factors or considerations relevant to the costs incurred.
Many of our business activities are highly seasonal and operating results vary throughout the year. For example, in our Ag segment, our country operations business generally experiences higher volumes and income during the spring planting season and during the fall harvest season and our agronomy business generally experiences higher volumes and income during the spring planting season. Our global grain marketing operations are also subject to fluctuations in volume and earnings based on producer harvests, world grain prices and demand. Our Energy segment generally experiences higher volumes and profitability in certain operating areas, such as refined products, in the summer and early fall when gasoline and diesel fuel usage is highest and is subject to global supply and demand forces. Other energy products, such as propane, may experience higher volumes and profitability during the winter heating and crop-drying seasons.
Our revenues, assets and cash flows can be significantly affected by global market prices for commodities such as petroleum products, natural gas, grains, oilseeds, crop nutrients and flour. Changes in market prices for commodities that we purchase without a corresponding change in the selling prices of those products can affect revenues and operating earnings. Commodity prices are affected by a wide range of factors beyond our control, including the weather, crop damage due to plant disease or insects, drought, availability and adequacy of supply, availability of a reliable rail and river transportation network, outbreaks of disease, government regulations and policies, world events,global trade disputes, and general political and economic conditions.
While our revenues and operating results are derived primarily from businesses and operations that are wholly-owned or subsidiaries and limited liability companies in which we have a controlling interest, a portion of our business operations are conducted through companies in which we hold ownership interests of 50% or less or do not control the operations. We account for these investments primarily using the equity method of accounting, wherein we record our proportionate share of income or loss reported by the entity as equity income from investments, without consolidating the revenues and expenses of the entity in our Consolidated Statements of Operations. In our Nitrogen Production segment, this consists of our approximate 10% membership interest (based on product tons) in CF Nitrogen. In Corporate and Other, this principally includes our 50% ownership in Ventura Foods and our 12% ownership in Ardent Mills. See Note 5, 6, Investments, for more information related to CF Nitrogen, Ventura Foods and Ardent Mills.
Reconciling amounts represent the elimination of revenues between segments. Such transactions are executed at market prices to more accurately evaluate the profitability of the individual business segments.
Segment information for the years ended August 31, 2020, 2019 2018 and 20172018 is presented in the tables below. The fiscal 2020 and fiscal 2019 results for our Ag segment include results associated with our acquisition of the remaining 75% ownership interest in WCD that we did not previously own on March 1, 2019, which were not included in our prior periodfiscal 2018 results. Refer to further details related to our acquisition of the remaining 75% ownership interest in WCD that we did not previously own within Note 18, 20, Acquisitions.
| | | | | | | | | | | | | | | | | | | | | | | | | | | | | | | | | | | |
| Energy | | Ag | | Nitrogen Production | | Corporate
and Other | | Reconciling
Amounts | | Total |
| | (Dollars in thousands) |
| For the year ended August 31, 2020 | | | | | | | | | | | |
| Revenues, including intersegment revenues | $ | 5,820,154 | | | $ | 22,940,712 | | | $ | 0 | | | $ | 55,567 | | | $ | (410,068) | | | $ | 28,406,365 | |
| Intersegment revenues | (389,020) | | | (14,613) | | | 0 | | | (6,435) | | | 410,068 | | | 0 | |
| Revenues, net of intersegment revenues | $ | 5,431,134 | | | $ | 22,926,099 | | | $ | 0 | | | $ | 49,132 | | | $ | 0 | | | $ | 28,406,365 | |
| Operating earnings (loss) | 219,861 | | | 82,543 | | | (33,497) | | | 8,358 | | | 0 | | | 277,265 | |
| Gain on disposal of business | 0 | | | (211) | | | 0 | | | (1,239) | | | 0 | | | (1,450) | |
| | | | | | | | | | | |
| Interest expense | 308 | | | 71,682 | | | 45,255 | | | 11,806 | | | (12,074) | | | 116,977 | |
| Other income | (3,005) | | | (35,349) | | | (2,635) | | | (9,510) | | | 12,074 | | | (38,425) | |
| Equity income from investments | (2,759) | | | (7,303) | | | (127,954) | | | (48,699) | | | 0 | | | (186,715) | |
| Income before income taxes | $ | 225,317 | | | $ | 53,724 | | | $ | 51,837 | | | $ | 56,000 | | | $ | 0 | | | $ | 386,878 | |
| | | | | | | | | | | |
| Capital expenditures | 175,169 | | | 158,903 | | | 0 | | | 84,287 | | | 0 | | | 418,359 | |
| Depreciation and amortization | 245,983 | | | 196,510 | | | 0 | | | 34,882 | | | 0 | | | 477,375 | |
| Total assets as of August 31, 2020 | 4,447,526 | | | 6,325,857 | | | 2,681,616 | | | 2,538,948 | | | 0 | | | 15,993,947 | |
| | | | | | | | | | | | | | | | | | | | | | | | | | | | | | | | | | | |
| Energy | | Ag | | Nitrogen Production | | Corporate
and Other | | Reconciling
Amounts | | Total |
| (Dollars in thousands) |
| For the year ended August 31, 2019 | | | | | | | | | | | |
| Revenues, including intersegment revenues | $ | 7,581,450 | | | $ | 24,736,425 | | | $ | 0 | | | $ | 68,710 | | | $ | (486,132) | | | $ | 31,900,453 | |
| Intersegment revenues | (462,374) | | | (16,353) | | | 0 | | | (7,405) | | | 486,132 | | | 0 | |
| Revenues, net of intersegment revenues | $ | 7,119,076 | | | $ | 24,720,072 | | | $ | 0 | | | $ | 61,305 | | | $ | 0 | | | $ | 31,900,453 | |
| Operating earnings (loss) | 615,662 | | | 65,181 | | | (35,046) | | | 13,805 | | | 0 | | | 659,602 | |
| Gain on disposal of business | 0 | | | (3,886) | | | 0 | | | 0 | | | 0 | | | (3,886) | |
| Interest expense | 5,719 | | | 101,386 | | | 55,226 | | | 11,684 | | | (6,950) | | | 167,065 | |
| Other income | (5,548) | | | (70,888) | | | (2,769) | | | (10,168) | | | 6,950 | | | (82,423) | |
| Equity income from investments | (2,697) | | | (4,447) | | | (160,373) | | | (69,238) | | | 0 | | | (236,755) | |
| Income before income taxes | $ | 618,188 | | | $ | 43,016 | | | $ | 72,870 | | | $ | 81,527 | | | $ | 0 | | | $ | 815,601 | |
| | | | | | | | | | | |
| Capital expenditures | 268,877 | | | 110,197 | | | 0 | | | 64,142 | | | 0 | | | 443,216 | |
| Depreciation and amortization | 233,624 | | | 208,294 | | | 0 | | | 31,293 | | | 0 | | | 473,211 | |
| Total assets as of August 31, 2019 | 4,401,793 | | | 6,415,580 | | | 2,730,306 | | | 2,899,815 | | | 0 | | | 16,447,494 | |
|
| | | | | | | | | | | | | | | | | | | | | | | |
| | Energy | | Ag | | Nitrogen Production | | Corporate
and Other | | Reconciling
Amounts | | Total |
| | (Dollars in thousands) |
| For the year ended August 31, 2019: | |
| | |
| | | | |
| | |
| | |
|
| Revenues, including intersegment revenues | $ | 7,581,450 |
| | $ | 24,736,425 |
| | $ | — |
| | $ | 68,710 |
| | $ | (486,132 | ) | | $ | 31,900,453 |
|
| Operating earnings (loss) | 615,662 |
| | 65,181 |
| | (35,046 | ) | | 13,805 |
| | — |
| | 659,602 |
|
| (Gain) loss on disposal of business | — |
| | (3,886 | ) | | — |
| | — |
| | — |
| | (3,886 | ) |
| Interest expense | 5,719 |
| | 101,386 |
| | 55,226 |
| | 11,684 |
| | (6,950 | ) | | 167,065 |
|
| Other (income) loss | (5,548 | ) | | (70,888 | ) | | (2,769 | ) | | (10,168 | ) | | 6,950 |
| | (82,423 | ) |
| Equity (income) loss from investments | (2,697 | ) | | (4,447 | ) | | (160,373 | ) | | (69,238 | ) | | — |
| | (236,755 | ) |
| Income (loss) before income taxes | $ | 618,188 |
| | $ | 43,016 |
| | $ | 72,870 |
| | $ | 81,527 |
| | $ | — |
| | $ | 815,601 |
|
| | | | | | | | | | | | |
| Intersegment revenues | $ | (462,374 | ) | | $ | (16,353 | ) | | $ | — |
| | $ | (7,405 | ) | | $ | 486,132 |
| | $ | — |
|
| Capital expenditures | 268,877 |
| | 110,197 |
| | — |
| | 64,142 |
| | — |
| | 443,216 |
|
| Depreciation and amortization | 233,624 |
| | 208,294 |
| | — |
| | 31,293 |
| | — |
| | 473,211 |
|
| Total assets as of August 31, 2019 | 4,401,793 |
| | 6,415,580 |
| | 2,730,306 |
| | 2,899,815 |
| | — |
| | 16,447,494 |
|
|
| | | | | | | | | | | | | | | | | | | | | | | |
| | Energy | | Ag | | Nitrogen Production | | Corporate
and Other | | Reconciling
Amounts | | Total |
| | (Dollars in thousands) |
| For the year ended August 31, 2018: | | | | | | | | | | | |
| Revenues, including intersegment revenues | $ | 8,068,717 |
| | $ | 25,052,395 |
| | $ | — |
| | $ | 64,516 |
| | $ | (502,281 | ) | | $ | 32,683,347 |
|
| Operating earnings (loss) | 388,112 |
| | 93,728 |
| | (20,619 | ) | | (8,857 | ) | | — |
| | 452,364 |
|
| (Gain) loss on disposal of business | (65,862 | ) | | (7,707 | ) | | — |
| | (58,247 | ) | | — |
| | (131,816 | ) |
| Interest expense | 14,627 |
| | 94,256 |
| | 50,499 |
| | (7,712 | ) | | (2,468 | ) | | 149,202 |
|
| Other (income) loss | (9,698 | ) | | (68,471 | ) | | (3,061 | ) | | (3,975 | ) | | 2,468 |
| | (82,737 | ) |
| Equity (income) loss from investments | (3,063 | ) | | 1,392 |
| | (106,895 | ) | | (44,949 | ) | | — |
| | (153,515 | ) |
| Income (loss) before income taxes | $ | 452,108 |
| | $ | 74,258 |
| | $ | 38,838 |
| | $ | 106,026 |
| | $ | — |
| | $ | 671,230 |
|
| | | | | | | | | | | | |
| Intersegment revenues | $ | (479,598 | ) | | $ | (14,914 | ) | | $ | — |
| | $ | (7,769 | ) | | $ | 502,281 |
| | $ | — |
|
| Capital expenditures | 248,207 |
| | 77,962 |
| | — |
| | 29,243 |
| | — |
| | 355,412 |
|
| Depreciation and amortization | 230,230 |
| | 218,716 |
| | — |
| | 29,104 |
| | — |
| | 478,050 |
|
| Total assets as of August 31, 2018 | 4,168,239 |
| | 6,534,777 |
| | 2,758,668 |
| | 2,919,494 |
| | — |
| | 16,381,178 |
|
| | | | | | | | | | | | | | | | | | | | | | | | | | | | | | | | | | | |
| Energy | | Ag | | Nitrogen Production | | Corporate
and Other | | Reconciling
Amounts | | Total |
| (Dollars in thousands) |
| For the year ended August 31, 2018 | | | | | | | | | | | |
| Revenues, including intersegment revenues | $ | 8,068,717 | | | $ | 25,052,395 | | | $ | 0 | | | $ | 64,516 | | | $ | (502,281) | | | $ | 32,683,347 | |
| Intersegment revenues | (479,598) | | | (14,914) | | | 0 | | | (7,769) | | | 502,281 | | | 0 | |
| Revenues, net of intersegment revenues | $ | 7,589,119 | | | $ | 25,037,481 | | | $ | 0 | | | $ | 56,747 | | | $ | 0 | | | $ | 32,683,347 | |
| Operating earnings (loss) | 388,112 | | | 93,728 | | | (20,619) | | | (8,857) | | | 0 | | | 452,364 | |
| Gain on disposal of business | (65,862) | | | (7,707) | | | 0 | | | (58,247) | | | 0 | | | (131,816) | |
| Interest expense | 14,627 | | | 94,256 | | | 50,499 | | | (7,712) | | | (2,468) | | | 149,202 | |
| Other income | (9,698) | | | (68,471) | | | (3,061) | | | (3,975) | | | 2,468 | | | (82,737) | |
| Equity (income) loss from investments | (3,063) | | | 1,392 | | | (106,895) | | | (44,949) | | | 0 | | | (153,515) | |
| Income before income taxes | $ | 452,108 | | | $ | 74,258 | | | $ | 38,838 | | | $ | 106,026 | | | $ | 0 | | | $ | 671,230 | |
| | | | | | | | | | | |
| Capital expenditures | 248,207 | | | 77,962 | | | 0 | | | 29,243 | | | 0 | | | 355,412 | |
| Depreciation and amortization | 230,230 | | | 218,716 | | | 0 | | | 29,104 | | | 0 | | | 478,050 | |
|
| | | | | | | | | | | | | | | | | | | | | | | |
| | Energy | | Ag | | Nitrogen Production | | Corporate
and Other | | Reconciling
Amounts | | Total |
| | (Dollars in thousands) |
| For the year ended August 31, 2017: | | | | | | | | | | | |
| Revenues, including intersegment revenues | $ | 6,620,680 |
| | $ | 25,738,740 |
| | $ | — |
| | $ | 95,414 |
| | $ | (417,408 | ) | | $ | 32,037,426 |
|
| Operating earnings (loss) | 75,203 |
| | (268,884 | ) | | (18,430 | ) | | 38,233 |
| | — |
| | (173,878 | ) |
| (Gain) loss on disposal of business | — |
| | 2,190 |
| | — |
| | — |
| | — |
| | 2,190 |
|
| Interest expense | 18,365 |
| | 71,986 |
| | 48,893 |
| | 33,250 |
| | (1,255 | ) | | 171,239 |
|
| Other (income) loss | (1,099 | ) | | (65,622 | ) | | (30,534 | ) | | (3,803 | ) | | 1,255 |
| | (99,803 | ) |
| Equity (income) loss from investments | (3,181 | ) | | (7,277 | ) | | (66,530 | ) | | (60,350 | ) | | — |
| | (137,338 | ) |
| Income (loss) before income taxes | $ | 61,118 |
| | $ | (270,161 | ) | | $ | 29,741 |
| | $ | 69,136 |
| | $ | — |
| | $ | (110,166 | ) |
| | | | | | | | | | | | |
| Intersegment revenues | $ | (392,842 | ) | | $ | (20,312 | ) | | $ | — |
| | $ | (4,254 | ) | | $ | 417,408 |
| | $ | — |
|
| Capital expenditures | 260,543 |
| | 146,139 |
| | — |
| | 37,715 |
| | — |
| | 444,397 |
|
| Depreciation and amortization | 223,229 |
| | 232,443 |
| | — |
| | 24,551 |
| | — |
| | 480,223 |
|
We have international sales, which are predominantly in our Ag segment. The following table presents our sales, based on the geographic location of the subsidiary making the sale, for the years ended August 31, 2020, 2019, 2018 and 2017:2018:
| | | | 2019 | | 2018 | | 2017 | | 2020 | | 2019 | | 2018 |
| | (Dollars in thousands) | | (Dollars in thousands) |
North America (a) | $ | 27,896,269 |
| | $ | 29,475,724 |
| | $ | 29,068,842 |
| North America (a) | $ | 25,360,077 | | | $ | 27,896,269 | | | $ | 29,475,724 | |
| South America | 2,027,020 |
| | 1,569,330 |
| | 1,441,316 |
| South America | 1,559,380 | | | 2,027,020 | | | 1,569,330 | |
| Europe, Middle East and Africa (EMEA) | 895,472 |
| | 536,501 |
| | 652,308 |
| Europe, Middle East and Africa (EMEA) | 774,068 | | | 895,472 | | | 536,501 | |
| Asia Pacific (APAC) | 1,081,692 |
| | 1,101,792 |
| | 874,960 |
| Asia Pacific (APAC) | 712,840 | | | 1,081,692 | | | 1,101,792 | |
| Total | $ | 31,900,453 |
| | $ | 32,683,347 |
| | $ | 32,037,426 |
| Total | $ | 28,406,365 | | | $ | 31,900,453 | | | $ | 32,683,347 | |
(a) Revenues in North America are substantially all attributed to revenues from the United States.
Long-lived assets include our property, plant and equipment, capitalfinance lease assets and capitalized major maintenance costs. The following table presents long-lived assets by geographical region based on physical location:
| | | | | | | | | | | |
| 2020 | | 2019 |
| | (Dollars in thousands) |
| United States | $ | 5,121,315 | | | $ | 5,295,752 | |
| International | 65,134 | | | 79,846 | |
| Total | $ | 5,186,449 | | | $ | 5,375,598 | |
|
| | | | | | | |
| | 2019 | | 2018 |
| | (Dollars in thousands) |
| United States | $ | 5,295,752 |
| | $ | 5,185,572 |
|
| International | 79,846 |
| | 86,927 |
|
| Total | $ | 5,375,598 |
| | $ | 5,272,499 |
|
Note 1315 Derivative Financial Instruments and Hedging Activities
Our We enter into various derivative instruments to manage our exposure to movements primarily consist ofassociated with agricultural and energy commodity and forward contractsprices and, to a minorlesser degree, may include foreign currency exchange rates and interest rates. Except for certain interest rate swap contracts. These contractsswaps and certain pay-fixed, receive-variable, cash-settled swaps related to future crude oil purchases, which are accounted for as fair value hedges and cash flow hedges, respectively, our derivative instruments represent economic hedges of price risk but we do not applyfor which hedge accounting under ASC Topic 815 Derivatives and Hedging, except with respect to certain interest rate swap contracts that are accounted for as cash flow hedges and certain future crude oil purchases that are accounted for as cash flow hedges. Derivativeis not applied. Rather, the derivative instruments are recorded on our Consolidated Balance Sheets at fair value as describedwith changes in fair value being recorded directly to earnings, primarily within cost of goods sold in our Consolidated Statements of Operations. See Note 14, 16, Fair Value Measurements,.for additional information. The majority of our exchange traded agricultural commodity futures are settled daily through CHS Hedging, our wholly-owned futures commission merchant.
The following tables present the gross fair values of derivative assets, derivative liabilities and margin deposits (cash collateral) recorded on our Consolidated Balance Sheets, along with related amounts permitted to be offset in accordance with U.S. GAAP. WeAlthough we have certain netting arrangements for our exchange-traded futures and options contracts and certain
over-the-counter ("OTC") contracts, we have elected not to offsetreport our derivative assets and liabilities when we have the right of offsetinstruments on a gross basis on our Consolidated Balance Sheets under ASC Topic 210-20, Balance Sheet - Offsetting, or when the instruments are subject to master netting arrangements under ASC Topic 815-10-45, Derivatives and Hedging - Overall.
| | | | | | | | | | | | | | | | | | | | | | | |
| August 31, 2020 |
| | | Amounts Not Offset on the Consolidated Balance Sheet but Eligible for Offsetting | | |
| Gross Amounts Recognized | | Cash Collateral | | Derivative Instruments | | Net Amounts |
| | (Dollars in thousands) |
| Derivative Assets | | | | | | | |
| Commodity derivatives | $ | 327,493 | | | $ | — | | | $ | 2,980 | | | $ | 324,513 | |
| Foreign exchange derivatives | 11,809 | | | — | | | 9,385 | | | 2,424 | |
| | | | | | | |
| | | | | | | |
| Embedded derivative asset | 18,998 | | | — | | | 0 | | | 18,998 | |
| Total | $ | 358,300 | | | $ | — | | | $ | 12,365 | | | $ | 345,935 | |
| Derivative Liabilities | | | | | | | |
| Commodity derivatives | $ | 343,343 | | | $ | 956 | | | $ | 5,578 | | | $ | 336,809 | |
| Foreign exchange derivatives | 69,466 | | | 0 | | | 9,385 | | | 60,081 | |
| | | | | | | |
| | | | | | | |
| Total | $ | 412,809 | | | $ | 956 | | | $ | 14,963 | | | $ | 396,890 | |
|
| | | | | | | | | | | | | | | |
| | August 31, 2019 |
| | | | Amounts Not Offset on the Consolidated Balance Sheet but Eligible for Offsetting | | |
| | Gross Amounts Recognized | | Cash Collateral | | Derivative Instruments | | Net Amounts |
| | (Dollars in thousands) |
| Derivative Assets | | | | | | | |
| Commodity derivatives | $ | 215,030 |
| | $ | — |
| | $ | 58,726 |
| | $ | 156,304 |
|
| Foreign exchange derivatives | 10,334 |
| | — |
| | 7,108 |
| | 3,226 |
|
| Embedded derivative asset | 21,364 |
| | — |
| | — |
| | 21,364 |
|
| Total | $ | 246,728 |
| | $ | — |
| | $ | 65,834 |
| | $ | 180,894 |
|
| Derivative Liabilities | | | | | | | |
| Commodity derivatives | $ | 223,410 |
| | $ | 4,191 |
| | $ | 41,647 |
| | $ | 177,572 |
|
| Foreign exchange derivatives | 20,609 |
| | — |
| | 7,108 |
| | 13,501 |
|
| Total | $ | 244,019 |
| | $ | 4,191 |
| | $ | 48,755 |
| | $ | 191,073 |
|
| | | | | | | | | | | | | | | | | | | | | | | |
| August 31, 2019 |
| | | Amounts Not Offset on the Consolidated Balance Sheet but Eligible for Offsetting | | |
| Gross Amounts Recognized | | Cash Collateral | | Derivative Instruments | | Net Amounts |
| | (Dollars in thousands) |
| Derivative Assets | | | | | | | |
| Commodity derivatives | $ | 215,030 | | | $ | — | | | $ | 58,726 | | | $ | 156,304 | |
| Foreign exchange derivatives | 10,334 | | | — | | | 7,108 | | | 3,226 | |
| | | | | | | |
| | | | | | | |
| Embedded derivative asset | 21,364 | | | — | | | 0 | | | 21,364 | |
| Total | $ | 246,728 | | | $ | — | | | $ | 65,834 | | | $ | 180,894 | |
| Derivative Liabilities | | | | | | | |
| Commodity derivatives | $ | 223,410 | | | $ | 4,191 | | | $ | 41,647 | | | $ | 177,572 | |
| Foreign exchange derivatives | 20,609 | | | 0 | | | 7,108 | | | 13,501 | |
| | | | | | | |
| | | | | | | |
| Total | $ | 244,019 | | | $ | 4,191 | | | $ | 48,755 | | | $ | 191,073 | |
|
| | | | | | | | | | | | | | | |
| | August 31, 2018 |
| | | | Amounts Not Offset on the Consolidated Balance Sheet but Eligible for Offsetting | | |
| | Gross Amounts Recognized | | Cash Collateral | | Derivative Instruments | | Net Amounts |
| | (Dollars in thousands) |
| Derivative Assets | | | | | | | |
| Commodity derivatives | $ | 313,033 |
| | $ | — |
| | $ | 26,781 |
| | $ | 286,252 |
|
| Foreign exchange derivatives | 15,401 |
| | — |
| | 8,703 |
| | 6,698 |
|
| Embedded derivative asset | 23,595 |
| | — |
| | — |
| | 23,595 |
|
| Total | $ | 352,029 |
| | $ | — |
| | $ | 35,484 |
| | $ | 316,545 |
|
| Derivative Liabilities | | | | | | | |
| Commodity derivatives | $ | 421,054 |
| | $ | 12,983 |
| | $ | 26,781 |
| | $ | 381,290 |
|
| Foreign exchange derivatives | 24,701 |
| | — |
| | 8,703 |
| | 15,998 |
|
| Total | $ | 445,755 |
| | $ | 12,983 |
| | $ | 35,484 |
| | $ | 397,288 |
|
Derivative assets and liabilities with maturities of less than 12 months are recorded in derivativeother current assets and derivativeother current liabilities, respectively, on the Consolidated Balance Sheets. Derivative assets and liabilities with maturities greater than 12 months are recorded in other assets and other liabilities, respectively, on the Consolidated Balance Sheets. The amount of long-term derivative assets, excluding derivatives accounted for as fair value hedges, recorded on the Consolidated Balance Sheet at August 31, 2020 and 2019, and 2018, was $26.6$21.2 million and $23.1$26.6 million, respectively. The amount of long-term derivative liabilities, excluding derivatives accounted for as fair value hedges, recorded on the Consolidated Balance Sheet at August 31, 2020 and 2019, was $5.4 million and 2018, was $7.4 million, and $7.9 million, respectively.
Derivatives Not Designated as Hedging Instruments
The majority of our derivative instruments have not been designated as hedging instruments. The following table sets forth the pretax gains (losses) on derivatives not accounted for as hedging instruments that have been included in our Consolidated Statements of Operations for the years ended August 31, 2020, 2019 2018 and 2017.2018.
| | | | | | | | | | | | | | | | | | | | | | | |
| Derivative Type | Location of
Gain (Loss) | | 2020 | | 2019 | | 2018 |
| | | | (Dollars in thousands) |
| Commodity derivatives | Cost of goods sold | | $ | 89,248 | | | $ | 125,323 | | | $ | 162,321 | |
| Foreign exchange derivatives | Cost of goods sold | | (184,692) | | | 4,228 | | | (26,010) | |
| Foreign exchange derivatives | Marketing, general and administrative expenses | | (2,986) | | | (1,229) | | | 596 | |
| Interest rate derivatives | Interest expense | | (1,226) | | | 0 | | | (1) | |
| Embedded derivative | Other income | | 2,634 | | | 2,769 | | | 3,061 | |
| Total | | | $ | (97,022) | | | $ | 131,091 | | | $ | 139,967 | |
|
| | | | | | | | | | | | | |
| Derivative Type | Location of Gain (Loss) | | 2019 | | 2018 | | 2017 |
| | | | (Dollars in thousands) |
| Commodity derivatives | Cost of goods sold | | $ | 125,323 |
| | $ | 162,321 |
| | $ | 168,569 |
|
| Foreign exchange derivatives | Cost of goods sold | | 4,228 |
| | (26,010 | ) | | (13,140 | ) |
| Foreign exchange derivatives | Marketing, general and administrative expenses | | (1,229 | ) | | 596 |
| | (1,604 | ) |
| Interest rate derivatives | Interest expense | | — |
| | (1 | ) | | 8 |
|
| Embedded derivative | Other income (loss) | | 2,769 |
| | 3,061 |
| | 30,533 |
|
| Total | | | $ | 131,091 |
| | $ | 139,967 |
| | $ | 184,366 |
|
Commodity Contracts
When we enter a commodity purchase or sales commitment, we are exposed to risks related to price changes and performance, including delivery, quality, quantity and shipment period. If market prices decrease, we are exposed to risk of loss in the market value of inventory and purchase contracts with a fixed or partially fixed price. Conversely, we are exposed to risk of loss on our fixed or partially fixed price sales contracts if market prices increase.
Our use of hedging reduces exposure to price volatility by protecting against adverse short-term price movements, but also limits the benefits of favorable short-term price movements. To reduce price risk associated with fixed price commitments, we generally enter into commodity derivative contracts, to the extent practical, to achieve a net commodity position within the formal position limits we have established and deemed prudent for each commodity. These contracts are primarily transacted on regulated commodity futures exchanges, but may also include over-the-counter derivative instruments when deemed appropriate. For commodities where there is no liquid derivative contract, risk is managed using forward sales contracts, other pricing arrangements and, to some extent, futures contracts in highly correlated commodities. These contracts are economic hedges of price risk, but are not designated as hedging instruments for accounting purposes. The contracts are recorded on our Consolidated Balance Sheets at fair values based on quotes listed on regulated commodity exchanges or the market prices of the underlying products listed on the exchanges, except that fertilizer and certain propane contracts are accounted for as normal purchase and normal sales transactions. Unrealized gains and losses on these contracts are recognized in cost of goods sold in our Consolidated Statements of Operations.
When a futures position is established, initial margin must be deposited with the applicable exchange or broker. The amount of margin required varies by commodity and is set by the applicable exchange at its sole discretion. If the market price relative to a short futures position increases, an additional margin deposit would be required. Similarly, a margin deposit would be required if the market price relative to a long futures position decreases. Conversely, if the market price increases relative to a long futures position or decreases relative to a short futures position, margin deposits may be returned by the applicable exchange or broker.
Our policy is to manage our commodity price risk exposure according to internal policespolicies and in alignment with our tolerance for risk. Our profitability from operations is primarily derived from margins on products sold and grain merchandised, not from hedging transactions. At any one time, inventory and purchase contracts for delivery to us may be substantial. We have risk management policies that include established net position limits. These limits are defined for each commodity and business unit and may include both trader and management limits as appropriate. The limits policy is managed within each individual business unit to ensure any limits overage is explained and exposures reduced, or a temporary limit increase is established if needed. The position limits are reviewed at least annually with our senior leadership and Board of Directors. We monitor current market conditions and may expand or reduce our net position limits in response to changes in those conditions. In addition, all purchase and sales contracts are subject to credit approvals and appropriate terms and conditions.
The use of hedging instruments does not protect against nonperformance by counterparties to cash contracts. We evaluate counterparty exposure by reviewing contracts and adjusting the values to reflect potential nonperformance. Risk of nonperformance by counterparties includes inability to perform because of a counterparty's financial condition and the risk that the counterparty will refuse to perform on a contract during periods of price fluctuations where contract prices are significantly
different than the current market prices. We manage these risks by entering into fixed price purchase and sales contracts with preapproved producers and by establishing appropriate limits for individual suppliers. Fixed price contracts are entered into
with customers of acceptable creditworthiness, as internally evaluated. Regarding our use of derivatives, we primarily transact in exchange traded instruments or enter into over-the-counter derivatives that clear through a designated clearing organization, which limits our counterparty exposure relative to hedging activities. Historically, we have not experienced significant events of nonperformance on open contracts. Accordingly, we only adjust the estimated fair values of specifically identified contracts for nonperformance. Although we have established policies and procedures, we make no assurances that historical nonperformance experience will carry forward to future periods.
As of August 31, 20192020 and 2018,2019, we had outstanding commodity futures and options contracts that were used as economic hedges, as well as fixed-price forward contracts related to physical purchases and sales of commodities. The table below presents the notional volumes for all outstanding commodity contracts accounted for as derivative instruments.contracts.
| | | | | | | | | | | | | | | | | | | | | | | | | | |
| | | 2020 | | 2019 |
| Derivative Type | | Long | | Short | | Long | | Short |
| | | (Units in thousands) |
| Grain and oilseed (bushels) | | 664,673 | | | 892,303 | | | 547,096 | | 717,522 |
| Energy products (barrels) | | 10,028 | | | 6,570 | | | 13,895 | | 4,663 |
| Processed grain and oilseed (tons) | | 657 | | | 3,304 | | | 597 | | 2,454 |
| Crop nutrients (tons) | | 74 | | | 127 | | | 76 | | 23 |
| Ocean freight (metric tons) | | 1,140 | | | 95 | | | 295 | | 85 |
| Natural gas (MMBtu) | | 0 | | | 0 | | | 130 | | | 0 | |
|
| | | | | | | | | | | |
| | 2019 | | 2018 |
| Derivative Type | Long | | Short | | Long | | Short |
| | (Units in thousands) |
| Grain and oilseed (bushels) | 547,096 |
| | 717,522 |
| | 715,866 |
| | 929,873 |
|
| Energy products (barrels) | 13,895 |
| | 4,663 |
| | 17,011 |
| | 8,329 |
|
| Processed grain and oilseed (tons) | 597 |
| | 2,454 |
| | 1,064 |
| | 2,875 |
|
| Crop nutrients (tons) | 76 |
| | 23 |
| | 11 |
| | 76 |
|
| Ocean freight (metric tons) | 295 |
| | 85 |
| | 227 |
| | 45 |
|
| Natural gas (MMBtu) | 130 |
| | — |
| | 610 |
| | — |
|
Foreign Exchange Contracts
We conduct a substantial portion of our business in U.S. dollars, but we are exposed to risks relating to foreign currency fluctuations primarily due to global grain marketing transactions in South America, the Asia Pacific region and Europe, and purchases of products from Canada. We use foreign currency derivative instruments to mitigate the impact of exchange rate fluctuations. Although CHS has some risk exposure relating to foreign currency transactions, a larger impact with exchange rate fluctuations is the ability of foreign buyers to purchase U.S. agricultural products and the competitiveness of U.S. agricultural products compared to the same products offered by alternative sources of world supply. The notional amounts of our foreign exchange derivative contracts were $894.7 million$1.2 billion and $988.8$894.7 million as of August 31, 20192020 and August 31, 2018,2019, respectively.
Embedded Derivative Asset
Under the terms of our strategic investment in CF Nitrogen, if the CF Industries credit rating is reduced below certain levels by two of three specified credit ratings agencies, we are entitled to receive a non-refundablenonrefundable annual payment of $5.0 million from CF Industries. These payments will continue on an annual basis until the date the CF Industries credit rating is upgraded to or above certain levels by two of the three specified credit ratings agencies or February 1, 2026, whichever is earlier.
Since the CF Industries credit rating was reduced below the specified levels during fiscal 2017, we have received an annual payment of $5.0 million from CF Industries. Gains totaling $2.6 million, $2.8 million $3.1 million and $30.5$3.1 million were recognized in other income (loss) in our Consolidated Statements of Operations during fiscal 2020, fiscal 2019 and fiscal 2018, and fiscal 2017, respectively. The fair value of the embedded derivative asset recorded on our Consolidated Balance Sheet as of August 31, 2019,2020, was equal to $21.4$19.0 million. The current and long-term portions of the embedded derivative asset are included in derivativeother current assets and other assets on our Consolidated Balance Sheet, respectively. See Note 14, 16, Fair Value Measurements, for additional information regarding the valuation of the embedded derivative asset.
Derivatives Designated as Cash Flow or Fair Value Hedging Strategies
Fair Value Hedges
During the year ended August 31, 2020, we exited all our interest rate swaps resulting in a $16.4 million gain, which is being amortized over the life of the fixed-rate debt for which the swaps had previously been designated as fair value hedges, through fiscal 2025. As of August 31, 2019, we had outstanding interest rate swaps with an aggregate notional amount of $365.0 million designated as fair value hedges of portions of our fixed-rate debt due between fiscal 2021 and fiscal 2025. As of August 31, 2018, we had outstanding interest rate swaps with an aggregate notional amount of $495.0 million.debt. Our objective in entering into these transactions iswas to offset changes in the fair value of the debt associated with the risk of variability in the three-month U.S. dollar LIBOR interest rate, in essence converting the fixed-rate debt to variable-rate debt. Under these interest rate swaps, we receivereceived fixed-rate interest payments and makemade interest payments based on the three-month U.S. dollar LIBOR. Offsetting changes in the
fair values of both the swap instruments and the hedged debt arewere recorded contemporaneously each period and only createcreated an impact to earnings to the extent the hedge iswas ineffective.
The following table presents the fair value of our derivative interest rate swap instruments designated as fair value hedges and the line items on our Consolidated Balance Sheets in which they are recorded as of August 31, 20192020 and 2018.2019.
| | | | | | | | | | | | | | | | | | | | |
| | 2020 | | 2019 | | | | | | |
| Balance Sheet Location | | Derivative Assets | | | | |
| | (Dollars in thousands) | | | | |
| | | | | | | | | | |
| Other assets | | $ | 0 | | | $ | 9,841 | | | | | | | |
| | | | | | | | | | |
|
| | | | | | | | | | | | | | | | | | |
| | | 2019 | | 2018 | | | | 2019 | | 2018 |
| Balance Sheet Location | | Derivative Assets | | Balance Sheet Location | | Derivative Liabilities |
| | | (Dollars in thousands) | | | | (Dollars in thousands) |
| Derivative assets | | $ | — |
| | $ | — |
| | Derivative liabilities | | $ | — |
| | $ | 771 |
|
| Other assets | | 9,841 |
| | — |
| | Other liabilities | | — |
| | 8,681 |
|
| Total | | $ | 9,841 |
| | $ | — |
| | Total | | $ | — |
| | $ | 9,452 |
|
The following table sets forth the pretax gains (losses) on derivatives accounted for as hedging instruments that have been included in our Consolidated Statements of Operations for the years ended August 31, 2020, 2019 2018 and 2017.2018.
| | | | | | | | | | | | | | | | | | | | | | | | | | |
| Gain (Loss) on Fair Value Hedging Relationships | | Location of
Gain (Loss) | | 2020 | | 2019 | | 2018 |
| | | | (Dollars in thousands) |
| Interest rate swaps | | Interest expense | | $ | (1,897) | | | $ | 21,158 | | | $ | 18,723 | |
| Hedged item | | Interest expense | | 1,897 | | | (21,158) | | | (18,723) | |
| Total | | $ | 0 | | | $ | 0 | | | $ | 0 | |
|
| | | | | | | | | | | | | | |
| Gain (Loss) on Fair Value Hedging Relationships: | | Location of Gain (Loss) | | 2019 | | 2018 | | 2017 |
| | | | | (Dollars in thousands) |
| Interest rate swaps | | Interest expense | | $ | 21,158 |
| | $ | 18,723 |
| | $ | 12,806 |
|
| Hedged item | | Interest expense | | (21,158 | ) | | (18,723 | ) | | (12,806 | ) |
| Total | | $ | — |
| | $ | — |
| | $ | — |
|
The following table provides the location and carrying amount of hedged liabilities in our Consolidated Balance Sheets as of August 31, 20192020 and 2018.2019.
| | | | | | | | | | | | | | | | | | | | | | | | | | |
| | August 31, 2020 | | August 31, 2019 |
| Balance Sheet Location | | Carrying Amount of Hedged Liabilities | | Cumulative Amount of Fair Value Hedging Adjustments Included in the Carrying Amount of Hedged Liabilities | | Carrying Amount of Hedged Liabilities | | Cumulative Amount of Fair Value Hedging Adjustments Included in the Carrying Amount of Hedged Liabilities |
| | (Dollars in thousands) |
| Long-term debt | | $ | 0 | | | $ | 0 | | | $ | 334,389 | | | $ | 30,611 | |
|
| | | | | | | | | | | | | | | | |
| | | August 31, 2019 | | August 31, 2018 |
| Balance Sheet Location | | Carrying Amount of Hedged Liabilities | | Cumulative Amount of Fair Value Hedging Adjustments Included in the Carrying Amount of Hedged Liabilities | | Carrying Amount of Hedged Liabilities | | Cumulative Amount of Fair Value Hedging Adjustments Included in the Carrying Amount of Hedged Liabilities |
| | | (Dollars in thousands) |
| Long-term debt | | $ | 334,389 |
| | $ | 30,611 |
| | $ | 485,548 |
| | $ | 9,452 |
|
Cash Flow Hedges
In fiscal 2018, our Energy segment began designating certain of its pay-fixed, receive-variable, cash-settled swaps as cash flow hedges of future crude oil purchases. We also began designating certain pay-variable, receive-fixed, cash-settled swaps as cash flow hedges of future refined product sales. These hedging instruments and the related hedged items are exposed to significant market price risk and potential volatility. As part of our risk management strategy, we look to hedge a portion of our expected future crude oil needs and the resulting refined product output based on prevailing futures prices, management's expectations about future commodity price changes and our risk appetite. As of August 31, 20192020 and 2018,2019, the aggregate notional amount of cash flow hedges was 7.79.7 million and 1.17.7 million barrels, respectively.
The following table presents the fair value of our commodity derivative instruments designated as cash flow hedges and the line items on our Consolidated Balance Sheets in which they are recorded.recorded as of August 31, 2020 and 2019.
| | | | | | | | | | | | | | | | | | | | | | | | | | | | | | | | |
| | Derivative Assets | | | | Derivative Liabilities |
| Balance Sheet Location | | 2020 | | 2019 | | Balance Sheet Location | | 2020 | | 2019 |
| | (Dollars in thousands) | | | | (Dollars in thousands) |
| Other current assets | | $ | 34,052 | | | $ | 33,179 | | | Other current liabilities | | $ | 8,821 | | | $ | 5,351 | |
|
| | | | | | | | | | | | | | | | | | |
| | | Derivative Assets | | | | Derivative Liabilities |
| Balance Sheet Location | | August 31, 2019 | | August 31, 2018 | | Balance Sheet Location | | August 31, 2019 | | August 31, 2018 |
| | | (Dollars in thousands) | | | | (Dollars in thousands) |
| Derivative assets | | $ | 33,179 |
| | $ | 812 |
| | Derivative liabilities | | $ | 5,351 |
| | $ | 634 |
|
The following table presents the pretax gains (losses) recorded in other comprehensive income relating to cash flow hedges for the years ended August 31, 2020, 2019 2018 and 2017:2018:
| | | | | | | | | | | | | | | | | | | | |
| | 2020 | | 2019 | | 2018 |
| | | (Dollars in thousands) |
| Commodity derivatives | | $ | (2,596) | | | $ | 27,650 | | | $ | 178 | |
|
| | | | | | | | | | | | |
| | | 2019 | | 2018 | | 2017 |
| | | (Dollars in thousands) |
| Commodity derivatives | | $ | 27,650 |
| | $ | 178 |
| | $ | — |
|
The following table presents the pretax gains (losses) relating to cash flow hedges that were reclassified from accumulated other comprehensive loss into our Consolidated Statements of Operations for the years ended August 31, 2020, 2019 2018 and 2017:2018:
| | | | | | | | | | | | | | | | | | | | | | | |
| Location of
Gain (Loss) | | 2020 | | 2019 | | 2018 |
| | | | (Dollars in thousands) |
| Commodity derivatives | Cost of goods sold | | $ | 23,807 | | | $ | 11,497 | | | $ | 0 | |
|
| | | | | | | | | | | | | |
| | Location of Gain (Loss) | | 2019 | | 2018 | | 2017 |
| | | | (Dollars in thousands) |
| Commodity derivatives | Cost of goods sold | | $ | 11,497 |
| | $ | — |
| | $ | — |
|
Note 1416 Fair Value Measurements
ASC Topic 820, Fair Value Measurement, defines fair value as the price that would be received for an asset or paid to transfer a liability (an exit price) in the principal or most advantageous market for the asset or liability in an orderly transaction between market participants on the measurement date.
We determine fair values of derivative instruments and certain other assets, based on the fair value hierarchy established in ASC Topic 820, which requires an entity to maximize the use of observable inputs and minimize the use of unobservable inputs when measuring fair value. Observable inputs are inputs that reflect the assumptions market participants would use in pricing the asset or liability based on the best information available in the circumstances. ASC Topic 820 describes three levels within its hierarchy that may be used to measure fair value, and our assessment of relevant instruments within those levels is as follows:
Level 1. Values are based on unadjusted quoted prices in active markets for identical assets or liabilities. These assets and liabilities may include exchange-traded derivative instruments, rabbi trust investments, deferred compensation investments and available-for-sale investments.
Level 2. Values are based on quoted prices for similar assets or liabilities in active markets, quoted prices for identical or similar assets or liabilities in markets that are not active, or other inputs that are observable or can be corroborated by observable market data for substantially the full term of the assets or liabilities. These assets and liabilities include interest rate, foreign exchange and commodity swaps; forward commodity contracts with a fixed price component; and other OTC derivatives whose value is determined with inputs that are based on exchange traded prices, adjusted for location specific inputs that are primarily observable in the market or can be derived principally from, or corroborated by, observable market data.
Level 3. Values are generated from unobservable inputs that are supported by little or no market activity and that are a significant component of the fair value of the assets or liabilities. These unobservable inputs would reflect our own estimates of assumptions that market participants would use in pricing related assets or liabilities. Valuation techniques might include the use of pricing models, discounted cash flow models or similar techniques.
The following tables present assets and liabilities, included on our Consolidated Balance Sheets, that are recognized at fair value on a recurring basis and indicate the fair value hierarchy utilized to determine these fair values. Assets and liabilities are classified in their entirety based on the lowest level of input that is a significant component of the fair value measurement. The lowest level of input is considered Level 3. Our assessment of the significance of a particular input to the fair value
measurement requires judgment and may affect the classification of fair value assets and liabilities within the fair value hierarchy levels.
Recurring fair value measurements at August 31, 20192020 and 2018,2019, are as follows:
| | | | | | | | | | | | | | | | | | | | | | | |
| 2020 |
| Quoted Prices in Active Markets
for Identical Assets
(Level 1) | | Significant Other Observable
Inputs
(Level 2) | | Significant
Unobservable
Inputs
(Level 3) | | Total |
| | (Dollars in thousands) |
| Assets | | | | | | | |
| Commodity derivatives | $ | 5,762 | | | $ | 355,783 | | | $ | 0 | | | $ | 361,545 | |
| Foreign currency derivatives | 0 | | | 11,523 | | | 0 | | | 11,523 | |
| | | | | | | |
| Deferred compensation assets | 47,669 | | | 0 | | | 0 | | | 47,669 | |
| Embedded derivative asset | 0 | | | 18,998 | | | 0 | | | 18,998 | |
| Segregated investments | 85,950 | | | 0 | | | 0 | | | 85,950 | |
| Other assets | 5,276 | | | 0 | | | 0 | | | 5,276 | |
| Total | $ | 144,657 | | | $ | 386,304 | | | $ | 0 | | | $ | 530,961 | |
| Liabilities | | | | | | | |
| Commodity derivatives | $ | 6,037 | | | $ | 346,126 | | | $ | 0 | | | $ | 352,163 | |
| Foreign currency derivatives | 0 | | | 69,467 | | | 0 | | | 69,467 | |
| | | | | | | |
| Total | $ | 6,037 | | | $ | 415,593 | | | $ | 0 | | | $ | 421,630 | |
|
| | | | | | | | | | | | | | | |
| | 2019 |
| | Quoted Prices in Active Markets for Identical Assets (Level 1) | | Significant Other Observable Inputs (Level 2) | | Significant Unobservable Inputs (Level 3) | | Total |
| | (Dollars in thousands) |
| Assets | |
| | |
| | | | |
|
| Commodity derivatives | $ | 67,817 |
| | $ | 180,392 |
| | $ | — |
| | $ | 248,209 |
|
| Foreign currency derivatives | — |
| | 10,339 |
| | — |
| | 10,339 |
|
| Interest rate swap derivatives | — |
| | 9,841 |
| | — |
| | 9,841 |
|
| Deferred compensation assets | 40,368 |
| | — |
| | — |
| | 40,368 |
|
| Embedded derivative asset | — |
| | 21,364 |
| | — |
| | 21,364 |
|
| Segregated investments | 77,777 |
| | — |
| | — |
| | 77,777 |
|
| Other assets | 6,519 |
| | — |
| | — |
| | 6,519 |
|
| Total | $ | 192,481 |
| | $ | 221,936 |
| | $ | — |
| | $ | 414,417 |
|
| Liabilities | |
| | |
| | | | |
|
| Commodity derivatives | $ | 40,305 |
| | $ | 188,455 |
| | $ | — |
| | $ | 228,760 |
|
| Foreign currency derivatives | — |
| | 20,701 |
| | — |
| | 20,701 |
|
| Total | $ | 40,305 |
| | $ | 209,156 |
| | $ | — |
| | $ | 249,461 |
|
| | | | | | | | | | | | | | | | | | | | | | | |
| | 2019 |
| Quoted Prices in Active Markets
for Identical Assets
(Level 1) | | Significant Other Observable
Inputs
(Level 2) | | Significant
Unobservable
Inputs
(Level 3) | | Total |
| | (Dollars in thousands) |
| Assets | | | | | | | |
| Commodity derivatives | $ | 67,817 | | | $ | 180,392 | | | $ | 0 | | | $ | 248,209 | |
| Foreign currency derivatives | 0 | | | 10,339 | | | 0 | | | 10,339 | |
| Interest rate swap derivatives | — | | | 9,841 | | | — | | | 9,841 | |
| Deferred compensation assets | 40,368 | | | 0 | | | 0 | | | 40,368 | |
| Embedded derivative asset | 0 | | | 21,364 | | | 0 | | | 21,364 | |
| Segregated investments | 77,777 | | | — | | | — | | | 77,777 | |
| Other assets | 6,519 | | | 0 | | | 0 | | | 6,519 | |
| Total | $ | 192,481 | | | $ | 221,936 | | | $ | 0 | | | $ | 414,417 | |
| Liabilities | | | | | | | |
| Commodity derivatives | $ | 40,305 | | | $ | 188,455 | | | $ | 0 | | | $ | 228,760 | |
| Foreign currency derivatives | 0 | | | 20,701 | | | 0 | | | 20,701 | |
| | | | | | | |
| Total | $ | 40,305 | | | $ | 209,156 | | | $ | 0 | | | $ | 249,461 | |
|
| | | | | | | | | | | | | | | |
| | 2018 |
| | Quoted Prices in Active Markets for Identical Assets (Level 1) | | Significant Other Observable Inputs (Level 2) | | Significant Unobservable Inputs (Level 3) | | Total |
| | (Dollars in thousands) |
| Assets | |
| | |
| | | | |
|
| Commodity derivatives | $ | 54,487 |
| | $ | 259,359 |
| | $ | — |
| | $ | 313,846 |
|
| Foreign currency derivatives | — |
| | 15,401 |
| | — |
| | 15,401 |
|
| Deferred compensation assets | 39,073 |
| | — |
| | — |
| | 39,073 |
|
| Embedded derivative asset | — |
| | 23,595 |
| | — |
| | 23,595 |
|
| Other assets | 5,334 |
| | — |
| | — |
| | 5,334 |
|
| Total | $ | 98,894 |
| | $ | 298,355 |
| | $ | — |
| | $ | 397,249 |
|
| Liabilities | |
| | |
| | | | |
|
| Commodity derivatives | $ | 31,778 |
| | $ | 389,911 |
| | $ | — |
| | $ | 421,689 |
|
| Foreign currency derivatives | — |
| | 24,701 |
| | — |
| | 24,701 |
|
| Interest rate swap derivatives | — |
| | 9,452 |
| | — |
| | 9,452 |
|
| Total | $ | 31,778 |
| | $ | 424,064 |
| | $ | — |
| | $ | 455,842 |
|
Commodity and foreign currency derivatives. Exchange-traded futures and options contracts are valued based on unadjusted quoted prices in active markets and are classified within Level 1. Our forward commodity purchase and sales contracts with fixed-price components, select ocean freight contracts and other OTC derivatives are determined using inputs that are generally based on exchange traded prices and/or recent market bids and offers, adjusted for location specific inputs, and are classified within Level 2. Location-specific inputs are driven by local market supply and demand and are generally based on broker or dealer quotations or market transactions in either listed or OTC markets. Changes in the fair values of these contracts are recognized in our Consolidated Statements of Operations as a component of cost of goods sold.
Interest rate swap derivatives. Fair values of our interest rate swap derivatives are determined utilizing valuation models that are widely accepted in the market to value these OTC derivative contracts. The specific terms of the contracts, as well as market observable inputs, such as interest rates and credit risk assumptions, are factored into the models. As all significant inputs are market observable, all interest rate swaps are classified within Level 2. Changes in the fair values of contracts not designated as hedging instruments for accounting purposes are recognized in our Consolidated Statements of
Operations as a component of interest expense. As of August 31, 2020, all interest rate swaps were unwound. See Note 13, 15, Derivative Financial Instruments and Hedging Activities, for additional information about interest rates swaps designated as fair value and cash flow hedges.
Deferred compensation and other assets. Our deferred compensation investments consist primarily of rabbi trust assets that are valued based on unadjusted quoted prices on active exchanges and classified within Level 1. Changes in the fair values of these other assets are primarily recognized in our Consolidated Statements of Operations as a component of marketing, general and administrative expenses.
Embedded derivative asset. The embedded derivative asset relates to contingent payments inherent to our investment in CF Nitrogen. The inputs used in the fair value measurement include the probability of future upgrades and downgrades of the CF Industries credit rating based on historical credit rating movements of other public companies and the discount rates applied to potential annual payments based on applicable historical and current yield coupon rates. Based on these observable inputs, our fair value measurement is classified within Level 2. See Note 13, 15, Derivative Financial Instruments and Hedging Activities, for additional information.
Segregated investments. Our segregated investments are comprised of U.S. Treasury securities, which are valued using quoted market prices and classified within Level 1.
Note 1517 Commitments and Contingencies
Environmental
We are required to comply with various environmental laws and regulations incidental to our normal business operations. To meet our compliance requirements, we establish reserves for the probable future costs of remediation ofassociated with identified issues whichthat are both probable and can be reasonably estimated. Estimates of environmental costs are based on current available facts, existing technology, undiscounted site-specific costs and currently enacted laws and regulations and are included in cost of goods sold and marketing, general and administrative expenses in our Consolidated Statements of Operations. Recoveries, if any, are recorded in the period in which recovery is received. Liabilities are monitored and adjusted as new facts or changes in law or technology occur. The resolution of any such matters may affect consolidated net income for any fiscal period; however, we believe any resulting liabilities, individually or in the aggregate, will not have a material effect on our consolidated financial position, results of operations or cash flows during any fiscal year.
Other Litigation and Claims
We are involved as a defendant in various lawsuits, claims and disputes, which are in the normal course of our business. The resolution of any such matters may affect consolidated net income for any fiscal period; however, we believe any resulting liabilities, individually or in the aggregate, will not have a material effect on our consolidated financial position, results of operations or cash flows during any fiscal year.
Guarantees
We are a guarantor for lines of credit and performance obligations of related, non-consolidatednonconsolidated companies. Our bank covenants allow maximum guarantees of $1.0 billion, of which $196.0$127.9 million were outstanding on August 31, 2019.2020. We have collateral for a portion of these contingent obligations. We have not recorded a liability related to the contingent obligations as we do not expect to pay out any cash related to them, and the fair values are considered immaterial. The underlying loans to the counterparties for which we provide these guarantees are current as of August 31, 2019.2020.
Credit Commitments
CHS Capital has commitments to extend credit to customers if there is no violation of any condition established in the contracts. As of August 31, 2019,2020, CHS Capital customers have additional available credit of $650.6$714.5 million.
Lease Commitments
We lease certain property, plant and equipment used in our operations under both capital and operating lease agreements. Many leases contain renewal options and escalation clauses. Our operating leases, which are primarily for railcars, equipment, vehicles and office space have remaining terms of one to 18 years. Total rental expense for operating leases was $113.3 million, $88.5 million and $81.3 million for the years ended August 31, 2019, 2018 and 2017, respectively.
On November 30, 2017, we completed a sale-leaseback transaction for our primary corporate office building located in Inver Grove Heights, Minnesota. Simultaneous with the closing of the sale of the building, we entered into a 20-year operating lease arrangement with respect to the building, with base annual rent of approximately $3.4 million during the first year, followed by annual increases of 2% through the remainder of the lease period.
We lease certain railcars, equipment, vehicles and other assets under capital lease arrangements. These assets are included in property, plant and equipment on our Consolidated Balance Sheets while the corresponding capital lease obligations are included in long-term debt. See Note 6, Property, Plant and Equipment, and Note 8, Notes Payable and Long-Term Debt,for more information about capital leases.
Minimum future lease payments required under noncancelable operating leases as of August 31, 2019, are as follows:
|
| | | |
| | (Dollars in thousands) |
| 2020 | $ | 87,168 |
|
| 2021 | 57,381 |
|
| 2022 | 43,665 |
|
| 2023 | 34,328 |
|
| 2024 | 26,793 |
|
| Thereafter | 92,653 |
|
| Total minimum future lease payments | $ | 341,988 |
|
Unconditional Purchase Obligations
Unconditional purchase obligations are commitments to transfer funds in the future for fixed or minimum amounts or quantities of goods or services at fixed or minimum prices. Our long-term unconditional purchase obligations primarily relate to pipeline and grain handling take-or-pay and throughput agreements and are not recorded on our Consolidated Balance Sheets. As of August 31, 2019,2020, minimum future payments required under long-term commitments that are noncancelable, and that third parties have used to secure financing for facilities that will provide contracted goods, are as follows:
| | | | | | | | | | | | | | | | | | | | | | | | | | | | | | | | | | | | | | | | | |
| | Payments Due by Period |
| Total | | 2021 | | 2022 | | 2023 | | 2024 | | 2025 | | Thereafter |
| | (Dollars in thousands) |
| Long-term unconditional purchase obligations | $ | 544,203 | | | $ | 78,939 | | | $ | 58,214 | | | $ | 58,592 | | | $ | 58,262 | | | $ | 52,702 | | | $ | 237,494 | |
|
| | | | | | | | | | | | | | | | | | | | | | | | | | | |
| | Payments Due by Period |
| | Total | | 2020 | | 2021 | | 2022 | | 2023 | | 2024 | | Thereafter |
| | (Dollars in thousands) |
| Long-term unconditional purchase obligations | $ | 623,193 |
| | $ | 81,607 |
| | $ | 63,286 |
| | $ | 58,965 |
| | $ | 59,419 |
| | $ | 58,804 |
| | $ | 301,112 |
|
Total payments under these arrangements were $77.6 million, $70.8 million $61.4 million and $70.5$61.4 million for the years ended August 31, 2020, 2019 2018 and 2017,2018, respectively.
Note 16 Supplemental Cash Flow and Other Information
Additional information concerning supplemental disclosures of cash flow activities for the years ended August 31, 2019, 2018 and 2017, is included in the table below.
|
| | | | | | | | | | | |
| | 2019 | | 2018 | | 2017 |
| | (Dollars in thousands) |
| Net cash paid during the period for: | |
| | |
| | |
|
| Interest | $ | 172,259 |
| | $ | 148,874 |
| | $ | 160,040 |
|
| Income taxes | 19,918 |
| | 13,410 |
| | 14,571 |
|
| Other significant noncash investing and financing transactions: | |
| | |
| | |
|
| Notes receivable reacquired under Securitization Facility | — |
| | 615,089 |
| | — |
|
| Trade receivables reacquired under Securitization Facility | — |
| | 402,421 |
| | — |
|
| Securitized debt reacquired under Securitization Facility | — |
| | 634,000 |
| | — |
|
| Deferred purchase price receivable extinguished under Securitization Facility | — |
| | 386,900 |
| | — |
|
| Notes receivable sold under Securitization Facility | — |
| | — |
| | 747,345 |
|
| Securitized debt extinguished under Securitization Facility | — |
| | — |
| | 554,000 |
|
| Deferred purchase price receivable recognized under Securitization Facility | — |
| | — |
| | 547,553 |
|
| Land and improvements received for notes receivable | — |
| | — |
| | 138,699 |
|
| Capital expenditures and major maintenance incurred but not yet paid | 28,478 |
| | 53,453 |
| | 22,490 |
|
| Capital lease obligations incurred | 7,351 |
| | 396 |
| | 6,832 |
|
| Capital equity certificates redeemed with preferred stock | — |
| | — |
| | 19,985 |
|
| Capital equity certificates issued in exchange for Ag acquisitions | — |
| | — |
| | 2,928 |
|
| Accrual of dividends and equities payable | 180,000 |
| | 153,941 |
| | 12,121 |
|
| Assets contributed to joint venture | 7,353 |
| | — |
| | — |
|
Note 1718 Related Party Transactions
We purchase and sell grain and other agricultural commodity products from certain equity investees, primarily CF Nitrogen, Ventura Foods, Ardent Mills and TEMCO, LLC. Sales to and purchases from related parties for the years ended August 31, 2020, 2019, 2018 and 2017,2018, respectively, are as follows:
| | | | | | | | | | | | | | | | | |
| 2020 | | 2019 | | 2018 |
| | (Dollars in thousands) |
| Sales | $ | 2,528,921 | | | $ | 2,628,670 | | | $ | 2,928,984 | |
| Purchases | 872,819 | | | 901,812 | | | 2,505,185 | |
|
| | | | | | | | | | | |
| | 2019 | | 2018 | | 2017 |
| | (Dollars in thousands) |
| Sales | $ | 2,628,670 |
| | $ | 2,928,984 |
| | $ | 3,183,944 |
|
| Purchases | 901,812 |
| | 2,505,185 |
| | 2,610,887 |
|
Receivables due from and payables due to related parties as of August 31, 20192020 and 2018,2019, are as follows:
| | | | | | | | | | | |
| 2020 | | 2019 |
| | (Dollars in thousands) |
| Due from related parties | $ | 129,397 | | | $ | 26,785 | |
| Due to related parties | 53,602 | | | 60,156 | |
|
| | | | | | | |
| | 2019 | | 2018 |
| | (Dollars in thousands) |
| Due from related parties | $ | 26,785 |
| | $ | 31,063 |
|
| Due to related parties | 60,156 |
| | 52,284 |
|
As a cooperative, we are owned by farmers and ranchers and their member cooperatives, which are referred to as members. We buy commodities from and provide products and services to our members. Individually, our members do not have a significant ownership in CHS.
Note 19 Leases
We adopted ASC Topic 842 on September 1, 2019, using the modified retrospective approach. In addition, we used the additional optional transition method and package of practical expedients in the period of adoption without retrospective adjustment to previous periods presented, although we elected not to apply the hindsight practical expedient. As a result of using the additional optional transition method and following a modified retrospective approach, prior periods have not been restated, and a $25.3 million cumulative-effect adjustment, including the deferred income tax impact, was recorded to increase the opening balance of capital reserves as of the adoption date related to recognition of previously deferred gains associated with the sale-leaseback of our primary corporate office building located in Inver Grove Heights, Minnesota. Our accounting for finance leases (previously referred to as capital leases) remains substantially unchanged; however, adoption of ASC Topic 842 resulted in recognition of operating lease right of use assets and associated lease liabilities of $268.4 million and $267.0 million, respectively, as of September 1, 2019. Adoption of ASC Topic 842 did not have a material impact on our Consolidated Statements of Operations or Consolidated Statements of Cash Flows.
We assess arrangements at inception to determine whether they contain a lease. An arrangement is considered to contain a lease if it conveys the right to control the use of an asset for a period of time in exchange for consideration. The right to control the use of an asset must include both (a) the right to obtain substantially all economic benefits associated with an identified asset and (b) the right to direct how and for what purpose the identified asset is used. Certain arrangements provide us with the right to use an identified asset; however, most of these arrangements are not considered to represent a lease as we do
not control how and for what purpose the identified asset is used. For example, our supply agreements, warehousing and distribution services agreements, and transportation services agreements generally do not contain leases.
We lease property, plant and equipment used in our operations primarily under operating lease agreements and, to a lesser extent, under finance lease agreements. Our operating leases are primarily for railcars, equipment, vehicles and office space, many of which contain renewal options and escalation clauses. Renewal options are included as part of the right of use asset and liability when it is reasonably certain that we will exercise the renewal option; however, renewal options are generally not included as we are not reasonably certain to exercise such options.
Operating lease right of use assets and liabilities for operating leases are recognized at the lease commencement date for leases in excess of 12 months based on the present value of lease payments over the lease term. For measurement and classification of lease agreements, lease and nonlease components are grouped into a single lease component for all asset classes. Variable lease payments are excluded from measurement of right of use assets and liabilities and generally include payments for nonlease components such as maintenance costs, payments for leased assets beyond their noncancelable lease term and payments for other nonlease components such as sales tax. The discount rate used to calculate present value is our collateralized incremental borrowing rate or, if available, the rate implicit in the lease. The incremental borrowing rate is determined for each lease based primarily on its lease term. Certain lease arrangements include rental payments adjusted annually based on changes in an inflation index. Our lease arrangements generally do not contain residual value guarantees or material restrictive covenants.
Lease expense is recognized on a straight-line basis over the lease term. The components of lease expense recognized in our Condensed Consolidated Statements of Operations are as follows:
| | | | | | | | | |
| Year Ended
August 31, 2020 | | | | |
| (Dollars in thousands) | | | | |
| Operating lease expense | $ | 71,541 | | | | | |
| Finance lease expense: | | | | | |
| Amortization of assets | 8,205 | | | | | |
| Interest on lease liabilities | 1,060 | | | | | |
| Short-term lease expense | 15,991 | | | | | |
| Variable lease expense | 3,674 | | | | | |
| Total net lease expense* | $ | 100,471 | | | | | |
*Income related to sub-lease activity is not material and has been excluded from the table above.
Supplemental balance sheet information related to operating and finance leases is as follows:
| | | | | | | | | | | |
| Balance Sheet Location | | August 31, 2020 |
| | | (Dollars in thousands) |
| Operating leases | | | |
| Assets | | | |
| Operating lease right of use assets | Other assets | | $ | 257,834 | |
| Liabilities | | | |
| Current operating lease liabilities | Accrued expenses | | 57,200 | |
| Long-term operating lease liabilities | Other liabilities | | 203,691 | |
| Total operating lease liabilities | | $ | 260,891 | |
| | | |
| Finance leases | | | |
| Assets | | | |
| Finance lease assets | Property, plant and equipment | | $ | 44,860 | |
| Liabilities | | | |
| Current finance lease liabilities | Current portion of long-term debt | | 7,993 | |
| Long-term finance lease liabilities | Long-term debt | | 23,467 | |
| Total finance lease liabilities | | $ | 31,460 | |
| | | |
| Weighted average remaining lease term (in years) | | | |
| Operating leases | | 8.3 |
| Finance leases | | 6.0 |
| | | |
| Weighted average discount rate | | | |
| Operating leases | | 3.11 | % |
| Finance leases | | 3.33 | % |
Supplemental cash flow and other information related to operating and finance leases is as follows:
| | | | | |
| Year Ended
August 31, 2020 |
| (Dollars in thousands) |
| Cash paid for amounts included in measurement of lease liabilities: | |
| Operating cash flows from operating leases | $ | 71,003 | |
| Operating cash flows from finance leases | 1,060 | |
| Financing cash flows from finance leases | 7,949 | |
| |
| Supplemental noncash information: | |
| Right of use assets obtained in exchange for lease liabilities | 56,461 | |
| Right of use asset modifications | 7,333 | |
Maturities of lease liabilities as of August 31, 2020, were as follows:
| | | | | | | | | | | |
| August 31, 2020 |
| Finance Leases | | Operating Leases |
| (Dollars in thousands) |
| Fiscal 2021 | $ | 8,845 | | | $ | 64,379 | |
| Fiscal 2022 | 7,017 | | | 50,398 | |
| Fiscal 2023 | 6,053 | | | 40,269 | |
| Fiscal 2024 | 3,443 | | | 32,195 | |
| Fiscal 2025 | 2,046 | | | 23,034 | |
| Thereafter | 7,933 | | | 95,553 | |
| Total maturities of lease liabilities | 35,337 | | | 305,828 | |
| Less amounts representing interest | 3,877 | | | 44,937 | |
| Present value of future minimum lease payments | 31,460 | | | 260,891 | |
| Less current obligations | 7,993 | | | 57,200 | |
| Long-term obligations | $ | 23,467 | | | $ | 203,691 | |
Disclosures Related to Periods Prior to Adoption of New Lease Standard
The following pertains to previously disclosed information in our Annual Report on Form 10-K for the fiscal year ended August 31, 2019, which incorporates information about leases now in the scope of ASC Topic 842. Total rental expense for operating leases was $113.3 million, $88.5 million and $81.3 million for the years ended August 31, 2019, 2018 and 2017, respectively. Various leases under capital lease totaled $62.7 million and $50.0 million as of August 31, 2019 and 2018, respectively. Accumulated amortization on assets under capital leases was $20.6 million and $18.9 million as of August 31, 2019 and 2018, respectively. Minimum future lease payments required under noncancelable capital and operating leases as of August 31, 2019, were as follows:
| | | | | | | | | | | |
| August 31, 2019 |
| Finance Leases | | Operating Leases |
| (Dollars in thousands) |
| Fiscal 2020 | $ | 6,761 | | | $ | 87,168 | |
| Fiscal 2021 | 6,199 | | | 57,381 | |
| Fiscal 2022 | 5,021 | | | 43,665 | |
| Fiscal 2023 | 4,548 | | | 34,328 | |
| Fiscal 2024 | 2,638 | | | 26,793 | |
| Thereafter | 6,517 | | | 92,653 | |
| Total minimum future lease payments | 31,684 | | | $ | 341,988 | |
| Less amount representing interest | 3,445 | | | |
| Present value of net minimum lease payments | $ | 28,239 | | | |
Note 1820 Acquisitions
On March 1, 2019, we completed our acquisition of the remaining 75% ownership interest in WCD, a full-service wholesale distributor of agronomy products that operates primarily in the United States. The purchase price was equal to $113.4 million, including $6.7 million that was previously paid and $106.7 million paid on March 1, 2019, of which the net cash flows were reduced by $8.0 million of cash acquired. Prior to completing this acquisition and through February 28, 2019, we had a 25% ownership interest in WCD, which was accounted for under the equity method of accounting whereby we shared in the economics of WCD earnings on a pro-rata basis. Related party transactions through the date of the acquisition have been included within Note 17, 18, Related Party Transactions. By acquiring the remaining ownership interest in WCD, we were able to expand our agronomy platform, position ourselves as a leading supply partner to cooperatives and retailers serving growers throughout the United States and add value for our owners. The WCD enterprise value was determined using a discounted cash flow model in which the fair value of the business was estimated based on the earning capacity of WCD. We estimated the fair value of the previously held equity interest to be equal to 25% of the total fair value of WCD, which was implied based on the purchase price we paid for the remaining 75% interest. The acquisition-date fair value of the previous equity interest was $37.8 million and is included in the measurement of the consideration transferred. We recognized a gain of approximately $19.1 million as a result of remeasuring our prior equity interest in WCD held before the acquisition of the remaining 75% interest. The gain is included in other (income) loss in our Consolidated Statements of Operations.
Preliminary allocation Allocation of the purchase price for this transaction resulted in goodwill of $61.4 million, which is nondeductible for tax purposes, and definite-lived intangible assets of $47.2 million. As this acquisition is not considered to have a material impact on our financial statements, pro forma results of operations are not presented. The acquisition resulted in fair value measurements that are not on a recurring basis and did not have a material impact on our consolidated results of operations. Purchase accounting has not been finalized and preliminary fair values assigned to the net assets acquired are as follows:
| | | | | |
| (Dollars in thousands) |
| Cash | $ | 8,033 | |
| Other current assets | 708,764 | |
| Property, plant and equipment | 44,064 | |
| Goodwill | 61,358 | |
| Other intangible assets | 47,200 | |
| Other non-current assets | 55 | |
| Liabilities | (718,262) | |
| Total net assets acquired | $ | 151,212 | |
|
| | | |
| | (Dollars in thousands) |
| Cash | $ | 8,033 |
|
| Other current assets | 708,764 |
|
| Property, plant and equipment | 44,064 |
|
| Goodwill | 61,358 |
|
| Other intangible assets | 47,200 |
|
| Other non-current assets | 55 |
|
| Liabilities | (718,262 | ) |
| Total net assets acquired | $ | 151,212 |
|
Operating results for WCD are included in our Consolidated Statements of Operations from the day of the acquisition on March 1, 2019, through August 31, 2019, including2020. WCD revenues and income (loss) before income taxes of $456.2were $569.2 million and $19.0 million, respectively, for the year ended August 31, 2020, and $456.2 million and $12.9 million, respectively.
respectively, for the year ended August 31, 2019. Due to the timing of the acquisition during the third quarter of fiscal 2019, WCD's results prior to acquisition were not included in the fiscal 2019 or fiscal 2018 results.