Home Delivery Service
Customer Service
Innovation
Sleep Number’s global research and Development
With over 800 patents and patent applications pending worldwide, Sleep Number’s innovation pipeline is robust. The combination of trademark individualized comfort and adjustability features – with AI, biometric analysis and other digital tools – creates the sleep wellness platform, which is the foundation of a long-term value proposition. Paired with millions of connected sleepers with 80% monthly average smart bed user engagement and high customer lifetime value, the Company believes in the potential for expanded market relevance beyond the traditional mattress space into wellness technology and data, where there are many untapped consumer opportunities to solve persistent sleep issues.
Sleep Number is redefining the standards for monitoring sleep for research and health, and its smart bed ecosystem offers a non-invasive, real-world and accurate method to conduct sleep research. The Company’s wellness technology platform generates longitudinal sleep and biosignal data through a research-grade, multi-sensor ecosystem including ballistocardiography and AI/ML algorithms. This platform leverages high-resolution, full-body, continuous sensor recordings, as well as utilizing signal processing and machine-learning methods. Cloud infrastructure enables scale for one-to-many security and data sharing capabilities. Cloud intelligence and edge intelligence engines deliver advanced AI and analytics to generate a physical and digital immersive, adaptive and effortless sleep experience for each sleeper.
Sleep Number’s wellness technology platform automatically collects and analyzes billions of data points from millions of Smart Sleepers, conducting one of the largest sample sizes of sleep studies every night. To date, the Company has leveraged and learned from more than 24 billion hours of sleep data gathered from over 3 billion real-world sleep sessions, generating comprehensive longitudinal and ecologically-valid data to improve sleep quality. More than 433,000 individuals in its Smart SleeperSM community — and counting — have opted in to participate in ongoing sleep research and advance the science of sleep and health. This participation has led to rapid enrollment in Institutional Review Board (IRB)-approved studies, which combine the power of Sleep Number’s broad sleep database with subjective understanding of sleeper behaviors to understand real-world outcomes. The smart bed ecosystem is helping to advance the linkage of quality sleep to health, bringing significant benefits to real-world sleepers.
Sleep Number is pairing data and innovations with meaningful collaborations with world-leading partners in sleep, leveraging the potential of the Company’s research and technology to advance sleep science and to develop new products, services and synergistic interactions.
| 7 | 2023 FORM 10-K | SLEEP NUMBER CORPORATION | |||||||
Partnerships and Collaborations
Strategic partnerships amplify the effectiveness, impact and scale of Sleep Number’s brand and marketing efforts.
National Football League (NFL)
As the Official Sleep and Wellness Partner of the NFL since 2018, the partnership broadens Sleep Number’s brand reach, deepens its brand relevance and amplifies the benefits of its proprietary innovations. The partnership has led to unparalleled product adoption: 80% of NFL players have a Sleep Number smart bed*. With the extension of the partnership through 2027, Sleep Number expects to continue to actively support players and team personnel with their performance and recovery programs through sleep assessments, new innovations and more. As the NFL is expanding its schedule of international games, Sleep Number works directly with team training staff on integrating sleep into the teams’ schedule to ensure best on-field performance during and after international travel. Additionally, the Company also offers 1:1 coaching for players, deepening their engagement with their smart bed and quality sleep.
Sleep Number’s NFL partnership also includes partnership with the NFL Players Association (NFLPA) and the Professional Football Athletic Trainers Society (PFATS) which helps drive greater engagement on and off the field. Through Sleep Number content, seminars, and team sleep education meetings, the trainers and football medical personnel qualify for continuing education credits, the only of its kind for this community.
In 2023, Sleep Number had partnerships with five clubs — Super Bowl LIV, LVII and LVIII Champion Kansas City Chiefs, Super Bowl LVI Champion Los Angeles Rams, the Dallas Cowboys, Minnesota Vikings and Cincinnati Bengals— which add to its national media and community-activation efforts. These partnerships allow for focused communications in some of Sleep Number’s most important markets.
Additionally, the Company leverages the NFL audience to further support American Cancer Society (ACS), being recognized as “an Official Partner of Crucial Catch” and a presenting sponsor of the Defender, an online tool developed by ACS and the NFL to provide cancer prevention, screening and support. The Company included ACS in its brand communications to Smart Sleepers, in its work with the NFL, across its social media and more. Sleep Number customers were incredibly engaged in this work; through Sleep Number Rewards, they donated over $150,000 in reward certificates in 2023 to benefit ACS.
* Based on the number of active roster players eligible for the NFL player Sleep Number® bed program who received a bed between 7/23/18 and 11/28/22.
Health & Research Institutions
Through partnerships with world-leading health and wellness institutions, Sleep Number is advancing sleep science with its highly accurate, longitudinal sleep data. This data serves as the foundation for groundbreaking research on various health-related issues.
By enabling a longitudinal view of sleep habits for organizations that otherwise may not have access, Sleep Number believes current partnerships and collaborations with physicians, researchers and institutions – including the Mayo Clinic, American Cancer Society, Northwestern University, University of Pittsburgh and Sleep Number’s own Scientific Advisory Board – will deliver meaningful health solutions.
These partnerships will provide society with a comprehensive, accurate picture of how sleep affects health. In 2020, Sleep Number announced a collaboration with Mayo Clinic. Sleep Number is advancing the science of sleep by funding several Mayo Clinic research projects, including:
•Research to investigate the prevalence of disordered sleep (sleep apnea, insomnia and short sleep) in patients with Somali heritage and the implications for cardiovascular risk;
•Research to explore the relationship between disrupted sleep and markers of aging (telomeres, senescence, chronological EKG based on AI); and
•Research to explore excessive daytime sleepiness (EDS) and its cardiovascular implications.
| 8 | 2023 FORM 10-K | SLEEP NUMBER CORPORATION | |||||||
In 2022, Sleep Number formed a partnership with the American Cancer Society to study the connection between cancer and sleep quality, with the goal of developing the first-ever sleep strategies and guidance for cancer patients and survivors. With contributions from Sleep Number’s proprietary sleep data, American Cancer Society will conduct research over six years, which may lead to improved sleep outcomes for cancer patients and survivors. Additionally, Sleep Number supports cancer patients and caregivers through donations of sleep solutions to American Cancer Society Hope Lodges across the country. And, as part of the Crucial Catch partnership, Sleep Number inspired tens of thousands of NFL fans to learn more about cancer risks and prevention by driving activation of The Defender. In 2023, Sleep Number was named American Cancer Society’s Corporate Partner of the Year.
Intellectual Property
As a result of the Company’s R&D and strategic efforts, Sleep Number has continued to strengthen its patent portfolio, with a particular focus on smart features that improve sleep quality and thermal solutions to solve temperature disruptions to sleep. The Company holds various U.S. and foreign patents and patent applications regarding certain elements of the design and function of Sleep Number products, including air control systems, remote control systems, air chamber features, mattress construction, foundation systems, sensing systems, automated adjustments, in-bed temperature control, as well as other technology. Sleep Number has numerous U.S. patents, expiring at various dates between November 2025 and March 2042, and numerous U.S. patent applications pending. The Company also has numerous foreign patents, expiring at various dates between September 2026 and June 2045 and foreign patent applications pending. Notwithstanding these patents and patent applications, the Company cannot ensure that these patent rights will provide substantial protection or that others will not be able to develop products that are similar to, or competitive with, Sleep Number products.
Sleep Number has a number of trademarks and service marks registered with the U.S. Patent and Trademark Office, including Sleep Number®, SleepIQ®, Sleep Number 360®, 360®, the Double Arrow logo, Select Comfort®, AirFit®,Climate360®, Comfortaire®, Does Your Bed Do That?®, the DualTemp logo, the DualAir Technology Inside logo, FlexTop®, HealthIQ®, IndividualFit®, Know Better Sleep®, Pillow[ology]®, PillowFit®, Responsive Air®, Sleep Is Training®, Sleep Number Inner Circle®, Sleep30®, Smart SleeperSM,Tech-e®, This Is Not A Bed®, and We Make Beds Smart®. We have several trademarks that are the subject of pending applications, including Auto Snore™, DualTemp™, EnviroIQ™, HeartIQ™, Individualized Sleep Experiences™, Inspire Next Level™, Perform Next Level™, RespiratoryIQ™, Retail Flow™, Sleep Next Level™, Sleep Number Labs logo, Sleep Number Labs Sleep For The Future logo, and WellnessIQ™. Each registered mark is renewable indefinitely as long as the mark remains in use and/or is not deemed to be invalid or canceled. The Company also has a number of common law trademarks, including ActiveComfort™, Clima-Temp™, Comfortable. Adjustable. Affordable.™, ComfortFit™, CoolFit™, DualAir™, Firmness Control™, FlexFit™, In Balance™, Partner Snore™, The Bed Reborn™, The Bed That Moves You™, The Best Bed For Couples™, True Temp™, Winter Soft™ and the Company’s bed model names.
Several of the Company’s trademarks have been registered, or are the subject of pending applications for registration, in various foreign countries. Sleep Number also has other intellectual property rights related to its products, processes and technologies, including trade secrets, trade dress and copyrights. The Company protects and enforces its intellectual property rights, including through litigation, as necessary.
| 9 | 2023 FORM 10-K | SLEEP NUMBER CORPORATION | |||||||
Industry and Competition
Up to 50% of the developed world’s population experiences sleep deficiencies. In the United States, sleep disorders have been declared a public health epidemic by the U.S. Center for Disease Control. Sleep Number is focused on innovations that will address this growing problem. The total U.S. sleep-health economy was estimated to be over $30 billion in a 2017 $28report published by McKinsey & Company. This reflects the traditional view of the bedding industry, which includes the sales of mattresses and foundations, as well as emerging solutions for insufficient sleep such as routine modifications and therapeutic treatments. As the sleep-health economy continues to evolve, Sleep Number intends to play a role in the digital health market as consumers look for products and reliable data sources to address their overall wellbeing. The digital health market is $77 billion in the U.S. alone; $211 billion globally with markets expecting to expand by 4x by 2030.
The traditional view of the U.S. bedding industry, including mattresses and foundations (static and adjustable), is measured through data provided by the International Sleep Products Association (ISPA). According to ISPA*, the industry has grown by approximately 4% annually over the last 20 years, including 4% annually, on average, over the past five years. According to ISPA* and the Company’s estimates, industry wholesale shipments of mattresses and foundations (including imported products and adjustable bases) were approximately $12 billion in 2022 (approximately $23 billion at retail). The U.S. bedding industry has experienced recessionary demand levels for the past two years. After peaking at 33 million mattress units in 20162020, the U.S. bedding industry has experienced an estimated 25% decline in units to end 2023 at approximately 25 million mattress units. The 2023 U.S. mattress unit levels are the lowest annual levels since 2015 and $16per capita spending on mattresses is also at historic lows approaching levels not seen since the 2008/2009 great recession. These data points signal the potential for pent-up demand as the sector recovers.
The retail bedding industry is commoditized and highly competitive. Sleep Number competes against regional and local specialty bedding retailers, bedding manufacturers, home furnishing stores, mass merchants, national discount stores and online marketers. Furniture Today, a furniture industry trade publication, has ranked Sleep Number as the third largest U.S. bedding retailer and etailer for 2022, with an estimated 9% market share of industry retail revenue. Sleep Number’s consumer innovation strategy with proprietary sleep innovations and exclusive direct-to-consumer distribution is highly differentiated, resulting in lifelong customer relationships and contributing to the Company’s continued profitable growth.
Manufacturers in the bedding industry mostly compete through national and regional retail partners, regional manufacturing verticals, and online direct-to-consumer. Price, quality, brand name recognition, product availability and product performance are the primary ways manufacturers differentiate themselves. There is a high degree of concentration among manufacturers who produce innerspring, memory foam and hybrid beds under nationally recognized brand names, including Tempur-Pedic, Sealy, Stearns & Foster, Serta, and Simmons. National manufacturers still dominate the bedding industry. Newer brands like Purple, Casper, and Nectar, which started online have now moved into traditional retail channels for growth.
*2023 ISPA industry information had not been published at the time of this report.
Seasonality
The Company’s business is modestly impacted by seasonal influences inherent in the U.S. bedding industry and general retail shopping patterns. The U.S. bedding industry generally experiences lower sales demand in the second quarter of the calendar year and increased sales demand during selected holiday or promotional periods.
| 10 | 2023 FORM 10-K | SLEEP NUMBER CORPORATION | |||||||
Working Capital
The Company is able to operate with minimal working capital requirements because it sells directly to customers, utilizes both “make-to-order” and “make-to-stock” production processes and operates retail stores that serve mainly as showrooms. Sleep Number has historically generated sufficient cash flows to self-fund operations through an accelerated cash-conversion cycle. The Company’s Credit Agreement provides a revolving credit facility for general corporate purposes with net aggregate availability of $685 million. The Credit Agreement contains an accordion feature that allows the Company to increase the amount of the credit facility from $685 million up to $1.0 billion in 2015.total availability, subject to Lenders’ approval. The Credit Agreement matures in December 2026.
Qualified customers are offered revolving credit to finance purchases through a private-label consumer credit facility provided by Synchrony Bank. Approximately 48% of net sales in 2023 were financed by Synchrony Bank. The Company’s current agreement with Synchrony Bank expires December 31, 2028, subject to earlier termination upon certain events. The Company pays Synchrony Bank a fee for extended credit promotional financing offers. Under the terms of the agreement, Synchrony Bank sets the minimum acceptable credit ratings, interest rates, fees and all other terms and conditions of the customers’ accounts, including collection policies and procedures. As the receivables are owned by Synchrony Bank, at no time are the receivables purchased or acquired from the Company. Sleep Number is not liable to Synchrony Bank for its customers’ credit defaults. In connection with all purchases financed under these arrangements, Synchrony Bank pays the Company an amount equal to the total amount of such purchases, net of promotional related discounts, upon delivery to the customer.
Information Systems
See Item 1C. Cybersecurity for further information regarding the information set forth in Part I, Item 1A., Risk Factors, for a discussion of certain risks that may be encountered in connection with ourCompany’s cybersecurity risk management information systems.program.
Governmental Regulation and Compliance
As a vertically integrated manufacturer and retailer, we arethe Company is subject to extensive federal, state and local laws and regulations affecting all aspects of ourits business.
As a manufacturer, we areSleep Number is committed to product quality and safety, including adherence to all applicable laws and regulations affecting our products.the Company’s products and services. Compliance with health, safety and environmental laws and regulations, including the federal fire retardant standards developed by the U.S. Consumer Product Safety Commission, includingwhich requires rigorous and costly testing, has increased the cost and complexity of manufacturing ourthe Company’s products and may adversely impact the speed and cost of product development efforts. Further, ourthe Company’s manufacturing, distribution, delivery and other business operations and facilities are or may, become subject to additional federal, state or local laws or regulations relating toincluding supply chain transparency, conflict minerals sourcing and disclosure, end-of-life disposal, recycling and recyclingpackaging requirements, transportation, electrification of the Company’s vehicle fleet and other laws or regulations relating to environmental protection and health and safety requirements. We are not aware of any national or local environmental laws or regulations that may require material capital expenditures or which may materially affect our competitive position or our operational results, financial position or cash flows.
As a retailer, we arethe Company is subject to additional laws and regulations that apply to retailers generally and govern the marketing and sale of ourthe Company’s products and the operation of both ourSleep Number retail stores and our e-commerce activities. Many of the statutory and regulatory requirements whichthat impact ourthe Company’s retail and e-commerce operations are consumer-focused and pertain to activities such as the Company’s promotions, advertising and selling of credit-based promotional offers,claims, marketing practices, pricing, consumer credit offerings, truth-in-advertising, consumer privacy, “do not call/mail” requirements, text messaging requirements, warranty disclosure, delivery timing requirements, accessibility and similar requirements.
The Company’s operations are or may become subject to federal, state and local labor laws including, but not limited to, those relating to occupational health and safety, employee privacy, wage and hour, overtime pay, pay transparency, harassment and
| 11 | 2023 FORM 10-K | SLEEP NUMBER CORPORATION | |||||||
discrimination, equal opportunity and employee leaves and benefits. We areThe Company is also subject to existing and emerging federal and state laws relating to insider trading, data security.security, privacy, cybersecurity disclosure, clawback policy disclosures and greenhouse gas measurement and climate impact disclosure.
It is ourSleep Number’s policy and practice to comply with all legal and regulatory requirements and ourrequirements. The Company’s procedures and internal controls are designed to promote such compliance.
At December 30, 2017, we2023, Sleep Number employed 4,099 individuals, including 2,105a total of 4,145 team members, of which 77 were classified as part-time and 14 were employed on a temporary basis. The breakdown of team members by area was as follows: 2,125 in retail sales and support, team members, 412490 in field services, 372 in customer service, team members, 1,080423 in manufacturing and logistics, and 735 in technology, corporate, management and administrative positions. Forty-two percent of team members are racially diverse and 40% are women.
Sleep Number’s holistic approach to talent management, designed to attract, motivate, develop, reward and retain the right talent, is critical to the execution of the Company’s consumer innovation strategy. The Company sustains its inclusive culture built on individuality and wellbeing by providing an exceptional team member experience, offering ample opportunities for professional learning and advancement. Sleep Number leaders are deeply committed to the success of its talent management approach and the Company holds itself accountable by routinely measuring its progress on a variety of elements and metrics including:
•Retention: To advance brand awareness, increase overall candidate traffic and diverse hiring, and improve retention strategies, Sleep Number tracks numerous talent recruitment, retention and turnover metrics, including new hires on a monthly, quarterly and rolling 12-month basis;
•Diversity, Equity and Inclusion (DEI): Sleep Number’s approach to DEI is designed to embrace different perspectives, cultivate an inclusive environment and empower its team members. The Company maintains a dashboard that tracks race/ethnicity and gender by job grade, tenure and generation to provide increased visibility to leaders across the Company on progress toward key goals. The Company also measures and reports a team member inclusion and belonging index, and has conducted a self-identification survey to learn how team members identify and how they want to be appreciated as individuals;
•Engagement: Sleep Number has a continuous listening strategy to ensure it stays connected to the voice of its team members at critical times of the team member experience. The key survey touchpoints are at new hire, pulse check-in, annual engagement and exit, enabling leaders to monitor team member sentiment and course-correct in real time as appropriate;
•Performance Management: Sleep Number utilizes a human capital management (HCM) system to track and follow team member performance evaluations, competency assessments and development plans. The Company uses its HCM system to monitor the completion of learning courses for its team members. Sleep Number’s enterprise learning management system provides all team members access to an equitable learning and training curriculum that is dynamic and mobile-accessible;
| 12 | 2023 FORM 10-K | SLEEP NUMBER CORPORATION | |||||||
•Safety: Sleep Number has a commitment to maintain a safety-first mindset. The Company has policies and practices that create clear expectations for how each team member contributes to a safe and healthy workplace. The Company collects and monitors workplace injury and accident information across all its locations and takes appropriate steps to reduce incident rates, number of workers’ compensation claims and lost workdays. The Company actively evolves its health and safety policies during the year to ensure the safety of its team members and 502 managementcustomers; and administrative team members. Approximately 72
•Total Rewards: Sleep Number benchmarks and reviews, at least annually, all aspects of ourits total rewards program to ensure programs are valued, equitable and competitive. Sleep Number’s rewards offering is unique because in addition to competitive base pay, all team members were employedparticipate in some type of variable pay program (e.g., bonus, commissions) and more than 99% of employees are eligible to participate in medical, dental and vision insurance offerings as well as 401(k), spending accounts and life insurance. Sleep Number also offers all team members access to mental health, caregiver and LGBTQ+ support resources. The Company’s overall Total Rewards offering is committed to maintaining reward programs that help employees be their best self at work and in life through a holistic approach to wellbeing, including physical, emotional, financial, community and career health.
Commitment to Environmental Stewardship, Social Progress and Corporate Governance
Sleep Number’s purpose – to improve the health and wellbeing of society through higher quality sleep – is foundational to the Company’s culture of individuality, central to its consumer innovation strategy, and inherent in its commitment to continually advance environmental stewardship, social programs, and governance practices. The Company’s deep commitment to do the right thing and make the world a better place underlies its priorities.
Environmental
The Company’s sustainability efforts are focused on aligning and integrating environmental stewardship with the pursuit of sustainable, profitable growth, an approach that benefits all stakeholders. The Company is engaging constructively with industry peers, supply chain partners and external stakeholders to accelerate the transition to a part-time or temporary basis at December 30, 2017. Except for manageriallow-carbon economy and working hard to better understand and reduce the impact of manufacturing, supply chain, retail operations and products throughout their life cycles. The Company is also raising awareness of its actions and plans among Sleep Number team members and professional support staff, allinviting their ideas on ways to progress the Company’s environmental efforts, including:
•Maturing greenhouse gas (GHG) measurement methodologies and enhancing documentation for disclosure and reporting;
•Refining business operations across the fulfillment chain to profitably improve the Company’s environmental footprint; and
•Building the Company’s material circularity capability to extend the useful life of ourselect components and reduce waste.
Social
Sleep Number takes seriously its responsibility to its stakeholders, including team members, are paidconsumers, community, suppliers and shareholders, and is tireless in its efforts to advance social priorities. The Company is:
•Striving to create and sustain a workplace culture of inclusion and belonging, grounded in its shared purpose and values. By prioritizing wellbeing, the Company seeks to create a safe environment in which every team member can bring their authentic and whole self to work every day and is empowered to reach their highest potential;
•Committed to advancing sleep health through innovations that, informed by data and scientific expertise, benefit millions of individuals and contribute to the health and wellbeing of society; and
•Actively engaging its suppliers on an hourly basis (plus commissionscommitments to and compliance with human rights, health and safety standards.
| 13 | 2023 FORM 10-K | SLEEP NUMBER CORPORATION | |||||||
Governance
Sleep Number has a longstanding record of strong corporate governance, grounded in the values, culture, policies and training that guide its business decisions. Building on this record, the Company is proactively taking steps to strengthen oversight, controls and practices that reinforce its commitment to the highest standards of integrity and accountability and continue to earn stakeholder trust, including:
•Advancing compliance readiness for sales professionals). Additionally, we provide various broad-participation incentive compensation programs tiednewly enacted and proposed state and federal disclosure rules;
•Developing internal systems to various performance objectives. None of our team members are represented by a labor union or covered by a collective bargaining agreement. We have a highly engaged team working in a values-driven culture, which we believe is important for an innovation company with such an aspirational visionsupport reporting under the Task Force on Climate-related Financial Disclosures framework; and life-changing mission.
Additional information is available in the Company’s Corporate Sustainability Report, posted within the Investor Relations section of the Sleep Number website. It may be accessed at www.sleepnumber.com: select the “Investors” link, the “ESG” link and then “Sustainability Reports.” The information contained on the Company’s website or connected to its website is not incorporated by reference into this Form 10-K and should not be considered part of this report.
| 14 | 2023 FORM 10-K | SLEEP NUMBER CORPORATION | |||||||
Information about the Company’s Executive Officers
SHELLY R. IBACH, 5864
Chair, President and Chief Executive Officer (Joined the Company in April 2007, and was promoted to President and CEO in June 2012)2012 and became Chair of the Board of Directors in May 2022)
Shelly R. Ibach, Sleep Number® setting 40, isserves as the Chair, President and Chief Executive Officer (CEO) for Sleep Number (NASDAQ:(Nasdaq: SNBR). From June 2011 to June 2012, Ms. Ibach served as the company’sCompany’s Executive Vice President and Chief Operating Officer and from October 2008 to June 2011, she served as Executive Vice President, Sales &and Merchandising. Ms. Ibach joined the companyCompany in April 2007 as Senior Vice President of U.S. sales for company-ownedCompany-owned channels. Before joining the company,Company, Ms. Ibach was Senior Vice President and General Merchandise Manager for Macy’s home division. From 1982 to 2005, Ms. Ibach held various leadership and executive positions within Target Corporation.
FRANCIS K. LEE, 52,
Executive Vice President and Chief Financial Officer (Joined the Company in August 2023)
Francis K. Lee, Sleep Number® setting 45, joined Sleep Number in 2023, and leads the Company’s teams to drive sustainable, profitable growth and strengthen total shareholder return. Mr. Lee is a global finance and strategy leader with extensive experience across consumer product, retail, and technology companies. Formerly the CFO at Wyze Labs, a smart home products company, from 2021 to 2023, Mr. Lee increased cash flow and profitability through a business model evolution, adding a software recurring revenue stream. From 2007 to 2020, Mr. Lee served at Nike, Inc., an athletic footwear and apparel company, in several corporate and operating unit leadership positions, including CFO of Nike Japan and executive roles in global finance. Mr. Lee also worked at Gap Inc., leading long-range planning across the company on the Corporate Strategy and Development team. After completing his MBA at Northwestern University Kellogg School of Management, Mr. Lee served as a consultant to Fortune 500 companies at Marakon Associates.
MELISSA BARRA, 4652
Melissa Barra, Sleep Number® setting 30, serves as the Executive Vice President and Chief Sales and Services Officer. Ms. Barra leads the Company’s customer-focused strategy and its sales, real estate, field services, customer relationship, and corporate technology teams. From June 2019 to December 2020, Ms. Barra was Senior Vice President, Chief Sales, Services and Strategy Officer. Ms. Barra was Senior Vice President and Chief Strategy and Customer Relationship Officer. Ms. Barra wasOfficer from January 2015 to June 2019 and Vice President, Consumer Insights and Strategy from February 2013 to January 2015. Prior to joining Sleep Number in February 2013, Ms. Barra was Vice President, Process Reengineering Officer for Best Buy Co., Inc. from 2011 to 2012. In a dual role, she also served as Vice President, Finance, New Business Customer Solutions Group from 2010 to 2012. From 2005 to 2010, she held leadership positions in Strategic Alliances and Corporate Development for Best Buy. Prior to Best Buy, Ms. Barra held corporate finance and strategy leadership roles in companies in the U.S. and internationally includingin process reengineering, finance, strategic alliances and corporate development for Best Buy, Grupo Futuro S.A., Citibank and GE Capital.
Annie L. Bloomquist, Sleep Number® setting 25, serves as Executive Vice President and Chief Innovation Officer. Ms. Bloomquist leads the Company’s sleep innovation strategy, including research and development of its physical and digital smart bed ecosystem, digital engagement with its Smart Sleeper community, and strategic partnerships to further sleep science, health and wellbeing. Ms. Bloomquist was the Senior Vice President and Chief Product Officer from June 2012 to December 2020 and leads all product innovation, research and development for software and hardware, product brand management, clinical sleep research and merchandising. Ms. Bloomquist was the Chief Product and Merchandising Officer from June 2011 to June 2012. Ms. Bloomquist joined Sleep Number in May 2008 as Vice President and General Merchandise Manager. Prior to joining Sleep Number, Ms. Bloomquist held leadership positions in productgeneral management, sourcing, buying, development and merchandisingplanning at Macy’s and Marshall Field’sThe Department Stores for Target Corporation.
| 15 | 2023 FORM 10-K | SLEEP NUMBER CORPORATION | |||||||
KEVIN K. BROWN, 4955
CHRISTOPHER D. KRUSMARK, 44
Executive Vice President and Chief Human Resources Officer (Joined the Company in 2005, was promoted to Chief Human Resources Officer in July 2020)
Chris Krusmark, Sleep Number® setting 55, serves as the Executive Vice President and Chief Human Resources Officer, where he leads all human resources, training and learning functions. From January 2023 through August 2023, Mr. Krusmark also served as Interim CFO. Prior to being promoted to his Chief Human Resources Officer role in July 2020, Mr. Krusmark served as Sleep Number’s Vice President of GlobalSales Operations, Field Services and Integration, leadingTraining where he led retail and home delivery operations and wholesale business development. From June 2005 to October 2015, Mr. Krusmark held a 6,500+ person operations organizationvariety of leadership roles in finance at Sleep Number supporting sales, real estate, marketing and driving a culture changeproduct. Prior to embrace lean acrossjoining Sleep Number, Mr. Krusmark worked on the entire enterprise. In July 2014, he was promoted tofinancial audit staff of EY and Arthur Andersen.
J. HUNTER SAKLAD, 54
Executive Vice President and Business Unit Head of Europe Middle East & Africa (EMEA) for Polaris, where he was responsible for a full P&L with factories, R&D centers, subsidiaries, distributors and dealer networks across more than 60 countries. From 2007 to 2010, he served as Vice President Global Operations,Chief Supply Chain and IT at a division of UTC Fire & Security. Krishna also served in a variety of roles for Diageo, including Vice President of Supply Chain, North America; as a Program Director for an ERP implementation; and as a Director of Strategic Planning and Finance. Earlier in his career he was an associate at Booz Allen & Hamilton.
Hunter Saklad, Sleep Number® setting 50, is65, serves as the Executive Vice President and Chief Supply Chain Officer at Sleep Number and leads the Company’s sourcing, procuring, inventory planning and manufacturing capabilities. From December 2012 to December 2020, Mr. Saklad served as Senior Vice President and Chief Information Officer at Sleep Number.Officer. From June 2011 to December 2012, Mr. Saklad served as the Vice President, Consumer Insight and Strategy at Sleep Number. From March 2006 to June 2011 he was Vice President of Finance and held a variety of positions across Finance serving business partners in marketing, sales, supply chain, FP&A, investor relations and treasury. Mr. Saklad joined Sleep Number in October 2004 as Sr. Director of Finance. Prior to joining Sleep Number, Mr. Saklad held finance leadership roles at Ford Motor Company and Visteon.
| 16 | 2023 FORM 10-K | SLEEP NUMBER CORPORATION | |||||||
Available Information
Copies of any of the above referencedabove-referenced information will also be made available, free of charge, upon written request to:
Sleep Number Corporation
Investor Relations Department
1001 Third Avenue South
Minneapolis, MN 55404
| 17 | 2023 FORM 10-K | SLEEP NUMBER CORPORATION | |||||||
ITEM 1A. RISK FACTORS
An investment in ourSleep Number’s common stock involves a high degree of risk. You should carefully consider the specific risks set forth below and other matters described in this Annual Report on Form 10-K before making an investment decision. The risks and uncertainties described below are not the only ones facing us.the Company. Additional risks and uncertainties, including risks and uncertainties that impact the business environment generally, those not presently known to usthe Company, or those that weit currently seesees as immaterial, may also harm ourits business. If any of these risks occur, ourthe Company’s business, results of operations, cash flows and financial condition could be materially and adversely affected.
Adverse changes in general economic conditions have reduced, and could materiallycontinue to reduce discretionary consumer spending and, as a result, have adversely affected and could continue to adversely affect ourthe Company’s sales, profitability, cash flows, availability of credit, and financial condition.
During 2022 and 2023, high inflation due to various economic factors, adversely affected the Company’s business operations and financial results by increasing the costs of fuel, shipping, raw materials, labor, commodity, and other costs and may continue to do so going forward. While the Company has historically been able to pass along some cost increases to its customers, it has not and may not be able to offset such higher costs through price increases or other means, and its margins, profitability, cash flows, availability of credit, and financial condition have been and could continue to be adversely impacted.
The Federal Reserve significantly increased the federal funds rate in 2022 and 2023 and has not reduced the rate to date. Such rate increases, as well as decisions and timing on whether or not to reduce the rate, have and may continue to negatively affect customer purchasing behavior, which has and may continue to adversely affect the Company’s sales, profitability, cash flows, credit availability, and financial condition. It is uncertain whether the Federal Reserve will hold, reduce, or increase the rate going forward and such uncertainty, as well as any Federal Reserve action or non-action with respect to the rate, has and may continue to negatively affect customer purchasing behavior, which has and may continue to adversely affect the Company’s sales profitability, cash flows, credit availability, and financial condition.
The United States debt ceiling and budget deficit concerns have increased the possibility of credit-rating downgrades, economic slowdowns, or a recession in the United States. There remain increased risks of a government shutdown or sovereign default if the spending bills necessary to fund the government through 2024 are not passed by Congress. Whether or not these concerns materialize, growing uncertainty may reduce consumer confidence and increase levels of unemployment, all of which may reduce demand for the Company’s products, causing harm to its sales, profitability, cash flows, availability of credit, and financial condition.
Additionally, instability or disruptions to credit markets or the financial services industry, including banks that fail or otherwise become distressed, could adversely affect the Company’s, sales, operations, profitability, cash flows, availability of credit, and financial condition.
| 18 | 2023 FORM 10-K | SLEEP NUMBER CORPORATION | |||||||
Increases in interest rates has increased and may continue to increase the cost of servicing the Company’s indebtedness and have an adverse effect on its results of operations, cash flows and stock price.
The Company’s credit facility currently bears interest at a variable rate based on its leverage ratio. The Company bears the risk that the rates charged by the Company’s lenders will outpace expectations and the earnings and cash flow of its business. This has reduced the Company’s profitability and has potential to continue to reduce profitability in addition to the potential to adversely affect the Company’s ability to service its debt, or cause the Company to breach covenants or other terms contained in its Credit Agreement, which could materially adversely affect the Company’s business, financial condition and results of operations.
In 2023, the average interest rate with respect to the Company’s credit facility significantly increased year-over-year, which has and continues to adversely affect the Company’s profitability, operations and reported earnings-per-share.
A reduction in the availability of, or increase in the cost of, credit to consumers generally or under the Company’s existing consumer credit programs has negatively impacted, and could continue to negatively impact, the Company’s sales, profitability, cash flows and financial condition.
Synchrony Bank provides credit to the Company’s customers through a private label credit card agreement that is currently scheduled to expire on December 31, 2028, subject to earlier termination upon certain events. Synchrony Bank has discretion to control the content of financing offers to the Company’s customers and to set minimum credit standards under which credit is extended to customers.
Reduction of credit availability due to changing economic conditions, including rising inflation, increased interest rates, changes in credit standards under the Company’s private label credit card program or changes in regulatory requirements, or the termination of its agreement with Synchrony Bank, could harm the Company’s sales, profitability, cash flows and financial condition.
The Company may not be successful in achieving the expected cost savings, efficiencies, and other benefits related to its business restructuring actions and such actions could have unexpected adverse effects on the Company.
The Company’s strategy includes identifying and executing cost savings and operating efficiencies to increase financial resilience by expanding profit margins and cash flows to pay down debt as part of its operating transformation to a more durable business model. The Company may not be successful in fully implementing its cost savings plans or realizing anticipated savings and efficiencies, including potentially as a result of factors outside the Company’s control. A failure or delay in implementing or realizing the anticipated savings and efficiencies of its cost savings plans and related strategic initiatives could materially and adversely impact the Company’s business, results, profitability, cash flows, availability of credit, and financial condition. Charges and costs incurred in connection with implementing the cost savings plan and business restructuring actions may be significant and have and may continue to be higher than expected. In addition, implementing the cost savings plans could unexpectedly and negatively impact the Company’s workforce, partnerships, initiatives, innovation, and development plans or otherwise interfere with the Company’s ability to grow and compete effectively, each of which could adversely impact the Company’s business, results, profitability, cash flows, availability of credit, and financial condition.
| 19 | 2023 FORM 10-K | SLEEP NUMBER CORPORATION | |||||||
Risks Related to the Company’s Reliance on Third Parties and Reliance on a Global Supply Chain
The Company relies upon several key suppliers and third parties that are, in some instances, the only source of supply or services currently used by the Company for particular materials, components, products, services, or consumer financing. A disruption in the supply or substantial increase in cost of any of these products or services has, and could continue to, harm the Company’s sales, profitability, cash flows, availability of credit, and financial condition.
Sleep Number currently obtains all the materials and components used to produce its smart beds from outside sources including some that are located outside the United States. In several cases, including its air chambers, integrated non-adjustable foundations, adjustable foundations, various components for its Firmness Control and Smart Control systems, certain electronic componentry, certain foam formulations, as well as its fabrics and zippers, the Company obtains these materials, components and products from suppliers who serve as the only source of supply, or who supply the vast majority of the Company’s needs of the particular material, component or product. While the Company believes that some of these materials, components and products, or suitable replacements, could be obtained from other sources in the event of a disruption or loss of supply, it has not been able to, and in the future may not be able to, find alternative sources of supply or alternative sources of supply on comparable terms, quantities and timelines. If the Company’s relationship with these suppliers or the suppliers’ services are disrupted, terminated or otherwise negatively impacted, the Company could have difficulty in replacing these sources since there are relatively few other suppliers presently capable of manufacturing these components and products. Constraints on the ability of certain of its suppliers to timely meet commitments, including in an environment of increased demand for consumer products and labor challenges, has, and may continue to, adversely impact the Company’s ability to meet its product demand, result in additional costs, or otherwise adversely impact the Company’s business, operations and financial results.
The Company also relies on several suppliers for information technology systems and services as well as on Synchrony Financial for the majority of its consumer financing services. If the Company’s relationship with these suppliers or the suppliers’ services are disrupted, terminated or otherwise negatively impacted, the Company could have difficulty in replacing these services in a timely and cost-effective manner, adversely impacting the Company’s sales, profitability, cash flows, availability of credit, and financial condition.
In addition, third parties on which the Company relies may, for various reasons have demanded or required or may demand or require changes to their payment terms and frequency, credit limits and exposures, or other contractual terms with the Company. If the Company is unable to accommodate or otherwise resolve such demands or changes, the Company’s supply of goods, products and services from these third parties could be disrupted, terminated or otherwise negatively impacted and the Company may not be able to or could have difficulty in replacing the supply of such goods, products and services in a timely and cost-effective manner, adversely impacting the Company’s sales, profitability, cash flows, availability of credit, and financial condition.
Fluctuations in commodity prices or availability or third-party delivery or logistics costs has resulted, and could continue to result, in an increase in component costs and/or delivery costs.
The Company’s business is subject to significant increases or volatility in the prices of certain commodities, including but not limited to electronic componentry, fuel, oil, natural gas, rubber, cotton, plastic resin, corrugate, steel and chemical ingredients used to produce foam, as well as third-party logistic costs. Increases in prices of these commodities or logistics costs or other inflationary pressures have resulted, and may continue to result, in significant cost increases for the Company’s raw materials and product components, as well as increases in the cost of delivering its products to customers. The Company has been, and may continue to be, unable to offset any such increased costs through value engineering and similar initiatives, or through price increases, and, as a result, the Company’s profitability, cash flows and financial condition have been, and may continue to be adversely impacted. Price increases to offset the increased costs, have, and may continue to, adversely impact the Company’s sales volumes.
The Company relies on third parties to deliver some of its products to its facilities and customers on a timely and cost-effective basis. These third-party providers could be vulnerable to labor challenges, liquidity concerns, the impacts of global health conditions, or other factors that may result in disruption, delays in deliveries or increased costs of deliveries. Any significant delay in deliveries to its customers could lead to increased cancellations or returns and cause the Company to lose sales or incur increased costs. Delays in deliveries and increases in freight charges or other costs of deliveries has and could continue to harm the Company’s sales, profitability, cash flows and financial condition.
| 20 | 2023 FORM 10-K | SLEEP NUMBER CORPORATION | |||||||
The Company’s business is subject to risks inherent in global sourcing activities.
Sleep Number’s air chambers, certain electronic components, and some of its other components are manufactured outside the United States, and therefore are subject to risks associated with foreign sourcing of materials, including but not limited to:
•Existing or potential duties, tariffs or quotas on certain types of goods that may be imported into the United States;
•Foreign regulations that may impact availability or cost of supply;
•Political instability, unrest, geopolitical turmoil, acts of terrorism, global conflicts (such as any conflict that may arise between China and Taiwan) or war (such as the war between Russia and Ukraine and the war between Israel and Hamas), outbreaks of pandemics or contagious diseases, shipping delays, foreign or domestic strikes, customs inspections, or other factors resulting in disruption in supply, transportation, trade, labor, or the availability of global contractors utilized in the Company’s business operations;
•Foreign currency fluctuations;
•Economic uncertainties, including inflation; and
•Adverse weather conditions, climate change or other natural or man-made disasters.
The Company cannot predict whether the countries in which some of its components are manufactured, or may be manufactured in the future, or where the Company contracts for labor will be subject to new or additional trade restrictions imposed by the United States or other foreign governments, including the likelihood, type, or effect of any such restrictions. The United States government has implemented certain trade policies, including imposing tariffs on certain goods imported from China and other countries and imposing sanctions against Russia as a result of the war in Ukraine, and may take further actions with respect to these policies in the future. Additionally, although the Company does not have operations in Russia, Belarus, or Ukraine and has not been directly impacted by the war in Ukraine, some of the Company’s third-party suppliers have disclosed that they may source, directly or indirectly, a portion of their supply chain requirements of gold, tantalum, tin, and tungsten (collectively the “3TGs”), as well as birch plywood from Russia. Similarly, some of the Company’s third-party suppliers have disclosed that they may source, directly or indirectly, a portion of their supply chain requirements of 3TGs or fabrics from China, which materials have generally been under scrutiny for potential ties to Uyghur forced labor camps. These factors have, and could continue to, increase the costs of doing business with foreign suppliers, lead to inadequate inventory levels or delays in shipping products to customers, or the need to find new sources for certain materials on short notice, which could harm the Company’s sales, customer satisfaction, profitability, cash flows and financial condition.
The locations where Sleep Number and its suppliers and global contractors operate have experienced, and may experience in the future, adverse regional events such as extreme weather conditions, climate change and other natural and man-made disasters, which could have a significant adverse effect on the Company, its ability to source necessary materials, components and products, and its ability to develop, launch, sell and deliver its products to customers. Climate change may increase the frequency and severity of adverse weather conditions and other natural disasters. All regions of the U.S. and warmer climates globally may be particularly impacted by extreme weather, such as hurricanes, natural disasters, droughts, wildfires and rising sea levels. These events have disrupted, and may continue to, disrupt the Company’s operations and ability to source components and products.
The Company has been, and could continue to be, vulnerable to shortages in supply of components necessary to manufacture its products due to its manufacturing processes which operate with minimal levels of inventory or due to global shortages of supply of electronic componentry or other materials, which, in turn, has and may continue to harm its ability to satisfy consumer demand and adversely impact the Company’s sales and profitability.
A significant percentage of the Company’s products are assembled after it receives orders from customers utilizing manufacturing processes with minimal levels of raw materials, work-in-process and finished goods inventories. Lead times for ordered components may vary significantly, and some components used to manufacture its products are provided on a sole source basis. The Company’s ongoing efforts to mitigate supply chain weaknesses may not be
| 21 | 2023 FORM 10-K | SLEEP NUMBER CORPORATION | |||||||
successful or may have unfavorable effects such as increased storage costs or excess supply. Shortage of materials caused by disruptions or unavailability of supply or an increase in the demand for some or all of its products, has harmed and could continue to harm the Company’s ability to satisfy customer demand, delay deliveries of its products to customers, lead to customer cancellations and returns, delay the development and launch of new products, and increase its costs. In addition, the Company may carry some excess inventory of certain components for various products from time to time especially when the Company has faced component shortages or when the Company introduces new products that use different components, and if the Company is unable to use that excess inventory fully or timely, the Company may run the risk of obsolescence, which could result in write-downs of inventory and an adverse effect on gross margins. Any such impacts or delays could adversely affect the Company’s sales, customer satisfaction, profitability, cash flows and financial condition.
Risks Related to the Company’s Marketing Strategy and Execution of Total Retail Distribution Strategy
The Company’s future growth and profitability dependsdepend upon the effectiveness and efficiency of ourits marketing programs.
The Company relies in part upon third parties, such as social media influencers and athletes, to market its brand, and are unable to fully control their efforts. Influencers and athletes with whom the Company maintains a relationship could engage in behavior or use their platforms to communicate directly with Sleep Number’s customers in a manner that reflects poorly on its brand, and these communications may be attributed to the Company or otherwise adversely affect the Company. It is not possible to prevent such behavior, and the precautions the Company takes to prevent or detect this activity may not be effective.
Consumers are increasingly usinghaving digital toolsexperiences and interactions as a part of their shopping experience. As a result, ourthe Company’s future growth and profitability will depend in part on (i) the effectiveness and efficiency of our on-linethe Company’s online experience, including without limitation advertising and search marketing and optimization programs, in generating consumer awareness and sales of our products,its products; (ii) ourthe Company’s ability to prevent confusion among consumers that can result from search engines that allow competitors to use or bid on ourits trademarks to direct consumers to competitors’ websites through confusing or misleading advertisements; (iii) ourits ability to prevent Internet publication of false or misleading information regarding ourits products or ourthe Company’s competitors’ products; (iv) reviews of Sleep Number’s products; (v) the nature and tone of consumer sentiment, including those published on various social media sites;online or elsewhere; and (v)(vi) the stability of ourthe Company’s website. In recent periods, competitorCompetitor spending on Internet-baseddigital marketing programs has increased,and may continue to increase, including without limitation from a number of direct-to-consumer, Internet-baseddigital and omnichannel retailers, which, in turn, has and may continue to increase the cost of basicthe Company’s digital marketing programs and online search terms and the cost of our Internet-based marketing programs.terms.
If ourthe Company’s marketing messages are ineffective or ourits advertising expenditures and other marketing programs, including digital programs, are inefficient in creating awareness and consideration of ourits products and brand name, and in driving consumer traffic to ourthe Company’s website, call centers, or stores, ourthe Company’s sales, profitability, cash flows, availability of credit, and financial condition may be adversely impacted. In addition, if we arethe Company is not effective in preventing the publication of confusing, false or misleading information regarding ourits brand or ourits products, or if there is publication online or elsewhere of significant negative consumer sentiment on social media regarding ourthe Company, brand or our products, our sales, profitability, cash flows, availability of credit, and financial condition may be adversely impacted.
The vast majority of ourthe Company’s sales occur through our Company-Controlled distribution channel,Total Retail, including ourits retail stores and this Company-Controlled distribution channelwebsite. Total Retail represents ourthe Company’s largest opportunity for growth in sales and improvement in profitability. OurThe Company’s retail stores carry significant fixed costs. WeSleep Number also makemakes significant capital expenditures as weit open new stores and remodel or reposition existing stores. We areThe Company is highly dependent on ourits ability to maintain and increase sales per store to cover these fixed expenses, provide a return on ourits capital investments and improve ourthe Company operating margins.
| 22 | 2023 FORM 10-K | SLEEP NUMBER CORPORATION | |||||||
margins. As a part of ourthe Company’s cost savings plan and business restructuring actions, select stores have been closed and additional stores are expected to be closed. These closures may result in higher than expected costs, charges, lost sales, lower brand awareness, or otherwise negatively impact the Company’s sales, profitability, cash flows, availability of credit, and financial condition.
Some of the Company’s stores are mall-based. We dependThe Company depends on the continued popularity of malls as shopping destinations and the ability of mall anchor tenants and other attractions to generate customer traffic for ourits mall-based retail stores. Any decrease in mall traffic, including due to increased online shopping, could adversely affect ourthe Company’s sales, profitability, cash flows, availability of credit, and financial condition.
Failure to achieve and maintain a high level of product quality could negatively impact ourthe Company’s sales, profitability, cash flows and financial condition.
In addition, a decline in product quality could result in an increase in return rates and a corresponding decrease in sales, or an increase in product warranty claims in excess of ourthe Company’s warranty reserves. An unexpected increase in return rates or warranty claims could harm ourthe Company’s sales, profitability, cash flows and financial condition.
As a consumer innovation companyCompany with differentiated products, we facethe Company faces an inherent risk of exposure to product liability claims or regulatory actions if the use of ourits products is alleged to have resulted in personal injury or property damage. If any of ourthe Company’s products proves to be defective weor non-compliant with applicable regulations such as the federal Consumer Product Safety Commission flammability standards, the Company may be required to recall or redesign such products. We haveThe Company has at times experienced increased returns and adverse impacts on sales, as well as product liability litigation, as a result of media reports related to the alleged propensity of ourit products to develop mold. WeThe Company may experience additional adverse impacts on sales and additional litigation if any similar media reports were to occur in the future. We maintainThe Company maintains insurance against some forms of product liability claims, but such coverage may not be applicable to, or adequate for, liabilities actually incurred. A successful claim brought against usthe Company outside of, or in excess of, available insurance coverage, or any claim or product recall that results in significant adverse publicity against us,about the Company, may have a material adverse effect on ourthe Company’s sales, profitability, cash flows and financial condition.
As described in greater detail below, the mattressbedding industry, as well as the market for sleep monitoring products, are both highly competitive, and ourthe Company’s ability to compete effectively and to profitably grow ourits market share dependsdepend in part on ourits ability to continue to improve and expand ourthe Company’s product line of adjustable firmness air beds, SleepIQ technology and related accessory products. We incurThe Company incurs significant research and development and other expenditures in the pursuit of improvements and additions to ourits product line.line and is re-prioritizing research and development resources in this highly constrained environment. If these efforts do not result in meaningful product improvements or new product introductions, or if we arethe Company is not able to gain widespread consumer acceptance of product improvements or new product introductions, ouror there are delays or production limitations with respect to its
| 23 | 2023 FORM 10-K | SLEEP NUMBER CORPORATION | |||||||
product improvements or new product introductions, the Company’s sales, profitability, cash flows and financial condition may be adversely affected. If the Company offers products or services in other countries, the Company’s business may be exposed to additional risks, such as additional and varied legal/regulatory requirements, complexity and cost to maintain operations in multiple countries, adapting and localizing products for enhanced market acceptance, ability to enforce intellectual property rights, tariffs and non-tariff barriers, fluctuation in and barriers to currency exchange, and political or social unrest, and economic instability. In addition, if any significant product improvements or new product introductions are not successful, ourdelayed, or constrained the Company’s reputation and brand image may be adversely affected.
The Company’s intellectual property rights may not prevent others from using its technology or trademarks in connection with the sale of competitive products. The Company is from time to time subject to claims that its products, processes or trademarks infringe intellectual property rights of others.
The Company owns various U.S. and foreign patents and patent applications related to certain elements of the design and function of the Company’s beds, biosignal monitoring and related products. The Company owns numerous registered and unregistered trademarks and trademark applications, including in particular the Sleep Number, Climate360 and SleepIQ trademarks, as well as other intellectual property rights, including trade secrets, trade dress and copyrights, which it believes has significant value and is important to the development, function, and marketing of its products. These intellectual property rights may not provide adequate protection against infringement or piracy, may not prevent competitors from developing and marketing products that are similar to or competitive with Sleep Number beds, biosignal monitoring or other products, and may be costly and time-consuming to protect and enforce. The Company’s patents are also subject to varying expiration dates. In 2017, we beganaddition, the laws of some foreign countries may not protect its intellectual property rights and confidential information to introduce a new linethe same extent as the laws of mattressesthe United States. If the Company is unable to replace our prior lineprotect and enforce its intellectual property, the Company may be unable to prevent other companies from using the Company’s technology or trademarks in connection with competitive products, which could adversely affect the Company’s sales, profitability, cash flows and financial condition.
The Company is from time to time subject to claims that its products, processes, advertising, or trademarks infringe the intellectual property rights of mattresses,others. The defense of these claims, even if ultimately successful, may result in costly litigation, and this new product introduction will continueif the Company is not successful in 2018 as we planits defense, it could be subject to convertinjunctions and liability for damages or royalty obligations, and the remainder of our product line. This new product launch requires significant transition costs in our supply chain and retail stores. If we are not able to gain widespread consumer acceptance of this new product line, or if we do not successfully execute the new product introduction effectively and efficiently, ourCompany’s sales, profitability, cash flows and financial condition maycould be adversely affected.
Risks Related to the Company’s Vertically Integrated Business
Significant competition could adversely affect our business.the Company’s business.
Because of the vertical integration of ourthe Company’s business model, ourits products and distribution channels face significant competition from both manufacturers of different types of mattresses and a variety of retailers. OurThe Company’s SleepIQ technology also faces significant competition from various manufacturers and retailers of sleep tracking and monitoring products.
The mattress industry is characterized by a high degree of concentration among the largest manufacturers of innerspring mattresses and foam mattresses and one dominant national mattress retailer. Many newer competitorsretailer, including further consolidation pending a publicly announced merger or other business combination of one such mattress manufacturer and a national mattress retailer set to close in the mattress industrysecond half of 2024. In recent years, numerous direct-to-consumer companies and low-cost importers have begun to offerentered the market, offering “bed-in-a-box” or similar products primarily through online distribution directly to consumers through the Internet and other distribution channels.
though many now also partner with traditional mattress retailers. A variety of sleep tracking and monitoring products that compete with ourthe Company’s SleepIQ technology have been introduced by various manufacturers and retailers, both within and outside of the traditional mattress industry. A variety of mattress and base manufacturers have also come to market with copycat smart beds, some featuring a version of what they market as “adjustable firmness.” This competition has and may continue to increase the costs of search terms and digital advertising and otherwise adversely affect the Company’s business.
Some of the manufacturers that we compete withCompany’s competitors have substantially greater financial, marketing and manufacturing resources and greater brand name recognition than we dothe Company does and sell products through broader and more established distribution channels. Our touchpoints. Proposed consolidation in the mattress industry will amplify this disparity. The Company’s
| 24 | 2023 FORM 10-K | SLEEP NUMBER CORPORATION | |||||||
national, exclusive distribution competes with other retailers who generally provide a wider selection of mattress alternatives than we offer.the Company offers. A number of these retailers also have more points of distribution, greater marketing resources, and greater brand name recognition than we do.the Company does.
These manufacturing and retailing competitors, or a combination of these competitors, or new entrants into the market, may compete aggressively and gain market share with existing or new products, and may pursue or expand their presence in the adjustable firmness air bed segment of the market as well as in the market for sleep tracking and monitoring products. We haveThe Company has limited ability to anticipate the timing and scale of new product introductions, advertising campaigns or new pricing strategies by ourits competitors, which could inhibit ourits ability to retain or increase market share, or to maintain our productthe Company’s profit margins.
If we arethe Company is unable to effectively compete with other manufacturers and retailers of mattress and sleep tracking and monitoring products, ourthe Company’s sales, profitability, cash flows and financial condition may be adversely impacted.
| 25 | 2023 FORM 10-K | SLEEP NUMBER CORPORATION | |||||||
where the layers are in conflict, could require alteration of ourits manufacturing processes or operational parameters which may adversely impact ourthe Company’s business.
Legislative or regulatory changes that impact ourthe Company’s relationship with ourits workforce, such as minimum wage requirements or health insurance or other employee benefits mandates, could increase ourthe Company’s expenses and adversely affect ourits operations. While it is ourSleep Number’s policy and practice to comply with legal and regulatory requirements and ourits procedures and internal controls are designed to promote such compliance, wethe Company cannot assure that all of ourits operations will comply with all such legal and regulatory requirements. Further, laws and regulations change over time and wethe Company may be required to incur significant expenses and/or to modify ourits operations in order to ensure compliance. This could harm ourthe Company’s profitability or financial condition. If we areSleep Number is found to be in violation of any laws or regulations, weit could become subject to fines, penalties, damages or other sanctions as well as potential adverse publicity or litigation exposure. This could adversely impact ourthe Company’s business, reputation, sales, profitability, cash flows or financial condition.
The federal Consumer Product Safety Commission adoptedCompany’s ability to commercialize new flammability standards and related regulations which became effective nationwide in July 2007 for mattresses and mattress and foundation sets. Compliance with these requirements has resulted in higher materials and manufacturing costs for our products and has required modifications to our information systems and business operations, further increasing our costs and negatively impacting our capacity.
As the Company works to temporarily cease productiondevelop innovations with enhanced health capabilities, including possible capabilities of providing advanced monitoring and distribution and/health risk evaluations, depending on the features that ultimately become commercially available, some features may require regulatory requirements or approvals beyond those that apply to recallSleep Number’s current products from the field, and weor features. These additional regulatory requirements or approvals may be subject to finesprohibitively expensive or penalties, any of which outcomes could harm our business, reputation, sales, profitability, cash flows and financial condition.otherwise delay or prevent certain features, innovations, or product from being commercialized.
Pending or unforeseen litigation and the potential for adverse publicity associated with litigation could adversely impact ourthe Company’s business, reputation, financial results or financial condition.
Risks Related to the Company’s Information Systems and Cybersecurity
Information systems that contain confidential Company data, consumers’ personal information, and team members’ personal information may be subject to attacks by hackers or other cyber threats that could compromise the confidentiality, integrity, and availability of the data, which could substantially disrupt the Company’s business and could result in a breach of the data.
The Company’s information systems and information systems of third-party vendors it uses to assist in the storage and management of information, including on-premise and cloud-based systems, contain personal, financial, and SleepIQ® data and information related to its customers and team members collected and maintained in the ordinary course of its business. These information systems also contain confidential Company data regarding its business and innovations. The Company’s use and dependence on its information systems has increased with amplified remote working and has required additional data storage in cloud-based systems. While the Company maintains, and requires the Company’s third-party vendors to maintain, security measures to protect this information, a breach of these security measures, such as through third-party action and attacks, team member error, access to its data and systems, malfeasance or otherwise, could compromise the security of the Company’s data and customers’ and team members’ personal information. Like many other businesses, Sleep Number has and will likely continue to experience cyber-based attacks and incidents from time to time. As the techniques used to breach security measures change frequently and may not be recognized until launched against a target, the Company may be unable to anticipate these techniques or to implement adequate preventive measures. In addition, the Company or its third-party vendors may not be successful in timely identifying or remediating cyber-based attacks and incidents. Any failure of the Company’s systems and processes or its third-party vendors’ systems and processes to adequately protect its data or customer or team member personal information from
| 26 | 2023 FORM 10-K | SLEEP NUMBER CORPORATION | |||||||
exposure, theft or loss could adversely impact the Company’s business, reputation, sales, profitability, cash flows and financial condition.
Advancements in and adoption of artificial intelligence technologies may increase cost and risks associated with competition, regulatory requirements, and cybersecurity threats.
Rapidly evolving technological and regulatory developments related to artificial intelligence and related technologies may increase competitive, legal, and security risks facing the Company. To effectively compete, the Company may need to increase investments to innovate new capabilities and features based on artificial intelligence as well as to develop appropriate protections, safeguards, and policies for handling the processing of data. In addition, the regulatory and legal landscape regarding artificial intelligence is rapidly evolving and the Company may be challenged to timely comply in a cost-effective manner. Any actual or perceived failure to comply with evolving regulatory frameworks regarding, or the introduction of potential or actual bias through, the development and use of artificial intelligence could adversely affect the Company’s business operations, reputation, customer satisfaction, profitability, cash flows, and financial condition. In addition, new artificial intelligence technologies may increase the risk of internal or external data loss, misappropriation of intellectual property, and enable cyber-attackers to create increasingly effective and powerful methods of cyber-attack, including, for example, the development of malicious code, denial-of-service attacks, use of quantum computing, sophisticated phishing attempts, and other attacks. The Company may not be able to sufficiently identify, withstand, and remediate such attacks, which may cause disruption to business operations and harm the Company’s sales, customer satisfaction, profitability, cash flows and financial condition.
Any maintenance, improvements or upgrades to our management information systems and services that may be required to meet the ongoing and evolving needs of ourthe Company’s business and cybersecurity needs as well as existing and emerging regulatory requirements may be costly to implement, and may take longer or require greater resources than anticipated and may result in disruptions to ourits systems or business.
Risks Related to Workforce
The Company’s operating performance, profitability, and demographic information of our customers, SleepIQ data from our customer base and social security numbers and demographic information of our employees. While we maintain security measures to protect this information, a breach of these security measures, such as through third-party action, employee error, malfeasance or otherwise, could compromise the security of our customers’ and employees’ personal information. As the techniques used to breach such security measures change frequently and may not be recognized until launched against a target, we may be unable to anticipate these techniques or to implement adequate preventive measures. Any failure of our systems and processes to adequately protect customer or employee personal information from theft or loss could adversely impact our business, reputation, sales, profitability, cash flows and financial condition.
As a vertically integrated manufacturer and retailer, ourthe Company’s future growth and profitability will depend in part upon ourits ability to attract, retain and motivate qualified personnel in a wide variety of areas to execute ourits growth strategy, including qualified management and executive personnel, and qualified retail sales professionals and managers.managers, and manufacturing, home delivery and technical personnel. In addition, the Company’s success will depend upon the effectiveness of its organizational leadership and managers as well as the capabilities of its team members. The current labor challenges or other economic factors may prevent the Company, and its suppliers and vendors, from successfully hiring and retaining qualified personnel. The failure to attract, retain and motivate qualified personnel or the lack of effective organizational leadership, management or appropriate team capabilities may hinder ourthe Company’s ability to execute ourits business strategy and growth initiatives and may adversely impact ourthe Company’s sales, profitability, cash flows, and financial condition.
Certain portions of the Company’s workforce, in particular its home delivery, logistics, manufacturing, warehouse, and retail, may seek to unionize or engage in unionization activities. Such activities may cause distraction from the Company’s
| 27 | 2023 FORM 10-K | SLEEP NUMBER CORPORATION | |||||||
core business, reduce the Company’s ability to manufacture, sell, or deliver its products, increase the Company’s costs, reduce efficiency, and adversely impact the Company’s sales, profitability, cash flows, and financial condition.
Risks Related to the Company’s Stock
The Company’s stock price has and may continue to fluctuate and the Company’s financial results, removal from various stock indices and other factors have and may continue to adversely affect the Company’s stock price.
The Company’s stock price has and may continue to fluctuate significantly in response to numerous factors such as: the overall performance of the equity markets and the economy as a whole; the Company’s’ financial and operating performance, which may fluctuate due to the risk factors set forth herein; changes in the financial projections the Company or third parties may provide to the public or the Company’s failure to meet these projections; actual or anticipated changes in its growth rate relative to that of its competitors; inclusion or removal from various stock indices; significant stock trades by large shareholders; failure of securities analysts to maintain coverage of the Company; changes in financial estimates by securities analysts who follow the Company or its failure to meet these estimates or the expectations of investors; sales of share of the Company’s common stock by Sleep Number or its shareholders particularly sales by its directors, executive officers and significant shareholders or the perception that these sales could occur. Although our common shares are quoted on the Nasdaq Stock Market, the volume of trades on any given day may be limited and, as a result, shareholders might not be able to sell or purchase our common shares at the volume, price or time desired. On November 28, 2023, S&P Global announced that the Company’s common shares would be removed from the S&P SmallCap 600 index effective December 4, 2023. This removal and any other removal from various stock indices has and may continue to cause index funds, institutional investors, or other shareholders attempting to track the composition of that index to sell the Company’s common stock, adversely affecting the stock price.
A substantial amount of the Company’s stock is held by a small number of large investors and significant sales of its common stock by one or more of these holders could adversely affect the Company’s stock price.
As of December 31, 2023, the Company’s 25 largest holders of common stock were investors who held approximately 66% of the outstanding shares of common stock in the aggregate. These investors have sold and may sell some or all of their shares at any time for a variety of reasons, and such sales could depress the market price of the Company’s common stock, which could adversely affect the Company’s stock price. In addition, any such sales of the Company’s common stock by these entities could also impair its ability to raise capital through the sale of additional equity securities.
Our business could be negatively affected as a result of the actions of activists.
The Company could be negatively affected as a result of shareholder activism, which could cause the Company to incur significant expense, hinder execution of its business strategy, and impact the trading value of its securities. In the past, the Company has been the subject of shareholder activism, and it is subject to the risks associated with any ongoing or future such activism. Shareholder activism, including potential proxy contests, requires significant time and attention by management and the Board, potentially interfering with the Company’s ability to execute its strategic plan. The Company may be required to incur significant legal fees and other expenses related to activist shareholder matters, and the attention of management may be diverted by such activism. While the Company welcomes shareholders’ constructive input, there can be no assurance that shareholder actions would not result in negative impacts to the Company. Any of these impacts could materially and adversely affect the Company’s business and operating results, and the Company’s stock price has experienced fluctuation and could continue to experience fluctuation or otherwise be adversely affected by shareholder activism.
The timing and amount of the Company’s share repurchases is subject to a number of uncertainties.
While the Company currently has no plans to resume share repurchases, the Company’s Board has authorized management to repurchase up to $600 million worth of shares. As of December 30, 2023, the remaining authorization under that program was $348 million. The Inflation Reduction Act of 2022 (the Act) imposed a non-deductible 1% excise tax on net repurchases of shares, with some exceptions. The excise tax was imposed on transactions occurring after December 31, 2022. The imposition of the excise tax increased the cost to the Company of making repurchases and may cause it to reduce the number of shares repurchased when or if the Company were to resume share repurchases.
| 28 | 2023 FORM 10-K | SLEEP NUMBER CORPORATION | |||||||
Other factors that may influence the Company’s decision to utilize, limit, suspend or delay future share repurchases include market conditions, the trading price of its common stock, the nature and magnitude of other investment opportunities available to the Company from time to time, and the amount of available cash.
If securities analysts do not publish, or cease publishing, research or reports about the Company, the Company’s business, or if they change their recommendations regarding the Company’s stock adversely, the price of the Company’s common stock and trading volume could decline.
The trading market for the Company’s common stock could be influenced by any research and reports that securities or industry analysts publish about the Company, the Company’s business or the Company’s market. If one or more of the analysts who covers the Company downgrades the Company’s common stock or publishes inaccurate or unfavorable research about the Company, the Company’s business or the Company’s market, the price of the Company’s common stock would likely decline. If one or more of these analysts ceases coverage of the Company or fails to publish reports on the Company regularly, demand for the Company’s common stock could decrease, which could cause the price of the Company’s common stock and trading volume to decline.
Risks Related to Environmental, Social and Governance Matters
The Company’s priorities and progress with respect to Environmental, Social and Governance (ESG) matters may expose it to numerous risks, including risks to its reputation and stock price, and may impose additional costs on the Company.
There has been an increased focus on the Company’s ESG practices within the general markets. Investor advocacy groups, investment funds and influential investors are also increasingly focused on these practices, especially as they relate to the environment, climate change, health and safety, supply chain management, diversity, equity and inclusion, labor conditions and human rights, both in their own operations and in the Company’s operations and supply chain. Sleep Number current ESG priorities reflect the Company’s strategic plans and aspirations and are not guarantees that it will be able to achieve them. The Company’s efforts to accomplish and accurately report its progress present numerous operational, reputational, financial, legal, and other risks, any of which could have a material adverse impact, including on the Company’s reputation, stock price, and results of operation. Sleep Number could also incur additional costs and require additional resources to implement various projects that impact the progress made against its priorities and hurt its ability to monitor and track its performance with respect to such priorities.
The standards for tracking and reporting on ESG matters are relatively new, have not been formalized and continue to evolve. Collecting, measuring, and reporting ESG information and metrics can be difficult and time consuming. While Sleep Number has taken steps to evolve its priorities and related disclosures, including through implementing enhanced data collection methods and reporting certain data under recognized reporting frameworks and standards, the Company’s practices may not meet the standards of all of its stakeholders and advocacy groups may campaign for further changes. Additionally, the Company’s selected disclosure framework or standards may need to be changed from time to time, which may result in a lack of consistent or meaningful comparative data from period to period. Further, the Company’s interpretation of reporting frameworks or standards may differ from those of others and such frameworks or standards may change over time, any of which could result in significant revisions to the Company’s ESG priorities or reported progress.
The Company’s ability to achieve any ESG-related objective is subject to numerous risks, many of which are outside of its control, including: the availability and cost of low-or non-carbon-based energy sources and technologies, evolving regulatory requirements affecting relevant standards or disclosures, the availability of vendors and suppliers that can meet its sustainability, diversity and other standards, and the availability of raw materials that meet and further the Company’s sustainability objectives. If its ESG practices do not meet evolving standards or the Company cannot make progress on its priorities, then the Company’s reputation, its ability to attract or retain employees and its competitiveness, including as an investment and business partner, could be negatively impacted. Furthermore, if Sleep Number’s competitors’ ESG performance is perceived to be better than the Company’s, potential or current customers and investors may elect to do business with its competitors instead, and the Company’s ability to attract or retain employees could be negatively impacted. The Company’s failure, or perceived failure, to pursue or fulfill its priorities and objectives or to satisfy various reporting standards within the timelines the Company announces, or at all, could also expose the Company to government enforcement actions and private litigation.
| 29 | 2023 FORM 10-K | SLEEP NUMBER CORPORATION | |||||||
Climate change and legal or regulatory responses may adversely affect the Company’s business, operations and financial condition.
Climate change presents various near and long-term risks that may adversely impact the Company’s business. The enactment of new laws and regulations to address or limit the effects of climate change, or changes to existing laws and regulations, could mandate more restrictive standards or require such changes on a more accelerated time frame. The consequences of climate change and the ensuing governmental regulations could disrupt the Company’s operations or harm its ability to source necessary materials and components and manufacture its products, which may adversely affect the Company’s financial condition. If public perception of Sleep Number’s compliance with laws and regulations related to climate change is negative, it could adversely affect the Company’s business, reputation and shareholder perception. Adverse publicity or climate-related litigation that impacts the Company could also have a negative impact on its business.
Extreme weather, natural disasters, power outages, or other unexpected climate-related events could result in physical damage to and complete or partial closure of one or more of the Company’s manufacturing, distribution centers or other facilities or those of its suppliers, temporary or long-term disruption in its supply chain or logistics, disruption of or harm to the Company’s workforce and/or disruption of its ability to deliver products to customers. Current or future insurance arrangements may not provide protection for costs that may arise from such events, particularly if such events are catastrophic in nature or if multiple such events occur. Climate change may also subject the Company’s business to significant increases or volatility in the prices of certain commodities, including but not limited to electronic componentry, fuel, oil, natural gas, rubber, cotton, plastic resin, corrugate, plywood, steel and chemical ingredients used to produce foam, as well as third-party logistic costs. Further, the long-term effects of climate change on general economic conditions and the Company’s industry in particular are unclear, and changes in the supply, demand, or available sources of energy and the regulatory and other costs associated with energy production and delivery may affect the availability or cost of goods and services, including natural resources, necessary to run its business. Any long-term disruption in the Company’s ability to service its customers from one or more manufacturing, distribution centers or other facilities could have an adverse effect on the Company’s operations.
New climate disclosure rules passed by California, as well as those proposed by the SEC, will increase the Company’s compliance costs and may subject the Company to litigation or other risks, which would materially and adversely affect its future results of operations and financial condition.
During fiscal 2022, the SEC proposed new climate disclosure rules, which if adopted, would require new climate-related disclosures in SEC filings, including certain climate-related metrics and greenhouse gas emissions data, information about climate-related targets and goals, transition plans, if any, and extensive attestation requirements. During fiscal 2023, California passed new climate disclosure rules similar to those proposed by the SEC and that currently would require the Company to begin reporting on such climate-related data for its fiscal year 2025. In addition to requiring filers to quantify and disclose direct emissions data, the new California rules and the proposed SEC rules also would require disclosure of climate impact arising from the operations and uses by the filer’s business partners and contractors and end-users of the filer’s products and/or services. The Company is currently assessing the impact of the new California rules as well as the proposed SEC rules, but at this time, it cannot predict the costs of implementation or any specific potential adverse impacts resulting from the new rules. However, Sleep Number will incur increased costs relating to the collection, review and assurance for new required disclosures of climate metrics and climate-related risks and may experience increased litigation, regulatory, business, reputation, or other risks related to disclosures made pursuant to the new rules. Either the increased cost to comply with the new rules or the potential for increased litigation and other risks could materially and adversely affect the Company’s future results of operations and financial condition.
ITEM 1B. UNRESOLVED STAFF COMMENTS
None.
| 30 | 2023 FORM 10-K | SLEEP NUMBER CORPORATION | |||||||
ITEM 1C. CYBERSECURITY
Sleep Number uses a “defense in depth” approach for its cybersecurity risk management program leveraging the National Institute of Standards and Technology (NIST) framework, which organizes cybersecurity risks into five categories: identify, protect, detect, respond and recover. The Company regularly assesses the threat landscape for cybersecurity risks, with a strategy based on prevention, detection and mitigation. The Company’s information technology (IT) security team--led by the VP of Information Security and Architecture and Chief Information Officer--reviews cybersecurity risks on an ongoing basis. IT security team members who support its information security program have relevant educational and industry experience. The VP of Information Security and Architecture, and their team, provide regular reports to senior management, the Audit Committee, and other relevant teams on various cybersecurity threats, assessments and findings. The IT Security team has established policies, standards, processes and practices for assessing, identifying, and managing material risks from cybersecurity threats, which are also identified and assessed through the Company’s overall risk management program, including quarterly assessments of IT systems, cybersecurity and related risks.
The Company maintains controls and procedures that are designed to ensure prompt escalation of certain cybersecurity incidents so that decisions regarding public disclosure and reporting of such incidents can be made by management and the Audit Committee in a timely manner.
The Company assesses cybersecurity risks on an ongoing basis, including assessing and deploying technical safeguards designed to protect its information systems from cybersecurity threats. The Company has established comprehensive incident response and recovery plans, regularly tests and evaluates the effectiveness of those plans, and maintains cybersecurity risk insurance.
The Company implements processes to identify, prioritize, assess, mitigate and remediate risks associated with third-party service providers. It conducts security assessments of critical third-party providers before engagement and maintains ongoing monitoring to ensure compliance with the Company’s cybersecurity standards. The monitoring includes ongoing assessments by the IT security team. This approach is designed to mitigate risks related to data breaches or other security incidents originating from third parties. The Company also contractually requires the key third parties it engages to implement security programs commensurate with their risk.
The Company regularly reminds its team members and contractors of the importance of handling and protecting customer and employee data. The Company provides all its team members with dedicated cybersecurity awareness training annually and, conducts monthly phishing simulation testing and other cybersecurity awareness campaigns (e.g., intranet articles, cybersecurity awareness month).
The Company engages with a range of external experts, including cybersecurity assessors, consultants, auditors, and legal counsel, in evaluating and testing its cybersecurity risk management systems. This enables the Company to leverage specialized knowledge, experience and insights, to help ensure its cybersecurity strategies and processes remain current.
•The Company has cybersecurity operations and engineering capabilities that provide comprehensive monitoring to detect and respond to cyber threats and alerts and execute cyber incident response playbooks. This includes a vulnerability management program which identifies and drives remediation of risks. The Company employs a wide array of industry-leading security platforms and tools.
•The Company has retained data security and data privacy legal counsel whose practices focus on data breach response, information security compliance, and compliance with the data privacy laws in the various jurisdictions in which the Company operates.
•In addition, the Company engages specialized consultants and third-party managed service providers on a project-specific basis to assist it with projects that will improve the Company’s IT infrastructure, strengthen its security posture and cyber incident investigations, and improve its cyber readiness.
| 31 | 2023 FORM 10-K | SLEEP NUMBER CORPORATION | |||||||
Management’s Role
The Chief Information Officer (CIO) has primary operational responsibility for the Company’s cybersecurity function. The CIO has served in various roles in information technology and information security for over 28 years with nine years’ experience specifically in cybersecurity. The CIO, together with the Vice President of Information Security and Architecture – who has 20 years of cybersecurity experience and has maintained a Certified Information Systems Security Professional (CISSP) certification since 2008 – and the Chief Legal and Risk Officer have primary responsibility for assessing and managing material cybersecurity risks. This group, and their supporting teams, meets quarterly to review security performance metrics, identify security risks, and assess the status of approved security enhancements. This group also considers and makes recommendations on security policies and procedures, security service requirements, and risk mitigation strategies.
Board Oversight
At the Board level, the Audit Committee is formally tasked with assisting the full Board in overseeing information security systems, including cybersecurity, and reporting to the Board with respect to significant and material developments or proposed changes to the Company’s cybersecurity framework. The Audit Committee receives regular reports from the CIO and the Vice President of Information Security and Architecture about the prevention, detection, mitigation, and remediation of cybersecurity incidents, including material security risks and information security threats and risks. The Audit Committee also receives regular updates from management on cybersecurity risk resulting from risk assessments, progress of risk reduction initiatives, and relevant internal and industry cybersecurity incidents and emerging threats.
The Company has not experienced any material security incidents or data breaches as a result of a compromise of its information systems and is not aware of any cybersecurity incidents that have had a material impact, or are reasonably likely to materially effect, on its business strategy, operating results, or financial condition.
| 32 | 2023 FORM 10-K | SLEEP NUMBER CORPORATION | |||||||
ITEM 2.PROPERTIES
Retail Locations
The following table summarizes the geographic locations of our 556Sleep Number’s 672 retail stores as of December 30, 2017:2023:
| Retail Stores | Retail Stores | Retail Stores | |||||||||||||||||||||
| Alabama | 10 | Kentucky | 9 | North Dakota | 2 | ||||||||||||||||||
| Alaska | 1 | Louisiana | 11 | Ohio | 22 | ||||||||||||||||||
| Arizona | 14 | Maine | 3 | Oklahoma | 6 | ||||||||||||||||||
| Arkansas | 9 | Maryland | 16 | Oregon | 8 | ||||||||||||||||||
| California | 74 | Massachusetts | 11 | Pennsylvania | 26 | ||||||||||||||||||
| Colorado | 15 | Michigan | 19 | Rhode Island | 1 | ||||||||||||||||||
| Connecticut | 7 | Minnesota | 16 | South Carolina | 10 | ||||||||||||||||||
| Delaware | 2 | Mississippi | 6 | South Dakota | 2 | ||||||||||||||||||
| District of Columbia | 1 | Missouri | 13 | Tennessee | 17 | ||||||||||||||||||
| Florida | 47 | Montana | 4 | Texas | 64 | ||||||||||||||||||
| Georgia | 25 | Nebraska | 5 | Utah | 9 | ||||||||||||||||||
| Hawaii | 2 | Nevada | 7 | Vermont | 1 | ||||||||||||||||||
| Idaho | 3 | New Hampshire | 4 | Virginia | 20 | ||||||||||||||||||
| Illinois | 25 | New Jersey | 14 | Washington | 19 | ||||||||||||||||||
| Indiana | 13 | New Mexico | 4 | West Virginia | 4 | ||||||||||||||||||
| Iowa | 6 | New York | 22 | Wisconsin | 12 | ||||||||||||||||||
| Kansas | 6 | North Carolina | 23 | Wyoming | 2 | ||||||||||||||||||
| Total | 672 | ||||||||||||||||||||||
Retail Stores | Retail Stores | Retail Stores | |||||||||||
| Alabama | 8 | Louisiana | 8 | Ohio | 19 | ||||||||
| Alaska | 1 | Maine | 2 | Oklahoma | 4 | ||||||||
| Arizona | 10 | Maryland | 13 | Oregon | 6 | ||||||||
| Arkansas | 4 | Massachusetts | 11 | Pennsylvania | 20 | ||||||||
| California | 67 | Michigan | 18 | Rhode Island | 1 | ||||||||
| Colorado | 14 | Minnesota | 15 | South Carolina | 8 | ||||||||
| Connecticut | 6 | Mississippi | 5 | South Dakota | 2 | ||||||||
| Delaware | 2 | Missouri | 13 | Tennessee | 11 | ||||||||
| Florida | 39 | Montana | 4 | Texas | 51 | ||||||||
| Georgia | 20 | Nebraska | 3 | Utah | 6 | ||||||||
| Hawaii | 1 | Nevada | 5 | Vermont | 1 | ||||||||
| Idaho | 3 | New Hampshire | 4 | Virginia | 17 | ||||||||
| Illinois | 21 | New Jersey | 14 | Washington | 13 | ||||||||
| Indiana | 10 | New Mexico | 3 | West Virginia | 2 | ||||||||
| Iowa | 8 | New York | 17 | Wisconsin | 11 | ||||||||
| Kansas | 7 | North Carolina | 15 | Wyoming | 1 | ||||||||
| Kentucky | 8 | North Dakota | 4 | Total | 556 | ||||||||
Manufacturing, Distribution and Headquarters
The Company has five additional assembly distribution centers (Ontario, CA; Tampa, FL; Minneapolis, MN; Cincinnati, OH; and Dallas, TX) and one storage facility in Salt Lake Cityformer assembly distribution center now used as a distribution center (Baltimore, MD), with a combined total square footage of approximately 57,000700,000 square feet and lease terms ending in October 2025 through April 2020, and a second storage facility in Salt Lake City of approximately 80,000 square feet through November 2019.
| 33 | 2023 FORM 10-K | SLEEP NUMBER CORPORATION | |||||||
ITEM 3. LEGAL PROCEEDINGS
ITEM 4. MINE SAFETY DISCLOSURES
Not applicable.
| 34 | 2023 FORM 10-K | SLEEP NUMBER CORPORATION | |||||||
PART II
ITEM 5. MARKET FOR REGISTRANT’S COMMON EQUITY, RELATED STOCKHOLDER MATTERS AND ISSUER PURCHASES OF EQUITY SECURITIES
The following table sets forth the quarterly high and low sales prices per share of our common stock, at closing, as reported by NASDAQ for the two most recent fiscal years.
First Quarter | Second Quarter | Third Quarter | Fourth Quarter | |||||||||||||
| Fiscal 2017 | ||||||||||||||||
| High | $ | 24.79 | $ | 35.60 | $ | 34.97 | $ | 38.00 | ||||||||
| Low | 19.53 | 24.49 | 28.49 | 29.84 | ||||||||||||
| Fiscal 2016 | ||||||||||||||||
| High | $ | 21.24 | $ | 24.68 | $ | 27.68 | $ | 24.33 | ||||||||
| Low | 15.58 | 19.17 | 21.31 | 18.55 | ||||||||||||
Information concerning share repurchases completed during the fourth quarter of fiscal 20172023 is set forth below:
| Period | Total Number of Shares Purchased(1)(2) | Average Price Paid per Share | Total Number of Shares Purchased as Part of Publicly Announced Plans or Programs(1) | Approximate Dollar Value of Shares that May Yet Be Purchased Under the Plans or Programs(3) | ||||||||||||||||||||||
| October 1, 2023 through October 28, 2023 | 247 | $ | 18.02 | — | $ | 348,071,000 | ||||||||||||||||||||
| October 29, 2023 through November 25, 2023 | 236 | $ | 11.65 | — | 348,071,000 | |||||||||||||||||||||
| November 26, 2023 through December 30, 2023 | 1,784 | $ | 16.19 | — | 348,071,000 | |||||||||||||||||||||
| Total | 2,267 | $ | 15.92 | — | $ | 348,071,000 | ||||||||||||||||||||
____________________
(1)Sleep Number did not repurchase any shares during the three months ended December 30, 2023 under its Board-approved $600 million share repurchase program (effective April 4, 2021).
(2)In connection with the vesting of employee restricted stock grants, the Company repurchased 2,267 shares of its common stock at a cost of $36 thousand during the three months ended December 30, 2023.
(3)There is no expiration date governing the period over which the Company can repurchase shares under its Board-approved share repurchase program. Any repurchased shares are constructively retired and returned to an unissued status.
| Fiscal Period | Total Number of Shares Purchased(1)(2) | Average Price Paid per Share | Total Number of Shares Purchased as Part of Publicly Announced Plans or Programs(1) | Approximate Dollar Value of Shares that May Yet Be Purchased Under the Plans or Programs(3) | ||||||||||
| October 1, 2017 through October 28, 2017 | 241,934 | $ | 32.21 | 240,530 | $ | 492,252,000 | ||||||||
| October 29, 2017 through November 25, 2017 | 349,171 | 32.18 | 348,429 | 481,041,000 | ||||||||||
| November 26, 2017 through December 30, 2017 | 432,649 | 37.12 | 432,173 | 465,000,000 | ||||||||||
| Total | 1,023,754 | $ | 34.27 | 1,021,132 | $ | 465,000,000 | ||||||||
Comparative Stock Performance
The graph below compares the total cumulative shareholder return on ourSleep Number’s common stock over the last five years to the total cumulative return on the Standard and Poor’s (S&P) 400 Specialty Stores Index and The NASDAQNasdaq Stock Market (U.S.) Index assuming a $100 investment made on December 29, 2012.2018. Each of the three measures of cumulative total return assumes reinvestment of dividends. The stock performance shown on the graph below is not necessarily indicative of future price performance. The information contained in this “Comparative Stock Performance” section shall not be deemed to be “soliciting material” or “filed” or incorporated by reference in future filings with the SEC, or subject to the liabilities of Section 18 of the Securities Exchange Act of 1934, as amended, except to the extent that wethe Company specifically requestrequests that it be treated as soliciting material or incorporate it by reference into a document filed under the Securities Act of 1933, as amended, or the Securities Exchange Act of 1934, as amended.

| 12/29/18 | 12/28/19 | 01/02/21 | 01/01/22 | 12/31/22 | 12/30/23 | |||||||||||||||
| Sleep Number Corporation | $ | 100 | $ | 154 | $ | 255 | $ | 238 | $ | 81 | $ | 46 | ||||||||
| S&P 400 Specialty Stores Index | $ | 100 | $ | 113 | $ | 134 | $ | 195 | $ | 183 | $ | 224 | ||||||||
| The Nasdaq Stock Market (U.S.) Index | $ | 100 | $ | 137 | $ | 199 | $ | 243 | $ | 163 | $ | 233 | ||||||||
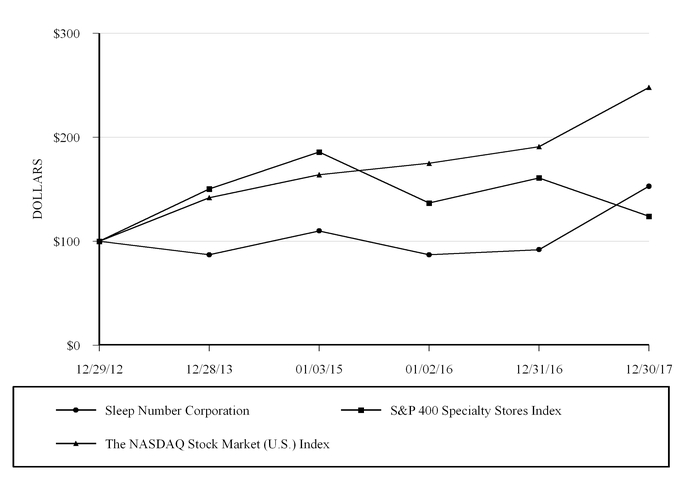
| 12/29/2012 | 12/28/2013 | 1/3/2015 | 1/2/2016 | 12/31/2016 | 12/30/2017 | |||||||||||||||||||
| Sleep Number Corporation | $ | 100 | $ | 87 | $ | 110 | $ | 87 | $ | 92 | $ | 153 | ||||||||||||
| S&P 400 Specialty Stores Index | 100 | 150 | 186 | 137 | 161 | 124 | ||||||||||||||||||
| The NASDAQ Stock Market (U.S.) Index | 100 | 142 | 164 | 175 | 191 | 248 | ||||||||||||||||||
| 36 | 2023 FORM 10-K | SLEEP NUMBER CORPORATION | |||||||
ITEM 6. SELECTED FINANCIAL DATA
(in thousands, except per share and selected operating data, unless otherwise indicated)
The Consolidated Statements of Operations Data and Consolidated Balance Sheet Data presented below have been derived from ourSleep Number’s Consolidated Financial Statements and should be read in conjunction with “Management’s Discussion and Analysis of Financial Condition and Results of Operations” and ourthe Consolidated Financial Statements and Notes thereto included in this Annual Report on Form 10-K.
| Year | |||||||||||||||||||||||||||||
| 2023 | 2022 | 2021 | 2020 (1) | 2019 | |||||||||||||||||||||||||
| Consolidated Statements of Operations Data: | |||||||||||||||||||||||||||||
| Net sales | $ | 1,887,482 | $ | 2,114,297 | $ | 2,184,949 | $ | 1,856,555 | $ | 1,698,352 | |||||||||||||||||||
| Gross profit | 1,088,530 | 1,202,296 | 1,318,847 | 1,156,000 | 1,051,923 | ||||||||||||||||||||||||
| Operating expenses: | |||||||||||||||||||||||||||||
| Sales and marketing | 847,442 | 919,629 | 905,359 | 771,195 | 766,922 | ||||||||||||||||||||||||
| General and administrative | 146,621 | 153,266 | 161,412 | 158,999 | 137,956 | ||||||||||||||||||||||||
| Research and development | 55,797 | 61,521 | 58,540 | 40,910 | 34,950 | ||||||||||||||||||||||||
| Restructuring costs | 15,728 | — | — | — | — | ||||||||||||||||||||||||
| Operating income | 22,942 | 67,880 | 193,536 | 184,896 | 112,095 | ||||||||||||||||||||||||
| Net (loss) income | $ | (15,287) | $ | 36,610 | $ | 153,746 | $ | 139,189 | $ | 81,845 | |||||||||||||||||||
| Net (loss) income per share: | |||||||||||||||||||||||||||||
| Basic | $ | (0.68) | $ | 1.63 | $ | 6.40 | $ | 5.03 | $ | 2.78 | |||||||||||||||||||
| Diluted | $ | (0.68) | $ | 1.60 | $ | 6.16 | $ | 4.90 | $ | 2.70 | |||||||||||||||||||
| Shares used in calculation of net (loss) income per share: | |||||||||||||||||||||||||||||
| Basic | 22,429 | 22,396 | 24,038 | 27,665 | 29,472 | ||||||||||||||||||||||||
| Diluted | 22,429 | 22,852 | 24,947 | 28,428 | 30,355 | ||||||||||||||||||||||||
| Consolidated Balance Sheet Data: | |||||||||||||||||||||||||||||
| Cash and cash equivalents | $ | 2,539 | $ | 1,792 | $ | 2,389 | $ | 4,243 | $ | 1,593 | |||||||||||||||||||
| Total assets | 950,880 | 953,936 | 919,540 | 800,136 | 806,043 | ||||||||||||||||||||||||
| Borrowings under revolving credit facility | 539,500 | 459,600 | 382,500 | 244,200 | 231,000 | ||||||||||||||||||||||||
| Total shareholders’ deficit | (441,928) | (438,177) | (424,953) | (223,978) | (159,431) | ||||||||||||||||||||||||
| Selected Operating Data: | |||||||||||||||||||||||||||||
| Stores open at period-end | 672 | 670 | 648 | 602 | 611 | ||||||||||||||||||||||||
| Stores opened during period | 36 | 49 | 77 | 30 | 59 | ||||||||||||||||||||||||
| Stores closed during period | (34) | (27) | 31 | 39 | 27 | ||||||||||||||||||||||||
Average sales per store (000’s)(2) | $ | 2,853 | $ | 3,281 | $ | 3,600 | $ | 3,052 | $ | 2,877 | |||||||||||||||||||
Percentage of stores with > $2 million in net sales(3) | 65 | % | 76 | % | 84 | % | 67 | % | 70 | % | |||||||||||||||||||
Percentage of stores with > $3 million in net sales(3) | 24 | % | 36 | % | 48 | % | 29 | % | 30 | % | |||||||||||||||||||
Average revenue per smart bed unit - Total Retail(4) | $ | 5,755 | $ | 5,403 | $ | 5,102 | $ | 4,856 | $ | 4,865 | |||||||||||||||||||
Total Retail comparable-sales change(5) | (12 | %) | (6 | %) | 17 | % | 6 | % | 6 | % | |||||||||||||||||||
| Total retail square footage (at period-end) (000’s) | 2,080 | 2,053 | 1,948 | 1,762 | 1,749 | ||||||||||||||||||||||||
| Year | |||||||||||||||||||
| 2017 | 2016 | 2015 | 2014(1) | 2013 | |||||||||||||||
| Consolidated Statements of Operations Data: | |||||||||||||||||||
| Net sales | $ | 1,444,497 | $ | 1,311,291 | $ | 1,213,699 | $ | 1,156,757 | $ | 960,171 | |||||||||
| Gross profit | 897,347 | 810,160 | 740,751 | 706,850 | 601,755 | ||||||||||||||
| Operating expenses: | |||||||||||||||||||
| Sales and marketing | 650,357 | 595,845 | 550,475 | 512,007 | 439,156 | ||||||||||||||
| General and administrative | 127,269 | 109,674 | 99,209 | 84,864 | 62,433 | ||||||||||||||
| Research and development | 27,806 | 27,991 | 15,971 | 8,233 | 9,478 | ||||||||||||||
| Operating income | 91,915 | 76,650 | 75,096 | 101,746 | 90,688 | ||||||||||||||
| Net income | $ | 65,077 | $ | 51,417 | $ | 50,519 | $ | 67,974 | $ | 60,081 | |||||||||
| Net income per share: | |||||||||||||||||||
| Basic | $ | 1.58 | $ | 1.11 | $ | 0.99 | $ | 1.27 | $ | 1.10 | |||||||||
| Diluted | $ | 1.55 | $ | 1.10 | $ | 0.97 | $ | 1.25 | $ | 1.08 | |||||||||
| Shares used in calculation of net income per share: | |||||||||||||||||||
| Basic | 41,212 | 46,154 | 51,252 | 53,452 | 54,866 | ||||||||||||||
| Diluted | 42,085 | 46,902 | 52,101 | 54,193 | 55,803 | ||||||||||||||
| Consolidated Balance Sheet Data: | |||||||||||||||||||
| Cash, cash equivalents and marketable debt securities | $ | 3,651 | $ | 11,609 | $ | 36,114 | $ | 166,045 | $ | 145,014 | |||||||||
| Total assets | 471,834 | 457,166 | 500,897 | 474,187 | 381,765 | ||||||||||||||
| Total shareholders’ equity | 89,156 | 160,320 | 222,339 | 256,907 | 225,220 | ||||||||||||||
| Selected Operating Data: | |||||||||||||||||||
| Stores open at period-end | 556 | 540 | 488 | 463 | 440 | ||||||||||||||
| Stores opened during period | 36 | 72 | 38 | 57 | 71 | ||||||||||||||
| Stores closed during period | 20 | 20 | 13 | 34 | 41 | ||||||||||||||
Average revenue per store (000’s)(2) | $ | 2,420 | $ | 2,364 | $ | 2,377 | $ | 2,327 | $ | 2,093 | |||||||||
Percentage of stores with more than $1.0 million in net sales(2) | 98 | % | 98 | % | 99 | % | 98 | % | 96 | % | |||||||||
Percentage of stores with more than $2.0 million in net sales(2) | 61 | % | 61 | % | 62 | % | 59 | % | 46 | % | |||||||||
Average revenue per mattress unit - Company-Controlled channel(3) | $ | 4,283 | $ | 4,046 | $ | 4,028 | $ | 3,671 | $ | 3,245 | |||||||||
Company-Controlled comparable-sales increase (decrease)(4) | 4 | % | 1 | % | 3 | % | 12 | % | (4 | )% | |||||||||
| Total retail square footage (at period-end) (000's) | 1,489 | 1,399 | 1,214 | 1,106 | 949 | ||||||||||||||
Average square footage per store open during period(2) | 2,647 | 2,538 | 2,445 | 2,302 | 1,985 | ||||||||||||||
Net sales per square foot(2) | $ | 920 | $ | 937 | $ | 980 | $ | 1,025 | $ | 1,077 | |||||||||
| Average store age (in months at period-end) | 97 | 93 | 99 | 97 | 102 | ||||||||||||||
Earnings before interest, depreciation and amortization (Adjusted EBITDA)(5) | $ | 169,097 | $ | 145,689 | $ | 133,057 | $ | 148,223 | $ | 125,020 | |||||||||
Free cash flows(5) | $ | 112,778 | $ | 93,793 | $ | 22,356 | $ | 67,874 | $ | 11,294 | |||||||||
Return on invested capital (ROIC)(5) | 14.3 | % | 12.2 | % | 11.2 | % | 15.1 | % | 15.1 | % | |||||||||
| Year | |||||||||||||||||||||||||||||
| 2023 | 2022 | 2021 | 2020 (1) | 2019 | |||||||||||||||||||||||||
Average square footage per store open during period(3) | 3,082 | 3,036 | 3,006 | 2,926 | 2,802 | ||||||||||||||||||||||||
Average sales per square foot(2) | $ | 926 | $ | 1,081 | $ | 1,212 | $ | 1,051 | $ | 1,034 | |||||||||||||||||||
| Average store age (in months at period-end) | 93 | 91 | 91 | 97 | 94 | ||||||||||||||||||||||||
Earnings before interest, depreciation and amortization (Adjusted EBITDA)(6) | $ | 126,676 | $ | 148,024 | $ | 276,701 | $ | 267,891 | $ | 190,351 | |||||||||||||||||||
Free cash flows(6) | $ | (66,084) | $ | (33,316) | $ | 233,110 | $ | 242,561 | $ | 129,921 | |||||||||||||||||||
Adjusted return on invested capital (Adjusted ROIC)(6) | 7.8 | % | 17.6 | % | 47.2 | % | 39.9 | % | 24.4% | ||||||||||||||||||||
_____________________
(1)Fiscal year 2020 had 53 weeks. All other fiscal years presented had 52 weeks.
(2)Trailing-twelve months Total Retail comparable sales per store open at least one year.
(3)For stores open during the entire period indicated (excludes Online, Phone and Chat sales).
(4)Represents Total Retail net sales divided by Total Retail smart bed units.
(5)Stores are included in the comparable sales calculation in the 13th full month of operation. Stores that have been remodeled or repositioned within the same shopping center remain in the comparable-store base. The number of comparable stores used to calculate such data was 630, 608, 568, 567 and 539 for 2023, 2022, 2021, 2020 and 2019, respectively. Fiscal 2020 included 53 weeks, as compared to 52 weeks for the other periods presented. Comparable sales have been adjusted and reported as if all years had the same number of weeks.
(6)These non-GAAP measures are not in accordance with, or preferable to, GAAP financial data. However, the Company is providing this information as it believes it facilitates annual and year-over-year comparisons for investors and financial analysts. See pages 39 and 40 for the reconciliation of these non-GAAP measures to the appropriate GAAP measures.
Non-GAAP Data Reconciliations
Earnings before Interest, Taxes, Depreciation and Amortization (Adjusted EBITDA)
| Year | ||||||||||||||||||||
| 2017 | 2016 | 2015 | 2014 | 2013 | ||||||||||||||||
| Net income | $ | 65,077 | $ | 51,417 | $ | 50,519 | $ | 67,974 | $ | 60,081 | ||||||||||
| Income tax expense | 25,961 | 24,516 | 24,911 | 34,134 | 30,930 | |||||||||||||||
| Interest expense | 975 | 811 | 160 | 53 | 51 | |||||||||||||||
| Depreciation and amortization | 61,077 | 56,910 | 46,916 | 38,767 | 29,599 | |||||||||||||||
| Stock-based compensation | 15,763 | 11,961 | 10,290 | 6,798 | 4,232 | |||||||||||||||
| Asset impairments | 244 | 74 | 261 | 497 | 127 | |||||||||||||||
| Adjusted EBITDA | $ | 169,097 | $ | 145,689 | $ | 133,057 | $ | 148,223 | $ | 125,020 | ||||||||||
| Year | |||||||||||||||||||||||||||||
| 2023 | 2022 | 2021 | 2020 | 2019 | |||||||||||||||||||||||||
| Net (loss) income | $ | (15,287) | $ | 36,610 | $ | 153,746 | $ | 139,189 | $ | 81,845 | |||||||||||||||||||
| Income tax (benefit) expense | (4,466) | 12,285 | 33,545 | 36,783 | 18,663 | ||||||||||||||||||||||||
| Interest expense | 42,695 | 18,985 | 6,245 | 9,021 | 11,591 | ||||||||||||||||||||||||
| Depreciation and amortization | 72,479 | 66,626 | 59,779 | 60,783 | 61,410 | ||||||||||||||||||||||||
| Stock-based compensation | 14,855 | 13,223 | 23,214 | 21,813 | 16,657 | ||||||||||||||||||||||||
| Restructuring costs | 15,728 | — | — | — | — | ||||||||||||||||||||||||
| Asset impairments | 672 | 295 | 172 | 302 | 185 | ||||||||||||||||||||||||
| Adjusted EBITDA | $ | 126,676 | $ | 148,024 | $ | 276,701 | $ | 267,891 | $ | 190,351 | |||||||||||||||||||
Free Cash Flow
The following table summarizes the Company’s free cash flow calculations (in thousands):
| Year | |||||||||||||||||||||||||||||
| 2023 | 2022 | 2021 | 2020 | 2019 | |||||||||||||||||||||||||
| Net cash (used in) provided by operating activities | $ | (9,028) | $ | 36,138 | $ | 300,010 | $ | 279,661 | $ | 189,160 | |||||||||||||||||||
| Subtract: Purchases of property and equipment | (57,056) | (69,454) | (66,900) | (37,100) | (59,239) | ||||||||||||||||||||||||
| Free cash flow | $ | (66,084) | $ | (33,316) | $ | 233,110 | $ | 242,561 | $ | 129,921 | |||||||||||||||||||
| Year | ||||||||||||||||||||
| 2017 | 2016 | 2015 | 2014 | 2013 | ||||||||||||||||
| Net cash provided by operating activities | $ | 172,607 | $ | 151,645 | $ | 107,942 | $ | 144,468 | $ | 88,105 | ||||||||||
| Less: Purchases of property and equipment | (59,829 | ) | (57,852 | ) | (85,586 | ) | (76,594 | ) | (76,811 | ) | ||||||||||
| Free cash flow | $ | 112,778 | $ | 93,793 | $ | 22,356 | $ | 67,874 | $ | 11,294 | ||||||||||
| 39 | 2023 FORM 10-K | SLEEP NUMBER CORPORATION | |||||||
Non-GAAP Data Reconciliations (continued)
Return on Invested Capital (ROIC)(Adjusted ROIC)
Adjusted ROIC is a financial measure we usethe Company uses to determine how efficiently we deploy ourit deploys its capital. It quantifies the return we earnthe Company earns on ourits adjusted invested capital. Management believes Adjusted ROIC is also a useful metric for investors and financial analysts. We computeThe Company computes Adjusted ROIC as outlined below. OurIts definition and calculation of Adjusted ROIC may not be comparable to similarly titled definitions and calculations used by other companies.
The tables below reconcile adjusted net operating profit after taxes (NOPAT)(Adjusted NOPAT) and total adjusted invested capital, which are non-GAAP financial measures, to the comparable GAAP financial measures:measures (in thousands):
| Year | |||||||||||||||||||||||||||||
| 2023 | 2022 | 2021 | 2020 | 2019 | |||||||||||||||||||||||||
| Adjusted net operating profit after taxes (Adjusted NOPAT) | |||||||||||||||||||||||||||||
| Operating income | $ | 22,942 | $ | 67,880 | $ | 193,536 | $ | 184,896 | $ | 112,095 | |||||||||||||||||||
Add: Operating lease interest(1) | 27,777 | 25,912 | 24,763 | 24,966 | 25,635 | ||||||||||||||||||||||||
| Add: Interest income | — | — | — | 97 | 3 | ||||||||||||||||||||||||
Less: Income taxes(2) | (11,851) | (23,542) | (52,807) | (49,391) | (33,036) | ||||||||||||||||||||||||
| Adjusted NOPAT | $ | 38,868 | $ | 70,250 | $ | 165,492 | $ | 160,568 | $ | 104,697 | |||||||||||||||||||
| Average adjusted invested capital | |||||||||||||||||||||||||||||
| Total deficit | $ | (441,928) | $ | (438,177) | $ | (424,953) | $ | (223,978) | (159,431) | ||||||||||||||||||||
Add: Long-term debt(3) | 539,819 | 460,020 | 383,037 | 244,849 | 231,756 | ||||||||||||||||||||||||
Add: Operating lease obligations(4) | 433,154 | 436,412 | 408,552 | 345,161 | 357,651 | ||||||||||||||||||||||||
| Total adjusted invested capital at end of period | $ | 531,045 | $ | 458,255 | $ | 366,636 | $ | 366,032 | $ | 429,976 | |||||||||||||||||||
Average adjusted invested capital(5) | $ | 496,612 | $ | 400,038 | $ | 350,597 | $ | 402,647 | $ | 429,751 | |||||||||||||||||||
| Adjusted return on invested capital (Adjusted ROIC) | 7.8 | % | 17.6 | % | 47.2 | % | 39.9 | % | 24.4 | % | |||||||||||||||||||
| Year | ||||||||||||||||||||
| 2017 | 2016 | 2015 | 2014 | 2013 | ||||||||||||||||
| Net operating profit after taxes (NOPAT) | ||||||||||||||||||||
| Operating income | $ | 91,915 | $ | 76,650 | $ | 75,096 | $ | 101,746 | $ | 90,688 | ||||||||||
Add: Rent expense(1) | 74,019 | 67,416 | 62,369 | 57,605 | 50,289 | |||||||||||||||
| Add: Interest income | 97 | 94 | 494 | 415 | 375 | |||||||||||||||
Less: Depreciation on capitalized operating leases(2) | (18,865 | ) | (17,185 | ) | (16,203 | ) | (14,265 | ) | (13,095 | ) | ||||||||||
Less: Income taxes(3) | (48,970 | ) | (41,933 | ) | (40,384 | ) | (48,900 | ) | (43,827 | ) | ||||||||||
| NOPAT | $ | 98,196 | $ | 85,042 | $ | 81,372 | $ | 96,601 | $ | 84,430 | ||||||||||
| Average invested capital | ||||||||||||||||||||
| Total equity | $ | 89,156 | $ | 160,320 | $ | 222,339 | $ | 256,907 | $ | 225,220 | ||||||||||
Less: Cash greater than target(4) | — | — | — | (37,319 | ) | (29,622 | ) | |||||||||||||
Add: Long-term debt(5) | — | — | — | — | 2 | |||||||||||||||
Add: Capitalized operating lease obligations(6) | 592,152 | 539,328 | 498,952 | 460,840 | 402,312 | |||||||||||||||
| Total invested capital at end of period | $ | 681,308 | $ | 699,648 | $ | 721,291 | $ | 680,428 | $ | 597,912 | ||||||||||
Average invested capital(7) | $ | 686,436 | $ | 699,576 | $ | 726,756 | $ | 639,118 | $ | 560,133 | ||||||||||
Return on invested capital (ROIC)(8) | 14.3 | % | 12.2 | % | 11.2 | % | 15.1 | % | 15.1 | % | ||||||||||
(2) Depreciation is based on the average of the last five fiscal quarters' ending capitalized operating lease obligations (see note 6) for the respective reporting periods with an assumed thirty-year useful life. This is subtracted from operating income to illustrate the impact of owning versus leasing the related assets.
Note - Our– The Company’s Adjusted ROIC calculation and data are considered non-GAAP financial measures and are not in accordance with, or preferable to, GAAP financial data. However, we arethe Company is providing this information as we believeit believes it facilitates analysis of the Company'sCompany’s financial performance by investors and financial analysts.
GAAP - generally accepted accounting principles in the U.S.
| 40 | 2023 FORM 10-K | SLEEP NUMBER CORPORATION | |||||||
ITEM 7. MANAGEMENT’S DISCUSSION AND ANALYSIS OF FINANCIAL CONDITION AND RESULTS OF OPERATIONS
Forward-Looking Statements
The discussion in this Annual Report contains certain forward-looking statements that relate to future plans, events, financial results or performance. You can identify forward-looking statements by those that are not historical in nature, particularly those that use terminology such as “may,” “will,” “should,” “could,” “expect,” “anticipate,” “believe,” “estimate,” “plan,” “project,” “predict,” “intend,” “potential,” “continue” or the negative of these or similar terms. These statements are subject to certain risks and uncertainties that could cause actual results to differ materially from ourthe Company’s historical experience and our present expectations or projections. These risks and uncertainties include, among others:
•Availability of attractive and cost-effective consumer credit options;
•Dependence on, and ability to maintain working relationships with key suppliers and third parties;
•Fluctuations in commodity costs or third-party delivery or logistics costs and other inflationary pressures;
•Risks inherent in global-sourcing activities, including tariffs, foreign regulation, geo-political turmoil, war, pandemics, labor challenges, foreign currency fluctuations, inflation, and climate or other disasters, and resulting supply shortages and production and delivery delays and disruptions;
•Operating with minimal levels of inventory, which may leave usthe Company vulnerable to shortages in supply;supply shortages;
•The execution of Sleep Number’s Total Retail distribution strategy;
•Ability to achieve and maintain relationships with key suppliers, including several sole-source suppliers;high levels of product quality and to improve and expand the product line;
•Risks of disruption in the operation of eitherany of our two mainthe Company’s facilities and operations, including manufacturing, facilities;assembly, distribution, logistics, field services, home delivery, headquarters, product development, retail or customer service operations;
•Pending or unforeseen litigation and the potential for associated adverse publicity associated with litigation;publicity;
•The adequacy of our managementthe Company’s and third-party information systems to meet the evolving needs of our business and existing and evolving risks and regulatory standards applicable to data privacy and security;
•The vulnerability of our management information systemsCompany’s ability to attacks by hackers or otheridentify and withstand cyber threats that could compromise the security of ourits systems, result in a data breach or disrupt our business;business disruption;
•Sleep Number’s ability, and the ability of its suppliers and vendors, to attract, retain and motivate qualified management, executive and other key employees,effective personnel;
•The volatility of Sleep Number stock, its removal from various stock indices, and the potential negative effects of shareholder activism or of changes in coverage by securities analysts;
•Environmental, social and governance risks, including qualified retail sales professionalsincreasing regulation and managers.stakeholder expectations; and
•The Company’s ability to adapt to climate change and readiness for legal or regulatory responses thereto.
| 41 | 2023 FORM 10-K | SLEEP NUMBER CORPORATION | |||||||
Additional information concerning these and other risks and uncertainties is contained under the caption "Risk Factors"“Risk Factors” in this Annual Report on Form 10-K.
Management’s Discussion and Analysis of Financial Condition and Results of Operations (MD&A) is intended to provide a reader of ourthe Company’s consolidated financial statements with a narrative from the perspective of management on ourits financial condition, results of operations, liquidity and certain other factors that may affect ourits future results. OurThe Company’s MD&A is presented in sixthe following sections:
•Overview
•Results of Operations
•Liquidity and Capital Resources
•Critical Accounting Policies and Estimates
•Recent Accounting Pronouncements
Overview
Business Overview
Sleep Number’s life-changing, differentiated smart beds combine physical and digital innovations, integrating unparalleled physical comfort with a highly advanced technology platform. The smart beds offer the Company’s signature firmness adjustability, enabling each sleeper adjustable comfort. Embedded digital sensors learn the sleep needs of each individual; “sense and do” technology uses the sensed data to automatically adjust the smart bed to keep the sleeper comfortable throughout the night. Active temperature balancing technology supports the ideal climate for both sleepers and solves a prevalent sleep challenge. Additionally, the smart beds are an exceptional value, with personalized sleep insights delivered daily, new features regularly added to all smart beds through over-the-air updates, and prices to meet most budgets. Sleep Number® smart beds provide unmatched features, benefits and comfort that can lead to improved sleep health and wellness for both sleepers.
The Company’s advantaged business model is supported by individualizingits consumer innovation strategy: an individualized sleep experiences. Ourwellness platform, a network of highly engaged Smart Sleepers, a vertically integrated operating model, and a culture of individuality, with an ambitious vision is to become one of the world'sworld’s most beloved brandsbrands. Sleep Number’s exclusive distribution meets its customers whenever and wherever they choose – through digital and in-store touchpoints – to provide an exceptional experience and a lifelong relationship. The Company partners with world-leading institutions to bring the power of 24 billion hours of longitudinal sleep data to sleep science and research. And Sleep Number’s 4,100 purpose-driven team members are dedicated to the Company’s mission of improving lives by delivering an unparalleledindividualizing sleep experience. We plan to achieve this by strengthening our three significant competitive advantages: proprietary sleep innovations, lifelong customer relationships and exclusive retail distribution.experiences.
Results of Operations
Fiscal 20172023 Summary
Financial highlights for fiscal 20172023 were as follows:
•Net sales for 2017 increased 10%2023 decreased 11% to $1.44$1.9 billion, compared with $1.31$2.1 billion in the prior year. Company-Controlled2022. Demand was impacted by ongoing macro challenges with consumers’ increased focus on price to value as their purchasing power reached a record low in August of 2023. The bedding industry remains at recessionary levels with low consumer sentiment.
•The 11% net sales decrease consisted of a 12% comparable sales increased 4% and sales from 16 net new stores openeddecrease in the past 12 months added 7Total Retail, partially offset by 1 percentage points (ppt.) of sales growth in 2017.
•2023 operating income of $2.4$23 million increased 2% fromdecreased by $45 million compared with $68 million in the comparable period one-year ago.
•Net loss in our gross profit rate; and (iii) the operating expense leverage resulting from a 10% increase in net sales, partially offset by transition costs associated with the launch2023 of our Sleep Number 360 smart beds and evolution of our supply chain.
•Cash used in operating activities in 2023 decreased to $9 million, compared with cash provided by operating activities increased by 14% in 2017 to $173 million, compared with $152of $36 million for the prior year. Purchases of property and equipment for 2017 increased to $602023 was $57 million, compared with $58$69 million in 2016.2022.
•The Company suspended share repurchases under the Board-approved share repurchase authorization to $500 million. In 2017, we repurchased 5.4 million sharesprogram in the second quarter of our common stock at a cost of $150 million ($28.00 per share).fiscal 2022. As of December 30, 2017,2023, the remaining authorization under ourits Board-approved share repurchase program was $465$348 million.
| 43 | 2023 FORM 10-K | SLEEP NUMBER CORPORATION | |||||||
The following table sets forth ourthe Company’s results of operations expressed as dollars and percentages of net sales. Figures are in millions, except percentages and per share amounts. Amounts may not add due to rounding differences.
| 2023 | 2022 | 2021 | |||||||||||||||||||||||||||||||||
| $ | % of Net Sales | $ | % of Net Sales | $ | % of Net Sales | ||||||||||||||||||||||||||||||
| Net sales | $ | 1,887.5 | 100.0 | % | $ | 2,114.3 | 100.0 | % | $ | 2,184.9 | 100.0 | % | |||||||||||||||||||||||
| Cost of sales | 799.0 | 42.3 | % | 912.0 | 43.1 | % | 866.1 | 39.6 | % | ||||||||||||||||||||||||||
| Gross profit | 1,088.5 | 57.7 | % | 1,202.3 | 56.9 | % | 1,318.8 | 60.4 | % | ||||||||||||||||||||||||||
| Operating expenses: | |||||||||||||||||||||||||||||||||||
| Sales and marketing | 847.4 | 44.9 | % | 919.6 | 43.5 | % | 905.4 | 41.4 | % | ||||||||||||||||||||||||||
| General and administrative | 146.6 | 7.8 | % | 153.3 | 7.2 | % | 161.4 | 7.4 | % | ||||||||||||||||||||||||||
| Research and development | 55.8 | 3.0 | % | 61.5 | 2.9 | % | 58.5 | 2.7 | % | ||||||||||||||||||||||||||
| Restructuring costs | 15.7 | 0.8 | % | — | — | % | — | — | % | ||||||||||||||||||||||||||
| Total operating expenses | 1,065.6 | 56.5 | % | 1,134.4 | 53.7 | % | 1,125.3 | 51.5 | % | ||||||||||||||||||||||||||
| Operating income | 22.9 | 1.2 | % | 67.9 | 3.2 | % | 193.5 | 8.9 | % | ||||||||||||||||||||||||||
| Interest expense, net | 42.7 | 2.3 | % | 19.0 | 0.9 | % | 6.2 | 0.3 | % | ||||||||||||||||||||||||||
| (Loss) income before income taxes | (19.8) | (1.0 | %) | 48.9 | 2.3 | % | 187.3 | 8.6 | % | ||||||||||||||||||||||||||
| Income tax (benefit) expense | (4.5) | (0.2 | %) | 12.3 | 0.6 | % | 33.5 | 1.5 | % | ||||||||||||||||||||||||||
| Net (loss) income | $ | (15.3) | (0.8 | %) | $ | 36.6 | 1.7 | % | $ | 153.7 | 7.0 | % | |||||||||||||||||||||||
| Net (loss) income per share: | |||||||||||||||||||||||||||||||||||
| Basic | $ | (0.68) | $ | 1.63 | $ | 6.40 | |||||||||||||||||||||||||||||
| Diluted | $ | (0.68) | $ | 1.60 | $ | 6.16 | |||||||||||||||||||||||||||||
| Weighted-average number of common shares: | |||||||||||||||||||||||||||||||||||
| Basic | 22.4 | 22.4 | 24.0 | ||||||||||||||||||||||||||||||||
| Diluted | 22.4 | 22.9 | 24.9 | ||||||||||||||||||||||||||||||||
| 2017 | 2016 | 2015 | |||||||||||||||||||
| $ | % of Net Sales | $ | % of Net Sales | $ | % of Net Sales | ||||||||||||||||
| Net sales | $ | 1,444.5 | 100.0 | % | $ | 1,311.3 | 100.0 | % | $ | 1,213.7 | 100.0 | % | |||||||||
| Cost of sales | 547.2 | 37.9 | 501.1 | 38.2 | 472.9 | 39.0 | |||||||||||||||
| Gross profit | 897.3 | 62.1 | 810.2 | 61.8 | 740.8 | 61.0 | |||||||||||||||
| Operating expenses: | |||||||||||||||||||||
| Sales and marketing | 650.4 | 45.0 | 595.8 | 45.4 | 550.5 | 45.4 | |||||||||||||||
| General and administrative | 127.3 | 8.8 | 109.7 | 8.4 | 99.2 | 8.2 | |||||||||||||||
| Research and development | 27.8 | 1.9 | 28.0 | 2.1 | 16.0 | 1.3 | |||||||||||||||
| Total operating expenses | 805.4 | 55.8 | 733.5 | 55.9 | 665.7 | 54.8 | |||||||||||||||
| Operating income | 91.9 | 6.4 | 76.7 | 5.8 | 75.1 | 6.2 | |||||||||||||||
| Other (expense) income, net | (0.9 | ) | (0.1 | ) | (0.7 | ) | (0.1 | ) | 0.3 | 0.0 | |||||||||||
| Income before income taxes | 91.0 | 6.3 | 75.9 | 5.8 | 75.4 | 6.2 | |||||||||||||||
| Income tax expense | 26.0 | 1.8 | 24.5 | 1.9 | 24.9 | 2.1 | |||||||||||||||
| Net income | $ | 65.1 | 4.5 | % | $ | 51.4 | 3.9 | % | $ | 50.5 | 4.2 | % | |||||||||
| Net income per share: | |||||||||||||||||||||
| Basic | $ | 1.58 | $ | 1.11 | $ | 0.99 | |||||||||||||||
| Diluted | $ | 1.55 | $ | 1.10 | $ | 0.97 | |||||||||||||||
| Weighted-average number of common shares: | |||||||||||||||||||||
| Basic | 41.2 | 46.2 | 51.3 | ||||||||||||||||||
| Diluted | 42.1 | 46.9 | 52.1 | ||||||||||||||||||
The percentage of ourthe Company’s total net sales, by dollar volume, from each of our channels was as follows:
| 2017 | 2016 | 2015 | |||||||
| Company-Controlled channel | 98.7 | % | 97.7 | % | 97.6 | % | |||
| Wholesale/Other channel | 1.3 | % | 2.3 | % | 2.4 | % | |||
| Total | 100.0 | % | 100.0 | % | 100.0 | % | |||
| 2023 | 2022 | 2021 | |||||||||||||||
| Retail stores | 86.8 | % | 86.3 | % | 87.1 | % | |||||||||||
| Online, phone, chat and other | 13.2 | % | 13.7 | % | 12.9 | % | |||||||||||
| Total Company | 100.0 | % | 100.0 | % | 100.0 | % | |||||||||||
The components of total net sales growth,change, including comparable net sales changes, were as follows:
| Net Sales Increase/(Decrease) | |||||||||||||||||
| 2023 | 2022 | 2021 | |||||||||||||||
Retail comparable-store sales(1) | (12 | %) | (8 | %) | 19 | % | |||||||||||
Online, phone and chat(1) | (15 | %) | 4 | % | 4 | % | |||||||||||
Total Retail comparable sales change(1) | (12 | %) | (6 | %) | 17 | % | |||||||||||
| Net opened/closed stores, other and 53rd week | 1 | % | 3 | % | 1 | % | |||||||||||
| Total Company | (11 | %) | (3 | %) | 18 | % | |||||||||||
| Net Sales Increase/(Decrease) | |||||||||
| 2017 | 2016 | 2015 | |||||||
Retail comparable-store sales(1) | 3 | % | 0 | % | 3 | % | |||
Online and phone(1) | 16 | % | 25 | % | (4 | %) | |||
Company-Controlled comparable sales change(1) | 4 | % | 1 | % | 3 | % | |||
| Net opened/closed stores | 7 | % | 7 | % | 2 | % | |||
| Total Company-Controlled channel | 11 | % | 8 | % | 5 | % | |||
| Wholesale/Other channel | (38 | %) | 5 | % | (9 | %) | |||
| Total net sales change | 10 | % | 8 | % | 5 | % | |||
(1)Stores are included in the comparable-store calculation in the 13th full month of operations. Stores that have been remodeled or repositioned within the same shopping center remain in the comparable-store base. Fiscal 2020 included 53 weeks, as compared to 52 weeks for the periods presented. Total Retail comparable sales in 2020 have been adjusted to remove the estimated impact of the additional week.
| 44 | 2023 FORM 10-K | SLEEP NUMBER CORPORATION | |||||||
Other sales metrics were as follows:
| 2023 | 2022 | 2021 | |||||||||||||||
Average sales per store ($ in thousands)(1)(4) | $ | 2,853 | $ | 3,281 | $ | 3,600 | |||||||||||
Average sales per square foot(1)(4) | $ | 926 | $ | 1,081 | $ | 1,212 | |||||||||||
Stores > $2 million in net sales(2)(4) | 65 | % | 76 | % | 84 | % | |||||||||||
Stores > $3 million in net sales(2)(4) | 24 | % | 36 | % | 48 | % | |||||||||||
Average revenue per smart bed unit – Total Retail(3) | $ | 5,755 | $ | 5,403 | $ | 5,102 | |||||||||||
| 2017 | 2016 | 2015 | ||||||||||
Average sales per store(1) ($ in thousands) | $ | 2,420 | $ | 2,364 | $ | 2,377 | ||||||
Average sales per square foot(1) | $ | 920 | $ | 937 | $ | 980 | ||||||
Stores > $1 million in net sales(1) | 98 | % | 98 | % | 99 | % | ||||||
Stores > $2 million in net sales(1) | 61 | % | 61 | % | 62 | % | ||||||
Average revenue per mattress unit – Company-Controlled channel(2) | $ | 4,283 | $ | 4,046 | $ | 4,028 | ||||||
(4)Fiscal 2020 included 53 weeks, as compared to 52 weeks in fiscal 2023, 2022 and 2021. The additional week in 2020 was in the fiscal fourth quarter. Total Retail comparable sales have been adjusted to remove the estimated impact of the additional week in 2020.
The number of retail stores operating during the last three years was as follows:
| 2023 | 2022 | 2021 | |||||||||||||||
| Beginning of period | 670 | 648 | 602 | ||||||||||||||
| Opened | 36 | 49 | 77 | ||||||||||||||
| Closed | (34) | (27) | (31) | ||||||||||||||
| End of period | 672 | 670 | 648 | ||||||||||||||
| 2017 | 2016 | 2015 | |||||||
| Beginning of period | 540 | 488 | 463 | ||||||
| Opened | 36 | 72 | 38 | ||||||
| Closed | (20 | ) | (20 | ) | (13 | ) | |||
| End of period | 556 | 540 | 488 | ||||||
Comparison of 20172023 and 20162022
Net sales
Net sales in 2017 increased 10%2023 decreased 11% to $1.44$1.9 billion, compared with $1.31$2.1 billion for the same period one year ago.in 2022. Demand was impacted by ongoing macro challenges with consumers’ increased focus on price to value as their purchasing power reached a record low in August of 2023. The bedding industry remains at recessionary levels with low consumer sentiment. The 11% net sales increasedecrease was driven by a 4%12% comparable sales increasedecrease in our Company-Controlled channel and 7Total Retail, partially offset by 1 percentage points (ppt.) of growth from sales generated by 16 net new retailopened/closed stores opened in the past 12 months, partially offset by a decreaseand other. Online, Phone and Chat sales (included in Wholesale/Other channel sales.comparable sales noted above) made up 13.2% and 13.7% of total net sales in 2023 and 2022, respectively, as consumers embraced transacting remotely with Sleep Number as well as in its stores. For additional details, see the components of total net sales growth on page 44.
The $133$227 million net sales increasedecrease compared with the same period one year ago was primarily comprised of: (i) a $91$206 million decrease in the Company’s Total Retail comparable net sales; (ii) a $42 million decrease from phone, online and chat; offset by (iii) a $21 million increase resulting from net store openings; and (ii) a $54 millionopenings. Total Retail smart bed unit sales increase from Company-Controlled comparable sales; partially offsetdecreased 16% compared with the prior year. Average revenue per smart bed unit in Total Retail increased by (iii) a $12 million decrease7% to $5,755, compared with $5,403 in Wholesale/Other channel sales. Company-Controlled mattress units increased 5% compared to the prior-year period. Average revenue per mattress unit in our Company-Controlled channel increased by 6%.
Gross profit
Gross profit for 2023 of $897 million increased$1.09 billion decreased by $87$114 million, or 11%9%, compared with $810 million for the same period one year ago.$1.20 billion in 2022. The 2023 gross profit rate increased to 62.1% of net sales for 2017, compared with 61.8% for the prior-year period. The prior-year gross profit rate was negatively impacted by actions taken to manage operating issues associated with our ERP implementation during the first six months of 2016. The current-year gross profit rate improvement of 0.3 ppt. benefited from manufacturing and supply chain efficiencies, including lean initiatives, and lower sales return and exchange costs compared with the same period one year ago. In addition, our gross profit rate can fluctuate from year to year due to a variety of other factors, including warranty expenses, product mix changes and performance-based incentive compensation.
| 45 | 2023 FORM 10-K | SLEEP NUMBER CORPORATION | |||||||
Sales and marketing expenses
Sales and marketing expenses decreased to $847 million in 2016 increased 8% to $596 million,2023, compared with $550$920 million last year. The sales and marketing expense rate of 45.4%increased to 44.9% of net sales, was consistentcompared with 43.5% for the same period one year agoago. The current-year sales and marketing expenses rate increase of 1.4 ppt. was primarily due to: (i) leveraging our media spending, which increased by 5% compared withdeleveraging impact of the prior year, while11% net sales increased by 8%;decrease; partially offset by (ii) a decrease in consumer financing costs as the Company adjusted promotional offers to mitigate increased costs associated with the higher customer service costs;interest rate environment resulting in 0.3 ppt. of leverage; and (iii) an increasea 12% decrease in customer financing expenses, as a larger percentagemedia spend year-over-year resulting in 0.2 ppt. of our customers took advantage of promotional financing offers.leverage.
General and administrative expenses
General and administrative (G&A) expenses increased $10.5decreased $7 million to $110$147 million in 2016,2023, compared with $99$153 million in the prior year, and increased to 8.4%7.8% of net sales, compared with 8.2%7.2% of net sales one year ago. The $10.5$7 million decrease in G&A expenses mainly consisted of the following: (i) a $8.2 million reduction in employee compensation on lower headcount; (ii) a $3.1 million benefit from favorable legal settlements (iii) a $0.9 million reduction in professional and consulting fees; (iv) a $0.7 million decrease in travel and training expenses; and (v) a $1.2 million decrease in other miscellaneous expenses; partially offset by (vi) a $4.0 million increase in G&A expenses consistedcompany-wide, performance-based incentive compensation due to the achievement of first half of the following major components: (i)fiscal year performance targets in the current year; and (vi) a $10.4$3.5 million increase in employee compensation, including headcount increases to support business growth initiatives, and salary and wage rate increases that were in line with inflation; (ii) $6.5 million of additionaldepreciation expense resulting from the increase in capital expenditures to support the growth of the business, including our new ERP system that was launched in the fourth quarter of 2015; (iii) a $3.5 million gain (net of acquisition-related expenses) in 2015 related to our previously held minority equity investment in BAM Labs, Inc.; and (iv) a$1.5 million increase in miscellaneous other expenses. These increases were partially offset by $11.6 million of data conversion and training expenses incurred in 2015 to support the launch of our ERP system.technology investments. The G&A expenseexpenses rate increased by 0.20.6 ppt. in 20162023, compared with the same period one year ago2022 due to the increase in expensesitems discussed above partially offset byin addition to the leveragingdeleveraging impact of the 8%11% net sales increase.decrease.
Research and development expenses
Research and development (R&D) expenses decreased by $6 million to $56 million in 2023, compared with $62 million in 2022 on lower outside services and headcount. While the Company’s consumer innovation pipeline remains robust, it is re-prioritizing R&D resources in this highly constrained environment.
Restructuring costs
In fiscal 2023, the Company incurred $15.7 million of restructuring costs. In light of the demand trajectory change in August 2023, the Company initiated business restructuring actions. Charges comprised of contract termination costs, severance and employee-related benefits, professional fees and other, and asset impairment charges. These actions support $40 to $45 million of incremental operating expense reductions in 2024.
Interest expense, net
Interest expense, net increased to $43 million for the year ended December 31, 2016 were $28 million, or 2.1% of net sales,30, 2023, compared with $16$19 million or 1.3% of net sales, for the same period one year ago. The $12$24 million increase in R&D expenses was due to increased investments to support product innovations, including a $9.7 million increase in expensesprimarily related to SleepIQ LABS' operations (post acquisition; acquired on September 15, 2015). The $12 million increase is consistenta higher weighted-average interest rate during 2023 compared with our long-term consumer innovation strategy.2022.
Income tax (benefit) expense
Income tax expensebenefit was $25$4 million for the year ended December 31, 2016,30, 2023, compared with $25income tax expense of $12 million for the same period one year ago. The effective income tax rate for the year ended December 31, 201630, 2023 was 32.3%22.6% compared with 33.0%25.1% for the prior-year period. The effective tax rates for 2016year ended December 31, 2022.
Comparison of 2022 and 2015 include tax benefits associated with our acquisition2021
For a discussion of BAM Labs, including higher research and development tax credits.the Company’s 2022 versus 2021 results, see its 2022 Form 10-K.
| 46 | 2023 FORM 10-K | SLEEP NUMBER CORPORATION | |||||||
Liquidity and Capital Resources
Managing ourthe Company’s liquidity and capital resources is an important part of ourits commitment to deliver superior shareholder value. Our business model, which can operate with minimal working capital, does not require additional capital from external sources to fund operations or organic growth. Ourvalue over time.
The Company’s primary sources of liquidity are cash flows provided by operating activities and cash available under our $300its $685 million revolving credit facility (increasedfacility. As of December 30, 2023, the Company did not have any off-balance sheet financing other than its $7 million in February 2018 from $153 million).outstanding letters of credit. The cash generated from ongoing operations and cash available under ourits revolving credit facility are expected to be adequate to maintain operations and fund anticipated expansion, and strategic initiatives and contractual obligations such as lease payments and capital commitments for new retail store locations for the foreseeable future. See Notes 7, Leases, and 13, Commitments and Contingencies, for further details on the Company’s contractual obligations.
The following table summarizes ourthe Company’s cash flows (dollars in millions). Amounts may not add due to rounding differences:
| 2023 | 2022 | ||||||||||
| Total cash (used in) provided by: | |||||||||||
| Operating activities | $ | (9,028) | $ | 36,138 | |||||||
| Investing activities | (58,352) | (70,607) | |||||||||
| Financing activities | 68,127 | 33,872 | |||||||||
| Net increase (decrease) in cash and cash equivalents | $ | 747 | $ | (597) | |||||||
| 2017 | 2016 | |||||||
| Total cash provided by (used in): | ||||||||
| Operating activities | $ | 172.6 | $ | 151.6 | ||||
| Investing activities | (56.6 | ) | (42.7 | ) | ||||
| Financing activities | (123.9 | ) | (118.4 | ) | ||||
| Net decrease in cash and cash equivalents | $ | (8.0 | ) | $ | (9.4 | ) | ||
Cash provided byused in operating activities for the fiscal year ended December 30, 20172023 was $173$9 million compared with $152net cash provided by operating activities of $36 million for the fiscal year ended December 31, 2016.2022. Significant components of the $21$45 million year-over-year changedecrease in cash from operating activities included: (i) a $14$52 million increasedecrease in net (loss) income in 20172023 compared with 2016;2022; (ii) a $23$32 million fluctuation in income taxes based on a $15 million income taxes receivable atcustomer prepayments due to the endtiming of 2015 compared with income tax liabilities at the end of 2016 and 2017;customer deliveries; (iii) a $13$25 million change in prepaid expenses and other current assets primarily due to amount and timing of rebate payments; (iv) a $24 million fluctuation in accounts payable due to lower expenses in the current year’s fourth quarter and timing of payments; and (v) a $17 million fluctuation in accrued compensation and benefits dueprimarily related to the year-over-year changes in company-wide performance-based incentive compensation resulting fromthat was earned in 2021 and paid in the strong 2017 financial performance; and (iv) the ERP implementation issues we experienced in our plants and supply chain during the fourthfirst quarter of 2015 that resulted2022, compared with no company-wide performance-based compensation earned in higher inventory levels, increased accounts receivables, increased accounts payables2022 and higher customer prepayments atpaid in the endfirst quarter of 2015.2023.
Net cash used in investing activities was $57$58 million for the fiscal year ended December 30, 2017,2023, compared with $43$71 million for the same period one year ago.in 2022. Investing activities for the current-year periodin 2023 included $60$57 million of property and equipment purchases, compared with $58$69 million for the same period last year. We decreased our net investments in marketable debt securities by $15 million during the fiscal year ended December 31, 2016 and held no marketable debt securities at December 30, 2017 or December 31, 2016.
Net cash used inprovided by financing activities was $124$68 million for the fiscal year ended December 30, 2017,2023, compared with net cash used$34 million in financing activities of $118 million for the same period one year ago.2022. During the fiscal year ended December 30, 2017, we2023, the Company repurchased $155$4 million of ourits common stock ($150(in connection with the vesting of employee restricted stock grants), compared with $64 million in 2022 (based on settlement dates, $55 million under ourits Board-approved share repurchase program and $5$9 million in connection with the vesting of employee restricted stock grants) compared with $127 million during the same period one year ago.
. Short-term borrowings increased by $22$73 million during the current-year period, reflecting $252023 due to a $80 million ofincrease in borrowings under our revolvingits credit facility as of December 30, 2017, compared with no borrowing as of December 31, 2016. Changesto $540 million, offset by a $6 million decrease in book overdrafts which are included in the net change in short-term borrowings. Short-term borrowings increased by $98 million during 2022 due to a $77 million increase in borrowings under its credit facility to $460 million, in addition to a $21 million increase in book overdrafts. Financing activities for both periodsyears reflect the cash proceeds from the exercise of employee stock options.
| 47 | 2023 FORM 10-K | SLEEP NUMBER CORPORATION | |||||||
In the second quarter of fiscal 2022, the Company suspended share repurchases under its Board-approved share repurchase program, weprogram. During 2022, the Company repurchased 5.41.0 million shares at a cost of $150$55 million ($28.00 per share) during the fiscal year ended December 30, 2017. During 2016, we repurchased 5.9 million shares at a cost of $125 million ($21.02(based on trade dates, $57.46 per share). Effective as of October 1, 2017, our Board approved an increase in our total remaining share repurchase authorization to $500 million. As of December 30, 2017,2023, the remaining authorization under ourits Board-approved share repurchase program was $465$348 million. There is no expiration date governing the period over which wethe Company can repurchase shares.
The Company amended the Credit Agreement on July 24, 2023. The amendment, among other things, extends the increased permissible Net Leverage Ratio to 5.0x to include the quarterly reporting period ending September 30, 2023. For the quarterly reporting period ending December 30, 2023, and subsequent quarterly reporting periods, the Maximum Leverage Ratio will be 4.5x.
The Company amended the Credit Agreement on November 2, 2023. This Tenth Amendment, among other things: (a) decreased the total aggregate commitment under the Credit Agreement from $825 million to $685 million; (b) decreased the $625 million revolving loan commitment to $485 million; (c) decreased the accordion from $400 million to $342.5 million; (d) increased the Applicable Commitment Fee Rate to 50 basis points when the Net Leverage Ratio is greater than or equal to 3.50 to 1.00 (as each is defined in the Credit Agreement); (e) increased the Applicable Margin by 25 to 75 basis points for each respective range of Net Leverage Ratios (as each is defined in the Credit Agreement); (f) deemed the Company’s Net Leverage Ratio as greater than or equal to 4.00 to 1.00 but less than 4.50 to 1.00 as of the Tenth Amendment effective date to set pricing for the Applicable Commitment Fee Rate and Applicable Margin until receipt of the compliance certificate for the quarterly reporting period ending December 30, 2023; (g) amends the definition of Consolidated EBITDA (as defined in the Credit Agreement) to include cash add backs, capped at $30 million for the quarterly reporting periods ending December 30, 2023, March 30, 2024, June 29, 2024, September 28, 2024, and December 28, 2024 and capped at $20 million for each quarterly reporting period ending thereafter; (h) amends the definitions of each of Net Leverage Ratio and Senior Secured Leverage Ratio (as each is defined in the Credit Agreement) to include the total operating lease liabilities of borrower, as calculated in accordance with ASC 842 accounting guidance (as of the end of the most recently completed quarterly reporting period) replacing the prior language of six multiplied by Consolidated Rent Expense (for the most recently completed four quarterly reporting periods); (i) adjusts the permissible maximum Net Leverage Ratio (as defined in the Credit Agreement) to (I) 5.00 to 1.00 for the quarterly reporting periods ending December 30, 2023 and March 30, 2024, (II) 5.50 to 1.00 for the quarterly reporting period ending June 29, 2024, (III) 5.00 to 1.00 for the quarterly reporting period ending September 28, 2024, (IV) 4.80 to 1.00 for the quarterly reporting period ending December 28, 2024, and (V) 4.00 to 1.00 for each quarterly reporting period occurring thereafter; (j) adjusts the permissible maximum Interest Coverage Ratio (as defined in the Credit Agreement) to (I) 1.50 to 1.00 for the quarterly reporting periods ending December 30, 2023 and March 30, 2024, (II) 1.25 to 1.00 for the quarterly reporting period ending June 29, 2024, (III) 1.50 to 1.00 for the quarterly reporting periods ending September 28, 2024 and December 28, 2024, and (IV) 3.00 to 1.00 for each quarterly reporting period occurring thereafter; and (k) decreased the requisite Net Leverage Ratio from 3.75 to 1.00 down to 3.00 to 1.00 (under the new applicable definitions) before any Acquisitions (with the exception of the Specified Acquisition) or Restricted Payments (as each is defined in the Credit Agreement) may be made. A fee for the amendment is payable to the approving lenders in an amount equal to 20 basis points multiplied by the sum of such lender's Revolving Credit Commitment and outstanding Term Loans (as each is defined in the Credit Agreement). The foregoing description of the Tenth Amendment is qualified in its entirety by reference to the complete terms of the credit agreement we pay a variable rate of interest and a commitment fee basedTenth Amendment, which is filed as an exhibit to this Quarterly Report on our leverage ratio. Form 10-Q.
As of December 30, 2017, we2023, the Company had $25$540 million in outstandingof borrowings and $3under its revolving credit facility, $7 million in outstanding letters of credit. Ascredit and net liquidity available under the credit facility of $138 million. At December 30, 2017,2023, the company’s leverage ratio as defined in the credit agreement was 4.1x versus the permissible net leverage ratio of
| 48 | 2023 FORM 10-K | SLEEP NUMBER CORPORATION | |||||||
5.0x, the weighted-average interest rate on borrowings outstanding under the credit facility was 3.1%. We were8.5% and the Company was in compliance with all financial covenants.
Payments Due by Period(1) | ||||||||||||||||||||
| Total | < 1 Year | 1 - 3 Years | 3 - 5 Years | > 5 Years | ||||||||||||||||
Operating leases(2) | $ | 436,767 | $ | 70,604 | $ | 123,183 | $ | 97,941 | $ | 145,039 | ||||||||||
| Purchase commitments | 8,600 | 8,600 | — | — | — | |||||||||||||||
| Total | $ | 445,367 | $ | 79,204 | $ | 123,183 | $ | 97,941 | $ | 145,039 | ||||||||||
Critical Accounting Policies and Estimates
| Description | |||||||||||||||
| Judgments and Uncertainties | Effect if Actual Results Differ | ||||||||||||||
| Stock-Based Compensation | |||||||||||||||
See Note 1, Business and Summary of Significant Accounting Policies, and Note | Option-pricing models and generally accepted valuation techniques require management to make assumptions and to apply judgment to determine the fair value of Performance-based stock awards require management to make assumptions regarding the likelihood of achieving performance targets. | The Company does not believe there is a reasonable likelihood that there will be a material change in the future estimates or assumptions In addition, if actual results are not consistent with the assumptions used, the stock-based compensation expense reported in A 10% change in | |||||||||||||
| 49 | 2023 FORM 10-K | SLEEP NUMBER CORPORATION | |||||||
| Description | Judgments and Uncertainties | Effect if Actual Results Differ from Assumptions | ||||||||||||
| Warranty Liabilities | ||||||||||||||
products it sells. See Note 1, Business and Summary of Significant Accounting Policies | ||||||||||||||
The majority of | A 10% change in 2023. | |||||||||||||
| Revenue Recognition | ||||||||||||||
Certain accounting estimates relating to revenue recognition contain uncertainty because they require management to make assumptions and to apply judgment regarding the effects of future events. See Note 1, Business and Summary of Significant Accounting Policies, and Note 9, Revenue Recognition, to the Notes to Consolidated Financial Statements, included in Item 8,Financial Statements and Supplementary Data, of this Annual Report on Form 10-K, for a complete discussion of | The Company has not made any material changes in the accounting methodology used to establish A 10% change in | |||||||||||||
Recent Accounting Pronouncements
See “Part II, Item 8. Financial Statements and Supplementary Data – Notes to Consolidated Financial Statements – Note 1, – Business and Summary of Significant Accounting Policies - New“New Accounting Pronouncements”Pronouncements” for recent accounting pronouncements that may affect ourthe Company’s financial reporting.
ITEM 7A. QUANTITATIVE AND QUALITATIVE DISCLOSURES ABOUT MARKET RISK
one percentage point higher than current rates, ourits annual net interest expense(loss) income would not changedecrease by a significant amount$4.1 million based on the $25$540 million of borrowings under our revolvingits credit facility at December 30, 2017. We do2023. The Company does not manage ourits interest-rate volatility risk through the use of derivative instruments.
| 50 | 2023 FORM 10-K | SLEEP NUMBER CORPORATION | |||||||
ITEM 8. FINANCIAL STATEMENTS AND SUPPLEMENTARY DATA
REPORT OF INDEPENDENT REGISTERED PUBLIC ACCOUNTING FIRM
To the shareholders and the Board of Directors and Shareholders of
Sleep Number Corporation
Opinion on the Financial Statements
We have audited the accompanying consolidated balance sheets of Sleep Number Corporation and subsidiaries (the “Company,” formerly Select Comfort Corporation)"Company") as of December 30, 20172023 and December 31, 2016,2022, the related consolidated statements of income, comprehensive income, shareholders’ equity, and cash flows, for each of the three years in the period ended December 30, 2017,2023, and the related notes and the schedule listed in the Index at Item 15 (collectively referred to as the “financial statements”"financial statements"). In our opinion, the financial statements present fairly, in all material respects, the financial position of the Company as of December 30, 20172023 and December 31, 2016,2022, and the results of its operations and its cash flows for each of the three years in the period ended December 30, 2017,2023, in conformity with accounting principles generally accepted in the United States of America.
We have also audited, in accordance with the standards of the Public Company Accounting Oversight Board (United States) (PCAOB), the Company's internal control over financial reporting as of December 30, 2017,2023, based on criteria established in Internal Control -— Integrated Framework (2013) issued by the Committee of Sponsoring Organizations of the Treadway Commission and our report dated February 27, 2018,23, 2024, expressed an unqualified opinion on the Company's internal control over financial reporting.
Basis for Opinion
These financial statements are the responsibility of the Company's management. Our responsibility is to express an opinion on the Company's financial statements based on our audits. We are a public accounting firm registered with the PCAOB and are required to be independent with respect to the Company in accordance with the U.S. federal securities laws and the applicable rules and regulations of the Securities and Exchange Commission and the PCAOB.
We conducted our audits in accordance with the standards of the PCAOB. Those standards require that we plan and perform the audit to obtain reasonable assurance about whether the financial statements are free of material misstatement, whether due to error or fraud. Our audits included performing procedures to assess the risks of material misstatement of the financial statements, whether due to error or fraud, and performing procedures that respond to those risks. Such procedures included examining, on a test basis, evidence regarding the amounts and disclosures in the financial statements. Our audits also included evaluating the accounting principles used and significant estimates made by management, as well as evaluating the overall presentation of the financial statements. We believe that our audits provide a reasonable basis for our opinion.
Critical Audit Matter
The critical audit matter communicated below is a matter arising from the current-period audit of the financial statements that was communicated or required to be communicated to the audit committee and that (1) relates to accounts or disclosures that are material to the financial statements and (2) involved our especially challenging, subjective, or complex judgments. The communication of critical audit matters does not alter in any way our opinion on the financial statements, taken as a whole, and we are not, by communicating the critical audit matter below, providing a separate opinion on the critical audit matter or on the accounts or disclosures to which it relates.
Warranty Liability - Refer to “Note 1 -Warranty Liabilities”
Critical Audit Matter Description
The Company provides a limited warranty on most products sold. The estimated warranty liabilities, which are expensed at the time of sale and included in cost of sales, are based on historical trends and warranty claim rates incurred and the assumptions are adjusted for any current trends as appropriate. As of December 30, 2023, the Company has warranty liabilities of $8.5 million.
| 51 | 2023 FORM 10-K | SLEEP NUMBER CORPORATION | |||||||
We identified the warranty liability as a critical audit matter because of the significant judgments made by management to estimate warranty claim rates. This required a high degree of auditor judgment and an increased extent of effort when performing audit procedures to evaluate the reasonableness of management’s estimates of future warranty claims based on historical claims paid, from which management uses to develop warranty liability estimates.
How the Critical Audit Matter Was Addressed in the Audit
Our procedures related to the warranty liabilities included the following, among others:
•We tested the effectiveness of controls related to warranty liabilities, including those over historical warranty claim data and estimated future warranty claim rates.
•We evaluated the reasonableness of management’s estimate of warranty liabilities by comparing the historical warranty claim trends to the current warranty claim rates of the Sleep Number 360 smart bed line and other products.
•We evaluated the completeness of the warranty liabilities through inquiries of operational and executive management regarding knowledge of known product warranty claims or product issues and evaluated whether they were appropriately considered in the determination of the warranty liabilities.
•We evaluated the methods and assumptions used by management to estimate the warranty liabilities by:
•Testing the underlying data that served as the basis for the estimate, to test that the inputs to the estimate were reasonable and to test the mathematical accuracy of the calculation.
•Developing an expectation of warranty liabilities and comparing it to the recorded balance.
•Comparing management’s prior-year assumption of expected claim rates to actuals incurred during the year to evaluate management’s ability to estimate the warranty liabilities.
/s/ DELOITTE & TOUCHE LLP
Minneapolis, Minnesota
February 27, 201823, 2024
We have served as the Company'sCompany’s auditor since 2010.
| 52 | 2023 FORM 10-K | SLEEP NUMBER CORPORATION | |||||||
REPORT OF INDEPENDENT REGISTERED PUBLIC ACCOUNTING FIRM
To the shareholders and the Board of Directors and Shareholders of
Sleep Number Corporation
Opinion on Internal Control over Financial Reporting
We have audited the internal control over financial reporting of Sleep Number Corporation and subsidiaries (the “Company,” formerly Select Comfort Corporation)“Company”) as of December 30, 2017,2023, based on the criteria established in Internal Control-IntegratedControl — Integrated Framework (2013) issued by the Committee of Sponsoring Organizations of the Treadway Commission (COSO). In our opinion, the Company maintained, in all material respects, effective internal control over financial reporting as of December 30, 2017,2023, based on criteria established in Internal Control -— Integrated Framework (2013) issued by COSO.
We have also audited, in accordance with the standards of the Public Company Accounting Oversight Board (United States) (PCAOB), the consolidated financial statements and financial statement schedule as of and for the year ended December 30, 2017,2023, of the Company and our report dated February 27, 201823, 2024, expressed an unqualified opinion on those financial statements and financial statement schedule.
Basis for Opinion
The Company’s management is responsible for maintaining effective internal control over financial reporting and for its assessment of the effectiveness of internal control over financial reporting, included in the accompanying Management’s Report on Internal Control Over Financial Reporting.Reporting. Our responsibility is to express an opinion on the Company’s internal control over financial reporting based on our audit. We are a public accounting firm registered with the PCAOB and are required to be independent with respect to the Company in accordance with the U.S. federal securities laws and the applicable rules and regulations of the Securities and Exchange Commission and the PCAOB.
We conducted our audit in accordance with the standards of the PCAOB. Those standards require that we plan and perform the audit to obtain reasonable assurance about whether effective internal control over financial reporting was maintained in all material respects. Our audit included obtaining an understanding of internal control over financial reporting, assessing the risk that a material weakness exists, testing and evaluating the design and operating effectiveness of internal control based on the assessed risk, and performing such other procedures as we considered necessary in the circumstances. We believe that our audit provides a reasonable basis for our opinion.
Definition and Limitations of Internal Control over Financial Reporting
A company’s internal control over financial reporting is a process designed to provide reasonable assurance regarding the reliability of financial reporting and the preparation of financial statements for external purposes in accordance with generally accepted accounting principles. A company’s internal control over financial reporting includes those policies and procedures that (1) pertain to the maintenance of records that, in reasonable detail, accurately and fairly reflect the transactions and dispositions of the assets of the company; (2) provide reasonable assurance that transactions are recorded as necessary to permit preparation of financial statements in accordance with generally accepted accounting principles, and that receipts and expenditures of the company are being made only in accordance with authorizations of management and directors of the company; and (3) provide reasonable assurance regarding prevention or timely detection of unauthorized acquisition, use, or disposition of the company’s assets that could have a material effect on the financial statements.
Because of its inherent limitations, internal control over financial reporting may not prevent or detect misstatements. Also, projections of any evaluation of effectiveness to future periods are subject to the risk that controls may become inadequate because of changes in conditions, or that the degree of compliance with the policies or procedures may deteriorate.
/s/ DELOITTE & TOUCHE LLP
Minneapolis, Minnesota
February 27, 201823, 2024
| 53 | 2023 FORM 10-K | SLEEP NUMBER CORPORATION | |||||||
SLEEP NUMBER CORPORATION
AND SUBSIDIARIES
Consolidated Balance Sheets
December 30, 20172023 and December 31, 20162022
(in thousands, except per share amounts)
| 2023 | 2022 | ||||||||||
| Assets | |||||||||||
| Current assets: | |||||||||||
| Cash and cash equivalents | $ | 2,539 | $ | 1,792 | |||||||
| Accounts receivable, net of allowances of $1,437 and $1,267, respectively | 26,859 | 26,005 | |||||||||
| Inventories | 115,433 | 114,034 | |||||||||
| Prepaid expenses | 16,660 | 16,006 | |||||||||
| Other current assets | 44,637 | 39,921 | |||||||||
| Total current assets | 206,128 | 197,758 | |||||||||
| Non-current assets: | |||||||||||
| Property and equipment, net | 179,503 | 200,605 | |||||||||
| Operating lease right-of-use assets | 395,411 | 397,755 | |||||||||
| Goodwill and intangible assets, net | 66,634 | 68,065 | |||||||||
| Deferred income taxes | 20,253 | 7,958 | |||||||||
| Other non-current assets | 82,951 | 81,795 | |||||||||
| Total assets | $ | 950,880 | $ | 953,936 | |||||||
| Liabilities and Shareholders’ Deficit | |||||||||||
| Current liabilities: | |||||||||||
| Borrowings under revolving credit facility | $ | 539,500 | $ | 459,600 | |||||||
| Accounts payable | 135,901 | 176,207 | |||||||||
| Customer prepayments | 49,143 | 73,181 | |||||||||
| Accrued sales returns | 22,402 | 25,594 | |||||||||
| Compensation and benefits | 28,273 | 31,291 | |||||||||
| Taxes and withholding | 17,134 | 23,622 | |||||||||
| Operating lease liabilities | 81,760 | 79,533 | |||||||||
| Other current liabilities | 61,958 | 60,785 | |||||||||
| Total current liabilities | 936,071 | 929,813 | |||||||||
| Non-current liabilities: | |||||||||||
| Operating lease liabilities | 351,394 | 356,879 | |||||||||
| Other non-current liabilities | 105,343 | 105,421 | |||||||||
| Total liabilities | 1,392,808 | 1,392,113 | |||||||||
| Shareholders’ deficit: | |||||||||||
| Undesignated preferred stock; 5,000 shares authorized, no shares issued and outstanding | — | — | |||||||||
| Common stock, $0.01 par value; 142,500 shares authorized, 22,235 and 22,014 shares issued and outstanding, respectively | 222 | 220 | |||||||||
| Additional paid-in capital | 16,716 | 5,182 | |||||||||
| Accumulated deficit | (458,866) | (443,579) | |||||||||
| Total shareholders’ deficit | (441,928) | (438,177) | |||||||||
| Total liabilities and shareholders’ deficit | $ | 950,880 | $ | 953,936 | |||||||
See accompanying notes to consolidated financial statements.
| 54 | 2023 FORM 10-K | SLEEP NUMBER CORPORATION | |||||||
SLEEP NUMBER CORPORATION
AND SUBSIDIARIES
Consolidated Statements of Operations
Years ended December 30, 2023, December 31, 2022 and January 1, 2022
(in thousands, except per share amounts)
| 2017 | 2016 | ||||||
| Assets | |||||||
| Current assets: | |||||||
| Cash and cash equivalents | $ | 3,651 | $ | 11,609 | |||
| Accounts receivable, net of allowance for doubtful accounts of $714 and $884, respectively | 19,312 | 19,705 | |||||
| Inventories | 84,298 | 75,026 | |||||
| Prepaid expenses | 17,565 | 8,705 | |||||
| Other current assets | 27,665 | 23,282 | |||||
| Total current assets | 152,491 | 138,327 | |||||
| Non-current assets: | |||||||
| Property and equipment, net | 208,646 | 208,367 | |||||
| Goodwill and intangible assets, net | 77,588 | 80,817 | |||||
| Deferred income taxes | 2,625 | 4,667 | |||||
| Other non-current assets | 30,484 | 24,988 | |||||
| Total assets | $ | 471,834 | $ | 457,166 | |||
| Liabilities and Shareholders’ Equity | |||||||
| Current liabilities: | |||||||
| Borrowings under revolving credit facility | $ | 24,500 | $ | — | |||
| Accounts payable | 129,194 | 105,375 | |||||
| Customer prepayments | 27,767 | 26,207 | |||||
| Accrued sales returns | 19,270 | 15,222 | |||||
| Compensation and benefits | 34,602 | 19,455 | |||||
| Taxes and withholding | 24,234 | 23,430 | |||||
| Other current liabilities | 46,822 | 35,628 | |||||
| Total current liabilities | 306,389 | 225,317 | |||||
| Non-current liabilities: | |||||||
| Other non-current liabilities | 76,289 | 71,529 | |||||
| Total liabilities | 382,678 | 296,846 | |||||
| Shareholders’ equity: | |||||||
| Undesignated preferred stock; 5,000 shares authorized, no shares issued and outstanding | — | — | |||||
| Common stock, $0.01 par value; 142,500 shares authorized, 38,813 and 43,569 shares issued and outstanding, respectively | 388 | 436 | |||||
| Additional paid-in capital | — | — | |||||
| Retained earnings | 88,768 | 159,884 | |||||
| Total shareholders’ equity | 89,156 | 160,320 | |||||
| Total liabilities and shareholders’ equity | $ | 471,834 | $ | 457,166 | |||
| 2023 | 2022 | 2021 | |||||||||||||||
| Net sales | $ | 1,887,482 | $ | 2,114,297 | $ | 2,184,949 | |||||||||||
| Cost of sales | 798,952 | 912,001 | 866,102 | ||||||||||||||
| Gross profit | 1,088,530 | 1,202,296 | 1,318,847 | ||||||||||||||
| Operating expenses: | |||||||||||||||||
| Sales and marketing | 847,442 | 919,629 | 905,359 | ||||||||||||||
| General and administrative | 146,621 | 153,266 | 161,412 | ||||||||||||||
| Research and development | 55,797 | 61,521 | 58,540 | ||||||||||||||
| Restructuring costs | 15,728 | — | — | ||||||||||||||
| Total operating expenses | 1,065,588 | 1,134,416 | 1,125,311 | ||||||||||||||
| Operating income | 22,942 | 67,880 | 193,536 | ||||||||||||||
| Interest expense, net | 42,695 | 18,985 | 6,245 | ||||||||||||||
| (Loss) income before income taxes | (19,753) | 48,895 | 187,291 | ||||||||||||||
| Income tax (benefit) expense | (4,466) | 12,285 | 33,545 | ||||||||||||||
| Net (loss) income | $ | (15,287) | $ | 36,610 | $ | 153,746 | |||||||||||
| Basic net (loss) income per share: | |||||||||||||||||
| Net (loss) income per share – basic | $ | (0.68) | $ | 1.63 | $ | 6.40 | |||||||||||
| Weighted-average shares – basic | 22,429 | 22,396 | 24,038 | ||||||||||||||
| Diluted net (loss) income per share: | |||||||||||||||||
| Net (loss) income per share – diluted | $ | (0.68) | $ | 1.60 | $ | 6.16 | |||||||||||
| Weighted-average shares – diluted | 22,429 | 22,852 | 24,947 | ||||||||||||||
See accompanying notes to consolidated financial statements.
| 55 | 2023 FORM 10-K | SLEEP NUMBER CORPORATION | |||||||
SLEEP NUMBER CORPORATION
AND SUBSIDIARIES
Consolidated Statements of OperationsShareholders’ Deficit
Years ended December 30, 2017, 2023, December 31, 20162022 and January 2, 20161, 2022
(in thousands, except per share amounts)thousands)
| 2017 | 2016 | 2015 | |||||||||
| Net sales | $ | 1,444,497 | $ | 1,311,291 | $ | 1,213,699 | |||||
| Cost of sales | 547,150 | 501,131 | 472,948 | ||||||||
| Gross profit | 897,347 | 810,160 | 740,751 | ||||||||
| Operating expenses: | |||||||||||
| Sales and marketing | 650,357 | 595,845 | 550,475 | ||||||||
| General and administrative | 127,269 | 109,674 | 99,209 | ||||||||
| Research and development | 27,806 | 27,991 | 15,971 | ||||||||
| Total operating expenses | 805,432 | 733,510 | 665,655 | ||||||||
| Operating income | 91,915 | 76,650 | 75,096 | ||||||||
| Other (expense) income, net | (877 | ) | (717 | ) | 334 | ||||||
| Income before income taxes | 91,038 | 75,933 | 75,430 | ||||||||
| Income tax expense | 25,961 | 24,516 | 24,911 | ||||||||
| Net income | $ | 65,077 | $ | 51,417 | $ | 50,519 | |||||
| Basic net income per share: | |||||||||||
| Net income per share – basic | $ | 1.58 | $ | 1.11 | $ | 0.99 | |||||
| Weighted-average shares – basic | 41,212 | 46,154 | 51,252 | ||||||||
| Diluted net income per share: | |||||||||||
| Net income per share – diluted | $ | 1.55 | $ | 1.10 | $ | 0.97 | |||||
| Weighted-average shares – diluted | 42,085 | 46,902 | 52,101 | ||||||||
| Common Stock | Additional Paid-in Capital | Accumulated Deficit | |||||||||||||||||||||||||||
| Shares | Amount | Total | |||||||||||||||||||||||||||
| Balance at January 2, 2021 | 25,390 | $ | 254 | $ | — | $ | (224,232) | $ | (223,978) | ||||||||||||||||||||
| Net income | — | — | — | 153,746 | 153,746 | ||||||||||||||||||||||||
| Exercise of common stock options | 174 | 2 | 4,439 | — | 4,441 | ||||||||||||||||||||||||
| Stock-based compensation | 369 | 4 | 23,210 | — | 23,214 | ||||||||||||||||||||||||
| Repurchases of common stock | (3,250) | (33) | (23,678) | (358,665) | (382,376) | ||||||||||||||||||||||||
| Balance at January 1, 2022 | 22,683 | $ | 227 | $ | 3,971 | $ | (429,151) | $ | (424,953) | ||||||||||||||||||||
| Net income | — | — | — | 36,610 | 36,610 | ||||||||||||||||||||||||
| Exercise of common stock options | 48 | — | 1,131 | — | 1,131 | ||||||||||||||||||||||||
| Stock-based compensation | 405 | 4 | 13,219 | — | 13,223 | ||||||||||||||||||||||||
| Repurchases of common stock | (1,122) | (11) | (13,139) | (51,038) | (64,188) | ||||||||||||||||||||||||
| Balance at December 31, 2022 | 22,014 | $ | 220 | $ | 5,182 | $ | (443,579) | $ | (438,177) | ||||||||||||||||||||
| Net loss | — | — | — | (15,287) | (15,287) | ||||||||||||||||||||||||
| Exercise of common stock options | 20 | — | 428 | — | 428 | ||||||||||||||||||||||||
| Stock-based compensation | 335 | 3 | 14,852 | — | 14,855 | ||||||||||||||||||||||||
| Repurchases of common stock | (134) | (1) | (3,746) | — | (3,747) | ||||||||||||||||||||||||
| Balance at December 30, 2023 | 22,235 | $ | 222 | $ | 16,716 | $ | (458,866) | $ | (441,928) | ||||||||||||||||||||
See accompanying notes to consolidated financial statements.
| 56 | 2023 FORM 10-K | SLEEP NUMBER CORPORATION | |||||||
SLEEP NUMBER CORPORATION
AND SUBSIDIARIES
Consolidated Statements of Comprehensive IncomeCash Flows
Years ended December 30, 2017,2023, December 31, 20162022 and January 2, 20161, 2022
(in thousands)
| 2017 | 2016 | 2015 | ||||||||||
| Net income | $ | 65,077 | $ | 51,417 | $ | 50,519 | ||||||
| Other comprehensive income – unrealized gain on available-for-sale marketable debt securities, net of income tax | — | 14 | 20 | |||||||||
| Comprehensive income | $ | 65,077 | $ | 51,431 | $ | 50,539 | ||||||
| 2023 | 2022 | 2021 | |||||||||||||||
| Cash flows from operating activities: | |||||||||||||||||
| Net (loss) income | $ | (15,287) | $ | 36,610 | $ | 153,746 | |||||||||||
| Adjustments to reconcile net (loss) income to net cash provided by operating activities: | |||||||||||||||||
| Depreciation and amortization | 74,043 | 67,401 | 60,394 | ||||||||||||||
| Stock-based compensation | 14,855 | 13,223 | 23,214 | ||||||||||||||
| Net loss on disposals and impairments of assets | 2,898 | 291 | 37 | ||||||||||||||
| Deferred income taxes | (12,295) | (8,646) | 446 | ||||||||||||||
| Changes in operating assets and liabilities: | |||||||||||||||||
| Accounts receivable | (854) | (287) | 6,153 | ||||||||||||||
| Inventories | (1,399) | (11,560) | (24,282) | ||||||||||||||
| Income taxes | (5,969) | 1,356 | (3,066) | ||||||||||||||
| Prepaid expenses and other assets | (5,220) | 19,379 | (13,836) | ||||||||||||||
| Accounts payable | (28,934) | (4,743) | 54,405 | ||||||||||||||
| Customer prepayments | (24,038) | (56,318) | 57,482 | ||||||||||||||
| Accrued compensation and benefits | (2,943) | (19,821) | (24,790) | ||||||||||||||
| Other taxes and withholding | (519) | 179 | 1,814 | ||||||||||||||
| Other accruals and liabilities | (3,366) | (926) | 8,293 | ||||||||||||||
| Net cash (used in) provided by operating activities | (9,028) | 36,138 | 300,010 | ||||||||||||||
| Cash flows from investing activities: | |||||||||||||||||
| Purchases of property and equipment | (57,056) | (69,454) | (66,900) | ||||||||||||||
| Proceeds from sales of property and equipment | 21 | 49 | 257 | ||||||||||||||
| Issuance of notes receivable | (1,317) | — | — | ||||||||||||||
| Investment in non-marketable equity securities | — | (1,202) | — | ||||||||||||||
| Net cash used in investing activities | (58,352) | (70,607) | (66,643) | ||||||||||||||
| Cash flows from financing activities: | |||||||||||||||||
| Repurchases of common stock | (3,747) | (64,188) | (382,376) | ||||||||||||||
| Net increase in short-term borrowings | 73,463 | 97,647 | 145,473 | ||||||||||||||
| Proceeds from issuance of common stock | 428 | 1,131 | 4,441 | ||||||||||||||
| Debt issuance costs | (2,017) | (718) | (2,759) | ||||||||||||||
| Net cash provided by (used in) financing activities | 68,127 | 33,872 | (235,221) | ||||||||||||||
| Net increase (decrease) in cash and cash equivalents | 747 | (597) | (1,854) | ||||||||||||||
| Cash and cash equivalents, at beginning of period | 1,792 | 2,389 | 4,243 | ||||||||||||||
| Cash and cash equivalents, at end of period | $ | 2,539 | $ | 1,792 | $ | 2,389 | |||||||||||
| Supplemental Disclosure of Cash Flow Information | |||||||||||||||||
| Income taxes paid, net of refunds | $ | 13,716 | $ | 19,792 | $ | 36,305 | |||||||||||
| Interest paid | $ | 40,570 | $ | 16,918 | $ | 5,438 | |||||||||||
| Purchases of property and equipment included in accounts payable | $ | 6,670 | $ | 11,707 | $ | 13,968 | |||||||||||
See accompanying notes to consolidated financial statements.
| 57 | 2023 FORM 10-K | SLEEP NUMBER CORPORATION | |||||||
SLEEP NUMBER CORPORATION
AND SUBSIDIARIES
| Common Stock | Additional Paid-in Capital | Retained Earnings | Accumulated Other Comprehensive Income/(Loss) | Total | ||||||||||||||||||
| Shares | Amount | |||||||||||||||||||||
| Balance at January 3, 2015 | 52,798 | $ | 528 | $ | — | $ | 256,413 | $ | (34 | ) | $ | 256,907 | ||||||||||
| Net income | — | — | — | 50,519 | — | 50,519 | ||||||||||||||||
| Other comprehensive income: | ||||||||||||||||||||||
| Unrealized gain on available-for-sale marketable debt securities, net of tax | — | — | — | — | 20 | 20 | ||||||||||||||||
| Exercise of common stock options | 253 | 3 | 2,973 | — | — | 2,976 | ||||||||||||||||
| Tax effect from stock-based compensation | — | — | 1,828 | — | — | 1,828 | ||||||||||||||||
| Stock-based compensation | (7 | ) | — | 10,290 | — | — | 10,290 | |||||||||||||||
| Repurchases of common stock | (3,642 | ) | (37 | ) | (15,091 | ) | (85,073 | ) | — | (100,201 | ) | |||||||||||
| Balance at January 2, 2016 | 49,402 | $ | 494 | $ | — | $ | 221,859 | $ | (14 | ) | $ | 222,339 | ||||||||||
| Net income | — | — | — | 51,417 | — | 51,417 | ||||||||||||||||
| Other comprehensive income: | ||||||||||||||||||||||
| Unrealized gain on available-for-sale marketable debt securities, net of tax | — | — | — | — | 14 | 14 | ||||||||||||||||
| Exercise of common stock options | 188 | 2 | 2,296 | — | — | 2,298 | ||||||||||||||||
| Tax effect from stock-based compensation | — | — | (1,016 | ) | — | — | (1,016 | ) | ||||||||||||||
| Stock-based compensation | 11 | — | 11,961 | — | — | 11,961 | ||||||||||||||||
| Repurchases of common stock | (6,032 | ) | (60 | ) | (13,241 | ) | (113,392 | ) | — | (126,693 | ) | |||||||||||
| Balance at December 31, 2016 | 43,569 | $ | 436 | $ | — | $ | 159,884 | $ | — | $ | 160,320 | |||||||||||
| Net income | — | — | — | 65,077 | — | 65,077 | ||||||||||||||||
| Exercise of common stock options | 222 | 2 | 3,239 | — | — | 3,241 | ||||||||||||||||
| Stock-based compensation | 594 | 6 | 15,757 | — | — | 15,763 | ||||||||||||||||
| Repurchases of common stock | (5,572 | ) | (56 | ) | (18,996 | ) | (136,193 | ) | — | (155,245 | ) | |||||||||||
| Balance at December 30, 2017 | 38,813 | $ | 388 | $ | — | $ | 88,768 | $ | — | $ | 89,156 | |||||||||||
| 2017 | 2016 | 2015 | |||||||||
| Cash flows from operating activities: | |||||||||||
| Net income | $ | 65,077 | $ | 51,417 | $ | 50,519 | |||||
| Adjustments to reconcile net income to net cash provided by operating activities: | |||||||||||
| Depreciation and amortization | 61,291 | 57,172 | 47,630 | ||||||||
| Stock-based compensation | 15,763 | 11,961 | 10,290 | ||||||||
| Net loss on disposals and impairments of assets | 249 | 27 | 190 | ||||||||
| Excess tax benefits from stock-based compensation | — | (517 | ) | (2,182 | ) | ||||||
| Deferred income taxes | 2,042 | (1,640 | ) | 11,924 | |||||||
| Gain on sale of non-marketable equity securities | — | — | (6,891 | ) | |||||||
| Changes in operating assets and liabilities, net of effect of acquisition: | |||||||||||
| Accounts receivable | 393 | 9,297 | (9,259 | ) | |||||||
| Inventories | (9,272 | ) | 11,574 | (33,065 | ) | ||||||
| Income taxes | 1,697 | 25,119 | (13,943 | ) | |||||||
| Prepaid expenses and other assets | (12,405 | ) | (2,195 | ) | 8,680 | ||||||
| Accounts payable | 21,779 | (4,965 | ) | 19,130 | |||||||
| Customer prepayments | 1,560 | (25,266 | ) | 22,735 | |||||||
| Accrued compensation and benefits | 15,398 | 2,808 | (17,493 | ) | |||||||
| Other taxes and withholding | (893 | ) | 2,723 | 135 | |||||||
| Other accruals and liabilities | 9,928 | 14,130 | 19,542 | ||||||||
| Net cash provided by operating activities | 172,607 | 151,645 | 107,942 | ||||||||
| Cash flows from investing activities: | |||||||||||
| Purchases of property and equipment | (59,829 | ) | (57,852 | ) | (85,586 | ) | |||||
| Decrease in restricted cash | 3,150 | — | — | ||||||||
| Proceeds from sales of property and equipment | 36 | 92 | 72 | ||||||||
| Proceeds from marketable debt securities | — | 21,053 | 127,664 | ||||||||
| Investments in marketable debt securities | — | (5,968 | ) | (29,299 | ) | ||||||
| Acquisition of business | — | — | (70,018 | ) | |||||||
| Proceeds from non-marketable equity securities | — | — | 12,891 | ||||||||
| Net cash used in investing activities | (56,643 | ) | (42,675 | ) | (44,276 | ) | |||||
| Cash flows from financing activities: | |||||||||||
| Repurchases of common stock | (155,245 | ) | (126,693 | ) | (100,201 | ) | |||||
| Net increase in short-term borrowings | 28,094 | 5,932 | 1,097 | ||||||||
| Proceeds from issuance of common stock | 3,241 | 2,298 | 2,976 | ||||||||
| Debt issuance costs | (12 | ) | (409 | ) | (721 | ) | |||||
| Excess tax benefits from stock-based compensation | — | 517 | 2,182 | ||||||||
| Net cash used in financing activities | (123,922 | ) | (118,355 | ) | (94,667 | ) | |||||
| Net decrease in cash and cash equivalents | (7,958 | ) | (9,385 | ) | (31,001 | ) | |||||
| Cash and cash equivalents, at beginning of period | 11,609 | 20,994 | 51,995 | ||||||||
| Cash and cash equivalents, at end of period | $ | 3,651 | $ | 11,609 | $ | 20,994 | |||||
| Supplemental Disclosure of Cash Flow Information | |||||||||||
| Income taxes paid (received) | $ | 22,807 | $ | (653 | ) | $ | 26,681 | ||||
| Interest paid | $ | 753 | $ | 608 | $ | 96 | |||||
| Purchases of property and equipment included in accounts payable | $ | 3,964 | $ | 5,517 | $ | 5,051 | |||||
Notes to Consolidated Financial Statements
(1) Business and Summary of Significant Accounting Policies
Business & Basis of Presentation
Sleep Number Corporation (previously Select Comfort Corporation) and ourits 100%-owned subsidiaries (Sleep Number or the Company) have a vertically integrated business model and are the exclusive designer, manufacturer, marketer, retailer and servicer of Sleep Number® beds. We are the pioneer in biometricNumber beds which allows it to offer consumers high-quality, individualized sleep trackingsolutions and adjustability. Only the Sleep Number bed offers SleepIQ technology - a proprietary sensor technology that tracks each individual's sleep and works directly with the bed’s DualAir system to automatically adjust the comfort level of each sleeper. SleepIQ technology communicates how you slept and provides insights on what adjustments you can make to optimize your sleep and improve your daily life.services. Sleep Number also offers FlextFit adjustable bases, and Sleep Number pillows, sheets and other bedding products.
The consolidated financial statements include the accounts of Sleep Number Corporation and ourits 100%-owned subsidiaries. All significant intra-entity balances and transactions have been eliminated in consolidation.
Fiscal Year
Use of Estimates in the Preparation of Financial Statements
The preparation of consolidated financial statements in conformity with U.S. generally accepted accounting principlesGenerally Accepted Accounting Principles (GAAP) requires usthe Company to make estimates and assumptions. These estimates and assumptions affect the reported amounts of assets and liabilities, disclosure of contingent assets and liabilities at the date of the consolidated financial statements, and the reported amounts of sales, expenses and income taxes during the reporting period. Predicting future events is inherently an imprecise activity and, as such, requires the use of judgment. As future events and their effects cannot be determined with precision, actual results could differ significantly from these estimates. Changes in these estimates will be reflected in the consolidated financial statements in future periods. Ourperiods and could be material.
The Company’s critical accounting policies consist of stock-based compensation, goodwill and indefinite-lived intangible assets, warranty liabilities and revenue recognition.
Cash and Cash Equivalents
Cash and cash equivalents include highly liquidhighly-liquid investments with original maturities of three months or less. The carrying value of these investments approximates fair value due to their short-term maturity. OurThe Company’s banking arrangements allow usit to fund outstanding checks when presented to the financial institution for payment, resulting in book overdrafts. Book overdrafts are included in accounts payable in ourthe consolidated balance sheets and in net increase (decrease) in short-term borrowings in the financing activities section of ourthe Company’s consolidated statements of cash flows. Book overdrafts totaled $30$30 million and $27$36 million at December 30, 2017,2023 and December 31, 2016,2022, respectively.
Accounts Receivable
Accounts receivable are recorded net of an allowance for expected credit losses and consist primarily of receivables from wholesale customers and receivables from third-party financiers for customer credit card purchases. The allowance is recognized in an amount equal to anticipated future write-offs. We estimateThe Company estimates future write-offs based on delinquencies, aging trends, industry risk trends, ourits historical experience and current trends. Account balances are charged off against the allowance when we believethe Company believes it is probable the receivable will not be recovered.
| 58 | 2023 FORM 10-K | SLEEP NUMBER CORPORATION | |||||||
SLEEP NUMBER CORPORATION
AND SUBSIDIARIES
Notes to Consolidated Financial Statements - (continued)
Inventories
Inventories include materials, labor and overhead and are stated at the lower of cost or net realizable value. Cost is determined by the first-in, first-out method. The Company reviews inventory quantities on hand and record reserves for obsolescence based on historical selling prices, current market conditions and forecasted product demand, to reduce inventory to net realizable value.
Property and Equipment
Property and equipment, carried at cost, is depreciated using the straight-line method over the estimated useful lives of the assets. The cost and related accumulated depreciation of assets sold or retired is removed from the accounts with any resulting gain or loss included in net (loss) income in ourthe consolidated statements of operations. Maintenance and repairs are charged to expense as incurred. Major renewals and betterments that extend useful life are capitalized.
Leasehold improvements are depreciated over the shorter of the estimated useful lives of the assets or the contractual term of the lease, with consideration of lease renewal options if renewal appears probable.
Estimated useful lives of ourthe Company’s property and equipment by major asset category are as follows:
| Leasehold improvements | 5 to 15 years | ||||
| Furniture and equipment | |||||
| Production machinery | 3 to 7 years | ||||
| Computer equipment and software | 3 to 12 years | ||||
Goodwill and Intangible Assets, Net
Goodwill is the difference between the purchase price of a company and the fair market value of the acquired company'scompany’s net identifiable assets. OurThe Company’s intangible assets include developed technologies and trade names/trademarks and customer relationships.trademarks. Definite-lived intangible assets are being amortized using the straight-line method over their estimated lives, ranging from 8-10 years.
Asset Impairment Charges
Long-lived Assets and Definite-lived Intangible Assets- we review ourthe Company reviews its long-lived assets and definite-lived intangible assets for impairment whenever events or changes in circumstances indicate that the carrying amount of an asset may not be recoverable. When evaluating long-lived assets for potential impairment, wethe Company first comparecompares the carrying value of the asset to the estimated future cash flows (undiscounted and without interest charges - plus proceeds expected from disposition, if any). If the estimated undiscounted cash flows are less than the carrying value of the asset, we calculatethe Company calculates an impairment loss. The impairment loss calculation compares the carrying value of the asset to the asset’s estimated fair value. When we recognizethe Company recognizes an impairment loss, the carrying amount of the asset is reduced to estimated fair value based on discounted cash flows, quoted market prices or other valuation techniques. Assets to be disposed of are reported at the lower of the carrying amount of the asset or fair value less costs to sell. We reviewThe Company reviews retail store assets for potential impairment based on historical cash flows, lease termination provisions and expected future retail store operating results. If we recognizethe Company recognizes an impairment loss for a depreciable long-lived asset, the adjusted carrying amount of the asset becomes its new cost basis and will be depreciated (amortized) over the remaining useful life of that asset.
Goodwill and Indefinite-lived Intangible Assets- goodwill and indefinite-lived intangible assets are not amortized but are tested for impairment annually or when there are indicators of impairment using a fair value approach. The Financial Accounting Standards Board's (FASB) guidance allows us to perform either a quantitative assessment or a qualitative assessment before calculating the fair
| 59 | 2023 FORM 10-K | SLEEP NUMBER CORPORATION | |||||||
SLEEP NUMBER CORPORATION
AND SUBSIDIARIES
Notes to Consolidated Financial Statements - (continued)
carrying value exceeds fair value, an impairment loss is recognized in an amount equal to the excess. Based on our 2017the Company’s 2023 assessments, weit determined there was no impairment.
Other Investments
The Company has an investment in non-marketable equity securities of $1.2 million at December 30, 2023. This investment was made in a strategic product-development partner and is included in other non-current assets in the consolidated balance sheet. Non-marketable equity securities are equity securities without readily determinable fair value that are measured and recorded using a measurement alternative that measures the securities at cost minus impairment, if any, plus or minus changes resulting from qualifying observable price changes.
Warranty Liabilities
| 2023 | 2022 | 2021 | |||||||||||||||
| Balance at beginning of period | $ | 8,997 | $ | 10,069 | $ | 12,152 | |||||||||||
| Additions charged to costs and expenses for current-year sales | 15,939 | 16,694 | 16,732 | ||||||||||||||
| Deductions from reserves | (16,438) | (17,157) | (18,134) | ||||||||||||||
| Change in liabilities for pre-existing warranties during the current year, including expirations | 5 | (609) | (681) | ||||||||||||||
| Balance at end of period | $ | 8,503 | $ | 8,997 | $ | 10,069 | |||||||||||
| 2017 | 2016 | 2015 | |||||||||
| Balance at beginning of period | $ | 8,633 | $ | 10,028 | $ | 5,824 | |||||
| Additions charged to costs and expenses for current-year sales | 12,214 | 9,034 | 9,368 | ||||||||
| Deductions from reserves | (10,752 | ) | (10,016 | ) | (6,486 | ) | |||||
| Changes in liability for pre-existing warranties during the current year, including expirations | (775 | ) | (413 | ) | 1,322 | ||||||
| Balance at end of period | $ | 9,320 | $ | 8,633 | $ | 10,028 | |||||
Fair Value Measurements
Fair value measurements are reported in one of three levels based on the lowest level of significant input used:
•Level 1 – observable inputs such as quoted prices in active markets;
•Level 2 – inputs, other than the quoted prices in active markets, that are observable either directly or indirectly; and
•Level 3 – unobservable inputs in which there is little or no market data, which require the reporting entity to develop its own assumptions.
| 60 | 2023 FORM 10-K | SLEEP NUMBER CORPORATION | |||||||
SLEEP NUMBER CORPORATION
AND SUBSIDIARIES
Notes to Consolidated Financial Statements - (continued)
Shareholders’ Deficit
Dividends
Share Repurchases
At December 30, 2023, there was $348 million remaining authorization under the $600 million board-approved share repurchase program. There is no expiration date governing the period over which the Company can repurchase shares. Any repurchased shares are constructively retired and returned to an unissued status. The cost of stock repurchases is first charged to additional paid-in-capital. Once additional paid-in capital is reduced to zero, any additional amounts are charged to accumulated deficit.
Revenue Recognition
The Company recognizes revenue when control of the promised goods or services is transferred to its customers, in an amount that reflects the consideration it expects to be entitled to in exchange for those goods or services. Revenue is recognized when theexcludes sales price is fixed or determinable, collectability is reasonably assured and title passes.taxes. Amounts billed to customers for delivery and setup are included in net sales. Revenue is reported net of estimatedFor most products, the Company receives payment before or promptly after, the products or services are delivered to the customer.
The Company accepts sales returns and excludes sales taxes.
See Note 9, Revenue Recognition, for additional information on revenue recognition and sales returns.
| 61 | 2023 FORM 10-K | SLEEP NUMBER CORPORATION | |||||||
SLEEP NUMBER CORPORATION
AND SUBSIDIARIES
Notes to Consolidated Financial Statements - (continued)
Cost of Sales, Sales and Marketing, General and Administrative (G&A) and Research & Development (R&D) Expenses
The following tables summarize the primary costs classified in each major expense category (the classification of which may vary within ourthe Company’s industry):
| Cost of Sales | Sales & Marketing | |||||||||||||
• | Costs associated with purchasing, manufacturing, shipping, handling and delivering | • | ||||||||||||
| • | Marketing and selling materials such as brochures, videos, websites, customer mailings and in-store signage; | |||||||||||||
| • | Physical inventory losses, scrap and obsolescence; | • | Payroll and benefits for sales and customer service staff; | |||||||||||
| • | Related occupancy and depreciation expenses; | • | Store occupancy costs; | |||||||||||
| • | Costs associated with returns and exchanges; and | • | Store depreciation expense; | |||||||||||
| • | Estimated costs to service customer warranty claims. | • | Credit card processing fees; and | |||||||||||
| • | Promotional financing costs. | |||||||||||||
| G&A | R&D(1) | |||||||||||||
| • | ||||||||||||||
| • | Outside consulting services related to research and development activities; and | |||||||||||||
| • | Testing equipment related to research and development activities. | |||||||||||||
| • | Occupancy costs of corporate facilities; | ___________________________ (1) Costs incurred in connection with R&D are charged to expense as incurred. | ||||||||||||
| • | Depreciation related to corporate assets; | |||||||||||||
| • | Information hardware, software and maintenance; | |||||||||||||
| • | Insurance; | |||||||||||||
| • | Investor relations costs; and | |||||||||||||
| • | Other overhead costs. | |||||||||||||
See Note 7, Leases, respectively, and deferred lease incentives included in other non-current liabilities in our consolidated balance sheets were $10 million and $9 million, respectively.for further information regarding the Company’s operating leases.
Costs associated with the start-up and promotion of new retail store openings are expensed as incurred.
Advertising Costs
| 62 | 2023 FORM 10-K | SLEEP NUMBER CORPORATION | |||||||
SLEEP NUMBER CORPORATION
AND SUBSIDIARIES
Notes to Consolidated Financial Statements - (continued)
operations. Advertising costs deferred and included in prepaid expenses in ourthe consolidated balance sheetssheet were $2 million and $1 million as ofnot significant at December 30, 2017, and2023 or December 31, 2016,2022, respectively.
Insurance
Software Capitalization
For software developed or obtained for internal use, we capitalizethe Company capitalizes direct external costs associated with developing or obtaining internal-use software. In addition, we capitalizethe Company capitalizes certain payroll and payroll-related costs for employees who are directly involved with the development of such applications. Capitalized costs related to internal-use software under development are treated as construction-in-progress until the program, feature or functionality is ready for its intended use, at which time depreciation commences. We expenseThe Company expenses any data conversion or training costs as incurred. Capitalized software costs are included in property and equipment, net in the consolidated balance sheet.
The Company capitalizes costs incurred with the implementation of a cloud computing arrangement that is a service contract, consistent with its policy for software developed or obtained for internal use. The capitalized implementation costs of cloud computing arrangements are expensed over the term of the cloud computing arrangement in the same line item in the statement of operations as the associated hosting fees. Capitalized costs incurred with the implementation of a cloud computing arrangement are included in prepaid expenses and other non-current assets in the Company’s consolidated balance sheet, and in operating cash flows in its consolidated statement of cash flows.
Stock Options - stock option awards are granted at exercise prices equal to the closing price of ourthe Company’s stock on the grant date. Generally, options vest proportionally over three years and expire after 10 years. Compensation expense is recognized ratably over the vesting period.
Expected Volatility– expected volatility was determined based on implied volatility of ourthe Company’s traded options and historical volatility of ourthe Company’s stock price.
| 63 | 2023 FORM 10-K | SLEEP NUMBER CORPORATION | |||||||
SLEEP NUMBER CORPORATION
AND SUBSIDIARIES
Notes to Consolidated Financial Statements - (continued)
Risk-Free Interest Rate – the risk-free interest rate was based on the implied yield available on U.S. Treasury zero-coupon issues at the date of grant with a term equal to the expected term.
Expected Term – expected term represents the period that ourthe Company’s stock-based awards are expected to be outstanding and was determined based on historical experience and anticipated future exercise patterns, giving consideration to the contractual terms of unexercised stock-based awards.
Stock Awards - we issuethe Company issues stock awards to certain employees in conjunction with ourits stock-based compensation plan. The stock awards generally vest over three years based on continued employment (time-based). Compensation expense related to stock awards, except for stock awards with a market condition, is determined on the grant date based on the publicly quoted closing price of ourthe Company’s common stock and is charged to earnings on a straight-line basis over the vesting period. Stock awards with a market condition are valued using a Monte Carlo simulation model. The significant assumptions used to estimate the expected volatility and risk-free interest rate are similar to those described above in Stock Options.
Certain time-based stock awards have a performance condition (performance-based). The final number of shares earned for performance-based stock awards and the related compensation expense is adjusted up or down to the extent the performance target is met as of the last day of the performance period.met. The actual number of shares that will ultimately be awarded range from 0% - 200% of the targeted amount for the 2017, 20162023, 2022 and 20152021 awards. We evaluateThe Company evaluates the likelihood of meeting the performance targets at each reporting period and adjust compensation expense, on a cumulative basis, based on the expected achievement of each of the performance targets. For performance-based stock awards granted in 2017, 20162023, 2022 and 2015,2021, the performance targets are based on growth in net sales and in operating profit, and the performance periods are fiscal 20172023 through 2019,2025, 2022 through 2024 and fiscal 20162021 through 2018, and 2015 through 2017,2023, respectively.
See Note 9, 8, Shareholders’ EquityDeficit, for additional information on stock-based compensation.
Income Taxes
| 64 | 2023 FORM 10-K | SLEEP NUMBER CORPORATION | |||||||
SLEEP NUMBER CORPORATION
AND SUBSIDIARIES
Notes to Consolidated Financial Statements - (continued)
Net (Loss) Income Per Share
Sources of Supply
(2) Acquisition of BAM Labs, Inc.
| Accounts receivable | $ | 105 | |
| Prepaid expenses | 98 | ||
| Property and equipment | 91 | ||
| Deferred income taxes | 2,754 | ||
| Goodwill | 55,083 | ||
| Intangible assets | 13,619 | ||
| Total assets acquired | 71,750 | ||
| Accounts payable | 269 | ||
| Compensation and benefits | 322 | ||
| Other non-current liabilities | 1,141 | ||
| Total liabilities acquired | 1,732 | ||
| Net assets acquired | $ | 70,018 | |
At December 30, 20172023 and December 31, 2016, we2022, the Company had $4$19 million and $2$17 million,, respectively, of debt and equity securities that fund ourits deferred compensation plan and are classified in other non-current assets. WeThe Company also had corresponding deferred compensation plan liabilities of $4$19 million and $2$17 million, at December 30, 20172023 and December 31, 2016,2022, respectively, which are included in other non-current liabilities. The majority of the debt and equity securities are Level 1 as they trade with sufficient frequency and volume to enable usit to obtain pricing information on an ongoing basis. Unrealized gains/(losses) on the debt and equity securities offset those associated with the corresponding deferred compensation plan liabilities.
Inventories consisted of the following (in thousands):
| December 30, 2023 | December 31, 2022 | ||||||||||
| Raw Materials | $ | 9,092 | $ | 7,785 | |||||||
| Work in Progress | 92 | 102 | |||||||||
| Finished goods | 106,249 | 106,147 | |||||||||
| $ | 115,433 | $ | 114,034 | ||||||||
Finished goods inventories consisted of the following (in thousands):
| December 30, 2023 | December 31, 2022 | ||||||||||
| Finished beds, including deliveries in-transit to those customers who have utilized home delivery services | $ | 39,235 | $ | 36,708 | |||||||
| Finished components that were ready for assembly for the completion of beds | 46,179 | 45,722 | |||||||||
| Retail accessories | 20,835 | 23,717 | |||||||||
| $ | 106,249 | $ | 106,147 | ||||||||
| December 30, 2017 | December 31, 2016 | ||||||
| Raw materials | $ | 6,577 | $ | 7,973 | |||
| Work in progress | 170 | 72 | |||||
| Finished goods | 77,551 | 66,981 | |||||
| $ | 84,298 | $ | 75,026 | ||||
| 65 | 2023 FORM 10-K | SLEEP NUMBER CORPORATION | |||||||
SLEEP NUMBER CORPORATION
AND SUBSIDIARIES
Notes to Consolidated Financial Statements - (continued)
(4) Property and Equipment
Property and equipment consisted of the following (in thousands):
| December 30, 2023 | December 31, 2022 | ||||||||||
| Leasehold improvements | $ | 143,006 | $ | 140,344 | |||||||
| Furniture and equipment | 158,309 | 151,202 | |||||||||
| Production machinery, computer equipment and software | 306,972 | 287,834 | |||||||||
| Construction in progress | 6,552 | 11,568 | |||||||||
| Less: Accumulated depreciation and amortization | (435,336) | (390,343) | |||||||||
| $ | 179,503 | $ | 200,605 | ||||||||
Depreciation for 2023, 2022 and 2021 was $71 million, $64 million and $57 million, respectively.
| December 30, 2017 | December 31, 2016 | |||||||
| Land | $ | 1,999 | $ | 1,999 | ||||
| Leasehold improvements | 102,495 | 97,600 | ||||||
| Furniture and equipment | 94,265 | 81,541 | ||||||
| Production machinery, computer equipment and software | 224,758 | 209,900 | ||||||
| Construction in progress | 5,661 | 13,823 | ||||||
| Less: Accumulated depreciation and amortization | (220,532 | ) | (196,496 | ) | ||||
| $ | 208,646 | $ | 208,367 | |||||
Goodwill and Indefinite-LivedIndefinite-lived Intangible Assets
Goodwill was $64 million at December 30, 20172023 and December 31, 2016.2022. Indefinite-lived trade name/trademarks totaled $1.4 million at December 30, 20172023 and December 31, 2016.2022.
| December 30, 2023 | December 31, 2022 | ||||||||||||||||||||||
| Gross Carrying Amount | Accumulated Amortization | Gross Carrying Amount | Accumulated Amortization | ||||||||||||||||||||
| Developed technologies | $ | 18,851 | $ | 18,851 | $ | 18,851 | $ | 17,641 | |||||||||||||||
| Patents | 1,972 | 780 | 1,972 | 559 | |||||||||||||||||||
| $ | 20,823 | $ | 19,631 | $ | 20,823 | $ | 18,200 | ||||||||||||||||
| December 30, 2017 | December 31, 2016 | ||||||||||||||
Gross Carrying Amount | Accumulated Amortization | Gross Carrying Amount | Accumulated Amortization | ||||||||||||
| Developed technologies | $ | 18,851 | $ | 6,705 | $ | 18,851 | $ | 4,524 | |||||||
| Customer relationships | 2,413 | 2,413 | 2,413 | 1,365 | |||||||||||
| Trade names/trademarks | 101 | 101 | 101 | 101 | |||||||||||
| $ | 21,365 | $ | 9,219 | $ | 21,365 | $ | 5,990 | ||||||||
Amortization expense in 2017, 2016 and 2015 for definite-lived intangible assetsdeveloped technologies was $3$1.2 million, $2$2.0 million and $1$2.0 million in 2023, 2022 and 2021, respectively.
Amortization expense for patents was $0.2 million, in each of 2023, 2022 and 2021.
Annual amortization for definite-lived intangible assets is expected to be approximately $2 million for 2018 through 2022.
| 2024 | $ | 222 | |||
| 2025 | 226 | ||||
| 2026 | 222 | ||||
| 2027 | 222 | ||||
| 2028 | 155 | ||||
| Thereafter | 145 | ||||
| Total future amortization for definite-lived intangible assets | $ | 1,192 | |||
| Facility Rents: | 2017 | 2016 | 2015 | |||||||||
| Minimum rents | $ | 66,239 | $ | 59,002 | $ | 52,650 | ||||||
| Contingent rents | 2,845 | 3,099 | 5,168 | |||||||||
| Total | $ | 69,084 | $ | 62,101 | $ | 57,818 | ||||||
| Equipment Rents | $ | 4,935 | $ | 5,316 | $ | 4,362 | ||||||
| 66 | 2023 FORM 10-K | SLEEP NUMBER CORPORATION | |||||||
SLEEP NUMBER CORPORATION
AND SUBSIDIARIES
Notes to Consolidated Financial Statements - (continued)
| 2018 | $ | 70,604 | ||
| 2019 | 65,114 | |||
| 2020 | 58,069 | |||
| 2021 | 52,284 | |||
| 2022 | 45,657 | |||
| Thereafter | 145,039 | |||
| Total future minimum lease payments | $ | 436,767 | ||
The Company amended the Credit Agreement on October 26, 2022. The amendment, among other things: (a) provided relief from the requirement that the net leverage ratio not exceed 3.75x for certain corporate actions including Permitted Capital Distributions for Performance or Taxes (as defined in the Credit Agreement) and certain acquisition activity; (b) increased the permissible net leverage ratio to 5.0x for the three consecutive quarterly reporting periods ending July 1, 2023; (c) increased the commitment fee rate to 50 basis points and the margin applicable to interest rates for all borrowings by an additional 50 basis points, in each case if the net leverage ratio is greater than or equal to 4.5x; and (d) replaces the option to borrow at an interest rate based on London Interbank Offered Rate (LIBOR) to one based on a Term SOFR Rate. The Term SOFR Rate equals the sum of (x) the Term SOFR Screen Rate (as defined in the Credit Agreement) for the applicable interest period (but in no event less than zero), plus (y) 0.10%, plus (z) the margin based on Sleep Number’s net leverage ratio.
The Company amended the Credit Agreement on July 24, 2023. The amendment, among other things, extended the increased permissible Net Leverage Ratio to 5.0x to include the quarterly reporting period ending September 30, 2023. For the quarterly reporting period ending December 30, 2023, and subsequent quarterly reporting periods, the Maximum Leverage Ratio will be 4.5x.
The Company amended the Credit Agreement on November 2, 2023. The amendment, among other things: (a) decreased the total aggregate commitment under the Credit Agreement from $825 million to $685 million; (b) decreased the $625 million revolving loan commitment to $485 million; (c) decreased the accordion from $400 million to $342.5 million; (d) increased the Applicable Commitment Fee Rate to 50 basis points when the Net Leverage Ratio is greater than or equal to 3.50 to 1.00 (as each is defined in the Credit Agreement); (e) increased the Applicable Margin by 25 to 75 basis points for each respective range of Net Leverage Ratios (as each is defined in the Credit Agreement); (f) deemed the Company’s Net Leverage Ratio as greater than or equal to 4.00 to 1.00 but less than 4.50 to 1.00 as of the amendment effective date to set pricing for the Applicable Commitment Fee Rate and Applicable Margin until receipt of the compliance certificate for the quarterly reporting period ending December 30, 2023; (g) amended the definition of Consolidated EBITDA (as defined in the Credit Agreement) to include cash add backs, capped at $30 million for the quarterly reporting periods ending December 30, 2023, March 30, 2024, June 29, 2024, September 28, 2024, and December 28, 2024 and capped at $20 million for each quarterly reporting period ending thereafter; (h) amended the definitions of each of Net Leverage Ratio and Senior Secured Leverage Ratio (as each is defined in the Credit Agreement) to include the total operating lease liabilities of borrower, as calculated in accordance with ASC 842 accounting guidance (as of the end of the most recently completed quarterly reporting period) replacing the prior language of six multiplied by Consolidated Rent Expense (for the most recently completed four quarterly reporting
periods); (i) adjusted the permissible maximum Net Leverage Ratio (as defined in the Credit Agreement) to (I) 5.00 to 1.00 for the quarterly reporting periods ending December 30, 2023 and March 30, 2024, (II) 5.50 to 1.00 for the quarterly reporting period ending June 29, 2024, (III) 5.00 to 1.00 for the quarterly reporting period ending September 28, 2024, (IV) 4.80 to 1.00 for the quarterly reporting period ending December 28, 2024, and (V) 4.00 to 1.00 for each quarterly reporting period occurring thereafter; (j) adjusted the permissible maximum Interest Coverage Ratio (as defined in the Credit Agreement) to (I) 1.50 to 1.00 for the quarterly reporting periods ending December 30, 2023 and March 30, 2024, (II) 1.25 to 1.00 for the quarterly reporting period ending June 29, 2024, (III) 1.50 to 1.00 for the quarterly reporting periods ending September 28, 2024 and December 28, 2024, and (IV) 3.00 to 1.00 for each quarterly reporting period occurring thereafter; and (k) decreased the requisite Net Leverage Ratio from 3.75 to 1.00 down to 3.00 to 1.00 (under the new applicable definitions) before any Acquisitions (with the exception of the Specified Acquisition) or Restricted Payments (as each is defined in the Credit Agreement) may be made. A fee for the amendment was payable to the approving lenders in an amount equal to 20 basis points multiplied by the sum of such lender's Revolving Credit Commitment and outstanding Term Loans (as each is defined in the Credit Agreement).
| 67 | 2023 FORM 10-K | SLEEP NUMBER CORPORATION | |||||||
SLEEP NUMBER CORPORATION
AND SUBSIDIARIES
Notes to Consolidated Financial Statements - (continued)
Under the terms of the credit agreement we payCredit Agreement, the Company pays a variable rate of interest and a commitment fee based on ourits leverage ratio.
| December 30, 2023 | December 31, 2022 | ||||||||||
| Outstanding borrowings | $ | 539,500 | $ | 459,600 | |||||||
| Outstanding letters of credit | $ | 7,147 | $ | 5,947 | |||||||
| Additional borrowing capacity | $ | 138,353 | $ | 359,453 | |||||||
| Weighted-average interest rate | 8.5 | % | 6.7 | % | |||||||
(7) Leases
The Company leases its retail, office and manufacturing space under operating leases which, in addition to increase ourthe minimum lease payments, may require payment of a proportionate share of the real estate taxes and certain building operating expenses. While the Company’s local market development approach generally results in long-term participation in given markets, its retail store leases generally provide for an initial lease term of five to 10 years. Sleep Number’s office and manufacturing leases provide for an initial lease term of up to 15 years. In addition, its mall-based retail store leases may require payment of variable rent based on net aggregate availabilitysales in excess of certain thresholds. Certain leases may contain options to extend the term of the original lease. The exercise of lease renewal options is at the Company’s sole discretion. Lease options are included in the lease term only if exercise is reasonably certain at lease commencement. The Company lease agreements do not contain any material residual value guarantees. The Company also leases vehicles and certain equipment under operating leases with an initial lease term of three to six years.
The Company’s operating lease costs include facility, vehicle and equipment lease costs, but exclude variable lease costs. Operating lease costs are recognized on a straight-line basis over the accordion feature which allows us to increaselease term, after consideration of rent escalations and rent holidays. The lease term for purposes of the calculation begins on the earlier of the lease commencement date or the date the Company takes possession of the property. During lease renewal negotiations that extend beyond the original lease term, the Company estimates straight-line rent expense based on current market conditions. Variable lease costs are recorded when it is probable the cost has been incurred and the amount can be reasonably estimated. Future payments for real estate taxes and certain building operating expenses for which the Company is obligated are not included in operating lease costs.
At December 30, 2023, the Company’s finance lease right-of-use assets and lease liabilities were not significant.
Lease costs were as follows (in thousands):
| 2023 | 2022 | 2021 | |||||||||||||||
Operating lease costs(1) | $ | 113,510 | $ | 109,766 | $ | 99,474 | |||||||||||
| Variable lease costs | $ | 278 | $ | 877 | $ | 2,205 | |||||||||||
____________________
(1)Includes short-term lease costs which are not significant.
| 68 | 2023 FORM 10-K | SLEEP NUMBER CORPORATION | |||||||
SLEEP NUMBER CORPORATION
AND SUBSIDIARIES
Notes to Consolidated Financial Statements - (continued)
The maturities of operating lease liabilities as of December 30, 2023, were as follows(1) (in thousands):
| 2024 | $ | 106,670 | |||
| 2025 | 97,359 | ||||
| 2026 | 85,276 | ||||
| 2027 | 69,744 | ||||
| 2028 | 57,767 | ||||
| Thereafter | 103,541 | ||||
Total operating lease payments(2) | 520,357 | ||||
| Less: Interest | 87,203 | ||||
| Present value of operating lease liabilities | $ | 433,154 | |||
___________________
(1)Total operating lease payments exclude $25 million of legally binding minimum lease payments for leases signed but not yet commenced.
(2)Includes the credit facilitycurrent portion of $82 million for operating lease liabilities.
Other information related to $450 million, subject to Lenders' approval. The Credit Agreement,operating leases was as amended, matures in February 2023. There were no other significant changes to the Credit Agreement's terms and conditions.follows:
| December 30, 2023 | December 31, 2022 | |||||||||||||
| Weighted-average remaining lease term (years) | 5.9 | 6.2 | ||||||||||||
| Weighted-average discount rate | 6.5 | % | 6.2 | % | ||||||||||
| (in thousands) | 2023 | 2022 | 2021 | |||||||||||||||||
| Cash paid for amounts included in present value of operating lease liabilities | $ | 108,294 | $ | 99,819 | $ | 90,198 | ||||||||||||||
| Right-of-use assets obtained in exchange for operating lease liabilities | $ | 69,396 | $ | 82,117 | $ | 109,000 | ||||||||||||||
(8) Shareholders’ EquityDeficit
Stock-Based Compensation Expense
Total stock-based compensation expense was as follows (in thousands):
| 2023 | 2022 | 2021 | |||||||||||||||
Stock awards(1) | $ | 11,053 | $ | 9,471 | $ | 20,216 | |||||||||||
| Stock options | 3,802 | 3,752 | 2,998 | ||||||||||||||
Total stock-based compensation expense(1) | 14,855 | 13,223 | 23,214 | ||||||||||||||
| Income tax benefit | 3,476 | 3,319 | 5,722 | ||||||||||||||
| Total stock-based compensation expense, net of tax | $ | 11,379 | $ | 9,904 | $ | 17,492 | |||||||||||
____________________
(1) Changes in annual stock-based compensation expense includes the cumulative impact of the change in the expected achievements of certain performance targets.
| 2017 | 2016 | 2015 | ||||||||||
| Stock options | $ | 2,344 | $ | 2,281 | $ | 2,634 | ||||||
| Stock awards | 13,419 | 9,680 | 7,656 | |||||||||
| Total stock-based compensation expense | 15,763 | 11,961 | 10,290 | |||||||||
| Income tax benefit | 5,249 | 3,947 | 3,413 | |||||||||
| Total stock-based compensation expense, net of tax | $ | 10,514 | $ | 8,014 | $ | 6,877 | ||||||
| 69 | 2023 FORM 10-K | SLEEP NUMBER CORPORATION | |||||||
SLEEP NUMBER CORPORATION
AND SUBSIDIARIES
Notes to Consolidated Financial Statements - (continued)
Stock Options
A summary of ourthe Company’s stock option activity was as follows (in thousands, except per share amounts and years):
Stock Options | Weighted- Average Exercise Price per Share | Weighted- Average Remaining Contractual Term (years) | Aggregate Intrinsic Value (1) | ||||||||||
| Balance at December 31, 2016 | 1,354 | $ | 18.70 | 5.9 | $ | 7,541 | |||||||
| Granted | 262 | 24.26 | |||||||||||
| Exercised | (222 | ) | 14.58 | ||||||||||
| Canceled/Forfeited | (39 | ) | 26.17 | ||||||||||
| Outstanding at December 30, 2017 | 1,355 | $ | 20.23 | 6.2 | $ | 23,515 | |||||||
| Exercisable at December 30, 2017 | 879 | $ | 18.79 | 4.8 | $ | 16,533 | |||||||
| Vested and expected to vest at December 30, 2017 | 1,321 | $ | 20.16 | 6.1 | $ | 23,023 | |||||||
| Stock Options | Weighted- Average Exercise Price per Share | Weighted- Average Remaining Contractual Term (years) | Aggregate Intrinsic Value (1) | ||||||||||||||||||||
| Outstanding at December 31, 2022 | 787 | $ | 46.02 | 6.1 | $ | 829 | |||||||||||||||||
| Granted | 305 | 27.30 | |||||||||||||||||||||
| Exercised | (20) | 21.43 | |||||||||||||||||||||
| Canceled/Forfeited | (26) | 55.69 | |||||||||||||||||||||
| Outstanding at December 30, 2023 | 1,046 | $ | 40.80 | 6.2 | $ | — | |||||||||||||||||
| Exercisable at December 30, 2023 | 654 | $ | 42.08 | 4.5 | $ | — | |||||||||||||||||
| Vested and expected to vest at December 30, 2023 | 1,014 | $ | 40.87 | 6.1 | $ | — | |||||||||||||||||
____________________
(1) Aggregate intrinsic value includes only those options where the current share price is equal to or greater than the share price on the date of grant.
Other information pertaining to options was as follows (in thousands, except per share amounts):
| 2017 | 2016 | 2015 | 2023 | 2022 | 2021 | ||||||||||||||||||||||||||||||
| Weighted-average grant date fair value of stock options granted | $ | 10.33 | $ | 8.85 | $ | 15.94 | |||||||||||||||||||||||||||||
| Total intrinsic value (at exercise) of stock options exercised | $ | 3,586 | $ | 2,088 | $ | 4,592 | |||||||||||||||||||||||||||||
Cash received from the exercise of stock options for the fiscal year ended December 30, 20172023 was $3.2 million. Our$0.4 million. The Company’s tax benefit related to the exercise of stock options for the fiscal year ended December 30, 20172023 was $1.3$0.1 million.
At December 30, 2017,2023, there was $2.8$5.2 million of total stock option compensation expense related to non-vested stock options not yet recognized, which is expected to be recognized over a weighted-average period of 1.81.9 years.
| Valuation Assumptions | 2017 | 2016 | 2015 | ||||
| Expected dividend yield | NA | 0 | % | NA | |||
| Expected volatility | NA | 50 | % | NA | |||
| Risk-free interest rate | NA | 1.8 | % | NA | |||
The assumptions used to calculate the fair value of options granted using the Black-Scholes-Merton option-pricing model were as follows:
| Valuation Assumptions | 2023 | 2022 | 2021 | ||||||||||||||
| Expected dividend yield | 0.0 | % | 0.0 | % | 0.0 | % | |||||||||||
| Expected volatility | 64 | % | 57 | % | 58 | % | |||||||||||
| Risk-free interest rate | 3.8 | % | 2.2 | % | 0.9 | % | |||||||||||
| Expected term (years) | 5.7 | 5.3 | 5.2 | ||||||||||||||
| Valuation Assumptions | 2017 | 2016 | 2015 | ||||||
| Expected dividend yield | 0 | % | 0 | % | 0 | % | |||
| Expected volatility | 46 | % | 50 | % | 54 | % | |||
| Risk-free interest rate | 2.0 | % | 1.4 | % | 1.6 | % | |||
| Expected term (in years) | 5.1 | 5.2 | 5.2 | ||||||
| 70 | 2023 FORM 10-K | SLEEP NUMBER CORPORATION | |||||||
SLEEP NUMBER CORPORATION
AND SUBSIDIARIES
Notes to Consolidated Financial Statements - (continued)
Stock Awards
Stock award activity was as follows (in thousands, except per share amounts):
| Time- Based Stock Awards | Weighted-Average Grant Date Fair Value | Performance- Based Stock Awards | Weighted-Average Grant Date Fair Value | ||||||||||||||||||||
| Outstanding at December 31, 2022 | 261 | $ | 61.88 | 501 | $ | 66.33 | |||||||||||||||||
| Granted | 304 | 26.10 | 440 | 28.85 | |||||||||||||||||||
| Vested | (127) | 57.10 | (201) | 36.84 | |||||||||||||||||||
| Canceled/Forfeited | (41) | 48.64 | (41) | 61.15 | |||||||||||||||||||
| Outstanding at December 30, 2023 | 397 | $ | 37.38 | 699 | $ | 51.74 | |||||||||||||||||
Time- Based Stock Awards | Weighted-Average Grant Date Fair Value | Performance- and Market-Based Stock Awards | Weighted-Average Grant Date Fair Value | |||||||||
| Outstanding at December 31, 2016 | 530 | $20.83 | 899 | $20.87 | ||||||||
| Granted | 217 | 25.81 | 568 | 23.03 | ||||||||
| Vested | (312 | ) | 20.35 | (338 | ) | 16.73 | ||||||
| Canceled/Forfeited | (40 | ) | 22.47 | (66 | ) | 19.88 | ||||||
| Outstanding at December 30, 2017 | 395 | $23.77 | 1,063 | $23.41 | ||||||||
At December 30, 2017,2023, there was $5.5$8.7 million of unrecognized compensation expense related to non-vested time-based stock awards, which is expected to be recognized over a weighted-average period of 1.81.7 years, and $15.2$7.8 million of unrecognized compensation expense related to non-vested performance-based and market-based stock awards, which is expected to be recognized over a weighted-average period of 2.1 years.
| Valuation Assumptions | 2017 | 2016 | 2015 | |||
| Expected dividend yield | 0% | NA | NA | |||
| Expected volatility | 46% | NA | NA | |||
| Risk-free interest rate | 1.5% | NA | NA | |||
Repurchases of Common Stock
Repurchases of ourthe Company’s common stock were as follows (in thousands):
| 2023 | 2022 | 2021 | |||||||||||||||
| Amount repurchased under Board-approved share repurchase program | $ | — | $ | 54,868 | $ | 364,479 | |||||||||||
| Amount repurchased in connection with the vesting of employee restricted stock grants | 3,747 | 9,320 | 17,897 | ||||||||||||||
| Total amount repurchased (based on trade dates) | $ | 3,747 | $ | 64,188 | $ | 382,376 | |||||||||||
| 2017 | 2016 | 2015 | ||||||||||
| Amount repurchased under Board-approved share repurchase program | $ | 150,000 | $ | 125,000 | $ | 98,446 | ||||||
| Amount repurchased in connection with the vesting of employee restricted stock grants | 5,245 | 1,693 | 1,755 | |||||||||
| Total amount repurchased | $ | 155,245 | $ | 126,693 | $ | 100,201 | ||||||
Net (Loss) Income per Common Share
The components of basic and diluted net (loss) income per share were as follows (in thousands, except per share amounts):
| 2023 | 2022 | 2021 | |||||||||||||||
| Net (loss) income | $ | (15,287) | $ | 36,610 | $ | 153,746 | |||||||||||
| Reconciliation of weighted-average shares outstanding: | |||||||||||||||||
| Basic weighted-average shares outstanding | 22,429 | 22,396 | 24,038 | ||||||||||||||
| Dilutive effect of stock-based awards | — | 456 | 909 | ||||||||||||||
| Diluted weighted-average shares outstanding | 22,429 | 22,852 | 24,947 | ||||||||||||||
| Net (loss) income per share – basic | $ | (0.68) | $ | 1.63 | $ | 6.40 | |||||||||||
| Net (loss) income per share – diluted | $ | (0.68) | $ | 1.60 | $ | 6.16 | |||||||||||
| 2017 | 2016 | 2015 | |||||||||
| Net income | $ | 65,077 | $ | 51,417 | $ | 50,519 | |||||
| Reconciliation of weighted-average shares outstanding: | |||||||||||
| Basic weighted-average shares outstanding | 41,212 | 46,154 | 51,252 | ||||||||
| Dilutive effect of stock-based awards | 873 | 748 | 849 | ||||||||
| Diluted weighted-average shares outstanding | 42,085 | 46,902 | 52,101 | ||||||||
| Net income per share – basic | $ | 1.58 | $ | 1.11 | $ | 0.99 | |||||
| Net income per share – diluted | $ | 1.55 | $ | 1.10 | $ | 0.97 | |||||
Additional potential dilutive stock optionsstock-based awards totaling 0.41.3 million, 0.6 million and 0.40.9 million for 2017, 20162023, 2022 and 2015,2021, respectively, have been excluded from ourthe diluted net (loss) income per share calculations because these securities’ exercise pricesstock-based awards were anti-dilutive. For 2023, otherwise dilutive stock-based awards of $0.1 million have been excluded from the calculation of diluted weighted-average shares outstanding, as their inclusion would have had an anti-dilutive (e.g., greater than the average market price of our common stock).effect on net loss per diluted share.
| 2017 | 2016 | 2015 | |||||||||
| Interest expense | $ | (975 | ) | $ | (811 | ) | $ | (160 | ) | ||
| Interest income | 98 | 94 | $ | 494 | |||||||
| Other (expense) income, net | $ | (877 | ) | $ | (717 | ) | $ | 334 | |||
| 71 | 2023 FORM 10-K | SLEEP NUMBER CORPORATION | |||||||
| 2017 | 2016 | 2015 | ||||||||||
| Current: | ||||||||||||
| Federal | $ | 19,153 | $ | 21,634 | $ | 7,272 | ||||||
| State | 4,046 | 5,289 | 3,870 | |||||||||
| 23,199 | 26,923 | 11,142 | ||||||||||
| Deferred: | ||||||||||||
| Federal | 2,734 | (105 | ) | 13,567 | ||||||||
| State | 28 | (2,302 | ) | 202 | ||||||||
| 2,762 | (2,407 | ) | 13,769 | |||||||||
| Income tax expense | $ | 25,961 | $ | 24,516 | $ | 24,911 | ||||||
SLEEP NUMBER CORPORATION
AND SUBSIDIARIES
Notes to Consolidated Financial Statements - (continued)
(9) Revenue Recognition
Deferred contract assets and deferred contract liabilities are included in the consolidated balance sheets as follows (in thousands):
| December 30, 2023 | December 31, 2022 | ||||||||||
| Deferred contract assets included in: | |||||||||||
| Other current assets | $ | 28,567 | $ | 28,121 | |||||||
| Other non-current assets | 54,795 | 55,564 | |||||||||
| $ | 83,362 | $ | 83,685 | ||||||||
| December 30, 2023 | December 31, 2022 | ||||||||||
| Deferred contract liabilities included in: | |||||||||||
| Other current liabilities | $ | 36,421 | $ | 36,335 | |||||||
| Other non-current liabilities | 69,098 | 70,999 | |||||||||
| $ | 105,519 | $ | 107,334 | ||||||||
During the years ended December 30, 2023, December 31, 2022 and January 1, 2022 the Company recognized revenue of $36 million, $34 million and $29 million, respectively, that was included in the deferred contract liability balance at the beginning of the year.
Revenue from goods and services transferred to customers at a point in time accounted for approximately 98% of the Company’s revenues for 2023, 2022 and 2021.
Net sales consisted of the following (in thousands):
| 2023 | 2022 | 2021 | |||||||||||||||
| Retail stores | $ | 1,639,073 | $ | 1,823,617 | $ | 1,904,037 | |||||||||||
| Online, phone, chat and other | 248,409 | 290,680 | 280,912 | ||||||||||||||
| Total Company | $ | 1,887,482 | $ | 2,114,297 | $ | 2,184,949 | |||||||||||
Obligation for Sales Returns
The activity in the sales returns liability account for 2023 and 2022 was as follows (in thousands):
| 2023 | 2022 | ||||||||||
| Balance at beginning of year | $ | 25,594 | $ | 22,368 | |||||||
| Additions that reduce net sales | 109,153 | 103,477 | |||||||||
| Deduction from reserves | (112,345) | (100,251) | |||||||||
| Balance at end of period | $ | 22,402 | $ | 25,594 | |||||||
(10) Profit Sharing and 401(k) Plan
Under the Company’s profit sharing and 401(k) plan, eligible employees may defer up to 50% of their compensation on a pre-tax basis, subject to Internal Revenue Service limitations. Each year, the Company makes a contribution equal to a percentage of the employee’s contribution. During 2023, 2022 and 2021, the Company’s contributions, net of forfeitures, were $10 million, $10 million and $7 million, respectively.
| 72 | 2023 FORM 10-K | SLEEP NUMBER CORPORATION | |||||||
SLEEP NUMBER CORPORATION
AND SUBSIDIARIES
Notes to Consolidated Financial Statements - (continued)
(11) Restructuring Costs
In the fourth quarter of 2023, the Company initiated cost reduction actions to reduce operating expenses and accelerate gross margin initiatives. In addition to the costs incurred in 2023, the Company expects an additional $12 million of restructuring costs to be incurred in 2024, including product value engineering, service simplification, streamlining suppliers and re-prioritizing spend to accelerate near-term growth and efficiency. Charges incurred related to this initiative in 2023 were comprised of contract termination costs, severance and employee-related benefits, professional fees and other, and asset impairment charges and are included in the restructuring costs line in the Company’s consolidated statement of operations.
During the fourth quarter of fiscal 2023, the Company recognized $15.7 million of restructuring costs, as follows (in thousands):
| 2023 | ||||||||||||||
| Cash restructuring costs: | ||||||||||||||
Contract termination costs (1) | $ | 7,410 | ||||||||||||
| Severance and employee-related benefits | 4,966 | |||||||||||||
| Professional fees and other | 1,110 | |||||||||||||
| Total cash restructuring costs | 13,486 | |||||||||||||
| Non-cash restructuring costs: | ||||||||||||||
Asset impairments (2) | 2,242 | |||||||||||||
| Total restructuring costs | $ | 15,728 | ||||||||||||
____________________
(1)Primarily comprised of lease termination costs.
(2) Includes impairments of both lease right-of-use assets and property and equipment.
The following table provides the activity in the Company’s restructuring related liabilities, which are included within accounts payable, compensation and benefits and other current liabilities on the consolidated balance sheet (in thousands):
| 2023 | ||||||||||||||
| Balance at December 31, 2022 | $ | — | ||||||||||||
| Expenses | 13,486 | |||||||||||||
| Cash payments | (4,766) | |||||||||||||
| Balance at December 30, 2023 | $ | 8,720 | ||||||||||||
(12) Income Taxes
Income tax expense (benefit) consisted of the following (in thousands):
| 2023 | 2022 | 2021 | |||||||||||||||
| Current: | |||||||||||||||||
| Federal | $ | 5,474 | $ | 15,518 | $ | 17,019 | |||||||||||
| State | 3,106 | 5,174 | 4,568 | ||||||||||||||
| 8,580 | 20,692 | 21,587 | |||||||||||||||
| Deferred: | |||||||||||||||||
| Federal | (10,151) | (7,264) | 10,954 | ||||||||||||||
| State | (2,895) | (1,143) | 1,004 | ||||||||||||||
| (13,046) | (8,407) | 11,958 | |||||||||||||||
| Income tax (benefit) expense | $ | (4,466) | $ | 12,285 | $ | 33,545 | |||||||||||
| 73 | 2023 FORM 10-K | SLEEP NUMBER CORPORATION | |||||||
SLEEP NUMBER CORPORATION
AND SUBSIDIARIES
Notes to Consolidated Financial Statements - (continued)
The following table provides a reconciliation between the statutory federal income tax rate and ourthe Company’s effective income tax rate:
| 2023 | 2022 | 2021 | |||||||||||||||
| Statutory federal income tax | 21.0 | % | 21.0 | % | 21.0 | % | |||||||||||
| State income taxes, net of federal benefit | (3.5) | 6.4 | 3.0 | ||||||||||||||
| R&D tax credits | 14.1 | (5.5) | (1.4) | ||||||||||||||
| Return to provision | 6.1 | 0.8 | 0.1 | ||||||||||||||
| Investment tax credit | 1.1 | — | — | ||||||||||||||
| Stock-based compensation | (6.2) | (1.2) | (6.3) | ||||||||||||||
| Non-deductible compensation | (5.7) | 1.7 | 1.5 | ||||||||||||||
| Non-deductible expenses | (2.8) | 1.3 | 0.3 | ||||||||||||||
| Changes in unrecognized tax benefits | (0.5) | (0.4) | (0.1) | ||||||||||||||
| Other | (1.0) | 1.0 | (0.2) | ||||||||||||||
| Effective income tax rate | 22.6 | % | 25.1 | % | 17.9 | % | |||||||||||
| 2017 | 2016 | 2015 | |||||||
| Statutory federal income tax | 35.0 | % | 35.0 | % | 35.0 | % | |||
| State income taxes, net of federal benefit | 2.5 | 2.6 | 3.0 | ||||||
| Manufacturing deduction | (3.5 | ) | (3.3 | ) | (1.7 | ) | |||
| Effect of 2018 deferred tax rate change | (1.9 | ) | — | — | |||||
| Changes in unrecognized tax benefits | (0.6 | ) | 1.2 | 0.3 | |||||
| Non-taxable acquisition-related transactions | — | — | (2.6 | ) | |||||
| Other | (3.0 | ) | (3.2 | ) | (1.0 | ) | |||
| Effective income tax rate | 28.5 | % | 32.3 | % | 33.0 | % | |||
Deferred Income Taxes
The tax effects of temporary differences that give rise to deferred income taxes were as follows (in thousands):
| 2023 | 2022 | ||||||||||
| Deferred tax assets: | |||||||||||
| Stock-based compensation | $ | 7,006 | $ | 6,896 | |||||||
| Operating lease liabilities | 108,952 | 109,144 | |||||||||
| Warranty and returns liabilities | 6,894 | 7,881 | |||||||||
| Net operating loss carryforwards and credits | 1,738 | 2,051 | |||||||||
| Compensation and benefits | 7,484 | 7,678 | |||||||||
| Research and development | 18,079 | 13,860 | |||||||||
| Other | 8,931 | 6,110 | |||||||||
| Total gross deferred tax assets | 159,084 | 153,620 | |||||||||
| Valuation allowance | (48) | (615) | |||||||||
| Total gross deferred tax assets after valuation allowance | 159,036 | 153,005 | |||||||||
| Deferred tax liabilities: | |||||||||||
| Property and equipment | 33,772 | 38,442 | |||||||||
| Operating lease right-of-use assets | 99,351 | 99,311 | |||||||||
| Deferred revenue | 3,065 | 4,394 | |||||||||
| Other | 2,595 | 2,900 | |||||||||
| Total gross deferred tax liabilities | 138,783 | 145,047 | |||||||||
| Net deferred tax assets | $ | 20,253 | $ | 7,958 | |||||||
| 2017 | 2016 | |||||||
| Deferred tax assets: | ||||||||
| Stock-based compensation | $ | 6,940 | $ | 9,834 | ||||
| Deferred rent and lease incentives | 6,007 | 8,388 | ||||||
| Warranty and returns liabilities | 6,602 | 7,948 | ||||||
| Net operating loss carryforwards and credits | 3,240 | 6,368 | ||||||
| Compensation and benefits | 3,315 | 4,115 | ||||||
| Other | 3,321 | 5,264 | ||||||
| Total gross deferred tax assets | 29,425 | 41,917 | ||||||
| Valuation allowance | (615 | ) | (620 | ) | ||||
| Total deferred tax assets after valuation allowance | 28,810 | 41,297 | ||||||
| Deferred tax liabilities: | ||||||||
| Property and equipment | 21,475 | 27,049 | ||||||
| Deferred revenue | 723 | 3,279 | ||||||
| Other | 3,987 | 6,302 | ||||||
| Total gross deferred tax liabilities | 26,185 | 36,630 | ||||||
| Net deferred tax assets | $ | 2,625 | $ | 4,667 | ||||
At December 30, 2017, we2023, the Company had net operating loss carryforwards for federal purposes of $3$0.4 million, which will expire between 2025 and 2034, and for state income tax purposes of $6 million, which will expire between 2028 and 2037.2027.
| 74 | 2023 FORM 10-K | SLEEP NUMBER CORPORATION | |||||||
SLEEP NUMBER CORPORATION
AND SUBSIDIARIES
Notes to Consolidated Financial Statements - (continued)
The Company evaluates its deferred income taxes quarterly to determine if valuation allowances are required. As part of this evaluation, wethe Company assess whether valuation allowances should be established for any deferred tax assets that are not considered more likely than not to be realized, using all available evidence, both positive and negative. This assessment considers, among other matters, the nature, frequency, and severity of historical losses, forecasts of future profitability, taxable income in available carryback periods and tax planning strategies. In making such judgments, significant weight is given to evidence that can be objectively verified. We haveThe Company has provided a $0.6 million$48 thousand valuation allowance resulting primarily from ourits inability to utilize certain foreign net operating losses, and federal net operating losses associated with our acquisition of BAM Labs, Inc.losses.
Unrecognized Tax Benefits
Reconciliations of the beginning and ending amounts of unrecognized tax benefits for 2017, 2016 and 2015 were as follows (in thousands):
| Federal and State Tax | |||||||||||||||||
| 2023 | 2022 | 2021 | |||||||||||||||
| Beginning balance | $ | 3,645 | $ | 3,869 | $ | 3,912 | |||||||||||
| Increases related to current-year tax positions | 753 | 910 | 831 | ||||||||||||||
| Increases related to prior-year tax positions | 40 | 252 | 4 | ||||||||||||||
| Decreases related to prior-year tax positions | — | (328) | (33) | ||||||||||||||
| Lapse of statute of limitations | (601) | (1,058) | (845) | ||||||||||||||
| Settlements with taxing authorities | (166) | — | — | ||||||||||||||
| Ending balance | $ | 3,671 | $ | 3,645 | $ | 3,869 | |||||||||||
| Federal and State Tax | ||||||||||||
| 2017 | 2016 | 2015 | ||||||||||
| Beginning balance | $ | 3,460 | $ | 2,077 | $ | 742 | ||||||
| Increases related to current-year tax positions | 330 | 326 | 1,277 | |||||||||
| Increases related to prior-year tax positions | 87 | 1,594 | 113 | |||||||||
| Decreases related to prior-year tax positions | (1,038 | ) | — | — | ||||||||
| Lapse of statute of limitations | — | (333 | ) | (55 | ) | |||||||
| Settlements with taxing authorities | — | (204 | ) | — | ||||||||
| Ending balance | $ | 2,839 | $ | 3,460 | $ | 2,077 | ||||||
(13) Commitments and Contingencies
Legal Proceedings
Purported Class Action Complaint
On January 12, 2015, Plaintiffs David and Katina Spade commencedDecember 15, 2023, a former Field Services team member filed a purported class action lawsuitComplaint in New Jersey state court againstthe Superior Court of California, County of Santa Clara, alleging violations of California’s meal and rest break law and additional wage and hour derivative claims under the California Labor Code. While the representative plaintiff was in the Field Services workforce, the Complaint does not limit the purported plaintiff class to that group, but rather extends to all non-exempt Sleep Number allegingemployees in the state. The plaintiff alleges that Sleep Number violated New Jersey consumer statutes by failingfailed to provide compliant meal or rest breaks, failed to purchasing consumers certain disclosures required bypay wages owed due to alleged off the New Jersey Furniture Regulations. It is undisputed that plaintiffs suffered no actual clock work, failed to pay overtime, minimum wage and wages due at termination, thus resulting in inaccurate wage statements, all in violation of California law. The Complaint seeks
| 75 | 2023 FORM 10-K | SLEEP NUMBER CORPORATION | |||||||
SLEEP NUMBER CORPORATION
AND SUBSIDIARIES
Notes to Consolidated Financial Statements - (continued)
damages or in any way relied upon or were impacted by the alleged omissions. Nonetheless, on behalfform of a purported class of New Jersey purchasers of Sleep Number bedsunpaid regular and bases, plaintiffs seek to recover a $100premium wages, statutory fine for each alleged omission, along withpenalties, pre-judgment and post-judgment interest, plaintiffs’ attorneys’ fees and costs.
Shareholder Class Action Complaints
On December 14, 2021, purported Sleep Number removed the case toshareholder, Steamfitters Local 449 Pension & Retirement Security Funds (Steamfitters), filed a putative class action complaint in the United States District Court for the District of New Jersey, which subsequently grantedMinnesota (the District of Minnesota) on behalf of all purchasers of Sleep Number common stock between February 18, 2021 and July 20, 2021, inclusive, against Sleep Number, Shelly Ibach and David Callen, the Company’s former Executive Vice President and Chief Financial Officer. Steamfitters alleges material misstatements and omissions in certain of Sleep Number’s motion to dismiss. Plaintiffs appealed topublic disclosures during the United States Courtpurported class period, in violation of Appeals forSections 10(b) and 20(a) of the Third Circuit, which has certified two questionsSecurities Exchange Act of law to the New Jersey Supreme Court relating to whether plaintiffs who have suffered no actual injury may bring claims.1934, as amended (the Exchange Act). The New Jersey Supreme Court has accepted the certified questionscomplaint seeks, among other things, unspecified monetary damages, reasonable costs and oral arguments were heard in November 2017. As the United States District Court forexpenses and equitable/injunctive or other relief as deemed appropriate by the District of New Jersey determined, we believeMinnesota.
On February 14, 2022, a second purported Sleep Number shareholder, Ricardo Dario Schammas, moved for appointment as lead plaintiff in the action. On March 24, 2022, the District of Minnesota heard argument on Schammas’s motion, and subsequently appointed Steamfitters and Schammas as Co-Lead Plaintiffs (together, Co-Lead Plaintiffs). On July 19, 2022, Co-Lead Plaintiffs filed a consolidated amended complaint, which, like the predecessor complaint, asserts claims against Sleep Number, Shelly Ibach, and David Callen under Sections 10(b) and 20(a) of the Exchange Act. Co- Lead Plaintiffs purport to assert these claims on behalf of all purchasers of Sleep Number common stock between February 18, 2021 and July 20, 2021. On September 19, 2022, Defendants moved to dismiss the consolidated amended complaint, which motion was heard by the Court on January 17, 2023. On July 10, 2023, the Court issued an order dismissing the Plaintiffs’ consolidated amended complaint with prejudice.
Shareholder Derivative Complaint
On May 12, 2022, Gwendolyn Calla Moore, as the appointed representative of purported Sleep Number shareholder
Matthew Gelb, filed a derivative action (the Derivative Action) in the District of Minnesota against Jean-Michel Valette,
Shelly Ibach, Barbara Matas, Brenda Lauderback, Daniel Alegre, Deborah Kilpatrick, Julie Howard, Kathleen Nedorostek,
Michael Harrison, Stephen Gulis, Jr., David Callen, and Kevin Brown. Moore purports to assert claims on behalf of Sleep
Number for breaches of fiduciary duty, waste, and contribution under Sections 10(b) and 21(d) of the Exchange Act.
Moore’s allegations generally mirror those asserted in the securities complaint described above. The Moore complaint
seeks damages in an unspecified amount, disgorgement, interest, and costs and expenses, including attorneys’ and
experts’ fees.
On September 13, 2022, the District of Minnesota entered a joint stipulation staying all proceedings in the Derivative
Action pending the outcome of any motion to dismiss the Steamfitters consolidated amended complaint. On July 10, 2023, the District of Minnesota in the Steamfitters case dismissed the consolidated amended complaint with prejudice, as noted above. The Plaintiff in the Derivative Action subsequently moved the Court to voluntarily dismiss its the Complaint and on January 22, 2024, the District of Minnesota dismissed the Derivative Action without prejudice.
Stockholder Demand
On March 25, 2022, Sleep Number received a shareholder litigation demand (the “Demand”), requesting that the case is without meritBoard
investigate the allegations in the Steamfitters complaint and pursue claims on Sleep Number’s behalf based on
those allegations. On May 12, 2022, the orderBoard established a special litigation committee to investigate the demand.
On October 5 and October 12, 2022, Sleep Number received two additional shareholder litigation demands, which
adopted and incorporated the allegations and requests in the Demand. Both of dismissal shouldthese additional litigation demands were
referred to the special litigation committee.
The special litigation committee has concluded that it would not be affirmed.in the best interests of Sleep Number and its
shareholders to take any of the actions requested in the demands at this time.
| 76 | 2023 FORM 10-K | SLEEP NUMBER CORPORATION | |||||||
SLEEP NUMBER CORPORATION
AND SUBSIDIARIES
Notes to Consolidated Financial Statements - (continued)
Consumer Credit Arrangements
Commitments
As of December 30, 2017, we had $92023, the Company has $35 million of inventory purchase commitments. As part of the normal course of business, there are a limited number of inventory supply contracts that contain penalty provisions for failure to purchase contracted quantities. We doThe Company does not currently expect any material payments under these provisions. At December 30, 2017, we2023, the Company had entered into 3816 lease commitments primarily for future retail store locations. These lease commitments provide for minimum rentalstotal lease payments over the next fivesix to 10 years, which if consummated based on current cost estimates, would approximate $54$25 million over the initial lease term. The minimum rentalsfuture lease payments for these lease commitments have been includedexcluded in the future minimumtotal operating lease payments in Note 7, Leases.
| 2017 | First | Second | Third | Fourth | Fiscal Year | |||||||||||||||
| Net sales | $ | 393,899 | $ | 284,673 | $ | 402,646 | $ | 363,279 | $ | 1,444,497 | ||||||||||
| Gross profit | 246,459 | 176,619 | 253,465 | 220,804 | 897,347 | |||||||||||||||
| Operating income (loss) | 35,828 | (3,061 | ) | 39,029 | 20,119 | 91,915 | ||||||||||||||
| Net income (loss) | 24,461 | (778 | ) | 25,603 | 15,791 | 65,077 | ||||||||||||||
| Net income (loss) per share – diluted | $ | 0.56 | $ | (0.02 | ) | $ | 0.62 | $ | 0.39 | $ | 1.55 | |||||||||
| 77 | 2023 FORM 10-K | SLEEP NUMBER CORPORATION | |||||||
| 2016 | First | Second | Third | Fourth | Fiscal Year | |||||||||||||||
| Net sales | $ | 352,980 | $ | 276,878 | $ | 367,988 | $ | 313,445 | $ | 1,311,291 | ||||||||||
| Gross profit | 209,074 | 171,261 | 232,343 | 197,482 | 810,160 | |||||||||||||||
| Operating income | 19,898 | 2,396 | 39,044 | 15,312 | 76,650 | |||||||||||||||
| Net income | 12,969 | 1,416 | 25,745 | 11,287 | 51,417 | |||||||||||||||
| Net income per share – diluted | $ | 0.27 | $ | 0.03 | $ | 0.56 | $ | 0.25 | $ | 1.10 | ||||||||||
ITEM 9. CHANGES IN AND DISAGREEMENTS WITH ACCOUNTANTS ON ACCOUNTING AND FINANCIAL DISCLOSURE
None
ITEM 9A. CONTROLS AND PROCEDURES
Conclusions Regarding the Effectiveness of Disclosure Controls and Procedures
Management’s Report on Internal Control Over Financial Reporting
Sleep Number’s management is responsible for establishing and maintaining adequate internal control over financial reporting, as such term is defined in Exchange Act Rule 13a-15(f). OurThe Company’s internal control over financial reporting is a process designed to provide reasonable assurance regarding the reliability of financial reporting and the preparation of financial statements for external purposes in accordance with generally accepted accounting principles. OurThe Company’s internal control over financial reporting includes those policies and procedures that (1) pertain to the maintenance of records that, in reasonable detail, accurately and fairly reflect the transactions and dispositions of the assets of the Company; (2) provide reasonable assurance that transactions are recorded as necessary to permit preparation of financial statements in accordance with U.S. generally accepted accounting principles, and that receipts and expenditures of the Company are being made only in accordance with authorizations of management and directors of the Company; and (3) provide reasonable assurance regarding prevention or timely detection of unauthorized acquisition, use or disposition of the Company’s assets that could have a material effect on the financial statements.
Because of its inherent limitations, internal control over financial reporting may not prevent or detect misstatements. Also, projections of any evaluation of effectiveness to future periods are subject to the risk that controls may become inadequate because of changes in conditions, or that the degree of compliance with the policies or procedures may deteriorate.
Fourth Quarter Changes in Internal Control Over Financial Reporting
There were no changes in ourthe Company’s internal control over financial reporting during the quarter ended December 30, 20172023 that have materially affected, or are reasonably likely to materially affect, ourthe Company’s internal control over financial reporting.
ITEM 9B. OTHER INFORMATION
During the quarter ended December 30, 2023, none of the Company’s directors or officers adopted, modified or terminated any contract, instruction or written plan for the purchase or sale of Company securities that was intended to satisfy the affirmative defense conditions of Rule 10b5-1(c) or any “non-Rule 10b5-1 trading arrangement.”
ITEM 9C. DISCLOSURE REGARDING FOREIGN JURISDICTIONS THAT PREVENT INSPECTIONS
Not applicable.
PART III
ITEM 10. DIRECTORS, EXECUTIVE OFFICERS AND CORPORATE GOVERNANCE
The information under the captions “Election of Directors,” “Corporate Governance”“Our Board; Who We Are” and “Section 16(a) Beneficial Ownership Reporting Compliance”“Our Board; How We are Governed and Govern” in ourthe Company’s Proxy Statement for our 2018its 2024 Annual Meeting of Shareholders is incorporated herein by reference. Information concerning ourthe Company’s executive officers is included in Part I of this report under the caption “Executive Officers of“Information about the Registrant.Company’s Executive Officers.”
ITEM 11. EXECUTIVE COMPENSATION
The information under the caption “Executive Compensation”“Our Pay” in ourthe Company’s Proxy Statement for our 2018its 2024 Annual Meeting of Shareholders is incorporated herein by reference.
ITEM 12. SECURITY OWNERSHIP OF CERTAIN BENEFICIAL OWNERS AND MANAGEMENT AND RELATED STOCKHOLDER MATTERS
Stock Ownership
The information under the caption “Stock Ownership of Management and Certain Beneficial Owners” in ourthe Company’s Proxy Statement for our 2018its 2024 Annual Meeting of Shareholders is incorporated herein by reference.
Securities Authorized for Issuance under Equity Compensation Plans
The information under the caption "Equity“Equity Compensation Plan Information"Information” in ourthe Company’s Proxy Statement for our 2018its 2024 Annual Meeting of Shareholders is incorporated herein by reference.
ITEM 13. CERTAIN RELATIONSHIPS AND RELATED TRANSACTIONS, AND DIRECTOR INDEPENDENCE
The information under the caption “Corporate Governance”“Provisions Applicable to All Directors and the Board; Related Party Transactions Policy” and “Provisions Applicable to All Directors and the Board; Independence” in ourthe Company’s Proxy Statement for our 2018the 2024 Annual Meeting of Shareholders is incorporated herein by reference.
ITEM 14. PRINCIPAL ACCOUNTING FEES AND SERVICES
The information under the caption “Ratification of Selection of Independent Registered Public Accounting Firm” for Deloitte & Touche LLP (PCAOB No. 34) in ourthe Company’s Proxy Statement for our 2018the 2024 Annual Meeting of Shareholders is incorporated herein by reference.
| 79 | 2023 FORM 10-K | SLEEP NUMBER CORPORATION | |||||||
PART IV
ITEM 15. EXHIBITS,EXHIBIT AND FINANCIAL STATEMENT SCHEDULES
(a) Consolidated Financial Statements and Schedule
(1) Financial Statements
All financial statements as set forth under Item 8 of this report.
(2)Consolidated Financial Statement Schedule
The following Report and financial statement schedule are included in this Part IV:
Schedule II - Valuation and Qualifying Accounts
All other schedules are omitted because they are not applicable or the required information is included in the consolidated financial statements or notes thereto.
(3)Exhibits
The exhibits to this Report are listed in the Exhibit Index below.
| 80 | 2023 FORM 10-K | SLEEP NUMBER CORPORATION | |||||||
SLEEP NUMBER CORPORATION
EXHIBIT INDEX TO ANNUAL REPORT ON FORM 10-K
FOR THE YEAR ENDED DECEMBER 30, 2023
| Exhibit No. | Description | |||||||
| 2000 (File No. 000-25121)) | ||||||||
| 8-K filed May 16, 2006 (File No. 000-25121)) | ||||||||
| 8-K filed May 25, 2010 (File No. 000-25121)) | ||||||||
| 8-K filed November 1, 2017 (File No. 000-25121)) | ||||||||
| 8-K filed May 22, 2017 (File No. 000-25121)) | ||||||||
| 10.1 | ||||||||
| 10.2 | ||||||||
| 10.3 | ||||||||
| 10.4 | ||||||||
| 10.5 | ||||||||
| 10.6 | ||||||||
| 10.7 | ||||||||
10.8† | ||||||||
| 81 | 2022 FORM 10-K | SLEEP NUMBER CORPORATION | |||||||
| Exhibit No. | Description | |||||||
10.9† | ||||||||
| (incorporated by reference to Exhibit 10.20 contained in Sleep Number’s Annual Report on Form 10-K for the fiscal year ended January 1, 2011 (File No. 000-25121)) | ||||||||
10.10† | ||||||||
| (incorporated by reference to Exhibit 10.2 contained in Sleep Number’s Quarterly Report on Form 10-Q for the fiscal quarter ended September 28, 2019 (File No. 000-25121)) | ||||||||
10.11† | ||||||||
| (incorporated by reference to Exhibit 10.8 contained in Sleep Number’s Quarterly Report on Form 10-Q for the fiscal quarter ended September 28, 2019 (File No. 000-25121)) | ||||||||
10.12† | ||||||||
| 0-K for the fiscal year ended December 31, 2022 (File No. 000-25121)) | ||||||||
10.13† | ||||||||
| (incorporated by reference to Exhibit 10.30 contained in Sleep Number’s Annual Report on Form 10-K for the fiscal year ended December 29, 2012 (File No. 000-25121)) | ||||||||
10.14† | ||||||||
| Francis K. Lee (incorporated by reference to Exhibit 10.5 contained in Sleep Number’s Quarterly Report on Form 10-Q for the fiscal quarter ended July 1, 2023 (File No. 000-25121)) | |||||
10.15*† | |||||
10.16*† | ||||||||
| 82 | 2023 FORM 10-K | SLEEP NUMBER CORPORATION | |||||||
| Exhibit No. | Description | |||||||
| 10.24 | ||||||||
| 10.25 | ||||||||
| U.S. Bank National Association and the several banks and other financial institutions from time to time party thereto (incorporated by reference to Exhibit 10.29 contained in Sleep Number’s Annual Report on Form 10-K for the fiscal year ended December 29, 2018 (File No. 000-25121)) | ||||||||
| 10.27 | ||||||||
| 10.28 | ||||||||
| 10.29 | ||||||||
| 10.30 | ||||||||
| 10.31 | ||||||||
| 10.32 | ||||||||
| 10.33 | ||||||||
| 10.34 | ||||||||
10.35† | ||||||||
10.36† | ||||||||
10.37† | ||||||||
| 83 | 2023 FORM 10-K | SLEEP NUMBER CORPORATION | |||||||
| Exhibit No. | Description | |||||||
10.38† | ||||||||
10.39† | ||||||||
10.40† | ||||||||
10.41† | ||||||||
10.42† | ||||||||
10.43† | ||||||||
10.44† | ||||||||
10.45† | ||||||||
10.46† | ||||||||
10.47† | ||||||||
10.48† | ||||||||
10.49† | ||||||||
10.50† | ||||||||
| 84 | 2023 FORM 10-K | SLEEP NUMBER CORPORATION | |||||||
| Exhibit No. | Description | |||||||
10.51† | ||||||||
10.52† | ||||||||
| 10.53 | ||||||||
| 21.1* | ||||||||
| 23.1* | ||||||||
| 24.1* | ||||||||
| 31.1* | ||||||||
| 31.2* | ||||||||
| 32.1* | ||||||||
| 32.2* | ||||||||
97.1*† | ||||||||
| 101.INS* | Inline XBRL Instance Document – the instance document does not appear in the Interactive Data File because its XBRL tags are embedded within the Inline XBRL document | |||||||
| 101.SCH* | Inline XBRL Taxonomy Extension Schema Document | |||||||
| 101.CAL* | Inline XBRL Taxonomy Extension Calculation Linkbase Document | |||||||
| 101.DEF* | Inline XBRL Taxonomy Extension Definition Linkbase Document | |||||||
| 101.LAB* | Inline XBRL Taxonomy Extension Label Linkbase Document | |||||||
| 101.PRE* | Inline XBRL Taxonomy Extension Presentation Linkbase Document | |||||||
| 104* | Cover Page Interactive Data File (formatted as inline XBRL and contained in Exhibit 101) | |||||||
____________________
(1)Confidential treatment has been requested by the issuer with respect to designated portions contained within document. Such portions have been omitted and filed separately with the Securities and Exchange Commission pursuant to Rule 24b-2 of the Securities and Exchange Act of 1934, as amended.
(2)Portions of this exhibit have been redacted in compliance with Regulation S-K Item 601(b)(10).
*Filed herein.
† Management contract or compensatory plan or arrangement.
ITEM 16. FORM 10-K SUMMARY
Not applicable.
| 85 | 2023 FORM 10-K | |||||||||||
| SLEEP NUMBER CORPORATION | |||||||||||
SIGNATURES
Pursuant to the requirements of Section 13 or 15(d) of the Securities and Exchange Act of 1934, the Registrantregistrant has duly caused this report to be signed on its behalf by the undersigned, thereunto duly authorized.
| SLEEP NUMBER CORPORATION | |||||||||||||||
| (Registrant) | |||||||||||||||
| February 23, 2024 | /s/ Shelly R. Ibach | ||||||||||||||
| Shelly R. Ibach | |||||||||||||||
| Chief Executive Officer | |||||||||||||||
| (principal executive officer) | |||||||||||||||
| By: | /s/ Francis K. Lee | ||||||||||||||
| Francis K. Lee | |||||||||||||||
| Chief Financial Officer | |||||||||||||||
| (principal financial officer) | |||||||||||||||
| By: | /s/ Joel J. Laing | ||||||||||||||
| Laing | |||||||||||||||
| Chief Accounting Officer | |||||||||||||||
| (principal accounting officer) | |||||||||||||||
| 86 | 2023 FORM 10-K | SLEEP NUMBER CORPORATION | |||||||
POWER OF ATTORNEY
Know all persons by these presents, that each person whose signature appears below constitutes and appoints Shelly R. Ibach, DavidFrancis K. Lee and Sam R. Callen and Mark A. Kimball,Hellfeld, and each of them, as such person’s true and lawful attorneys-in-fact and agents, with full power of substitution and resubstitution, for such person and in such person’s name, place and stead, in any and all capacities, to sign any and all amendments to this Report, and to file the same, with all exhibits thereto, and other documents in connection therewith, with the Securities and Exchange Commission, granting unto said attorneys-in-fact and agents, and each of them, full power and authority to do and perform each and every act and thing requisite and necessary to be done in connection therewith, as fully to all intents and purposes as such person might or could do in person, hereby ratifying and confirming that all said attorneys-in-fact and agents, or any of them or their or such person’s substitute or substitutes, may lawfully do or cause to be done by virtue thereof.
Pursuant to the requirements of the Securities Exchange Act of 1934, this Report has been signed below by the following persons on behalf of the Registrantregistrant and in the capacities and on the date or dates indicated.
| Name | Title | Date | |||||||||||||
| /s/ Shelly R. Ibach | Chair of the Board | February | |||||||||||||
| Shelly R. Ibach | |||||||||||||||
| /s/ Daniel I. Alegre | Director | February | |||||||||||||
| Daniel I. Alegre | |||||||||||||||
| /s/ Phillip M. Eyler | Director | February 21, 2024 | |||||||||||||
| Phillip M. Eyler | |||||||||||||||
| /s/ Stephen L. Gulis, Jr. | Director | February | |||||||||||||
| Stephen L. Gulis, Jr. | |||||||||||||||
| /s/ Michael J. Harrison | Director | February | |||||||||||||
| Michael J. Harrison | |||||||||||||||
| /s/ Julie M. Howard | Director | February 21, 2024 | |||||||||||||
| Julie M. Howard | |||||||||||||||
| /s/ Deborah L. Kilpatrick | Director | February 21, 2024 | |||||||||||||
| Deborah L. Kilpatrick | |||||||||||||||
| /s/ Brenda J. Lauderback | Director | February | |||||||||||||
| Brenda J. Lauderback | |||||||||||||||
| /s/ Stephen E. Macadam | Director | February 20, 2024 | |||||||||||||
| Stephen E. Macadam | |||||||||||||||
| /s/ Barbara R. Matas | Director | February | |||||||||||||
| Barbara R. Matas | |||||||||||||||
| /s/ Angel L. Mendez | Director | February 20, 2024 | |||||||||||||
| Angel L. Mendez | |||||||||||||||
| /s/Hilary A. Schneider | Director | February 22, 2024 | |||||||||||||
| SLEEP NUMBER CORPORATION | |||||||||||
SLEEP NUMBER CORPORATION AND SUBSIDIARIES
Schedule II - Valuation and Qualifying Accounts
(in thousands)
| Description | 2023 | 2022 | 2021 | ||||||||||||||||||||
| Allowances for credit losses | |||||||||||||||||||||||
| Balance at beginning of period | $ | 1,267 | $ | 924 | $ | 1,046 | |||||||||||||||||
| Additions charged to costs and expenses | 1,437 | 2,294 | 1,750 | ||||||||||||||||||||
| Deductions from reserves | (1,267) | (1,951) | (1,872) | ||||||||||||||||||||
| Balance at end of period | $ | 1,437 | $ | 1,267 | $ | 924 | |||||||||||||||||
| Description | 2017 | 2016 | 2015 | |||||||||
| Allowance for doubtful accounts | ||||||||||||
| Balance at beginning of period | $ | 884 | $ | 1,039 | $ | 739 | ||||||
| Additions charged to costs and expenses | 915 | 1,224 | 1,577 | |||||||||
| Deductions from reserves | (1,085 | ) | (1,379 | ) | (1,277 | ) | ||||||
| Balance at end of period | $ | 714 | $ | 884 | $ | 1,039 | ||||||
| Accrued sales returns | ||||||||||||
| Balance at beginning of period | $ | 15,222 | $ | 20,562 | $ | 15,262 | ||||||
| Additions charged to costs and expenses | 77,226 | 71,958 | 84,265 | |||||||||
| Deductions from reserves | (73,178 | ) | (77,298 | ) | (78,965 | ) | ||||||
| Balance at end of period | $ | 19,270 | $ | 15,222 | $ | 20,562 | ||||||
| 88 | 2023 FORM 10-K | SLEEP NUMBER CORPORATION | |||||||