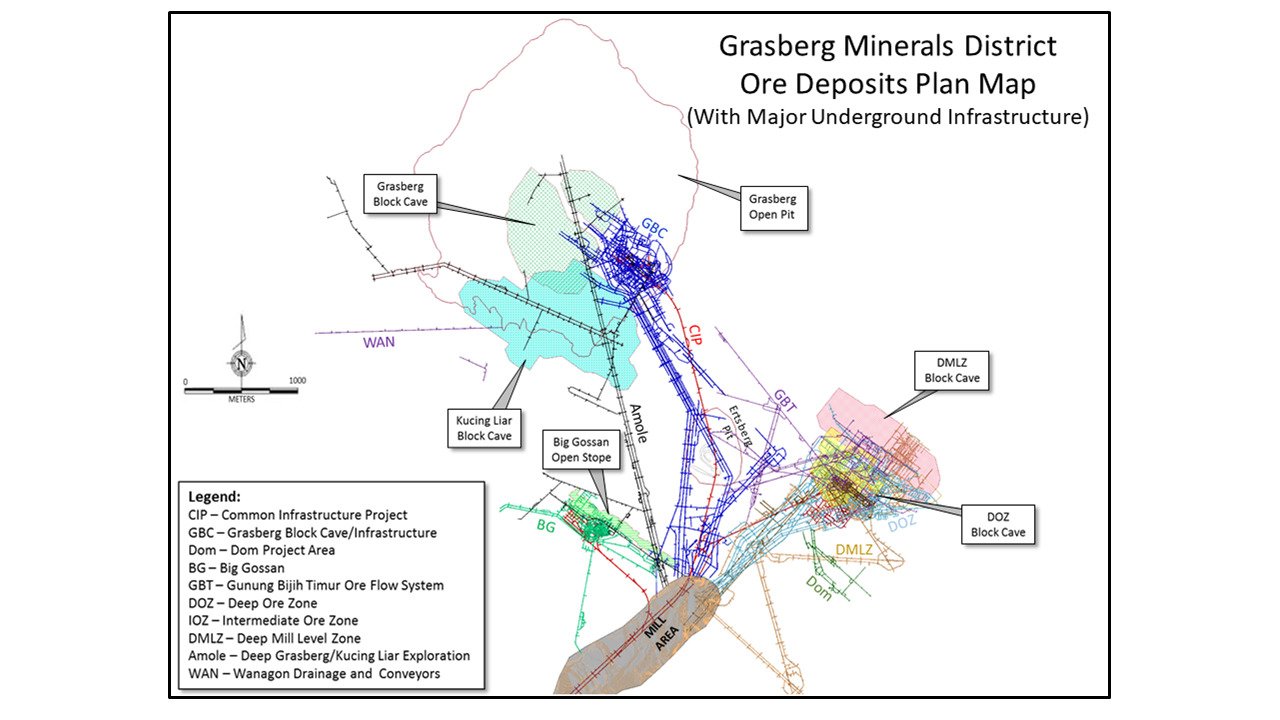
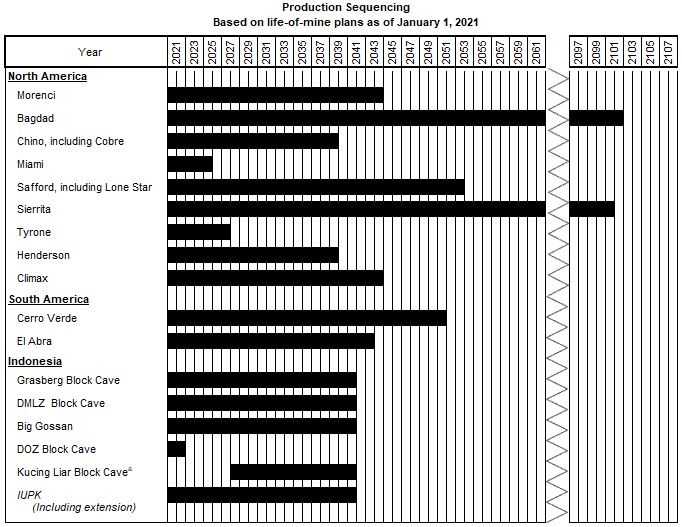
The following chart illustrates our current plans for sequencing and producing our proven and probable reserves at each of our ore bodies and the years in which we currently expect production from each ore body and related stockpiles. Our proven and probable ore reserves in Indonesia reflect estimates of minerals that can be recovered through the end of 2041, and our current mine plan and planned operations are based on the assumption that PT-FI will comply with its obligations under the IUPK and receive the second 10-year extension from 2031 through 2041 (refer to Item 1A. “Risk Factors” and Note 13 for further discussion). Production volumes are typically lower in the first few years for each ore body as development activities are ongoing and as the mine ramps up to full production and production volumes may also be lower as the mine reaches the end of its life. The sequencing dates shown in the chart below include development activity that results in metal production. The ultimate timing of the start of production from our undeveloped mines is dependent upon a number of factors, including the results of our exploration and development efforts, and may vary from the dates shown below. In addition, we develop our mine plans based on maximizing the net present value from the ore bodies. Significant additional capital expenditures will be required at many of these mines in order to achieve the life-of-mine plans reflected below.
Mill and leach stockpiles generally contain lower grade ores that have been extracted from an ore body and are available for metal recovery. Mill stockpiles contain sulfide ores and recovery of metal is through milling, concentrating, smelting and refining or, alternatively, by concentrate leaching. Leach stockpiles contain oxide ores and certain secondary sulfide ores and recovery of metal is through exposure to acidic solutions that dissolve contained copper and deliver it in solution to extraction processing facilities.
Because it is impracticable to determine copper contained in mill and leach stockpiles by physical count, reasonable estimation methods are employed. The quantity of material delivered to mill and leach stockpiles is based on surveyed volumes of mined material and daily production records. Sampling and assaying of blasthole cuttings determine the estimated copper grades of material delivered to mill and leach stockpiles.
Expected copper recovery rates for mill stockpiles are determined by metallurgical testing. The recoverable copper in mill stockpiles, once entered into the production process, can be produced into copper concentrate almost immediately.
Expected copper recovery rates for leach stockpiles are determined using small-scale laboratory tests, small- to large-scale column testing (which simulates the production process), historical trends and other factors, including mineralogy of the ore and rock type. Total copper recovery in leach stockpiles can vary significantly from a low percentage to more than 90 percent depending on several variables, including processing methodology, processing variables, mineralogy and particle size of the rock. For newly placed material on active stockpiles, as much as 80 percent of total copper recovery may be extracted during the first year, and the remaining copper may be recovered over many years. Processes and recovery rates are monitored regularly, and recovery rate estimates are adjusted periodically as additional information becomes available and as related technology changes.
Exploration and Development Activities
Capital expenditures associated with oil and gas properties totaled $2 million in 2018, and we have no plans to incur significant capital expenditures associated with oil and gas properties in future periods. Capital expenditures for our oil and gas operations totaled $34 million in 2017 and $1.2 billion in 2016 (including $0.6 billion incurred for Gulf of Mexico and $0.5 billion for changes in capital expenditure accruals).
Production and Sales Data
Oil and gas sales totaled 3.1 MMBOE in 2018 and 4.6 MMBOE in 2017. Oil and gas production and sales for the year 2016 totaled 47.1 MMBOE, including 34.4 million barrels (MMBbls) of oil, 65.1 billion cubic feet of natural gas and 1.8 MMBbls of natural gas liquids.
Productive Wells
At December 31, 2018 and 2017, the total number of active producing oil and gas wells was not significant. At December 31, 2016, we had working interests in 120 gross (94 net) active producing oil wells and 640 gross (100 net) active producing natural gas wells.
Drilling Activities
As of and for the years ended December 31, 2018 and 2017, there were no exploratory or development wells drilled or in progress. During the year ended December 31, 2016, we drilled 3 gross (2 net) exploratory productive wells and 9 gross (5 net) development productive wells.
Item 1A. Risk Factors.
This report contains “forward-looking statements” within the meaning of United States (U.S.) federal securities laws. Forward-looking statements are all statements other than statements of historical facts, such as plans, projections or expectations relating to ore grades and milling rates; business outlook; production and sales volumes; unit net cash costs; cash flows, capital expenditures, liquidity; operating cash flows; capital expenditures;costs; operating plans; our financial policy; our expectations regarding our share of PT Freeport Indonesia’s (PT-FI) ramp-up of underground mining activities and future cash flows through 2022; PT-FI’s development, financing, construction and completion of a new smelter in Indonesia;Indonesia and possible expansion of the smelter at PT Smelting; our commitments to deliver responsibly produced copper, including plans to implement and validate all of our operating sites under specific frameworks; improvements in operating procedures and technology; exploration efforts and results; development and production activities, rates and costs; liquidity; tax rates; supply ofexport quotas and demand for, andduties; the impact of copper, gold and molybdenum price changes; the impact of deferred intercompany profits on earnings; mineralization and reserve estimates; execution of the settlement agreements associated with the Louisiana coastal erosion cases and talc-related litigation; descriptions of our objectives, strategies, plans, goals or targets, including our net debt target, anticipated improvements in energy efficiency at certain operating sites, and environmental, social and governance (ESG) targets; and future dividend payments; andpayments, share purchases and sales.sales, including under our Board of Director’s (Board’s) financial policy.
We undertake no obligation to update any forward-looking statements. We caution readers that forward-looking statements are not guarantees of future performance and our actual results may differ materially from those anticipated, expected, projected or assumed in the forward-looking statements. Important factors that can cause our actual results to differ materially from those anticipated in the forward-looking statements include the following:
Risk Factor Summary
Investing in our securities involves a high degree of risk and uncertainties. Below is a summary of the material risk factors associated with an investment in our securities. You should read this summary together with the more detailed description of each risk factor that immediately follows this summary.
However, the risk factors described herein are not all of the risks we may face. Other risks not presently known to us or that we currently believe are immaterial may materially affect our business if they occur. Moreover, new risks emerge from time to time. Further, our business may also be affected by additional factors that apply to all companies operating in the U.S. and globally, which have not been included.
In addition to this summary and the more detailed description of the risk factors, you should carefully consider other sections of this annual report on Form 10-K, which may include additional factors that could adversely affect our business, prior to investing in our securities.
Financial risks
•Fluctuations in the market prices of the commodities we produce have caused and may continue to cause significant volatility in our financial performance and in the trading prices of our common stock and debt. Extended declines in the market prices of the commodities we produce could have an adverse effect on our business.
•Our debt and other financial commitments may limit our financial and operating flexibility.
•The ongoing COVID-19 pandemic and any future pandemic, epidemic, endemic or similar public health threats and resulting negative impact on the global economy and financial markets may have an adverse impact on our business and results of operations, the duration and extent of which is highly uncertain and could be material.
•Changes in or the failure to comply with the financial assurance requirements relating to our mine closure reclamation and plugging and abandonment obligations could have a material adverse effect on our business.
•Unanticipated litigation or negative developments in pending litigation or with respect to other contingencies could have a material adverse effect on our business.
•We may be adversely impacted by increased liabilities and costs related to our defined benefit pension plans.
International risks
•Our international operations are subject to, and may be adversely affected by, political, economic, social and regional risks of doing business in countries outside the U.S.
•Our special mining license (IUPK) may not be extended through 2041 if PT-FI fails to abide by the terms and conditions of the IUPK and applicable laws and regulations.
Operational risks
•Our mining operations are subject to operational risks that could adversely affect our business and our underground mining operations can be particularly dangerous.
•Our management of waste rock and tailings are subject to significant environmental, safety and engineering challenges and risks that could adversely affect our business.
•Violence, including shooting incidents, civil and religious strife, and activism could result in loss of life and/or disrupt our operations and may adversely affect our business.
•Our business depends on good relations with our workforce and labor disputes or labor unrest could disrupt our operations from time to time, which could adversely affect our financial results.
•Our mining operations depend on the availability of significant quantities of secure water supplies.
•Development projects are inherently risky and may require more capital than anticipated, which could adversely affect our business. The development of our underground mines and operations are also subject to other unique risks.
•We must continually replace reserves depleted by production but exploration is highly speculative and our exploration activities may not result in additional discoveries.
•Estimates of proven and probable reserves and mineralized material are uncertain and the volume and grade of ore actually recovered may vary from our estimates.
•Our operations are subject to extensive laws and regulations, some of which require permits and other approvals, which may increase our costs and may delay or result in a suspension of our operations.
•Our business is dependent upon information technology systems, which may be adversely affected by disruptions, damage, failure and risks associated with implementation and integration.
Environmental and social risks
•Our operations are subject to environmental laws and regulations, and compliance with these laws and regulations involves significant costs and may constrain existing operations or expansion opportunities.
•We incur significant costs for remediating environmental conditions on properties that have not been operated in many years.
•Our Indonesia mining operations create difficult and costly environmental challenges, which could require us to incur increased costs.
•Our operations require significant energy and regulation of greenhouse gas emissions may increase our costs and adversely affect our operations.
•The physical impacts of climate change may adversely affect our copper mining operations.
•Increasing scrutiny and evolving expectations from stakeholders with respect to our environmental, social and governance practices, performance and disclosures may impact our reputation and business and impose additional costs on us.
•Failure or perceived failure to manage our relationships with the communities where we operate, including communities that are adjacent to or near our operations and Indigenous People, could harm our reputation and social license to operate.
Other risks
•Our holding company structure may impact our ability to service debt and our stockholders’ ability to receive dividends.
•Anti-takeover provisions in our charter documents and Delaware law may make an acquisition of us more difficult.
Financial risks
Fluctuations in the market prices of the commodities we produce, primarily copper, gold and molybdenum, have caused and may continue to cause significant volatility in our financial performance and in the trading prices of our debtcommon stock and common stock.debt. Extended declines in the market prices of copper, gold and, to a lesser extent, molybdenum, could adversely affect our earnings, cash flows and asset values and, if sustained, may adversely affect our ability to repay debt.
Our financial results will vary with fluctuations in the market prices of the commodities we produce, primarily copper and gold, and to a lesser extent molybdenum. An extended declineDuring 2020, the COVID-19 pandemic and resulting negative impact on the global economy created significant volatility in the financial markets, including the copper market. In 2020, copper prices ranged from a low of $2.09 per pound in March 2020 and a high of $3.61 per pound in December 2020, and with the ongoing COVID-19 pandemic, significant volatility may continue. Extended declines in market prices of theseour commodities, whether related to the ongoing COVID-19 pandemic or otherwise, could have a material adverse effect on our financial results and the value of our assets, and/ormay depress the price of our common stock, and may have a material adverse effect on our ability to comply with financial and other covenants in our debt agreements, repay our debt and meet our other fixed obligations; and may depress the trading prices of our common stock and of our publicly traded debt securities.obligations.
Additionally, if market prices for our primary commodities decline and remain low for a sustained period of time, we may have to revise our operating plans, including curtailing production, reducing operating costsor modifying some of our mining and capital expenditures and discontinuing certain exploration and development programs.processing operations. We may be unable to decrease our costs in an amount sufficient to offset reductions in revenues, in which case we may incur losses, and those losses may be material. For example, in early 2020, we announced revised operating plans in response to the global COVID-19 pandemic and resulting negative impact on the global economy, which resulted in reductions in (i) operating costs, (ii) capital expenditures, (iii) exploration and administrative costs, and (iv) sales volumes and production from those planned.
Fluctuations in commodities prices are caused by varied and complex factors beyond our control, including global supply and demand balances and inventory levels; global economic and political conditions; international regulatory, trade andand/or tax policies, including national tariffs; commodities investment activity and speculation; interest rates; expectations regarding future inflation rates; the strength of the U.S. dollar compared to foreign currencies; the price and availability of substitute products; and changes in technology. Volatility in global economic growth, particularly in developing economies, has the potential to adversely affect future demand and prices for commodities. Geopolitical uncertainty and protectionism, including the United Kingdom’s plans to exit from the European Union (commonly referred to as Brexit), have the potential to inhibit international trade and negatively impact business confidence, which creates the risk of constraints on our ability to trade in certain markets and has the potential to increase price volatility.
Copper prices may be affected by demand from China, which has becomeis currently the largest consumer of refined copper in the world, and by changes in demand for industrial, commercial and residential products containing copper. Rising trade tensions betweenChina had a major economic shutdown during first-quarter 2020 in connection with its efforts to contain and mitigate the U.S. and China and efforts byspread of COVID-19, which resulted in the Chinese government to reduce debt levels contributed tocountry’s first reported economic contraction in over 40 years. Although our sales during 2020 were not significantly affected, a recent slowdown in China’s growth. A continued slowing in China’s economic growth, and demand and continued trade tensions betweenanother widespread COVID-19 outbreak in China or other pandemic, epidemic or endemic health issues, the U.S. and China could result in lower copper prices which could have a material adverse impact on our business and results of operations, including cash flow. The adoption and expansion of trade restrictions, changes in the state of China-U.S. relations, including the current trade war, or other governmental action related to tariffs or trade agreements or policies are difficult to predict and could adversely affect copper prices, demand for our products, our costs, our customers, our suppliers, and the U.S. economy, which in turn could have a material adverse effect on our business, results of operations, or financial condition.
Copper prices have fluctuated historically, with London Metal Exchange (LME) copper settlement prices ranging from $1.96$2.09 per pound to $3.29$3.61 per pound during the three years ended December 31, 2018.2020. LME copper settlement prices averaged $2.80 per pound in 2020, $2.72 per pound in 2019 and $2.96 per pound in 2018, $2.80 per pound in 2017 and $2.21 per pound in 2016.2018. The LME copper settlement price was $2.71$3.51 per pound on December 31, 2018,2020, and $2.79$3.57 per pound on January 31, 2019.29, 2021.
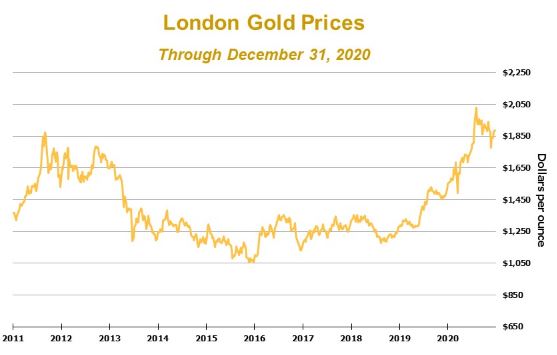
Factors affecting gold prices may include the relative strength of the U.S. dollar to other currencies, inflation and interest rate expectations, purchases and sales of gold by governments and central banks, demand from China and India, two of the world’s largest consumers of gold, and global demand for jewelry containing gold. The London Bullion Market Association (London) PM gold price averaged $1,770 per ounce in 2020, $1,393 per ounce in 2019 and $1,268 per ounce in 2018, $1,257 per ounce in 2017 and $1,250 per ounce in 2016.2018. The London PM gold price was $1,279$1,888 per ounce on December 28, 201830, 2020 (there was no London PM gold price quote on December 31, 2018)2020), and $1,323$1,864 per ounce on January 31, 2019.29, 2021.
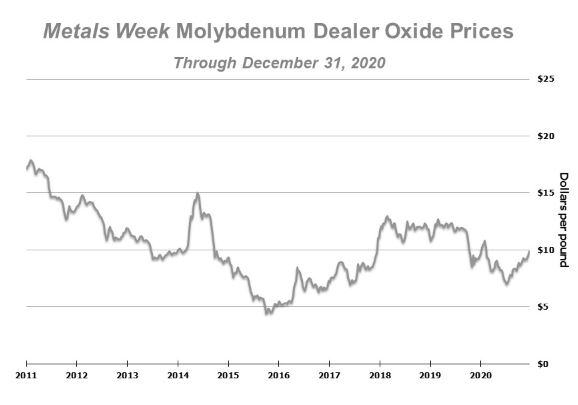
The Metals Week Molybdenum Dealer Oxide weekly average price averaged $8.69 per pound in 2020, $11.37 per pound in 2019 and $11.93 per pound in 2018, $8.21 per pound in 2017 and $6.47 per pound in 2016.2018. The Metals Week Molybdenum Dealer Oxide weekly average price was $11.88$9.86 per pound on December 31, 2018,2020, and $10.95$10.38 per pound on January 31, 2019.29, 2021.
Declines in prices of commodities we sell could result in metals inventory adjustments and impairment charges for our long-lived assets.During 2020, we recorded unfavorable metals inventory adjustments totaling $96 million associated with lower market prices for copper and molybdenum. Refer to Note 4 for additional information regarding metals inventory adjustments. Other events that could result in impairment of our long-lived assets include, but are not limited to, decreases in estimated proven and probable mineral reserves and any event that might have a material adverse effect on current and future expected mine production costs.
Our debt and other financial commitments may limit our financial and operating flexibility.
At December 31, 2018,2020, our total consolidated debt was $11.1$9.7 billion (see Note 8) and our total consolidated cash was $4.2$3.7 billion. We also have various other financial commitments, including reclamation and environmental obligations, take-or-pay contracts and leases. For further information, refer to thesee risk factor below relating to mine closure and reclamation regulations, and plugging and abandonment obligations related to our remaining oil and gas properties. Although we have been successful in repaying debt in the past, refinancing our bank facilities, and issuing new debt securities in capital markets transactions, there can be no assurance that we can continue to do so. In addition, we may incur additional debt in future periods or reduce our holdings of cash and cash equivalents in connection with funding existing operations, capital expenditures, dividends, share repurchases or in pursuing other business opportunities.
Our level of indebtedness and other financial commitments could have important consequences to our business, including the following:
•Limiting our flexibility in planning for, or reacting to, changes in the industry in which we operate;
•Increasing our vulnerability to general adverse economic, industry and industryregulatory conditions;
•Limiting our ability to fund future working capital, capital expenditures, general corporate requirements and/or material contingencies, to engage in future development activities, or to otherwise realize the value of our assets and opportunities fully because of the need to dedicate a substantial portion of our cash flows from operations to payments on our debt;
•Requiring us to sell assets to reduce debt; or
•Placing us at a competitive disadvantage compared to our competitors that have less debt and/or fewer financial commitments.
Any failure to comply with the financial andand/or other covenants in our debt agreements may result in an event of default that would allow the creditors to accelerate maturities of the related debt, which in turn may trigger cross-acceleration or cross-default provisions in other debt agreements. Our available cash and liquidity may not be sufficient to fully repay borrowings under our debt instruments that aremay be accelerated upon an event of default.
From August 2015 through November 2016, we sold 326.5 million shares of our common stock under registered at-the-market equity programs, which generated $3.5 billion in gross proceeds (refer to Note 10). In addition, during 2016, we issued 48.1 million shares of our common stock in connection with the settlement of two drilling rig contracts (refer to Note 13) and 27.7 million shares of our common stock in exchange for $369 million of FCX senior notes (refer to Note 10). Any additional issuance of equity capital to fund operations, reduce debt, improve our financial position or for other purposes, may have a negative impact on our stock price.
As of January 31, 2019,29, 2021, our senior unsecured debt was rated “BB“ with a stablepositive outlook by Standard & Poor’s, (S&P), “BB+” with a negativestable outlook by Fitch Ratings, (Fitch), and “Ba2”“Ba1” with a stable outlook by Moody’s Investors Service (Moody’s). ThereService. If we are unable to maintain our indebtedness and financial ratios at levels acceptable to these credit rating agencies, or should our business prospects deteriorate, our current credit ratings could be downgraded, which could adversely affect the value of our outstanding securities and existing debt and our ability to obtain new financing on favorable terms and could increase our borrowing costs.
The ongoing COVID-19 pandemic and any future pandemic, epidemic, endemic or similar public health threats and resulting negative impact on the global economy and financial markets may have an adverse impact on our business and results of operations, the duration and extent of which is highly uncertain and could be material.
The ongoing COVID-19 pandemic continues to adversely impact the global economy and is creating significant volatility in the financial markets, including the copper markets. The duration and scope of and uncertainties associated with, the ongoing COVID-19 pandemic and the related impact on commodity prices, our business and the global economy are evolving and beyond our control. The extent and duration of adverse impacts that the COVID-19 pandemic may have on supply, demand and prices of the commodities we produce, on our suppliers, vendors, customers and employees and on global financial markets is unknown at this time, but could be both material and prolonged. Prolonged unfavorable economic conditions, and any resulting slowed global economic growth, including the current U.S. recession, may result in lower demand for the commodities we produce, as well as the inability of various customers, contractors, suppliers and other business partners to fulfill their obligations, which could have a material adverse effect on our business and results of operations.
The COVID-19 pandemic disrupted our 2020 operating plans. In April 2020, we announced revised operating plans in response to the global COVID-19 pandemic and resulting negative impact on the global economy. Our revised operating plans focused on safeguarding our business in an uncertain public health and economic environment, advancing the ramp-up of underground production at Grasberg, and advancing initiatives in North America and South America. The ongoing COVID-19 pandemic or any future pandemic, epidemic, endemic or other similar public health threats could disrupt or change our future operating plans. For additional information, refer to Part 1, Item 2. herein.
Our business and results of operations could be adversely affected if significant portions of our workforce are unable to work effectively, including because of illness, quarantines, government actions or other restrictions in connection with the COVID-19 pandemic. We have proactively implemented operating protocols at each of our operating sites to contain and mitigate the risk of spread of COVID-19, including but not limited to, physical distancing, travel restrictions, sanitizing, and frequent health screening and monitoring. COVID-19 cases have been confirmed through testing at our operating sites, including PT-FI’s remote operating site in Papua, Indonesia. Despite our efforts to manage these impacts, there can be no assurance that our credit ratingsactions will be effective in containing and mitigating the risk of spread or a major outbreak of COVID-19 at our operating sites. Additionally, although several vaccines for COVID-19 have been approved, there are risks that these vaccines will not be downgradedeffective against variants of the virus and that these vaccines may not be accepted or widely available in the future.
Certainareas in which we operate due to shortages or other issues with distribution. A major outbreak of COVID-19 at any of our debt agreements, includingoperating sites, and particularly at PT-FI’s remote operating site, could have a material adverse effect on our revolving credit facility, usebusiness and results of operations.
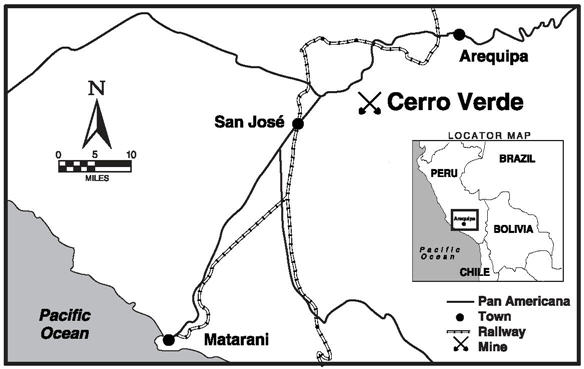
Actions taken by governmental authorities and third parties to contain and mitigate the London Interbank Offered Rate (LIBOR) asrisk of spread of COVID-19 may have an adverse impact on our business. For example, in mid-March 2020, the Peru government issued a reference rate. In July 2017,Supreme Decree and declaration of a National Emergency in its efforts to contain the United Kingdom’s Financial Conduct Authority, which regulates LIBOR, announced that it intendsoutbreak of COVID-19, and subsequently extended the order through May 10, 2020. The Peru government also extended the quarantine measures instituted in mid-March 2020 through August 31, 2020, for certain cities in Peru (including Arequipa, where our Cerro Verde mine is located). To comply with the government’s requirements, we temporarily transitioned our Cerro Verde mine to phase out LIBORcare and maintenance status and adjusted operations to prioritize critical activities. Strict health protocols have been implemented and a plan for Cerro Verde to restore operations was approved by the endPeru government in second-quarter 2020. Cerro Verde continued to increase milling rates while operating consistent with our April 2020 revised operating plans and under strict COVID-19 restrictions and protocols. Cerro Verde expects mill rates to average approximately 360,000 metric tons of 2021. If LIBORore per day in 2021 with the potential to ramp-up to pre-COVID-19 levels approximating 400,000 metric tons of ore per day as COVID-19 restrictions are lifted.
These and other impacts of COVID-19 or other pandemic, epidemic, endemic or similar public health threats could also have the effect of heightening many of the other risks described in these “Risk Factors.” The ultimate impact of COVID-19 on our business is unavailable after 2021, our debt with interest ratesdifficult to predict and depends on factors that are indexedevolving and beyond our control, including the scope and duration of the outbreak and recovery, including any future resurgences, as well as actions taken by governmental authorities and third parties, including the distribution, effectiveness and acceptance of
vaccines, to LIBOR willcontain its spread and mitigate its public health effects. Any of these disruptions could continue to adversely impact our business and results of operations, and such adverse impacts could be determined using various alternative methods to the extent provided for in our agreements, which could result in increases in interest rates on such debt. Further, we may need to renegotiate our debt agreements and the loans that utilize LIBOR to replace LIBOR with the new standard that is established by the U.S. Alternative Rate Reference Committee, which is currently expected to be the Secured Overnight Bank Financing Rate.material.
Mine closure and reclamation regulations impose substantial costs on our operations and include requirements that we provide financial assurance supporting those obligations. We also have plugging and abandonment obligations related to our remaining oil and gas properties, and are required to provide bonds or other forms of financial assurance in connection with those properties.Changes in or the failure to comply with these requirements could have a material adverse effect on us.our business.
We are required by U.S. federal and state laws and regulations to provide financial assurance sufficient to allow a third party to implement approved closure and reclamation plans for our mining properties if we are unable to do so. Most of our financial assurance obligations are imposed by state laws that vary significantly by jurisdiction, depending on how each state regulates land use and groundwater quality. The U.S. Environmental Protection Agency (EPA) and state agencies may also require financial assurance for investigation and remediation actions that are required under settlements of enforcement actions under the Comprehensive Environmental Response, Compensation and Liability Act of 1980 (CERCLA) or similar state laws. Refer to Note 12 for additional information regarding our financial assurance obligations.
With respect to our mining operations, most of our financial assurance obligations are imposed by state laws that vary significantly by jurisdiction, depending on how each state regulates land use and groundwater quality. Although Section 108(b) of CERCLA has required EPA to identify classes of facilities that must establish evidence of financial responsibility since CERCLA was adopted in 1980, currently, there are no financial assurance requirements for
active mining operations under CERCLA. In response to litigation initiated by several environmental organizations against EPA and a subsequent settlement, EPA proposed financial assurance regulations for the hard rock mining industry in January 2017, which were vigorously opposed by us and others in the mining industry. As proposed, the rules would have imposed financial responsibility obligations on U.S. hard rock mining operations that are unnecessary, duplicative of existing state and other federal requirements, and unreasonable. Our initial calculations suggested that the financial responsibility amounts would be difficult, if not impossible, for us and others to meet with corporate resources, and would be extremely expensive, if not impossible, to finance with third-party financial instruments such as letters of credit, bonds or insurance. In December 2017, EPA withdrew its proposed rules and in February 2018, EPA published its final decision that additional financial assurance regulations for the hard rock mining industry would not be needed given the existing state and federal regulatory programs that became effective in March 2018. In May 2018, environmental organizations filed a petition for review with the U.S. Court of Appeals for the District of Columbia. We and others in the mining industry intervened in the case. If the court remands the rule back to EPA for reconsideration, a re-proposal of rules similar in nature to EPA’s 2017 proposed rules would severely harm the international competitiveness of the U.S. hard rock mining industry and would materially and adversely affect our cash flows, results of operations and financial condition.
We are also subject to financial assurance requirements in connection with our remaining oil and gas properties and certain of our previously sold oil and gas properties under both state and federal laws, including financial responsibility required under the Oil Pollution Act of 1990 to cover containment and cleanup costs resulting from an oil spill. As a result of a significant increase in the number of oil and gas companies experiencing financial distress, especially those operating in the Outer Continental Shelf, we may have additional exposure if our partners or buyers of our previously owned properties file for bankruptcy and/or default on their share of the abandonment obligations. In 2016, the U.S. Bureau of Ocean Energy Management (BOEM) issued revised requirements for lessees operating in federal waters to secure the cost of plugging, abandoning, decommissioning and/or removing wells, platforms and pipelines at the end of production. The revised requirements eliminate previously provided waivers from requirements to post security. In early 2017, the BOEM announced a delay in the implementation of certain aspects of the rules pending further review and in June 2017, BOEM further extended the start date for implementation indefinitely. This extension currently remainsOn October 16, 2020, BOEM issued a Notice of Proposed Rulemaking and Request for Comments that proposed to limit the circumstances in effect. If implemented,which it will require supplemental bonding so that it will apply more narrowly than the new requirements could require us2016 requirements. However, we may still be subject to post security in the formsignificant levels of bonds or similar assurances.supplemental bonding. The cost for bonds or other forms of assurances can be substantial, and there is no assurance that they can be obtained in all cases.
As of December 31, 2018,2020, our financial assurance obligations totaled $1.2$1.5 billion for closure and reclamation/restoration costs of U.S. mining sites, and $0.5 billion for plugging and abandonment obligations of our remaining oil and gas properties. A substantial portion of our financial assurance obligations are satisfied by FCXFreeport-McMoRan Inc. (FCX) and subsidiary guarantees and financial capability demonstrations. Our ability to continue to provide guarantees and financial capability demonstrations depends on state and other regulatory requirements, our financial performance and our financial condition. Other forms of assurance, such as letters of credit and surety bonds, are costly to provide and, depending on our financial condition and market conditions, may be difficult or impossible to obtain. Failure to provide the required financial assurance could result in the closure of the affected properties.
The laws and regulations governing mine closure and remediation in a particular jurisdiction and oil and gas properties plugging and abandonment obligations are subject to review at any time and may be amended to impose additional requirements and conditions, which may cause our provisions for environmental and asset retirement obligations to be underestimated and could materially affect our financial position or results of operations. Similarly, our implementation of the Global Industry Standard for Tailings Management (the Tailings Standard) (discussed below) could require changes to our closure and reclamation plans, although it is uncertain if these changes would result in material capital or operating cost increases. In addition, climate change could lead to changes in the physical risks posed to our operations, which could result in changes in our closure and reclamation plans to address such risks. Any modifications to our closure and reclamation plans that may be required to address physical climate risks may materially increase the costs associated with implementing closure and reclamation at any or all of our active or inactive mine sites and the financial assurance obligations related to the same. Refer to Notes 1 and 12, for further discussion of our environmental and asset retirement obligations.
Unanticipated litigation or negative developments in pending litigation or with respect to other contingencies could have a material adverse effect on our cash flows, results of operations and financial condition.
We are involved in numerous legal proceedings and subject to other contingencies that have arisen or may arise in the ordinary course of our business or are associated with environmental issues, including those described in Note 12 and in Item 3. “Legal Proceedings” involving matters such as remediation, restoration and reclamation of environmental contamination, claims of personal injury or property damage arising from such contamination or from exposure to substances such as lead, arsenic, asbestos, talc, uranium and other allegedly toxic substances, disputes over water rights, and disputes with foreign governments or regulatory authorities over royalties, taxes, rights and obligations under concession or other agreements, or other matters. We are also involved periodically in other reviews, inquiries,investigations and other proceedings initiated by or involving government agencies, some of which may result in adverse judgments, settlements, fines, penalties, injunctions or other relief. In addition, fromFrom time to time we are involved in disputes over the allocation of environmental remediation obligations at Superfund“superfund” and other sites. In addition, we may be held responsible for the costs of addressing contamination at the site of current or former activities or at third party sites, or be held liable to third parties for exposure to hazardous substances should those be identified in the future. The outcome of litigation is inherently uncertain and adverse developments or outcomes can result in significant monetary damages, penalties, other sanctions or injunctive relief against us, limitations on our property rights, or regulatory interpretations that increase our operating costs. Management does not believe, based on currently available information, that the outcome of any individual legal proceeding will have a material adverse effect on our financial condition, although individual or cumulative outcomes could be material to our operating
results for a particular period, depending on the nature and magnitude of the outcome and the operating results for the period.
With respect to the asbestos and talc exposure cases described in Note 12, there has been a recent significant increase in the number of cases alleging the presence of asbestos contamination in talc-based personal care products and in cases alleging exposure to talc products that are not alleged to be contaminated with asbestos. In these cases, plaintiffs allege serious health risks and often fatal diseases, including mesothelioma and ovarian cancer, allegedly caused by long-term use of talc-based cosmetic and personal care products. Nationwide trial results in these cases have ranged from outright dismissals to very large jury awards of both compensatory and punitive damages. The primary targets have been the producers of those products, but defendants in many of these cases also include talc miners. Cyprus Amax Minerals Company (CAMC), an indirect wholly owned subsidiary of FCX is one of those targets. One of CAMC’s wholly owned subsidiaries, Cyprus Mines Corporation, was involved in talc mining until 1992 when it exited that business. CAMC has contractual indemnification rights, subject to limited reservations, against the ultimate successor to the business, which has acknowledged those indemnification obligations and has taken responsibility for all cases tendered to it to date. However, on February 13, 2019, the indemnitor filed for Chapter 11 bankruptcy protection, and CAMC is in the very early stages of evaluating the potential implications of that filing.
We may be adversely impacted by increased liabilities and costs related toour defined benefit pension plans.
We sponsor two defined benefit pension plans for certain current and former employeeemployees in the U.S. and a few pension plans for non-U.S. locations which provide for specified payments after retirement. The major defined benefit pension plans are funded with trust assets invested in a diversified portfolio of securities and other investments. Changes in regulatory requirements or the market value of plan assets, investment returns, interest rates and mortality rates may affect the funded status of our defined benefit pension plans and may cause volatility in the net periodic benefit cost, future funding requirements of the plans and the funded status as recorded on the balance sheet. A sustained period of low or insufficient investment returns or low interest rates could require us to fund our pension plans to a greater extent than anticipated. Refer to Note 9 for further discussion.
International risks
Our international operations are subject to political, economic, social and regional risks of doing business in countries outside the U.S.
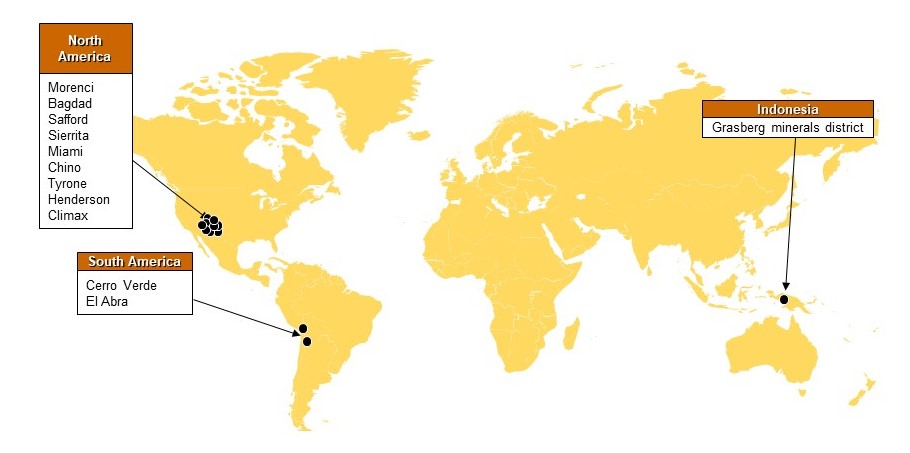
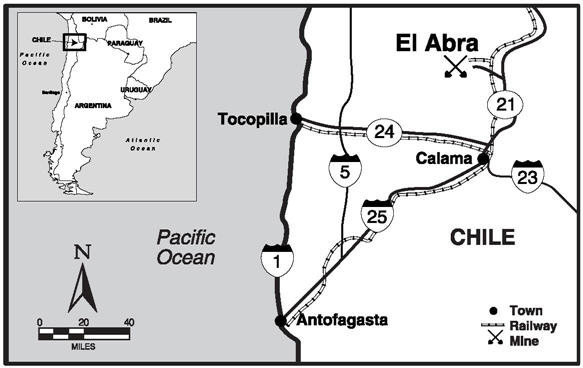
We are a U.S.-based mining company with substantial assets located outside of the U.S. We conduct international mining operations in Indonesia, Peru and Chile and exploration activities in various foreign jurisdictions. Accordingly, in addition to the usual risks associated with conducting business in countries outside the U.S., our business may be adversely affected by political, economic, social and regional uncertainties in each of these countries. Risks of conducting business in countries outside the U.S. include:
•Delays in obtaining or renewing, or the inability to obtain, maintain or renew, or the renegotiation, cancellation, revocation or forced modification of existing contracts, leases, licenses, permits or other agreements and/or approvals;
•Expropriation or nationalization of property, protectionism, or restrictions on repatriation of earnings or capital, or other currency controls;capital;
•Changes in the host country’s laws, regulations and policies (which may be applied retroactively), including, but not limited to, those relating to labor, taxation, royalties, duties, tariffs, divestment, imports, exports (including restrictions on the export of copper concentrates, copper and/or gold), trade regulations, immigration, currency and environmental matters (including land use and water use), which because of rising “resource nationalism” in countries around the world, may impose increasingly onerous requirements on foreign operations and investment;investment, and/or result in fines, fees, and sanctions imposed for failure to comply with the laws and regulations of the jurisdictions in which we operate;
•Political, social and economic instability, bribery, extortion, corruption, civil unrest, acts of war, guerrilla activities, insurrection and terrorism;
Changes in the aspirations and expectations of local communities in which we operate with respect to our contributions to employee health and safety, infrastructure and community development and other factors that may affect our social license to operate, allterrorism, certain of which leadmay result in, among other things, an inability to increased costs;access our property;
•Risk of loss associated with trespass, local artisanal or illegal mining, theft and vandalism;vandalism or due to potential pandemic, epidemic and endemic health issues;
•Changes in U.S. trade, tariff, tax, immigration or other policies that may harm relations with foreign countries or result in retaliatory policies, including the U.S.-China trade war that began in 2018 which, if prolonged, could have a significant adverse effect on global trade and the global economy;policies;
•Increases in training and other costs and challenges relating to requirements by governmental entities to employ the nationals of the country in which a particular operation is located;
•Foreign exchange controls, fluctuations in foreign currency exchange rates and inflation;
•Reduced protection for intellectual property rights; and
•The risk of having to submit to the jurisdiction of an international court or arbitration panel or having to enforce the judgment of an international court or arbitration panel against a sovereign nation within its own territory.nation.
Our insurance does not cover most losses caused by the above described risks. Accordingly, our exploration, development and production activities outside of the U.S. may be substantially affected by many unpredictable factors beyond our control, some of which could have a material adverse effect on our cash flows, results of operations and financial condition.
Our international operations must comply with the U.S. Foreign Corrupt Practices Act and similar anti-corruption and anti-bribery laws of the other jurisdictions in which we operate. There has been a substantial increase in the global enforcement of these laws in recent years. We operate in certain jurisdictions that have experienced governmentalpublic and private sector corruption to some degree, and in certain circumstances, compliance withwhere significant anti-corruption enforcement activities, prosecutions, and anti-bribery laws and heightened expectations of enforcement authorities may be in tension with certain local customs and practices.settlements have occurred. There can be no assurance that our internal control policies and procedures will always protect us from misinterpretation of or noncompliance with applicable laws and internal policies, recklessness, fraudulent behavior, dishonesty or other inappropriate acts committed by our affiliates, employees, agents or contractors. As such, our corporate policies and processes may not prevent or detect all potential breaches of law or other governance practices. Any violation of thoseanti-corruption or anti-bribery laws could result in significant criminal or civil fines and penalties, litigation, and loss of operating licenses or permits, and may damage our reputation, which could have a material adverse effect on our cash flows, results of operations and financial condition.
We conduct international mining operations in Indonesia, Peru and Chile and exploration activities in various foreign jurisdictions. Accordingly, in addition to the usual risks associated with conducting business in countries outside the U.S., our business may be adversely affected by political, economic, social and regional uncertainties in each of these countries. For example, we are involved in several significant tax proceedings and other tax disputes with IndonesianIndonesia and PeruvianPeru tax authorities (refer to Note 12 for further discussion of these matters). Other risks specific to certain countries in which we operate are discussed in more detail below.
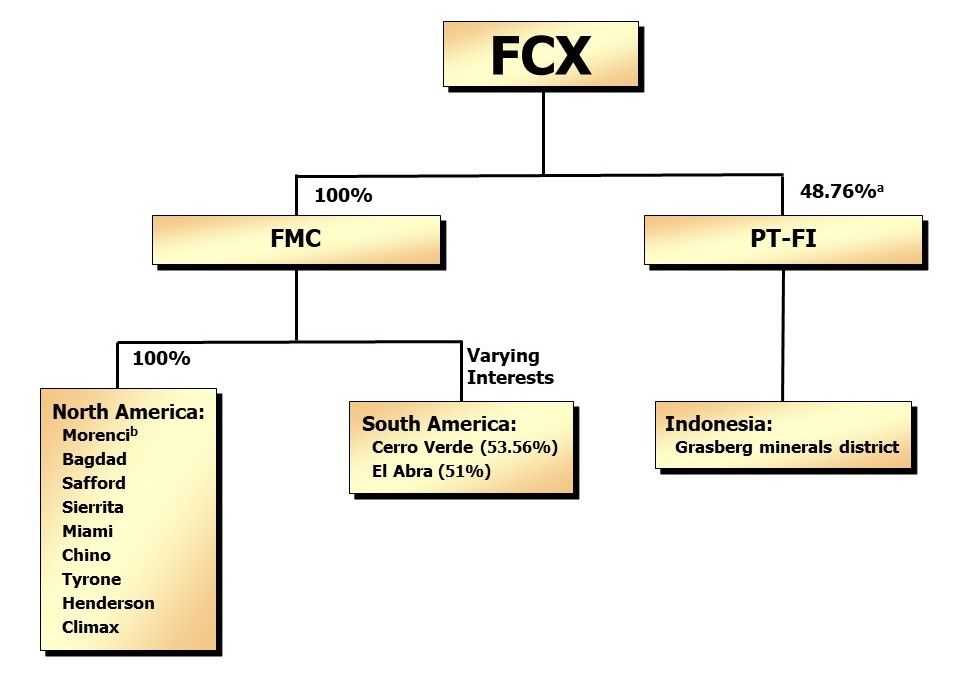
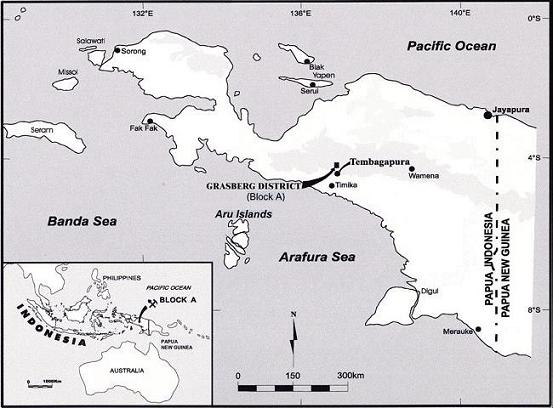
Because our mining operationoperations in Indonesia isare a significant operating asset, our business may be adversely affected by political, economic and social uncertainties in Indonesia.
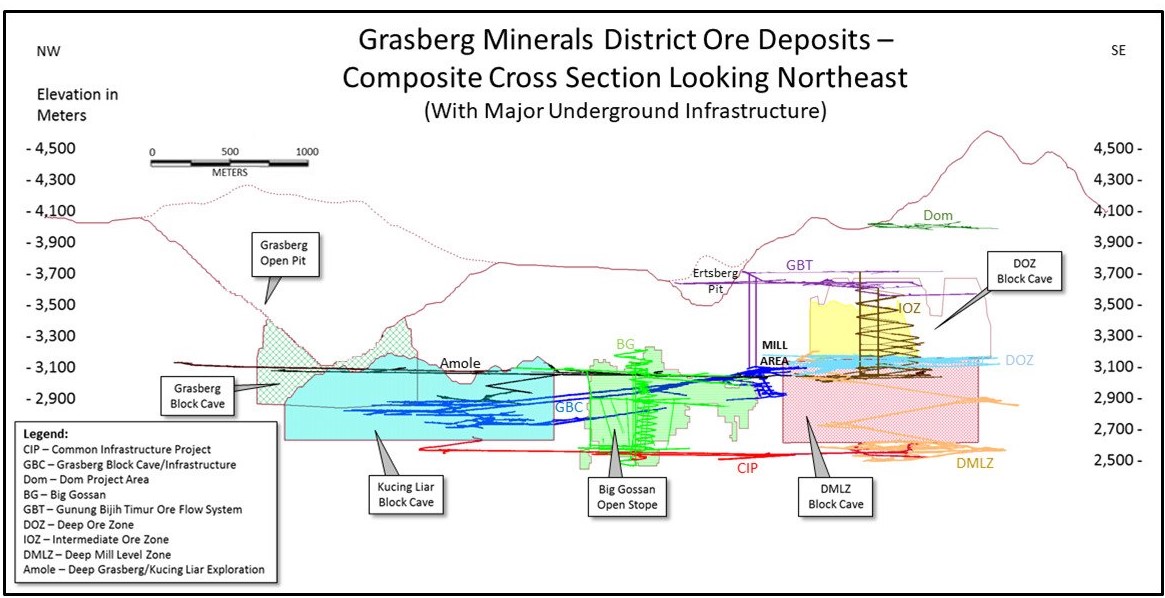
Our Indonesia mining operations include the Grasberg minerals district, one of the world’s largest copper and gold deposits. These operations are conducted by our subsidiary PT-FI pursuant to a special mining license (IUPK) issued by the Indonesian government on December 21, 2018, which replaced PT-FI’s former Contract of Work (COW) entered into in December 1991. Under the terms of the IUPK, PT-FI has been granted an extension of mining rights through 2031, with rights to extend its mining rights through 2041, subject to, among other things, PT-FI completing the construction of a new smelter in Indonesia by December 21, 2023, and fulfilling its defined fiscal obligations to the Indonesian government. Refer to Note 13 for a summary of the IUPK’s key fiscal terms.
PT-FI has applied for a one-year extension of its export license, which currently expires on February 16, 2019. Export licenses are valid for one year periods, subject to review and approval by the Indonesian government every six months, depending on smelter construction progress.
Maintaining a good working relationship with the IndonesianIndonesia government is important because of the significance of our Indonesia operations to our business, and because our mining operations there are among Indonesia’s most significant business enterprises. The Grasberg minerals district has been designated by the IndonesianIndonesia government as one of Indonesia’s vital national assets. Partially because of its significance to Indonesia’s economy, the environmentally sensitive area where it is located, and the number of people employed, our Indonesia operations have been the subject of political debates and of criticism in the IndonesianIndonesia press, and have been the target of
protests and occasional violence. Improper management of our working relationship with the IndonesianIndonesia government could lead to a disruption of operations and/or impact our reputation in Indonesia and in the region where we operation, operate,
which could adversely affect our business. In addition, PT Indonesia Asahan Aluminium (Persero) (PT Inalum)Inalum, also known as MIND ID), a shareholder in PT-FI, is an IndonesianIndonesia state-owned enterprise. Disputes between us and PT Inalum may result in litigation or arbitration, which could increase our expenses and distract our officers and directors from focusing their time and effort on our business.business and could create tensions with the Indonesia government.
The IndonesianIndonesia mining industry is subject to extensive regulation within Indonesia, and there have been major developments in laws and regulations applicable to mining concession holders, some of which have conflicted with PT-FI’s contractual rights in the past. In particular, the enactment of Law No. 4 of 2009 on Coal and Mineral Mining on January 12, 2009 (the Mining Law) replaced the previous regulatory framework which allowed concession holders, including PT-FI, to conduct mining activities in Indonesia under a contract of work system. The Mining Law, which sets out the regulatory framework for the mining industry in Indonesia, only contains substantive principles and leaves many specific issues to be addressed in implementing regulations, some of which have conflicted with PT-FI’s contractual rights in the past, including, but not limited to, regulations that imposed a progressive export duty on copper concentrate, restricted exports of copper concentrate and anode slimes, increased royalty rates, and required payment of a smelter assurance bond to support a commitment to construct a new smelter in Indonesia (refer to Note 13 for further discussion of the smelter assurance bond). In January 2017, PT-FI suspended exports through April 2017 in response to these Mining Law regulations.
The Mining Law stipulated that previously granted mining rights (through a contract of work) would continue to be valid until expiry, subject to certain adjustments. PT-FI’s former COW was concluded pursuant to the 1967 Foreign Capital Investment Law, which provided basic guarantees of remittance rights and protection against nationalization, a framework for economic incentives and basic rules regarding other rights and obligations of foreign investors. The initial term of PT-FI’s former COW was scheduled to expire in 2021 and explicitly provided that it could be extended for two 10-year periods subject to Indonesian government approval, which could not be withheld or delayed unreasonably. Prior to the issuance of the IUPK to PT-FI in December 2018, PT-FI had been engaged in discussions with the Indonesian government since 2012 regarding various provisions of its former COW, including extending its term. Notwithstanding provisions in PT-FI’s former COWContract of Work (COW) prohibiting it from doing so, the IndonesianIndonesia government sought to modify PT-FI’s former COW to address provisions contained in the Mining Law and implementing regulations adopted thereunder, some of which were not required under or conflicted with PT-FI’s former COW, including, but not limited to (i) restrictions on PT-FI’s basic right to export mining products; (ii) imposition of additional export duties;duties and higher royalty rates; (iii) imposition of excess surface water taxes (refer to Note 12); (iv) imposition of new requirement to build additional smelter capacity in Indonesia; (v) unreasonable withholding and delay in granting approval of two successive ten-year extensions of the term of the former COW; and (vi) imposition of new divestment requirements.
In early 2017, the Indonesia government issued new regulations to address exports of unrefined metals, including copper concentrate and anode slimes, and other matters related to the mining sector. PT-FI’s export license for copper concentrate is valid for one year periods, subject to review and approval by the Indonesia government every six months, depending on smelter construction progress. PT-FI’s export license expires on March 15, 2021. Refer to MD&A and Note 12 for further discussion of the administrative fine levied by the Indonesia government on PT-FI for failing to achieve physical development progress on the new smelter, and ongoing discussions with the Indonesia government regarding a deferred schedule for the completion of the new smelter project as well as other alternatives in light of the ongoing COVID-19 pandemic and volatile global economic conditions. The 2017 regulations also permit the export of anode slimes, which is necessary for PT Smelting (PT-FI’s 25-percent-owned copper smelter and refinery located in Gresik, Indonesia) to continue operating. PT Smelting’s export license for anode slimes expires on July 18, 2021. In addition to a delay in the renewal of its export license for anode slimes in 2017, PT Smelting’s operations were shut down from mid-January 2017 until early March 2017 as a result of labor disturbances. Copper concentrate sales to PT Smelting totaled over 10 percent of our consolidated revenues for each of the years ended December 31, 2020, 2019 and 2018. We cannot predict when PT-FI’s copper concentrate license and PT Smelting’s anode slimes export license may be renewed. PT-FI’s sale of concentrates could be interrupted if either of these export license is not timely renewed or if PT Smelting is unable to operate either due to other operational or financial constraints, which would adversely impact our revenues and operations.
We cannot assure you that future regulatory changes affecting the mining industry in Indonesia will not be introduced or unexpectedly repealed, or that new interpretations of existing laws and regulations will not be issued, which could adversely affect our business, financial condition and results of operations.
In 2019, Indonesia will hold national legislative elections. The presidential election will be held in April 2019, with a run-off in August 2019, if required. Political considerations leading up to these elections could affect the country’s policies pertaining to foreign investment, which could adversely affect our Indonesia mining operations.
We will not mine all of PT-FI’s ore reserves in the Grasberg minerals district before the initial term of PT-FI’s IUPK expires in 2031 and the IUPK may not be extended through 2041 if PT-FI fails to abide by the terms and conditions of the IUPK and applicable laws and regulations.
As discussed in the above risk factor, “Because our mining operation in Indonesia is a significant operating asset, our business may be adversely affected by political, economic and social uncertainties in Indonesia”, onOn December 21, 2018, PT-FI was granted a newan IUPK to replace its former COW, enabling PT-FI to conduct operations in the Grasberg minerals district through 2041. Under the terms of the IUPK, PT-FI has been granted mining rights through 2031, with rights to extend its mining rights through 2041, subject to, among other things, PT-FI completing the construction of a new smelter in Indonesia by December 21, 2023 (an extension of which has been requested due to COVID-19 mitigation measures subject to the approval of the Indonesia government), and
fulfilling its defined fiscal obligations to the IndonesianIndonesia government. Refer to Note 13 for a summary of the IUPK’s key fiscal terms.
The IUPK also requires PT-FI to pay duties on concentrate exports of 5 percent, declining to 2.5 percent when smelter development progress exceeds 30 percent, and eliminated when smelter development progress exceeds 50 percent. SmelterRefer to MD&A and Note 12 for further discussion of the administrative fine levied by the Indonesia government on PT-FI for failing to achieve physical development progress will be determined by an independent verifier appointed byon the Ministrynew smelter, and ongoing discussions with the Indonesia government regarding a deferred schedule for the completion of Energythe new smelter project as well as other alternatives in light of the ongoing COVID-19 pandemic and Mineral Resources (MEMR)volatile global economic conditions. Engineering and subject to approval by the MEMR. PT-FI is initiating front-end engineering and design and intends to pursue financing, commercial and potential partner arrangements for this project, which has athe selected process technology are ongoing. The preliminary estimated capital cost inestimate for the project approximates $3 billion, range.and PT-FI plans to arrange financing for the project. The economics of the new smelter will be borne by PT-FI’s shareholders according to their respective long-term share ownership percentages. PT-FI’s ability to raise and service significant new sources of capital will be a function of macroeconomic conditions, future market prices as well as PT-FI’s operational performance, cash flow and debt position, among other factors. Financing may not be available when needed or, if available, the terms of such financing may not be favorable to PT-FI.
Our proven and probable ore reserves in Indonesia reflect estimates of minerals that can be recovered through the end of 2041, and PT-FI’s current long-term mine plan and planned operations are based on the assumption that PT-FI will abide by the terms and conditions of the IUPK and will be granted the 10-year extension from 2031 through 2041. As a result, we will not mine all of these ore reserves during the initial term of the IUPK. Prior to the end of 2031, we expect to mine 5350 percent of aggregate proven and probable recoverable ore at December 31, 2018,2020, representing 57 percent of our net equity share of recoverable copper reserves and 6459 percent of our net equity share of recoverable gold reserves.
If PT-FI does not complete the construction of a new smelter in Indonesia by December 21, 2023 (an extension of which has been requested due to COVID-19 mitigation measures subject to the approval of the Indonesia government), or fulfill its defined fiscal obligations to the IndonesianIndonesia government as set forth in the IUPK, the IUPK will likely not be extended from 2031 to 2041, and we would be unable to mine all of PT-FI’s ore reserves in the Grasberg minerals district, which would adversely affect our business, results of operations and financial position.
Operational risks
Our mining operations are subject to operational risks that could adversely affect our business and our underground mining operations can be particularly dangerous.
Our mines are very large in scale and, by their nature are subject to significant operational risks, some of which are outside of our control, and many of which are not covered fully, or in some cases even partially, by insurance. These operational risks, which could materially and adversely affect our business, operating results and cash flow, include earthquakes, rainstorms, floods, and other natural disasters; environmental hazards, including discharge of metals, concentrates, pollutants or hazardous chemicals; surface or underground fires; equipment failures; accidents;accidents, including in connection with mining equipment, milling equipment or conveyor systems, transportation of chemicals, explosives or other materials and in the transportation of employees and business partners to and from sites; wall failures and rock slides in our open-pit mines, and structural collapses of our underground mines or tailings impoundments; and lower than expected ore grades or recovery rates.rates; and unexpected geological formations or conditions (whether in mineral or gaseous form).
Since late JanuaryFor a discussion of risks specific to our tailings management, see below “Our management of waste rock and tailings are subject to significant environmental, safety and engineering challenges and risks that could adversely affect our business.”
We are facing continued geotechnical challenges due to the older age of some of our open-pit mines and a trend toward mining deeper pits and more complex deposits. No assurances can be given that unanticipated geotechnical and hydrological conditions may or may not occur, nor whether these conditions may lead to events such as landslides and pit wall failures, in the future or that such events will be detected in advance. Geotechnical instabilities can be difficult to predict and are often affected by risks and hazards outside of our control, such as seismic activity or severe weather, which may lead to floods, mudslides, pit-wall instability, and possibly even slippage of material. During the first quarter of 2019, our El Abra operation in Chile has experienced heavy rainfall and electrical storms, resulting instorms. As a result, our operating results for 2019 were impacted by a suspension of El Abra’s crushed
leach stacking operations since February 4, 2019.for approximately 35 days. We have been unablecannot predict whether similar events will occur in the future or the extent to assess damages becausewhich any such event would affect this, or any of poor road conditions and inaccessible areas and we do not currently know when normal operations will resume. We estimate the impact on 2019 production will approximate 8 million pounds of copper through mid-February 2019, and additional impacts of approximately 600 thousand pounds of copper per day are expected until normal operations resume.our other operations.
Underground mining operations can be particularly dangerous, and in May 2013, a tragic accident, which resulted in 28 fatalities and 10 injuries, occurred at PT-FI when the rock structure above the ceiling of an underground training facility collapsed. PT-FI temporarily suspended mining and processing activities at the Grasberg complex to conduct inspections and resumed open-pit mining and concentrating activities in June 2013, and underground operations in July 2013. No assurance can be given that similar events will not occur in the future.
In addition to the usual risks encountered in the mining industry, our Indonesia mining operations involve additional
risks given that such operations are locatedtheir location in steep mountainous terrain in a remote area of Indonesia. These
conditions have required us to overcome special engineering difficulties and develop extensive infrastructure facilities. The area also receives considerableextreme rainfall, which has led to periodic floods and mudslides. Further, the
mine site is also in an active seismic area and has experienced earth tremors from time to time. Our
We maintain insurance at amounts we believe to be reasonable to cover some of these risks and hazards; however, our insurance may
not sufficiently cover an unexpectedlosses from certain natural or operating disaster.disasters. No assurance can be given that such insurance will continue to be available, or that it will be available at economically feasible premiums, or that we will be able to obtain or maintain such insurance. We may elect to not purchase insurance for certain risks due to the high premium costs associated with insuring such risk or for various other reasons. We do not have coverage for certain environmental losses and other risks, as such coverage generally cannot be purchased at a commercially reasonable cost by us or other companies within the mining industry. The lack of, or insufficiency of, insurance coverage could adversely affect our cash flow and overall profitability.
The occurrence of one or more of these events in connection with our exploration activities and development of and production from mining operations may result in the death of, or personal injury to, our employees, other personnel or third parties, the loss of mining equipment, damage to or destruction of mineral properties or production facilities, significant repair costs, monetary losses, deferral or unanticipated fluctuations in production, extensive community disruption, loss of licenses, permits or necessary approvals to operate, loss of infrastructure and services, disruption to essential supplies or delivery of our products, environmental damage and potential legal liabilities, all of which may adversely affect our reputation, business, prospects, results of operations and financial position.
Our management of waste rock and tailings are subject to significant environmental, safety and engineering challenges and risks that could adversely affect our business.
The waste rock (including overburden) and tailings produced in our mining operations represent our largest volume of waste material. Managing the volume of waste rock and tailings presents significant environmental, safety and
engineering challenges and risks primarily relating to structural stability, geochemistry, water quality and dust generation. Management of this waste is regulated in the jurisdictions where we operate and our programs are designed to be in compliancecomply with applicable national, state and local laws, permits and approved environmental impact studies.
We maintain large leach pads and tailings impoundments containing viscous material, which are effectivelymaterial. Tailings impoundments include large damsembankments that must be engineered, constructed and monitored to ensure structural stability and avoid leakages or structural collapse. Our tailings impoundments in arid areas must have effective programs to suppress fugitive dust emissions, and we must effectively monitor and treat acid rock drainage at all of our operations. In Indonesia, we use a river transport system for tailings management, which presents other risks as discussed below.in more detail below under Environmental and social risks - “Our Indonesia mining operations create difficult and costly environmental challenges, and future changes in environmental laws, or unanticipated environmental impacts from those operations, could require us to incur increased costs.”
WeAffiliates of our company currently operate 1917 tailings storage facilities, 15 in the U.S. and 2 in Peru; and manage 5556 tailings storage facilities in the U.S. that are inactive or closed (approximately three-fourths of the inactive facilities have been reclaimed (approximately two-thirdsclosed). Our inventory of these have been reclaimed).tailings storage facilities comprises 12 active and 51 inactive or closed facilities with an upstream design and 5 active and 5 inactive with a centerline design. In 2020, we produced approximately 259 million metric tons of tailings. The failure of tailings and other impoundmentsembankments at any of our mining operations could cause severe, and in some cases catastrophic, property and environmental damage and loss of life, as well as adverse effects on our business and reputation. Many of our tailings storage facilities are located in areas where a failure has the potential to impact individual dwellings and a limited number of impoundments are in areas where a
failure has the potential to impact nearby communities or mining infrastructure. As a result, our programs take into account the significant consequences resulting from a potential failure, and we apply significantsubstantial financial resources and both internal and external technical resources to pursue the safe management of all those facilities. The importance of careful design, management and monitoring of large impoundments has been emphasized in recent years, including as recently as January 2019, by large scale tailings dam failures at unaffiliated mines, which resulted in numerous fatalities and caused extensive property and environmental damage. Our tailings management and stewardship program, which involves qualified external Engineers of Record and periodic oversight by independent External Tailingstailings Technical Review Boards at numerous operations,and our Tailings Stewardship Team, complies with the tailings governance framework on preventing catastrophic failure of tailings storage facilities adopted in December 2016 by the International Council on Mining and Metals (ICMM), an industry group of which we are a founding member, and required to be implemented by ICMM members. We continue to enhance our existing practices and work with ICMM members on additional initiatives to strengthen critical controls for the design, operation and closure of tailings storage facilities in an effort to reduce the risk of severe or catastrophic failure of tailings storage facilities butthose facilities. However, no assurance can be given that these events will not occur in the future.
Labor unrest, violence, activismThe importance of careful design, management and monitoring of large impoundments has been emphasized in recent years by large scale tailings dam failures at unaffiliated mines, which resulted in numerous fatalities and caused extensive property and environmental damage. As a result of failures at unaffiliated mines, in 2019, international groups initiated the drafting of standards for the safe management of tailings facilities. In August 2020, the co-conveners of the Global Tailings Review, which included ICMM, published the Tailings Standard. The Tailings Standard includes 77 requirements across 6 key areas including the design, construction, operation and monitoring of tailings facilities, management and governance, emergency response and long-term recovery, and public disclosure. ICMM has committed that members will implement the Tailings Standard within three years for certain facilities and within five years for all others. ICMM members have prepared a guidance document focused on practices that drive safe tailings management and prepared a conformance protocol document to be used by companies on demonstrating implementation of the Tailings Standard; both documents are expected to be published in early 2021. As an ICMM member, management has committed to implement the Tailings Standard at our tailings storage facilities, including providing required public disclosures regarding our facilities and efforts. We are evaluating changes to our tailings stewardship and management programs and approaches that may be needed to demonstrate conformance with the Tailings Standard, although it is uncertain if changes would result in material capital or operating cost increases.
In addition, changes in physical risks to our facilities resulting from climate change could lead to changes in our plans for managing tailings and waste rock in order to address such risks, which may materially increase the costs associated with managing waste rock and tailings at any or all of our active or inactive mine sites. Addressing the effects of climate change on tailings facilities is a requirement under the Tailings Standard.
Based on observations from such tailings failures at unaffiliated mines, in addition to fatalities and severe personal, property and environmental damages, these events could result in limited or restricted access to mine sites, suspension of operations, decrease in reserves, legal liability (possibly involving the freezing of assets), government investigations, additional regulations and restrictions on mining operations in response to any such failure, increased monitoring costs and production costs, increased insurance costs or inability to obtain insurance, increased costs and/or limited access to capital, remediation costs, inability to comply with any additional safety requirements or obtain necessary certifications, evacuation or relocation of communities or other emergency action, and other impacts, which could have a material adverse effect on our operations and financial position.
Violence, including shooting incidents, civil and religious strife, and activism could result in loss of life and/or disrupt our operations and may adversely affect our business, financial condition, results of operations and prospects.
Indonesia has long faced separatist movements and civil and religious strife in a number of provinces. Several separatist groups have sought increased political independence for the province of Papua, where our Grasberg minerals district is located. In Papua, there have been sporadic attacks on civilians by separatists and sporadic but highly publicized conflicts between separatists and the Indonesia military and police. In addition, illegal miners have periodically clashed with police who have attempted for years to move them away from our facilities. Social, economic and political instability in Papua could materially and adversely affect us if it results in damage to our property or interruption of our Indonesia operations.
In 2009, a series of shooting incidents occurred within the PT-FI project area, including along the road leading to our mining and milling operations. The shooting incidents continued on a sporadic basis through January 2020. During this time, there were 22 fatalities and more than 75 injuries to our employees, contractor employees, government
security personnel and civilians. In addition, in December 2018, a mass shooting incident targeting a highway construction crew occurred in a remote mountain area approximately 100 miles east of the PT-FI project area, resulting in at least 19 fatalities and several reported as missing. During first-quarter 2020 and April 2020, there was an escalation in shooting incidents in PT-FI’s area of operations. In late March 2020, a shooting incident occurred near PT-FI’s administrative offices in the lowlands in Papua, Indonesia, resulting in the death of one PT-FI employee and injuries to two other workers. In January 2021, another shooting incident occurred when a helicopter operating under contract to PT-FI was struck by a single gunshot. Separatist security incidents, including shootings, continue to be sporadically reported, and PT-FI continues to monitor the occurrence of incidents in the region.
The safety of our workforce is a critical concern, and PT-FI continues to work with the Indonesia government to enhance security and address security issues within the PT-FI project area and in nearby areas. We continue to limit the use of the road leading to our mining and milling operations to secured convoys, including transport of personnel by armored vehicles in designated areas.
We cannot predict whether additional incidents will occur that could result in loss of life, disrupt or suspend our operations. If other disruptive incidents occur, they could adversely affect our results of operations and financial condition in ways that we cannot predict at this time.
South America countries have historically experienced uneven periods of economic growth, as well as recession, periods of high inflation and general economic and political instability. During 2019 and 2020, both Peru and Chile experienced significant and prolonged civil unrest unrelated to our operations. Production and sales for the third quarter and first nine months of 2019 were impacted by protests associated with an unaffiliated copper development project in Peru that blocked access to the shipping ports and main transportation routes. Although the civil unrest did not significantly impact our results for 2019, similar events in the future could cause, our South America operations to be materially impacted, in which case, we may not be able to meet our production and sales targets. We cannot predict whether similar or more significant incidents of civil unrest will occur in the future in Peru or Chile.
Our business depends on good relations with our workforce and labor disputes or labor unrest could disrupt our operations from time to time, which could adversely affect our financial results.
Our business is dependent, in part, on maintaining good relations with our workforce. A significant portion of our employees are represented by labor unions in a number of countries under various collective bargaining agreements with varying durations and expiration dates. Refer to Items 1. and 2. “Business and Properties” of this annual report on Form 10-K for additional information regarding labor matters, and expiration dates of such agreements. As of December 31, 2018,2020, approximately 3738 percent of our global labor force was covered by collective bargaining agreements and approximately 2116 percent of our global labor force was covered by agreements that have expired and are currently being negotiated or will expire during 2019.2021.
Labor agreements are negotiated on a periodic basis, and may not be renewed on reasonably satisfactory terms to us or at all. If we do not successfully negotiate new collective bargaining agreements with our union workers, we may incur prolonged strikes and other work stoppages at our mining operations, which could adversely affect our financial condition and results of operations. Additionally, if we enter into a new labor agreement with any union that significantly increases our labor costs relative to our competitors, our ability to compete may be materially and adversely affected. Refer to Items 1. and 2., “Business and Properties,” for additional information regarding labor matters, and expiration dates of such agreements.
We could also experience labor disruptions such as work stoppages, work slowdowns, union organizing campaigns, strikes, or lockouts that could adversely affect our operations. For example, during third-quarter 2016, PT-FI experienced labor productivity issues and a 10-day work stoppage, that began in late September 2016. These labor productivity issueswhich continued during fourth-quarter 2016 and into the first half of 2017. Beginning in mid-April 2017, PT-FI experienced a high level of worker absenteeism, which unfavorably impacted mining and milling rates. Arates, and in May 2017, a significant number of employees and contractors elected to participate in an illegal strike action beginning in May 2017, andaction. These employees were subsequently deemed to have voluntarily resigned under existing IndonesianIndonesia laws and regulations resulting in increased costs associated with employee severance. In third-quarter 2020, we experienced a five-day labor-related work stoppage related to COVID-19 travel restrictions when a small group of workers at PT-FI staged protests and a blockade restricting access to the main road to the mining operations area. We reached an amicable resolution with the group of workers while upholding our COVID-19 safety protocols. There were no strikes or lockouts at any of our operations in 2020.
We cannot predict whether additional labor disruptions will occur. Significant reductions in productivity or protracted work stoppages at one or more of our operations could significantly reduce our production and sales volumes or disrupt operations, which could adversely affect our cash flow, results of operations and financial condition.
Indonesia has long faced separatist movements and civil and religious strife in a number of provinces. Several separatist groups have sought increased political independence for the province of Papua, where our Grasberg minerals district is located. In Papua, there have been sporadic attacks on civilians by separatists and sporadic but highly publicized conflicts between separatists and the Indonesian military and police. In addition, illegal miners have periodically clashed with police who have attempted for years to move them away from our facilities. Social,
economic and political instability in Papua could materially and adversely affect us if it results in damage to our property or interruption of our Indonesia operations.
In 2009, a series of shooting incidents occurred within the PT-FI project area, including along the road leading to our mining and milling operations. The shooting incidents continued on a sporadic basis through January 2015. During this time, there were 20 fatalities and more than 50 injuries to our employees, contractor employees, government security personnel and civilians. The next shooting incident occurred in August 2017, and a series of shooting incidents continued on a sporadic basis within the PT-FI project area and in nearby areas through August 2018, resulting in two fatalities and 25 injuries. In December 2018, a mass shooting incident targeting a highway construction crew occurred in a remote mountain area approximately 100 miles east of the PT-FI project area, resulting in at least 19 fatalities and several reported as missing. PT-FI continues to monitor the situation in the region.
The safety of our workforce is a critical concern, and PT-FI continues to work with the Indonesian government to address security issues within the PT-FI project area and in nearby areas. We continue to limit the use of the road leading to our mining and milling operations to secured convoys, including transport of personnel by armored vehicles in designated areas.
We cannot predict whether additional incidents will occur that could disrupt or suspend our operations. If other disruptive incidents occur, they could adversely affect our results of operations and financial condition in ways that we cannot predict at this time.
Our mining operations depend on the availability of significant quantities of secure water supplies.
Our mining operations require physical availability and secure legal rights to significant quantities of water for mining and ore processing activities, and related support facilities. Most of our North America and South America mining operations are in areas where competition for water supplies is significant.significant, and where climate change may lead to increasing scarcity of water resources in the future. Continuous production at our mines is dependent on many factors, including our ability to maintain our water rights and claims, and the continuing physical availability of the water supplies.
As discussed in Item 33. “Legal Proceedings”,Proceedings,” in Arizona, where our operations use both surface water and groundwater, we are a participant in an active general stream adjudication in which Arizona courts have been attempting, for over 4045 years, to quantify and prioritize surface water claims for the Gila River watershed, one of the state’s largest river systems. This stream adjudication primarily affects our Morenci, Safford and Sierrita mines. The adjudication is addressing the state law claims of thousands of competing users, including us, as well as significant federal water claims that are potentially adverse to the state law claims of both surface water and groundwater users. Groundwater is treated differently fromthan surface water under Arizona law, which historically allowed landownersland owners to pump subsurface water, subject only to the requirement of putting it to “reasonable use.” However, court decisions in the adjudication have concluded that some, as yet undetermined, volume of subsurface underground water constitutes “subflow” that is to be treated legally as surface water (rather than groundwater) and is therefore subject to the Arizona doctrine of prior appropriation (first in time, first in right) and subject to the adjudication and potentially unavailable to groundwater pumpers, including us, in the absence of valid surface water claims. AnyA re-characterization of groundwater as surface water could affect the ability of consumers, farmers, ranchers, municipalities, and industrial users like us to continue to access water supplies that have been relied on for decades. Because we are a user of both groundwater and surface water in Arizona, we are an active participant in the adjudication proceedings. Given the legal and technical complexity of these adjudications, their long history, and their long-term legal, economic and political implications, it is difficult to predict the timing or the outcome of these proceedings. If we are not able to satisfactorily resolve the issues being addressed in the adjudications, our ability to pump groundwater could be diminished or curtailed, and our operations at Morenci, Safford and Sierrita could be adversely affected unless we are able to acquire alternative resources.
Water for our Cerro Verde operation in Peru comes from renewable sources through a series of storage reservoirs on the Rio Chili watershed that collects water primarily from seasonal precipitation.precipitation and from wastewater collected from the city of Arequipa and treated at a wastewater treatment plant. As a result of occasional drought conditions, temporary supply shortages are possible that could affect our Cerro Verde operations.operations are possible.
Water for our El Abra mining operation in Chile comes from the continued pumping of groundwater from the Salar de Ascotán aquifer. In 2010, El Abra obtained regulatory approval for the continued pumping of groundwater from the Salar de Ascotán aquifer for its sulfide processing plant, which began operations in 2011. Our current permit will expire in 2029 unless we are able to renew it again. The agreement to pump from this aquifer is subject to continued monitoring of the aquifer level to ensure that environmentally
sensitive areas are not impacted by our pumping. If impact occurs, we would have to reduce pumping to restore water levels, which could have an adverse effect on production from El Abra.
Although we typically have sufficient water for our IndonesianIndonesia operations, (thethe area receives considerable rainfall that has ledmakes us susceptible to periodic floods and mudslides), lower rainfall could affect our water supply availability from time to time.mudslides, the nature and magnitude of which cannot be predicted.
Although each of our mining operations currently has access to sufficient water supplies to support current operational demands, as discussed above, some supplies are subject to adjudication proceedings, the outcome of which we cannot predict, and the availability of additional supplies that may be required for potential future expansions is uncertain. While we are taking actions to acquire additional back-up water supplies, such supplies may not be available at acceptable cost, or at all, so that the loss of a water right or currently available water supply could force us to curtail operations or force premature closures, thereby increasing and/or accelerating costs or foregoing profitable operations.
Development projects are inherently risky and may require more capital than anticipated, which could adversely affect our business. The development of our underground mines and operations are also subject
to other unique risks.
Mine development projects typically require a number of years and significant expenditures during the development phase before production is possible. Currently, our major mining projects include underground development activities in the Grasberg minerals district, which currently constitutes approximately 3029 percent of our estimated consolidated recoverable proven and probable copper reserves, and development of the Lone Star oxide project in Arizona.reserves. There are many risks and uncertainties inherent in all development projects including, but not limited to, unexpected or difficult geological formations or conditions, potential delays, cost overruns, lower levels of production during ramp-up periods, shortages of material or labor, construction defects, breakdowns and injuries to persons and property. The development of our underground mines and operations are also subject to other unique risks including, but not limited to, underground fires or floods, ventilating harmful gases, fall-of-ground accidents, and seismic activity resulting from unexpected or difficult geological formations or conditions. While we anticipate taking all measures that we deem reasonable and prudent in connection with the development of our underground mines to safely manage production, there is no assurance that these risks will not cause schedule delays, revised mine plans, injuries to persons and property, or increased capital costs, any of which may have a material adverse impact on our cash flows, results of operations and financial condition. Additionally, although we devote significant time and resources to our project planning, approval and review processes, many of our development projects are highly complex and rely on factors that are outside of our control, which may cause us to underestimate the time and capital required to complete a development project.
For example, in September 2015, we initiated pre-commercial productionexperience mining induced seismic activity from time to time at the Deep Mill Level Zone (DMLZ) underground mine in the Grasberg minerals district. During second-quarter 2018, PT-FI revised its mine plansResults to incorporate a slower ramp-update of the DMLZ underground mine following the continuing occurrence of mining induced seismic activity experienced in 2017 and 2018. PT-FI commenced hydraulic fracturing activities during third-quarter 2018 to manage rock stresses and pre-condition the DMLZ underground mine for large-scale production. Although results to dateproduction have been effective in managing rock stresses,effective. However, we cannot predict whether additional occurrences of seismic activity or other unexpected geological activity will occur that could cause schedule delays or additional revisions to PT-FI’s mine plans, which could adversely affect our cash flows, results of operations and financial condition. PT-FI currently expects the DMLZ to reach full production rates of 80,000 metric tons per day in 2022; however, estimates of timing of future production continue to be reviewed and may be modified as additional information becomes available.
Our decision to develop a project is typically based on the results of feasibility studies, which estimate the anticipated economic returns of a project. In addition, the economic feasibility of development projects is based on many factors, including the accuracy of estimated reserves, estimated capital and operating costs, and estimated future prices of the relevant commodity. Consolidated capital expenditures are expected to approximate $2.4 billion for the year 2019, including $1.5 billion for major mining projects primarily associated with underground development activities in the Grasberg minerals district and development of the Lone Star oxide project.
New development projects have no operating history upon which to base estimates of future cash flow. The actual costs, production rates and economic returns of our development projects may differ materially from our estimates, which may have a material adverse impact on our cash flows, results of operations and financial condition.
We must continually replace reserves depleted by production but exploration is highly speculative and our exploration activities may not result in additional discoveries.
Our existing mineral reserves will be depleted over time by production from our operations. Because our profits are primarily derived from our mining operations, our ability to replenish our mineral reserves is essential to our long-term success. Depleted reserves can be replaced in several ways, including expanding known ore bodies, reducing operating costs that could extend the life of a mine by allowing us to cost-effectively process ore types that were previously considered uneconomic, by locating new deposits or acquiring interests in reserves from third parties. Exploration is highly speculative in nature, involves many risks and uncertainties, requires substantial capital expenditures, and is frequently unsuccessful in discovering significant mineralization. Accordingly, our current or future exploration programs may not result in the discovery of additional deposits that can be produced profitably. Even if significant mineralization is discovered, it will likely take many years from the initial phases of exploration until commencement of production, during which time the economic feasibility of production may change. We may not be able to discover, enhance, develop or acquire reserves in sufficient quantities to maintain or grow our current reserve levels, which could negatively affect our cash flow, results of operations and financial condition.
Estimates of proven and probable reserves and mineralized material are uncertain and the volume and grade of ore actually recovered may vary from our estimates.
EstimatesOur estimates of recoverable proven and probable mineral reserves have been calculatedprepared in accordance with Industry Guide 7 as required by the Securities Exchange Act of 1934. There are numerous uncertainties inherent in estimating mineral reserves.reserves estimates. Such estimates are, to a large extent, based on the averageassumed long-term prices for the commodities we produce, primarily copper, gold and molybdenum, and interpretations of geologic data obtained from drill holes and other exploration techniques, which data may not necessarily be indicative of future results. Our mineral reserve estimates are based on the latest available geological and geotechnical studies. We conduct ongoing studies of our ore bodies to optimize economic values and to manage risk. We revise our mine plans and estimates of recoverable proven and probable mineral reserves as required in accordance with the latest available studies. Geological assumptions about our mineralization that are valid at the time of estimation may change significantly when new information becomes available.
Estimates of recoverable proven and probable mineral reserves, that will be recovered, or the cost at which we anticipate such mineral reserves will be recovered, are based on uncertain assumptions. The uncertain global financial outlook may affect economic assumptions related to reserve recovery and may require reserve revisions. Changes to reservesuch estimates could affect our asset carrying values and may also negatively impact our future financial condition and results.
In addition, if the market prices for the commodities we produce decline from recent levels, if production costs increase or recovery rates decrease, or if applicable laws and regulations are adversely changed, we can offer no assurance that the indicated level of recovery will be realized or that mineral reserves can be mined or processed profitably. If we determine that certain of our estimated recoverable proven and probable mineral reserves have become uneconomic, this may ultimately lead to a reduction in our aggregate reported mineral reserves which could have a material adverse effect on our business, financial condition and results of operations.
Additionally, the term “mineralized material” does not indicate recoverable proven and probable mineral reserves as defined by the U.S. Securities and Exchange Commission.Commission (SEC). Estimates of mineralized material are subject to further exploration and potential development, and, therefore, are subject to considerable uncertainty. Mineralized material is a mineralized body that has been delineated by appropriately spaced drilling and/or underground sampling to support the reported tonnage and average metal grades. Such a deposit cannot qualify as recoverable proven and probable mineral reserves until legal and economic feasibility are confirmed based upon a comprehensive evaluation of development costs, unit costs, grades, recoveries and other material factors and are, therefore, subject to considerable uncertainty.factors. Accordingly, no assurance can be given that the estimated mineralized material not included in reserves will become recoverable proven and probable mineral reserves.
In 2018, the SEC adopted amendments to the disclosure requirements for mining registrants. We will be required to comply with the new rules beginning with our annual report on Form 10-K for fiscal year 2021. Future adjustment to estimates of mineral reserves or mineralized material may occur as a result of the differing standards under the new requirements including, but not limited to, the replacement of our estimate of mineralized material with an estimate of “mineral resources.”
Our operations are subject to extensive laws and regulations, some of which require permits and other approvals. TheseCompliance with these regulations increaseincreases our costs and, in some circumstancesthe event of an alleged violation, may delay or suspendresult in a suspension of our operations.
Our operations are subject to extensive and complex laws and regulations that are subject to change and to changing interpretation by governmental agencies and other bodies vested with broad supervisory authority. As a mining company, compliance with environmental legal requirements is an integral and costly part of our business. For additional information, see “Environmental and social risks” below. We are also subject to extensive regulation of worker health and safety, including the requirements of the U.S. Occupational Safety and Health Act and similar laws of
other jurisdictions. In the U.S., the operation of our mines is subject to regulation by the U.S. Mine Safety and Health Administration (MSHA) under the Federal Mine Safety and Health Act of 1977 (Mine Act). MSHA inspects our mines on a regular basis and issues citations and orders when it believes a violation has occurred under the Mine Act. Additionally, in the U.S. various state agencies have concurrent jurisdiction arising under state law that regulate worker health and safety in both our industrial facilities and mines. If regulatory inspections result in an alleged violation, we may be subject to fines and penalties and, in instances of alleged significant violations, our mining operations or industrial facilities could be subject to temporary or extended closures. Refer to Exhibit 9595.1 to this annual report on Form 10-K for additional information regarding certain orders and citations issued by MSHA for our operations during the year ended December 31, 2018.2020.
Many other governmental bodies regulate other aspects of our operations, and our failure to comply with these legal requirements can result in substantial penalties. In addition, new laws and regulations, including executive orders, or changes to existing laws and regulations andor new interpretations of existing laws and regulations by courts or regulatory authorities occur regularly, but are difficult to predict. Changes under a new president, administration and Congress in the U.S. are also difficult to predict. Any such variations could negatively impact the mining sector, including our business, substantially increase costs to achieve compliance or otherwise could have a material adverse effect on our cash flow, results of operations and financial condition.
Our business is dependent upon information technology systems, which may be adversely affected by disruptions, damage, failure and risks associated with implementation and integration.
Our industry has become increasingly dependent on digital technologies. Our strategy of operating large, long-lived, geographically diverse assets has been increasingly dependent on our ability to become fully integrated and highly automated. Many of our business and operational processes are heavily dependent on traditional and emerging technology systems to conduct day-to-day operations, improve safety and efficiency, and lower costs.
As our dependence on information systems, including those of our third party service providers and vendors, grows, we become more vulnerable to an increasing threat of continually evolving cybersecurity risks.
Cybersecurity In recent years, cybersecurity incidents are increasinghave increased in frequency and magnitude. These incidents may include, but are not limited to, installation of malicious software, phishing, credential attacks, unauthorized access to data and other advanced
and sophisticated cybersecurity breaches and threats, including threats that increasingly target critical operational
technologies and process control networks. If any of these threats materialize, we could be subject to manipulation
or improper use of our systems and networks, production downtimes, communication interruption or other disruptions and delays to our operations or to the transportation of products or infrastructure utilized by our operations, unauthorized release of proprietary, commercially sensitive, confidential or otherwise protected information, the corruption of data, significant health and safety consequences, environmental damage, loss of intellectual property, fines and litigation, damage to our reputation or financial losses from remedial actions, any of which could have a material adverse effect on our cash flow, results of operations and financial condition. We have experienced targeted and non-targeted cybersecurity incidents in the past and may experience them in the future. While these cybersecurity incidents did not result in any material loss to us or interrupt our day-to-day operations, there can be no assurance that we will not experience any such losses in the future.
We believe we have implemented appropriate measures to mitigate potential risks. However, given Given the unpredictability of the timing and the evolving nature and scope of information technology disruptions, the various procedures and controls we use to monitor and protect against these threats and to mitigate our potential risks to such threats may not be sufficient in preventing cybersecurity incidents from materializing. Further, as cybersecurity threats continue to evolve, we may be required to expend significant additional resources to continue to modify or enhance our protective measures or to investigate and remediate vulnerabilities to cybersecurity threats.
We could also be adversely affected by system or network disruptions if new or upgraded information technology systems are defective, not installed properly or not properly integrated into our operations. Various measures have been implemented to manage our risks related to the system implementation and modification, but system modification failures could have a material adverse effect on our business, financial position and results of operations and could, if not successfully implemented, adversely impact the effectiveness of our internal controls over financial reporting.
Environmental and social risks
Our operations are subject to complex, evolving and increasingly stringent environmental laws and regulations. Compliance with environmental regulatory requirements involves significant costs and may constrain existing operations or expansion opportunities.
Our operations, both in the U.S. and internationally, are subject to extensive and complex environmental laws and regulations governing the generation, storage, treatment, transportation and disposal of hazardous substances; solid waste disposal; air emissions; wastewater discharges; remediation, restoration and reclamation of environmental contamination, including mine closures and reclamation; well plug and abandonment requirements; protection of endangered and protected species and designation of critical habitats; and other related matters. In addition, we must obtain regulatory permits and approvals to start, continue and expand operations.
Our Miami, Arizona, smelter processes approximately halfa significant portion of the aggregate copper concentrate produced by our North America copper mines. EPA regulations required us to invest approximately $230 million in 2017 for new pollution control equipment to reduce sulfur dioxide (SO2) to meet both regional haze requirements and to allow the Arizona Department of Environmental Quality (ADEQ) to demonstrate compliance with EPA’s SO2 ambient air quality standards. The new SO2 pollution control equipment was operational as of the January 1, 2018, deadline imposed byIn addition, EPA and the Miami smelter has been in compliance with both the regional haze requirements and the ADEQ rules. ADEQ also has two SO2 monitorsis currently in the Miami area that continually read ambient SO2 levels, and during 2018, there were several instances inprocess of revising the standards for hazardous air pollutants from primary copper smelters, which ADEQ’s monitors read SO2 levels that exceeded the specified level. We are engaged in discussions with ADEQ and conducting an ongoing investigation of the cause of the ambient levels.could impose additional requirements on our operations. We cannot guarantee that we will not be required to modify our systemsystems or install additional equipment to address findings, or reflect new requirements or for other reasons, which could result in significant costs, including increased capital expenditures and operating costs, and could adversely impact our business.
Laws such as CERCLA and similar state laws may expose us to joint and several liability for environmental damages caused by our operations, or by previous owners or operators of properties we acquired or are currently operating or at sites where we previously sent materials for processing, recycling or disposal. As discussed in more detail in the nextbelow risk factor - “We incur significant costs for remediating environmental conditions on properties that have not been operated in many years,” we have substantial obligations for environmental remediation on mining properties previously owned or operated by Freeport Minerals Corporation (FMC) and certain of its affiliates. Noncompliance with these laws and regulations could result in material penalties or other liabilities. In addition, compliance with these laws may from time to time result in delays in or changes to our development or expansion plans. Compliance with these laws and regulations imposes substantial costs, which we expect will continue to increase over time because of increased regulatory oversight, adoption of increasingly stringent environmental standards, as well asand other factors.
New or revised environmental regulatory requirements are frequently proposed, many of which result in substantially increased costs for our business, including those regarding financial assurance in the financial risk factorFinancial Risks above. For example, criteria for man-made organic compounds that could be present in soil, groundwater and surface water at our existing and former operations are currently under review by federal and state agencies, including drinking water regulation of Perfluorooctanesulfonic and Perfluorooctanoic acids proposed by EPA in February 2020 and a provisional National Pollutant Discharge Elimination strategy for permitting Per- and Polyfluoroalkyl substances proposed by EPA in November 2020.
In 2015, EPA and the Department of the Army (collectively, the Agencies) adopted rules that added remote “tributaries” into the regulatory definition of “waters of the United States” that are protected by the Clean Water Act, thereby imposing significant additional restrictions on land uses in remote areas with only tenuous connections to active waterways. These rules were challenged by multiple states and industry parties and litigation is ongoing. EPA has moved forward to rescindOn October 22, 2019, the Agencies published a final rule that repeals these 2015 rules and reconsiderrecodifies the regulations in place prior to adoption of the 2015 rules. EPA also published a proposed rule on February 14, 2019, which revises the definition of “waters of the United States” to clarify the scope of waters federally regulated under the Clean Water Act. A pre-publication version of a proposed revised definition of “waters ofThe final rule became effective on June 22, 2020, and is currently subject to multiple legal challenges. In connection with the United States” wasPresidential Executive Order issued on January 20, 2021 (the Executive Order), this final rule will be reviewed again by EPA and the U.S. Army Corps of Engineers in December 2018. If adopted in final form as proposed,Agencies. These rules define whether we need federal permitting requirementsauthorization under the Clean Water Act could be less stringent which would limit or eliminateto expand our need to obtain federal permits for future expansions at our operations in Arizona and New Mexico. However, there can be no assurance that the proposed revised definition will be adopted as proposed or that it will not be challenged by environmental groups.operations.
Regulations have been considered at various governmental levels to increase federal financial responsibility requirements both for mine closure and reclamation and for oil and gas decommissioning. In January 2019, legislative bills were introducedlegislation was enacted in both Colorado and New Mexico that would eliminate self-bonding andeliminates our ability to use parent company guarantees, for financial assurance for mine closure and reclamation activities. We are working to retain flexibility in financial assurance forms at our operations, but if enacted as proposed, we would be precluded from using parent company guarantees for any financial assurance obligations associated with our Colorado and New Mexico operations, which would result in increased costs. The legislative bill introduced in Colorado would also
requirerequires proof of an end date for water treatment as a condition of permit issuance authorizing mining operations, with some exceptions for existing operations. Also in January 2019, legislation was proposed in New Mexico that would require water quality standards to be applied at the point of discharge to groundwater. Adoption of these or similar new environmental regulations or more stringent application of existing regulations may materially increase our costs, threaten certain operating activities and constrain our expansion opportunities. In 2018, EPA concluded a rulemaking that considered the need for financial responsibility for hardrock mining operations under CERCLA by publishing its determination that it did not intend to require financial responsibility for the hardrock mining industry sector. In connection with the Executive Order, EPA will review this final action.
Our mining operations are subject to regulations under the Endangered Species Act (ESA) that are intended to protect species listed by the Department of Interior’s Fish & Wildlife Service (FWS) as endangered or threatened, along with critical habitat designated by FWS for these listed species. The regulations limit the ability of landowners, including us, to obtain federal permits or authorizations needed for expansion of our operations, and may also affect our ability to obtain, retain or deliver water to some operations. These regulations were revised in 2016 to expand the ability ofOn August 27, 2019, FWS to designate critical habitat in areaspublished final rules that are not occupied by a listed species. As part of its plan to modernize the implementation of the ESA, the FWS issued proposed rules in July 2018 that, if finalized, could mitigate, but do not eliminate, potential regulatory constraints on mining operations under the ESA and change some aspectson December 16, 2020, FWS published revisions to its definition of critical habitat. On December 18, 2020, FWS published a final rule governing exclusion of areas from critical habitat based on a discretionary exclusion analysis. In connection with the revised regulations adopted in 2016.Executive Order, these rules will be reviewed again by FWS. FWS is also evaluating whetherreconsidering the listing of certain species should still be listed under the ESA, and reconsideringdesignation of critical habitat that was proposed but never finalized. Environmental groups have aggressively challenged FWS’s regulatory reforms.for several listed species. No assurances can be made that restrictions relating to conservation will not have an adverse impact on expansion of our operations or not result in delays in project development, constraints on exploration and constraints on operations in impacted areas.
We incurred environmental capital expenditures and other environmental costs (including our joint venture partners’ shares) to comply with applicable environmental laws and regulations that affect our operations totaling $0.4$0.3 billion in 2018, $0.5 billion in 20172020 and $0.4 billion in 2016.both 2019 and 2018. For 2019,2021, we expect to incur approximately $0.5$0.4 billion of aggregate environmental capital expenditures and other environmental costs. The timing and amounts of estimated payments
could change as a result of changes in regulatory requirements, changes in scope and costs of reclamation and plug and abandonment activities, the settlement of environmental matters and the rate at which actual spending occurs on continuing matters.
We incur significant costs for remediating environmental conditions on properties that have not been operated in many years.
FMC and its subsidiaries, and many of their affiliates and predecessor companies, have been involved in exploration, mining, milling, smelting and manufacturing in the U.S. for more than a century. Activities that occurred in the late 19th century and the 20th century prior to the advent of modern environmental laws were not subject to environmental regulation and were conducted before American industrial companies fully understood the long-term effects of their operations on the surrounding environment.
With the passage of CERCLA in 1980, companies like FMC became legally responsible for remediating hazardous substances released into the environment from properties owned or operated by them as well as properties where they arranged for disposal of such substances, irrespective of when the release to the environment occurred or who caused it. That liability is often asserted on a joint and several basis with other prior and subsequent owners, operators and arrangers, meaning that each owner or operator of the property is, and each arranger may be, held fully responsible for the remediation, although in many cases some or all of the other responsible parties no longer exist, do not have the financial ability to respond or cannot be found. As a result, because of our acquisition of FMC in 2007, many of the subsidiary companies we now own are potentially responsible for a wide variety of environmental remediation projects throughout the U.S., and we expect to spend substantial sums annually for many years to address those remediation issues. We are also subject to claims where the release of hazardous substances is alleged to have damaged natural resources. At December 31, 2018,2020, we had more than 100 active remediation projects in 2624 U.S. states. In addition, FMC and certain affiliates and predecessor companies were parties to agreements relating to the transfer of businesses or properties that contained indemnification provisions relating to environmental matters, and from time to time these provisions become the source of claims against us.
At December 31, 2018,2020, we had $1.5$1.6 billion recorded in our consolidated balance sheet for environmental obligations attributable to CERCLA or analogous state programs and for estimated future costs associated with environmental matters at closed facilities or closed portions of operating facilities.
Our environmental obligation estimates are primarily based upon:
•Our knowledge and beliefs about complex scientific and historical facts and circumstances that in many cases occurred many decades ago;
•Our beliefs and assumptions regarding the nature, extent and duration of remediation activities that we will be required to undertake and the estimated costs of those remediation activities, which are subject to varying interpretations; and
•Our beliefs regarding the requirements that are imposed on us by existing laws and regulations and, in some cases, the clarification of uncertain regulatory requirements that could materially affect our environmental obligation estimates.
Significant adjustments to these estimates are likely to occur in the future as additional information becomes available. The actual environmental costs may exceed our current and future accruals for these costs, and any such changes could be material.
In addition, remediation standards imposed by EPA and state environmental agencies have generally become more stringent over time and may become even more stringent in the future. Imposition of more stringent remediation standards, particularly for arsenic and lead in soils, poses a risk that additional remediation work could be required at our active remediation sites and at sites that we have already remediated to the satisfaction of the responsible governmental agencies, and may increase the risk of toxic tort litigation.
EPA is considering how to reduce lead exposure in the environment under multiple environmental programs. Certain federal and state health agencies also support lower lead cleanup levels. The timing for these EPA activities is unclear, but any reduction in lead cleanup levels could result in material increases to our environmental reserves for ongoing residential property cleanup projects near former smelter sites.
Refer to Note 12 for further discussion of our environmental obligations.
Our Indonesia mining operations create difficult and costly environmental challenges, and future changes in environmental laws, or unanticipated environmental impacts from those operations, could require us to incur increased costs.
Mining operations on the scale of our Indonesia operations involve significant environmental risks and challenges. Our primary challenge is to dispose of the large amount of crushed and ground rock material, called tailings, that results from the process by which we physically separate the copper-, gold- and silver-bearing materials from the ore that we mine. In 2020, PT-FI produced approximately 30 million metric tons of tailings. Our tailings management plan, which has been approved by the IndonesianIndonesia government, uses the unnavigable river system in the highlands near our mine to transport the tailings to an engineered area in the lowlands where the tailings and natural sediments are managed in a deposition area. Lateral levees have been constructed to help contain the footprint of the tailings and to limit their impact in the lowlands.
Another major environmental challenge is managing overburden, which is the rock that must be moved aside in the mining process to reach the ore. In the presence of air, water and naturally occurring bacteria, some overburden can generate acid rock drainage, or acidic water containing dissolved metals that, if not properly managed, can adversely affect the environment. In addition, certain overburden stockpiles are subject to erosion caused by the large amounts of rainfall, with the eroded stockpile material eventually being deposited in the lowlands tailings management area; this additional material influencesarea. Certain of the deposition of finer sediment material in the estuary, as well as presents the potential for increased environmental impacts. The Grasberg overburden stockpiles have experienced significant erosion, over time, exacerbated in 2011 by unanticipated work stoppages that adversely affected our ability to properly manage certainthese overburden stockpiles. TheThis overburden affects the volume as well as the physical and chemical characteristics of the sediment material deposited in the lowlands tailings management area, resulting in increased environmental impacts. PT-FI’s current tailings deposition management plan as well as environmental monitoring programs take into account the presence of this overburden in the lowlands tailings management area. As part of its management and monitoring program, PT-FI expanded the scope of its studies and analysis to assess the environmental and potential human health impacts resulting from the overburden erosion, including conducting and updating risk assessments to determine what additional monitoring and mitigation efforts such impacts may require in the future, which will result in increased costs that could be significant.
In the past, certain IndonesianIndonesia government officials have raised questions with respect to our tailings and overburden management plans, including a suggestion that we implement a pipeline system rather than the river transport system for tailings management and disposition. Because our Indonesia mining operations are remotely located in steep mountainous terrain and in an active seismic area, a pipeline system would be costly, difficult to construct and maintain, and more prone to catastrophic failure, and could therefore involve significant potentially
adverse environmental issues. Based on our own studies and others conducted by third parties we do not believe that a pipeline system is necessary or practical.
We cannot guarantee that we will not have overtopping or levee failure caused by extreme weather events or unanticipated structural failure in the future, which could result in flooding of the nearby communities. If flooding were to occur, it could result in loss of lives, and severe personal, property and environmental damages, which could necessitate evacuation or relocation of communities or other emergency action, financial assistance to the communities impacted, and remediation costs to repair and compensate for the social, cultural and economic impacts.
In October 2017,December 2018, Indonesia’s Ministry of Environment and Forestry (the MOEF) notified PT-FI of administrative sanctions related to certain activities that it indicated are not reflected in PT-FI’s environmental permit. The MOEF also notified PT-FI that certain operational activities were inconsistent with factors set forth in PT-FI’s environmental permitting studies and that additional monitoring and improvements need to be undertaken related to air quality, water drainage, treatment and handling of certain wastes, and tailings management. In April 2018, the MOEF issued decrees imposing unattainable environmental standards related to PT-FI’s controlled riverine tailings management system. The decrees included a six-month transition period and conflicted with PT-FI’s approved environmental management programs and existing environmental permits. In December 2018, the MOEF(MOEF) issued a revised environmental permit to PT-FI to address many of the operational activities that it alleged were inconsistent with earlier studies. The remaining administrative sanctions are being resolved through adoption of revised practices and, in a few situations, PT-FI has agreed with the MOEF on an appropriate multi-year work plan, including the closure of an overburden stockpile.
PT-FI and the MOEF also established a new framework for continuous improvement in environmental practices in PT-FI’s operations, including initiatives that PT-FI will pursue to increase tailings retention and to evaluate large-scalelarge scale beneficial uses of tailings within Indonesia. TheIn addition, PT-FI continues to work with MOEF issued a new decree that incorporates various initiativesto finalize environmental permitting related to the rail facilities and studiescertain of the underground mining production operations as well as permitting for the extension of levees to be completed by PT-FI during 2019 targeting continuous improvementcontain the lateral flow of tailings in a manner that would not impose new technical risks or significant long-term costs to PT-FI’s operations. The new framework enables PT-FI to maintain compliance with site-specific standards and provides for ongoing monitoring by the MOEF.lowlands. Refer to Note 12 for further discussion.
We cannot assure you that future environmental changes affecting the mining industry in Indonesia will not be introduced or unexpectedly altered or repealed, or that new interpretations of existing environmental laws and regulations will not be issued, which might have a significant impact on PT-FI.
Our copper mining operations require significant energy and regulation of greenhouse gas (GHG) emissions and climate change issues may increase our costs and adverselyaffect our operations.
Our copper mining operations require significant energy, principally diesel, electricity, coal and natural gas, mostmuch of which is from fossil fuel sources, and is obtained from third parties under long-term contracts. Energy represented approximately 2016 percent of our copper mine site operating costs in 2018,2020, and areis expected to approximate 2018 percent in 2021. The principal sources of energy consumption at our mining operations are: diesel fuel, which powers mine trucks and other transportation equipment; purchased electricity, which powers core facilities and certain on-site metal processing operations; and coal and natural gas, which provides electricity at certain operations.
In certain aspects of our copper mine site operating costs in 2019.
Carbon-based energyoperations, our ability to reduce our GHG emissions is adirectly dependent on the actions of third parties, and our ability to make significant, inputrapid changes in our GHG emissions in response to potential future regulations may be limited. For example, GHG emissions from our diesel-fueled mine trucks make up the majority of our Scope 1 GHG emissions at our North America and South America operations, although haul truck diesel usebut reduction of emissions from mine trucks will depend upon the development of alternative-fueled mining equipment by our third-party suppliers. In addition, while we strive to purchase renewable power for our mining operations, as a commercial consumer of power, our ability to reduce our Scope 2 GHG emissions associated with our power demand is dependent upon the mix of our suppliers and the amountlocally-available renewable energy resources. As a result, we could face additional costs associated with any new regulation of purchased power that is derived from fossil fuel or renewable sources varies significantly depending on site productionGHG emissions, and country-specific circumstances. The potential physical impacts of climate change onour ability to modify our operations are highly uncertain, and would vary by operation based on particular geographic circumstances. to avoid these costs may be limited in the near term.
As a result of the Paris Agreement reached during the 21st Conference of the Parties to the United Nations Framework Convention on Climate Change in 2015, a number of governments have pledged “Nationally Determined Contributions” to control and reduce greenhouse gasGHG emissions. Under the new presidential administration, the U.S. re-joined the Paris Agreement in January 2021, which may result in a renewed focus on policies to reduce GHG emissions at the federal level. In the U.S., several states, including Colorado and New Mexico, have advanced goals reducing or eliminating fossil-fuel based energy production. Transitions to renewable and other energy sources could, among other things, increase our operating and energy costs depending on the scope, magnitude, and magnitudetiming of increased regulation of fossil-fuel based energy production, including greenhouse gasGHG emissions.
The physical impacts of climate change may adversely affect our copper mining operations.
The potential physical impacts of climate change on our operations are highly uncertain, and would vary by operation based on particular geographic circumstances. At many of our copper mine sites, climate change is projected to impact local precipitation regimes, resulting in shorter-duration, higher-intensity storm events, and the potential for less precipitation overall. We could face increased operational costs associated with managing additional volumes of storm water during more intense future events. In addition, the potential for overall decreases in precipitation could affect the availability of water needed for our operations, leading to increased operating costs, or in extreme cases disruptions to mining operations.
As part of our commitment to implementing the Tailings Standard, we will be required to consider uncertainties due to climate change, incorporate that assessment into the relevant knowledge base for our tailings facilities, use this knowledge base to enhance the resilience of our approach to the impacts of climate change using an adaptive management approach, incorporate that knowledge into facility operations, and take measures to mitigate both environmental impact and potential failure risks at our tailings facilities, including those arising from climate change. To the extent these obligations require future changes at our tailings facilities, it could increase our operational expenses or require further capital investments.
Increasing scrutiny and evolving expectations from stakeholders with respect to our ESG practices, performance and disclosures may impact our reputation and business and impose additional costs on us.
There is increased scrutiny from stakeholders related to our ESG practices, performance and disclosures, including prioritization of sustainable and responsible production practices, decarbonization and reduction of our carbon footprint, tailings stewardship and social license to operate among others in the jurisdictions where we operate. We have adopted certain policies and programs as highlighted in our Annual Report on Sustainability, including with respect to responsible production frameworks, climate change, water stewardship, biodiversity, tailings management and stewardship, waste management, safety and health, human capital management, human rights, social performance and community and Indigenous People relations, and responsible sourcing. It is possible,
however, that our stakeholders might not be satisfied with our ESG practices, performance and/or disclosures, or the speed of their adoption, implementation and measurable success. If we do not meet our evolving stakeholders’ expectations, our reputation, our access to and cost of capital, and our stock price could be negatively impacted.
In addition, our customers and end users may require that we implement certain additional ESG procedures or standards before they will start or continue to do business with us, which could lead to preferential buying based on our ESG practices compared to our competitors’ ESG practices.
Investor advocacy groups, certain institutional investors, investment funds, creditors and other influential investors are increasingly focused on our ESG practices and in recent years have placed increasing importance on the implications of their investments. Organizations that provide information to investors on ESG performance and related matters have developed quantitative and qualitative data collection processes and ratings processes for evaluating companies on their approach to ESG matters. Such ratings are used by some investors to inform their investment and voting decisions. Unfavorable ratings or assessment of our ESG practices may lead to negative investor sentiment toward us, which could have a negative impact on our stock price and our access to and cost of capital. Additionally, if we do not adapt to or comply with investor or stakeholder expectations and standards, which are evolving, or if we are perceived to have not responded appropriately, regardless of whether there is a legal requirement to do so, we may suffer from reputational damage and our business, financial condition, and/or stock price could be materially and adversely affected.
Failure or perceived failure to manage our relationships with the communities where we operate, including communities that are adjacent to or near our operations and Indigenous People, could harm our reputation and social license to operate.
Our relationships with the communities where we operate, including communities that are adjacent to or near our operations and Indigenous People, are critical to the long-term success of our existing operations and the development of any future projects. There is an ongoing and potentially increasing public concern relating to social license to operate and the perceived effect of mining activities on the environment and on communities impacted by such activities. We may engage in activities, such as exploration, production, construction or expansion of our operations that have or are perceived to have adverse impacts on the local communities and their relevant stakeholders, society as a whole, Indigenous Peoples, cultural heritage, human rights and the environment. For example, our operations may take place on or adjacent to Indigenous Peoples’ territories. We may be required or expected by our stakeholders to consult with and/or obtain consent from Indigenous Peoples with respect to these operations. In addition, our assets are generally long-lived and perceptions and expectations from stakeholders can change over the life of the mine. Changes in the aspirations and expectations of local communities where we operate, including Indigenous Peoples, with respect to our contributions to employee health and safety, infrastructure, community development, environmental management and other factors could affect our social license to operate and reputation and lead to increased costs and reduced future earnings if expansions or new projects are blocked either temporarily or for extended periods. Failure to effectively engage with communities on an ongoing basis, including the withdrawal of consent or support of Indigenous Peoples, or other stakeholders, could adversely impact our business, damage our reputation and/or result in loss of rights to explore, operate or develop our projects.
Other risks
Our holding company structure may impact our ability to service debt and our stockholders’ ability to receive dividends.
We are a holding company with no material assets other than the capital stock and intercompany receivables of our subsidiaries. As a result, our ability to repay our indebtedness and pay dividends is dependent on the generation of cash flow by our subsidiaries and their ability to make such cash available to us, by dividend, loan, debt repayment or otherwise. Our subsidiaries do not have any obligation to make funds available to us to repay our indebtedness or pay dividends. Dividends from subsidiaries that are not wholly owned are shared with other equity owners. Cash at our international operations is also typically subject to foreign withholding taxes upon repatriation into the U.S.
In addition, our subsidiaries may not be able to, or be permitted to, make distributions to us or repay loans to us, to enable us to repay our indebtedness or pay dividends. Each of our subsidiaries is a distinct legal entity and, under certain circumstances, legal restrictions, as well as the financial condition and operating requirements of our subsidiaries, may limit our ability to obtain cash from our subsidiaries. Certain of our subsidiaries are parties to
credit agreements that restrict their ability to make distributions or loan repayments to us if such subsidiary is in default under such agreements, or to transfer substantially all of the assets of such subsidiary without the consent of the lenders.
Our rights to participate in any distribution of our subsidiaries’ assets upon their liquidation, reorganization or insolvency would generally be subject to the prior claims of the subsidiaries’ creditors, including any trade creditors.
Anti-takeover provisions in our charter documents and Delaware law may make an acquisition of us more difficult.
Anti-takeover provisions in our charter documents and Delaware law may make an acquisition of us more difficult. These provisions:
•Authorize the Board to issue preferred stock without stockholder approval and to designate the rights, preferences and privileges of each class; if issued, such preferred stock would increase the number of outstanding shares of our capital stock and could include terms that may deter an acquisition of us;
•Establish advance notice requirements for nominations to the Board or for proposals that can be presented at stockholder meetings;
•Limit who may call stockholder meetings;meetings and establish information requirements and timing restrictions for meeting requests;
•Require the approval of the holders of two thirds of our outstanding common stock to enter into certain business combination transactions, subject to certain exceptions, including if the consideration to be received by our common stockholders in the transaction is deemed to be a fair price.price; and
•Provide to the fullest extent permitted by law that unless FCX consents in writing to the selection of an alternative forum, the Court of Chancery of the State of Delaware (or, if the Court of Chancery does not have, or declines to accept, jurisdiction, the United States District Court for the District of Delaware) will be the sole and exclusive forum for any (i) derivative action or proceeding brought on behalf of FCX, (ii) action asserting a claim that is based upon a violation of a duty by a current or former director, officer, employee or stockholder of FCX in such capacity, (iii) action asserting a claim arising pursuant to any provision of the Delaware General Corporation Law or to which the Delaware General Corporation Law confers jurisdiction upon the Court of Chancery of the State of Delaware, (iv) action asserting a claim governed by the internal affairs doctrine, or (v) action asserting an “internal corporate claim” as that term is defined in Section 115 of the Delaware General Corporation Law.
These provisions may discourage potential takeover attempts, discourage bids for our common stock at a premium over market price or adversely affect the market price of, and the voting and other rights of the holders of, our common stock. These provisions could also discourage proxy contests and make it more difficult for stockholders to elect directors other than the candidates nominated by the Board.
The choice of forum provision may increase costs to bring a claim, discourage claims or limit a stockholder’s ability to bring a claim in a judicial forum that it finds favorable for disputes with FCX or its directors, officers or other employees, which may discourage such lawsuits against FCX or its directors, officers and other employees. Alternatively, if a court were to find the choice of forum provision contained in FCX’s By-laws to be inapplicable or unenforceable in an action, FCX may incur additional costs associated with resolving such action in other jurisdictions. The exclusive forum provision in FCX’s By-laws will not preclude or contract the scope of exclusive federal or concurrent jurisdiction for actions brought under the federal securities laws including the Securities Exchange Act of 1934, as amended, or the Securities Act of 1933, as amended, or the respective rules and regulations promulgated thereunder.
In addition, because we are incorporated in Delaware, we are governed by the provisions of Section 203 of the Delaware General Corporation Law, which may prohibit large stockholders from consummating a merger with, or acquisition of, us.
These provisions may deter an acquisition of us that might otherwise be attractive to our stockholders.
Item 1B. Unresolved Staff Comments.
Not applicable.
Item 3. Legal Proceedings.
We are involved in numerousBelow is a discussion of our material pending legal proceedings that arisenot otherwise required to be disclosed in our Notes to Consolidated Financial Statements. Refer to Note 12 for a discussion of other material pending legal proceedings.
In addition to the ordinary course of our business ormaterial pending legal proceedings discussed below and in Note 12, we are associated with environmental issues. We are also involved periodically in reviews, inquiries, investigationsordinary routine litigation incidental to our business and other proceedings initiated by or involving government agencies,not required to be disclosed, some of which may result in adverse judgments, settlements, fines, penalties, injunctions or other relief.
United States (U.S.) Securities and Exchange Commission (SEC) regulations require us to disclose environmental proceedings involving a governmental authority if we reasonably believe that such proceedings may result in monetary sanctions above a stated threshold. Pursuant to the SEC regulations, we use a threshold of $1 million for purposes of determining whether disclosure of any such environmental proceedings is required.
Management does not believe, based on currently available information, that the outcome of any currently pending legal proceeding will have a material adverse effect on our financial condition; although individual or cumulative outcomes could be material to our operating results for a particular period, depending on the nature and magnitude of the outcome and the operating results for the period.
Below is a discussion of our material legal proceedings not otherwise required to be disclosed in Note 12. Refer to Note 12 for discussion of additional material legal proceedings.
Water Rights Adjudications
Our operations in the western United States (U.S.)U.S. require significant secure quantities of water for mining and ore processing activities, and related support facilities. Continuous operation of our mines is dependent on, among other things, our ability to maintain our water rights and claims and the continuing physical availability of the water supplies. In the arid western U.S., where certain of our mines are located, water rights are often contested, and disputes over water rights are generally time-consuming, expensive and not necessarily dispositive unless they resolve both actual and potential claims. The loss of a water right or a currently available water supply could force us to curtail operations, or force premature closures, thereby increasing and/or accelerating costs or foregoing profitable operations.
At our North America operations, certain of our water supplies are supported by surface water rights, which give us the right to use public waters for a statutorily defined beneficial use at a designated location. In Arizona, where our operations use both surface and groundwater, we are a participant in an active general stream adjudication in which Arizona courts have been attempting, for over 4045 years, to quantify and prioritize surface water claims for the Gila River system, one of the state’s largest river systems. This streamGila River adjudication primarily affects our Morenci, Safford and Sierrita mines. The Gila River adjudication is addressing the state law claims of thousands of competing users, including us, as well as significant federal water claims that are potentially adverse to the state law claims of both surface water and groundwater users. Groundwater is treated differently from surface water under Arizona law, which historically allowed land owners to pump unlimited quantities of subsurface water, subject only to the requirement of putting it to “reasonable use.” However, court decisions in the adjudication have concluded that some undergroundsubsurface water constitutes “subflow” that is to be treated legally as surface water and is therefore subject to the Arizona doctrine of prior appropriation and to the adjudication, and potentially unavailable to groundwater pumpers, including us, in the absence of valid surface water claims. Any re-characterization of groundwater as surface water could affect the ability of consumers, farmers, ranchers, municipalities, and industrial users like us to continue to access water supplies that have been relied on for decades. Because we are a user of both groundwater and surface water in Arizona, we are an active participant in the adjudication proceeding.Gila River adjudication.
In Re The General Adjudication of All Rights to Use Water in the Gila River System and Sources, Maricopa County, Superior Court, Cause Nos. W-1 (Salt), W-2 (Verde), W-3 (Upper Gila), and W-4 (San Pedro). This case was originally initiated in 1974 with the filing of a petition with the Arizona State Land Department and was consolidated and transferred to the Maricopa County Superior Court in 1981. The principal parties, in addition to us, include: Arizona Public Service Company, ASARCO, LLC; BHP Copper, Inc; the state of Arizona; various cities and towns and water companies; the Gila Valley Irrigation District; the Franklin Irrigation District; the San Carlos Irrigation and Drainage District; the Salt River Project; the San Carlos Apache Tribe; the Gila River Indian Community (GRIC);Community; and the U.S. on behalf of those tribes, on its own behalf, and on behalf of the White Mountain Apache Tribe, the Fort
McDowell Mohave-Apache Indian Community, the Salt River Pima-Maricopa Indian Community, and the Payson Community of Yavapai Apache Indians.
Prior to January 1, 1983, various Indian tribes filed separate suits in the U.S. District Court in Arizona claiming superior rights to water being used by many other parties, including us, and claiming damages for prior use in derogation of their allegedly superior rights. These federal proceedings have been stayed in favor of the adjudications pending thein Arizona Superior Court adjudicationsstate courts, and some of the federal suits have since been settled.
In 2005, the Maricopa County Superior Court directed the Arizona Department of Water Resources (ADWR) to prepare detailed recommendations regarding the delineation of the “subflow” zone of the San Pedro River, a tributary of the Gila River. UndergroundSubsurface water within the subflow zone is presumed to constitute appropriable subflow rather than groundwater. Although we have minimal interests in the San Pedro River Basin, a decision that re-characterizes groundwater in that basin as appropriable surface watersubflow may set a precedent for other river systems in Arizona that could have material implications for many commercial, industrial, municipal and agricultural users of groundwater, including our Arizona operations. In 2017, the court approved ADWR’s proposed subflow zone delineation.maps; water pumped from wells located inside the mapped subflow zone is now presumed to be appropriable subflow. No party has appealed that decision.
In 2014, ADWR submitted a proposal for the development of procedures for “cone of depression” analyses to determine whether a well located outside of the subflow zone creates a cone of depression that intersects the subflow zone. Based on thethese cone of depression analyses, wells outside of the subflow zone could be subject to the jurisdiction of the adjudication court.adjudications pending in Arizona state courts. In the absence of a valid surface water claim to support the pumping, owners
of wells deemed to be depleting the subflow zone through their cones of depression may be subject to claims that they must refrain from pumping subflow or must pay damages. In January 2017, ADWR issued a report containing its recommended cone of depression test, and a trial was held in March 2018 concerning ADWR’s recommended action.
On November 14, 2018, the court’s Special Master for the Gila River adjudication issued a final decision rejecting ADWR’s recommended cone of depression test, instead adopting our position that a numeric model capable of accounting for complexities of the aquifer system should be used. The Special Master also confirmed that this initialthe cone of depression test isinstead would be an initial test for determining which wells are subject to the jurisdiction of the adjudication court, notadjudications, rather than proving that a well is pumping subflow or establishing how much of a well’s water production is subflow. ThoseSuch matters will be determined by a subsequent “subflow depletion test,” which has not yet been formulated. OurSome of our adversaries are expectedobjected to seek review of the Special Master’s November 2018 final decision. Objections must be fileddecision, and the Arizona Superior Court heard oral argument on the objections in February 2020. This issue remains under advisement with the Arizona Superior Court in May 2019.Court.
In response to the Special Master’s decision, in December 2018, ADWR submitted its initial report on the “subflow depletion test,” which will specify the methodology a well owner must use to quantify the portion of the water drawn from a well that is subflow as opposed to groundwater. A status conference has beengroundwater; however, ADWR remains in the process of developing its proposed subflow depletion test. We, along with the other parties, will have the opportunity to provide input throughout the process. The first issue being litigated concerning the subflow depletion test is scheduled for trial in February 2019 to identify issues2021, and we are among the active litigants.
In June 2020, the Special Master designated legal questions to be addressed during this phase ofresolved concerning a well owner’s ability to obtain a surface water right for subsurface water that is ultimately determined to be appropriable subflow. The parties will be briefing these issues in January and February 2021, and the litigation and to discuss future case deadlines.Special Master has scheduled a trial for April 2021.
As part of the Gila River adjudication,adjudications, the U.S. has asserted numerous claims for express and implied “reserved” surface water and groundwater rights on Indian and non-Indian federal lands throughout Arizona. These claims are related to reservations of federal land for specific purposes (e.g., Indian reservations, national parks, military bases and wilderness areas). Unlike state law-based water rights, federal reserved water rights are given priority in the prior appropriation“prior appropriation” system based on the date the land was reserved, not the date that water was first used on the land. In addition, federal reserved water rights if recognized by the court, may enjoy greater protection from groundwater pumping than is accorded to state law-based water rights.
In multiple instances, the U.S. asserts a right to all water in a particular watershed that was not effectively appropriated under state law prior to the establishment of the federal reservation. This creates risks for both surface water users and groundwater users because such expansive claims may severely impede competing uses of water
within the same watershed. Because there are numerous federal reservations in watersheds across Arizona, the reserved water right claims of the U.S. pose a significant risk to multiple operations, including Morenci and Safford in the Upper Gila River watershed, and Sierrita in the Santa Cruz watershed. Because federal reserved water rights may adversely affect water uses at each of these operations, we have been actively involved in litigation over these claims. Because federal reserved water rights have not yet been quantified, the task of determining how much water each federal reservation may use has been left to the Arizona Superior Court handling the Gila River adjudication court.adjudication. Several “contested cases” to quantify reserved water rights for particular federal reservations in Arizona are currently pending in the adjudication andwith only one was recently resolved.resolved at this time. That case, In re Aravaipa Canyon Wilderness Area, was to resolve the U.S.’s claims to water for the Aravaipa Canyon Wilderness Area. The case was tried in 2015 and the court issued a decision in December 2018 supportive of our position on almost all issues, including rejection of the government’sU.S.’s core argument that wilderness areas are entitled to all water that was not appropriated at the time the reservation was created. We believe the rulings in this case will support our positions in other pending federal reserved water right cases, including these: In re Fort Huachuca, which involves the U.S.’s claims to water for an Arizona army base and is awaiting a decision following a trial which concluded in February 2017;In re Redfield Canyon Wilderness Area, which involves the U.S.’s claims to water for another wilderness area and is awaiting a decision following a trial which concluded in May 2017; and In re San Pedro Riparian National Conservation Area, which involves the U.S.’s claims to water for a national conservation area and is awaiting a decision following a trial which is currentlyconcluded in trial.May 2018.
Given the legal and technical complexity of these adjudications, their long history, and their long-term legal, economic and political implications, it is difficult to predict the timing or the outcome of these proceedings. If we are not able to satisfactorily resolve the issues being addressed in the adjudications, our ability to pump groundwater could be diminished or curtailed, and our operations at Morenci, Safford and Sierrita could be adversely affected unless we are able to acquire alternative resources.
Environmental Legal Proceedings
Louisiana Parishes Coastal Erosion Cases
Certain FCX affiliates have been named as defendants, along with numerous co-defendants, in 13 cases out of a total of 42 cases filed in Louisiana state courts by six south Louisiana parishes (Cameron, Jefferson, Plaquemines, St. Bernard, St. John the Baptist and Vermilion), alleging that certain oil and gas exploration and production
operations and sulphur mining and production operations in coastal Louisiana have contaminated and damaged coastal wetlands, and caused significant land loss along the Louisiana coast, resulting in increased risk of damage from storm-generated surges and flooding and accelerated saltwater intrusion. The State of Louisiana, through the Attorney General and separately through the Louisiana Department of Natural Resources, has intervened in the litigation in support of the parishes’ claims. Specifically, the cases allege the defendants failed to obtain and/or comply with required coastal use permits in violation of the Louisiana State and Local Coastal Resources Management Act of 1978, and seek unspecified damages for the alleged statutory violations, and restoration of the properties at issue to their original condition. Five of the 42 cases were previously scheduled for trials in state courts beginning in early 2019; however, the state court proceedings have been stayed while federal courts in the Eastern and Western Districts of Louisiana consider the defendants’ second effort to remove the cases from state courts to federal courts. Certain FCX affiliates have been named as defendants in two of the five cases that had been set for trial, both originally filed on November 8, 2013: Parish of Plaquemines v. ConocoPhillips Company et al, 25th Judicial District Court, Plaquemines Parish, Louisiana; No. 60-982, Div. B, which was set for jury trial in state court in August 2019; and Parish of Plaquemines v. Hilcorp Energy Company et al, 25th Judicial District Court, Plaquemines Parish, Louisiana; No. 60-999, Div. B, which was set for jury trial in state court in January 2020. Plaintiffs have not alleged specific monetary demands. FCX intends to vigorously defend these matters.
Item 4. Mine Safety Disclosures.
TheOur highest priority is the health, safety and well-being of our workforce. We believe that health of all employees is our highest priority. Management believes thatand safety and health considerations are integral to, and compatible with,fundamental for, all other functions in theour organization, and we understand that proper safety and health management will enhance production and reduce costs. Our approach towards the health and safety of our workforce is critical to continuously improve performanceour operational efficiency and long-term success. Our global health and safety approach, “Safe Production Matters,” is focused on fatality prevention and continuous improvement through implementingthe use of robust management systems, empowering safe work behaviors and providing adequate training,strengthening our safety incentive and occupational health programs.culture.
Our objective is to achieve zero work placeworkplace fatalities and to decrease injuries and occupational illnesses. We measure progress toward achieving our objective against regularly established benchmarks, including measuring company-wide Total Recordable Incident Rates (TRIR). Our TRIR (including contractors) per 200,000 man-hours worked was 0.69 in 2020, 0.74 in 2019 and 0.71 in 2018, 0.75 in 2017 and 0.64 in 2016.2018. The metal mining sector industry average per 200,000 man-hours worked reported by the U.S. Mine Safety and Health Administration was 1.741.81 in 20172019 and 1.931.68 in 2016.2018. The metal mining sector industry average for 20182020 was not available at the time of this filing.
Refer to Exhibit 95.1 for mine safety disclosures required in accordance with Section 1503(a) of the Dodd-Frank Wall Street Reform and Consumer Protection Act and Item 104 of Regulation S-K.
Information About our Executive Officers of the Registrant.Officers.
Certain information as of January 31, 2019,February 3, 2021, about our executive officers is set forth in the following table and accompanying text:
|
| | | | | | | | | | | | | |
| Name | | Age | | Position or Office |
| Richard C. Adkerson | | 7274 | | Vice Chairman of the Board President and Chief Executive Officer |
| Kathleen L. Quirk | | 5557 | | Executive Vice President and Chief Financial Officer |
Harry M. “Red” Conger, IV | | 63 | | President and Chief Operating Officer - Americas |
Richard C. Adkerson has served was appointed as Vice Chairman of the Board since June 2013, President since January 2008 and also from April 1997 to March 2007,in February 2021. He has served as Chief Executive Officer since December 2003 and has been a director since October 2006. Mr. Adkerson previously served as Vice Chairman of the Board from May 2013 to February 2021, President from January 2008 to February 2021 and also from April 1997 to March 2007, and Chief Financial Officer from October 2000 to December 2003.
Kathleen L. Quirk was appointed as President in February 2021 and has served as Executive Vice President since March 2007 and Chief Financial Officer since December 2003. Ms. Quirk previously served as Executive Vice President from March 2007 to February 2021, Treasurer from February 2000 to August 2018 and as Senior Vice President from December 2003 to March 2007. Ms. Quirk also serves on the Board of Directors of Vulcan Materials Company.
Harry M. “Red” Conger, IV has served as Chief Operating Officer - Americas since July 2015, and as President - Americas since 2007. Mr. Conger has also served as President and Chief Operating Officer - Rod and Refining since October 2014. He previously served as Chief Operating Officer - Africa Mining from July 2015 to December 2016. Prior to 2007, he served in a number of senior operations positions at Phelps Dodge Corporation.
PART II
Item 5. Market for Registrant’s Common Equity, Related Stockholder Matters and Issuer Purchases of Equity Securities.
Unregistered Sales of Equity Securities
None.
Common Stock
Our common shares trade on the New York Stock Exchange (NYSE) under the symbol “FCX.” At January 31, 2019,29, 2021, there were 12,52011,309 holders of record of our common stock.
Common Stock Dividends
In December 2015,March 2020, in response to the FCXCOVID-19 pandemic and resulting global economic uncertainties, our Board of Directors (the Board) suspended the annual common stock dividend. Accordingly, there were no common stock dividends paid in 2017 or 2016.FCX’s quarterly cash dividend of $0.05 per share. In February 2018,2021, the Board reinstated a cash dividend on our common stock. See Note 10stock at an annual rate of $0.30 per share. The Board intends to declare a quarterly dividend of $0.075 per share, with the initial quarterly dividend expected to be paid on May 3, 2021. The Board also adopted a new financial policy for further discussion.the allocation of cash flows aligned with our strategic objectives of maintaining a strong balance sheet, increasing cash returns to shareholders and advancing opportunities for future growth. The declaration of dividends is at the discretion of our Board and will depend upon our financial results, cash requirements, future prospects and other factors deemed relevant.relevant by our Board. See “Cautionary Statement,” and Notes 8 and 10 for further discussion.
Issuer Purchases of Equity Securities
The following table sets forth information with respect to shares of FCX common stock purchased by us during the three months ended December 31, 2018:2020:
| | | | | | | | | | | | | | | | | | | | | | | | | | |
| Period | | (a) Total
Number of
Shares Purchased | | (b) Average
Price Paid Per Share | | (c) Total Number of Shares Purchased as Part of Publicly Announced Plans or Programsa | | (d) Maximum Number of Shares That May Yet Be Purchased Under the Plans or Programsa |
| October 1-31, 2020 | | — | | | — | | | — | | | 23,685,500 | |
| November 1-30, 2020 | | 109,952 | | b | $ | 23.54 | | | — | | | 23,685,500 | |
| December 1-31, 2020 | | 145,926 | | b | $ | 24.95 | | | — | | | 23,685,500 | |
| Total | | 255,878 | | | $ | 24.35 | | | — | | | 23,685,500 | |
|
| | | | | | | | | | | | |
Period | | (a) Totala.We have a Board-approved open-market share purchase program for up to 30 million shares, which does not have an expiration date.
b.Consists of shares acquired in connection with stock option exercises during the periods shown.
Number of
Shares Purchased
| | (b) Average
Price Paid Per Share
| | (c) Total Number of
Shares Purchased as Part of Publicly Announced Plans or Programsa
| | (d) Maximum Number of Shares That May
Yet Be Purchased Under the Plans or Programsa
|
October 1-31, 2018 | | — |
| | — |
| | — |
| | 23,685,500 |
|
November 1-30, 2018 | | — |
| | — |
| | — |
| | 23,685,500 |
|
December 1-31, 2018 | | — |
| | — |
| | — |
| | 23,685,500 |
|
Total | | — |
| | — |
| | — |
| | 23,685,500 |
|
| |
a. | On July 21, 2008, the Board approved an increase in our open-market share purchase program for up to 30 million shares. The program does not have an expiration date. |
Item 6. Selected Financial Data.
FREEPORT-McMoRan INC.
SELECTED FINANCIAL AND OPERATING DATAReserved.
|
| | | | | | | | | | | | | | | | | | | | |
| | Years Ended December 31, | |
| | 2018 | | 2017 | | 2016 | | 2015 | | 2014 | |
| CONSOLIDATED FINANCIAL DATA | (In millions, except per share amounts) | |
| Revenues | $ | 18,628 |
| | $ | 16,403 |
| | $ | 14,830 |
| a | $ | 14,607 |
| a | $ | 20,001 |
| a |
Operating income (loss)b | $ | 4,754 |
| c,d | $ | 3,690 |
| e | $ | (2,729 | ) | f | $ | (13,512 | ) | g | $ | (298 | ) | h |
| Net income (loss) from continuing operations | $ | 2,909 |
| i,j,k,l | $ | 2,029 |
| i,j,k | $ | (3,832 | ) | j,k | $ | (12,180 | ) | l | $ | (1,022 | ) | j,k |
Net (loss) income from discontinued operationsm | $ | (15 | ) | | $ | 66 |
| | $ | (193 | ) | | $ | 91 |
| | $ | 277 |
| |
| Net income (loss) attributable to common stock | $ | 2,602 |
| | $ | 1,817 |
|
| $ | (4,154 | ) | n | $ | (12,236 | ) |
| $ | (1,308 | ) |
|
| Diluted net income (loss) per share attributable to common stock: | | | | | | | | | | |
| Continuing operations | $ | 1.79 |
| | $ | 1.21 |
| | $ | (2.96 | ) | | $ | (11.32 | ) | | $ | (1.37 | ) | |
| Discontinued operations | (0.01 | ) | | 0.04 |
| | (0.20 | ) | | 0.01 |
| | 0.11 |
| |
| | $ | 1.78 |
| | $ | 1.25 |
| | $ | (3.16 | ) | | $ | (11.31 | ) | | $ | (1.26 | ) | |
| Weighted-average common shares outstanding: | | | | | | | | | | |
| Basic | 1,449 |
| | 1,447 |
| | 1,318 |
| | 1,082 |
| | 1,039 |
| |
| Diluted | 1,458 |
| | 1,454 |
| | 1,318 |
| | 1,082 |
| | 1,039 |
| |
| Dividends declared per share of common stock | $ | 0.20 |
| | $ | — |
| | $ | — |
| | $ | 0.2605 |
| | $ | 1.25 |
| |
| Operating cash flows | $ | 3,863 |
| | $ | 4,666 |
| | $ | 3,737 |
| | $ | 3,220 |
| | $ | 5,631 |
| |
| Capital expenditures | $ | 1,971 |
| | $ | 1,410 |
| | $ | 2,813 |
| | $ | 6,353 |
| | $ | 7,215 |
| |
| At December 31: | | | | | | | | | | |
| Cash and cash equivalents | $ | 4,217 |
| | $ | 4,526 |
| | $ | 4,262 |
| | $ | 193 |
| | $ | 315 |
| |
| Property, plant, equipment and mine development costs, net | $ | 28,010 |
| | $ | 22,994 |
| | $ | 23,348 |
| | $ | 24,245 |
| | $ | 22,927 |
| |
| Oil and gas properties, net | $ | — |
| | $ | — |
| | $ | 74 |
| | $ | 7,093 |
| | $ | 19,274 |
| |
Assets held for sale, including current portiono | $ | — |
| | $ | — |
| | $ | 5 |
| | $ | 4,862 |
| | $ | 4,829 |
| |
| Total assets | $ | 42,216 |
| | $ | 37,302 |
| | $ | 37,317 |
| | $ | 46,577 |
| | $ | 58,674 |
| |
| Total debt, including current portion | $ | 11,141 |
| | $ | 13,229 |
| | $ | 16,126 |
| | $ | 20,428 |
| | $ | 18,970 |
| |
| Redeemable noncontrolling interest | $ | — |
| | $ | — |
| | $ | — |
| | $ | 764 |
| | $ | 751 |
| |
| Total stockholders’ equity | $ | 9,798 |
| | $ | 7,977 |
| | $ | 6,051 |
| | $ | 7,828 |
| | $ | 18,287 |
| |
The selected consolidated financial data shown above is derived from our audited consolidated financial statements. These historical results are not necessarily indicative | |
a. | Includes net noncash mark-to-market (losses) gains associated with crude oil and natural gas derivative contracts totaling$(41) million ($(41) million to net loss attributable to common stock or $(0.03) per share) in 2016, $(319) million ($(198) million to net loss attributable to common stock or $(0.18) per share) in 2015 and $627 million ($389 million to net loss attributable to common stock or $0.37 per share) in 2014.
|
| |
b. | Includes net charges (credits) for adjustments to environmental obligations and related litigation reserves of $57 million ($57 million to net income attributable to common stock or $0.04 per share) in 2018, $210 million ($210 million to net income attributable to common stock or $0.14 per share) in 2017, $(16) million ($(16) million to net loss attributable to common stock or $(0.01) per share) in 2016, $43 million ($28 million to net loss attributable to common stock or $0.03 per share) in 2015 and $76 million ($50 million to net loss attributable to common stock or $0.05 per share) in 2014. |
| |
c. | The year 2018 includes net credits totaling $96 million ($156 million to net income attributable to common stock or $0.11 per share) consisting of gains on sales of assets totaling $208 million, partly offset by net charges of $69 million associated with Cerro Verde’s collective labor agreement and $43 million mostly associated with depreciation expense at Freeport Cobalt for the period December 2016 through December 2017, which was suspended while it was classified as held for sale. |
| |
d. | The year 2018 also includes net charges at PT Freeport Indonesia (PT-FI) totaling $223 million ($110 million to net income attributable to common stock or $0.08 per share) consisting of $69 million for surface water tax disputes with the local regional tax authority in Papua,Indonesia,$32 million for assessments of prior period permit fees with Indonesia's Ministry of Environment and Forestry, $72 million for disputed payroll withholding taxes for prior years and other tax settlements, and $62 million to write-off certain previously capitalized project costs for the new smelter in Indonesia, partly offset by inventory adjustments totaling $12 million.
|
| |
e. | The year 2017 includes net charges totaling $68 million to operating income ($12 million to net income attributable to common stock or $0.01 per share) consisting of charges totaling $125 million for workforce reductions at PT-FI and other net charges of $24 million mostly for asset impairments and metals inventory adjustments, partly offset by net gains on sales of assets totaling $81 million primarily associated with oil and gas transactions. |
| |
f. | The year 2016 includes net charges totaling $4.9 billion to operating loss ($4.8 billion to net loss attributable to common stock or $3.67 per share) consisting of (i) $4.3 billion for impairment of oil and gas properties, (ii) $926 million for drillship settlements/idle rig and contract termination costs, (iii) $196 million for other charges at oil and gas operations primarily associated with inventory adjustments, asset impairment and other restructuring charges and (iv) $69 million for charges at mining operations for metals inventory adjustments, PT-FI asset retirement and Cerro Verde social commitments, partly offset by (v) net gains on sales of assets totaling $649 million mostly associated with the Morenci and Timok transactions, and net of estimated losses associated with assets held for sale. |
| |
g. | The year 2015 includes net charges totaling $13.8 billion to operating loss ($12.0 billion to net loss attributable to common stock or $11.10 per share) consisting of (i) $13.1 billion for impairment of oil and gas properties, (ii) $338 million for metals inventory adjustments, (iii) $188 million for charges at oil and gas operations primarily associated with other asset impairment and inventory adjustments, idle/terminated rig costs and prior year mineral tax assessments related to the California properties, (iv) $145 million for charges at mining operations primarily associated with asset impairment, restructuring and other net charges and (v) $18 million for executive retirement benefits, partly offset by (vi) a net gain of $39 million for the sale of our interest in the Luna Energy power facility. |
| |
h. | The year 2014 includes net charges totaling $4.8 billion to operating loss ($3.6 billion to net loss attributable to common stock or $3.46 per share) consisting of (i) $3.7 billion for impairment of oil and gas properties, (ii) $1.7 billionto impair the full carrying value of goodwill, (iii) $46 million for charges at oil and gas operations primarily associated with idle/terminated rig costs and inventory adjustments and (iv) $6 million for adjustments to molybdenum inventories, partly offset by (v) net gains on sales of assets of $717 million primarily from the sale of our 80 percent interests in the Candelaria and Ojos del Salado mining operations.
|
| |
i. | Includes net charges at Cerro Verde related to disputed royalty matters for prior years totaling $195 million to net income attributable to common stock ($0.13 per share) in 2018 and $186 million to net income attributable to common stock ($0.13 per share) in 2017. Net charges for 2018 consist of charges (credits) of $14 million to operating income, $370 million to interest expense, $22 million to other expense, net of $35 million of net income tax benefits and $176 million to noncontrolling interests. Net charges for 2017 consist of $203 million to operating income, $145 million to interest expense and $7 million to provision for income taxes, net of $169 million to noncontrolling interests. Refer to Note 12 for further discussion. |
| |
j. | Includes after-tax net gains (losses) on early extinguishment and exchanges of debt totaling $7 million (less than $0.01 per share) in 2018, $21 million ($0.01 per share) in 2017, $26 million ($0.02 per share) in 2016 and $3 million (less than $0.01 per share) in 2014. |
| |
k. | As further discussed in “Consolidated Results - Income Taxes” contained in MD&A, amounts include net tax credits (charges) of $632 million ($574 million net of noncontrolling interests or $0.39 per share) in 2018, $438 million ($0.30 per share) in 2017, $370 million ($374 million net of noncontrolling interests or $0.28 per share) in 2016 and $(121) million ($(103) million net of noncontrolling interests or $(0.10) per share) in 2014. |
| |
l. | The year 2018 includes a gain of $19 million to net income attributable to common stock or $0.01 per share for interest received on tax refunds. The year 2015 includes a gain of $92 million to net loss attributable to common stock or $0.09 per share related to net proceeds received from insurance carriers and other third parties related to the shareholder derivative litigation settlement. |
| |
m. | Discontinued operations reflects the results of TF Holdings Limited (TFHL), through which we held an interest in the Tenke Fungurume (Tenke) mine until it was sold on November 16, 2016, and includes charges for allocated interest expense associated with the portion of the term loan that was required to be repaid as a result of the sale. Net (loss) income from discontinued operations in 2018 and 2017 primarily reflect adjustments to the fair value of the potential contingent consideration related to the sale and will continue to be adjusted through December 31, 2019. The year 2016 also includes a net charge of $198 million for the loss on disposal. |
| |
n. | Includes a gain on redemption of a redeemable noncontrolling interest of $199 million ($0.15 per share) associated with the settlement of a preferred stock obligation. Refer to Note 2 for further discussion. |
| |
o. | In accordance with accounting guidelines, the assets and liabilities of TFHL have been presented as held for sale in the consolidated balance sheets for all periods presented. |
FREEPORT-McMoRan INC.
SELECTED FINANCIAL AND OPERATING DATA (Continued)
|
| | | | | | | | | | | | | | | | | | | | |
| | Years Ended December 31, | |
| | 2018 | | 2017 | | 2016 | | 2015 | | 2014 | |
CONSOLIDATED MINING (CONTINUING OPERATIONS)a,b | | | | | | | | | | |
| Copper (millions of recoverable pounds) | | | | | | | | | | |
| Production | 3,813 |
| | 3,737 |
| | 4,222 |
| | 3,568 |
| | 3,457 |
| |
| Sales, excluding purchases | 3,811 |
| | 3,700 |
| | 4,227 |
| | 3,603 |
| | 3,463 |
| |
| Average realized price per pound | $ | 2.91 |
| | $ | 2.93 |
| | $ | 2.28 |
| | $ | 2.42 |
| | $ | 3.09 |
| |
| Gold (thousands of recoverable ounces) | | | | | | | | | | |
| Production | 2,439 |
| | 1,577 |
| | 1,088 |
| | 1,257 |
| | 1,214 |
| |
| Sales, excluding purchases | 2,389 |
| | 1,562 |
| | 1,079 |
| | 1,247 |
| | 1,248 |
| |
| Average realized price per ounce | $ | 1,254 |
| | $ | 1,268 |
| | $ | 1,238 |
| | $ | 1,129 |
| | $ | 1,231 |
| |
| Molybdenum (millions of recoverable pounds) | | | | | | | | | | |
| Production | 95 |
| | 92 |
| | 80 |
| | 92 |
| | 95 |
| |
| Sales, excluding purchases | 94 |
| | 95 |
| | 74 |
| | 89 |
| | 95 |
| |
| Average realized price per pound | $ | 12.50 |
| | $ | 9.33 |
| | $ | 8.33 |
| | $ | 8.70 |
| | $ | 12.74 |
| |
| | | | | | | | | | | |
| NORTH AMERICA COPPER MINES | | | | | | | | | | |
Operating Data, Net of Joint Venture Interestsc | | | | | | | | | | |
| Copper (millions of recoverable pounds) | | | | | | | | | | |
| Production | 1,404 |
| | 1,518 |
| | 1,831 |
| | 1,947 |
| | 1,670 |
| |
| Sales, excluding purchases | 1,428 |
| | 1,484 |
| | 1,841 |
| | 1,988 |
| | 1,664 |
| |
| Average realized price per pound | $ | 2.96 |
| | $ | 2.85 |
| | $ | 2.24 |
| | $ | 2.47 |
| | $ | 3.13 |
| |
| Molybdenum (millions of recoverable pounds) | | | | | | | | | | |
| Production | 32 |
| | 33 |
| | 33 |
| | 37 |
| | 33 |
| |
| 100% Operating Data | | | | | | | | | | |
| Leach operations | | | | | | | | | | |
| Leach ore placed in stockpiles (metric tons per day) | 681,400 |
| | 679,000 |
| | 737,400 |
| | 913,000 |
| | 1,011,500 |
| |
| Average copper ore grade (percent) | 0.24 |
| | 0.28 |
| | 0.31 |
| | 0.26 |
| | 0.25 |
| |
| Copper production (millions of recoverable pounds) | 951 |
| | 1,016 |
| | 1,120 |
| | 1,086 |
| | 963 |
| |
| Mill operations | | | | | | | | | | |
| Ore milled (metric tons per day) | 301,000 |
| | 299,500 |
| | 300,500 |
| | 312,100 |
| | 273,800 |
| |
| Average ore grade (percent): | | | | | | | | | | |
| Copper | 0.35 |
| | 0.39 |
| | 0.47 |
| | 0.49 |
| | 0.45 |
| |
| Molybdenum | 0.02 |
| | 0.03 |
| | 0.03 |
| | 0.03 |
| | 0.03 |
| |
| Copper recovery rate (percent) | 87.8 |
| | 86.4 |
| | 85.5 |
| | 85.4 |
| | 85.8 |
| |
| Copper production (millions of recoverable pounds) | 719 |
| | 788 |
| | 958 |
| | 1,020 |
| | 828 |
| |
| | | | | | | | | | | |
SOUTH AMERICA MININGb | | | | | | | | | | |
| Copper (millions of recoverable pounds) | | | | | | | | | | |
| Production | 1,249 |
| | 1,235 |
| | 1,328 |
| | 869 |
| | 1,151 |
| |
| Sales | 1,253 |
| | 1,235 |
| | 1,332 |
| | 871 |
| | 1,135 |
| |
| Average realized price per pound | $ | 2.87 |
| | $ | 2.97 |
| | $ | 2.31 |
| | $ | 2.38 |
| | $ | 3.08 |
| |
| Molybdenum (millions of recoverable pounds) | | | | | | | | | | |
| Production | 28 |
| | 27 |
| | 21 |
| | 7 |
| | 11 |
| |
| Leach operations | | | | | | | | | | |
| Leach ore placed in stockpiles (metric tons per day) | 195,200 |
| | 142,800 |
| | 149,100 |
| | 208,400 |
| | 246,400 |
| |
| Average copper ore grade (percent) | 0.33 |
| | 0.37 |
| | 0.41 |
| | 0.44 |
| | 0.48 |
| |
| Copper production (millions of recoverable pounds) | 287 |
| | 255 |
| | 328 |
| | 430 |
| | 491 |
| |
| Mill operations | | | | | | | | | | |
| Ore milled (metric tons per day) | 387,600 |
| | 360,100 |
| | 353,400 |
| | 152,100 |
| | 180,500 |
| |
| Average ore grade: | | | | | | | | | | |
| Copper (percent) | 0.38 |
| | 0.44 |
| | 0.43 |
| | 0.46 |
| | 0.54 |
| |
| Molybdenum (percent) | 0.01 |
| | 0.02 |
| | 0.02 |
| | 0.02 |
| | 0.02 |
| |
| Copper recovery rate (percent) | 84.3 |
| | 81.2 |
| | 85.8 |
| | 81.5 |
| | 88.1 |
| |
| Copper production (millions of recoverable pounds) | 962 |
| | 980 |
| | 1,000 |
| | 439 |
| | 660 |
| |
FREEPORT-McMoRan INC.
SELECTED FINANCIAL AND OPERATING DATA (Continued)
|
| | | | | | | | | | | | | | | | | | | | |
| | Years Ended December 31, | |
| | 2018 | | 2017 | | 2016 | | 2015 | | 2014 | |
| INDONESIA MINING | | | | | | | | | | |
Operating Data, Net of Rio Tinto Joint Venture Interestd | | | | | | | | | | |
| Copper (millions of recoverable pounds) | | | | | | | | | | |
| Production | 1,160 |
| | 984 |
| | 1,063 |
| | 752 |
| | 636 |
| |
| Sales | 1,130 |
| | 981 |
| | 1,054 |
| | 744 |
| | 664 |
| |
| Average realized price per pound | $ | 2.89 |
| | $ | 3.00 |
| | $ | 2.32 |
| | $ | 2.33 |
| | $ | 3.01 |
| |
| Gold (thousands of recoverable ounces) | | | | | | | | | | |
| Production | 2,416 |
| | 1,554 |
| | 1,061 |
| | 1,232 |
| | 1,130 |
| |
| Sales | 2,366 |
| | 1,540 |
| | 1,054 |
| | 1,224 |
| | 1,168 |
| |
| Average realized price per ounce | $ | 1,254 |
| | $ | 1,268 |
| | $ | 1,237 |
| | $ | 1,129 |
| | $ | 1,229 |
| |
| 100% Operating Data | | | | | | | | | | |
| Ore milled (metric tons per day) | 178,100 |
| | 140,400 |
| | 165,700 |
| | 162,500 |
| | 120,500 |
| |
| Average ore grade: | | | | | | | | | | |
| Copper (percent) | 0.98 |
| | 1.01 |
| | 0.91 |
| | 0.67 |
| | 0.79 |
| |
| Gold (grams per metric ton) | 1.58 |
| | 1.15 |
| | 0.68 |
| | 0.79 |
| | 0.99 |
| |
| Recovery rates (percent): | | | | | | | | | | |
| Copper | 91.8 |
| | 91.6 |
| | 91.0 |
| | 90.4 |
| | 90.3 |
| |
| Gold | 84.7 |
| | 85.0 |
| | 82.2 |
| | 83.4 |
| | 83.2 |
| |
| Production: | | | | | | | | | | |
| Copper (millions of recoverable pounds) | 1,227 |
| | 996 |
| | 1,063 |
| | 752 |
| | 651 |
| |
| Gold (thousands of recoverable ounces) | 2,697 |
| | 1,554 |
| | 1,061 |
| | 1,232 |
| | 1,132 |
| |
| | | | | | | | | | | |
| MOLYBDENUM MINES | | | | | | | | | | |
| Molybdenum production (millions of recoverable pounds) | 35 |
| | 32 |
| | 26 |
| | 48 |
| | 51 |
| |
| Ore milled (metric tons per day) | 27,900 |
| | 22,500 |
| | 18,300 |
| | 34,800 |
| | 39,400 |
| |
| Average molybdenum ore grade (percent) | 0.18 |
| | 0.20 |
| | 0.21 |
| | 0.2 |
| | 0.19 |
| |
| | | | | | | | | | | |
OIL AND GAS OPERATIONSe | | | | | | | | | | |
| Sales Volumes: | | | | | | | | | | |
| Oil (million barrels) | 1.4 |
| | 1.8 |
| | 34.4 |
| | 35.3 |
| | 40.1 |
| |
| Natural gas (billion cubic feet) | 10.1 |
| | 15.8 |
| | 65.1 |
| | 89.7 |
| | 80.8 |
| |
| Natural gas liquids (NGLs) (million barrels) | 0.1 |
| | 0.2 |
| | 1.8 |
| | 2.4 |
| | 3.2 |
| |
| Million barrels of oil equivalents | 3.1 |
| | 4.6 |
| | 47.1 |
| | 52.6 |
| | 56.8 |
| |
| Average Realizations: | | | | | | | | | | |
| Oil (per barrel) | $ | 54.13 |
| | $ | 40.71 |
| | $ | 39.13 |
| | $ | 57.11 |
| | $ | 90.00 |
| |
Natural gas (per million British thermal units) | $ | 3.15 |
| | $ | 3.18 |
| | $ | 2.38 |
| | $ | 2.59 |
| | $ | 4.23 |
| |
| NGLs (per barrel) | $ | 44.11 |
| | $ | 30.65 |
| | $ | 18.11 |
| | $ | 18.90 |
| | $ | 39.73 |
| |
| |
a. | Excludes the results from the Tenke mine, which is reported as discontinued operations. |
| |
b. | Includes the results of the Candelaria and Ojos del Salado mines prior to their sale in November 2014. |
| |
c. | Net of Morenci’s joint venture interest; effective May 31, 2016, our undivided interest in Morenci was prospectively reduced from 85 percent to 72 percent. Refer to Note 2 for further discussion. |
| |
d. | Prior to December 21, 2018, PT-FI had an unincorporated joint venture with Rio Tinto. Refer to Notes 2 and 3 for further discussion. |
| |
e. | During the three years ended December 31, 2018, we completed sales of substantially all of our oil and gas assets. Refer to Note 2 for further discussion. |
Items 7. and 7A. Management’s Discussion and Analysis of Financial Condition and Results of Operations and Quantitative and Qualitative Disclosures About Market Risk.
In Management’s Discussion and Analysis of Financial Condition and Results of Operations and Quantitative and Qualitative Disclosures About Market Risk (MD&A), “we,” “us” and “our” refer to Freeport-McMoRan Inc. (FCX) and its consolidated subsidiaries. The results of operations reported and summarized below are not necessarily indicative of future operating results (refer to “Cautionary Statement” for further discussion). References to “Notes” are Notes included in our Notes to Consolidated Financial Statements. Throughout MD&A, all references to earnings or losses per share are on a diluted basis, unless otherwise noted. Additionally,basis.
This section of our Form 10-K generally discusses the results of operations for the years 2020 and 2019 and comparisons between these years. Discussion of the results of operations for the year 2018 and comparisons between the years 2019 and 2018 are not included in accordance with accounting guidelines, TF Holdings Limited (TFHL), through which we held a controlling interestthis Form 10-K and can be found in “Management’s Discussion and Analysis of Financial Condition and Results of Operations and Quantitative and Qualitative Disclosures About Market Risk” in Part II, Items 7. and 7A. of our Annual Report on Form 10-K for the Tenke Fungurume (Tenke) mine until it was sold on November 16, 2016, is reported as a discontinued operation for all periods presented.fiscal year ended December 31, 2019.
OVERVIEW
We are a leading international mining company with headquarters in Phoenix, Arizona. We operate large, long-lived, geographically diverse assets with significant proven and probable reserves of copper, gold and molybdenum. We are one of the world’s largest publicly traded copper producer.producers. Our portfolio of assets includes the Grasberg minerals district in Indonesia, one of the world’s largest copper and gold deposits; and significant mining operations in the Americas,North America and South America, including the large-scale Morenci minerals district in North AmericaArizona and the Cerro Verde operation in South America.Peru.
Protecting the health of our workforce and communities where we operate is a top priority and we continue to focus on safeguarding our business in an uncertain public health and economic environment. Our operating sites successfully executed our April 2020 revised operating plans implemented in response to the global COVID-19 pandemic and resulting negative impact on the global economy.
We believe that we have a high-quality portfolio of long-lived copper assets positioned to generate long-term value. We have commenced a project to develop the Lone Star oxide ores near the Safford operation in eastern Arizona, andThe ramp-up of underground mining at PT Freeport Indonesia (PT-FI) has several projectsand production from the Lone Star copper leach project are both advancing on schedule. Cerro Verde is continuing to increase milling rates while operating under strict COVID-19 restrictions and protocols that remain in the Grasberg minerals district relatedplace. Refer to the development of its large-scale, long-lived, high-grade underground ore bodies (refer to “Operations - Indonesia Mining”“Operations” for further discussion of PT-FI’s transition mining from the open pit to underground).discussion. We are also pursuing other opportunities to enhance our mines’ net present values, and we continue to advance studies for future development of our copper resources, the timing of which will be dependentdepend on market conditions. We plan to prioritize long-term development opportunities during 2021 while focusing on the continued execution of our strategic objectives of maintaining a strong balance sheet, increasing cash returns to shareholders and advancing opportunities for future growth.
Our 2020 results reflect strong cash flows and effective cost and capital expenditure management. Net income (loss) attributable to common stock totaled $2.6 billion$599 million in 2018, $1.8 billion2020 and $(239) million in 2017 and $(4.2) billion in 2016.2019. Our results in 2018,2020, compared to 2017, benefited from2019, primarily reflect higher copper and gold sales volumes, higher gains on sales of assetsprices and lower adjustments to environmental obligations, partly offset by higher income tax expense mostly at our international operations. Our results for the year 2016 were unfavorably impacted by charges of $5.4 billion at oilproduction and gas operations primarily for the impairment of oil and gas properties, drillship settlements and contract terminationdelivery costs. Refer to “Consolidated Results” for discussion of items impacting our consolidated results for the threetwo years ended December 31, 2018.2020.
At December 31, 2018,2020, we had $4.2$3.7 billion in consolidated cash and cash equivalents, $11.1$9.7 billion in total debt, and no borrowings and approximately $3.5 billion available under our revolving credit facility.
As further discussedIn connection with our financing activities in Note 2,2019 and 2020, we issued a total of $4.0 billion in December 2018, we completed the transaction with the Indonesian government regarding PT-FI’s long-term mining rightsnew senior notes and share ownership. We expect our share of future cash flowsused most of the expanded PT-FI asset base, combined with the cashnet proceeds received in the transaction, to be comparable to our share of anticipated future cash flows under PT-FI’s former Contract of Work (COW)purchase and joint venture arrangements with Rio Tinto plc (Rio Tinto Joint Venture).
redeem outstanding senior notes. As a result, of the transaction, PT Indonesia Asahan Aluminium’s (Persero) (PT Inalum)we have extended our debt maturities and PT Indonesia Papua Metal Dan Mineral’s (PTI - formerly known as PT Indocopper Investama) collective share ownership of PT-FI totals 51.24 percent andstrengthened our share ownership is 48.76 percent. The arrangements provide for us and the other pre-transaction PT-FI shareholders to retain the economics of the revenue and cost sharing arrangements under the former Rio Tinto Joint Venture. As a result, our economic interestfinancial flexibility. We have no significant scheduled debt maturities in PT-FI is expected to approximate 81 percent from 2019 through 2022.
We, PT-FI, PTI and PT Inalum also entered into a shareholders agreement, which governs certain matters with respect to the governance and management of PT-FI in connection with their ownership of shares in PT-FI, and establishes our control over the management of PT-FI's operations. Concurrent with closing the transaction, the Indonesian government granted PT-FI a new special mining license (IUPK) to replace its former COW, enabling PT-FI to conduct operations in the Grasberg minerals district through 2041. Under the terms of the IUPK, PT-FI has
been granted an extension of mining rights through 2031, with rights to extend mining rights through 2041, subject to PT-FI completing the construction of a new smelter in Indonesia within five years of closing the transaction and fulfilling its defined fiscal obligations to the Indonesian government.2021. Refer to Note 138 and “Risk Factors” contained in Part I, Item 1A. of our annual report on Form 10-K for the year ended December 31, 2018,“Capital Resources and Liquidity” for further discussion of PT-FI’s IUPK.discussion.
We have significant mineral reserves, resources and future development opportunities within our portfolio of mining assets. At December 31, 2018,2020, our estimated consolidated recoverable proven and probable mineral reserves totaled 119.6113.2 billion pounds of copper, 30.828.9 million ounces of gold and 3.783.71 billion pounds of molybdenum. Refer to “Critical Accounting Estimates – Mineral Reserves” and Note 17 for further discussion.
During 2018,2020, production from our mines totaled 3.83.2 billion pounds of copper, 2.40.9 million ounces of gold and 9576 million pounds of molybdenum. Following is a summary of the geographic locationsan allocation of our consolidated copper, gold and molybdenum production in 2018:2020 by geographic location:
| | | | | | | | | | | | | | | | | | | | |
| Copper | | Gold | | Molybdenum | |
| North America | 44 | % | | 1 | % | | 75 | % | a |
| South America | 31 | | | — | | | 25 | | |
| Indonesia | 25 | | | 99 | | | — | | |
| 100 | % | | 100 | % | | 100 | % | |
|
| | | | | | | | | |
| | Copper | | Gold | | Molybdenum | |
| North America | 37 | % | | 1 | % | | 71 | % | a |
| South America | 33 |
| | — |
| | 29 |
| |
| Indonesia | 30 |
| | 99 |
| | — |
| |
| | 100 | % | | 100 | % | | 100 | % | |
| |
a. | Our Henderson and Climax molybdenum mines produced 37 percent of consolidated molybdenum production, and our North America copper mines produced 34 percent. |
a.Our North America copper mines produced 43 percent of consolidated molybdenum production, and our Henderson and Climax molybdenum mines produced 32 percent.
Copper production from the Grasberg open-pit mine in Indonesia, Morenci mine in North America, and Cerro Verde mine in Peru and the Grasberg minerals district in Indonesia together totaled 7673 percent of our consolidated copper production in 2018.2020.
OUTLOOK
WeDespite volatile market conditions and global economic uncertainty as a result of the ongoing COVID-19 pandemic, we continue to view the long-term outlook for our business positively, supported by limitations on supplies of copper and by the requirements for copper in the world’s economy. Our financial results vary as a result of fluctuations in market prices primarily for copper, gold and, to a lesser extent, molybdenum, as well as other factors. World market prices for these commodities have fluctuated historically and are affected by numerous factors beyond our control. Refer to “Markets” for further discussion. Because we cannot control the price of our products, the key measures that management focuses on in operating our business are sales volumes, unit net cash costs, operating cash flowflows and capital expenditures.
Sales Volumes
Following are our projected consolidated sales volumes for 2019 (which reflects a transition year)2021 and actual consolidated sales volumes for 2018:2020:
| | | | | | | | | | | | | | |
| 2021 | | 2020 | |
| (Projected) | | (Actual) | |
Copper (millions of recoverable pounds): | | | | |
| North America copper mines | 1,465 | | | 1,422 | | |
| South America mining | 1,035 | | | 976 | | |
| Indonesia mining | 1,320 | | | 804 | | |
| Total | 3,820 | | | 3,202 | | |
| | | | |
| | | | |
| | | | |
Gold (thousands of recoverable ounces) | 1,325 | | | 855 | | |
Molybdenum (millions of recoverable pounds) | 85 | | a | 80 | | |
|
| | | | | | |
| | 2019 | | 2018 | |
| | (Projected) | | (Actual) | |
Copper (millions of recoverable pounds): | | | | |
| North America copper mines | 1,400 |
| | 1,428 |
| |
| South America mining | 1,270 |
| | 1,253 |
| |
| Indonesia mining | 615 |
| | 1,130 |
| |
| Total | 3,285 |
| | 3,811 |
| |
| | | | | |
Gold (thousands of recoverable ounces) | 785 |
| | 2,389 |
| |
Molybdenum (millions of recoverable pounds) | 94 |
| a | 94 |
| |
| |
a. | Projected molybdenum sales include 35 million pounds produced by our Molybdenum mines and 59 million pounds produced by our North America and South America copper mines. |
a.Includes 25 million pounds from our Molybdenum mines and 60 million pounds from our North America and South America copper mines.
Consolidated sales for first-quarter 20192021 are expected to approximate 825 million pounds of copper, 255275 thousand ounces of gold and 2420 million pounds of molybdenum. As PT-FI transitions mining from the open pit to underground, its production is expected to be significantly lower in 2019 and 2020, compared to 2018. Metal production is expected to improve significantly by 2021 following a ramp-up period. Projected sales volumes for the year 2019 are dependent on operational performance, weather-related conditions,continued progress of the ramp-up of underground mining at PT-FI, impacts and duration of the COVID-19 pandemic, timing of shipments, the Indonesia government’s extension of PT-FI’s export license beyond March 15, 2021, and other factors. For other important factors that could cause results to differ materially from projections, refer to “Cautionary Statement,”Statement” and “Risk Factors” contained in Part I, Item 1A. of our annual report on Form 10-K for the year ended December 31, 2018.2020.
Consolidated Unit Net Cash Costs
Assuming average prices of $1,300$1,850 per ounce of gold and $12.00$9.00 per pound of molybdenum for 2019 and achievement of current sales volume and cost estimates, consolidated unit net cash costs (net of by-product credits) for our copper mines are expected to average $1.73$1.25 per pound of copper in 2019.2021. The impact of price changes on 20192021 consolidated unit net cash costs would approximate $0.01$0.03 per pound for each $50$100 per ounce change in the average price of gold and $0.03$0.01 per pound for each $2$2 per pound change in the average price of molybdenum. Quarterly unit net cash costs vary with fluctuations in sales volumes and realized prices, primarily for gold and molybdenum. Refer to “Consolidated Results – Production and Delivery Costs” for further discussion
Consolidated Operating Cash FlowFlows
Our consolidated operating cash flows vary with sales volumes,volumes; prices realized from copper, gold and molybdenum sales,sales; production costs,costs; income taxes,taxes; other working capital changeschanges; and other factors. Based on current sales volume and cost estimates, and assuming average prices of $2.75$3.50 per pound of copper, $1,300$1,850 per ounce of gold and $12.00$9.00 per pound of molybdenum, our consolidated operating cash flows are estimated to approximate $1.8$5.5 billion (net of $0.2(including $0.4 billion infrom working capital uses and timing of other tax payments)sources) for the year 2019.2021. Estimated consolidated operating cash flows in 20192021 also reflect a projected income tax provision of $0.5$1.8 billion (refer to “Consolidated Results - Income Taxes” for further discussion of our projected income tax rate for the year 2019)2021). The impact of price changes during 20192021 on operating cash flows would approximate $315$380 million for each $0.10 per pound change in the average price of copper, $40$120 million for each $50$100 per ounce change in the average price of gold and $130$80 million for each $2 per pound change in the average price of molybdenum.
Consolidated Capital Expenditures
Consolidated capital expenditures are expected to approximate $2.4$2.3 billion in 2019,2021, including $1.5$1.4 billion for major mining projects primarily associated with underground development activities in the Grasberg minerals district and exclude estimates associated with the new smelter in Indonesia.
We expect capital expenditures for the development of the Lone Star oxide project.new smelter in Indonesia to approximate $0.1 billion in 2021, of which approximately 49 percent will be attributable to our equity interest. PT-FI expects these amounts to be funded by a new bank loan.
MARKETS
World prices for copper, gold and molybdenum can fluctuate significantly. During the period from January 20092011 through December 2018,2020, the London Metal Exchange (LME) copper settlement price varied from a low of $1.38$1.96 per pound in 20092016 to a record high of $4.60$4.60 per pound in 2011; the London Bullion Market Association (London) PM gold price fluctuated from a low of $810$1,049 per ounce in 20092015 to a record high of $1,895$2,067 per ounce in 2011,2020, and the Metals Week Molybdenum Dealer Oxide weekly average price ranged from a low of $4.46$4.46 per pound in 2015 to a high of $18.60$17.88 per pound in 2010.2011. Copper, gold and molybdenum prices are affected by numerous factors beyond our control as described further in our “Risk Factors” contained in Part I, Item 1A. of our annual report on Form 10-K for the year ended December 31, 2018.2020.
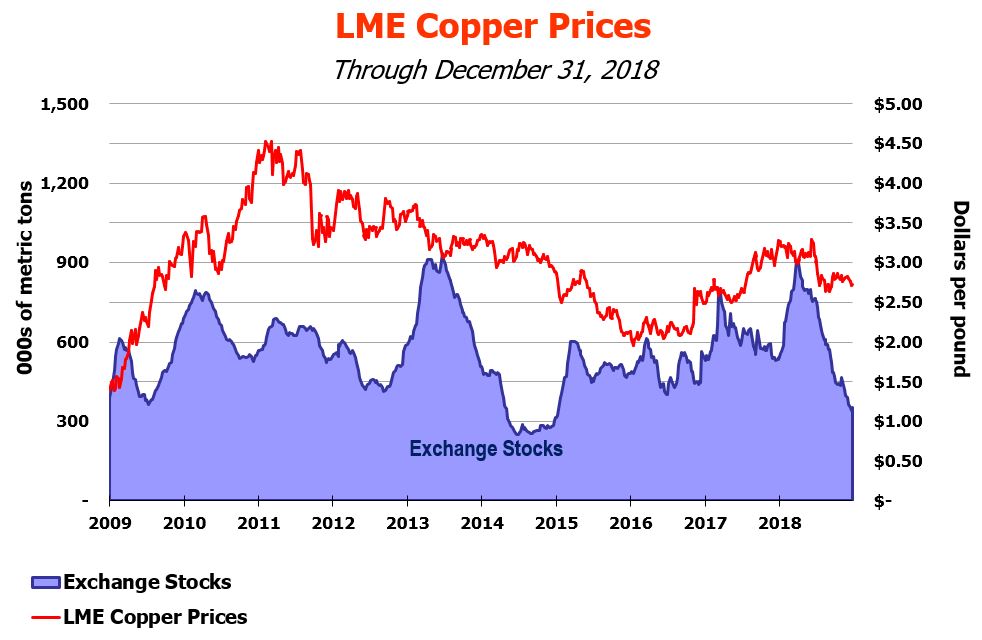
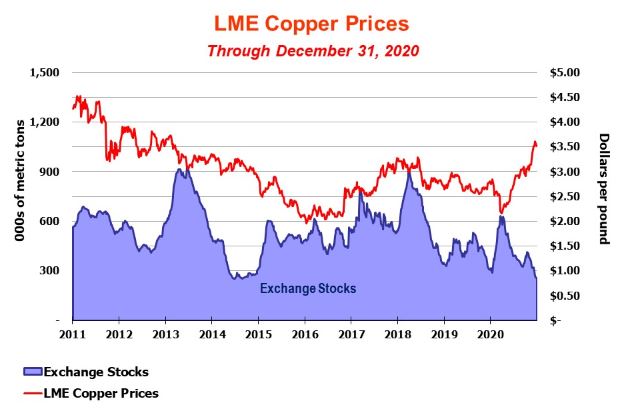
This graph presents LME copper settlement prices and the combined reported stocks of copper at the LME, Commodity Exchange Inc., a division of the New York Mercantile Exchange (NYMEX), and the Shanghai Futures Exchange from January 20092011 through December 2018. Beginning in mid-2014, copper prices declined because of concerns about slowing growth rates in China, a stronger United States (U.S.) dollar and a broad-based decline in commodity prices, but improved throughout 2017. Beginning in second-quarter 2018, copper prices declined in response to global trade actions initiated by the U.S., lower economic growth in China and globally, and concerns about rising interest rates and a stronger U.S. dollar.2020. For the year 2018,2020, LME copper settlement prices ranged from a low of $2.64$2.09 per pound to a high of $3.29$3.61 per pound, averaged $2.96$2.80 per pound and closed at $2.71$3.51 per pound on December 31, 2018.2020. During 2020, copper prices were initially negatively impacted by economic uncertainty associated with the COVID-19 pandemic, but began to rise in second-quarter 2020 and continued to rise through the end of 2020 as a result of a positive economic outlook lead by China’s continued recovery, decreasing inventories and supply curtailments related to the COVID-19 pandemic. The LME copper settlement price was $2.79$3.57 per pound on January 31, 2019.29, 2021.
WeWhile we acknowledge the global economic turmoil associated with the ongoing COVID-19 pandemic, we continue to believe the underlying long-term fundamentals of the copper business remain positive, supported by the significant role of copper in the global economy and a challenging long-term supply environment attributable to difficulty in replacing existing large mines’ output with new production sources. Future copper prices are expected to be volatile and are likely to be influenced by the ongoing COVID-19 pandemic, demand from China and emerging markets, as well as economic activity in the U.S.United States (U.S.) and other industrialized countries, the timing of the development of new supplies of copper and production levels of mines and copper smelters.
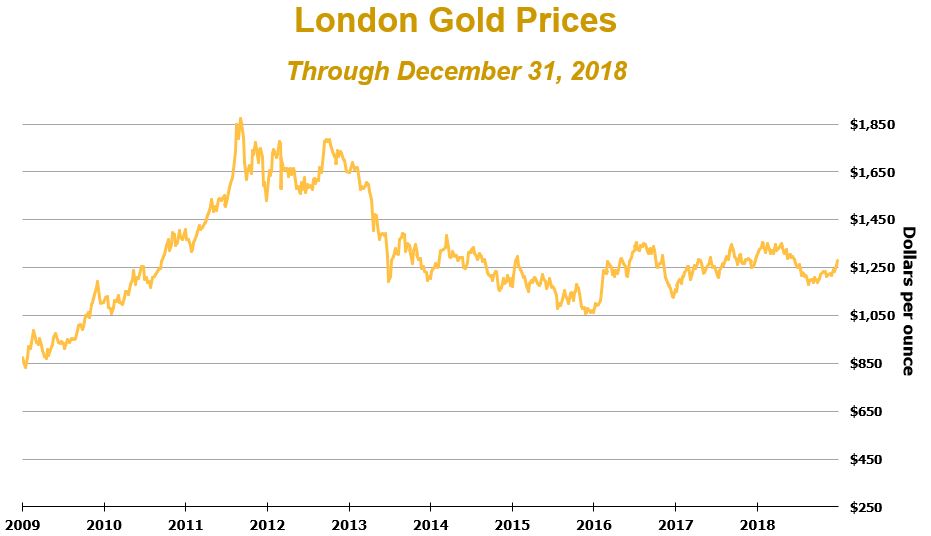
This graph presents London PM gold prices from January 20092011 through December 2018. An improving economic outlook, stronger2020. Concerns about the global economy related to the COVID-19 pandemic, historically low U.S. dollarinterest rates and positive equity performance contributed to lowerthe anticipated effects of global stimulus efforts have driven increased demand for gold since 2014. During 2018,gold. For the year 2020, London PM gold prices ranged from a low of $1,178$1,474 per ounce to a record high of $1,355$2,067 per ounce, averaged $1,268$1,770 per ounce and closed at $1,279$1,888 per ounce on December 28, 201830, 2020 (there was no London PM gold price quote on December 31, 2018)2020). The London PM gold price was $1,323$1,864 per ounce on January 31, 2019.29, 2021.
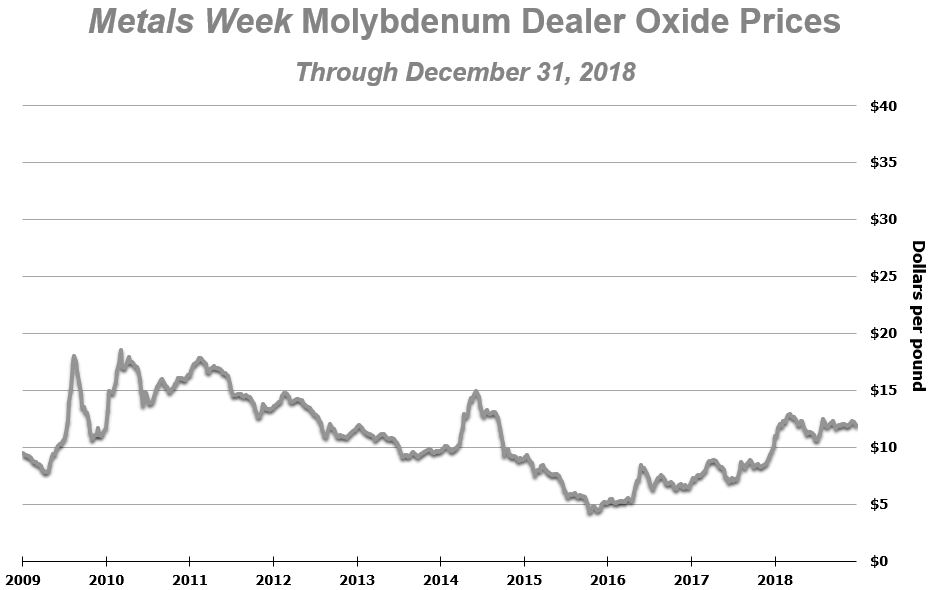
This graph presents the Metals Week Molybdenum Dealer Oxide weekly average price from January 20092011 through December 2018.2020. Molybdenum prices have declined beginningwere negatively impacted by economic uncertainty associated with the COVID-19 pandemic in mid-2014 becauseearly 2020, but began to improve in the second half of weaker demand from global steel2020 as a result of increases in spot sale activity in Europe and stainless steel producers, but rebounded starting in 2016. During 2018,China. For the year 2020, the weekly average price for molybdenum ranged from a low of $10.67$7.01 per pound to a high of $12.97$10.79 per pound, averaged $11.93$8.69 per pound and was $11.88$9.86 per pound on December 31, 2018.2020. The Metals Week Molybdenum Dealer Oxide weekly average price was $10.95$10.38 per pound on January 31, 2019.29, 2021.
CRITICAL ACCOUNTING ESTIMATES
MD&A is based on our consolidated financial statements, which have been prepared in conformity with generally accepted accounting principles (GAAP) in the U.S. The preparation of these statements requires that we make estimates and assumptions that affect the reported amounts of assets, liabilities, revenues and expenses. We base these estimates on historical experience and on assumptions that we consider reasonable under the circumstances; however, reported results could differ from those based on the current estimates under different assumptions or conditions. The areas requiring the use of management’s estimates are also discussed in Note 1 under the subheading “Use of Estimates.” Management has reviewed the following discussion of its development and selection of critical accounting estimates with the Audit Committee of our Board of Directors (the Board).
Mineral ReservesTaxes
Recoverable proven and probable reserves are the part of a mineral deposit that can be economically and legally extracted or produced at the time of the reserve determination. The determination of reserves involves numerous uncertainties with respect to the ultimate geology of the ore bodies, including quantities, grades and recovery rates. Estimating the quantity and grade of mineral reserves requires us to determine the size, shape and depth of our ore bodies by analyzing geological data, such as samplings of drill holes, tunnels and other underground workings. In addition to the geology of our mines, assumptions are required to determine the economic feasibility of mining these reserves, including estimates of future commodity prices and demand, the mining methods we use and the related costs incurred to develop and mine our reserves. Our estimates of recoverable proven and probable mineral reserves are prepared by and are the responsibility of our employees. A majority of these estimates are reviewed annually and verified by independent experts in mining, geology and reserve determination.
At December 31, 2018,preparing our consolidated estimated recoverable proven and probable reserves were assessed using long-term pricesfinancial statements, we estimate the actual amount of $2.50 per pound for copper in North America and South America and $2.00 per pound of copper in Indonesia, $1,000 per ounce of gold and $10 per pound of molybdenum. Reserves for Indonesia would not significantly change if assessed under a long-term price of $2.50 per pound of copperincome taxes currently payable or receivable as PT-FI’s reserve plan is mill-constrained by the term of its IUPK, which contains rights to extend mining rights through 2041. The following table summarizes changes in our estimated consolidated recoverable proven and probable copper, gold and molybdenum reserves during 2018 and 2017:
|
| | | | | | | | | | |
| | | Coppera (billion pounds) | | Gold (million ounces) | | Molybdenum (billion pounds) | |
| Consolidated reserves at December 31, 2016 | | 86.8 |
| | 26.1 |
| | 2.95 |
| |
| Net additions (revisions) | | 3.6 |
| | (1.0 | ) | | (0.02 | ) | |
| Production | | (3.7 | ) | | (1.6 | ) | | (0.09 | ) | |
| Consolidated reserves at December 31, 2017 | | 86.7 |
| | 23.5 |
| | 2.84 |
| |
| PT-FI acquisition of Rio Tinto Joint Venture interest | | 13.0 |
| | 10.1 |
| | — |
| |
| Other net additions (revisions) | | 23.7 |
| b | (0.4 | ) | | 1.04 |
| c |
| Production | | (3.8 | ) | | (2.4 | ) | | (0.10 | ) | |
| Consolidated reserves at December 31, 2018 | | 119.6 |
| | 30.8 |
| | 3.78 |
| |
| | | | | | | | |
| |
a. | Includes estimated recoverable metals contained in stockpiles. See below for additional discussion of recoverable copper in stockpiles. |
| |
b. | Primarily reflects an increase in the copper price assumption from $2.00 per pound to $2.50 per pound for determining reserves in North America and South America. |
| |
c. | Primarily reflects an increase in molybdenum reserves at North America copper mines and the Cerro Verde mine in Peru. |
Refer to Note 20 and “Risk Factors” contained in Part I, Item 1A. of our annual report on Form 10-K for the year ended December 31, 2018, for further information regarding, and risks associated with, our estimated recoverable proven and probable mineral reserves.
As discussed in Note 1, we depreciate our life-of-mine mining and millingwell as deferred income tax assets and values assignedliabilities attributable to proventemporary differences between the financial statement carrying amounts of existing assets and probable mineral reservesliabilities and their respective tax bases. Deferred income tax assets and liabilities are measured using the unit-of-production (UOP) method based on our estimated recoverable proven and probable mineral reserves. Because the economic assumptions usedenacted tax rates expected to estimate mineral reserves may change from periodapply to period and additional geological data is generated during the course of operations, estimates of reserves may change, which could have a significant impact on our results of operations, including changes to prospective depreciation rates and impairments of long-lived asset carrying values. Excluding impacts associated
with changestaxable income in the levels of finished goods inventories and based on projected copper sales volumes, if estimated copper reserves at our mines were 10 percent higher at December 31, 2018, we estimate that our annual depreciation, depletion and amortization (DD&A) expense for 2019 would decrease by $44 million ($22 million to net income attributable to common stock), and a 10 percent decreaseyears in copper reserves would increase DD&A expense by $53 million ($26 million to net income attributable to common stock). We perform annual assessments of our existing assets in connection with the review of mine operating and development plans. If it is determined that assigned asset lives do not reflect the expected remaining period of benefit, any change could affect prospective DD&A rates.
As discussed below and in Note 1, we review and evaluate our long-lived assets for impairment when events or changes in circumstances indicate that the related carrying amount of such assets may not be recoverable, and changes to our estimates of recoverable proven and probable mineral reserves could have an impact on our assessment of asset recoverability.
Recoverable Copper in Stockpiles
We record, as inventory, applicable costs for copper contained in mill and leach stockpiles thatwhich these temporary differences are expected to be processedrecovered or settled. The effect on deferred income tax assets and liabilities of a change in tax rates or laws is recognized in income in the period in which such changes are enacted.
Our operations are in multiple jurisdictions where uncertainties arise in the application of complex tax regulations. Some of these tax regimes are defined by contractual agreements with the local government, while others are defined by general tax laws and regulations. We and our subsidiaries are subject to reviews of our income tax filings and other tax payments, and disputes can arise with the taxing authorities over the interpretation of our contracts or laws. Final taxes paid may be dependent upon many factors, including negotiations with taxing authorities. In certain jurisdictions, we pay a portion of the disputed amount before formally appealing an assessment. Such payment is recorded as a receivable if we believe the amount is collectible.
A valuation allowance is provided for those deferred income tax assets for which the weight of available evidence suggests that the related benefits will not be realized. In determining the amount of the valuation allowance, we consider estimated future based on proven processing technologies. Mill and leach stockpiles are evaluated periodicallytaxable income or loss as well as feasible tax planning strategies in each jurisdiction. If we determine that we will not realize all or a portion of our deferred income tax assets, we will increase our valuation allowance. Conversely, if we determine that we will ultimately be able to ensure that they are statedrealize all or a portion of the related benefits for which a valuation allowance has been provided, all or a portion of the related valuation allowance will be reduced.
Our valuation allowances totaled $4.7 billion at the lower of weighted-average cost or net realizable value (refer to Note 4 and “Consolidated Results” for further discussion of inventory adjustments recorded for the three years ended December 31, 2018). Accounting for recoverable copper from mill2020, which covered all of our U.S. foreign tax credits, U.S. federal net operating losses, foreign net operating losses, and leach stockpiles represents a critical accounting estimate because (i) it is impracticable to determine copper contained in mill and leach stockpiles by physical count, thus requiring management to employ reasonable estimation methods and (ii) recovery rates from leach stockpiles can vary significantly.substantially all of our U.S. state net operating losses. Refer to Note 111 for further discussion of our accounting policy for recoverable copper in stockpiles.discussion.
At December 31, 2018, estimated consolidated recoverable copper was 2.0 billion pounds in leach stockpiles (with a carrying value of $2.2 billion) and 0.6 billion pounds in mill stockpiles (with a carrying value of $0.5 billion).
Impairment of Long-Lived Assets
As discussed in Note 1, we assess the carrying values of our long-lived mining assets when events or changes in circumstances indicate that the related carrying amounts of such assets may not be recoverable. In evaluating our long-lived mining assets for recoverability, we use estimates of pre-tax undiscounted future cash flows of our individual mines. Estimates of future cash flows are derived from current business plans, which are developed using near-term metal price forecasts reflective of the current price environment and management’s projections for long-term average metal prices. In addition to near- and long-term metal price assumptions, other key assumptions include estimates of commodity-based and other input costs; proven and probable mineral reserves estimates, including the timing and cost to develop and produce the reserves; value beyond proven and probable mineral reserve estimates (refer to Note 1); and the use of appropriate discount rates in the measurement of fair value. We believe our estimates and models used to determine fair value are similar to what a market participant would use. As quoted market prices are unavailable for our individual mining operations, fair value is determined through the use of after-tax discounted estimated future cash flows.
For the three years ended December 31, 2018, we concluded there were no events or changes in circumstances that would indicate that the carrying amount of our long-lived mining assets might not be recoverable.
In addition to decreases in future metal price assumptions, other events that could result in future impairment of our long-lived mining assets include, but are not limited to, decreases in estimated recoverable proven and probable mineral reserves and any event that might otherwise have a material adverse effect on mine site production levels or costs. Refer to “Risk Factors” contained in Part I, Item 1A. of our annual report on Form 10-K for the year ended December 31, 2018.
Environmental Obligations
Our current and historical operating activities are subject to various national, state and local environmental laws and regulations that govern the protection of the environment, and compliance with those laws requires significant expenditures. Environmental expenditures are charged to expense or capitalized, depending upon their future economic benefits. The guidance provided by U.S. GAAP requires that liabilities for contingencies be recorded when it is probable that obligations have been incurred, and the cost can be reasonably estimated. At December 31, 2018,2020, environmental obligations recorded in our consolidated balance sheet totaled $1.5$1.6 billion,, which reflect obligations for environmental liabilities attributed to the Comprehensive Environmental Response,
Compensation, and Liability Act of 1980 (CERCLA) or analogous state programs and for estimated future costs associated with environmental matters. Refer to Notes 1 and 12 for further discussion of environmental obligations, including a summary of changes in our estimated environmental obligations for the three years ended December 31, 2018.2020.
Accounting for environmental obligations represents a critical accounting estimate because (i) changes to environmental laws and regulations and/or circumstances affecting our operations could result in significant changes to our estimates, which could have a significant impact on our results of operations, (ii) we will not incur most of these costs for a number of years, requiring us to make estimates over a long period, (iii) calculating the discounted cash flows for certain of our environmental obligations requires management to estimate projected cash flows and make long-term assumptions about inflation rates and (iv) changes in estimates used in determining our environmental obligations could have a significant impact on our results of operations.
We perform a comprehensive annual review of our environmental obligations and also review changes in facts and circumstances associated with these obligations at least quarterly. Judgments and estimates are based upon currently available facts, existing technology, presently enacted laws and regulations, remediation experience, whether or not we are a potentially responsible party (PRP), the ability of other PRPs to pay their allocated portions and take into consideration reasonably possible outcomes. Our cost estimates can change substantially as additional information becomes available regarding the nature or extent of site contamination, updated cost assumptions (including increases and decreases to cost estimates), changes in the anticipated scope and timing of remediation activities, the settlement of environmental matters, required remediation methods and actions by or against governmental agencies or private parties.
Asset Retirement Obligations
We record the fair value of our estimated asset retirement obligations (AROs) associated with tangible long-lived assets in the period incurred. Fair value is measured as the present value of cash flow estimates after considering inflation and a market risk premium. Our cost estimates are reflected on a third-party cost basis and comply with our legal obligation to retire tangible long-lived assets in the period incurred. These cost estimates may differ from financial assurance cost estimates for reclamation activities because of a variety of factors, including obtaining updated cost estimates for reclamation activities, the timing of reclamation activities, changes in scope and the exclusion of certain costs not considered reclamation and closure costs. At December 31, 2018,2020, AROs recorded in our consolidated balance sheet totaled $2.5 billion, including $0.5$0.4 billion associated with our remaining oil and gas
operations. Refer to Notes 1 and 12 for further discussion of reclamation and closure costs, including a summary of changes in our AROs for the three years ended December 31, 2018.2020.
Generally, ARO activities are specified by regulations or in permits issued by the relevant governing authority, and managementmanagement’s judgment is required to estimate the extent and timing of expenditures. Accounting for AROs represents a critical accounting estimate because (i) we will not incur most of these costs for a number of years, requiring us to make estimates over a long period, (ii) reclamation and closure laws and regulations could change in the future and/or circumstances affecting our operations could change, either of which could result in significant changes to our current plans, (iii) the methods used or required to plug and abandon non-producing oil and gas wellbores, remove platforms, tanks, production equipment and flow lines, and restore the wellsite could change, (iv) calculating the fair value of our AROs requires management to estimate projected cash flows, make long-term assumptions about inflation rates, determine our credit-adjusted, risk-free interest rates and determine market risk premiums that are appropriate for our operations and (v) given the magnitude of our estimated reclamation, mine closure and wellsite abandonment and restoration costs, changes in any or all of these estimates could have a significant impact on our results of operations.
TaxesMineral Reserves
Recoverable proven and probable reserves are the part of a mineral deposit that can be economically and legally extracted or produced at the time of the reserve determination. The determination of reserves involves numerous uncertainties with respect to the ultimate geology of the ore bodies, including quantities, grades and recovery rates. Estimating the quantity and grade of mineral reserves requires us to determine the size, shape and depth of our ore bodies by analyzing geological data, such as samplings of drill holes, tunnels and other underground workings. In preparingaddition to the geology of our mines, assumptions are required to determine the economic feasibility of mining these reserves, including estimates of future commodity prices and demand, the mining methods we use and the related costs incurred to develop and mine our reserves. Our estimates of recoverable proven and probable mineral reserves are prepared by and are the responsibility of our employees. These estimates are reviewed and verified regularly by independent experts in mining, geology and reserve determination.
Our consolidated estimated recoverable proven and probable reserves shown below were assessed using long-term prices of $2.50 per pound for copper, $1,200 per ounce of gold and $10 per pound of molybdenum. The following table summarizes changes in our estimated consolidated recoverable proven and probable copper, gold and molybdenum reserves during 2020 and 2019:
| | | | | | | | | | | | | | | | | | | | | | | |
| | Coppera (billion pounds) | | Gold (million ounces) | | Molybdenum (billion pounds) | |
| Consolidated reserves at December 31, 2018 | | 119.6 | | | 30.8 | | | 3.78 | | |
| | | | | | | |
| Net revisions | | (0.4) | | | (0.3) | | | (0.11) | | |
| Production | | (3.2) | | | (0.9) | | | (0.09) | | |
| Consolidated reserves at December 31, 2019 | | 116.0 | | | 29.6 | | | 3.58 | | |
| Net additions | | 0.4 | | | 0.2 | | | 0.21 | | |
| Production | | (3.2) | | | (0.9) | | | (0.08) | | |
| Consolidated reserves at December 31, 2020 | | 113.2 | | | 28.9 | | | 3.71 | | |
| | | | | | | |
a.Includes estimated recoverable metals contained in stockpiles. See below for additional discussion of recoverable copper in stockpiles.
Refer to Note 17 and “Risk Factors” contained in Part I, Item 1A. of our annual consolidated financial statements,report on Form 10-K for the year ended December 31, 2020, for further information regarding, and risks associated with, our estimated recoverable proven and probable mineral reserves.
As discussed in Note 1, we depreciate our life-of-mine mining and milling assets and values assigned to proven and probable mineral reserves using the unit-of-production (UOP) method based on our estimated recoverable proven and probable mineral reserves. Because the economic assumptions used to estimate mineral reserves may change from period to period and additional geological data is generated during the course of operations, estimates of reserves may change, which could have a significant impact on our results of operations, including changes to prospective depreciation rates and impairments of long-lived asset carrying values. Based on projected copper sales volumes, if estimated copper reserves at our mines were 10 percent higher at December 31, 2020, we estimate that our annual depreciation, depletion and amortization (DD&A) expense for 2021 would decrease by $84 million ($44 million to net income attributable to common stock), and a 10 percent decrease in copper reserves
would increase DD&A expense by $103 million ($53 million to net income attributable to common stock). We perform annual assessments of our existing assets in connection with the actualreview of mine operating and development plans. If it is determined that assigned asset lives do not reflect the expected remaining period of benefit, any change could affect prospective DD&A rates.
As discussed below and in Note 1, we review and evaluate our long-lived assets for impairment when events or changes in circumstances indicate that the related carrying amount of income taxes currently payable or receivablesuch assets may not be recoverable, and changes to our estimates of recoverable proven and probable mineral reserves could have an impact on our assessment of asset recoverability.
Recoverable Copper in Stockpiles
We record, as well as deferred income tax assetsinventory, applicable costs for copper contained in mill and liabilities attributable to temporary differences between the financial statement carrying amounts of existing assets and liabilities and their respective tax bases. Deferred income tax assets and liabilities are measured using enacted tax rates expected to apply to taxable income in the years in which these temporary differencesleach stockpiles that are expected to be recoveredprocessed in the future based on proven processing technologies. Mill and leach stockpiles are evaluated periodically to ensure that they are stated at the lower of weighted-average cost or settled. Thenet realizable value (refer to Note 4 and “Consolidated Results” for further discussion of inventory adjustments recorded for the three years ended December 31, 2020). Accounting for recoverable copper from mill and leach stockpiles represents a critical accounting estimate because (i) it is impracticable to determine copper contained in mill and leach stockpiles by physical count, thus requiring management to employ reasonable estimation methods and (ii) recovery rates from leach stockpiles can vary significantly. Refer to Note 1 for further discussion of our accounting policy for recoverable copper in stockpiles.
At December 31, 2020, estimated consolidated recoverable copper was 1.7 billion pounds in leach stockpiles (with a carrying value of $2.0 billion) and 0.3 billion pounds in mill stockpiles (with a carrying value of $0.4 billion).
Impairment of Long-Lived Assets
As discussed in Note 1, we assess the carrying values of our long-lived mining assets when events or changes in circumstances indicate that the related carrying amounts of such assets may not be recoverable. In evaluating our long-lived mining assets for recoverability, we use estimates of pre-tax undiscounted future cash flows of our mines. Estimates of future cash flows are derived from current business plans, which are developed using near-term metal price forecasts reflective of the current price environment and management’s projections for long-term average metal prices. In addition to near- and long-term metal price assumptions, other key assumptions include estimates of commodity-based and other input costs; proven and probable mineral reserves estimates, including the timing and cost to develop and produce the reserves; value beyond proven and probable mineral reserve estimates (refer to Note 1); and the use of appropriate discount rates in the measurement of fair value. We believe our estimates and models used to determine fair value are similar to what a market participant would use. As quoted market prices are unavailable for our individual mining operations, fair value is determined through the use of after-tax discounted estimated future cash flows.
For the two years ended December 31, 2020, our evaluation of our long-lived mining assets did not result in any material impairments.
In addition to decreases in future metal price assumptions, other events that could result in future impairment of our long-lived mining assets include, but are not limited to, decreases in estimated recoverable proven and probable mineral reserves and any event that might otherwise have a material adverse effect on deferredmine site production levels or costs. Refer to “Risk Factors” contained in Part I, Item 1A. of our annual report on Form 10-K for the year ended December 31, 2020.
CONSOLIDATED RESULTS
| | | | | | | | | | | | | | | | |
| | Years Ended December 31, | | | |
| | 2020 | | 2019 | | | |
| SUMMARY FINANCIAL DATA | (in millions, except per share amounts) | | | |
Revenuesa,b | $ | 14,198 | | c | $ | 14,402 | | d | | |
Operating incomea,e,f,g | $ | 2,437 | | h | $ | 1,091 | |
| | |
Net income (loss) from continuing operationsi,j,k | $ | 865 | | c,l | $ | (192) | | m,n,o | | |
| | | | | | |
| Net income (loss) attributable to common stock | $ | 599 | | | $ | (239) | | | | |
| Diluted net income (loss) per share attributable to common stock | $ | 0.41 | | | $ | (0.17) | | | | |
| | | | | | |
| | | | | | |
| | | | | | |
| | | | | | |
| Diluted weighted-average common shares outstanding | 1,461 | | | 1,451 | | | | |
Operating cash flowsp | $ | 3,017 | | | $ | 1,482 | | | | |
| Capital expenditures | $ | 1,961 | | | $ | 2,652 | | | | |
| At December 31: | | | | | | |
| Cash and cash equivalents | $ | 3,657 | | | $ | 2,020 | | | | |
| Total debt, including current portion | $ | 9,711 | | | $ | 9,826 | | | | |
a.Refer to Note 16 for a summary of revenues and operating income by operating division.
b.Includes adjustments to embedded derivatives for provisionally priced concentrate and cathode sales (refer to Note 14).
c.Includes net charges totaling $62 million ($24 million to net income attributable to common stock or $0.02 per share), primarily associated with Cerro Verde tax matters and asset impairments, partly offset by net credits primarily associated with the sale of royalty assets. These net (charges) credits were recorded in revenues ($(7) million), production and delivery ($(48) million), interest expense ($(55) million) and in other expenses, net ($48 million).
d.Includes charges totaling $166 million ($91 million to net loss attributable to common stock or $0.06 per share), primarily associated with an unfavorable Indonesia Supreme Court ruling related to certain disputed PT-FI export duties (refer to Note 12).
e.Includes net gains on sales of assets totaling $473 million ($337 million to net income attributable to common stock or $0.23 per share) in 2020 and liabilities$417 million ($339 million to net loss attributable to common stock or $0.23 per share) in 2019. Refer to Note 2 and “Net Gain on Sales of Assets” below for further discussion.
f.The year 2020 includes net charges for adjustments to environmental obligations and related litigation reserves of $113 million ($113 million to net income attributable to common stock or $0.08 per share), primarily associated with a changeframework for the resolution of all current and future potential talc-related litigation ($132 million), partly offset by net favorable adjustments to environmental reserves ($19 million). The year 2019 includes net charges for adjustments to environmental obligations and related litigation reserves of $68 million ($68 million to net loss attributable to common stock or $0.05 per share).
g.Includes unfavorable metals inventory adjustments totaling $96 million ($94 million to net income attributable to common stock or $0.06 per share) for the year 2020 and $179 million ($144 million to net loss attributable to common stock or $0.10 per share) for the year 2019.
h.Includes charges totaling $258 million ($178 million to net income attributable to common stock or $0.12 per share) associated with (i) idle facility costs (Cerro Verde), contract cancellation and other charges directly related to the COVID-19 pandemic and (ii) our April 2020 revised operating plans (including employee separation costs) recorded in production and delivery ($202 million), depreciation, depletion and amortization ($32 million), selling, general and administrative ($16 million), and mining exploration and research ($8 million).
i.Includes after-tax net losses on early extinguishment and exchanges of debt totaling $100 million ($0.07 per share) in 2020 and $26 million ($0.02 per share) in 2019. Refer to Note 8 for further discussion.
j.Includes net tax ratescredits (charges) of $15 million ($27 million net of noncontrolling interests or laws is recognized$0.02 per share) in 2020 and $(1) million ($34 million net of noncontrolling interests or $0.02 per share) in 2019. Refer to “Income Taxes” below for further discussion.
k.We defer recognizing profits on intercompany sales until final sales to third parties occur. Refer to “Operations - Smelting & Refining” for a summary of net impacts from changes in these deferrals.
l.Includes charges at PT-FI totaling $65 million ($47 million to net income attributable to common stock or $0.03 per share) associated with historical contested tax audits ($50 million) and currency exchange adjustments to value added tax receivables ($15 million). These charges were recorded in interest expense, net ($35 million) and other expenses, net ($30 million).
m.Includes net charges associated with disputed Cerro Verde royalties for prior years of $7 million to net loss attributable to common stock (less than $0.01 per share) in 2019. Net charges for the period in which such changes are enacted.year 2019 consist of charges to production and delivery costs ($6 million) and interest expense ($10 million). Refer to Note 12 for further discussion.
n.Includes charges at PT-FI of $294 million ($288 million to net loss attributable to common stock or $0.20 per share) consisting of $234 million associated with PT-FI's historical contested tax disputes, $32 million for a currency exchange
Our operations are in multiple jurisdictions where uncertainties arise in
adjustment to value-added tax receivables and $28 million for an adjustment to the applicationsettlement of complexthe historical surface water tax regulations. Some of these tax regimes are defined by contractual agreementsmatters with the local government, while others are definedregional tax authority in Papua, Indonesia.
o.Includes net charges totaling $59 million ($26 million to net loss attributable to common stock or $0.02 per share), primarily associated with weather-related issues at El Abra, adjustments to Cerro Verde’s deferred profit sharing and mining asset impairments, partly offset by general tax laws and regulations. We and our subsidiaries are subject to reviews of our income tax filingsnet credits mostly for asset retirement obligation adjustments.
p.Working capital and other tax payments,sources totaled $665 million in 2020 and disputes can arise with the taxing authorities over the interpretation$349 million in 2019.
| | | | | | | | | | | | | | | | |
| Years Ended December 31, | | | |
| 2020 | | 2019 | | | |
| SUMMARY OPERATING DATA | | | | | | |
Copper (millions of recoverable pounds) | | | | | | |
| Production | 3,206 | | | 3,247 | | | | |
| Sales, excluding purchases | 3,202 | | | 3,292 | | | | |
| Average realized price per pound | $ | 2.95 | | | $ | 2.73 | | | | |
Site production and delivery costs per pounda | $ | 1.88 | | | $ | 2.15 | | | | |
Unit net cash costs per pounda | $ | 1.48 | | | $ | 1.74 | | | | |
Gold (thousands of recoverable ounces) | | | | | | |
| Production | 857 | | | 882 | | | | |
| Sales, excluding purchases | 855 | | | 991 | | | | |
| Average realized price per ounce | $ | 1,832 | | | $ | 1,415 | | | | |
Molybdenum (millions of recoverable pounds) | | | | | | |
| Production | 76 | | | 90 | | | | |
| Sales, excluding purchases | 80 | | | 90 | | | | |
| Average realized price per pound | $ | 10.20 | | | $ | 12.61 | | | | |
| | | | | | |
| | | | | | |
| | | | | | |
| | | | | | |
| | | | | | |
| | | | | | |
| | | | | | |
| | | | | | |
a.Reflects per pound weighted-average production and delivery costs and unit net cash costs (net of our contracts or laws. Final taxes paid may be dependent upon many factors, including negotiations with taxing authorities. In certain jurisdictions, we must pay a portionby-product credits) for all copper mines, before net noncash and other costs. For reconciliations of the disputed amountper pound unit costs by operating division to the local governmentproduction and delivery costs applicable to sales reported in orderour consolidated financial statements, refer to formally appeal an assessment. Such payment is recorded as a receivable if we believe the amount is collectible.“Product Revenues and Production Costs.”
A valuation allowance is provided for those deferred income tax assets for which the weight of available evidence suggests that the related benefits will not be realized. In determining the amount of the valuation allowance, we consider estimated future taxable income or loss as well as feasible tax planning strategies in each jurisdiction. If we determine that we will not realize all or a portion of our deferred income tax assets, we will increase our valuation allowance. Conversely, if we determine that we will ultimately be able to realize all or a portion of the related benefits for which a valuation allowance has been provided, all or a portion of the related valuation allowance will be reduced.
Our valuation allowances totaled $4.5 billion at December 31, 2018, which covered all of our U.S. foreign tax credits, U.S. federal net operating loss carryforwards, foreign net operating loss carryforwards, and substantially all of our U.S. state net operating losses. Refer to Note 11 for further discussion.
CONSOLIDATED RESULTS
|
| | | | | | | | | | | | |
| | Years Ended December 31, | |
| | 2018 | | 2017 | | 2016 | |
| SUMMARY FINANCIAL DATA | (in millions, except per share amounts) | |
Revenuesa,b | $ | 18,628 |
| | $ | 16,403 |
| | $ | 14,830 |
| c |
Operating income (loss)a,d,e | $ | 4,754 |
| f,g | $ | 3,690 |
| h | $ | (2,729 | ) | i |
Net income (loss) from continuing operationsj,k,l | $ | 2,909 |
| m,n | $ | 2,029 |
| n | $ | (3,832 | ) | |
Net (loss) income from discontinued operationso | $ | (15 | ) | | $ | 66 |
| | $ | (193 | ) | |
| Net income (loss) attributable to common stock | $ | 2,602 |
| | $ | 1,817 |
| | $ | (4,154 | ) | p |
| Diluted net income (loss) per share attributable to common stock: | | | | | | |
| Continuing operations | $ | 1.79 |
| | $ | 1.21 |
| | $ | (2.96 | ) | |
| Discontinued operations | (0.01 | ) | | 0.04 |
| | (0.20 | ) | |
| | $ | 1.78 |
| | $ | 1.25 |
| | $ | (3.16 | ) | |
| | | | | | | |
| Diluted weighted-average common shares outstanding | 1,458 |
| | 1,454 |
| | 1,318 |
| |
Operating cash flowsq | $ | 3,863 |
| | $ | 4,666 |
| | $ | 3,737 |
| |
| Capital expenditures | $ | 1,971 |
| | $ | 1,410 |
| | $ | 2,813 |
| |
| At December 31: | | | | | | |
| Cash and cash equivalents | $ | 4,217 |
| | $ | 4,526 |
| | $ | 4,262 |
| |
| Total debt, including current portion | $ | 11,141 |
| | $ | 13,229 |
| | $ | 16,126 |
| |
| |
a. | Refer to Note 16 for a summary of revenues and operating income by operating division. |
| |
b. | Includes adjustments to embedded derivatives for provisionally priced concentrate and cathode sales (refer to Note 14). |
| |
c. | Includes net noncash mark-to-market losses associated with crude oil and natural gas derivative contracts totaling $41 million ($41 million to net loss attributable to common stock or $0.03 per share). Refer to Note 14 for further discussion. |
| |
d. | Includes net gains on sales of assets totaling $208 million ($208 million to net income attributable to common stock or $0.14 per share) in 2018, $81 million ($81 million to net income attributable to common stock or $0.06 per share) in 2017 and $649 million ($649 million to net loss attributable to common stockholders or $0.49 per share) in 2016. Refer to Note 2 and “Net Gain on Sales of Assets” below for further discussion. |
| |
e. | Includes net charges (credits) for adjustments to environmental obligations and related litigation reserves of $57 million ($57 million to net income attributable to common stock or $0.04 per share) in 2018, $210 million ($210 million to net income attributable to common stock or $0.14 per share) in 2017 and $(16) million ($(16) million to net loss attributable to common stock or $(0.01) per share) in 2016. |
| |
f. | The year 2018 includes net charges of $112 million ($52 million to net income attributable to common stock or $0.04 per share) consisting of $69 million for Cerro Verde’s new three-year collective labor agreement (CLA) and $43 million mostly associated with depreciation expense at Freeport Cobalt for the period December 2016 through December 2017, which was suspended while it was classified as held for sale. |
| |
g. | The year 2018 also includes net charges at PT-FI of $223 million($110 million to net income attributable to common stock or $0.08 per share) consisting of $69 million for surface water tax disputes with the local regional tax authority in Papua,Indonesia,$32 million for assessments of prior period permit fees with Indonesia's Ministry of Environment and Forestry (MOEF), $72 million for disputed payroll withholding taxes for prior years and other tax settlements, and $62 million to write-off certain previously capitalized project costs for the new smelter in Indonesia, partly offset by inventory adjustments totaling $12 million.
|
| |
h. | The year 2017 includes net charges of $149 million ($93 to net income attributable to common stock or $0.06 per share) mostly associated with workforce reductions at PT-FI. |
| |
i. | The year 2016 also includes charges of $5.5 billion ($5.5 billion to net loss attributable to common stockholders or $4.16 per share) consisting of (i) $4.3 billion to reduce the carrying value of oil and gas properties pursuant to full cost accounting rules, (ii) $1.1 billion of other net oil and gas charges, primarily for drillship settlements/idle rig costs, the termination of contracts for support vessels and equipment, inventory adjustments, asset impairment and restructuring charges, and (iii) $69 million of net charges at mining operations primarily reflecting inventory adjustments, PT-FI asset retirement and Cerro Verde social commitments. |
| |
j. | Includes net gains on early extinguishment and exchanges of debt totaling $7 million (less than $0.01 per share) in2018,$21 million ($0.01 per share) in 2017 and $26 million ($0.02 per share) in 2016. Refer to Note 8 for further discussion.
|
| |
k. | Includes net tax credits of $632 million ($574 million net of noncontrolling interests or $0.39 per share) in 2018, $438 million ($0.30 per share) in 2017 and $370 million ($374 million net of noncontrolling interests or $0.28 per share) in 2016. Refer to “Income Taxes” below for further discussion. |
| |
l. | We defer recognizing profits on intercompany sales until final sales to third parties occur. Refer to “Operations - Smelting & Refining” for a summary of net impacts from changes in these deferrals. |
| |
m. | Includes interest received on tax refunds totaling $30 million ($19 million to net income attributable to common stock or $0.01 per share), mostly associated with the refund of PT-FI’s prior years’ tax receivables. |
| |
n. | Includes net charges associated with disputed Cerro Verde royalties for prior years of $195 million to net income attributable to common stock ($0.13 per share) in 2018 and $186 million to net income attributable to common stock ($0.13 per share) in 2017. Net charges for the year 2018 consist of charges to production and delivery costs ($14 million), interest expense ($370 million) and other expense ($22 million), net of income tax benefits ($35 million) and noncontrolling interests ($176 million). Net charges for the year 2017 primarily reflect charges to production and delivery ($203 million), interest expense ($145 million) and income taxes ($7 million), net of noncontrolling interests ($169 million). Refer to Note 12 for further discussion.
|
| |
o. | Primarily reflects adjustments to the estimated fair value of contingent consideration related to the November 2016 sale of our interest in TFHL, which will continue to be adjusted through December 31, 2019. |
| |
p. | Includes a gain on redemption of noncontrolling interest of $199 million ($0.15 per share) for the settlement of a preferred stock obligation. Refer to Note 2 for further discussion. |
| |
q. | Includes net working capital (uses) sources and timing of other tax payments of $(0.6) billion in 2018, $0.6 billion in 2017 and $87 million in 2016. |
|
| | | | | | | | | | | | |
| | Years Ended December 31, | |
| | 2018 | | 2017 | | 2016a | |
| SUMMARY OPERATING DATA | | | | | | |
Copper (millions of recoverable pounds) | | | | | | |
| Production | 3,813 |
| | 3,737 |
| | 4,222 |
| |
| Sales, excluding purchases | 3,811 |
| | 3,700 |
| | 4,227 |
| |
| Average realized price per pound | $ | 2.91 |
| | $ | 2.93 |
| | $ | 2.28 |
| |
Site production and delivery costs per poundb | $ | 1.76 |
| | $ | 1.60 |
| | $ | 1.42 |
| |
Unit net cash costs per poundb | $ | 1.07 |
| | $ | 1.19 |
| | $ | 1.26 |
| |
Gold (thousands of recoverable ounces) | | | | | | |
| Production | 2,439 |
| | 1,577 |
| | 1,088 |
| |
| Sales, excluding purchases | 2,389 |
| | 1,562 |
| | 1,079 |
| |
| Average realized price per ounce | $ | 1,254 |
| | $ | 1,268 |
| | $ | 1,238 |
| |
Molybdenum (millions of recoverable pounds) | | | | | | |
| Production | 95 |
| | 92 |
| | 80 |
| |
| Sales, excluding purchases | 94 |
| | 95 |
| | 74 |
| |
| Average realized price per pound | $ | 12.50 |
| | $ | 9.33 |
| | $ | 8.33 |
| |
| |
a. | Excludes results from the Tenke mine, which is reported as a discontinued operation. |
| |
b. | Reflects per pound weighted-average production and delivery costs and unit net cash costs (net of by-product credits) for all copper mines, before net noncash and other costs. For reconciliations of the per pound unit costs by operating division to production and delivery costs applicable to sales reported in our consolidated financial statements, refer to “Product Revenues and Production Costs.” |
Revenues
Consolidated revenues totaled $18.6$14.2 billion in 2018, $16.42020 and $14.4 billion in 2017 and $14.8 billion in 2016.2019. Our revenues primarily include the sale of copper concentrate, copper cathode, copper rod, gold in concentrate and molybdenum. Following is a summary of changes in our consolidated revenues between periodsfrom 2019 to 2020 (in millions):
| | | | | | | | | | |
| | | | |
| | | | |
| Consolidated revenues - 2019 | $ | 14,402 | | | | |
| Mining operations: | | | | |
| Lower sales volumes: | | | | |
| Copper | (246) | | | | |
| Gold | (193) | | | | |
| Molybdenum | (124) | | | | |
| Higher (lower) averaged realized prices: | | | | |
| Copper | 704 | | | | |
| Gold | 356 | | | | |
| Molybdenum | (194) | | | | |
| Adjustments for prior year provisionally priced copper sales | (160) | | | | |
| Lower revenues from sales of purchased copper | (239) | | | | |
| Lower cobalt revenues | (301) | | | | |
| Lower Atlantic Copper revenues | (31) | | | | |
| Lower treatment and refining charges | 42 | | | | |
| Lower royalties and export duties | 77 | | | | |
| | | | |
| | | | |
| | | | |
| Other, including intercompany eliminations | 105 | | | | |
| Consolidated revenues - 2020 | $ | 14,198 | | | | |
|
| | | | | | | | |
| | 2018 | | 2017 | |
| | | | | |
| Consolidated revenues - prior year | $ | 16,403 |
| | $ | 14,830 |
| |
| Mining operations: | | | | |
| Higher (lower) sales volumes: | | | | |
| Copper | 326 |
| | (1,201 | ) | |
| Gold | 1,049 |
| | 598 |
| |
| Molybdenum | (9 | ) | | 175 |
| |
| (Lower) higher averaged realized prices: | | | | |
| Copper | (76 | ) | | 2,405 |
| |
| Gold | (33 | ) | | 47 |
| |
| Molybdenum | 299 |
| | 95 |
| |
| Adjustments for prior year provisionally priced copper sales | (151 | ) | | 76 |
| |
| Higher revenues from sales of purchased copper | 264 |
| | 361 |
| |
| Higher Atlantic Copper revenues | 270 |
| | 202 |
| |
| Higher royalties and export duties | (130 | ) | | (63 | ) | |
| Lower oil sales volumes | (17 | ) | | (1,269 | ) | |
| Other, including intercompany eliminations | 433 |
| | 147 |
| |
| Consolidated revenues - current year | $ | 18,628 |
| | $ | 16,403 |
| |
Mining Operations
Sales Volumes. Higher copper Copper sales volumes were slightly lower in 2018,2020, compared to 2017,2019, primarily reflect higher operatingreflecting lower mining rates in South America associated with COVID-19 restrictions and our April 2020 revised operating plans, partly offset by higher ore grades in Indonesia. Lower copper sales volumes in 2017, compared to 2016, primarily reflect lower sales volumes in North America mainly caused by lower ore grades.
Higher gold sales volumes in 2018,2020, compared to 2019, primarily
reflect lower mining and milling rates associated with 2017, primarily reflect higher operating rates and ore grades at PT-FI. Higher gold sales volumesthe ramp-up of underground mining in 2017, compared with 2016, primarily reflectIndonesia, partly offset by higher ore grades at PT-FI.grades.
ConsolidatedLower molybdenum sales volumes in 2018 approximated 2017 sales volumes. Higher molybdenum sales volumes in 2017,2020, compared with 2016,2019, primarily reflect increased demand and higher production.lower by-product production from Cerro Verde associated with lower mining rates as a result of COVID-19 restrictions.
Refer to “Operations” for further discussion of sales volumes at our mining operations.
Realized Prices. Our consolidated revenues can vary significantly as a result of fluctuations in the market prices of copper, gold and molybdenum. In 2018,2020, our average realized prices were 1 percent lower for copper and gold and 34 percent higher for molybdenum in 2018, compared with 2017. In 2017, our average realized prices were 298 percent higher for copper, 229 percent higher for gold and 1219 percent higherlower for molybdenum, compared with 2016.2019.
Average realized copper prices include net favorable (unfavorable) adjustments to current year provisionally priced copper sales (i.e., provisionally priced sales for the years 2020 and 2019) totaling $361 million for 2020 and $(24) million for 2019. Refer to Note 14 for a summary of total adjustments to prior period and current period provisionally priced sales. As discussed below and in “Disclosures About Market Risks-Commodity Price Risk”, substantially all of our copper concentrate and cathode sales contracts provide final copper pricing in a specified future month (generally one to four months from the shipment date). We record revenues and invoice customers at the time of shipment based on then-current LME prices, which results in an embedded derivative on provisionally priced concentrate and cathode sales that is adjusted to fair value through earnings each period, using the period-end forward prices, until final pricing on the date of settlement. To the extent final prices are higher or lower than what was recorded on a provisional basis, an increase or decrease to revenues is recorded each reporting period until the date of final pricing. Accordingly, in times of rising copper prices, our revenues benefit from adjustments to the final pricing of provisionally priced sales pursuant to contracts entered into in prior periods; in times of falling copper prices, the opposite occurs. Average realized copper prices include netin 2020 also included reductions totaling $24 million related to forward sales contracts (refer to Note 14).
Prior Year Provisionally Priced Copper Sales. Net (unfavorable) favorable adjustments to current periodprior years’ provisionally priced copper sales totaling $(240)(i.e., provisionally priced copper sales at December 31, 2019 and 2018) recorded in consolidated revenues totaled $(102) million in 2020 and $58 million in 2019. Refer to “Disclosures About Market Risks-Commodity Price Risk” for 2018, $408 million for 2017further discussion of our provisionally priced copper sales, and $257 million for 2016. Refer to Note 14 for a summary of total adjustments to prior period and current period provisionally priced copper sales.
Prior Year Provisionally Priced Copper Sales. Net adjustments to prior years’ provisionally priced copper sales recordedCobalt Revenues. Lower cobalt revenues in consolidated revenues totaled $(70) million2020, compared with 2019, primarily reflect the sale of our cobalt refinery and related cobalt cathode precursor business in 2018, $81 million in 2017 and $5 million in 2016. Refer to Note 14 for a summary of total adjustments to prior period and current period provisionally priced sales.fourth-quarter 2019.
Purchased Copper. We purchase copper cathode primarily for processing by our Rod & Refining operations. Purchased copper volumes totaled 356290 million pounds in 2018, 2732020 and 379 million pounds in 2017 and 188 million pounds in 2016.2019.
Atlantic Copper Revenues.Atlantic Copper revenues totaled $2.3 billion in 2018, $2.0 billion in 20172020 and $1.8$2.1 billion in 2016. Higher2019. Lower Atlantic Copper revenues in 2018,2020, compared with 2017,2019, primarily reflect higher copper andlower gold sales volumes. Higher Atlantic Copper revenues in 2017, compared
Treatment and Refining Charges. Revenues from our concentrate sales are recorded net of treatment charges (i.e., fees paid to smelters that are generally negotiated annually), which will vary with 2016, primarily reflect higher copper prices.the sales volumes and the price of copper.
Royalties and Export Duties. Primarily reflects royalties Royalties are primarily for sales from PT-FI that willand vary with the volume of metal sold and the prices of copper and gold. PT-FI also payswill continue to pay export duties until development progress for the new smelter in Indonesia exceeds 50 percent. The year 2019 included charges totaling $166 million, primarily associated with an unfavorable Indonesia Supreme Court ruling related to certain disputed PT-FI export duties (refer to Note 12 for further discussion). Refer to Note 13 for a summary of PT-FI’s royalties and export duties.
Oil & Gas Operations
Oil sales volumes totaled 1.4 million barrels (MMBbls) in 2018, 1.8 MMBbls in 2017 and 34.4 MMBbls in 2016. During the three years ended December 31, 2018, we completed the sales of substantially all of our oil and gas properties. As a result, oil sales volumes have significantly declined in 2018 and 2017, compared to 2016.
Production and Delivery Costs
Consolidated production and delivery costs totaled $11.7$10.0 billion in 2018, $10.32020, compared with $11.5 billion in 2017 and $10.7 billion in 2016. Higher2019. Lower consolidated production and delivery costs in 2018, compared to 2017,2020 primarily reflected higherreflect lower mining and milling costsrates related to (i) the ramp-up of underground mining at PT-FI, (ii) our April 2020 revised operating plans in North America and South America and higher copper purchases(iii) COVID-19 restrictions at our rod and refining operations. LowerCerro Verde mine in South America. Refer to Note 16 for details of production and delivery costs by operating segment.
Charges in 2017, compared to 2016, primarily reflected lower costs related to our oil and gas operations because of the sale of substantially all of our oil and gas properties in late 2016.
The year 2018 included net charges at PT-FI totaling $223 million (refer to the “Summary Financial Data” table above for a summary of these charges) and charges at Cerro Verde totaling $69 million related to its new three-year CLA.
The year 2017 included charges totaling $2032020 include $202 million associated with disputed royalties at Cerro Verde for prior yearsthe COVID-19 pandemic and $120 million associated with workforce reductions at PT-FI.revised operating plans (including employee separation costs).
The year 2016 included charges totaling $926 million associated with drillship settlements/idle rig and contract termination costs at U.S. oil and gas operations.
Mining Unit Site Production and Delivery Costs
Site production and delivery costs for our copper mining operations primarily include labor, energy and commodity-based inputs, such as sulphuric acid, reagents, liners, tires and explosives. Consolidated unit site production and delivery costs (before net noncash and other costs) for our copper mines averaged $1.76$1.88 per pound of copper in 2018, $1.602020 and $2.15 per pound in 20172019. Consolidated site production and $1.42delivery costs per pound of copper exclude certain charges associated with the COVID-19 pandemic and implementation of our April 2020 revised operating plans totaling $0.06 per pound of copper in 2016. Higher2020. Lower consolidated unit site production and delivery costs in 2018,2020, compared with 2017,2019, primarily reflected higher mining and millingreflect lower costs at ourin Indonesia, North America and South America mining operations as well as charges associated with Cerro Verde’s new three-year CLA. Higher consolidated unit site production and delivery costs(for the same reasons discussed in 2017, compared with 2016, primarily reflected lower consolidated copper sales volumes and higher mining, milling and employee costs at our South America mining operations.the paragraph above). Refer to “Operations – Unit Net Cash Costs” for further discussion of unit net cash costs associated with our operating divisions, and to “Product Revenues and Production Costs” for reconciliations of per pound costs by operating division to production and delivery costs applicable to sales reported in our consolidated financial statements.
Our copper mining operations require significant amounts of energy, principally diesel, electricity, coal and natural gas, most of which is obtained from third parties under long-term contracts. Our take-or-pay contractual obligations for electricity totaled approximately $301 million at December 31, 2020. We do not have take-or-pay contractual obligations for other energy commodities. Energy represented approximately 2016 percent of our copper mine site operating costs in 2018,2020, including purchases of approximately 220180 million gallons of diesel fuel; 8,1507,500 gigawatt hours of electricity at our North America and South America copper mining operations (we generate all of our power at our Indonesia mining operation); 740700 thousand metric tons of coal for our coal power plant in Indonesia; and 1 million MMBtu (million British thermal units) of natural gas at certain of our North America mines. Based on current cost estimates, energy will also approximate 2018 percent of our copper mine site operating costs for 2019.2021.
Depreciation, Depletion and Amortization
Depreciation will vary under the UOP method as a result of changes in sales volumes and the related UOP rates at our mining operations. Consolidated DD&A totaled $1.75 billion in 2018, $1.7 billion in 2017 and $2.5$1.5 billion in 2016. The year 2018 included $31 million of depreciation expense at Freeport Cobalt from December 2016 through December 2017 that was suspended while it was classified as held for sale. Lower2020 and $1.4 billion in 2019. Higher DD&A in 2017,2020, compared with 2016,2019, primarily reflectedrelates to assets placed in service associated with the impactramp-up of the sale of substantially all of our oilunderground mining at PT-FI.
Metals Inventory Adjustments
Unfavorable net realizable value metals inventory adjustments totaled $96 million in 2020 and gas properties$179 million in late 2016.2019. Metals inventory adjustments in 2020 were related to volatility in copper and molybdenum prices. Metals inventory adjustments in 2019 were mostly related to volatility in copper and cobalt prices.
Impairment of Oil and Gas Properties
Under full cost accounting rules, we recognized impairment charges totaling $4.3 billion in 2016 primarily for U.S. oil and gas properties. Refer to Note 1 for further discussion.
Selling, General and Administrative Expensesexpenses
Consolidated selling,Selling, general and administrative expenses totaled $443$370 million in 2018, $477 million in 20172020 and $597 million in 2016. Selling, general and administrative expenses included oil and gas contract termination costs of $17$394 million in 20172019. During second-quarter 2020, we implemented a series of actions to reduce administrative and $85 million for restructuringcentralized support costs in 2016.conjunction with our April 2020 revised operating plans, including a temporary reduction in certain employee benefits, furloughs and an employee separation program, and reductions in third party service costs, facilities costs, travel and other expenses. As part of the cost savings initiatives, the Board approved a 25 percent reduction in the salary of each of our Chief Executive Officer (CEO) and Chief Financial Officer (CFO) through the end of 2020. Our CEO and CFO also agreed to forgo substantially all of their reduced cash salary during 2020, which was substituted with an award of restricted stock units that vested at the end of 2020.
Consolidated selling, general and administrative expenses were net of capitalized general and administrative expenses at our oil and gas operations totaling $78 million in 2016; no such costs were capitalized in subsequent periods.
Mining Exploration and Research Expenses
Consolidated exploration and research expenses for our mining operations totaled $105$50 million in 2018, $932020 and $104 million in 20172019. Lower consolidated exploration and $63 millionresearch expenses in 2016. Our mining2020, compared to 2019, reflect a significant reduction in exploration and research activities are generally associated with our existing mines, focusing on opportunities to expand reserves and resources to support development of additional future production capacity. A drilling program to further delineate the Lone Star resource continues to indicate significant additional mineralization in this district, with higher ore grades than our other North America copper mines. Exploration results continue to indicate opportunities for significant future potential reserve additions in North America and South America.April 2020 revised operating plans. Exploration spending is expected to approximate $65$34 million in 2019.2021, consistent with 2020.
Environmental Obligations and Shutdown Costs
Environmental obligation costs reflect net revisions to our long-term environmental obligations, which vary from period to period because of changes to environmental laws and regulations, the settlement of environmental matters and/or circumstances affecting our operations that could result in significant changes in our estimates (refer to “Critical Accounting Estimates – Environmental Obligations” for further discussion). Shutdown costs include care-and-maintenancecare-
and-maintenance costs and any litigation, remediation or related expenditures associated with closed facilities or operations.
Net charges for environmental obligations and shutdown costs totaled $89$159 million in 2018, $2442020 and $105 million in 20172019. The year 2020 includes talc-related litigation charges of $132 million, primarily associated with a framework for the resolution of all current and $14future potential talc-related litigation, partly offset by $19 million in 2016. Higher costs in 2018 and 2017, compared with 2016, primarily reflect of net favorable adjustments to environmental obligations resulting from revised cost estimates.reserves. Refer to Note 12 for environmental obligations and litigation matters.
Net Gain on Sales of Assets
Net gain on sales of assets totaled $208$473 million in 2018, primarily reflecting gains on sales of assets, adjustments to the carrying value of assets no longer held for sale and fair value adjustments associated with contingent consideration related to the 2016 sale of onshore California oil and gas properties. Relative to 2018, we realized $50 million in contingent consideration related to the 2016 sale of oil and gas properties, which was received in 2019, and we would receive additional contingent consideration related to this transaction consisting of $50 million per year for 2019 and 2020, if the price of Brent crude oil averages over $70 per barrel in each of these calendar years.
Net gain on sales of assets totaled $81 million in 2017, primarily associated with oilthe sale of our interests in the Kisanfu undeveloped exploration project located in the Democratic Republic of Congo (DRC), and gas transactions and adjustments to assets held for sale.
Net gain on sales of assets totaled $649$417 million in 2016,2019, primarily related to the gains recognized for the Morenci and Timok transactions, partly offset by estimated losses on assets held for sale. Net gain on sales of assets for the year 2016 also included $183 million for contingent consideration, including $150$343 million associated with the sale of our interest in the Deepwater Gulf of Mexico (GOM) oil and gas properties, and $33 million for the fair valuelower zone of the potential $150Timok exploration project in Serbia and $59 million in contingent consideration fromassociated with the sale of the onshore California oilour cobalt refinery in Kokkola, Finland, and gas properties discussed above.related cobalt cathode precursor business.
Refer to Note 2 for further discussion of dispositions.
Interest Expense, Net
Consolidated interest costs (before capitalization and excluding interest expense associated with disputed Cerro Verde royalties)international tax matters) totaled $671$655 million in 2018, $7772020and$675 million in 2017 and $854 million in 2016. Lower interest expense in 2018 and 2017, compared2019. Refer to 2016, reflects a decrease in total debt.Note 8 for further discussion of our 2020 debt transactions. Interest expense associated with disputed Cerro Verde royalties (refer to Note 12 for further discussion)PT-FI’s historical contested tax disputes totaled $370$35 million in 20182020 and$145 $78 million in 2017.2019. Interest expense associated with South America tax matters totaled $61 million in 2020 and $10 million in 2019.
Capitalized interest varies with the level of expenditures for our development projects and average interest rates on our borrowings, and totaled $96 million in 2018, $121 million in 2017 and $99$147 million in 2016.2020 and $149 million in 2019. Refer to “Operations” and “Capital Resources and Liquidity – Investing Activities” for further discussion of current development projects.
Net Gain on Early Extinguishment and Exchanges of Debt
Net gain on early extinguishment and exchanges of debt totaled $7 millionin 2018, $21 million in 2017 and $26 million in 2016. Refer to Note 8 for further discussion.
Other Income (Expense), Net
Other income (expense), net, primarily includes foreign currency translation adjustments and interest income, and totaled $76$59 million in 2018, $(8)2020 and $(138) million in 2017 and $(14) million in 2016.2019. The year 2018, compared to2020 included the sale of royalty interests and other net credits. The year 2017, reflects higher interest income and $302019 included charges at PT-FI totaling $188 million of interest received on tax refunds, mostly associated with the refund of PT-FI’s prior years’historical contested tax disputes (refer to Note 11) and a currency exchange adjustment to value-added tax receivables.
Income Taxes
Following is a summary of the approximate amounts used in the calculation of our consolidated income tax (provision) benefitprovision from continuing operations for the years ended December 31 (in millions, except percentages):
| | | | | | | | | | | | | | | | | | | | | | | | | | | | | | | | | | | | | | |
| 2020 | | 2019 | |
| Income (Loss)a | | Effective
Tax Rate | | Income Tax
(Provision)
Benefit | | Income (Loss)a | | Effective
Tax Rate | | Income Tax
(Provision)
Benefit | |
U.S.b | $ | (532) | | | 11% | | $ | 60 | | c | $ | (277) | | | N/A | | $ | — | | d,e |
| South America | 466 | | | 51% | | (239) | | f | 497 | | | 48% | | (241) | | |
| Indonesia | 1,342 | | | 45% | | (608) | | g | 340 | | | 44% | | (149) | | h |
| Gain on sale of Kisanfu | 486 | | | N/A | | (135) | | | — | | | N/A | | — | | |
PT-FI historical contested tax disputesi | (44) | | | 5% | | 2 | | | (201) | | | (39)% | | (78) | | |
| PT-FI export duty matter | — | | | N/A | | — | | | (155) | | j | 31% | | 48 | | |
| | | | | | | | | | | | |
| | | | | | | | | | | | |
| Adjustment to deferred taxes | — | | | N/A | | — | | | — | | | N/A | | (49) | | k |
| | | | | | | | | | | | |
| Cerro Verde royalty dispute | — | | | N/A | | — | | | (16) | | | N/A | | 2 | | l |
| | | | | | | | | | | | |
| | | | | | | | | | | | |
| | | | | | | | | | | | |
| Eliminations and other | 79 | | | N/A | | (24) | | | 118 | | | N/A | | (43) | | |
| | | | | | | | | | | | |
| | | | | | | | | | | | |
| | | | | | | | | | | | |
| Consolidated | $ | 1,797 | | | 53% | m | $ | (944) | | | $ | 306 | | | (167)% | | $ | (510) | | |
a.Represents income (loss) from continuing operations by geographic location before income taxes and equity in affiliated companies’ net earnings.
b.In addition to our North America mining operations, the U.S. jurisdiction reflects corporate-level expenses, which include interest expense associated with senior notes, general and administrative expenses, and environmental obligations and shutdown costs.
|
| | | | | | | | | | | | | | | | | | | | |
| | 2018 | | 2017 | |
| | Income (Loss)a | | Effective Tax Rate | | Income Tax
(Provision)
Benefit | | Income (Loss)a | | Effective
Tax Rate | | Income Tax
(Provision)
Benefit | |
| U.S. | $ | 352 |
| | 7% | | $ | (24 | ) | b,c | $ | 41 |
| | (156)% | | $ | 64 |
| d |
| South America | 706 |
| | 43% | | (303 | ) | | 1,059 |
| | 41% | | (439 | ) | |
| Indonesia | 3,027 |
| | 42% | | (1,284 | ) | e | 2,033 |
| | 43% | | (869 | ) | |
| U.S. tax reform | — |
| | N/A | | 123 |
| f | — |
| | N/A | | 393 |
| f |
| Cerro Verde royalty dispute | (406 | ) | | N/A | | 35 |
| g | (348 | ) | | N/A | | (7 | ) | g |
| Change in PT-FI tax rates | — |
| | N/A | | 504 |
| h | — |
| | N/A | | — |
| |
| Eliminations and other | 213 |
| | N/A | | (42 | ) | | 117 |
| | N/A | | (25 | ) | |
| Consolidated FCX | $ | 3,892 |
| | 25% | | $ | (991 | ) | | $ | 2,902 |
| | 30% | | $ | (883 | ) | |
d.Includes tax credits of $29 million associated with adjustments to the calculation of transition tax related to U.S. tax reform and $24 million associated with state law changes and the settlement of state income tax examinations. |
| | | | | | | | | | |
| | 2016 | |
| | Income (Loss)a | | Effective
Tax Rate | | Income Tax
(Provision)
Benefit | |
| U.S. | $ | (865 | ) | | 41% | | $ | 357 |
| i |
| South America | 501 |
| | 43% | | (216 | ) | j |
| Indonesia | 1,058 |
| | 42% | | (442 | ) | |
| Impairment of oil and gas properties | (4,317 | ) | | N/A | | — |
| k |
| Eliminations and other | 151 |
| | N/A | | (70 | ) | |
| Consolidated FCX | $ | (3,472 | ) | | (11)% | | $ | (371 | ) | |
| |
a. | Represents income (loss) from continuing operations by geographic location before income taxes and equity in affiliated companies’ net earnings. |
| |
b. | The year 2018 includes net tax credits of $9 million for changes in valuation allowances and a tax credit of $5 million associated with the settlement of a state income tax examination. |
| |
c. | The year 2018 also includes a tax charge of $29 million associated with adjustments to the calculation of transition tax resulting from recently released guidance by the U.S. Internal Revenue Service. |
| |
d. | The year 2017 includes net tax credits of $24 million for changes in valuation allowances and $21 million associated with alternative minimum tax (AMT) credit carryforwards, which are not related to the AMT credits resulting from U.S. tax reform that are presented separately in the above tables. |
| |
e. | Includes a tax credit of $20 million ($17 million net of noncontrolling interest) for adjustments to PT-FI's historical tax positions. |
| |
f. | The Tax Cuts and Jobs Act (the Act), which was enacted on December 22, 2017, included significant modifications to U.S. tax laws and created many new complex tax provisions. In December 2018, we completed our analysis of the Act and recognized benefits totaling $123 million ($119 million net of noncontrolling interest) in 2018 associated with AMT credit refunds. During 2017, we recorded net tax benefits related to specific provisions of the Act totaling $393 million, reflecting the reversal of valuation allowances associated with anticipated refunds of AMT credits through 2021 ($272 million) and a decrease in corporate income tax rates ($121 million). |
| |
g. | Refer to Note 12 for a summary of charges related to Cerro Verde’s disputed royalties for prior years. |
| |
h. | Reflects a tax credit of $504 million ($453 million net of noncontrolling interest) resulting from the change in PT-FI's tax rates in accordance with its IUPK. |
| |
i. | Includes tax credits of $357 million associated with AMT credits, changes to valuation allowances and net operating loss carryback claims. |
| |
j. | Includes a net tax credit of $13 million ($17 million net of noncontrolling interests) related to changes in Peruvian tax rules. |
| |
k. | As a result of the impairment to U.S. oil and gas properties, we recorded tax charges to establish valuation allowances against U.S. federal and state deferred tax assets that will not generate a future benefit. |
e.Includes a tax charge of $53 million associated with the sale of our interest in the lower zone of the Timok exploration project in Serbia.
f.Includes tax charges at Cerro Verde of $15 million ($8 million net of noncontrolling interest) primarily associated with adjustments to profit sharing for prior years.
g.Includes tax charges of $21 million ($17 million net of noncontrolling interests) associated with establishing a tax reserve related to the treatment of prior year contractor support costs and $8 million ($7 million net of noncontrolling interest) associated with an unfavorable 2012 Indonesia Supreme Court ruling.
h.Includes a tax charge of $5 million ($4 million net of noncontrolling interests) primarily for non-deductible penalties related to PT-FI’s surface water tax settlement.
i.Refer to Note 11 for further discussion of a framework for resolution of these historical contested tax disputes.
j.Refer to Note 12 for further discussion of the unfavorable Indonesia Supreme Court ruling related to certain disputed PT-FI export duties.
k.Includes net tax charges totaling $49 million ($15 million net of noncontrolling interests) primarily to adjust deferred taxes on historical balance sheet items in accordance with tax accounting principles.
l.Refer to Note 12 for a summary of charges related to Cerro Verde’s disputed royalties for prior years.
m.Our consolidated effective income tax rate is a function of the combined effective tax rates for the jurisdictions in which we operate. Accordingly, variationsoperate, excluding the U.S. jurisdiction.
Assuming achievement of current sales volume and cost estimates and average prices of $3.50 per pound for copper, $1,850 per ounce for gold and $9.00 per pound for molybdenum for 2021, we estimate our consolidated effective tax rate for the year 2021 would approximate 35 percent. Changes in projected sales volumes and average prices during 2021 would incur tax impacts at estimated effective rates of 38 percent for Indonesia, 39 percent for Peru and 0 percent for the U.S.
Variations in the relative proportions of jurisdictional income result in fluctuations to our consolidated effective income tax rate. Assuming achievement of current sales volume and cost estimates and average prices of $2.75 per pound for copper, $1,300 per ounce for gold and $12.00 per pound for molybdenum for 2019, we estimate our consolidated effective tax rate for the year 2019 would approximate 46 percent (comprised of an estimated effective rate of 0 percent on U.S. income, 38 percent on Indonesia income and 40 percent on South America income). Because of our U.S. tax position, we do not record a financial statement impact for income or losses generated in the U.S.; therefore, our consolidated effective rate is generally higher than the international rates at lower copper prices and lower than international rates at higher copper prices.
Refer to Note 11 for further discussion of income taxes.
Net (Loss) Income from Discontinued Operations
In November 2016, we completed the sale of our interest in TFHL. In accordance with accounting guidelines, the results of TFHL have been reported as discontinued operations for all periods presented. Net (loss) income from discontinued operations totaled $(15) million in 2018 and $66 million in 2017, primarily reflecting adjustments to the estimated fair value of contingent consideration related to the sale of our interest in TFHL, which will continue to be adjusted through December 31, 2019. Net loss from discontinued operations of $193 million in 2016 primarily reflected the loss on disposal. Refer to Note 2 for further discussion.
Gain on Redemption and Preferred Dividends Attributable to Redeemable Noncontrolling Interest
In connection with the December 2016 sale of the Deepwater GOM oil and gas properties, we settled a preferred stock obligation, which resulted in the recognition of a $199 million gain on redemption. Refer to Note 2 for further discussion.
OPERATIONS
During 2020, we announced our commitment to the Copper Mark. The Copper Mark is a new, comprehensive assurance framework that demonstrates the industry’s responsible production practices and contribution to the United Nations Sustainable Development Goals. It is the first and only framework developed specifically for the copper industry and enables each site to demonstrate to customers, investors and other stakeholders their responsible production performance. Four of our sites were awarded the Copper Mark in 2020 (Cerro Verde, El Abra, Miami and the Atlantic Copper smelter). We have future plans to validate all of our remaining copper operating sites against the Copper Mark requirements.
During 2020, we continued to advance innovation initiatives designed to enhance productivity, expand margins and reduce the capital intensity of our business through the utilization of new technology applications in combination with a more interactive operating structure. We were successful in implementing and embedding many of these initiatives across our operations by utilizing data science, machine learning and integrated cross-functional agile teams to identify opportunities and drive improved overall performance.
North America Copper Mines
We operate seven open-pit copper mines in North America – Morenci, Bagdad, Safford (including Lone Star), Sierrita and Miami in Arizona, and Chino and Tyrone in New Mexico. All of the North America mining operations are wholly owned, except for Morenci.
We record our 72 percent undivided joint venture interest in Morenci using the proportionate consolidation method. In May 2016, we completed the sale of an additional 13 percent undivided interest in Morenci. As a result of the transaction, our undivided interest in Morenci was prospectively reduced from 85 percent to 72 percent. Refer to Note 2 for further discussion.
The North America copper mines include open-pit mining, sulfide ore concentrating, leaching and solution extraction/electrowinning (SX/EW) operations. A majority of the copper produced at our North America copper mines
is cast into copper rod by our Rod & Refining segment. The remainder of our North America copper salesproduction is in the form ofsold as copper cathode or copper concentrate, a portion of which is shipped to Atlantic Copper (our wholly owned smelter). Molybdenum concentrate, gold and silver are also produced by certain of our North America copper mines.
Operating and Development Activities. We have significant undeveloped reserves and resources in Our North America
and a portfolio of potential long-term development projects. Future investments will be undertaken based on the results of economic and technical feasibility studies, and are dependent on market conditions. We operating sites continue to study opportunities to reduce the capital intensityfocus on strong execution of our potential long-term development projects.
Through exploration drilling, we have identified a significant resource at our wholly owned Lone Star project located near the Safford operation in eastern Arizona. An initial project to develop the Lone Star oxide ores commenced in first-quarter 2018, with first production expected by the end of 2020. Initial productionoperating plans. Production from the Lone Star oxide oresore body at Safford where we completed development in 2020 continues to ramp-up on schedule and is expected to average approximatelyexceed 200 million pounds of copper for the year 2021. Our plan is to advance studies for potential expansions and long-term development options for the large-scale sulfide resources at Lone Star.
After shutting down mining activities in accordance with our April 2020 revised operating plans, in January 2021, we restarted mining activities at the Chino mine at a reduced rate of approximately 100 million pounds of copper per year. Total capital costs, including mine equipment and pre-production stripping, are expected to approximate $850 millionyear (approximately 50 percent of capacity).
We have substantial resources in the U.S., primarily associated with existing mining operations, and will benefit from the utilization of existing infrastructure at the adjacent Safford operation. As of December 31, 2018, approximately $290 million has been incurredcontinue to assess options for this project. The project also advances exposure to a significant sulfide resource. We expect to incorporate recent positive drilling and ongoing results in our future development plans. further growth.
Operating Data. Following is summary operating data for the North America copper mines for the years ended December 31:
| | | | | | | | | | | | | | |
| | 2020 | | 2019 | |
| Operating Data, Net of Joint Venture Interests | | | | |
Copper (millions of recoverable pounds) | | | | |
| Production | 1,418 | | | 1,457 | | |
| Sales, excluding purchases | 1,422 | | | 1,442 | | |
| Average realized price per pound | $ | 2.82 | | a | $ | 2.74 | | |
| | | | |
Molybdenum (millions of recoverable pounds) | | | | |
Productionb | 33 | | | 32 | | |
| | | | |
| 100% Operating Data | | | | |
| Leach operations | | | | |
| Leach ore placed in stockpiles (metric tons per day) | 714,300 | | | 750,900 | | |
| Average copper ore grade (percent) | 0.27 | | | 0.23 | | |
| Copper production (millions of recoverable pounds) | 1,047 | | | 993 | | |
| | | | |
| Mill operations | | | | |
| Ore milled (metric tons per day) | 279,700 | | | 326,100 | | |
| Average ore grade (percent): | | | | |
| Copper | 0.35 | | | 0.34 | | |
| Molybdenum | 0.02 | | | 0.02 | | |
| Copper recovery rate (percent) | 84.1 | | | 87.0 | | |
| Copper production (millions of recoverable pounds) | 647 | | | 748 | | |
|
| | | | | | | | | | | | |
| | 2018 | | 2017 | | 2016 | |
| Operating Data, Net of Joint Venture Interests | | | | | | |
Copper (millions of recoverable pounds) | | | | | | |
| Production | 1,404 |
| | 1,518 |
| | 1,831 |
| |
| Sales, excluding purchases | 1,428 |
| | 1,484 |
| | 1,841 |
| a |
| Average realized price per pound | $ | 2.96 |
| | $ | 2.85 |
| | $ | 2.24 |
| |
| | | | | | | |
Molybdenum (millions of recoverable pounds) | | | | | | |
Productionb | 32 |
| | 33 |
| | 33 |
| |
| | | | | | | |
| 100% Operating Data | | | | | | |
| Leach operations | | | | | | |
| Leach ore placed in stockpiles (metric tons per day) | 681,400 |
| | 679,000 |
| | 737,400 |
| |
| Average copper ore grade (percent) | 0.24 |
| | 0.28 |
| | 0.31 |
| |
| Copper production (millions of recoverable pounds) | 951 |
| | 1,016 |
| | 1,120 |
| |
| | | | | | | |
| Mill operations | | | | | | |
| Ore milled (metric tons per day) | 301,000 |
| | 299,500 |
| | 300,500 |
| |
| Average ore grade (percent): | | | | | | |
| Copper | 0.35 |
| | 0.39 |
| | 0.47 |
| |
| Molybdenum | 0.02 |
| | 0.03 |
| | 0.03 |
| |
| Copper recovery rate (percent) | 87.8 |
| | 86.4 |
| | 85.5 |
| |
| Copper production (millions of recoverable pounds) | 719 |
| | 788 |
| | 958 |
| |
| |
a. | Included approximately 60 million pounds of copper from the 13 percent undivided interest in Morenci that we sold in May 2016. |
| |
b. | Refer to “Consolidated Results” for our consolidated molybdenum sales volumes, which include sales of molybdenum produced at the North America copper mines. |
a.Includes reductions to average realized prices of $0.02 per pound of copper related to forward sales contracts covering 150 million pounds of copper sales for May and June 2020 at a fixed price of $2.34 per pound. There are no remaining forward sales contracts.
b.Refer to “Consolidated Results” for our consolidated molybdenum sales volumes, which include sales of molybdenum produced at the North America copper mines.
Copper sales volumes from our North America copper mines totaled 1.4 billion pounds in 2018, 1.5 billion pounds in 2017 2020and 1.8 billion pounds in 2016. The decreases in 2018 and 2017, compared with 2016, primarily reflect lower ore grades.
2019. North America copper sales are estimated to approximate 1.41.5 billion pounds of copper in 2019.2021. Refer to “Outlook” for projected molybdenum sales volumes.
Unit Net Cash Costs. Unit net cash costs per pound of copper is a measure intended to provide investors with information about the cash-generating capacity of our mining operations expressed on a basis relating to the primary metal product for our respective operations. We use this measure for the same purpose and for monitoring operating performance by our mining operations. This information differs from measures of performance determined in accordance with U.S. GAAP and should not be considered in isolation or as a substitute for measures of performance determined in accordance with U.S. GAAP. This measure is presented by other metals mining companies, although our measure may not be comparable to similarly titled measures reported by other companies.
Gross Profit per Pound of Copper and Molybdenum
The following tables summarizetable summarizes unit net cash costs and gross profit per pound of copper at our North America copper mines for the threetwo years ended December 31, 2018.2020. Refer to “Product Revenues and Production Costs” for an explanation of the “by-product” and “co-product” methods and a reconciliation of unit net cash costs per pound to production and delivery costs applicable to sales reported in our consolidated financial statements.
| | | | | | | | | | | | | | | | | | | | | | | | | | | | | | | | | | | |
| | 2020 | | 2019 |
| | By- | | Co-Product Method | | By- | | Co-Product Method |
| Product
Method | | Copper | | Molyb- denuma | | Product
Method | | Copper | | Molyb- denuma |
| Revenues, excluding adjustments | $ | 2.82 | | b | $ | 2.82 | | | $ | 8.62 | | | $ | 2.74 | | | $ | 2.74 | | | $ | 11.51 | |
| Site production and delivery, before net noncash | | | | | | | | | | | |
| and other costs shown below | 1.90 | | | 1.78 | | | 6.84 | | | 2.05 | | | 1.88 | | | 9.29 | |
| By-product credits | (0.19) | | | — | | | — | | | (0.24) | | | — | | | — | |
| Treatment charges | 0.10 | | | 0.10 | | | — | | | 0.11 | | | 0.11 | | | — | |
| Unit net cash costs | 1.81 | | | 1.88 | | | 6.84 | | | 1.92 | | | 1.99 | | | 9.29 | |
| DD&A | 0.25 | | | 0.23 | | | 0.56 | | | 0.24 | | | 0.21 | | | 0.72 | |
| Metals inventory adjustments | 0.03 | | | 0.03 | | | — | | | 0.02 | | | 0.02 | | | — | |
| Noncash and other costs, net | 0.10 | | c | 0.10 | | | 0.09 | | | 0.08 | | | 0.07 | | | 0.29 | |
| Total unit costs | 2.19 | | | 2.24 | | | 7.49 | | | 2.26 | | | 2.29 | | | 10.30 | |
| Revenue adjustments, primarily for pricing on prior period open sales | (0.02) | | | (0.02) | | | — | | | — | | | — | | | — | |
| Gross profit per pound | $ | 0.61 | | | $ | 0.56 | | | $ | 1.13 | | | $ | 0.48 | | | $ | 0.45 | | | $ | 1.21 | |
| | | | | | | | | | | |
| Copper sales (millions of recoverable pounds) | 1,420 | | | 1,420 | | | | | 1,441 | | | 1,441 | | | |
Molybdenum sales (millions of recoverable pounds)a | | | | | 33 | | | | | | | 32 | |
|
| | | | | | | | | | | | | | | | | | | | | | | |
| | 2018 | | 2017 |
| | By- | | Co-Product Method | | By- | | Co-Product Method |
| | Product Method | | Copper | | Molyb- denuma | | Product Method | | Copper | | Molyb- denuma |
| Revenues, excluding adjustments | $ | 2.96 |
| | $ | 2.96 |
| | $ | 11.64 |
| | $ | 2.85 |
| | $ | 2.85 |
| | $ | 7.80 |
|
| Site production and delivery, before net noncash | | | | | | | | | | | |
| and other costs shown below | 1.94 |
| | 1.77 |
| | 9.03 |
| | 1.63 |
| | 1.52 |
| | 5.75 |
|
| By-product credits | (0.26 | ) | | — |
| | — |
| | (0.17 | ) | | — |
| | — |
|
| Treatment charges | 0.11 |
| | 0.10 |
| | — |
| | 0.10 |
| | 0.10 |
| | — |
|
| Unit net cash costs | 1.79 |
| | 1.87 |
| | 9.03 |
| | 1.56 |
| | 1.62 |
| | 5.75 |
|
| DD&A | 0.25 |
| | 0.23 |
| | 0.73 |
| | 0.29 |
| | 0.27 |
| | 0.54 |
|
| Noncash and other costs, net | 0.07 |
| | 0.06 |
| | 0.17 |
| | 0.06 |
| | 0.06 |
| | 0.07 |
|
| Total unit costs | 2.11 |
| | 2.16 |
| | 9.93 |
| | 1.91 |
| | 1.95 |
| | 6.36 |
|
| Revenue adjustments, primarily for pricing on prior period open sales | — |
| | — |
| | — |
| | — |
| | — |
| | — |
|
| Gross profit per pound | $ | 0.85 |
| | $ | 0.80 |
| | $ | 1.71 |
| | $ | 0.94 |
| | $ | 0.90 |
| | $ | 1.44 |
|
| | | | | | | | | | | | |
| Copper sales (millions of recoverable pounds) | 1,426 |
| | 1,426 |
| | | | 1,481 |
| | 1,481 |
| | |
Molybdenum sales (millions of recoverable pounds)a | | | | | 32 |
| | | | | | 33 |
|
| |
a. | Reflects sales of molybdenum produced by certain of the North America copper mines to our molybdenum sales company at market-based pricing. |
a.Reflects sales of molybdenum produced by certain of the North America copper mines to our molybdenum sales company at market-based pricing.
b.Includes reductions to average realized prices of $0.02 per pound of copper related to forward sales contracts covering 150 million pounds of copper sales for May and June 2020 at a fixed price of $2.34 per pound. There are no remaining forward sales contracts.
c.Includes charges totaling $0.02 per pound of copper, primarily associated with our April 2020 revised operating plans (including employee separation costs) and the COVID-19 pandemic (including health and safety costs).
Our North America copper mines have varying cost structures because of differences in ore grades and characteristics, processing costs, by-product credits and other factors. During 2018,2020, average unit net cash costs (net of by-product credits) for the North America copper mines ranged from $1.55$1.61 per pound to $2.63$2.28 per pound at the individual mines and averaged $1.79$1.81 per pound. HigherLower average unit net cash costs (net of by-product credits) of $1.79$1.81 in 2018,2020, compared with $1.56$1.92 per pound in 2017,2019, primarily reflected higher mining and milling costs,reflect the impact of our April 2020 revised operating plans, partly offset by higherlower by-product credits because of lower molybdenum credits.prices.
Because certain assets are depreciated on a straight-line basis, North America’s average unit depreciation rate may vary with asset additions and the level of copper production and sales. North America’s average unit depreciation rate is expected to be lower in 2019, compared to 2018, as a result of reserve additions. See “Critical Accounting Estimates-Mineral Reserves” for further discussion.
Average unit net cash costs (net of by-product credits) for our North America copper mines are expected to
approximate $1.86 per pound of copper in 2019,2021, based on achievement of current sales volume and cost
estimates and assuming an average molybdenum price of $12.00$9.00 per pound.pound for the year 2021. The impact of price changes during 2021 on North America’s average unit net cash costs in 2019for the year 2021 would change by approximately $0.04approximate $0.05 per pound for each $2 per pound change in the average price of molybdenum.
|
| | | | | | | | | | | | | | | | | | | | | | | |
| | 2017 | | 2016 |
| | By- | | Co-Product Method | | By- | | Co-Product Method |
| | Product Method | | Copper | | Molyb- denuma | | Product Method | | Copper | | Molyb- denuma |
| Revenues, excluding adjustments | $ | 2.85 |
| | $ | 2.85 |
| | $ | 7.80 |
| | $ | 2.24 |
| | $ | 2.24 |
| | $ | 6.34 |
|
| Site production and delivery, before net noncash | | | | | | | | | | | |
| and other costs shown below | 1.63 |
| | 1.52 |
| | 5.75 |
| | 1.41 |
| | 1.34 |
| | 4.91 |
|
| By-product credits | (0.17 | ) | | — |
| | — |
| | (0.12 | ) | | — |
| | — |
|
| Treatment charges | 0.10 |
| | 0.10 |
| | — |
| | 0.11 |
| | 0.10 |
| | — |
|
| Unit net cash costs | 1.56 |
| | 1.62 |
| | 5.75 |
| | 1.40 |
| | 1.44 |
| | 4.91 |
|
| DD&A | 0.29 |
| | 0.27 |
| | 0.54 |
| | 0.29 |
| | 0.27 |
| | 0.60 |
|
| Noncash and other costs, net | 0.06 |
| | 0.06 |
| | 0.07 |
| | 0.04 |
| | 0.04 |
| | 0.06 |
|
| Total unit costs | 1.91 |
| | 1.95 |
| | 6.36 |
| | 1.73 |
| | 1.75 |
| | 5.57 |
|
| Revenue adjustments, primarily for pricing on prior period open sales | — |
| | — |
| | — |
| | — |
| | — |
| | — |
|
| Gross profit per pound | $ | 0.94 |
| | $ | 0.90 |
| | $ | 1.44 |
| | $ | 0.51 |
| | $ | 0.49 |
| | $ | 0.77 |
|
| | | | | | | | | | | | |
| Copper sales (millions of recoverable pounds) | 1,481 |
| | 1,481 |
| | | | 1,836 |
| | 1,836 |
| | |
Molybdenum sales (millions of recoverable pounds)a | | | | | 33 |
| | | | | | 33 |
|
| |
a. | Reflects sales of molybdenum produced by certain of the North America copper mines to our molybdenum sales company at market-based pricing. |
Unit net cash costs (net of by-product credits) for our North America copper mines increased to $1.56 per pound of copper in 2017, compared with $1.40 per pound in 2016, primarily reflecting lower copper sales volumes.
South America Mining
We operate two copper mines in South America – Cerro Verde in Peru (in which we own a 53.56 percent interest) and El Abra in Chile (in which we own a 51 percent interest), which are consolidated in our financial statements.
South America mining includes open-pit mining, sulfide ore concentrating, leaching and SX/EW operations. Production from our South America mines is sold as copper concentrate or cathode under long-term contracts. Our South America mines also sell a portion of their copper concentrate production to Atlantic Copper. In addition to copper, the Cerro Verde mine produces molybdenum concentrate and silver.
Operating and Development Activities. During fourth-quarter 2020, Cerro Verde’s expanded operations benefit from its large-scale, long-lived reserves and cost efficiencies. Cerro Verde’s concentrator facilities haveVerde continued to perform well, withincrease milling rates to an average mill throughput rates of 387,600373,200 metric tons of ore per day for the year 2018. During 2018,while operating consistent with our April 2020 revised operating plans and under strict COVID-19 restrictions and protocols. We expect Cerro Verde received a modified environmental permit allowing itVerde's mill rates to operate its existing concentrator facilities at rates up to 409,500average approximately 360,000 metric tons of ore per day.day in 2021 with the potential to ramp-up to pre-COVID-19 levels approximating 400,000 metric tons of ore per day as COVID-19 restrictions are lifted.
El Abra plans to increase operating rates during 2021 to pre-COVID-19 levels, subject to ongoing monitoring of public health conditions in Chile. Incremental copper production associated with increasing El Abra's stacking rates from 65,000 metric tons of ore per day to over 100,000 metric tons of ore per day, approximates 70 million pounds per year beginning in 2022.
We continue to evaluate a large-scale expansion at El Abra to process additional sulfide material and to achieve higher recoveries. El Abra’sAbra's large sulfide resource could potentially support a major mill project similar to facilities constructed at Cerro Verde. Technical and economic studies are being advancedcontinue to be evaluated to determine the optimal scope and timing for the project in parallel with extending the life of the project.current leaching operation.
Operating Data. Following is summary operating data for our South America mining operations for the years ended December 31.
| | | | | | | | | | | |
| | 2020 | | 2019 |
Copper (millions of recoverable pounds) | | | |
| Production | 979 | | | 1,183 | |
| Sales | 976 | | | 1,183 | |
| Average realized price per pound | $ | 3.05 | | | $ | 2.71 | |
| | | |
| | | |
| | | |
| | | |
| | | |
| | | |
Molybdenum (millions of recoverable pounds) | | | |
Productiona | 19 | | | 29 | |
| | | |
| Leach operations | | | |
| Leach ore placed in stockpiles (metric tons per day) | 160,300 | | | 205,900 | |
| Average copper ore grade (percent) | 0.35 | | | 0.37 | |
| Copper production (millions of recoverable pounds) | 241 | | | 268 | |
| | | |
| Mill operations | | | |
| Ore milled (metric tons per day) | 331,600 | | b | 393,100 | |
| Average ore grade (percent): | | | |
| Copper | 0.34 | | | 0.36 | |
| | | |
| Molybdenum | 0.01 | | | 0.02 | |
| Copper recovery rate (percent) | 84.3 | | | 83.5 | |
| Copper production (millions of recoverable pounds) | 738 | | | 916 | |
|
| | | | | | | | | | | |
| | 2018 | | 2017 | | 2016 |
Copper (millions of recoverable pounds) | | | | | |
| Production | 1,249 |
| | 1,235 |
| | 1,328 |
|
| Sales | 1,253 |
| | 1,235 |
| | 1,332 |
|
| Average realized price per pound | $ | 2.87 |
| | $ | 2.97 |
| | $ | 2.31 |
|
| | | | | | |
Molybdenum (millions of recoverable pounds) | | | | | |
Productiona | 28 |
| | 27 |
| | 21 |
|
| | | | | | |
| Leach operations | | | | | |
| Leach ore placed in stockpiles (metric tons per day) | 195,200 |
| | 142,800 |
| | 149,100 |
|
| Average copper ore grade (percent) | 0.33 |
| | 0.37 |
| | 0.41 |
|
| Copper production (millions of recoverable pounds) | 287 |
| | 255 |
| | 328 |
|
| | | | | | |
| Mill operations | | | | | |
| Ore milled (metric tons per day) | 387,600 |
| | 360,100 |
| | 353,400 |
|
| Average ore grade (percent): | | | | | |
| Copper | 0.38 |
| | 0.44 |
| | 0.43 |
|
| Molybdenum | 0.01 |
| | 0.02 |
| | 0.02 |
|
| Copper recovery rate (percent) | 84.3 |
| | 81.2 |
| | 85.8 |
|
| Copper production (millions of recoverable pounds) | 962 |
| | 980 |
| | 1,000 |
|
| |
a. | a.Refer to “Consolidated Results” for our consolidated molybdenum sales volumes, which include sales of molybdenum produced at Cerro Verde. |
Consolidated copper sales volumes, from South Americawhich include sales of 1.25 billion pounds in 2018molybdenum produced at Cerro Verde.
b.Cerro Verde mill operations were approximately 1 percent higher than 1.24 billion pounds in 2017, primarily reflecting higher mining and milling rates, partly offsetnegatively impacted by lower ore grades.COVID-19 restrictions.
Lower consolidated copper sales volumes from South America of 1.241.0 billion pounds in 2017,2020, compared with 1.331.2 billion pounds in 2016,2019, primarily reflectedreflect lower recoveryore grades and mining rates associated with COVID-19 protocols at Cerro Verde and lower ore gradesour April 2020 revised operating plans at El Abra.Abra, partly offset by higher recovery rates.
Copper sales from South America mines are expected to approximate 1.31.0 billion pounds of copper in 2019.2021, consistent with the year 2020. Refer to “Outlook” for projected molybdenum sales volumes. Since late January 2019, our El Abra operation has experienced heavy rainfall and electrical storms, resulting in a suspension of operations since February 4, 2019. We have been unable to assess damages because of poor road conditions and inaccessible areas and we do not currently know when normal operations will resume. We estimate the impact on 2019 production will approximate 8 million pounds of copper through mid-February 2019, and additional impacts of approximately 600 thousand pounds of copper per day are expected until normal operations resume.
Unit Net Cash Costs. Unit net cash costs per pound of copper is a measure intended to provide investors with information about the cash-generating capacity of our mining operations expressed on a basis relating to the primary metal product for our respective operations. We use this measure for the same purpose and for monitoring operating performance by our mining operations. This information differs from measures of performance determined in accordance with U.S. GAAP and should not be considered in isolation or as a substitute for measures of performance determined in accordance with U.S. GAAP. This measure is presented by other metals mining companies, although our measure may not be comparable to similarly titled measures reported by other companies.
Gross Profit per Pound of Copper
The following tables summarizetable summarizes unit net cash costs and gross profit per pound of copper at our South America mining operations for the threetwo years ended December 31, 2018.2020. Unit net cash costs per pound of copper are reflected under the by-product and co-product methods as the South America mining operations also had sales of molybdenum and silver. Refer to “Product Revenues and Production Costs” for an explanation of the “by-product” and “co-product” methods and a reconciliation of unit net cash costs per pound to production and delivery costs applicable to sales reported in our consolidated financial statements.
| | | | | | | | | | | | | | | | | | | | | | | |
| | 2020 | | 2019 |
| By-Product
Method | | Co-Product
Method | | By-Product
Method | | Co-Product
Method |
| Revenues, excluding adjustments | $ | 3.05 | | | $ | 3.05 | | | $ | 2.71 | | | $ | 2.71 | |
| Site production and delivery, before net noncash | | | | | | | |
| and other costs shown below | 1.86 | | | 1.74 | | | 1.85 | | | 1.68 | |
| By-product credits | (0.17) | | | — | | | (0.27) | | | — | |
| Treatment charges | 0.15 | | | 0.15 | | | 0.18 | | | 0.18 | |
| Royalty on metals | 0.01 | | | 0.01 | | | 0.01 | | | 0.01 | |
| Unit net cash costs | 1.85 | | | 1.90 | | | 1.77 | | | 1.87 | |
| DD&A | 0.43 | | | 0.41 | | | 0.40 | | | 0.36 | |
| | | | | | | |
| Noncash and other costs, net | 0.13 | | a | 0.12 | | | 0.08 | | | 0.07 | |
| Total unit costs | 2.41 | | | 2.43 | | | 2.25 | | | 2.30 | |
| Revenue adjustments, primarily for pricing on | | | | | | | |
| prior period open sales | (0.07) | | | (0.07) | | | 0.03 | | | 0.03 | |
| Gross profit per pound | $ | 0.57 | | | $ | 0.55 | | | $ | 0.49 | | | $ | 0.44 | |
| | | | | | | |
| Copper sales (millions of recoverable pounds) | 976 | | | 976 | | | 1,183 | | | 1,183 | |
|
| | | | | | | | | | | | | | | | | | | | | | | |
| | 2018 | | 2017 | | 2016 |
| | By-Product Method | | Co-Product Method | | By-Product Method | | Co-Product Method | | By-Product Method | | Co-Product Method |
| Revenues, excluding adjustments | $ | 2.87 |
| | $ | 2.87 |
| | $ | 2.97 |
| | $ | 2.97 |
| | $ | 2.31 |
| | $ | 2.31 |
|
| Site production and delivery, before net noncash | | | | | | | | | | | |
| and other costs shown below | 1.79 |
| a | 1.65 |
| | 1.59 |
| | 1.49 |
| | 1.26 |
| | 1.20 |
|
| By-product credits | (0.24 | ) | | — |
| | (0.18 | ) | | — |
| | (0.10 | ) | | — |
|
| Treatment charges | 0.19 |
| | 0.19 |
| | 0.22 |
| | 0.22 |
| | 0.24 |
| | 0.24 |
|
| Royalty on metals | 0.01 |
| | 0.01 |
| | 0.01 |
| | 0.01 |
| | 0.01 |
| | — |
|
| Unit net cash costs | 1.75 |
| | 1.85 |
| | 1.64 |
| | 1.72 |
| | 1.41 |
| | 1.44 |
|
| DD&A | 0.44 |
| | 0.40 |
| | 0.43 |
| | 0.39 |
| | 0.41 |
| | 0.39 |
|
| Noncash and other costs, net | 0.06 |
| b | 0.06 |
| | 0.19 |
| b | 0.18 |
| | 0.03 |
| | 0.03 |
|
| Total unit costs | 2.25 |
| | 2.31 |
| | 2.26 |
| | 2.29 |
| | 1.85 |
| | 1.86 |
|
| Revenue adjustments, primarily for pricing on | | | | | | | | | | | |
| prior period open sales | (0.03 | ) | | (0.03 | ) | | 0.03 |
| | 0.03 |
| | 0.01 |
| | 0.01 |
|
| Gross profit per pound | $ | 0.59 |
| | $ | 0.53 |
| | $ | 0.74 |
| | $ | 0.71 |
| | $ | 0.47 |
| | $ | 0.46 |
|
| | | | | | | | | | | | |
| Copper sales (millions of recoverable pounds) | 1,253 |
| | 1,253 |
| | 1,235 |
| | 1,235 |
| | 1,332 |
| | 1,332 |
|
| |
a. | Includes $0.06 per pound of copper for the year 2018 associated with charges for Cerro Verde's new three-year CLA. |
| |
b. | Includes charges totaling $0.01 per pound of copper for the year 2018 and $0.16 per pound of copper for the year 2017, associated with disputed Cerro Verde royalties for prior years (refer to Note 12 for further discussion). |
During 2018, unit net cash costs (net of by-product credits) for the South America mines averaged $1.75 per pound, including $1.67a.Includes charges totaling $0.09 per pound of copper, forprimarily associated with idle facility (Cerro Verde) and contract cancellation costs related to the Cerro Verde mineCOVID-19 pandemic, and $2.13 per pound for the El Abra mine.employee separation costs associated with our April 2020 revised operating plans.
Our South America mines have varying cost structures because of differences in ore grades and characteristics, processing costs, by-product credits and other factors. Higher average unit net cash costs (net of by-product credits) for our South America mining operations in 2018, compared with $1.64 per pound in 2017, primarily reflected higher mining and milling costs and costs associated with Cerro Verde’s new three-year CLA, partly offset by higher by-product credits.
Unit net cash costs (net of by-product credits) for our South America mining operations increased to $1.64$1.85 per pound of copper in 2017,2020, compared with $1.41$1.77 per pound in 2016,2019, primarily reflectingreflected lower sales volumes and higher mining, milling and employee costs at Cerro Verde,by-product credits, partly offset by higher by-product credits.lower mining rates.
Revenues from Cerro Verde’s concentrate sales are recorded net of treatment charges, which will vary with Cerro Verde’s sales volumes and the price of copper.
Because certain assets are depreciated on a straight-line basis, South America’s unit depreciation rate may vary with asset additions and the level of copper production and sales. South America’s average unit depreciation rate is expected to be lowerDD&A per pound of copper under the by-product method was $0.43 in 2020, compared with $0.40 in 2019, compared to 2018, as a result of reserve additions. See “Critical Accounting Estimates-Mineral Reserves” for further discussion.primarily reflecting lower sales volumes.
Revenue adjustments primarily result from changes in prices on provisionally priced copper sales recognized in prior periods. Refer to “Consolidated Results - Revenues” for further discussion of adjustments to prior period provisionally priced copper sales.
Average unit net cash costs (net of by-product credits) for our South America mining operationsmines are expected to
approximate $1.66$1.92 per pound of copper in 2019,2021, based on current sales volume and cost estimates and assuming average prices of $12.00$9.00 per pound of molybdenum in 2019.for the year 2021.
Indonesia Mining
We operate PT-FI’s mining operations, in which we own a 48.76 percent interest and consolidate in our financial statements. PT-FI’s assets include one of the world’s largest copper and gold deposits at the Grasberg minerals district in Papua, Indonesia. PT-FI produces copper concentrate that contains significant quantities of gold and silver. We have a 48.76 percent interest in PT-FI and manage its mining operations. As further discussed in Note 2, under the terms of the shareholders agreement, our economic interest in PT-FI approximates 81 percent through 2022. PT-FI’s results are consolidated in our financial statements.
Substantially all of PT-FI’s copper concentrate is sold under long-term contracts, and in 2018, approximately 38contracts. During 2020, 50 percent of PT-FI’s copper concentrate was sold to PT Smelting (PT-FI’s 25 percent-owned25-percent-owned smelter and refinery in Gresik, Indonesia).
Regulatory Matters. On December 21, 2018, we completedAs noted below, PT-FI is discussing the transaction with the Indonesian government regarding PT-FI’s long-term mining rights and share ownership. We expect our share of future cash flowspotential expansion of the expanded PT-FI asset base, combined with the cash proceeds received in the transaction, to be comparable to our share of anticipated future cash flows under PT-FI’s former COW and Rio Tinto Joint Venture.
In connection with the transaction, a 40 percent share ownership in PT-FI was issued tocapacity at PT Inalum and PTI (whichSmelting, which is expected to be owned by PT Inalum and the provincial/regional governmentresult in Papua) and the Rio Tinto Joint Venture interests were effectively merged into PT-FI. As a result, PT Inalum's and PTI's collective sharean increase in PT-FI’s ownership of PT-FI totals 51.24 percent and our share ownership is 48.76 percent. The arrangements provide for us and the other pre-transaction PT-FI shareholders to retain the economics of the revenue and cost sharing arrangements under the former Rio Tinto Joint Venture. As a result, our economic interest in PT-FI is expected to approximate 81 percent from 2019 through 2022.PT Smelting.
We, PT-FI, PTIOperating and PT Inalum also entered into a shareholders agreementDevelopment Activities. The ramp-up of underground production at closing, which includes provisions related to the governance and management of PT-FI, and establishes our control over the management of PT-FI's operations. As a result, we continue to consolidate PT-FI in our financial statements.
Refer to Note 2 for further discussion of the transaction.
Concurrent with closing the transaction, the Indonesian government granted PT-FI an IUPK to replace its former COW, enabling PT-FI to conduct operations in the Grasberg minerals district through 2041. Under the terms of the IUPK, PT-FI has been granted an extension of mining rights through 2031, with rights to extend mining rights through 2041, subject to PT-FI completing the construction of a new smelter in Indonesia within five yearscontinues to advance on schedule. During 2020, a total of closing the transaction and fulfilling its defined fiscal obligations to the Indonesian government. The IUPK, and related documentation, contains legal and fiscal terms and is legally enforceable through 2041. In addition, we, as a foreign investor, have rights to resolve investment disputes with the Indonesian government through international arbitration. Refer to Note 13 for further discussion of PT-FI’s IUPK.
Refer to “Risk Factors” contained in Part I, Item 1A. of our annual report on Form 10-K for the year ended December 31, 2018, for further discussion of risks associated with our mining operations in Indonesia.
Operating and Development Activities. PT-FI is currently mining the final phase of the Grasberg open pit and expects to transition to206 new drawbells were added at the Grasberg Block Cave (GBC)and DMLZ underground mine in the first half of 2019.
PT-FI continuesmines, bringing cumulative open drawbells to advance several projects inover 370. Combined average production from the Grasberg minerals district relatedBlock Cave and DMLZ mines approximated 85,000 metric tons of ore per day during fourth-quarter 2020 (including approximately 95,000 metric tons of ore per day during the month of December). According to the development of its large-scale, long-lived, high-grade underground ore bodies. In aggregate, these underground ore bodiescurrent ramp-up schedule, average production rates at the Grasberg Block Cave and DMLZ are expected to produce large-scale quantitiescontinue to accelerate, with combined average production rates expected to reach approximately 172,000 metric tons of ore per day in 2022 and 200,000 metric tons of ore per day in 2023. PT-FI expects production for the year 2021 to approximate 1.4 billion pounds of copper and 1.4 million ounces of gold, followingwhich is nearly double 2020 levels.
The successful completion of this ramp-up is expected to enable PT-FI to generate average annual production for the transition from the Grasberg open pit.next several years of 1.55 billion pounds of copper and 1.6 million ounces of gold at an attractive unit net cash cost, providing significant margins and cash flows.
PT-FI's estimated annual capital spending on underground mine development projects is expected to average $0.7approximately $0.9 billion per year overfor the next four years,two-year period 2021 through 2022, net of scheduled contributions from PT Inalum.Indonesia Asahan Aluminium (Persero) (PT Inalum, also known as MIND ID). In accordance with applicable accounting guidance, aggregate costs (before scheduled contributions from PT Inalum), which are expected to average $0.9$1.1 billion per year for the two-year period 2021 through 2022, will be reflected as an investing activity in FCX's cash flow statement, and contributions from PT Inalum which are expected to average approximately $0.17 billion per year through 2022, will be reflected as a financing activity. Considering
Indonesia Smelter. In connection with the long-term nature and sizeextension of these projects, actual costs could varyPT-FI’s mining rights from these estimates.
2031 to 2041, PT-FI has also committed to construct a new smelter in Indonesia by December 21, 2023. PT-FI2023 (an extension of which has reviewed various process technologiesbeen requested as a result of the COVID-19 pandemic). A potential site for the new smelter has been selected in East Java, and ground preparation is initiatingadvancing. Engineering and front-end engineering and design for the selected process technology are in progress.
As a result of COVID-19 mitigation measures, there have been disruptions to work and intendstravel schedules of international contractors and restrictions on access to pursue financing, commercial and potential partner arrangements for this project, which has a preliminary estimated capital cost in the $3 billion range. The economics of PT-FI’s shareproposed physical site of the new smelter in East Java. PT-FI continues to discuss with the Indonesia government a deferred schedule for the new smelter as well as other alternatives in light of the ongoing COVID-19 pandemic and volatile global economic conditions. On January 7, 2021, the Indonesia government levied an administrative fine of $149 million on PT-FI for failing to achieve physical development progress on the new smelter as of July 31, 2020. PT-FI does not believe an administrative fine is warranted. Refer to Note 12 and Item 1A. “Risk Factors” for further discussion.
PT-FI and PT Inalum have been discussing with the Indonesia government alternatives to PT-FI’s commitment to build a new smelter. In connection with exploring alternatives to its commitment to develop additional smelter capacity in Indonesia, PT-FI has advanced discussions with the majority owner of PT Smelting regarding an expansion of the smelter to increase smelter concentrate treatment capacity by approximately 30 percent (300,000 metric tons of concentrate per year). Commercial and financial arrangements for this potential project are being advanced and engineering is in progress. The initial estimate for the cost of the expansion of PT Smelting is $250 million, which is expected to be funded by PT-FI as a convertible loan.
An expansion of PT Smelting is expected to reduce PT-FI's smelter development commitment from 2.0 million metric tons of concentrate per year to 1.7 million metric tons per year.
While PT-FI continues to evaluate the new greenfield smelter project in East Java, it is also advancing discussions in parallel with a third party to develop the new smelter capacity at an alternate location in partnership with PT-FI.
The preliminary capital cost estimate for the new smelter in East Java approximates $3 billion, pending completion of final engineering. PT-FI had capitalized costs for the new smelter totaling $216 million as of December 31, 2020. Estimated related capital expenditures for 2021 approximate $0.1 billion. PT-FI plans to arrange financing for the project and debt service will be borneshared by PT-FI’s shareholders according to their respective long-term shareequity ownership percentages.
The following provides additional information on the continued development As a result, our future distributions from PT-FI will incorporate approximately 49 percent of the Common Infrastructure project, the GBC underground mine and the Deep Mill Level Zone (DMLZ) ore body that lies below the Deep Ore Zone (DOZ) underground mine.smelter debt service.
Common Infrastructure and GBC Underground Mine. In 2004, PT-FI commenced its Common Infrastructure project to provide access to its large undeveloped underground ore bodies located in the Grasberg minerals district through a tunnel system located approximately 400 meters deeper than its existing underground tunnel system. In addition
to providing access to our underground ore bodies, the tunnel system will enable PT-FI to conduct future exploration in prospective areas associated with currently identified ore bodies. The tunnel system was completed to the Big Gossan terminal and development of the GBC and DMLZ underground mines is advancing using the Common Infrastructure project tunnels as access.
The GBC underground mine accounts for approximately half of our recoverable proven and probable reserves in Indonesia. Substantial progress has been made to prepare for the transition to mining of the GBC underground mine. First undercut blasting occurred in September 2018, first drawbell blasting occurred in December 2018 and cave production is scheduled for the first half of 2019. All underground mining levels and the ore flow system are being commissioned. Production rates over the next five years are expected to ramp up to 130,000 metric tons per day.
Mine development capital for the GBC underground mine and associated Common Infrastructure is expected to approximate $6.8 billion, including $3.9 billion incurred through December 31, 2018 ($0.6 billion during 2018).
DMLZ. The DMLZ ore body lies below the DOZ mine at the 2,590-meter elevation and represents the downward continuation of mineralization in the Ertsberg East Skarn system and neighboring Ertsberg porphyry. In September 2015, PT-FI initiated pre-commercial production that represented ore extracted during the development phase for the purpose of obtaining access to the ore body. During third-quarter 2018, PT-FI commenced hydraulic fracturing activities to manage rock stresses and pre-condition the DMLZ underground mine for large-scale production following mining induced seismic activity experienced in 2017 and 2018. Results to date have been effective in managing rock stresses and pre-conditioning the cave. PT-FI expects to commence the ramp-up of production in the DMLZ underground mine by mid-2019 and to reach full production rates of 80,000 metric tons per day in 2022. Estimates of timing of future production continue to be reviewed and may be modified as additional information becomes available.
Mine development capital costs for the DMLZ underground mine are expected to approximate $3.3 billion, including $2.5 billion incurred through December 31, 2018 (approximately $0.4 billion during 2018).
Operating Data. Following is summary operating data for our Indonesia mining operations for the years ended December 31.
| | | | | | | | | | | |
| | 2020 | | 2019 |
| Operating Data | | | |
Copper (millions of recoverable pounds) | | | |
| Production | 809 | | | 607 | |
| Sales | 804 | | | 667 | |
| Average realized price per pound | $ | 3.08 | | | $ | 2.72 | |
| | | |
Gold (thousands of recoverable ounces) | | | |
| Production | 848 | | | 863 | |
| Sales | 842 | | | 973 | |
| Average realized price per ounce | $ | 1,832 | | | $ | 1,416 | |
| | | |
| 100% Operating Data | | | |
| Ore milled (metric tons per day): | | | |
Grasberg Block Cave underground minea | 30,800 | | | 8,600 | |
DMLZ underground minea | 28,600 | | | 9,800 | |
DOZ underground minea | 20,900 | | | 25,500 | |
Big Gossan underground minea | 7,000 | | | 6,100 | |
Grasberg open pitb | 400 | | | 60,100 | |
| Total | 87,700 | | | 110,100 | |
| | | |
| Average ore grade: | | | |
| Copper (percent) | 1.32 | | | 0.84 | |
| Gold (grams per metric ton) | 1.10 | | | 0.93 | |
| Recovery rates (percent): | | | |
| Copper | 91.9 | | | 88.4 | |
| Gold | 78.1 | | | 75.0 | |
| Production (recoverable): | | | |
| Copper (millions of pounds) | 809 | | | 607 | |
| Gold (thousands of ounces) | 848 | | | 863 | |
|
| | | | | | | | | | | |
| | 2018 | | 2017 | | 2016 |
Operating Data, Net of Rio Tinto Joint Venture Interesta | | | | | |
Copper (millions of recoverable pounds) | | | | | |
| Production | 1,160 |
| | 984 |
| | 1,063 |
|
| Sales | 1,130 |
| | 981 |
| | 1,054 |
|
| Average realized price per pound | $ | 2.89 |
| | $ | 3.00 |
| | $ | 2.32 |
|
| | | | | | |
Gold (thousands of recoverable ounces) | | | | | |
| Production | 2,416 |
| | 1,554 |
| | 1,061 |
|
| Sales | 2,366 |
| | 1,540 |
| | 1,054 |
|
| Average realized price per ounce | $ | 1,254 |
| | $ | 1,268 |
| | $ | 1,237 |
|
| | | | | | |
| 100% Operating Data | | | | | |
Ore milled (metric tons per day):b | | | | | |
| Grasberg open pit | 133,300 |
| | 101,800 |
| | 119,700 |
|
| DOZ underground mine | 33,800 |
| | 31,200 |
| | 38,000 |
|
| DMLZ underground mine | 3,200 |
| | 3,200 |
| | 4,400 |
|
| GBC underground mine | 4,000 |
| | 3,600 |
| | 2,700 |
|
| Big Gossan underground mine | 3,800 |
| | 600 |
| | 900 |
|
| Total | 178,100 |
| | 140,400 |
| | 165,700 |
|
| | | | | | |
| Average ore grade: | | | | | |
| Copper (percent) | 0.98 |
| | 1.01 |
| | 0.91 |
|
| Gold (grams per metric ton) | 1.58 |
| | 1.15 |
| | 0.68 |
|
| Recovery rates (percent): | | | | | |
| Copper | 91.8 |
| | 91.6 |
| | 91.0 |
|
| Gold | 84.7 |
| | 85.0 |
| | 82.2 |
|
| Production (recoverable): | | | | | |
| Copper (millions of pounds) | 1,227 |
| | 996 |
| | 1,063 |
|
| Gold (thousands of ounces) | 2,697 |
| | 1,554 |
| | 1,061 |
|
| |
a. | Operating data through December 21, 2018, is net of the former Rio Tinto Joint Venture interest. Refer to Note 2 for further discussion. |
| |
b. | Amounts represent the approximate average daily throughput processed at PT-FI’s mill facilities from each producing mine and from development activities that result in metal production. |
b.Includes ore from related stockpiles.
Higher consolidated copper andsales of 0.8 billion pounds in 2020, compared with 0.7 billion pounds in 2019, primarily reflect higher copper ore grades, partly offset by lower mining rates as underground mining ramps up. Lower consolidated gold sales of 0.8 million ounces of gold in 2020, compared with 1.0 million ounces of gold in 2019, primarily reflect lower mining rates as underground mining ramps up, partly offset by higher gold ore grades.
Consolidated sales volumes from our Indonesia mining operations of 1.1PT-FI are expected to approximate 1.3 billion pounds of copper and 2.41.3 million ounces of gold in 2018, compared with 1.0 billion pounds of copper and 1.5 million ounces of gold in 2017, primarily reflected higher milling rates and gold ore grades.2021.
Sales volumes from our Indonesia mining operations totaled 1.0 billion pounds of copper and 1.5 million ounces of gold in 2017, compared with 1.1 billion pounds of copper and 1.1 million ounces of gold in 2016. Lower copper sales volumes in 2017 primarily reflected the impact of regulatory restrictions on PT-FI’s concentrate exports at the beginning of 2017, partly offset by higher copper ore grades. Higher gold sales volumes in 2017 primarily reflected higher gold ore grades.
As PT-FI transitions mining from the open pit to underground, production is expected to be significantly lower in 2019 and 2020, compared to 2018. Metal production is expected to improve significantly by 2021 following a ramp-up period. Consolidated sales volumes from Indonesia mining are expected to approximate 615 million pounds of copper and 785 thousand ounces of gold in 2019. Indonesia mining's projected sales volumes and unit net cash costs for the year 2019 are dependent on a number of factors, including operational performance, timing of shipments, workforce productivity and the Indonesian government’s extension of PT-FI’s export license. PT-FI has applied for a one-year extension of its export license, which currently expires on February 16, 2019.
Unit Net Cash Costs. Unit net cash costs per pound of copper is a measure intended to provide investors with information about the cash-generating capacity of our mining operations expressed on a basis relating to the
primary metal product for our respective operations. We use this measure for the same purpose and for monitoring operating performance by our mining operations. This information differs from measures of performance determined in accordance with U.S. GAAP and should not be considered in isolation or as a substitute for measures of performance determined in accordance with U.S. GAAP. This measure is presented by other metal mining companies, although our measure may not be comparable to similarly titled measures reported by other companies.
Gross Profit per Pound of Copper and per Ounce of Gold
The following tables summarizetable summarizes the unit net cash (credits) costs and gross profit per pound of copper and per ounce of gold at our Indonesia mining operations for the threetwo years ended December 31, 2018.2020. Refer to “Product Revenues and Production Costs” for an explanation of “by-product” and “co-product” methods and a reconciliation of unit net cash (credits) costs per pound to production and delivery costs applicable to sales reported in our consolidated financial statements.
| | | | | | | | | | | | | | | | | | | | | | | | | | | | | | | | | | | |
| | 2020 | | 2019 |
| | By-
Product | | Co-Product Method | | By-
Product | | Co-Product Method |
| Method | | Copper | | Gold | | Method | | Copper | | Gold |
| Revenues, excluding adjustments | $ | 3.08 | | | $ | 3.08 | | | $ | 1,832 | | | $ | 2.72 | | | $ | 2.72 | | | $ | 1,416 | |
| Site production and delivery, before net noncash | | | | | | | | | | | |
| and other costs shown below | 1.88 | | | 1.13 | | | 674 | | | 2.91 | | | 1.63 | | | 849 | |
| Gold and silver credits | (2.03) | | | — | | | — | | | (2.13) | | | — | | | — | |
| Treatment charges | 0.27 | | | 0.17 | | | 98 | | | 0.26 | | | 0.14 | | | 75 | |
| Export duties | 0.12 | | | 0.07 | | | 41 | | | 0.08 | | | 0.05 | | | 25 | |
| Royalty on metals | 0.19 | | | 0.11 | | | 72 | | | 0.16 | | | 0.09 | | | 49 | |
| Unit net cash costs | 0.43 | | | 1.48 | | | 885 | | | 1.28 | | | 1.91 | | | 998 | |
| DD&A | 0.72 | | | 0.43 | | | 259 | | | 0.61 | | | 0.34 | | | 178 | |
| Metals inventory adjustments | — | | | — | | | — | | | 0.01 | | | 0.01 | | | — | |
| Noncash and other costs, net | 0.11 | | a | 0.07 | | | 41 | | | 0.37 | | b | 0.20 | | | 110 | |
| Total unit costs | 1.26 | | | 1.98 | | | 1,185 | | | 2.27 | | | 2.46 | | | 1,286 | |
| Revenue adjustments, primarily for pricing on | | | | | | | | | | | |
| prior period open sales | (0.03) | | | (0.03) | | | 5 | | | 0.03 | | | 0.03 | | | 2 | |
| PT Smelting intercompany loss | (0.01) | | | (0.01) | | | (5) | | | (0.02) | | | (0.02) | | | (8) | |
| Gross profit per pound/ounce | $ | 1.78 | | | $ | 1.06 | | | $ | 647 | | | $ | 0.46 | | | $ | 0.27 | | | $ | 124 | |
| | | | | | | | | | | |
| Copper sales (millions of recoverable pounds) | 804 | | | 804 | | | | | 667 | | | 667 | | | |
| Gold sales (thousands of recoverable ounces) | | | | | 842 | | | | | | | 973 | |
|
| | | | | | | | | | | | | | | | | | | | | | | |
| | 2018 | | 2017 |
| | By- Product | | Co-Product Method | | By-
Product | | Co-Product Method |
| | Method | | Copper | | Gold | | Method | | Copper | | Gold |
| Revenues, excluding adjustments | $ | 2.89 |
| | $ | 2.89 |
| | $ | 1,254 |
| | $ | 3.00 |
| | $ | 3.00 |
| | $ | 1,268 |
|
| Site production and delivery, before net noncash | | | | | | | | | | | |
| and other costs shown below | 1.48 |
| | 0.77 |
| | 335 |
| | 1.57 |
| | 0.94 |
| | 396 |
|
| Gold and silver credits | (2.69 | ) | | — |
| | — |
| | (2.05 | ) | | — |
| | — |
|
| Treatment charges | 0.26 |
| | 0.14 |
| | 59 |
| | 0.27 |
| | 0.16 |
| | 67 |
|
| Export duties | 0.16 |
| | 0.08 |
| | 36 |
| | 0.12 |
| | 0.07 |
| | 30 |
|
| Royalty on metals | 0.21 |
| | 0.11 |
| | 48 |
| | 0.17 |
| | 0.10 |
| | 47 |
|
| Unit net cash (credits) costs | (0.58 | ) | | 1.10 |
| | 478 |
| | 0.08 |
| | 1.27 |
| | 540 |
|
| DD&A | 0.54 |
| | 0.28 |
| | 121 |
| | 0.57 |
| | 0.34 |
| | 142 |
|
| Noncash and other costs, net | 0.21 |
| a | 0.11 |
| | 48 |
| | 0.17 |
| b | 0.10 |
| | 42 |
|
| Total unit costs | 0.17 |
| | 1.49 |
| | 647 |
| | 0.82 |
| | 1.71 |
| | 724 |
|
| Revenue adjustments, primarily for pricing on | | | | | | | | | | | |
| prior period open sales | (0.03 | ) | | (0.03 | ) | | 7 |
| | 0.04 |
| | 0.04 |
| | 6 |
|
| PT Smelting intercompany profit (loss) | 0.04 |
| | 0.03 |
| | 12 |
| | (0.02 | ) | | (0.01 | ) | | (7 | ) |
| Gross profit per pound/ounce | $ | 2.73 |
| | $ | 1.40 |
| | $ | 626 |
| | $ | 2.20 |
| | $ | 1.32 |
| | $ | 543 |
|
| | | | | | | | | | | | |
| Copper sales (millions of recoverable pounds) | 1,130 |
| | 1,130 |
| | | | 981 |
| | 981 |
| | |
| Gold sales (thousands of recoverable ounces) | | | | | 2,366 |
| | | | | | 1,540 |
|
| |
a. | Includes $0.20 per pound of copper primarily associated with PT-FI net charges (refer to “Consolidated Results” for a summary of these charges). |
| |
b. | Includes $0.12 per pound of copper of costs charged directly to production and delivery costs as a result of workforce reductions. |
a.Includes COVID-19 related costs (including one-time incremental employee benefits and health and safety costs) totaling $0.02 per pound of copper.
b.Includes charges in revenues totaling $0.25 per pound of copper primarily associated with an unfavorable Indonesia Supreme Court ruling related to certain disputed PT-FI export duties, partly offset by adjustments to prior year treatment charges totaling $0.03 per pound of copper. Also includes charges of $0.04 per pound of copper associated with adjustments to the settlement of the historical surface water tax disputes with the local regional tax authority in Papua, Indonesia.
A significant portion of PT-FI’s costs are fixed and unit costs vary depending on volumes and other factors. As a result of higher gold and silver credits and sales volumes, Indonesia hadPT-FI’s unit net cash (credits) costs (including gold and silver credits) of $(0.58)$0.43 per pound of copper in 2018, compared with $0.082020, were lower than unit net cash credits of $1.28 per pound in 2017.2019, primarily reflecting higher copper sales volumes and lower mining costs.
Treatment charges vary with the volume of metals sold and the price of copper, and royalties vary with the volume
of metals sold and the prices of copper and gold.
PT-FI’s export duties totaled $180$93 million in 2018, $1152020 and $56 million in 2017 and $96 million in 2016,2019, and PT-FI’s royalties totaled $238$153 million in 2018, $1732020 and $107 million in 2017 and $131 million2019. PT-FI will continue to pay export duties until development progress for the new smelter in 2016.Indonesia exceeds 50 percent. Refer to Note 13 for further discussion of PT-FI’s export duties and royalties.
Because certain assets are depreciated on a straight-line basis, PT-FI’s unit depreciation rate may vary with asset additions and the level of copper production and sales. DD&A per pound of copper under they by-product method was $0.72 in 2020, compared with $0.61 in 2019, primarily reflecting underground development assets placed in service.
Revenue adjustments primarily result from changes in prices on provisionally priced copper sales recognized in prior periods. Refer to “Consolidated Results - Revenues” for further discussion of adjustments to prior period provisionally priced copper sales.
PT Smelting intercompany profit (loss)loss represents the change in the deferral of 25 percent of PT-FI’s profit on sales to PT Smelting. Refer to “Operations - Smelting & Refining” below for further discussion.
Because of the fixed nature of a large portion of Indonesia’s costs, unit net cash costs vary from quarter to quarter depending on copper and gold volumes. Assuming an average gold price of $1,300$1,850 per ounce for 20192021 and achievement of current sales volume and cost estimates, unit net cash costs (net of(including gold and silver credits) for Indonesia miningPT-FI are expected to approximate $1.55$0.06 per pound of copper in 2019. Unit net cash costs are expected to decline significantly followingfor the ramp-upyear 2021. The impact of production. Indonesia mining’sprice changes during 2021 on PT-FI’s average unit net cash costs for the year 2019 would change by approximately $0.06approximate $0.09 per pound for each $50$100 per ounce change in the average price of gold.
|
| | | | | | | | | | | | | | | | | | | | | | | |
| | 2017 | | 2016 |
| | By-
Product | | Co-Product Method | | By-
Product | | Co-Product Method |
| | Method | | Copper | | Gold | | Method | | Copper | | Gold |
| Revenues, excluding adjustments | $ | 3.00 |
| | $ | 3.00 |
| | $ | 1,268 |
| | $ | 2.32 |
| | $ | 2.32 |
| | $ | 1,237 |
|
| Site production and delivery, before net noncash | | | | | | | | | | | |
| and other costs shown below | 1.57 |
| | 0.94 |
| | 396 |
| | 1.61 |
| | 1.04 |
| | 553 |
|
| Gold and silver credits | (2.05 | ) | | — |
| | — |
| | (1.30 | ) | | — |
| | — |
|
| Treatment charges | 0.27 |
| | 0.16 |
| | 67 |
| | 0.28 |
| | 0.18 |
| | 97 |
|
| Export duties | 0.12 |
| | 0.07 |
| | 30 |
| | 0.09 |
| | 0.06 |
| | 31 |
|
| Royalty on metals | 0.17 |
| | 0.10 |
| | 47 |
| | 0.13 |
| | 0.07 |
| | 47 |
|
| Unit net cash costs | 0.08 |
| | 1.27 |
| | 540 |
| | 0.81 |
| | 1.35 |
| | 728 |
|
| DD&A | 0.57 |
| | 0.34 |
| | 142 |
| | 0.36 |
| | 0.24 |
| | 125 |
|
| Noncash and other costs, net | 0.17 |
| a | 0.10 |
| | 42 |
| | 0.05 |
| | 0.03 |
| | 17 |
|
| Total unit costs | 0.82 |
| | 1.71 |
| | 724 |
| | 1.22 |
| | 1.62 |
| | 870 |
|
| Revenue adjustments, primarily for pricing on | | | | | | | | | | | |
| prior period open sales | 0.04 |
| | 0.04 |
| | 6 |
| | — |
| | — |
| | 16 |
|
| PT Smelting intercompany loss | (0.02 | ) | | (0.01 | ) | | (7 | ) | | (0.02 | ) | | (0.02 | ) | | (8 | ) |
| Gross profit per pound/ounce | $ | 2.20 |
| | $ | 1.32 |
| | $ | 543 |
| | $ | 1.08 |
| | $ | 0.68 |
| | $ | 375 |
|
| | | | | | | | | | | | |
| Copper sales (millions of recoverable pounds) | 981 |
| | 981 |
| | | | 1,054 |
| | 1,054 |
| | |
| Gold sales (thousands of recoverable ounces) | | | | | 1,540 |
| | | | | | 1,054 |
|
| |
a. | Includes $0.12 per pound of copper of costs charged directly to productionPT-FI’s projected sales volumes and delivery costs as a result of workforce reductions. |
Unit net cash costs (net of gold and silver credits) for our Indonesia mining operations of $0.08 per pound of copper in 2017 were lower than unit net cash costs of $0.81 per pound in 2016, primarily reflecting higher gold and silver credits.
Higher DD&A in 2017, compared with 2016, primarily related to higher amortization of asset retirement costs associated with revised estimates atfor the end of 2016 for an overburden stockpile. Because certain assetsyear 2021 are depreciateddependent on a straight-line basis,number of factors, including continued progress of the ramp-up of underground mining, operational performance, timing of shipments and the Indonesia government’s extension of PT-FI’s unit depreciation rate variesexport permit. In March 2020, PT-FI received a one-year extension of its export license through March 15, 2021. Refer to Note 12 and Item 1A. “Risk Factors” for a discussion of the administrative fine levied by the Indonesia government on PT-FI for failing to achieve physical development progress on the new smelter and ongoing discussions with the levelIndonesia government regarding a deferred schedule for the completion of copper productionthe new smelter project as well as other alternatives in light of the ongoing COVID-19 pandemic and sales.volatile global economic conditions
Molybdenum Mines
We have two wholly owned molybdenum mines in Colorado – the Henderson underground mine and the Climax open-pit mine, both in Colorado.mine. The Henderson and Climax mines produce high-purity, chemical-grade molybdenum concentrate, which is typically further processed into value-added molybdenum chemical products. The majority of the molybdenum concentrate produced at the Henderson and Climax mines, as well as from our North America and South America copper mines, is processed at our own conversion facilities.
Operating and Development Activities. Production from the Molybdenum mines totaled 3524 million pounds of molybdenum in 2018, 322020 and 29 million pounds in 2017 and 26 million pounds2019. The decrease in 2016.2020, compared with 2019, primarily reflected lower operating rates pursuant to our April 2020 revised operating plans in response to market conditions. Refer to “Consolidated Results” for our consolidated molybdenum operating data, which includes sales of molybdenum produced at our Molybdenum mines, and from our North America and South America copper mines, and refer to “Outlook” for projected consolidated molybdenum sales volumes.
Unit Net Cash Costs Per Pound of Molybdenum. Unit net cash costs per pound of molybdenum is a measure intended to provide investors with information about the cash-generating capacity of our mining operations expressed on a basis relating to the primary metal product for our respective operations. We use this measure for the same purpose and for monitoring operating performance by our mining operations. This information differs from measures of performance determined in accordance with U.S. GAAP and should not be considered in isolation or
as a substitute for measures of performance determined in accordance with U.S. GAAP. This measure is presented by other metals mining companies, although our measure may not be comparable to similarly titled measures reported by other companies.
Unit net cash costs for our Molybdenum mines of $9.50 per pound of molybdenum in 2020 were lower than $10.80 per pound in 2019, primarily reflecting lower mining and input costs associated with our April 2020 revised operating plans. Average unit net cash costs for our molybdenumMolybdenum mines totaled $8.77 do not include noncash and other costs, which include charges totaling $0.29per pound of molybdenum in 2018, $7.71 per pound in 2017primarily associated with our April 2020 revised operating plans (including employee separation costs) and $8.28 per pound in 2016. The increase incontract cancellation costs related to the average unit net cash costs for molybdenum in 2018, compared to 2017, primarily reflected higher operating rates and lower ore grades. The decrease in the average unit net cash costs for molybdenum in 2017, compared to 2016, primarily reflected higher sales volumes.COVID-19 pandemic. Based on current sales volume and cost estimates, average unit net cash costs for the Molybdenum mines are expected to approximate $8.90$9.80 per pound of molybdenum for the year 2019.2021. Refer to “Product Revenues and Production Costs” for a reconciliation of unit net cash costs per pound to production and delivery costs applicable to sales reported in our consolidated financial statements.
Smelting & Refining
We wholly own and operate a smelter in Arizona (Miami smelter), a refinery in Texas (El Paso refinery) and a smelter and refinery in Spain (Atlantic Copper). Additionally, PT-FI owns 25 percent of a smelter and refinery in Gresik, Indonesia (PT Smelting)., which is expected to increase in connection with the potential expansion of PT Smelting. See “Indonesia Smelter” for additional information regarding the potential PT Smelting expansion. Treatment charges for smelting and refining copper concentrate consist of a base rate per pound of copper and per ounce of gold and are generally fixed. Treatment charges represent a cost to our mining operations and income to Atlantic Copper and PT Smelting. Thus, higher treatment charges benefit our smelter operations and adversely affect our mining operations. Our North America copper mines are less significantly affected by changes in
treatment charges because these operations are largely integrated with our Miami smelter and El Paso refinery. Through this form of downstream integration, we are assured placement of a significant portion of our concentrate production.
During 2019, we incurred charges totaling $38 million for a maintenance turnaround at the Miami smelter. The next major maintenance turnaround at the Miami smelter is scheduled for first-quarter 2021, for which we expect to incur charges of approximately $60 million.
Atlantic Copper smelts and refines copper concentrate and markets refined copper and precious metals in slimes. Following is a summaryan allocation of Atlantic Copper’s concentrate purchases from unaffiliated third parties and our copper mining operations for the threetwo years ended December 31, 2018:2020:
| | | | | | | | | | | |
| | 2020 | | 2019 |
| Third parties | 79 | % | | 73 | % |
| North America copper mines | 10 | | | 22 | |
| South America mining | 7 | | | 2 | |
| Indonesia mining | 4 | | | 3 | |
| | 100 | % | | 100 | % |
|
| | | | | | | | |
| | 2018 | | 2017 | | 2016 |
| Third parties | 77 | % | | 67 | % | | 77 | % |
| North America copper mines | 14 |
| | 18 |
| | 13 |
|
| South America mining | 5 |
| | 15 |
| | 7 |
|
| Indonesia mining | 4 |
| | — |
| | 3 |
|
| | 100 | % | | 100 | % | | 100 | % |
During 2019, we incurred charges totaling $16 million for a short-term maintenance turnaround at the Atlantic Copper smelter. The next major maintenance turnaround at the Atlantic Copper smelter is scheduled for second-quarter 2022.
Atlantic Copper has take-or-pay contractual obligations for the procurement of copper concentrate totaling $2.9 billion at December 31, 2020, that provide for deliveries of specified volumes at market-based prices.
PT-FI’s contract with PT Smelting provides for PT-FI to supply 100 percent of the copper concentrate requirements (subject to a minimum or maximum treatment charge rate) necessary for PT Smelting to produce 205,000 metric tons of copper annually on a priority basis. PT-FI may also sell copper concentrate to PT Smelting at market rates for quantities in excess of 205,000 metric tons of copper annually. PT-FI supplied 9074 percent of PT Smelting’s concentrate requirements in 2018, 932020 and 90 percent in 2017 and 88 percent in 2016.2019. PT Smelting processed 3850 percent in 2018, 46 percent in 2017 and 42 percent in 2016 of PT-FI’s concentrate production.production in 2020and64 percent of such production in 2019 .
PT Smelting produced 258,800276,900 metric tons of copper anode from its smelter and 257,600273,000 metric tons of copper cathode from its refinery in 2018; 245,8002020; and 246,100 metric tons of copper anode from its smelter and 247,800241,200 metric tons of copper cathode from its refinery in 2017; and 255,700 metric tons of copper anode from its smelter and 241,700 metric tons of copper cathode from its refinery in 2016.2019.
In early 2017, the Indonesian government issued new regulations to address exports of unrefined metals, including copper concentrate and anode slimes, and other matters related to the mining sector. These regulations permit the export of anode slimes, which is necessary forJanuary 2021, PT Smelting to continue operating. Asreceived a result of labor disturbances and a delay in the renewal of its export license for anode slimes, PT Smelting’s operations were shut down from mid-January 2017 until early March 2017. PT Smelting has applied for a one-yearsix-month extension of its anodeanodes slimes export license, which currently expires February 26, 2019.July 18, 2021.
PT Smelting’s maintenance turnarounds (which range from two weeks to a month to complete) typically are expected to occur approximately every two years, with short-term maintenance turnarounds in the interim. PT Smelting completed a 25-day maintenance turnaround during 2016, and a 30-day maintenance turnaround during 2018. In addition to its scheduled annual maintenance in November 2018, PT Smelting also experienced downtime in December 2018 caused by unscheduled maintenance at its sole-source oxygen supplier. This resulted in a
temporary shutdown of PT Smelting’s operations in December 2018. The2020, and the next major maintenance turnaround is scheduled for 2020.the second half of 2022.
We defer recognizing profits on sales from our mining operations to Atlantic Copper and on 25 percent of PT-FI’s sales to PT Smelting until final sales to third parties occur. Changes in these deferrals attributable to variability in intercompany volumes resulted in net (reductions) additions (reductions)to operating income totaling $(7) million ($1 million to net income attributable to common stock of $42stock) in 2020 and $(22) million ($0.03 per share) ($(18) million to net loss attributable to common stock) in 2018, $(21) million ($(0.01) per share) in 2017 and $(8) million ($(0.01) per share) in 2016.2019. Our net deferred profits on our inventories at Atlantic Copper and PT Smelting to be recognized in future periods’ net income attributable to common stock totaled $31$54 million at December 31, 2018. Net additions to net income attributable to common stock for fourth-quarter 2018 totaled $46 million; based on our current projections, we don’t expect any significant adjustments in first-quarter 2019.2020. Quarterly variations in ore grades, the timing of intercompany shipments and changes in product prices will result in variability in our net deferred profits and quarterly earnings. We currently expect first-quarter 2021 results to reflect an increase in net deferred profits, totaling an approximate $50 million reduction to net income, associated with an anticipated increase in sales to Atlantic Copper as a result of the major maintenance turnaround at the Miami smelter noted above, which will be recognized in future periods as Atlantic Copper sells final refined products to third parties.
CAPITAL RESOURCES AND LIQUIDITY
During second-quarter 2020, we announced revised operating plans in response to the global COVID-19 pandemic and resulting negative impact on the global economy. The revised operating plans allowed us to maximize cash flow and protect liquidity and to preserve asset values in an uncertain economic environment.
Our consolidated operating cash flows vary with sales volumes; prices realized from copper, gold and molybdenum; our sales volumes;molybdenum sales; production costs; income taxes; other working capital changes; and other factors. A large component of our production costs are related to energy. See “Consolidated Results” for further discussion of our energy requirements and related costs. We believe that we have a high-quality portfolio of long-lived copper assets positioned to generate long-term value. We have commenced a project to developrecently completed the Lone Star oxide ores near thecopper leach project at our Safford operation in easternsoutheastern Arizona, and PT-FI has several projects in the Grasberg minerals district related to the development of its large-scale, long-lived, high-grade underground ore bodies (refer to “Operations - Indonesia Mining” for further discussion of PT-FI’s transition mining from the open pit to underground).bodies. We are also pursuingevaluating other opportunities to enhance net present values, and we continue to advance studies forconsider future development of our copper resources, the timing of which will be dependent on market conditions. We believe that our cash generating capability and financial condition, together with our credit facility, will be adequate to meet our operating, investing and financing needs.
As presented in “Outlook”, our projected capital expenditures for 2019 are approximately $0.6 billion higher than projected operating cash flows. A large portion of the capital expenditures relate to projects that are expected to add significant production and cash flow in future periods, enabling us to generate operating cash flows exceeding capital expenditures in future years. We have cash on hand and the financial flexibility to fund these expenditures and will continue to be disciplined in deploying capital. Subject to future commodity prices for copper, gold, and molybdenum, we expect estimated consolidated operating cash flows of $5.5 billion in 2019,2021, plus available cash, and availability under our credit facility, to be sufficient to fund our budgeted capital expenditures cash dividends, noncontrolling interest distributionsof $2.3 billion in 2021, as well as projected spending on the new smelter in Indonesia and other cash requirements for the year.
year, including common stock dividends and approximately $0.6 billion of noncontrolling interest distributions. Refer to “Outlook” for further discussion of projected operating cash flows and capital expenditures for 2019.2021.
At December 31, 2020, we had $7.2 billion in liquidity, comprised of $3.7 billion in consolidated cash and $3.5 billion of availability under our revolving credit facility.
In connection with our financing activities in 2019 and 2020, we issued a total of $4.0 billion in new senior notes and used most of the net proceeds to purchase and redeem outstanding senior notes. As a result, we have extended our debt maturities and strengthened our financial flexibility. We have no significant scheduled debt maturities in 2021.
In February 2021, the Board reinstated a cash dividend on our common stock at an annual rate of $0.30 per share. The Board intends to declare a quarterly dividend of $0.075 per share, with the initial quarterly dividend expected to be paid on May 3, 2021. The Board also adopted a new financial policy for the allocation of cash flows aligned with our strategic objectives of maintaining a strong balance sheet, increasing cash returns to shareholders and advancing opportunities for future growth. Under the new policy, up to 50 percent of available cash flows generated after planned capital spending and distributions to noncontrolling interests would be allocated to shareholder returns and the balance to debt reduction and investments in value enhancing growth projects. The new payout policy will be implemented following achievement of a net debt (total consolidated debt less total consolidated cash and cash equivalents) target in the range of $3 billion to $4 billion, excluding project debt for additional smelter capacity in Indonesia. Under current market conditions and with continued strong execution of our plans, we currently expect to reach this target in early 2022 (refer to “Cautionary Statement”).
Cash
Following is a summary of the U.S. and international components of consolidated cash and cash equivalents available to the parent company, net of noncontrolling interests’ share, taxes and other costs at December 31, 20182020 (in billions):
|
| | | | |
| Cash at domestic companies | $ | 3.2 |
| |
| Cash at international operations | 1.0 |
| |
| Total consolidated cash and cash equivalents | 4.2 |
| |
| Noncontrolling interests’ share | (0.4 | ) | |
| Cash, net of noncontrolling interests’ share | $ | 3.8 |
| |
| Withholding taxes and other | — |
| a |
| Net cash available | $ | 3.8 |
| |
| | | | | | | | | |
a. | Rounds to less than $0.1 billion. | | |
| Cash at domestic companies | $ | 2.9 | | | |
| Cash at international operations | 0.8 | | | |
| Total consolidated cash and cash equivalents | 3.7 | | | |
| Noncontrolling interests’ share | (0.4) | | | |
| Cash, net of noncontrolling interests’ share | $ | 3.3 | | | |
| Withholding taxes | — | | a | |
| Net cash available | $ | 3.3 | | | |
a.Rounds to less than $0.1 billion.
Cash held at our international operations is generally used to support our foreign operations’ capital expenditures, operating expenses, debt repayments, working capital and other tax payments, or other cash needs. Management believes that sufficient
liquidity is available in the U.S. from cash balances and availability from our revolving credit facility. We have not elected to permanently reinvest earnings from our foreign subsidiaries, and we have recorded deferred tax liabilities for foreign earnings that are available to be repatriated to the U.S. From time to time, our foreign subsidiaries distribute earnings to the U.S. through dividends that are subject to applicable withholding taxes and noncontrolling interests’ share.
Debt
At December 31, 2018,2020, consolidated debt totaled $11.1$9.7 billion, with a related weighted-average interest rate of 4.554.6 percent. We had no borrowings, $13$10 million in letters of credit issued and approximately $3.5 billion available under our revolving credit facility at December 31, 2018.2020. Refer to “Financing Activities” below and Note 8 for further discussion of debt.
In December 2020, Cerro Verde prepaid $0.3 billion on its Term Loan that was scheduled to mature in December 2021. The remaining balance of $0.5 billion matures in June 2022 (refer to Note 8).
In June 2020, we amended our revolving credit facility to provide additional flexibility on certain financial covenants. The key changes under the amendment include a suspension of the total leverage ratio through June 30, 2021, and a reduction in the interest expense coverage ratio to a minimum of 2.0x through December 31, 2021. We also agreed to a minimum liquidity covenant of $1 billion (consisting of consolidated unrestricted cash and availability under the revolving credit facility) applicable to each quarter through June 30, 2021, and additional restrictions on priority debt and liens, and on the payment of dividends through December 31, 2021. At December 31, 2020, we were in compliance with our revolving credit facility covenants.
As further discussed in Note 10, in February 2021, the Board reinstated a cash dividend on our common stock. Prior to the Board’s declaration of the initial quarterly dividend, we will deliver a covenant reversion notice, at which time the financial covenants and other restrictions, including the dividend restriction, will revert to the limits applicable prior to the June 2020 amendment.
During 2020, we completed the sale of $2.8 billion of senior notes and used most of the net proceeds to purchase and redeem senior notes maturing in 2021, 2022, 2023 and 2024. The remaining net proceeds were used for general corporate purposes.
In August 2019, we completed the sale of $1.2 billion of senior notes and used the net proceeds to fund the make-whole redemption of all of our outstanding senior notes maturing in 2023, and the concurrent tender offers to purchase a portion of our senior notes maturing in 2021 and 2022.
For additional information regarding our debt arrangements, refer to Note 8.
Operating Activities
We generated consolidated operating cash flows of $3.9$3.0 billion in 2018 (net of $0.62020 (including $0.7 billion from working capital and other sources) and $1.5 billion in 2019 (including $0.3 billion from working capital uses and timing of other tax payments), $4.7 billion in 2017 (including $0.6 billion in working capital sources and timing of other tax payments) and$3.7 billion in 2016 (including $87 million in working capital sources and timing of other tax payments)sources).
Lower operating cash flows for 2018, compared with 2017, primarily reflected an increase in working capital uses mostly because of timing of international income tax payments. Higher operating cash flows for 2017,2020, compared with 2016,2019, primarily reflected the impact ofreflect higher copper prices, lower production and an increase in working capital sources from income tax refundsdelivery costs associated with lower mining rates, and other tax receivable collections, partly offset by increases in inventories.cost reductions associated with our April 2020 revised operating plans.
Investing Activities
Capital Expenditures. Capital expenditures, including capitalized interest, totaled $2.0$2.0 billion in 2018, for the year 2020, including $1.2 billion for major mining projects; $1.4projects primarily associated with underground development activities in the Grasberg minerals district and the now complete Lone Star copper leach project. Capital expenditures, including capitalized interest, totaled $2.7 billion in 2017, for the year 2019, including $0.9$1.5 billion for major mining projects;projects.
A large portion of the capital expenditures relate to projects that are expected to add significant production and $2.8 billioncash flow in 2016, consisting of $1.6 billion for mining operations (including $1.2 billion for major projects) and $1.2 billion for oil and gas operations.
Higherfuture periods, enabling us to continue to generate operating cash flows exceeding capital expenditures in 2018, compared with 2017, primarily reflected development of Safford’s Lone Star oxide project. Lower capital expenditures in2017, compared with 2016, primarily reflected a decrease in oil and gas exploration and development activities as a result of the sale of substantially all of our oil and gas properties in late 2016.
future years. Refer to “Outlook” for further discussion of projected capital expenditures for 2019.2021.
Acquisitions and Dispositions. In December 2018, we completedProceeds from Sales of Assets. Proceeds from sales of assets totaled $0.7 billion for the transaction with the Indonesian government regarding PT-FI’s long-term mining rights and share ownership. In connection with the transaction, PT-FI acquired Rio Tinto’s Joint Venture interests for $3.5 billion. In addition, we received proceeds of $350 million foryear 2020, primarily related to the sale of 100 percent ofKisanfu, our interestsundeveloped exploration project in PTI and $107 million from Rio Tinto for its sharethe DRC ($550 million), contingent consideration associated with the 2016 sale of the 2018 joint venture cash flows.Tenke Fungurume Mining assets in the DRC ($60 million), the
In 2016,collection of proceeds netrelated to the 2019 sale of closing adjustments,the Timok exploration assets in Serbia ($45 million) and the sale of royalty assets ($31 million).
Proceeds from asset sales of assets totaled $6.4$0.6 billion for the year 2019, primarily associated with the sales of (i) our interest in TFHL; oil and gas properties; an additional 13 percent undivided interest in Morenci; and an interest inthe lower zone of the Timok exploration project in Serbia.
Serbia, (ii) our cobalt refinery in Kokkola, Finland, and related cobalt cathode precursor business and (iii) interests in oil and gas properties, including $50 million in contingent consideration associated with the 2016 sale of onshore California oil and gas properties.
Refer to Note 2 for further discussion of acquisitions and dispositions.
Financing Activities
Debt Transactions. Net repayments of debt in 20182020 totaled $2.1$0.2 billion, primarily consistingreflecting the repayment of $1.4$0.3 billion for senior notes due March 2018 and $454 million for senior notes due in 2022 and 2023.under Cerro Verde’s Term Loan.
Net repayments of debt in 20172019 totaled $2.9$1.3 billion, primarily forconsisting of the redemption and repayment of $1.0 billion aggregate principal amount of our senior notes.
Net repayments of debtnotes maturing in 2016 totaled $3.9 billion, primarily for2020 and the repayment of an unsecured bank term loan and payments on$200 million under the Cerro Verde credit facility.Term Loan. Additionally, during 2019, we issued $1.2 billion in new senior notes and used the net proceeds to redeem and purchase senior notes maturing in 2021, 2022 and 2023.
Refer to Note 8 for further discussion of debt transactions.
Equity Transactions. In December 2018, an aggregate 40 percent share ownership in PT-FI was issued to PT InalumCash Dividends and PTI, for $3.5 billion. See Note 2 for further discussion.
In 2016, net proceeds from the sale of common stock totaled $1.5 billion, reflecting sales ofDistributions Paid. We paid dividends on our common stock under registered at-the-market equity offerings. Refer tototaling $73 million in 2020 (associated with the $0.05 per share common stock cash dividend declared in December 2019) and $291 million in 2019.
As further discussed in Note 10, for further discussion of equity transactions.
Dividends. Inin February 2018,2021, the Board reinstated a cash dividend on our common stock. We paid dividends onstock and also adopted a new financial policy for the allocation of cash flows aligned with our common stock totaling $218 million in 2018. On December 19, 2018, we declaredstrategic objectives of maintaining a quarterlystrong balance sheet, increasing cash dividend of $0.05 per share on our common stock, which was paid on February 1, 2019,returns to shareholders of record as of January 15, 2019.and advancing opportunities for future growth. The declaration and payment of future dividends is at the discretion of ourthe Board and will depend uponbe assessed on an ongoing basis, taking into account our financial results, cash requirements, future prospects, global economic conditions, and other factors deemed relevant by ourthe Board.
Dividends paid on our common stock totaling $2 million in 2017 and $6 million in 2016 related to accumulatedThere were no cash dividends paid for vested stock-based compensation.
Cash dividends and otheror distributions paid to noncontrolling interests totaled $278in 2020 and $82 million in 2018, $174 million in 2017 and $693 million in 2016 (including $582 million for the redemption of a redeemable noncontrolling interest).2019. These payments will vary based on the operating results and cash requirements of our consolidated subsidiaries.
CONTRACTUAL OBLIGATIONS
Contributions from Noncontrolling Interests.We have contractualreceived equity contributions from PT Inalum for their share of capital spending on PT-FI underground mine development projects and other long-term obligations, including debt maturities based on principal amounts, which we expect to fund with available cash, projected operating cash flows, availability under our revolving credit facility or future financing transactions, if necessary. Following is a summary of these various obligations at December 31, 2018 (in millions):
|
| | | | | | | | | | | | | | | | | | | | |
| | Total | | 2019 | | 2020 to 2021 | | 2022 to 2023 | | Thereafter |
| Debt maturities | $ | 11,152 |
| | $ | 17 |
| | $ | 2,124 |
| | $ | 5,074 |
| | $ | 3,937 |
|
Scheduled interest payment obligationsa | 4,867 |
| | 508 |
| — |
| 969 |
| | 661 |
| | 2,729 |
|
ARO and environmental obligationsb | 8,069 |
| | 449 |
| | 809 |
| | 532 |
| | 6,279 |
|
Take-or-pay contractsc | 2,920 |
| | 2,144 |
| | 381 |
| | 94 |
| | 301 |
|
| Operating lease obligations | 365 |
| | 53 |
| | 80 |
| | 61 |
| | 171 |
|
Totald | $ | 27,373 |
| | $ | 3,171 |
| | $ | 4,363 |
| | $ | 6,422 |
| | $ | 13,417 |
|
| |
a. | Scheduled interest payment obligations were calculated using stated coupon rates for fixed-rate debt and interest rates applicable at December 31, 2018, for variable-rate debt. |
| |
b. | Represents estimated cash payments, on an undiscounted and unescalated basis, associated with ARO and environmental activities (including $476 million for our oil and gas operations). The timing and the amount of these payments could change as a result of changes in regulatory requirements, changes in scope and timing of ARO activities, the settlement of environmental matters and as actual spending occurs. Refer to Note 12 for additional discussion of environmental and ARO matters. |
| |
c. | Represents contractual obligations for purchases of goods or services agreements enforceable and legally binding and that specify all significant terms, and primarily include the procurement of copper concentrate ($1.5 billion), cobalt ($0.5 billion), electricity ($0.4 billion) and transportation services ($0.3 billion). Some of our take-or-pay contracts are settled based on the prevailing market rate for the service or commodity purchased, and in some cases, the amount of the actual obligation may change over time because of market conditions. Obligations for copper concentrate provide for deliveries of specified volumes to Atlantic Copper at market-based prices. Obligations for cobalt hydroxide intermediate provide for deliveries of specified volumes to Freeport Cobalt at market-based prices. Electricity obligations are primarily for long-term power purchase agreements in North America and contractual minimum demand at the South America mines. Transportation obligations are primarily for South America contracted ocean freight. |
| |
d. | This table excludes certain other obligations in our consolidated balance sheets, such as estimated funding for pension, postretirement and other employee benefit obligations as the funding may vary from year to year based on changes in the fair value of plan assets and actuarial assumptions, commitments and contingencies totaling $97 million and unrecognized tax benefits totaling $230 million where the timing of settlement is not determinable, and other less significant amounts. This table also excludes purchase orders for inventory and other goods and services, as purchase orders typically represent authorizations to purchase rather than binding agreements. |
In addition to our debt maturities and other contractual obligations discussed above, we have other commitments, which we expect to fund with available cash, projected operating cash flows, available credit facilities or future financing transactions, if necessary. These include (i) PT-FI’s commitment to provide one percent of its annual revenuecosts for the development of the local peoplenew smelter in its area of operations through the Freeport Partnership Fund for Community Development, (ii) Cerro Verde’s scheduled installment payments for disputed mining royalty assessmentsIndonesia totaling $156 million in 2020 and (iii) other commercial commitments, including standby letters of credit, surety bonds and guarantees. Refer to Notes 12 and 13 for further discussion of these commitments.$165 million in 2019.
CONTINGENCIES
Environmental
The cost of complying with environmental laws is a fundamental and substantial cost of our business. At December 31, 2018,2020, we had $1.5$1.6 billion recorded in our consolidated balance sheet for environmental obligations attributed to CERCLA or analogous state programs and for estimated future costs associated with environmental obligations that are considered probable based on specific facts and circumstances.
We incurred environmental capital expenditures and other environmental costs (including our joint venture partners’ shares) to comply with applicable environmental laws and regulations that affect our operations totaling $0.4$0.3 billion in 2018, $0.5 billion in 20172020 and $0.4 billion in 2016.2019. For 2019,2021, we expect to incur approximately $0.5$0.4 billion of aggregate environmental capital expenditures and other environmental costs. The timing and amount of estimated payments could change as a result of changes in regulatory requirements, changes in scope and timing of reclamation and plug and abandonment activities, the settlement of environmental matters and the rate at which actual spending occurs on continuing matters.
In August 2020, the co-conveners of the Global Tailings Review, which included the International Council on Mining and Metals (ICMM), an industry group of which we are a founding member, published the first Global Industry Standard on Tailings Management (the Tailings Standard). The Tailings Standard includes 77 requirements across 6 key areas including the design, construction, operation and monitoring of tailings facilities, management and governance, emergency response and long-term recovery, and public disclosure. ICMM has committed that
members will implement the Tailings Standard within three years for certain facilities and within five years for all others. ICMM members have prepared a guidance document focused on practices that drive safe tailings management and prepared a conformance protocol document to be used by companies on demonstrating implementation of the Tailings Standard; both documents are expected to be published in early 2021. As a member of ICMM, which has endorsed the Tailings Standard, we are moving toward implementation and have begun undertaking an extensive, multi-year analysis of our tailings facilities to ensure conformance with the Tailings Standard. We are assessing the costs of complying with the new Tailings Standard.
Refer to Note 12 and “Risk Factors” contained in Part I, Item 1A. of our annual report on Form 10-K for the year ended December 31, 2018,2020, for further information about environmental regulation, including significant environmental matters.
Asset Retirement Obligations
We recognize AROs as liabilities when incurred, with the initial measurement at fair value. These obligations, which are initially estimated based on discounted cash flow estimates, are accreted to full value over time through charges to cost of sales. Mine reclamation costs for disturbances are recorded as an ARO and as a related asset retirement cost (ARC) (included in property, plant, equipment and mine development costs) in the period of disturbance. Oil and gas plugging and abandonment costs are recognized as an ARO and as a related ARC (included in oil and gas properties) in the period in which the well is drilled or acquired. For non-operating properties without reserves, changes to the ARO are recorded in earnings. Our cost estimates are reflected on a third-party cost basis and comply with our legal obligation to retire tangible, long-lived assets. At December 31, 2018,2020, we had $2.5 billion recorded in our consolidated balance sheet for AROs, including $0.5$0.4 billion related to our oil and gas properties. Spending on AROs totaled $160$156 million in 2018, $712020and $170 million in 2017 and $1882019 (including $38 million in 2016 (including $832020 and $77 million in 2018, $30 million in 2017 and $133 million in 20162019 for our oil and gas operations). For 2019,2021, we expect to incur approximately $0.3 billion in aggregate ARO payments (including $114 million$0.1 billion for our oil and gas operations). Refer to Note 12 for further discussion.
Litigation and Other Contingencies
Refer to Notes 2 and 12, and “Legal Proceedings” contained in Part I, Item 3. of our annual report on Form 10-K for the year ended December 31, 2018,2020, for further discussion of contingencies associated with legal proceedings and other matters.
DISCLOSURES ABOUT MARKET RISKS
Commodity Price Risk
Our consolidated revenues from our mining operations include the sale of copper concentrate, copper cathode, copper rod, gold, molybdenum and other metals by our North America and South America mines, the sale of copper concentrate (which also contains significant quantities of gold and silver) by our Indonesia mining operations, the sale of molybdenum in various forms by our molybdenum operations, and the sale of copper cathode, copper anode and gold in anode and slimes by Atlantic Copper. Our financial results will vary with fluctuations in the market prices of the commodities we produce, primarily copper and gold, and to a lesser extent molybdenum and silver. For projected sensitivities of our operating cash flow to changes in commodity prices, refer to “Outlook.” World market prices for these commodities have fluctuated historically and are affected by numerous factors beyond our control. Refer to “Risk Factors” contained in Part I, Item 1A. of our annual report on Form 10-K for the year ended December 31, 2018,2020, for further discussion of financial risks associated with fluctuations in the market prices of the commodities we sell.
During 2018,2020, our mined copper was sold 5951 percent in concentrate, 2128 percent as cathode and 2021 percent as rod from North America operations. Substantially all of our copper concentrate and cathode sales contracts provide final copper pricing in a specified future month (generally one to four months from the shipment date) based primarily on quoted LME monthly average copper settlement prices. We receive market prices based on prices in the specified
future period, which results in price fluctuations recorded through revenues until the date of settlement. We record revenues and invoice customers at the time of shipment based on then-current LME prices, which results in an embedded derivative on our provisionally priced concentrate and cathode sales that is adjusted to fair value through earnings each period, using the period-end forward prices, until final pricing on the date of settlement. To the extent final prices are higher or lower than what was recorded on a provisional basis, an increase or decrease to revenues is recorded each reporting period until the date of final pricing. Accordingly, in times of rising copper prices, our revenues benefit from adjustments to the final pricing of provisionally priced sales pursuant to contracts entered into in prior periods; in times of falling copper prices, the opposite occurs.
Following are the (unfavorable) favorable impacts of net adjustments to the prior years’ provisionally priced copper sales for the years ended December 31 (in millions, except per share amounts): | | | | 2018 | | 2017 | | 2016 | | 2020 | | 2019 | | |
| Revenues | $ | (70 | ) | | $ | 81 |
| | $ | 5 |
| Revenues | $ | (102) | | | $ | 58 | | | |
| Net income attributable to common stock | $ | (31 | ) | | $ | 34 |
| | $ | 2 |
| Net income attributable to common stock | $ | (42) | | | $ | 24 | | | |
| Net income per share attributable to common stock | $ | (0.02 | ) | | $ | 0.02 |
| | $ | — |
| Net income per share attributable to common stock | $ | (0.03) | | | $ | 0.02 | | | |
At December 31, 2018,2020, we had provisionally priced copper sales at our copper mining operations totaling 308320 million pounds of copper (net of intercompany sales and noncontrolling interests) recorded at an average price of $2.71$3.52 per pound, subject to final pricing over the next several months. We estimate that each $0.05 change in the price realized from the December 31, 2018,2020, provisional price recorded would have an approximate $10$10 million effect on 20192021 net income attributable to common stock. The LME copper settlement price closed at $2.79$3.57 per pound on January 31, 2019.29, 2021.
Foreign Currency Exchange Risk
The functional currency for most of our operations is the U.S. dollar. Substantially all of our revenues and a significant portion of our costs are denominated in U.S. dollars; however, some costs and certain asset and liability accounts are denominated in local currencies, including the IndonesianIndonesia rupiah, Australian dollar, Peruvian sol, Chilean peso and euro. We recognized foreign currency translation gains (losses) on balances denominated in foreign currencies totaling $14$34 million in 2018, $(5)2020 and$24 million in 2017 and $32 million in 2016, primarily at our Indonesia and South America mines.2019. Generally, our operating results are positively affected when the U.S. dollar strengthens in relation to those foreign currencies and are adversely affected when the U.S. dollar weakens in relation to those foreign currencies.
Following is a summary of estimated annual payments and the impact of changes in foreign currency rates on our annual operating costs:
| | | | | | | | | | | | | | | | | | | | | | | | | | | | | | | | | | | | | |
| Exchange Rate per $1
at December 31, | | Estimated Annual Payments | | 10% Change in Exchange Rate (in millions of U.S. dollars)a |
| | 2020 | | 2019 | | | | (in local currency) | | (in millions of U.S. dollars)b | | Increase | | Decrease |
| Indonesia | | | | | | | | | | | | | |
| Rupiah | 14,034 | | | 13,832 | | | | | 11.9 trillion | | $ | 848 | | | $ | (77) | | | $ | 94 | |
| Australian dollar | 1.30 | | | 1.43 | | | | | 195 million | | $ | 150 | | | $ | (14) | | | $ | 17 | |
| South America | | | | | | | | | | | | | |
| Peruvian sol | 3.62 | | | 3.32 | | | | | 2.1 billion | | $ | 573 | | | $ | (52) | | | $ | 64 | |
| Chilean peso | 711 | | | 749 | | | | | 175 billion | | $ | 246 | | | $ | (22) | | | $ | 27 | |
| Atlantic Copper | | | | | | | | | | | | | |
| Euro | 0.82 | | | 0.89 | | | | | 138 million | | $ | 169 | | | $ | (15) | | | $ | 19 | |
|
| | | | | | | | | | | | | | | | | | | | | | |
| | Exchange Rate per $1 at December 31, | | Estimated Annual Payments | | 10% Change in Exchange Rate (in millions of U.S. dollars)a |
| | 2018 | | 2017 | | 2016 | | (in local currency) | | (in millions of U.S. dollars)b | | Increase | | Decrease |
| Indonesia | | | | | | | | | |
| | | | |
| Rupiah | 14,409 |
| | 13,480 |
| | 13,369 |
| | 9.6 trillion | | $ | 666 |
| | $ | (61 | ) | | $ | 74 |
|
| Australian dollar | 1.41 |
| | 1.28 |
| | 1.39 |
| | 311 million | | $ | 221 |
| | $ | (20 | ) | | $ | 25 |
|
| South America | | | | | | | | | | | | | |
| Peruvian sol | 3.38 |
| | 3.25 |
| | 3.36 |
| | 2.3 billion | | $ | 667 |
| | $ | (61 | ) | | $ | 74 |
|
| Chilean peso | 695 |
| | 615 |
| | 670 |
| | 179 billion | | $ | 258 |
| | $ | (23 | ) | | $ | 29 |
|
| Atlantic Copper | | | | | | | | | | | | | |
| Euro | 0.87 |
| | 0.83 |
| | 0.95 |
| | 137 million | | $ | 157 |
| | $ | (14 | ) | | $ | 17 |
|
| |
a. | Reflects the estimated impact on annual operating costs assuming a 10 percent increase or decrease in the exchange rate reported at December 31, 2018. |
| |
b. | Based on exchange rates at December 31, 2018. |
b.Based on exchange rates at December 31, 2020.
Interest Rate Risk
At December 31, 2018,2020, we had total debt maturities based on principal amounts of $11.2$9.8 billion, of which approximately 106 percent was variable-rate debt with interest rates primarily based on the London Interbank Offered Rate. Refer to “Risk Factors” contained in Part I, Item 1A. of our annual report on Form 10-K for the year ended December 31, 2018. The table below presents average interest rates for our scheduled maturities of principal for
our outstanding debt (excluding fair value adjustments) and the related fair values at December 31, 20182020 (in millions, except percentages):
| | | | | | | | | | | | | | | | | | | | | | | | | | | | | | | | | | | | | | | | | |
| | 2021 | | 2022 | | 2023 | | 2024 | | 2025 | | Thereafter | | Fair Value |
| Fixed-rate debt | $ | 4 | | | $ | 524 | | | $ | 996 | | | $ | 730 | | | $ | — | | | $ | 6,963 | | | $ | 10,428 | |
| Average interest rate | — | % | | 3.6 | % | | 3.9 | % | | 4.6 | % | | — | % | | 5.1 | % | | 4.9 | % |
| | | | | | | | | | | | | |
| Variable-rate debt | $ | 32 | | | $ | 529 | | | $ | — | | | $ | — | | | $ | — | | | $ | 8 | | | $ | 566 | |
| Average interest rate | 1.2 | % | | 2.0 | % | | — | % | | — | % | | — | % | | 3.8 | % | | 2.0 | % |
|
| | | | | | | | | | | | | | | | | | | | | | | | | | | |
| | 2019 | | 2020 | | 2021 | | 2022 | | 2023 | | Thereafter | | Fair Value |
| Fixed-rate debt | $ | 5 |
| | $ | 1,004 |
| | $ | 614 |
| | $ | 1,897 |
| | $ | 2,653 |
| | $ | 3,812 |
| | $ | 9,076 |
|
| Average interest rate | 0.8 | % | | 3.1 | % | | 3.9 | % | | 3.5 | % | | 4.7 | % | | 5.4 | % | | 4.5 | % |
| | | | | | | | | | | | | | |
| Variable-rate debt | $ | 12 |
| | — |
| | $ | 505 |
| | $ | 525 |
| | — |
| | $ | 125 |
| | $ | 1,163 |
|
| Average interest rate | 1.7 | % | | — |
| | 4.4 | % | | 4.4 | % | | — |
| | 6.3 | % | | 4.6 | % |
NEW ACCOUNTING STANDARDS
Refer to Note 1 for discussion of a recently issuedadopted accounting standards and their projected impact on our future financial statements and disclosures.standard.
OFF-BALANCE SHEET ARRANGEMENTS
PRODUCT REVENUES AND PRODUCTION COSTS
Mining Product Revenues and Unit Net Cash Costs
Unit net cash costs per pound of copper and molybdenum are measures intended to provide investors with information about the cash-generating capacity of our mining operations expressed on a basis relating to the primary metal product for the respective operations. We use this measure for the same purpose and for monitoring operating performance by our mining operations. This information differs from measures of performance determined in accordance with U.S. GAAP and should not be considered in isolation or as a substitute for measures of performance determined in accordance with U.S. GAAP. These measures are presented by other metals mining companies, although our measures may not be comparable to similarly titled measures reported by other companies.
We present gross profit per pound of copper in the following tables using both a “by-product” method and a “co-product” method. We use the by-product method in our presentation of gross profit per pound of copper because (i) the majority of our revenues are copper revenues, (ii) we mine ore, which contains copper, gold, molybdenum and other metals, (iii) it is not possible to specifically assign all of our costs to revenues from the copper, gold, molybdenum and other metals we produce, (iv) it is the method used to compare mining operations in certain industry publications and (v) it is the method used by our management and the Board to monitor operations and to compare mining operations in certain industry publications. In the co-product method presentations, shared costs are allocated to the different products based on their relative revenue values, which will vary to the extent our metals sales volumes and realized prices change.
We show revenue adjustments for prior period open sales as separate line items. Because these adjustments do not result from current period sales, these amounts have been reflected separately from revenues on current period sales. Noncash and other costs, which are removed from site production and delivery costs in the calculation of unit net cash costs, consist of items such as stock-based compensation costs, start-up costs, inventory adjustments, long-lived asset impairments, restructuring and/or unusual charges. As discussed above, gold, molybdenum and other metal revenues at copper mines are reflected as credits against site production and delivery costs in the by-product method. The following schedules are presentations under both the by-product and co-product methods together with reconciliations to amounts reported in our consolidated financial statements.
North America Copper Mines Product Revenues, Production Costs and Unit Net Cash Costs
| | | | | | | | | | | | | | | | | | | | | | | | | | | | | | | | |
| Year Ended December 31, 2020 | | | | |
| (In millions) | | By-Product | | Co-Product Method |
| | Method | | Copper | | Molybdenuma | | Otherb | | Total |
| Revenues, excluding adjustments | | $ | 4,005 | | c | $ | 4,005 | | | $ | 281 | | | $ | 83 | | | $ | 4,369 | |
Site production and delivery, before net noncash
and other costs shown below | | 2,700 | | | 2,529 | | | 223 | | | 44 | | | 2,796 | |
| By-product credits | | (268) | | | — | | | — | | | — | | | — | |
| Treatment charges | | 139 | | | 136 | | | — | | | 3 | | | 139 | |
| Net cash costs | | 2,571 | | | 2,665 | | | 223 | | | 47 | | | 2,935 | |
| DD&A | | 355 | | | 330 | | | 18 | | | 7 | | | 355 | |
| Metals inventory adjustments | | 52 | | | 49 | | | — | | | 3 | | | 52 | |
| Noncash and other costs, net | | 138 | | d | 133 | | | 3 | | | 2 | | | 138 | |
| Total costs | | 3,116 | | | 3,177 | | | 244 | | | 59 | | | 3,480 | |
Other revenue adjustments, primarily for pricing
on prior period open sales | | (22) | | | (22) | | | — | | | — | | | (22) | |
| Gross profit | | $ | 867 | | | $ | 806 | | | $ | 37 | | | $ | 24 | | | $ | 867 | |
| | | | | | | | | | |
| Copper sales (millions of recoverable pounds) | | 1,420 | | | 1,420 | | | | | | | |
Molybdenum sales (millions of recoverable pounds)a | | | | | | 33 | | | | | |
| | | | | | | | | | |
| Gross profit per pound of copper/molybdenum: | | | | | |
| | | | | | | | | | |
| Revenues, excluding adjustments | | $ | 2.82 | | c | $ | 2.82 | | | $ | 8.62 | | | | | |
Site production and delivery, before net noncash
and other costs shown below | | 1.90 | | | 1.78 | | | 6.84 | | | | | |
| By-product credits | | (0.19) | | | — | | | — | | | | | |
| Treatment charges | | 0.10 | | | 0.10 | | | — | | | | | |
| Unit net cash costs | | 1.81 | | | 1.88 | | | 6.84 | | | | | |
| DD&A | | 0.25 | | | 0.23 | | | 0.56 | | | | | |
| Metals inventory adjustments | | 0.03 | | | 0.03 | | | — | | | | | |
| Noncash and other costs, net | | 0.10 | | d | 0.10 | | | 0.09 | | | | | |
| Total unit costs | | 2.19 | | | 2.24 | | | 7.49 | | | | | |
Other revenue adjustments, primarily for pricing
on prior period open sales | | (0.02) | | | (0.02) | | | — | | | | | |
| Gross profit per pound | | $ | 0.61 | | | $ | 0.56 | | | $ | 1.13 | | | | | |
| | | | | | | | | | |
| Reconciliation to Amounts Reported | | | | | | | | |
| | | | | | | | Metals | | |
| | | | | Production | | | | Inventory | | |
| | Revenues | | and Delivery | | DD&A | | Adjustments | | |
| Totals presented above | | $ | 4,369 | | | $ | 2,796 | | | $ | 355 | | | $ | 52 | | | |
| Treatment charges | | (15) | | | 124 | | | — | | | — | | | |
| Noncash and other costs, net | | — | | | 138 | | | — | | | — | | | |
Other revenue adjustments, primarily for pricing
on prior period open sales | | (22) | | | — | | | — | | | — | | | |
| Eliminations and other | | 32 | | | 42 | | | — | | | — | | | |
| North America copper mines | | 4,364 | | | 3,100 | | | 355 | | | 52 | | | |
Other mininge | | 13,642 | | | 10,595 | | | 1,103 | | | 16 | | | |
| | | | | | | | | | |
| | | | | | | | | | |
| Corporate, other & eliminations | | (3,808) | | | (3,664) | | | 70 | | | 28 | | | |
| As reported in our consolidated financial statements | | $ | 14,198 | | | $ | 10,031 | | | $ | 1,528 | | | $ | 96 | | | |
a.Reflects sales of molybdenum produced by certain of the North America copper mines to our molybdenum sales company at market-based pricing.
b.Includes gold and silver product revenues and production costs.
c.Includes reductions to revenues and average realized prices totaling $24 million ($0.02 per pound of copper) related to forward sales contracts covering 150 million pounds of copper sales for May and June 2020 at a fixed price of $2.34 per pound.
d.Includes charges totaling $32 million ($0.02 per pound of copper) primarily associated with our April 2020 revised operating plans (including employee separation costs) and the COVID-19 pandemic (including health and safety costs).
e.Represents the combined total for our other mining operations as presented in Note 16.
|
| | | | | | | | | | | | | | | | | | | | |
| Year Ended December 31, 2018 | | | | |
| (In millions) | | By-Product | | Co-Product Method |
| | | Method | | Copper | | Molybdenuma | | Otherb | | Total |
| Revenues, excluding adjustments | | $ | 4,217 |
| | $ | 4,217 |
| | $ | 376 |
| | $ | 90 |
| | $ | 4,683 |
|
| Site production and delivery, before net noncash | | | | | | | | | | |
| and other costs shown below | | 2,766 |
| | 2,522 |
| | 291 |
| | 52 |
| | 2,865 |
|
| By-product credits | | (367 | ) | | — |
| | — |
| | — |
| | — |
|
| Treatment charges | | 150 |
| | 144 |
| | — |
| | 6 |
| | 150 |
|
| Net cash costs | | 2,549 |
| | 2,666 |
| | 291 |
| | 58 |
| | 3,015 |
|
| DD&A | | 359 |
| | 327 |
| | 24 |
| | 8 |
| | 359 |
|
| Noncash and other costs, net | | 94 |
| | 87 |
| | 6 |
| | 1 |
| | 94 |
|
| Total costs | | 3,002 |
| | 3,080 |
| | 321 |
| | 67 |
| | 3,468 |
|
Other revenue adjustments, primarily for pricing on prior period open sales | | (5 | ) | | (5 | ) | | — |
| | — |
| | (5 | ) |
| Gross profit | | $ | 1,210 |
| | $ | 1,132 |
| | $ | 55 |
| | $ | 23 |
| | $ | 1,210 |
|
| | | | | | | | | | | |
| Copper sales (millions of recoverable pounds) | | 1,426 |
| | 1,426 |
| | | | | | |
Molybdenum sales (millions of recoverable pounds)a | | | | | | 32 |
| | | | |
| | | | | | | | | | | |
| Gross profit per pound of copper/molybdenum: | | | | | |
| | | | | | | | | | | |
| Revenues, excluding adjustments | | $ | 2.96 |
| | $ | 2.96 |
| | $ | 11.64 |
| | | | |
| Site production and delivery, before net noncash | | | | | | | | | | |
| and other costs shown below | | 1.94 |
| | 1.77 |
| | 9.03 |
| | | | |
| By-product credits | | (0.26 | ) | | — |
| | — |
| | | | |
| Treatment charges | | 0.11 |
| | 0.10 |
| | — |
| | | | |
| Unit net cash costs | | 1.79 |
| | 1.87 |
| | 9.03 |
| | | | |
| DD&A | | 0.25 |
| | 0.23 |
| | 0.73 |
| | | | |
| Noncash and other costs, net | | 0.07 |
| | 0.06 |
| | 0.17 |
| | | | |
| Total unit costs | | 2.11 |
| | 2.16 |
| | 9.93 |
| | | | |
| Other revenue adjustments, primarily for pricing | | | | | | | | | | |
| on prior period open sales | | — |
| | — |
| | — |
| | | | |
| Gross profit per pound | | $ | 0.85 |
| | $ | 0.80 |
| | $ | 1.71 |
| | | | |
| | | | | | | | | | | |
| Reconciliation to Amounts Reported | | | | | | | | |
| (In millions) | | | | | | | | | | |
| | | | | Production | | | | | | |
| | | Revenues | | and Delivery | | DD&A | | | | |
| Totals presented above | | $ | 4,683 |
| | $ | 2,865 |
| | $ | 359 |
| | | | |
| Treatment charges | | (30 | ) | | 120 |
| | — |
| | | | |
| Noncash and other costs, net | | — |
| | 94 |
| | — |
| | | | |
Other revenue adjustments, primarily for pricing on prior period open sales | | (5 | ) | | — |
| | — |
| | | | |
| Eliminations and other | | 46 |
| | 49 |
| | 1 |
| | | | |
| North America copper mines | | 4,694 |
| | 3,128 |
| | 360 |
| | | | |
Other miningc | | 17,060 |
| | 11,853 |
| | 1,269 |
| | | | |
| Corporate, other & eliminations | | (3,126 | ) | | (3,290 | ) | | 125 |
| | | | |
| As reported in FCX’s consolidated financial statements | | $ | 18,628 |
| | $ | 11,691 |
| | $ | 1,754 |
| | | | |
| |
a. | Reflects sales of molybdenum produced by certain of the North America copper mines to our molybdenum sales company at market-based pricing. |
| |
b. | Includes gold and silver product revenues and production costs.
|
| |
c. | Represents the combined total for our other mining operations as presented in Note 16. |
North America Copper Mines Product Revenues, Production Costs and Unit Net Cash Costs
| | | | | | | | | | | | | | | | | | | | | | | | | | | | | | | | |
| Year Ended December 31, 2019 | | | | |
| (In millions) | | By-Product | | Co-Product Method |
| | Method | | Copper | | Molybdenuma | | Otherb | | Total |
| Revenues, excluding adjustments | | $ | 3,950 | | | $ | 3,950 | | | $ | 370 | | | $ | 84 | | | $ | 4,404 | |
Site production and delivery, before net noncash
and other costs shown below | | 2,957 | | | 2,711 | | | 299 | | | 53 | | | 3,063 | |
| By-product credits | | (348) | | | — | | | — | | | — | | | — | |
| Treatment charges | | 161 | | | 155 | | | — | | | 6 | | | 161 | |
| Net cash costs | | 2,770 | | | 2,866 | | | 299 | | | 59 | | | 3,224 | |
| DD&A | | 348 | | | 318 | | | 23 | | | 7 | | | 348 | |
| Metals inventory adjustments | | 30 | | | 30 | | | — | | | — | | | 30 | |
| Noncash and other costs, net | | 110 | | | 98 | | | 9 | | | 3 | | | 110 | |
| Total costs | | 3,258 | | | 3,312 | | | 331 | | | 69 | | | 3,712 | |
Other revenue adjustments, primarily for pricing
on prior period open sales | | 4 | | | 4 | | | — | | | — | | | 4 | |
| Gross profit | | $ | 696 | | | $ | 642 | | | $ | 39 | | | $ | 15 | | | $ | 696 | |
| | | | | | | | | | |
| Copper sales (millions of recoverable pounds) | | 1,441 | | | 1,441 | | | | | | | |
Molybdenum sales (millions of recoverable pounds)a | | | | | | 32 | | | | | |
| | | | | | | | | | |
| Gross profit per pound of copper/molybdenum: | | | | | |
| | | | | | | | | | |
| Revenues, excluding adjustments | | $ | 2.74 | | | $ | 2.74 | | | $ | 11.51 | | | | | |
Site production and delivery, before net noncash
and other costs shown below | | 2.05 | | | 1.88 | | | 9.29 | | | | | |
| By-product credits | | (0.24) | | | — | | | — | | | | | |
| Treatment charges | | 0.11 | | | 0.11 | | | — | | | | | |
| Unit net cash costs | | 1.92 | | | 1.99 | | | 9.29 | | | | | |
| DD&A | | 0.24 | | | 0.21 | | | 0.72 | | | | | |
| Metals inventory adjustments | | 0.02 | | | 0.02 | | | — | | | | | |
| Noncash and other costs, net | | 0.08 | | | 0.07 | | | 0.29 | | | | | |
| Total unit costs | | 2.26 | | | 2.29 | | | 10.30 | | | | | |
Other revenue adjustments, primarily for pricing
on prior period open sales | | — | | | — | | | — | | | | | |
| Gross profit per pound | | $ | 0.48 | | | $ | 0.45 | | | $ | 1.21 | | | | | |
| | | | | | | | | | |
| Reconciliation to Amounts Reported | | | | | | | | | | |
| | | | | | | | Metals | | |
| | | | | Production | | | | Inventory | | |
| | Revenues | | and Delivery | | DD&A | | Adjustments | | |
| Totals presented above | | $ | 4,404 | | | $ | 3,063 | | | $ | 348 | | | $ | 30 | | | |
| Treatment charges | | (60) | | | 101 | | | — | | | — | | | |
| Noncash and other costs, net | | — | | | 110 | | | — | | | — | | | |
Other revenue adjustments, primarily for pricing
on prior period open sales | | 4 | | | — | | | — | | | — | | | |
| Eliminations and other | | 38 | | | 45 | | | 1 | | | — | | | |
| North America copper mines | | 4,386 | | | 3,319 | | | 349 | | | 30 | | | |
Other miningc | | 13,054 | | | 11,126 | | | 979 | | | 57 | | | |
| | | | | | | | | | |
| | | | | | | | | | |
| Corporate, other & eliminations | | (3,038) | | | (2,911) | | | 84 | | | 92 | | | |
| As reported in our consolidated financial statements | | $ | 14,402 | | | $ | 11,534 | | | $ | 1,412 | | | $ | 179 | | | |
|
| | | | | | | | | | | | | | | | | | | | |
| Year Ended December 31, 2017 | | | | |
| (In millions) | | By-Product | | Co-Product Method |
| | | Method | | Copper | | Molybdenuma | | Otherb | | Total |
| Revenues, excluding adjustments | | $ | 4,215 |
| | $ | 4,215 |
| | $ | 254 |
| | $ | 90 |
| | $ | 4,559 |
|
| Site production and delivery, before net noncash | | | | | | | | | | |
| and other costs shown below | | 2,406 |
| | 2,256 |
| | 187 |
| | 51 |
| | 2,494 |
|
| By-product credits | | (256 | ) | | — |
| | — |
| | — |
| | — |
|
| Treatment charges | | 157 |
| | 150 |
| | — |
| | 7 |
| | 157 |
|
| Net cash costs | | 2,307 |
| | 2,406 |
| | 187 |
| | 58 |
| | 2,651 |
|
| DD&A | | 423 |
| | 397 |
| | 18 |
| | 8 |
| | 423 |
|
| Noncash and other costs, net | | 89 |
| | 86 |
| | 2 |
| | 1 |
| | 89 |
|
| Total costs | | 2,819 |
| | 2,889 |
| | 207 |
| | 67 |
| | 3,163 |
|
Other revenue adjustments, primarily for pricing on prior period open sales | | 4 |
| | 4 |
| | — |
| | — |
| | 4 |
|
| Gross profit | | $ | 1,400 |
| | $ | 1,330 |
| | $ | 47 |
| | $ | 23 |
| | $ | 1,400 |
|
| | | | | | | | | | | |
| Copper sales (millions of recoverable pounds) | | 1,481 |
| | 1,481 |
| | | | | | |
Molybdenum sales (millions of recoverable pounds)a | | | | | | 33 |
| | | | |
| | | | | | | | | | | |
| Gross profit per pound of copper/molybdenum: | | | | | |
| | | | | | | | | | | |
| Revenues, excluding adjustments | | $ | 2.85 |
| | $ | 2.85 |
| | $ | 7.80 |
| | | | |
| Site production and delivery, before net noncash | | | | | | | | | | |
| and other costs shown below | | 1.63 |
| | 1.52 |
| | 5.75 |
| | | | |
| By-product credits | | (0.17 | ) | | — |
| | — |
| | | | |
| Treatment charges | | 0.10 |
| | 0.10 |
| | — |
| | | | |
| Unit net cash costs | | 1.56 |
| | 1.62 |
| | 5.75 |
| | | | |
| DD&A | | 0.29 |
| | 0.27 |
| | 0.54 |
| | | | |
| Noncash and other costs, net | | 0.06 |
| | 0.06 |
| | 0.07 |
| | | | |
| Total unit costs | | 1.91 |
| | 1.95 |
| | 6.36 |
| | | | |
| Other revenue adjustments, primarily for pricing | | | | | | | | | | |
| on prior period open sales | | — |
| | — |
| | — |
| | | | |
| Gross profit per pound | | $ | 0.94 |
| | $ | 0.90 |
| | $ | 1.44 |
| | | | |
| | | | | | | | | | | |
| Reconciliation to Amounts Reported | | | | | | | | | | |
| (In millions) | | | | | | | | | | |
| | | | | Production | | | | | | |
| | | Revenues | | and Delivery | | DD&A | | | | |
| Totals presented above | | $ | 4,559 |
| | $ | 2,494 |
| | $ | 423 |
| | | | |
| Treatment charges | | (52 | ) | | 105 |
| | — |
| | | | |
| Noncash and other costs, net | | — |
| | 89 |
| | — |
| | | | |
Other revenue adjustments, primarily for pricing on prior period open sales | | 4 |
| | — |
| | — |
| | | | |
| Eliminations and other | | 54 |
| | 57 |
| | 2 |
| | | | |
| North America copper mines | | 4,565 |
| | 2,745 |
| | 425 |
| | | | |
Other miningc | | 14,921 |
| | 10,639 |
| | 1,195 |
| | | | |
| Corporate, other & eliminations | | (3,083 | ) | | (3,118 | ) | | 94 |
| | | | |
| As reported in FCX’s consolidated financial statements | | $ | 16,403 |
| | $ | 10,266 |
| | $ | 1,714 |
| | | | |
| |
a. | a.Reflects sales of molybdenum produced by certain of the North America copper mines to our molybdenum sales company at market-based pricing. |
| |
b. | Includes gold and silver product revenues and production costs. |
| |
c. | Represents the combined total for our other mining operations as presented in Note 16. |
North America Copper Mines Product Revenues, Production Costscopper mines to our molybdenum sales company at market-based pricing.
b.Includes gold and Unit Net Cash Costssilver product revenues and production costs.
c.Represents the combined total for our other mining operations as presented in Note 16.
|
| | | | | | | | | | | | | | | | | | | | |
| Year Ended December 31, 2016 | | | | |
| (In millions) | | By-Product | | Co-Product Method |
| | | Method | | Copper | | Molybdenuma | | Otherb | | Total |
| Revenues, excluding adjustments | | $ | 4,113 |
| | $ | 4,113 |
| | $ | 213 |
| | $ | 94 |
| | $ | 4,420 |
|
| Site production and delivery, before net noncash | | | | | | | | | | |
| and other costs shown below | | 2,596 |
| | 2,458 |
| | 165 |
| | 58 |
| | 2,681 |
|
| By-product credits | | (222 | ) | | — |
| | — |
| | — |
| | — |
|
| Treatment charges | | 193 |
| | 185 |
| | — |
| | 8 |
| | 193 |
|
| Net cash costs | | 2,567 |
| | 2,643 |
| | 165 |
| | 66 |
| | 2,874 |
|
| DD&A | | 527 |
| | 496 |
| | 20 |
| | 11 |
| | 527 |
|
| Noncash and other costs, net | | 85 |
| | 83 |
| | 2 |
| | — |
| | 85 |
|
| Total costs | | 3,179 |
| | 3,222 |
| | 187 |
| | 77 |
| | 3,486 |
|
Other revenue adjustments, primarily for pricing on prior period open sales | | (1 | ) | | (1 | ) | | — |
| | — |
| | (1 | ) |
| Gross profit | | $ | 933 |
| | $ | 890 |
| | $ | 26 |
| | $ | 17 |
| | $ | 933 |
|
| | | | | | | | | | | |
| Copper sales (millions of recoverable pounds) | | 1,836 |
| | 1,836 |
| | | | | | |
Molybdenum sales (millions of recoverable pounds)a | | | | | | 33 |
| | | | |
| | | | | | | | | | | |
| Gross profit per pound of copper/molybdenum: | | | | | |
| | | | | | | | | | | |
| Revenues, excluding adjustments | | $ | 2.24 |
| | $ | 2.24 |
| | $ | 6.34 |
| | | | |
| Site production and delivery, before net noncash | | | | | | | | | | |
| and other costs shown below | | 1.41 |
| | 1.34 |
| | 4.91 |
| | | | |
| By-product credits | | (0.12 | ) | | — |
| | — |
| | | | |
| Treatment charges | | 0.11 |
| | 0.10 |
| | — |
| | | | |
| Unit net cash costs | | 1.40 |
| | 1.44 |
| | 4.91 |
| | | | |
| DD&A | | 0.29 |
| | 0.27 |
| | 0.60 |
| | | | |
| Noncash and other costs, net | | 0.04 |
| | 0.04 |
| | 0.06 |
| | | | |
| Total unit costs | | 1.73 |
| | 1.75 |
| | 5.57 |
| | | | |
| Other revenue adjustments, primarily for pricing | | | | | | | | | | |
| on prior period open sales | | — |
| | — |
| | — |
| | | | |
| Gross profit per pound | | $ | 0.51 |
| | $ | 0.49 |
| | $ | 0.77 |
| | | | |
| | | | | | | | | | | |
| Reconciliation to Amounts Reported | | | | | | | | | | |
| (In millions) | | | | | | | | | | |
| | | | | Production | | | | | | |
| | | Revenues | | and Delivery | | DD&A | | | | |
| Totals presented above | | $ | 4,420 |
| | $ | 2,681 |
| | $ | 527 |
| | | | |
| Treatment charges | | (90 | ) | | 103 |
| | — |
| | | | |
| Noncash and other costs, net | | — |
| | 85 |
| | — |
| | | | |
Other revenue adjustments, primarily for pricing on prior period open sales | | (1 | ) | | — |
| | — |
| | | | |
| Eliminations and other | | 45 |
| | 45 |
| | 3 |
| | | | |
| North America copper mines | | 4,374 |
| | 2,914 |
| | 530 |
| | | | |
Other miningc | | 12,111 |
| | 9,290 |
| | 1,044 |
| | | | |
| Corporate, other & eliminations | | (1,655 | ) | | (1,517 | ) | | 956 |
| | | | |
| As reported in FCX’s consolidated financial statements | | $ | 14,830 |
| | $ | 10,687 |
| | $ | 2,530 |
| | | | |
| |
a. | Reflects sales of molybdenum produced by certain of the North America copper mines to our molybdenum sales company at market-based pricing. |
| |
b. | Includes gold and silver product revenues and production costs. |
| |
c. | Represents the combined total for our other mining operations as presented in Note 16. |
South America Mining Product Revenues, Production Costs and Unit Net Cash Costs
| | | | | | | | | | | | | | | | | | | | | | | |
| Year Ended December 31, 2020 | | | | | | | |
| (In millions) | By-Product | | Co-Product Method |
| Method | | Copper | | Othera | | Total |
| Revenues, excluding adjustments | $ | 2,976 | | | $ | 2,976 | | | $ | 209 | | | $ | 3,185 | |
Site production and delivery, before net noncash
and other costs shown below | 1,816 | | | 1,701 | | | 158 | | | 1,859 | |
| By-product credits | (166) | | | — | | | — | | | — | |
| Treatment charges | 152 | | | 152 | | | — | | | 152 | |
| Royalty on metals | 6 | | | 6 | | | — | | | 6 | |
| Net cash costs | 1,808 | | | 1,859 | | | 158 | | | 2,017 | |
| DD&A | 421 | | | 391 | | | 30 | | | 421 | |
| Metals inventory adjustments | 3 | | | 3 | | | — | | | 3 | |
| Noncash and other costs, net | 122 | | b | 115 | | | 7 | | | 122 | |
| Total costs | 2,354 | | | 2,368 | | | 195 | | | 2,563 | |
Other revenue adjustments, primarily for pricing
on prior period open sales | (70) | | | (70) | | | — | | | (70) | |
| Gross profit | $ | 552 | | | $ | 538 | | | $ | 14 | | | $ | 552 | |
| | | | | | | |
| Copper sales (millions of recoverable pounds) | 976 | | | 976 | | | | | |
| | | | | | | |
| Gross profit per pound of copper: | | | |
| | | | | | | |
| Revenues, excluding adjustments | $ | 3.05 | | | $ | 3.05 | | | | | |
Site production and delivery, before net noncash
and other costs shown below | 1.86 | | | 1.74 | | | | | |
| By-product credits | (0.17) | | | — | | | | | |
| Treatment charges | 0.15 | | | 0.15 | | | | | |
| Royalty on metals | 0.01 | | | 0.01 | | | | | |
| Unit net cash costs | 1.85 | | | 1.90 | | | | | |
| DD&A | 0.43 | | | 0.41 | | | | | |
| Metals inventory adjustments | — | | | — | | | | | |
| Noncash and other costs, net | 0.13 | | b | 0.12 | | | | | |
| Total unit costs | 2.41 | | | 2.43 | | | | | |
Other revenue adjustments, primarily for pricing
on prior period open sales | (0.07) | | | (0.07) | | | | | |
| Gross profit per pound | $ | 0.57 | | | $ | 0.55 | | | | | |
| | | | | | | |
| Reconciliation to Amounts Reported | | | | | | | |
| | | | | | | Metals |
| | | | Production | | | | Inventory |
| Revenues | | and Delivery | | DD&A | | Adjustments |
| Totals presented above | $ | 3,185 | | | $ | 1,859 | | | $ | 421 | | | $ | 3 | |
| Treatment charges | (152) | | | — | | | — | | | — | |
| Royalty on metals | (6) | | | — | | | — | | | — | |
| Noncash and other costs, net | — | | | 122 | | | — | | | — | |
Other revenue adjustments, primarily for pricing
on prior period open sales | (70) | | | — | | | — | | | — | |
| Eliminations and other | (2) | | | (3) | | | — | | | — | |
| South America mining | 2,955 | | | 1,978 | | | 421 | | | 3 | |
Other miningc | 15,051 | | | 11,717 | | | 1,037 | | | 65 | |
| | | | | | | |
| | | | | | | |
| Corporate, other & eliminations | (3,808) | | | (3,664) | | | 70 | | | 28 | |
| As reported in our consolidated financial statements | $ | 14,198 | | | $ | 10,031 | | | $ | 1,528 | | | $ | 96 | |
a.Includes silver sales of 3.4 million ounces ($21.86 per ounce average realized price). Also reflects sales of molybdenum produced by Cerro Verde to our molybdenum sales company at market-based pricing.
b.Includes charges totaling $91 million($0.09 per pound of copper) primarily associated with idle facility (Cerro Verde) and contract cancellation costs related to the COVID-19 pandemic, and employee separation costs associated with our April 2020 revised operating plans.
c.Represents the combined total for our other mining operations as presented in Note 16.
|
| | | | | | | | | | | | | | | |
| Year Ended December 31, 2018 | | | | | | | |
| (In millions) | By-Product | | Co-Product Method |
| | Method | | Copper | | Othera | | Total |
| Revenues, excluding adjustments | $ | 3,593 |
| | $ | 3,593 |
| | $ | 352 |
| | $ | 3,945 |
|
| Site production and delivery, before net noncash | | | | | | | |
| and other costs shown below | 2,244 |
| b | 2,065 |
| | 226 |
| | 2,291 |
|
| By-product credits | (305 | ) | | — |
| | — |
| | — |
|
| Treatment charges | 243 |
| | 243 |
| | — |
| | 243 |
|
| Royalty on metals | 8 |
| | 7 |
| | 1 |
| | 8 |
|
| Net cash costs | 2,190 |
| | 2,315 |
| | 227 |
| | 2,542 |
|
| DD&A | 546 |
| | 499 |
| | 47 |
| | 546 |
|
| Noncash and other costs, net | 79 |
| c | 75 |
| | 4 |
| | 79 |
|
| Total costs | 2,815 |
| | 2,889 |
| | 278 |
| | 3,167 |
|
Other revenue adjustments, primarily for pricing on prior period open sales | (37 | ) | | (37 | ) | | — |
| | (37 | ) |
| Gross profit | $ | 741 |
| | $ | 667 |
| | $ | 74 |
| | $ | 741 |
|
| | | | | | | | |
| Copper sales (millions of recoverable pounds) | 1,253 |
| | 1,253 |
| | | | |
| | | | | | | | |
| Gross profit per pound of copper: | | | |
| | | | | | | | |
| Revenues, excluding adjustments | $ | 2.87 |
| | $ | 2.87 |
| | | | |
| Site production and delivery, before net noncash | | | | | | | |
| and other costs shown below | 1.79 |
| b | 1.65 |
| | | | |
| By-product credits | (0.24 | ) | | — |
| | | | |
| Treatment charges | 0.19 |
| | 0.19 |
| | | | |
| Royalty on metals | 0.01 |
| | 0.01 |
| | | | |
| Unit net cash costs | 1.75 |
| | 1.85 |
| | | | |
| DD&A | 0.44 |
| | 0.40 |
| | | | |
| Noncash and other costs, net | 0.06 |
| c | 0.06 |
| | | | |
| Total unit costs | 2.25 |
| | 2.31 |
| | | | |
| Other revenue adjustments, primarily for pricing | | | | | | | |
| on prior period open sales | (0.03 | ) | | (0.03 | ) | | | | |
| Gross profit per pound | $ | 0.59 |
| | $ | 0.53 |
| | | | |
| | | | | | | | |
| Reconciliation to Amounts Reported | | | | | | | |
| (In millions) | | | | | | | |
| | | | Production | | | | |
| | Revenues | | and Delivery | | DD&A | | |
| Totals presented above | $ | 3,945 |
| | $ | 2,291 |
| | $ | 546 |
| | |
| Treatment charges | (243 | ) | | — |
| | — |
| | |
| Royalty on metals | (8 | ) | | — |
| | — |
| | |
| Noncash and other costs, net | — |
| | 79 |
| | — |
| | |
Other revenue adjustments, primarily for pricing on prior period open sales | (37 | ) | | — |
| | — |
| | |
| Eliminations and other | (2 | ) | | (5 | ) | | — |
| | |
| South America mining | 3,655 |
| | 2,365 |
| | 546 |
| | |
Other miningd | 18,099 |
| | 12,616 |
| | 1,083 |
| | |
| Corporate, other & eliminations | (3,126 | ) | | (3,290 | ) | | 125 |
| | |
| As reported in FCX’s consolidated financial statements | $ | 18,628 |
| | $ | 11,691 |
| | $ | 1,754 |
| | |
| |
a. | Includes silver sales of 4.5 million ounces ($15.20 per ounce average realized price). Also reflects sales of molybdenum produced by Cerro Verde to our molybdenum sales company at market-based pricing. |
| |
b. | Includes charges totaling $69 million ($0.06 per pound of copper) for Cerro Verde’s three-year CLA.
|
| |
c. | Includes charges totaling $14 million ($0.01 per pound of copper) at Cerro Verde associated with disputed royalties for prior years. |
| |
d. | Represents the combined total for our other mining operations as presented in Note 16. |
South America Mining Product Revenues, Production Costs and Unit Net Cash Costs
| | | | | | | | | | | | | | | | | | | | | | | |
| Year Ended December 31, 2019 | | | | | | | |
| (In millions) | By-Product | | Co-Product Method |
| Method | | Copper | | Othera | | Total |
| Revenues, excluding adjustments | $ | 3,213 | | | $ | 3,213 | | | $ | 358 | | | $ | 3,571 | |
Site production and delivery, before net noncash
and other costs shown below | 2,185 | |
| 1,991 | | | 245 | | | 2,236 | |
| By-product credits | (307) | | | — | | | — | | | — | |
| Treatment charges | 212 | | | 212 | | | — | | | 212 | |
| Royalty on metals | 7 | | | 6 | | | 1 | | | 7 | |
| Net cash costs | 2,097 | | | 2,209 | | | 246 | | | 2,455 | |
| DD&A | 474 | | | 427 | | | 47 | | | 474 | |
| Metals inventory adjustments | 2 | | | 2 | | | — | | | 2 | |
| Noncash and other costs, net | 94 | | | 90 | | | 4 | | | 94 | |
| Total costs | 2,667 | | | 2,728 | | | 297 | | | 3,025 | |
Other revenue adjustments, primarily for pricing
on prior period open sales | 37 | | | 37 | | | — | | | 37 | |
| Gross profit | $ | 583 | | | $ | 522 | | | $ | 61 | | | $ | 583 | |
| | | | | | | |
| Copper sales (millions of recoverable pounds) | 1,183 | | | 1,183 | | | | | |
| | | | | | | |
| Gross profit per pound of copper: | | | |
| | | | | | | |
| Revenues, excluding adjustments | $ | 2.71 | | | $ | 2.71 | | | | | |
Site production and delivery, before net noncash
and other costs shown below | 1.85 | |
| 1.68 | | | | | |
| By-product credits | (0.27) | | | — | | | | | |
| Treatment charges | 0.18 | | | 0.18 | | | | | |
| Royalty on metals | 0.01 | | | 0.01 | | | | | |
| Unit net cash costs | 1.77 | | | 1.87 | | | | | |
| DD&A | 0.40 | | | 0.36 | | | | | |
| Metals inventory adjustments | — | | | — | | | | | |
| Noncash and other costs, net | 0.08 | | | 0.07 | | | | | |
| Total unit costs | 2.25 | | | 2.30 | | | | | |
Other revenue adjustments, primarily for pricing
on prior period open sales | 0.03 | | | 0.03 | | | | | |
| Gross profit per pound | $ | 0.49 | | | $ | 0.44 | | | | | |
| | | | | | | |
| Reconciliation to Amounts Reported | | | | | | | |
| | | | | | | Metals |
| | | | Production | | | | Inventory |
| Revenues | | and Delivery | | DD&A | | Adjustments |
| Totals presented above | $ | 3,571 | | | $ | 2,236 | | | $ | 474 | | | $ | 2 | |
| Treatment charges | (212) | | | — | | | — | | | — | |
| Royalty on metals | (7) | | | — | | | — | | | — | |
| Noncash and other costs, net | — | | | 94 | | | — | | | — | |
Other revenue adjustments, primarily for pricing
on prior period open sales | 37 | | | — | | | — | | | — | |
| Eliminations and other | (1) | | | (4) | | | — | | | — | |
| South America mining | 3,388 | | | 2,326 | | | 474 | | | 2 | |
Other miningb | 14,052 | | | 12,119 | | | 854 | | | 85 | |
| | | | | | | |
| | | | | | | |
| Corporate, other & eliminations | (3,038) | | | (2,911) | | | 84 | | | 92 | |
| As reported in our consolidated financial statements | $ | 14,402 | | | $ | 11,534 | | | $ | 1,412 | | | $ | 179 | |
a.Includes silver sales of 4.7 million ounces ($16.57 per ounce average realized price). Also reflects sales of molybdenum produced by Cerro Verde to our molybdenum sales company at market-based pricing.
b.Represents the combined total for our other mining operations as presented in Note 16.
|
| | | | | | | | | | | | | | | |
| Year Ended December 31, 2017 | | | | | | | |
| (In millions) | By-Product | | Co-Product Method |
| | Method | | Copper | | Othera | | Total |
| Revenues, excluding adjustments | $ | 3,668 |
| | $ | 3,668 |
| | $ | 267 |
| | $ | 3,935 |
|
| Site production and delivery, before net noncash | | | | | | | |
| and other costs shown below | 1,960 |
| | 1,838 |
| | 171 |
| | 2,009 |
|
| By-product credits | (218 | ) | | — |
| | — |
| | — |
|
| Treatment charges | 272 |
| | 272 |
| | — |
| | 272 |
|
| Royalty on metals | 8 |
| | 7 |
| | 1 |
| | 8 |
|
| Net cash costs | 2,022 |
| | 2,117 |
| | 172 |
| | 2,289 |
|
| DD&A | 525 |
| | 489 |
| | 36 |
| | 525 |
|
| Noncash and other costs, net | 241 |
| b | 224 |
| | 17 |
| | 241 |
|
| Total costs | 2,788 |
| | 2,830 |
| | 225 |
| | 3,055 |
|
Other revenue adjustments, primarily for pricing on prior period open sales | 41 |
| | 41 |
| | — |
| | 41 |
|
| Gross profit | $ | 921 |
| | $ | 879 |
| | $ | 42 |
| | $ | 921 |
|
| | | | | | | | |
| Copper sales (millions of recoverable pounds) | 1,235 |
| | 1,235 |
| | | | |
| | | | | | | | |
| Gross profit per pound of copper: | | | |
| | | | | | | | |
| Revenues, excluding adjustments | $ | 2.97 |
| | $ | 2.97 |
| | | | |
| Site production and delivery, before net noncash | | | | | | | |
| and other costs shown below | 1.59 |
| | 1.49 |
| | | | |
| By-product credits | (0.18 | ) | | — |
| | | | |
| Treatment charges | 0.22 |
| | 0.22 |
| | | | |
| Royalty on metals | 0.01 |
| | 0.01 |
| | | | |
| Unit net cash costs | 1.64 |
| | 1.72 |
| | | | |
| DD&A | 0.43 |
| | 0.39 |
| | | | |
| Noncash and other costs, net | 0.19 |
| b | 0.18 |
| | | | |
| Total unit costs | 2.26 |
| | 2.29 |
| | | | |
| Other revenue adjustments, primarily for pricing | | | | | | | |
| on prior period open sales | 0.03 |
| | 0.03 |
| | | | |
| Gross profit per pound | $ | 0.74 |
| | $ | 0.71 |
| | | | |
| | | | | | | | |
| Reconciliation to Amounts Reported | | | | | | | |
| (In millions) | | | | | | | |
| | | | Production | | | | |
| | Revenues | | and Delivery | | DD&A | | |
| Totals presented above | $ | 3,935 |
| | $ | 2,009 |
| | $ | 525 |
| | |
| Treatment charges | (272 | ) | | — |
| | — |
| | |
| Royalty on metals | (8 | ) | | — |
| | — |
| | |
| Noncash and other costs, net | — |
| | 241 |
| | — |
| | |
Other revenue adjustments, primarily for pricing on prior period open sales | 41 |
| | — |
| | — |
| | |
| Eliminations and other | (2 | ) | | (6 | ) | | — |
| | |
| South America mining | 3,694 |
| | 2,244 |
| | 525 |
| | |
Other miningc | 15,792 |
| | 11,140 |
| | 1,095 |
| | |
| Corporate, other & eliminations | (3,083 | ) | | (3,118 | ) | | 94 |
| | |
| As reported in FCX’s consolidated financial statements | $ | 16,403 |
| | $ | 10,266 |
| | $ | 1,714 |
| | |
| |
a. | Includes silver sales of 3.8 million ounces ($16.74 per ounce average realized price). Also reflects sales of molybdenum produced by Cerro Verde to our molybdenum sales company at market-based pricing. |
| |
b. | Includes charges totaling $203 million ($0.16 per pound of copper) at Cerro Verde associated with disputed royalties for prior years. |
| |
c. | Represents the combined total for our other mining operations as presented in Note 16. |
South America Mining Product Revenues, Production Costs and Unit Net Cash Costs
|
| | | | | | | | | | | | | | | |
| Year Ended December 31, 2016 | | | | | | | |
| (In millions) | By-Product | | Co-Product Method |
| | Method | | Copper | | Othera | | Total |
| Revenues, excluding adjustments | $ | 3,077 |
| | $ | 3,077 |
| | $ | 176 |
| | $ | 3,253 |
|
| Site production and delivery, before net noncash | | | | | | | |
| and other costs shown below | 1,681 |
| | 1,601 |
| | 120 |
| | 1,721 |
|
| By-product credits | (136 | ) | | — |
| | — |
| | — |
|
| Treatment charges | 320 |
| | 320 |
| | — |
| | 320 |
|
| Royalty on metals | 7 |
| | 6 |
| | 1 |
| | 7 |
|
| Net cash costs | 1,872 |
| | 1,927 |
| | 121 |
| | 2,048 |
|
| DD&A | 552 |
| | 523 |
| | 29 |
| | 552 |
|
| Noncash and other costs, net | 40 |
| | 38 |
| | 2 |
| | 40 |
|
| Total costs | 2,464 |
| | 2,488 |
| | 152 |
| | 2,640 |
|
Revenue adjustments, primarily for pricing on prior period open sales | 11 |
| | 11 |
| | — |
| | 11 |
|
| Gross profit | $ | 624 |
| | $ | 600 |
| | $ | 24 |
| | $ | 624 |
|
| | | | | | | | |
| Copper sales (millions of recoverable pounds) | 1,332 |
| | 1,332 |
| | | | |
| | | | | | | | |
| Gross profit per pound of copper: | | | |
| | | | | | | | |
| Revenues, excluding adjustments | $ | 2.31 |
| | $ | 2.31 |
| | | | |
| Site production and delivery, before net noncash | | | | | | | |
| and other costs shown below | 1.26 |
| | 1.20 |
| | | | |
| By-product credits | (0.10 | ) | | — |
| | | | |
| Treatment charges | 0.24 |
| | 0.24 |
| | | | |
| Royalty on metals | 0.01 |
| | — |
| | | | |
| Unit net cash costs | 1.41 |
| | 1.44 |
| | | | |
| DD&A | 0.41 |
| | 0.39 |
| | | | |
| Noncash and other costs, net | 0.03 |
| | 0.03 |
| | | | |
| Total unit costs | 1.85 |
| | 1.86 |
| | | | |
| Revenue adjustments, primarily for pricing | | | | | | | |
| on prior period open sales | 0.01 |
| | 0.01 |
| | | | |
| Gross profit per pound | $ | 0.47 |
| | $ | 0.46 |
| | | | |
| | | | | | | | |
| Reconciliation to Amounts Reported | | | | | | | |
| (In millions) | | | | | | | |
| | | | Production | | | | |
| | Revenues | | and Delivery | | DD&A | | |
| Totals presented above | $ | 3,253 |
| | $ | 1,721 |
| | $ | 552 |
| | |
| Treatment charges | (320 | ) | | — |
| | — |
| | |
| Royalty on metals | (7 | ) | | — |
| | — |
| | |
| Noncash and other costs, net | — |
| | 40 |
| | — |
| | |
Revenue adjustments, primarily for pricing on prior period open sales | 11 |
| | — |
| | — |
| | |
| Eliminations and other | 1 |
| | (3 | ) | | 1 |
| | |
| South America mining | 2,938 |
| | 1,758 |
| | 553 |
| | |
Other miningb | 13,547 |
| | 10,446 |
| | 1,021 |
| | |
| Corporate, other & eliminations | (1,655 | ) | | (1,517 | ) | | 956 |
| | |
| As reported in FCX’s consolidated financial statements | $ | 14,830 |
| | $ | 10,687 |
| | $ | 2,530 |
| | |
| |
a. | Includes silver sales of 3.7 million ounces ($18.05 per ounce average realized price). Also reflects sales of molybdenum produced by Cerro Verde to our molybdenum sales company at market-based pricing. |
| |
b. | Represents the combined total for all other mining operations as presented in Note 16. |
Indonesia Mining Product Revenues, Production Costs and Unit Net Cash (Credits) Costs
|
| | | | | | | | | | | | | | | | | | | |
| Year Ended December 31, 2018 | | | |
| (In millions) | By-Product | | Co-Product Method |
| | Method | | Copper | | Gold | | Silvera | | Total |
| Revenues, excluding adjustments | $ | 3,264 |
| | $ | 3,264 |
| | $ | 2,967 |
| | $ | 57 |
| | $ | 6,288 |
|
| Site production and delivery, before net noncash | | | | | | | | | |
| and other costs shown below | 1,678 |
| | 871 |
| | 792 |
| | 15 |
| | 1,678 |
|
| Gold and silver credits | (3,041 | ) | | — |
| | — |
| | — |
| | — |
|
| Treatment charges | 294 |
| | 153 |
| | 139 |
| | 2 |
| | 294 |
|
| Export duties | 180 |
| | 93 |
| | 85 |
| | 2 |
| | 180 |
|
| Royalty on metals | 238 |
| | 122 |
| | 114 |
| | 2 |
| | 238 |
|
| Net cash (credits) costs | (651 | ) | | 1,239 |
| | 1,130 |
| | 21 |
| | 2,390 |
|
| DD&A | 606 |
| | 314 |
| | 286 |
| | 6 |
| | 606 |
|
| Noncash and other costs, net | 242 |
| b | 126 |
| | 114 |
| | 2 |
| | 242 |
|
| Total costs | 197 |
| | 1,679 |
| | 1,530 |
| | 29 |
| | 3,238 |
|
Other revenue adjustments, primarily for pricing on prior period open sales | (34 | ) | | (34 | ) | | 17 |
| | — |
| | (17 | ) |
| PT Smelting intercompany profit | 56 |
| | 29 |
| | 27 |
| | — |
| | 56 |
|
| Gross profit | $ | 3,089 |
| | $ | 1,580 |
| | $ | 1,481 |
| | $ | 28 |
| | $ | 3,089 |
|
| | | | | | | | | | |
| Copper sales (millions of recoverable pounds) | 1,130 |
| | 1,130 |
| | | | | | |
| Gold sales (thousands of recoverable ounces) | | | | | 2,366 |
| | | | |
| | | | | | | | | | |
| Gross profit per pound of copper/per ounce of gold: | | | | | |
| | | | | | | | | | |
| Revenues, excluding adjustments | $ | 2.89 |
| | $ | 2.89 |
| | $ | 1,254 |
| | | | |
| Site production and delivery, before net noncash | | | | | | | | | |
| and other costs shown below | 1.48 |
| | 0.77 |
| | 335 |
| | | | |
| Gold and silver credits | (2.69 | ) | | — |
| | — |
| | | | |
| Treatment charges | 0.26 |
| | 0.14 |
| | 59 |
| | | | |
| Export duties | 0.16 |
| | 0.08 |
| | 36 |
| | | | |
| Royalty on metals | 0.21 |
| | 0.11 |
| | 48 |
| | | | |
| Unit net cash (credits) costs | (0.58 | ) | | 1.10 |
| | 478 |
| | | | |
| DD&A | 0.54 |
| | 0.28 |
| | 121 |
| | | | |
| Noncash and other costs, net | 0.21 |
| b | 0.11 |
| | 48 |
| | | | |
| Total unit costs | 0.17 |
| | 1.49 |
| | 647 |
| | | | |
| Other revenue adjustments, primarily for pricing | | | | | | | | | |
| on prior period open sales | (0.03 | ) | | (0.03 | ) | | 7 |
| | | | |
| PT Smelting intercompany profit | 0.04 |
| | 0.03 |
| | 12 |
| | | | |
| Gross profit per pound/ounce | $ | 2.73 |
| | $ | 1.40 |
| | $ | 626 |
| | | | |
| | | | | | | | | | |
| Reconciliation to Amounts Reported | | | | | | | | | |
| (In millions) | | | | | | | | | |
| | | | Production | | | | | | |
| | Revenues | | and Delivery | | DD&A | | | | |
| Totals presented above | $ | 6,288 |
| | $ | 1,678 |
| | $ | 606 |
| | | | |
| Treatment charges | (294 | ) | | — |
| | — |
| | | | |
| Export duties | (180 | ) | | — |
| | — |
| | | | |
| Royalty on metals | (238 | ) | | — |
| | — |
| | | | |
| Noncash and other costs, net | — |
| | 242 |
| | — |
| | | | |
Other revenue adjustments, primarily for pricing on prior period open sales | (17 | ) | | — |
| | — |
| | | | |
| PT Smelting intercompany profit | — |
| | (56 | ) | | — |
| | | | |
| Indonesia mining | 5,559 |
| | 1,864 |
| | 606 |
| | | | |
Other miningc | 16,195 |
| | 13,117 |
| | 1,023 |
| | | | |
| Corporate, other & eliminations | (3,126 | ) | | (3,290 | ) | | 125 |
| | | | |
| As reported in FCX’s consolidated financial statements | $ | 18,628 |
| | $ | 11,691 |
| | $ | 1,754 |
| | | | |
| |
a. | Includes silver sales of 3.8 million ounces ($15.24 per ounce average realized price). |
| |
b. | Includes net charges of $223 million ($0.20 per pound of copper). Refer to “Consolidated Results-Summary Financial Data” for a summary of these charges. |
| |
c. | Represents the combined total for our other mining operations as presented in Note 16. |
Indonesia Mining Product Revenues, Production Costs and Unit Net Cash Costs
| | | | | | | | | | | | | | | | | | | | | | | | | | | | | |
| Year Ended December 31, 2020 | | | |
| (In millions) | By-Product | | Co-Product Method |
| Method | | Copper | | Gold | | Silvera | | Total |
| Revenues, excluding adjustments | $ | 2,475 | | | $ | 2,475 | | | $ | 1,545 | | | $ | 81 | | | $ | 4,101 | |
Site production and delivery, before net noncash
and other costs shown below | 1,508 | | | 910 | | | 568 | | | 30 | | | 1,508 | |
| Gold and silver credits | (1,630) | | | — | | | — | | | — | | | — | |
| Treatment charges | 219 | | | 132 | | | 83 | | | 4 | | | 219 | |
| Export duties | 93 | | | 56 | | | 35 | | | 2 | | | 93 | |
| Royalty on metals | 153 | | | 90 | | | 60 | | | 3 | | | 153 | |
| Net cash costs | 343 | | | 1,188 | | | 746 | | | 39 | | | 1,973 | |
| DD&A | 580 | | | 350 | | | 219 | | | 11 | | | 580 | |
| | | | | | | | | |
| Noncash and other costs, net | 93 | | b | 56 | | | 35 | | | 2 | | | 93 | |
| Total costs | 1,016 | | | 1,594 | | | 1,000 | | | 52 | | | 2,646 | |
Other revenue adjustments, primarily for pricing
on prior period open sales | (20) | | | (20) | | | 4 | | | — | | | (16) | |
| PT Smelting intercompany loss | (11) | | | (7) | | | (4) | | | — | | | (11) | |
| Gross profit | $ | 1,428 | | | $ | 854 | | | $ | 545 | | | $ | 29 | | | $ | 1,428 | |
| | | | | | | | | |
| Copper sales (millions of recoverable pounds) | 804 | | | 804 | | | | | | | |
| Gold sales (thousands of recoverable ounces) | | | | | 842 | | | | | |
| | | | | | | | | |
| Gross profit per pound of copper/per ounce of gold: | | | | | |
| | | | | | | | | |
| Revenues, excluding adjustments | $ | 3.08 | | | $ | 3.08 | | | $ | 1,832 | | | | | |
Site production and delivery, before net noncash
and other costs shown below | 1.88 | | | 1.13 | | | 674 | | | | | |
| Gold and silver credits | (2.03) | | | — | | | — | | | | | |
| Treatment charges | 0.27 | | | 0.17 | | | 98 | | | | | |
| Export duties | 0.12 | | | 0.07 | | | 41 | | | | | |
| Royalty on metals | 0.19 | | | 0.11 | | | 72 | | | | | |
| Unit net cash costs | 0.43 | | | 1.48 | | | 885 | | | | | |
| DD&A | 0.72 | | | 0.43 | | | 259 | | | | | |
| | | | | | | | | |
| Noncash and other costs, net | 0.11 | | b | 0.07 | | | 41 | | | | | |
| Total unit costs | 1.26 | | | 1.98 | | | 1,185 | | | | | |
Other revenue adjustments, primarily for pricing
on prior period open sales | (0.03) | | | (0.03) | | | 5 | | | | | |
| PT Smelting intercompany loss | (0.01) | | | (0.01) | | | (5) | | | | | |
| Gross profit per pound/ounce | $ | 1.78 | | | $ | 1.06 | | | $ | 647 | | | | | |
| | | | | | | | | |
| Reconciliation to Amounts Reported | | | | | | | | | |
| | | | | | | | | |
| | | | Production | | | | | | |
| Revenues | | and Delivery | | DD&A | | | | |
| Totals presented above | $ | 4,101 | | | $ | 1,508 | | | $ | 580 | | | | | |
| Treatment charges | (219) | | | — | | | — | | | | | |
| Export duties | (93) | | | — | | | — | | | | | |
| Royalty on metals | (153) | | | — | | | — | | | | | |
| Noncash and other costs, net | (6) | | | 87 | | | — | | | | | |
Other revenue adjustments, primarily for pricing
on prior period open sales | (16) | | | — | | | — | | | | | |
| PT Smelting intercompany loss | — | | | 11 | | | — | | | | | |
| Indonesia mining | 3,614 | | | 1,606 | | | 580 | | | | | |
Other miningc | 14,392 | | | 12,089 | | | 878 | | | | | |
| | | | | | | | | |
| | | | | | | | | |
| Corporate, other & eliminations | (3,808) | | | (3,664) | | | 70 | | | | | |
| As reported in our consolidated financial statements | $ | 14,198 | | | $ | 10,031 | | | $ | 1,528 | | | | | |
a.Includes silver sales of 3.6 million ounces ($22.40 per ounce average realized price).
b.Includes COVID-19 related costs (including one-time incremental employee benefits and health and safety costs) of $14 million ($0.02 per pound of copper).
c.Represents the combined total for our other mining operations as presented in Note 16.
|
| | | | | | | | | | | | | | | | | | | |
| Year Ended December 31, 2017 | | | |
| (In millions) | By-Product | | Co-Product Method |
| | Method | | Copper | | Gold | | Silvera | | Total |
| Revenues, excluding adjustments | $ | 2,945 |
| | $ | 2,945 |
| | $ | 1,952 |
| | $ | 49 |
| | $ | 4,946 |
|
| Site production and delivery, before net noncash | | | | | | | | | |
| and other costs shown below | 1,544 |
| | 919 |
| | 609 |
| | 16 |
| | 1,544 |
|
| Gold and silver credits | (2,010 | ) | | — |
| | — |
| | — |
| | — |
|
| Treatment charges | 261 |
| | 156 |
| | 103 |
| | 2 |
| | 261 |
|
| Export duties | 115 |
| | 68 |
| | 46 |
| | 1 |
| | 115 |
|
| Royalty on metals | 173 |
| | 98 |
| | 73 |
| | 2 |
| | 173 |
|
| Net cash costs | 83 |
| | 1,241 |
| | 831 |
| | 21 |
| | 2,093 |
|
| DD&A | 556 |
| | 331 |
| | 220 |
| | 5 |
| | 556 |
|
| Noncash and other costs, net | 163 |
| b | 97 |
| | 64 |
| | 2 |
| | 163 |
|
| Total costs | 802 |
| | 1,669 |
| | 1,115 |
| | 28 |
| | 2,812 |
|
Other revenue adjustments, primarily for pricing on prior period open sales | 39 |
| | 39 |
| | 9 |
| | — |
| | 48 |
|
| PT Smelting intercompany loss | (28 | ) | | (17 | ) | | (11 | ) | | — |
| | (28 | ) |
| Gross profit | $ | 2,154 |
| | $ | 1,298 |
| | $ | 835 |
| | $ | 21 |
| | $ | 2,154 |
|
| | | | | | | | | | |
| Copper sales (millions of recoverable pounds) | 981 |
| | 981 |
| | | | | | |
| Gold sales (thousands of recoverable ounces) | | | | | 1,540 |
| | | | |
| | | | | | | | | | |
| Gross profit per pound of copper/per ounce of gold: | | | | | |
| | | | | | | | | | |
| Revenues, excluding adjustments | $ | 3.00 |
| | $ | 3.00 |
| | $ | 1,268 |
| | | | |
| Site production and delivery, before net noncash | | | | | | | | | |
| and other costs shown below | 1.57 |
| | 0.94 |
| | 396 |
| | | | |
| Gold and silver credits | (2.05 | ) | | — |
| | — |
| | | | |
| Treatment charges | 0.27 |
| | 0.16 |
| | 67 |
| | | | |
| Export duties | 0.12 |
| | 0.07 |
| | 30 |
| | | | |
| Royalty on metals | 0.17 |
| | 0.10 |
| | 47 |
| | | | |
| Unit net cash costs | 0.08 |
| | 1.27 |
| | 540 |
| | | | |
| DD&A | 0.57 |
| | 0.34 |
| | 142 |
| | | | |
| Noncash and other costs, net | 0.17 |
| b | 0.10 |
| | 42 |
| | | | |
| Total unit costs | 0.82 |
| | 1.71 |
| | 724 |
| | | | |
| Other revenue adjustments, primarily for pricing | | | | | | | | | |
| on prior period open sales | 0.04 |
| | 0.04 |
| | 6 |
| | | | |
| PT Smelting intercompany loss | (0.02 | ) | | (0.01 | ) | | (7 | ) | | | | |
| Gross profit per pound/ounce | $ | 2.20 |
| | $ | 1.32 |
| | $ | 543 |
| | | | |
| | | | | | | | | | |
| Reconciliation to Amounts Reported | | | | | | | | | |
| (In millions) | | | | | | | | | |
| | | | Production | | | | | | |
| | Revenues | | and Delivery | | DD&A | | | | |
| Totals presented above | $ | 4,946 |
| | $ | 1,544 |
| | $ | 556 |
| | | | |
| Treatment charges | (261 | ) | | — |
| | — |
| | | | |
| Export duties | (115 | ) | | — |
| | — |
| | | | |
| Royalty on metals | (173 | ) | | — |
| | — |
| | | | |
| Noncash and other costs, net | — |
| | 163 |
| | — |
| | | | |
Other revenue adjustments, primarily for pricing on prior period open sales | 48 |
| | — |
| | — |
| | | | |
| PT Smelting intercompany loss | — |
| | 28 |
| | — |
| | | | |
| Indonesia mining | 4,445 |
| | 1,735 |
| | 556 |
| | | | |
Other miningc | 15,041 |
| | 11,649 |
| | 1,064 |
| | | | |
| Corporate, other & eliminations | (3,083 | ) | | (3,118 | ) | | 94 |
| | | | |
| As reported in FCX’s consolidated financial statements | $ | 16,403 |
| | $ | 10,266 |
| | $ | 1,714 |
| | | | |
| |
a. | Includes silver sales of 3.0 million ounces ($16.56 per ounce average realized price). |
| |
b. | Includes $120 million ($0.12 per pound of copper) of costs charged directly to production and delivery costs as a result of workforce reductions. |
| |
c. | Represents the combined total for our other mining operations as presented in Note 16. |
Indonesia Mining Product Revenues, Production Costs and Unit Net Cash Costs
| | | | | | | | | | | | | | | | | | | | | | | | | | | | | |
| Year Ended December 31, 2019 | | | |
| (In millions) | By-Product | | Co-Product Method |
| Method | | Copper | | Gold | | Silvera | | Total |
| Revenues, excluding adjustments | $ | 1,814 | | | $ | 1,814 | | | $ | 1,378 | | | $ | 40 | | | $ | 3,232 | |
Site production and delivery, before net noncash
and other costs shown below | 1,938 | | | 1,088 | | | 826 | | | 24 | | | 1,938 | |
| Gold and silver credits | (1,419) | | | — | | | — | | | — | | | — | |
| Treatment charges | 171 | | | 96 | | | 73 | | | 2 | | | 171 | |
| Export duties | 56 | | | 31 | | | 24 | | | 1 | | | 56 | |
| Royalty on metals | 107 | | | 58 | | | 48 | | | 1 | | | 107 | |
| Net cash costs | 853 | | | 1,273 | | | 971 | | | 28 | | | 2,272 | |
| DD&A | 406 | | | 228 | | | 173 | | | 5 | | | 406 | |
| Metals inventory adjustments | 5 | | | 5 | | | — | | | — | | | 5 | |
| Noncash and other costs, net | 246 | | b | 136 | | | 107 | | | 3 | | | 246 | |
| Total costs | 1,510 | | | 1,642 | | | 1,251 | | | 36 | | | 2,929 | |
Other revenue adjustments, primarily for pricing
on prior period open sales | 18 | | | 18 | | | 1 | | | — | | | 19 | |
| PT Smelting intercompany loss | (17) | | | (10) | | | (7) | | | — | | | (17) | |
| Gross profit | $ | 305 | | | $ | 180 | | | $ | 121 | | | $ | 4 | | | $ | 305 | |
| | | | | | | | | |
| Copper sales (millions of recoverable pounds) | 667 | | | 667 | | | | | | | |
| Gold sales (thousands of recoverable ounces) | | | | | 973 | | | | | |
| | | | | | | | | |
| Gross profit per pound of copper/per ounce of gold: | | | | | |
| | | | | | | | | |
| Revenues, excluding adjustments | $ | 2.72 | | | $ | 2.72 | | | $ | 1,416 | | | | | |
Site production and delivery, before net noncash
and other costs shown below | 2.91 | | | 1.63 | | | 849 | | | | | |
| Gold and silver credits | (2.13) | | | — | | | — | | | | | |
| Treatment charges | 0.26 | | | 0.14 | | | 75 | | | | | |
| Export duties | 0.08 | | | 0.05 | | | 25 | | | | | |
| Royalty on metals | 0.16 | | | 0.09 | | | 49 | | | | | |
| Unit net cash costs | 1.28 | | | 1.91 | | | 998 | | | | | |
| DD&A | 0.61 | | | 0.34 | | | 178 | | | | | |
| Metals inventory adjustments | 0.01 | | | 0.01 | | | — | | | | | |
| Noncash and other costs, net | 0.37 | | b | 0.20 | | | 110 | | | | | |
| Total unit costs | 2.27 | | | 2.46 | | | 1,286 | | | | | |
Other revenue adjustments, primarily for pricing
on prior period open sales | 0.03 | | | 0.03 | | | 2 | | | | | |
| PT Smelting intercompany loss | (0.02) | | | (0.02) | | | (8) | | | | | |
| Gross profit per pound/ounce | $ | 0.46 | | | $ | 0.27 | | | $ | 124 | | | | | |
| | | | | | | | | |
| Reconciliation to Amounts Reported | | | | | | | | | |
| | | | | | | Metals | | |
| | | | Production | | | | Inventory | | |
| Revenues | | and Delivery | | DD&A | | Adjustments | | |
| Totals presented above | $ | 3,232 | | | $ | 1,938 | | | $ | 406 | | | $ | 5 | | | |
| Treatment charges | (171) | | | — | | | — | | | — | | | |
| Export duties | (56) | | | — | | | — | | | — | | | |
| Royalty on metals | (107) | | | — | | | — | | | — | | | |
| Noncash and other costs, net | (146) | | | 100 | | | — | | | — | | | |
Other revenue adjustments, primarily for pricing
on prior period open sales | 19 | | | — | | | — | | | — | | | |
| PT Smelting intercompany loss | — | | | 17 | | | — | | | — | | | |
| Indonesia mining | 2,771 | | | 2,055 | | | 406 | | | 5 | | | |
Other miningc | 14,669 | | | 12,390 | | | 922 | | | 82 | | | |
| | | | | | | | | |
| | | | | | | | | |
| Corporate, other & eliminations | (3,038) | | | (2,911) | | | 84 | | | 92 | | | |
| As reported in our consolidated financial statements | $ | 14,402 | | | $ | 11,534 | | | $ | 1,412 | | | $ | 179 | | | |
a.Includes silver sales of 2.5 million ounces ($16.15 per ounce average realized price).
b.Includes charges in revenues totaling $166 million ($0.25 per pound of copper), primarily associated with an unfavorable Indonesia Supreme Court ruling related to certain disputed PT-FI export duties, partly offset by adjustments to prior year treatment charges totaling $20 million ($0.03 per pound of copper). Also includes charges of $28 million ($0.04 per pound of copper) associated with adjustments to the settlement of the historical surface water tax disputes with the local regional tax authority in Papua, Indonesia.
c.Represents the combined total for our other mining operations as presented in Note 16.
|
| | | | | | | | | | | | | | | | | | | |
| Year Ended December 31, 2016 | | | |
| (In millions) | By-Product | | Co-Product Method |
| | Method | | Copper | | Gold | | Silvera | | Total |
| Revenues, excluding adjustments | $ | 2,448 |
| | $ | 2,448 |
| | $ | 1,304 |
| | $ | 50 |
| | $ | 3,802 |
|
| Site production and delivery, before net noncash | | | | | | | | | |
| and other costs shown below | 1,698 |
| | 1,094 |
| | 582 |
| | 22 |
| | 1,698 |
|
| Gold and silver credits | (1,371 | ) | | — |
| | — |
| | — |
| | — |
|
| Treatment charges | 297 |
| | 191 |
| | 102 |
| | 4 |
| | 297 |
|
| Export duties | 96 |
| | 62 |
| | 33 |
| | 1 |
| | 96 |
|
| Royalty on metals | 131 |
| | 79 |
| | 50 |
| | 2 |
| | 131 |
|
| Net cash costs | 851 |
| | 1,426 |
| | 767 |
| | 29 |
| | 2,222 |
|
| DD&A | 384 |
| | 247 |
| | 132 |
| | 5 |
| | 384 |
|
| Noncash and other costs, net | 51 |
| | 33 |
| | 17 |
| | 1 |
| | 51 |
|
| Total costs | 1,286 |
| | 1,706 |
| | 916 |
| | 35 |
| | 2,657 |
|
Other revenue adjustments, primarily for pricing on prior period open sales | — |
| | — |
| | 17 |
| | — |
| | 17 |
|
| PT Smelting intercompany loss | (26 | ) | | (17 | ) | | (9 | ) | | — |
| | (26 | ) |
| Gross profit | $ | 1,136 |
| | $ | 725 |
| | $ | 396 |
| | $ | 15 |
| | $ | 1,136 |
|
| | | | | | | | | | |
| Copper sales (millions of recoverable pounds) | 1,054 |
| | 1,054 |
| | | | | | |
| Gold sales (thousands of recoverable ounces) | | | | | 1,054 |
| | | | |
| | | | | | | | | | |
| Gross profit per pound of copper/per ounce of gold: | | | | | |
| | | | | | | | | | |
| Revenues, excluding adjustments | $ | 2.32 |
| | $ | 2.32 |
| | $ | 1,237 |
| | | | |
| Site production and delivery, before net noncash | | | | | | | | | |
| and other costs shown below | 1.61 |
| | 1.04 |
| | 553 |
| | | | |
| Gold and silver credits | (1.30 | ) | | — |
| | — |
| | | | |
| Treatment charges | 0.28 |
| | 0.18 |
| | 97 |
| | | | |
| Export duties | 0.09 |
| | 0.06 |
| | 31 |
| | | | |
| Royalty on metals | 0.13 |
| | 0.07 |
| | 47 |
| | | | |
| Unit net cash costs | 0.81 |
| | 1.35 |
| | 728 |
| | | | |
| DD&A | 0.36 |
| | 0.24 |
| | 125 |
| | | | |
| Noncash and other costs, net | 0.05 |
| | 0.03 |
| | 17 |
| | | | |
| Total unit costs | 1.22 |
| | 1.62 |
| | 870 |
| | | | |
| Other revenue adjustments, primarily for pricing | | | | | | | | | |
| on prior period open sales | — |
| | — |
| | 16 |
| | | | |
| PT Smelting intercompany loss | (0.02 | ) | | (0.02 | ) | | (8 | ) | | | | |
| Gross profit per pound/ounce | $ | 1.08 |
| | $ | 0.68 |
| | $ | 375 |
| | | | |
| | | | | | | | | | |
| Reconciliation to Amounts Reported | | | | | | | | | |
| (In millions) | | | | | | | | | |
| | | | Production | | | | | | |
| | Revenues | | and Delivery | | DD&A | | | | |
| Totals presented above | $ | 3,802 |
| | $ | 1,698 |
| | $ | 384 |
| | | | |
| Treatment charges | (297 | ) | | — |
| | — |
| | | | |
| Export duties | (96 | ) | | — |
| | — |
| | | | |
| Royalty on metals | (131 | ) | | — |
| | — |
| | | | |
| Noncash and other costs, net | — |
| | 51 |
| | — |
| | | | |
Other revenue adjustments, primarily for pricing on prior period open sales | 17 |
| | — |
| | — |
| | | | |
| PT Smelting intercompany loss | — |
| | 26 |
| | — |
| | | | |
| Indonesia mining | 3,295 |
| | 1,775 |
| | 384 |
| | | | |
Other miningb | 13,190 |
| | 10,429 |
| | 1,190 |
| | | | |
| Corporate, other & eliminations | (1,655 | ) | | (1,517 | ) | | 956 |
| | | | |
| As reported in FCX’s consolidated financial statements | $ | 14,830 |
| | $ | 10,687 |
| | $ | 2,530 |
| | | | |
| |
a. | Includes silver sales of 2.9 million ounces ($17.09 per ounce average realized price). |
| |
b. | Represents the combined total for our other mining operations as presented in Note 16. |
Molybdenum Mines Product Revenues, Production Costs and Unit Net Cash Costs
| | | | | | | | | | | | | | | | | | | | | | | | | | |
| | | | Years Ended December 31, | | | |
| (In millions) | | | 2020 | | 2019 | | | |
Revenues, excluding adjustmentsa | | | $ | 243 | | | $ | 369 | | | | |
Site production and delivery, before net noncash
and other costs shown below | | | 211 | | | 293 | | | | |
| Treatment charges and other | | | 21 | | | 25 | | | | |
| Net cash costs | | | 232 | | | 318 | | | | |
| DD&A | | | 57 | | | 62 | | | | |
| Metals inventory adjustments | | | 10 | | | 50 | | | | |
| Noncash and other costs, net | | | 19 | | b | 6 | | | | |
| Total costs | | | 318 | | | 436 | | | | |
| Gross loss | | | $ | (75) | | | $ | (67) | | | | |
| | | | | | | | |
Molybdenum sales (millions of recoverable pounds)a | | | 24 | | | 29 | | | | |
| | | | | | | | |
| Gross loss per pound of molybdenum: | | |
| | | | | | | | |
Revenues, excluding adjustmentsa | | | $ | 9.94 | | | $ | 12.51 | | | | |
Site production and delivery, before net noncash
and other costs shown below | | | 8.65 | | | 9.95 | | | | |
| Treatment charges and other | | | 0.85 | | | 0.85 | | | | |
| Unit net cash costs | | | 9.50 | | | 10.80 | | | | |
| DD&A | | | 2.34 | | | 2.11 | | | | |
| Metals inventory adjustments | | | 0.42 | | | 1.69 | | | | |
| Noncash and other costs, net | | | 0.75 | | b | 0.20 | | | | |
| Total unit costs | | | 13.01 | | | 14.80 | | | | |
| Gross loss | | | $ | (3.07) | | | $ | (2.29) | | | | |
| | | | | | | | |
| Reconciliation to Amounts Reported | | | | | | | | |
| | | | | | | Metals | |
| | | Production | | | | Inventory | |
| Year Ended December 31, 2020 | Revenues | | and Delivery | | DD&A | | Adjustments | |
| Totals presented above | $ | 243 | | | $ | 211 | | | $ | 57 | | | $ | 10 | | |
| Treatment charges and other | (21) | | | — | | | — | | | — | | |
| Noncash and other costs, net | — | | | 19 | | | — | | | — | | |
| Molybdenum mines | 222 | | | 230 | | | 57 | | | 10 | | |
Other miningc | 17,784 | | | 13,465 | | | 1,401 | | | 58 | | |
| | | | | | | | |
| | | | | | | | |
| Corporate, other & eliminations | (3,808) | | | (3,664) | | | 70 | | | 28 | | |
| As reported in our consolidated financial statements | $ | 14,198 | | | $ | 10,031 | | | $ | 1,528 | | | $ | 96 | | |
| | | | | | | | |
| Year Ended December 31, 2019 | | | | | | | | |
| Totals presented above | $ | 369 | | | $ | 293 | | | $ | 62 | | | $ | 50 | | |
| Treatment charges and other | (25) | | | — | | | — | | | — | | |
| Noncash and other costs, net | — | | | 6 | | | — | | | — | | |
| | | | | | | | |
| | | | | | | | |
| Molybdenum mines | 344 | | | 299 | | | 62 | | | 50 | | |
Other miningc | 17,096 | | | 14,146 | | | 1,266 | | | 37 | | |
| | | | | | | | |
| | | | | | | | |
| Corporate, other & eliminations | (3,038) | | | (2,911) | | | 84 | | | 92 | | |
| As reported in our consolidated financial statements | $ | 14,402 | | | $ | 11,534 | | | $ | 1,412 | | | $ | 179 | | |
| | | | | | | | |
a.Reflects sales of the Molybdenum mines’ production to the molybdenum sales company at market-based pricing. On a consolidated basis, realizations are based on the actual contract terms for sales to third parties; as a result, our consolidated average realized price per pound of molybdenum will differ from the amounts reported in this table.
b.Includes charges totaling $7 million ($0.29 per pound of molybdenum) primarily associated with contract cancellation costs related to the COVID-19 pandemic and employee separation costs associated with April 2020 revised operating plans.
c.Represents the combined total for our other mining operations as presented in Note 16. Also includes amounts associated with the molybdenum sales company, which includes sales of molybdenum produced by the Molybdenum mines and by certain of the North America and South America copper mines.
|
| | | | | | | | | | | | | | | | |
| | | | Years Ended December 31, | |
| (In millions) | | | 2018 | | 2017 | | 2016 | |
Revenues, excluding adjustmentsa | | | $ | 440 |
| | $ | 295 |
| | $ | 208 |
| |
| Site production and delivery, before net noncash | | | | | | | | |
| and other costs shown below | | | 282 |
| | 220 |
| | 193 |
| |
| Treatment charges and other | | | 30 |
| | 27 |
| | 22 |
| |
| Net cash costs | | | 312 |
| | 247 |
| | 215 |
| |
| DD&A | | | 79 |
| | 76 |
| | 68 |
| |
| Noncash and other costs, net | | | 7 |
| | 7 |
| | 19 |
| |
| Total costs | | | 398 |
| | 330 |
| | 302 |
| |
| Gross profit (loss) | | | $ | 42 |
| | $ | (35 | ) | | $ | (94 | ) | |
| | | | | | | | | |
Molybdenum sales (millions of recoverable pounds)a | | | 35 |
| | 32 |
| | 26 |
| |
| | | | | | | | | |
| Gross profit (loss) per pound of molybdenum: | | | |
| | | | | | | | | |
Revenues, excluding adjustmentsa | | | $ | 12.36 |
| | $ | 9.22 |
| | $ | 8.02 |
| |
| Site production and delivery, before net noncash | | | | | | | | |
| and other costs shown below | | | 7.92 |
| | 6.86 |
| | 7.42 |
| |
| Treatment charges and other | | | 0.85 |
| | 0.85 |
| | 0.86 |
| |
| Unit net cash costs | | | 8.77 |
| | 7.71 |
| | 8.28 |
| |
| DD&A | | | 2.21 |
| | 2.39 |
| | 2.62 |
| |
| Noncash and other costs, net | | | 0.19 |
| | 0.23 |
| | 0.73 |
| |
| Total unit costs | | | 11.17 |
| | 10.33 |
| | 11.63 |
| |
| Gross profit (loss) per pound | | | $ | 1.19 |
| | $ | (1.11 | ) | | $ | (3.61 | ) | |
| | | | | | | | | |
| Reconciliation to Amounts Reported | | | | | | | | |
| (In millions) | | | | | | | | |
| | | | Production | | | | | |
| Year Ended December 31, 2018 | Revenues | | and Delivery | | DD&A | | | |
| Totals presented above | $ | 440 |
| | $ | 282 |
| | $ | 79 |
| | | |
| Treatment charges and other | (30 | ) | | — |
| | — |
| | | |
| Noncash and other costs, net | — |
| | 7 |
| | — |
| | | |
| Molybdenum mines | 410 |
| | 289 |
| | 79 |
| | | |
Other miningb | 21,344 |
| | 14,692 |
| | 1,550 |
| | | |
| Corporate, other & eliminations | (3,126 | ) | | (3,290 | ) | | 125 |
| | | |
| As reported in FCX’s consolidated financial statements | $ | 18,628 |
| | $ | 11,691 |
| | $ | 1,754 |
| | | |
| | | | | | | | | |
| Year Ended December 31, 2017 | | | | | | | | |
| Totals presented above | $ | 295 |
| | $ | 220 |
| | $ | 76 |
| | | |
| Treatment charges and other | (27 | ) | | — |
| | — |
| | | |
| Noncash and other costs, net | — |
| | 7 |
| | — |
| | | |
| Molybdenum mines | 268 |
| | 227 |
| | 76 |
| | | |
Other miningb | 19,218 |
| | 13,157 |
| | 1,544 |
| | | |
| Corporate, other & eliminations | (3,083 | ) | | (3,118 | ) | | 94 |
| | | |
| As reported in FCX’s consolidated financial statements | $ | 16,403 |
| | $ | 10,266 |
| | $ | 1,714 |
| | | |
| | | | | | | | | |
| Year Ended December 31, 2016 | | | | | | | | |
| Totals presented above | $ | 208 |
| | $ | 193 |
| | $ | 68 |
| | | |
| Treatment charges and other | (22 | ) | | — |
| | — |
| | | |
| Noncash and other costs, net | — |
| | 19 |
| | — |
| | | |
| Molybdenum mines | 186 |
| | 212 |
| | 68 |
| | | |
Other miningb | 16,299 |
| | 11,992 |
| | 1,506 |
| | | |
| Corporate, other & eliminations | (1,655 | ) | | (1,517 | ) | | 956 |
| | | |
| As reported in FCX’s consolidated financial statements | $ | 14,830 |
| | $ | 10,687 |
| | $ | 2,530 |
| | | |
| | | | | | | | | |
| |
a. | Reflects sales of the Molybdenum mines’ production to the molybdenum sales company at market-based pricing. On a consolidated basis, realizations are based on the actual contract terms for sales to third parties; as a result, our consolidated average realized price per pound of molybdenum will differ from the amounts reported in this table. |
| |
b. | Represents the combined total for our other mining operations as presented in Note 16. Also includes amounts associated with the molybdenum sales company, which includes sales of molybdenum produced by the Molybdenum mines and by certain of the North America and South America copper mines. |
GUARANTOR SUMMARIZED FINANCIAL INFORMATION
All of the senior notes issued by Freeport-McMoRan Inc. (FCX) are fully and unconditionally guaranteed on a senior basis jointly and severally by Freeport-McMoRan Oil & Gas LLC (FM O&G LLC), as guarantor, which is a 100-percent-owned subsidiary of FCX Oil & Gas LLC (FM O&G) and FCX. The guarantee is an unsecured obligation of the guarantor and ranks equal in right of payment with all existing and future indebtedness of FM O&G LLC, including indebtedness under our revolving credit facility. The guarantee ranks senior in right of payment with all of FM O&G LLC’s future subordinated obligations and is effectively subordinated in right of payment to any debt of FM O&G LLC’s subsidiaries. The indentures provide that FM O&G LLC’s guarantee obligations may be released or terminated upon: (i) the sale of all or substantially all of the equity interests or assets of FM O&G LLC to a third party that is not our subsidiary or our affiliate; (ii) FM O&G LLC no longer having any obligations under any FM O&G senior notes or any refinancing thereof and no longer being a co-borrower or guarantor of any of our obligations under the revolving credit facility or any other senior debt or, in each case, any refinancing thereof; or (iii) the discharge of our obligations under the indentures in accordance with their terms.
The following summarized financial data includes information regarding FCX, as issuer, FM O&G LLC, as guarantor, and all our other non-guarantor subsidiaries at December 31, 2020, and 2019, and for the year ended December 31, 2020.
| | | | | | | | | | | | | | | | | | | | | | | | | | | | | | | | |
| | FCX | | FM O&G LLC | | Non-guarantor | | | | Consolidated |
| | Issuer | | Guarantor | | Subsidiaries | | Eliminations | | FCX |
| December 31, 2020 | | | | | | | | | | |
| Current assets | | $ | 65 | | | $ | 697 | | | $ | 9,287 | | | $ | (746) | | | $ | 9,303 | |
| Noncurrent assets | | 785 | | | 6 | | | 32,806 | | | (756) | | | 32,841 | |
| Current liabilities | | 187 | | | 31 | | | 3,964 | | | (765) | | | 3,417 | |
| Noncurrent liabilities | | 9,433 | | | 11,208 | | | 15,075 | | | (15,657) | | | 20,059 | |
| | | | | | | | | | |
| December 31, 2019 | | | | | | | | | | |
| Current assets | | $ | 154 | | | $ | 657 | | | $ | 7,778 | | | $ | (674) | | | $ | 7,915 | |
| Noncurrent assets | | 1,620 | | | 22 | | | 32,692 | | | (1,440) | | | 32,894 | |
| Current liabilities | | 323 | | | 42 | | | 3,550 | | | (706) | | | 3,209 | |
| Noncurrent liabilities | | 9,180 | | | 10,892 | | | 15,975 | | | (15,895) | | | 20,152 | |
| | | | | | | | | | |
| Year Ended December 31, 2020 | | | | | | | | | | |
| Revenues | | $ | — | | | $ | 26 | | | $ | 14,172 | | | $ | — | | | $ | 14,198 | |
| Operating (loss) income | | (30) | | | (10) | | | 2,489 | | | (12) | | | 2,437 | |
| Net income (loss) | | 599 | | a | (302) | | a | 865 | | | (297) | | | 865 | |
a.Net income (loss) equals net income (loss) attributable to common stockholders because net income attributable to noncontrolling interests is zero for issuer and guarantor.
CAUTIONARY STATEMENT
Our discussion and analysis contains forward-looking statements in which we discuss our potential future performance. Forward-looking statements are all statements other than statements of historical facts, such as plans, projections, or expectations relating to ore grades and milling rates,rates; business outlook; production and sales volumes,volumes; unit net cash costs,costs; cash flows; capital expenditures; liquidity; operating cash flows, capital expenditures,costs; operating plans; our financial policy; our expectations regarding our sharePT-FI’s ramp-up of PT-FI’sunderground mining activities and future cash flows through 2022, PT-FI’s2022; PT-FI's development, financing, construction and completion of a new smelter in Indonesia PT-FI’s compliance with environmental standardsand possible expansion of the smelter at PT Smelting; our commitments to deliver responsibly produced copper, including plans to implement and validate all of our operating sites under the new framework established by the MOEF,specific frameworks; improvements in operating procedures and technology; exploration efforts and results,results; development and production activities, rates and costs, liquidity,costs; tax rates,rates; export duties,quotas and duties; the impact of copper, gold and molybdenum price changes,changes; the impact of deferred intercompany profits on earnings,earnings; mineralization and reserve estimates,estimates; execution of the settlement agreements associated with the Louisiana coastal erosion cases and talc-related litigation; descriptions of our objectives, strategies, plans, goals or targets, including our net debt target, anticipated improvements in energy efficiency at certain operating sites, and environmental, social and governance (ESG) targets; and future dividend payments, share purchases and sales.sales, including under the Board’s financial policy. The words “anticipates,” “may,” “can,” “plans,” “believes,” “estimates,” “expects,” “projects,” “targets,”"targets," “intends,” “likely,” “will,” “should,” “could,” “to be,” “potential””potential," “assumptions,” “guidance,” “future” and any similar expressions are intended to identify those assertions as forward-looking statements. The declaration and payment of future dividends is at the discretion of the Board and will depend on our financial results, cash requirements, future prospects, global economic conditions, and other factors deemed relevant by the Board. In accordance with the June 2020 amendment to the revolving credit facility, we are currently restricted from declaring or paying common stock dividends through December 31, 2021. Prior to the Board’s declaration of the initial quarterly dividend, we will deliver a covenant reversion notice, which would eliminate the restriction on the declaration or payment of common stock dividends.
We caution readers that forward-looking statements are not guarantees of future performance and actual results may differ materially from those anticipated, expected, projected or assumed in the forward-looking statements. Important factors that can cause our actual results to differ materially from those anticipated in the forward-looking statements include, but are not limited to, changes in our credit rating; changes in our cash requirements, financial position, financing plans or investment plans; changes in general market, economic, tax, regulatory or industry conditions; the duration and scope of and uncertainties associated with the COVID-19 pandemic, and the impact thereof on commodity prices, our business and the global economy and any related actions taken by governments and businesses; our ability to contain and mitigate the risk of spread or major outbreak of COVID-19 at our operating sites, including at PT-FI’s remote operating site in Papua; supply of and demand for, and prices of, copper, gold and molybdenum; mine sequencing; changes in mine plans or operational modifications, delays, deferrals or cancellations; production rates; timing of shipments; results of feasibility studies; potential inventory adjustments; potential impairment of long-lived mining assets; the potential effects of violence in Indonesia generally and in the province of Papua; the Indonesian government’sIndonesia government's extension of PT-FI’sPT-FI's export license after February 16, 2019;March 15, 2021; risks associated with underground mining; satisfaction of requirements in accordance with PT-FI’s IUPKPT-FI's special mining license to extend mining rights from 2031 through 2041; the Indonesia government's approval of a deferred schedule for completion of the new smelter in Indonesia; expected results from improvements in operating procedures and technology, including innovation initiatives; industry risks; regulatory changes; political and social risks; labor relations;relations, including labor-related work stoppages; weather- and climate-related risks; environmental risks; litigation results;our plans and ability to implement ESG practices; litigation; cybersecurity incidents; changes in general market, economic and industry conditions; financial condition of our customers, suppliers, vendors, partners and affiliates, particularly during weak economic conditions and extended periods of volatile commodity prices; reductions in liquidity and access to capital; our ability to comply with our responsible production commitments under specific frameworks and any changes to such frameworks; and other factors described in more detail in Part I, Item 1A. “Risk Factors” of our annual report on Form 10-K for the year ended December 31, 2018.2020.
Investors are cautioned that many of the assumptions upon which our forward-looking statements are based are likely to change after the forward-looking statements are made, including for example commodity prices, which we cannot control, and production volumes and costs, some aspects of which we may not be able to control. Further, we may make changes to our business plans that could affect our results. We caution investors that we do not intend to update forward-looking statements more frequently than quarterly notwithstanding any changes in our assumptions, changes in business plans, actual experience or other changes, and we undertake no obligation to update any forward-looking statements.
This annual report on Form 10-K for the year ended December 31, 2020, also contains the financial measure unit net cash costs per pound of copper and molybdenum, which is not recognized under U.S. GAAP. Refer to “Operations – Unit Net Cash Costs” for further discussion of unit net cash costs associated with our operating divisions, and to “Product Revenues and Production Costs” for reconciliations of per pound costs by operating division to production and delivery costs applicable to sales reported in our consolidated financial statements.
Item 8. Financial Statements and Supplementary Data.
MANAGEMENT’S REPORT ON INTERNAL CONTROL OVER FINANCIAL REPORTING
Freeport-McMoRan Inc.’s (the Company’s) management is responsible for establishing and maintaining adequate internal control over financial reporting. Internal control over financial reporting is defined in Rule 13a-15(f) or 15d-15(f) under the Securities Exchange Act of 1934 as a process designed by, or under the supervision of, the Company’s principal executive and principal financial officers and effected by the Company’s Board of Directors, management and other personnel, to provide reasonable assurance regarding the reliability of financial reporting and the preparation of financial statements for external purposes in accordance with generally accepted accounting principles and includes those policies and procedures that:
•Pertain to the maintenance of records that in reasonable detail accurately and fairly reflect the transactions and dispositions of the Company’s assets;
•Provide reasonable assurance that transactions are recorded as necessary to permit preparation of financial statements in accordance with generally accepted accounting principles, and that receipts and expenditures of the Company are being made only in accordance with authorizations of management and directors of the Company; and
•Provide reasonable assurance regarding prevention or timely detection of unauthorized acquisition, use or disposition of the Company’s assets that could have a material effect on the financial statements.
Because of its inherent limitations, internal control over financial reporting may not prevent or detect misstatements. Projections of any evaluation of effectiveness to future periods are subject to the risk that controls may become inadequate because of changes in conditions, or that the degree of compliance with the policies or procedures may deteriorate.
Our management, including our principal executive officer and principal financial officer, assessed the effectiveness of our internal control over financial reporting as of the end of the fiscal year covered by this annual report on Form 10-K. In making this assessment, our management used the criteria set forth in Internal Control-Integrated Framework issued by the Committee of Sponsoring Organizations of the Treadway Commission (2013 framework) (the COSO criteria). Based on its assessment, management concluded that, as of December 31, 2018,2020, our Company’s internal control over financial reporting is effective based on the COSO criteria.
Ernst & Young LLP, an independent registered public accounting firm, who audited the Company’s consolidated financial statements included in this Form 10-K, has issued an attestation report on the Company’s internal control over financial reporting, which is included herein.
|
| | | | | | | |
| /s/ Richard C. Adkerson | | /s/ Kathleen L. Quirk |
| Richard C. Adkerson | | Kathleen L. Quirk |
Vice Chairman of the Board and | | Executive Vice President and |
| President and Chief Financial Officer |
| Chief Executive Officer | | Chief Financial Officer |
REPORT OF INDEPENDENT REGISTERED PUBLIC ACCOUNTING FIRM
TO THE BOARD OF DIRECTORS AND STOCKHOLDERS OFTo the Board of Directors and Stockholders of
FREEPORT-McMoRan INC.
Freeport-McMoRan Inc.
Opinion on Internal Control over Financial Reporting
We have audited Freeport-McMoRan Inc.’s internal control over financial reporting as of December 31, 2018,2020, based on criteria established in Internal Control-Integrated Framework issued by the Committee of Sponsoring Organizations of the Treadway Commission (2013 framework) (the COSO criteria). In our opinion, Freeport-McMoRan Inc. (the Company) maintained, in all material respects, effective internal control over financial reporting as of December 31, 2018,2020, based on the COSO criteria.
We also have audited, in accordance with the standards of the Public Company Accounting Oversight Board (United States) (PCAOB), the consolidated balance sheets of Freeport-McMoRan Inc. as of December 31, 20182020 and 2017, and2019, the related consolidated statements of operations, comprehensive income (loss), equity and cash flows for each of the three years in the period ended December 31, 2018,2020, and the related notes of the Company and our report dated February 15, 201916, 2021 expressed an unqualified opinion thereon.
Basis for Opinion
The Company’s management is responsible for maintaining effective internal control over financial reporting and for its assessment of the effectiveness of internal control over financial reporting included in the accompanying Management’s Report on Internal Control Over Financial Reporting. Our responsibility is to express an opinion on the Company’s internal control over financial reporting based on our audit. We are a public accounting firm registered with the PCAOB and are required to be independent with respect to the Company in accordance with the U.S. federal securities laws and the applicable rules and regulations of the Securities and Exchange Commission and the PCAOB.
We conducted our audit in accordance with the standards of the PCAOB. Those standards require that we plan and perform the audit to obtain reasonable assurance about whether effective internal control over financial reporting was maintained in all material respects.
Our audit included obtaining an understanding of internal control over financial reporting, assessing the risk that a material weakness exists, testing and evaluating the design and operating effectiveness of internal control based on the assessed risk, and performing such other procedures as we considered necessary in the circumstances. We believe that our audit provides a reasonable basis for our opinion.
Definition and Limitations of Internal Control Over Financial Reporting
A company’s internal control over financial reporting is a process designed to provide reasonable assurance regarding the reliability of financial reporting and the preparation of financial statements for external purposes in accordance with generally accepted accounting principles. A company’s internal control over financial reporting includes those policies and procedures that (1) pertain to the maintenance of records that, in reasonable detail, accurately and fairly reflect the transactions and dispositions of the assets of the company; (2) provide reasonable assurance that transactions are recorded as necessary to permit preparation of financial statements in accordance with generally accepted accounting principles, and that receipts and expenditures of the company are being made only in accordance with authorizations of management and directors of the company; and (3) provide reasonable assurance regarding prevention or timely detection of unauthorized acquisition, use, or disposition of the company’s assets that could have a material effect on the financial statements.
Because of its inherent limitations, internal control over financial reporting may not prevent or detect misstatements. Also, projections of any evaluation of effectiveness to future periods are subject to the risk that controls may become inadequate because of changes in conditions, or that the degree of compliance with the policies or procedures may deteriorate.
/s/ Ernst & Young LLP
Phoenix, Arizona
February 15, 201916, 2021
REPORT OF INDEPENDENT REGISTERED PUBLIC ACCOUNTING FIRM
TO THE BOARD OF DIRECTORS AND STOCKHOLDERS OFTo the Board of Directors and Stockholders of
FREEPORT-McMoRan INC.Freeport-McMoRan Inc.
Opinion on the Financial Statements
We have audited the accompanying consolidated balance sheets of Freeport-McMoRan Inc. (the Company) as of December 31, 20182020 and 2017, and2019, the related consolidated statements of operations, comprehensive income (loss), equity and cash flows for each of the three years in the period ended December 31, 2018,2020, and the related notes (collectively referred to as the “financial“consolidated financial statements”). In our opinion, the consolidated financial statements present fairly, in all material respects, the consolidated financial position of the Company at December 31, 20182020 and 2017,2019, and the consolidated results of its operations and its cash flows for each of the three years in the period ended December 31, 2018,2020, in conformity with U.S. generally accepted accounting principles.
We also have audited, in accordance with the standards of the Public Company Accounting Oversight Board (United States) (PCAOB), the Company’s internal control over financial reporting as of December 31, 2018,2020, based on criteria established in Internal Control-Integrated Framework issued by the Committee of Sponsoring Organizations of the Treadway Commission (2013 framework) and our report dated February 15, 201916, 2021 expressed an unqualified opinion thereon.
Basis for Opinion
These financial statements are the responsibility of the Company’sCompany's management. Our responsibility is to express an opinion on the Company’s financial statements based on our audits. We are a public accounting firm registered with the PCAOB and are required to be independent with respect to the Company in accordance with the U.S. federal securities laws and the applicable rules and regulations of the Securities and Exchange Commission and the PCAOB.
We conducted our audits in accordance with the standards of the PCAOB. Those standards require that we plan and perform the audit to obtain reasonable assurance about whether the financial statements are free of material misstatement, whether due to error or fraud. Our audits included performing procedures to assess the risks of material misstatement of the financial statements, whether due to error or fraud, and performing procedures that respond to those risks. Such procedures included examining, on a test basis, evidence regarding the amounts and disclosures in the financial statements. Our audits also included evaluating the accounting principles used and significant estimates made by management, as well as evaluating the overall presentation of the financial statements. We believe that our audits provide a reasonable basis for our opinion.
Critical Audit Matters
The critical audit matters communicated below are matters arising from the current period audit of the consolidated financial statements that were communicated or required to be communicated to the audit committee and that: (1) relate to accounts or disclosures that are material to the consolidated financial statements and (2) involved our especially challenging, subjective, or complex judgments. The communication of critical audit matters does not alter in any way our opinion on the consolidated financial statements, taken as a whole, and we are not, by communicating the critical audit matters below, providing separate opinions on the critical audit matters or on the accounts or disclosures to which they relate.
| | | | | | | | | | |
| Uncertain tax positions | | | |
| Description of the Matter | As discussed in Note 12 to the consolidated financial statements, the Company’s operations are in certain taxing jurisdictions where uncertainties arise in the application of complex income tax regulations. The Company has disclosed uncertain tax positions related to income tax assessments in Indonesia and Peru totaling $1.7 billion, including penalties and interest, which have not been recorded at December 31, 2020. The Company recognizes a liability for income tax assessments when it is more likely than not that it will not sustain the benefit taken or expected to be taken in the tax return. | | | |
| | | | |
| | | | | | | | |
| Because of the complexity of tax laws, regulations and contractual agreements with the applicable government, auditing the recognition and measurement of uncertain tax positions requires a high degree of auditor judgment and increased extent of effort, including the involvement of our tax professionals. | |
| | |
| | | | | | | | |
| How We Addressed the Matter in Our Audit | We obtained an understanding, evaluated the design and tested the operating effectiveness of controls over the Company’s accounting process for uncertain tax positions. This included testing controls over management’s review of the technical merits of tax positions and disputed tax assessments, including the process to measure the financial statement impact of these tax matters. | |
| | |
| Our audit procedures included, among others, evaluating the Company’s accounting for these tax positions by using our knowledge of and experience with the application of respective tax laws by the relevant tax authorities, or our understanding of the contractual arrangements with the applicable government, if the position is governed by a contract. We analyzed the Company’s assumptions and data used to determine the tax assessments and tested the accuracy of the calculations. We involved our tax professionals located in the respective jurisdictions to assess the technical merits of the Company’s tax positions and to evaluate the application of relevant tax laws in the Company’s recognition determination. We assessed the Company’s correspondence with the relevant tax authorities and evaluated third-party tax or legal opinions obtained by the Company. We also evaluated the adequacy of the Company’s disclosures included in Note 12 in relation to these tax matters. | |
| | |
| Environmental obligations | |
| Description of the Matter | As discussed in Note 12 to the consolidated financial statements, the Company is subject to national, state and local environmental laws and regulations governing the protection of the environment, including restoration and reclamation of environmental contamination. Liabilities for environmental contingencies are recorded when it is probable that a liability has been incurred and the amount can be reasonably estimated. At December 31, 2020, the Company’s consolidated environmental obligations totaled $1.6 billion. | |
| | |
| Auditing management’s accounting for environmental obligations was challenging, as significant judgment is required by the Company to evaluate whether an environmental loss has been incurred and to estimate the future costs to remediate the environmental matters. The significant judgment was primarily due to the inherent estimation uncertainty relating to the amount of future costs. Such uncertainties involve assumptions regarding the nature and extent of contamination at each site, the nature and extent of required cleanup efforts under existing environmental regulations, the duration and effectiveness of the chosen remedial strategy, and allocation of costs among other potentially responsible parties. Actual costs incurred in future periods could differ from amounts estimated. | |
| | |
| | | | | | | | |
| | |
| How We Addressed the Matter in Our Audit | We obtained an understanding, evaluated the design and tested the operating effectiveness of controls over the Company’s identification and measurement of the environmental loss contingencies. For example, we tested controls over management’s review of the environmental loss contingency calculations and management’s assessment to evaluate key judgments and estimates affecting the environmental loss contingencies. | |
| | |
| To test the Company’s identification and measurement of the environmental loss contingencies, among other procedures, we inspected correspondence with regulatory agencies, obtained external legal counsel confirmation letters, and inspected environmental studies. Additionally, we assessed the appropriateness of the Company’s models and tested the significant assumptions discussed above along with the underlying data used by the Company in its analyses. We utilized our environmental specialists to search for new or contrary evidence related to the Company’s sites and to assist in evaluating the reasonableness of estimated future costs by comparing the estimated future costs to environmental permits, third party observable data such as vendor quotes, and to historical costs incurred for similar activities. | |
| | |
/s/ Ernst & Young LLP
We have served as the Company’s auditor since 2002.
Phoenix, Arizona
February 15, 201916, 2021
FREEPORT-McMoRan INC.Freeport-McMoRan Inc.
CONSOLIDATED STATEMENTS OF OPERATIONS
| | | | | | | | | | | | | | | | | |
| | Years Ended December 31, |
| | 2020 | | 2019 | | 2018 |
| | (In millions, except per share amounts) |
| Revenues | $ | 14,198 | | | $ | 14,402 | | | $ | 18,628 | |
| Cost of sales: | | | | | |
| Production and delivery | 10,031 | | | 11,534 | | | 11,708 | |
| Depreciation, depletion and amortization | 1,528 | | | 1,412 | | | 1,754 | |
| | | | | |
| Metals inventory adjustments | 96 | | | 179 | | | 4 | |
| Total cost of sales | 11,655 | | | 13,125 | | | 13,466 | |
| Selling, general and administrative expenses | 370 | | | 394 | | | 422 | |
| Mining exploration and research expenses | 50 | | | 104 | | | 105 | |
| Environmental obligations and shutdown costs | 159 | | | 105 | | | 89 | |
| | | | | |
| Net gain on sales of assets | (473) | | | (417) | | | (208) | |
| | | | | |
| Total costs and expenses | 11,761 | | | 13,311 | | | 13,874 | |
| Operating income | 2,437 | | | 1,091 | | | 4,754 | |
| Interest expense, net | (598) | | | (620) | | | (945) | |
| Net (loss) gain on early extinguishment of debt | (101) | | | (27) | | | 7 | |
| | | | | |
| Other income (expense), net | 59 | | | (138) | | | 76 | |
| Income from continuing operations before income taxes and equity in affiliated companies’ net earnings | 1,797 | | | 306 | | | 3,892 | |
| Provision for income taxes | (944) | | | (510) | | | (991) | |
| Equity in affiliated companies’ net earnings | 12 | | | 12 | | | 8 | |
| Net income (loss) from continuing operations | 865 | | | (192) | | | 2,909 | |
| Net gain (loss) from discontinued operations | 0 | | | 3 | | | (15) | |
| Net income (loss) | 865 | | | (189) | | | 2,894 | |
| Net income attributable to noncontrolling interests | (266) | | | (50) | | | (292) | |
| | | | | |
| | | | | |
| Net income (loss) attributable to common stockholders | $ | 599 | | | $ | (239) | | | $ | 2,602 | |
| | | | | |
| Basic net income (loss) per share attributable to common stockholders: | | | | | |
| Continuing operations | $ | 0.41 | | | $ | (0.17) | | | $ | 1.80 | |
| Discontinued operations | 0 | | | 0 | | | (0.01) | |
| $ | 0.41 | | | $ | (0.17) | | | $ | 1.79 | |
| | | | | |
| Diluted net income (loss) per share attributable to common stockholders: | | | | | |
| Continuing operations | $ | 0.41 | | | $ | (0.17) | | | $ | 1.79 | |
| Discontinued operations | 0 | | | 0 | | | (0.01) | |
| $ | 0.41 | | | $ | (0.17) | | | $ | 1.78 | |
| | | | | |
| Weighted-average common shares outstanding: | | | | | |
| Basic | 1,453 | | | 1,451 | | | 1,449 | |
| Diluted | 1,461 | | | 1,451 | | | 1,458 | |
| | | | | |
| Dividends declared per share of common stock | $ | 0 | | | $ | 0.20 | | | $ | 0.20 | |
|
| | | | | | | | | | | |
| | Years Ended December 31, |
| | 2018 | | 2017 | | 2016 |
| | (In millions, except per share amounts) |
| Revenues | $ | 18,628 |
| | $ | 16,403 |
| | $ | 14,830 |
|
| Cost of sales: | | | | | |
| Production and delivery | 11,691 |
| | 10,266 |
| | 10,687 |
|
| Depreciation, depletion and amortization | 1,754 |
| | 1,714 |
| | 2,530 |
|
| Impairment of oil and gas properties | — |
| | — |
| | 4,317 |
|
| Total cost of sales | 13,445 |
| | 11,980 |
| | 17,534 |
|
| Selling, general and administrative expenses | 443 |
| | 477 |
| | 597 |
|
| Mining exploration and research expenses | 105 |
| | 93 |
| | 63 |
|
| Environmental obligations and shutdown costs | 89 |
| | 244 |
| | 14 |
|
| Net gain on sales of assets | (208 | ) | | (81 | ) | | (649 | ) |
| Total costs and expenses | 13,874 |
| | 12,713 |
| | 17,559 |
|
| Operating income (loss) | 4,754 |
| | 3,690 |
| | (2,729 | ) |
| Interest expense, net | (945 | ) | | (801 | ) | | (755 | ) |
| Net gain on early extinguishment and exchanges of debt | 7 |
| | 21 |
| | 26 |
|
| Other income (expense), net | 76 |
| | (8 | ) | | (14 | ) |
| Income (loss) from continuing operations before income taxes and equity in affiliated companies’ net earnings | 3,892 |
| | 2,902 |
| | (3,472 | ) |
| Provision for income taxes | (991 | ) | | (883 | ) | | (371 | ) |
| Equity in affiliated companies’ net earnings | 8 |
| | 10 |
| | 11 |
|
| Net income (loss) from continuing operations | 2,909 |
| | 2,029 |
| | (3,832 | ) |
| Net (loss) income from discontinued operations | (15 | ) | | 66 |
| | (193 | ) |
| Net income (loss) | 2,894 |
| | 2,095 |
| | (4,025 | ) |
| Net income attributable to noncontrolling interests: | | | | | |
| Continuing operations | (292 | ) | | (274 | ) | | (227 | ) |
| Discontinued operations | — |
| | (4 | ) | | (63 | ) |
| Gain on redemption and preferred dividends attributable to redeemable noncontrolling interest | — |
| | — |
| | 161 |
|
| Net income (loss) attributable to common stockholders | $ | 2,602 |
| | $ | 1,817 |
| | $ | (4,154 | ) |
| | | | | | |
| Basic net income (loss) per share attributable to common stockholders: | | | | | |
| Continuing operations | $ | 1.80 |
| | $ | 1.21 |
| | $ | (2.96 | ) |
| Discontinued operations | (0.01 | ) | | 0.04 |
| | (0.20 | ) |
| | $ | 1.79 |
| | $ | 1.25 |
| | $ | (3.16 | ) |
| | | | | | |
| Diluted net income (loss) per share attributable to common stockholders: | | | | | |
| Continuing operations | $ | 1.79 |
| | $ | 1.21 |
| | $ | (2.96 | ) |
| Discontinued operations | (0.01 | ) | | 0.04 |
| | (0.20 | ) |
| | $ | 1.78 |
| | $ | 1.25 |
| | $ | (3.16 | ) |
| | | | | | |
| Weighted-average common shares outstanding: | | | | | |
| Basic | 1,449 |
| | 1,447 |
| | 1,318 |
|
| Diluted | 1,458 |
| | 1,454 |
| | 1,318 |
|
| | | | | | |
| Dividends declared per share of common stock | $ | 0.20 |
| | $ | — |
| | $ | — |
|
The accompanying Notes to Consolidated Financial Statements are an integral part of these consolidated financial statements.
FREEPORT-McMoRan INC.
Freeport-McMoRan Inc.
CONSOLIDATED STATEMENTS OF COMPREHENSIVE INCOME (LOSS)
| | | | | | | | | | | | | | | | | |
| Years Ended December 31, |
| 2020 | | 2019 | | 2018 |
| (In millions) |
| | | | | |
| Net income (loss) | $ | 865 | | | $ | (189) | | | $ | 2,894 | |
| | | | | |
| Other comprehensive income (loss), net of taxes: | | | | | |
| | | | | |
| Defined benefit plans: | | | | | |
| Actuarial gains (losses) arising during the period, net of taxes | 46 | | | (116) | | | (77) | |
| Prior service costs arising during the period | 0 | | | 0 | | | (4) | |
| Amortization or curtailment of unrecognized amounts included in net periodic benefit costs | 45 | | | 47 | | | 48 | |
| Foreign exchange (losses) gains | (1) | | | 1 | | | (1) | |
| | | | | |
| | | | | |
| Other comprehensive income (loss) | 90 | | | (68) | | | (34) | |
| | | | | |
| Total comprehensive income (loss) | 955 | | | (257) | | | 2,860 | |
| Total comprehensive income attributable to noncontrolling interests | (263) | | | (53) | | | (291) | |
| | | | | |
| | | | | |
| Total comprehensive income (loss) attributable to common stockholders | $ | 692 | | | $ | (310) | | | $ | 2,569 | |
|
| | | | | | | | | | | |
| | Years Ended December 31, |
| | 2018 | | 2017 | | 2016 |
| | (In millions) |
| | | | | | |
| Net income (loss) | $ | 2,894 |
| | $ | 2,095 |
| | $ | (4,025 | ) |
| | | | | | |
| Other comprehensive income (loss), net of taxes: | | | | | |
| Unrealized gains on securities | — |
| | 1 |
| | 2 |
|
| Defined benefit plans: | | | | | |
| Actuarial (losses) gains arising during the period, net of taxes | (77 | ) | | 14 |
| | (88 | ) |
| Prior service costs arising during the period | (4 | ) | | — |
| | — |
|
| Amortization or curtailment of unrecognized amounts included in net periodic benefit costs | 48 |
| | 54 |
| | 44 |
|
| Foreign exchange losses | (1 | ) | | — |
| | (1 | ) |
| Other comprehensive (loss) income | (34 | ) | | 69 |
| | (43 | ) |
| | | | | | |
| Total comprehensive income (loss) | 2,860 |
| | 2,164 |
| | (4,068 | ) |
| Total comprehensive income attributable to noncontrolling interests | (291 | ) | | (286 | ) | | (292 | ) |
| Gain on redemption and preferred dividends attributable to | | | | | |
redeemable noncontrolling interest
| — |
| | — |
| | 161 |
|
| Total comprehensive income (loss) attributable to common stockholders | $ | 2,569 |
| | $ | 1,878 |
| | $ | (4,199 | ) |
The accompanying Notes to Consolidated Financial Statements are an integral part of these consolidated financial statements.
FREEPORT-McMoRan INC.
Freeport-McMoRan Inc.
CONSOLIDATED STATEMENTS OF CASH FLOWS
| | | | | Years Ended December 31, | | | Years Ended December 31, |
| | | 2018 | | 2017 | | 2016 | | | 2020 | | 2019 | | 2018 |
| | | (In millions) | | | (In millions) |
| Cash flow from operating activities: | | | | | | | Cash flow from operating activities: | | | | | | |
| Net income (loss) | | $ | 2,894 |
| | $ | 2,095 |
| | $ | (4,025 | ) | Net income (loss) | | $ | 865 | | | $ | (189) | | | $ | 2,894 | |
| Adjustments to reconcile net income (loss) to net cash provided by operating activities: | | | | | | | Adjustments to reconcile net income (loss) to net cash provided by operating activities: | | | | | | |
| Depreciation, depletion and amortization | | 1,754 |
| | 1,714 |
| | 2,610 |
| Depreciation, depletion and amortization | | 1,528 | | | 1,412 | | | 1,754 | |
| U.S. tax reform benefit | | (123 | ) | | (393 | ) | | — |
| |
| Net charges for Cerro Verde royalty dispute | | 371 |
| | 355 |
| | — |
| |
| Payments for Cerro Verde royalty dispute | | (56 | ) | | (53 | ) | | (30 | ) | |
| Impairment of oil and gas properties | | — |
| | — |
| | 4,317 |
| |
| Oil and gas noncash drillship settlement costs and other adjustments | | — |
| | (33 | ) | | 803 |
| |
| Metals inventory adjustments | | Metals inventory adjustments | | 96 | | | 179 | | | 4 | |
| Net gain on sales of assets | | (208 | ) | | (81 | ) | | (649 | ) | Net gain on sales of assets | | (473) | | | (417) | | | (208) | |
| Stock-based compensation | | 76 |
| | 71 |
| | 86 |
| Stock-based compensation | | 99 | | | 63 | | | 76 | |
| Net charges for environmental and asset retirement obligations, including accretion | | 262 |
| | 383 |
| | 191 |
| Net charges for environmental and asset retirement obligations, including accretion | | 181 | | | 221 | | | 262 | |
| Payments for environmental and asset retirement obligations | | (239 | ) | | (131 | ) | | (242 | ) | Payments for environmental and asset retirement obligations | | (216) | | | (244) | | | (239) | |
| Charge associated with framework for global settlement of talc-related litigation | | Charge associated with framework for global settlement of talc-related litigation | | 130 | | | 0 | | | 0 | |
| Net charges for defined pension and postretirement plans | | 81 |
| | 120 |
| | 113 |
| Net charges for defined pension and postretirement plans | | 65 | | | 108 | | | 81 | |
| Pension plan contributions | | (75 | ) | | (174 | ) | | (57 | ) | Pension plan contributions | | (121) | | | (75) | | | (75) | |
| Net gain on early extinguishment and exchanges of debt | | (7 | ) | | (21 | ) | | (26 | ) | |
| Net loss (gain) on early extinguishment of debt | | Net loss (gain) on early extinguishment of debt | | 101 | | | 27 | | | (7) | |
| Deferred income taxes | | (404 | ) | | 76 |
| | 239 |
| Deferred income taxes | | 181 | | | 29 | | | 100 | |
| Loss (gain) on disposal of discontinued operations | | 15 |
| | (57 | ) | | 198 |
| |
| Decrease in long-term mill and leach stockpiles | | 94 |
| | 224 |
| | 10 |
| |
| | Dividends received from PT Smelting | | Dividends received from PT Smelting | | 3 | | | 40 | | | 0 | |
| | (Credits) charges for PT Freeport Indonesia (PT-FI) surface water tax, withholding tax and environmental matters | | (Credits) charges for PT Freeport Indonesia (PT-FI) surface water tax, withholding tax and environmental matters | | (19) | | | 30 | | | 162 | |
| Payments for PT-FI surface water tax, withholding tax and environmental matters | | Payments for PT-FI surface water tax, withholding tax and environmental matters | | (14) | | | (67) | | | 0 | |
| Charges for Cerro Verde royalty dispute | | Charges for Cerro Verde royalty dispute | | 32 | | | 65 | | | 371 | |
| Payments for Cerro Verde royalty dispute | | Payments for Cerro Verde royalty dispute | | (139) | | | (187) | | | (56) | |
| U.S. tax reform benefit | | U.S. tax reform benefit | | 0 | | | 0 | | | (123) | |
| Change in PT-FI statutory tax rate | | Change in PT-FI statutory tax rate | | 0 | | | 0 | | | (504) | |
| Other, net | | 16 |
| | (2 | ) | | 112 |
| Other, net | | 53 | | | 138 | | | 27 | |
| Changes in working capital and other tax payments, excluding disposition amounts: | | | | | | | |
| Changes in working capital and other: | | Changes in working capital and other: | | | | | | |
| Accounts receivable | | 649 |
| | 427 |
| | (175 | ) | Accounts receivable | | 132 | | | 119 | | | 649 | |
| Inventories | | (631 | ) | | (393 | ) | | 117 |
| Inventories | | 42 | | | 259 | | | (537) | |
| Other current assets | | (28 | ) | | (28 | ) | | 37 |
| Other current assets | | (27) | | | 60 | | | (28) | |
| Accounts payable and accrued liabilities | | (106 | ) | | 110 |
| | (28 | ) | Accounts payable and accrued liabilities | | 115 | | | (60) | | | (106) | |
| Accrued income taxes and timing of other tax payments | | (472 | ) | | 457 |
| | 136 |
| Accrued income taxes and timing of other tax payments | | 403 | | | (29) | | | (634) | |
| Net cash provided by operating activities | | 3,863 |
| | 4,666 |
| | 3,737 |
| Net cash provided by operating activities | | 3,017 | | | 1,482 | | | 3,863 | |
| Cash flow from investing activities: | | | | | | | Cash flow from investing activities: | | | | | | |
| Capital expenditures: | | | | | | | Capital expenditures: | | | | | | |
| North America copper mines | | (601 | ) | | (167 | ) | | (102 | ) | North America copper mines | | (428) | | | (877) | | | (601) | |
| South America | | (237 | ) | | (115 | ) | | (382 | ) | South America | | (183) | | | (256) | | | (237) | |
| Indonesia | | (1,001 | ) | | (875 | ) | | (1,025 | ) | Indonesia | | (1,266) | | | (1,369) | | | (1,001) | |
| Molybdenum mines | | (9 | ) | | (5 | ) | | (2 | ) | Molybdenum mines | | (19) | | | (19) | | | (9) | |
| Other, including oil and gas operations | | (123 | ) | | (248 | ) | | (1,302 | ) | |
| Other | | Other | | (65) | | | (131) | | | (123) | |
| Acquisition of PT Rio Tinto Indonesia | | (3,500 | ) | | — |
| | — |
| Acquisition of PT Rio Tinto Indonesia | | 0 | | | 0 | | | (3,500) | |
| Proceeds from sales of: | | | | | | | Proceeds from sales of: | |
| Tenke Fungurume mine | | — |
| | — |
| | 2,664 |
| |
| Deepwater Gulf of Mexico and onshore California oil and gas properties | | — |
| | — |
| | 2,272 |
| |
| Additional interest in Morenci joint venture | | — |
| | — |
| | 996 |
| |
PT Indonesia Papua Metal dan Mineral
| | 457 |
| | — |
| | — |
| |
| Kisanfu exploration project | | Kisanfu exploration project | | 550 | | | 0 | | | 0 | |
| Timok exploration project and a portion of Freeport Cobalt | | Timok exploration project and a portion of Freeport Cobalt | | 0 | | | 452 | | | 0 | |
| PT Indonesia Papua Metal Dan Mineral | | PT Indonesia Papua Metal Dan Mineral | | 0 | | | 0 | | | 457 | |
| Other assets | | 93 |
| | 72 |
| | 423 |
| Other assets | | 154 | | | 109 | | | 93 | |
| Other, net | | (97 | ) | | 17 |
| | 11 |
| Other, net | | (7) | | | (12) | | | (97) | |
| Net cash (used in) provided by investing activities | | (5,018 | ) | | (1,321 | ) | | 3,553 |
| |
| Net cash used in investing activities | | Net cash used in investing activities | | (1,264) | | | (2,103) | | | (5,018) | |
| Cash flow from financing activities: | | | | | | | Cash flow from financing activities: | | | | | | |
| Proceeds from debt | | 632 |
| | 955 |
| | 3,681 |
| Proceeds from debt | | 3,531 | | | 1,879 | | | 632 | |
| Repayments of debt | | (2,717 | ) | | (3,812 | ) | | (7,625 | ) | Repayments of debt | | (3,724) | | | (3,197) | | | (2,717) | |
| Proceeds from sale of PT Freeport Indonesia shares | | 3,500 |
| | — |
| | — |
| |
| Net proceeds from sale of common stock | | — |
| | — |
| | 1,515 |
| |
| Proceeds from sale of PT-FI shares | | Proceeds from sale of PT-FI shares | | 0 | | | 0 | | | 3,500 | |
| | Cash dividends and distributions paid: | | | | | | | Cash dividends and distributions paid: | | | | | | |
| Common stock | | (218 | ) | | (2 | ) | | (6 | ) | Common stock | | (73) | | | (291) | | | (218) | |
| Noncontrolling interests, including redemption | | (278 | ) | | (174 | ) | | (693 | ) | |
| Noncontrolling interests | | Noncontrolling interests | | 0 | | | (82) | | | (278) | |
| Contributions from noncontrolling interests | | Contributions from noncontrolling interests | | 156 | | | 165 | | | 0 | |
| | Other, net | | (19 | ) | | (22 | ) | | (38 | ) | Other, net | | (18) | | | (30) | | | (19) | |
| Net cash provided by (used in) financing activities | | 900 |
| | (3,055 | ) | | (3,166 | ) | |
| Net (decrease) increase in cash, cash equivalents, restricted cash and restricted cash equivalents | | (255 | ) | | 290 |
| | 4,124 |
| |
| Increase in cash and cash equivalents in assets held for sale | | — |
| | — |
| | (45 | ) | |
| Net cash (used in) provided by financing activities | | Net cash (used in) provided by financing activities | | (128) | | | (1,556) | | | 900 | |
| | Net increase (decrease) in cash, cash equivalents, restricted cash and restricted cash equivalents | | Net increase (decrease) in cash, cash equivalents, restricted cash and restricted cash equivalents | | 1,625 | | | (2,177) | | | (255) | |
| | Cash, cash equivalents, restricted cash and restricted cash equivalents at beginning of year | | 4,710 |
| | 4,420 |
| | 341 |
| Cash, cash equivalents, restricted cash and restricted cash equivalents at beginning of year | | 2,278 | | | 4,455 | | | 4,710 | |
| Cash, cash equivalents, restricted cash and restricted cash equivalents at end of year | | $ | 4,455 |
| | $ | 4,710 |
| | $ | 4,420 |
| Cash, cash equivalents, restricted cash and restricted cash equivalents at end of year | | $ | 3,903 | | | $ | 2,278 | | | $ | 4,455 | |
The accompanying Notes to Consolidated Financial Statements are an integral part of these consolidated financial statements.
FREEPORT-McMoRan INC.
Freeport-McMoRan Inc.
CONSOLIDATED BALANCE SHEETS
| | | | December 31, | | December 31, |
| | 2018 | | 2017 | | 2020 | | 2019 |
| | (In millions, except par value) | | (In millions, except par value) |
| ASSETS | | | | ASSETS | | | |
| Current assets: | | | | Current assets: | | | |
| Cash and cash equivalents | $ | 4,217 |
| | $ | 4,526 |
| Cash and cash equivalents | $ | 3,657 | | | $ | 2,020 | |
| Trade accounts receivable | 829 |
| | 1,322 |
| Trade accounts receivable | 892 | | | 741 | |
| Income and other tax receivables | 493 |
| | 343 |
| Income and other tax receivables | 520 | | | 426 | |
| | Inventories: | | | | Inventories: | | | |
| Materials and supplies, net | 1,528 |
| | 1,323 |
| Materials and supplies, net | 1,594 | | | 1,649 | |
| Mill and leach stockpiles | 1,453 |
| | 1,422 |
| Mill and leach stockpiles | 1,014 | | | 1,143 | |
| Product | 1,778 |
| | 1,404 |
| Product | 1,285 | | | 1,281 | |
| Other current assets | 422 |
| | 286 |
| Other current assets | 341 | | | 655 | |
| | Total current assets | 10,720 |
| | 10,626 |
| Total current assets | 9,303 | | | 7,915 | |
| Property, plant, equipment and mine development costs, net | 28,010 |
| | 22,994 |
| Property, plant, equipment and mine development costs, net | 29,818 | | | 29,584 | |
| | Long-term mill and leach stockpiles | 1,314 |
| | 1,409 |
| Long-term mill and leach stockpiles | 1,463 | | | 1,425 | |
| | Other assets | 2,172 |
| | 2,273 |
| Other assets | 1,560 | | | 1,885 | |
| | Total assets | $ | 42,216 |
| | $ | 37,302 |
| Total assets | $ | 42,144 | | | $ | 40,809 | |
| | | | | | | | |
| LIABILITIES AND EQUITY | | | | LIABILITIES AND EQUITY | | | |
| Current liabilities: | | | | Current liabilities: | | | |
| Accounts payable and accrued liabilities | $ | 2,625 |
| | $ | 2,497 |
| Accounts payable and accrued liabilities | $ | 2,708 | | | $ | 2,576 | |
| Current portion of environmental and asset retirement obligations | | Current portion of environmental and asset retirement obligations | 351 | | | 436 | |
| Accrued income taxes | 165 |
| | 583 |
| Accrued income taxes | 324 | | | 119 | |
| Current portion of environmental and asset retirement obligations | 449 |
| | 420 |
| |
| Current portion of debt | | Current portion of debt | 34 | | | 5 | |
| Dividends payable | 73 |
| | — |
| Dividends payable | 0 | | | 73 | |
| Current portion of debt | 17 |
| | 1,414 |
| |
| | Total current liabilities | 3,329 |
| | 4,914 |
| Total current liabilities | 3,417 | | | 3,209 | |
| Long-term debt, less current portion | 11,124 |
| | 11,815 |
| Long-term debt, less current portion | 9,677 | | | 9,821 | |
| Deferred income taxes | 4,032 |
| | 3,663 |
| Deferred income taxes | 4,408 | | | 4,210 | |
| Environmental and asset retirement obligations, less current portion | 3,609 |
| | 3,602 |
| Environmental and asset retirement obligations, less current portion | 3,705 | | | 3,630 | |
| Other liabilities | 2,230 |
| | 2,012 |
| Other liabilities | 2,269 | | | 2,491 | |
| | Total liabilities | 24,324 |
| | 26,006 |
| Total liabilities | 23,476 | | | 23,361 | |
| | | | | | | |
| Equity: | | | | Equity: | | | |
| Stockholders’ equity: | | | | Stockholders’ equity: | | | |
| Common stock, par value $0.10, 1,579 shares and 1,578 shares issued, respectively | 158 |
| | 158 |
| |
| Common stock, par value $0.10, 1,590 shares and 1,582 shares issued, respectively | | Common stock, par value $0.10, 1,590 shares and 1,582 shares issued, respectively | 159 | | | 158 | |
| Capital in excess of par value | 26,013 |
| | 26,751 |
| Capital in excess of par value | 26,037 | | | 25,830 | |
| Accumulated deficit | (12,041 | ) | | (14,722 | ) | Accumulated deficit | (11,681) | | | (12,280) | |
| Accumulated other comprehensive loss | (605 | ) | | (487 | ) | Accumulated other comprehensive loss | (583) | | | (676) | |
| Common stock held in treasury – 130 shares, at cost | (3,727 | ) | | (3,723 | ) | |
| Common stock held in treasury – 132 shares and 131 shares, respectively, at cost | | Common stock held in treasury – 132 shares and 131 shares, respectively, at cost | (3,758) | | | (3,734) | |
| Total stockholders’ equity | 9,798 |
| | 7,977 |
| Total stockholders’ equity | 10,174 | | | 9,298 | |
| Noncontrolling interests (refer to Note 2) | 8,094 |
| | 3,319 |
| |
| Noncontrolling interests | | Noncontrolling interests | 8,494 | | | 8,150 | |
| Total equity | 17,892 |
| | 11,296 |
| Total equity | 18,668 | | | 17,448 | |
| Total liabilities and equity | $ | 42,216 |
| | $ | 37,302 |
| Total liabilities and equity | $ | 42,144 | | | $ | 40,809 | |
The accompanying Notes to Consolidated Financial Statements are an integral part of these consolidated financial statements.
FREEPORT-McMoRan INC.
Freeport-McMoRan Inc.
CONSOLIDATED STATEMENTS OF EQUITY
| | | | | | | | | | | | | | | | | | | | | | | Stockholders’ Equity | |
| | Stockholders’ Equity | | | | | | Common Stock | | Accumulated Deficit | | Accumu-
lated
Other Compre-hensive
Loss | | Common Stock
Held in Treasury | | Total
Stock-
holders’
Equity | |
| | Common Stock | | | | Accumulated Deficit | | Accumu-
lated Other Compre-hensive Loss | | Common Stock Held in Treasury | | Total Stock- holders’ Equity | | | | | | Number
of
Shares | | At Par
Value | | Capital in
Excess of
Par Value | | Number
of
Shares | | At
Cost | | Non-
controlling
Interests | | Total
Equity |
| | Number of Shares | | At Par Value | | Capital in Excess of Par Value | | Number of Shares | | At Cost | | Non- controlling Interests | | Total Equity | | (In millions) |
| Balance at January 1, 2018 | | Balance at January 1, 2018 | 1,578 | | | $ | 158 | | | $ | 26,751 | | | $ | (14,722) | | | $ | (487) | | | 130 | | | $ | (3,723) | | | $ | 7,977 | | | $ | 3,319 | | | $ | 11,296 | |
| | (In millions) | |
| Balance at January 1, 2016 | 1,374 |
| | $ | 137 |
| | $ | 24,283 |
| | $ | (12,387 | ) | | $ | (503 | ) | | 128 |
| | $ | (3,702 | ) | | $ | 7,828 |
| | $ | 4,216 |
| | $ | 12,044 |
| |
| Issuance of common stock | 197 |
| | 20 |
| | 2,346 |
| | — |
| | — |
| | — |
| | — |
| | 2,366 |
| | — |
| | 2,366 |
| |
| Exercised and issued stock-based awards | 3 |
| | — |
| | — |
| | — |
| | — |
| | — |
| | — |
| | — |
| | — |
| | — |
| |
| Stock-based compensation, including tax reserve and the tender of shares | — |
| | — |
| | 61 |
| | — |
| | — |
| | 1 |
| | (6 | ) | | 55 |
| | — |
| | 55 |
| |
| Dividends, including forfeited dividends | — |
| | — |
| | — |
| | 1 |
| | — |
| | — |
| | — |
| | 1 |
| | (90 | ) | | (89 | ) | |
| Changes in noncontrolling interests | — |
| | — |
| | — |
| | — |
| | — |
| | — |
| | — |
| | — |
| | (6 | ) | | (6 | ) | |
| Sale of interest in TF Holdings Limited | — |
| | — |
| | — |
| | — |
| | — |
| | — |
| | — |
| | — |
| | (1,206 | ) | | (1,206 | ) | |
| Net loss attributable to common stockholders | — |
| | — |
| | — |
| | (4,154 | ) | | — |
| | — |
| | — |
| | (4,154 | ) | | — |
| | (4,154 | ) | |
| Net income attributable to noncontrolling interests, including discontinued operations | — |
| | — |
| | — |
| | — |
| | — |
| | — |
| | — |
| | — |
| | 290 |
| | 290 |
| |
| Other comprehensive (loss) income | — |
| | — |
| | — |
| | — |
| | (45 | ) | | — |
| | — |
| | (45 | ) | | 2 |
| | (43 | ) | |
| Balance at December 31, 2016 | 1,574 |
| | 157 |
| | 26,690 |
| | (16,540 | ) | | (548 | ) | | 129 |
| | (3,708 | ) | | 6,051 |
| | 3,206 |
| | 9,257 |
| |
| | Exercised and issued stock-based awards | 4 |
| | 1 |
| | 5 |
| | — |
| | — |
| | — |
| | — |
| | 6 |
| | — |
| | 6 |
| Exercised and issued stock-based awards | 1 | | | — | | | 8 | | | — | | | — | | | — | | | — | | | 8 | | | — | | | 8 | |
| Stock-based compensation, including the tender of shares | — |
| | — |
| | 56 |
| | — |
| | — |
| | 1 |
| | (15 | ) | | 41 |
| | 1 |
| | 42 |
| Stock-based compensation, including the tender of shares | — | | | — | | | 70 | | | — | | | — | | | — | | | (4) | | | 66 | | | 0 | | | 66 | |
| Dividends, including forfeited dividends | — |
| | — |
| | — |
| | 1 |
| | — |
| | — |
| | — |
| | 1 |
| | (174 | ) | | (173 | ) | |
| Net income attributable to common stockholders | — |
| | — |
| | — |
| | 1,817 |
| | — |
| | — |
| | — |
| | 1,817 |
| | — |
| | 1,817 |
| |
| Net income attributable to noncontrolling interests, including discontinued operations | — |
| | — |
| | — |
| | — |
| | — |
| | — |
| | — |
| | — |
| | 278 |
| | 278 |
| |
| Other comprehensive income | — |
| | — |
| | — |
| | — |
| | 61 |
| | — |
| | — |
| | 61 |
| | 8 |
| | 69 |
| |
| Balance at December 31, 2017 | 1,578 |
| | 158 |
| | 26,751 |
| | (14,722 | ) | | (487 | ) | | 130 |
| | (3,723 | ) | | 7,977 |
| | 3,319 |
| | 11,296 |
| |
| Exercised and issued stock-based awards | 1 |
| | — |
| | 8 |
| | — |
| | — |
| | — |
| | — |
| | 8 |
| | — |
| | 8 |
| |
| Stock-based compensation, including the tender of shares | — |
| | — |
| | 70 |
| | — |
| | — |
| | — |
| | (4 | ) | | 66 |
| | — |
| | 66 |
| |
| | Dividends | — |
| | — |
| | (291 | ) | | — |
| | — |
| | — |
| | — |
| | (291 | ) | | (278 | ) | | (569 | ) | Dividends | — | | | — | | | (291) | | | 0 | | | — | | | — | | | — | | | (291) | | | (278) | | | (569) | |
| Adoption of new accounting standard for reclassification of income taxes | — |
| | — |
| | — |
| | 79 |
| | (79 | ) | | — |
| | — |
| | — |
| | — |
| | — |
| Adoption of new accounting standard for reclassification of income taxes | — | | | — | | | — | | | 79 | | | (79) | | | — | | | — | | | — | | | — | | | — | |
| Sale of interest in PT Freeport Indonesia (refer to Note 2) | — |
| | — |
| | (525 | ) | | — |
| | (6 | ) | | — |
| | — |
| | (531 | ) | | 4,762 |
| | 4,231 |
| |
| | Sale of interest in PT-FI | | Sale of interest in PT-FI | — | | | — | | | (525) | | | — | | | (6) | | | — | | | — | | | (531) | | | 4,762 | | | 4,231 | |
| Net income attributable to common stockholders | — |
| | — |
| | — |
| | 2,602 |
| | — |
| | — |
| | — |
| | 2,602 |
| | — |
| | 2,602 |
| Net income attributable to common stockholders | — | | | — | | | — | | | 2,602 | | | — | | | — | | | — | | | 2,602 | | | — | | | 2,602 | |
| Net income attributable to noncontrolling interests | — |
| | — |
| | — |
| | — |
| | — |
| | — |
| | — |
| | — |
| | 292 |
| | 292 |
| Net income attributable to noncontrolling interests | — | | | — | | | — | | | — | | | — | | | — | | | — | | | — | | | 292 | | | 292 | |
| Other comprehensive loss | — |
| | — |
| | — |
| | — |
| | (33 | ) | | — |
| | — |
| | (33 | ) | | (1 | ) | | (34 | ) | Other comprehensive loss | — | | | — | | | — | | | — | | | (33) | | | — | | | — | | | (33) | | | (1) | | | (34) | |
| Balance at December 31, 2018 | 1,579 |
| | $ | 158 |
| | $ | 26,013 |
| | $ | (12,041 | ) | | $ | (605 | ) | | 130 |
| | $ | (3,727 | ) | | $ | 9,798 |
| | $ | 8,094 |
| | $ | 17,892 |
| Balance at December 31, 2018 | 1,579 | | | 158 | | | 26,013 | | | (12,041) | | | (605) | | | 130 | | | (3,727) | | | 9,798 | | | 8,094 | | | 17,892 | |
| | Exercised and issued stock-based awards | | Exercised and issued stock-based awards | 3 | | | — | | | 1 | | | — | | | — | | | — | | | — | | | 1 | | | — | | | 1 | |
| Stock-based compensation, including the tender of shares | | Stock-based compensation, including the tender of shares | — | | | — | | | 50 | | | — | | | — | | | 1 | | | (7) | | | 43 | | | 1 | | | 44 | |
| | Dividends | | Dividends | — | | | — | | | (291) | | | — | | | — | | | — | | | — | | | (291) | | | (73) | | | (364) | |
| | Changes in noncontrolling interests | | Changes in noncontrolling interests | — | | | — | | | (1) | | | — | | | — | | | — | | | — | | | (1) | | | (11) | | | (12) | |
| Contributions from noncontrolling interests | | Contributions from noncontrolling interests | — | | | — | | | 80 | | | — | | | — | | | — | | | — | | | 80 | | | 86 | | | 166 | |
| | Adjustment for deferred taxes | | Adjustment for deferred taxes | — | | | — | | | (22) | | | — | | | — | | | — | | | — | | | (22) | | | — | | | (22) | |
| | Net loss attributable to common stockholders | | Net loss attributable to common stockholders | — | | | — | | | — | | | (239) | | | — | | | — | | | — | | | (239) | | | — | | | (239) | |
| Net income attributable to noncontrolling interests | | Net income attributable to noncontrolling interests | — | | | — | | | — | | | — | | | — | | | — | | | — | | | — | | | 50 | | | 50 | |
| Other comprehensive (loss) income | | Other comprehensive (loss) income | — | | | — | | | — | | | — | | | (71) | | | — | | | — | | | (71) | | | 3 | | | (68) | |
| Balance at December 31, 2019 | | Balance at December 31, 2019 | 1,582 | | | 158 | | | 25,830 | | | (12,280) | | | (676) | | | 131 | | | (3,734) | | | 9,298 | | | 8,150 | | | 17,448 | |
| Exercised and issued stock-based awards | | Exercised and issued stock-based awards | 8 | | | 1 | | | 57 | | | — | | | — | | | — | | | — | | | 58 | | | — | | | 58 | |
| Stock-based compensation, including the tender of shares | | Stock-based compensation, including the tender of shares | — | | | — | | | 74 | | | — | | | — | | | 1 | | | (24) | | | 50 | | | — | | | 50 | |
| | Change in ownership interests | | Change in ownership interests | — | | | — | | | — | | | — | | | — | | | — | | | — | | | 0 | | | 1 | | | 1 | |
| Contributions from noncontrolling interests | | Contributions from noncontrolling interests | — | | | — | | | 76 | | | — | | | — | | | — | | | — | | | 76 | | | 80 | | | 156 | |
| | Net income attributable to common stockholders | | Net income attributable to common stockholders | — | | | — | | | — | | | 599 | | | — | | | — | | | — | | | 599 | | | — | | | 599 | |
| Net income attributable to noncontrolling interests | | Net income attributable to noncontrolling interests | — | | | — | | | — | | | — | | | — | | | — | | | — | | | — | | | 266 | | | 266 | |
| Other comprehensive income (loss) | | Other comprehensive income (loss) | — | | | — | | | — | | | — | | | 93 | | | — | | | — | | | 93 | | | (3) | | | 90 | |
| Balance at December 31, 2020 | | Balance at December 31, 2020 | 1,590 | | | $ | 159 | | | $ | 26,037 | | | $ | (11,681) | | | $ | (583) | | | 132 | | | $ | (3,758) | | | $ | 10,174 | | | $ | 8,494 | | | $ | 18,668 | |
The accompanying Notes to Consolidated Financial Statements are an integral part of these consolidated financial statements.
FREEPORT-McMoRan INC.Freeport-McMoRan Inc.
NOTES TO CONSOLIDATED FINANCIAL STATEMENTS
NOTE 1. SUMMARY OF SIGNIFICANT ACCOUNTING POLICIES
Basis of Presentation. The consolidated financial statements of Freeport-McMoRan Inc. (FCX) include the accounts of those subsidiaries where it directly or indirectly has more than 50 percent of the voting rights and/or has control over the subsidiary. As of December 31, 2018,2020, the most significant entities that FCX consolidates include its 48.76 percent-owned subsidiary PT Freeport Indonesia (PT-FI), and the following wholly owned subsidiaries: Freeport Minerals Corporation (FMC) and Atlantic Copper, S.L.U. (Atlantic Copper). Refer to Notes 2 and 3 for further discussion, including FCX’s conclusion to consolidate PT-FI.
During 2016, FCX completed sales of its Africa mining operation held by FMC and substantially all of its oil and gas operations. Refer to Note 2 for further discussion.
FCX’s unincorporated joint ventures are reflected using the proportionate consolidation method (refer to Note 3 for further discussion). Investments in unconsolidated companies owned 20 percent or more are recorded using the equity method. Investments in unconsolidated companies owned less than 20 percent, and for which FCX does not exercise significant influence, are recorded using theat (i) fair value for those that have a readily determinable fair value or (ii) cost, method.less any impairment, for those that do not have a readily determinable fair value. All significant intercompany transactions have been eliminated. Dollar amounts in tables are stated in millions, except per share amounts.
Business Segments. FCX has organized its mining operations into four primary divisions – North America copper mines, South America mining, Indonesia mining and Molybdenum mines, and operating segments that meet certain thresholds are reportable segments. FCX’s reportable segments include the Morenci, Cerro Verde and Grasberg (Indonesia mining) copper mines, the Rod & Refining operations and Atlantic Copper Smelting & Refining. Refer to Note 16 for further discussion.
Use of Estimates. The preparation of FCX’s financial statements in conformity with accounting principles generally accepted in the United States (U.S.) requires management to make estimates and assumptions that affect the amounts reported in these financial statements and accompanying notes. The more significant areas requiring the use of management estimates include minerals reserve estimation; asset lives for depreciation, depletion and amortization; environmental obligations; asset retirement obligations; estimates of recoverable copper in mill and leach stockpiles; deferred taxes and valuation allowances; reserves for contingencies and litigation; asset acquisitions and impairment, including estimates used to derive future cash flows associated with those assets; pension benefits; and valuation of derivative instruments. Actual results could differ from those estimates.
Functional Currency. The functional currency for the majority of FCX’s foreign operations is the U.S. dollar. For foreign subsidiaries whose functional currency is the U.S. dollar, monetary assets and liabilities denominated in the local currency are translated at current exchange rates, and non-monetary assets and liabilities, such as inventories, property, plant, equipment and mine development costs, are translated at historical rates. Gains and losses resulting from translation of such account balances are included in other (expense) income, net, as are gains and losses from foreign currency transactions. Foreign currency gains (losses) totaled $34 million in 2020, $24 million in 2019 and $14 million in 2018, $(5) million in 2017 and $32 million in 2016.2018.
Cash Equivalents. Highly liquid investments purchased with maturities of three months or less are considered cash equivalents.
Restricted Cash and Restricted Cash Equivalents. FCX’s restricted cash and restricted cash equivalents are primarily related to PT-FI’s commitment for the development of a new smelter in Indonesia; and guarantees and commitments for certain mine closure and reclamation obligations, and customs duty taxes; and funds held as cash collateral for surety bonds related to plugging and abandonment obligations of certain oil and gas properties.obligations. Restricted cash and restricted cash equivalents are classified as a current or long-term asset based on the timing and nature of when or how the cash is expected to be used or when the restrictions are expected to lapse. Restricted cash and restricted cash equivalents are comprised of timebank deposits and money market funds.
Inventories. Inventories include materials and supplies, mill and leach stockpiles, and product inventories. Inventories are stated at the lower of weighted-average cost or net realizable value (NRV).
Mill and Leach Stockpiles. Mill and leach stockpiles are work-in-process inventories for FCX’s mining operations. Mill and leach stockpiles contain ore that has been extracted from an ore body and is available for metal recovery. Mill stockpiles contain sulfide ores, and recovery of metal is through milling, concentrating and smelting and refining or, alternatively, by concentrate leaching. Leach stockpiles contain oxide ores and certain secondary sulfide ores and recovery of metal is through exposure to acidic solutions that dissolve contained copper and deliver it in solution to extraction processing facilities (i.e., solution extraction and electrowinning (SX/EW)). The recorded cost of mill and leach stockpiles includes mining and haulage costs incurred to deliver ore to stockpiles, depreciation, depletion, amortization and site overhead costs. Material is removed from the stockpiles at a weighted-average cost per pound.
Because it is impracticable to determine copper contained in mill and leach stockpiles by physical count, reasonable estimation methods are employed. The quantity of material delivered to mill and leach stockpiles is based on surveyed volumes of mined material and daily production records. Sampling and assaying of blasthole cuttings determine the estimated copper grade of the material delivered to mill and leach stockpiles.
Expected copper recovery rates for mill stockpiles are determined by metallurgical testing. The recoverable copper in mill stockpiles, once entered into the production process, can be produced into copper concentrate almost immediately.
Expected copper recovery rates for leach stockpiles are determined using small-scale laboratory tests, small- to large-scale column testing (which simulates the production process), historical trends and other factors, including mineralogy of the ore and rock type. Total copper recovery in leach stockpiles can vary significantly from a low percentage to more than 90 percent depending on several variables, including processing methodology, processing variables, mineralogy and particle size of the rock. For newly placed material on active stockpiles, as much as 80 percent of the total copper recovery may occur during the first year, and the remaining copper may be recovered over many years.
Processes and recovery rates for mill and leach stockpiles are monitored regularly, and recovery rate estimates are adjusted periodically as additional information becomes available and as related technology changes. Adjustments to recovery rates will typically result in a future impact to the value of the material removed from the stockpiles at a revised weighted-average cost per pound of recoverable copper.
Product. Product inventories include raw materials, work-in-process and finished goods. Raw materials are primarily unprocessed concentrate at Atlantic Copper’s smelting and refining operations. Work-in-process inventories are primarily copper concentrate at various stages of conversion into anode and cathode at Atlantic Copper’s operations. Atlantic Copper’s in-process inventories are valued at the weighted-average cost of the material fed to the smelting and refining process plus in-process conversion costs. Finished goods for mining operations represent salable products (e.g., copper and molybdenum concentrate, copper anode, copper cathode, copper rod, copper wire, molybdenum oxide, and high-purity molybdenum chemicals and other metallurgical products). Finished goods are valued based on the weighted-average cost of source material plus applicable conversion costs relating to associated process facilities. Costs of finished goods and work-in-process (i.e., not raw materials) inventories include labor and benefits, supplies, energy, depreciation, depletion, amortization, site overhead costs and other necessary costs associated with the extraction and processing of ore, including, depending on the process,such as mining, haulage, milling, concentrating, smelting, leaching, solution extraction,SX/EW, refining, roasting and chemical processing. Corporate general and administrative costs are not included in inventory costs.
Property, Plant, Equipment and Mine Development Costs. Property, plant, equipment and mine development costs are carried at cost. Mineral exploration costs, as well as drilling and other costs incurred for the purpose of converting mineral resources to proven and probable reserves or identifying new mineral resources at development or production stage properties, are charged to expense as incurred. Development costs are capitalized beginning after proven and probable mineral reserves have been established. Development costs include costs incurred resulting from mine pre-production activities undertaken to gain access to proven and probable reserves, including shafts, adits, drifts, ramps, permanent excavations, infrastructure and removal of overburden. For underground mines certain costs related to panel development, such as undercutting and drawpoint development, are also capitalized as mine development costs until production reaches sustained design capacity for the mine. After reaching design capacity, the mine transitions to the production phase and panel development costs are allocated to
inventory and then included as a component of cost of goods sold. Additionally, interest expense allocable to the cost of developing mining properties and to constructing new facilities is capitalized until assets are ready for their intended use.
Expenditures for replacements and improvements are capitalized. Costs related to periodic scheduled maintenance (i.e., turnarounds) are charged to expense as incurred. Depreciation for mining and milling life-of-mine assets, infrastructure and other common costs is determined using the unit-of-production (UOP) method based on total estimated recoverable proven and probable copper reserves (for primary copper mines) and proven and probable molybdenum reserves (for primary molybdenum mines). Development costs and acquisition costs for proven and probable mineral reserves that relate to a specific ore body are depreciated using the UOP method based on estimated recoverable proven and probable mineral reserves for the ore body benefited. Depreciation, depletion and amortization using the UOP method is recorded upon extraction of the recoverable copper or molybdenum from the ore body or production of finished goods (as applicable), at which time it is allocated to inventory cost and then included as a component of cost of goods sold. Other assets are depreciated on a straight-line basis over estimated useful lives for the related assets of up to 4050 years for buildings and three3 to 3050 years for machinery and equipment, and mobile equipment.
Included in property, plant, equipment and mine development costs is value beyond proven and probable mineral reserves (VBPP), primarily resulting from FCX’s acquisition of FMC in 2007. The concept of VBPP may be interpreted differently by different mining companies. FCX’s VBPP is attributable to (i) mineralized material, which includes measured and indicated amounts, that FCX believes could be brought into production with the establishment or modification of required permits and should market conditions and technical assessments warrant, (ii) inferred mineral resources and (iii) exploration potential.
Carrying amounts assigned to VBPP are not charged to expense until the VBPP becomes associated with additional proven and probable mineral reserves and the reserves are produced or the VBPP is determined to be impaired. Additions to proven and probable mineral reserves for properties with VBPP will carry with them the value assigned to VBPP at the date acquired, less any impairment amounts. Refer to Note 5 for further discussion.
Impairment of Long-Lived Mining Assets. FCX assesses the carrying values of its long-lived mining assets for impairment when events or changes in circumstances indicate that the related carrying amounts of such assets may not be recoverable. In evaluating long-lived mining assets for recoverability, estimates of pre-tax undiscounted future cash flows of FCX’s individual mines are used. An impairment is considered to exist if total estimated undiscounted future cash flows are less than the carrying amount of the asset. Once it is determined that an impairment exists, an impairment loss is measured as the amount by which the asset carrying value exceeds its fair value. The estimated undiscounted cash flows used to assess recoverability of long-lived assets and to measure the fair value of FCX’s mining operations are derived from current business plans, which are developed using near-term price forecasts reflective of the current price environment and management’s projections for long-term average metal prices. In addition to near- and long-term metal price assumptions, other key assumptions include estimates of commodity-based and other input costs; proven and probable mineral reserves estimates, including the timing and cost to develop and produce the reserves; VBPP estimates; and the use of appropriate discount rates in the measurement of fair value. FCX believes its estimates and models used to determine fair value are similar to what a market participant would use. As quoted market prices are unavailable for FCX’s individual mining operations, fair value is determined through the use of after-tax discounted estimated future cash flows (i.e., Level 3 measurement).
Oil and Gas Properties. FCX follows the full cost method of accounting specified by the U.S. Securities and Exchange Commission’s (SEC) rules whereby all costs associated with oil and gas property acquisition, exploration and development activities are capitalized into a cost center on a country-by-country basis. Such costs include internal general and administrative costs, such as payroll and related benefits and costs directly attributable to employees engaged in acquisition, exploration and development activities. General and administrative costs associated with production, operations, marketing and general corporate activities are charged to expense as incurred. Capitalized costs, along with estimated future costs to develop proved reserves and asset retirement costs that are not already included in oil and gas properties, net of related salvage value, are amortized to expense under the UOP method using engineers’ estimates of the related, by-country proved oil and natural gas reserves.
The costs of unproved oil and gas properties were excluded from amortization until the properties were evaluated. Costs were transferred into the amortization base on an ongoing basis as the properties were evaluated and proved oil and natural gas reserves were established or if impairment was determined. Unproved oil and gas properties were assessed periodically, at least annually, to determine whether impairment had occurred. FCX assessed unproved oil and gas properties for impairment on an individual basis or as a group if properties were individually insignificant. The assessment considered the following factors, among others: intent to drill, remaining lease term, geological and geophysical evaluations, drilling results and activity, the assignment of proved reserves, the economic viability of development if proved reserves were assigned and other current market conditions. During any period in which these factors indicated an impairment, the cumulative drilling costs incurred to date for such property and all or a portion of the associated leasehold costs were transferred to the full cost pool and were then subject to amortization. Including amounts determined to be impaired, FCX transferred $4.9 billion of costs associated with unevaluated properties to the full cost pool in 2016. The transfer of costs into the amortization base involved a significant amount of judgment. Costs not subject to amortization consisted primarily of capitalized costs incurred for undeveloped acreage and wells in progress pending determination, together with capitalized interest for these projects. Following the completion of the sales of oil and gas properties discussed in Note 2, FCX had no unproved oil and gas properties in the consolidated balance sheets at December 31, 2018 or 2017. Interest costs totaling $7 million in 2016 were capitalized on oil and gas properties not subject to amortization and in the process of development.
Proceeds from the sale of oil and gas properties are accounted for as reductions to capitalized costs unless the reduction causes a significant change in proved reserves, which, absent other factors, is generally described as a 25 percent or greater change, and significantly alters the relationship between capitalized costs and proved reserves attributable to a cost center, in which case a gain or loss is recognized.
Impairment of Oil and Gas Properties. Under the SEC full cost accounting rules, FCX reviewed the carrying value of its oil and gas properties in the full cost pool for impairment each quarter on a country-by-country basis. Under these rules, capitalized costs of oil and gas properties (net of accumulated depreciation, depletion, amortization and impairment, and related deferred income taxes) for each cost center may not exceed a “ceiling” equal to:
the present value, discounted at 10 percent, of estimated future net cash flows from the related proved oil and natural gas reserves, net of estimated future income taxes; plus
the cost of the related unproved properties not being amortized; plus
the lower of cost or estimated fair value of the related unproved properties included in the costs being amortized (net of related tax effects).
These rules require that FCX price its future oil and gas production at the twelve-month average of the first-day-of-the-month historical reference prices as adjusted for location and quality differentials. FCX’s reference prices are West Texas Intermediate (WTI) for oil and the Henry Hub price for natural gas. Such prices are utilized except where different prices are fixed and determinable from applicable contracts for the remaining term of those contracts. The reserve estimates exclude the effect of any crude oil and natural gas derivatives FCX has in place. The estimated future net cash flows also exclude future cash outflows associated with settling asset retirement obligations included in the net book value of the oil and gas properties. The rules require an impairment if the capitalized costs exceed this “ceiling.”
In 2016, net capitalized costs with respect to FCX’s proved oil and gas properties exceeded the related ceiling test limitation; therefore, impairment charges of $4.3 billion were recorded primarily because of the lower twelve-month average of the first-day-of-the-month historical reference oil price and reserve revisions.
Deferred Mining Costs. Stripping costs (i.e., the costs of removing overburden and waste material to access mineral deposits) incurred during the production phase of aan open-pit mine are considered variable production costs and are included as a component of inventory produced during the period in which stripping costs are incurred. Major development expenditures, including stripping costs to prepare unique and identifiable areas outside the current mining area for future production that are considered to be pre-production mine development, are capitalized and amortized using the UOP method based on estimated recoverable proven and probable reserves for the ore body benefited. However, where a second or subsequent pit or major expansion is considered to be a continuation of existing mining activities, stripping costs are accounted for as a current production cost and a component of the associated inventory.
Environmental Obligations. Environmental expenditures are charged to expense or capitalized, depending upon their future economic benefits. Accruals for such expenditures are recorded when it is probable that obligations have been incurred and the costs can be reasonably estimated. Environmental obligations attributed to the Comprehensive Environmental Response, Compensation, and Liability Act of 1980 (CERCLA) or analogous state programs are considered probable when a claim is asserted, or is probable of assertion, and FCX, or any of its subsidiaries, have been associated with the site. Other environmental remediation obligations are considered probable based on specific facts and circumstances. FCX’s estimates of these costs are based on an evaluation of various factors, including currently available facts, existing technology, presently enacted laws and regulations, remediation experience, whether or not FCX is a potentially responsible party (PRP) and the ability of other PRPs to pay their allocated portions. With the exception of those obligations assumed in the acquisition of FMC that were initially recorded at estimated fair values (refer to Note 12 for further discussion), environmental obligations are recorded on an undiscounted basis. Where the available information is sufficient to estimate the amount of the obligation, that estimate has been used. Where the information is only sufficient to establish a range of probable liability and no point within the range is more likely than any other, the lower end of the range has been used. Possible recoveries of some of these costs from other parties are not recognized in the consolidated financial statements until they become probable. Legal costs associated with environmental remediation (such as fees to outside lawthird-party legal firms for work relating to determining the extent and type of remedial actions and the allocation of costs among PRPs) are included as part of the estimated obligation.
Environmental obligations assumed in the acquisition of FMC, which were initially recorded at fair value and estimated on a discounted basis, are accreted to full value over time through charges to interest expense. Adjustments arising from changes in amounts and timing of estimated costs and settlements may result in increases and decreases in these obligations and are calculated in the same manner as they were initially estimated. Unless these adjustments qualify for capitalization, changes in environmental obligations are charged to operating income when they occur.
FCX performs a comprehensive review of its environmental obligations annually and also reviews changes in facts and circumstances associated with these obligations at least quarterly.
Asset Retirement Obligations. FCX records the fair value of estimated asset retirement obligations (AROs) associated with tangible long-lived assets in the period incurred. Retirement obligations associated with long-lived assets are those for which there is a legal obligation to settle under existing or enacted law, statute, written or oral contract or by legal construction. These obligations, which are initially estimated based on discounted cash flow estimates, are accreted to full value over time through charges to cost of sales. In addition, asset retirement costs (ARCs) are capitalized as part of the related asset’s carrying value and are depreciated over the asset’s respective useful life.
For mining operations, reclamation costs for disturbances are recognized as an ARO and as a related ARC in the period of the disturbance and depreciated primarily on a UOP basis. FCX’s AROs for mining operations consist primarily of costs associated with mine reclamation and closure activities. These activities, which are site specific, generally include costs for earthwork, revegetation, water treatment and demolition.
For oil and gas properties, the fair value of the legal obligation is recognized as an ARO and as a related ARC in the period in which the well is drilled or acquired and is amortized on a UOP basis together with other capitalized costs. Substantially all of FCX’s oil and gas leases require that, upon termination of economic production, the working interest owners plug and abandon non-producing wellbores; remove platforms, tanks, production equipment and flow lines; and restore the wellsite.
For non-operating properties without reserves, changes to the ARO are recorded in earnings.
At least annually, FCX reviews its ARO estimates for changes in the projected timing of certain reclamation and closure/restoration costs, changes in cost estimates and additional AROs incurred during the period. Refer to Note 12 for further discussion.
Revenue Recognition. Effective January 1, 2018, FCX adopted the new revenue recognition accounting standard, which did not result in any financial statement impacts or changes to FCX’s revenue recognition policies or processes as revenue is primarily derived from arrangements in which the transfer of control coincides with the fulfillment of performance obligations.
FCX recognizes revenue for all of its products upon transfer of control in an amount that reflects the consideration it expects to receive in exchange for those products. Transfer of control is in accordance with the terms of customer contracts, which is generally upon shipment or delivery of the product. While payment terms vary by contract, terms generally include payment to be made within 30 days, but not longer than 60 days. Certain of FCX’s concentrate and cathode sales contracts also provide for provisional pricing, which is accounted for as an embedded derivative (refer to Note 14 for further discussion). For provisionally priced sales, 90 percent to 100 percent of the provisional payment is madecollected upon shipment or within 20 days, and final balances are settled in a contractually specified future month (generally one to four months from the shipment date) based on quoted monthly average copper settlement prices on the London Metal Exchange (LME) or the Commodity Exchange Inc. (COMEX), a division of the New York Mercantile Exchange, and quoted monthly average London Bullion Market Association (LBMA)(London) PM gold settlement prices.
FCX’s product revenues are also recorded net of treatment charges, royalties and export duties. Moreover, because a portion of the metals contained in copper concentrate is unrecoverable as a result of the smelting process, FCX’s revenues from concentrate sales are also recorded net of allowances based on the quantity and value of these unrecoverable metals. These allowances are a negotiated term of FCX’s contracts and vary by customer. Treatment and refining charges represent payments or price adjustments to smelters and refiners that are generally fixed. Refer to Note 16 for a summary of revenue by product type.
Gold sales are priced according to individual contract terms, generally the average LBMALondon PM gold settlement price for a specified month near the month of shipment.
The majority of FCX’s molybdenum sales are priced based on the average published Metals Week price, plus conversion premiums for products that undergo additional processing, such as ferromolybdenum and molybdenum chemical products, for the month prior to the month of shipment.
Stock-Based Compensation. Compensation costs for share-based payments to employees are measured at fair value and charged to expense over the requisite service period for awards that are expected to vest. The fair value of stock options is determined using the Black-Scholes-Merton option valuation model. The fair value for stock-settled restricted stock units (RSUs) is based on FCX’s stock price on the date of grant. Shares of common stock are issued at the vesting date for stock-settled RSUs. The fair value of performance share units (PSUs) are determined using FCX’s stock price and a Monte-Carlo simulation model. The fair value for liability-classified awards (i.e., cash-settled stock appreciation rights (SARs), cash-settled RSUs and cash-settled PSUs)RSUs) is remeasured each reporting period using the Black-Scholes-Merton option valuation model for SARs and FCX’s stock price for cash-settled RSUs and cash-settled PSUs.price. FCX has elected to recognize compensation costs for stock option awards and SARs that vest over several years on a straight-line basis over the vesting period, and for RSUs and cash-settled PSUs on the graded-vesting method over the vesting period. Refer to Note 10 for further discussion.
Earnings Per Share. FCX calculates its basic net income (loss) per share of common stock under the two-class method and calculates its diluted net income (loss) per share of common stock using the more dilutive of the two-class method or the treasury-stock method. Basic net income (loss) per share of common stock was computed by dividing net income (loss) attributable to common stockholders (after deducting accumulated dividends and undistributed earnings to participating securities) by the weighted-average shares of common stock outstanding during the year. Diluted net income (loss) per share of common stock was calculated by including the basic weighted-average shares of common stock outstanding adjusted for the effects of all potential dilutive shares of common stock, unless their effect would be anti-dilutive.
Reconciliations of net income (loss) and weighted-average shares of common stock outstanding for purposes of calculating basic and diluted net income (loss) per share for the years ended December 31 follow:
| | | | | | | | | | | | | | | | | | | | |
| | 2020 | | 2019 | | 2018 | |
| Net income (loss) from continuing operations | $ | 865 | | | $ | (192) | | | $ | 2,909 | | |
| Net income from continuing operations attributable to noncontrolling interests | (266) | | | (50) | | | (292) | | |
| | | | | | |
| Accumulated dividends and undistributed earnings allocated to participating securities | (3) | | | (3) | | | (4) | | |
| Net income (loss) from continuing operations attributable to common stockholders | 596 | | | (245) | | | 2,613 | | |
| | | | | | |
| Net income (loss) from discontinued operations | 0 | | | 3 | | | (15) | | |
| | | | | | |
| | | | | | |
| | | | | | |
| Net income (loss) attributable to common stockholders | $ | 596 | | | $ | (242) | | | $ | 2,598 | | |
| | | | | | |
| Basic weighted-average shares of common stock outstanding (millions) | 1,453 | | | 1,451 | | | 1,449 | | |
| Add shares issuable upon exercise or vesting of dilutive stock options and RSUs (millions) | 8 | | | 0 | | a | 9 | | a |
| | | | | | |
| | | | | | |
| Diluted weighted-average shares of common stock outstanding (millions) | 1,461 | | | 1,451 | | | 1,458 | | |
| | | | | | |
| Basic net income (loss) per share attributable to common stockholders: | | | | | | |
| Continuing operations | $ | 0.41 | | | $ | (0.17) | | | $ | 1.80 | | |
| Discontinued operations | 0 | | | 0 | | | (0.01) | | |
| $ | 0.41 | | | $ | (0.17) | | | $ | 1.79 | | |
| | | | | | |
| Diluted net income (loss) per share attributable to common stockholders: | | | | | | |
| Continuing operations | $ | 0.41 | | | $ | (0.17) | | | $ | 1.79 | | |
| Discontinued operations | 0 | | | 0 | | | (0.01) | | |
| $ | 0.41 | | | $ | (0.17) | | | $ | 1.78 | | |
| | | | | | |
| | | | | | |
| | | | | | |
| | | | | | |
|
| | | | | | | | | | | | |
| | 2018 | | 2017 | | 2016 | |
| Net income (loss) from continuing operations | $ | 2,909 |
| | $ | 2,029 |
| | $ | (3,832 | ) | |
| Net income from continuing operations attributable to noncontrolling interests | (292 | ) | | (274 | ) | | (227 | ) | |
| Gain on redemption and preferred dividends attributable to redeemable noncontrolling interest | — |
| | — |
| | 161 |
| |
| Accumulated dividends and undistributed earnings allocated to participating securities | (4 | ) | | (4 | ) | | (3 | ) | |
| Net income (loss) from continuing operations attributable to common stockholders | 2,613 |
| | 1,751 |
| | (3,901 | ) | |
| | | | | | | |
| Net (loss) income from discontinued operations | (15 | ) | | 66 |
| | (193 | ) | |
| Net income from discontinued operations attributable to noncontrolling interests | — |
| | (4 | ) | | (63 | ) | |
| Net (loss) income from discontinued operations attributable to common stockholders | (15 | ) | | 62 |
| | (256 | ) | |
| | | | | | | |
| Net income (loss) attributable to common stockholders | $ | 2,598 |
| | $ | 1,813 |
| | $ | (4,157 | ) | |
| | | | | | | |
| Basic weighted-average shares of common stock outstanding (millions) | 1,449 |
| | 1,447 |
| | 1,318 |
| |
| Add shares issuable upon exercise or vesting of dilutive stock options and RSUs (millions) | 9 |
| a | 7 |
| | — |
| a |
| Diluted weighted-average shares of common stock outstanding (millions) | 1,458 |
| | 1,454 |
| | 1,318 |
| |
| | | | | | | |
| Basic net income (loss) per share attributable to common stockholders: | | | | | | |
| Continuing operations | $ | 1.80 |
| | $ | 1.21 |
| | $ | (2.96 | ) | |
| Discontinued operations | (0.01 | ) | | 0.04 |
| | (0.20 | ) | |
| | $ | 1.79 |
| | $ | 1.25 |
| | $ | (3.16 | ) | |
| | | | | | | |
| Diluted net income (loss) per share attributable to common stockholders: | | | | | | |
| Continuing operations | $ | 1.79 |
| | $ | 1.21 |
| | $ | (2.96 | ) | |
| Discontinued operations | (0.01 | ) | | 0.04 |
| | (0.20 | ) | |
| | $ | 1.78 |
| | $ | 1.25 |
| | $ | (3.16 | ) | |
| |
a. | Excludes approximately 1 million in 2018 and 12 million in 2016 associated with outstanding stock options with exercise prices less than the average market price of FCX’s common stock and RSUs that were anti-dilutive. |
Outstanding stock options with exercise prices greater than the average market price of FCX’s common stock during the year are excluded from the computation of diluted net income (loss) per share of common stock. Stock options for 3731 million shares of common stock were excludedin 2020, 42 million shares in 2019 and 37 million shares in 2018 41 million in 2017 and 46 million in 2016.were excluded.
New Accounting Standards.Following is a discussion of new accounting standards.
Revenue Recognition. In May 2014,June 2016, the Financial Accounting Standards Board (FASB) issued an Accounting Standards Update (ASU) related to revenue recognition. FCX adopted this standard effective January 1, 2018, under the modified retrospective approach applied to contracts that remain in force at the adoption date. The adoption of this standard did not result in any financial statement impacts or changes to FCX’s revenue recognition policies or processes as revenue is primarily derived from arrangements in which the transfer of control coincides with the fulfillment of performance obligations (refer to Revenue Recognition policy in this note). In connection with the adoption of the standard and consistent with FCX’s policy prior to adoption of the standard, FCX has elected to account for shipping and handling activities performed after control of goods has been transferred to a customer as a fulfillment cost recorded in production and delivery costs on the consolidated statements of operations.
Financial Instruments. In January 2016, FASB issued an ASU that amends the guidance on the classification and measurement of financial instruments. This ASU makes limited changes to prior guidance and amends certain disclosure requirements. FCX adopted this ASU effective January 1, 2018, and adoption did not have a material impact on its financial statements.
In June 2016, FASB issued an ASU that requires entities to estimate all expected credit losses for most financial assets held at the reporting date based on an expected loss model, which requires consideration of historical experience, current conditions, and reasonable and supportable forecasts. This ASU also requires enhanced disclosure requirements to enable users of financial statements to understand the entity’s assumptions, models and methods for estimating expected credit losses. For public companies, this ASU is effective for interim and annual reporting periods beginning after December 15, 2019, with early adoption permitted. FCX is currently evaluating the impact this ASU will have on its financial statements.
Leases. In February 2016, FASB issued an ASU that will require lessees to recognize most leases on the balance sheet. FCX adopted this ASU effective January 1, 2019,2020, and elected the practical expedient allowing it to apply the provisions of the updated lease guidance at the January 1, 2019, effective date, without adjusting the comparative periods presented. FCX also elected an accounting policy to not recognize a lease asset and liability for leases with a term of 12 months or less and a purchase option that is not expected to be exercised. FCX completed an assessment of its lease portfolio, implemented a new information technology system, and designed processes and controls to account for its leases in accordance with the new standard. FCX has concluded that the adoption of this ASU did not have a material impact on its consolidated financial statements. FCX will begin making the required lease disclosures under the ASU beginning with its March 31, 2019, quarterly report on Form 10-Q.
Statement of Cash Flows. In November 2016, FASB issued an ASU that changes the classification and presentation of restricted cash and restricted cash equivalents on the statement of cash flows. The ASU requires that a statement of cash flows include the change during the period in the total of cash, cash equivalents and amounts generally described as restricted cash or restricted cash equivalents. Therefore, amounts generally described as restricted cash and restricted cash equivalents should be included with cash and cash equivalents when reconciling the beginning-of-period and end-of-period total amounts shown on the statement of cash flows. FCX adopted this ASU effective January 1, 2018, and adjusted its consolidated statement of cash flows for the years ended December 31, 2017 and 2016, to include restricted cash and restricted cash equivalents with cash and cash equivalents.
The impact of adopting this ASU for the years ended December 31 follows: |
| | | | | | | | | | | | |
| | | 2017 |
| | | Previously Reported | | Impact of Adoption | | After Adoptiona |
| Accrued income taxes and changes in other tax payments included in cash flow from operating activities | | $ | 473 |
| | $ | (16 | ) | | $ | 457 |
|
| Net cash provided by operating activities | | 4,682 |
| | (16 | ) | | 4,666 |
|
| Other, net included in cash flow from investing activities | | (25 | ) | | 42 |
| | 17 |
|
| Net cash used in investing activities | | (1,363 | ) | | 42 |
| | (1,321 | ) |
| Net increase in cash, cash equivalents, restricted cash and restricted cash equivalents | | 264 |
| | 26 |
| | 290 |
|
| Cash, cash equivalents, restricted cash and restricted cash equivalents at beginning of year | | 4,245 |
| | 158 |
| | 4,403 |
|
| Cash, cash equivalents, restricted cash and restricted cash equivalents at end of period | | 4,447 |
| | 184 |
| | 4,631 |
|
|
| | | | | | | | | | | | |
| | | 2016 |
| | | Previously Reported | | Impact of Adoption | | After Adoptiona |
| Other, net included in cash flow from operating activities | | $ | 48 |
| | $ | 8 |
| | $ | 56 |
|
| Net cash provided by operating activities | | 3,729 |
| | 8 |
| | 3,737 |
|
| Other, net included in cash flow from investing activities | | 8 |
| | 3 |
| | 11 |
|
| Net cash provided by investing activities | | 3,550 |
| | 3 |
| | 3,553 |
|
| Net increase in cash, cash equivalents, restricted cash and restricted cash equivalents | | 4,113 |
| | 11 |
| | 4,124 |
|
| Cash, cash equivalents, restricted cash and restricted cash equivalents at beginning of year | | 177 |
| | 147 |
| | 324 |
|
| Cash, cash equivalents, restricted cash and restricted cash equivalents at end of period | | 4,245 |
| | 158 |
| | 4,403 |
|
| |
a. | Excludes the reclassification of assets held for sale and other adjustments to conform with the current year presentation. |
Net Periodic Pension and Postretirement Benefit Cost. In March 2017, FASB issued an ASU that changes how entities with defined benefit pension or other postretirement benefit plans present net periodic benefit cost in the income statement. This ASU requires the service cost component of net periodic benefit cost to be presented in the same income statement line item or items as other compensation costs for those employees who are receiving the benefit. In addition, only the service cost component is eligible for capitalization when applicable (i.e., as a cost of inventory or an internally constructed asset). The other components of net periodic benefit cost are required to be presented separately from the service cost component and outside of operating income. These other components of net periodic benefit cost are not eligible for capitalization, and FCX elected to include these other components in other income (expense), net. FCX adopted this ASU effective January 1, 2018, and adjusted its presentation in the consolidated statements of operations for the years ended December 31, 2017 and 2016, to conform with the new guidance. The impact of adopting this ASU for the years ended December 31 follows:
|
| | | | | | | | | | | | |
| | | 2017 |
| | | Previously Reported | | Impact of Adoption | | Current Presentation |
| Production and delivery | | $ | 10,308 |
| a | $ | (42 | ) | | $ | 10,266 |
|
| Total cost of sales | | 12,022 |
| | (42 | ) | | 11,980 |
|
| Selling, general and administrative expenses | | 484 |
| | (7 | ) | | 477 |
|
| Mining exploration and research expenses | | 94 |
| | (1 | ) | | 93 |
|
| Environmental obligations and shutdown costs | | 251 |
| | (7 | ) | | 244 |
|
| Total costs and expenses | | 12,770 |
| | (57 | ) | | 12,713 |
|
| Operating income | | 3,633 |
| | 57 |
| | 3,690 |
|
| Other income (expense), net | | 49 |
| | (57 | ) | | (8 | ) |
|
| | | | | | | | | | | | |
| | | 2016 |
| | | Previously Reported | | Impact of Adoption | | Current Presentation |
| Production and delivery | | $ | 10,733 |
| a | $ | (46 | ) | | $ | 10,687 |
|
| Total cost of sales | | 17,580 |
| | (46 | ) | | 17,534 |
|
| Selling, general and administrative expenses | | 607 |
| | (10 | ) | | 597 |
|
| Mining exploration and research expenses | | 64 |
| | (1 | ) | | 63 |
|
| Environmental obligations and shutdown costs | | 20 |
| | (6 | ) | | 14 |
|
| Total costs and expenses | | 17,622 |
| | (63 | ) | | 17,559 |
|
| Operating loss | | (2,792 | ) | | 63 |
| | (2,729 | ) |
| Other income (expense), net | | 49 |
| | (63 | ) | | (14 | ) |
| |
a. | Includes $8 millionfor metals inventory adjustments in 2017 and $36 millionin 2016.
|
Tax Reform Reclassification. In February 2018, FASB issued an ASU that allows entities to elect to reclassify the stranded income tax effects caused by the December 2017 Tax Cuts and Jobs Act (the Act) in accumulated other comprehensive income (AOCI) to retained earnings. This election applies to the U.S. federal income tax rate change from 35 percent to 21 percent. FCX elected to early adopt this standard effective July 1, 2018, which resulted in a one-time reclassification totaling $79 million from AOCI to retained earnings in third-quarter 2018. FCX has not elected to reclassify other “indirect” income tax effects of the Act stranded in AOCI. Any additional income tax effects stranded in AOCI will continue to pass through earnings in future periods as specific classes of AOCI items are reversed.
Fair Value Measurement. In August 2018, FASB issued an ASU in connection with the disclosure framework project that modifies the disclosure requirements on fair value measurements. FCX early adopted this ASU in third-quarter 2018, which did not have a material impact on its financial statements.
Defined Benefit Plans. In August 2018, FASB issued an ASU in connection with the disclosure framework project that modifies the disclosure requirements for employers that sponsor defined benefit pension or other postretirement plans. FCX early adopted this ASU in fourth-quarter 2018, which did not have a material impact on its financial statements.
Reclassifications. As a result of adopting new accounting standards in 2018 (refer to New Accounting Standards in this Note) and the reclassification of assets held for sale (refer to Note 2), For comparative purposes, certain prior year amounts have been reclassified to conform with the current year presentation. The reclassifications relate to a revision to FCX’s presentation of business segments to remove a business segment that no longer qualifies as a reportable segment (refer to Note 16), as well as, reclassification of certain costs from selling, general and administrative expenses to production and delivery in the consolidated statements of operations in 2019 ($20 million) and 2018 ($21 million).
Subsequent Events. FCX evaluated events after December 31, 2020, and through the date the financial statements were issued, and determined any events or transactions occurring during this period that would require recognition or disclosure are appropriately addressed in these financial statements.
NOTE 2. ACQUISITIONS AND DISPOSITIONS
PT-FI Divestment. On December 21, 2018, FCX completed the transaction with the IndonesianIndonesia government regarding PT-FI’s long-term mining rights and share ownership.
Pursuant to the previously announced divestment agreement and related documents, PT Indonesia Asahan Aluminium (Persero) (PT Inalum)Inalum, also known as MIND ID), an IndonesianIndonesia state-owned enterprise, acquired for cash consideration of $3.85 billion all of Rio Tinto plc's (Rio Tinto) interests associated with its joint venture with PT-FI (the former Rio Tinto Joint Venture) and 100 percent of FCX's interests in PT Indonesia Papua Metal Dan Mineral (PTI - formerly known as PT Indocopper Investama), which at the time owned 9.36 percent of PT-FI. Of the $3.85 billion in cash consideration, Rio Tinto received $3.5 billion and FCX received $350 million. In addition, Rio Tinto paid FCX $107 million for its share of the 2018 joint venture cash flows.
In connection with the transaction, an aggregate 40 percent share ownership in PT-FI was issued to PT Inalum and PTI (which is expected to be owned by PT Inalum and the provincial/regional government in Papua). Based on a subscription of PT Inalum’s rights to acquire for cash consideration of $3.5 billion all of Rio Tinto’s interests in the former Rio Tinto Joint Venture, PT-FI acquired all of the common stock of the entity (PT Rio Tinto Indonesia) that held Rio Tinto’s interest. After the transaction, PT Inalum’s (26.24 percent) and PTI’s (25.00 percent) collective share ownership of PT-FI totals 51.24 percent and FCX's share ownership totals 48.76 percent. The arrangements provide for FCX and the other pre-transaction PT-FI shareholders (i.e., PT Inalum and PTI) to retain the economics of the revenue and cost sharing arrangements under the former Rio Tinto Joint Venture. As a result, FCX’s economic interest in PT-FI is expected to approximate 81 percent from 2019 through 2022.
The divestment agreement provides that FCX will indemnify PT Inalum and PTI from any losses (reduced by receipts) arising from any tax disputes of PT-FI disclosed to PT Inalum in a Jakarta, Indonesia tax court letter limited to PTI’s respective percentage share at the time the loss is finally incurred. Any net obligations arising from any tax settlement would be paid on December 21, 2025. As of December 31, 2020, FCX had accrued $42 million (included in other liabilities in the consolidated balance sheet at December 31, 2020) related to this indemnification.
FCX, PT-FI, PTI and PT Inalum entered into a shareholders agreement (the PT-FI Shareholders Agreement), which includes provisions related to the governance and management of PT-FI. FCX considered the terms of the PT-FI Shareholders Agreement and related governance structure, including whether PT Inalum has substantive participating rights, and concluded that it has retained control and would continue to consolidate PT-FI in its financial statements following the transaction. Among other terms, the governance arrangements under the PT-FI Shareholders Agreement transfers control over the management of PT-FI’s mining operations to an operating committee, which is controlled by FCX. Additionally, as discussed above, the existing PT-FI shareholders will retain the economics of the revenue and cost-sharingcost sharing arrangements under the former Rio Tinto Joint Venture, so that FCX’s economic interest in the project through 2041 will not be significantly affected by the transaction. FCX believes its conclusion to continue to consolidate PT-FI in its financial statements is in accordance with SECthe U.S. Securities and Exchange Commission (SEC) Regulation S-X, Rule 3A-02 (a), which provides for situations in which consolidation of an entity, notwithstanding the lack of majority ownership, is necessary to present fairly the financial position and results of operations of the registrant, because of the existence of a parent-subsidiary relationship by means other than record ownership of voting stock.
Attribution of PT-FI Net Income or Loss.FCX also analyzedhas concluded that the attribution of PT-FI’s acquisitionnet income or loss from December 21, 2018 (the date of the Rio Tinto Joint Venture interests and concluded the transactiondivestment transaction), through December 31, 2022 (the Initial Period), should be accountedbased on the economics replacement agreement, as previously discussed. The economics replacement agreement entitles FCX to approximately 81 percent of PT-FI dividends paid during the Initial Period, with the remaining 19 percent paid to the noncontrolling interests. PT-FI’s net income for as an asset acquisition as substantially2020 totaled $765 million, of which $621 million was attributed to FCX. PT-FI’s net loss for 2019 totaled $203 million, of which $165 million was attributed to FCX. PT-FI’s cumulative net income since December 21, 2018, through December 31, 2020, totaled $425 million, of which $346 million was attributed to FCX. PT-FI has not paid dividends during the Initial Period.
The above-described attribution of PT-FI’s net income or loss applies only through the Initial Period. Beginning January 1, 2023, the attribution of PT-FI’s net income or loss will be based on equity ownership percentages (48.76 percent for FCX, 26.24 percent for PT Inalum and 25.00 percent for PTI). For all of its other partially owned consolidated subsidiaries, FCX attributes net income or loss based on equity ownership percentages.
Kisanfu Transaction. In December 2020, FCX completed the fair valuesale of its interests in the Kisanfu undeveloped project to a wholly owned subsidiary of China Molybdenum Co., Ltd. (CMOC) for $550 million, with after-tax net cash proceeds totaling $415 million. The Kisanfu project, located in the Democratic Republic of Congo, is an undeveloped cobalt and copper resource. As of December 31, 2019, FCX did not have any proven and probable reserves associated with the Kisanfu project. FCX recorded a gain of $486 million in 2020 associated with this transaction.
Cobalt Business. In fourth-quarter 2019, FCX completed the sale of its cobalt refinery in Kokkola, Finland, and related cobalt cathode precursor business (consisting of approximately $271 million of assets and $63 million of liabilities at the time of closing) to Umicorefor total cash consideration of approximately $200 million, including approximately $50 million of working capital. Under the terms of the gross assetsagreement, FCX separated its cobalt business, and Umicore acquired the refinery and cathode precursor business. FCX and the current noncontrolling interest partners in Freeport Cobalt retained the remaining cobalt business, which is concentrated in mineral reservesa producer of cobalt fine powders, chemicals, catalysts, ceramics and related long-lived mining assets. The acquisition was a single asset because substantially allpigments. Lundin Mining Corporation, one of the acquired assetsnoncontrolling interest partners, received 30 percent of the proceeds from this transaction. FCX recorded a gain of $59 million in 2019 associated with this transaction.
Timok Transaction. In 2016, FCX sold an interest in the upper zone of the Timok exploration project in Serbia (the 2016 Transaction).
In December 2019, FCX completed the sale of its interest in the lower zone of the Timok exploration project to an affiliate of the purchaser in the 2016 Transaction, for cash consideration of $240 million at closing plus the right to future contingent payments of up to $150 million. These future contingent payments will be based on the future sale of products (as defined in the agreement) from the Timok lower zone. For a period of 12 months after the third anniversary of the initial sale of products from the Timok lower zone, the purchaser can settle, or FCX can demand payment of, such deferred payment obligation, in each case, for a total of $60 million. As these deferred payments are linkedcontingent upon future production (the Timok project is still in the exploration phase) and would result in gain recognition, no amounts were recorded upon the closing of the transaction. Subsequent recognition will be based on the gain contingency model, in which the consideration would be recorded in the period in which all contingencies are resolved and the gain is realized. This is expected to each other and cannot be physically removed without causing a significant diminutionwhen FCX (i) is provided periodic product sales information by the purchaser or (ii) gives notice to the fair valuepurchaser or receives notice from the purchaser regarding the settlement of the other assets. PT-FI allocateddeferred payments for $60 million. In addition, in lieu of such payment upon achievement of defined development milestones, the $3.5 billion purchase pricepurchaser agreed to pay the assets acquired and liabilities assumed based on their estimated fair values on the acquisition date. The fair value estimates were based on, but not limited to, long-term metal price assumptions of $3.00 per pound of copper and $1,300 per ounce of gold; expected future cash flows based on estimated reserve quantities; costs to produce and develop the related reserves; current replacement cost$107 million contingent consideration provided for similar capacity for certain fixed assets; and appropriate discount rates using an estimated international cost of capital of 14 percent. The estimates were primarily based on significant inputs not observable in the market (as discussed above)2016 Transaction in three installment payments of $45 million by July 31, 2020 (which was collected in 2020), $50 million by December 31, 2021, and thus represent Level 3 measurements.
The following table summarizes the allocation$12 million by March 31, 2022. As a result of this transaction, FCX recorded a gain of $343 million, consisting of the purchase price:
|
| | | | | |
| Current assets | | $ | 25 |
| |
| Property, plant, equipment and mine development costs: | | | |
| Mineral reserves | | 3,056 |
| |
| Mine development, infrastructure and other | | 1,559 |
| |
| Liabilities other than taxes | | (77 | ) | |
| Deferred income taxes, net | | (1,063 | ) | a |
| Total purchase price | | $ | 3,500 |
| |
| |
a. | Deferred income taxes have been recognized on the fair value adjustments to net assets using an Indonesia corporate income tax rate of 25 percent. |
Under applicable accounting guidance, changes in ownership that do not result in a change in control are accounted for as equity transactions with no impact on net income. The following table summarizescash consideration ($240 million) and the consolidated impactaggregate discounted amount of the transaction discussed above on FCX’s consolidated balance sheet asthree installment payments ($103 million).
Oil and Gas Operations.In 2016, FCX sold the majority of December 21, 2018:its oil and gas assets held by its wholly owned subsidiary, FCX Oil & Gas LLC (FM O&G). In 2019, FM O&G sold certain property interests for cash consideration of $36 million (before closing adjustments), which resulted in the recognition of a gain of $20 million. In 2018, FM O&G disposed of certain property interests that resulted in the recognition of a gain of $27 million, primarily associated with the abandonment obligations that were assumed by the acquirer.
|
| | | | | |
| Cash | | $ | 458 |
| |
| Other current assets | | 23 |
| |
| Property, plant, equipment and mine development costs: | | | |
| Mineral reserves | | 3,056 |
| |
| Mine development, infrastructure and other | | 1,559 |
| |
| Liabilities other than taxes | | (77 | ) | |
| Deferred income taxes, net | | (788 | ) | |
| Noncontrolling interests | | (4,762 | ) | a |
| Capital in excess of par value | | 531 |
| |
| |
a. | Primarily reflects the approximate 40 percent economic interest in the former Rio Tinto Joint Venture for the period from 2023 through 2041, which was acquired by PTI and PT Inalum. |
FCX considered if the adjustment to capital in excess of par value was an indicator of impairment and after considering other factors, such as PT-FI’s historical results and projected undiscounted cash flows, concluded that it did not indicate a potential impairment at PT-FI.
TF Holdings Limited - Discontinued Operations. On November 16,In 2016, FCX completed the sale of its70 percent interest in TF Holdings Limited (TFHL) to China Molybdenum Co., Ltd. (CMOC)COMC for $2.65 billion in cash (before closing adjustments) and contingent consideration of up to $120 million in cash, consisting of $60 million if the average copper price exceedsexceeded $3.50 per pound and $60 million if the average cobalt price exceedsexceeded $20 per pound, both during the 24-month period beginning January 1, 2018. One-half of the proceeds from this transaction was used to repay borrowings under FCX’s unsecured bank term loan.ending December 31, 2019.
The contingent consideration iswas considered a derivative, and the fair value will bewas adjusted through December 31, 2019. The fair value of theFCX realized and collected in January 2020 contingent consideration derivative (includedof $60 million because the average cobalt price exceeded $20 per pound during the 24-month period ending December 31, 2019 (no amount was realized associated with the copper price), and was included in other current assets in the consolidated balance sheets) was $57 millionsheet at December 31, 2018, and $74 million at December 31, 2017. (Losses) gains2019. Gains (losses) resulting from changes in the fair value of the contingent consideration derivative ($(17)totaling $3 million in 2019 and $(17) million in 2018 $61 million in 2017 and $13 million in 2016) arewere included in net income (loss) income from discontinued operations and primarily resulted from fluctuations in cobalt and copper prices. Future changes in the fair value
In accordance with accounting guidance, FCX reported the results of operations offrom TFHL as discontinued operations in the consolidated statements of operations because the disposal representsrepresented a strategic shift that had a major effect on operations. The consolidated statements of comprehensive income (loss) were not impacted by discontinued operations as TFHL did not have any other comprehensive income (loss), and the consolidated statements of cash flows are reported on a combined basis without separately presenting discontinued operations.
Net gain (loss) income from discontinued operations of $3 million in 2019 and $(15) million in 2018 in the consolidated statements of operations, consists of the following:
|
| | | | | | | | | | | | |
| | Years Ended December 31, | |
| | 2018 | | 2017 | | 2016 | |
Revenuesa | $ | — |
| | $ | 13 |
| | $ | 959 |
| |
| Costs and expenses: | | | | | | |
| Production and delivery costs | — |
| | — |
| | 833 |
| |
| Depreciation, depletion and amortization | — |
|
| — |
| | 80 |
| b |
| Interest expense allocated from parent | — |
| | — |
| | 39 |
| c |
| Other costs and expenses, net | — |
| | — |
| | 10 |
| |
| Income (loss) before income taxes and net (loss) gain on disposal | — |
| | 13 |
| | (3 | ) | |
| Net (loss) gain on disposal | (15 | ) | d | 57 |
| d | (198 | ) | e |
| Net (loss) income before income taxes | (15 | ) | | 70 |
| | (201 | ) | |
| (Provision for) benefit from income taxes | — |
| | (4 | ) | | 8 |
| |
| Net (loss) income from discontinued operations | $ | (15 | ) | | $ | 66 |
| | $ | (193 | ) | |
| |
a. | In accordance with accounting guidance, amounts are net of recognition (eliminations) of intercompany sales totaling $13 million in 2017 and $(157) million in 2016. |
| |
b. | In accordance with accounting guidance, depreciation, depletion and amortization was suspended subsequent to classification as assets held for sale, which occurred in May 2016. |
| |
c. | In accordance with accounting guidance, interest associated with FCX’s unsecured bank term loan that was required to be repaid as a result of the sale of TFHL has been allocated to discontinued operations. |
| |
d. | Includes a (loss) gain of $(17) million in 2018 and $61 million in 2017primarily includes gains (losses) associated with the change in the fair value of contingent consideration. |
| |
e. | Includes a charge of $33 million associated with the settlement agreement entered into with Gécamines, partly offset by a gain of $13 million for the fair value of contingent consideration. |
Cash flows from discontinued operations included in the consolidated statements of cash flows for the year ended December 31, 2016, follow:
|
| | | | | |
| | | | |
| Net cash provided by operating activities | | | $ | 241 |
|
| Net cash used in investing activities | | | (73 | ) |
| Net cash used in financing activities | | | (123 | ) |
| Increase in cash and cash equivalents | | | $ | 45 |
|
Assets Held for Sale. As a result of the 2016 sale of TFHL, FCX planned to sell its effective 56 percent interest in Freeport Cobalt and its wholly owned Kisanfu exploration project. Freeport Cobalt includes the large-scale cobalt refinery in Kokkola, Finland, and the related sales and marketing business. Kisanfu is a copper and cobalt exploration project, located near Tenke in the Democratic Republic of Congo (DRC). The assets and liabilities of Freeport Cobalt and Kisanfu were previously classified as held for sale in the consolidated balance sheet at December 31, 2017, and a $110 million estimated loss on disposal was recognized in 2016 when these assets were classified as held for sale (included in net gain on sales of assets in the consolidated statements of operations).
FCX is continuing to assess opportunities for its Kisanfu copper and cobalt exploration project, including development of the project on its own or a sale of all or a minority stake in the project. In 2017, a gain of $13 million was recorded to adjust the Kisanfu assets to their carrying value when they were initially classified as held for sale. In second-quarter 2018, management concluded it no longer believes that it is probable an outright sale will occur in the near term and the related assets and liabilities should no longer be classified as held for sale. Because of this conclusion, revisions to the consolidated balance sheet as of December 31, 2017, included a $90 million increase to property, plant, equipment and mine development costs, net, with an offsetting reduction in current assets held for sale, and a $27 million increase to deferred income taxes, with an offsetting reduction in current liabilities held for sale.
FCX continues to market the Freeport Cobalt assets, but concluded that they no longer qualified as held for sale as of December 31, 2018. In accordance with applicable accounting guidance, during 2018, FCX recorded a gain of $97 million to adjust the Freeport Cobalt assets to their carrying value when they were initially classified as held for sale. During fourth-quarter 2018, FCX also recorded $48 million of depreciation, depletion and amortization expense that was suspended while the assets were held for sale from December 2016 through September 2018. The carrying amounts of Freeport Cobalt’s major classes of assets and liabilities, which were reclassified from held for sale in the consolidated balance sheet at December 31, 2017, follow:
|
| | | | |
| Assets | | |
| Cash and cash equivalents | | $ | 79 |
|
| Trade receivables | | 76 |
|
| Inventories | | 256 |
|
| Other receivables and current assets | | 20 |
|
| Property, plant, equipment and mine development costs, net | | 60 |
|
| Other assets | | 3 |
|
| Total previously included in current assets held for sale | | $ | 494 |
|
| | | |
| Liabilities | | |
| Accounts payable and accrued liabilities | | $ | 176 |
|
| Accrued income taxes | | 18 |
|
| Long-term debt | | 112 |
|
| Deferred income taxes and asset retirement obligations | | 17 |
|
| Total previously included in current liabilities held for sale | | $ | 323 |
|
Morenci. In May 2016, FCX sold a 13 percent undivided interest in its Morenci unincorporated joint venture to SMM Morenci, Inc. for $1.0 billion in cash. FCX recorded a $576 million gain on the transaction and used losses to offset cash taxes on the transaction. A portion of the proceeds from the transaction was used to repay borrowings under FCX’s unsecured bank term loan and revolving credit facility.
The Morenci unincorporated joint venture was owned 85 percent by FCX and 15 percent by Sumitomo Metal Mining Arizona, Inc. (Sumitomo). As a result of the transaction, the unincorporated joint venture is owned 72 percent by FCX, 15 percent by Sumitomo and 13 percent by SMM Morenci, Inc. (an affiliate of Sumitomo Metal Mining Co, Ltd.).
Timok. In May 2016, FMC sold an interest in the Timok exploration project in Serbia to Global Reservoir Minerals Inc. (now known as Nevsun Resources, Ltd.) for consideration of $135 million in cash and contingent consideration of up to $107 million payable to FCX in stages upon achievement of defined development milestones. As a result of this transaction, FCX recorded a gain of $133 million in 2016, and no amounts were recorded for contingent consideration under the loss recovery approach. A portion of the proceeds from the transaction was used to repay borrowings under FCX’s unsecured bank term loan.
Oil and Gas Operations.In 2018, FCX Oil & Gas LLC (FM O&G) disposed of certain property interests that resulted in the recognition of a gain of $27 million, primarily associated with the abandonment obligations that were assumed by the acquirer. In 2017, FM O&G sold certain property interests for cash consideration of $80 million (before closing adjustments). Under the full cost accounting rules, the sales resulted in the recognition of gains of $49 million in 2017.
In December 2016, FM O&G completed the sale of its onshore California oil and gas properties to Sentinel Peak Resources California LLC (Sentinel) for cash consideration of $592 million (before closing adjustments from the July 1, 2016, effective date) and contingent consideration of up to $150 million, consisting of $50 million per year for 2018, 2019 and 2020 if the price of Brent crude oil averages over $70 per barrel in each of these calendar years. The contingent consideration is considered a derivative, and the fair value will be adjusted through the year 2020. The fair value of the contingent consideration derivative (included in other assets in the consolidated balance sheets) was $16 million at December 31, 2018, and $34 million at December 31, 2017. The contingent consideration of $50 million for 2018 was realized because the average Brent crude oil price exceeded $70 per barrel for the year and was included in other current assets in the consolidated balance sheet at December 31, 2018. Future changes in the fair value of the contingent consideration derivative will continue to be recorded in operating income. Sentinel assumed abandonment obligations associated with the properties.consideration.
In December 2016, FM O&G completed the sale of its Deepwater Gulf of Mexico (GOM) oil and gas properties to Anadarko Petroleum Corporation (Anadarko) for cash consideration of $2.0 billion (before closing adjustments from the August 1, 2016, effective date) and up to $150 million in contingent payments. The contingent payments were recorded under the loss recovery approach, whereby contingent gains are recorded up to the amount of any loss on the sale, and reduced the loss on the sale in 2016. The contingent payments were included in other current assets ($27 million) and other assets ($116 million) at December 31, 2018, and in other current assets ($24 million) and other assets ($126 million) at December 31, 2017, in the consolidated balance sheets. The contingent payments will be received over time ($7 million was collected in 2018) as Anadarko realizes future cash flows in connection with a third-party production handling agreement for an offshore platform. Anadarko assumed abandonment obligations associated with these properties. A portion of the proceeds from this transaction was used to repay FCX’s remaining outstanding borrowings under its unsecured bank term loan.
Under the full cost accounting rules, the sales of the Deepwater GOM and onshore California oil and gas properties required gain (loss) recognition (net loss of $9 million in 2016, which was net of $150 million for contingent payments associated with the Deepwater GOM sale and $33 million for the fair value of contingent consideration from the onshore California sale) because of their significance to the full cost pool.
In connection with the sale of the Deepwater GOM oil and gas properties, FM O&G entered into an agreement to amend the terms of the Plains Offshore Operations Inc. Preferred Stock that was reported as redeemable noncontrolling interest on FCX’s financial statements. The amendment provided FM O&G the right to call these securities for $582 million. FM O&G exercised this option in December 2016 and recorded a $199 million gain on redemption to retained earnings.
In July 2016, FM O&G sold its Haynesville shale assets for cash consideration of $87 million, before closing adjustments. In June 2016, FM O&G sold certain oil and gas royalty interests to Black Stone Minerals, L.P. for cash consideration of $102 million, before closing adjustments. Under the full cost accounting rules, the proceeds from these transactions were recorded as a reduction of capitalized oil and gas properties, with no gain or loss recognition in 2016 because the reserves were not significant to the full cost pool.
NOTE 3. OWNERSHIP IN SUBSIDIARIES AND JOINT VENTURES
Ownership in Subsidiaries. FMC produces copper and molybdenum, with mines in North America and South America. At December 31, 2018,2020, FMC’s operating mines in North America were Morenci, Bagdad, Safford, Sierrita and Miami located in Arizona; Tyrone and Chino located in New Mexico; and Henderson and Climax located in Colorado. FCX has a 72 percent interest (subsequent to the sale of a 13 percent undivided interest on May 31, 2016) in Morenci (refer to “Joint Ventures – Sumitomo and SMM Morenci, Inc.”) and owns 100 percent of the other North America mines. At December 31, 2018,2020, operating mines in South America were Cerro Verde (53.56(53.56 percent owned) located in Peru and El Abra (51(51 percent owned) located in Chile. At December 31, 2018,2020, FMC’s net assets totaled $16.0$15.0 billion and its accumulated deficit totaled $14.0 billion.$15.7 billion. FCX had no0 loans outstanding to FMC at December 31, 2018.2020.
FCX’s direct share ownership in PT-FI totaled 81.28 percent through December 21, 2018, and 48.76 percent thereafter. PTI owned 9.36 percent of PT-FI through December 21, 2018, and FCX owned 100 percent of PTI through December 21, 2018. Refer to Note 2 for a discussion of the PT-FI divestment. Refer to “Joint Ventures - Former Rio Tinto Joint Venture” for discussion of PT-FI’s unincorporated joint venture. At December 31, 2018,2020, PT-FI’s net assets totaled $10.5$11.4 billion and its retained earnings totaled $6.6 billion.$7.2 billion. FCX had $76$539 million in intercompany loans to PT-FI outstanding at December 31, 2018.2020.
FCX owns 100 percent of the outstanding Atlantic Copper common stock. At December 31, 2018,2020, Atlantic Copper’s net liabilitiesassets totaled $23$145 million and its accumulated deficit totaled $436 million.$406 million. FCX had $434$56 million in intercompany loans to Atlantic Copper outstanding at December 31, 2018.2020.
FCX owns 100 percent of FM O&G, which, as of December 31, 2018, has oil and gas assets that primarily include natural gas production onshore in South Louisiana and oil production offshore California. At December 31, 2018, FM O&G’s net liabilities totaled $14.2 billion and its accumulated deficit totaled $25.8 billion. FCX had $10.6 billion in intercompany loans to FM O&G outstanding at December 31, 2018, which were fully impaired.
Joint Ventures. FCX has the following unincorporated joint ventures.
Sumitomo and SMM Morenci, Inc. FMC owns a 72 percent undivided interest in Morenci via an unincorporated joint venture. The remaining 28 percent is owned by Sumitomo (15 percent) and SMM Morenci, Inc. (13 percent). Each partner takes in kind its share of Morenci’s production. FMC purchased 146 million pounds of Morenci’s copper cathode from Sumitomo and SMM Morenci, Inc. at market prices for $409 million during 2020. FMC had receivables from Sumitomo and SMM Morenci, Inc. totaling $15 million at December 31, 2020, and $19 million at December 31, 2019.
Former Rio Tinto Joint Venture. On December 21, 2018, PT-FI acquired Rio Tinto’s interest in the joint venture and is consolidating 100 percent of the Indonesia operations (refer to Note 2 for discussion of the PT-FI divestment). Pursuant to Rio Tinto’s previous joint venture agreement with PT-FI, Rio Tinto had a 40 percent interest in certain assets and future production exceeding specified annual amounts of copper, gold and silver through 2022 in Block A of PT-FI’s former Contract of Work (COW), and, after 2022, a 40 percent interest in all production from Block A. The amount due Rio Tinto for its share
Sumitomo and SMM Morenci, Inc. FMC owns a 72 percent undivided interest in Morenci via an unincorporated joint venture. The remaining 28 percent is owned by Sumitomo (15 percent) and SMM Morenci, Inc. (13 percent). Each partner takes in kind its share of Morenci’s production. FMC purchased 178 million pounds of Morenci’s copper cathode from Sumitomo and SMM Morenci, Inc. at market prices for $519 million during 2018. FMC had receivables from Sumitomo and SMM Morenci, Inc. totaling $13 million at December 31, 2018, and $18 million at December 31, 2017.
NOTE 4. INVENTORIES, INCLUDING LONG-TERM MILL AND LEACH STOCKPILES
The components of inventories follow:
| | | | | | | | | | | | | | |
| | December 31, | |
| | 2020 | | 2019 | |
| Current inventories: | | | | |
Total materials and supplies, neta | $ | 1,594 | | | $ | 1,649 | | |
| | | | |
| Mill stockpiles | $ | 205 | | | $ | 220 | | |
| Leach stockpiles | 809 | | | 923 | | |
| Total current mill and leach stockpiles | $ | 1,014 | | | $ | 1,143 | | |
| | | | |
| Raw materials (primarily concentrate) | $ | 366 | | | $ | 318 | | |
| Work-in-process | 174 | | | 124 | | |
| Finished goods | 745 | | | 839 | | |
| Total product | $ | 1,285 | | | $ | 1,281 | | |
| | | | |
| Long-term inventories: | | | | |
| Mill stockpiles | $ | 223 | | | $ | 181 | | |
| Leach stockpiles | 1,240 | | | 1,244 | | |
Total long-term mill and leach stockpilesb | $ | 1,463 | | | $ | 1,425 | | |
|
| | | | | | | | |
| | December 31, | |
| | 2018 | | 2017 | |
| Current inventories: | | | | |
Total materials and supplies, neta | $ | 1,528 |
| | $ | 1,323 |
| |
| | | | | |
| Mill stockpiles | $ | 282 |
| | $ | 360 |
| |
| Leach stockpiles | 1,171 |
| | 1,062 |
| |
| Total current mill and leach stockpiles | $ | 1,453 |
| | $ | 1,422 |
| |
| | | | | |
| Raw materials (primarily concentrate) | $ | 260 |
| | $ | 265 |
| |
| Work-in-process | 192 |
| | 154 |
| |
| Finished goods | 1,326 |
| | 985 |
| |
| Total product inventories | $ | 1,778 |
| | $ | 1,404 |
| |
| | | | | |
| Long-term inventories: | | | | |
| Mill stockpiles | $ | 265 |
| | $ | 300 |
| |
| Leach stockpiles | 1,049 |
| | 1,109 |
| |
Total long-term inventoriesb | $ | 1,314 |
| | $ | 1,409 |
| |
| |
a. | Materials and supplies inventory was net of obsolescence reserves totaling $24 million at December 31, 2018, and $29 million at December 31, 2017. |
| |
b. | Estimated metals in stockpiles not expected to be recovered within the next 12 months. |
b.Estimated metals in stockpiles not expected to be recovered within the next 12 months.
FCX recorded charges forNRV inventory adjustments to decrease metals inventory carrying values oftotaling $96 million in 2020, associated with lower market prices for copper ($58 million) and molybdenum ($38 million); $179 million in 2019, associated with lower market prices for molybdenum ($84 million), cobalt ($58 million) and copper ($37 million); and $4 million in 2018, $8 million in 2017 and $36 million in 2016 (primarily2018. Refer to Note 16 for molybdenum inventories).metals inventory adjustments by business segment.
NOTE 5. PROPERTY, PLANT, EQUIPMENT AND MINE DEVELOPMENT COSTS, NET
The components of net property, plant, equipment and mine development costs follow:
| | | | | | | | | | | |
| | December 31, |
| | 2020 | | 2019 |
| Proven and probable mineral reserves | $ | 7,142 | | | $ | 7,087 | |
| VBPP | 376 | | | 465 | |
| Mine development and other | 10,686 | | | 8,180 | |
| Buildings and infrastructure | 9,214 | | | 8,435 | |
| Machinery and equipment | 14,235 | | | 13,312 | |
| Mobile equipment | 4,495 | | | 4,320 | |
| Construction in progress | 1,454 | | | 4,265 | |
| Oil and gas properties | 27,281 | | | 27,293 | |
| Total | 74,883 | | | 73,357 | |
Accumulated depreciation, depletion, and amortizationa | (45,065) | | | (43,773) | |
| Property, plant, equipment and mine development costs, net | $ | 29,818 | | | $ | 29,584 | |
|
| | | | | | | |
| | December 31, |
| | 2018 | | 2017 |
| Proven and probable mineral reserves | $ | 7,089 |
| | $ | 3,974 |
|
| VBPP | 477 |
| | 536 |
|
| Mine development and other | 8,195 |
| | 6,213 |
|
| Buildings and infrastructure | 8,051 |
| | 7,553 |
|
| Machinery and equipment | 12,985 |
| | 12,330 |
|
| Mobile equipment | 4,010 |
| | 3,766 |
|
| Construction in progress | 3,006 |
| | 2,971 |
|
| Oil and gas properties | 27,292 |
| | 27,453 |
|
| Total | 71,105 |
| | 64,796 |
|
Accumulated depreciation, depletion, and amortizationa | (43,095 | ) | | (41,802 | ) |
| Property, plant, equipment and mine development costs, net | $ | 28,010 |
| | $ | 22,994 |
|
| |
a. | Includes accumulated amortization of $27.3 billion and $27.4 billion for oil and gas properties at December 31, 2018 and 2017, respectively. |
a.Includes accumulated amortization for oil and gas properties of $27.3 billion at December 31, 2020 and 2019.
In 2018, FCX recorded $4.6 billion for proven and probable mineral reserves and other property, plant, equipment and mine development costs associated with the acquisition of PT Rio Tinto Indonesia (refer to Note 2 for further discussion).
FCX recorded $1.7$1.6 billion for VBPP in connection with the FMC acquisition in 2007 (excluding $544$634 million associated with mining operations that were subsequently sold) and transferred $59$811 million to proven and probable mineral reserves during 2018 and $752 million prior to 2018 ($112through 2020 (less than $0.1 million in 2017)2020 and NaN in 2019). Cumulative impairments of and adjustments to VBPP total $485$497 million, which were primarily recorded in 2008.
Capitalized interest, which primarily related to FCX’s mining operations’ capital projects, totaled $147 million in 2020, $149 million in 2019 and $96 million in 2018, $121 million in 2017 and $92 million in 2016.2018.
During 20172020 and 2018, FCX concluded there were2019, no events or changes in circumstances that would indicate that the carrying amountmaterial impairments of itsFCX’s long-lived mining assets might not be recoverable.were recorded.
NOTE 6. OTHER ASSETS
The components of other assets follow:
| | | | | | | | | | | |
| | December 31, |
| | 2020 | | 2019 |
Disputed tax assessments:a | | | |
| PT-FI | $ | 143 | | | $ | 178 | |
| Cerro Verde | 190 | | | 187 | |
Long-term receivable for taxesb | 106 | | | 290 | |
Intangible assetsc | 401 | | | 402 | |
| Investments: | | | |
Assurance bondd | 148 | | | 157 | |
PT Smeltinge | 77 | | | 80 | |
| Fixed income, equity securities and other | 70 | | | 66 | |
| | | |
Legally restricted fundsf | 213 | | | 196 | |
Contingent consideration associated with sales of assetsg | 96 | | | 115 | |
| Long-term employee receivables | 19 | | | 22 | |
| Timok transaction receivable (refer to Note 2) | 12 | | | 58 | |
| | | |
| | | |
| | | |
| Other | 85 | | | 134 | |
| Total other assets | $ | 1,560 | | | $ | 1,885 | |
|
| | | | | | | |
| | December 31, |
| | 2018 | | 2017 |
Disputed tax assessments:a | | | |
| PT-FI | $ | 493 |
| | $ | 417 |
|
| Cerro Verde | 183 |
| | 185 |
|
Long-term receivable for taxesb | 260 |
| | 445 |
|
Intangible assetsc | 398 |
| | 307 |
|
| Investments: | | | |
Assurance bondd | 126 |
| | 123 |
|
PT Smeltinge | 125 |
| | 61 |
|
| Fixed income and equity securities | 29 |
| | 30 |
|
| Other | 36 |
| | 48 |
|
Contingent consideration associated with sales of assetsf | 189 |
| | 234 |
|
Legally restricted fundsg | 181 |
| | 189 |
|
| Rio Tinto’s share of ARO | — |
| | 68 |
|
| Long-term employee receivables | 20 |
| | 20 |
|
| Other | 132 |
| | 146 |
|
| Total other assets | $ | 2,172 |
| | $ | 2,273 |
|
| |
a. | Refer to Note 12 for further discussion.
|
| |
b. | Includes tax overpayments and refunds not expected to be realized within the next 12 months (primarily associated with U.S. tax reform, refer to Note 11). |
| |
c. | Indefinite-lived intangible assets totaled $215 million at December 31, 2018 and 2017. Accumulated amortization of definite-lived intangible assets totaled $51 million at December 31, 2018, and $46 million at December 31, 2017.
|
| |
d. | Relates to PT-FI’s commitment for the development of a new smelter in Indonesia (refer to Note 13 for further discussion). |
| |
e. | PT-FI’s 25 percent ownership in PT Smelting (smelter and refinery in Gresik, Indonesia) is recorded using the equity method. Amounts were reduced by unrecognized profits on sales from PT-FI to PT Smelting totaling $11 million at December 31, 2018, and $68 million at December 31, 2017. Trade accounts receivable from PT Smelting totaled $176 million at December 31, 2018, and $308 million at December 31, 2017.
|
| |
f. | Refer to Note 2 for further discussion. |
| |
g. | Includes $180 million at December 31, 2018 and 2017, held in trusts for AROs related to properties in New Mexico (refer to Note 12 for further discussion).
|
a.Refer to Note 12 for further discussion.
b.Includes tax overpayments and refunds not expected to be realized within the next 12 months (refer to Note 11). c.Indefinite-lived intangible assets totaled $215 million at both December 31, 2020, and December 31, 2019. Accumulated amortization of definite-lived intangible assets totaled $32 million at December 31, 2020, and $54 million at December 31, 2019.
d.Relates to PT-FI’s commitment for the development of a new smelter in Indonesia (refer to Note 13 for further discussion).
e.PT-FI’s 25 percent ownership in PT Smelting (smelter and refinery in Gresik, Indonesia) is recorded using the equity method. Amounts were reduced by unrecognized profits on sales from PT-FI to PT Smelting totaling $39 million at December 31, 2020, and $29 million at December 31, 2019. Trade accounts receivable from PT Smelting totaled $265 million at December 31, 2020, and $261 million at December 31, 2019.
f.Includes $212 million at December 31, 2020, and $196 millionat December 31, 2019, held in trusts for AROs related to properties in New Mexico (refer to Note 12 for further discussion).
g.Refer to Note 15 for further discussion.
NOTE 7. ACCOUNTS PAYABLE AND ACCRUED LIABILITIES
The components of accounts payable and accrued liabilities follow:
| | | | | | | | | | | |
| | December 31, |
| | 2020 | | 2019 |
| Accounts payable | $ | 1,473 | | | $ | 1,654 | |
| Salaries, wages and other compensation | 312 | | | 249 | |
Accrued interesta | 243 | | | 178 | |
PT-FI contingenciesb | 196 | | | 115 | |
Pension, postretirement, postemployment and other employee benefitsc | 91 | | | 69 | |
| Legal matters | 86 | | | 88 | |
| Accrued taxes, other than income taxes | 76 | | | 79 | |
| Deferred revenue | 65 | | | 12 | |
Leasesd | 38 | | | 44 | |
| | | |
| | | |
| | | |
| Other | 128 | | | 88 | |
| Total accounts payable and accrued liabilities | $ | 2,708 | | | $ | 2,576 | |
a.Third-party interest paid, net of capitalized interest, was $472 million in 2020, $591 million in 2019 and $500 million in 2018.
b.Refer to Note 12 for further discussion.
c.Refer to Note 9 for long-term portion.
d.Refer to Note 13 for further discussion.
|
| | | | | | | |
| | December 31, |
| | 2018 | | 2017 |
| Accounts payable | $ | 1,661 |
| | $ | 1,546 |
|
| Salaries, wages and other compensation | 273 |
| | 241 |
|
Accrued interesta | 183 |
| | 168 |
|
PT-FI contingenciesb | 162 |
| | — |
|
| Accrued taxes, other than income taxes | 109 |
| | 129 |
|
Pension, postretirement, postemployment and other employee benefitsc | 78 |
| | 114 |
|
| Deferred revenue | 35 |
| | 91 |
|
| Accrued mining royalties | 29 |
| | 68 |
|
| Other | 95 |
| | 140 |
|
| Total accounts payable and accrued liabilities | $ | 2,625 |
| | $ | 2,497 |
|
| |
a. | Third-party interest paid, net of capitalized interest, was $500 million in 2018, $565 million in 2017 and $743 million in 2016. |
| |
b. | Refer to Note 12 for further discussion. |
| |
c. | Refer to Note 9 for long-term portion. |
NOTE 8. DEBT
FCX’s debt at December 31, 2018,2020, included additions of $58$10 million ($9711 million at December 31, 2017)2019) for unamortized fair value adjustments, (primarily from the 2013 oil and gas acquisitions), and is net of reductions of $69$85 million ($8566 million at December 31, 2017)2019) for unamortized net discounts and unamortized debt issuance costs. The components of debt follow:
| | | | | | | | | | | |
| | December 31, |
| | 2020 | | 2019 |
| | | |
| Revolving credit facility | $ | 0 | | | $ | 0 | |
| | | |
| Cerro Verde Term Loan | 523 | | | 826 | |
| | | |
| Senior notes and debentures: | | | |
| Issued by FCX: | | | |
| | | |
| | | |
| | | |
| | | |
| | | |
| | | |
| | | |
| 4.00% Senior Notes due 2021 | 0 | | | 194 | |
| | | |
| 3.55% Senior Notes due 2022 | 523 | | | 1,876 | |
| 3.875% Senior Notes due 2023 | 994 | | | 1,917 | |
| 4.55% Senior Notes due 2024 | 728 | | | 846 | |
| 5.00% Senior Notes due 2027 | 593 | | | 592 | |
| 4.125% Senior Notes due 2028 | 691 | | | 0 | |
| 4.375% Senior Notes due 2028 | 642 | | | 0 | |
| 5.25% Senior Notes due 2029 | 593 | | | 592 | |
| 4.25% Senior Notes due 2030 | 592 | | | 0 | |
| 4.625% Senior Notes due 2030 | 840 | | | 0 | |
| 5.40% Senior Notes due 2034 | 742 | | | 741 | |
| 5.450% Senior Notes due 2043 | 1,845 | | | 1,844 | |
| Issued by FMC: | | | |
71/8% Debentures due 2027 | 115 | | | 115 | |
| 9½% Senior Notes due 2031 | 124 | | | 125 | |
61/8% Senior Notes due 2034 | 117 | | | 117 | |
| | | |
| | | |
| | | |
| | | |
| | | |
| | | |
| | | |
| | | |
| Other | 49 | | | 41 | |
| Total debt | 9,711 | | | 9,826 | |
| Less current portion of debt | (34) | | | (5) | |
| Long-term debt | $ | 9,677 | | | $ | 9,821 | |
|
| | | | | | | |
| | December 31, |
| | 2018 | | 2017 |
| Revolving credit facility | $ | — |
| | $ | — |
|
| Cerro Verde credit facility | 1,023 |
| | 1,269 |
|
| Senior notes and debentures: | | | |
| Issued by FCX: | | | |
| 2.375% Senior Notes due 2018 | — |
| | 1,408 |
|
| 3.100% Senior Notes due 2020 | 999 |
| | 997 |
|
| 4.00% Senior Notes due 2021 | 597 |
| | 596 |
|
| 6.75% Senior Notes due 2022 | — |
| | 427 |
|
| 3.55% Senior Notes due 2022 | 1,886 |
| | 1,884 |
|
67/8% Senior Notes due 2023 | 768 |
| | 776 |
|
| 3.875% Senior Notes due 2023 | 1,915 |
| | 1,914 |
|
| 4.55% Senior Notes due 2024 | 845 |
| | 845 |
|
| 5.40% Senior Notes due 2034 | 741 |
| | 740 |
|
| 5.450% Senior Notes due 2043 | 1,843 |
| | 1,842 |
|
| Issued by FMC: | | | |
71/8% Debentures due 2027 | 115 |
| | 115 |
|
| 9½% Senior Notes due 2031 | 126 |
| | 127 |
|
61/8% Senior Notes due 2034 | 117 |
| | 116 |
|
| Issued by Freeport-McMoRan Oil & Gas LLC (FM O&G LLC): | | | |
67/8% Senior Notes due 2023 | — |
| | 54 |
|
| Other | 166 |
| | 119 |
|
| Total debt | 11,141 |
| | 13,229 |
|
| Less current portion of debt | (17 | ) | | (1,414 | ) |
| Long-term debt | $ | 11,124 |
| | $ | 11,815 |
|
Revolving Credit Facility. At December 31, 2018, there were no2020, FCX had 0 borrowings outstanding and $13$10 million in letters of credit issued under FCX’sits revolving credit facility, resulting in availability of approximately $3.5 billion, of which approximately $1.5 billion could be used for additional letters of credit.
In April 2018, FCX, PT-FI and FM O&G LLC entered into a new $3.5 billion, five-year, unsecured Availability under FCX’s revolving credit facility which replaced FCX’s prior revolving credit facility (scheduled to mature on May 31, 2019). The newconsists of $3.28 billion maturing April 2024 and $220 million maturing April 2023. For PT-FI, $500 million of the revolving credit facility is available until April 20, 2023, with $500 million available to PT-FI, and up to $1.5 billion available in letters of credit, and has a substantially similar structure and terms as the prior revolving credit facility. Interest on loans made under the new revolving credit facility is, at the option of FCX, determined based on the adjusted London Interbank Offered rate (LIBOR) or the alternate base rate (each as defined in the new revolving credit facility) plus a spread to be determined by reference to FCX’s credit ratings.available.
Cerro Verde Credit Facility. In March 2014, Cerro Verde entered into a five-year, $1.8 billion senior unsecured credit facility that is nonrecourse to FCX and the other shareholders of Cerro Verde. In June 2017, Cerro Verde’s credit facility was amended (balance outstanding at the time of amendment was $1.275 billion) to increase the commitment by $225 million to $1.5 billion, to modify the amortization schedule and to extend the maturity date to June 19, 2022. The amended credit facility amortizes in four installments, with $225 million due on December 31, 2020 (of which $5 million was prepaid during 2018 and $220 million was prepaid during 2017), $225 million due on June 30, 2021 (which was fully prepaid during 2018), $525 million due on December 31, 2021 (of which $20 million was prepaid during 2018), and the remaining balance due on the maturity date of June 19, 2022. All other terms, including the interest rates, remain the same. Interest under the term loan is based on LIBOR plus a spread based on Cerro Verde’s total net debt to earnings before interest, taxes, depreciation and amortization (EBITDA) ratio as defined in the agreement. The interest rate on Cerro Verde’s credit facility was 4.42 percent at December 31, 2018.
Cerro Verde Shareholder Loans. In December 2014, Cerro Verde entered into loan agreements with three of its shareholders for borrowings up to $800 million. In June 2017, Cerro Verde used the proceeds from its amended credit facility plus available cash to repay the balance of its outstanding shareholder loans. The remaining availability for borrowings under these agreements totals $200 million.
Senior Notes issued by FCX. In December 2016, FCX completed an exchange offer and consent solicitation associated with FM O&G LLC senior notes. Holders representing 89 percent of the outstanding FM O&G LLC senior notes tendered their notes and received new FCX senior notes. Each series of newly issued FCX senior notes have an interest rate that is identical to the interest rate of the applicable series of FM O&G LLC senior notes. The newly issued FCX senior notes are senior unsecured obligations of FCX and rank equally in right of payment with all other existing and future senior unsecured indebtedness of FCX. A summary of the tenders follows:
|
| | | | | | | | | | | |
| | Principal Amount Outstanding | | Principal Amount Tendered | | Book Value of New FCX Senior Notes |
| 6.125% Senior Notes due 2019 | $ | 237 |
| | $ | 179 |
| | $ | 186 |
|
| 6½% Senior Notes due 2020 | 617 |
| | 552 |
| | 583 |
|
| 6.625% Senior Notes due 2021 | 261 |
| | 228 |
| | 242 |
|
| 6.75% Senior Notes due 2022 | 449 |
| | 404 |
| | 432 |
|
67/8% Senior Notes due 2023 | 778 |
| | 728 |
| | 785 |
|
| | $ | 2,342 |
| | $ | 2,091 |
| | $ | 2,228 |
|
The principal amounts were increased by $151 million to reflect the remaining unamortized acquisition-date fair market value adjustments associated with the 2013 oil and gas acquisitions. In addition, FCX paid $14 million in cash consideration for FM O&G LLC’s senior notes that were tendered, which reduced the book value of the new FCX senior notes. All of these senior notes, except the 6.75% Senior Notes due 2022 and the 67/8% Senior Notes due 2023, were redeemed during 2017 and the 6.75% Senior Notes due 2022 were redeemed during 2018 (refer to Early Extinguishment and Exchanges of Debt in this note). The 67/8% Senior Notes due 2023 are redeemable in whole or in part, at the option of FCX, at a make-whole redemption price prior to February 15, 2020, and at a specified redemption price thereafter. As of December 31, 2018, the book value of these senior notes totaled $768 million, which reflects the remaining unamortized acquisition-date fair market value adjustments ($46 million) and the cash consideration ($6 million) that are being amortized over the term of these senior notes and recorded as a net reduction of interest expense.
In November 2014, FCX sold $750 million of 2.30% Senior Notes due 2017 (which matured and were repaid in 2017), $600 million of 4.00% Senior Notes due 2021, $850 million of 4.55% Senior Notes due 2024 and $800 million of 5.40% Senior Notes due 2034 for total net proceeds of $2.97 billion.
In March 2013, in connection with the financing of the 2013 oil and gas acquisitions, FCX issued $6.5 billion of unsecured senior notes in four tranches. FCX sold $1.5 billion of 2.375% Senior Notes due March 2018 (which matured and were repaid in 2018), $1.0 billion of 3.100% Senior Notes due March 2020, $2.0 billion of 3.875% Senior Notes due March 2023 and $2.0 billion of 5.450% Senior Notes due March 2043 for total net proceeds of $6.4 billion.
In February 2012, FCX sold $500 million of 2.15% Senior Notes due 2017 (which matured and were repaid in 2017) and $2.0 billion of 3.55% Senior Notes due 2022 for total net proceeds of $2.47 billion.
The 3.100% Senior Notes due 2020 and 4.00% Senior Notes due 2021 are redeemable in whole or in part, at the option of FCX, at a make-whole redemption price. The senior notes listed below are redeemable in whole or in part, at the option of FCX, at a make-whole redemption price prior to the dates stated below, and beginning on the dates stated below at 100 percent of principal.
|
| | |
Debt Instrument | | Date |
3.55% Senior Notes due 2022 | | December 1, 2021 |
3.875% Senior Notes due 2023 | | December 15, 2022 |
4.55% Senior Notes due 2024 | | August 14, 2024 |
5.40% Senior Notes due 2034 | | May 14, 2034 |
5.450% Senior Notes due 2043 | | September 15, 2042 |
These senior notes rank equally with FCX’s other existing and future unsecured and unsubordinated indebtedness.
Early Extinguishment and Exchanges of Debt. During 2018, FCX redeemed in full certain senior notes, and holders received the principal amounts together with the redemption premiums and accrued and unpaid interest up to the redemption date. A summary of these redemptions follows:
|
| | | | | | | | | | | | | | | | | | | |
| | | | | | | | | | |
| | Principal Amount | | Net Adjustments | | Book Value | | Redemption Value | | Gain |
| FCX 6.75% Senior Notes due 2022 | $ | 404 |
| | $ | 22 |
| | $ | 426 |
| | $ | 418 |
| | $ | 8 |
|
FM O&G LLC 67/8% Senior Notes due 2023 | 50 |
| | 4 |
| | 54 |
| | 52 |
| | 2 |
|
| | $ | 454 |
| | $ | 26 |
| | $ | 480 |
| | $ | 470 |
| | $ | 10 |
|
Partially offsetting the $10 million gain were losses of $3 million, primarily associated with Cerro Verde’s prepayments in 2018 and entering into the new revolving credit facility in April 2018.
During 2017, FCX redeemed in full or purchased in open-market transactions certain senior notes. A summary of these debt extinguishments follows:
|
| | | | | | | | | | | | | | | | | | | |
| | Principal Amount | | Net Adjustments | | Book Value | | Redemption Value | | Gain |
| 2.375% Senior Notes due 2018 | $ | 74 |
| | $ | — |
| | $ | 74 |
| | $ | 74 |
| | $ | — |
|
| FCX 6.125% Senior Notes due 2019 | 179 |
| | 5 |
| | 184 |
| | 182 |
| | 2 |
|
| FM O&G LLC 6.125% Senior Notes due 2019 | 58 |
| | 2 |
| | 60 |
| | 59 |
| | 1 |
|
| FCX 6½% Senior Notes due 2020 | 552 |
| | 23 |
| | 575 |
| | 562 |
| | 13 |
|
| FM O&G LLC 6½% Senior Notes due 2020 | 65 |
| | 3 |
| | 68 |
| | 66 |
| | 2 |
|
| FCX 6.625% Senior Notes due 2021 | 228 |
| | 12 |
| | 240 |
| | 234 |
| | 6 |
|
| FM O&G LLC 6.625% Senior Notes due 2021 | 33 |
| | 2 |
| | 35 |
| | 34 |
| | 1 |
|
| FM O&G LLC 6.750% Senior Notes due 2022 | 45 |
| | 2 |
| | 47 |
| | 46 |
| | 1 |
|
| | $ | 1,234 |
| | $ | 49 |
| | $ | 1,283 |
| | $ | 1,257 |
| | $ | 26 |
|
Partially offsetting the $26 million gain was a net loss of $5 million, primarily associated with the modification of Cerro Verde’s credit facility in June 2017 and Cerro Verde’s prepayment in December 2017.
During 2016, FCX redeemed certain senior notes in exchange for its common stock (refer to Note 10 for further discussion) and purchased certain senior notes in open-market transactions. A summary of these transactions follows:
|
| | | | | | | | | | | | | | | | | | | |
| | Principal Amount | | Net Adjustments | | Book Value | | Redemption Value | | Gain |
| | | | | | | | | | |
| 2.30% Senior Notes due 2017 | $ | 20 |
| | $ | — |
| | $ | 20 |
| | $ | 20 |
| | $ | — |
|
| 2.375% Senior Notes due 2018 | 18 |
| | — |
| | 18 |
| | 18 |
| | — |
|
| 3.55% Senior Notes due 2022 | 108 |
| | (1 | ) | | 107 |
| | 96 |
| | 11 |
|
| 3.875% Senior Notes due 2023 | 77 |
| | — |
| | 77 |
| | 68 |
| | 9 |
|
| 5.40% Senior Notes due 2034 | 50 |
| | (1 | ) | | 49 |
| | 41 |
| | 8 |
|
| 5.450% Senior Notes due 2043 | 134 |
| | (2 | ) | | 132 |
| | 106 |
| | 26 |
|
| | $ | 407 |
| | $ | (4 | ) | | $ | 403 |
| | $ | 349 |
| | $ | 54 |
|
Partially offsetting the $54 million gain was $28 million in losses, primarily related to deferred debt issuance costs for an unsecured bank term loan that was repaid and costs associated with the December 2016 senior note exchange offer and consent solicitation.
Guarantees. Refer to Note 17 for a discussion of FCX’s senior notes guaranteed by FM O&G LLC.
Restrictive Covenants.FCX’s revolving credit facility contains customary affirmative covenants and representations, and also contains a number of negative covenants that, among other things, restrict, subject to certain exceptions, the ability of FCX’s subsidiaries that are not borrowers or guarantors to incur additional indebtedness (including guarantee obligations) and FCX’s or its subsidiaries’ abilities to: create liens on assets; enter into sale and leaseback transactions; engage in mergers, liquidations and dissolutions; and sell assets. FCX’s revolving credit facility also contains financial ratios governing maximum total leverage and minimum interest expense coverage. FCX’s
In June 2020, FCX, PT-FI and Freeport-McMoRan Oil & Gas LLC (FM O&G LLC) amended the $3.5 billion, unsecured revolving credit facility. The key changes under the amendment include (i) suspension of the total leverage ratio (ratio of total debt to consolidated EBITDA,earnings before interest, taxes, depreciation and amortization (EBITDA), as defined in the credit agreement) cannot exceedthrough June 30, 2021, followed by a limit of 5.25x beginning with the quarter ended September 30, 2021, and stepping down to 3.75x beginning January 1, 2022; and (ii) a reduction in the minimum interest expense coverage ratio (ratio of consolidated EBITDA to consolidated cash interest expense, as defined in the credit agreement) is 2.25x. FCX’s senior notes contain limitationsto a minimum of 2.00x through December 31, 2021, reverting to 2.25x beginning January 1, 2022. FCX also agreed to a minimum liquidity covenant of $1 billion (consisting of consolidated unrestricted cash and availability under the revolving credit facility) applicable to each quarter through June 30, 2021, and additional restrictions on liens.priority debt and liens, and the payment of common stock dividends through December 31, 2021. At December 31, 2018,2020, FCX was in compliance with all of its covenants.
As further discussed in Note 10, in February 2021, the FCX Board of Directors (the Board) reinstated a cash dividend on FCX’s common stock. Prior to the Board’s declaration of the initial quarterly dividend, FCX will deliver a covenant reversion notice, at which time the financial covenants and other restrictions, including the dividend restriction, will revert to the limits applicable prior to the June 2020 amendment.
Interest on loans made under the revolving credit facility is, at the option of FCX, determined based on the adjusted London Interbank Offered rate (LIBOR) or the alternate base rate (each as defined in the revolving credit facility) plus a spread to be determined by reference to FCX’s credit ratings.
Certain of FCX’s debt agreements, including our revolving credit facility, reference LIBOR and other interbank offered rates, which are being phased out and replaced with alternative reference rates. FCX does not expect the transition from LIBOR and other interbank offered rates to have a material impact on its consolidated financial results.
Cerro Verde Term Loan. Repayments of the Cerro Verde Term Loan totaled $305 million in 2020, $200 million in 2019 and $470 million in 2018, with the remaining balance of $525 million due on the maturity date of June 19, 2022. Interest under the Term Loan is based on LIBOR plus a spread based on Cerro Verde’s total net debt to EBITDA ratio as defined in the agreement. The interest rate on Cerro Verde’s Term Loan was 2.05 percent at December 31, 2020.
FCX recorded net losses of $1 million in 2020, $1 million in 2019 and $3 million in 2018, associated with Cerro Verde’s prepayments on its Term Loan.
Cerro Verde Shareholder Loans. In December 2014, Cerro Verde entered into loan agreements with three of its shareholders for borrowings up to $800 million. NaN amounts were outstanding at December 31, 2020 and 2019, and availability under these agreements totals $200 million at December 31, 2020.
Senior Notes. In July 2020, FCX completed the sale of $650 million of 4.375% Senior Notes due 2028 and $850 million of 4.625% Senior Notes due 2030 for proceeds, net of underwriting fees, totaling $1.485 billion. Interest on these senior notes is payable semiannually on February 1 and August 1 of each year. FCX used $1.4 billion of the net proceeds from this offering to purchase a portion of its outstanding 3.55% Senior Notes due 2022, 3.875% Senior Notes due 2023 and 4.55% Senior Notes due 2024, and the payment of accrued and unpaid interest, premiums, fees and expenses in connection with these transactions. The remaining net proceeds from this offering were used for general corporate purposes.
In March 2020, FCX completed the sale of $700 million of 4.125% Senior Notes due 2028 and $600 million of 4.25% Senior Notes due 2030 for proceeds, net of underwriting fees, totaling $1.285 billion. Interest on these senior notes is payable semiannually on March 1 and September 1 of each year. FCX used a portion of the net proceeds from this offering to purchase a portion of its 4.00% Senior Notes due 2021 and its 3.55% Senior Notes due 2022 and the payment of accrued and unpaid interest, premiums, fees and expenses in connection with these transactions. In April 2020, FCX used the remaining net proceeds to fund the make-whole redemption of all of its remaining 4.00% Senior Notes due 2021 and the payment of accrued and unpaid interest, premiums, fees and expenses in connection with the transaction.
In August 2019, FCX sold $600 million of 5.00% Senior Notes due 2027 and $600 million of 5.25% Senior Notes due 2029 for total net proceeds of $1.187 billion. Interest on these senior notes is payable semiannually on March 1 and September 1 of each year. FCX used the net proceeds from this offering to fund the make-whole redemption of all of its outstanding 6.875% Senior Notes due 2023, and the concurrent tender offers to purchase a portion of its 4.00% Senior Notes due 2021 and its 3.55% Senior Notes due 2022, and the payment of accrued and unpaid interest, premiums, fees and expenses in connection with these transactions.
During 2020, 2019 and 2018, FCX redeemed in full or purchased a portion of the following senior notes.
| | | | | | | | | | | | | | | | | | | | | | | | | | | | | |
| | | | | | | | | |
| Principal Amount | | Net Adjustments | | Book Value | | Redemption/Tender Value | | Loss/(Gain) |
| Year Ended December 31, 2020 | | | | | | | | | |
| FCX 4.00% Senior Notes due 2021 | $ | 195 | | | $ | (1) | | | $ | 194 | | | $ | 205 | | | $ | 11 | |
| FCX 3.55% Senior Notes due 2022 | 1,356 | | | (6) | | | 1,350 | | | 1,391 | | | 41 | |
| FCX 3.875% Senior Notes due 2023 | 927 | | | (4) | | | 923 | | | 964 | | | 41 | |
| FCX 4.55% Senior Notes due 2024 | 120 | | | (1) | | | 119 | | | 126 | | | 7 | |
| Total | $ | 2,598 | | | $ | (12) | | | $ | 2,586 | | | $ | 2,686 | | | $ | 100 | |
| | | | | | | | | | | | | | | | | | | | | | | | | | | | | |
| | | | | | | | | |
| | | | | | | | | |
| Year Ended December 31, 2019 | | | | | | | | | |
| FCX 3.100% Senior Notes due 2020 | $ | 1,000 | | | $ | (2) | | | $ | 998 | | | $ | 1,003 | | | $ | 5 | |
| FCX 6.875% Senior Notes due 2023 | 728 | | | 34 | | | 762 | | | 768 | | | 6 | |
| FCX 4.00% Senior Notes due 2021 | 405 | | | (2) | | | 403 | | | 418 | | | 15 | |
| FCX 3.55% Senior Notes due 2022 | 12 | | | 0 | | | 12 | | | 12 | | | 0 | |
| Total | $ | 2,145 | | | $ | 30 | | | $ | 2,175 | | | $ | 2,201 | | | $ | 26 | |
| | | | | | | | | | | | | | | | | | | | | | | | | | | | | |
| Year Ended December 31, 2018 | | | | | | | | | |
| FCX 6.75% Senior Notes due 2022 | $ | 404 | | | $ | 22 | | | $ | 426 | | | $ | 418 | | | $ | (8) | |
FM O&G LLC 67/8% Senior Notes due 2023 | 50 | | | 4 | | | 54 | | | 52 | | | (2) | |
| Total | $ | 454 | | | $ | 26 | | | $ | 480 | | | $ | 470 | | | $ | (10) | |
The senior notes listed below are redeemable in whole or in part, at the option of FCX, at a make-whole redemption price prior to the dates stated below, at specified redemption prices beginning on the dates stated below and at 100 percent of principal two years before maturity.
| | | | | | | | |
| Debt Instrument | | Date |
| 5.00% Senior Notes due 2027 | | September 1, 2022 |
| 4.125% Senior Notes due 2028 | | March 1, 2023 |
| 4.375% Senior Notes due 2028 | | August 1, 2023 |
| 5.25% Senior Notes due 2029 | | September 1, 2024 |
| 4.25% Senior Notes due 2030 | | March 1, 2025 |
| 4.625% Senior Notes due 2030 | | August 1, 2025 |
The senior notes listed below are redeemable in whole or in part, at the option of FCX, at a make-whole redemption price prior to the dates stated below, and beginning on the dates stated below at 100 percent of principal.
| | | | | | | | |
| Debt Instrument | | Date |
| 3.55% Senior Notes due 2022 | | December 1, 2021 |
| 3.875% Senior Notes due 2023 | | December 15, 2022 |
| 4.55% Senior Notes due 2024 | | August 14, 2024 |
| 5.40% Senior Notes due 2034 | | May 14, 2034 |
| 5.450% Senior Notes due 2043 | | September 15, 2042 |
FCX’s senior notes contain limitations on liens and rank equally with FCX’s other existing and future unsecured and unsubordinated indebtedness.
Guarantees. All of the senior notes issued by FCX are fully and unconditionally guaranteed on a senior basis jointly and severally by FM O&G LLC, as guarantor, which is a 100-percent-owned subsidiary of FM O&G and FCX.
Maturities. Maturities of debt instruments based on the principal amounts and terms outstanding at December 31, 2018,2020, total $17$36 million in 2019,2021, $1.05 billion in 2022, $1.0 billion in 2020, $1.12023, $730 million in 2024, NaN in 2025 and 2026 and $7.0 billion in 2021, $2.4 billion in 2022, $2.7 billion in 2023 and $3.9 billion thereafter.
NOTE 9. OTHER LIABILITIES, INCLUDING EMPLOYEE BENEFITS
The components of other liabilities follow:
| | | | | | | | | | | |
| | December 31, |
| | 2020 | | 2019 |
Pension, postretirement, postemployment and other employment benefitsa | $ | 1,213 | | | $ | 1,318 | |
| Cerro Verde royalty dispute | 376 | | | 502 | |
| Provision for tax positions | 261 | | | 255 | |
| | | |
| | | |
| | | |
| | | |
Leasesb | 190 | | | 204 | |
| Other | 229 | | | 212 | |
| Total other liabilities | $ | 2,269 | | | $ | 2,491 | |
|
| | | | | | | |
| | December 31, |
| | 2018 | | 2017 |
Pension, postretirement, postemployment and other employment benefitsa | $ | 1,174 |
| | $ | 1,154 |
|
| Cerro Verde royalty dispute | 631 |
| | 368 |
|
| Provision for tax positions | 230 |
| | 291 |
|
| Other | 195 |
| | 199 |
|
| Total other liabilities | $ | 2,230 |
| | $ | 2,012 |
|
| |
a.
| Refer to Note 7 for current portion.
|
b.Refer to Note 13 for further discussion.
Pension Plans. Following is a discussion of FCX’s pension plans.
FMC Plans. FMC has U.S. trusteed, non-contributory pension plans covering substantially all of itssome U.S. employees and some employees of its international subsidiaries hired before 2007. The applicable FMC plan design determines the manner in which benefits are calculated for any particular group of employees. Benefits are calculated based on final average monthly compensation and years of service or based on a fixed amount for each year of service. Non-bargained FMC employees hired after December 31, 2006, are not eligible to participate in the FMC U.S. pension plan. See below for discussion of a 2020 plan amendment.
FCX’s funding policy for these plans provides that contributions to pension trusts shall be at least equal to the minimum funding requirements of the Employee Retirement Income Security Act of 1974, as amended, for U.S. plans; or, in the case of international plans, the minimum legal requirements that may be applicable in the various countries. Additional contributions also may be made from time to time.
FCX’s policy for determining asset-mix targets for the FMC plan assets held in a master trust (Master Trust) includes the periodic development of asset allocation studies and review of the liabilities to determine expected long-term rates of return and expected risk for various investment portfolios. FCX’s retirement plan administration and investment committee considers these studies in the formal establishment of asset-mix targets defined in the investment policy. FCX’s investment objective emphasizes diversification through both the allocation of the Master Trust assets among various asset classes and the selection of investment managers whose various styles are fundamentally complementary to one another and serve to achieve satisfactory rates of return. Diversification, by asset class and by investment manager, is FCX’s principal means of reducing volatility and exercising prudent investment judgment. FCX’s present target asset allocation approximates 4140 percent equity investments (primarily globaldeveloped market equities), 5152 percent fixed income (primarily long-term treasury STRIPS or “separate trading or registered interest and principal securities”; long-term U.S. treasury/agency bonds; global fixed income securities; long-term, high-credit quality corporate bonds; high-yield and emerging markets fixed income securities; and fixed income debt securities) and 8 percent alternative investments (private real estate, real estate investment trusts and private equity).
The expected rate of return on plan assets is evaluated at least annually, taking into consideration asset allocation, historical and expected future performance on the types of assets held in the Master Trust, and the current economic environment. Based on these factors, FCX expects the pension assets will earn an average of 6.55.25 percent per annum beginning January 1, 2019. The 6.5 percent estimation2021, which was based on a passive return on a compound basis of 6.0 percent and a premium for active management of 0.5 percent reflecting the target asset allocation and current investment array.long-term capital market return expectations.
For estimation purposes, FCX assumes the long-term asset mix for these plans generally will be consistent with the current mix. Changes in the asset mix could impact the amount of recorded pension costs, the funded status of the plans and the need for future cash contributions. A lower-than-expected return on assets also would decrease plan assets and increase the amount of recorded pension costs in future years. When calculating the expected return on plan assets, FCX uses the market value of assets.
Among the assumptions used to estimate the pension benefit obligation is a discount rate used to calculate the present value of expected future benefit payments for service to date. The discount rate assumption for FCX’s U.S. plans is designed to reflect yields on high-quality, fixed-income investments for a given duration. The determination of the discount rate for these plans is based on expected future benefit payments for service to date together with the Mercer Pension DiscountYield Curve - Above Mean Yield.Mean. The Mercer Pension DiscountYield Curve - Above Mean Yield is constructed from the bonds in the Mercer Pension Discount Curve that have a yield higher than the regression mean yield curve. The Mercer Pension DiscountYield Curve - Above Mean consists of spot (i.e., zero coupon) interest rates at one-half-year increments for each of the next 30 years and is developed based on pricing and yield information for high-quality corporate bonds. Changes in the discount rate are reflected in FCX’s benefit obligation and, therefore, in future pension costs.
SERP Plan. FCX has an unfunded Supplemental Executive Retirement Plan (SERP) for its chief executive officer. The SERP provides for retirement benefits payable in the form of a joint and survivor annuity, life annuity or an equivalent lump sum, which is determined on January 1 of the year in which the participant completed 25 years of credited service. The annuity will equal a percentage of the participant’s highest average compensation for any consecutive three-year period during the five years immediately preceding the completion of 25 years of credited service. The SERP benefit will be reduced by the value of all benefits from current and former retirement plans (qualified and nonqualified) sponsored by FCX, by FM Services Company, FCX’s wholly owned subsidiary, or by any predecessor employer (including FCX’s former parent company), except for benefits produced by accounts funded exclusively by deductions from the participant’s pay.
PT-FI Plan. PT-FI has a defined benefit pension plan denominated in IndonesianIndonesia rupiah covering substantially all of its IndonesianIndonesia national employees. PT-FI funds the plan and invests the assets in accordance with IndonesianIndonesia pension guidelines. The pension obligation was valued at an exchange rate of 14,40914,034 rupiah to one U.S. dollar on December 31, 2018,2020, and 13,48013,832 rupiah to one U.S. dollar on December 31, 2017. Indonesian2019. Indonesia labor laws require that companies provide a minimum level of benefits to employees upon employment termination based on the reason for termination and the employee’s years of service. PT-FI’s pension benefit obligation includes benefits related todetermined in accordance with this law. PT-FI’s expected rate of return on plan assets is evaluated at least annually, taking into consideration its long-range estimated return for the plan based on the asset mix. Based on these factors, PT-FI expects its pension assets will earn an average of 7.75 percent per annum beginning January 1, 2019.2021. The discount rate assumption for PT-FI’s plan is based on the Mercer Indonesian zero coupon bond yield curve derived from the IndonesianIndonesia Government Security Yield Curve. Changes in the discount rate are reflected in PT-FI’s benefit obligation and, therefore, in future pension costs.
Plan Information. FCX uses a measurement date of December 31 for its plans. Information for thosequalified and non-qualified plans where the projected benefit obligations and the accumulated benefit obligations exceed the fair value of plan assets follows:
| | | | | | | | | | | |
| | December 31, |
| | 2020 | | 2019 |
| Projected benefit obligation | $ | 2,666 | | | $ | 2,522 | |
| Accumulated benefit obligation | 2,664 | | | 2,361 | |
| Fair value of plan assets | 1,884 | | | 1,615 | |
|
| | | | | | | |
| | December 31, |
| | 2018 | | 2017 |
| Projected benefit obligation | $ | 2,177 |
| | $ | 2,287 |
|
| Accumulated benefit obligation | 2,048 |
| | 2,163 |
|
| Fair value of plan assets | 1,373 |
| | 1,521 |
|
Information on the qualified and non-qualified FCX (FMC and SERP plans) and PT-FI plans as of December 31 follows:
| | | | | | | | | | | | | | | | | | | | | | | |
| FCX | | PT-FI |
| | 2020 | | 2019 | | 2020 | | 2019 |
| Change in benefit obligation: | | | | | | | |
| Benefit obligation at beginning of year | $ | 2,576 | | | $ | 2,230 | | | $ | 217 | | | $ | 220 | |
| Service cost | 37 | | | 42 | | | 11 | | | 12 | |
| Interest cost | 77 | | | 95 | | | 14 | | | 17 | |
| Actuarial losses (gains) | 308 | | | 328 | | | 12 | | | (27) | |
| | | | | | | |
| Foreign exchange losses (gains) | 1 | | | 1 | | | (2) | | | 8 | |
| Curtailment | (154) | | | 0 | | | 0 | | | 0 | |
| | | | | | | |
| Benefits and administrative expenses paid | (123) | | | (120) | | | (14) | | | (13) | |
| Benefit obligation at end of year | 2,722 | | | 2,576 | | | 238 | | | 217 | |
| | | | | | | |
| Change in plan assets: | | | | | | | |
| Fair value of plan assets at beginning of year | 1,677 | | | 1,433 | | | 254 | | | 238 | |
| Actual return on plan assets | 272 | | | 289 | | | 13 | | | 19 | |
Employer contributionsa | 119 | | | 74 | | | 2 | | | 0 | |
| | | | | | | |
| Foreign exchange gains (losses) | 1 | | | 1 | | | (4) | | | 10 | |
| Benefits and administrative expenses paid | (123) | | | (120) | | | (14) | | | (13) | |
| Fair value of plan assets at end of year | 1,946 | | | 1,677 | | | 251 | | | 254 | |
| Funded status | $ | (776) | | | $ | (899) | | | $ | 13 | | | $ | 37 | |
| | | | | | | |
| Accumulated benefit obligation | $ | 2,719 | | | $ | 2,414 | | | $ | 194 | | | $ | 175 | |
| | | | | | | |
| Weighted-average assumptions used to determine benefit obligations: | | | | | | | |
| | | | | | | |
| Discount rate | 2.50 | % | | 3.40 | % | | 6.25 | % | | 7.25 | % |
| Rate of compensation increase | 0 | % | | 3.25 | % | | 4.00 | % | | 4.00 | % |
| | | | | | | |
| Balance sheet classification of funded status: | | | | | | | |
| Other assets | $ | 7 | | | $ | 8 | | | $ | 13 | | | $ | 37 | |
| Accounts payable and accrued liabilities | (4) | | | (4) | | | 0 | | | 0 | |
| Other liabilities | (779) | | | (903) | | | 0 | | | 0 | |
| Total | $ | (776) | | | $ | (899) | | | $ | 13 | | | $ | 37 | |
|
| | | | | | | | | | | | | | | |
| | FCX | | PT-FI |
| | 2018 | | 2017 | | 2018 | | 2017 |
| Change in benefit obligation: | | | | | | | |
| Benefit obligation at beginning of year | $ | 2,343 |
| | $ | 2,135 |
| | $ | 240 |
| | $ | 374 |
|
| Service cost | 44 |
| | 44 |
| | 13 |
| | 20 |
|
| Interest cost | 84 |
| | 91 |
| | 14 |
| | 23 |
|
| Actuarial (gains) losses | (124 | ) | | 188 |
| | (19 | ) | | (61 | ) |
| Plan amendments | 4 |
| | — |
| | — |
| | — |
|
| Foreign exchange (gains) losses | (1 | ) | | 3 |
| | (15 | ) | | (2 | ) |
Curtailmenta | — |
| | — |
| | — |
| | (62 | ) |
| Benefits and administrative expenses paid | (120 | ) | | (118 | ) | | (13 | ) | | (52 | ) |
| Benefit obligation at end of year | 2,230 |
| | 2,343 |
| | 220 |
| | 240 |
|
| | | | | | | | |
| Change in plan assets: | | | | | | | |
| Fair value of plan assets at beginning of year | 1,588 |
| | 1,329 |
| �� | 269 |
| | 284 |
|
| Actual return on plan assets | (104 | ) | | 230 |
| | (5 | ) | | 11 |
|
Employer contributionsb | 70 |
| | 145 |
| | 4 |
| | 28 |
|
| Foreign exchange (losses) gains | (1 | ) | | 2 |
| | (17 | ) | | (2 | ) |
Benefits and administrative expenses paid
| (120 | ) | | (118 | ) | | (13 | ) | | (52 | ) |
| Fair value of plan assets at end of year | 1,433 |
| | 1,588 |
| | 238 |
| | 269 |
|
| Funded status | $ | (797 | ) | | $ | (755 | ) | | $ | 18 |
| | $ | 29 |
|
| | | | | | | | |
| Accumulated benefit obligation | $ | 2,101 |
| | $ | 2,218 |
| | $ | 181 |
| | $ | 194 |
|
| | | | | | | | |
| Weighted-average assumptions used to determine benefit obligations: | | | | | | | |
| Discount rate | 4.40 | % | | 3.70 | % | | 8.25 | % | | 6.75 | % |
| Rate of compensation increase | 3.25 | % | | 3.25 | % | | 4.00 | % | | 4.00 | % |
| | | | | | | | |
| Balance sheet classification of funded status: | | | | | | | |
| Other assets | $ | 7 |
| | $ | 11 |
| | $ | 18 |
| | $ | 29 |
|
| Accounts payable and accrued liabilities | (4 | ) | | (4 | ) | | — |
| | — |
|
| Other liabilities | (800 | ) | | (762 | ) | | — |
| | — |
|
| Total | $ | (797 | ) | | $ | (755 | ) | | $ | 18 |
| | $ | 29 |
|
| |
a. | Resulted from the 2017 PT-FI reductions in workforce (refer to Restructuring Charges in this note for further discussion). |
| |
b. | Employer contributions for 2019 are expected to approximate $74 million for the FCX plans and $2 million for the PT-FI plan (based on a December 31, 2018, exchange rate of 14,409 Indonesian rupiah to one U.S. dollar).
|
a.Employer contributions for 2021 are expected to approximate $64 million for the FCX plans and $2 million for the PT-FI plan (based on a December 31, 2020, exchange rate of 14,034 Indonesia rupiah to one U.S. dollar).
In August 2020, the FMC Retirement Plan, the largest FMC plan, was amended such that, effective September 1, 2020, participants no longer accrue any additional benefits under the FMC Retirement Plan. As a result, FCX remeasured its pension assets and benefit obligation as of July 31, 2020. The discount rate and expected long-term rate of return on the plan assets used for the July 31, 2020, remeasurement were 2.40 percent and 6.25 percent, respectively. The rate of compensation increase was unchanged (3.25 percent). The remeasurement and curtailment resulted in the projected benefit obligation increasing by $184 million and plan assets increasing by $103 million. In addition, FCX recognized a curtailment loss of $4 million in third-quarter 2020.
During 2018,2020, the actuarial gainloss of $124$308 million for the FCX pension plans primarily resulted from the increasedecrease in the discount rate from 3.703.40 percent to 4.402.50 percent,($205 million), partially offset by new census data incorporated into the valuations ($33 million) and updated demographic assumptions ($49 million) mainly resulting from mortality updates. FMC Retirement Plan amendment to discontinue additional benefits. During 2017,2019, the actuarial loss of $188$328 million for the FCX pension plans primarily resulted from the decrease in the discount rate from 4.40 percent to 3.70 percentand the update to3.40 percent.
During 2020, the actuarial basis for lump sum conversions.
During 2018, the actuarial gainloss of $19$12 million for the PT-FI pension plan primarily resulted from the increasedecrease in the discount rate from 6.757.25 percent to 8.25 percent and demographic experience gains.6.25 percent. During 2017,2019, the actuarial gain of $61$27 million for the PT-FI pension plan primarily resulted primarily because of the workforce reduction during 2017, experience gains andfrom a declinechange in the rate of compensation increase,estimated plan administration costs, partially offset by thea decrease in the discount rate from 8.25 percent to 6.757.25 percent.
The weighted-average assumptions used to determine net periodic benefit cost and the components of net periodic benefit cost for FCX’s pension plans for the years ended December 31 follow:
| | | | | | | | | | | | | | | | | |
| | 2020 | | 2019 | | 2018 |
Weighted-average assumptions:a | | | | | |
| Discount rate | 2.98 | % | | 4.40 | % | | 3.70 | % |
| Expected return on plan assets | 6.25 | % | | 6.50 | % | | 6.50 | % |
| Rate of compensation increase | 3.25 | % | | 3.25 | % | | 3.25 | % |
| | | | | |
| Service cost | $ | 37 | | | $ | 42 | | | $ | 44 | |
| Interest cost | 77 | | | 95 | | | 84 | |
| Expected return on plan assets | (105) | | | (90) | | | (101) | |
| | | | | |
| Amortization of net actuarial losses | 45 | | | 48 | | | 49 | |
| Curtailment loss | 4 | | | 0 | | | 0 | |
| Net periodic benefit cost | $ | 58 | | | $ | 95 | | | $ | 76 | |
|
| | | | | | | | | | | |
| | 2018 | | 2017 | | 2016 |
Weighted-average assumptions:a | | | | | |
| Discount rate | 3.70 | % | | 4.40 | % | | 4.60 | % |
| Expected return on plan assets | 6.50 | % | | 7.00 | % | | 7.25 | % |
| Rate of compensation increase | 3.25 | % | | 3.25 | % | | 3.25 | % |
| | | | | | |
| Service cost | $ | 44 |
| | $ | 44 |
| | $ | 27 |
|
| Interest cost | 84 |
| | 91 |
| | 93 |
|
| Expected return on plan assets | (101 | ) | | (93 | ) | | (96 | ) |
| Amortization of net actuarial losses | 49 |
| | 49 |
| | 42 |
|
| Net periodic benefit cost | $ | 76 |
| | $ | 91 |
| | $ | 66 |
|
| |
a. | The assumptions shown relate only to the FMC plans. |
a.The assumptions shown relate only to the FMC Retirement Plan.
The weighted-average assumptions used to determine net periodic benefit cost and the components of net periodic benefit cost for PT-FI’s pension plan for the years ended December 31 follow:
| | | | | | | | | | | | | | | | | |
| | 2020 | | 2019 | | 2018 |
| Weighted-average assumptions: | | | | | |
| Discount rate | 7.25 | % | | 8.25 | % | | 6.75 | % |
| Expected return on plan assets | 7.75 | % | | 8.25 | % | | 6.75 | % |
| Rate of compensation increase | 4.00 | % | | 4.00 | % | | 4.00 | % |
| | | | | |
| Service cost | $ | 11 | | | $ | 12 | | | $ | 13 | |
| Interest cost | 14 | | | 17 | | | 14 | |
| Expected return on plan assets | (19) | | | (17) | | | (19) | |
| Amortization of prior service cost | 2 | | | 1 | | | 2 | |
| Amortization of net actuarial gains | (3) | | | (1) | | | (1) | |
| | | | | |
| Net periodic benefit cost | $ | 5 | | | $ | 12 | | | $ | 9 | |
|
| | | | | | | | | | | |
| | 2018 | | 2017 | | 2016 |
| Weighted-average assumptions: | | | | | |
| Discount rate | 6.75 | % | | 8.25 | % | | 9.00 | % |
| Expected return on plan assets | 6.75 | % | | 7.75 | % | | 7.75 | % |
| Rate of compensation increase | 4.00 | % | | 8.00 | % | | 9.40 | % |
| | | | | | |
| Service cost | $ | 13 |
| | $ | 20 |
| | $ | 27 |
|
| Interest cost | 14 |
| | 23 |
| | 29 |
|
| Expected return on plan assets | (19 | ) | | (21 | ) | | (17 | ) |
| Amortization of prior service cost | 2 |
| | 2 |
| | 3 |
|
| Amortization of net actuarial (gain) loss | (1 | ) | | — |
| | 5 |
|
| Curtailment loss | — |
| | 4 |
| | — |
|
| Net periodic benefit cost | $ | 9 |
| | $ | 28 |
| | $ | 47 |
|
The service cost component of net periodic benefit cost is included in operating income, and the other components are included in other income (expense), net in the consolidated statements of operations.
Included in accumulated other comprehensive loss are the following amounts that have not been recognized in net periodic pension cost as of December 31:
| | | | | | | | | | | | | | | | | | | | | | | |
| 2020 | | 2019 |
| | Before Taxes | | After Taxes and Noncontrolling Interests | | Before Taxes | | After Taxes and Noncontrolling Interests |
| Net actuarial losses | $ | 673 | | | $ | 558 | | | $ | 710 | | | $ | 604 | |
| Prior service costs | 6 | | | 1 | | | 11 | | | 6 | |
| $ | 679 | | | $ | 559 | | | $ | 721 | | | $ | 610 | |
|
| | | | | | | | | | | | | | | |
| | 2018 | | 2017 |
| | Before Taxes | | After Taxes and Noncontrolling Interests | | Before Taxes | | After Taxes and Noncontrolling Interests |
| Net actuarial loss | $ | 659 |
| | $ | 539 |
| | $ | 620 |
| | $ | 412 |
|
| Prior service costs | 13 |
| | 8 |
| | 10 |
| | 6 |
|
| | $ | 672 |
| | $ | 547 |
| | $ | 630 |
| | $ | 418 |
|
Plan assets are classified within a fair value hierarchy that prioritizes the inputs to valuation techniques used to measure fair value. The hierarchy gives the highest priority to unadjusted quoted prices in active markets for identical assets or liabilities (Level 1), then to prices derived using significant observable inputs (Level 2) and the lowest priority to prices derived using significant unobservable inputs (Level 3).
A summary of the fair value for pension plan assets, including those measured at net asset value (NAV) as a practical expedient, associated with the FCX plans follows:
| | | | | | | | | | | | | | | | | | | | | | | | | | | | | |
| | Fair Value at December 31, 2020 |
| | Total | | NAV | | Level 1 | | Level 2 | | Level 3 |
| Commingled/collective funds: | | | | | | | | | |
| Global equity | $ | 527 | | | $ | 527 | | | $ | 0 | | | $ | 0 | | | $ | 0 | |
| Fixed income securities | 404 | | | 404 | | | 0 | | | 0 | | | 0 | |
| | | | | | | | | |
| | | | | | | | | |
| International small-cap equity | 76 | | | 76 | | | 0 | | | 0 | | | 0 | |
| Real estate property | 59 | | | 59 | | | 0 | | | 0 | | | 0 | |
| U.S. real estate securities | 51 | | | 51 | | | 0 | | | 0 | | | 0 | |
| | | | | | | | | |
| | | | | | | | | |
| | | | | | | | | |
| | | | | | | | | |
| | | | | | | | | |
| | | | | | | | | |
| | | | | | | | | |
| Short-term investments | 51 | | | 51 | | | 0 | | | 0 | | | 0 | |
| U.S. small-cap equity | 25 | | | 25 | | | 0 | | | 0 | | | 0 | |
| Fixed income: | | | | | | | | | |
| Corporate bonds | 381 | | | 0 | | | 0 | | | 381 | | | 0 | |
| Government bonds | 181 | | | 0 | | | 0 | | | 181 | | | 0 | |
| Global large-cap equity securities | 109 | | | 0 | | | 109 | | | 0 | | | 0 | |
| Private equity investments | 10 | | | 10 | | | 0 | | | 0 | | | 0 | |
| Other investments | 55 | | | 0 | | | 1 | | | 54 | | | 0 | |
| Total investments | 1,929 | | | $ | 1,203 | | | $ | 110 | | | $ | 616 | | | $ | 0 | |
| | | | | | | | | |
| Cash and receivables | 100 | | | | | | | | | |
| Payables | (83) | | | | | | | | | |
| Total pension plan net assets | $ | 1,946 | | | | | | | | | |
| | | | Fair Value at December 31, 2018 | | Fair Value at December 31, 2019 |
| | Total | | NAV | | Level 1 | | Level 2 | | Level 3 | | Total | | NAV | | Level 1 | | Level 2 | | Level 3 |
| Commingled/collective funds: | | | | | | | | | | Commingled/collective funds: | | | | | | | | |
| Global equity | $ | 291 |
| | $ | 291 |
| | $ | — |
| | $ | — |
| | $ | — |
| Global equity | $ | 425 | | | $ | 425 | | | $ | 0 | | | $ | 0 | | | $ | 0 | |
| Fixed income securities | 144 |
| | 144 |
| | — |
| | — |
| | — |
| Fixed income securities | 239 | | | 239 | | | 0 | | | 0 | | | 0 | |
| Global fixed income securities | 108 |
| | 108 |
| | — |
| | — |
| | — |
| |
| Emerging markets equity | 71 |
| | 71 |
| | — |
| | — |
| | — |
| |
| U.S. small-cap equity | | U.S. small-cap equity | 67 | | | 67 | | | 0 | | | 0 | | | 0 | |
| | Real estate property | 55 |
| | 55 |
| | — |
| | — |
| | — |
| Real estate property | 58 | | | 58 | | | 0 | | | 0 | | | 0 | |
| U.S. small-cap equity | 54 |
| | 54 |
| | — |
| | — |
| | — |
| |
| | International small-cap equity | 47 |
| | 47 |
| | — |
| | — |
| | — |
| International small-cap equity | 55 | | | 55 | | | 0 | | | 0 | | | 0 | |
| U.S. real estate securities | 41 |
| | 41 |
| | — |
| | — |
| | — |
| U.S. real estate securities | 53 | | | 53 | | | 0 | | | 0 | | | 0 | |
| Short-term investments | 15 |
| | 15 |
| | — |
| | — |
| | — |
| Short-term investments | 16 | | | 16 | | | 0 | | | 0 | | | 0 | |
| | Fixed income: | | | | | | | | | | Fixed income: | |
| Government bonds | 224 |
| | — |
| | — |
| | 224 |
| | — |
| Government bonds | 279 | | | 0 | | | 0 | | | 279 | | | 0 | |
| Corporate bonds | 211 |
| | — |
| | — |
| | 211 |
| | — |
| Corporate bonds | 256 | | | 0 | | | 0 | | | 256 | | | 0 | |
| Global large-cap equity securities | 94 |
| | — |
| | 94 |
| | — |
| | — |
| Global large-cap equity securities | 107 | | | 0 | | | 107 | | | 0 | | | 0 | |
| Private equity investments | 15 |
| | 15 |
| | — |
| | — |
| | — |
| Private equity investments | 11 | | | 11 | | | 0 | | | 0 | | | 0 | |
| Other investments | 61 |
| | — |
| | 16 |
| | 45 |
| | — |
| Other investments | 64 | | | 0 | | | 14 | | | 50 | | | 0 | |
| Total investments | 1,431 |
| | $ | 841 |
| | $ | 110 |
| | $ | 480 |
| | $ | — |
| Total investments | 1,630 | | | $ | 924 | | | $ | 121 | | | $ | 585 | | | $ | 0 | |
| | | | | | | | | | | | | | | | | | |
| Cash and receivables | 32 |
| | | | | | | | | Cash and receivables | 86 | | |
| Payables | (30 | ) | | | | | | | | | Payables | (39) | | |
| Total pension plan net assets | $ | 1,433 |
| | | | | | | | | Total pension plan net assets | $ | 1,677 | | |
|
| | | | | | | | | | | | | | | | | | | |
| | Fair Value at December 31, 2017 |
| | Total | | NAV | | Level 1 | | Level 2 | | Level 3 |
| Commingled/collective funds: | | | | | | | | | |
| Global equity | $ | 404 |
| | $ | 404 |
| | $ | — |
| | $ | — |
| | $ | — |
|
| Fixed income securities | 154 |
| | 154 |
| | — |
| | — |
| | — |
|
| Global fixed income securities | 115 |
| | 115 |
| | — |
| | — |
| | — |
|
| Emerging markets equity | 87 |
| | 87 |
| | — |
| | — |
| | — |
|
| International small-cap equity | 72 |
| | 72 |
| | — |
| | — |
| | — |
|
| U.S. small-cap equity | 67 |
| | 67 |
| | — |
| | — |
| | — |
|
| Real estate property | 50 |
| | 50 |
| | — |
| | — |
| | — |
|
| U.S. real estate securities | 45 |
| | 45 |
| | — |
| | — |
| | — |
|
| Short-term investments | 12 |
| | 12 |
| | — |
| | — |
| | — |
|
| Fixed income: | | | | | | | | | |
| Government bonds | 208 |
| | — |
| | — |
| | 208 |
| | — |
|
| Corporate bonds | 168 |
| | — |
| | — |
| | 168 |
| | — |
|
| Global large-cap equity securities | 119 |
| | — |
| | 119 |
| | — |
| | — |
|
| Private equity investments | 20 |
| | 20 |
| | — |
| | — |
| | — |
|
| Other investments | 62 |
| | — |
| | 19 |
| | 43 |
| | — |
|
| Total investments | 1,583 |
| | $ | 1,026 |
| | $ | 138 |
| | $ | 419 |
| | $ | — |
|
| | | | | | | | | | |
| Cash and receivables | 21 |
| | | | | | | | |
| Payables | (16 | ) | | | | | | | | |
| Total pension plan net assets | $ | 1,588 |
| | | | | | | | |
Following is a description of the pension plan asset categories and the valuation techniques used to measure fair value. There have been no changes to the techniques used to measure fair value.
Commingled/collective funds are managed by several fund managers and are valued at the NAV per unit of the fund. For most of these funds, the majority of the underlying assets are actively traded securities. These funds (except the real estate property fund) require up to a 60-day15-calendar-day notice for redemptions. The real estate property fund is valued at NAV using information from independent appraisal firms, who have knowledge and expertise about the current market values of real property in the same vicinity as the investments. Redemptions of the real estate property fund are allowed once per quarter, subject to available cash.
Fixed income investments include government and corporate bonds held directly by the Master Trust. Fixed income securities are valued using a bid-evaluation price or a mid-evaluation price and, as such, are classified within Level 2 of the fair value hierarchy. A bid-evaluation price is an estimated price at which a dealer would pay for a security. A mid-evaluation price is the average of the estimated price at which a dealer would sell a security and the estimated price at which a dealer would pay for a security. These evaluations are based on quoted prices, if available, or models that use observable inputs.
Common stocks included in global large-cap equity securities and preferred stocks included in other investments are valued at the closing price reported on the active market on which the individual securities are traded and, as such, are classified within Level 1 of the fair value hierarchy.
Private equity investments are valued at NAV using information from general partners and have inherent restrictions on redemptions that may affect the ability to sell the investments at their NAV in the near term.
A summary of the fair value hierarchy for pension plan assets associated with the PT-FI plan follows:
| | | | | | | | | | | | | | | | | | | | | | | |
| | Fair Value at December 31, 2020 |
| | Total | | Level 1 | | Level 2 | | Level 3 |
| Government bonds | $ | 117 | | | $ | 117 | | | $ | 0 | | | $ | 0 | |
| Common stocks | 77 | | | 77 | | | 0 | | | 0 | |
| Mutual funds | 18 | | | 18 | | | 0 | | | 0 | |
| Total investments | 212 | | | $ | 212 | | | $ | 0 | | | $ | 0 | |
| | | | | | | |
Cash and receivablesa | 41 | | | | | | | |
| Payables | (2) | | | | | | | |
| Total pension plan net assets | $ | 251 | | | | | | | |
| | | | Fair Value at December 31, 2018 | | Fair Value at December 31, 2019 |
| | Total | | Level 1 | | Level 2 | | Level 3 | | Total | | Level 1 | | Level 2 | | Level 3 |
| Government bonds | $ | 72 |
| | $ | 72 |
| | $ | — |
| | $ | — |
| Government bonds | $ | 93 | | | $ | 93 | | | $ | 0 | | | $ | 0 | |
| Common stocks | 72 |
| | 72 |
| | — |
| | — |
| Common stocks | 80 | | | 80 | | | 0 | | | 0 | |
| Mutual funds | 20 |
| | 20 |
| | — |
| | — |
| Mutual funds | 17 | | | 17 | | | 0 | | | 0 | |
| Total investments | 164 |
| | $ | 164 |
| | $ | — |
| | $ | — |
| Total investments | 190 | | | $ | 190 | | | $ | 0 | | | $ | 0 | |
| | | | | | | | | | | | | | |
Cash and receivablesa | 75 |
| | | | | | | Cash and receivablesa | 65 | | |
| Payables | (1 | ) | | | | | | | Payables | (1) | | |
| Total pension plan net assets | $ | 238 |
| | | | | | | Total pension plan net assets | $ | 254 | | |
a.Cash consists primarily of short-term time deposits.
|
| | | | | | | | | | | | | | | |
| | Fair Value at December 31, 2017 |
| | Total | | Level 1 | | Level 2 | | Level 3 |
| Government bonds | $ | 81 |
| | $ | 81 |
| | $ | — |
| | $ | — |
|
| Common stocks | 78 |
| | 78 |
| | — |
| | — |
|
| Mutual funds | 16 |
| | 16 |
| | — |
| | — |
|
| Total investments | 175 |
| | $ | 175 |
| | $ | — |
| | $ | — |
|
| | | | | | | | |
Cash and receivablesa | 94 |
| | | | | | |
| Total pension plan net assets | $ | 269 |
| | | | | | |
| |
a. | Cash consists primarily of short-term time deposits. |
Following is a description of the valuation techniques used for pension plan assets measured at fair value associated with the PT-FI plan. There have been no changes to the techniques used to measure fair value.
CommonGovernment bonds, common stocks government bonds and mutual funds are valued at the closing price reported on the active market on which the individual securities are traded and, as such, are classified within Level 1 of the fair value hierarchy.
The techniques described above may produce a fair value calculation that may not be indicative of NRV or reflective of future fair values. Furthermore, while FCX believes its valuation techniques are appropriate and consistent with those used by other market participants, the use of different techniques or assumptions to determine the fair value of certain financial instruments could result in a different fair value measurement at the reporting date.
The expected benefit payments for FCX’s and PT-FI’s pension plans follow:
| | | | | | | | | | | |
| FCX | | PT-FIa |
| 2021 | $ | 127 | | | $ | 16 | |
| 2022 | 174 | | | 21 | |
| 2023 | 129 | | | 29 | |
| 2024 | 131 | | | 31 | |
| 2025 | 132 | | | 28 | |
| 2026 through 2030 | 655 | | | 154 | |
|
| | | | | | | |
| | FCX | | PT-FIa |
| 2019 | $ | 117 |
| | $ | 45 |
|
| 2020 | 160 |
| | 11 |
|
| 2021 | 123 |
| | 19 |
|
| 2022 | 126 |
| | 22 |
|
| 2023 | 128 |
| | 30 |
|
| 2024 through 2028 | 664 |
| | 160 |
|
| |
a. | Based on a December 31, 2018, exchange rate of 14,409 Indonesian rupiah to one U.S. dollar.
|
a.Based on a December 31, 2020, exchange rate of 14,034 Indonesia rupiah to one U.S. dollar.
Postretirement and Other Benefits. FCX also provides postretirement medical and life insurance benefits for certain U.S. employees and, in some cases, employees of certain international subsidiaries. These postretirement benefits vary among plans, and many plans require contributions from retirees. The expected cost of providing such postretirement benefits is accrued during the years employees render service.
The benefit obligation (funded status) for the postretirement medical and life insurance benefit plans consisted of a current portion of $13$7 million (included in accounts payable and accrued liabilities) and a long-term portion of $115$69 million (included in other liabilities) at December 31, 2018,2020, and a current portion of $14$13 million and a long-term portion of $129$112 million at December 31, 2017.2019. The decrease in the benefit obligation from December 31, 2019, to December 31, 2020, is primarily a result of a plan amendment that modified the benefit for most medicare eligible retirees effective January 1, 2021. The discount rate used to determine the benefit obligation for these plans, which was determined on the same basis as FCX’s pension plans, was 4.202.21 percent at December 31, 2018,2020, and 3.503.00 percent at December 31, 2017.2019. Expected benefit payments for these plans total $13$8 million for 2019, $132021, $7 million for 2020, $132022, $7 million for 2021, $122023, $6 million for 2022, $11 million for 2023 and $47 million for 2024, $6 million for 2025 and $23 million for 2026 through 2028.2030.
The net periodic benefit cost charged to operations for FCX’s postretirement benefits (primarily for interest costs) totaled $3 million in 2020, $4 million in 2019 and $5 million in 2018, $5 million in 2017 and $4 million in 2016.2018. The discount rate used to determine net periodic benefit cost and the components of net periodic benefit cost for FCX’s postretirement benefits was 3.00 percent in 2020, 4.20 percent in 2019 and 3.50 percent in 2018, 3.80 percent in 2017 and 4.10 percent in 2016.2018. The medical-care trend rates assumed the first year trend rate was 7.757.50 percent at December 31, 2018,2020, which declines over the next 15 years with an ultimate trend rate of 4.25 percent.
FCX has a number of postemployment plans covering severance, long-term disability income, continuation of health and life insurance coverage for disabled employees or other welfare benefits. The accumulated postemployment benefit obligation consisted of a current portion of $6$6 million (included in accounts payable and accrued liabilities) and a long-term portion of $39$42 million (included in other liabilities) at December 31, 2018,2020, and a current portion of $5$7 million and a long-term portion of $38$44 million at December 31, 2017.2019.
FCX also sponsors savings plans for the majority of its U.S. employees. The plans allow employees to contribute a portion of their pre-tax income in accordance with specified guidelines. These savings plans are principally qualified 401(k) plans for all U.S. salaried and non-bargained hourly employees. In these plans, participants exercise control and direct the investment of their contributions and account balances among various investment options. FCX contributes to these plans at varying rates and matches a percentage of employee pre-tax deferral contributions up to certain limits, which vary by plan. For employees whose eligible compensation exceeds certain levels, FCX provides an unfunded defined contribution plan, which had a liability balance of $45$49 million at December 31, 2018,2020, and $46 million at December 31, 2017,2019, all of which was included in other liabilities.
The costs charged to operations for employee savings plans totaled $75$40 million in 2018 (none2020, $85 million in 2019 and $75 million in 2018. The decrease in costs for 2020, compared with 2019, resulted from a temporary suspension of which was capitalized), $65 million in 2017 (noneFCX contributions to certain plans implemented as part of which was capitalized) and $78 million in 2016 (of which $4 million was capitalized to oil and gas properties).its April 2020 revised operating plans. FCX contributions resumed on January 1, 2021. FCX has other employee benefit plans, certain of which are related to FCX’s financial results, which are recognized in operating costs.
Restructuring Charges. As a result
laws and regulations. As a result, PT-FI recorded charges in 2017 to production costs of $120 million, and selling, general and administrative costs of $5 million for employee severance and related costs, and a pension curtailment loss of $4 million in production costs.
In early 2016, FCX restructured its oil and gas business to reduce costs and in late 2016, FCX sold substantially all of its remaining oil and gas properties. As a result, FCX recorded charges of $85 million to selling, general and administrative expenses and $6 million to production costs for net restructuring-related costs in 2016.
NOTE 10. STOCKHOLDERS’ EQUITY AND STOCK-BASED COMPENSATION
FCX’s authorized shares of capital stock total 3.05 billion shares, consisting of 3.0 billion shares of common stock and 50 million shares of preferred stock.
Common Stock. In November 2016, FCX completed a $1.5 billion registered at-the-market equity offeringMarch 2020, in response to the COVID-19 pandemic and resulting global economic uncertainties, the Board suspended FCX’s quarterly cash dividend of common stock that was announced on July 27, 2016. FCX sold 116.5 million shares of its common stock at an average price of $12.87$0.05 per share, which generated gross proceeds of $1.5 billion (net proceeds of $1.48 billion after $15 million of commissions and expenses).
During 2016, FCX issued 48.1 million shares of its common stock (with a value of $540 million, excluding $5 million of commissions paid by FCX) in connection with the settlement of two drilling rig contracts. Also during 2016, FCX negotiated private exchange transactions exempt from registration under the Securities Act of 1933, as amended, whereby 27.7 million shares of FCX’s common stock were issued (with an aggregate value of $311 million), in exchange for $369 million principal amount of FCX’s senior notes.
From January 1, 2016, through January 5, 2016, FCX sold 4.3 million shares of its common stock, which generated proceeds of $29 million (after $0.3 million of commissions and expenses). FCX used the proceeds to repay indebtedness.
share. In February 2018, FCX’s2021, the Board of Directors (the Board) reinstated a cash dividend on FCX’s common stock withat an annual rate of $0.20$0.30 per share. The Board also adopted a new financial policy for the allocation of cash flows aligned with our strategic objectives of maintaining a strong balance sheet, increasing cash returns to shareholders and advancing opportunities for future growth. Under the new policy, up to 50 percent of available cash flows generated after planned capital spending and distributions to noncontrolling interests would be allocated to shareholder returns and the balance to debt reduction and investments in value enhancing growth projects. The new payout policy will be implemented following achievement of a net debt (total consolidated debt less total consolidated cash and cash equivalents) target in the range of $3 billion to $4 billion, excluding project debt for additional smelter capacity in Indonesia. The declaration and payment of future dividends is at the discretion of the Board and will dependbe assessed on an ongoing basis, taking into account FCX’s financial results, cash requirements, future prospects, global economic conditions and other factors deemed relevant by the Board.
Accumulated Other Comprehensive Loss. A summary of changes in the balances of each component of accumulated other comprehensive loss, net of tax, follows:
| | | | | | | | | | | | | | | | | | | | | | | |
| Defined Benefit Plans | | Unrealized Losses on Securities | | Translation Adjustment | | Total |
| Balance at January 1, 2018 | $ | (494) | | | $ | (3) | | | $ | 10 | | | $ | (487) | |
| Adoption of accounting standard for reclassification of income taxes | (79) | | | 0 | | | 0 | | | (79) | |
Amounts arising during the perioda,b | (84) | | | 0 | | | 0 | | | (84) | |
Amounts reclassifiedc | 48 | | | 3 | | | 0 | | | 51 | |
| Sale of interest in PT-FI (refer to Note 2) | (6) | | | 0 | | | 0 | | | (6) | |
| Balance at December 31, 2018 | (615) | | | 0 | | | 10 | | | (605) | |
| | | | | | | |
Amounts arising during the perioda,b | (118) | | | 0 | | | 0 | | | (118) | |
Amounts reclassifiedc | 47 | | | 0 | | | 0 | | | 47 | |
| | | | | | | |
| Balance at December 31, 2019 | (686) | | | 0 | | | 10 | | | (676) | |
| | | | | | | |
Amounts arising during the perioda,b | 47 | | | 0 | | | 0 | | | 47 | |
Amounts reclassifiedc | 46 | | | 0 | | | 0 | | | 46 | |
| | | | | | | |
| Balance at December 31, 2020 | $ | (593) | | | $ | 0 | | | $ | 10 | | | $ | (583) | |
|
| | | | | | | | | | | | | | | |
| | Defined Benefit Plans | | Unrealized Losses on Securities | | Translation Adjustment | | Total |
| Balance at January 1, 2016 | $ | (507 | ) | | $ | (6 | ) | | $ | 10 |
| | $ | (503 | ) |
Amounts arising during the perioda,b | (91 | ) | | 2 |
| | — |
| | (89 | ) |
Amounts reclassifiedc | 44 |
| | — |
| | — |
| | 44 |
|
| Balance at December 31, 2016 | (554 | ) | | (4 | ) | | 10 |
| | (548 | ) |
Amounts arising during the perioda,b | 7 |
| | 1 |
| | — |
| | 8 |
|
Amounts reclassifiedc | 53 |
| | — |
| | — |
| | 53 |
|
| Balance at December 31, 2017 | (494 | ) | | (3 | ) | | 10 |
| | (487 | ) |
| Adoption of new accounting standard for reclassification of income taxes (refer to Note 1) | (79 | ) | | — |
| | — |
| | (79 | ) |
Amounts arising during the perioda,b | (84 | ) | | — |
| | — |
| | (84 | ) |
Amounts reclassifiedc | 48 |
| | 3 |
| | — |
| | 51 |
|
| Sale of interest in PT-FI (refer to Note 2) | (6 | ) | | — |
| | — |
| | (6 | ) |
| Balance at December 31, 2018 | $ | (615 | ) | | $ | — |
| | $ | 10 |
| | $ | (605 | ) |
| |
a. | Includes net actuarial (losses) gains, net of noncontrolling interest, totaling $(79) million for 2016, $52 million for 2017 and $(87) million for 2018. |
| |
b. | Includes tax provision totaling $11 million for 2016, $45 million for 2017 and $4 million for 2018. |
| |
c. | Includes amortization primarily related to actuarial losses, net of taxes of $4 million for 2016, $5 million for 2017 and none for 2018.
|
a.Includes net actuarial (losses) gains, net of noncontrolling interest, totaling $(87) million for 2018, $(111) million for 2019 and $40 million for 2020.
b.Includes tax provision (benefit) totaling $4 million for 2018, $(8) million for 2019 and $7 million for 2020.
c.Includes amortization primarily related to actuarial losses, net of taxes of less than $1 million for 2018, 2019 and 2020.
Stock Award Plans. FCX currently has awards outstanding under various stock-based compensation plans. The stockholder-approved 2016 Stock Incentive Plan (the 2016 Plan) provides for the issuance of stock options, SARs,stock appreciation rights, restricted stock, RSUs, PSUs and other stock-based awards for up to 72 million common shares. As of December 31, 2018, 58.62020, 39.7 million shares were available for grant under the 2016 Plan, and no shares were available under other plans.
Stock-Based Compensation Cost. Compensation cost charged against earnings for stock-based awards for the years ended December 31 follows: |
| | | | | | | | | | | | |
| | 2018 | | 2017 | | 2016 | |
| Selling, general and administrative expenses | $ | 62 |
| | $ | 55 |
| | $ | 69 |
| |
| Production and delivery | 12 |
| | 16 |
| | 16 |
| |
| Capitalized costs | — |
| | — |
| | 4 |
| |
| Total stock-based compensation | 74 |
| | 71 |
| | 89 |
| |
| Less capitalized costs | — |
| | — |
| | (4 | ) | |
| Tax benefit and noncontrolling interests’ share | (4 | ) | a | (4 | ) | a | (3 | ) | a |
| Impact on net income (loss) from continuing operations | $ | 70 |
| | $ | 67 |
| | $ | 82 |
| |
| | | | | | | | | | | | | | | | | | | | |
| 2020 | | 2019 | | 2018 | |
| Selling, general and administrative expenses | $ | 70 | | | $ | 48 | | | $ | 62 | | |
| Production and delivery | 29 | | | 15 | | | 12 | | |
| | | | | | |
| Total stock-based compensation | 99 | | | 63 | | | 74 | | |
| | | | | | |
Tax benefit and noncontrolling interests’ sharea | (5) | | | (4) | | | (4) | | |
| Impact on net income (loss) | $ | 94 | | | $ | 59 | | | $ | 70 | | |
a. Charges in the U.S. are not expected to generate a future tax benefit.
Stock Options. Stock options granted under the plans generally expire 10 years after the date of grant. Stock options granted prior to 2018 generally vest in 25 percent annual increments andincrements; beginning in 2018, awards granted vest in 33 percent annual increments beginning one year from the date of grant. The award agreements provide that participants will receive the following year’s vesting upon retirement. Therefore, on the date of grant, FCX accelerates one year of amortization for retirement-eligible employees. Stock options provide for accelerated vesting only upon certain qualifying terminations of employment within one year following a change of control.
A summary of stock options outstanding as of December 31, 2018,2020, and activity during the year ended December 31, 2018,2020, follows:
| | | | | | | | | | | | | | | | | | | | | | | | | | |
| Number of
Options | | Weighted-
Average
Exercise Price
Per Share | | Weighted-
Average
Remaining
Contractual
Term (years) | | Aggregate
Intrinsic
Value | |
| Balance at January 1 | 48,312,053 | | | $ | 26.16 | | | | | | |
| Granted | 3,803,000 | | | 12.04 | | | | | | |
| Exercised | (6,240,340) | | | 9.09 | | | | | | |
| Expired/Forfeited | (8,774,615) | | | 34.62 | | | | | | |
| Balance at December 31 | 37,100,098 | | | 25.58 | | | 4.6 | | $ | 259 | | |
| | | | | | | | |
| Vested and exercisable at December 31 | 30,045,828 | | | 28.71 | | | 3.7 | | $ | 162 | | |
|
| | | | | | | | | | | | | |
| | Number of Options | | Weighted- Average Exercise Price Per Share | | Weighted- Average Remaining Contractual Term (years) | | Aggregate Intrinsic Value | |
| Balance at January 1 | 48,014,688 |
| | $ | 28.63 |
| |
| | | |
| Granted | 3,315,000 |
| | 18.74 |
| | | | | |
| Exercised | (801,706 | ) | | 10.05 |
| |
| | | |
| Expired/Forfeited | (3,721,618 | ) | | 39.26 |
| |
| | | |
| Balance at December 31 | 46,806,364 |
| | 27.40 |
| | 4.5 | | $ | 38 |
| |
| | | | | | | | | |
| Vested and exercisable at December 31 | 39,919,885 |
| | 29.80 |
| | 3.8 | | $ | 26 |
| |
The fair value of each stock option is estimated on the date of grant using the Black-Scholes-Merton option valuation model. Expected volatility is based on implied volatilities from traded options on FCX’s common stock and historical volatility of FCX’s common stock. FCX uses historical data to estimate future option exercises, forfeitures and expected life. When appropriate, separate groups of employees who have similar historical exercise behavior are considered separately for valuation purposes. The expected dividend rate is calculated using the annual dividend (excluding supplemental dividends) at the date of grant. The risk-free interest rate is based on Federal Reserve rates in effect for bonds with maturity dates equal to the expected term of the option.
Information related to stock options during the years ended December 31 follows:
| | | | | | | | | | | | | | | | | | | | |
| | 2020 | | 2019 | | 2018 | |
| Weighted-average assumptions used to value stock option awards: | | | | | | |
| Expected volatility | 47.7 | % | | 47.8 | % | | 46.1 | % | |
| Expected life of options (in years) | 5.83 | | 6.10 | | 5.92 | |
| Expected dividend rate | 1.7 | % | | 1.8 | % | | 1.2 | % | |
| Risk-free interest rate | 1.5 | % | | 2.5 | % | | 2.6 | % | |
| Weighted-average grant-date fair value (per option) | $ | 4.72 | | | $ | 4.87 | | | $ | 7.84 | | |
| Intrinsic value of options exercised | $ | 82 | | | $ | 3 | | | $ | 7 | | |
| Fair value of options vested | $ | 28 | | | $ | 26 | | | $ | 24 | | |
|
| | | | | | | | | | | | |
| | 2018 | | 2017 | | 2016 | |
| Weighted-average assumptions used to value stock option awards: | | | | | | |
| Expected volatility | 46.1 | % | | 51.4 | % | | 71.6 | % | |
| Expected life of options (in years) | 5.92 |
| | 5.70 |
| | 5.34 |
| |
| Expected dividend rate | 1.2 | % | | — |
| | — |
| |
| Risk-free interest rate | 2.6 | % | | 2.0 | % | | 1.3 | % | |
| Weighted-average grant-date fair value (per share) | $ | 7.84 |
| | $ | 7.61 |
| | $ | 2.64 |
| |
| Intrinsic value of options exercised | $ | 7 |
| | $ | 5 |
| | $ | — |
| a |
| Fair value of options vested | $ | 24 |
| | $ | 25 |
| | $ | 43 |
| |
a. Rounds to less than $1 million.
As of December 31, 2018,2020, FCX had $23$14 million of total unrecognized compensation cost related to unvested stock options expected to be recognized over a weighted-average period of approximately 1.41.2 years.
Stock-Settled PSUs and RSUs. Beginning in 2014, FCX’s executive officers were grantedreceived annual grants of PSUs that vest after three years. For the PSUs granted in 2017 and 2016, the final number of shares to be issued to the executive officers will be determined based on (i) FCX’s achievement of certain financial and operational performance metrics and (ii) FCX’s total shareholder return compared to the shareholder return of a peer group. The total grant date target shares related to the PSU grants were 0.6 million for 2017 and 1.5 million for 2016, of which the executive officers will earn (i) between 0 percent and 175 percent of the target shares based on achievement of financial and operating metrics and (ii) +/- 25 percent of the target shares based on FCX’s total shareholder return compared to a peer group. For the PSUs granted in 2018, the final number of shares to be issued to the executive officers will be determined based on (i) FCX’s achievement of certain financial metrics and (ii) FCX’s total shareholder return compared to the shareholder return of a peer group. The total grant date target shares related to the PSU grants were 0.5 million for 2018, 0.7 million for 2019 and 0.8 million for 2020, of which the executive officers will earn (i) between 0 percent and 200 percent of the target shares based on achievement of financial metrics and (ii) +/- up to 25 percent of the target shares based on FCX’s total shareholder return compared to the total shareholder return of a peer group.
All of FCX’s executive officers are retirement eligible, and their PSU awards are therefore non-forfeitable. As such, FCX charges the estimated fair value of the PSU awards to expense at the time the financial and operational, if applicable, metrics are established.
FCX grants RSUs that vest over a period of three years or at the end of three years to certain employees. Some award agreements allow for participants to receive the following year’s vesting upon retirement. Therefore, on the date of grant of these RSU awards, FCX accelerates one year of amortization for retirement-eligible employees. FCX also grants RSUs to its directors. Beginning in December 2015, RSUs granted to directors, which vest on the first anniversary of the grant. Prior to December 2015, RSUs granted to directors generally vest over a perioddate of four years.grant. The fair value of the RSUs is amortized over the vesting period or the period until the director becomes retirement eligible, whichever is shorter. Upon a director’s retirement, all of their unvested RSUs immediately vest. For retirement-eligible directors, the fair value of RSUs is recognized in earnings on the date of grant.
The award agreements provide for accelerated vesting of all RSUs held by directors if there is a change of control (as defined in the award agreements) and for accelerated vesting of all RSUs held by employees if they experience a qualifying termination within one year following a change of control.
Dividends attributable to RSUs and PSUs accrue and are paid if the award vests. A summary of outstanding stock-settled RSUs and PSUs as of December 31, 2018,2020, and activity during the year ended December 31, 2018,2020, follows:
| | | | | | | | | | | | | | | | | |
| Number of Awards | | Weighted-Average Grant-Date Fair Value Per Award | | Aggregate
Intrinsic
Value |
| Balance at January 1 | 5,590,685 | | | $ | 18.61 | | | |
| Granted | 3,548,497 | | | 13.15 | | | |
| Vested | (1,475,892) | | | 14.95 | | | |
| Forfeited | (140,268) | | | 14.85 | | | |
| Balance at December 31 | 7,523,022 | | | 16.79 | | | $ | 196 | |
|
| | | | | | | | | | |
| | Number of Awards | | Weighted-Average Grant-Date Fair Value Per Award | | Aggregate Intrinsic Value |
| Balance at January 1 | 5,206,624 |
| | $ | 18.48 |
| | |
| Granted | 2,127,785 |
| a | 19.11 |
| | |
| Vested | (753,806 | ) | | 15.53 |
| | |
| Forfeited | (775,966 | ) | | 11.91 |
| | |
| Balance at December 31 | 5,804,637 |
| | 19.97 |
| | $ | 60 |
|
a. Excludes 187 thousand PSUs related to 2017 grants for which the performance metrics have not yet been established.
The total fair value of stock-settled RSUs and PSUs granted was $47 million during 2020, $24 million during 2019 and $41 million during 2018, $32 million during 2017 and $37 million during 2016.2018. The total intrinsic value of stock-settled RSUs and PSUs vested was $18 million during 2020, $26 million during 2019 and $14 million during 2018, $45 million during 2017 and $22 million during 2016.2018. As of December 31, 2018,2020, FCX had $6$10 million of total unrecognized compensation cost related to unvested stock-settled RSUs expected to be recognized over approximately 1.11.6 years.
Cash-Settled RSUs and PSUs.RSUs. Cash-settled RSUs are similar to stock-settled RSUs, but are settled in cash rather than in shares of common stock. These cash-settled RSUs generally vest over three years of service. Some award agreements allow for participants to receive the following year’s vesting upon retirement. Therefore, on the date of grant of these cash-settled RSU awards, FCX accelerates one year of amortization for retirement-eligible employees. The cash-settled RSUs are classified as liability awards, and the fair value of these awards is remeasured each reporting period until the vesting dates. The award agreements for cash-settled RSUs provide for accelerated vesting upon certain qualifying terminations of employment within one year following a change of control (as defined in the award agreements).control.
In 2015, certain members of FM O&G’s senior management were granted cash-settled PSUs that vested over three years. The total grant date target shares related to the 2015 cash-settled PSU grants were 582 thousand shares, of which FM O&G’s senior management earned a total of 487 thousand shares at maturity during 2018 based on the achievement of applicable performance goals.
The cash-settled RSUs and PSUs are classified as liability awards, and the fair value of these awards is remeasured each reporting period until the vesting dates.
Dividends attributable to cash-settled RSUs and PSUs accrue and are paid if the award vests. A summary of outstanding cash-settled RSUs and PSUs as of December 31, 2018,2020, and activity during the year ended December 31, 2018,2020, follows:
| | | | | | | | | | | | | | | | | |
| Number of Awards | | Weighted-Average Grant-Date Fair Value Per Award | | Aggregate
Intrinsic
Value |
| Balance at January 1 | 1,582,887 | | | $ | 14.54 | | | |
| Granted | 879,500 | | | 11.96 | | | |
| Vested | (911,459) | | | 14.79 | | | |
| Forfeited | (29,831) | | | 13.44 | | | |
| Balance at December 31 | 1,521,097 | | | 12.92 | | | $ | 40 | |
|
| | | | | | | | | | |
| | Number of Awards | | Weighted-Average Grant-Date Fair Value Per Award | | Aggregate Intrinsic Value |
| Balance at January 1 | 1,307,235 |
| | $ | 13.32 |
| | |
| Granted | 870,312 |
| | 17.91 |
| | |
| Vested | (666,975 | ) | | 14.12 |
| | |
| Forfeited | (23,706 | ) | | 15.92 |
| | |
| Balance at December 31 | 1,486,866 |
| | 15.61 |
| | $ | 15 |
|
The total grant-date fair value of cash-settled RSUs was $11 million during 2020, $10 million during 2019 and $16 million during 2018, $10 million during 2017 and $4 million during 2016.2018. The intrinsic value of cash-settled RSUs and PSUs vested was $12$11 million during 2018, $272020, $8 million during 20172019 and $15$11 million during 2016.2018. The accrued liability associated with cash-settled RSUs consisted of a current portion of $7$22 million (included in accounts payable and accrued liabilities) and a long-term portion of $3$6 million (included in other liabilities) at December 31, 2018,2020, and a current portion of $11 million and a long-term portion of $5$3 million at December 31, 2017.2019.
Other Information. The following table includes amounts related to exercises of stock options and vesting of RSUs and PSUs during the years ended December 31:31:
| | | | | | | | | | | | | | | | | | | | |
| | 2020 | | 2019 | | 2018 | |
| FCX shares tendered to pay the exercise price | | | | | | |
and/or the minimum required taxesa | 1,193,183 | | | 670,508 | | | 195,322 | | |
| Cash received from stock option exercises | $ | 51 | | | $ | 2 | | | $ | 8 | | |
| Actual tax benefit realized for tax deductions | $ | 2 | | | $ | 1 | | | $ | 3 | | |
| Amounts FCX paid for employee taxes | $ | 17 | | | $ | 8 | | | $ | 4 | | |
|
| | | | | | | | | | | | |
| | 2018 | | 2017 | | 2016 | |
| FCX shares tendered to pay the exercise price | | | | | | |
and/or the minimum required taxesa | 195,322 |
| | 1,041,937 |
| | 906,120 |
| |
| Cash received from stock option exercises | $ | 8 |
| | $ | 5 |
| | $ | — |
| b |
| Actual tax benefit realized for tax deductions | $ | 3 |
| | $ | 1 |
| | $ | — |
| b |
| Amounts FCX paid for employee taxes | $ | 4 |
| | $ | 15 |
| | $ | 6 |
| |
| |
a.
| Under terms of the related plans, upon exercise of stock options and vesting of stock-settled RSUs, employees may tender FCX shares to pay the exercise price and/or the minimum required taxes. |
| |
b. | Rounds to less than $1 million. |
a.Under terms of the related plans, upon exercise of stock options, vesting of stock-settled RSUs and payout of PSUs, employees may tender FCX shares to pay the exercise price and/or the minimum required taxes.
NOTE 11. INCOME TAXES
Geographic sources of income (losses) before income taxes and equity in affiliated companies’ net earnings for the years ended December 31 consist of the following:
| | | | | | | | | | | | | | | | | |
| | 2020 | | 2019 | | 2018 |
| U.S. | $ | (40) | | | $ | (287) | | | $ | 390 | |
| Foreign | 1,837 | | | 593 | | | 3,502 | |
| Total | $ | 1,797 | | | $ | 306 | | | $ | 3,892 | |
|
| | | | | | | | | | | |
| | 2018 | | 2017 | | 2016 |
| U.S. | $ | 390 |
| | $ | 20 |
| | $ | (5,179 | ) |
| Foreign | 3,502 |
| | 2,882 |
| | 1,707 |
|
| Total | $ | 3,892 |
| | $ | 2,902 |
| | $ | (3,472 | ) |
Income taxes are provided on the earnings of FCX’s material foreign subsidiaries under the assumption that these earnings will be distributed. FCX has not provided deferred income taxes for other differences between the book and tax carrying amounts of its investments in material foreign subsidiaries as FCX considers its ownership positions to be permanent in duration, and quantification of the related deferred tax liability is not practicable.
FCX’s (provision for) benefit fromprovision for income taxes for the years ended December 31 consist of the following:
| | | | | | | | | | | | | | | | | | | | |
| | 2020 | | 2019 | | 2018 | |
| Current income taxes: | | | | | | |
| Federal | $ | 53 | | a | $ | (23) | | c,d | $ | 46 | | c,e |
| State | (1) | | | 3 | | | 1 | | |
| Foreign | (816) | | b | (462) | | | (1,445) | | e |
| Total current | (764) | | | (482) | | | (1,398) | | |
| | | | | | |
| Deferred income taxes: | | | | | | |
| Federal | 3 | | | 48 | | | (106) | | |
| State | 5 | | | 8 | | | (8) | | |
| Foreign | (306) | | | (101) | | | (102) | | |
| Total deferred | (298) | | | (45) | | | (216) | | |
| | | | | | |
| Adjustments | 37 | | | 12 | | | 504 | | f |
| Operating loss carryforwards | 81 | | | 5 | | | 119 | | |
| Provision for income taxes | $ | (944) | | | $ | (510) | | | $ | (991) | | |
| | | | | | |
a.Includes a tax credit of $53 million associated with the reversal of the tax charge discussed in footnote d below.
b.Includes a tax charge of $135 million associated with the gain on sale of Kisanfu.
c.As a result of the 2017 Tax Cuts and Jobs Act (the Act) guidance regarding a transition tax issued in 2018, FCX recognized a $29 million tax charge in 2018. Additional guidance released in 2019 resulted in a $29 million tax credit in 2019.
d.Includes a tax charge of $53 million associated with the sale of FCX’s interest in the lower zone of the Timok exploration project in Serbia.
e.In 2018, FCX completed its analysis of the Act and recognized benefits totaling $123 million ($76 million to the U.S. tax provision and $47 million to PT-FI’s tax provision) associated with alternative minimum tax (AMT) credit refunds.
f.Represents net tax credits resulting from the reduction in PT-FI's statutory tax rates in accordance with its new special mining license (IUPK).
|
| | | | | | | | | | | | |
| | 2018 | | 2017 | | 2016 | |
| Current income taxes: | | | | | | |
| Federal | $ | 46 |
| a | $ | (3 | ) | | $ | 164 |
| |
| State | 1 |
| | (10 | ) | | 17 |
| |
| Foreign | (1,445 | ) | a | (1,426 | ) | | (352 | ) | |
| Total current | (1,398 | ) | | (1,439 | ) | | (171 | ) | |
| | | | | | | |
| Deferred income taxes: | | | | | | |
| Federal | (106 | ) | | 64 |
| | 137 |
| |
| State | (8 | ) | | 10 |
| | 41 |
| |
| Foreign | (102 | ) | | 89 |
| | (451 | ) | |
| Total deferred | (216 | ) | | 163 |
| | (273 | ) | |
| | | | | | | |
| Adjustments | 504 |
| b | 393 |
| c | 13 |
| d |
| Operating loss carryforwards | 119 |
| | — |
| | 60 |
| |
| Provision for income taxes | $ | (991 | ) | | $ | (883 | ) | | $ | (371 | ) | |
| |
a. | In 2018, FCX completed its analysis of the Act and recognized benefits totaling $123 million ($76 million to the U.S. tax provision and $47 million to PT-FI’s tax provision) associated with alternative minimum tax (AMT) credit refunds. |
| |
b. | Includes net tax credits totaling $504 million resulting from the reduction in PT-FI's statutory tax rates in accordance with PT-FI’s new special mining license (IUPK). |
| |
c. | Includes net tax credits totaling $393 million associated with the Act, including $272 million for the reversal of valuation allowances associated with AMT credit refunds and $121 million for a decrease in corporate income tax rates. |
| |
d. | Benefit related to changes in Peruvian tax rules. |
A reconciliation of the U.S. federal statutory tax rate to FCX’s effective income tax rate for the years ended December 31 follows:
|
| | | | | | | | | | | | | | | | | | | | |
| | 2018 | | 2017 | | 2016 |
| | Amount | | Percent | | Amount | | Percent | | Amount | | Percent |
| U.S. federal statutory tax rate | $ | (817 | ) | | (21 | )% | | $ | (1,016 | ) | | (35 | )% | | $ | 1,215 |
| | (35 | )% |
| Valuation allowance, net | 129 |
| a | 3 |
| | 28 |
| | 1 |
| | (1,680 | ) | b | 48 |
|
| Foreign tax credit limitation | (195 | ) | | (5 | ) | | (159 | ) | | (5 | ) | | (598 | ) | | 17 |
|
U.S. tax reformc | 123 |
| | 3 |
| | 393 |
| | 14 |
| | — |
| | — |
|
Cerro Verde royalty disputed | (55 | ) | | (1 | ) | | (129 | ) | | (5 | ) | | — |
| | — |
|
| Change in PT-FI tax rates | 504 |
| | 13 |
| | — |
| | — |
| | — |
| | — |
|
| Impairment of oil and gas properties | — |
| | — |
| | — |
| | — |
| | 520 |
| e | (15 | ) |
| Percentage depletion | 141 |
| | 4 |
| | 227 |
| | 8 |
| | 211 |
| | (6 | ) |
| Withholding and other impacts on | | | | | | | | | | | |
| foreign earnings | (232 | ) | | (6 | ) | | (216 | ) | | (7 | ) | | (93 | ) | | 3 |
|
| Effect of foreign rates different than the U.S. | | | | | | | | | | | |
| federal statutory rate | (494 | ) | | (13 | ) | | 17 |
| | 1 |
| | 45 |
| | (1 | ) |
| State income taxes | 7 |
| | 1 |
| | (5 | ) | | (1 | ) | | 46 |
| b | (1 | ) |
| Other items, net | (102 | ) | | (3 | ) | | (23 | ) | | (1 | ) | | (37 | ) | | 1 |
|
| Provision for income taxes | $ | (991 | ) | | (25 | )% | | $ | (883 | ) | | (30 | )% | | $ | (371 | ) | | 11 | % |
| |
a. | Refer to “Valuation Allowance” below for discussion of changes. |
| |
b. | Includes tax charges totaling $1.6 billion in 2016 as a result of the impairment to U.S. oil and gas properties to establish valuation allowances against U.S. federal and state deferred tax assets that will not generate a future benefit. |
| |
c. | Refer to discussion of 2017 U.S. Tax Reform below. |
| |
d. | Refer to Note 12 for further discussion of the Cerro Verde royalty dispute. |
| |
e. | Reflects a loss under U.S. federal income tax law related to the impairment of investments in oil and gas properties. |
| | | | | | | | | | | | | | | | | | | | | | | | | | | | | | | | | | | |
| | 2020 | | 2019 | | 2018 |
| | Amount | | Percent | | Amount | | Percent | | Amount | | Percent |
| U.S. federal statutory tax rate | $ | (377) | | | (21) | % | | $ | (64) | | | (21) | % | | $ | (817) | | | (21) | % |
Valuation allowancea | (210) | | | (12) | | | (149) | | | (49) | | | 129 | | | 3 | |
| PT-FI historical tax disputes | (8) | | | 0 | | | (145) | | | (47) | | | 0 | | | 0 | |
| Percentage depletion | 104 | | | 6 | | | 118 | | | 39 | | | 141 | | | 4 | |
| Effect of foreign rates different than the U.S. | | | | | | | | | | | |
| federal statutory rate | (109) | | | (6) | | | (64) | | | (21) | | | (494) | | | (13) | |
| Withholding and other impacts on | | | | | | | | | | | |
| foreign earnings | (193) | | | (11) | | | (55) | | | (18) | | | (232) | | | (6) | |
| Adjustment to deferred taxes | 0 | | | — | | | (49) | | b | (16) | | | 0 | | | — | |
| Non-deductible permanent differences | 0 | | | — | | | (47) | | | (15) | | | (25) | | | (1) | |
| Uncertain tax positions | (15) | | | (1) | | | (47) | | | (15) | | | (7) | | | — | |
| U.S. tax reform | 0 | | | — | | | 29 | | c | 9 | | | 94 | | c,d | 2 | |
| Foreign tax credit limitation | 28 | | | 2 | | | (16) | | | (5) | | | (195) | | | (5) | |
| | | | | | | | | | | |
| State income taxes | (2) | | | — | | | 16 | | | 6 | | | 7 | | | 1 | |
Cerro Verde historical tax disputese | (39) | | | (2) | | | 2 | | | 1 | | | (55) | | | (1) | |
| Change in PT-FI tax rates | 0 | | | — | | | 0 | | | — | | | 504 | | | 13 | |
| | | | | | | | | | | |
| Timok exploration project sale | 53 | | | 3 | | | (15) | | | (5) | | | 0 | | | — | |
| | | | | | | | | | | |
| | | | | | | | | | | |
| Sale of Kisanfu | (135) | | | (8) | | | 0 | | | — | | | 0 | | | — | |
| Other items, net | (41) | | | (3) | | | (24) | | | (9) | | | (41) | | | (1) | |
| Provision for income taxes | $ | (944) | | | (53) | % | | $ | (510) | | | (166) | % | | $ | (991) | | | (25) | % |
a.Refer to “Valuation Allowance” below for discussion of changes.
b.Represents net tax charges primarily to adjust deferred taxes on historical balance sheet items in accordance with tax accounting principles.
c.As a result of the Act guidance regarding a transition tax issued in 2018, FCX recognized a $29 million tax charge in 2018. Additional guidance released in 2019 resulted in a $29 million tax credit in 2019.
d.In 2018, FCX completed its analysis of the Act and recognized benefits totaling $123 million ($76 million to the U.S. tax provisions and $47 million to PT-FI’s tax provision) associated with AMT credit refunds.
e.Refer to Note 12 for further discussion.
FCX paid federal, state and foreign income taxes totaling $2$397 million in 2020, $610 million in 2019 and $2.0 billion in 2018, $702 million in 2017 and $203 million in 2016 (including $27 million for discontinued operations).2018. FCX received refunds of federal, state and foreign income taxes of $108$265 million in 2018, $3292020, $306 million in 20172019 and $247$108 million in 2016.2018.
The components of deferred taxes follow:
| | | | | | | | | | | |
| | December 31, |
| | 2020 | | 2019 |
| Deferred tax assets: | | | |
| Foreign tax credits | $ | 1,641 | | | $ | 1,716 | |
| Accrued expenses | 1,194 | | | 1,108 | |
| | | |
| | | |
| Net operating losses | 2,443 | | | 2,249 | |
| Employee benefit plans | 171 | | | 198 | |
| | | |
| Other | 238 | | | 267 | |
| Deferred tax assets | 5,687 | | | 5,538 | |
| Valuation allowances | (4,732) | | | (4,576) | |
| Net deferred tax assets | 955 | | | 962 | |
| | | |
| Deferred tax liabilities: | | | |
| Property, plant, equipment and mine development costs | (4,500) | | | (4,372) | |
| | | |
| Undistributed earnings | (694) | | | (639) | |
| Other | (169) | | | (157) | |
| Total deferred tax liabilities | (5,363) | | | (5,168) | |
| Net deferred tax liabilities | $ | (4,408) | | | $ | (4,206) | |
|
| | | | | | | |
| | December 31, |
| | 2018 | | 2017 |
| Deferred tax assets: | | | |
| Foreign tax credits | $ | 1,814 |
| | $ | 2,129 |
|
| Accrued expenses | 881 |
| | 789 |
|
| Oil and gas properties | — |
| | 236 |
|
| Net operating losses | 2,235 |
| | 2,043 |
|
| Employee benefit plans | 245 |
| | 248 |
|
| Other | 212 |
| | 260 |
|
| Deferred tax assets | 5,387 |
| | 5,705 |
|
| Valuation allowances | (4,507 | ) | | (4,575 | ) |
| Net deferred tax assets | 880 |
| | 1,130 |
|
| | | | |
| Deferred tax liabilities: | | | |
| Property, plant, equipment and mine development costs | (4,200 | ) | | (3,754 | ) |
| Undistributed earnings | (578 | ) | | (811 | ) |
| Other | (130 | ) | | (223 | ) |
| Total deferred tax liabilities | (4,908 | ) | | (4,788 | ) |
| Net deferred tax liabilities | $ | (4,028 | ) | | $ | (3,658 | ) |
Tax Attributes. At December 31, 2018,2020, FCX had (i) U.S. foreign tax credits of $1.8$1.6 billion that will expire between 20192021 and 2027, (ii) U.S. federal net operating losses of $6.0$7.0 billion that primarily expire between 2036 and 2037, of that balance approximately $305 million can be carried forward indefinitely, (iii) U.S. state net operating losses of $10.5$10.8 billion that primarily expire between 20192021 and 2038,2040, (iv) Spanish net operating losses of $537$559 million that can be carried forward indefinitely and (v) IndonesianIndonesia net operating losses of $975$910 million that expire between 20202021 and 2025.
Valuation Allowance. On the basis of available information at December 31, 2018,2020, including positive and negative evidence, FCX has provided valuation allowances for certain of its deferred tax assets where it believes it is more likely than notmore- likely-than-not that some portion or all of such assets will not be realized. Valuation allowances totaled $4.5$4.7 billion at December 31, 2018,2020, and $4.6 billion at December 31, 2017,2019, and covered all of FCX’s U.S. foreign tax credits, U.S. federal net operating losses, foreign net operating losses and substantially all of its U.S. state net operating losses. FCX’s valuation allowances at December 31, 2017, also covered all of its U.S. federal capital losses.
The valuation allowance related to FCX’s U.S. foreign tax credits totaled $1.8$1.6 billionat December 31, 2018.2020. FCX has operations in tax jurisdictions where statutory income taxes and withholding taxes are in excess of the U.S. federal income tax rate. Valuation allowances are recordedrecognized on foreign tax credits for which no benefit is expected to be realized.
The valuation allowance related to FCX’s U.S. federal, state and foreign net operating losses totaled $2.4 billion and foreignother deferred tax assets totaled $2.2 billion and $458$647 million respectively, at December 31, 2018.2020. Net operating losses and deferred tax assets represent future deductions for which a benefit will only be realized to the extent these deductions offset future income. FCX develops an estimate of which future tax deductions will be realized and providesrecognizes a valuation allowance to the extent these deductions are not expected to be realized in future periods.
Valuation allowances will continue to be carried on U.S. foreign tax credits, U.S. federal, state and foreign net operating losses and U.S. federal, state and foreign deferred tax assets, until such time that (i) FCX generates taxable income against which any of the assets, credits or net operating losses can be used, (ii) forecasts of future income provide sufficient positive evidence to support reversal of the valuation allowances or (iii) FCX identifies a prudent and feasible means of securing the benefit of the assets, credits or net operating losses that can be implemented.
The $68$156 million net decreaseincrease in the valuation allowances during 20182020 primarily related to decreasesincreases totaling $315 million in U.S. foreign tax credits associated with expirations and 2017 tax reform adjustments, and $45$250 million in U.S. federal net operating losses associated with 2018 usage and 2017 tax reform adjustments,loss carryforwards, partly offset by a $244an $11 million increasedecrease in foreign net operating lossesU.S. deferred tax assets for which no benefit is expected to be realized.realized, and a $75 million decrease in U.S foreign tax credits associated with expirations.
2017 U.S. Tax Reform. The Act, which was enacted on December 22, 2017, included significant modifications to then-existing U.S. tax laws and created many new complex tax provisions. The Act reducedOther Events. In connection with the corporate income tax rate to 21 percent, eliminated the corporate AMT, provided for a refund of AMT credits, maintained hard minerals percentage depletion, allowed for immediate expensing of certain qualified property and generally broadened the tax base. The Act also created a territorial tax system (with a one-time mandatory tax on previously deferred foreign earnings), created anti-base erosion rules that require companies to pay a minimum tax on foreign earnings and may disallow certain payments from U.S. corporations to foreign related parties.
In December 2018, FCX completed its analysisnegative impacts of the COVID-19 pandemic on the global economy, governments throughout the world are announcing measures that are intended to provide tax and other financial relief. Such measures include the Coronavirus Aid, Relief, and Economic Security Act and recognized benefits totaling $123 million associated with AMT credit refunds. In 2017, FCX recorded net tax benefits related(CARES Act), signed into law by President Trump on March 27, 2020. None of these measures resulted in material impacts to specificFCX’s provision for income taxes for the year ended December 31, 2020. However, certain provisions of the CARES Act totaling $393 million, reflectingprovided FCX with the reversalopportunity to accelerate collections of valuation allowancestax refunds, primarily those associated with anticipatedthe U.S. AMT. FCX collected U.S. AMT credit refunds of AMT credits through 2021 ($272 million) and a decrease in corporate income tax rates ($121 million).
Elimination of Corporate AMT and Refund of AMT Credits. For tax years beginning after December 31, 2017, the corporate AMT was repealed. FCX has historically incurred an AMT liability in excess of regular tax liability, resulting in accumulated AMT credits totaling $490 million as of December 31, 2017. The Act allows the use of existing corporate AMT credits to offset regular tax liability for tax years after December 31, 2017. AMT credits in excess of regular liability are refundable on tax returns for the years 2018 through 2021.
Prior to the Act, FCX recognized a $110 million benefit for AMT credits expected to be refunded. As a result of the Act, FCX recognized a provisional net benefit of $272$244 million in 2017, consisting of a $380 million tax benefit for historical AMT credits expected2020. FCX expects to be refunded, partially offset by a $108 million tax charge to establish a reserve for uncertain tax positions. At December 31, 2018, FCX recognizedcollect an additional $123$24 million net benefit for historical AMT credits consisting of $51 million in additional refundable credits and $72 million in reductionwithin the next 12 months. FCX continues to reserves.
Reduction in Corporate Income Tax Rate. The Act reduced the U.S. federal corporate income tax rate from 35 percent to 21 percent. While applicable for years after December 31, 2017, existingevaluate income tax accounting guidance requires the effectsconsiderations of changes in tax rates and lawsCOVID-19 measures as they develop, including any impact on its measurement of existing deferred tax balancesassets and deferred tax liabilities. FCX will recognize any impact from COVID-19 related changes to be recognizedtax laws in the period in which the new legislation is enacted. In fourth-quarter 2017, FCX recognized this change in the federal statutory rate and recorded a provisional net benefit of $121 million, consisting of a $1.1 billion tax benefit associated with changes in related valuation allowances, partly offset by a $975 million tax charge related to existing net U.S. federal deferred tax assets and liabilities. In fourth-quarter 2018, FCX finalized the impact of this change in federal statutory rate resulting in a net zero impact, consisting of a $32 million tax benefit associated with changes in related valuation allowances offset by a $32 million tax charge related to existing net U.S. federal deferred tax assets and liabilities.
Transition Tax on Previously Deferred Foreign Earnings. Under the Act, U.S. shareholders owning at least 10 percent of a foreign subsidiary generally must recognize taxable income equal to the shareholder’s pro rata share of accumulated post-1986 historical Earnings and Profits (E&P). The portion of any E&P associated with cash or cash equivalents is taxed at a rate of 15.5 percent, while any remaining E&P is taxed at a reduced rate of 8 percent. The resulting tax liability (Transition Tax) may be reduced by available foreign tax credits. Because FCX operates in foreign jurisdictions with statutory tax rates in excess of the U.S. historical statutory tax rate of 35 percent, the December 31, 2017, Transition Tax was fully offset by foreign tax credits generated in 2017. During fourth-quarter 2018, additional guidance was released by the IRS clarifying the computation of Transition Tax liability. As a result of this additional guidance, FCX recognized a $29 million tax charge related to Transition Tax for 2018.
Anti-Base Erosion Rules. For tax years that begin after December 31, 2017, applicable taxpayers are required to pay the Base Erosion Anti-Abuse Tax (BEAT). BEAT is an alternative tax calculation that disallows deduction of certain amounts paid or accrued by a U.S. taxpayer to a foreign related party. The BEAT provisions do not currently impact FCX’s computation of U.S. federal taxable income.
The Act also included provisions to tax a new class of income called Global Intangible Low-Taxed Income (GILTI). Under the new GILTI provisions, FCX will use U.S. federal net operating loss carryforwards in current and future tax years against income that would otherwise not generate a net tax liability absent the availability of net operating losses. As a result, FCX does not consider GILTI to be a source of income against which a benefit for U.S. federal net operating losses can be realized. Under U.S. generally accepted accounting principles, FCX is allowed to make an accounting policy choice of either (i) treating taxes due on future U.S. inclusions in taxable income related to GILTI as a current period expense when incurred or (ii) factoring such amounts into the measurement of deferred taxes. FCX has elected to treat taxes due on future U.S. inclusions in taxable income related to GILTI as a current period expense when incurred.
Executive Compensation Limitation. For tax years beginning after December 31, 2017, tax deductible compensation of covered employees is limited to $1 million. In addition, the definition of covered employees is revised to include the principal executive officer, the principal financial officer, and the three other highest paid officers. If an individual is a covered employee for a tax year beginning after December 31, 2016, the individual remains a covered employee for all future years. Under a transition rule, the changes do not apply to any remuneration under specified contracts in effect on November 2, 2017. During fourth-quarter 2018, FCX determined that only immaterial adjustments were needed in relation to future disallowance of deferred executive compensation balances as of December 31, 2017.
Other. As of December 31, 2018, FCX has offset $5.4 billion of foreign source income with U.S. source losses. Under existing U.S. tax law, FCX has the ability to re-characterize $5.4 billion of future U.S. source income into foreign source income. While utilization of U.S. foreign tax credits is dependent upon FCX generating future U.S. tax liabilities within the carryforward period, this re-sourcing may permit FCX to utilize up to $1.1 billion of the $1.8 billion foreign tax credits that would otherwise expire unused.
Other Events. On December 21, 2018, FCX completed the transaction with the IndonesianIndonesia government regarding PT-FI’s long-term mining rights and share ownership. Concurrent with closing the transaction, the IndonesianIndonesia government granted PT-FI an IUPK to replace its former COW. Under the terms of the IUPK, PT-FI is subject to a 25 percent corporate income tax rate and a 10 percent profits tax on net income beginning in 2019. As a result of the change in statutory tax rate applicable to deferred income tax liabilities, during fourth-quarter 2018, FCX recognized a tax credit of $504 million.
In 2018, PT-FI received unfavorable Indonesia Tax Court decisions with respect to its appeal of capitalized mine development costs on its 2012 and 2014 corporate income tax returns. PT-FI appealed those decisions to the Indonesia Supreme Court. On October 31, 2019, the Indonesia Supreme Court communicated an unfavorable ruling regarding the treatment of mine development costs on PT-FI’s 2014 tax return. During the fourth quarter of 2019, PT-FI met with the Indonesia Tax Office and developed a framework for resolution of the disputed matters. On December 30, 2019, PT-FI made a payment of $250 million based on its understanding of the framework for resolution of disputes arising from the audits of the tax years 2012 through 2016, as well as tax years 2017 (for which a tax audit is not complete), 2018 (for which a tax audit has not begun) and 2019 (for which an audit has just begun). Additional administrative steps will need to be completed by both PT-FI and the Indonesia Tax Office in order to implement the resolution.
In 2019, in conjunction with the framework for resolution above, PT-FI recorded total net charges in 2019 of $304 million, including $123 million for non-deductible penalties recorded to other income (expense), net, $78 million for non-deductible interest recorded to interest expense and $103 million to provision for income tax expense, primarily for the impact of a reduction in the statutory rate on PT-FI’s deferred tax assets.
During fourth-quarter 2020, in connection with progress of the framework for resolution, PT-FI recorded additional net charges of $42 million, including $9 million for non-deductible penalties recorded to otherincome (expense), net and $35 million for non-deductible interest recorded to interest expense, partly offset by a benefit of $2 million to provision for income tax expense.
SUNAT (National Superintendency of Customs and Administration), the Peru national tax authority, has assessed mining royalties on ore processed by the Cerro Verde concentrator for the period December 2006 to December 2013, which Cerro Verde has contested on the basis that its 1998 stability agreement exempts from royalties all minerals extracted from its mining concessions, irrespective of the method used for processing those minerals. Refer to Note 12 for further discussion of the Cerro Verde royalty dispute and net charges recorded in 2018 and 2017.2017 through 2019.
In December 2016, the PeruvianPeru parliament passed tax legislation that, in part, modified the applicable tax rates established in its December 2014 tax legislation, which progressively decreased the corporate income tax rate from 30 percent in 2014 to 26 percent in 2019 and thereafter, and also increased the dividend tax rate on distributions from 4.1 percent in 2014 to 9.3 percent in 2019 and thereafter. Under the tax legislation, which was effective January 1, 2017, the corporate income tax rate was 29.5 percent, and the dividend tax rate on distributions of earnings was 5 percent. Cerro Verde’s current mining stability agreement subjects FCX to a stable income tax rate of 32 percent through the expiration of the agreement on December 31, 2028. The tax rate on dividend distributions is not stabilized by the agreement.
In September 2014, the ChileanChile legislature approved a tax reform package that implemented a dual tax system, which was amended in January 2016. Under previous rules, FCX’s share of income from ChileanChile operations was subject to an effective 35 percent tax rate allocated between income taxes and dividend withholding taxes. Under the
amended tax reform package, FCX’s ChileanChile operation is subject to the “Partially-Integrated System,” resulting in FCX’s share of income from El Abra being subject to progressively increasing effective tax rates of 35 percent through 2019 and 44.5 percent in 2020 and thereafter. In November 2017, the progression of increasing tax rates was delayed by the ChileanChile legislature so that the 35 percent rate continues through 2021 increasing to 44.5 percent in 2022 and thereafter. In January 2020, the Chile legislature approved a tax reform package that would further delay the 44.5 percent rate until 2027 and thereafter.
In 2010, the ChileanChile legislature approved an increase in mining royalty taxes to help fund earthquake reconstruction activities, education and health programs. Mining royalty taxes at FCX’s El Abra mine were 4 percent for the years 2013 through 2017. Beginning in 2018, and through 2023, rates moved to a sliding scale of 5 to 14 percent (depending on a defined operational margin).
Uncertain Tax Positions. FCX accounts for uncertain income tax positions using a threshold and measurement criteria for the financial statement recognition and measurement of a tax position taken or expected to be taken in a tax return. FCX’s policy associated with uncertain tax positions is to record accrued interest in interest expense and accrued penalties in other income and expense(expense), net rather than in the provision for income taxes.
A summary of the activities associated with FCX’s reserve for unrecognized tax benefits for the years ended December 31 follows:
| | | | | | | | | | | | | | | | | |
| 2020 | | 2019 | | 2018 |
| Balance at beginning of year | $ | 376 | | | $ | 404 | | | $ | 390 | |
| Additions: | | | | | |
| Prior year tax positions | 48 | | | 73 | | | 100 | |
| Current year tax positions | 10 | | | 11 | | | 14 | |
| | | | | |
| Decreases: | | | | | |
| Prior year tax positions | (60) | | | (75) | | | (86) | |
| | | | | |
| Settlements with taxing authorities | (79) | | | (37) | | | (9) | |
| Lapse of statute of limitations | 0 | | | 0 | | | (5) | |
| | | | | |
| Balance at end of year | $ | 295 | | | $ | 376 | | | $ | 404 | |
|
| | | | | | | | | | | |
| | 2018 | | 2017 | | 2016 |
| Balance at beginning of year | $ | 390 |
| | $ | 101 |
| | $ | 110 |
|
| Additions: | | | | | |
| Prior year tax positions | 100 |
| | 302 |
| | 5 |
|
| Current year tax positions | 14 |
| | 6 |
| | 28 |
|
| Decreases: | | | | | |
| Prior year tax positions | (86 | ) | | (1 | ) | | (3 | ) |
| Settlements with taxing authorities | (9 | ) | | (17 | ) | | — |
|
| Lapse of statute of limitations | (5 | ) | | (1 | ) | | (39 | ) |
| Balance at end of year | $ | 404 |
| | $ | 390 |
| | $ | 101 |
|
The total amount of accrued interest and penalties associated with unrecognized tax benefits included in the consolidated balance sheets was $186$163 million at December 31, 2018,2020, primarily relating to unrecognized tax benefits associated with royalties and other related mining taxes, and $22$231 million at December 31, 2017,2019, and $19$186 million at December 31, 2016.2018.
The reserve for unrecognized tax benefits of $404$295 million at December 31, 2018,2020, included $296$254 million ($147 ($168 million net of income tax benefits and valuation allowances) that, if recognized, would reduce FCX’s provision for income taxes. Changes in the reserve for unrecognized tax benefits associated with prior year tax positions were primarily related to uncertainties associated with non-deductible service costs, royalties and other related mining taxes and cost recovery methods. Changes to the reserve for unrecognized tax benefits associated with current year tax positions were primarily related to uncertainties associated with FCX’sFCX’s tax treatment of social welfare payments and cost recovery methods. Changes in the reserve for unrecognized tax benefits associated with prior year tax positions were primarily related to uncertainties associated with royalties and other related mining taxes and AMT credit refunds.
Changes to the reserve for unrecognized tax benefits associated with the lapse of statute of limitations were primarily related to social welfare payments. There continues to be uncertainty related to the timing of settlements with taxing authorities, but if additional settlements are agreed upon during 2019,the year 2021, FCX could experience a change in its reserve for unrecognized tax benefits.
FCX or its subsidiaries file income tax returns in the U.S. federal jurisdiction and various state and foreign jurisdictions. The tax years for FCX’s major tax jurisdictions that remain subject to examination are as follows:
| | | | | | | | | | | | | | |
| Jurisdiction | | Years Subject to Examination | | Additional Open Years |
| U.S. Federal | | 2017-2018 | | 2014-2016, 2019-2020 |
| Indonesia | | 2011-2017, 2019 | | 2018, 2020 |
| Peru | | 2014-2016 | | 2017-2020 |
| Chile | | 2018-2019 | | 2020 |
| | | | |
Jurisdiction | | Years Subject to Examination | | Additional Open Years |
U.S. Federal | | N/A | | 2014-2018 |
Indonesia | | 2008, 2011-2016 | | 2017-2018 |
Peru | | 2012-2013 | | 2014-2018 |
Chile | | 2016-2017 | | 2018 |
NOTE 12. CONTINGENCIES
Environmental. FCX subsidiaries are subject to various national, state and local environmental laws and regulations that govern emissions of air pollutants; discharges of water pollutants; generation, handling, storage and disposal of hazardous substances, hazardous wastes and other toxic materials; and remediation, restoration and reclamation of environmental contamination. FCX subsidiaries that operate in the U.S. also are subject to potential liabilities arising under CERCLA and similar state laws that impose responsibility on current and previous owners and operators of a facility for the remediation of hazardous substances released from the facility into the environment, including damages to natural resources, in some cases irrespective of when the damage to the environment occurred or who caused it. Remediation liability also extends to persons who arranged for the disposal of hazardous substances or transported the hazardous substances to a disposal site selected by the transporter. These liabilities are often shared on a joint and several basis, meaning that each responsible party is fully responsible for the remediation if some or all of the other historical owners or operators no longer exist, do not have the financial ability to respond or cannot be found. As a result, because of FCX’s acquisition of FMC in 2007, many of the subsidiary companies FCX now owns are responsible for a wide variety of environmental remediation projects throughout the U.S., and FCX expects to spend substantial sums annually for many years to address those remediation issues. Certain FCX subsidiaries have been advised by the U.S. Environmental Protection Agency (EPA), the Department of the Interior, the Department of Agriculture and various state agencies that, under CERCLA or similar state laws and regulations, they may be liable for costs of responding to environmental conditions at a number of sites that have been or are being investigated to determine whether releases of hazardous substances have occurred and, if so, to develop and implement remedial actions to address environmental concerns. FCX is also subject to claims where the release of hazardous substances is alleged to have damaged natural resources (NRD) and to litigation by individuals allegedly exposed to hazardous substances. As of December 31, 2018,2020, FCX had more than 100 active remediation projects, including NRD claims, in 2624 U.S. states.
A summary of changes in estimated environmental obligations for the years ended December 31 follows:
| | | | | | | | | | | | | | | | | |
| | 2020 | | 2019 | | 2018 |
| Balance at beginning of year | $ | 1,561 | | | $ | 1,511 | | | $ | 1,439 | |
Accretion expensea | 102 | | | 102 | | | 100 | |
Additionsb | 38 | | | 23 | | | 56 | |
Reductionsb | (58) | | | (1) | | | 0 | |
| Spending | (59) | | | (74) | | | (84) | |
| Balance at end of year | 1,584 | | | 1,561 | | | 1,511 | |
| Less current portion | (83) | | | (106) | | | (132) | |
| Long-term portion | $ | 1,501 | | | $ | 1,455 | | | $ | 1,379 | |
|
| | | | | | | | | | | |
| | 2018 | | 2017 | | 2016 |
| Balance at beginning of year | $ | 1,439 |
| | $ | 1,221 |
| | $ | 1,215 |
|
Accretion expensea | 100 |
| | 84 |
| | 81 |
|
Additionsb | 56 |
| | 241 |
| | 26 |
|
Reductionsb | — |
| | (43 | ) | | (43 | ) |
| Spending | (84 | ) | | (64 | ) | | (58 | ) |
| Balance at end of year | 1,511 |
| | 1,439 |
| | 1,221 |
|
| Less current portion | (132 | ) | | (134 | ) | | (129 | ) |
| Long-term portion | $ | 1,379 |
| | $ | 1,305 |
| | $ | 1,092 |
|
| |
a. | Represents accretion of the fair value of environmental obligations assumed in the 2007 acquisition of FMC, which were determined on a discounted cash flow basis. |
| |
b. | Adjustments to environmental obligations that do not provide future economic benefits are charged to operating income. Reductions primarily reflect revisions for changes in the anticipated scope and timing of projects and other noncash adjustments. |
a.Represents accretion of the fair value of environmental obligations assumed in the 2007 acquisition of FMC, which were determined on a discounted cash flow basis.
b.Adjustments to environmental obligations that do not provide future economic benefits are charged to operating income. Reductions primarily reflect revisions for changes in the anticipated scope and timing of projects and other noncash adjustments.
Estimated future environmental cash payments (on an undiscounted and unescalatedde-escalated basis) total $132$83 million in 2019, $1172021, $95 million in 2020, $1192022, $100 million in 2021, $882023, $100 million in 2022, $1002024, $100 million in 20232025 and $2.7$3.2 billion thereafter. The amount and timing of these estimated payments will change as a result of changes in regulatory requirements, changes in scope and timing of remediation activities, the settlement of environmental matters and as actual spending occurs.
At December 31, 2018,2020, FCX’s environmental obligations totaled $1.5$1.6 billion,, including $1.4$1.5 billion recorded on a discounted basis for those obligations assumed in the FMC acquisition at fair value. On an undiscounted and unescalatedde-escalated basis, these obligations totaled $3.3$3.7 billion. FCX estimates it is reasonably possible that these obligations could range between $2.7$3.3 billion and $3.7$4.2 billion on an undiscounted and unescalated basis.
At December 31, 2018,2020, the most significant environmental obligations were associated with the Pinal Creek site in Arizona; the Newtown Creek site in New York City; historical smelter sites principally located in Arizona, Indiana, Kansas, Missouri, New Jersey, Oklahoma and Pennsylvania; and uranium mining sites in the western U.S. The recorded environmental obligations for these sites totaled $1.3$1.4 billion at December 31, 2018.2020. FCX may also be subject to litigation brought by private parties, regulators and local governmental authorities related to these historical sites. A discussion of these sites follows.
Pinal Creek. The Pinal Creek site was listed under the Arizona Department of Environmental Quality’s (ADEQ) Water Quality Assurance Revolving Fund program in 1989 for contamination in the shallow alluvial aquifers within the Pinal Creek drainage near Miami, Arizona. Since that time, environmental remediation has been performed by members of the Pinal Creek Group, consisting of Freeport-McMoRan Miami Inc. (Miami), an indirect wholly owned subsidiary of FCX, and two other companies. Pursuant to a 2010 settlement agreement, Miami agreed to take full responsibility for future groundwater remediation at the Pinal Creek site, with limited exceptions. Remediation work consisting of groundwater extraction and treatment plus source control capping areis expected to continue for many years in the future.years.
Newtown Creek. From the 1930s until 1964, Phelps Dodge Refining Corporation (PDRC), an indirect wholly owned subsidiary of FCX, operated a copper smelter, and from the 1930s until 1984 operated a copper refinery, on the banks of Newtown Creek (the creek), which is a 3.5-mile-long waterway that forms part of the boundary between Brooklyn and Queens in New York City. Heavy industrialization along the banks of the creek and discharges from the City of New York’s sewer system over more than a century resulted in significant environmental contamination of the waterway. In 2010, EPA notified PDRC, four other companies and the City of New York that EPA considers them to be PRPs under CERCLA. The notified parties began working with EPA to identify other PRPs. In 2010, EPA designated the creek as a Superfund site, and in 2011, PDRC and five other parties (the Newtown Creek Group, NCG) entered an Administrative Order on Consent (AOC) to perform a remedial investigation/feasibility study (RI/FS) to assess the nature and extent of environmental contamination in the creek and identify potential remedial options. The parties’ RI/FS work under the AOC and their efforts to identify other PRPs are ongoing. EPA recently identified eight additional parties as PRPs forThe NCG submitted the creek. Theinitial draft RI was submitted to EPA in November 2016 and currently expects the report to be finalized in 2021. The NCG currently anticipates a draft FS is expected to be submitted to EPA by the end of 2020.for review and approval in 2024. EPA is not expected to propose a final creek-wide remedy until after the RI/FS is completed, but has recently considered allowing for interim remedial measures as suggested by the PRPs. EPA’s remedial decision could be made in 2021 and remedial design could begin in 2022, with the actual remediation construction starting several years later. In July 2019, the NCG entered into an AOC to conduct a Focused Feasibility Study (FFS) of the first two miles of the creek to support an evaluation of an interim remedy for that section of the creek (Early Action). A draft FFS was submitted to EPA in December 2019, and an EPA decision on the Early Action is currently expected in late 2021. The actual costs of fulfilling this remedial obligation and the allocation of costs among PRPs are uncertain and subject to change based on the results of the Early Action, the RI/FS, the remedy ultimately selected by EPA and related allocation determinations. The overall cost and the portion ultimately allocated to PDRC could be material to FCX. During 2017, FCX recorded charges of $138 million for revised cost estimates for the Newtown Creek environmental obligation.
Historical Smelter Sites. FCX subsidiaries and their predecessors at various times owned or operated copper, zinc and lead smelters or refineries in states including Arizona, Indiana, Kansas, Missouri, New Jersey, Oklahoma and Pennsylvania. For some of these former processing sites, certain FCX subsidiaries have been advised by EPA or state agencies that they may be liable for costs of investigating and, if appropriate, remediating environmental conditions associated with these former processing facilities. At other sites, certain FCX subsidiaries have entered into state voluntary remediation programs to investigate and, if appropriate, remediate onsiteon-site and offsiteoff-site conditions associated with the facilities. The historical processing sites are in various stages of assessment and remediation. At some of these sites, disputes with local residents and elected officials regarding alleged health effects or the effectiveness of remediation efforts have resulted in litigation of various types, and similar litigation at other sites is possible.
From 1920 until 1986, United States Metals Refining Company (USMR), an indirect wholly owned subsidiary of FCX, owned and operated a copper smelter and refinery in the Borough of Carteret, New Jersey. Since the early 1980s, the site has been the subject of environmental investigation and remediation, under the direction and supervision of the New Jersey Department of Environmental Protection. Protection (NJDEP). On-site contamination is in the later stages of remediation. In 2012, after receiving a request from NJDEP, USMR also began investigating and remediating off-site properties, which is ongoing. As a result of off-site soil sampling in public and private areas near the former Carteret smelter, FCX established an environmental obligation for known and potential off-site environmental remediation. Additional sampling and analysis is ongoing and could result in additional adjustments to the related environmental remediation obligation in future periods. The extent of contamination and potential remedial actions are uncertain and may take several years to evaluate.
On January 30, 2017, a putative class action titled Juan Duarte, Betsy Duarte and N.D., Infant, by Parents and Natural Guardians Juan Duarte and Betsy Duarte, Leroy Nobles and Betty Nobles, on behalf of themselves and all others similarly situated v. United States Metals Refining Company, Freeport-McMoRan Copper & Gold Inc. and Amax Realty Development, Inc., Docket No. 734-17, was filed in the Superior Court of New Jersey against USMR, FCX, and Amax Realty Development, Inc. The defendants removed this litigation to the U.S. District Court for the District of New Jersey, where it remains pending. In December 2017, the plaintiffs amended their complaint and FCX was dismissed as a defendantpending, and FMC was added as a defendant to the lawsuit.defendant. The suit alleges that USMR
generated and disposed of smelter waste at the site and allegedly released contaminants onsiteon-site and offsiteoff-site through discharges to surface water and air emissions over a period of decades and seeks unspecified compensatory and punitive damages for economic losses, including loss ofdiminished property value, medical monitoring, punitive damagesvalues, additional soil investigation and remediation and other damages. In October 2018,January 2020, the magistrate judge deniedparties completed briefing on the plaintiffs’ July 2018 request to amendmotion for class certification and are awaiting a decision by the complaint to rejoin FCX as a defendant, and the plaintiffs have appealed that decision.court. FCX continues to vigorously defend this matter.
As a result of off-site soil sampling in public and private areas near the former Carteret smelter, FCX increased its associated environmental obligation for known and potential off-site environmental remediation by recording a $59 million charge to operating income in 2017. Additional sampling and analysis occurred through 2018 and is ongoing and could result in additional adjustments to the related environmental remediation obligation in future periods.
Uranium Mining Sites. During a period between 1940 and the early 1970s,1980s, certain FCX subsidiaries and their predecessors were involved in uranium exploration and mining in the western U.S., primarily on federal and tribal lands in the Four Corners region of the southwest. Similar exploration and mining activities by other companies have also caused environmental impacts warranting remediation. In January 2017, the Department of Justice, EPA, Navajo Nation, and two FCX subsidiaries reached an agreement regarding the financial contribution of the U.S. Government and the FCX subsidiaries and the scope of the environmental investigation and remediation work for 94 former uranium mining sites on tribal lands. The settlementUnder the terms are outlined in aof the Consent Decree that was filedexecuted on January 17,May 22, 2017, inand approved by the U.S. District Court for the District of Arizona. Under the Consent Decree, which the U.S. Government valued at over $600 million,Arizona, the U.S. contributed $335 million into a trust fund to cover the government’s initial share of the costs, and FCX’s subsidiaries are proceeding with the environmental investigation and remediation work at the 94 sites. The program is expected to take more than 20 years to complete. Based on updated cash flow and timing estimates,In 2020, FCX reduced its associated obligation by recordingand recorded a $41$47 million credit to operating income in 2017 after receiving court approvalto reflect the discounting effect of the Consent Decree. In addition to uranium activities on tribal lands,recent and expected pace of project work under post-COVID-19 pandemic conditions. FCX is also conducting site surveys of historical uranium mining claims associated with FCX subsidiaries on non-tribal federal lands in the Four Corners region. Under a memorandum of understanding with the U.S. Bureau of Land Management (BLM), site surveys are being performed on over 10,000approximately 15,000 mining claims, ranging from undisturbed claims to claims with mining features. Based on these surveys, BLM may providehas issued no further action determinations for certain undisturbed claims or requests forclaims. BLM may request additional assessment or reclamation activities for others.other claims with mining features. FCX will update this obligation when it has a sufficient number of remedy decisions from the BLM to support a reasonably certain range of outcomes. FCX expects it will take several years to complete this work.
AROs. FCX’s ARO estimates are reflected on a third-party cost basis and are based on FCX’s legal obligation to retire tangible, long-lived assets. A summary of changes in FCX’s AROs for the years ended December 31 follows:
| | | | | | | | | | | | | | | | | | | | |
| | 2020 | | 2019 | | 2018 | |
| Balance at beginning of year | $ | 2,505 | | | $ | 2,547 | | | $ | 2,583 | | |
| | | | | | |
| Liabilities incurred | 7 | | | 20 | | | 1 | | |
| Settlements and revisions to cash flow estimates, net | (13) | | | (5) | | | 50 | | |
| Accretion expense | 131 | | | 118 | | | 110 | | |
| Dispositions | (2) | |
| (5) | | | (37) | | |
| Spending | (156) | | | (170) | | | (160) | | |
| | | | | | |
| Balance at end of year | 2,472 | | | 2,505 | | | 2,547 | | |
| Less current portion | (268) | | | (330) | | | (317) | | |
| Long-term portion | $ | 2,204 | | | $ | 2,175 | | | $ | 2,230 | | |
|
| | | | | | | | | | | | |
| | 2018 | | 2017 | | 2016 | |
| Balance at beginning of year | $ | 2,583 |
| | $ | 2,638 |
| | $ | 2,774 |
| |
| Liabilities incurred | 1 |
| | 14 |
| | 12 |
| |
| Settlements and revisions to cash flow estimates, net | 50 |
| | (112 | ) | | 529 |
| a |
| Accretion expense | 110 |
| | 124 |
| | 137 |
| |
Dispositionsb | (37 | ) |
| (10 | ) | | (626 | ) | |
| Spending | (160 | ) | | (71 | ) | | (188 | ) | |
| Balance at end of year | 2,547 |
| | 2,583 |
| | 2,638 |
| |
| Less current portion | (317 | ) | | (286 | ) | | (240 | ) | |
| Long-term portion | $ | 2,230 |
| | $ | 2,297 |
| | $ | 2,398 |
| |
| |
a. | Revisions to cash flow estimates were primarily related to revised estimates for an overburden stockpile in Indonesia and at certain oil and gas properties. |
| |
b. | Primarily reflects the sale of certain oil and gas properties. |
ARO costs may increase or decrease significantly in the future as a result of changes in regulations, changes in engineering designs and technology, permit modifications or updates, changes in mine plans, settlements, inflation or other factors and as reclamation (concurrent with mining operations or post mining) spending occurs. ARO activities and expenditures for mining operations generally are made over an extended period of time commencing near the end of the mine life; however, certain reclamation activities may be accelerated if legally required or if determined to be economically beneficial. The methods used or required to plug and abandon non-producing oil and gas wellbores; remove platforms, tanks, production equipment and flow lines; and restore wellsites could change over time.
Financial Assurance. New Mexico, Arizona, Colorado and other states, as well as federal regulations governing mine operations on federal land, require financial assurance to be provided for the estimated costs of mine reclamation and closure, including groundwater quality protection programs. FCX has satisfied financial assurance requirements by using a variety of mechanisms, primarily involving parent company performance guarantees and financial capability demonstrations, but also including trust funds, surety bonds, letters of credit and other collateral. The applicable regulations specify financial strength tests that are designed to confirm a company’s or guarantor’s financial capability to fund estimated reclamation and closure costs. The amount of financial assurance FCX subsidiaries are required to provide will vary with changes in laws, regulations, reclamation and closure
requirements, and cost estimates. At December 31, 2018,2020, FCX’s financial assurance obligations associated with these U.S. mine closure and reclamation/restoration costs totaled $1.2$1.5 billion, of which $703$860 million was in the form of guarantees issued by FCX and FMC. At December 31, 2018,2020, FCX had trust assets totaling $180$212 million (included in other assets), which are legally restricted to be used to satisfy its financial assurance obligations for its mining properties in New Mexico. In addition, FCX subsidiaries have financial assurance obligations for its oil and gas properties associated with plugging and abandoning wells and facilities totaling $545$469 million. Where oil and gas guarantees associated with the Bureau of Ocean Energy Management do not include a stated cap, the amounts reflect management’s estimates of the potential exposure.
New Mexico Environmental and Reclamation Programs. FCX’s New Mexico operations are regulated under the New Mexico Water Quality Act and regulations adopted by the Water Quality Control Commission (WQCC).Commission. In connection with discharge permits, the New Mexico Environment Department (NMED) has required each of these operations to submit closure plans for NMED’s approval. The closure plans must include measures to assure meeting applicable groundwater quality standards following the closure of discharging facilities and to abate groundwater or surface water contamination to meet applicable standards. In 2013, the WQCC adopted Supplemental Permitting Requirements for Copper Mining Facilities, which became effective on December 1, 2013, and specify closure requirements for copper mine facilities. The rules were adopted after an extensive stakeholder process in which FCX participated and were jointly supported by FCX and NMED. The New Mexico Supreme Court upheld the rules in 2018, following a challenge by certain environmental organizations and the New Mexico Attorney General. Finalized closure plans that meet the requirements of these rules will be submitted in 2019 and will result in material increases in closure costs for FCX’s New Mexico operations.
FCX’s New Mexico operations also are subject to regulation under the 1993 New Mexico Mining Act (the Mining Act) and the related rules that are administered by the Mining and Minerals Division (MMD) of the New Mexico Energy, Minerals and Natural Resources Department. Under the Mining Act, mines are required to obtain approval of plans describingreclamation plans. In 2020, the reclamationagencies approved updates to the closure plan and financial assurance instruments and completed a permit renewal for Chino.FCX expects permit renewals and updated financial assurance instruments for Tyrone to be performed following cessation of mining operations.finalized during in 2021. At December 31, 2018,2020, FCX had accrued reclamation and closure costs of $450$477 million for its New Mexico operations. Additional accruals may be required based on the state’s periodic review of FCX’s updated closure plans and any resulting permit conditions, and the amount of those accruals could be material.
Arizona Environmental and Reclamation Programs. FCX’s Arizona propertiesoperations are subject to regulatory oversight in several areas.by the ADEQ. ADEQ has adopted regulations for its aquifer protection permit (APP) program that require permits for, among other things, certain facilities, activities and structures used for mining, leaching, concentrating and smelting, and require compliance with aquifer water quality standards at an applicable point of compliance well or location during both operations and closure. The APP program also may require mitigation and discharge reduction or elimination of some discharges.
An application for an APP requires a proposed closure strategy that will meet applicable groundwater protection requirements following cessation of operations and an estimate of the implementation cost, to implement the closure strategy. An APP application specifies closure obligations, including post-closure monitoring and maintenance. Awith a more detailed closure plan must be submitted within 90 days after a permitted entity notifies ADEQ of its intent to cease operations.required at the time operations cease. A permit applicant must demonstrate its financial ability to meet the closure costs approved by ADEQ. In
2014, the state enacted legislation requiring closureClosure costs for facilities covered by APPs are required to be updated no more frequently than every six years and financial assurance mechanisms are required to be updated no more frequently than every two years. In 2016, ADEQ approved a closure plan update for Sierrita,Morenci’s APP requires updated stockpile reclamation plans by 2022, which resultedwill result in increased closure costs. Bagdad’s APP also requires an updated cost estimate for its closure plan in 2022. FCX will continue updating its closure strategy and closure cost estimates at other Arizona sites and intends to submit an updated tailings dam system closure cost for Morenci in April 2019. FCX expectsBagdad according to update the closure strategy and closure costs for Morenci’s stockpiles in 2020. FCX intendsa schedule to update Bagdad closure costs in 2021. FCX has also proposed a closure strategy and closure costs for a former leach stockpile at Bisbee (a discontinued operation), which is currently under reviewbe determined by ADEQ.
Portions of Arizona mining facilities that operated after January 1, 1986, also are subject to the Arizona Mined Land Reclamation Act (AMLRA). AMLRA requires reclamation to achieve stability and safety consistent with post-mining land use objectives specified in a reclamation plan. Reclamation plans must be approved by the State Mine Inspector and must include an estimate of the cost to perform the reclamation measures specified in the plan along with financial assurance. During 2017, Safford submitted an update to its reclamation plan to include the Lone Star expansion, which increased its reclamation costs. FCX will continue to evaluate options for future reclamation and closure activities at its operating and non-operating sites, which are likely to result in adjustments to FCX’s AROs, and those adjustments could be material. At December 31, 2018,2020, FCX had accrued reclamation and closure costs of $367$362 million for its Arizona operations.
Colorado Reclamation Programs. FCX’s Colorado operations are regulated by the Colorado Mined Land Reclamation Act (Reclamation Act) and regulations promulgated thereunder. Under the Reclamation Act, mines are required to obtain approval of plans for reclamation of lands affected by mining operations to be performed during mining or upon cessation of mining operations. During 2016, atIn December 2019, Henderson submitted an updated closure plan, which resulted in increased closure costs. In March 2020, the request of the Colorado Division of Reclamation, Mining, &and Safety the Climax mine submitted a revised cost estimate for(DRMS) approved Henderson’s proposed update to its current reclamation plan, which did not materially change the closure plan cost. In 2017, Henderson began considering alternatives for theand closure of the tailings facility and, in 2018, began evaluating potential options for long-term water treatment, which are likely to result in adjustments to FCX’s AROs, and those adjustments could be material.cost estimate. As of December 31, 2018,2020, FCX had accrued reclamation and closure costs of $61$138 million for its Colorado operations. In 2019, a bill has been introduced in the Colorado legislatureenacted legislation that requires financial assuranceproof of an end date for water treatment as a condition of permit authorizations for new mining operations and expansions beyond current permit authorizations. While this requirement does not apply to existing operations, it may lead to changes in long-term water management requirements at Climax and eliminates the potential for future permits for mining sites that include long-term water management as part
Henderson operations and AROs. In accordance with its permit from DRMS, Climax will submit an updated reclamation plan and cost estimate in 2024.
ChileanChile Reclamation and Closure Programs. In July 2011,El Abra is subject to regulation under the Chilean senate passed legislation regulating mine closure, which established new requirements for closure plans.Mine Closure Law administered by the Chile Mining and Geology Agency. In compliance with the requirement for five-year updates, in November 2018, FCX’s El Abra operation submitted an updated plan with closure cost estimates based on the existing approved closure plan. Approval is expected in 2019. This update willof the updated closure plan and cost estimates was received on August 12, 2020, and did not result in a material increase to closure costs. At December 31, 2018,2020, FCX had accrued reclamation and closure costs of $63$81 million for its El Abra operation.
PeruvianPeru Reclamation and Closure Programs. Cerro Verde is subject to regulation under the Mine Closure Law administered by the PeruvianPeru Ministry of Energy and Mines. Under the closure regulations, mines must submit a closure plan that includes the reclamation methods, closure cost estimates, methods of control and verification, closure and post-closure plans, and financial assurance. In compliance with the five yearfive-year closure plan and cost update required by the Mine Closure Law, the latest closure plan and cost estimate for the Cerro Verde mine expansion were submitted to the Peruvian regulatory authorities in 2017 and approved in February 2018. This update did not result in a material increase to closure costs. At December 31, 2018,2020, FCX had accrued reclamation and closure costs of $105$138 million for its Cerro Verde operation.
IndonesianIndonesia Reclamation and Closure Programs. The ultimate amount of reclamation and closure costs to be incurred at PT-FI’s operations will be determined based on applicable laws and regulations and PT-FI’s assessment of appropriate remedial activities inunder the circumstances, after consultation with governmental authorities, affected local residents and other affected parties and cannot currently be projected with precision. Some reclamation costs will be incurred during mining activities, while the remaining reclamation costs will be incurred at the end of mining activities, which are currently estimated to continue through 2041. At the end of 2016, PT-FI revised its estimates for an overburden stockpile to address ongoing erosion that occurred during 2016, a design change that increased the volume and updated cost estimates reflecting more recent productivity and costs at the overburden stockpile, which resulted in an increase in the ARO of $372 million. At December 31, 2018,2020, FCX had accrued reclamation and closure costs of $991$827 million for its PT-FI operations. PT-FI is currently mining
Indonesia government regulations issued in the final phase of the Grasberg
open pit and expects to transition to the underground mine in the first half of 2019. As a result, beginning in 2019, any adjustments to the costs for the overburden stockpile will impact earnings.
In December 2009, PT-FI submitted its revised mine closure plan to the Department of Energy and Mineral Resources for review and addressed comments received during the course of this review process. In December 2010 the Indonesian government issued a regulation regarding mine reclamation and closure, which requiresrequire a company to provide a mine closure guarantee in the form of a time deposit placed in a state-owned bank in Indonesia. In December 2018, PT-FI, in conjunction with the issuance of the IUPK, submitted a revised mine closure plan to Indonesia’s Department of Energy and Mineral Resources to reflect the extension of operations to 2041. At December 31, 2018,2020, PT-FI funded $90 million into ahad restricted time deposit accountdeposits for mine closure guarantees ($94 million) and $11 million for reclamation guarantees.guarantees ($2 million).
In October 2017, Indonesia’s Ministry of Environment and Forestry (the MOEF) notified PT-FI of administrative sanctions related to certain activities the MOEF indicated arewere not reflected in itsPT-FI’s environmental permit. The MOEF also notified PT-FI that certain operational activities were inconsistent with factors set forth in its environmental permitting studies and that additional monitoring and improvements need to be undertaken related to air quality, water drainage, treatment and handling of certain wastes, and tailings management. In December 2018, the MOEF issued a revised environmental permit to PT-FI to address many of the operational activities that it alleged were inconsistent with earlier studies. The remaining administrative sanctions are being resolved through adoption of revised practices and, in a few situations, PT-FI has agreed with the MOEF on an appropriate multi-year work plan, including the closure of an overburden stockpile. In addition, PT-FI continues to work with MOEF to finalize environmental permitting related to the rail facilities and certain of the underground mining production operations as well as permitting for the extension of levees to contain the lateral flow of tailings in the lowlands.
In December 2018, PT-FI and the MOEF also established a new framework for continuous improvement in environmental practices in PT-FI’s operations, including initiatives that PT-FI will pursue to increase tailings retention and to evaluate large-scale beneficial uses of tailings within Indonesia. The MOEF issued a new decree that incorporates various initiatives and studies to be completed by PT-FI that would target continuous improvement in a manner that would not impose new technical risks or significant long-term costs to PT-FI’s operations. The new framework enables PT-FI to maintain compliance with site-specific standards and provides for ongoing monitoring by the MOEF. In 2018, PT-FI recorded a $32 million charge for MOEF assessments of prior period permit fees. In 2020, the final settlement for these permit fees with the MOEF.totaled $13 million and PT-FI recorded a credit of $19 million.
Oil and Gas Properties. Substantially all of FM O&G’s oil and gas leases require that, upon termination of economic production, the working interest owners plug and abandon non-producing wellbores, remove equipment and facilities from leased acreage, and restore land in accordance with applicable local, state and federal laws. Following several sales transactions, in 2016, 2017 and 2018, FM O&G’s remaining operating areas primarily include offshore California and onshore in South Louisiana as
the Gulf of Mexico (GOM). As of December 31, 2018.2020, FM O&G AROs cover approximately 210165 wells and 120 platforms and other structures. At December 31, 2018, FM O&Gstructures and it had accrued $476 million associated with its AROs.reclamation and closure costs of $410 million.
Litigation. FCX is involved in numerousIn addition to the material pending legal proceedings that arise in the ordinary course of business ordiscussed below and above under “Environmental”, we are associated with environmental issues as discussed in this note under “Environmental.” FCX is also involved periodically in reviews, inquiries, investigationsordinary routine litigation incidental to our business and other proceedings initiated by or involving government agencies,not required to be disclosed, some of which may result in adverse judgments, settlements, fines, penalties, injunctions or other relief. SEC regulations require us to disclose environmental proceedings involving a governmental authority if we reasonably believe that such proceedings may result in monetary sanctions above a stated threshold. Pursuant to the SEC regulations, we use a threshold of $1 million for purposes of determining whether disclosure of any such environmental proceedings is required. Management does not believe, based on currently available information, that the outcome of any current pending legal proceeding will have a material adverse effect on FCX’s financial condition, although individual or cumulative outcomes could be material to FCX’s operating results for a particular period, depending on the nature and magnitude of the outcome and the operating results for the period.
FM O&G LLC, an indirect wholly owned subsidiaryLouisiana Parishes Coastal Erosion Cases. Certain FCX affiliates were named as defendants, along with numerous co-defendants, in 13 cases out of a total of 42 cases filed in Louisiana state courts by six south Louisiana parishes (Cameron, Jefferson, Plaquemines, St. Bernard, St. John the Baptist and Vermilion), alleging that certain oil and gas exploration and production operations and sulphur mining and production operations in coastal Louisiana contaminated and damaged coastal wetlands and caused significant land loss along the Louisiana coast. The state of Louisiana, through the Attorney General and separately through the Louisiana Department of Natural Resources, intervened in the litigation in support of the parishes’ claims. Specifically, the cases alleged the defendants failed to obtain and/or comply with required coastal use permits in violation of the Louisiana State and Local Coastal Resources Management Act of 1978, and sought unspecified damages for the alleged statutory violations, and restoration of the properties at issue to their original condition. Certain FCX affiliates were named as defendants in two of the five cases that had been set for trial, both originally filed on November 8, 2013: Parish of Plaquemines v. ConocoPhillips Company et al., 25th Judicial District Court, Plaquemines Parish, Louisiana; No. 60-982, Div. B and Parish of Plaquemines v. Hilcorp Energy Company et al., 25th Judicial District Court, Plaquemines Parish, Louisiana; No. 60-999, Div. B. In 2019, affiliates of FCX isreached an agreement in principle to settle all 13 cases. The maximum out-of-pocket settlement payment will be $23.5 million with the initial payment of $15 million to be paid upon execution of the settlement agreement. The initial payment will be held in trust and later deposited into a defendantnewly formed Coastal Zone Recovery Fund (the Fund) once the state of Louisiana passes enabling legislation to establish the Fund. The settlement agreement will also require the FCX affiliates to pay into the Fund twenty annual installments of $4.25 million beginning in 2023 provided the state of Louisiana passes the enabling legislation. The first two of those annual installments are conditioned only on the enactment of the enabling legislation within three years of execution of the settlement agreement, but all subsequent installments are also conditioned on the FCX affiliates receiving simultaneous reimbursement on a purported class action titled David Garcia v. Freeport-McMoRan Oil & Gas LLC filed on April 1, 2016,dollar-for-dollar basis from the proceeds of environmental credit sales generated by the Fund, resulting in the Superior Court$23.5 million maximum total payment obligation. The settlement agreement must be executed by all parties, including authorized representatives of the Statesix south Louisiana parishes originally plaintiffs in the suit and certain other non-plaintiff Louisiana parishes and the state of CaliforniaLouisiana. The agreement in principle does not include any admission of liability by FCX or its affiliates. FCX recorded a charge in 2019 for the Countyinitial payment of Santa Barbara (Case No. 16CV01305)$15 million, which will be paid upon execution of the settlement agreement. The settlement agreement has been executed by the FCX affiliates and subsequently removedseveral of the Louisiana parishes. FCX expects the agreement to be executed by all parties; however, execution has been delayed by the ongoing COVID-19 pandemic, fall 2020 elections and changes to the U.S. District Court for the Central District of California (the District Court). The plaintiff, a former FM O&G LLC employee who worked on offshore production platforms in federal waters, alleged violations of various California wage and hour laws and sought relief for past wages, overtime, penalties, interest and attorney’s fees. The case was dismissedadministrative structure developed by the District Court onLouisiana parishes. Upon execution of the basis that federal law, not state law, applied,settlement agreement by all parties, the FCX affiliates will be fully released and the complaint alleged no violations of federal law. The dismissal was appealed by the plaintiff to the U.S. Court of Appeals for the Ninth Circuit where the case is currently stayed in deference to the ongoing appeal of a similar case. Based on recent developments, FCX has concluded that its exposure in the Garcia case is not material to its consolidated financial statements.dismissed from all 13 pending cases.
Asbestos and Talc Claims.Claims. Since approximately 1990, various FCX affiliates have been named as defendants in a large number of lawsuits alleging personal injury from exposure to asbestos or talc allegedly contained in industrial products such as electrical wire and cable, raw materials such as paint and joint compounds, talc-based lubricants used in rubber manufacturing or from asbestos contained in buildings and facilities located at properties owned or operated by affiliates of FCX. Many of these suits involve a large number of codefendants. Based on litigation results to date and facts currently known, FCX believes there is a reasonable possibility that losses may have been incurred related to these matters; however, FCX also believes that the amounts of any such losses, individually or in the aggregate, are not material to its consolidated financial statements. There can be no assurance that future developments will not alter this conclusion.
There has been a recent significant increase in the number of cases alleging the presence of asbestos contamination in talc-based cosmetic and personal care products and in cases alleging exposure to talc products that are not alleged
to be contaminated with asbestos. In these cases, plaintiffs allege serious health risks and often fatal diseases, including mesothelioma and ovarian cancer, allegedly caused by long-term use of talc-based cosmetic and personal care products. Nationwide trial results in these cases have ranged from outright dismissals to large jury awards of both compensatory and punitive damages. The primary targets have been the producers of those products, but defendants in many of these cases also include talc miners. Cyprus Amax Minerals Company (CAMC), an indirect wholly owned subsidiary of FCX, is one of those targets. One of CAMC’s wholly owned subsidiaries,and Cyprus Mines Corporation (Cyprus Mines), a wholly owned subsidiary of CAMC, are among those targets. Cyprus Mines was involvedengaged in talc mining and processing from 1964 until 1992 when it exited its talc business by conveying it to a third party in two related transactions. Those transactions involved (1) a transfer by Cyprus Mines of the assets of its talc business to a newly formed subsidiary that business.assumed all pre-sale and post-sale talc liabilities, subject to limited reservations, and (2) a sale of the stock of that subsidiary to the third party. In 2011, the third party sold that subsidiary to Imerys Talc America (Imerys), an affiliate of Imerys S.A. In accordance with the terms of the 1992 transactions and subsequent agreements, Imerys undertook the defense and indemnification of Cyprus Mines and CAMC in talc lawsuits.
Cyprus Mines has contractual indemnification rights, subject to limited reservations, against the ultimate successor to the business,Imerys, which has historically acknowledged those indemnification obligations and has takentook responsibility for all cases tendered to it to date.it. However, on February 13, 2019, the indemnitorImerys filed for Chapter 11 bankruptcy protection, which triggered an immediate automatic stay under the federal bankruptcy code prohibiting any party from continuing or initiating litigation or asserting new claims against Imerys. As a result, Imerys stopped defending the talc lawsuits against Cyprus Mines and CAMC. In addition, Imerys took the position that it alone owns, and has the sole right to access, the proceeds of the legacy insurance coverage of Cyprus Mines and CAMC for talc liabilities. In late March 2019, Cyprus Mines and CAMC challenged this position and obtained emergency relief from the bankruptcy court to gain access to the insurance until the question of ownership and contractual access could be decided in an adversary proceeding before the bankruptcy court, which is incurrently on hold.
FCX recorded legal defense and settlement costs associated with talc-related litigation totaling approximately $24 million for the very early stagesyear 2020 and $28 million for the year 2019. Multiple trials previously scheduled during 2020 were postponed because of evaluating the ongoing COVID-19 pandemic. Postponed cases may be reset prior to the adversary proceeding regarding the legacy insurance, which is currently on hold.
On December 22, 2020, Imerys filed an amended bankruptcy plan disclosing a global settlement with Cyprus Mines and CAMC, which provides a framework for a full and comprehensive resolution of all current and future potential implicationsliabilities arising out of that filing. To date, no judgments have been renderedthe Cyprus Mines talc business, including claims against FCX, its affiliates, Cyprus Mines, and CAMC.
On January 21 2021, Imerys sought an injunction temporarily staying approximately 950 talc-related lawsuits against CAMC and FCX believes that CAMC has strong defenses. Accordingly, FCX currently believesCyprus Mines and the losses, if any, relatedbankruptcy court is expected to these cases, individually orrule on the injunction in February 2021. The interim stay is a component of the aggregate, are not material to its consolidated financial statements. Thereglobal settlement but there can be no assurance that the bankruptcy court will impose the interim stay.
On January 23, 2021, Imerys filed the form of a settlement and release agreementto be entered into by CAMC, Cyprus Mines, FCX, Imerys and the other debtors, tort claimants’ committee and future developmentsclaims representative in the Imerys bankruptcy. In accordance with the global settlement, among other things, (1) CAMC will not alter this conclusion.pay a total of $130 million in cash to a settlement trust in seven annual installments, which will be guaranteed by FCX; (2) CAMC and Cyprus Mines and their affiliates will contribute to the settlement trust all rights that they have to the proceeds of certain legacy insurance policies as well as indemnity rights they have against Johnson & Johnson, and (3) Cyprus Mines will file for Chapter 11 bankruptcy protection with CAMC paying expenses of Cyprus Mines’ bankruptcy process. On February 11, 2021, Cyprus Mines filed for Chapter 11 bankruptcy protection. FCX has concluded that it has a probable loss and recorded a $130 million charge to environmental obligations and shutdown costs in 2020.
The global settlement is subject to, among other things, bankruptcy court approvals of both the Imerys bankruptcy plan and the Cyprus Mines bankruptcy plan, and there can be no assurance that the global settlement will be successfully implemented.
Tax and Other Matters. FCX’s operations are in multiple jurisdictions where uncertainties arise in the application of complex tax regulations. Some of these tax regimes are defined by contractual agreements with the local government, while others are defined by general tax laws and regulations. FCX and its subsidiaries are subject to reviews of its income tax filings and other tax payments, and disputes can arise with the taxing authorities over the interpretation of its contracts or laws. The final taxes paid may be dependent upon many factors, including negotiations with taxing authorities. In certain jurisdictions, FCX must paypays a portion of the disputed amount to the local government in order tobefore formally appeal theappealing an assessment. Such payment is recorded as a receivable if FCX believes the amount is collectible.
Cerro Verde Royalty Dispute. SUNAT has assessed mining royalties on ore processed by the Cerro Verde concentrator, which commenced operations in late 2006, for the period December 2006 to December 2013. No assessments can be issued for years after 2013, as Cerro Verde hasbegan paying royalties on all of its production in January 2014 under its new 15-year stability agreement. Cerro Verde contested each of these assessments because it believes that its 1998 stability agreement exempts from royalties all minerals extracted from its mining concession, irrespective of the method used for processing such minerals. No assessments can be issued for years after 2013, as Cerro Verde began paying royalties on all of its production in January 2014 under its new 15-year stability agreement. Since 2014, Cerro Verde has been paying the disputed assessments for the period from December 2006 through December 20082013 under an installment program ($188 million paid bypayment programs provided under Peru law. Through December 31, 2020, Cerro Verde through December 31, 2018). Cerro Verde will also begin making monthly payments beginning in second-quarter 2019has paid $477 million under a 66-monththese installment payment plan related to assessments for the period January 2009 through September 2011.programs.
In October 2017, the PeruvianPeru Supreme Court issued a ruling in favor of SUNAT that the assessments of royalties for the year 2008 on ore processed by the Cerro Verde concentrator were proper under PeruvianPeru law. As a result of the unfavorable PeruvianPeru Supreme Court ruling, Cerro Verde recorded net charges of $186 million in 2017 (consisting of pre-tax charges of $348 million and $7 million of net tax charges, net of $169 million of noncontrolling interests) primarily for royalty assessments for the period December 2006 through the year 2013, penalties and interest related to assessments for the period December 2006 through the year 2008, and other related items that Cerro Verde would have incurred under the view that its concentrator was not stabilized.
2017. In September 2018, the PeruvianPeru Tax Tribunal denied Cerro Verde’s request to waive penalties and interest, primarily associated with the disputed assessments for the period January 2009 through September 2011. In December 2018, Cerro Verde elected not to appeal the PeruvianPeru Tax Tribunal’s decisions, and is continuing to evaluate alternative strategies to defend its rights, including international arbitration. Asas a result, Cerro Verde recorded net charges for these amounts in 2018.
As of $211 million in 2018 (consistingDecember 31, 2019, Cerro Verde had recorded all of pre-taxits exposure associated with disputed royalties for prior years with the Peru tax authorities. Cumulative charges to net income recorded during the three years ended December 31, 2019, totaled $388 million. Any future recoveries would be recorded when collected.
A summary of $420 million,the charges recorded for the three-years ended December 31, 2019, related to the Cerro Verde royalty dispute follows:
| | | | | | | | | | | | | | | | | | | | | | | | | | | | | | | | | | |
| Royalty and related assessment charges: | | | | 2019 | | 2018a | | 2017 | | Total | |
| Production and delivery | | | | $ | 6 | | | $ | 14 | | | $ | 203 | | b | $ | 223 | | |
| Interest expense, net | | | | 10 | | | 370 | | | 145 | | | 525 | | |
| Other expense | | | | 0 | | | 22 | | | 0 | | | 22 | | |
| (Benefit from) provision for income taxes | | | | (2) | | | (35) | | | 7 | | c | (30) | | |
| Net loss attributable to noncontrolling interests | | | | (7) | | | (176) | | | (169) | | | (352) | | |
| | | | | $ | 7 | | | $ | 195 | | | $ | 186 | | | $ | 388 | | |
a.Amounts are net of $18 million of tax benefits and $191 million of noncontrolling interests) primarily for penalties and interest related to assessments for the years 2009 through 2013 and other related items.
Cerro Verde also recognized a net gaingains of $16 million (consisting of pre-tax gains of $14 million and net tax benefits of $17 million, net of $15 million in noncontrolling interests) in 2018 for refunds received for the overpayment of special (voluntary) levies (GEM) for the period October 2012 through the year 2013. Cerro Verde has also submitted a refund request
b.Includes $175 million related to disputed royalty assessments for the remainderperiod from December 2006 to September 2011 (when royalties were determined based on revenues).
c.Includes tax charges of the GEM assessments$136 million for disputed royalties ($69 million) and other related mining taxes ($67 million) for the period October 2011 through September 2012 totaling $57the year 2013 when royalties were determined based on operating income, mostly offset by a tax benefit of $129 million but will not record a receivableassociated with disputed royalties and other related mining taxes for this amount until the request is granted by SUNAT.period December 2006 through December 2013.
As of December 31, 2018, Cerro Verde has also recorded all of its exposureother interest charges associated with royalty matters, including installment payment programs, totaling $44 million in 2020 and $58 million in 2019.
On February 28, 2020, FCX filed on its royalty dispute with the Peruvian tax authoritiesown behalf and will continue to record interest charges until all obligations are settled. Any future recoveries would be recorded when collected.
A summaryon behalf of the charges recorded in 2018 and 2017 for the Cerro Verde royalty dispute follows:international arbitration proceedings against the Peru government. In April 2020, SMM Cerro Verde Netherlands B.V., another shareholder of Cerro Verde, filed a parallel arbitration proceeding under a different investment treaty against the Peru government.
|
| | | | | | | | | | | | | | |
| Royalty and related assessment charges: | | 2018a | | 2017 | | Total | |
| | Production and delivery | | $ | 14 |
| | $ | 203 |
| b | $ | 217 |
| |
| | Interest expense, net | | 370 |
| | 145 |
| | 515 |
| |
| | Other expense | | 22 |
| | — |
| | 22 |
| |
| | (Benefit from) provision for income taxes | | (35 | ) | | 7 |
| c | (28 | ) | |
| Net loss attributable to noncontrolling interests | | (176 | ) | | (169 | ) | | (345 | ) | |
| | | | $ | 195 |
| | $ | 186 |
| | $ | 381 |
| |
| |
a. | Amounts are net of gains from the refund of GEM for the period October 2012 through the year 2013. |
| |
b. | Includes $175 million related to disputed royalty assessments for the period from December 2006 to September 2011 (when royalties were determined based on revenues). |
| |
c. | Includes tax charges of $136 million for disputed royalties ($69 million) and other related mining taxes ($67 million) for the period October 2011 through the year 2013 when royalties were determined based on operating income, mostly offset by a tax benefit of $129 million associated with disputed royalties and other related mining taxes for the period December 2006 through December 2013. |
Other PeruvianPeru Tax Matters. Cerro Verde has also received assessments from SUNAT for additional taxes, penalties and interest related to various audit exceptions for income and other taxes. Cerro Verde has filed or will file objections to the assessments because it believes it has properly determined and paid its taxes. A summary of these assessments follows:
| | | | | | | | | | | | | | | | | | | | | | | |
| Tax Year | | Tax Assessment | | Penalty and Interest Assessment | | Total | |
| 2003 to 2008 | | $ | 50 | | | $ | 129 | | | $ | 179 | | |
| 2009 | | 56 | | | 52 | | | 108 | | |
| 2010 | | 54 | | | 118 | | | 172 | | |
| 2011 and 2012 | | 42 | | | 78 | | | 120 | | |
| 2013 | | 48 | | | 66 | | | 114 | | |
| 2014 to 2020 | | 45 | | | 0 | | | 45 | | |
| | $ | 295 | | | $ | 443 | | | $ | 738 | | |
|
| | | | | | | | | | | | | |
| Tax Year | | Tax Assessment | | Penalty and Interest Assessment | | Total | |
| 2003 to 2008 | | $ | 56 |
| | $ | 130 |
| | $ | 186 |
| |
| 2009 | | 57 |
| | 51 |
| | 108 |
| |
| 2010 | | 63 |
| | 105 |
| | 168 |
| |
| 2011 | | 49 |
| | 65 |
| | 114 |
| |
| 2014 to 2018 | | 32 |
| | — |
| | 32 |
| |
| | | $ | 257 |
| | $ | 351 |
| | $ | 608 |
| |
As of December 31, 2018,2020, Cerro Verde had paid $386$433 million on these disputed tax assessments. A reserve has been applied against these payments totaling $203$243 million, resulting in a net receivable of $183$190 million(included in other assets), which Cerro Verde believes is collectible.
Indonesia Tax Matters.PT-FI has received assessments from the IndonesianIndonesia tax authorities for additional taxes and interest related to various audit exceptions for income and other taxes. PT-FI has filed objections to the assessments because it believes it has properly determined and paid its taxes. Excluding surface water and withholding tax assessments discussed below and the IndonesianIndonesia government’s previous imposition of a 7.5 percent export duty that PT-FI paid under protest during the period April 2017 to December 21, 2018 (refer to Note 13), a summary of these assessments follows:
| | | | | | | | | | | | | | | | | | | | |
| Tax Year | | Tax Assessment | | Interest Assessment | | Total |
| 2005 | | $ | 62 | | | $ | 30 | | | $ | 92 | |
| | | | | | |
| 2007 | | 48 | | | 23 | | | 71 | |
| 2008, 2010 to 2011 | | 31 | | | 8 | | | 39 | |
| | | | | | |
| | | | | | |
| 2012 | | 97 | | | 0 | | | 97 | |
| 2013 | | 152 | | | 76 | | | 228 | |
| 2014 | | 123 | | | 0 | | | 123 | |
| 2015 | | 159 | | | 0 | | | 159 | |
| 2016 | | 257 | | | 113 | | | 370 | |
| 2017 | | 40 | | | 19 | | | 59 | |
| | $ | 969 | | | $ | 269 | | | $ | 1,238 | |
|
| | | | | | | | | | | | |
| Tax Year | | Tax Assessment | | Interest Assessment | | Total |
| 2005 | | $ | 73 |
| | $ | 35 |
| | $ | 108 |
|
| 2007 | | 47 |
| | 23 |
| | 70 |
|
| 2008, 2010 to 2011 | | 55 |
| | 37 |
| | 92 |
|
| 2012 | | 124 |
| | — |
| | 124 |
|
| 2013 | | 154 |
| | 74 |
| | 228 |
|
| 2014 | | 139 |
| | 6 |
| | 145 |
|
| 2015 | | 158 |
| | — |
| | 158 |
|
| 2016 | | 266 |
| | 113 |
| | 379 |
|
| | | $ | 1,016 |
| | $ | 288 |
| | $ | 1,304 |
|
As of December 31, 2018,2020, PT-FI had paid $493$143 million (included in other assets) on disputed tax assessments, which it believes is collectible.
Surface Water Taxes. PT-FI received assessments from the local regional tax authority in Papua, Indonesia, for additional taxes and penalties related to surface water taxes for the period from January 2011 through December 2018. As a result, PT-FI has filed oroffered to pay 1000000000000 rupiah to settle these historical surface water tax disputes and charged $69 million to production and delivery costs in December 2018. In May 2019, PT-FI agreed to a final settlement of 1.394 trillion rupiah (approximately $99 million) and recorded an incremental charge of $28 million. PT-FI paid 708.5 billion rupiah ($50 million) in October 2019, and will file appealspay the balance of these assessments with the Indonesia Tax Court. During the first half of 2018 and in fourth-quarter 2018, the Indonesia Tax Court ruled partially in favor of PT-FI with respect to assessments for the period January 2016 through April 2017 by reducing these assessments from $80685.5 billion rupiah ($49 million including penalties, to $48 million, including penalties (basedbased on the exchange rate at December 31, 2018), or an approximate 40 percent reduction.
During 2017, PT-FI filed reconsideration request petitions to2020, and included in accounts payable and accrued liabilities in the Indonesia Supreme Court with respect to assessments for the period from January 2011 through December 2015; and in second-quarter 2018, filed reconsideration request petitions with respect to the Indonesia Tax Court decisions related to the assessments for the period from January 2016 through April 2016. In second-quarter 2018, the Indonesia Supreme Court issued favorable decisions relating to surface water tax assessments for the period January 2011 through July 2015. The Indonesia Supreme Court ruling concluded that PT-FI and the Indonesian government are bound by PT-FI’s former COW, which is lex specialis, and prevails as the law for the parties to the former COW that should be carried out in good faith. As a result, FCX estimates the total amount of the assessments, including penalties, (based on the exchange rateconsolidated balance sheet at December 31, 2018) for the period from August 2015 through December 2018 totals $174 million, including $87 million2020) in penalties. In accordance with its IUPK discussed in Note 13, PT-FI is obligated to pay surface water taxes of $15 million annually, beginning in 2019. In addition, PT-FI has offered to pay one trillion rupiah ($69 million based on the exchange rate as of December 31, 2018) to settle historical disputes regarding surface water taxes, which was charged to production and delivery costs in December 2018.2021.
In September 2018, PT-FI received an unfavorable decision from the Indonesian Tax Court with respect to its appeal of disallowed items on its 2012 corporate income tax return. The most significant disallowed item relates to the tax treatment of mine development costs. A similar decision on PT-FI’s 2014 corporate income tax return was announced in October 2018. PT-FI has filed or will file appeals related to these decisions to the Indonesian Supreme Court because it believes the former COW is explicit about the tax treatment associated with mine development costs. No adjustments have been recorded for this matter as of December 31, 2018, because FCX believes PT-FI has properly determined and paid its taxes. As of December 31, 2018, PT-FI had long-term receivables totaling approximately $350 million related to this matter, and no reserves have been recorded for these receivables. FCX estimates the potential exposure for penalties for the years 2013, 2016 and 2017, in which the Indonesian tax authorities may assert that PT-FI has underpaid income taxes, totals $251 million based on the exchange rate as of December 31, 2018.
Export Duty Matter. In April 2017, PT-FI entered into a memorandum of understanding with the IndonesianIndonesia government (the 2017 MOU) confirming that the former COW would continue to be valid and honored until replaced by a mutually agreed IUPK and investment stability agreement. In the 2017 MOU, PT-FIagreement and agreed to continue to pay aexport duties of 5 percent on copper concentrate export duty during this period.sales until completion of the divestment and new IUPK. Subsequently, the Customs Office of the Minister of Finance refused to recognize the 5 percent export duty agreed to under the 2017 MOU and imposed a 7.5 percent export duty under the Ministry of Finance regulations, whichregulations. PT-FI paid $155 million under protest during the period April 2017 toand December 21, 2018. PT-FI is disputing2018, and appealed the incremental 2.5 percent export duty whiledisputed amounts to the matter is pending inIndonesia Tax Court. The Indonesia Tax Court proceedings, and amounts paid are being held in a restricted cash account or in a current or long-term receivable in the consolidated balance sheets ($144 million at December 31, 2018, consisting of $15 millionin income and other tax receivables, $7 million in other current assets and $122 million in other assets; and $38 million at December 31, 2017, consisting of $22 million in other current assets and $16 million in other assets) that PT-FI expects to have released or refunded in full once the matter is resolved. In December 2018, the Indonesia Tax Court announced a rulingsubsequently ruled in favor of PT-FI related to $15the cases involving $29 million of the disputed export duties,amounts, which were refunded by the Indonesia Customs Office to PT-FI. The Indonesia
Customs Office appealed the Indonesia Tax Court decisions on these cases to the Indonesia Supreme Court. On October 29, 2019, the Indonesia Supreme Court posted on its website rulings unfavorable to PT-FI expects to collect in 2019. Under the termsfor certain of the IUPK,appealed cases involving approximately half of the $29 million that had been refunded to PT-FI. As a result of the October 2019 ruling, FCX recorded a charge of $155 million in 2019 to fully reserve for this matter. PT-FI is subjectcontinues to anbelieve that a 5 percent export duty until smelter development reaches 50 percent, at which time the export duty will be eliminated (referwas applicable during this period and is evaluating options to Note 13 for export duty rates).recover these overpayments.
Withholding Tax Assessments. In January 2019, PT-FI noted that the IndonesianIndonesia Supreme Court posted on its website an unfavorable decision related to a PT-FI 2005 withholding tax matter. PT-FI had also received an unfavorable IndonesianIndonesia Supreme Court decision in November 2017 and has other pending cases at the IndonesianIndonesia Supreme Court related to withholding taxes for employees and other service providers for the year 2005 and the year 2007, which total approximately $61$47 million (based on the exchange rate as of December 31, 2018)2020, and included in accounts payable and accrued liabilities in the consolidated balance sheet at December 31, 2020), including penalties and interest. As a result of the January 2019 ruling, PT-FI concluded a loss on all outstanding withholding tax matters is probable under applicable accounting guidance, and it recorded a charge of $61 million in 2018.
For information regarding PT-FI mine development cost tax matters, refer to Note 11.
Smelter Development Progress. As a result of COVID-19 mitigation measures, there have been disruptions to work and travel schedules of international contractors and restrictions on access to the proposed physical site of the new smelter in Gresik, Indonesia. PT-FI continues to discuss with the Indonesia government a deferred schedule for the new smelter project as well as other alternatives in light of the ongoing COVID-19 pandemic and volatile global economic conditions.
On January 7, 2021, the Indonesia government levied an administrative fine of $149 million for the period from March 30, 2020, through September 30, 2020 (additional fines could be levied on exports after September 30, 2020), on PT-FI for failing to achieve physical development progress on the new smelter as of July 31, 2020. On January 13, 2021, PT-FI responded to the Indonesia government objecting to the fine because of events outside of its control causing a delay of the new smelter’s development progress. PT-FI believes that its communications during 2020 with the Indonesia government were not properly considered before the administrative fine was levied. PT-FI and its legal counsel believe, upon consideration of all the facts, PT-FI is not obligated to pay the fine and, therefore, it has not recorded an accrual for this loss contingency.
Letters of Credit, Bank Guarantees and Surety Bonds. Letters of credit and bank guarantees totaled$528671 million at December 31, 2018,2020, primarily for environmental and asset retirement obligations,AROs, the Cerro Verde royalty dispute (refer to discussion above), workers’ compensation insurance programs, tax and customs obligations, and other commercial obligations. In addition, FCX had surety bonds totaling $342$437 million at December 31, 2018,2020, primarily associated with environmental and asset retirement obligations.AROs.
Insurance. FCX purchases a variety of insurance products to mitigate potential losses, which typically have specified deductible amounts or self-insured retentions and policy limits. FCX generally is self-insured for U.S. workers’ compensation, but purchases excess insurance up to statutory limits. An actuarial analysis is performed twice a year on the various casualty insurance programs covering FCX’s U.S.-based mining operations, including workers’ compensation, to estimate expected losses. At December 31, 2018,2020, FCX’s liability for expected losses under these insurance programs totaled $60$50 million,, which consisted of a current portion of $11$9 million (included in accounts payable and accrued liabilities) and a long-term portion of $49$41 million (included in other liabilities). In addition, FCX has receivables of $15$14 million (a current portion of $2$5 million included in other accounts receivable and a long-term portion of $13$9 million included in other assets) for expected claims associated with these losses to be filed with insurance carriers.
FCX’s oil and gas operations are subject to all of the risks normally incident to the production of oil and gas, including well blowouts, cratering, explosions, oil spills, releases of gas or well fluids, fires, pollution and releases of toxic gas, each of which could result in damage to or destruction of oil and gas wells, production facilities or other property, or injury to persons. While FCX is not fully insured against all risks related to its oil and gas operations, its insurance policies provide limited coverage for losses or liabilities relating to pollution, with broader coverage for sudden and accidental occurrences. FCX is self-insured for named windstorms in the GOM.
NOTE 13. COMMITMENTS AND GUARANTEES
Operating Leases.Effective January 1, 2019, FCX adopted the new ASU for lease accounting. FCX leases various types of properties, including offices and equipment. Future minimum rentalsequipment under non-cancelable leases. Nearly all of FCX’s leases at were considered operating leases under the new ASU.
The components of FCX’s leases presented in the consolidated balance sheet for the years ended December 31 follow:
| | | | | | | | | | | | | |
| | | | | |
| December 31, | | |
| 2020 | | 2019 | | |
| Lease right-of-use assets (included in property, plant, equipment and mine development costs, net) | $ | 207 | | | $ | 232 | | | |
| | | | | |
Short-term lease liabilities (included in accounts payable and accrued liabilities) | $ | 38 | | | $ | 44 | | | |
| Long-term lease liabilities (included in other liabilities) | 190 | | | 204 | | | |
| Total lease liabilities | $ | 228 | | | $ | 248 | | | |
| | | | | |
| | | | | |
Operating lease costs, primarily included in production and delivery expense in the consolidated statement of operations, for the two years ended December 31 follow:
| | | | | | | | | | | | | | | |
| | | 2020 | | 2019 |
| | | | | |
| Operating leases | | | $ | 42 | | | $ | 55 | |
| | | | | |
| Variable and short-term leases | | | 74 | | | $ | 79 | |
| Total operating lease costs | | | $ | 116 | | | $ | 134 | |
| | | | | |
| | | | | |
| | | | | |
| | | | | |
| | | | | |
| | | | | |
| | | | | |
| | | | | |
| | | | | |
| | | | | |
| | | | | |
Prior to the adoption of the new ASU, lease costs totaled $80 million in 2018, total $53 (FCX elected the practical expedient not to adjust that year).
FCX paid $40 million during 2020 and $43 million in 2019 $42 millionfor lease liabilities recorded in 2020, $38 millionthe consolidated balance sheet (primarily included in 2021, $32 millionoperating cash flows in 2022, $29 million in 2023 and $171 million thereafter. Minimum payments under operating leases have not been reduced by aggregate minimum sublease rentals, which are minimal. Total aggregate rental expense under operating leases was $80 million in 2018, $59 million in 2017 and $71 million 2016the consolidated statements of cash flows).
Contractual Obligations. At As of December 31, 2018,2020, the weighted-average discount rate used to determine the lease liabilities was 5.4 percent (5.5 percent as of December 31, 2019) and the weighted-average remaining lease term was 7.7 years (8.2 years as of December 31, 2019).
The future minimum payments for leases presented in the consolidated balance sheet at December 31, 2020, follow:
| | | | | | | |
| | | |
| 2021 | $ | 50 | | | |
| 2022 | 41 | | | |
| 2023 | 36 | | | |
| 2024 | 34 | | | |
| 2025 | 29 | | | |
| Thereafter | 97 | | | |
| Total payments | 287 | | | |
| Less amount representing interest | (59) | | | |
| Present value of net minimum lease payments | 228 | | | |
| Less current portion | (38) | | | |
| Long-term portion | $ | 190 | | | |
Contractual Obligations. At December 31, 2020, based on applicable prices on that date, FCX has unconditional purchase obligations (including take-or-pay contracts with terms less than one year) of $2.9$4.2 billion,, primarily comprising the procurement of copper concentrate ($1.52.9 billion), cobalt ($0.5 billion)516 million), electricity ($0.4 billion)301 million) and transportation services ($0.3 billion)($209 million). Some of FCX’s unconditional purchase obligations are settled based on the prevailing market rate for the service or commodity purchased. In some cases, the amount of the actual obligation may change over time because of market conditions. Obligations for copper concentrate provide for deliveries of
specified volumes to Atlantic Copper at market-based prices. Obligations for cobalt hydroxide intermediate provide for deliveries of specified volumes to Freeport Cobalt at market-based prices. Electricity obligations are primarily for long-term power purchase agreements in North America and contractual minimum demand at the South America mines. Transportation obligations are primarily for South America contracted ocean freight.
FCX’s unconditional purchase obligations by year total $2.1$1.8 billion in 2019, $234 million in 2020, $147 million in 2021, $50 million$1.2 billion in 2022, $44$539 million in 2023, $334 million in 2024, $119 million in 2025 and $301$253 million thereafter. During the three-year period ended December 31, 2018,2020, FCX fulfilled its minimum contractual purchase obligations.
Special Mining License (IUPK) - Indonesia. As discussed in Note 2, on December 21, 2018, FCX completed the transaction with the IndonesianIndonesia government regarding PT-FI’s long-term mining rights and share ownership. Concurrent with the closing of the transaction, the IndonesianIndonesia government granted PT-FI an IUPK to replace its former COW, enabling PT-FI to conduct operations in the Grasberg minerals district through 2041. Under the terms of the IUPK, PT-FI has been granted an extension of mining rights through 2031, with rights to extend mining rights through 2041, subject to PT-FI completing the construction of a new smelter in Indonesia within five years of closing the transaction and fulfilling its defined fiscal obligations to the IndonesianIndonesia government. The IUPK, and related documentation, contains legal and fiscal terms and is legally enforceable through 2041. In addition, FCX, as a foreign investor, has rights to resolve investment disputes with the IndonesianIndonesia government through international arbitration.
The key fiscal terms set forth in the IUPK include a 25 percent corporate income tax rate, a 10 percent profits tax on net income, and royalty rates of 4 percent for copper, 3.75 percent for gold and 3.25 percent for silver. PT-FI’s royalties totaled $160 million in 2020, $106 million in 2019 and $238 million in 2018, $173 million in 2017 and $131 million in 2016.2018. Dividend distributions from PT-FI to FCX are subject to a 10 percent withholding tax.
The IUPK also requires PT-FI to pay export duties of 5 percent, declining to 2.5 percent when smelter development progress exceeds 30 percent and eliminated when smelter progress exceeds 50 percent. PT-FI had previously agreed to and has been paying export duties since July 2014 (refer to Note 12 for further discussion of disputed export duties for the period April 2017 to December 21, 2018). PT-FI’s export duties charged against revenues totaled $92 million in 2020, $66 million in 2019 (excluding $155 million associated with the historical export duty matter as discussed in Note 12), and $180 million in 2018, $115 million in 2017 and $95 million in 2016.2018.
The IUPK also requires PT-FI to pay surface water taxes of $15 million annually, beginning in 2019.2019, which are recognized in production and delivery costs as incurred.
In connection with a memorandum of understanding previously entered into with the IndonesianIndonesia government in July 2014, PT-FI provided an assurance bond at that time to support its commitment to construct a new smelter in Indonesia ($126148 million based on exchange rate as of December 31, 2018)2020).
In March 2020, PT-FI has applied forreceived a one-year extension of its export license which currently expires on February 16, 2019.through March 15, 2021.
Other. In 2016, FCX negotiated the termination and settlement of FM O&G’s drilling rig contracts with Noble Drilling (U.S.) LLC (Noble) and Rowan Companies plc (Rowan). Under the settlement with Noble, FCX issued 48.1 million shares of its common stock (representing a value of $540 million) during second-quarter 2016, and Noble immediately sold these shares. Under the settlement with Rowan, FCX paid $215 million in cash during 2016. FCX also agreed to provide contingent payments of up to $75 million to Noble and up to $30 million to Rowan, depending on the average price of crude oil over the 12-month period ending June 30, 2017. In January 2017, FCX paid $6 million to early settle a portion of the Rowan contingent payments and no additional payments were due when the contingency period ended on June 30, 2017. As a result of the settlements, FM O&G was released from a total of $1.1 billion in payment obligations under its three drilling rig contracts.
Community Development Programs. FCX has adopted policies that govern its working relationships with the communities where it operates. These policies are designed to guide its practices and programs in a manner that respects and promotes basic human rights and the culture of the local people impacted by FCX’s operations. FCX continues to make significant expenditures on community development, education, training and cultural programs.
In 1996, PT-FI established the Freeport Partnership Fund for Community Development (Partnership Fund) through which PT-FI has made available funding and technical assistance to support community development initiatives in the areas of health, education, economic development and local infrastructure of the area. Throughout 2019, PT-FI has committed through June 30, 2019,consulted with key stakeholders to provide one percent of its annual revenue forrestructure the developmentmanagement of the local communitiesPartnership Fund in compliance with PT-FI’s IUPK. Throughout the restructuring process, PT-FI continued its areacontributions to ensure no disruptions in implementation of operations throughapproved projects. Beginning in February 2020, the Partnership Fund.Fund is managed by a legally-recognized Indonesian foundation (Yayasan Pemberdayaan Masyarakat Amungme dan Kamoro, or YPMAK). PT-FI charged $55$36 million in 2018, $442020, $28 million in 20172019 and $33$55 million in 20162018 to cost of sales for this commitment.
Guarantees. FCX provides certain financial guarantees (including indirect guarantees of the indebtedness of others) and indemnities.
Prior to its acquisition by FCX, FMC and its subsidiaries have, as part of merger, acquisition, divestiture and other transactions, from time to time, indemnified certain sellers, buyers or other parties related to the transaction from and against certain liabilities associated with conditions in existence (or claims associated with actions taken) prior to the closing date of the transaction. As part of these transactions, FMC indemnified the counterparty from and against certain excluded or retained liabilities existing at the time of sale that would otherwise have been transferred to the party at closing. These indemnity provisions generally now require FCX to indemnify the party against certain liabilities that may arise in the future from the pre-closing activities of FMC for assets sold or purchased. The indemnity classifications include environmental, tax and certain operating liabilities, claims or litigation existing at closing and various excluded liabilities or obligations. Most of these indemnity obligations arise from transactions that closed many years ago, and given the nature of these indemnity obligations, it is not possible to estimate the maximum potential exposure. Except as described in the following sentence, FCX does not consider any of such obligations as having a probable likelihood of payment that is reasonably estimable, and accordingly, has not recorded any obligations associated with these indemnities. With respect to FCX’s environmental indemnity obligations, any expected costs from these guarantees are accrued when potential environmental obligations are considered by management to be probable and the costs can be reasonably estimated.
NOTE 14. FINANCIAL INSTRUMENTS
FCX does not purchase, hold or sell derivative financial instruments unless there is an existing asset or obligation, or it anticipates a future activity that is likely to occur and will result in exposure to market risks, which FCX intends to offset or mitigate. FCX does not enter into any derivative financial instruments for speculative purposes, but has entered into derivative financial instruments in limited instances to achieve specific objectives. These objectives principally relate to managing risks associated with commodity price changes, foreign currency exchange rates and interest rates.
Commodity Contracts. From time to time, FCX has entered into derivative contracts to hedge the market risk associated with fluctuations in the prices of commodities it purchases and sells. Derivative financial instruments used by FCX to manage its risks do not contain credit risk-related contingent provisions. As a result
In April 2020, FCX entered into forward sales contracts for 150 million pounds of copper for settlement in May and June of 2020. The forward sales provided for fixed pricing of $2.34 per pound of copper on approximately 60 percent of North America's sales volumes for May and June 2020. These contracts resulted in hedging losses totaling $24 million for the acquisition of the oil and gas business in 2013, FCX assumed a variety of crude oil and natural gas commodity derivatives to hedge the exposure to the volatility of crude oil and natural gas commodity prices, all of which had matured byyear ended December 31, 2015. As of December 31, 2018 and 2017, FCX had2020. There were no price protectionremaining forward sales contracts relating to its mine production. after June 30, 2020.
A discussion of FCX’s other derivative contracts and programs follows.
Derivatives Designated as Hedging Instruments – Fair Value Hedges
Copper Futures and Swap Contracts. Some of FCX’s U.S. copper rod customers request a fixed market price instead of the COMEX average copper price in the month of shipment. FCX hedges this price exposure in a manner that allows it to receive the COMEX average price in the month of shipment while the customers pay the fixed price they requested. FCX accomplishes this by entering into copper futures or swap contracts. Hedging gains or losses from these copper futures and swap contracts are recorded in revenues. FCX did not have any significant gains or losses during the three years ended December 31, 2018,2020, resulting from hedge ineffectiveness. At December 31, 2018,2020, FCX held copper futures and swap contracts that qualified for hedge accounting for 6850 million pounds at an average contract price of $2.77$3.21 per pound, with maturities through June 2020.December 2022.
A summary of gains (losses) gains recognized in revenues for derivative financial instruments related to commodity contracts that are designated and qualify as fair value hedge transactions, including the unrealized gains (losses) on the related hedged item for the years ended December 31 follows:
| | | | | | | | | | | | | | | | | |
| | 2020 | | 2019 | | 2018 |
| Copper futures and swap contracts: | | | | | |
| Unrealized gains (losses): | | | | | |
| Derivative financial instruments | $ | 9 | | | $ | 15 | | | $ | (20) | |
| Hedged item – firm sales commitments | (9) | | | (15) | | | 20 | |
| | | | | |
| Realized gains (losses): | | | | | |
| Matured derivative financial instruments | 22 | | | (8) | | | (22) | |
|
| | | | | | | | | | | |
| | 2018 | | 2017 | | 2016 |
| Copper futures and swap contracts: | | | | | |
| Unrealized (losses) gains: | | | | | |
| Derivative financial instruments | $ | (20 | ) | | $ | 4 |
| | $ | 16 |
|
| Hedged item – firm sales commitments | 20 |
| | (4 | ) | | (16 | ) |
| | | | | | |
| Realized (losses) gains: | | | | | |
| Matured derivative financial instruments | (22 | ) | | 30 |
| | 1 |
|
Derivatives Not Designated as Hedging Instruments
Embedded Derivatives. Certain FCX concentrate, copper cathode and gold sales contracts provide for provisional pricing primarily based on the LME copper price or the COMEX copper price and the LMBALondon gold price at the time of shipment as specified in the contract. FCX receives market prices based on prices in the specified future month, which results in price fluctuations recorded toin revenues until the date of settlement. FCX records revenues and invoices customers at the time of shipment based on then-current LME or COMEX copper prices and London gold prices as specified in the contracts, which results in an embedded derivative (i.e., a pricing mechanism that is finalized after the time of delivery) that is required to be bifurcated from the host contract. The host contract is the sale of the metals contained in the concentrate or cathode at the then-current LME or COMEX copper price and the London gold price. FCX applies the normal purchases and normal sales scope exception in accordance with derivatives and hedge accounting guidance to the host contract in its concentrate or cathode sales agreements since these contracts do not allow for net settlement and always result in physical delivery. The embedded derivative does not qualify for hedge accounting and is adjusted to fair value through earnings each period, using the period-end LME or COMEX copper forward prices and the adjusted London gold price, until the date of final pricing. Similarly, FCX purchases copper and cobalt under contracts that provide for provisional pricing. Mark-to-market price fluctuations from these embedded derivatives are recorded through the settlement date and are reflected in revenues for sales contracts and in inventory for purchase contracts.
A summary of FCX’s embedded derivatives at December 31, 2018,2020, follows:
| | | | | | | | | | | | | | | | | | | | | | | |
| Open | | Average Price
Per Unit | | Maturities |
| | Positions | | Contract | | Market | | Through |
| Embedded derivatives in provisional sales contracts: | | | | | | | |
| Copper (millions of pounds) | 520 | | | $ | 3.21 | | | $ | 3.52 | | | May 2021 |
| Gold (thousands of ounces) | 142 | | | 1,850 | | | 1,893 | | | February 2021 |
| Embedded derivatives in provisional purchase contracts: | | | | | | | |
| Copper (millions of pounds) | 53 | | | 3.15 | | | 3.52 | | | April 2021 |
| | | | | | | |
|
| | | | | | | | | | | | |
| | Open | | Average Price Per Unit | | Maturities |
| | Positions | | Contract | | Market | | Through |
| Embedded derivatives in provisional sales contracts: | | | | | | | |
| Copper (millions of pounds) | 489 |
| | $ | 2.78 |
| | $ | 2.70 |
| | May 2019 |
| Gold (thousands of ounces) | 119 |
| | 1,229 |
| | 1,286 |
| | April 2019 |
| Embedded derivatives in provisional purchase contracts: | | | | | | | |
| Copper (millions of pounds) | 117 |
| | 2.79 |
| | 2.71 |
| | May 2019 |
| Cobalt (millions of pounds) | 9 |
| | 19.58 |
| | 19.25 |
| | March 2019 |
Crude Oil and Natural Gas Contracts. FCX had no outstanding crude oil or natural gas derivative contracts as of December 31, 2018 or 2017. As part of the terms of the agreement to sell its onshore California oil and gas properties, FM O&G entered into derivative contracts during October 2016. Sentinel assumed these contracts at the time of the sale in December 2016. These derivative contracts were not designated as hedges for accounting purposes, and were recorded at fair value with the mark-to-market gains and losses recorded in revenues (oil contracts) and production costs (natural gas contracts).
Copper Forward Contracts. Atlantic Copper, FCX’s wholly owned smelting and refining unit in Spain, enters into copper forward contracts designed to hedge its copper price risk whenever its physical purchases and sales pricing periods do not match. These economic hedge transactions are intended to hedge against changes in copper prices, with the mark-to-market hedging gains or losses recorded in cost of sales.production and delivery costs. At December 31, 2018,2020, Atlantic Copper held net copper forward salespurchase contracts for 86 million pounds at an average contract price of $2.76$3.56 per pound, with maturities through February 2019.2021.
Summary of Gains (Losses) Gains. . A summary of the realized and unrealized gains (losses) gains recognized in operating income (loss) for commodity contracts that do not qualify as hedge transactions, including embedded derivatives, for the years ended December 31 follows:
| | | | | | | | | | | | | | | | | |
| | 2020 | | 2019 | | 2018 |
Embedded derivatives in provisional sales contractsa: | | | | | |
| Copper | $ | 259 | | | $ | 34 | | | $ | (310) | |
| Gold and other | 45 | | | 20 | | | (7) | |
| | | | | |
| | | | | |
| | | | | |
| | | | | |
Copper forward contractsb | 3 | | | (7) | | | 18 | |
a.Amounts recorded in revenues.
b.Amounts recorded in cost of sales as production and delivery costs.
|
| | | | | | | | | | | |
| | 2018 | | 2017 | | 2016 |
Embedded derivatives in provisional sales contractsa | | | | | |
| Copper | $ | (310 | ) | | $ | 489 |
| | $ | 262 |
|
| Gold and other | (7 | ) | | 26 |
| | 4 |
|
Crude oil options and swapsa | — |
| | — |
| | (35 | ) |
Copper forward contractsb | 18 |
| | (15 | ) | | 5 |
|
| |
a. | Amounts recorded in revenues. |
| |
b. | Amounts recorded in cost of sales as production and delivery costs. |
Unsettled Derivative Financial Instruments
A summary of the fair values of unsettled commodity derivative financial instruments follows:
| | | | | | | | | | | |
| | December 31, |
| | 2020 | | 2019 |
| Commodity Derivative Assets: | | | |
| Derivatives designated as hedging instruments: | | | |
| Copper futures and swap contracts | $ | 15 | | | $ | 6 | |
| Derivatives not designated as hedging instruments: | | | |
| Embedded derivatives in provisional sales/purchase contracts | 169 | | | 68 | |
| | | |
| | | |
| Total derivative assets | $ | 184 | | | $ | 74 | |
|
| | | | | | | |
| | December 31, |
| | 2018 | | 2017 |
| Commodity Derivative Assets: | | | |
| Derivatives designated as hedging instruments: | | | |
| Copper futures and swap contracts | $ | — |
| | $ | 11 |
|
| Derivatives not designated as hedging instruments: | | | |
| Embedded derivatives in provisional copper, gold and cobalt | |
| | |
|
| sales/purchase contracts | 23 |
| | 155 |
|
| Copper forward contracts | — |
| | 1 |
|
| Total derivative assets | $ | 23 |
| | $ | 167 |
|
| | | | | | | | | | | |
| Commodity Derivative Liabilities: | | | |
| | | |
| | | |
| Derivatives not designated as hedging instruments: | | | |
| Embedded derivatives in provisional sales/purchase contracts | $ | 21 | | | $ | 20 | |
| | | |
| | | |
| Copper forward contracts | 0 | | | 1 | |
| Total derivative liabilities | $ | 21 | | | $ | 21 | |
|
| | | | | | | |
| Commodity Derivative Liabilities: | | | |
| Derivatives designated as hedging instruments: | | | |
| Copper futures and swap contracts | $ | 9 |
| | $ | — |
|
| Derivatives not designated as hedging instruments: | | | |
| Embedded derivatives in provisional copper, gold and cobalt | | | |
| sales/purchase contracts | 39 |
| | 55 |
|
| Copper forward contracts | — |
| | 2 |
|
| Total derivative liabilities | $ | 48 |
| | $ | 57 |
|
FCX’s commodity contracts have netting arrangements with counterparties with which the right of offset exists, and it is FCX’s policy to generally offset balances by contract on its balance sheet. FCX’s embedded derivatives on provisional sales/purchase contracts are netted with the corresponding outstanding receivable/payable balances.
A summary of these unsettled commodity contracts that are offset in the balance sheet follows: | | | | | Assets at December 31, | | Liabilities at December 31, | | Assets at December 31, | | Liabilities at December 31, |
| | | 2018 | | 2017 | | 2018 | | 2017 | | | 2020 | | 2019 | | 2020 | | 2019 |
| | | | | | | | | | | | | | | | | |
| Gross amounts recognized: | | | | | | | | | Gross amounts recognized: | |
| Commodity contracts: | | | | | | | | | Commodity contracts: | |
| Embedded derivatives in provisional | | | | | | | | | Embedded derivatives in provisional | |
| sales/purchase contracts | | $ | 23 |
| | $ | 155 |
| | $ | 39 |
| | $ | 55 |
| sales/purchase contracts | | $ | 169 | | | $ | 68 | | | $ | 21 | | | $ | 20 | |
| | Copper derivatives | | — |
| | 12 |
| | 9 |
| | 2 |
| Copper derivatives | | 15 | | | 6 | | | 0 | | | 1 | |
| | | 23 |
| | 167 |
| | 48 |
| | 57 |
| | 184 | | | 74 | | | 21 | | | 21 | |
| | | | | | | | | | | | | | | | | |
| Less gross amounts of offset: | | | | | | | | | Less gross amounts of offset: | |
| Commodity contracts: | | | | | | | | | Commodity contracts: | |
| Embedded derivatives in provisional | | | | | | | | | Embedded derivatives in provisional | |
| sales/purchase contracts | | 7 |
| | — |
| | 7 |
| | — |
| sales/purchase contracts | | 1 | | | 0 | | | 1 | | | 0 | |
| Copper derivatives | | — |
| | 1 |
| | — |
| | 1 |
| |
| | | | 7 |
| | 1 |
| | 7 |
| | 1 |
| | 1 | | | 0 | | | 1 | | | 0 | |
| | | | | | | | | | | | | | | | | |
| Net amounts presented in balance sheet: | | | | | | | | | Net amounts presented in balance sheet: | |
| Commodity contracts: | | | | | | | | | Commodity contracts: | |
| Embedded derivatives in provisional | | | | | | | | | Embedded derivatives in provisional | |
| sales/purchase contracts | | 16 |
| | 155 |
| | 32 |
| | 55 |
| sales/purchase contracts | | 168 | | | 68 | | | 20 | | | 20 | |
| | Copper derivatives | | — |
| | 11 |
| | 9 |
| | 1 |
| Copper derivatives | | 15 | | | 6 | | | 0 | | | 1 | |
| | | $ | 16 |
| | $ | 166 |
| | $ | 41 |
| | $ | 56 |
| | $ | 183 | | | $ | 74 | | | $ | 20 | | | $ | 21 | |
| | | | | | | | | | | | | | | | | |
| Balance sheet classification: | | | | | | | | | Balance sheet classification: | |
| Trade accounts receivable | | $ | 3 |
| | $ | 151 |
| | $ | 24 |
| | $ | — |
| Trade accounts receivable | | $ | 168 | | | $ | 66 | | | $ | 0 | | | $ | 0 | |
| Other current assets | | — |
| | 11 |
| | — |
| | — |
| Other current assets | | 15 | | | 6 | | | 0 | | | 0 | |
| | Accounts payable and accrued liabilities | | 13 |
| | 4 |
| | 17 |
| | 56 |
| Accounts payable and accrued liabilities | | 0 | | | 2 | | | 20 | | | 21 | |
| | | $ | 16 |
| | $ | 166 |
| | $ | 41 |
| | $ | 56 |
| |
| | | $ | 183 | | | $ | 74 | | | $ | 20 | | | $ | 21 | |
Credit Risk. FCX is exposed to credit loss when financial institutions with which it has entered into derivative transactions (commodity, foreign exchange and interest rate swaps) are unable to pay. To minimize the risk of such losses, FCX uses counterparties that meet certain credit requirements and periodically reviews the creditworthiness of these counterparties. FCX does not anticipate that any of the counterparties it deals with will default on their obligations. As of December 31, 2018,2020, the maximum amount of credit exposure associated with derivative transactions was $16$186 million.
Other Financial Instruments. Other financial instruments include cash and cash equivalents, restricted cash, restricted cash equivalents, accounts receivable, investment securities, legally restricted funds, accounts payable and accrued liabilities, dividends payable and long-term debt. The carrying value for cash and cash equivalents (which included time deposits of $2.3$0.3 billion at December 31, 2018,2020, and $2.9$1.3 billion at December 31, 2017)2019), restricted cash, restricted cash equivalents, accounts receivable, accounts payable and accrued liabilities, and dividends payable approximates fair value because of their short-term nature and generally negligible credit losses (refer to Note 15 for the fair values of investment securities, legally restricted funds and long-term debt).
In addition, as of December 31, 2018,2020, FCX has contingent consideration assets related to the sales of certain 2016 asset salesoil and gas properties (refer to Note 15 for the related fair value and to Note 2 for further discussion of these instruments)values).
Cash, Cash Equivalents, Restricted Cash and Restricted Cash Equivalents. The following table provides a reconciliation of total cash, cash equivalents, restricted cash and restricted cash equivalents presented in the consolidated statements of cash flows to the components presented in the consolidated balance sheets:
| | | | | | | | | | | | | | |
| | December 31, |
| | 2020 | | 2019 |
| Balance sheet components: | | | | |
| Cash and cash equivalents | | $ | 3,657 | | | $ | 2,020 | |
| Restricted cash and restricted cash equivalents included in: | | | | |
| Other current assets | | 97 | | | 100 | |
| Other assets | | 149 | | | 158 | |
| Total cash, cash equivalents, restricted cash and restricted cash equivalents presented in the consolidated statements of cash flows | | $ | 3,903 | | | $ | 2,278 | |
|
| | | | | | | | |
| | | December 31, 2018 | | December 31, 2017 |
| Balance sheet components: | | | | |
| Cash and cash equivalents | | $ | 4,217 |
| | $ | 4,526 |
|
| Restricted cash and restricted cash equivalents included in: | | | | |
| Other current assets | | 110 |
| | 52 |
|
| Other assets | | 128 |
| | 132 |
|
| Total cash, cash equivalents, restricted cash and restricted cash equivalents presented in the consolidated statements of cash flows | | $ | 4,455 |
| | $ | 4,710 |
|
NOTE 15. FAIR VALUE MEASUREMENT
Fair value accounting guidance includes a hierarchy that prioritizes the inputs to valuation techniques used to measure fair value. The hierarchy gives the highest priority to unadjusted quoted prices in active markets for identical assets or liabilities (Level 1) and the lowest priority to unobservable inputs (Level 3). FCX did not have any significant transfers in or out of Level 3 for 2018.2020.
FCX’s financial instruments are recorded on the consolidated balance sheets at fair value except for contingent consideration associated with the sale of the Deepwater GOM oil and gas properties (which was recorded under the loss recovery approach) and debt. A summary of the carrying amount and fair value of FCX’s financial instruments (including those measured at NAV as a practical expedient), other than cash and cash equivalents, restricted cash, restricted cash equivalents, accounts receivable, accounts payable and accrued liabilities, and dividends payable (refer to Note 14) follows: |
| | | | | | | | | | | | | | | | | | | | | | | |
| | At December 31, 2018 |
| | Carrying | | Fair Value |
| | Amount | | Total | | NAV | | Level 1 | | Level 2 | | Level 3 |
| Assets | | | | | | | | | | | |
Investment securities:a,b | | | | | | | | | | | |
| U.S. core fixed income fund | $ | 25 |
| | $ | 25 |
| | $ | 25 |
| | $ | — |
| | $ | — |
| | $ | — |
|
| Equity securities | 4 |
| | 4 |
| | — |
| | 4 |
| | — |
| | — |
|
| Total | 29 |
| | 29 |
| | 25 |
| | 4 |
| | — |
| | — |
|
| | | | | | | | | | | | |
Legally restricted funds:a | | | | | | | | | | | |
| U.S. core fixed income fund | 55 |
| | 55 |
| | 55 |
| | — |
| | — |
| | — |
|
| Government mortgage-backed securities | 38 |
| | 38 |
| | — |
| | — |
| | 38 |
| | — |
|
| Government bonds and notes | 36 |
| | 36 |
| | — |
| | — |
| | 36 |
| | — |
|
| Corporate bonds | 28 |
| | 28 |
| | — |
| | — |
| | 28 |
| | — |
|
| Asset-backed securities | 11 |
| | 11 |
| | — |
| | — |
| | 11 |
| | — |
|
| Collateralized mortgage-backed securities | 7 |
| | 7 |
| | — |
| | — |
| | 7 |
| | — |
|
| Money market funds | 5 |
| | 5 |
| | — |
| | 5 |
| | — |
| | — |
|
| Municipal bonds | 1 |
| | 1 |
| | — |
| | — |
| | 1 |
| | — |
|
| Total | 181 |
| | 181 |
| | 55 |
| | 5 |
| | 121 |
| | — |
|
| | | | | | | | | | | | |
| Derivatives: | | | | | | | | | | | |
| Embedded derivatives in provisional copper, | | | | | | | | | | | |
| gold and cobalt sales/purchase contracts | | | | | | | | | | | |
in a gross asset positionc | 23 |
| | 23 |
| | — |
| | — |
| | 23 |
| | — |
|
| Contingent consideration for the sales of TFHL | | | | | | | | | | | |
and onshore California oil and gas propertiesa | 73 |
| | 73 |
| | — |
| | — |
| | 73 |
| | — |
|
| Total | 96 |
| | 96 |
| | — |
| | — |
| | 96 |
| | — |
|
| | | | | | | | | | | | |
| Contingent consideration for the sale of the | | | | | | | | | | | |
Deepwater GOM oil and gas propertiesa | 143 |
| | 127 |
| | — |
| | — |
| | — |
| | 127 |
|
| | | | | | | | | | | | |
|
| | | | | | | | | | | | | | | | | | | | | | | |
| Liabilities | | | | | | | | | | | |
Derivatives:c | | | | | | | | | | | |
| Embedded derivatives in provisional copper, | | | | | | | | | | | |
| gold and cobalt sales/purchase contracts | | | | | | | | | | | |
| in a gross asset position | $ | 39 |
| | $ | 39 |
| | $ | — |
| | $ | — |
| | $ | 39 |
| | $ | — |
|
| Copper futures and swap contracts | 9 |
| | 9 |
| | — |
| | 7 |
| | 2 |
| | — |
|
| Total | 48 |
| | 48 |
| | — |
| | 7 |
| | 41 |
| | — |
|
| | | | | | | | | | | | |
Long-term debt, including current portiond | 11,141 |
| | 10,238 |
| | — |
| | — |
| | 10,238 |
| | — |
|
| | | | | | | | | | | | | | | | | | | | | | | | | | | | | | | | | | | |
| | At December 31, 2020 |
| Carrying | | Fair Value |
| | Amount | | Total | | NAV | | Level 1 | | Level 2 | | Level 3 |
| Assets | | | | | | | | | | | |
Investment securities:a,b | | | | | | | | | | | |
| U.S. core fixed income fund | $ | 29 | | | $ | 29 | | | $ | 29 | | | $ | 0 | | | $ | 0 | | | $ | 0 | |
| | | | | | | | | | | |
| Equity securities | 7 | | | 7 | | | — | | | 7 | | | 0 | | | 0 | |
| Total | 36 | | | 36 | | | 29 | | | 7 | | | 0 | | | 0 | |
| | | | | | | | | | | |
Legally restricted funds:a | | | | | | | | | | | |
| U.S. core fixed income fund | 65 | | | 65 | | | 65 | | | 0 | | | 0 | | | 0 | |
| Government bonds and notes | 49 | | | 49 | | | — | | | 0 | | | 49 | | | 0 | |
| Corporate bonds | 43 | | | 43 | | | — | | | 0 | | | 43 | | | 0 | |
| Government mortgage-backed securities | 30 | | | 30 | | | — | | | 0 | | | 30 | | | 0 | |
| Asset-backed securities | 16 | | | 16 | | | — | | | 0 | | | 16 | | | 0 | |
| Money market funds | 5 | | | 5 | | | — | | | 5 | | | 0 | | | 0 | |
| Collateralized mortgage-backed securities | 4 | | | 4 | | | — | | | 0 | | | 4 | | | 0 | |
| Municipal bonds | 1 | | | 1 | | | — | | | 0 | | | 1 | | | 0 | |
| Total | 213 | | | 213 | | | 65 | | | 5 | | | 143 | | | 0 | |
| | | | | | | | | | | |
| Derivatives: | | | | | | | | | | | |
| Embedded derivatives in provisional sales/purchase | | | | | | | | | | | |
contracts in a gross asset positionc | 169 | | | 169 | | | — | | | 0 | | | 169 | | | 0 | |
Copper futures and swap contractsc | 15 | | | 15 | | | — | | | 13 | | | 2 | | | 0 | |
| | | | | | | | | | | |
| | | | | | | | | | | |
| | | | | | | | | | | |
| Total | 184 | | | 184 | | | — | | | 13 | | | 171 | | | 0 | |
| | | | | | | | | | | |
| Contingent consideration for the sale of the | | | | | | | | | | | |
Deepwater GOM oil and gas propertiesa | 108 | | | 88 | | | — | | | 0 | | | 0 | | | 88 | |
| | | | | | | | | | | |
| | | | | | | | | | | |
| | | | | | | | | | | |
| | | | | | | | | | | | | | | | | | | | | | | | | | | | | | | | | | | |
| Liabilities | | | | | | | | | | | |
Derivatives:c | | | | | | | | | | | |
| Embedded derivatives in provisional sales/purchase | | | | | | | | | | | |
| contracts in a gross liability position | 21 | | | 21 | | | — | | | 0 | | | 21 | | | 0 | |
| | | | | | | | | | | |
| | | | | | | | | | | |
| | | | | | | | | | | |
| | | | | | | | | | | |
| | | | | | | | | | | |
| | | | | | | | | | | |
| | | | | | | | | | | |
| | | | | | | | | | | |
| | | | | | | | | | | |
Long-term debt, including current portiond | 9,711 | | | 10,994 | | | — | | | 0 | | | 10,994 | | | 0 | |
| | | | | | | | | | | |
| | | | | | | | | | | |
| | | | | | | | | | | | | | | | | | | | | | | | | | | | | | | | | | | |
| At December 31, 2019 |
| | Carrying | | Fair Value |
| | Amount | | Total | | NAV | | Level 1 | | Level 2 | | Level 3 |
| Assets | | | | | | | | | | | |
Investment securities:a,b | | | | | | | | | | | |
| U.S. core fixed income fund | $ | 27 | | | $ | 27 | | | $ | 27 | | | $ | 0 | | | $ | 0 | | | $ | 0 | |
| | | | | | | | | | | |
| Equity securities | 4 | | | 4 | | | — | | | 4 | | | 0 | | | 0 | |
| Total | 31 | | | 31 | | | 27 | | | 4 | | | 0 | | | 0 | |
| | | | | | | | | | | |
Legally restricted funds:a | | | | | | | | | | | |
| U.S. core fixed income fund | 59 | | | 59 | | | 59 | | | 0 | | | 0 | | | 0 | |
| Government mortgage-backed securities | 43 | | | 43 | | | — | | | 0 | | | 43 | | | 0 | |
| Government bonds and notes | 36 | | | 36 | | | — | | | 0 | | | 36 | | | 0 | |
| Corporate bonds | 33 | | | 33 | | | — | | | 0 | | | 33 | | | 0 | |
| Asset-backed securities | 14 | | | 14 | | | — | | | 0 | | | 14 | | | 0 | |
| Collateralized mortgage-backed securities | 7 | | | 7 | | | — | | | 0 | | | 7 | | | 0 | |
| Money market funds | 3 | | | 3 | | | — | | | 3 | | | 0 | | | 0 | |
| Municipal bonds | 1 | | | 1 | | | — | | | 0 | | | 1 | | | 0 | |
| Total | 196 | | | 196 | | | 59 | | | 3 | | | 134 | | | 0 | |
| | | | | | | | | | | |
| Derivatives: | | | | | | | | | | | |
| Embedded derivatives in provisional sales/purchase | | | | | | | | | | | |
contracts in a gross asset positionc | 68 | | | 68 | | | — | | | 0 | | | 68 | | | 0 | |
Copper futures and swap contractsc | 6 | | | 6 | | | — | | | 5 | | | 1 | | | — | |
| | | | | | | | | | | |
| Contingent consideration for the sale of onshore | | | | | | | | | | | |
California oil and gas propertiesa | 11 | | | 11 | | | — | | | 0 | | | 11 | | | 0 | |
| Total | 85 | | | 85 | | | — | | | 5 | | | 80 | | | 0 | |
| | | | | | | | | | | |
| Contingent consideration for the sale of the | | | | | | | | | | | |
Deepwater GOM oil and gas propertiesa | 122 | | | 108 | | | — | | | 0 | | | 0 | | | 108 | |
| | | | | | | | | | | |
| | | | | | | | | | | |
| | | | | | | | | | | |
| Liabilities | | | | | | | | | | | |
Derivatives:c | | | | | | | | | | | |
| Embedded derivatives in provisional sales/purchase | | | | | | | | | | | |
| contracts in a gross liability position | 20 | | | 20 | | | — | | | 0 | | | 20 | | | 0 | |
| | | | | | | | | | | |
| | | | | | | | | | | |
| | | | | | | | | | | |
| | | | | | | | | | | |
| Copper forward contracts | 1 | | | 1 | | | — | | | 0 | | | 1 | | | 0 | |
| Total | 21 | | | 21 | | | — | | | 0 | | | 21 | | | 0 | |
| | | | | | | | | | | |
| | | | | | | | | | | |
| | | | | | | | | | | |
Long-term debt, including current portiond | 9,826 | | | 10,239 | | | — | | | 0 | | | 10,239 | | | 0 | |
| | | | | | | | | | | |
| | | | | | | | | | | |
a.Current portion included in other current assets and long-term portion included in other assets. |
| | | | | | | | | | | | | | | | | | | | | | | |
| | At December 31, 2017 |
| | Carrying | | Fair Value |
| | Amount | | Total | | NAV | | Level 1 | | Level 2 | | Level 3 |
| Assets | | | | | | | | | | | |
Investment securities:a,b | | | | | | | | | | | |
| U.S. core fixed income fund | $ | 25 |
| | $ | 25 |
| | $ | 25 |
| | $ | — |
| | $ | — |
| | $ | — |
|
| Equity securities | 5 |
| | 5 |
| | — |
| | 5 |
| | — |
| | — |
|
| Total | 30 |
| | 30 |
| | 25 |
| | 5 |
| | — |
| | — |
|
| | | | | | | | | | | | |
Legally restricted funds:a | | | | | | | | | | | |
| U.S. core fixed income fund | 55 |
| | 55 |
| | 55 |
| | — |
| | — |
| | — |
|
| Government bonds and notes | 40 |
| | 40 |
| | — |
| | — |
| | 40 |
| | — |
|
| Corporate bonds | 32 |
| | 32 |
| | — |
| | — |
| | 32 |
| | — |
|
| Government mortgage-backed securities | 27 |
| | 27 |
| | — |
| | — |
| | 27 |
| | — |
|
| Asset-backed securities | 15 |
| | 15 |
| | — |
| | — |
| | 15 |
| | — |
|
| Money market funds | 11 |
| | 11 |
| | — |
| | 11 |
| | — |
| | — |
|
| Collateralized mortgage-backed securities | 8 |
| | 8 |
| | — |
| | — |
| | 8 |
| | — |
|
| Municipal bonds | 1 |
| | 1 |
| | — |
| | — |
| | 1 |
| | — |
|
| Total | 189 |
| | 189 |
| | 55 |
| | 11 |
| | 123 |
| | — |
|
| | | | | | | | | | | | |
| Derivatives: | | | |
| | | | |
| | |
| | |
|
| Embedded derivatives in provisional copper, | | | |
| | | | |
| | |
| | |
|
| gold and cobalt sales/purchase contracts | | | | | | | | | | | |
in a gross asset positionc | 155 |
| | 155 |
| | — |
| | — |
| | 155 |
| | — |
|
Copper futures and swap contractsc | 11 |
| | 11 |
| | — |
| | 9 |
| | 2 |
| | — |
|
Copper forward contractsc | 1 |
| | 1 |
| | — |
| | — |
| | 1 |
| | — |
|
| Contingent consideration for the sales of TFHL | | | | | | | | | | | |
and onshore California oil and gas propertiesa | 108 |
| | 108 |
| | — |
| | — |
| | 108 |
| | — |
|
| Total | 275 |
| | 275 |
| | — |
| | 9 |
| | 266 |
| | — |
|
| | | | | | | | | | | | |
| Contingent consideration for the sale of the | | | | | | | | | | | |
Deepwater GOM oil and gas propertiesa | 150 |
| | 134 |
| | — |
| | — |
| | — |
| | 134 |
|
| | | | | | | | | | | | |
| Liabilities | | | |
| | | | |
| | |
| | |
|
Derivatives:c | | | |
| | | | |
| | |
| | |
|
| Embedded derivatives in provisional copper, | | | |
| | | | |
| | |
| | |
|
| gold and cobalt sales/purchase contracts | | | | | | | | | | | |
| in a gross liability position | $ | 55 |
| | $ | 55 |
| | $ | — |
| | $ | — |
| | $ | 55 |
| | $ | — |
|
| Copper forward contracts | 2 |
| | 2 |
| | — |
| | 1 |
| | 1 |
| | — |
|
| Total | 57 |
| | 57 |
| | — |
| | 1 |
| | 56 |
| | — |
|
| | | | | | | | | | | | |
| | | | | | | | | | | | |
Long-term debt, including current portiond | 13,229 |
| | 13,381 |
| | — |
| | — |
| | 13,381 |
| | — |
|
| |
a. | Current portion included in other current assets and long-term portion included in other assets. |
| |
b. | Excludes time deposits (which approximated fair value) included in (i) other current assets of $109 million at December 31, 2018, and $52 million at December 31, 2017, and (ii) other assets of $126 million at December 31, 2018, and $123 million at December 31, 2017, primarily associated with an assurance bond to support PT-FI’s commitment for the development of a new smelter in Indonesia (refer to Note 13 for further discussion) and PT-FI’s closure and reclamation guarantees (refer to Note 12 for further discussion). |
| |
c. | Refer to Note 14 for further discussion and balance sheet classifications. |
| |
d. | Recorded at cost except for debt assumed in acquisitions, which are recorded at fair value at the respective acquisition dates. |
b.Excludes time deposits (which approximated fair value) included in (i) other current assets of $97 million at December 31, 2020, and $100 million at December 31, 2019, and (ii) other assets of $148 million at December 31, 2020, and $157 million at December 31, 2019, primarily associated with an assurance bond to support PT-FI’s commitment for the development of a new smelter in Indonesia (refer to Note 13 for further discussion) and PT-FI’s closure and reclamation guarantees (refer to Note 12 for further discussion).
c.Refer to Note 14 for further discussion and balance sheet classifications.
d.Recorded at cost except for debt assumed in acquisitions, which are recorded at fair value at the respective acquisition dates.
Valuation Techniques. The U.S. core fixed income fund is valued at NAV. The fund strategy seeks total return consisting of income and capital appreciation primarily by investing in a broad range of investment-grade debt securities, including U.S. government obligations, corporate bonds, mortgage-backed securities, asset-backed securities and money market instruments. There are no restrictions on redemptions (which are usually within one business day of notice).
Money market funds are classified within Level 1 of the fair value hierarchy because they are valued using quoted market prices in active markets.
Equity securities are valued at the closing price reported on the active market on which the individual securities are traded and, as such, are classified within Level 1 of the fair value hierarchy.
Fixed income securities (government securities, corporate bonds, asset-backed securities, collateralized mortgage-backed securities and municipal bonds) are valued using a bid-evaluation price or a mid-evaluation price. These
evaluations are based on quoted prices, if available, or models that use observable inputs and, as such, are classified within Level 2 of the fair value hierarchy.
Money market funds are classified within Level 1 of the fair value hierarchy because they are valued using quoted market prices in active markets.
FCX’s embedded derivatives on provisional copper concentrate, copper cathode and gold purchases and sales are valued using only quoted monthly LME or COMEX copper forward prices and the adjusted LBMALondon gold prices at each reporting date based on the month of maturity (refer to Note 14 for further discussion); however, FCX’s contracts themselves are not traded on an exchange. FCX’s embedded derivatives on provisional cobalt purchases are valued using quoted monthly LME cobalt forward prices or average published Metals Bulletin cobalt prices, subject to certain adjustments as specified by the terms of the contracts, at each reporting date based on the month of maturity. As a result, these derivatives are classified within Level 2 of the fair value hierarchy.
FCX’s derivative financial instruments for copper futures and swap contracts and copper forward contracts that are traded on the respective exchanges are classified within Level 1 of the fair value hierarchy because they are valued using quoted monthly COMEX or LME prices at each reporting date based on the month of maturity (refer to Note 14 for further discussion). Certain of these contracts are traded on the over-the-counter market and are classified within Level 2 of the fair value hierarchy based on COMEX and LME forward prices.
The fair valueIn 2016, FCX completed the sale of contingent consideration for the sales of TFHL andits onshore California oil and gas properties, (referwhich included contingent consideration of up to Note 2$150 million, consisting of $50 million per year for further discussion) is2018, 2019 and 2020 if the price of Brent crude oil averages over $70 per barrel in each of these calendar years. No contingent consideration was realized in 2020 or 2019 because the average Brent crude oil price did not exceeded $70 per barrel for either year. Contingent consideration of $50 million was realized in 2018 and collected in first-quarter 2019 (included in proceeds from sales of assets in the consolidated statements of cash flows) because the average Brent crude oil price exceeded $70 per barrel for 2018. The fair value of the contingent consideration derivative was $11 million (included in other assets in the consolidated balance sheets) at December 31, 2019. The fair value at December 31, 2019, was calculated based on average commodity price forecasts through the applicable maturity datesdate using a Monte CarloMonte-Carlo simulation model. The models usemodel used various observable inputs, including Brent crude oil forward prices, historical coppervolatilities and cobalt prices, volatilities, discount rates and settlement terms.rates. As a result, thesethis contingent consideration assets areasset was classified within Level 2 of the fair value hierarchy.
The fair value of contingent consideration for theIn December 2016, FCX’s sale of its Deepwater GOM oil and gas properties (referincluded up to Note 2$150 million in contingent consideration that was recorded at the total amount under the loss recovery approach. The contingent consideration will be received over time as future cash flows are realized in connection from a third-party production handling agreement for further discussion) isan offshore platform, with the related payments commencing in third-quarter 2018. The contingent consideration included in (i) other current assets totaled $12 million at December 31, 2020, and $18 million at December 31, 2019, and (ii) other assets totaled $96 million at December 31, 2020, and $104 million at December 31, 2019. The fair value of this contingent consideration was calculated based on a discounted cash flow model using inputs that include third-party estimates for reserves, production rates and production timing, and discount rates. Because significant inputs are not observable in the market, the contingent consideration is classified within Level 3 of the fair value hierarchy.
Long-term debt, including current portion, is primarily valued using available market quotes and, as such, is classified within Level 2 of the fair value hierarchy.
The techniques described above may produce a fair value calculation that may not be indicative of NRV or reflective of future fair values. Furthermore, while FCX believes its valuation techniques are appropriate and consistent with those used by other market participants, the use of different techniques or assumptions to determine fair value of certain financial instruments could result in a different fair value measurement at the reporting date. There have been no changes in the techniques used at December 31, 2018.2020, as compared to those techniques used at December 31, 2019.
A summary of the changes in the fair value of FCX’s Level 3 instrument, contingent consideration for the sale of the Deepwater GOM oil and gas properties, for the years ended December 31 follows:
| | | | | | | | | | | | | | | | | | | | |
| 2020 | | 2019 | | 2018 | |
| Balance at beginning of year | $ | 108 | | | $ | 127 | | | $ | 134 | | |
| | | | | | |
| Net unrealized (losses) gains related to assets still held at the end of the year | (6) | | | 2 | | | 0 | | |
| Settlements | (14) | | | (21) | | | (7) | | |
| Balance at end of year | $ | 88 | | | $ | 108 | | | $ | 127 | | |
|
| | | | | | | | | | | | |
| | 2018 | | 2017 | | 2016 | |
| Balance at beginning of year | $ | 134 |
| | $ | 135 |
| | $ | — |
| |
| Net unrealized (losses) gains related to assets still held at the end of the year | — |
| | (1 | ) | | 135 |
| |
| Settlements | (7 | ) | | — |
| | — |
| |
| Balance at the end of the year | $ | 127 |
| | $ | 134 |
| | $ | 135 |
| |
NOTE 16. BUSINESS SEGMENT INFORMATION
Product Revenues. FCX’s revenues attributable to the products it sold for the years ended December 31 follow:
| | | | | | | | | | | | | | | | | |
| | 2020 | | 2019 | | 2018 |
| Copper: | | | | | |
| Concentrate | $ | 4,294 | | | $ | 4,566 | | | $ | 6,180 | |
| Cathode | 4,204 | | | 3,656 | | | 4,366 | |
| Rod and other refined copper products | 2,052 | | | 2,110 | | | 2,396 | |
Purchased coppera | 821 | | | 1,060 | | | 1,053 | |
| Gold | 1,702 | | | 1,620 | | | 3,231 | |
| Molybdenum | 848 | | | 1,169 | | | 1,190 | |
Otherb | 592 | | | 905 | | | 1,490 | |
| Adjustments to revenues: | | | | | |
| Treatment charges | (362) | | | (404) | | | (535) | |
Royalty expensec | (165) | | | (113) | | | (246) | |
Export dutiesd | (92) | | | (221) | | | (180) | |
| Revenues from contracts with customers | 13,894 | | | 14,348 | | | 18,945 | |
Embedded derivativese | 304 | | | 54 | | | (317) | |
| Total consolidated revenues | $ | 14,198 | | | $ | 14,402 | | | $ | 18,628 | |
|
| | | | | | | | | | | |
| | 2018 | | 2017 | | 2016 |
| Copper: | | | | | |
| Concentrate | $ | 6,180 |
| | $ | 5,604 |
| | $ | 5,048 |
|
| Cathode | 4,366 |
| | 3,759 |
| | 3,495 |
|
| Rod, and other refined copper products | 2,396 |
| | 2,387 |
| | 2,082 |
|
Purchased coppera | 1,053 |
| | 789 |
| | 428 |
|
| Gold | 3,231 |
| | 2,126 |
| | 1,592 |
|
| Molybdenum | 1,190 |
| | 896 |
| | 659 |
|
Otherb | 1,490 |
| | 1,159 |
| | 2,145 |
|
| Adjustments to revenues: | | | | | |
| Treatment charges | (535 | ) | | (536 | ) | | (652 | ) |
Royalty expensec | (246 | ) | | (181 | ) | | (138 | ) |
Export dutiesd | (180 | ) | | (115 | ) | | (95 | ) |
| Revenues from contracts with customers | 18,945 |
| | 15,888 |
| | 14,564 |
|
Embedded derivativese | (317 | ) | | 515 |
| | 266 |
|
| Total consolidated revenues | $ | 18,628 |
| | $ | 16,403 |
| | $ | 14,830 |
|
| |
a. | FCX purchases copper cathode primarily for processing by its Rod & Refining operations. |
| |
b. | Primarily includes revenues associated with cobalt, silver, oil, gas and natural gas liquids. |
| |
c. | Reflects royalties for sales from PT-FI and Cerro Verde that will vary with the volume of metal sold and the prices of copper and gold. |
| |
d. | Refer to Note 13 for discussion of PT-FI export duties. |
| |
e. | Refer to Note 14 for discussion of embedded derivatives related to FCX’s provisionally priced concentrate and cathode sales contracts. |
a.FCX purchases copper cathode primarily for processing by its Rod & Refining operations.
b.Primarily includes revenues associated with cobalt and silver.
c.Reflects royalties on sales from PT-FI and Cerro Verde that will vary with the volume of metal sold and prices.
d.Reflects PT-FI export duties. The year 2019 includes charges totaling $155 million primarily associated with an unfavorable Indonesia Supreme Court ruling related to certain disputed export duties (refer to Note 12).
e.Refer to Note 14 for discussion of embedded derivatives related to FCX’s provisionally priced concentrate and cathode sales contracts.
Geographic Area. Information concerning financial data by geographic area follows:
| | | | | | | | | | | |
| December 31, |
| | 2020 | | 2019 |
Long-lived assets:a | | | |
| Indonesia | $ | 15,567 | | | $ | 14,971 | |
| U.S. | 8,420 | | | 8,834 | |
| Peru | 6,989 | | | 7,215 | |
| | | |
| Chile | 1,172 | | | 1,084 | |
| Other | 290 | | | 384 | |
| Total | $ | 32,438 | | | $ | 32,488 | |
a.Excludes deferred tax assets and intangible assets.
|
| | | | | | | | | | | |
| | December 31, |
| | 2018 | | 2017 | | 2016 |
Long-lived assets:a | | | | | |
| Indonesia | $ | 14,025 |
| | $ | 8,938 |
| | $ | 8,794 |
|
| U.S. | 8,208 |
| | 8,312 |
| | 8,282 |
|
| Peru | 7,274 |
| | 7,485 |
| | 7,981 |
|
| Chile | 1,128 |
| | 1,221 |
| | 1,269 |
|
| Other | 458 |
| | 408 |
| | 378 |
|
| Total | $ | 31,093 |
| | $ | 26,364 |
| | $ | 26,704 |
|
| |
a. | Excludes deferred tax assets and intangible assets. |
| | | | | | | | | | | | | | | | | |
| Years Ended December 31, |
| | 2020 | | 2019 | | 2018 |
Revenues:a | | | | | |
| U.S. | $ | 5,248 | | | $ | 5,107 | | | $ | 5,790 | |
| Switzerland | 2,032 | | | 2,223 | | | 2,941 | |
| Indonesia | 1,760 | | | 1,894 | | | 2,226 | |
| Japan | 1,205 | | | 1,181 | | | 1,946 | |
| Spain | 785 | | | 884 | | | 1,070 | |
| China | 692 | | | 531 | | | 873 | |
| United Kingdom | 491 | | | 233 | | | 296 | |
| Germany | 248 | | | 311 | | | 256 | |
| Chile | 221 | | | 242 | | | 294 | |
| France | 153 | | | 198 | | | 255 | |
| India | 152 | | | 107 | | | 389 | |
| Korea | 89 | | | 140 | | | 269 | |
| Belgium | 36 | | | 160 | | | 278 | |
| Philippines | 34 | | | 73 | | | 221 | |
| Bermuda | 0 | | | 38 | | | 207 | |
| | | | | |
| | | | | |
| | | | | |
| Other | 1,052 | | | 1,080 | | | 1,317 | |
| Total | $ | 14,198 | | | $ | 14,402 | | | $ | 18,628 | |
a.Revenues are attributed to countries based on the location of the customer. |
| | | | | | | | | | | |
| | Years Ended December 31, |
| | 2018 | | 2017 | | 2016 |
Revenues:a | | | | | |
| U.S. | $ | 5,790 |
| | $ | 5,344 |
| | $ | 5,896 |
|
| Switzerland | 2,941 |
| | 1,200 |
| | 1,147 |
|
| Indonesia | 2,226 |
| | 2,023 |
| | 1,402 |
|
| Japan | 1,946 |
| | 1,882 |
| | 1,350 |
|
| Spain | 1,070 |
| | 1,086 |
| | 878 |
|
| China | 873 |
| | 1,136 |
| | 1,125 |
|
| India | 389 |
| | 782 |
| | 553 |
|
| United Kingdom | 296 |
| | 226 |
| | 204 |
|
| Chile | 294 |
| | 248 |
| | 250 |
|
| Belgium | 278 |
| | 39 |
| | 87 |
|
| Korea | 269 |
| | 364 |
| | 219 |
|
| Germany | 256 |
| | 161 |
| | 162 |
|
| France | 255 |
| | 122 |
| | 80 |
|
| Philippines | 221 |
| | 378 |
| | 261 |
|
| Bermuda | 207 |
| | 226 |
| | 273 |
|
| Other | 1,317 |
| | 1,186 |
| | 943 |
|
| Total | $ | 18,628 |
| | $ | 16,403 |
| | $ | 14,830 |
|
| |
a. | Revenues are attributed to countries based on the location of the customer. |
Major Customers and Affiliated Companies. Copper concentrate sales to PT Smelting totaled 12 percent of FCX’s consolidated revenues for both the yearsyear ended December 31, 20182020, 13 percent for the year ended December 31, 2019 and 2017,12 percent for the year ended December 31, 2018, which is the only customer that accounted for 10 percent or more of FCX’s consolidated revenues during the three years ended December 31, 2018.2020.
Consolidated revenues include sales to the noncontrolling interest owners of FCX’s South America mining operations totaling $1.2$0.9 billion in 2018, $1.12020, $1.0 billion in 20172019and$1.01.2 billion in2016,2018, and PT-FI’s sales to PT Smelting totaling $1.8 billion in 2020, $1.9 billion in 2019 and $2.2 billion in 2018, $2.0 billion in 2017 and $1.4 billion in 2016.2018.
Labor Matters.As of December 31, 2018,2020, approximately 3738 percent of FCX’s global labor force was covered by collective bargaining agreements, and approximately 2116 percent was covered by agreements that expired and are currently being negotiated or will expire within one year. In December 2020, PT-FI signed a new agreement with one union effective April 2020 through March 2022, giving all employees the option to reject the new stipulations, but no employees have rejected the agreement. Another union filed a lawsuit in November 2020 regarding the new agreement, and the pending decision could modify the agreement.
Business Segments. FCX has organized its mining operations into four primary divisions – North America copper mines, South America mining, Indonesia mining and Molybdenum mines, and operating segments that meet certain thresholds are reportable segments. Separately disclosed in the following tables are FCX’s reportable segments, which include the Morenci, Cerro Verde and Grasberg (Indonesia Mining) copper mines, the Rod & Refining operations and Atlantic Copper Smelting & Refining.
At year-end 2020, FCX’s Bagdad mine did not meet the quantitative thresholds of a reportable segment. As a result, FCX revised its segment disclosure for the years ended December 31, 2019 and 2018, to conform with the current year presentation.
Intersegment sales between FCX’s business segments are based on terms similar to arms-length transactions with third parties at the time of the sale. Intersegment sales may not be reflective of the actual prices ultimately realized because of a variety of factors, including additional processing, timing of sales to unaffiliated customers and transportation premiums.
FCX defers recognizing profits on sales from its mines to other divisions,segments, including Atlantic Copper (FCX’s wholly owned smelter and refinery in Spain)Smelting & Refining, and on 25 percent of PT-FI’s sales to PT Smelting, (PT-FI’s 25-percent-owned smelter and refinery in Indonesia), until final sales to third parties occur. Quarterly variations in ore grades, the timing of intercompany shipments and changes in product prices result in variability in FCX’s net deferred profits and quarterly earnings.
FCX allocates certain operating costs, expenses and capital expenditures to its operating divisions and individual segments. However, not all costs and expenses applicable to an operation are allocated. U.S. federal and state income taxes are recorded and managed at the corporate level (included in Corporate, Other & Eliminations), whereas foreign income taxes are recorded and managed at the applicable country level. In addition, most mining exploration and research activities are managed on a consolidated basis, and those costs, along with some selling, general and administrative costs, are not allocated to the operating divisions or individual segments. Accordingly, the following Financial Information by Business Segment reflects management determinations that may not be indicative of what the actual financial performance of each operating division or segment would be if it was an independent entity.
North America Copper Mines. FCX operates seven open-pit copper mines in North America – Morenci, Bagdad, Safford (including Lone Star), Sierrita and Miami in Arizona, and Chino and Tyrone in New Mexico. The North America copper mines include open-pit mining, sulfide ore concentrating, leaching and SX/EW operations. A majority of the copper produced at the North America copper mines is cast into copper rod by FCX’s Rod & Refining segment. In addition to copper, certain of FCX’s North America copper mines also produce molybdenum concentrate, gold and silver.
The Morenci open-pit mine, located in southeastern Arizona, produces copper cathode and copper concentrate. In addition to copper, the Morenci mine also produces molybdenum concentrate. The Morenci mine produced 4950 percent of FCX’s North America copper during 2018.2020.
South America Mining. South America mining includes two operating copper mines – Cerro Verde in Peru and El Abra in Chile. These operations include open-pit mining, sulfide ore concentrating, leaching and SX/EW operations.
The Cerro Verde open-pit copper mine, located near Arequipa, Peru, produces copper cathode and copper concentrate. In addition to copper, the Cerro Verde mine also produces molybdenum concentrate and silver. The Cerro Verde mine produced 84 percent of FCX’s South America copper during 2018.2020.
Indonesia Mining. Indonesia mining includes PT-FI’s Grasberg minerals district that produces copper concentrate that contains significant quantities of gold and silver.
Molybdenum Mines. Molybdenum mines include the wholly owned Henderson underground mine and Climax open-pit mine, both in Colorado. The Henderson and Climax mines produce high-purity, chemical-grade molybdenum concentrate, which is typically further processed into value-added molybdenum chemical products.
Rod & Refining. The Rod & Refining segment consists of copper conversion facilities located in North America, and includes a refinery threeand two rod mills, and a specialty copper products facility, which are combined in accordance with segment reporting aggregation guidance. These operations process copper produced at FCX’s North America copper mines and purchased copper into copper cathode, rod and custom copper shapes. At times these operations refine copper and produce copper rod and shapes for customers on a toll basis. Toll arrangements require the tolling customer to deliver appropriate copper-bearing material to FCX’s facilities for processing into a product that is returned to the customer, who pays FCX for processing its material into the specified products.
Atlantic Copper Smelting & Refining. Atlantic Copper smelts and refines copper concentrate and markets refined copper and precious metals in slimes. During 2018,2020, Atlantic Copper purchased 1410 percentof its concentrate requirements from theFCX’s North America copper mines, 57 percentfrom theFCX’s South America mining operations and 4 percent from theFCX’s Indonesia mining operations, with the remainder purchased from unaffiliated third parties.
Corporate, Other & Eliminations. Corporate, Other & Eliminations consists ofFCX’sother mining, and eliminations, oil and gas operations and other corporate and elimination items. Other mining and eliminations includeincludes the Miami smelter (a smelter at FCX’s Miami, Arizona, mining operation), Freeport Cobalt, molybdenum conversion facilities in the U.S. and Europe, five non-operating copper mines in North America (Ajo, Bisbee, Tohono, Twin Buttes and Christmas in Arizona) and other mining support entities.
Financial Information by Business Segment
| | | | | | | | | | | | | | | | | | | | | | | | | | | | | | | | | | | | | | | | | | | | | | | | | | | | | | | | | | | | | | | | | | | | | | | | | | | | | | | | | | | | |
| | | | | | | | |
| North America Copper Mines | | South America Mining | | | | | | | | | | | | | | | | | | | | | |
| | | | | | | | | | | | | | | | | | | | | | | Atlantic | | | | | | | | Corporate, | | | |
| | | | | | | | | | | | | | | | | | | | | | | Copper | | | | | | | | Other | | | |
| | | | | | | | | Cerro | | | | | | Indonesia | | | | Molybdenum | | Rod & | | Smelting | | | | | | | | & Elimi- | | FCX | |
| Morenci | | | | Other | | Total | | Verde | | Other | | Total | | Mining | | | | Mines | | Refining | | & Refining | | | | | | | | nations | | Total | |
| Year Ended December 31, 2020 | | | | | | | | | | | | | | | | | | | | | | | | | | | | | | | | | | |
| Revenues: | | | | | | | | | | | | | | | | | | | | | | | | | | | | | | | | | | |
| Unaffiliated customers | $ | 29 | | | | | $ | 48 | | | $ | 77 | | | $ | 2,282 | | | $ | 431 | | | $ | 2,713 | | | $ | 3,534 | | | | | $ | 0 | | | $ | 4,781 | | | $ | 2,020 | | | | | | | | | $ | 1,073 | | a | $ | 14,198 | | |
| Intersegment | 2,015 | | | | | 2,272 | | | 4,287 | | | 242 | | | 0 | |
| 242 | | | 80 | | | | | 222 | | | 33 | | | 17 | | | | | | | | | (4,881) | | | 0 | | |
| Production and delivery | 1,269 | | | | | 1,831 | | | 3,100 | | | 1,599 | |
| 379 | | | 1,978 | | | 1,606 | | | | | 230 | | | 4,819 | | | 1,962 | | | | | | | | | (3,664) | |
| 10,031 | | |
| Depreciation, depletion and amortization | 166 | | | | | 189 | | | 355 | | | 367 | | | 54 | | | 421 | | | 580 | | | | | 57 | | | 16 | | | 29 | | | | | | | | | 70 | | | 1,528 | | |
| | | | | | | | | | | | | | | | | | | | | | | | | | | | | | | | | | |
| Metals inventory adjustments | 4 | | | | | 48 | | | 52 | | | 0 | | | 3 | | | 3 | | | 0 | | | | | 10 | | | 3 | | | 0 | | | | | | | | | 28 | | | 96 | | |
| Selling, general and administrative expenses | 2 | | | | | 2 | | | 4 | | | 6 | | | 0 | | | 6 | | | 108 | | | | | 0 | | | 0 | | | 21 | | | | | | | | | 231 | |
| 370 | | |
| Mining exploration and research expenses | 0 | | | | | 2 | | | 2 | | | 0 | | | 0 | | | 0 | | | 0 | | | | | 0 | | | 0 | | | 0 | | | | | | | | | 48 | | | 50 | | |
| Environmental obligations and shutdown costs | 0 | | | | | (1) | | | (1) | | | 0 | | | 0 | | | 0 | | | 0 | | | | | 0 | | | 1 | | | 0 | | | | | | | | | 159 | | b | 159 | | |
| | | | | | | | | | | | | | | | | | | | | | | | | | | | | | | | | | |
| Net gain on sales of assets | 0 | | | | | 0 | | | 0 | | | 0 | | | 0 | | | 0 | | | 0 | | | | | 0 | | | 0 | | | 0 | | | | | | | | | (473) | | c | (473) | | |
| Operating income (loss) | 603 | | | | | 249 | | | 852 | | | 552 | | d | (5) | | | 547 | | | 1,320 | | | | | (75) | | | (25) | | d | 25 | |
| | | | | | | (207) | | d | 2,437 | | d |
| | | | | | | | | | | | | | | | | | | | | | | | | | | | | | | | | | |
| Interest expense, net | 2 | | | | | 0 | | | 2 | | | 139 | |
| 0 | | | 139 | | | 39 | | e | | | 0 | | | 0 | | | 6 | | | | | | | | | 412 | | | 598 | | |
| Provision for income taxes | 0 | | | | | 0 | | | 0 | | | 238 | |
| 1 | | | 239 | | | 606 | | | | | 0 | | | 0 | | | 2 | | | | | | | | | 97 | | f | 944 | | |
| Total assets at December 31, 2020 | 2,574 | | | | | 5,163 | | | 7,737 | | | 8,474 | | | 1,678 | | | 10,152 | | | 17,169 | | | | | 1,760 | | | 211 | | | 877 | | | | | | | | | 4,238 | | | 42,144 | | |
| Capital expenditures | 102 | | | | | 326 | | | 428 | | | 141 | | | 42 | | | 183 | | | 1,266 | | | | | 19 | | | 6 | | | 29 | | | | | | | | | 30 | | | 1,961 | | |
| | | | | | | | | | | | | | | | | | | | | | | | | | | | | | | | | | |
a.Includes revenues from FCX’s molybdenum sales company, which includes sales of molybdenum produced by the Molybdenum mines and by certain of the North America and South America copper mines.
b.Includes charges totaling $130 million associated with a framework for the resolution of all current and future potential talc-related litigation.
c.Includes a $486 million gain associated with the sale of FCX’s interests in the Kisanfu undeveloped project. Refer to Note 2 for further discussion.
d.Includes charges totaling $258 million associated with (i) idle facility costs (Cerro Verde), contract cancellation and other charges directly related to the COVID-19 pandemic and (ii) the April 2020 revised operating plans (including employee separation costs). These charges were primarily recorded in the Cerro Verde segment ($89 million), Corporate, Other & Eliminations ($57 million) and the Rod & Refining segment ($30 million).
e.Includes charges totaling $35 million associated with PT-FI's historical contested tax audits.
f.Includes tax charges totaling $135 million associated with the sale of the Kisanfu undeveloped project, partly offset by tax credits of $53 million associated with the reversal of a year-end 2019 tax charge related to the sale of FCX’s interest in the lower zone of the Timok exploration project in Serbia.
|
| | | | | | | | | | | | | | | | | | | | | | | | | | | | | | | | | | | | | | | | | | | | | | | | |
| | North America Copper Mines | | South America | | | | | | | | | | | | | |
| | | | | | | | | | | | | | | | | | | | Atlantic | | Corporate, | | | |
| | | | | | | | | | | | | | | | | | | | Copper | | Other | | | |
| | | | | | | | Cerro | | | | | | Indonesia | | Molybdenum | | Rod & | | Smelting | | & Elimi- | | FCX | |
| | Morenci | | Other | | Total | | Verde | | Other | | Total | | Mining | | Mines | | Refining | | & Refining | | nations | | Total | |
| Year Ended December 31, 2018 | | | | | | | | | | | | | | | | | | | | | | | | |
| Revenues: | | | | | | | | | | | | | | | | | | | | | | | | |
| Unaffiliated customers | $ | 90 |
| | $ | 54 |
| | $ | 144 |
| | $ | 2,709 |
| | $ | 594 |
| | $ | 3,303 |
| | $ | 5,446 |
|
| $ | — |
| | $ | 5,103 |
| | $ | 2,299 |
| | $ | 2,333 |
| a | $ | 18,628 |
| |
| Intersegment | 2,051 |
| | 2,499 |
| | 4,550 |
| | 352 |
| | — |
|
| 352 |
| | 113 |
| | 410 |
| | 31 |
| | 3 |
| | (5,459 | ) | | — |
| |
| Production and delivery | 1,183 |
| | 1,945 |
| | 3,128 |
| | 1,887 |
| b,c | 478 |
| | 2,365 |
| | 1,864 |
| d | 289 |
| | 5,117 |
| | 2,218 |
| | (3,290 | ) |
| 11,691 |
| |
| Depreciation, depletion and amortization | 176 |
| | 184 |
| | 360 |
| | 456 |
| | 90 |
| | 546 |
| | 606 |
| | 79 |
| | 11 |
| | 27 |
| | 125 |
| e | 1,754 |
| |
| Selling, general and administrative expenses | 3 |
| | 3 |
| | 6 |
| | 9 |
| | — |
| | 9 |
| | 123 |
| | — |
| | — |
| | 21 |
| | 284 |
|
| 443 |
| |
| Mining exploration and research expenses | — |
| | 3 |
| | 3 |
| | — |
| | — |
| | — |
| | — |
| | — |
| | — |
| | — |
| | 102 |
| | 105 |
| |
| Environmental obligations and shutdown costs | — |
| | 2 |
| | 2 |
| | — |
| | — |
| | — |
| | — |
| | — |
| | — |
| | — |
| | 87 |
| | 89 |
| |
| Net gain on sales of assets | — |
| | — |
| | — |
| | — |
| | — |
| | — |
| | — |
| | — |
| | — |
| | — |
| | (208 | ) | f | (208 | ) | |
| Operating income (loss) | 779 |
| | 416 |
| | 1,195 |
| | 709 |
| | 26 |
| | 735 |
| | 2,966 |
| | 42 |
| | 6 |
| | 36 |
|
| (226 | ) | | 4,754 |
| |
| | | | | | | | | | | | | | | | | | | | | | | | | |
| Interest expense, net | 3 |
| | 1 |
| | 4 |
| | 429 |
| c | — |
| | 429 |
| | 1 |
| | — |
| | — |
| | 25 |
| | 486 |
| | 945 |
| |
| Provision for (benefit from) income taxes | — |
| | — |
| | — |
| | 253 |
| c | 15 |
| | 268 |
| | 755 |
| g | — |
| | — |
| | 1 |
| | (33 | ) | h | 991 |
| |
| Total assets at December 31, 2018 | 2,922 |
| | 4,608 |
| | 7,530 |
| | 8,524 |
| | 1,707 |
| | 10,231 |
| | 15,646 |
| | 1,796 |
| | 233 |
| | 773 |
| | 6,007 |
| | 42,216 |
| |
| Capital expenditures | 216 |
| | 385 |
| | 601 |
| | 220 |
| | 17 |
| | 237 |
| | 1,001 |
| | 9 |
| | 5 |
| | 16 |
| | 102 |
| | 1,971 |
| |
| | | | | | | | | | | | | | | | | | | | | | | | | |
| Year Ended December 31, 2017 | | | | | | | | | | | | | | | | | | | | | | | | |
| Revenues: | | | | | | | | | | | | | | | | | | | | | | | | |
| Unaffiliated customers | $ | 228 |
| | $ | 180 |
| | $ | 408 |
| | $ | 2,811 |
| | $ | 498 |
| | $ | 3,309 |
| | $ | 4,445 |
| | $ | — |
| | $ | 4,456 |
| | $ | 2,031 |
| | $ | 1,754 |
| a | $ | 16,403 |
| |
| Intersegment | 1,865 |
| | 2,292 |
| | 4,157 |
| | 385 |
| | — |
|
| 385 |
| | — |
| | 268 |
| | 26 |
| | 1 |
| | (4,837 | ) | | — |
| |
| Production and delivery | 1,043 |
| | 1,702 |
| | 2,745 |
| | 1,878 |
| c | 366 |
| | 2,244 |
| | 1,735 |
| i | 227 |
| | 4,467 |
| | 1,966 |
| | (3,118 | ) | | 10,266 |
| j |
| Depreciation, depletion and amortization | 178 |
| | 247 |
| | 425 |
| | 441 |
| | 84 |
| | 525 |
| | 556 |
| | 76 |
| | 10 |
| | 28 |
| | 94 |
| | 1,714 |
| |
| Selling, general and administrative expenses | 2 |
| | 2 |
| | 4 |
| | 9 |
| | — |
| | 9 |
| | 126 |
| i | — |
| | — |
| | 18 |
| | 320 |
| | 477 |
| |
| Mining exploration and research expenses | — |
| | 2 |
| | 2 |
| | — |
| | — |
| | — |
| | — |
| | — |
| | — |
| | — |
| | 91 |
| | 93 |
| |
| Environmental obligations and shutdown costs | — |
| | — |
| | — |
| | — |
| | — |
| | — |
| | — |
| | — |
| | — |
| | — |
| | 244 |
| | 244 |
| |
| Net gain on sales of assets | — |
| | — |
| | — |
| | — |
| | — |
| | — |
| | — |
| | — |
| | — |
| | — |
| | (81 | ) | f | (81 | ) | |
| Operating income (loss) | 870 |
| | 519 |
| | 1,389 |
| | 868 |
| | 48 |
| | 916 |
| | 2,028 |
| | (35 | ) | | 5 |
| | 20 |
| | (633 | ) | | 3,690 |
| |
| | | | | | | | | | | | | | | | | | | | | | | | | |
| Interest expense, net | 3 |
| | 1 |
| | 4 |
| | 212 |
| c | — |
| | 212 |
| | 4 |
| | — |
| | — |
| | 18 |
| | 563 |
| | 801 |
| |
| Provision for (benefit from) income taxes | — |
| | — |
| | — |
| | 436 |
| c | 10 |
| | 446 |
| | 869 |
| | — |
| | — |
| | 5 |
| | (437 | ) | h | 883 |
| |
| Total assets at December 31, 2017 | 2,861 |
| | 4,241 |
| | 7,102 |
| | 8,878 |
| | 1,702 |
| | 10,580 |
| | 10,911 |
| | 1,858 |
| | 277 |
| | 822 |
| | 5,752 |
| | 37,302 |
| |
| Capital expenditures | 114 |
| | 53 |
| | 167 |
| | 103 |
| | 12 |
| | 115 |
| | 875 |
| | 5 |
| | 4 |
| | 41 |
| | 203 |
| | 1,410 |
| |
| |
a. | Includes revenues from FCX’s molybdenum sales company, which includes sales of molybdenum produced by the Molybdenum mines and by certain of the North America and South America copper mines. |
| |
b. | Includes charges totaling $69 million associated with Cerro Verde’s new three-year collective labor agreement. |
| |
c. | Includes net charges totaling $14 million in production and delivery costs in 2018 and $203 million in 2017, $370 million in interest expense in 2018 and $145 million in 2017, and $35 million of net tax benefits in provision for income taxes in 2018 and $7 million of net tax charges in 2017 associated with disputed royalties for prior years. |
| |
d. | Includes net charges of $223 million primarily associated with surface water tax disputes with the local regional tax authority in Papua, assessments of prior period permit fees | | | | | | | | | | | | | | | | | | | | | | | | | | | | | | | | | | | | | | | | | | | | | | | | | | | | | | | | | | | | | | | | | | | | | | | | | | | | | | | | | | | | | | | | | | | | | | | North America Copper Mines | | South America Mining | | | | | | | | | | | | | | | | | | | | | | | | | | | | | | | | | | | | | | | | | | | | | Atlantic | | | | | | | | Corporate, | | | | | | | | | | | | | | | | | | | | | | | | | | | Copper | | | | | | | | Other | | | | | | | | | | | | | Cerro | | | | | | Indonesia | | | | Molybdenum | | Rod & | | Smelting | | | | | | | | & Elimi- | | FCX | | | Morenci | | | | Other | | Total | | Verde | | Other | | Total | | Mining | | | | Mines | | Refining | | & Refining | | | | | | | | nations | | Total | | | Year Ended December 31, 2019 | | | | | | | | | | | | | | | | | | | | | | | | | | | | | | | | | | | | Revenues: | | | | | | | | | | | | | | | | | | | | | | | | | | | | | | | | | | | | Unaffiliated customers | $ | 143 | | | | | $ | 224 | | | $ | 367 | | | $ | 2,576 | | | $ | 499 | | | $ | 3,075 | | | $ | 2,713 | | a | | | $ | 0 | | | $ | 4,457 | | | $ | 2,063 | | | | | | | | | $ | 1,727 | | b | $ | 14,402 | | | | Intersegment | 1,864 | | | | | 2,155 | | | 4,019 | | | 313 | | | 0 | | | 313 | | | 58 | | | | | 344 | | | 26 | | | 5 | | | | | | | | | (4,765) | | | 0 | | | | Production and delivery | 1,376 | | | | | 1,943 | | | 3,319 | | | 1,852 | | | 474 | | | 2,326 | | | 2,055 | | c | | | 299 | | | 4,475 | | | 1,971 | | | | | | | | | (2,911) | | | 11,534 | | | | Depreciation, depletion and amortization | 171 | | | | | 178 | | | 349 | | | 406 | | | 68 | | | 474 | | | 406 | | | | | 62 | | | 9 | | | 28 | | | | | | | | | 84 | | | 1,412 | | | | | | | | | | | | | | | | | | | | | | | | | | | | | | | | | | | | | | | Metals inventory adjustments | 1 | | | | | 29 | | | 30 | | | 2 | | | 0 | | | 2 | | | 5 | | | | | 50 | | | 0 | | | 0 | | | | | | | | | 92 | | | 179 | | | | Selling, general and administrative expenses | 2 | | | | | 2 | | | 4 | | | 8 | | | 0 | | | 8 | | | 125 | | | | | 0 | | | 0 | | | 20 | | | | | | | | | 237 | | | 394 | | | | Mining exploration and research expenses | 0 | | | | | 2 | | | 2 | | | 0 | | | 0 | | | 0 | | | 0 | | | | | 0 | | | 0 | | | 0 | | | | | | | | | 102 | | | 104 | | | | Environmental obligations and shutdown costs | 1 | | | | | 0 | | | 1 | | | 0 | | | 0 | | | 0 | | | 0 | | | | | 0 | | | 0 | | | 0 | | | | | | | | | 104 | | | 105 | | | | | | | | | | | | | | | | | | | | | | | | | | | | | | | | | | | | | | | Net gain on sales of assets | 0 | | | | | 0 | | | 0 | | | 0 | | | 0 | | | 0 | | | 0 | | | | | 0 | | | 0 | | | 0 | | | | | | | | | (417) | | d | (417) | | | | Operating income (loss) | 456 | | | | | 225 | | | 681 | | | 621 | | | (43) | | | 578 | | | 180 | | | | | (67) | | | (1) | | | 49 | | | | | | | | | (329) | | | 1,091 | | | | | | | | | | | | | | | | | | | | | | | | | | | | | | | | | | | | | | | Interest expense, net | 3 | | | | | 1 | | | 4 | | | 114 | | | 0 | | | 114 | | | 82 | | c | | | 0 | | | 0 | | | 22 | | | | | | | | | 398 | | | 620 | | | | Provision for (benefit from) income taxes | 0 | | | | | 0 | | | 0 | | | 250 | | | (11) | | | 239 | | | 167 | | c | | | 0 | | | 0 | | | 5 | | | | | | | | | 99 | | e | 510 | | | | Total assets at December 31, 2019 | 2,880 | | | | | 5,109 | | | 7,989 | | | 8,612 | | | 1,676 | | | 10,288 | | | 16,485 | | | | | 1,798 | | | 193 | | | 761 | | | | | | | | | 3,295 | | | 40,809 | | | | Capital expenditures | 231 | | | | | 646 | | | 877 | | | 232 | | | 24 | | | 256 | | | 1,369 | | | | | 19 | | | 5 | | | 34 | | | | | | | | | 92 | | | 2,652 | | |
a.Includes charges totaling $155 million associated with an unfavorable Indonesia Supreme Court ruling related to PT-FI export duties. Refer to Note 12 for further discussion. b.Includes revenues from FCX’s molybdenum sales company, which includes sales of molybdenum produced by the Molybdenum mines and by certain of the North America and South America copper mines. c.Includes net charges totaling $28 million in production and delivery costs for an adjustment to the settlement of the historical surface water tax matters with the local regional tax authority in Papua, Indonesia, and $78 million in interest expense and $103 million of tax charges in provision for income taxes associated with PT-FI’s historical contested tax disputes. d.Includes net gains totaling $343 million associated with the sale of FCX’s interest in the lower zone of the Timok exploration project and $59 million for the sale of a portion of Freeport Cobalt. Refer to Note 2 for further discussion. e.Includes tax charges totaling $53 million associated with the sale of FCX’s interest in the lower zone of the Timok exploration project and $49 million primarily to adjust deferred taxes on historical balance sheet items in accordance with tax accounting principles.
| | | | | | | | | | | | | | | | | | | | | | | | | | | | | | | | | | | | | | | | | | | | | | | | | | | | | | | | | | | | | | | | | | | | | | | | | | | | | | | | | | | | | | | | | | | | | | | North America Copper Mines | | South America Mining | | | | | | | | | | | | | | | | | | | | | | | | | | | | | | | | | | | | | | | | | | | | | Atlantic | | | | | | | | Corporate, | | | | | | | | | | | | | | | | | | | | | | | | | | | Copper | | | | | | | | Other | | | | | | | | | | | | | Cerro | | | | | | Indonesia | | | | Molybdenum | | Rod & | | Smelting | | | | | | | | & Elimi- | | FCX | | | Morenci | | | | Other | | Total | | Verde | | Other | | Total | | Mining | | | | Mines | | Refining | | & Refining | | | | | | | | nations | | Total | | | Year Ended December 31, 2018 | | | | | | | | | | | | | | | | | | | | | | | | | | | | | | | | | | | | Revenues: | | | | | | | | | | | | | | | | | | | | | | | | | | | | | | | | | | | | Unaffiliated customers | $ | 90 | | | | | $ | 54 | | | $ | 144 | | | $ | 2,709 | | | $ | 594 | | | $ | 3,303 | | | $ | 5,446 | | | | | $ | 0 | | | $ | 5,103 | | | $ | 2,299 | | | | | | | | | $ | 2,333 | | a | $ | 18,628 | | | | Intersegment | 2,051 | | | | | 2,499 | | | 4,550 | | | 352 | | | 0 | |
| 352 | | | 113 | | | | | 410 | | | 31 | | | 3 | | | | | | | | | (5,459) | | | 0 | | | | Production and delivery | 1,183 | | | | | 1,941 | | | 3,124 | | | 1,887 | | b,c | 478 | | | 2,365 | | | 1,864 | | d | | | 289 | | | 5,117 | | | 2,218 | | | | | | | | | (3,269) | |
| 11,708 | | | | Depreciation, depletion and amortization | 176 | | | | | 184 | | | 360 | | | 456 | | | 90 | | | 546 | | | 606 | | | | | 79 | | | 11 | | | 27 | | | | | | | | | 125 | | e | 1,754 | | | | | | | | | | | | | | | | | | | | | | | | | | | | | | | | | | | | | | | Metals inventory adjustments | 0 | | | | | 4 | | | 4 | | | 0 | | | 0 | | | 0 | | | 0 | | | | | 0 | | | 0 | | | 0 | | | | | | | | | 0 | | | 4 | | | | Selling, general and administrative expenses | 3 | | | | | 3 | | | 6 | | | 9 | | | 0 | | | 9 | | | 123 | | | | | 0 | | | 0 | | | 21 | | | | | | | | | 263 | | | 422 | | | | Mining exploration and research expenses | 0 | | | | | 3 | | | 3 | | | 0 | | | 0 | | | 0 | | | 0 | | | | | 0 | | | 0 | | | 0 | | | | | | | | | 102 | | | 105 | | | | Environmental obligations and shutdown costs | 0 | | | | | 2 | | | 2 | | | 0 | | | 0 | | | 0 | | | 0 | | | | | 0 | | | 0 | | | 0 | | | | | | | | | 87 | | | 89 | | | | | | | | | | | | | | | | | | | | | | | | | | | | | | | | | | | | | | | Net gain on sales of assets | 0 | | | | | 0 | | | 0 | | | 0 | | | 0 | | | 0 | | | 0 | | | | | 0 | | | 0 | | | 0 | | | | | | | | | (208) | | f | (208) | | | | Operating income (loss) | 779 | | | | | 416 | | | 1,195 | | | 709 | | | 26 | | | 735 | | | 2,966 | | | | | 42 | | | 6 | | | 36 | | | | | | | | | (226) | | | 4,754 | | | | | | | | | | | | | | | | | | | | | | | | | | | | | | | | | | | | | | | Interest expense, net | 3 | | | | | 1 | | | 4 | | | 429 | | b | 0 | | | 429 | | | 1 | | | | | 0 | | | 0 | | | 25 | | | | | | | | | 486 | | | 945 | | | | Provision for (benefit from) income taxes | 0 | | | | | 0 | | | 0 | | | 253 | | b | 15 | | | 268 | | | 755 | | g | | | 0 | | | 0 | | | 1 | | | | | | | | | (33) | | h | 991 | | | | Total assets at December 31, 2018 | 2,922 | | | | | 4,608 | | | 7,530 | | | 8,524 | | | 1,707 | | | 10,231 | | | 15,646 | | | | | 1,796 | | | 233 | | | 773 | | | | | | | | | 6,007 | |
| 42,216 | | | | Capital expenditures | 216 | | | | | 385 | | | 601 | | | 220 | | | 17 | | | 237 | | | 1,001 | | | | | 9 | | | 5 | | | 16 | | | | | | | | | 102 | |
| 1,971 | | |
a.Includes revenues from FCX’s molybdenum sales company, which includes sales of molybdenum produced by the Molybdenum mines and by certain of the North America and South America copper mines. b.Includes net charges totaling $14 million in production and delivery costs, $370 million in interest expense and $35 million of net tax benefits in provision for income taxes associated with disputed royalties for prior years. c.Includes charges totaling $69 million associated with Cerro Verde’s three-year collective labor agreement. d.Includes net charges of $223 million, primarily associated with surface water tax disputes with the local regional tax authority in Papua, Indonesia, assessments for prior period permit fees with Indonesia’s MOEF, disputed payroll withholding taxes for prior years and other tax settlements, and to write-off certain previously capitalized project costs for the new smelter in Indonesia, partially offset by inventory adjustments. |
| |
e. | Includes $31 million of depreciation expense at Freeport Cobalt from December 2016 through December 2017 that was suspended while it was classified as held for sale. |
| |
f. | Includes net gains in 2018 totaling $97 million associated with a favorable adjustment to the estimated fair value less costs to sell for Freeport Cobalt and fair value adjustments of $31 million associated with potential contingent consideration related to the 2016 sale of onshore California oil and gas properties; and net gains in 2017, primarily associated with sales of oil and gas properties of $49 million and a favorable adjustment of $13 million associated with the estimated fair value less costs to sell for the Kisanfu exploration project. Refer to Note 2 for further discussion. |
| |
g. | Includes tax credits totaling $571 million related to the change in PT-FI's tax rates in accordance with its IUPK ($504 million), U.S. tax reform ($47 million) and adjustment to PT-FI's historical tax positions ($20 million). |
| |
h. | Includes net tax credits totaling $76 million in 2018 and $438 million in 2017 primarily related to U.S. tax reform. Refer to Note 11 for further discussion. |
| |
i. | Includes net charges at PT-FI associated with workforce reductions totaling $120 million in production and delivery costs and $5 million in selling, general and administrative expenses. |
| |
j. | Includes a $42 million decrease related to the adoption of the new guidance for the presentation of net periodic benefit cost for pension and other postretirement benefit plans (refer to Note 1 for further discussion). |
|
| | | | | | | | | | | | | | | | | | | | | | | | | | | | | | | | | | | | | | | | | | | | | | | | |
| | | | | | |
| | North America Copper Mines | | South America | | | | | | | | | | | | | |
| | | | | | | | | | | | | | | | | | | | Atlantic | | Corporate, | | | |
| | | | | | | | | | | | | | | | | | | | Copper | | Other | | | |
| | | | | | | | Cerro | | | | | | Indonesia | | Molybdenum | | Rod & | | Smelting | | & Elimi- | | FCX | |
| | Morenci | | Other | | Total | | Verde | | Other | | Total | | Mining | | Mines | | Refining | | & Refining | | nations | | Total | |
| Year Ended December 31, 2016 | | | | | | | | | | | | | | | | | | | | | | | | |
| Revenues: | | | | | | | | | | | | | | | | | | | | | | | | |
| Unaffiliated customers | $ | 444 |
| | $ | 240 |
| | $ | 684 |
| | $ | 2,241 |
| | $ | 510 |
| | $ | 2,751 |
| | $ | 3,233 |
| | $ | — |
| | $ | 3,833 |
| | $ | 1,825 |
| | $ | 2,504 |
| a,b | $ | 14,830 |
| |
| Intersegment | 1,511 |
| | 2,179 |
| | 3,690 |
| | 187 |
| | — |
|
| 187 |
| | 62 |
| | 186 |
| | 29 |
| | 5 |
| | (4,159 | ) | | — |
| |
| Production and delivery | 1,162 |
| | 1,752 |
| | 2,914 |
| | 1,351 |
| | 407 |
| | 1,758 |
| | 1,775 |
| | 212 |
| | 3,833 |
| | 1,712 |
| | (1,517 | ) | c | 10,687 |
| d |
| Depreciation, depletion and amortization | 217 |
| | 313 |
| | 530 |
| | 443 |
| | 110 |
| | 553 |
| | 384 |
| | 68 |
| | 10 |
| | 29 |
| | 956 |
| | 2,530 |
| |
| Impairment of oil and gas properties | — |
| | — |
| | — |
| | — |
| | — |
| | — |
| | — |
| | — |
| | — |
| | — |
| | 4,317 |
| | 4,317 |
| |
| Selling, general and administrative expenses | 2 |
| | 3 |
| | 5 |
| | 8 |
| | 1 |
| | 9 |
| | 88 |
| | — |
| | — |
| | 17 |
| | 478 |
| c | 597 |
| |
| Mining exploration and research expenses | — |
| | 3 |
| | 3 |
| | — |
| | — |
| | — |
| | — |
| | — |
| | — |
| | — |
| | 60 |
| | 63 |
| |
| Environmental obligations and shutdown costs | — |
| | — |
| | — |
| | — |
| | — |
| | — |
| | — |
| | — |
| | — |
| | — |
| | 14 |
| | 14 |
| |
| Net gain on sales of assets | (576 | ) | | — |
| | (576 | ) | | — |
| | — |
| | — |
| | — |
| | — |
| | — |
| | — |
| | (73 | ) | | (649 | ) | |
| Operating income (loss) | 1,150 |
| | 348 |
| | 1,498 |
| | 626 |
| | (8 | ) | | 618 |
| | 1,048 |
| | (94 | ) | | 19 |
| | 72 |
| | (5,890 | ) | | (2,729 | ) | |
| | | | | | | | | | | | | | | | | | | | | | | | | |
| Interest expense, net | 3 |
| | 1 |
| | 4 |
| | 82 |
| | — |
| | 82 |
| | — |
| | — |
| | — |
| | 15 |
| | 654 |
| | 755 |
| |
| Provision for (benefit from) income taxes | — |
| | — |
| | — |
| | 222 |
|
| (6 | ) | | 216 |
| | 442 |
| | — |
| | — |
| | 9 |
| | (296 | ) | | 371 |
| |
| Total assets at December 31, 2016 | 2,863 |
| | 4,448 |
| | 7,311 |
| | 9,076 |
| | 1,533 |
| | 10,609 |
| | 10,493 |
| | 1,934 |
| | 220 |
| | 658 |
| | 6,092 |
|
| 37,317 |
| |
| Capital expenditures | 77 |
| | 25 |
| | 102 |
| | 380 |
| | 2 |
| | 382 |
| | 1,025 |
| | 2 |
| | 1 |
| | 17 |
| | 1,284 |
| e | 2,813 |
| |
| |
a. | Includes revenues from FCX’s molybdenum sales company, which included sales of molybdenum produced by the Molybdenum mines and by certain of the North America and South America copper mines. |
| |
b. | Includes net mark-to-market losses totaling $35 million associated with oil derivative contracts, which were entered into as part of the terms to sell the onshore California oil and gas properties in 2016. |
| |
c. | Includes net charges for oil and gas operations totaling $1.0 billion in production and delivery costs, primarily for drillship settlements/idle rig and contract termination costs, inventory adjustments, asset impairments and other net charges, and $85 million in selling, general and administrative expenses for net restructuring charges. |
| |
d. | Includes a $46 million decrease related to the adoption of the new guidance for the presentation of net periodic benefit cost for pension and other postretirement benefit plans (refer to Note 1 for further discussion). |
| |
e. | Includes $1.2 billion associated with oil and gas operations and $73 million associated with discontinued operations. Refer to Note 2 for a summary of the results of discontinued operations. |
NOTE 17. GUARANTOR FINANCIAL STATEMENTS
All of the senior notes issued by FCX and discussed in Note 8 are fully and unconditionally guaranteed on a senior basis jointly and severally by FM O&G LLC, as guarantor, which is a 100-percent-owned subsidiary of FM O&G and FCX. The guarantee is an unsecured obligation of the guarantor and ranks equal in right of payment with all existing and future indebtedness of FM O&G LLC, including indebtedness under FCX’s revolving credit facility. The guarantee ranks senior in right of payment with all of FM O&G LLC’s future subordinated obligations and is effectively subordinated in right of payment to any debt of FM O&G LLC’s subsidiaries. The indentures provide that FM O&G LLC’s guarantee may be released or terminated for certain obligations under the following circumstances: (i) all or substantially all of the equity interests or assets of FM O&G LLC are sold to a third party; or (ii) FM O&G LLC no longer has any obligations under any FM O&G senior notes or any refinancing thereof and no longer guarantees any obligations of FCX under the revolving credit facility or any other senior debt or, in each case, any refinancing thereof.
The following condensed consolidating financial information includes information regarding FCX, as issuer, FM O&G LLC, as guarantor, and all other non-guarantor subsidiaries of FCX. Included are the condensed consolidating balance sheets at December 31, 2018 and 2017, and the related condensed consolidating statements of comprehensive income (loss) and the condensed consolidating statements of cash flows for the three years ended December 31, 2018, which should be read in conjunction with FCX’s notes to the consolidated financial statements.
CONDENSED CONSOLIDATING BALANCE SHEET
December 31, 2018
|
| | | | | | | | | | | | | | | | | | | |
| | FCX | | FM O&G LLC | | Non-guarantor | | | | Consolidated |
| | Issuer | | Guarantor | | Subsidiaries | | Eliminations | | FCX |
| ASSETS | | | | | | | | | |
| Current assets | $ | 309 |
| | $ | 620 |
| | $ | 10,376 |
| | $ | (585 | ) | | $ | 10,720 |
|
| Property, plant, equipment and mine development costs, net | 19 |
| | 7 |
| | 27,984 |
| | — |
| | 28,010 |
|
| Investments in consolidated subsidiaries | 19,064 |
| | — |
| | — |
| | (19,064 | ) | | — |
|
| Other assets | 880 |
| | 23 |
| | 3,218 |
| | (635 | ) | | 3,486 |
|
| Total assets | $ | 20,272 |
| | $ | 650 |
| | $ | 41,578 |
| | $ | (20,284 | ) | | $ | 42,216 |
|
| | | | | | | | | | |
| LIABILITIES AND EQUITY | | | | | | | | | |
| Current liabilities | $ | 245 |
| | $ | 34 |
| | $ | 3,667 |
| | $ | (617 | ) | | $ | 3,329 |
|
| Long-term debt, less current portion | 9,594 |
| | 6,984 |
| | 5,649 |
| | (11,103 | ) | | 11,124 |
|
| Deferred income taxes | 524 |
| a | — |
| | 3,508 |
| | — |
| | 4,032 |
|
| Environmental and asset retirement obligations, less current portion | — |
| | 227 |
| | 3,382 |
| | — |
| | 3,609 |
|
| Investments in consolidated subsidiary | — |
| | 578 |
| | 10,513 |
| | (11,091 | ) | | — |
|
| Other liabilities | 111 |
| | 3,340 |
| | 2,265 |
| | (3,486 | ) | | 2,230 |
|
| Total liabilities | 10,474 |
| | 11,163 |
| | 28,984 |
| | (26,297 | ) | | 24,324 |
|
| | | | | | | | | | |
| Equity: | | | | | | | | | |
| Stockholders’ equity | 9,798 |
| | (10,513 | ) | | 9,912 |
| | 601 |
| | 9,798 |
|
| Noncontrolling interests | — |
| | — |
| | 2,682 |
| | 5,412 |
| | 8,094 |
|
| Total equity | 9,798 |
| | (10,513 | ) | | 12,594 |
| | 6,013 |
| | 17,892 |
|
| Total liabilities and equity | $ | 20,272 |
| | $ | 650 |
| | $ | 41,578 |
| | $ | (20,284 | ) | | $ | 42,216 |
|
| |
a. | All U.S.-related deferred income taxes are recorded at the parent company. |
CONDENSED CONSOLIDATING BALANCE SHEET
December 31, 2017
|
| | | | | | | | | | | | | | | | | | | |
| | FCX | | FM O&G LLC | | Non-guarantor | | | | Consolidated |
| | Issuer | | Guarantor | | Subsidiaries | | Eliminations | | FCX |
| ASSETS | | | | | | | | | |
| Current assets | $ | 75 |
| | $ | 671 |
| | $ | 10,670 |
| | $ | (790 | ) | | $ | 10,626 |
|
| Property, plant, equipment and mine development costs, net | 14 |
| | 11 |
| | 22,979 |
| | (10 | ) | | 22,994 |
|
| Investments in consolidated subsidiaries | 19,570 |
| | — |
| | — |
| | (19,570 | ) | | — |
|
| Other assets | 943 |
| | 48 |
| | 3,182 |
| | (491 | ) | | 3,682 |
|
| Total assets | $ | 20,602 |
| | $ | 730 |
| | $ | 36,831 |
| | $ | (20,861 | ) | | $ | 37,302 |
|
| | | | | | | | | | |
| LIABILITIES AND EQUITY | | | | | | | | | |
| Current liabilities | $ | 1,683 |
| | $ | 220 |
| | $ | 3,949 |
| | $ | (938 | ) | | $ | 4,914 |
|
| Long-term debt, less current portion | 10,021 |
| | 6,512 |
| | 5,552 |
| | (10,270 | ) | | 11,815 |
|
| Deferred income taxes | 748 |
| a | — |
| | 2,915 |
| | — |
| | 3,663 |
|
| Environmental and asset retirement obligations, less current portion | — |
| | 201 |
| | 3,401 |
| | — |
| | 3,602 |
|
| Investments in consolidated subsidiary | — |
| | 853 |
| | 10,397 |
| | (11,250 | ) | | — |
|
| Other liabilities | 173 |
| | 3,340 |
| | 1,987 |
| | (3,488 | ) | | 2,012 |
|
| Total liabilities | 12,625 |
| | 11,126 |
| | 28,201 |
| | (25,946 | ) | | 26,006 |
|
| | | | | | | | | | |
| Equity: | | | | | | | | | |
| Stockholders’ equity | 7,977 |
| | (10,396 | ) | | 5,916 |
| | 4,480 |
| | 7,977 |
|
| Noncontrolling interests | — |
| | — |
| | 2,714 |
| | 605 |
| | 3,319 |
|
| Total equity | 7,977 |
| | (10,396 | ) | | 8,630 |
| | 5,085 |
| | 11,296 |
|
| Total liabilities and equity | $ | 20,602 |
| | $ | 730 |
| | $ | 36,831 |
| | $ | (20,861 | ) | | $ | 37,302 |
|
| |
a. | All U.S.-related deferred income taxes are recorded at the parent company.
|
CONDENSED CONSOLIDATING STATEMENTS OF COMPREHENSIVE INCOME (LOSS)
|
| | | | | | | | | | | | | | | | | | | |
| Year Ended December 31, 2018 | | | | | | | | | |
| | FCX | | FM O&G LLC | | Non-guarantor | | | | Consolidated |
| | Issuer | | Guarantor | | Subsidiaries | | Eliminations | | FCX |
| Revenues | $ | — |
| | $ | 59 |
| | $ | 18,569 |
| | $ | — |
| | $ | 18,628 |
|
| Total costs and expenses | 28 |
| | 58 |
|
| 13,798 |
|
| (10 | ) | | 13,874 |
|
| Operating (loss) income | (28 | ) | | 1 |
| | 4,771 |
| | 10 |
| | 4,754 |
|
| Interest expense, net | (388 | ) | | (301 | ) | | (734 | ) | | 478 |
| | (945 | ) |
| Net gain (loss) on early extinguishment of debt | 7 |
| | 2 |
| | (2 | ) | | — |
| | 7 |
|
| Other income (expense), net | 477 |
| | — |
| | 77 |
| | (478 | ) | | 76 |
|
| Income (loss) before income taxes and equity in affiliated companies’ net earnings (losses) | 68 |
| | (298 | ) | | 4,112 |
| | 10 |
| | 3,892 |
|
| (Provision for) benefit from income taxes | (176 | ) | | 61 |
| | (874 | ) | | (2 | ) | | (991 | ) |
| Equity in affiliated companies’ net earnings (losses) | 2,710 |
| | 10 |
| | (219 | ) | | (2,493 | ) | | 8 |
|
| Net income (loss) from continuing operations | 2,602 |
| | (227 | ) | | 3,019 |
| | (2,485 | ) | | 2,909 |
|
| Net loss from discontinued operations | — |
| | — |
| | (15 | ) | | — |
| | (15 | ) |
| Net income (loss) | 2,602 |
| | (227 | ) | | 3,004 |
| | (2,485 | ) | | 2,894 |
|
| Net income attributable to noncontrolling interests | — |
| | — |
| | (68 | ) | | (224 | ) | | (292 | ) |
| Net income (loss) attributable to common stockholders | $ | 2,602 |
| | $ | (227 | ) | | $ | 2,936 |
| | $ | (2,709 | ) | | $ | 2,602 |
|
| | | | | | | | | | |
| Other comprehensive (loss) income | (33 | ) | | — |
| | (33 | ) | | 33 |
| | (33 | ) |
| Total comprehensive income (loss) | $ | 2,569 |
| | $ | (227 | ) | | $ | 2,903 |
| | $ | (2,676 | ) | | $ | 2,569 |
|
|
| | | | | | | | | | | | | | | | | | | |
| Year Ended December 31, 2017 | | | | | | | | | |
| | FCX | | FM O&G LLC | | Non-guarantor | | | | Consolidated |
| | Issuer | | Guarantor | | Subsidiaries | | Eliminations | | FCX |
| Revenues | $ | — |
| | $ | 52 |
| | $ | 16,351 |
| | $ | — |
| | $ | 16,403 |
|
| Total costs and expenses | 39 |
| | 78 |
|
| 12,586 |
|
| 10 |
| | 12,713 |
|
| Operating (loss) income | (39 | ) | | (26 | ) | | 3,765 |
| | (10 | ) | | 3,690 |
|
| Interest expense, net | (467 | ) | | (227 | ) | | (455 | ) | | 348 |
| | (801 | ) |
| Net gain (loss) on early extinguishment of debt | 22 |
| | 5 |
| | (6 | ) | | — |
| | 21 |
|
| Other income (expense), net | 336 |
| | — |
| | 4 |
| | (348 | ) | | (8 | ) |
| (Loss) income before income taxes and equity in affiliated companies’ net earnings (losses) | (148 | ) | | (248 | ) | | 3,308 |
| | (10 | ) | | 2,902 |
|
| Benefit from (Provision for) income taxes | 220 |
| | (108 | ) | | (998 | ) | | 3 |
| | (883 | ) |
| Equity in affiliated companies’ net earnings (losses) | 1,745 |
| | 10 |
| | (337 | ) | | (1,408 | ) | | 10 |
|
| Net income (loss) from continuing operations | 1,817 |
| | (346 | ) | | 1,973 |
| | (1,415 | ) | | 2,029 |
|
| Net income from discontinued operations | — |
| | — |
| | 66 |
| | — |
| | 66 |
|
| Net income (loss) | 1,817 |
| | (346 | ) | | 2,039 |
| | (1,415 | ) | | 2,095 |
|
| Net income attributable to noncontrolling interests: | | | | | | | | | |
| Continuing operations | — |
| | — |
| | (150 | ) | | (124 | ) | | (274 | ) |
| Discontinued operations | — |
| | — |
| | (4 | ) | | — |
| | (4 | ) |
| Net income (loss) attributable to common stockholders | $ | 1,817 |
| | $ | (346 | ) | | $ | 1,885 |
| | $ | (1,539 | ) | | $ | 1,817 |
|
| | | | | | | | | | |
| Other comprehensive income (loss) | 61 |
| | — |
| | 61 |
| | (61 | ) | | 61 |
|
| Total comprehensive income (loss) | $ | 1,878 |
| | $ | (346 | ) | | $ | 1,946 |
| | $ | (1,600 | ) | | $ | 1,878 |
|
CONDENSED CONSOLIDATING STATEMENT OF COMPREHENSIVE INCOME (LOSS)
|
| | | | | | | | | | | | | | | | | | | |
| Year Ended December 31, 2016 | | | | | | | | | |
| | FCX | | FM O&G LLC | | Non-guarantor | | | | Consolidated |
| | Issuer | | Guarantor | | Subsidiaries | | Eliminations | | FCX |
| Revenues | $ | — |
| | $ | 379 |
| | $ | 14,451 |
| | $ | — |
| | $ | 14,830 |
|
| Total costs and expenses | 72 |
| | 3,074 |
| a | 14,403 |
| a | 10 |
| | 17,559 |
|
| Operating (loss) income | (72 | ) | | (2,695 | ) | | 48 |
| | (10 | ) | | (2,729 | ) |
| Interest expense, net | (534 | ) | | (56 | ) | | (498 | ) | | 333 |
| | (755 | ) |
| Net gain on early extinguishment of debt | 26 |
| | — |
| | — |
| | — |
| | 26 |
|
| Other income (expense), net | 268 |
| | — |
| | 10 |
| | (292 | ) | | (14 | ) |
| (Loss) income before income taxes and equity in affiliated companies’ net (losses) earnings | (312 | ) | | (2,751 | ) | | (440 | ) | | 31 |
| | (3,472 | ) |
| (Provision for) benefit from income taxes | (2,233 | ) | | 1,053 |
| | 821 |
| | (12 | ) | | (371 | ) |
| Equity in affiliated companies’ net (losses) earnings | (1,609 | ) | | (3,101 | ) | | (4,790 | ) | | 9,511 |
| | 11 |
|
| Net (loss) income from continuing operations | (4,154 | ) | | (4,799 | ) | | (4,409 | ) | | 9,530 |
| | (3,832 | ) |
| Net income from discontinued operations | — |
| | — |
| | (154 | ) | | (39 | ) | | (193 | ) |
| Net (loss) income | (4,154 | ) | | (4,799 | ) | | (4,563 | ) | | 9,491 |
| | (4,025 | ) |
| Net income and gain on redemption and preferred dividends attributable to noncontrolling interests: | | | | | | | | | |
| Continuing operations | — |
| | — |
| | — |
| | (66 | ) | | (66 | ) |
| Discontinued operations | — |
| | — |
| | (63 | ) | | — |
| | (63 | ) |
| Net (loss) income attributable to common stockholders | $ | (4,154 | ) | | $ | (4,799 | ) | | $ | (4,626 | ) | | $ | 9,425 |
| | $ | (4,154 | ) |
| | | | | | | | | | |
| Other comprehensive (loss) income | (45 | ) | | — |
| | (45 | ) | | 45 |
| | (45 | ) |
| Total comprehensive (loss) income | $ | (4,199 | ) | | $ | (4,799 | ) | | $ | (4,671 | ) | | $ | 9,470 |
| | $ | (4,199 | ) |
| |
a. | Includes impairment charges totaling $1.5 billion at the FM O&G LLC Guarantor and $2.8 billion at the non-guarantor subsidiaries related to ceiling test impairment charges for FCX’s oil and gas properties pursuant to full cost accounting rules and a goodwill impairment charge. |
CONDENSED CONSOLIDATING STATEMENT OF CASH FLOWS
|
| | | | | | | | | | | | | | | | | | | |
| Year Ended December 31, 2018 | | | | | | | | | |
| | FCX | | FM O&G LLC | | Non-guarantor | | | | Consolidated |
| | Issuer | | Guarantor | | Subsidiaries | | Eliminations | | FCX |
| Net cash (used in) provided by operating activities | $ | (40 | ) | | $ | (487 | ) | | $ | 4,390 |
| | $ | — |
| | $ | 3,863 |
|
| | | | | | | | | | |
| Cash flow from investing activities: | | | | | | | | | |
| Capital expenditures | (2 | ) | | — |
| | (1,969 | ) | | — |
| | (1,971 | ) |
| Acquisition of PT Rio Tinto Indonesia | — |
| | — |
| | (3,500 | ) | | — |
| | (3,500 | ) |
| Intercompany loans | (832 | ) | | — |
| | — |
| | 832 |
| | — |
|
| Dividends from (investments in) consolidated subsidiaries | 2,475 |
| | — |
| | 84 |
| | (2,559 | ) | | — |
|
| Asset sales and other, net | 460 |
| | 6 |
| | (13 | ) | | — |
| | 453 |
|
| Net cash provided by (used in) investing activities | 2,101 |
| | 6 |
| | (5,398 | ) | | (1,727 | ) | | (5,018 | ) |
| | | | | | | | | | |
| Cash flow from financing activities: | | | | | | | | | |
| Proceeds from debt | — |
| | — |
| | 632 |
| | — |
| | 632 |
|
| Repayments of debt | (1,826 | ) | | (53 | ) | | (838 | ) | | — |
| | (2,717 | ) |
| Intercompany loans | — |
| | 526 |
| | 306 |
| | (832 | ) | | — |
|
| Proceeds from sale of PT Freeport Indonesia shares | — |
| | — |
| | 3,710 |
| | (210 | ) | | 3,500 |
|
| Cash dividends paid and distributions received, net | (217 | ) | | — |
| | (3,032 | ) | | 2,753 |
| | (496 | ) |
| Other, net | (18 | ) | | — |
| | (17 | ) | | 16 |
| | (19 | ) |
| Net cash (used in) provided by financing activities | (2,061 | ) | | 473 |
| | 761 |
| | 1,727 |
| | 900 |
|
| | | | | | | | | | |
| Net decrease in cash, cash equivalents, restricted cash and restricted cash equivalents | — |
| | (8 | ) | | (247 | ) | | — |
| | (255 | ) |
| Cash, cash equivalents, restricted cash and restricted cash equivalents at beginning of year | — |
| | 8 |
| | 4,702 |
| | — |
| | 4,710 |
|
| Cash, cash equivalents, restricted cash and restricted cash equivalents at end of year | $ | — |
| | $ | — |
| | $ | 4,455 |
| | $ | — |
| | $ | 4,455 |
|
CONDENSED CONSOLIDATING STATEMENTS OF CASH FLOWS
|
| | | | | | | | | | | | | | | | | | | |
| Year Ended December 31, 2017 | | | | | | | | | |
| | FCX | | FM O&G LLC | | Non-guarantor | | | | Consolidated |
| | Issuer | | Guarantor | | Subsidiaries | | Eliminations | | FCX |
| Net cash (used in) provided by operating activities | $ | (156 | ) | | $ | (467 | ) | | $ | 5,289 |
| | $ | — |
| | $ | 4,666 |
|
| | | | | | | | | | |
| Cash flow from investing activities: | | | | | | | | | |
| Capital expenditures | — |
| | (25 | ) | | (1,385 | ) | | — |
| | (1,410 | ) |
| Intercompany loans | (777 | ) | | — |
| | — |
| | 777 |
| | — |
|
| Dividends from (investments in) consolidated subsidiaries | 3,226 |
| | (15 | ) | | 120 |
| | (3,331 | ) | | — |
|
| Asset sales and other, net | — |
| | 57 |
| | 32 |
| | — |
| | 89 |
|
| Net cash provided by (used in) investing activities | 2,449 |
| | 17 |
| | (1,233 | ) | | (2,554 | ) | | (1,321 | ) |
| | | | | | | | | | |
| Cash flow from financing activities: | | | | | | | | | |
| Proceeds from debt | — |
| | — |
| | 955 |
| | — |
| | 955 |
|
| Repayments of debt | (2,281 | ) | | (205 | ) | | (1,326 | ) | | — |
| | (3,812 | ) |
| Intercompany loans | — |
| | 663 |
| | 114 |
| | (777 | ) | | — |
|
| Cash dividends and distributions paid, including redemption | (2 | ) | | — |
| | (3,440 | ) | | 3,266 |
| | (176 | ) |
| Other, net | (10 | ) | | (10 | ) | | (67 | ) | | 65 |
| | (22 | ) |
| Net cash (used in) provided by financing activities | (2,293 | ) | | 448 |
| | (3,764 | ) | | 2,554 |
| | (3,055 | ) |
| | | | | | | | | | |
| Net (decrease) increase in cash, cash equivalents, restricted cash and restricted cash equivalents | — |
| | (2 | ) | | 292 |
| | — |
| | 290 |
|
| Cash, cash equivalents, restricted cash and restricted cash equivalents at beginning of year | — |
| | 10 |
| | 4,410 |
| | — |
| | 4,420 |
|
| Cash, cash equivalents, restricted cash and restricted cash equivalents at end of year | $ | — |
| | $ | 8 |
| | $ | 4,702 |
| | $ | — |
| | $ | 4,710 |
|
|
| | | | | | | | | | | | | | | | | | | |
| Year Ended December 31, 2016 | | | | | | | | | |
| | FCX | | FM O&G LLC | | Non-guarantor | | | | Consolidated |
| | Issuer | | Guarantor | | Subsidiaries | | Eliminations | | FCX |
| Net cash (used in) provided by operating activities | $ | (137 | ) | | $ | (263 | ) | | $ | 4,135 |
| | $ | 2 |
| | $ | 3,737 |
|
| | | | | | | | | | |
| Cash flow from investing activities: | | | | | | | | | |
| Capital expenditures | — |
| | (567 | ) | | (2,248 | ) | | 2 |
| | (2,813 | ) |
| Intercompany loans | 481 |
| | (346 | ) | | — |
| | (135 | ) | | — |
|
| Dividends from (investments in) consolidated subsidiaries | 1,469 |
| | (45 | ) | | 176 |
| | (1,600 | ) | | — |
|
| Asset sales and other, net | 2 |
| | 1,673 |
| | 4,695 |
| | (4 | ) | | 6,366 |
|
| Net cash provided by (used in) investing activities | 1,952 |
| | 715 |
| | 2,623 |
| | (1,737 | ) | | 3,553 |
|
| | | | | | | | | | |
| Cash flow from financing activities: | | | | | | | | | |
| Proceeds from debt | 1,721 |
| | — |
| | 1,960 |
| | — |
| | 3,681 |
|
| Repayments of debt | (5,011 | ) | | — |
| | (2,614 | ) | | — |
| | (7,625 | ) |
| Intercompany loans | — |
| | (332 | ) | | 197 |
| | 135 |
| | — |
|
Net proceeds from sale of common stock
| 1,515 |
| | — |
| | 3,388 |
| | (3,388 | ) | | 1,515 |
|
| Cash dividends and distributions paid | (6 | ) | | (107 | ) | | (5,555 | ) | | 4,969 |
| | (699 | ) |
| Other, net | (34 | ) | | (3 | ) | | (20 | ) | | 19 |
| | (38 | ) |
| Net cash (used in) provided by financing activities | (1,815 | ) | | (442 | ) | | (2,644 | ) | | 1,735 |
| | (3,166 | ) |
| | | | | | | | | | |
| Net increase in cash, cash equivalents, restricted cash and restricted cash equivalents | — |
| | 10 |
| | 4,114 |
| | — |
| | 4,124 |
|
| Increase in cash and cash equivalents in assets held for sale | — |
| | — |
| | (45 | ) | | — |
| | (45 | ) |
| Cash, cash equivalents, restricted cash and restricted cash equivalents at beginning of year | — |
| | — |
| | 341 |
| | — |
| | 341 |
|
| Cash, cash equivalents, restricted cash and restricted cash equivalents at end of year | $ | — |
| | $ | 10 |
| | $ | 4,410 |
| | $ | — |
| | $ | 4,420 |
|
NOTE 18. SUBSEQUENT EVENTS
FCX evaluated events after December 31, 2018, and through the date the financial statements were issued, and determined any events or transactions occurring during this period that would require recognition or disclosure are appropriately addressed in these financial statements.
NOTE 19. QUARTERLY FINANCIAL INFORMATION (UNAUDITED)
|
| | | | | | | | | | | | | | | | | | | | |
| | First Quarter | | Second Quarter | | Third Quarter | | Fourth Quarter | | Year | |
| 2018 | | | | | | | | | | |
| Revenues | $ | 4,868 |
| | $ | 5,168 |
| | $ | 4,908 |
| | $ | 3,684 |
| | $ | 18,628 |
| |
| Operating income | 1,459 |
| | 1,664 |
| | 1,315 |
| | 316 |
| | 4,754 |
| |
| Net income from continuing operations | 828 |
| | 1,039 |
| | 668 |
| | 374 |
| | 2,909 |
| |
| Net (loss) income from discontinued operations | (11 | ) | | (4 | ) | | (4 | ) | | 4 |
| | (15 | ) | |
| Net income | 817 |
| | 1,035 |
| | 664 |
| | 378 |
| | 2,894 |
| |
| Net (income) loss attributable to noncontrolling interests from continuing operations | (125 | ) | | (166 | ) | | (108 | ) | | 107 |
| | (292 | ) | |
| Net income attributable to common stockholders | 692 |
| | 869 |
| | 556 |
| | 485 |
| | 2,602 |
| |
| | | | | | | | | | | |
| Basic net income (loss) per share attributable to common stockholders: | | | | | | | | | | |
| Continuing operations | $ | 0.48 |
| | $ | 0.60 |
|
| $ | 0.38 |
|
| $ | 0.33 |
|
| $ | 1.80 |
| |
| Discontinued operations | (0.01 | ) | | — |
| | — |
| | — |
| | (0.01 | ) | |
| | $ | 0.47 |
| | $ | 0.60 |
| | $ | 0.38 |
| | $ | 0.33 |
| | $ | 1.79 |
| |
| | | | | | | | | | | |
| Basic weighted-average shares outstanding | 1,449 |
| | 1,449 |
| | 1,450 |
| | 1,450 |
| | 1,449 |
| |
| |
| |
| |
| |
| |
| |
| Diluted net income (loss) per share attributable to common stockholders: | | | | | | | | | | |
| Continuing operations | $ | 0.48 |
| | $ | 0.59 |
| | $ | 0.38 |
| | $ | 0.33 |
| | $ | 1.79 |
| |
| Discontinued operations | (0.01 | ) | | — |
| | — |
| | — |
| | (0.01 | ) | |
| | $ | 0.47 |
| | $ | 0.59 |
| | $ | 0.38 |
| | $ | 0.33 |
| | $ | 1.78 |
| |
| | | | | | | | | | | |
| Diluted weighted-average shares outstanding | 1,458 |
| | 1,458 |
| | 1,458 |
| | 1,457 |
| | 1,458 |
| |
| | | | | | | | | | | |
Following summarizes significant charges (credits) included in FCX’s net income attributable to common stockholders for the 2018 quarters:
Net charges at Cerro Verde related to Peruvian government claims for disputed royalties (refer to Note 12 for further discussion) totaled $195 millionto net income attributable to common stockholders or $0.13 per share for the year (consisting of $14 million to production and delivery costs, $370 million to interest expense, $22 million to other expense, net of income tax benefits of $35 million and noncontrolling interests of $176 million), most of which was recorded in the fourth quarter.
Net charges at PT-FI totaled $223 million ($110 million to net income attributable to common stockholders or $0.08 per share) consisting of charges to production and delivery of $69 million for surface water tax disputes with the local regional tax authority in Papua,Indonesia,$32 million for assessments of prior period permit fees with the MOEF, $72 million for disputed payroll withholding taxes for prior years and other tax settlements and $62 million to write-off certain previously capitalized project costs for the new smelter in Indonesia, in fourth quarter, partlypartially offset by inventory adjustments of $12 million recorded in second quarter. The fourth quarter also included $43adjustments.
e.Includes $31 million of inventory adjustmentsdepreciation expense at PT-FI related to prior 2018 quarterly periods.
Net charges at Cerro Verde related to Cerro Verde’s new three-year collective bargaining agreement totaled $69 million ($22 millionto net income attributable to common stockholders or $0.02 per share) for the year, whichFreeport Cobalt from December 2016 through December 2017 that was recorded in the third quarter.
Net adjustments to environmental obligations and related litigation reserves totaled $57 millionto operating income and net income attributable to common stockholders ($0.04per share) for the year, most of whichsuspended while it was recorded in the second quarter.
Net gains on sales of assets for the year totaled $208 millionto operating income and net income attributable to common stockholders ($0.14per share), mostly associated with adjustments to assets no longer classified as held for sale, adjustmentssale.
f.Includes net gains totaling $97 million associated with a favorable adjustment to the estimated fair value less costs to sell for Freeport Cobalt and fair value adjustments of $31 million associated with potential contingent consideration related to the 2016 sale of onshore California oil and gas properties (which will continue to be adjusted through December 31, 2020) and the sale of Port Carteret (assets held for sale), and included $11 million in the first quarter, $45 million in the second quarter, $70 million in the third quarter and $82 millionin the fourth quarter. Refer to Note 2 for further discussion of asset dispositions.
properties.Other net charges for the year totaled $50 million ($30 million to net income attributable to common stockholders or $0.02 per share), including prior period depreciation expense at Freeport Cobalt that was suspended while it was classified as held for sale ($48 million in fourth-quarter and $31 million for the year).
Netg.Includes tax credits fortotaling $549 million related to the year totaled $632 million ($574 million net of noncontrolling interest or $0.39 per share), primarily associated with a reductionchange in PT-FI’s statutorytax rates in accordance with theits IUPK ($504482 million) and benefits associated with, U.S. tax reform ($12347 million), most of which was recorded and adjustments to PT-FI’s historical tax positions ($20 million).
h.Includes net tax credits totaling $76 million, primarily related to the Act and $22 million related to the change in the fourth quarter.PT-FI’s tax rates in accordance with its IUPK. Refer to Note 11 for further discussion.
In November 2016, FCX completed the sale of its interest in TFHL (refer to Note 2 for further discussion), and, in accordance with accounting guidance, reported the results of operations of TFHL as discontinued operations for all periods presented. Net (loss) income from discontinued operations for the 2018 periods primarily reflects adjustments to the fair value of the potential contingent consideration related to the sale, which will continue to be adjusted through December 31, 2019.
|
| | | | | | | | | | | | | | | | | | | | |
| | First Quarter | | Second Quarter | | Third Quarter | | Fourth Quarter | | Year | |
| 2017 | | | | | | | | | | |
| Revenues | $ | 3,341 |
| | $ | 3,711 |
| | $ | 4,310 |
| | $ | 5,041 |
| | $ | 16,403 |
| |
| Operating income | 597 |
| | 686 |
| | 928 |
| | 1,479 |
| | 3,690 |
| |
| Net income from continuing operations | 268 |
| | 326 |
| | 242 |
| | 1,193 |
| | 2,029 |
| |
| Net income from discontinued operations | 38 |
| | 9 |
| | 3 |
| | 16 |
| | 66 |
| |
| Net income | 306 |
| | 335 |
| | 245 |
| | 1,209 |
| | 2,095 |
| |
| Net (income) loss attributable to noncontrolling interests: | | | | | | | | | | |
| Continuing operations | (75 | ) | | (66 | ) | | 35 |
| | (168 | ) | | (274 | ) | |
| Discontinued operations | (3 | ) | | (1 | ) | | — |
| | — |
| | (4 | ) | |
| Net income attributable to common stockholders | 228 |
| | 268 |
| | 280 |
| | 1,041 |
| | 1,817 |
| |
| | | | | | | | | | | |
| Basic net income per share attributable to common stockholders: | | | | | | | | | | |
| Continuing operations | $ | 0.13 |
| | $ | 0.18 |
| | $ | 0.19 |
| | $ | 0.71 |
| | $ | 1.21 |
| |
| Discontinued operations | 0.03 |
| | — |
| | — |
| | 0.01 |
| | 0.04 |
| |
| | $ | 0.16 |
| | $ | 0.18 |
| | $ | 0.19 |
| | $ | 0.72 |
| | $ | 1.25 |
| |
| | | | | | | | | | | |
| Basic weighted-average shares outstanding | 1,446 |
| | 1,447 |
| | 1,448 |
| | 1,448 |
| | 1,447 |
| |
| | | | | | | | | | | |
| Diluted net income per share attributable to common stockholders: | | | | | | | | | | |
| Continuing operations | $ | 0.13 |
| | $ | 0.18 |
| | $ | 0.19 |
| | $ | 0.70 |
| | $ | 1.21 |
| |
| Discontinued operations | 0.03 |
| | — |
| | — |
| | 0.01 |
| | 0.04 |
| |
| | $ | 0.16 |
| | $ | 0.18 |
| | $ | 0.19 |
| | $ | 0.71 |
| | $ | 1.25 |
| |
| | | | | | | | | | | |
| Diluted weighted-average shares outstanding | 1,454 |
| | 1,453 |
| | 1,454 |
| | 1,455 |
| | 1,454 |
| |
| | | | | | | | | | | |
Following summarizes significant charges (credits) included in FCX’s net income attributable to common stockholders for the 2017 quarters:
Net charges at Cerro Verde related to Peruvian government claims for disputed royalties (refer to Note 12 for further discussion) totaled$186 million to net income attributable to common stockholders or $0.13 per share for the year (consistingTable of $203 millionto operating income, $145 millionto interest expense and $7 millionto provision for income taxes, net of $169 million to noncontrolling interests), most of which was recorded in the third quarter.Contents
Net charges associated with PT-FI workforce reductions for the year totaled $125 million to operating income ($66 million to net income attributable to common stockholders or $0.04 per share) and included $21 million in the first quarter, $87 million in the second quarter, $9 million in the third quarter and $8 million in the fourth quarter.
Net adjustments to environmental obligations and related litigation reserves totaled $210 million to operating income and net income attributable to common stockholders ($0.14 per share) for the year, and included net charges (credits) of $19 million in the first quarter, $(30) million in the second quarter, $64 million in the third quarter and $157 million in the fourth quarter.
Net gains on sales of assets totaled $81 millionto operating income and net income attributable to common stockholders ($0.06 per share) for the year, mostly associated with sales of oil and gas properties, and included $23 million in the first quarter, $10 million in the second quarter, $33 million in the third quarter and $15 millionin the fourth quarter. Refer to Note 2 for further discussion of asset dispositions.
Net tax credits totaled $438 million to net income attributable to common stockholders ($0.30per share) for the year, primarily associated with provisional tax credits associated with U.S. tax reform ($393 million), which were recorded in the fourth quarter. Refer to Note 11 for further discussion.
Net income from discontinued operations for the 2017 periods primarily reflected adjustments to the fair value of the potential contingent consideration related to the 2016 TFHL sale.
NOTE 20.17. SUPPLEMENTARY MINERAL RESERVE INFORMATION (UNAUDITED)
Recoverable proven and probable reserves have been calculatedestimated as of December 31, 2018,2020, in accordance with Industry Guide 7 as required by the Securities Exchange Act of 1934. FCX’s proven and probable reserves may not be comparable to similar information regarding mineral reserves disclosed in accordance with the guidance in other countries. Proven and probable reserves were determined by the use of mapping, drilling, sampling, assaying and evaluation methods generally applied in the mining industry, as more fully discussed below. The term “reserve,” as used in the reserve data presented here, means that part of a mineral deposit that can be economically and legally extracted or produced at the time of the reserve determination. The term “proven reserves” means reserves for which (i) quantity is computed from dimensions revealed in outcrops, trenches, workings or drill holes; (ii) grade and/or quality are computed from the results of detailed sampling; and (iii) the sites for inspection, sampling and measurements are spaced so closely and the geologic character is sufficiently defined that size, shape, depth and mineral content of reserves are well established. The term “probable reserves” means reserves for which quantity and grade are computed from information similar to that used for proven reserves but the sites for sampling are farther apart or are otherwise less adequately spaced. The degree of assurance, although lower than that for proven reserves, is high enough to assume continuity between points of observation.
FCX’s reserve estimates are based on the latest available geological and geotechnical studies. FCX conducts ongoing studies of its ore bodies to optimize economic values and to manage risk. FCX revises its mine plans and estimates of proven and probable mineral reserves as required in accordance with the latest available studies.
Estimated recoverable proven and probable reserves at December 31, 2018,2020, were determined using $2.50metals price assumptions of $2.50 per pound for copper, in North America and South America and $2.00 per pound for copper in Indonesia, $1,000$1,200 per ounce for gold and $10$10 per pound for molybdenum. Reserves for Indonesia would not significantly change if assessed under a long-term price of $2.50 per pound of copper as PT-FI’s reserve plan is mill-constrained by the term of its IUPK, which contains rights to extend mining rights through 2041.
For the three-year period ended December 31, 2018,2020, LME copper settlement prices averaged $2.65$2.83 per pound, LBMALondon PM gold prices averaged $1,259$1,477 per ounce and the weekly average price for molybdenum quoted by Metals Week averaged $8.85$10.65 per pound.
The recoverable proven and probable reserves presented in the table below represent the estimated metal quantities from which FCX expects to be paid after application of estimated metallurgical recovery rates and smelter recovery rates, where applicable. Recoverable reserves are that part of a mineral deposit that FCX estimates can be economically and legally extracted or produced at the time of the reserve determination.
| | | | | | | | | | | | | | | | | |
| Estimated Recoverable Proven and Probable Mineral Reserves |
| at December 31, 2020 |
| Coppera (billion pounds) | | Gold (million ounces) | | Molybdenum (billion pounds) |
| North America | 47.1 | | | 0.6 | | | 3.01 | |
| South America | 32.7 | | | 0 | | | 0.70 | |
Indonesiab | 33.4 | | | 28.3 | | | 0 | |
Consolidatedc | 113.2 | | | 28.9 | | | 3.71 | |
Net equity interestd | 81.8 | | | 15.5 | | | 3.39 | |
|
| | | | | | | | |
| | Estimated Recoverable Proven and Probable Mineral Reserves
|
| | at December 31, 2018 |
| | Coppera (billion pounds) | | Gold (million ounces) | | Molybdenum (billion pounds) |
| North America | 49.9 |
| | 0.6 |
| | 3.06 |
|
| South America | 33.5 |
| | — |
| | 0.72 |
|
| Indonesia | 36.2 |
| b | 30.2 |
| b | — |
|
Consolidatedc | 119.6 |
| | 30.8 |
| | 3.78 |
|
| | | | | | |
Net equity interestd | 86.8 |
| | 17.0 |
| | 3.44 |
|
| |
a. | Estimated consolidated recoverable copper reserves included 2.0 billion pounds in leach stockpiles and 0.6 billion pounds in mill stockpiles.
|
| |
b. | Includes 13.0 billion pounds of copper and 10.1 million ounces of gold associated with PT-FI's acquisition of the Rio Tinto Joint Venture interest. Estimated recoverable proven and probable reserves from Indonesia reflectb.Reflects estimates of minerals that can be recovered through 2041. Refer to Note 13 for discussion of PT-FI’s IUPK. |
| |
c. | Consolidated reserves represent estimated metal quantities after reduction for joint venture partner interests at the Morenci mine in North America (refer to Note 3 for further discussion). Excluded from the table above were FCX’s estimated recoverable proven and probable reserves of 393.1 million ounces of silver, which were determined using $15 per ounce and include 55.7 million ounces associated with PT-FI's acquisition of the Rio Tinto Joint Venture interest.
|
| |
d. | Net equity interest reserves represent estimated consolidated metal quantities further reduced for noncontrolling interest ownership (refer to Note 3 for further discussion of FCX’s ownership in subsidiaries). FCX's net equity interest for estimated metal quantities in Indonesia reflects approximately 81 percent from 2019 through 2022 and 48.76 percent from 2023 through 2041. Excluded from the table above were FCX’s estimated recoverable proven and probable reserves of 269.3 million ounces of silver. |
|
| | | | | | | | | | | | | | | | | | | | | |
| | | Estimated Recoverable Proven and Probable Mineral Reserves |
| | | at December 31, 2018 |
| | | | | Average Ore Grade Per Metric Tona | | Recoverable Proven and Probable Reservesb |
| | | Orea (million metric tons) | | Copper (%) | | Gold (grams) | | Molybdenum (%) | | Copper (billion pounds) | | Gold (million ounces) | | Molybdenum (billion pounds) |
| North America | | | | | | | | | | | | | | |
| Developed and producing: | | | | | | | | | | | | |
| Morenci | | 4,619 |
| | 0.24 |
| | — |
| | — |
| c | 15.6 |
| | — |
| | 0.18 |
|
| Sierrita | | 3,369 |
| | 0.23 |
| | — |
| c | 0.02 |
| | 14.0 |
| | 0.2 |
| | 1.42 |
|
| Bagdad | | 2,426 |
| | 0.32 |
| | — |
| c | 0.02 |
| | 14.7 |
| | 0.1 |
| | 0.74 |
|
Safford, including
Lone Stard | | 839 |
| | 0.44 |
| | — |
| | — |
| | 6.2 |
| | — |
| | — |
|
| Chino, including Cobre | | 395 |
| | 0.46 |
| | 0.03 |
| | 0.01 |
| | 3.4 |
| | 0.3 |
| | 0.01 |
|
| Climax | | 168 |
| | — |
| | — |
| | 0.15 |
| | — |
| | — |
| | 0.52 |
|
| Henderson | | 71 |
| | — |
| | — |
| | 0.17 |
| | — |
| | — |
| | 0.24 |
|
| Tyrone | | 55 |
| | 0.25 |
| | — |
| | — |
| | 0.3 |
| | — |
| | — |
|
| Miami | | — |
| | — |
| | — |
| | — |
| | 0.1 |
| | — |
| | — |
|
| | | | | | | | | | | | | | | |
| South America | | | | | | | | | | | | | | |
| Developed and producing: | | | | | | | | | | | | |
| Cerro Verde | | 4,324 |
| | 0.35 |
| | — |
| | 0.01 |
| | 29.6 |
| | — |
| | 0.72 |
|
| El Abra | | 705 |
| | 0.42 |
| | — |
| | — |
| | 3.9 |
| | — |
| | — |
|
| | | | | | | | | | | | | | | |
Indonesiae | | | | | | | | | | | | | | |
| Developed and producing: | | | | | | | | | | |
| Deep Mill Level Zone | | 432 |
| | 0.92 |
| | 0.76 |
| | — |
| | 7.6 |
| | 8.4 |
| | — |
|
| Deep Ore Zone | | 51 |
| | 0.50 |
| | 0.57 |
| | — |
| | 0.5 |
| | 0.8 |
| | — |
|
| Big Gossan | | 57 |
| | 2.30 |
| | 1.02 |
| | — |
| | 2.6 |
| | 1.3 |
| | — |
|
| Grasberg open pit | | 5 |
| | 1.26 |
| | 1.98 |
| | — |
| | 0.2 |
| | 0.4 |
| | — |
|
| | | | | | | | | | | | | | | |
| Under development: | | | | | | | | | | | | | | |
Grasberg Block Cave
| | 963 |
| | 0.96 |
| | 0.72 |
| | — |
| | 17.2 |
| | 14.1 |
| | — |
|
| | | | | | | | | | | | | | | |
| Undeveloped: | | | | | | | | | | | | | | |
| Kucing Liar | | 349 |
| | 1.24 |
| | 1.03 |
| | — |
| | 8.1 |
| | 5.2 |
| | — |
|
| Total 100% basis | | 18,828 |
| | | | | | | | 124.0 |
| | 30.8 |
| | 3.83 |
|
Consolidatedf | | | | | | | | | | 119.6 |
| | 30.8 |
| | 3.78 |
|
FCX’s equity shareg | | | | | | | | | | 86.8 |
| | 17.0 |
| | 3.44 |
|
| |
a. | Excludes material contained in stockpiles. |
| |
b. | Includes estimated recoverable metals contained in stockpiles. |
| |
c. | Amounts not shown because of rounding. |
| |
d. | The Lone Star oxide project is under development. |
| |
e. | Estimated recoverable proven and probable reserves from Indonesia reflect estimates of minerals that can be recovered through 2041. Refer to Note 13 for discussion of PT-FI’s IUPK. |
| |
f. | Consolidated reserves represent estimated metal quantities after reduction for joint venture partner interests at the Morenci mine in North America. Refer to Note 3 for further discussion. |
| |
g. | Net equity interest reserves represent estimated consolidated metal quantities further reduced for noncontrolling interest ownership. FCX's net equity interest for estimated metal quantities in Indonesia reflects an approximate 81 percent from 2019 through 2022 and 48.76 percent from 2023 through 2041. Refer to Note 3 for further discussion of FCX’s ownership in subsidiaries. |
NOTE 21. SUPPLEMENTARY OIL AND GAS INFORMATION (UNAUDITED)
Following the sales of substantially all of FCX’s oil and gas properties, including the sale of its Deepwater GOM, onshore California and Haynesville oil and gas properties in 2016, along with the sales of its property interests in the Madden area in central Wyoming and certain property interests in the GOM Shelf in 2017 and 2018, FCX’s oil and gas producing activities are not considered significant beginning in 2017. Refer to Note 213 for discussion of PT-FI’s IUPK.
c.Consolidated reserves represent estimated metal quantities after reduction for joint venture partner interests at the Morenci mine in North America (refer to Note 3 for further discussion.discussion). Excluded from the table above were FCX’s estimated recoverable proven and probable reserves of 362 million ounces of silver, which were determined using $15 per ounce.
Costs Incurred. A summary of the costs incurredd.Net equity interest reserves represent estimated consolidated metal quantities further reduced for FCX’s oil and gas acquisition, exploration and development activitiesnoncontrolling interest ownership (refer to Note 3 for the year ended December 31, 2016, follows:
|
| | | |
| Property acquisition costs for unproved properties | $ | 7 |
|
| Exploration costs | 22 |
|
| Development costs | 749 |
|
| | $ | 778 |
|
These amounts included increases in AROs of $37 million, capitalized general and administrative expenses of $78 million, and capitalized interest of $7 million.
Capitalized Costs. The aggregate capitalized costs subject to amortization for oil and gas properties and the aggregate related accumulated amortization as of December 31, 2016, follow:
|
| | | | |
| Properties subject to amortization | | $ | 27,507 |
|
Accumulated amortizationa | | (27,433 | ) |
| | | $ | 74 |
|
| |
a. | Includes charges of$4.3 billion in 2016 to reduce the carrying value of oil and gas properties pursuant to full cost accounting rules.
|
The average amortization rate per barrel of oil equivalents (BOE) was $17.58 in 2016.
Costs Not Subject to Amortization. Including amounts determined to be impaired, FCX transferred $4.9 billion of costs associated with unevaluated properties to the full cost pool in 2016. Sales of unevaluated properties totaled $1.6 billion in 2016. Following FCX’s disposition of its Deepwater GOM and onshore California oil and gas properties in fourth-quarter 2016, the carrying value of allfurther discussion of FCX’s remaining oilownership in subsidiaries). FCX's net equity interest for estimated metal quantities in Indonesia reflects approximately 81 percent from 2021 through 2022 and gas properties was included in48.76 percent from 2023 through 2041. Excluded from the amortization base at December 31, 2018,table above were FCX’s estimated recoverable proven and 2017.
Results of Operations for Oil and Gas Producing Activities. The results of operations from oil and gas producing activities for the year ended December 31, 2016, presented below, excludes non-oil and gas revenues, general and administrative expenses, interest expense and interest income. Income tax benefit was determined by applying the statutory rates to pre-tax operating results:
|
| | | |
| Revenues from oil and gas producing activities | $ | 1,513 |
|
Production and delivery costsa | (1,829 | ) |
| Depreciation, depletion and amortization | (839 | ) |
| Impairment of oil and gas properties | (4,317 | ) |
Income tax benefit (based on FCX’s U.S. federal statutory tax rate)b | — |
|
| Results of operations from oil and gas producing activities | $ | (5,472 | ) |
| |
a. | Includes $926 million in charges related to drillship settlements/idle rig and contract termination costs. |
| |
b. | FCX has provided a full valuation allowance on losses associated with oil and gas activities. |
Proved Oil and Natural Gas Reserve Information. The following information summarizes the net provedprobable reserves of oil (including condensate247 million ounces of silver.
| | | | | | | | | | | | | | | | | | | | | | | | | | | | | | | | | | | | | | | | | | | | | | | |
| | Estimated Recoverable Proven and Probable Mineral Reserves | |
| | at December 31, 2020 | |
| | | | Average Ore Grade Per Metric Tona | | Recoverable Proven and Probable Reservesb | |
| | Orea (million metric tons) | | Copper (%) | | Gold (grams) | | Molybdenum (%) | | Copper
(billion pounds) | | Gold
(million ounces) | | Molybdenum
(billion pounds) | |
| | | | | | | | | | | | | | | |
| | | | | | | | | | | | | | | |
| | | | | | | | | | | | | | | |
| | | | | | | | | | | | | | | |
| | | | | | | | | | | | | | | |
| North America | | | | | | | | | | | | | | | |
| Developed and producing: | | | | | | | | | | | | | |
| Morenci | | 4,300 | | | 0.23 | | | 0 | | | 0 | | c | 14.3 | | | 0 | | | 0.20 | | |
| Sierrita | | 3,240 | | | 0.22 | | | 0 | | c | 0.02 | | | 13.2 | | | 0.2 | | | 1.28 | | |
| Bagdad | | 2,591 | | | 0.31 | | | 0 | | c | 0.02 | | | 15.2 | | | 0.2 | | | 0.92 | | |
Safford, including
Lone Star | | 777 | | | 0.45 | | | 0 | | | 0 | | | 5.7 | | | 0 | | | 0 | | |
| Chino, including Cobre | | 313 | | | 0.44 | | | 0.03 | | | 0 | | | 2.5 | | | 0.2 | | | 0 | | |
| Climax | | 156 | | | 0 | | | 0 | | | 0.15 | | | 0 | | | 0 | | | 0.48 | | |
| Henderson | | 60 | | | 0 | | | 0 | | | 0.17 | | | 0 | | | 0 | | | 0.20 | | |
| | | | | | | | | | | | | | | |
| Tyrone | | 33 | | | 0.27 | | | 0 | | | 0 | | | 0.2 | | | 0 | | | 0 | | |
| Miami | | 0 | | | 0 | | | 0 | | | 0 | | | 0.1 | | | 0 | | | 0 | | |
| | | | | | | | | | | | | | | |
| | | | | | | | | | | | | | | |
| | | | | | | | | | | | | | | |
| South America | | | | | | | | | | | | | | | |
| Developed and producing: | | | | | | | | | | | | | |
| Cerro Verde | | 4,077 | | | 0.36 | | | 0 | | | 0.01 | | | 28.6 | | | 0 | | | 0.70 | | |
| El Abra | | 779 | | | 0.41 | | | 0 | | | 0 | | | 4.2 | | | 0 | | | 0 | | |
| | | | | | | | | | | | | | | |
Indonesiad | | | | | | | | | | | | | | | |
| Developed and producing: | | | | | | | | | | | |
| Grasberg Block Cave | | 874 | | | 1.08 | | | 0.73 | | | 0 | | | 17.5 | | | 13.1 | | | 0 | | |
| Deep Mill Level Zone | | 439 | | | 0.89 | | | 0.72 | | | 0 | | | 7.4 | | | 8.1 | | | 0 | | |
| Big Gossan | | 53 | | | 2.30 | | | 0.98 | | | 0 | | | 2.5 | | | 1.1 | | | 0 | | |
| Deep Ore Zone | | 8 | | | 0.55 | | | 0.47 | | | 0 | | | 0.1 | | | 0.1 | | | 0 | | |
| | | | | | | | | | | | | | | |
| Undeveloped: | | | | | | | | | | | | | | | |
| Kucing Liar | | 351 | | | 0.92 | | | 0.90 | | | 0 | | | 6.0 | | | 6.0 | | | 0 | | |
| Total 100% basis | | 18,052 | | e | | | | | | | 117.2 | | e | 28.9 | | e | 3.77 | | e |
Consolidatedf | | | | | | | | | | 113.2 | | | 28.9 | | | 3.71 | | |
FCX’s equity shareg | | | | | | | | | | 81.8 | | | 15.5 | | | 3.39 | | |
a.Excludes material contained in stockpiles.
b.Includes estimated recoverable metals contained in stockpiles.
c.Amounts not shown because of rounding.
d.Estimated recoverable proven and natural gas liquids (NGLs)),probable reserves from Indonesia reflect estimates of minerals that can be recovered through 2041. Refer to Note 13 for discussion of PT-FI’s IUPK.
e.Does not foot because of rounding.
f.Consolidated reserves represent estimated metal quantities after reduction for joint venture partner interests at the Morenci mine in North America. Refer to Note 3 for further discussion.
g.Net equity interest reserves represent estimated consolidated metal quantities further reduced for noncontrolling interest ownership. FCX's net equity interest for estimated metal quantities in Indonesia reflects an approximate 81 percent from 2021 through 2022 and natural gas and the standardized measure as described below48.76 percent from 2023 through 2041. Refer to Note 3 for the year ended December 31, 2016. Allfurther discussion of FCX’s oil and natural gas reserves are locatedownership in the U.S.subsidiaries.
Management believes the reserve estimates presented herein are reasonable and prepared in accordance with guidelines established by the SEC as prescribed in Regulation S-X, Rule 4-10. However, there are numerous uncertainties inherent in estimating quantities and values of proved reserves and in projecting future rates of production and the amount and timing of development expenditures, including many factors beyond FCX’s control. Reserve engineering is a subjective process of estimating the recovery from underground accumulations of oil and natural gas that cannot be measured in an exact manner, and the accuracy of any reserve estimate is a function of the quality of available data and of engineering and geological interpretation and judgment. Because all oil and natural gas reserve estimates are to some degree subjective, the quantities of oil and natural gas that are ultimately recovered, production and operating costs, the amount and timing of future development expenditures, and future crude oil and natural gas sales prices may all differ from those assumed in these estimates. In addition, different reserve engineers may make different estimates of reserve quantities and cash flows based upon the same available data. Therefore, the standardized measure of discounted future net cash flows (Standardized Measure) shown below represents estimates only and should not be construed as the current market value of the estimated reserves attributable to FCX’s oil and gas properties. In this regard, the information set forth in the following tables includes revisions of reserve estimates attributable to proved properties acquired in the 2013 oil and gas acquisitions, and reflects additional information from subsequent development activities, production history of the properties involved and any adjustments in the projected economic life of such properties resulting from changes in product prices.170
Estimated Quantities of Oil and Natural Gas Reserves. The following table sets forth certain data pertaining to proved, proved developed and proved undeveloped reserves, all of which are in the U.S., for the year ended December 31, 2016. |
| | | | | | | | | |
| | | Oil | | Gas | | Total |
| | | (MMBbls)a,b | | (Bcf)a | | (MMBOE)a |
| 2016 | | | | | | |
| Proved reserves: | | | | | | |
| Balance at beginning of year | | 207 |
| | 274 |
| | 252 |
|
| Extensions and discoveries | | — |
| | — |
| | — |
|
| Acquisitions of reserves in-place | | — |
| | — |
| | — |
|
| Revisions of previous estimates | | 1 |
| | — |
| | 1 |
|
| Sale of reserves in-place | | (168 | ) | | (118 | ) | | (187 | ) |
| Production | | (36 | ) | | (69 | ) | | (48 | ) |
Balance at end of year
| | 4 |
| | 87 |
| | 18 |
|
| | | | | | | |
| Proved developed reserves at December 31, 2016 | | 4 |
| | 87 |
| | 18 |
|
| | | | | | | |
| Proved undeveloped reserves at December 31, 2016 | | — |
| | — |
| | — |
|
| |
a. | MMBbls = million barrels; Bcf = billion cubic feet; MMBOE = million BOE |
| |
b. | Includes NGL proved reserves of 1 MMBbls (all developed) at December 31, 2016. |
For the year ended December 31, 2016, FCX sold reserves in-place totaling 187 MMBOE, primarily representing all of its Deepwater GOM, onshore California and Haynesville properties.
Standardized Measure. The Standardized Measure (discounted at 10 percent) from production of proved oil and natural gas reserves has been developed in accordance with SEC guidelines. FCX estimated the quantity of proved oil and natural gas reserves and the future periods in which they were expected to be produced based on year-end economic conditions. Estimates of future net revenues from FCX’s proved oil and gas properties and the present value thereof were made using the twelve-month average of the first-day-of-the-month historical reference prices as adjusted for location and quality differentials, which were held constant throughout the life of the oil and gas properties, except where such guidelines permit alternate treatment, including the use of fixed and determinable contractual price escalations (excluding the impact of crude oil derivative contracts). Future gross revenues were reduced by estimated future operating costs (including production and ad valorem taxes) and future development and abandonment costs, all of which were based on current costs in effect at December 31, 2016, and held constant throughout the life of the oil and gas properties. Future income taxes were calculated by applying the statutory federal and state income tax rate to pre-tax future net cash flows, net of the tax basis of the respective oil and gas properties and utilization of FCX’s available tax carryforwards related to its oil and gas operations.
The Standardized Measure related to proved oil and natural gas reserves as of December 31, 2016, follows:
|
| | | |
| Future cash inflows | $ | 345 |
|
| Future production expense | (175 | ) |
Future development costsa | (439 | ) |
| Future income tax expense | — |
|
| Future net cash flows | (269 | ) |
| Discounted at 10% per year | 32 |
|
| Standardized Measure | $ | (237 | ) |
| |
a. | Includes estimated asset retirement costs of$0.4 billion at December 31, 2016.
|
A summary of the principal sources of changes in the Standardized Measure for the year ended December 31, 2016, follows:
|
| | | | |
| Balance at beginning of year | | $ | 1,392 |
|
| Changes during the year: | | |
| Sales, net of production expenses | | (831 | ) |
| Net changes in sales and transfer prices, net of production expenses | | (341 | ) |
| Extensions, discoveries and improved recoveries | | — |
|
| Changes in estimated future development costs, including timing and other | | 146 |
|
| Previously estimated development costs incurred during the year | | 295 |
|
| Sales of reserves in-place | | (1,049 | ) |
| Revisions of quantity estimates | | 12 |
|
| Accretion of discount | | 139 |
|
| Net change in income taxes | | — |
|
| Total changes | | (1,629 | ) |
| Balance at end of year | | $ | (237 | ) |
Item 9. Changes in and Disagreements with Accountants on Accounting and Financial Disclosure.
Not applicable.
Item 9A. Controls and Procedures.
(a) Evaluation of disclosure controls and procedures. Our chief executive officer and chief financial officer, with the participation of management, have evaluated the effectiveness of our “disclosure controls and procedures” (as defined in Rules 13a-15(e) and 15d-15(e) under the Securities Exchange Act of 1934) as of the end of the period covered by this annual report on Form 10-K. Based on their evaluation, they have concluded that our disclosure controls and procedures are effective as of the end of the period covered by this report.
(b) Changes in internal controls over financial reporting. There has been no change in our internal control over financial reporting that occurred during the quarter ended December 31, 2018,2020, that has materially affected, or is reasonably likely to materially affect, our internal control over financial reporting.
(c) Management’s annual report on internal control over financial reporting and the report thereon of Ernst & Young LLP are included herein under Item 8. “Financial Statements and SupplementalSupplementary Data.”
Item 9B. Other Information.
Not applicable.
PART III
Item 10. Directors, Executive Officers and Corporate Governance.
The information set forth under the captions “Information About Director Nominees”Nominees,” “Board Committees,” and “Section 16(a) Beneficial Ownership Reporting Compliance”“Board and Committee Independence; Audit Committee Financial Experts,” and “Corporate Governance Guidelines; Principles of Business Conduct,” of our definitive proxy statement to be filed with the United States Securities and Exchange Commission (SEC), relating to our 20192021 annual meeting of stockholders, is incorporated herein by reference. The information required by Item 10 regarding our executive officers appears in a separately captioned heading after Item 4. “Executive Officers of the Registrant”“Information About our Executive Officers” in Part I of this report.
Item 11. Executive Compensation.
The information set forth under the captions “Director Compensation” and “Executive Officer Compensation” of our definitive proxy statement to be filed with the SEC, relating to our 20192021 annual meeting of stockholders, is incorporated herein by reference.
Item 12. Security Ownership of Certain Beneficial Owners and Management and Related Stockholder Matters.
The information set forth under the captions “Stock Ownership of Directors and Executive Officers” and “Stock Ownership of Certain Beneficial Owners” of our definitive proxy statement to be filed with the SEC, relating to our 20192021 annual meeting of stockholders, is incorporated herein by reference.
Equity Compensation Plan Information
Only our 2016 Stock Incentive Plan (2016 plan), which was previously approved by our stockholders, has shares of our common stock available for future grant. However, we have equity compensation plans pursuant to which awards have previously been made that could result in issuance of our common stock to employees and non-employees as compensation, including plans that were assumed in connection with the acquisitioncompensation.
The following table presents information regarding our equity compensation plans as of December 31, 2018.2020:
| | | | | | | | | | | | | | |
| Number of Securities To be Issued Upon Exercise of Outstanding Options, Warrants and Rights | | Weighted-Average Exercise Price of Outstanding Options, Warrants and Rights | Number of Securities Remaining Available for Future Issuance Under Equity Compensation Plans (Excluding Securities Reflected in Column (a)) |
| (a) | | (b) | (c) |
| Equity compensation plans approved by security holders | 43,972,786 | | a | $ | 25.54 | | 39,721,487 | |
| Equity compensation plans not approved by security holders | 1,496,070 | | b | $ | 28.08 | | — | |
| Total | 45,468,856 | | | 25.65 | | 39,721,487 | |
|
| | | | | | | | |
| | Number of Securities To be Issued Upon Exercise of Outstanding Options, Warrants and Rights | | Weighted-Average Exercise Price of Outstanding Options, Warrants and Rights | Number of Securities Remaining Available for Future Issuance Under Equity Compensation Plans (Excluding Securities Reflected in Column (a)) |
| | (a) | | (b) | (c) |
| Equity compensation plans approved by security holders | 51,833,605 |
| a | $ | 27.45 |
| 58,584,822 |
|
| Equity compensation plans not approved by security holders | 3,233,353 |
| b | 26.70 |
| — |
|
Total
| 55,066,958 |
| | 27.40 |
| 58,584,822 |
|
| |
a. | Includes shares of our common stock issuable upon the vesting of 1,907,819 RSUs and 5,149,375 performance share units (PSUs) at maximum performance levels, and the termination of deferrals with respect to 1,189,900 RSUs that were vested as of December 31, 2018. These awards are not reflected in column (b) because they do not have an exercise price. The number of securities to be issued in column (a) does not include RSUs granted under our phantom stock plan, which are payable solely in cash. |
| |
b. | Represents securities to be issued under awards assumed in our acquisitions of McMoRan Exploration Co. Includes shares issuable upon the vesting of 13,500 RSUs that were assumed in prior acquisitions. These awards are not reflected in column (b) because they do not have an exercise price. |
a.Includes shares of our common stock issuable upon the vesting of 2,931,983 restricted stock units (RSUs) and 4,417,830 performance share units (PSUs) at maximum performance levels, and the termination of deferrals with respect to 1,197,900 RSUs that were vested as of December 31, 2020. These awards are not reflected in column (b) because they do not have an exercise price. The number of securities to be issued in column (a) does not include RSUs granted under our phantom stock plan, which are payable solely in cash.
b.Represents securities to be issued under awards assumed in our acquisition of McMoRan Exploration Co. Includes shares issuable upon the vesting of 13,500 RSUs that were assumed in prior acquisitions. These awards are not reflected in column (b) because they do not have an exercise price.
Item 13. Certain Relationships and Related Transactions, and Director Independence.
The information set forth under the captions “Certain Transactions” and “Board and Committee Independence”Independence; Audit Committee Financial Experts” of our definitive proxy statement to be filed with the SEC, relating to our 20192021 annual meeting of stockholders, is incorporated herein by reference.
Item 14. Principal Accounting Fees and Services.
The information set forth under the caption “Independent Registered Public Accounting Firm” of our definitive proxy statement to be filed with the SEC, relating to our 20192021 annual meeting of stockholders, is incorporated herein by reference.
PART IV
Item 15. Exhibits, Financial Statement Schedules.
(a)(1). Financial Statements.
The consolidated statements of operations, comprehensive income (loss), cash flows and equity, and the consolidated balance sheets are included as part of Item 8. “Financial Statements and Supplementary Data.”
(a)(2). Financial Statement Schedules.
The following financial statement schedule is presented below.
Schedule II – Valuation and Qualifying Accounts
Schedules other than the one above have been omitted since they are either not required, not applicable or the required information is included in the financial statements or notes thereto.
REPORT OF INDEPENDENT REGISTERED PUBLIC ACCOUNTING FIRM
TO THE BOARD OF DIRECTORS AND STOCKHOLDERS OFTo the Board of Directors and Stockholders of
FREEPORT-MCMORAN INC.Freeport-McMoRan Inc.
Opinion on the Financial Statement Schedule
We have audited the consolidated financial statements of Freeport-McMoRan Inc. (the Company) as of December 31, 20182020 and 2017, and2019, for each of the three years in the period ended December 31, 2018,2020, and have issued our report thereon dated February 15, 2019 (included16, 2021 included elsewhere in this Form 10-K).10-K. Our audits alsoof the consolidated financial statements included the financial statement schedule listed in Item 15 (a)(2) as of December 31, 2018, 2017 and 2016, and for each of the three years in the period ended December 31, 2018, of this Form 10-K. In our opinion, the financial statement schedule, when considered in relation to the basic financial statements taken as a whole, presents fairly, in all material respects the information set forth therein.
Basis for Opinion
10-K (the “schedule”). This schedule is the responsibility of the Company’s management. Our responsibility is to express an opinion on the
Company’s schedule based on our audits. We believe that
In our audits provide a reasonable basis for our opinion.opinion, the schedule presents fairly, in all material respects, the information set forth therein when considered in conjunction with the consolidated financial statements.
/s/ Ernst & Young LLP
Phoenix, Arizona
February 15, 201916, 2021
SCHEDULE II - VALUATION AND QUALIFYING ACCOUNTS (In millions)
| | | | | | | | | | | | | | | | | | | | | | | | | | | | | | | | |
| | | | | Additions (Deductions) | | | | |
| | | Balance at | | Charged to | | Charged to | | Other | | Balance at |
| | | Beginning of | | Costs and | | Other | | Additions | | End of |
| | | Year | | Expense | | Accounts | | (Deductions) | | Year |
| Reserves and allowances deducted | | | | | | | | | | |
| from asset accounts: | | | | | | | | | | |
| | | | | | | | | | |
| | | | | | | | | | |
| | | | | | | | | | |
| | | | | | | | | | |
| Valuation allowance for deferred tax assets | | | | | | | | | | |
| Year Ended December 31, 2020 | | $ | 4,576 | | | $ | 200 | | a | $ | (16) | | b | $ | (28) | | c | $ | 4,732 | |
| Year Ended December 31, 2019 | | 4,507 | | | 50 | | d | 19 | | b | 0 | | | 4,576 | |
| Year Ended December 31, 2018 | | 4,575 | | | (345) | | e | 8 | | b | 269 | | f | 4,507 | |
| | | | | | | | | | |
| Reserves for non-income taxes: | | | | | | | | | | |
| Year Ended December 31, 2020 | | $ | 58 | | | $ | 21 | | | $ | (1) | | | $ | 4 | | g | $ | 82 | |
| Year Ended December 31, 2019 | | 62 | | | 0 | | | 0 | | | (4) | | g | 58 | |
| Year Ended December 31, 2018 | | 58 | | | 7 | | | (1) | | | (2) | | g | 62 | |
a.Primarily relates to a $250 million increase in United States (U.S.) federal net operating loss (NOL) carryforwards, partly offset by a $75 million decrease in U.S foreign tax credits associated with expirations, and an $11 million decrease in U.S. deferred tax assets for which no benefit is expected to be realized.
b.Relates to a valuation allowance for tax benefits primarily associated with actuarial losses for U.S. defined benefit plans included in other comprehensive income (loss).
c.Relates to sale of interest in Kisanfu.
d.Primarily relates to a $208 million increase in U.S. federal deferred tax assets for which no benefit is expected to be realized, partly offset by a $98 million decrease in U.S. foreign tax credits associated with expirations and prior year adjustments, and a $44 million decrease in U.S. federal and state NOL carryforwards.
e.Primarily relates to a $315 million decrease in U.S. foreign tax credits associated with expirations and 2017 U.S. tax reform adjustments, and a decrease of $45 million in U.S. federal NOLs associated with 2018 usage and 2017 U.S. tax reform.
f.Primarily relates to a $244 million increase in foreign NOLs for which no benefit is expected to be realized resulting from PT Freeport Indonesia’s acquisition of PT Rio Tinto Indonesia.
g.Represents amounts paid or adjustments to reserves based on revised estimates.
|
| | | | | | | | | | | | | | | | | | | | |
| | | | | Additions (Deductions) | | | | |
| | | Balance at | | Charged to | | Charged to | | Other | | Balance at |
| | | Beginning of | | Costs and | | Other | | Additions | | End of |
| | | Year | | Expense | | Accounts | | (Deductions) | | Year |
| Reserves and allowances deducted | | | | | | | | | | |
| from asset accounts: | | | | | | | | | | |
| Valuation allowance for deferred tax assets | | | | | | | | | | |
| Year Ended December 31, 2018 | | $ | 4,575 |
| | $ | (345 | ) | a | $ | 8 |
| b | $ | 269 |
| c | $ | 4,507 |
|
| Year Ended December 31, 2017 | | 6,058 |
| | (1,484 | ) | d | 1 |
| b | — |
| | 4,575 |
|
| Year Ended December 31, 2016 | | 4,183 |
| | 1,852 |
| | 23 |
| b | — |
| | 6,058 |
|
| | | | | | | | | | | |
| Reserves for non-income taxes: | | | | | | | | | | |
| Year Ended December 31, 2018 | | $ | 58 |
| | $ | 7 |
| | $ | (1 | ) | | $ | (2 | ) | e | $ | 62 |
|
| Year Ended December 31, 2017 | | 64 |
| | (2 | ) | | — |
| | (4 | ) | e | 58 |
|
| Year Ended December 31, 2016 | | 83 |
| | 13 |
| | (3 | ) | | (29 | ) | e | 64 |
|
| | | | | | | | | | | | | | | | | |
a. | Primarily relates to a $315 million decrease in U.S. foreign tax credits associated with expirations and 2017 tax reform adjustments, and a decrease of $45 million in U.S. federal net operating losses associated with 2018 usage and 2017 tax reform. |
| |
b. | Relates to a valuation allowance for tax benefits primarily associated with actuarial losses for U.S. defined benefit plans included in other comprehensive income (loss). |
| Filed | | | |
c.Exhibit | Primarily relates to a $244 million increase in foreign net operating losses for which no benefit is expected to be realized resulting from PT-FI’s acquisition of PT Rio Tinto Indonesia. |
| with this | Incorporated by Reference |
d.Number | Relates to a $1.1 billion decrease associated with a reduction in the corporate income tax rate applicable to U.S. federal deferred tax assets and $371 million for the reversal of valuation allowances on U.S. federal alternative minimum tax credits. |
| Exhibit Title | |
e.Form 10-K | Represents amounts paid or adjustments to reserves based on revised estimates.Form |
(a)(3). Exhibits.
| File No. | Date Filed |
| | | | | |
| | Filed | | | |
Exhibit | | with this | Incorporated by Reference |
Number | Exhibit Title | Form 10-K | Form | File No. | Date Filed |
| Agreement and Plan of Merger dated as of November 18, 2006, by and among FCX, Phelps Dodge Corporation and Panther Acquisition Corporation. | | 8-K | 333-139252001-11307-01 | 11/20/2006 |
| | | | | |
| | | | | |
| Agreement and Plan of Merger by and among Plains Exploration & Production Company, FCX and IMONC LLC, dated as of December 5, 2012. | | 8-K | 001-11307-01 | 12/6/2012 |
| Agreement and Plan of Merger by and among McMoRan Exploration Co., FCX and INAVN Corp., dated as of December 5, 2012. | | 8-K | 001-11307-01 | 12/6/2012 |
| Stock Purchase Agreement, dated as of October 6, 2014, among LMC Candelaria SpA, LMC Ojos del Salado SpA and Freeport Minerals Corporation. | | 10-Q | 001-11307-01 | 11/7/2014 |
| Purchase Agreement dated February 15, 2016, between Sumitomo Metal Mining America Inc., Sumitomo Metal Mining Co., Ltd., Freeport-McMoRan Morenci Inc., Freeport Minerals Corporation, and FCX. | | 8-K | 001-11307-01 | 2/16/2016 |
| Stock Purchase Agreement dated May 9, 2016, among CMOC Limited, China Molybdenum Co., Ltd., Phelps Dodge Katanga Corporation and FCX. | | 8-K | 001-11307-01 | 2/5/9/2016 |
| Purchase and Sale Agreement dated September 12, 2016, between Freeport-McMoRan Oil & Gas LLC, Freeport-McMoRan Exploration & Production LLC, Plains Offshore Operations Inc. and Anadarko US Offshore LLC. | | 10-Q | 001-11307-01 | 11/9/2016 |
| PT-FI Divestment Agreement dated as of September 27, 2018 among FCX, International Support LLC, PT Freeport Indonesia, PT Indocopper Investama (subsequently renamed PT Indonesia Papua Metal Dan Mineral) and PT Indonesia Asahan Aluminium (Persero). | | 10-Q | 001-11307-01 | 11/9/2018 |
| Supplemental and Amendment Agreement to the PT-FI Divestment Agreement, dated December 21, 2018, among FCX, PT Freeport Indonesia, PT Indonesia Papua Metal Dan Mineral (f/k/a PT Indocopper Investama), PT Indonesia Asahan Aluminium (Persero) and International Support LLC. | X | 10-K | 001-11307-01 | 2/15/2019 |
| Amended and Restated Certificate of Incorporation of FCX, effective as of June 8, 2016. | | 8-K | 001-11307-01 | 6/9/2016 |
| Amended and Restated By-Laws of FCX, effective as of June 8, 2016.3, 2020. | | 8-K | 001-11307-01 | 6/9/20163/2020 |
| Description of Common Stock of Freeport-McMoRan Inc. | X | | | |
| Indenture dated as of February 13, 2012, between FCX and U.S. Bank National Association, as Trustee (relating to the 3.55% Senior Notes due 2022, the 4.00% Senior Notes due 2021, the 4.55% Senior Notes due 2024, and the 5.40% Senior Notes due 2034). | | 8-K | 001-11307-01 | 2/13/2012 |
| Third Supplemental Indenture dated as of February 13, 2012, between FCX and U.S. Bank National Association, as Trustee (relating to the 3.55% Senior Notes due 2022). | | 8-K | 001-11307-01 | 2/13/2012 |
| Fourth Supplemental Indenture dated as of May 31, 2013, among FCX, Freeport-McMoRan Oil & Gas LLC and U.S. Bank National Association, as Trustee (relating to the 3.55% Senior Notes due 2022, the 4.00% Senior Notes due 2021, the 4.55% Senior Notes due 2024, and the 5.40% Senior Notes due 2034). | | 8-K | 001-11307-01 | 6/3/2013 |
| | | | | | | | | | | | | | | | | |
| | Filed | | | |
| Exhibit | | with this | Incorporated by Reference |
| Number | Exhibit Title | Form 10-K | Form | File No. | Date Filed |
| | | | | |
|
|
| | | | | |
| | Filed | | | |
Exhibit | | with this | Incorporated by Reference |
Number | Exhibit Title | Form 10-K | Form | File No. | Date Filed |
| Sixth Supplemental Indenture dated as of November 14, 2014 among FCX, Freeport-McMoRan Oil & Gas LLC and U.S. Bank National Association, as Trustee (relating to the 4.00% Senior Notes due 2021).
| | 8-K | 001-11307-01 | 11/14/2014 |
| Seventh Supplemental Indenture dated as of November 14, 2014 among FCX, Freeport-McMoRan Oil & Gas LLC and U.S. Bank National Association, as Trustee (relating to the 4.55% Senior Notes due 2024). | | 8-K | 001-11307-01 | 11/14/2014 |
| Eighth Supplemental Indenture dated as of November 14, 2014 among FCX, Freeport-McMoRan Oil & Gas LLC and U.S. Bank National Association, as Trustee (relating to the 5.40% Senior Notes due 2034). | | 8-K | 001-11307-01 | 11/14/2014 |
| Indenture dated as of March 7, 2013, between FCX and U.S. Bank National Association, as Trustee (relating to the 3.100% Senior Notes due 2020, the 3.875% Senior Notes due 2023, and the 5.450% Senior Notes due 2043). | | 8-K | 001-11307-01 | 3/7/2013 |
| | | | | |
| | | | | |
| | | | | |
| | | | | |
|
|
| | | | | |
| | | | | |
| | | | | |
| Supplemental Indenture dated as of May 31, 2013, among FCX, Freeport-McMoRan Oil & Gas LLC, as guarantor, and U.S. Bank National Association, as Trustee (relating to the 3.100% Senior Notes due 2020, the 3.875% Senior Notes due 2023, and the 5.450% Senior Notes due 2043).
| | 8-K | 001-11307-01 | 6/3/2013 |
| Form of Indenture dated as of September 22, 1997, between Phelps Dodge Corporation and The Chase Manhattan Bank, as Trustee (relating to the 7.125% Senior Notes due 2027, the 9.50% Senior Notes due 2031, and the 6.125% Senior Notes due 2034). | | S-3 | 333-36415 | 9/25/1997 |
| Form of 7.125% Debenture due November 1, 2027 of Phelps Dodge Corporation issued on November 5, 1997, pursuant to the Indenture dated as of September 22, 1997, between Phelps Dodge Corporation and The Chase Manhattan Bank, as Trustee (relating to the 7.125% Senior Notes due 2027). | | 8-K | 001-00082 | 11/3/1997 |
| Form of 9.5% Note due June 1, 2031 of Phelps Dodge Corporation issued on May 30, 2001, pursuant to the Indenture dated as of September 22, 1997, between Phelps Dodge Corporation and First Union National Bank, as successor Trustee (relating to the 9.50% Senior Notes due 2031). | | 8-K | 001-00082 | 5/30/2001 |
| | | | | |
| | | |
| | | | | |
| | | | | |
| Form of 6.125% Note due March 15, 2034 of Phelps Dodge Corporation issued on March 4, 2004, pursuant to the Indenture dated as of September 22, 1997, between Phelps Dodge Corporation and First Union National Bank, as successor Trustee (relating to the 6.125% Senior Notes due 2034). | | 10-K | 001-00082 | 3/7/2005 |
| Supplemental Indenture dated as of April 4, 2007 to the Indenture dated as of September 22, 1997, among Phelps Dodge Corporation, as Issuer, Freeport-McMoRan Copper & Gold Inc., as Parent Guarantor, and U.S. Bank National Association, as Trustee (relating to the 7.125% Senior Notes due 2027, the 9.50% Senior Notes due 2031, and the 6.125% Senior Notes due 2034). | | 10-K | 001-11307-01 | 2/26/2016 |
| | | | | |
|
|
| | | | | |
| | | | | |
| | | | | |
| Form of Certificate representing shares of common stock, par value $0.10. | | 8-A/A | 001-11307-01 | 8/10/2015 |
| Indenture dated as of December 13, 2016 amongAugust 15, 2019, between FCX Freeport McMoRan Oil & Gas LLC, as guarantor, and U.S. Bank National Association, as Trustee (relating to the 6.875%5.00% Senior Notes due 2023)2027, the 5.25% Senior Notes due 2029, the 4.125% Senior Notes due 2028, the 4.25% Senior Notes due 2030, the 4.375% Senior Notes due 2028, and the 4.625% Senior Notes due 2030). | | 8-K | 001-11307-01 | 12/13/20168/15/2019 |
| Registration Rights AgreementFirst Supplemental Indenture dated as of December 13, 2016August 15, 2019, among FCX, Freeport-McMoRan Oil & Gas LLC, as Guarantor, and J.P. Morgan Securities LLC and Merrill Lynch, Pierce, Fenner & Smith Incorporated,U.S. Bank National Association, as Dealer Managers, relating toTrustee (including the 6.875%form of 5.00% Senior Notes due 2023.2027). | | 8-K | 001-11307-01 | 12/13/20168/15/2019 |
| FormSecond Supplemental Indenture dated as of Certificate representing sharesAugust 15, 2019, among FCX, Freeport-McMoRan Oil & Gas LLC, as Guarantor, and U.S. Bank National Association, as Trustee (including the form of common stock, par value $0.10.5.25% Senior Notes due 2029). | | 8-A/A8-K | 001-11307-01 | 8/10/201515/2019 |
| | | | | | | | | | | | | | | | | |
| | Filed | | | |
| Exhibit | | with this | Incorporated by Reference |
| Number | Exhibit Title | Form 10-K | Form | File No. | Date Filed |
| Third Supplemental Indenture dated as of March 4, 2020, among FCX, Freeport-McMoRan Oil & Gas LLC, as Guarantor, and U.S. Bank National Association, as Trustee (including the form of 4.125% Senior Notes due 2028). | | 8-K | 001-11307-01 | 3/4/2020 |
| Fourth Supplemental Indenture dated as of March 4, 2020, among FCX, Freeport-McMoRan Oil & Gas LLC, as Guarantor, and U.S. Bank National Association, as Trustee (including the form of 4.25% Senior Notes due 2030). | | 8-K | 001-11307-01 | 3/4/2020 |
| Fifth Supplemental Indenture dated as of March 31, 2020, among FCX, Freeport-McMoRan Oil & Gas LLC, as Guarantor, and U.S. Bank National Association, as Trustee (relating to the 4.125% Senior Notes due 2028 and the 4.25% Senior Notes due 2030). | | 10-Q | 001-11307-01 | 8/7/2020 |
| Sixth Supplemental Indenture dated as of July 27, 2020, among FCX, Freeport-McMoRan Oil & Gas LLC, as Guarantor, and U.S. Bank National Association, as Trustee (including the form of 4.375% Senior Notes due 2028). | | 8-K | 001-11307-01 | 7/27/2020 |
| Seventh Supplemental Indenture dated as of July 27, 2020, among FCX, Freeport-McMoRan Oil & Gas LLC, as Guarantor, and U.S. Bank National Association, as Trustee (including the form of 4.625% Senior Notes due 2030). | | 8-K | 001-11307-01 | 7/27/2020 |
| | | | | |
| | | | | |
| | Filed | | | |
Exhibit | | with this | Incorporated by Reference | | |
Number | Exhibit Title | Form 10-K | Form | File No. | Date Filed |
| | | | | |
| | | | | |
| | | | | |
| | | | | |
| | | | | |
| | | | | |
| | | | | |
| | | | | |
| Concentrate Purchase and Sales Agreement dated effective December 11, 1996, between PT Freeport Indonesia and PT Smelting. | | S-3 | 333-72760 | 11/5/2001 |
| Amendment No. 1, dated as of March 19, 1998, Amendment No. 2 dated as of December 1, 2000, Amendment No. 3 dated as of January 1, 2003, Amendment No. 4 dated as of May 10, 2004, Amendment No. 5 dated as of March 19, 2009, Amendment No. 6 dated as of January 1, 2011, and Amendment No. 7 dated as of October 29, 2012, to the Concentrate Purchase and Sales Agreement dated effective December 11, 1996, between PT Freeport Indonesia and PT Smelting. | | 10-K | 001-11307-01 | 2/27/2015 |
| | | | | |
| | | | | |
| Amendment No. 8 dated as of April 16, 2014 to the Concentrate Purchase and Sales Agreement dated December 11,1996 between PT Freeport Indonesia and PT Smelting. | | 10-K | 001-11307-01 | 2/20/2018 |
| Amendment No. 9 dated as of April 10, 2017 to the Concentrate Purchase and Sales Agreement dated December 11,1996 between PT Freeport Indonesia and PT Smelting. | | 10-K | 001-11307-01 | 2/20/2018 |
| Shareholders Agreement dated as of December 21, 2018, among FCX, PT Freeport Indonesia, PT Indonesia Papua Metal Dan Mineral and PT Indonesia Asahan Aluminium (Persero). | X | 10-K | 001-11307-01 | 2/15/2019 |
| PT Freeport Indonesia Special Mining License (IUPK) from the Minister of Energy and Mineral Resources of the Republic of Indonesia (English translation). | X | 10-K | 001-11307-01 | 2/15/2019 |
| Nomination and Standstill Agreement dated October 7, 2015, by and between FCX, Carl C. Icahn, High River Limited Partnership, Hopper Investments LLC, Barberry Corp., Icahn Partners Master Fund LP, Icahn Offshore LP, Icahn Partners LP, Icahn Onshore LP, Icahn Capital LP, IPH GP LLC, Icahn Enterprises Holdings L.P., Icahn Enterprises G.P. Inc., Beckton Corp., Andrew Langham and Courtney Mather. | | 8-K | 001-11307-01 | 10/7/2015 |
| Confidentiality Agreement dated October 7, 2015, by and between FCX, Carl C. Icahn, High River Limited Partnership, Hopper Investments LLC, Barberry Corp., Icahn Partners Master Fund LP, Icahn Offshore LP, Icahn Partners LP, Icahn Onshore LP, Icahn Capital LP, IPH GP LLC, Icahn Enterprises Holdings L.P., Icahn Enterprises G.P. Inc., Beckton Corp., Andrew Langham and Courtney Mather. | | 8-K | 001-11307-01 | 10/7/2015 |
| Third Amended and Restated Joint Venture and Shareholders Agreement dated as of December 11, 2003 among PT Freeport Indonesia, Mitsubishi Corporation, Nippon Mining & Metals Company, Limited and PT Smelting, as amended by the First Amendment dated as of September 30, 2005, and the Second Amendment dated as of April 30, 2008. | | 10-K | 001-11307-01 | 2/27/2015 |
| | | | | |
| | | | | |
| | | | | |
| | | | | | | | | | | | | | | | | |
| | Filed | | | |
| Exhibit | | with this | Incorporated by Reference |
| Number | Exhibit Title | Form 10-K | Form | File No. | Date Filed |
| Participation Agreement, dated as of March 16, 2005, among Phelps Dodge Corporation, Cyprus Amax Minerals Company, a Delaware corporation, Cyprus Metals Company, a Delaware corporation, Cyprus Climax Metals Company, a Delaware corporation, Sumitomo Corporation, a Japanese corporation, Summit Global Management, B.V., a Dutch corporation, Sumitomo Metal Mining Co., Ltd., a Japanese corporation, Compañia de Minas Buenaventura S.A.A., a Peruvian sociedad anonima abierta, and Sociedad Minera Cerro Verde S.A.A., a Peruvian sociedad anonima abierta. | | 8-K | 001-00082 | 3/22/2005 |
|
| | 8-K | 001-00082 | | |
| | Filed | | | |
Exhibit | | with this | Incorporated by Reference |
Number | Exhibit Title | Form 10-K | Form | File No. | Date Filed3/22/2005 |
| Shareholders Agreement, dated as of June 1, 2005, among Phelps Dodge Corporation, Cyprus Climax Metals Company, a Delaware corporation, Sumitomo Corporation, a Japanese corporation, Sumitomo Metal Mining Co., Ltd., a Japanese corporation, Summit Global Management B.V., a Dutch corporation, SMM Cerro Verde Netherlands, B.V., a Dutch corporation, Compañia de Minas Buenaventura S.A.A., a Peruvian sociedad anonima abierta, and Sociedad Minera Cerro Verde S.A.A., a Peruvian sociedad anonima abierta. | | 8-K | 001-00082 | 6/7/2005 |
| Revolving Credit Agreement dated as of April 20, 2018, among FCX, PT Freeport Indonesia, Freeport-McMoRan Oil & Gas LLC, JPMorgan Chase Bank, N.A., as administrative agent, Bank of America, N.A., as syndication agent, and each of the lenders and issuing banks party thereto. | | 8-K | 001-11307-0 | 4/23/2018 |
| First Amendment dated as of May 2, 2019 to the Revolving Credit Agreement dated as of April 20, 2018, among Freeport-McMoRan Inc., PT Freeport Indonesia, Freeport-McMoRan Oil & Gas LLC, JPMorgan Chase Bank, N.A., as administrative agent, Bank of America, N.A., as syndication agent, and each of the lenders and issuing banks party thereto.
| | 8-K | 001-11307-01 | 5/2/2019 |
| Second Amendment dated as of November 25, 2019 to the Revolving Credit Agreement dated as of April 20, 2018, as amended by that certain First Amendment dated as of May 2, 2019, among Freeport-McMoRan Inc., PT Freeport Indonesia, Freeport-McMoRan Oil & Gas LLC, JPMorgan Chase Bank, N.A., as administrative agent, Bank of America, N.A., as syndication agent, and each of the lenders and issuing banks party thereto. | | 8-K | 001-11307-01 | 11/25/2019 |
| Third Amendment dated as of June 3, 2020 to the Revolving Credit Agreement dated as of April 20, 2018, as amended, among FCX, PT Freeport Indonesia, Freeport-McMoRan Oil & Gas LLC, JPMorgan Chase Bank, N.A., as administrative agent, and each of the lenders and issuing banks party thereto. | | 8-K | 001-11307-01 | 6/3/2020 |
| Letter Agreement dated as of December 19, 2013, by and between FCX and Richard C. Adkerson. | | 8-K | 001-11307-01 | 12/23/2013 |
| FCX Director Compensation. | X | 10-K | 001-11307-01 | 2/26/2016 |
|
|
| Amended and Restated Executive Employment Agreement dated effective as of December 2, 2008, between FCX and Kathleen L. Quirk. | | 10-K | 001-11307-01 | 2/26/2009 |
| Amendment to Amended and Restated Executive Employment Agreement dated December 2, 2008, by and between FCX and Kathleen L. Quirk, dated April 27, 2011. | | 8-K | 001-11307-01 | 4/29/2011 |
| FCX Executive Services Program. | | 10-K | 001-11307-01 | 2/24/2017 |
| FCX Supplemental Executive Retirement Plan, as amended and restated. | | 8-K | 001-11307-01 | 2/5/2007 |
| FCX 1996 Supplemental Executive Capital Accumulation Plan. | | 10-Q | 001-11307-01 | 5/12/2008 |
| | | | | | | | | | | | | | | | | |
| | Filed | | | |
| Exhibit | | with this | Incorporated by Reference |
| Number | Exhibit Title | Form 10-K | Form | File No. | Date Filed |
| FCX 1996 Supplemental Executive Capital Accumulation Plan Amendment One. | | 10-Q | 001-11307-01 | 5/12/2008 |
| FCX 1996 Supplemental Executive Capital Accumulation Plan Amendment Two. | | 10-K | 001-11307-01 | 2/26/2009 |
| FCX 1996 Supplemental Executive Capital Accumulation Plan Amendment Three.
| | 10-K | 001-11307-01 | 2/27/2015 |
| FCX 1996 Supplemental Executive Capital Accumulation Plan Amendment Four.
| | 10-K | 001-11307-01 | 2/27/2015 |
| FCX 2005 Supplemental Executive Capital Accumulation Plan, as amended and restated effective January 1, 2015. | | 10-K | 001-11307-01 | 2/27/2015 |
| FCX 2005 Supplemental Executive Capital Accumulation Plan Amendment One | X | | | |
| FCX 2005 Supplemental Executive Capital Accumulation Plan Amendment Two | X | | | |
| FCX 2005 Supplemental Executive Capital Accumulation Plan Amendment Three | X | | | |
| Freeport Minerals Corporation Supplemental Retirement Plan, as amended and restated. | X | 10-K | 001-11307-01 | 2/15/2019 |
| FCX Amended and Restated 1999 Stock Incentive Plan, as amended and restated. | | 10-Q | 001-11307-01 | 5/10/2007 |
| FCX 2003 Stock Incentive Plan, as amended and restated. | | 10-Q | 001-11307-01 | 5/10/2007 |
| FCX 2004 Director Compensation Plan, as amended and restated. | | 10-Q | 001-11307-01 | 8/6/2010 |
| FCX Amended and Restated 2006 Stock Incentive Plan. | | 10-K | 001-11307-01 | 2/27/2014 |
| FCX 2016 Stock Incentive Plan. | | 8-K | 001-11307-01 | 6/9/2016 |
| Form of Notice of Grant of Nonqualified Stock Options and Restricted Stock Units under the 2006 Stock Incentive Plan (for grants made to non-management directors and advisory directors). | | 8-K | 001-11307-01 | 6/14/2010 |
| Form of Nonqualified Stock Options Grant Agreement under the FCX stock incentive plans (effective February 2014). | | 10-K | 001-11307-01 | 2/27/2014 |
| | | | | |
| FCX Annual Incentive Plan (For Fiscal Years Ending 2014 - 2018). | | 8-K | 001-11307-01 | 6/18/2014 |
| Form of Notice of Grant of Restricted Stock Units (for grants made to non-management directors).
| | 10-K | 001-11307-01 | 2/24/2017 |
|
| | | | | |
| | Filed | | | |
Exhibit | | with this | Incorporated by Reference |
Number | Exhibit Title | Form 10-K | Form | File No. | Date Filed |
| Form of Restricted Stock Unit Agreement (effective February 2015). | | 10-K | 001-11307-01 | 2/27/2015 |
| Form of Performance Share Unit Agreement (effective March 2016). | | 10-K | 001-11307-01 | 2/20/2018 |
| Form of Performance Share Unit Agreement (effective February 2018). | | 10-K | 001-11307-01 | 2/20/2018 |
| Form of Nonqualified Stock Options Grant Agreement (effective February 2018). | | 10-K | 001-11307-01 | 2/20/2018 |
| Form of Restricted Stock Unit Agreement (effective February 2018). | | 10-K | 001-11307-01 | 2/20/2018 |
| FCX Annual Incentive Plan (effective January 2019). | X | 10-K | 001-11307-01 | 2/15/2019 |
| Freeport-McMoRan Inc. Executive Change in Control Severance Plan, effective as of May 5, 2020. | | 10-Q | 001-11307-01 | 5/7/2020 |
| | | | | |
| FCX Principles of Business Conduct. | | 10-K | 001-11307-01 | 2/24/201714/2020 |
| Subsidiaries of FCX. | X | | | |
| List of Guarantor Subsidiaries | X | | | |
| Consent of Ernst & Young LLP. | X | | | |
| Certified resolution of the Board of Directors of FCX authorizing this report to be signed on behalf of any officer or director pursuant to a Power of Attorney. | X | | | |
| Powers of Attorney pursuant to which this report has been signed on behalf of certain officers and directors of FCX. | X | | | |
| | | | | | | | | | | | | | | | | |
| | Filed | | | |
| Exhibit | | with this | Incorporated by Reference |
| Number | Exhibit Title | Form 10-K | Form | File No. | Date Filed |
| Certification of Principal Executive Officer pursuant to Rule 13a-14(a)/15d – 14(a). | X | | | |
| Certification of Principal Financial Officer pursuant to Rule 13a-14(a)/15d – 14(a). | X | | | |
| Certification of Principal Executive Officer pursuant to 18 U.S.C. Section 1350. | X | | | |
| Certification of Principal Financial Officer pursuant to 18 U.S.C Section 1350. | X | | | |
| Mine Safety Disclosure. | X | | | |
101.INS | | | | | |
| 101.INS | XBRL Instance Document.Document - the XBRL Instance Document does not appear in the Interactive Data File because its XBRL tags are embedded within the Inline XBRL document. | X | | | |
| 101.SCH | Inline XBRL Taxonomy Extension Schema. | X | | | |
| 101.CAL | Inline XBRL Taxonomy Extension Calculation Linkbase. | X | | | |
| 101.DEF | Inline XBRL Taxonomy Extension Definition Linkbase. | X | | | |
101.LAB | | | | | |
| | | | | |
| | | | | |
| | | |
| | | | | |
| 101.LAB | Inline XBRL Taxonomy Extension Label Linkbase. | X | | | |
| 101.PRE | Inline XBRL Taxonomy Extension Presentation Linkbase. | X | | | |
| 104 | The cover page from this Annual Report on Form 10-K, formatted in Inline XBRL. | X | | | |
Note: Certain instruments with respect to long-term debt of FCX have not been filed as exhibits to this Annual Report on Form 10-K since the total amount of securities authorized under any such instrument does not exceed 10 percent of the total assets of FCX and its subsidiaries on a consolidated basis. FCX agrees to furnish a copy of each such instrument upon request of the Securities and Exchange Commission.Commission (SEC).
* Indicates management contract or compensatory plan or arrangement.
+ The registrant agrees to furnish supplementally to the SEC a copy of any omitted schedule or exhibit upon the request of the SEC in accordance with Item 601(b)(2) of Regulation S-K.
Item 16. Form 10-K Summary.
Not applicable.
GLOSSARY OF TERMS
Following is a glossary of selected terms used throughout the FCXthis Annual Report on Form 10-K that are technical in nature:
Mining
Adits. A horizontal passage leading into a mine for the purposes of access or drainage.
Alluvial aquifers. A water-bearing deposit of loosely arranged gravel, sand or silt left behind by a river or other flowing water.
Anode. A positively charged metal sheet, usually lead, on which oxidation occurs. During the electro-refining process, anodes are impure copper sheets from the smelting process that require further processing to produce refined copper cathode.
Azurite. A bluish supergene copper mineral and ore found in the oxidized portions of copper deposits often associated with malachite.
Barrel or Bbl. One stock tank barrel, or 42 U.S. gallons liquid volume (used in reference to crude oil or other liquid hydrocarbons).
Bench. The horizontal floor cuttings along which mining progresses in an open-pit mine. As the pit progresses to lower levels, safety benches are left in the walls to catch any falling rock.
Blasthole stoping. An underground mining method that extracts the ore zone in large vertical rooms. The ore is broken by blasting using large-diameter vertical drill holes.
Block cave. A general term used to describe an underground mining method where the extraction of ore depends largely on the action of gravity. By continuously removing a thin horizontal layer at the bottom mining level of the ore column, the vertical support of the ore column is removed and the ore then caves by gravity.
Blowouts. Accidents resulting from loss of hydraulic well control while conducting drilling operations.
Bornite. A red-brown isometric mineral comprising copper, iron and sulfur.
British thermal unit or Btu. One British thermal unit is the amount of heat required to raise the temperature of one pound of water by one degree Fahrenheit.
Brochantite. A greenish-black copper mineral occurring in the oxidation zone of copper sulfide deposits.
Cathode. Refined copper produced by electro-refining of impure copper or by electrowinning.
Chalcocite. A grayish copper sulfide mineral, usually found as a supergene in copper deposits formed from the re-deposition of copper minerals that were solubilized from the oxide portion of the deposit.
Chalcopyrite. A brass-yellow sulfide of mineral copper and iron.
Chrysocolla. A bluish-green to emerald-green oxide copper mineral that forms incrustations and thin seams in oxidized parts of copper-mineral veins; a source of copper and an ornamental stone.
Cobalt. A tough, lustrous, nickel-white or silvery-gray metallic element often associated with nickel and copper ores from which it is obtained as a by-product.
Concentrate. The resulting product from the concentrating process that is composed predominantly of copper sulfide or molybdenum sulfide minerals. Further processing might include smelting and electro-refining, or roasting.
Concentrating. The process by which ore is separated into metal concentrate through crushing, milling and flotation.
Concentrator. A process plant used to separate targeted minerals from gangue and produce a mineral concentrate that can be marketed or processed by additional downstream processes to produce salable metals or mineral products. Term is used interchangeably with Mill.
Contained copper. The percentage of copper in a mineral sample before the reduction of amounts unable to be recovered during the metallurgical process.
Covellite. A metallic, indigo-blue supergene mineral found in copper deposits.
Cratering. The collapse of the circulation system dug around the drilling rig for the prevention of blowouts.
Crushed-ore leach pad. A slightly sloping pad upon which leach ores are placed in lifts for processing.
Cutoff grade. The minimum percentage of copper contained in the ore for processing. When percentages are below this grade, the material would be routed to a high-lift or waste stockpile. When percentages are above grade, the material would be processed using concentrating or leaching methods for higher recovery.
Disseminations. A mineral deposit in which the desired minerals occur as scattered particles in the rock that has sufficient quantity to be considered an ore deposit.
Electrolytic refining. The purification of metals by electrolysis. A large piece of impure copper is used as the anode with a thin strip of pure copper as the cathode.
Electrowinning. A process that uses electricity to plate copper contained in an electrolyte solution into copper cathode.
Flotation. A concentrating process in which valuable minerals attach themselves to bubbles of an oily froth for separation as concentrate. The gangue material from the flotation process reports as a tailing product.
Grade. The relative quality or percentage of metal content.
Indigenous Peoples. Indigenous Peoples are distinct social and cultural groups that share collective ancestral ties to the lands and natural resources where they live, occupy or from which they have been displaced.
Leach stockpiles. A quantity of leachable ore placed on a leach pad or in another suitable location that permits leaching and collection of solutions that contain solubilized metal.
Leaching. The process of extracting copper using a chemical solution to dissolve copper contained in ore.
Malachite. A bright-green copper mineral (ore) that often occurs with azurite in oxidized zones of copper deposits.
Metric ton. The equivalent of 2,204.62 pounds.
Mill stockpile. Millable ore that has been mined, and is available for future processing.
Mine-for-leach. A mining operation focused on mining only leachable ores.
Mineralization. The process by which a mineral is introduced into a rock, resulting in concentration of minerals that may form a valuable or potentially valuable deposit.
Molybdenite. A black, platy, disulfide of molybdenum. It is the most common ore of molybdenum.
Ore body. A continuous, well-defined mass of mineralized material of sufficient ore content to make extraction economically feasible.
Oxide. In mining, oxide is used as an ore classification relating to material that usually leaches well but does not perform well in a concentrator. Oxide minerals in mining refer to an oxidized form.
Paste backfill. A slurry of paste material produced from tailings with engineered cement and water content that is used to fill underground mined out stopes.
Porphyry. A deposit in which minerals of copper, molybdenum, gold or, less commonly, tungsten and tin are disseminated or occur in stock-work of small veinlets within a large mass of hydro-thermally altered igneous rock. The host rock is commonly an intrusive porphyry, but other rocks intruded by a porphyry can also be hosts for ore minerals.
Production level. With respect to underground mining, the elevation of the underground works that permit extraction/transport of the ore to a common point, shaft or plant.
Pseudomalachite. A dark-green monoclinic copper mineral.
Roasting. The heating of sulfide ores to oxidize sulfides to facilitate further processing.
Run-of-Mine (ROM). Leachable ore that is mined and directly placed on a leach pad without utilizing any further processes to reduce particle size prior to leaching.
Skarn. A Swedish mining term for silicate gangue of certain iron ore and sulfide deposits of Archaean age, particularly those that have replaced limestone and dolomite. Its meaning has been generally expanded to include
lime-bearing silicates, of any geologic age, derived from nearly pure limestone and dolomite with the introduction of large amounts of silicon, aluminum, iron and magnesium.
Smelting. The process of melting and oxidizing concentrate to separate copper and precious metals from metallic and non-metallic impurities, including iron, silica, alumina and sulfur.
Solution extraction. A process that transfers copper from a copper-bearing ore to an organic solution, then to an electrolyte. The electrolyte is then pumped to a tankhouse where the copper is extracted, using electricity, into a copper cathode (refer to the term Electrowinning), together referred to as solution extraction/electrowinning (SX/EW).
Spot price. The current price at which a commodity can be bought or sold at a specified time and place.
Stope. An underground mining method that is usually applied to highly inclined or vertical veins. Ore is extracted by driving horizontally upon it in a series of workings, one immediately over the other. Each horizontal working is called
a stope because when a number of them are in progress, each working face under attack assumes the shape of a flight of stairs.
Sulfide. A mineral compound containing sulfur and a metal. Copper sulfides can be concentrated or leached, depending on the mineral type.
Tailing. Tailings. The crushed and ground material remaining after economically recoverable metals and minerals have been extracted. In upstream design and construction, tailings are deposited on the upstream side of the starter embankment, with subsequent crest raises progressively shifting upstream of each previous raise, using deposited tailings as a foundation. In downstream design and construction, tailings are deposited on the upstream side of the starter embankment. Borrow fill or a portion of the tailings are placed on the downstream side of the starter embankment. Subsequent crest raises progressively shift downstream of each previous raise, such that the previous raise becomes the foundation of the subsequent raise. As a result, the toe and the crest of the embankment progressively shift downstream as the embankment is raised. In centerline design and construction, tailings are deposited on the upstream side of the starter embankment. Borrow fill or a portion of the tailings are placed on the crest of the starter embankment. Subsequent crest raises are constructed vertically along the centerline of the previous raise such that the previous raise becomes the foundation of the subsequent raise. As a result, the toe of the embankment shifts downstream but the crest stays along initial alignment as the embankment is raised.
Tolling. The process of converting customer-owned material into specified products, which is then returned to the customer.
Oil and Gas
Barrel or Bbl. One stock tank barrel, or 42 U.S. gallons liquid volume (used in reference to crude oil or other liquid hydrocarbons).
Blowouts. Accidents resulting from loss of hydraulic well control while conducting drilling operations.
Barrel of Oil Equivalent or BOE. One stock tank barrel equivalent of oil, calculated by converting gas volumes to equivalent oil barrels at a ratio of 6 thousand cubic feet to 1 barrel of oil.
British thermal unit or Btu. One British thermal unit is the amount of heat required to raise the temperature of one pound of water by one degree Fahrenheit.
Condensate. A mixture of hydrocarbons that exists in the gaseous phase at original reservoir temperature and pressure, but that, when produced, is in the liquid phase at surface pressure and temperature.
Cratering. The collapse of the circulation system dug around the drilling rig for the prevention of blowouts.
Developed oil and gas reserves. Developed oil and gas reserves are reserves of any category that can be expected to be recovered: (i) through existing wells with existing equipment and operating methods or in which the cost of the required equipment is relatively minor compared to the cost of a new well; and (ii) through installed extraction equipment and infrastructure operational at the time of the reserves estimate if the extraction is by means not involving a well.
Development well. A well drilled within the proved area of an oil or gas reservoir to the depth of a stratigraphic horizon known to be productive.
Differential. An adjustment to the price of oil or natural gas from an established spot market price to reflect differences in the quality and/or location of oil or gas.
Natural gas liquids or NGLs. Hydrocarbons (primarily ethane, propane, butane and natural gasolines) which have been extracted from wet natural gas and become liquid under various combinations of increasing pressure and lower temperature.
Standardized measure. The present value, discounted at 10 percent per year, of estimated future net revenues from the production of proved reserves, computed by applying sales prices used in estimating proved oil and natural gas reserves to the year-end quantities of those reserves in effect as of the dates of such estimates and held constant
throughout the productive life of the reserves (except for consideration of future price changes to the extent provided by contractual arrangements in existence at year-end), and deducting the estimated future costs to be incurred in developing, producing and abandoning the proved reserves (computed based on year-end costs and assuming continuation of existing economic conditions). Future income taxes are calculated by applying the appropriate year-end statutory federal and state income tax rates, with consideration of future tax rates already legislated, to pre-tax future net cash flows, net of the tax basis of the properties involved and utilization of available tax carryforwards related to proved oil and natural gas reserves.
Undeveloped acreage. Lease acreage on which wells have not been drilled or completed to a point that would permit the production of economic quantities of oil or gas regardless of whether the acreage contains proved reserves.
Undeveloped oil and gas reserves. Undeveloped oil and natural gas reserves are reserves of any category that are expected to be recovered from new wells on undrilled acreage, or from existing wells where a relatively major expenditure is required for recompletion. Reserves on undrilled acreage shall be limited to those directly offsetting development spacing areas that are reasonably certain of production when drilled, unless evidence using reliable technology exists that establishes reasonable certainty of economic producibility at greater distances. Undrilled locations can be classified as having undeveloped reserves only if a development plan has been adopted indicating that they are scheduled to be drilled within five years, unless the specific circumstances justify a longer time. Under no circumstances shall estimates for undeveloped reserves be attributable to any acreage for which an application of fluid injection or other improved recovery technique is contemplated, unless such techniques have been proved effective by actual projects in the same reservoir or an analogous reservoir, or by other evidence using reliable technology establishing reasonable certainty.
Working interest. An interest in an oil and gas lease that gives the owner of the interest the right to drill for and produce oil and gas on the leased acreage and requires the owner to pay a share of the costs of drilling and production operations.
For additional information regarding the definitions contained in this Glossary, or for other oil and gas definitions, refer to Rule 4-10
SIGNATURES
Pursuant to the requirements of Section 13 of the Securities Exchange Act of 1934, the registrant has duly caused this report to be signed on its behalf by the undersigned, thereunto duly authorized, on February 15, 2019.16, 2021.
Freeport-McMoRan Inc.
By:/s/ Richard C. Adkerson
Richard C. Adkerson
Vice Chairman of the Board President and Chief Executive Officer
Pursuant to the requirements of the Securities Exchange Act of 1934, this report has been signed by the following persons on behalf of the registrant in the capacities indicated on February 15, 2019.
| | | | | |
| /s/ Richard C. Adkerson | Chairman of the Board and Chief Executive Officer |
| Richard C. Adkerson | (Principal Executive Officer) |
| |
/s/ Richard C. Adkerson | Vice Chairman of the Board, President and Chief Executive Officer |
Richard C. Adkerson | (Principal Executive Officer) |
| |
| /s/ Kathleen L. Quirk | Executive Vice President and Chief Financial Officer |
| Kathleen L. Quirk | (Principal Financial Officer) |
| |
| * | Vice President and Controller - Financial Reporting |
| C. Donald Whitmire, Jr. | (Principal Accounting Officer) |
| |
| * | Chairman of the BoardDirector |
| Gerald J. Ford | |
| |
| * | Director |
| Lydia H. Kennard | |
| |
| * | Director |
Courtney Mather | |
| |
* | Director |
| Dustan E. McCoy | |
| |
| * | Director |
| John J. Stephens | |
| |
| * | Director |
| Frances Fragos Townsend | |
| |
| * By: /s/ Richard C. Adkerson | |
| Richard C. Adkerson | |
| Attorney-in-Fact | |