UNITED STATES
SECURITIES AND EXCHANGE COMMISSION
Washington, D.C. 20549
Form 10-K | | | | | |
| ☑ | ANNUAL REPORT PURSUANT TO SECTION 13 OR 15(d) OF THE SECURITIES EXCHANGE ACT OF 1934 |
For the fiscal year ended December 31, 20222023 | | | | | |
| ☐ | TRANSITION REPORT PURSUANT TO SECTION 13 OR 15(d) OF THE SECURITIES EXCHANGE ACT OF 1934 |
| For the transition period from to |
Commission file number 1-10235
IDEX CORPORATION
(Exact name of registrant as specified in its charter) | | | | | | | | | | | | | | | | | | | | |
| Delaware | | 36-3555336 |
| (State or other jurisdiction of
incorporation or organization) | | (I.R.S. Employer
Identification No.) |
| 3100 Sanders Road, | Suite 301, | Northbrook, | Illinois | | 60062 |
| (Address of principal executive offices) | | (Zip Code) |
Registrant’s telephone number, including area code: (847) 498-7070
Securities Registered Pursuant to Section 12(b) of the Act: | | | | | | | | |
| Title of each class | Trading Symbol(s) | Name of each exchange on which registered |
| Common Stock, par value $.01 per share | IEX | New York Stock Exchange |
Securities Registered Pursuant to Section 12(g) of the Act:
None
Indicate by check mark if the registrant is a well-known seasoned issuer, as defined in Rule 405 of the Securities Act. Yes þ No ¨
Indicate by check mark if the registrant is not required to file reports pursuant to Section 13 or Section 15(d) of the Act. Yes ¨ No þ
Indicate by check mark whether the registrant (1) has filed all reports required to be filed by Section 13 or 15(d) of the Securities Exchange Act of 1934 during the preceding 12 months (or for such shorter period that the registrant was required to file such reports), and (2) has been subject to such filing requirements for the past 90 days. Yes þ No ¨
Indicate by check mark whether the registrant has submitted electronically every Interactive Data File required to be submitted pursuant to Rule 405 of Regulation S-T (§232.405 of this chapter) during the preceding 12 months (or for such shorter period that the registrant was required to submit such files). Yes þ No ¨
Indicate by check mark whether the registrant is a large accelerated filer, an accelerated filer, a non-accelerated filer, a smaller reporting company, or an emerging growth company. See the definitions of “large accelerated filer,” “accelerated filer,” “smaller reporting company,” and “emerging growth company” in Rule 12b-2 of the Exchange Act. | | | | | | | | | | | | | | | | | | | | | | | | | | |
| Large accelerated filer | ☑ | | Accelerated filer ☐ | | Non-accelerated filer ☐ | | Smaller reporting company | ☐ |
| Emerging growth company | ☐ | | | | | | | |
| If an emerging growth company, indicate by check mark if the registrant has elected not to use the extended transition period for complying with any new or revised financial accounting standards provided pursuant to Section 13(a) of the Exchange Act. ☐ |
Indicate by check mark whether the registrant has filed a report on and attestation to its management’s assessment of the effectiveness of its internal control over financial reporting under Section 404(b) of the Sarbanes-Oxley Act (15 U.S.C. 7262(b)) by the registered public accounting firm that prepared or issued its audit report. ☑
If securities are registered pursuant to Section 12(b) of the Act, indicate by check mark whether the financial statements of the registrant included in the filing reflect the correction of an error to previously issued financial statements. ☐
Indicate by check mark whether any of those error corrections are restatements that required a recovery analysis of incentive-based compensation received by any of the registrant’s executive officers during the relevant recovery period pursuant to §240.10D-1(b). ☐
Indicate by check mark whether the registrant is a shell company (as defined in Rule 12b-2 of the Act). Yes ☐ No þ
The aggregate market value, as of the last business day of the registrant’s most recently completed second fiscal quarter, of the common stock (based on the June 30, 20222023 closing price of $181.63)$215.26) held by non-affiliates of IDEX Corporation was $13,718,682,816.$16,267,670,265.
The number of shares outstanding of IDEX Corporation’s common stock, par value $.01 per share, as of February 17, 202316, 2024 was 75,518,200.75,644,654.
DOCUMENTS INCORPORATED BY REFERENCE
Portions of the proxy statement with respect to the IDEX Corporation 20232024 annual meeting of stockholders (the “2023“2024 Proxy Statement”) are incorporated by reference into Part III of this Form 10-K.
Table of Contents
| | | | | | | | | | | | | | |
| PART I. | Item 1. | | | |
| Item 1A. | | | |
| Item 1B. | | | |
| Item 1C. | | | |
| Item 2. | | | |
| Item 3. | | | |
| Item 4. | | | |
| | |
| PART II. | Item 5. | | | |
| Item 6. | | | |
| Item 7. | | | |
| Item 7A. | | | |
| Item 8. | | | |
| | | | |
| | | | |
| | | | |
| | | | |
| | | | |
| | | | |
| | | | |
| | | | |
| | | | |
| | | | |
| | | | |
| | | | |
| | | | |
| | | | |
| | | | |
| | | | |
| | | | |
| | | | |
| | | | |
| | | | |
| | | | |
| | | | |
| | | | |
| | | | |
| | | | |
| | | | |
| | | | |
| | | | |
| Item 9. | | | |
| Item 9A. | | | |
| Item 9B. | | | |
| Item 9C. | | | |
| | |
| PART III. | Item 10. | | | |
| Item 11. | | | |
| Item 12. | | | |
| Item 13. | | | |
| Item 14. | | | |
| | |
| PART IV. | Item 15. | | | |
| Item 16. | | | |
| | | | |
PART I
Cautionary Statement Under the Private Securities Litigation Reform Act
This report contains “forward-looking” statements within the meaning of the Private Securities Litigation Reform Act of 1995, as amended. These statements may relate to, among other things, the Company’s full year 20232024 focus and the assumptions underlying these expectations, plant and equipment capacity for future growth, and the anticipated timing and effects of planned facility expansion, the duration of supply chain challenges, anticipated future acquisition behavior and capital deployment, expectations regarding customer destocking efforts and future order stabilization and lead time, expectations regarding market sector contraction, recovery, stabilization or growth, availability of cash and financing alternatives the intent to refinance or repay the Company’s 3.20% Senior Notes due June 2023 using the available borrowing capacity of the Revolving Facility and the anticipated benefits of the Company’s recent acquisitions, including the acquisitions of ABEL Pumps, L.P. and certain of its affiliates (“ABEL”), Airtech Group, Inc., US Valve Corporation and related entities (“Airtech”), Nexsight, LLC and its businesses Envirosight, WinCan, MyTana and Pipeline Renewal Technologies (“Nexsight”), KZ CO. (“KZValve”) and Muon B.V. and its subsidiaries (“Muon Group”) and are indicated by words or phrases such as “anticipates,” “estimates,” “plans,” “guidance,” “expects,” “projects,” “forecasts,” “should,” “could,” “will,” “management believes,” “the Company believes,” “the Company intends” and similar words or phrases. These statements are subject to inherent uncertainties and risks that could cause actual results to differ materially from those anticipated at the date of this report.
The risks and uncertainties include, but are not limited to, the following: the impact of health epidemics and pandemics, including the COVID-19 pandemic, and the impact of related governmental actions on the Company’s ability to operate its business and facilities, on its customers, on supply chains and on the U.S. and global economy generally; economic and political consequences resulting from terrorist attacks and wars, including Russia's invasion of Ukraine and the global response to this invasion, which, along with the ongoing effects of the COVID-19 pandemic, could have an adverse impact on the Company's business by creating disruptions in the global supply chain and by potentially having an adverse impact on the global economy; levels of industrial activity and economic conditions in the U.S. and other countries around the world, including uncertainties in the financial markets;markets and adverse developments affecting the financial services industry; pricing pressures, including inflation and rising interest rates, and other competitive factors and levels of capital spending in certain industries, all of which could have a material impact on order rates and the Company’s results; the impact of catastrophic weather events, natural disasters and public health threats; economic and political consequences resulting from terrorist attacks and wars, which could have an adverse impact on the Company's business by creating disruptions in the global supply chain and by potentially having an adverse impact on the global economy; the Company’s ability to make acquisitions and to integrate and operate acquired businesses on a profitable basis; cybersecurity incident; the relationship of the U.S. dollar to other currencies and its impact on pricing and cost competitiveness; political and economic conditions in foreign countries in which the Company operates; developments with respect to trade policy and tariffs; interest rates; capacity utilization and the effect this has on costs; labor markets; supply chain backlogs, including risks affecting component availability, labor inefficiencies and freight logistical challenges;conditions; market conditions and material costs; risks related to environmental, social and corporate governance issues, including those related to climate change and sustainability; and developments with respect to contingencies, such as litigation and environmental matters, and the other risk factors discussed inItem 1A, “Risk Factors” of this annual report. The forward-looking statements included here are only made as of the date of this report, and management undertakes no obligation to publicly update them to reflect subsequent events or circumstances, except as may be required by law. Investors are cautioned not to rely unduly on forward-looking statements when evaluating the information presented here.
PART I
Item 1. Business.
Overview
IDEX Corporation (“IDEX” or the “Company”) was incorporated in Delaware on September 24, 1987 and is an applied solutions provider serving niche markets worldwide. IDEX is a high-performing global enterprise committed to making trusted solutions that improve lives and are mission critical components in everyday life. Substantially all of the Company’s business activities are carried out through over 50 wholly-owned subsidiaries with shared values of trust, teamTrust, Team and excellence.Excellence. IDEX’s diverse family of businesses is innovative and inquisitive in its quest to solve customers’ most challenging applied technology problems. These businesses operate with a high degree of autonomy, yet are all united by employing The IDEX Difference, a philosophy of great teams who embrace the 80/20 principle while remaining hyper-focused on serving customers. IDEX was incorporated in Delaware on September 24, 1987.
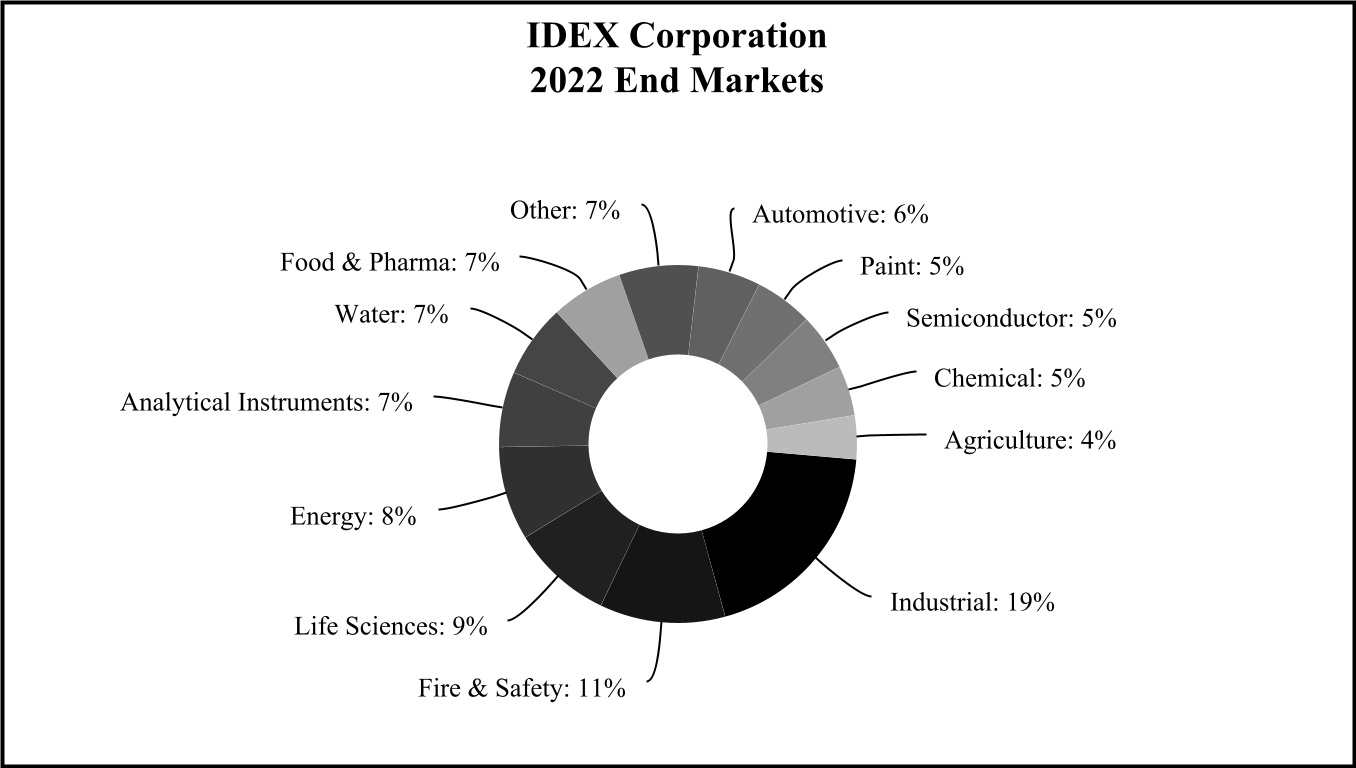
End Markets and Products
The following table summarizes the percentage of total IDEX sales generated by each end market:
The Company has three reportable segments: Fluid & Metering Technologies (“FMT”), Health & Science Technologies (“HST”) and Fire & Safety/Diversified Products (“FSDP”). The segments are structured around how to best serve customer needs, with each segment consisting of businesses that have product and end market similarities as well as common distribution methods and production processes. This structure enables management efficiency, aligns IDEX’s operations with its focus on organic growth, strategic acquisitions and capital allocation priorities and provides transparency about the Company’s performance to external stakeholders.
Within its three reportable segments, the Company maintains 13 reporting units.
IDEX believes that each of its reporting units is a leader in its products and services. The Company also believes that its strong financial performance has been attributable to its ability to design and engineer specialized quality products coupled with its ability to successfully identify, acquire and integrate strategic acquisitions. The table below illustrates the three reportable segments and the reporting units within each segment.
| | | | | | | | | | | | | | |
| FMT | | HST | | FSDP |
| | | | |
| Pumps | | Scientific Fluidics & Optics | | Fire & Safety |
| Water | | Sealing Solutions | | Dispensing |
| Energy | | Performance Pneumatic Technologies | | BAND-IT |
| Valves | | Material Processing Technologies | | |
| Agriculture | | | Micropump | |
The table below illustrates the percentages of the share of Net Salessales and Adjusted EBITDA contributed by each segment on the basis of total segments (not total Company) for the years ended December 31, 20222023 and 2021.2022.
| | Year Ended December 31, 2022 | Year Ended December 31, 2021 |
| FMT | | HST | | FSDP | | FMT | | HST | | FSDP |
| Net Sales | 37% | | 42% | | 21% | | 36% | | 41% | | 23% |
| Year Ended December 31, 2023 | | | Year Ended December 31, 2023 | Year Ended December 31, 2022 |
| FMT | | | FMT | | HST | | FSDP | | FMT | | HST | | FSDP |
| Net sales | | Net sales | 38% | | 40% | | 22% | | 37% | | 42% | | 21% |
Adjusted EBITDA(1) | Adjusted EBITDA(1) | 39% | | 42% | | 19% | | 36% | | 42% | | 22% | Adjusted EBITDA(1) | 42% | | 37% | | 21% | | 39% | | 42% | | 19% |
(1) Segment Adjusted EBITDA excludes the impact of unallocated corporate costs of $85.7$84.6 million and $73.2$85.7 million for the years ended December 31, 20222023 and 2021,2022, respectively.
FLUID & METERING TECHNOLOGIES SEGMENT
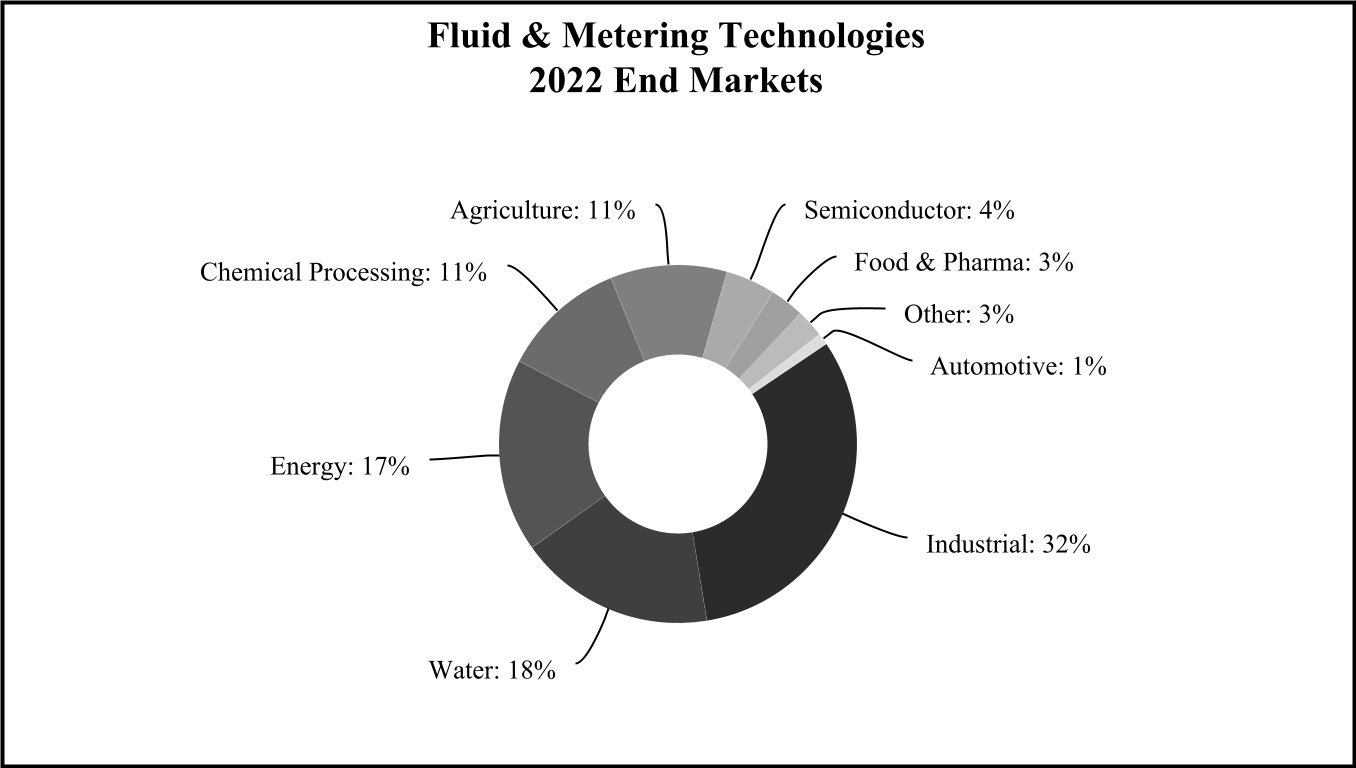
The FMT segment designs, produces and distributes positive displacement pumps, valves, small volume provers, flow meters, injectors and other fluid-handling pump modules and systems and provides flow monitoring and other services for the food, chemical, general industrial, water and wastewater, agriculture and energy industries. FMT application-specific pump and metering solutions serve a diverse range of end markets, including industrial infrastructure (fossil fuels, refined and alternative fuels and water and wastewater), energy, chemical processing, agriculture, food and beverage, semiconductor, pulp and paper, automotive/transportation, plastics and resins, electronics and electrical, construction and mining, pharmaceutical and bio-pharmaceutical, machinery and numerous other specialty niche markets.
The following table summarizes the percentage of total FMT sales generated by each end market:
The following discussion describes the reporting units included in the FMT segment:
Pumps. Pumps is a leading manufacturer of rotary internal gear, external gear, vane and rotary lobe pumps, custom-engineered OEMoriginal equipment manufacturer pumps, strainers, gear reducers and engineered pump systems. Pumps primarily uses independent distributors to market and sell its products. Pumps is comprised of the following businesses:
•Viking Pump’sPump is a global leader in pumping solutions, with products consist ofincluding internal gear, external gear, vane, lobe and circumferential piston pumps, strainersas well as parts, kits and reducersaccessories designed to support customers worldwide. With a focus on industrial applications like chemicals, polyurethane foam and related controls used for transferringasphalt; energy applications like oil transfer and metering thinglycol dehydration; and viscous liquids sold under the Viking Pump and Wright Flow brands. Viking Pump products primarily serve the chemical, petroleum, pulp and paper, plastics, paints, inks, tanker trucks, compressor,
construction,hygienic applications like biopharma, food and beverage, personal care, pharmaceutical and biotech markets.Viking Pump delivers proven liquid transfer pumping solutions for a wide variety of thin to viscous applications. Viking Pump maintains operations in Cedar Falls, Iowa, with locations in Windsor, Canada (Viking Pump Canada), Shannon, Ireland (IDEX Pump Technologies) and Wright Flow products); Eastbourne, England (Wright Flow products); Shannon, Ireland (Viking Pump products) and Windsor, Ontario (Viking Pump products)Hygienic).
•Warren Rupp manufactures air-operated double diaphragm pumpspump products (which include Versa-Maticincludes Sandpiper and Versamatic products) used for abrasive and semisolid materials as well as for applications where product degradation is a concern or where electricity is not available or should not be used. Warren Rupp products primarily serve the chemical, paint, food processing, electronics, construction, utilities, oil and gas, mining and industrial maintenance markets. Warren Rupp maintains operations in Mansfield, Ohio.
•ABEL designs and manufactures highly engineered reciprocating positive displacement pumps used for mine dewatering, back filling, transfer of mine tailings, municipal sledge and wastewater applications in a variety of end markets including mining, marine, power, water and wastewater andas well as other general industries. ABEL maintains operations in Büchen, Germany and Mansfield, Ohio and has a facility in Madrid, Spain.
Water. Water is a leading provider of metering technology, flow monitoring products and underground surveillance services for wastewater markets, as well as alloy and non-metallic gear pumps and peristaltic pumps. Water is comprised of the following businesses:
•ADS’ products and services provide comprehensive integrated solutions that enable industry, municipalities and government agencies to analyze and measure the capacity, quality and integrity of wastewater collection systems, including the maintenance and construction of such systems. ADS maintains operations in Huntsville, Alabama and various other locations in the United States, Canada and Australia.
•iPEK, supplies remote controlled systems usedEnvirosight and WinCan combined are the leading providers of integrated solutions for managing the complete lifecycle of water infrastructure inspection. iPEK maintains operations in Hirschegg, Austriaassets and Sulzberg, Germany.
•Nexsightprocess workflows. Their products and its market leading businesses, Envirosight, WinCan, MyTana and Pipeline Renewal Technologies, complement and create synergies with the Company’s existing iPEK and ADS business units that design and createsolutions include sewer crawlers, inspection and monitoring systems and software applications that allow teams to identify, anticipate and correct wastewaterwater system issues, remotely. Nexsightautomate and simplify inspection processes, improve infrastructure asset management and support distributed teams and cloud-based collaboration. MyTana and Pipeline Renewal Technologies design and build products used to clean and repair infrastructure in the sewer and drain industry. iPEK maintains operations in Hirschegg, Austria and Sulzberg, Germany. Envirosight and Pipeline Renewal Technologies maintain operations in Randolph, New Jersey; St. Paul, Minnesota;Jersey and Callery, Pennsylvania;Pennsylvania. WinCan has development centers in Murten, Switzerland and Krakow, Poland. MyTana maintains operations in St. Paul, Minnesota. All entities have various other locationssales and service outlets across the United States and Europe.
•Trebor is a leader in high-purity fluid handling products, including air-operated diaphragm pumps and deionized water-heating systems. Trebor products are used in the manufacturing of semiconductors, disk drives and flat panel displays. Trebor maintains operations in West Jordan, Utah.
•Pulsafeeder products are used to introduce precise amounts of fluids into processes to manage water quality and chemical composition as well as peristaltic pumps.composition. Its markets include industrial and municipal water and wastewater treatment, oil and gas, power generation, pulp and paper, chemical and hydrocarbon processing and swimming pools. Pulsafeeder serves these markets by producing hydraulic and mechanical diaphragm pumps, rotary pumps, peristaltic pumps and controllers. Pulsafeeder maintains operations in Rochester, New York and Punta Gorda, Florida.
Energy. Energy is a leading supplier of flow meters, small volume provers, electronic registration and control products, rotary vane and turbine pumps, reciprocating piston compressors and terminal automation control systems. Energy is comprised of the following businesses:
•Advanced Flow Solutions (“AFS”) consists of the Company’s Corken, Liquid Controls and SAMPI businesses. ApplicationsProducts for Liquid Controls and SAMPI consist of positive displacement flow meters andas well as electronic registration and control products, including mobile and stationary metering installations for wholesale and retail distribution of petroleum and liquefied petroleum gas, aviation refueling and industrial metering and dispensing of refined liquids and gases. Corken products consist of positive-displacementpositive displacement rotary vane pumps, single and multistage regenerative turbine pumps and small horsepower reciprocating piston compressors.compressors in the oil, gas and industrial markets. AFS maintains operations in Oklahoma City, Oklahoma (Corken and Liquid Controls products) and Altopascio, Italy (SAMPI products).
•Toptech supplies terminal automation hardware and software to control and manage inventories as well as transactional data and invoicing to customers in the oil, gas and refined-fuels markets. Toptech maintains operations in Longwood, Florida and Zwijndrecht, Belgium.
•Flow MD engineers and manufactures small volume provers that ensure custody transfer accuracy in the oil and gas industry.market. Flow MD maintains operations in Phoenix, Arizona.
Valves. Valves is a leader in the design, manufacture and sale of specialty valve products for use in the chemical, petro-chemical, energy and sanitary markets as well as a leading producer of fluoroplastic lined corrosion-resistant magnetic drive and mechanical seal pumps, shut-off, control and safety valves for corrosive, hazardous, contaminated, pure and high-purity fluids. Valves is comprised of the following businesses:
•Alfa Valvole and OBL manufacture specialty valve products used in various industrial fields for fluid control, in both gas and liquid form, in all sectors of plant engineering, cosmetics, detergents, food industry, electric energy, pharmaceutical, chemical plants, petrochemical plants, oil, heating/air conditioning and also on ships, ferries and marine oil platforms. Alfa Valvole and OBL maintain operations in Cassorezzo, Italy.
•Richter and Aegis produce superior solutions for demanding and complex pump and valve applications in the process industry as well as specialty chemical processing valves for use in the chemical, petro-chemical, chlor-alkali and pulp and paper industries. Richter and Aegis maintain operations in Kempen, Germany; Suzhou, China and Geismar, Louisiana.
Agriculture. Agriculture consists of the following businesses:
•Banjo is a provider of special purpose, severe-duty pumps, valves, fittings and systems used in liquid handling. Its products are used in agricultureagricultural and industrial applications. Banjo is basedmaintains operations in Crawfordsville, Indiana withand has distribution facilities in Didam, Thethe Netherlands and Valinhos, Brazil.
•KZValve is a leading manufacturer of electric valves and controllers used primarily in agricultural applications. KZValve maintains operations in Greenwood, Nebraska.
HEALTH & SCIENCE TECHNOLOGIES SEGMENT
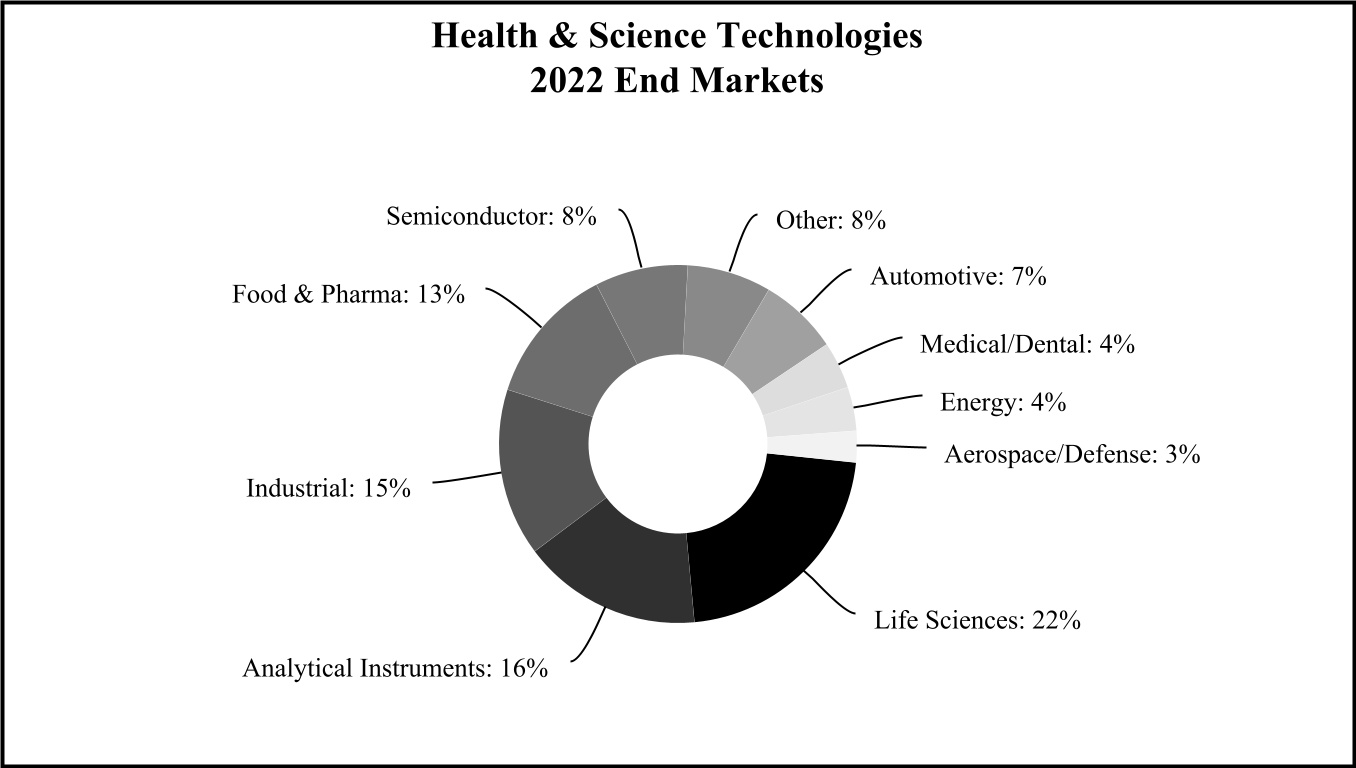
The HST segment designs, produces and distributes a wide range of precision fluidics, rotary lobe pumps, centrifugal and positive displacement pumps, roll compactionpowder and liquid processing technologies, drying systems, micro-precision components, pneumatic components and sealing solutions, high performance molded and extruded sealing components, custom mechanical and shaft seals, engineered hygienic mixers and valves, biocompatible medical devices and implantables, air compressors and blowers, optical components and coatings, laboratory and commercial equipment and precision photonic solutions and precision gear and peristaltic pump technologies. HST serves a variety of end markets, including food and beverage, life sciences, analytical instruments, pharmaceutical and biopharmaceutical, industrial, semiconductor, digital printing, automotive/transportation, medical/dental, energy, cosmetics, marine, chemical, wastewater and water treatment, research and aerospace/defense markets.solutions.
The following table summarizes the percentage of total HST sales generated by each end market:
The following discussion describes the reporting units included in the HST segment:
Scientific Fluidics & Optics. Scientific Fluidics & Optics is a global authority in life science fluidics, optics, microfluidics and photonics and the movement of liquids and gases in critical applications, offering a diverse set of technologies, expertise, capabilities and product solutions across numerous market segments. Scientific Fluidics & Optics is comprised of the following businesses:
•IDEX Health & Science (“IH&S”) consists of IH&S Life Science Fluidics, IH&S Life Science Optics and IH&S Microfluidics. The IH&S Life Science Fluidics technology and product portfolio consists of column hardware, degassers, fluidic connections, fluidic manifolds, pumps and pump components, sensors, refractive index detectors, valves and fluidics sub-systems. The IH&S Life Science Optics technology and product portfolio consists of illumination light engines, optical filters, optical subsystems, sensors, cameras and camera imaging objectives. IH&S Microfluidics includes thinXXS Microtechnology, a global leader in developing and producing microfluidic systems, components and consumables serving the point of care diagnostic and digital polymerase chain reaction (“PCR”) markets. IH&S serves the life science optics, chromatography, mass spectrometry, in-vitro diagnostics/biotech fluidics and fluidic connections markets. IH&S maintains operations in Bristol, Connecticut; Carlsbad, California; Lima, New York; Middleboro,
Massachusetts; Oak Harbor, Washington; Rochester, New York; Rohnert Park, California; Zweibruken, Germany and Saitama, Japan.
•IDEX Optical Technologies consists of Advanced Thin Films, CVI Laser Optics, and CVI Infrared Optics.Optics and Iridian Spectral Technologies. The technology and product portfolio consists of polarization optics, windows, optical filters, beamsplitters, lenses, waveplates, monolithic, optics, lens assemblies, imaging assemblies, shutters optical subsystems and detector integration. IDEX Optical Technologies serves the semiconductor metrology, satellite optical communications, defense, aerospace and remote sensing, additive manufacturing, and laser material processing, laser communications, telecommunications and life science markets. The businesses maintain operations in Albuquerque, New Mexico; Boulder, Colorado; Didam, Thethe Netherlands; Whetstone, England; and Whetstone Leicester, United Kingdom.Ottawa, Canada.
•Muon Group manufactures highly precise flow paths in a variety of materials that enable the movement of various liquids and gases in critical applications forwithin the medical, semiconductor, food processing, digital printing and filtration technologies.markets. The group includes LouwersHanique, Veco, Millux, Tecan and Atul, which have critical technical expertise in precision and tolerances for different materials, from metals and glass to plastics and ceramics. The business maintains operations in Hapert, the Netherlands; Eerbeek, the Netherlands; Wijchen, the Netherlands; Dorset, in the United KingdomEngland; and Pune, India.
•STC Material Solutions specializes in the design and manufacturing of technical ceramics and hermetic sealing products in mission critical applications within the semiconductor, aerospace and defense, industrial technology, medical technology and energy markets. The business maintains operations in St. Albans, Vermont, with additional operations in Santa Ana, California.
Sealing Solutions. Sealing Solutions focuses on providing special seals and related products and solutions in diversified markets. Sealing Solutions is comprised of the following businesses:
•Precision Polymer Engineering is a provider of proprietary high performance seals and advanced sealing solutions for a diverse range of global industries and applications, including hazardous duty, analytical instrumentation, semiconductor, process technologies, oil and gas, pharmaceutical, electronics and food applications. Precision Polymer Engineering is headquarteredmaintains operations in Blackburn, England and has an additional manufacturing facility in Brenham, Texas. Precision Polymer Engineering also entered into a joint venture with a third party to manufacture and sell high performance elastomer seals for the oil and gas industry to customers within the Kingdom of Saudi Arabia as well as export these high performance elastomer seals outside of the Kingdom of Saudi Arabia. The joint venture is headquarteredmaintains operations in Dammam, Saudi Arabia.
•FTL Seals Technology is locatedmaintains operations in Leeds, England and specializes in the design and application of high integrity rotary seals, specialty bearings and other custom products for the mining, power generation and marine markets.
•Novotema is located in Villongo, Italy and is a leader in the design, manufacture and sale of specialty sealing solutions for use in the building products, gas control, transportation, industrial and water markets.
•SFC Koenig is a producer of highly engineered expanders and check valves for critical applications across the transportation, hydraulic, aviation and medical markets. SFC Koenig is basedmaintains operations in Dietikon, Switzerland and has additional facilities in North Haven, Connecticut; Illerrieden, Germany and Suzhou, China.
•The Roplan businesses are global manufacturers of custom mechanical and shaft seals for a variety of end markets including food and beverage, marine, chemical, wastewater and water treatment. Roplan is headquarteredmaintains operations in Sweden and also has operations in Ningbo, China; Berkshire, England and Madison, Wisconsin.
Performance Pneumatic Technologies. Performance Pneumatic Technologies provides specialized, high-performing air moving technologies across a wide array of industries. Performance Pneumatic Technologies is comprised of the following businesses:
•Gast is a leading manufacturer of air-moving products, with a core technology around fractional horsepower (under 1 hp) air compressors, vacuum pumps and air motors. Gast products are used in a variety of long-life applications requiring a quiet, clean source of moderate vacuum or pressure and primarily serve the medical equipment, environmental equipment, computers and electronics, printing machinery, paint mixing machinery, packaging machinery, graphic arts and industrial manufacturing markets. Gast is basedmaintains operations in Benton Harbor, Michigan and has a logistics and commercial center in Redditch, England.
•Airtech designs and manufactures a wide range of highly-engineered pressure technology products, with a core technology around high performance blowers (2 hp and above) and pneumatic valves for a variety of end markets, including alternative energy, food processing, medical, packaging and transportation. Airtech is headquarteredmaintains operations in Rutherford, New Jersey and has other manufacturing operations in Linthicum Heights, Maryland; Wilmington, North Carolina; Werneck, Germany and Shenzhen, China.
Material Processing Technologies. Material Processing Technologies provides process equipment and global support service solutions that meet customer specific requirements with a focus in the pharmaceutical, food, battery and chemical markets. Material Processing Technologies is comprised of the following businesses:
•IDEX MPT, Inc., which includes Quadro, Steridose, Fitzpatrick, Microfluidics, Quadro and Steridose, is basedMatcon, maintains operations in Waterloo, CanadaCanada; Westwood, Massachusetts; Delran, New Jersey; Evesham, England; Ahmedebad, India and also has an office in Westwood, Massachusetts.Shanghai, China.
◦Quadro is a leading provider of powder processing solutions for the pharmaceutical, food, personal care and foodchemical markets. Quadro’s core capabilities include fine milling, emulsification and special handling of liquid and solid particulates for laboratory,laboratories, through the pilot phase andto full scale up with production scale processing.
◦Steridose develops engineered hygienicis a leading designer and manufacturer of magnetic coupled mixers and diaphragm valves for the global biopharmaceutical industry.
◦Fitzpatrick is a global leader in the design and manufacture of process technologies for the pharmaceutical food and personal care markets.chemical sectors. Fitzpatrick designs and manufactures customized size reduction and roll compaction systems to support their customers’ product development and manufacturing processes.
◦Microfluidics is a global leader in the design and manufacture of laboratory and production equipment used in the production of micro and nano scale materials for the pharmaceutical, biologics, personal care and vaccinechemical markets. Microfluidics is the exclusive producer of the Microfluidizer family of high shear fluid processors for uniform nano-emulsion formation, Lipidlipid nanoparticle creation, robust cell disruption and particle size reduction.
•◦Matcon is located in Evesham, England and is a global leader in creating flexible material processing solutions for high value powders used in the manufacture of foods, pharmaceuticals, food,batteries, plastics and fine chemicals. Matcon’s innovative products consist of the original cone valve powder discharge system and filling, mixing and packaging systems, all of which support its customers’ automation and process requirements. These products are critical to its customers’ need to maintain clean, reliable and repeatable formulations of prepackaged foods and pharmaceuticals while helping them achieve lean and agile manufacturing.
Micropump. Headquartered in Vancouver, Washington, Micropump is a leader in small, precision-engineered, magnetically and electromagnetically driven rotary gear, piston and centrifugal pumps. Micropump products are used in low-flow abrasive and corrosive applications. Micropump products primarily serve the continuous ink-jet printing, medical equipment, chemical processing, pharmaceutical, refining, laboratory, electronics, textiles, peristaltic metering pumps, analytical process controllers and sample preparation systems markets.Table of Contents
FIRE & SAFETY/DIVERSIFIED PRODUCTS SEGMENT
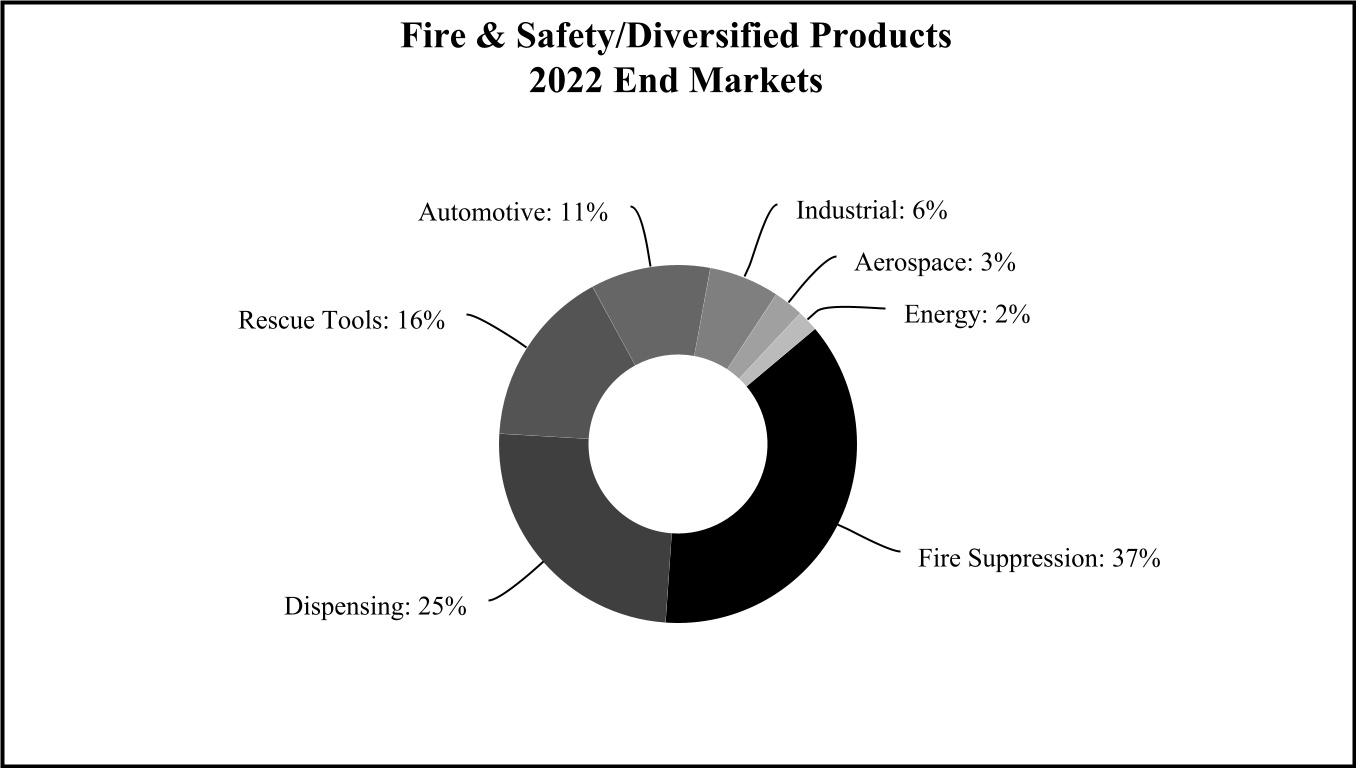
The FSDP segment designs, produces and distributes firefighting pumps, valves and controls, rescue tools, lifting bags and other components and systems for the fire and rescue industry,industry; engineered stainless steel banding and clamping devices used in a variety of industrial and commercial applications in the automotive, energy and industrial marketsapplications; and precision equipment for dispensing, metering and mixing colorants and paints used in a variety of retail and commercial businesses in the paint and industrial markets around the world.businesses.
The following table below summarizes the percentage of total FSDP sales generated by each end market:
The following discussion describes the reporting units included in the FSDP segment:
Fire & Safety. Fire & Safety businesses produce truck-mounted and portable fire pumps, stainless steel and brass valves, monitors, nozzles, foam and compressed air foam systems, pump modules and pump kits, electronic controls and information systems, conventional and networked electrical systems and mechanical components for the fire rescue and specialty vehicle markets,markets. Safety businesses produce hydraulic, battery, gas and electric-operated rescue equipment, hydraulic re-railing equipment, hydraulic tools for industrial applications, recycling cutters, pneumatic lifting and sealing bags for vehicle and aircraft rescue, environmental protection and disaster control and jumping cushions for building rescue.rescue for the rescue market. Fire & Safety’s customers are original equipment manufacturers (“OEMs”) as well as public and private fire and rescue organizations. Fire & Safety maintains facilitiesoperations in Ocala, Florida (Class 1 and Hale products); Warwick, England (Godiva products); Wooster and Columbus, Ohio (Akron Brass and Weldon products); Ballendorf, Germany (AWG Fittings products); Shelby, North Carolina (Hurst Jaws of Life® products); Tianjin, China (Dinglee products); Erlangen, Germany (Lukas products) and Zulpich, Germany (Vetter products).
Dispensing. Dispensing businesses produce precision equipment for dispensing, metering and mixing colorants and paints used in a variety of retail and commercial businesses around the world. Dispensing is a global supplier of such equipment focused on the architectural paints segment used in retail and commercial stores, hardware stores, home centers and paint and specialized stores as well as in some industrial settings. Dispensing maintains facilitiesoperations in Sassenheim, The Netherlandsthe Netherlands; Wheeling, Illinois and Wheeling, IllinoisSandani, India as well as multiple sales offices around the world.
BAND-IT. BAND-IT is a leading producer of high-quality stainless steel banding, buckles and clamping systems. The BAND-IT brand is highly recognized worldwide. BAND-IT products are used for securing exhaust system heat and sound shields, airbags, industrial hose fittings, traffic signs and signals, electrical cable shielding, identification and bundling and in numerous other industrial and commercial applications. BAND-IT products primarily serve the automotive, aerospace, energy, utility, municipal, cable management and general industrial markets. BAND-IT is based in Denver, Colorado, with additional operations in Staveley, England.
utility, municipal, cable management and general industrial markets. BAND-IT maintains operations in Denver, Colorado, with additional operations in Staveley, England.
INFORMATION APPLICABLE TO THE COMPANY’S BUSINESS IN GENERAL AND ITS SEGMENTS
Competitors
The Company’s businesses participate in highly competitive markets. IDEX believes that the principal points of competition are product quality, design and engineering capabilities, product development, conformity to customer specifications, quality of post-sale support, timeliness of delivery and effectiveness of the Company’s distribution channels.
Principal competitors of the FMT segment are the Pumps Group (Maag, Blackmer(Blackmer, Wilden and WildenEbsray products) of Dover Corporation (with respect to pumps and small horsepower compressors used in liquefied petroleum gas distribution facilities, rotary gear pumps and air-operated double-diaphragm pumps); and Ingersoll Rand’s Precision and Science Technologies (PST) division (with respect to metering, control, and rotary gear pumps and air operated double-diaphragm pumps).
Principal competitors of the HST segment are the Thomas division of Ingersoll Rand (with respect to vacuum pumps and compressors); Parker Hannifin (with respect to sealing devices); Valco Instruments Co., Inc. (with respect to fluid injectorsconnections, degassers and valves); Alluxa (with respect to filters); Jenoptik (with respect to optical assemblies in life sciences); and Tecan Trading AG (with respect to the life science fluidics market).
The principalPrincipal competitors of the FSDP segment are Waterous Company, a unit of American Cast Iron Pipe Company (with respect to truck-mounted firefighting pumps); Holmatro, Inc. (with respect to rescue tools); Corob S.p.A. (with respect to dispensing and mixing equipment for the paint industry); and Panduit Corporation (with respect to stainless steel bands, buckles and clamping systems).
Customers
In 2022,2023, the Company did not have any customers that accounted for more than 3% of net sales. Since the Company serves a wide variety of markets, customer concentrations are not significant.
International
The Company’s products and services are available worldwide, with manufacturing operations in more than 20 countries. The businesses located outside the U.S. are primarily based in Germany, India, the Netherlands, the United Kingdom, the Netherlands, Italy, India, ChinaSwitzerland, Canada and Canada.China. The Company’s geographic diversity allows it to draw on the skills of a global workforce, provides greater stability to its operations, allows the Company to drive economies of scale, provides revenue streams that may help offset economic trends that are specific to individual economies and offers the Company an opportunity to access new markets for products. A strong foothold in these countries has allowed the Company to make great strides to expand its footprint in emerging markets, where the Company believes there is tremendous potential for growth across all segments.
The following table illustrates sales to customers within and outside the U.S. as a percentage of total sales for total IDEX as well as by segment and by reporting unit for the year ended December 31, 2022:2023:
| | Domestic | | International |
| | Domestic | | | | Domestic | | International |
| FMT | FMT | | 57% | | | 43% | | FMT | | 56% | | 44% |
| Pumps | Pumps | | 57% | | | 43% | | Pumps | | 57% | | 43% |
| Water | Water | | 58% | | | 42% | | Water | | 57% | | 43% |
| Energy | Energy | | 62% | | | 38% | | Energy | | 64% | | 36% |
| Valves | Valves | | 14% | | | 86% | | Valves | | 13% | | 87% |
| Agriculture | Agriculture | | 77% | | | 23% | | Agriculture | | 75% | | 25% |
| | HST | HST | | 48% | | | 52% | |
| HST | |
| HST | | | 44% | | 56% |
| Scientific Fluidics & Optics | Scientific Fluidics & Optics | | 49% | | | 51% | | Scientific Fluidics & Optics | | 40% | | 60% |
| Sealing Solutions | Sealing Solutions | | 24% | | | 76% | | Sealing Solutions | | 21% | | 79% |
| Performance Pneumatic Technologies | Performance Pneumatic Technologies | | 81% | | | 19% | | Performance Pneumatic Technologies | | 81% | | 19% |
| Material Processing Technologies | Material Processing Technologies | | 38% | | | 62% | | Material Processing Technologies | | 37% | | 63% |
| Micropump | | 28% | | | 72% | |
Micropump(1) | | Micropump(1) | | 21% | | 79% |
| | FSDP | |
| FSDP | |
| FSDP | FSDP | | 50% | | | 50% | | | 52% | | 48% |
| Fire & Safety | Fire & Safety | | 53% | | | 47% | | Fire & Safety | | 53% | | 47% |
| Dispensing | Dispensing | | 40% | | | 60% | | Dispensing | | 46% | | 54% |
| BAND-IT | BAND-IT | | 57% | | | 43% | | BAND-IT | | 56% | | 44% |
| | IDEX | IDEX | | 52% | | | 48% | |
| IDEX | |
| IDEX | | | 50% |
(1) Revenue from Micropump, Inc. (“Micropump”) (sold on August 3, 2023) has been included in the Company’s Consolidated Statements of Income through the date of disposition. See Note 2 in Part II, Item 8, “Financial Statements and Supplementary Data” for further detail.
Shared Services
The Company has production facilities in Suzhou, China, Vadodara, India and Ahmedabad, India that support multiple business units. The Company completed an expansion of its China facility in late 2022 and its India facility in 2023 in an effort to increase its footprint in these emerging markets as the Company believes there is tremendous potential for growth across all segments. In addition, the Company expanded its facilities in Singapore and Dubai in 2022 to support growth in Southeast Asia and the Middle East. IDEX also has personnel in China, India, Dubai, Mexico, Latin America and Singapore that provide sales, marketing, product design, engineering and sourcing support to its business units in those regions, as well as personnel in various locations in South America, Southeast Asia, the Middle East, Korea and Japan to support sales and marketing efforts in those regions.
Raw Materials
The Company uses a wide variety of raw materials which are generally purchased from a large number of independent sources around the world. The Company believes it has an adequate supply of raw materials necessary to meet demand and continues to actively manage supply chain constraints. In addition, thedemand. The Company is exposed to fluctuations in commodity pricing and inflation and attempts to control these impacts through increased prices to customers and various other programs with its suppliers.
Suppliers
The Company manufactures many of the parts and components used in its products. Substantially all materials, parts and components purchased by the Company are available from a large number of independent sources around the world. The Company believes it has a sufficient number of suppliers necessary to meet demand but continues to actively evaluate its current suppliers and identify alternative sources to manage supply chain constraints, asif needed.
Inventory and Backlog
The Company regularly and systematically adjusts production schedules and quantities based on the flow of incoming orders. During 2022, backlog was elevated as compared to pre-pandemic levels due to supply chain constraints, which both extended lead times and shifted customer order patterns as well as increased inventory to support production. However, the Company remainsis a short cycle business and backlog is not generally considered a significant factor in the Company’s business as relatively short delivery periods and rapid inventory turnover are characteristic of most of the Company’s products. Even still, the Company regularly and systematically adjusts production schedules and quantities based on the flow of incoming orders. While backlog was elevated in recent years due to global supply chain constraints, which extended lead times, shifted customer order patterns and resulted in increased inventory to support production, customer destocking efforts in 2023 have resulted in orders stabilizing with backlog and lead times returning to more normalized levels. The Company remains focused on delivering products and services to customers against an elevated backlog and continues to actively manage inventory levels. Further, with respect to order cancellations, the Company has not historically experienced significant order cancellations and does not expect significant order cancellations in the future.
Shared Services
The Company has production facilities in Suzhou, China and Vadodara, India that support multiple business units. During 2021, the Company embarked on projects to expand both the China and India facilities in an effort to increase its footprint in these emerging markets as the Company believes there is tremendous potential for growth across all segments. The China
expansion was completed in late 2022 and the India facility is expected to be completed in early 2023. IDEX also expanded its facilities in Singapore and Dubai in 2022 to support growth in South East Asia and the Middle East. In addition, IDEX has personnel in China, India, Dubai, Mexico, Latin America and Singapore that provide sales, marketing, product design, engineering and sourcing support to its business units in those regions as well as personnel in various locations in South America, South East Asia, the Middle East, Korea and Japan to support sales and marketing efforts in those regions.
Government Regulations
Our compliance with federal, state and local laws and regulations, including those related to environmental, international trade, labor and employment, human rights, tax, anti-bribery and competition matters, did not have a material effect upon our capital expenditures, earnings or competitive position during the fiscal year ended December 31, 2022.2023.
Employees
At December 31, 2022,2023, the Company had 8,868approximately 8,800 employees. Approximately 4% of its employees are covered by various collective bargaining agreements in the U.S. which will expire at various times between now and October 2026. Of those, approximately 1% of employeesJune 2028. There are covered byno collective bargaining agreements in the U.S. whichthat will expire within one year. Management believes that the Company has a positive relationship with its employees. The Company historically has been able to renegotiate its collective bargaining agreements satisfactorily, with its last work stoppage occurring in March 1993.
Human Capital Management
The Company recognizes that its success would not be possible without the valuable contributions of its workforce. Investmentworkforce and is committed to creating a work environment where employees can thrive and grow. Our workplaces promote entrepreneurialism and autonomy while providing a strong safety net of benefits, training and personal development. Investments in peopleattracting, retaining and developing great teams enables the Company to accomplish its goals and deliver innovative customer solutions. The Company’s corporate Human Capital strategy is overseen by its Chief Human Resource Officer (“CHRO”). Annually, the CHRO presents a talent review to the Company’s Board of Directors focused on senior leader team development, the human capital strategy action plan and succession planning for senior management and the general human capital strategy action plan to ensure that the Board is informed on key human capital management matters and to seek alignment on plans about human capital management for the Company’sbusiness continuity and success.
The Company’s workforce advancement strategy is focused through investment in three pillars: skill-building for the entire workforce, leadership development aligned with the Company’s methodology and fostering a greatpremier culture. The Company’s approach to performance management, talent development, talent management and employee engagement helps drive long-term value by providing employees with opportunities to do and be their best both individually and as teams:teams.
•As part of our Organizational Talent Cycle process, we conduct regular in-depth talent reviews of our workforce teams and culture with business leaders, identify “stretch” opportunities to grow team members and connect our decentralized businesses by moving skilled employees from one business unit to another as opportunities and interest arise. Employees and leaders have performance and development conversations throughout the year, talking about business and development goals, reviewing progress, recognizing accomplishments, giving balanced feedback and identifying opportunities for improvement. Open, honest dialog about performance, development and career growth supports our values of trust, teamTrust, Team and excellenceExcellence and The IDEX Difference, building trust and helping us fulfill our purpose.
•The Company offers agile development solutions to support unique needs and drive long-term value. Employees have access to resources that enhance and build capabilities for success in their current position or future roles, including specific individual development plans and local training and development programs. Each year, the Company invests in a Global Leadership Conference for senior leaders to align on strategic vision and priorities and build core leadership skills. In support of our growth strategy and culture, the Company also sponsors global leadership programsaccelerated, on-the-job learning for key leaders in our pipeline through the IDEX Academy which provides acceleratedAcademy’s global leadership development programs. These programs provide opportunities for keyemerging leaders across geographies and businesses to deepen our pipeline across multiple levels of leadership.come together to practice and apply new leadership behaviors, share best practices, solve business challenges and build strong support networks. Our learning curriculum includes instructor-led, self-paced and blended solutions that have been created internally or sourced from external partners. These offerings also help to develop future and potential leaders in the IDEX leadership methodology. Additionally, the Company sponsored over 150 senior leaders
to participate in a coaching skill-building program in 2023 with continued on-the-job performance support and reinforcement designed to accelerate the growth and development of our high-performing talent and further promote our growth culture.
•The Company also enables employee development and growth by offering eligible U.S. employees the opportunity to participate in the Tuition Reimbursement program. Through the program, employees can have certain expenses from secondary educational institutions reimbursed up to $5,250 per year.
•The Company prioritizes hiring team members who will embrace the team-driven culture and also places considerable emphasis on leveraging the talented employees within the Company’s internal pipeline, filling many leadership positions with Company employees.
•AcrossPart of the enterprise, the Company’s goalIDEX Difference is building and engaging great teams. Employee engagement is essential to achieve manufacturing company top quartile employee engagement as measured by its engagement survey.create a diverse, inclusive and equitable culture where all employees thrive and have an equal opportunity to do and be their best. We believe our employees have a high level of engagement as the Company’s employee engagement index remains above the average for manufacturing companies at 76 percent.
Employee Pay and Benefits
Attracting and retaining top talent is critical74 percent, as measured by the Company’s employee engagement survey. The Company’s investments in people have led to significant increases in favorability for career development for all employees. Additionally, the successimportant capability-building investments of the Company’s business. The Company offers a highly competitive payGlobal Leadership Conference and benefits packagecoaching programs have positively impacted senior leader perceptions of learning and development, support for employees in all the markets where it operates. The performance-based pay packages provide many employees with short-term performance incentives. The Company also provides equity-based, long-term incentivesskill and career development and increased confidence of being able to its senior leaders. In 2022, a number of the Company’s business units took proactive action with off-cycle pay rate increases for hourly employees with the onset of higher cost of living expenses associated with rising inflation. The Company regularly reviews its compensation structure and intends to adjust pay as necessary to retain key talent.
The Company’s U.S. employees can participate in a 401(k) retirement plan and an Employee Stock Purchase Plan, which allows an employee to purchase IDEX stock through payroll deductions.achieve career goals at IDEX.
Diversity, Equity & Inclusion
The Company has always recognized diversity as foundational to creativity and resilience; the three pillars of Innovation, Diversity and Excellence form the acronym that is the Company’s name, IDEX. Gender, ethnic, cultural and other human diversity is critical to the Company’s success.
In 2022, the Company launched its Diversity, Equity and Inclusion (“DEI”) strategic roadmap. To prepare leadershipIn 2023, progress against the strategic roadmap included: (1) implementation of mentoring based on employee resource groups (“ERGs”) and talent development networks; (2) delivery of Inclusive Leadership Training; (3) increased participation in IDEX ERGs; (4) continuation of IDEX’s performance-based DEI goals for the launch, executives participated insenior leaders; and (5) expansion of talent development and recruiting efforts.
IDEX has built a day-long strategy and development session which includedreputation as a cultural competence assessment and personal feedback for all senior leaders. The Company also: 1) establishedrespected employer with a Corporate DEI team; 2) embedded DEI initiatives into Executive Leadership Team compensation and goals; 3) launched an Inclusive Leader Development approach; 4) expanded diverse talent recruiting outreach efforts; and 5) established key DEI partnerships. welcoming culture, where 80% of employees feel a strong sense of belonging, according to our 2023 employee engagement survey.
The Company’s Board of Directors and CEO regularly review DEI progress.
The Company has also enhanced the diversity of the Board of Directors in the last year and the Board now comprises 30% women and 30% members who identify with racial/ethnic minority groups.
Additionally, the Company has increased representation for bothof women and racially/ethnically diverse individuals in leadership roles.at the Company remained steady in 2023. From 20212022 to 2022,2023, and as of December 31, 2022,2023, the numberpercentage of women globally in senior leadership roles increased from 28% toremained constant at 31% and the number. The percentage of women globally in people managerleadership roles increased from 21% toremained at 22%. In addition,During the same time period, and also as of December 31, 2022,2023, the number of racial/ethnic minority senior leaders in the U.S. increased from 18%21% to 21%22%, and the number of racial/ethnic minority people managers in the U.S. held atincreased from 19% year over year.to 20%. The foregoing representation numbers do not include employee populations associated with acquisitions completed in 2021 or 2022.2023.
Further, the Company has conducted pay equity analyses for U.S. employees since 2018 to ensure that employees’ actual pay was substantially similar to their predicted pay. Where appropriate, the Company provided base pay adjustments for employees that were outliers from their predicted pay, further reinforcing the Company’s commitment to diversity and a culture of inclusion, equality and respect.
Employee Pay and Benefits
Attracting and retaining top talent is critical to the success of the Company’s business. The Company offers a highly competitive pay and benefits package for employees in all the markets where it operates. The performance-based pay packages provide many employees with short-term performance incentives. The Company also provides equity-based, long-term incentives to its senior leaders.
The Company’s U.S. employees can participate in a 401(k) retirement plan and an Employee Stock Purchase Plan, which allows an employee to purchase IDEX stock through payroll deductions.
Workplace Health & Safety
The Company is committed to providing a workplace that is safe for all of our employees, contractors, business partners and visitors. The commitment to Environmental, Health, and Safety (“EH&S”) begins at the corporate and executive level. The program is overseen by the EH&S Senior Director and the Chief ComplianceSustainability Officer, both of whom are part of the Legal Department. Each of the Company’s businesses employ local EH&S specialists. These individuals and local safety committees, in conjunction with the corporate team, form the basis of the global EH&S program. The Company’s corporate EH&S policies are a key part of the global EH&S program. They apply to all of the Company’s businesses and each business is expected to comply with policies and all EH&S laws and regulations. In addition to the corporate policies, each business develops and implements its own health and safety policies tailored to the local business.
The Company also encourages employees enrolled in the U.S. Healthcare Benefit Plan to participate in the third-party operated Wellness Program which provides access to annual biometric screenings, health evaluations and wellness credits that can be earned for meeting individual wellness goals each year. In addition, a number of the business units organize complementary wellness programs, including walking clubs, health fairs and “lunch and learns” with nutritionists for their employees.
Worker Rights and Protection
The Company believes that a respectful workplace is free from unlawful discrimination and harassment, and this involves more than just compliance with the law. The Company strives to create a work environment that is free of inappropriate and
unprofessional behavior and consistent with the Company’s values – a place where everyone is invited to do their best every day and feel free to report any concerns. The Company has policies, procedures and regular training in place to protect its workforce and prevent workplace harassment and discrimination. This includes a global Code of Business Conduct & Ethics policy where employees agree to follow and receive annual training. The Company also maintains a global hotline where employees are encouraged (and can choose to remain anonymous) to report any concerns or issues.
Information about Our Executive Officers
Set forth below are the names of the executive officers of the Company, their ages, years of service, the positions held by them and their business experience.
| | Name | Name | | Age | | Years of
Service | | Position | Name | | Age | | Years of
Service | | Position |
| Eric D. Ashleman | Eric D. Ashleman | | 55 | | 14 | | Chief Executive Officer and President | Eric D. Ashleman | | 56 | | 15 | | Chief Executive Officer and President |
| William K. Grogan | | 44 | | 11 | | Senior Vice President and Chief Financial Officer |
| Abhishek Khandelwal* | | Abhishek Khandelwal* | | 47 | | 11 | | Senior Vice President and Chief Financial Officer |
| Lisa M. Anderson | Lisa M. Anderson | | 46 | | 6 | | Senior Vice President, General Counsel and Corporate Secretary | Lisa M. Anderson | | 47 | | 7 | | Senior Vice President, General Counsel and Corporate Secretary |
| Melissa S. Flores | Melissa S. Flores | | 40 | | 12 | | Senior Vice President and Chief Human Resources Officer | Melissa S. Flores | | 41 | | 13 | | Senior Vice President and Chief Human Resources Officer |
| Marc Uleman | | 59 | | 11 | | Senior Vice President, Group Executive, Health & Science Technologies |
| Roopa Unnikrishnan | Roopa Unnikrishnan | | 51 | | 1 | | Senior Vice President, Strategy and Corporate Development | Roopa Unnikrishnan | | 52 | | 2 | | Senior Vice President, Strategy and Corporate Development |
*Mr. Khandelwal rejoined IDEX in November 2023 after previously serving in various roles from 2010 to 2020.
Mr. Ashleman has served as President and Chief Executive Officer since December 2020. Prior to that, Mr. Ashleman was Senior Vice President and Chief Operating Officer from July 2015 to December 2020, Vice President-Group Executive of the Company’s HST and FSDP segments from January 2014 through July 2015 and President-Group Executive of the Company’s FSDP segment from 2011 through January 2014. Mr. Ashleman joined IDEX in 2008 as the President of Gast Manufacturing.
Mr. GroganKhandelwal has served as Senior Vice President and Chief Financial Officer since January 2017.November 2023. Prior to that,rejoining IDEX, Mr. GroganKhandelwal served as Chief Financial Officer of Multi-Color Corporation, a manufacturer of printed labels for consumer goods, from January 2022 through November 2023, and as Senior Vice President and Chief Financial Officer of CIRCOR International, a pump & valve systems and custom engineering & design company, from April 2020 through December 2021. From 2010 through March 2020, Mr. Khandelwal held a number of senior finance roles within IDEX, serving most recently as Vice President of Finance Operations, from July 2015 through January 2017. From January 2012 through July 2015, Mr. Grogan was Vice President-FinanceTreasury and Financial Planning & Analysis for the Company’s HST and FSDP segments.Company.
Ms. Anderson has served as Senior Vice President, General Counsel and Corporate Secretary since February 2022. Prior to that, Ms. Anderson served as Vice President, Associate General Counsel and Assistant Secretary from December 2017 through February 2022 after joining IDEX as Assistant General Counsel in October 2016. Prior to joining IDEX, Ms. Anderson served
in various roles of increasing responsibility at SunCoke Energy, Inc., most recently as Senior Counsel and Deputy Chief Compliance Officer.
Ms. Flores has served as Senior Vice President and Chief Human Resources Officer since February 2021. Prior to that, Ms. Flores served as Global, Vice President Talent from May 2019 through February 2021. From February 2018 through May 2019, Ms. Flores was Group Vice President Human Resources. Prior to that she served as Vice President, Talent Management and Development from March 2017 to February 2018, after being promoted from Director, Talent Development, a position she served in from March 2015 to March 2017.
Mr. Uleman has served as Senior Vice President, Group Executive, HST since October 2022. Prior to that, Mr. Uleman served as Group President HST from September 2018 to October 2022 and Group President Diversified from February 2015 to September 2018. Mr. Uleman joined IDEX in January 2012 as President of Global Dispensing.
Ms. Unnikrishnan has served as Senior Vice President, Strategy and Corporate Development since March 2022. Prior to that, Ms. Unnikrishnan served as the Chief Strategy Officer of Vontier from October 2020 to July 2021. From September 2016 to October 2020, Ms. Unnikrishnan was Vice President of Strategy at Harman International. Prior to her time at Harman, Ms. Unnikrishnan led Center10 Consulting and served as Managing Director at Blackrock and Vice President of Corporate Strategy at Pfizer.
The Company’s executive officers are elected at a meeting of the Board of Directors immediately following the annual meeting of stockholders, and they serve until the meeting of the Board immediately following the next annual meeting of stockholders, or until their successors are duly elected and qualified or until their death, resignation or removal.
Public Filings
Copies of the Company’s annual report on Form 10-K, quarterly reports on Form 10-Q, current reports on Form 8-K and amendments to those reports are made available free of charge at www.idexcorp.com as soon as reasonably practicable after being filed electronically with the United States Securities and Exchange Commission (the “SEC”). The Company’s reports are also available free of charge on the SEC’s website, www.sec.gov. Information on the Company’s website is not incorporated into this Form 10-K.
Item 1A. Risk Factors.
For an enterprise as diverse and complex as the Company, a wide range of factors present risks to the Company and could materially affect future developments and performance. In addition to the factors affecting specific business operations identified in connection with the description of the Company’s operations and the financial results of its operations elsewhere in this report, the most material of these factors are included below. Current global economic events and conditions may amplify many of these risks. These risks are not the only risks that may affect the Company. Additional risks that the Company is not aware of or does not believe are material at the time of this filing may also become important factors that adversely affect the Company’s business.
Risks Related to the Company’s Operations
The Company’s Inability to Continue to Develop New Products Could Limit Sales Growth.
The Company’s ability to continue to grow organically is tied in large part to its ability to continue to develop new products. A failure to continue to develop and deliver new, innovative and competitive products to the market could limit sales growth and negatively impact the Company and its financial condition, results of operations and cash flow.
The Company’s Growth Strategy Includes Acquisitions and the Company May Not be Able to Make Acquisitions of Suitable Candidates or Integrate Acquisitions Successfully.
The Company’s historical growth has included, and the Company’s future growth is likely to continue to include, acquisitions. The Company intends to continue to seek acquisition opportunities both to expand into new markets and to enhance its position in existing markets throughout the world. The Company may not be able to successfully identify suitable candidates, negotiate appropriate acquisition terms, obtain financing needed to consummate those acquisitions, complete proposed acquisitions or successfully integrate acquired businesses into its existing operations. In addition, any acquisition, once successfully integrated, may not perform as planned, be accretive to earnings, or otherwise prove beneficial to the Company.
Acquisitions involve numerous risks, including the assumption of undisclosed, uninsured or unindemnified liabilities,liabilities; difficulties in the assimilation of the operations, technologies, services and products of the acquired companies and the diversion of management’s attention from other business concerns. In addition, prior acquisitions have resulted in, and future acquisitions could result in, the incurrence of substantial additional indebtedness and other expenses.
The Markets Served by the Company are Highly Competitive and this Competition Could Reduce Sales and Profit Margins.
Most of the Company’s products are sold in competitive markets. Maintaining and improving a competitive position will require continued investment in manufacturing, engineering, quality standards, marketing, technology, customer service and support and distribution networks. The Company may not be successful in maintaining its competitive position. The Company’s competitors may develop products that are superior, may develop methods of more efficiently and effectively providing products and services or may adapt quicker to new technologies or evolving customer requirements. Additionally, the Company’s competitors may adopt new technologies and technological advancements using artificial intelligence and machine learning to pursue new products and approaches more quickly, successfully and effectively than the Company. The Company may not be able to compete successfully with existing competitors or with new competitors. Pricing pressures may require the Company to adjust the prices of products to stay competitive. Failure to continue competing successfully could reduce sales, profit margins and overall financial performance.
The Company is Dependent on the Availability of Raw Materials, Parts and Components Used in Its Products and Changes in Supply of, or Price for, Raw Materials, Parts and Components May Materially Adversely Affect the Company.
While the Company manufactures certain parts and components used in its products, the Company also requires substantial amounts of raw materials and purchases certain parts and components from suppliers. The availability of and prices for raw materials, parts and components may be subject to curtailment or change due to, among other things, suppliers’ allocations to other purchasers, interruptions in production by suppliers, including due to geopolitical or civil unrest, unfavorable economic or industry conditions, labor disruptions, supply chain disruptions, catastrophic weather events, natural disasters, the occurrence of a contagious disease or illness,public health concerns, changes in exchange rates and prevailing price levels. Any change in the supply of, or price for, these raw materials or parts and components could materially affect the Company and its financial condition, results of operations and cash flow.
The Company and its Results of Operations and Financial Condition Have Been and May Continue To Be Materially Adversely Impacted by Public Health Conditions, Including Epidemics or Pandemics Such as COVID-19.
The Company faces various risks related to public health issues, including epidemics, pandemics and other outbreaks, including the global outbreak of the COVID-19 pandemic.
The ongoing COVID-19 pandemic continues to be a rapidly-changing situation that has negatively impacted and could continue to negatively impact the global economy. The impact of COVID-19, including changes in consumer behavior, pandemic fears, market downturns and restrictions on business and individual activities, has periodically created significant volatility in the global economy. There have been extraordinary actions taken by international, federal, state and local public health and governmental authorities to contain and combat the outbreak and spread of COVID-19 in regions throughout the world, including travel bans, quarantines, “stay-at-home” orders and similar mandates for many individuals to substantially restrict daily activities and for many businesses to curtail or cease normal operations. Any changes in or resurgence of COVID-19, or any other widespread public health conditions, could have a material impact on the Company’s ability to get the raw materials, parts and components it needs to manufacture its products as its suppliers face disruptions in their businesses, closures or bankruptcy as a result of COVID-19 or other widespread public health conditions. The Company depends greatly on its suppliers for items that are essential to the manufacturing of its products. If its suppliers fail to meet its manufacturing needs in the future, it would delay the Company’s production and product shipments to customers and negatively affect operations. Further, as new strains or variants of COVID-19 or other viruses, diseases or public health conditions develop or if sufficient amounts of vaccines or treatments are not available, not widely administered or otherwise prove ineffective, the impact of a widespread public health condition on the global economy, and in turn, our financial condition and operating results could be material.
The impacts of the COVID-19 pandemic or any future widespread public health conditions may impact our employees’ ability to work in proximity to others or travel for work. Due to large remote workforce populations resulting from COVID-19 or other widespread public health conditions, the Company may also face informational technology infrastructure and connectivity issues from the vendors that it relies on for certain information technologies to administer, store and support the Company’s multiple business activities. IDEX is heavily dependent on the availability and support of its technology landscape, several of which are provided by external third party service providers (e.g., Microsoft, AT&T and Verizon). Although the Company has not suffered any disruptions to date, any future disruptions in their operations could also negatively impact the Company and its operating results and financial condition.
To the extent COVID-19 or any future widespread public health conditions adversely affects the Company and its financial results, they may also have the effect of heightening many of the other risks described in Item 1A, “Risk Factors” of this annual report, such as those relating to international operations, the Company’s ability to develop new products, the Company’s ability to execute on its growth strategy of acquisitions, the Company’s dependency on raw materials, parts and components, the effects on movements in foreign currency exchange rates on the Company, the effects on the Company that result from declines in commodity prices and the Company’s reliance on labor availability to operate and grow the business.
The Company’s Business Operations May Be Materially Adversely Affected by Information Systems Interruptions or Intrusion, Including those Arising From Cybersecurity Attacks or Incidents.Incidents or Violations of Laws Regulating Privacy and Data Security.
The Company depends on various internal and third party information technologies to administer, store, process and transmit electronic information (including sensitive or controlled data such as confidential business information and personal data relating to employees, customers and other business partners) and to support a variety of critical business activities. Our business has an increasing reliance on IT systems and a growing digital footprint as a result of changing technologies, increasing connected devices and digital offerings, and an increase in remote and hybrid workforce populations. Additionally, some of our products contain computer hardware and software and offer the ability to connect to computer networks. Our customers, including government customers, are also requiring cybersecurity protections and mandating cybersecurity standards for our businesses with more frequency. If thesethe Company’s systems, (ortechnologies, products or services (including those we acquire through business acquisitions), or the systems, technologies, products or services of the Company’s customers or third-party hosting services)services (including third-party data centers and cloud platforms upon which we rely), are damaged or cease to function properly, or if the Company or third-party hosting service systems are subject to deliberate cyber-security attacks, such as those involving unauthorized access or malicious software, or unintentional cybersecurity incidents, such as those involving systems misconfigurations, misuse or human error and/or other intrusions, the Company, its operating results and financial condition could be materially adversely impacted. These impacts could include production downtimes, operational delays or other detrimental impacts on operations or the ability to provide products and services to its customers; the compromise, destruction, corruption or theft of confidential or otherwise protected information, data or intellectual property; security breaches; other manipulation or improper use of the Company’s systems or networks; financial losses from fraudulent transactions; financial losses from remedial actions; loss of business or potential liability; adverse media coverage; legal claims or legal proceedings including regulatory investigations, actions, penalties or fines, including those arising from the violation of any applicable data privacy laws; and/or damage to the Company’s reputation. While we have experienced, and expect to continue to experience, these types of threats and incidents, based on our analysis at this time, we have not experienced a cybersecurity threat or incident that we believe has or is reasonably likely to materially affect the Company.
As a global organization, we are also subject to data privacy and security laws, regulations and customer-imposed controls in numerous jurisdictions as a result of having access to and processing confidential, personal and/or sensitive data in the course of our business. Governmental investigations and enforcement actions can be costly and interrupt the regular operations of our business, and data breaches or violations of data privacy laws can result in civil and criminal, monetary and non-monetary penalties and damages to our reputation, any of which may adversely affect our business and financial statements. As cybersecurity threats continue to evolve and as cybersecurity and data protection laws and regulations continue to develop globally, we expect to expend additional resources to continue to develop our compliance programs, strengthen our information security, data protection, disaster recovery and business continuity measures, and investigate and remediate vulnerabilities.
There has been a rise in the number of cyberattacks targeting confidential business information generally and in the manufacturing industry specifically by both state-sponsored and criminal organizations. Moreover,These may include such things as denial of service attacks, introduction of ransomware or other malicious software programs, and other disruptive problems. In addition, there has been a rise in the number of cyberattacks that depend on human error or manipulation, including phishing attacks or schemes that use social
engineering to gain access to systems or perpetuate wire transfer or other frauds. Moreover, the rapid evolution and increased adoption of artificial intelligence technologies may intensify our cybersecurity risks. These trends increase the likelihood of such events occurring as well as the costs associated with protecting against such attacks.occurring.
The Company regularly identifies, defends against and responds to cyber threats and security incidents. While the Company attempts to mitigate thesecybersecurity risks by employing a number of measures, including employee training, technical security controls and maintenance of certain backup and protective systems, the Company’s systems, networks, products and services remain potentially vulnerable to known or unknown threats or other intrusions, and there are risks that our cybersecurity defenses will be insufficient to fully mitigate cyber risks and losses related to cybersecurity events, any of which could havemay result in a material adverse effect on the Company and its financial condition or results of operations. Moreover, until we have migrated businesses we acquire onto our IT systems or ensured compliance with our information technology and cybersecurity standards, we have in the past and may in the future face additional risks because of the continued use of predecessor IT systems, procedures and cybersecurity risk mitigation measures. Given the unpredictability, nature and scope of cyber-securitycybersecurity attacks and incidents, it is possible that potential vulnerabilities could go undetected for an extended period, and it could take considerable time for the Company to obtain full and reliable information as to the extent, amount and type of information and/or systems compromised. Any imposition of liability, particularly liability that is not covered by insurance or is in excess of our insurance coverage, could materially adversely harm our operating results and financial condition.
Uncertainty Related to Environmental Regulation, and Industry Standards, or Other Risks Associated with a Potential Global Transition to a Lower-Carbon Economy, as well as Physical Risks of Climate Change, Could Adversely Impact the Company's Results of Operations and Financial Position.
Increased public awareness and concern regarding environmental risks, including global climate change and the potential global transition to a lower-carbon economy, may result in more international, regional, federal and/or federalstate requirements or industry standards to reduce or mitigate global warming and other environmental risks. New climate change laws and regulations could require the Company to change its manufacturing processes or obtain substitute materials that may cost more or be less available for its manufacturing operations. For example, variousVarious jurisdictions in which the Company does business have implemented, or in the future could implement or amend, restrictions on emissions of carbon dioxide or other greenhouse gases, taxation of or caps on the use of carbon-based energy, limitations or restrictions on water use, limitations or restrictions on the production of single use plastics, regulations on energy management and waste management and other rules and regulations to address climate change and other environmental risks, which may increase the Company’s expenses and adversely affect its operating results. In addition to changes in regulations or industry standards, a failure by the Company to innovate and adapt products to new markets, changing customer preferences for higher-efficiency products, or increasing scrutiny around fossil fuels usage could limit sales growth and negatively impact the Company and its financial condition, results of operations and cash flow.
In addition, theThe physical risks of climate change are highly uncertain and differ in the geographic regions in which the Company operates. These physical risks, including wildfires, rising sea levels, floods and other extreme weather events, may impact the availability and cost of materials, sources and supply of energy, product demand and manufacturing and could increase insurance and other operating costs. Any future increased worldwide regulatory activity relating to climate change could expand the nature, scope and complexity of matters that the Company is required to control, assess and report. If environmental laws or regulations or industry standards are either changed or adopted and impose significant operational restrictions and compliance requirements upon the Company, its suppliers, its customers or its products, or the Company's operations are disrupted due to physical impacts of climate change on the Company, its customers or its suppliers, the Company's business, results of operations and financial condition could be adversely impacted. Further, any failure to adequately address stakeholder expectations or to achieve previously announced initiatives or goals with respect to sustainability or environmental, social and governance matters may adversely impact our reputation, business, financial condition and results of operations.
Business Disruptions Due to Catastrophic Weather Events, Natural Disasters and Public Health Threats Could Adversely Affect the Company.
The Company faces various risks related to the occurrence of catastrophic weather events or significant natural disasters, including earthquakes, wildfires, droughts, fires, power-outages or other catastrophic events, in areas in which we have manufacturing facilities or from which we obtain products. Severe weather conditions, including any that may be caused or exacerbated by global climate change, may cause physical damage to our properties, closure of one or more of our manufacturing or distribution facilities, lack of an adequate work force in a market, temporary disruption in the supply of inventory, disruption in the transport of products and utilities and delays in the delivery of products to our customers.
Additionally, public health threats may negatively impact the global economy by causing changes in consumer behavior, market downturns, restrictions on business and individual activities and increased volatility. Any widespread public health threats could have a significant impact on the Company’s supply chain, such as the Company experienced during the global outbreak of the COVID-19 pandemic.
To the extent that any of the foregoing adversely affect the Company and its financial results, they may also have the effect of heightening many of the other risks described in Item 1A, “Risk Factors” of this annual report, such as those relating to international operations, the Company’s ability to develop new products, the Company’s ability to execute on its growth strategy of acquisitions, the Company’s dependency on raw materials, parts and components, the effects on movements in foreign currency exchange rates on the Company, the effects on the Company that result from declines in commodity prices and the Company’s reliance on labor availability to operate and grow the business.
Risks Related to Economic and Political Conditions
A Slowdown in the U.S. or International Economy Could Materially Adversely Affect the Sales and Profitability of the Company’s Businesses.
In 2022, 52%2023, 50% of the Company’s sales were derived from domestic operations while 48%and 50% were derived from international operations. The Company’s largest end markets include industrial, semiconductor, automotive,fire and safety, energy, life sciences, water and wastewater treatment, semiconductor, automotive, analytical instruments, food and pharma,fire & safety,energy,pharmaceuticals, paint,chemical processing,agriculture and water and wastewater treatment.chemical
processing. A slowdown in the U.S. or global economy and, in particular, any of these specific end markets could materially reduce the Company’s sales and profitability.
Changes to Geopolitical and Economic Conditions in the U.S. and Foreign Countries in Which the Company Operates Could Adversely Affect the Company.
The Company expects international operations and export sales to continue to be significant for the foreseeable future. The Company’s sales from international operations and sales from export are both subject in varying degrees to risks inherent in doing business outside the U.S. These risks include the following:
•possibility of unfavorable circumstances arising from host country laws or regulations and the risks related to required compliance with local laws;
•risks of economic instability, including due to inflation;
•currency exchange rate fluctuations and restrictions on currency repatriation;
•potential negative consequences from changes to taxation policies;
•disruption of operations from labor and political disturbances;
•withdrawal from or renegotiation of international trade agreements and other restrictions on the trade between the United States and other countries;
•the effects of the Trade and Cooperation Agreement between the European Union, the European Atomic Energy Community and the United Kingdom that went into force on May 1, 2021, following the United Kingdom’s decision to exit the European Union, and other long term economic, legal, political and social implications of the United Kingdom’s exit from the European Union;
•the imposition of and changes in the United States’ and other governments’ trade regulations, trade wars, tariffs and other trade barriers, including as a result of geopolitical developments (such as escalating tensions in the Middle East) and relations between the United States and China and the United States and Russia; and
•geopolitical events, including natural disasters, catastrophic weather events, climate change, public health conditions, including epidemics, pandemics and other outbreaks (such as the global outbreak of the COVID-19 pandemic), political instability or other geopolitical events, including civil or political unrest, (such as the current conflict between Ukraine and Russia), terrorism, insurrection or war.
Any of these events could have a materially adverse impact on the Company and its operations.
Significant Movements in Foreign Currency Exchange Rates May Harm the Company’s Financial Results.
The Company is exposed to fluctuations in foreign currency exchange rates, particularly with respect to the Euro, Swiss Franc, Canadian Dollar, British Pound, Indian Rupee, Chinese Renminbi, Swedish Krona and Brazilian Real. Any significant change in the value of the currencies of the countries in which the Company does business against the U.S. Dollar could affect the Company’s ability to sell products competitively and control its cost structure, which could have a material adverse effect on results of operations. For additional detail related to this risk, see Part II, Item 7A, “Quantitative and Qualitative Disclosures About Market Risk.”
Fluctuations in Interest Rates Could Adversely Affect the Company’s Results of Operations and Financial Position.
The Company’s profitability may be adversely affected during any periods of unexpected or rapid increases in interest rates. The Company maintains a Credit Agreement with botha revolving credit facility (the “Revolving Facility”) in an aggregate principal amount of $800 million and a term facility and revolving credit facility (the “Term Facility”) in an aggregate principal amount of $200 million (together, the “Credit Facility”), which bears interest at either an alternate base rate or adjusted Term SOFR (or appropriate alternative currency reference rates) plus, in each case, an applicable margin based on the lower of the Company’s senior, unsecured, long-term debt rating or the Company’s applicable leverage ratio. A significant increase in Term SOFR or the other rates the Company has agreed to use as an alternative to Term SOFR (should Term SOFR become unavailable) under the Credit Facility, as amended, would significantly increase the Company’s cost of borrowings. Further, any changes in regulatory standards or industry practices, such as the discontinuation of the use of Term SOFR and/or the transition to alternative benchmark rates may result in the usage of higher interest rates under the Credit Facility, and the Company’s current or future indebtedness may be adversely affected. The Company is also exposed to risks if the U.S. Federal Reserve raises its benchmark interest rate, which may reduce the availability of and increase the cost of obtaining new debt and refinancing existing indebtedness. For additional detail related to this risk, see Part II, Item 7A, "Quantitative and Qualitative Disclosures About Market Risk."
A Significant or Sustained Decline in Commodity Prices, Including Oil, Could Negatively Impact the Levels of Expenditures by Certain of the Company’s Customers.
Demand for the Company’s products depends, in part, on the level of new and planned expenditures by certain of its customers. The level of expenditures by the Company’s customers is dependent on, among other factors, general economic conditions, availability of credit, economic conditions within their respective industries and expectations of future market behavior. Volatility in commodity prices, including oil, can negatively affect the level of these activities and can result in postponement of capital spending decisions or the delay or cancellation of existing orders. The ability of the Company’s customers to finance capital investment and maintenance may also be affected by the conditions in their industries. Reduced demand for the Company’s products could result in the delay or cancellation of existing orders or lead to excess manufacturing capacity, which unfavorably impacts the absorption of fixed manufacturing costs. This reduced demand could have a material adverse effect on the Company and its financial condition and results of operations.
Risks Related to Legal, Accounting and Regulatory Matters
An Unfavorable Outcome of Any Pending Contingencies or Litigation Could Adversely Affect the Company.
The Company is currently involved in pending and threatened legal, regulatory and other proceedings arising in the ordinary course of business. These proceedings may pertain to matters such as product liability or contract disputes, and may
also involve governmental inquiries, inspections, audits or investigations relating to issues such as tax matters, intellectual property, environmental, health and safety issues, governmental regulations, employment and other matters. Where it is reasonably possible to do so, the Company accrues estimates of the probable costs for the resolution of these matters. These estimates are developed in consultation with outside counsel and are based upon an analysis of potential results and the availability of insurance coverage, assuming a combination of litigation and settlement strategies. It is possible, however, that future operating results for any particular quarter or annual period could be materially affected by changes in assumptions, the continued availability of insurance coverage or the effectiveness of the Company’s strategies related to these proceedings. For additional detail related to this risk, see Item 3, “Legal Proceedings” and Note 1110 in Part II, Item 8, “Financial Statements and Supplementary Data.”
Failure to Adequately Protect the Company’s Intellectual Property and the Risk of Disputes Involving Intellectual Property Infringement Could Adversely Impact the Company’s Competitive Position, Results of Operations, and Financial Condition.
The Company owns patents, trademarks, licenses and other forms of intellectual property related to its products and continuously invests in research and development that may result in technological innovations and general intellectual property rights. The Company employs various measures to develop, maintain and protect its intellectual property rights. If these measures are not effective, or if the Company’s intellectual property is otherwise infringed, challenged, invalidated or circumvented, the Company may face adverse impacts to its results of operations and/or financial condition. Further, if intellectual property is infringed, challenged, invalidated or circumvented, this could reduce barriers to entry into the Company’s existing lines of business and may result in a loss of market share and adversely impact the Company’s competitive position. Additionally, the Company has registered intellectual property in multiple countries, and the Company’s ability to protect and enforce its intellectual property rights may be limited in foreign countries due to differences in intellectual property protections or proprietary rights laws. If the Company’s intellectual property is infringed, challenged, invalidated or circumvented due to these lesser protections, the Company may face adverse impacts to its results of operations, financial condition and/or competitive position.
Litigation may be necessary to enforce the Company’s intellectual property rights or to defend against infringement claims by third parties. Any litigation or claims brought by the Company could result in costs and diversion of resources, which could adversely affect the Company’s results of operations and/or financial condition. Any intellectual property litigation or claims brought against the Company may lead to litigation expenses, diversion of resources, losses or licensing expenses or the cessation of selling certain products, any of which could adversely affect the Company’s results of operations and/or financial condition.
The Company’s Intangible Assets, Including Goodwill, are a Significant Portion of Total Assets and a Write-off of Intangible Assets or Goodwill Would Adversely Impact the Company’s Operating Results and Significantly Reduce the Company’s Net Worth.
The Company’s total assets reflectincludes substantial intangible assets, primarily goodwill and identifiable intangible assets.assets, which primarily result from acquisitions. At December 31, 2022,2023, goodwill and intangible assets totaled $2,838.3 million and
$2,638.11,011.8 million, and $947.8 million, respectively. These assets primarily result from acquisitions, representing the excess of the purchase price over the fair value of the tangible net assets acquired. Annually, or when certain events occur that require a more current valuation, the Company assesses whether there has been an impairment in the value of goodwill and identifiable intangible assets. If future operating performance at one or more of the Company’s reporting units were to fall significantly below forecasted levels, the Company could be required to reflect, under current applicable accounting rules, a non-cash charge to operating income for an impairment. Any determination requiring the write-off of a significant portion of goodwill or identifiable intangible assets would adversely impact the Company’s results of operations and net worth. See Note 6 in Part II, Item 8, “Financial Statements and Supplementary Data” for further discussion on goodwill and intangible assets.
The Company May Face Adverse Effects Resulting from Improper Conduct by Our Employees, Agents or Business Partners.
While we strive to maintain high standards, the Company cannot guarantee that our internal controls and compliance systems will always protect us from reckless or criminal acts committed by employees, agents or business partners of ours (or businesses that we acquire or partner with) that would violate laws in the U.S. or foreign countries in which the Company operates, including laws governing payment to government officials, bribery, fraud, conflicts of interest, competition, employment practices and workplace behavior, export and import compliance, economic and trade sanctions, money laundering and data privacy.
In particular, recent years have seen a substantial increase in anti-bribery law enforcement activity with more frequent and aggressive investigations and enforcement proceedings by both the Department of Justice and the SEC, increased enforcement
activity by non-U.S. regulators and increases in criminal and civil proceedings brought against companies and individuals. The Company’s policies mandate compliance with all anti-bribery laws, including the U.S. Foreign Corrupt Practices Act, the U.K. Bribery Act and similar anti-bribery laws in other jurisdictions which generally prohibit companies and their intermediaries from making improper payments for the purpose of obtaining or retaining business. However, the Company operates in certain countries that are recognized as having governmental and commercial corruption. Violations of any of these laws may result in criminal or civil sanctions or penalties, both monetary and non-monetary, increased costs of compliance and/or damage to our reputation, any of which could have a material adverse effect on the Company and its financial condition and results of operations.
General Risk Factors
The Company’s Success Depends on ItsA Failure to Retain Executive Management and Other Key Personnel.Personnel or Recruit Adequate Successors May Adversely Affect the Company’s Operations and Implementation of Strategy.
The Company’s future success depends to a significant degree on the skills, experience and efforts of its executive management and other key personnel and their ability to provide the Company with uninterrupted leadership and direction. The loss of the services of any of the executive officers or other key personnel or a failure to provide adequate succession plans for key personnelthese individuals could have an adverse impact on the Company.Company’s operations and implementation of its strategic plan. The availability of highly qualified talent is limited and the competition for talent is robust. However, the Company provides long-term equity awards and certain other benefits for its executive officers which provides incentives for them to make a commitment to the Company. The Company’s future success will depend on its ability to have adequate succession plans in place and to attract, retain and develop qualified personnel. A failure to efficiently replace executive management members and other key personnel and to attract, retain and develop new qualified personnel could have an adverse effect on the Company’s operations and implementation of its strategic plan.
Challenges with Respect to Labor Availability Could Negatively Impact the Company’s Ability to Operate or Grow the Business.
The Company’s success depends in part on the ability of its businesses to proactively attract, motivate and retain a qualified and highly skilled workforce in an intensely competitive labor market. A failure to attract, motivate and retain highly skilled personnel could adversely affect the Company’s operating results or its ability to operate or grow the business. Additionally, any labor stoppages or labor disruptions, including due to geopolitical unrest, unfavorable economic or industry conditions, catastrophic weather events, natural disasters or the occurrence of a contagious disease or illnesspublic health threats could adversely affect the Company’s operating results or its ability to operate or grow the business.
Item 1B. Unresolved Staff Comments.
None.
Item 1C. Cybersecurity.
Risk Management and Strategy.
The Company’s cybersecurity program is designed to be aligned to the Cybersecurity Framework published by the National Institute of Standards and Technology (“NIST CSF”). While we use the NIST CSF as a guide, this does not imply that we meet any particular standards, specifications or requirements. We conduct regular internal and external assessments of our information security and cybersecurity programs, including periodic external audits for company-wide compliance with our program as well as specific business unit alignment, as required, with U.S. federal acquisition regulations and UK Cyber Essentials certifications. An external penetration test is performed annually against the Company’s network, in addition to our regular internal vulnerability scans.
The Company’s internal Incident Response Policy sets forth specific protocols for cyber or data incident identification, detection, response and recovery. This process includes the assembly of a response team consisting of internal and external technical and legal experts immediately upon the event of a cyberattack or incident. The Company reviews and updates this process regularly, including by engaging in tabletop exercises to simulate cybersecurity and data breach incidents. The Company maintains global cybersecurity insurance coverage that is reviewed annually for adequacy against operations and information systems.
The Company has implemented a number of measures to mitigate cybersecurity risk in its operations, including annual cybersecurity awareness training for employees, regular internal phishing exercises, technical security controls, maintenance of certain backup and protective systems, physical and system securities measures, and data security protocols. Once fully integrated, all of our businesses have access to a “cyber risk dashboard” that monitors various risk indicators. The cyber risk dashboard is monitored by our business units. The Company’s internal auditors periodically review and audit various processes and controls throughout the organization related to cybersecurity readiness.
The Company also has certain processes in place to manage cyber risks associated with third-party service providers which include various technical as well as contractual measures.
For more information on cybersecurity risks and how they affect our business, operating results and financial condition, please refer to Item 1A., “Risk Factors – The Company’s Business Operations May Be Materially Adversely Affected by Information Systems Interruptions or Intrusion, Including those Arising From Cybersecurity Attacks or Incidents or Violations of Laws Regulating Privacy and Data Security.” Based on our analysis at this time, we have notidentifiedany risks from a cybersecurity threat or incident that we believe has or is reasonably likely to materially affect the Company.
Governance, Oversight and Leadership.
The Board and the Audit Committee oversee management’s efforts to address cybersecurity and information security risks. Senior management provides the Board updates on the Company’s cybersecurity program at least once a year, including as part of the Company’s enterprise risk management assessment, and the Audit Committee reviews the cybersecurity program at least twice a year and on an as-needed basis. Such reviews, among other things, include the results of internal and/or external assessments, a review of cybersecurity governance at the management level, and a review of the Company’s cybersecurity program and progress toward various initiatives.
The Company also maintains an Executive Cybersecurity Steering Committee (the “Cybersecurity Committee”), made up of key members of senior leadership, to oversee and monitor progress of various cybersecurity initiatives throughout the organization. The Cybersecurity Committee meets quarterly. In addition, the Company asks each business unit to designate an employee as the local Information Security Officer responsible for monitoring the business unit’s cyber risk dashboard and coordinating with local leadership to respond to identified risks accordingly. Each local Information Security Officer completes an annual certification process and receives regular updates with respect to the Company’s cybersecurity program.
The Chief Information Officer (“CIO”), who reports to the Chief Financial Officer, along with members of the corporate and business unit information technology teams, are generally responsible for developing and managing the Company’s cybersecurity programs. Our CIO has over 20 years of experience in various information technology and information security roles, and our information security team is comprised of employees with broad knowledge of cybersecurity issues gained through experience and through training and certifications. These individuals, along with other internal and external personnel as needed, monitor the prevention, detection, mitigation and remediation of cybersecurity incidents, and applicable personnel are informed of known cybersecurity incidents to form the appropriate incident response team and respond accordingly.
Item 2. Properties.
The Company conducts business at plants and offices that can be owned or leased and located in the U.S. or outside the U.S., with square footage primarily in Germany (11%(12%), India (8%), the Netherlands (6%), the U.K. (6%), The Netherlands (6%Italy (3%), Italy (5%), India (4%Canada (3%), China (3%(2%) and Canada (2%Switzerland (1%). The Company recently invested a significant amount of capital to expand the China facility which was completed in late 2022 and the India facility which is expected to be completed in early 2023, ultimately doubling the Company’s historic capacity in each of these countries. Otherwise, managementManagement considers its facilities suitable and adequate for the Company’s operations and believes it has ample capacity in its plants and equipment to meet demand increases for future growth in the intermediate term, especially given its operational improvement initiatives that usually increase capacity.
A summary of properties used by the Company’s operations as of December 31, 20222023 are shown in the following table:
| | Square footage (in millions) |
| | Location | | Owned/Leased |
| Total | | Domestic | | International | | Owned | | Leased |
| | Square footage (in millions) | | | | Square footage (in millions) |
| | | | Location | | | | | | Location | | Owned/Leased |
| | Total | | | | Total | | Domestic | | International | | Owned | | Leased |
| Fluid & Metering Technologies | Fluid & Metering Technologies | | 2.0 | | | 1.4 | | | 0.6 | | | 1.3 | | | 0.7 | |
| Health & Science Technologies | Health & Science Technologies | | 2.0 | | | 1.0 | | | 1.0 | | | 0.7 | | | 1.3 | |
| Fire & Safety/Diversified Products | Fire & Safety/Diversified Products | | 1.2 | | | 0.6 | | | 0.6 | | | 0.9 | | | 0.3 | |
Other(1) | Other(1) | | 0.3 | | | 0.1 | | | 0.2 | | | 0.1 | | | 0.2 | |
| Total | Total | | 5.5 | | | 3.1 | | | 2.4 | | | 3.0 | | | 2.5 | |
(1) Other includes shared service locations as well as the Company’s executive office, which occupies 40,261 square feet of leased space in Northbrook, Illinois and 16,268 square feet of leased space in Chicago, Illinois.
Item 3. Legal Proceedings.
The Company and its subsidiaries are party to legal proceedings arising in the ordinary course of business as described in Note 1110 in Part II, Item 8, “Commitments“Financial Statements and Contingencies,Supplementary Data,” and such disclosure is incorporated by reference into this Item 3, “Legal Proceedings.”
The Company's threshold for disclosing material environmental legal proceedings involving a government authority where potential monetary sanctions are involved is $1.0 million.
In addition, the Company and sevensix of its subsidiaries are presently named as defendants in a number of lawsuits claiming various asbestos-related personal injuries, allegedly as a result of exposure to products manufactured with components that contained asbestos. These components were acquired from third party suppliers and were not manufactured by the Company or any of the defendant subsidiaries. To date, the majority of the Company’s settlements and legal costs, except for costs of coordination, administration, insurance investigation and a portion of defense costs, have been covered in full by insurance, subject to applicable deductibles. However, the Company cannot predict whether and to what extent insurance will be available to continue to cover these settlements and legal costs, or how insurers may respond to claims that are tendered to them. Asbestos-related claims have been filed in jurisdictions throughout the United States and the United Kingdom. Most of the claims resolved to date have been dismissed without payment. The balance of the claims have been settled for various immaterial amounts. Only one case has been tried, resulting in a verdict for the Company’s business unit. No provision has been made in the financial statements of the Company, other than for insurance deductibles in the ordinary course, and the Company does not currently believe the asbestos-related claims will have a material adverse effect on the Company’s business, financial position, results of operations or cash flows.
Item 4. Mine Safety Disclosures.
Not applicable.
PART II
Item 5. Market for Registrant’s Common Equity, Related Stockholder Matters and Issuer Purchases of Equity Securities.
The Company’s common stock trades on the New York Stock Exchange under the symbol “IEX”. As of February 17, 2023,16, 2024, there were approximately 6,5806,929 stockholders of record of the Company’s common stock and there were 75,518,20075,644,654 shares outstanding.
The Company’s payment of dividends in the future will be determined by the Board of Directors and will depend on business conditions, earnings and other factors.
For information pertaining to securities authorized for issuance under equity compensation plans and the related weighted average exercise price, see Part III, Item 12, “Security Ownership of Certain Beneficial Owners and Management and Related Stockholder Matters.”
On March 17, 2020, the Company’s Board of Directors approved an increase of $500.0 million in the authorized level of repurchases of common stock. This approval is in addition to the prior repurchase authorization of the Board of Directors of $300.0 million on December 1, 2015. These authorizations have no expiration date.
The Company’s purchases of common stock during the quarter ended December 31, 20222023 are as follows. As of December 31, 2022,2023, the amount of share repurchase authorization remaining was $563.8$539.7 million.
| | | | | | | | | | | | | | | | | | | | | | | |
| Period | Total Number of Shares Purchased | | Average Price
Paid per Share | | Total Number of
Shares Purchased as
Part of Publicly
Announced Plans
or Programs | | Maximum Dollar
Value that May Yet
be Purchased Under
the Plans
or Programs |
| October 1, 2022 to October 31, 2022 | 6,800 | | | $ | 199.04 | | | 6,800 | | | $ | 563,841,420 | |
| November 1, 2022 to November 30, 2022 | — | | | — | | | — | | | 563,841,420 | |
| December 1, 2022 to December 31, 2022 | — | | | — | | | — | | | 563,841,420 | |
| Total | 6,800 | | | $ | 199.04 | | | 6,800 | | | $ | 563,841,420 | |
| | | | | | | | | | | | | | | | | | | | | | | |
| Period | Total Number of Shares Purchased | | Average Price
Paid per Share | | Total Number of
Shares Purchased as
Part of Publicly
Announced Plans
or Programs | | Maximum Dollar
Value that May Yet
be Purchased Under
the Plans
or Programs |
| October 1, 2023 to October 31, 2023 | 45,000 | | | $ | 192.72 | | | 45,000 | | | $ | 554,091,268 | |
| November 1, 2023 to November 30, 2023 | 74,200 | | | 194.10 | | | 74,200 | | | 539,689,117 | |
| December 1, 2023 to December 31, 2023 | — | | | — | | | — | | | 539,689,117 | |
| Total | 119,200 | | | $ | 193.58 | | | 119,200 | | | $ | 539,689,117 | |
Performance Graph
The following table compares total stockholder returns over the last five years to the Standard & Poor’s (the “S&P”) 500 Index, the S&P Midcap Industrials Sector Index and the Russell 2000 Index assuming the value of the investment in the Company’s common stock and each index was $100 on December 31, 2017.2018. Total return values for the Company’s common stock, the S&P 500 Index, S&P Midcap Industrials Sector Index and the Russell 2000 Index were calculated on cumulative total return values assuming reinvestment of dividends. The stockholder return shown on the graph below is not necessarily indicative of future performance.
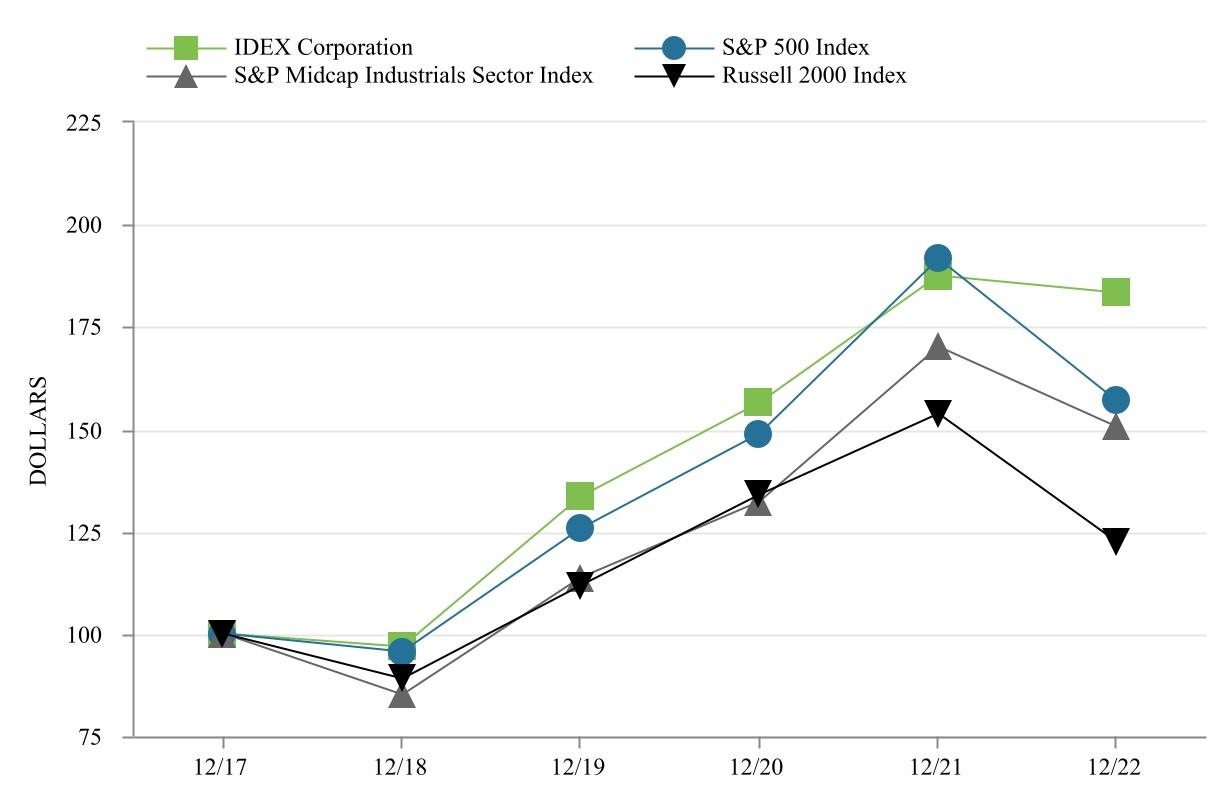
1
| | 12/17 | 12/18 | 12/19 | 12/20 | 12/21 | 12/22 |
| 12/18 | | | 12/18 | 12/19 | 12/20 | 12/21 | 12/22 | 12/23 |
| IDEX Corporation | IDEX Corporation | $ | 100.00 | | $ | 96.84 | | $ | 133.58 | | $ | 156.55 | | $ | 187.57 | | $ | 183.39 | |
| S&P 500 Index | S&P 500 Index | $ | 100.00 | | $ | 95.62 | | $ | 125.72 | | $ | 148.85 | | $ | 191.58 | | $ | 156.88 | |
| S&P Midcap 400 Industrials Sector Index | S&P Midcap 400 Industrials Sector Index | $ | 100.00 | | $ | 85.11 | | $ | 113.67 | | $ | 132.41 | | $ | 170.07 | | $ | 150.52 | |
| Russell 2000 Index | Russell 2000 Index | $ | 100.00 | | $ | 88.99 | | $ | 111.70 | | $ | 134.00 | | $ | 153.85 | | $ | 122.41 | |
The information contained in this Performance Graph section shall not be deemed to be “soliciting material” or “filed” with the SEC, nor shall such information be incorporated by reference into any future filing under the Securities Act of 1933 or the Securities Exchange Act of 1934.
Item 6. [Reserved]
Item 7. Management’s Discussion and Analysis of Financial Condition and Results of Operations.
The following discussion and analysis should be read in conjunction with the Company’s Consolidated Financial Statements and related notes in this annual report. This discussion may contain forward-looking statements based upon current expectations that involve risks and uncertainties. The Company’s actual results and the timing of selected events could differ materially from those anticipated in these forward-looking statements as a result of several factors, including those set forth under Item 1A, “Risk Factors” and under the heading “Cautionary Statement Under the Private Securities Litigation Reform Act” discussed elsewhere in this annual report.
This discussion includes certain non-GAAP financial measures that have been defined and reconciled to their most directly comparable measures that arefinancial measure prepared in accordance with accounting principles generally accepted in the United States of America (“U.S. GAAP”) later in this Item under the headings “Non-GAAP Disclosures” and “Free Cash Flow.” This discussion also includes Operating working capital which has been defined later in this Item under the heading “Cash Flow Summary.“Liquidity and Capital Resources.” The non-GAAP financial measures disclosed by the Company should not be considered a substitute for, or superior to, financial measures prepared in accordance with U.S. GAAP. The financial results prepared in accordance with U.S. GAAP and the reconciliations from these results should be carefully evaluated.
2022
2023 Overview
IDEX is an applied solutions provider specializing in the manufacture of fluid and metering technologies, health and science technologies and fire, safety and other diversified products built to customers’ specifications. IDEX’s products are sold in niche markets across a wide range of industries throughout the world. Accordingly, IDEX’s businesses are affected by levels of industrial activity and economic conditions in the U.S. and in other countries where it does business, andas well as by the relationship of the U.S. dollar to other currencies. Levels of capacity utilization and capital spending in certain industries and overall industrial activity are important factors that influence the demand for IDEX’s products.
In 2022,During 2023, the Company delivered strong operating performance amid sharp volume declines as customers recalibrated inventory levels and order patterns following the easing of global supply chain constraints and reduced lead times. While customer inventory destocking resulted in lower sales volumes, most prominently experienced by the Company’s Health & Science Technologies segment, the Company realized strong price/cost and achieved afavorable operational productivity across its segments. Net income attributable to IDEX and Adjusted EBITDA were $596.1 million and $899.6 million, respectively, in 2023, both up 2% from the prior year. Cash flows from operating activities were $716.7 million during the year ended December 31, 2023, reflecting inventory reduction efforts and resulting in record year in sales driven by robust demand. The Company’s ability to capture price amid inflation pressures and its focus on execution drove record earnings per share.free cash flow of $626.8 million during the year. Finally, the Company deployed record capital within its existing portfolio, with the acquisition of threetwo businesses - Nexsight, KZValve– Iridian Spectral Technologies (“Iridian”) and Muon Group - and through share repurchases to support our future goals.STC Material Solutions (“STC”).
Select key financial results for the year ended December 31, 20222023 when compared to 20212022 were as follows:
•Sales of $3.2 billion increased 15%; organic sales were up 13%.
•Net income of $586.7 million increased 31%; Net income margin of 18.4% increased 210 basis points.
•Diluted EPS attributable to IDEX of $7.71 increased $1.83, or 31%; Adjusted diluted EPS attributable to IDEX of $8.12 increased $1.25, or 18%.
•Adjusted EBITDA of $884.2 million increased 16%; Adjusted EBITDA margin of 27.9% increased 20 basis points.
•Cash flows provided by operating activities of $557.4 million were down as higher earnings were more than offset by an increased investment in working capital. Free cash flow of $489.4 million was 79% of adjusted net income attributable to IDEX. | | | | | | | | | | | | | | | | | |
| Year Ended December 31, |
| (Dollars in millions, except per share amounts) | 2023 | | 2022 | | % / bps Change |
| Net sales | $ | 3,273.9 | | $ | 3,181.9 | | 3% |
| Adjusted net sales* | 3,273.9 | | 3,164.0 | | 3% |
| Organic net sales growth* | | | | | (1%) |
| Gross profit | 1,446.9 | | 1,426.9 | | 1% |
| Adjusted gross profit* | 1,448.5 | | 1,417.5 | | 2% |
| Net income attributable to IDEX | 596.1 | | 586.9 | | 2% |
| Adjusted net income attributable to IDEX* | 623.6 | | 618.1 | | 1% |
| Adjusted EBITDA* | 899.6 | | 884.2 | | 2% |
| Diluted EPS attributable to IDEX | 7.85 | | 7.71 | | 2% |
| Adjusted diluted EPS attributable to IDEX* | 8.22 | | 8.12 | | 1% |
| Cash flows from operating activities | 716.7 | | 557.4 | | 29% |
| Free cash flow* | 626.8 | | 489.4 | | 28% |
| Gross margin | 44.2% | | 44.8% | | (60) bps |
| Adjusted gross margin* | 44.2% | | 44.8% | | (60) bps |
| Net income margin | 18.2% | | 18.4% | | (20) bps |
| Adjusted EBITDA margin* | 27.5% | | 27.9% | | (40) bps |
Focus for 2023*These are non-GAAP measures. See the definitions of these non-GAAP measures and reconciliations to their most directly comparable GAAP financial measures under the headings “Non-GAAP Disclosures” and “Free Cash Flow.”
During 2023, the Company’s primary focus will be on:2024 Outlook
•Foundational Execution. During 2021Moving into 2024, the majority of our businesses are currently experiencing stable demand and 2022,seeing early signs of improvement, particularly in the Company experienced both double-digit organic growthFluid & Metering Technologies segment. However, while the life sciences and a challenging operating environment characterizedanalytical instrumentation markets served by global supply chain constraints, record inflation and continuing effectsapproximately one-third of the COVID-19 environment. In 2023, the Company will renew its focus on the core elementsHealth & Science Technologies segment appear stable, these markets are not yet showing signs of its operating model that are designed to drive efficiency, innovation and growth. As market conditionsnear-term recovery. We continue to evolve,believe in the Company believes it will leverage its process-driven fundamental business practiceslong-term growth potential of these end markets and believe we are well positioned to drive above-marketsupport growth and operational excellence.
•Building Great Global Teams. Theas demand increases. Additionally, we expect the Dispensing reporting unit within the Company’s teams have demonstrated their abilityFire & Safety/Diversified Products segment to quickly adaptcontract in 2024, due to challenges and changing conditions as well as to solve critical problems for customers. The Company is committed to cultivating talent to fuel future growth and onboarding leaders whothe completion of the fleet refreshment cycle of our North American customers in 2023. These declines are committed to IDEX core values, talent development and creating an inspiring Company culture. Diversity, Equity and Inclusion continuesexpected to be an area of focus, creating environments where people feel they belongpartly offset by growth in the Dispensing reporting unit in emerging markets and can bring their true selves to work every day.growth in the Fire & Safety and BAND-IT reporting units.
•Capital Deployment. The Company deployed $1.5 billion over the last two years on growth business opportunities, will continue to identify both organic and inorganic opportunities and believes there will be a high quality pipeline for potential acquisitions. The Company believes that its strong operating cash flow and balance sheet enable deployment
of additional capital to acquire IDEX-like businesses in 2023 to further strengthen its portfolio. The Company anticipates that 2023 organic investment opportunities will be in line with 2022 spending.
Results of Operations
The following is a discussion and analysis of the Company’s results of operations for the year ended December 31, 20222023 compared with the year ended December 31, 2021.2022. For the discussion related to the consolidated results of operations for the year ended December 31, 20212022 compared with the year ended December 31, 2020,2021, refer to the Company’s Annual Report on Form 10-K for the year ended December 31, 2021,2022, which was filed with the Securities and Exchange Commission (“SEC”) on February 24, 2022.23, 2023.
Performance in 20222023 Compared with 20212022
| | Year Ended December 31, | | | Change |
| Year Ended December 31, | |
| Year Ended December 31, | |
| Year Ended December 31, | | | | Change |
| (Dollars in millions, except per share amounts) | (Dollars in millions, except per share amounts) | 2022 | | 2021 | | | $ | | % / bps | (Dollars in millions, except per share amounts) | 2023 | | 2022 | | | $ | | % / bps |
| Net sales | Net sales | $ | 3,181.9 | | $ | 2,764.8 | | | $ | 417.1 | | | 15 | % | Net sales | $ | 3,273.9 | | $ | 3,181.9 | | | $ | 92.0 | | | 3 | | 3 | % |
| Cost of sales | Cost of sales | 1,755.0 | | 1,540.3 | | | 214.7 | | | 14 | % | Cost of sales | 1,827.0 | | 1,755.0 | | | 72.0 | | | 4 | | 4 | % |
| Gross profit | Gross profit | 1,426.9 | | 1,224.5 | | | 202.4 | | | 17 | % | Gross profit | 1,446.9 | | 1,426.9 | | | 20.0 | | | 1 | | 1 | % |
| Gross margin | Gross margin | 44.8 | % | | 44.3 | % | | | n/a | | 50 bps | Gross margin | 44.2 | % | | 44.8 | % | | | n/a | | (60) bps |
| Selling, general and administrative expenses | Selling, general and administrative expenses | 652.7 | | 578.2 | | | 74.5 | | | 13 | % | Selling, general and administrative expenses | 703.5 | | 652.7 | | | 50.8 | | | 8 | | 8 | % |
| Restructuring expenses and asset impairments | Restructuring expenses and asset impairments | 22.8 | | 9.3 | | | 13.5 | | | 145 | % | Restructuring expenses and asset impairments | 10.9 | | 22.8 | | | (11.9) | | | (52 | | (52 | %) |
| Operating income | Operating income | 751.4 | | 637.0 | | | 114.4 | | | 18 | % | Operating income | 732.5 | | 751.4 | | | (18.9) | | | (3 | | (3 | %) |
| Operating margin | 23.6 | % | | 23.0 | % | | | n/a | | 60 bps |
| Gain on sale of business | (34.8) | | — | | | (34.8) | | | 100 | % |
| Other (income) expense - net | (3.9) | | 16.2 | | | (20.1) | | | (124 | %) |
| Gain on sale of businesses - net | | Gain on sale of businesses - net | (84.7) | | (34.8) | | | (49.9) | | | 143 | % |
| Other expense (income) - net | | Other expense (income) - net | 5.2 | | (3.9) | | | 9.1 | | | (233 | %) |
| Interest expense | Interest expense | 40.7 | | 41.0 | | | (0.3) | | | (1 | %) | Interest expense | 51.7 | | 40.7 | | | 11.0 | | | 27 | | 27 | % |
| Income before income taxes | Income before income taxes | 749.4 | | 579.8 | | | 169.6 | | | 29 | % | Income before income taxes | 760.3 | | 749.4 | | | 10.9 | | | 1 | | 1 | % |
| Provision for income taxes | Provision for income taxes | 162.7 | | 130.5 | | | 32.2 | | | 25 | % | Provision for income taxes | 164.7 | | 162.7 | | | 2.0 | | | 1 | | 1 | % |
| Effective tax rate | Effective tax rate | 21.7 | % | | 22.5 | % | | | n/a | | (80) bps | Effective tax rate | 21.7 | % | | 21.7 | % | | | n/a | | 0 bps |
| Net income attributable to IDEX | Net income attributable to IDEX | $ | 586.9 | | $ | 449.4 | | | $ | 137.5 | | | 31 | % | Net income attributable to IDEX | $ | 596.1 | | $ | 586.9 | | | $ | 9.2 | | | 2 | | 2 | % |
| Diluted earnings per common share attributable to IDEX | Diluted earnings per common share attributable to IDEX | $ | 7.71 | | $ | 5.88 | | | $ | 1.83 | | | 31 | % | Diluted earnings per common share attributable to IDEX | $ | 7.85 | | $ | 7.71 | | | $ | 0.14 | | | 2 | | 2 | % |
Net Sales
SalesNet sales increased 15%, reflecting3% as compared to the prior year, driven by a 13%5% increase in acquisitions, net of divestitures, partially offset by a 1% decrease in organic sales a 5% increase from acquisitions (Muon Group - November 2022, KZValve - May 2022, Nexsight - February 2022, Airtech - June 2021 and ABEL - March 2021) net of divestitures (Knight LLC and its related affiliates (“Knight”) - September 2022), a 1% increase from decrease due to the acceleration of previously deferred revenue related to thethe exit of a COVID-19 testing application in 2022 that did not reoccur in 2023 (see Note 1514 in the Notes to the Consolidated Financial Statements for further detail) anddetail). The decrease in organic sales was driven by lower volumes as a 4% unfavorable impact from foreign currency translation. Sales increased 23%result of market conditions during the year, particularly in the Health & Science Technologies businesses, partially offset by price capture across all segments. Net sales decreased 1% domestically and increased 7% internationally, and sales to customers outside the U.S. were approximately 48% and 52%50% of total sales in 2022 and 2021, respectively.2023 compared with 48% in 2022.
Cost of SalesGross Profit and Gross Margin
Cost of sales increased due to higher sales volume, inflation and acquisitions. Both Gross profit and Gross margin increased primarily due to higherwere positively impacted by price/cost and strong operational productivity as well as lower fair value inventory step-up charges, and negatively impacted by lower volume leverage, favorable price/cost and productivityhigher employee-related costs, unfavorable mix and the acceleration of previously deferred revenue related to the exit of a COVID-19 testing application, partially offset by increases in employee-related costs. Gross profit also increased as a result of2022 that did not reoccur in 2023. While acquisitions, net of the Knight divestiture, partially offset by an unfavorabledivestitures also positively impacted Gross profit, they resulted in a dilutive impact from foreign currency translation.to overall Gross margin.
Selling, General and Administrative Expenses
Selling, general and administrative (“SG&A”) expenses increased primarily due to the $49.1 million impact from acquisitions, including amortization, net of divestitures, as well as higher discretionary spending, resource investments andincreases in employee-related costs. Additionally, the prior year includedcosts, which were largely offset by a $3.5 million impact of a settlement for a corporate transaction indemnity that did not reoccurdecrease in 2022.variable compensation.
Restructuring Expenses and Asset Impairments
Restructuring expenses and asset impairments increaseddecreased primarily due to an asset impairment charge of $16.8 million related to the exit of a COVID-19 testing application in 2022, partially offset by lowerhigher severance costs in 2022.2023 incurred in conjunction with cost mitigation efforts as a result of current market conditions. See Note 1514 in the Notes to the Consolidated Financial Statements for further detail.
Operating Income
Operating income increased 18%, reflecting a 19% increase in organic operating income, a 2% increase from acquisitions net of divestitures (Knight - September 2022), a 1% favorable net impact from the exit of a COVID-19 testing application, partially offset by a 4% unfavorable impact from foreign currency translation. The increase in organic operating income is attributable to higher volume leverage, favorable price/cost and operational productivity, partially offset by increases in employee-related costs, discretionary spending and resource investments.
Operating Margin
Operating margin increased 60 basis points, reflecting a 130 basis point increase in organic operating margin, partially offset by a 70 basis point decrease due to acquisitions primarily driven by higher amortization. The increase in organic operating margin is primarily due to higher volume leverage, favorable price/cost and operational productivity, partially offset by increases in employee-related costs, discretionary spending and resource investments.
Gain on Sale of BusinessBusinesses - Net
In 2023, the third quarterCompany completed the sale of Micropump for proceeds of $110.3 million, net of cash remitted, which resulted in a pre-tax gain of $93.8 million, and the sale of Novotema, SpA (“Novotema”) for proceeds of $8.3 million, net of cash remitted, which resulted in a loss of $9.1 million. In 2022, the Company completed the sale of Knight LLC (“Knight”) for proceeds of $49.4 million, net of cash remitted, resultingwhich resulted in a pre-tax gain on the sale of $34.8 million. The Company recorded $5.5 million of income tax expense associated with this transaction as Provision for income taxes in the Consolidated Statements of Income during the year ended December 31, 2022.
Other Expense (Income) Expense - Net
Other expense (income) expense - net was $5.2 million of expense in 2023 compared to $3.9 million of income in 2022 compared2022. The increase in expense was primarily due to $16.2a $7.7 million of expensecredit loss reserve on an investment with a collaborative partner (see Note 3 in 2021. The prior year included an $8.6 million noncash loss relatedthe Notes to the termination of the U.S. pension plan, net of curtailmentConsolidated Financial Statements for further detail), higher foreign currency transaction losses and an $8.6 million loss on early debt redemption. Additionally, 2022 included $3.1$2.7 million of gains on the sale of assets and $2.5 million of foreign currency transaction gains,in 2022 that did not reoccur in 2023, partially offset by $2.3 millionhigher interest earned on cash balances and gains on the sale of losses on trading securities.securities in 2023.
Interest Expense
Interest expense decreasedincreased primarily due to lower weighted averagethe borrowings incurred under the Credit Facility in connection with the acquisition of Muon B.V. and its subsidiaries (“Muon Group”) in November 2022 as well as higher interest rates on the Company’s indebtedness, partially offset by an increase in the amount of debt outstanding compared with 2021 due to borrowings under the Term Facility and the Revolving Facility, both of which were used to fund the acquisition of Muon Group. Additionally, the prior year included $1.6 million of interest expense for the interest rate contract associated with the 4.20% Senior Notes that did not reoccur in 2022.indebtedness.
Income Taxes
The Company’s provision for income taxes is based upon estimated annual tax rates for the year applied to federal, state and foreign income. The provision for income taxes increased $32.2$2.0 million to $164.7 million in 2023 as compared with $162.7 million in 2022 as compared with $130.5 million in 2021 due to higher earnings.2022. The 20222023 effective tax rate of 21.7% decreasedremained unchanged compared with the 2022 effective tax rate.
In October 2021, members of the Organization for Economic Co-operation and Development (“OECD”) and G20 Inclusive Framework on Base Erosion and Profit Shifting agreed to a two-pillar solution to address the tax challenges associated with the digitalization of the economy. In December 2021, the OECD released the Pillar Two Model Rules (“Pillar Two”), which define the global minimum tax and call for the taxation of large corporations at a minimum rate of 15%. Although it is uncertain when and how the rules will be fully enacted into law, based on our initial assessment, nearly all of the jurisdictions in which the Company operates have an effective tax rate of 22.5% primarily due to tax benefits realizedabove the 15% threshold. Therefore, the Company does not expect a material impact from the divestiture of Knight as well as from realizing foreign currency impacts in connection with the funding of the acquisition of Muon Group.Pillar Two income tax rules.
Results of Reportable Business Segments
The Company has three reportable segments: Fluid & Metering Technologies (“FMT”), Health & Science Technologies (“HST”) and Fire & Safety/Diversified Products (“FSDP”). For a detailed description of the operations within each segment, please refer to Part I, Item 1, “Business”Business” of this Annual Report on Form 10-K.
Management’s primary measurements of segment performance are Net sales, adjusted earnings before interest, income taxes, depreciation and amortization (“Adjusted EBITDA”) and Adjusted EBITDA margin.
Within its three reportable segments, the Company maintains 13 reporting units where the Company focuses on organic growth and strategic acquisitions. Management’s primary measurements of segment performance are sales, Adjusted EBITDA and Adjusted EBITDA margin.
During the fourth quarter of 2022, the Company changed the segment measure of profit and loss used by the Chief Operating Decision Maker ("CODM") in accordance with Accounting Standards Codification ("ASC") 280, Segment Reporting, from operating income to Adjusted EBITDA. The change in segment measure of profit and loss aligns with how the CODM allocates resources and evaluates the performance of the business. It also allows the Company to better assess operating results over time since it excludes items that are not reflective of ongoing operations. For further discussion related to the Company’s change in the segment measure of profit and loss used by the CODM as well as the definition of Adjusted EBITDA, refer to Note 14 in Part II, Item 8, “Financial Statements and Supplementary Data.”
Fluid & Metering Technologies Segment
| | Year Ended December 31, | | Components of Change |
| Year Ended December 31, | | | Year Ended December 31, | | Components of Change |
| (Dollars in millions) | (Dollars in millions) | 2022 | | 2021 | | Change | | Organic | | Acq/Div(1) | | Foreign Currency | | Total | (Dollars in millions) | 2023 | | 2022 | | Change | | Organic(1) | | Acq/Div(1)(2) | | Foreign Currency | | Total |
| Domestic sales | |
| International sales | |
| International sales | |
| International sales | |
| Net sales | |
| Net sales | |
| Net sales | Net sales | $ | 1,167.3 | | $ | 998.7 | | 17 | % | | 13 | % | | 7 | % | | (3 | %) | | 17 | % | $ | 1,247.1 | | $ | 1,167.3 | | 7 | % | | 5 | % | | 2 | % | | — | % | | 7 | % |
| Adjusted EBITDA | Adjusted EBITDA | 374.2 | | 297.0 | | 26 | % | | 23 | % | | 6 | % | | (3 | %) | | 26 | % | Adjusted EBITDA | 416.1 | | 374.2 | | 11 | % | | 10 | % | | 2 | % | | (1 | %) | | 11 | % |
| Adjusted EBITDA margin | Adjusted EBITDA margin | 32.1 | % | | 29.7 | % | | 240 bps | | 280 bps | | (40) bps | | — | | 240 bps | Adjusted EBITDA margin | 33.4 | % | | 32.1 | % | | 130 bps | | 150 bps | | (10) bps | | 130 bps |
(1)Acquisitions included KZValve in May 2022, Nexsight in February 2022 and ABEL in March 2021. Divestitures included Knight in September 2022. Based on the timing of the acquisitions, Nexsight, LLC and its acquisition, ABELbusinesses Envirosight, WinCan, MyTana and Pipeline Renewal Technologies (“Nexsight”) results for the first twothree months of 20222023 and KZ CO. (“KZValve”) results for the first four months of 2023 are reflected in the acquisitions/divestitures column while the remaining year-over-year impact is included in the organic column.
(2)Divestitures included Knight sold in September 2022.
•Sales increased 24% domesticallyOrganic net sales were positively impacted by the following:
◦Water reporting unit driven by price capture, favorability in the municipal water market and 9% internationally. Salesoperational execution;
◦Energy reporting unit driven by operational execution related to customers outsidebacklog reduction, improved supply chain conditions, price capture and growth initiatives;
◦Valves reporting unit driven by strong price capture and demand in Asia; and
◦Pumps reporting unit driven by strong price capture and operational execution, which more than offset the U.S.impact of lower volumes in the industrial market.
Organic net sales were approximately 43% and 47% of total segment sales in 2022 and 2021, respectively.negatively impacted by the Agriculture reporting unit driven by distribution inventory recalibration, partially offset by positive original equipment manufacturer demand.
•The change in organic sales was attributed to increases in the Pumps reporting unit due to continued favorable demand in the industrial and energy markets as well as strong price capture. Additionally, there were increases in the Energy reporting unit due to a continued rebound in the refined fuel, liquefied petroleum gas and aviation markets as well as improved operational performance, increases in the Agriculture reporting unit due to strong market performance driven by favorable commodity prices and global demand for crops and increases in the Water reporting unit due to an overall positive municipal water market and water-saving targeted growth initiatives.
•Adjusted EBITDA margin of 32.1% increased 240 basis points compared with 29.7% in 2021. The changeincrease in Adjusted EBITDA margin was attributed to the following:
◦Organic Adjusted EBITDA margin increased 280 basis pointsprimarily due to strong price/cost favorableand operational productivity, and higher volume leverage, partially offset by increases inhigher employee-related costs, discretionary spendingunfavorable mix and resource investments.
◦Acquisitions negatively impacted Adjusted EBITDA margin by 40 basis points due to the dilutive impact from acquisitions on overall FMT Adjusted EBITDA margin.lower volume leverage.
Health & Science Technologies Segment
| | Year Ended December 31, | | Components of Change |
| Year Ended December 31, | | | Year Ended December 31, | | Components of Change |
| (Dollars in millions) | (Dollars in millions) | 2022 | | 2021 | | Change | | Organic | | Acq/Div(1) | | Other(2) | | Foreign Currency | | Total | (Dollars in millions) | 2023 | | 2022 | | Change | | Organic(1) | | Acq/Div(1)(2) | | Other(3) | | Foreign Currency | | Total |
| Domestic sales | |
| International sales | |
| International sales | |
| International sales | |
| Net sales | Net sales | $ | 1,339.2 | | $ | 1,121.8 | | 19 | % | | 15 | % | | 6 | % | | 2 | % | | (4 | %) | | 19 | % |
Adjusted net sales(3) | 1,321.3 | | 1,121.8 | | 17 | % | | 15 | % | | 6 | % | | — | | (4 | %) | | 17 | % |
| Net sales | |
| Net sales | | $ | 1,316.4 | | $ | 1,339.2 | | (2 | %) | | (10 | %) | | 9 | % | | (1 | %) | | — | % | | (2 | %) |
| Adjusted net sales | | Adjusted net sales | 1,316.4 | | 1,321.3 | | (1 | %) | | (10 | %) | | 9 | % | | — | % | | — | % | | (1 | %) |
| Adjusted EBITDA | Adjusted EBITDA | 411.8 | | 355.9 | | 16 | % | | 13 | % | | 6 | % | | — | | (3 | %) | | 16 | % | Adjusted EBITDA | 359.5 | | 411.8 | | (13 | %) | | (20 | %) | | 7 | % | | — | % | | — | % | | (13 | %) |
| Adjusted EBITDA margin | Adjusted EBITDA margin | 31.2 | % | | 31.7 | % | | (50) bps | | (70) bps | | — | | — | | 20 bps | | (50) bps | Adjusted EBITDA margin | 27.3 | % | | 31.2 | % | | (390) bps | | (360) bps | | (20) bps | | — | | (10) bps | | (390) bps |
(1) Acquisitions included Muon Group in November 2022 and Airtech in June 2021. Based on the timing of itsthe acquisition, AirtechMuon Group results for the first six10.5 months of 20222023 are reflected in the acquisitions/divestitures column while the remaining year-over-year impact is included in the organic column.
Table of Contents(2) Acquisitions included Iridian acquired in May 2023 and STC acquired in December 2023. Divestitures included Micropump sold in August 2023 and Novotema sold in December 2023.
(2)(3) Includes the impact ofChange in Net sales includes the acceleration of previously deferred revenue of $17.9 million as a result of a customer’s decision to discontinue further investment in commercializing its COVID-19 testing application.application in 2022 that did not reoccur in 2023, the impact of which was excluded from Adjusted net sales. See Note 1514 in the Notes to Consolidated Financial Statements for further detail.(3) Adjusted net sales is calculated as net sales less the acceleration of previously deferred revenue related to the exit of a COVID-19 testing application. It is used in the calculation of Adjusted EBITDA margin for the full year 2022. Refer to Non-GAAP Disclosures in Part II, Item 7, “Management’s Discussion and Analysis of Financial Condition and Results of Operations” for further details.
•Sales increased 32% domestically and 10% internationally. Sales to customers outside the U.S. were approximately 52% and 56% of total segment sales in 2022 and 2021, respectively.
•The change in organic sales was attributed to increases in the Scientific Fluidics & Optics reporting unit due to strong demand across the analytical instrumentation and life sciences markets, favorable but slowing demand in the semiconductor market and targeted growth initiatives tied to Next Gen Sequencing and satellite broadband, in the Performance Pneumatics Technologies reporting unit driven by strength in the industrial market, price capture and targeted growth initiatives tied to fuel cells and in the Sealing Solutions reporting unit due to favorable performance in the semiconductor, oil and gas and automotive markets.
•Adjusted EBITDA margin of 31.2% decreased 50 basis points compared with 31.7% in 2021. The change in Adjusted EBITDA margin was attributed to the following:
◦Organic Adjusted EBITDA margin decreased 70 basis points due to increases in employee-related costs, discretionary spending and resource investments, partially offset by higher volume leverage and favorable price/cost.
◦Foreign currency positively impacted Adjusted EBITDA margin by 20 basis points.
Fire & Safety/Diversified Products Segment
| | | | | | | | | | | | | | | | | | | | | | | | | | | | | | | | | | | | | | | | | | | | | | | |
| Year Ended December 31, | | Components of Change |
| (Dollars in millions) | 2022 | | 2021 | | Change | | Organic | | Acq/Div | | Other | | Foreign Currency | | Total |
| Net sales | $ | 679.2 | | $ | 647.9 | | 5 | % | | 9 | % | | — | | — | | (4 | %) | | 5 | % |
| Adjusted EBITDA | 183.9 | | 185.7 | | (1 | %) | | 4 | % | | — | | — | | (5 | %) | | (1 | %) |
| Adjusted EBITDA margin | 27.1 | % | | 28.7 | % | | (160) bps | | (140) bps | | — | | (10) bps | | (10) bps | | (160) bps |
•Sales increased 8% domestically and 2% internationally. Sales to customers outside the U.S. were approximately 50% and 51% of total segment sales in 2022 and 2021, respectively.
•The change in organic sales was attributed to increases in the Fire & Safety reporting unit due to acceptance of targeted growth initiatives, price realization and backlog execution, in the BAND-IT reporting unit due to strength in the energy market driven by increases in oil prices and in the automotive market driven by share gain as well as continued favorable industrial performance and in the Dispensing reporting unit due to continued favorable paint market, North American project volume and strong performance in India.
•Adjusted EBITDA margin of 27.1% decreased 160 basis points compared with 28.7% in 2021. The change in Adjusted EBITDA margin was primarily attributed to organic Adjusted EBITDA margin which decreased 140 basis points due to increases in employee-related costs and discretionary spending as well as compressed price/cost, partially offset by higher volume leverage.
Performance in 2021 Compared with 2020
Due to the change in segment measure of profit and loss discussed above, the following discussion and analysis of the Company’s segment results of operations for the year ended December 31, 2021 compared with the year ended December 31, 2020 has been updated to include Adjusted EBITDA margin for comparative purposes.
Fluid & Metering Technologies Segment
| | | | | | | | | | | | | | | | | | | | | | | | | | | | | | | | | | | | | | | | | | | | | | | |
| Year Ended December 31, | | Components of Change |
| (Dollars in millions) | 2021 | | 2020 | | Change | | Organic | | Acq/Div(1) | | Other | | Foreign Currency | | Total |
| Net sales | $ | 998.7 | | $ | 896.3 | | 11 | % | | 6 | % | | 4 | % | | — | | 1 | % | | 11 | % |
| Adjusted EBITDA | 297.0 | | 271.5 | | 9 | % | | 6 | % | | 2 | % | | — | | 1 | % | | 9 | % |
| Adjusted EBITDA margin | 29.7 | % | | 30.3 | % | | (60) bps | | (10) bps | | (40) bps | | — | | (10) bps | | (60) bps |
(1) Acquisitions included ABEL in March 2021 and Flow MD in February 2020. Based on the timing of its acquisition, Flow MD results for the first quarter of 2021 are reflected in the acquisitions/divestitures column while the remaining year-over-year impact is included in the organic column.
•Sales increased 5% domestically and 19% internationally. Sales to customers outside the U.S. were approximately 47% and 44% of total segment sales in 2021 and 2020, respectively.
•The change in organic sales was attributed to increases in the Pumps reporting unit due to recovery within the industrial market, in the Water reporting unit due to recovery of the municipal water market and water-saving growth projects and in the Agriculture reporting unit due to increased global demand, partially offset by a decrease in the Energy reporting unit due to a decline in capital spending in the oil and gas markets.
•Adjusted EBITDA margin of 29.7% decreased 60 basis points compared with 30.3% in 2020. The change in Adjusted EBITDA margin was attributed to the following:
◦Organic Adjusted EBITDA margin decreased 10 basis points due to increases to inventory reserves associated with COVID-19 new product development opportunities not materializing and resource investments, partially offset by higher volume leverage and favorable price/cost.
◦Acquisitions negatively impacted Adjusted EBITDA margin by 40 basis points due to the dilutive impact from acquisitions on overall FMT Adjusted EBITDA margin, which was primarily driven by the Flow MD acquisition.
◦Foreign currency negatively impacted Adjusted EBITDA margin by 10 basis points.
Health & Science Technologies Segment
| | | | | | | | | | | | | | | | | | | | | | | | | | | | | | | | | | | | | | | | | | | | | | | |
| Year Ended December 31, | | Components of Change |
| (Dollars in millions) | 2021 | | 2020 | | Change | | Organic | | Acq/Div(1) | | Other | | Foreign Currency | | Total |
| Net sales | $ | 1,121.8 | | $ | 896.0 | | 25 | % | | 18 | % | | 5 | % | | — | | 2 | % | | 25 | % |
| Adjusted EBITDA | 355.9 | | 250.9 | | 42 | % | | 33 | % | | 7 | % | | — | | 2 | % | | 42 | % |
| Adjusted EBITDA margin | 31.7 | % | | 28.0 | % | | 370 bps | | 390 bps | | — | | — | | (20) bps | | 370 bps |
(1) Acquisitions included Airtech in June 2021.
•Sales increased 27% domestically and 24% internationally. Sales to customers outside the U.S. were approximately 56% and 57% of total segment sales in 2021 and 2020, respectively.
•The change in organic sales was attributed to increases in the Scientific Fluidics & Optics reporting unit due to recovery within the analytical instrumentation market as well as increased microfluidics and optics demand, in the Sealing Solutions reporting unit due to strength in the semiconductor market and improvements in the automotive market and in the Material Processing Technologies reporting unit due to increased demand in the food and pharmaceutical markets.
•Adjusted EBITDA margin of 31.7% increased 370 basis points compared with 28.0% in 2020. The change in Adjusted EBITDA margin was attributed to the following:
◦Organic Adjusted EBITDA margin increased 390 basis points due to volume leverage and favorable price/cost, partially offset by targeted reinvestment.
◦Foreign currency negatively impacted Adjusted EBITDA margin by 20 basis points.
•The decrease in organic net sales was attributed to the following:
◦Scientific Fluidics & Optics reporting unit driven by lower demand from analytical instrumentation and life science original equipment manufacturers due to customer inventory recalibration and market slowing, partially offset by price capture and strong cost control;
◦Sealing Solutions reporting unit driven by lower volumes in the semiconductor market;
◦Material Processing Technologies reporting unit driven by lower volumes in the pharmaceuticals/biopharmaceuticals and food markets, partially offset by operational execution related to backlog reduction and price capture; and
◦Performance Pneumatics Technologies reporting unit driven by the impact of lower volumes in the industrial market, partially offset by targeted growth performance and price capture.
•The decrease in Adjusted EBITDA margin was primarily due to lower volume leverage, higher employee-related costs and unfavorable mix, partially offset by strong operational productivity and price/cost.
Fire & Safety/Diversified Products Segment
| | Year Ended December 31, | | Components of Change |
| Year Ended December 31, | | | Year Ended December 31, | | Components of Change |
| (Dollars in millions) | (Dollars in millions) | 2021 | | 2020 | | Change | | Organic | | Acq/Div | | Other | | Foreign Currency | | Total | (Dollars in millions) | 2023 | | 2022 | | Change | | Organic | | Acq/Div | | Foreign Currency | | Total |
| Domestic sales | |
| International sales | |
| International sales | |
| International sales | |
| Net sales | |
| Net sales | |
| Net sales | Net sales | $ | 647.9 | | $ | 562.9 | | 15 | % | | 13 | % | | — | | — | | 2 | % | | 15 | % | $ | 718.8 | | $ | 679.2 | | 6 | % | | 6 | % | | — | % | | — | % | | 6 | % |
| Adjusted EBITDA | Adjusted EBITDA | 185.7 | | 161.5 | | 15 | % | | 13 | % | | — | | — | | 2 | % | | 15 | % | Adjusted EBITDA | 208.6 | | 183.9 | | 13 | % | | 13 | % | | — | % | | — | % | | 13 | % |
| Adjusted EBITDA margin | Adjusted EBITDA margin | 28.7 | % | | 28.7 | % | | — | | (10) bps | | — | | — | | 10 bps | | — | Adjusted EBITDA margin | 29.0 | % | | 27.1 | % | | 190 bps | | 200 bps | | — | | | (10) bps | | (10) bps | | 190 bps |
•Sales increased 17% domestically and 13% internationally. Sales to customers outsideOrganic net sales were positively impacted by the U.S. were approximately 51% and 52% of total segment sales in 2021 and 2020, respectively.following:
•◦The change in organic sales was attributed to increases in the Dispensing reporting unit due to strong demand in the paint market and in the BAND-IT reporting unit due to improvements in the aerospace, energy and industrial markets, partially offset by a decrease in the Fire & Safety reporting unit due to a lack of large tendersdriven by price capture, continued demand for rescue tools, and North America Fire OEMimproved supply chain constraints slowing order to revenue conversion.conditions and operational execution; and
◦BAND-IT reporting unit driven by continued share gain in an otherwise flat automotive market.
Organic net sales had no impact from the Dispensing reporting unit as organic sales were flat. Price capture was fully offset by lower volumes.
•Adjusted EBITDA margin of 28.7% was flat compared with 2020. The changeincrease in Adjusted EBITDA margin was attributed to the following:
◦Organic Adjusted EBITDA margin decreased 10 basis pointsprimarily due to unfavorablestrong price/cost and mix,favorable operational productivity, partially offset by higher volume.
◦Foreign currency positively impacted Adjusted EBITDA margin by 10 basis points.employee-related costs.
Liquidity and Capital Resources
Liquidity
Based on management’s current expectations and currently available information, the Company believes current cash, cash from operations and cash available under the Revolving Facility will be sufficient to meet its operating cash requirements, planned capital expenditures, interest and principal payments on all borrowings, pension and postretirement funding requirements, share repurchases and quarterly dividend payments to holders of the Company’s common stock for the foreseeable future. Additionally, in the event that suitable businesses are available for acquisition upon acceptable terms, the Company may obtain all or a portion of the financing for these acquisitions through the incurrence of additional borrowings.
At
Select key liquidity metrics at December 31, 2022, working capital was $855.7 million and the Company’s current ratio was 2.6 to 1. At December 31, 2022, the Company’s cash and cash equivalents totaled $430.2 million, of which $373.1 million was held outside of the United States. At December 31, 2022, there was $77.7 million outstanding under the Revolving Facility and $7.9 million of outstanding letters of credit, resulting in a net available borrowing capacity under the Revolving Facility of $714.4 million. 2023 are as follows:
| | | | | | | | |
| (In millions) | | December 31, 2023 |
| Working capital | | $ | 946.0 | |
| Current ratio | | 2.9 to 1 |
| Cash and cash equivalents | | $ | 534.3 | |
| Cash held outside of the United States | | 445.9 | |
| Revolving Credit Facility capacity | | $ | 800.0 | |
| Borrowings | | 81.0 | |
| Letters of credit | | 3.4 | |
| Revolving Credit Facility availability | | $ | 715.6 | |
The Company believes that additional borrowings through various financing alternatives remain available, if required.
Cash Flow Summary
The following table is derived from the Consolidated Statements of Cash Flows:
| | | | | | | | | | | | | | |
| | Year Ended December 31, |
| (In millions) | | 2022 | | 2021 |
| Net cash flows provided by (used in): | | | | |
| Operating activities | | $ | 557.4 | | | $ | 565.3 | |
| Investing activities | | (917.2) | | | (698.1) | |
| Financing activities | | (37.8) | | | (9.5) | |
Operating Activities
Cash flows provided by operating activities decreased $7.9 million to $557.4 million in 2022 as higher earnings were more than offset by an increased investment in working capital.Working Capital
Operating working capital, calculated as Receivables - net plus Inventories - net minus Trade accounts payable, is used by management as a measurement of operational results as well as the short-term liquidity of the Company. The following table details operatingOperating working capital as of December 31, 20222023 and 2021:2022:
| | | | | | | | | | | | | | | | | | | | | | | | | | |
| (In millions) | | December 31, 2023 | | December 31, 2022 | | Change | | Organic Change |
| Receivables - net | | $ | 427.8 | | | $ | 442.8 | | | $ | (15.0) | | | $ | (15.6) | |
| Inventories - net | | 420.8 | | | 470.9 | | (50.1) | | | (62.8) | |
| Less: Trade accounts payable | | 179.7 | | | 208.9 | | | 29.2 | | | 25.0 | |
| Operating working capital | | $ | 668.9 | | | $ | 704.8 | | | $ | (35.9) | | | $ | (53.4) | |
Operating working capital decreased $35.9 million to $668.9 million at December 31, 2023. Acquisitions, divestitures and foreign currency translation increased Operating working capital by $17.5 million during 2023. Apart from these items, reduced inventory levels were partly offset by lower levels of accounts payable, and strong price capture partially offset the impact of lower volume on receivables.
Cash Flow Summary
| | | | | | | | | | | | | | |
| (In millions) | | 2022 | | 2021 |
| Receivables - net | | $ | 442.8 | | | $ | 356.4 | |
| Inventories | | 470.9 | | 370.4 |
| Less: Trade accounts payable | | 208.9 | | 178.8 |
| Operating working capital | | $ | 704.8 | | | $ | 548.0 | |
| | | | | | | | | | | | | | |
| | Year Ended December 31, |
| (In millions) | | 2023 | | 2022 |
| Net cash flows provided by (used in): | | | | |
| Operating activities | | $ | 716.7 | | | $ | 557.4 | |
| Investing activities | | (283.8) | | | (917.2) | |
| Financing activities | | (344.7) | | | (37.8) | |
Operating Activities
Cash flows provided by operating activities increased $159.3 million to $716.7 million in 2023 primarily due to lower working capital increased $156.8 million to $704.8 million at December 31, 2022. Acquisitions, divestitures and foreign currency translation contributed $31.9 million to the increaserequirements in operating working capital. Excluding those items, Receivables - net increased $63.1 million2023 as a result of efforts to recalibrate inventory levels in response to normalizing market conditions. The prior year period included higher volume; Inventoriesworking capital requirements related to higher volumes and increased $79.0 millioninventories to support production amid supply chain challenges; and Trade accounts payable increased $17.2 million due to higher inventory purchases.challenges.
Investing Activities
Cash flows used in investing activities increased $219.1decreased in 2023 primarily due to the purchase of Iridian and STC in 2023 for $311.8 million to $917.2as compared with the purchases of Nexsight, KZValve and Muon Group in 2022 for $945.6 million as well as proceeds of $118.6 million in 2023 from the sales of Micropump and Novotema as compared with $49.4 million in 2022 primarily due to higher cash outflows for acquisitions withfrom the additionsale of Muon Group, KZValve and Nexsight in 2022 compared to Airtech and ABEL in 2021,Knight. These items were partially offset by proceeds received from both the salehigher capital expenditures of Knight and the sale of marketable securities$89.9 million in 20222023 as well as higher proceeds from asset salescompared with $68.0 million in 2022 compared to 2021.2022.
Financing Activities
Cash flows used in financing activities increased $28.3in 2023 primarily consisted of dividends of $190.7 million paid to common shareholders, payments of $150.0 million on the Term Facility, and the repurchase of shares for $24.2 million. Additionally, in 2023, proceeds of $100.0 million from $9.5the issuance of the 5.13% Senior Notes were used to redeem the $100.0 million of the Company’s 3.20% Senior Notes due June 13, 2025 (the “3.20% Senior Notes”) outstanding. Cash flows used in 2021financing activities in 2022 primarily consisted of dividends of $177.4 million paid to $37.8 million in 2022. During 2022, common shareholders andthe Company repurchased 795,423repurchase of shares at a costfor $148.1 million. These outflows were partially offset by net proceeds of $148.1 million, paid $177.4 million in dividends, borrowed $210.4$75.4 million under the Revolving Facility and $200.0 million under the Term Facility, and repaid $135.0 million ofwhich were used to fund the Revolving Facility. During 2021, the Company issued $500.0 million of 2.625% Senior Notes, redeemed $350.0 million of 4.20% Senior Notes and paid $161.1 million in dividends.Muon Group acquisition.
Free Cash Flow
The Company believes free cash flow, a non-GAAP measure, is an important measure of performance because it provides a measurement of cash generated from operations that is available for payment obligations such as operating cash requirements, planned capital expenditures, interest and principal payments on all borrowings, pension and postretirement funding requirements and quarterly dividend payments to holders of the Company’s common stock as well as for funding acquisitions and share repurchases. Free cash flow is calculated as cash flows provided by operating activities less capital expenditures.
The following table reconciles free cash flow to cash flows provided by operating activities:
| | Year Ended December 31, |
| | Year Ended December 31, | | | | Year Ended December 31, |
| (Dollars in millions) | (Dollars in millions) | | 2022 | | 2021 | (Dollars in millions) | | 2023 | | 2022 |
| Cash flows provided by operating activities | Cash flows provided by operating activities | | $ | 557.4 | | $ | 565.3 | Cash flows provided by operating activities | | $ | 716.7 | | $ | 557.4 |
| Less: capital expenditures | Less: capital expenditures | | (68.0) | | (72.7) | Less: capital expenditures | | 89.9 | | 68.0 |
| Free cash flow | Free cash flow | | $ | 489.4 | | $ | 492.6 | Free cash flow | | $ | 626.8 | | $ | 489.4 |
Free cash flow as a percent of adjusted net income attributable to IDEX(1) | | 79.2 | % | | 93.8 | % |
| Free cash flow as a percent of adjusted net income attributable to IDEX | | Free cash flow as a percent of adjusted net income attributable to IDEX | | 101 | % | | 79 | % |
(1) Free cash flow as a percent of adjusted net income attributable to IDEX reflects the impact of excluding acquisition-related intangible asset amortization, net of related taxes, from adjusted net income attributable to IDEX in both periods presented.
The decreaseincrease in free cash flow as compared to 20212022 is due to the increases inlower working capital requirements in 2023 discussed above which more thanas compared with 2022, partially offset by higher earnings.
Cash Requirements
Contractual Obligations
The Company’s cash requirements under contractual obligations include borrowingsinclude:
•Borrowings and related interest purchase obligations, pension and post-retirement medical benefit plans, rental payments under operating leases, payments under capital leases, a transition tax payable and other obligations arising in the ordinary course of business (such as acquisition commitments). There are no identifiable events or uncertainties, including the lowering of the Company’s credit rating, which would accelerate payment or maturity of any of these commitments or obligations. For a description of the funding requirements related to the Company’s contractual obligations, refer to Note 4 (transition tax payable),- See Note 7 (borrowings and related interest), Note 10 (lease obligations) and Note 18 (pension and post-retirement obligations) in the Notes to Consolidated Financial Statements respectively.for further detail of the Company’s debt and timing of expected future principal payments. •Rental payments under operating leases - See Note 9 in the Notes to Consolidated Financial Statements for further detail of our obligations and the timing of expected future payments. •Purchase obligations - The Company enters into purchase orders with vendors and other parties in the ordinary course of business. As of December 31, 2022,2023, the Company’s purchase obligations, consisting primarily of inventory commitments, totaled approximately $364.4$265.6 million, of which $336.4$238.1 million is expected to be settled during 20232024 and the remainder thereafter.
•Pension and post-retirement medical benefit plans - See Note 17 in the Notes to Consolidated Financial Statements for further detail of our obligations and the timing of expected future payments.
Capital Expenditures
Capital expenditures generally include machinery and equipment that support growth and improved productivity, tooling, business system technology, replacement of equipment and investments in new facilities. The Company believes it has sufficient operating cash flows to continue to meet current obligations and invest in planned capital expenditures. In 2022 and 2021,C cashash flows from operations were more than adequate to fund capital expenditures of $89.9 million and $68.0 million in 2023 and $72.7 million, respectively. The Company recently invested a significant amount of capital to expand the China facility which was completed in late 2022, and the India facility which is expected to be completed in early 2023, ultimately doubling the Company’s historic capacity in each of these countries. Otherwise, management considers its facilities suitable and adequate for the Company’s operations and believes it has ample capacity in its plants and equipment to meet demand increases for future growth in the intermediate term, especially given its operational improvement initiatives that usually increase capacity.
Debt Repayment
As of December 31, 2022, the Company has $100.0 million of 3.20% Senior Notes due June 2023. The Company expects to either refinance or repay the Notes using the available borrowing capacity of the Revolving Facility, due November 2027.
Share Repurchases
The Company repurchased 124,600 shares at a cost of $24.2 million in 2023. The Company repurchased 795,423 shares at a cost of $148.1 million in 2022. There were no share repurchases in 2021. As of December 31, 2022,2023, the amount of share repurchase authorization remaining was $563.8$539.7 million. For additional information regarding the Company’s share repurchase program, refer to Note 1211 in the Notes to Consolidated Financial Statements.
Dividends
The Company increased its quarterly cash dividend by 7% from $0.60 per common share in 2022 to $0.64 per common share in 2023. Total dividend payments to common shareholders were $190.7 million in 2023 compared with $177.4 million in 2022.
Covenants
The key financial covenants that the Company is required to maintain in connection with the Revolving Facility, the Term Facility, the 3.37% Senior Notes and the 2016 Private Placement5.13% Senior Notes, are a minimum interest coverage ratio of 3.0 to 1 and a maximum leverage ratio of 3.50 to 1. At December 31, 2022,2023, the Company was in compliance with both of these financial covenants, as the Company’s interest coverage ratio was 24.3918.43 to 1 for covenant calculation purposes and the leverage ratio was 1.551.45 to 1. There are no financial covenants relating to the 2.625% Senior Notes or the 3.00% Senior Notes; however, both are subject to cross-default provisions. For a discussion of the Company’s Revolving Facility and Senior Notes as well as the associated covenants, refer to Note 7 in the Notes to Consolidated Financial Statements.
Credit Ratings
The Company’s credit ratings, which were independently developed by the following credit agencies, are detailed below:
•S&P Global Ratings affirmedreaffirmed the Company’s corporate credit rating of BBB (stable outlook) in August 2022.2023.
•Moody’s Investors Service affirmed the Company’s corporate credit rating of Baa2 (stable outlook) in December 2021.
•Fitch Ratings affirmedreaffirmed the Company’s corporate credit rating of BBB+ (stable outlook) in March 2022.April 2023.
DividendsOff-Balance Sheet Arrangements
The Company increased its quarterly cash dividend by 11% from $0.54 per common sharehad $10.5 million of letters of credit as of December 31, 2023, primarily issued as security for insurance and other performance obligations. Of the $10.5 million of letters of credit, only $3.4 million reduced the Company’s borrowing capacity under the Revolving Facility as of December 31, 2023.
Except as disclosed above, the Company has no off-balance sheet arrangements that currently have or are reasonably likely to have a material effect on the Company’s consolidated financial condition, changes in 2021 to $0.60 per common share in 2022. Total dividend payments to common shareholders were $177.4 million in 2022 compared with $161.1 million in 2021.financial condition, results of operations, liquidity, capital expenditures or capital resources.
Critical Accounting Estimates
The Company believes that the application of the following accounting policy, which is important to its financial position and results of operations, requires significant judgments and estimates on the part of management. For a summary of all of the Company’s accounting policies, including the accounting policy discussed below, see Note 1 in the Notes to Consolidated Financial Statements in Part II, Item 8, “Financial Statements and Supplementary Data.”Statements.
Goodwill and indefinite-lived intangible assets — The Company’s business acquisitions result in recording goodwillGoodwill and other intangible assets with indefinite lives, which affect the amountconsists solely of amortization expense and possibletrade names, are not amortized; rather they are tested for impairment expenseat least annually, or more frequently if events or circumstances indicate that the Company will incur in future periods. The Company evaluates the recoverability of certain noncurrent assets utilizing various estimation processes.asset may be impaired. The Company follows the guidance prescribed in Accounting Standards Codification (“ASC”) 350, Goodwill and Other Intangible Assets, to test goodwill and indefinite-lived intangible assets for impairment. TheIn assessing goodwill for impairment, the Company determines the fair value of each reporting unit utilizing an income approach (discounted cash flows) weighted 50% and a market approach (consisting of a comparable public company multiples methodology) weighted 50%. The Company uses the relief-from-royalty method, a form of the income approach, to determine the fair value of its indefinite-lived intangible assets. The relief-from-royalty method is dependent on a number of significant management assumptions, including estimates of revenues, royalty rates and discount rates. To determine the reasonableness of the calculated fair values, the Company reviews the assumptions to ensure that neither the income approach nor the market approach yielded significantly different valuations. Key assumptions and estimates used in the goodwill impairment assessment are described below. Based on the results of the Company’s annual impairment test at October 31, 2022,2023, all reporting units had fair values substantially in excess of their carrying values.
The key assumptions are updated every year for each reporting unit for the income and market approaches used to determine the fair value. Various assumptions are utilized including forecasted operating results, annual operating plans, strategic plans, economic projections, anticipated future cash flows, the weighted average cost of capital, market data and market multiples. The assumptions that have the most significant effect on the fair value calculations are the weighted average cost of capital, market multiples, forecasted EBITDA and terminal growth rates. The following assumption ranges were utilized by the Company in 20222023 and 2021:2022:
| | | | | | | | | | | |
| Assumptions | 20222023
Range | | 20212022
Range |
| Weighted average cost of capital | 10.00% to 12.25% | | 9.75% to 11.50% | | 8.25% to 9.75% |
| Market multiples | 10.0x to 19.0x20.0x | | 13.0x10.0x to 22.0x19.0x |
| Terminal growth rates | 2.5%3.0% to 3.5% | | 2.5% to 3.5% |
In assessing trade names for impairment, the Company uses the relief-from-royalty method, a form of the income approach, to determine the fair value of its trade names. The relief-from-royalty method is dependent on a number of significant management assumptions, including estimates of revenues, royalty rates and discount rates. Based on the results of the Company’s annual impairment test at October 31, 2023, the trade names had fair values in excess of their carrying values.
The Company’s acquisitions have generally included significant goodwill components and the Company expects to continue to make acquisitions. At December 31, 2023, goodwill and other indefinite-lived intangible assets totaled $2,929.2 million, or 50%, of the Company’s total assets.
See Note 6 in the Notes to Consolidated Financial Statements for further discussion on goodwill and indefinite-lived intangible assets.
Non-GAAP Disclosures
Set forth below are reconciliations of each of Organic net sales, Adjusted net sales, Adjusted gross profit, Adjusted gross margin, Adjusted net income attributable to IDEX, Adjusted diluted earnings per share (“EPS”) attributable to IDEX, Consolidated Adjusted earnings before interest, income taxes, depreciation and amortization (“Adjusted EBITDA”) and Consolidated Adjusted EBITDA margin to itstheir respective most directly comparable U.S. GAAP measure. Management uses these metrics to measure performance of the Company since they exclude items that are not reflective of ongoing operations, such as fair value inventory step-up charges, restructuring expenses and asset impairments,identified in the impact from the exit of a COVID-19 testing application, gain on sale of a business, gains on sales of assets, the impact of the settlement of a corporate transaction indemnity, the loss on early debt redemption, the noncash loss related to the termination of the U.S. pension plan, net of curtailment and acquisition-related intangible asset amortization.reconciliations below. Management also supplements its U.S. GAAP financial statements with adjusted information to provide investors with greater insight, transparency and a more comprehensive understanding of the information used by management in its financial and operational decision making.
This report references organic salesManagement uses Adjusted EBITDA as its principal measure of segment performance, and organic operating income, non-GAAP measures, that exclude (1) the impact of foreign currency translation and (2) sales and operating income, respectively, from acquired or divested businesses during the first 12 months of ownership or prior to divestiture and (3) the impact from the exit of a COVID-19 testing application. The portion of sales and operating income attributable to foreign currency translation is calculated as the difference between (a) the period-to-period change in organic sales and organic operating income, respectively, and (b) the period-to-period change in organic sales and organic operating income, respectively, after applying prior period foreign exchange rates to the current year period. Management believes that reporting organic sales and organic operating income provides useful information to investors by helping to identify underlying growth trends in the Company’s business and facilitating easier comparisons of the Company’s revenue and operating performance with prior and future periods and to its peers. The Company excludes the effect of foreign currency translation from organic sales and organic operating income because foreign currency translation is not under management’s control, is subject to volatility and can obscure underlying business trends. The Company excludes the effect of acquisitions and divestitures because they can obscure underlying business trends and make comparisons of long-term performance difficult due to the varying nature, size and number of transactions from period to period and between the Company and its peers. The Company excludes the impact from the exit of a COVID-19 testing application because it is not reflective of ongoing operations and can obscure underlying business trends.
Management believes that Adjusted EBITDA, which is EBITDA adjusted for items that are not reflective of ongoing operations, isa useful as a performance indicator of ongoing operations. The Company believes that Adjusted EBITDA is useful to investors as an indicator of the strength and performance of the Company and its segments’ ongoing business operations, andas well as a way for investors to evaluate and compare operating performance and value companies within the Company’s industry. Management believes that Adjusted EBITDA margin is useful for the same reason as Adjusted EBITDA. The definition of Adjusted EBITDA used here may differ from that used by other companies.
This report also references free cash flow. This non-GAAP measure is discussed and reconciled to its most directly comparable GAAP measure in the section above titled “Free Cash Flow.”
The non-GAAP financial measures disclosed by the Company should not be considered a substitute for, or superior to, financial measures prepared in accordance with U.S. GAAP. Due to rounding, numbers presented throughout this and other documents may not add up or recalculate precisely. The financial results prepared in accordance with U.S. GAAP and the reconciliations from these results should be carefully evaluated.
All table footnotes can be found at the end of this Non-GAAP Disclosures section.
| | | | | | | | | | | | | | | | | | | | | | | | | | | | | | | | | | | | | | | | | | | | | | | |
| 1. Reconciliations of the Change in Net Sales to Organic Net Sales | | | |
| |
| For the Years Ended December 31, |
| 2023 | | 2022 |
| FMT | | HST | | FSDP | | IDEX | | FMT | | HST | | FSDP | | IDEX |
| Change in net sales | 7 | % | | (2 | %) | | 6 | % | | 3 | % | | 17 | % | | 19 | % | | 5 | % | | 15 | % |
| Less: | | | | | | | | | | | | | | | |
Net impact from acquisitions/divestitures(1) | 2 | % | | 9 | % | | — | % | | 5 | % | | 7 | % | | 6 | % | | — | % | | 5 | % |
Impact from foreign currency(2) | — | % | | — | % | | — | % | | — | % | | (3 | %) | | (4 | %) | | (4 | %) | | (4 | %) |
Impact from the exit of a COVID-19 testing application(3) | — | % | | (1 | %) | | — | % | | (1 | %) | | — | % | | 2 | % | | — | % | | 1 | % |
| Change in organic net sales | 5 | % | | (10 | %) | | 6 | % | | (1 | %) | | 13 | % | | 15 | % | | 9 | % | | 13 | % |
| | | | | | | | | | | | | | | | | | | | | | | | | | | | | | | | | | | | | | | | | | | | | | | | | | | | | | | |
| 1. Reconciliations of the Change in Net Sales to Organic Net Sales | | | | | | | | | | | |
| |
| For the Years Ended December 31, |
| 2022 | | 2021 | | |
| FMT | | HST | | FSDP | | IDEX | | FMT | | HST | | FSDP | | IDEX | | | | | | | | |
| Change in net sales | 17 | % | | 19 | % | | 5 | % | | 15 | % | | 11 | % | | 25 | % | | 15 | % | | 18 | % | | | | | | | | |
| - Net impact from acquisitions/divestitures | 7 | % | | 6 | % | | — | % | | 5 | % | | 4 | % | | 5 | % | | — | % | | 4 | % | | | | | | | | |
| - Impact from foreign currency | (3 | %) | | (4 | %) | | (4 | %) | | (4 | %) | | 1 | % | | 2 | % | | 2 | % | | 2 | % | | | | | | | | |
- Impact from the exit of a COVID-19 testing application(1) | — | % | | 2 | % | | — | % | | 1 | % | | — | % | | — | % | | — | % | | — | % | | | | | | | | |
| Change in organic net sales | 13 | % | | 15 | % | | 9 | % | | 13 | % | | 6 | % | | 18 | % | | 13 | % | | 12 | % | | | | | | | | |
| | | | | | | | | | | |
2. Reconciliations of Reported-to-Adjusted Gross Profit, Net Sales and Gross Margin (dollars in millions) |
| | | |
| For the Years Ended December 31, |
| 2023 | | 2022 |
| Gross profit | $ | 1,446.9 | | $ | 1,426.9 |
Impact from the exit of a COVID-19 testing application(3) | — | | (17.9) |
| Fair value inventory step-up charges | 1.6 | | 8.5 |
| Adjusted gross profit | $ | 1,448.5 | | $ | 1,417.5 |
| | | |
| Net sales | $ | 3,273.9 | | $ | 3,181.9 |
Impact from the exit of a COVID-19 testing application(3) | | | (17.9) |
| Adjusted net sales | | | $ | 3,164.0 |
| | | |
| Gross margin | 44.2 | % | | 44.8 | % |
| Adjusted gross margin | 44.2 | % | | 44.8 | % |
| | | | | | | | | | | |
3. Reconciliations of Reported-to-Adjusted Net Income Attributable to IDEX and Diluted EPS Attributable to IDEX (in millions, except per share amounts) |
| |
| For the Years Ended December 31, |
| 2023 | | 2022 |
| Reported net income attributable to IDEX | $ | 596.1 | | | $ | 586.9 | |
| Fair value inventory step-up charges | 1.6 | | | 8.5 | |
| Tax impact on fair value inventory step-up charges | (0.4) | | | (2.2) | |
| Restructuring expenses and asset impairments | 10.9 | | | 4.5 | |
| Tax impact on restructuring expenses and asset impairments | (2.5) | | | (0.9) | |
Net impact from the exit of a COVID-19 testing application(3) | — | | | (1.1) | |
| Tax impact on the exit of a COVID-19 testing application | — | | | 0.3 | |
| Gain on sale of businesses - net | (84.7) | | | (34.8) | |
| Tax impact on gain on sale of businesses - net | 22.7 | | | 5.5 | |
| Gains on sales of assets | — | | | (2.7) | |
| Tax impact on gains on sales of assets | — | | | 0.6 | |
Credit loss on note receivable from collaborative partner(4) | 7.7 | | | — | |
| Tax impact on credit loss on note receivable from collaborative partner | (1.6) | | | — | |
| Acquisition-related intangible asset amortization | 94.9 | | | 69.0 | |
| Tax impact on acquisition-related intangible asset amortization | (21.1) | | | (15.5) | |
| Adjusted net income attributable to IDEX | $ | 623.6 | | | $ | 618.1 | |
| | | |
| Reported diluted EPS attributable to IDEX | $ | 7.85 | | | $ | 7.71 | |
| Fair value inventory step-up charges | 0.02 | | | 0.11 | |
| Tax impact on fair value inventory step-up charges | — | | | (0.03) | |
| Restructuring expenses and asset impairments | 0.15 | | | 0.06 | |
| Tax impact on restructuring expenses and asset impairments | (0.03) | | | (0.01) | |
Net impact from the exit of a COVID-19 testing application(3) | — | | | (0.01) | |
| Tax impact on the exit of a COVID-19 testing application | — | | | — | |
| Gain on sale of businesses - net | (1.12) | | | (0.46) | |
| Tax impact on gain on sale of businesses - net | 0.30 | | | 0.07 | |
| Gains on sales of assets | — | | | (0.03) | |
| Tax impact on gains on sales of assets | — | | | 0.01 | |
Credit loss on note receivable from collaborative partner(4) | 0.10 | | | — | |
| Tax impact on credit loss on note receivable from collaborative partner | (0.02) | | | — | |
| Acquisition-related intangible asset amortization | 1.25 | | | 0.91 | |
| Tax impact on acquisition-related intangible asset amortization | (0.28) | | | (0.21) | |
| Adjusted diluted EPS attributable to IDEX | $ | 8.22 | | | $ | 8.12 | |
| | | |
| Diluted weighted average shares outstanding | 75.9 | | | 76.0 | |
| | | | | | | | | | | | | | | | | | | | | | | | | | | | | | | | | | | | | | | | | | | | | | | | | | | | | | | | | | | |
4. Reconciliations of Net Income to Adjusted EBITDA and Net Sales to Adjusted Net Sales (dollars in millions) |
| | | | | | | | | | | | | | | | | | | |
| For the Year Ended December 31, |
| 2023 | | 2022 |
| FMT | | HST | | FSDP | | Corporate | | IDEX | | FMT | | HST | | FSDP | | Corporate | | IDEX |
| Reported net income | $ | — | | $ | — | | $ | — | | $ | — | | $ | 595.6 | | $ | — | | $ | — | | $ | — | | $ | — | | $ | 586.7 |
| Provision for income taxes | — | | — | | — | | — | | 164.7 | | — | | — | | — | | — | | 162.7 |
| Interest expense | — | | — | | — | | — | | 51.7 | | — | | — | | — | | — | | 40.7 |
| Other expense (income) - net | — | | — | | — | | — | | 5.2 | | — | | — | | — | | — | | (3.9) |
| Gain on sale of businesses - net | — | | — | | — | | — | | (84.7) | | — | | — | | — | | — | | (34.8) |
| Operating income (loss) | 374.2 | | 253.4 | | 192.2 | | (87.3) | | 732.5 | | 334.0 | | 334.9 | | 166.6 | | (84.1) | | 751.4 |
| Other income (expense) - net | 2.2 | | (1.1) | | 0.2 | | (6.5) | | (5.2) | | 1.8 | | 1.9 | | 2.4 | | (2.2) | | 3.9 |
| Depreciation | 14.1 | | 33.2 | | 8.9 | | 1.0 | | 57.2 | | 16.1 | | 25.7 | | 8.4 | | 0.5 | | 50.7 |
| Amortization | 22.7 | | 65.8 | | 6.4 | | — | | 94.9 | | 20.8 | | 41.6 | | 6.6 | | — | | 69.0 |
| Fair value inventory step-up charges | — | | 1.6 | | — | | — | | 1.6 | | 0.4 | | 8.1 | | — | | — | | 8.5 |
| Restructuring expenses and asset impairments | 2.9 | | 6.6 | | 0.9 | | 0.5 | | 10.9 | | 2.3 | | 0.7 | | 1.4 | | 0.1 | | 4.5 |
Net impact from the exit of a COVID-19 testing application(3) | — | | — | | — | | — | | — | | — | | (1.1) | | — | | — | | (1.1) |
| Gains on sales of assets | — | | — | | — | | — | | — | | (1.2) | | — | | (1.5) | | — | | (2.7) |
Credit loss on note receivable from collaborative partner(4) | — | | — | | — | | 7.7 | | 7.7 | | — | | — | | — | | — | | — |
| Adjusted EBITDA | $ | 416.1 | | $ | 359.5 | | $ | 208.6 | | $ | (84.6) | | $ | 899.6 | | $ | 374.2 | | $ | 411.8 | | $ | 183.9 | | $ | (85.7) | | $ | 884.2 |
| | | | | | | | | | | | | | | | | | | |
| Net sales (eliminations) | $ | 1,247.1 | | $ | 1,316.4 | | $ | 718.8 | | $ | (8.4) | | $ | 3,273.9 | | $ | 1,167.3 | | $ | 1,339.2 | | $ | 679.2 | | $ | (3.8) | | $ | 3,181.9 |
Impact from the exit of a COVID-19 testing application(3) | | | | | | | | | | | | | (17.9) | | | | | | | (17.9) | |
| Adjusted net sales (eliminations) | | | | | | | | | | | | $ | — | | $ | 1,321.3 | | | | | | | $ | 3,164.0 | |
| | | | | | | | | | | | | | | | | | | |
| Net income margin | | | | | | | | | 18.2 | % | | | | | | | | | | 18.4 | % |
| Adjusted EBITDA margin | 33.4 | % | | 27.3 | % | | 29.0 | % | | n/m | | 27.5 | % | | 32.1 | % | | 31.2 | % | | 27.1 | % | | n/m | | 27.9 | % |
(1) Represents the sales from acquired or divested businesses during the first 12 months of ownership or prior to divestiture.
(2)Represents The portion of sales attributable to foreign currency translation is calculated as the difference between (a) the period-to-period change in organic sales, and (b) the period-to-period change in organic sales after applying prior period foreign exchange rates to the current year period.
(3)The impact to Net sales and Gross margin represents the acceleration of previously deferred revenue of $17.9 million as a result of a customer’s decision to discontinue further investment in commercializing its COVID-19 testing application.application in 2022 that did not reoccur in 2023, which was largely offset by an impairment charge during the same period resulting in a $1.1 million impact on net income. See Note 114 in the Notes to Consolidated Financial Statements for further detail. (4)Represents a reserve recorded on an investment with a collaborative partner. See 5Note 3 in the Notes to Consolidated Financial Statements for further detail.
| | | | | | | | | | | | | |
| 2. Reconciliations of Reported-to-Adjusted Net Income and Diluted EPS |
| |
| (In millions, except per share amounts) | For the Years Ended December 31, |
| 2022 | | 2021 | | |
| Reported net income attributable to IDEX | $ | 586.9 | | | $ | 449.4 | | | |
| + Restructuring expenses and asset impairments | 4.5 | | | 9.3 | | | |
| + Tax impact on restructuring expenses and asset impairments | (0.9) | | | (2.2) | | | |
| + Fair value inventory step-up charges | 8.5 | | | 11.6 | | | |
| + Tax impact on fair value inventory step-up charges | (2.2) | | | (2.7) | | | |
- Net impact from the exit of a COVID-19 testing application(1) | (1.1) | | | — | | | |
| + Tax impact on the exit of a COVID-19 testing application | 0.3 | | | — | | | |
| - Gain on sale of business | (34.8) | | | — | | | |
| + Tax impact on gain on sale of business | 5.5 | | | — | | | |
| - Gains on sales of assets | (2.7) | | | — | | | |
| + Tax impact on gains on sales of assets | 0.6 | | | — | | | |
| + Loss on early debt redemption | — | | | 8.6 | | | |
| + Tax impact on loss on early debt redemption | — | | | (1.8) | | | |
| + Termination of the U.S. pension plan, net of curtailment | — | | | 8.6 | | | |
| + Tax impact on termination of the U.S. pension plan, net of curtailment | — | | | (1.9) | | | |
| + Corporate transaction indemnity | — | | | 3.5 | | | |
| + Tax impact on corporate transaction indemnity | — | | | (0.8) | | | |
| + Acquisition-related intangible asset amortization | 69.0 | | | 56.4 | | | |
| + Tax impact on acquisition-related intangible asset amortization | (15.5) | | | (12.9) | | | |
| Adjusted net income attributable to IDEX | $ | 618.1 | | | $ | 525.1 | | | |
| | | | | |
| Reported diluted EPS attributable to IDEX | $ | 7.71 | | | $ | 5.88 | | | |
| + Restructuring expenses and asset impairments | 0.06 | | | 0.12 | | | |
| + Tax impact on restructuring expenses and asset impairments | (0.01) | | | (0.03) | | | |
| + Fair value inventory step-up charges | 0.11 | | | 0.15 | | | |
| + Tax impact on fair value inventory step-up charges | (0.03) | | | (0.04) | | | |
- Net impact from the exit of a COVID-19 testing application(1) | (0.01) | | | — | | | |
| + Tax impact on the exit of a COVID-19 testing application | — | | | — | | | |
| - Gain on sale of business | (0.46) | | | — | | | |
| + Tax impact on gain on sale of business | 0.07 | | | — | | | |
| - Gains on sales of assets | (0.03) | | | — | | | |
| + Tax impact on gains on sales of assets | 0.01 | | | — | | | |
| + Loss on early debt redemption | — | | | 0.11 | | | |
| + Tax impact on loss on early debt redemption | — | | | (0.02) | | | |
| + Termination of the U.S. pension plan, net of curtailment | — | | | 0.11 | | | |
| + Tax impact on termination of the U.S. pension plan, net of curtailment | — | | | (0.02) | | | |
| + Corporate transaction indemnity | — | | | 0.05 | | | |
| + Tax impact on corporate transaction indemnity | — | | | (0.01) | | | |
| + Acquisition-related intangible asset amortization | 0.91 | | | 0.74 | | | |
| + Tax impact on acquisition-related intangible asset amortization | (0.21) | | | (0.17) | | | |
| Adjusted diluted EPS attributable to IDEX | $ | 8.12 | | | $ | 6.87 | | | |
| | | | | |
| Diluted weighted average shares outstanding | 76.0 | | | 76.4 | | | |
(1)Represents the net impact of the acceleration of previously deferred revenue of $17.9 million and an impairment charge of $16.8 million as a result of a customer’s decision to discontinue further investment in commercializing its COVID-19 testing application. See Note 15in the Notes to Consolidated Financial Statements for further detail.
| | | | | | | | | | | | | | | | | | | | | | | | | | | | | |
| 3. Reconciliations of Net Income to Adjusted EBITDA and Net Sales to Adjusted Net Sales |
| | | | | | | | | |
| (Dollars in millions) | | | | | | | | | |
| For the Year Ended December 31, 2022 |
| FMT | | HST | | FSDP | | Corporate | | IDEX |
| Reported net income | $ | — | | $ | — | | $ | — | | $ | — | | $ | 586.7 |
| + Provision for income taxes | — | | — | | — | | — | | 162.7 |
| + Interest expense | — | | — | | — | | — | | 40.7 |
| - Other income (expense) - net | — | | — | | — | | — | | 3.9 |
| - Gain on sale of business | — | | — | | — | | — | | 34.8 |
| Operating income (loss) | 334.0 | | 334.9 | | 166.6 | | (84.1) | | 751.4 |
| + Other income (expense) - net | 1.8 | | 1.9 | | 2.4 | | (2.2) | | 3.9 |
| + Depreciation | 16.1 | | 25.7 | | 8.4 | | 0.5 | | 50.7 |
| + Amortization | 20.8 | | 41.6 | | 6.6 | | — | | 69.0 |
| + Fair value inventory step-up charges | 0.4 | | 8.1 | | — | | — | | 8.5 |
| + Restructuring expenses and asset impairments | 2.3 | | 0.7 | | 1.4 | | 0.1 | | 4.5 |
- Net impact from the exit of a COVID-19 testing application(1) | — | | (1.1) | | — | | — | | (1.1) |
| - Gains on sales of assets | (1.2) | | — | | (1.5) | | — | | (2.7) |
| Adjusted EBITDA | $ | 374.2 | | $ | 411.8 | | $ | 183.9 | | $ | (85.7) | | $ | 884.2 |
| | | | | | | | | |
| Net sales (eliminations) | $ | 1,167.3 | | $ | 1,339.2 | | $ | 679.2 | | $ | (3.8) | | $ | 3,181.9 |
- Impact from the exit of a COVID-19 testing application (1) | | | (17.9) | | | | | | (17.9) |
| Adjusted net sales (eliminations) | | | $ | 1,321.3 | | | | | | $ | 3,164.0 |
| | | | | | | | | |
| Net income margin | | | | | | | | | 18.4 | % |
| Adjusted EBITDA margin | 32.1 | % | | 31.2 | % | | 27.1 | % | | n/m | | 27.9 | % |
(1)Represents the net impact of the acceleration of previously deferred revenue of $17.9 million and an impairment charge of $16.8 million as a result of a customer’s decision to discontinue further investment in commercializing its COVID-19 testing application. See Note 15 in the Notes to Consolidated Financial Statements for further detail.
| | | | | | | | | | | | | | | | | | | | | | | | | | | | | |
| For the Year Ended December 31, 2021 |
| FMT | | HST | | FSDP | | Corporate | | IDEX |
| Reported net income | $ | — | | $ | — | | $ | — | | $ | — | | $ | 449.3 |
| + Provision for income taxes | — | | — | | — | | — | | 130.5 |
| + Interest expense | — | | — | | — | | — | | 41.0 |
| - Other income (expense) - net | — | | — | | — | | — | | (16.2) |
| Operating income (loss) | 259.3 | | 288.9 | | 169.3 | | (80.5) | | 637.0 |
| + Other income (expense) - net | (6.1) | | (0.5) | | (1.2) | | (8.4) | | (16.2) |
| + Depreciation | 15.9 | | 21.6 | | 8.6 | | 0.5 | | 46.6 |
| + Amortization | 14.6 | | 35.1 | | 6.7 | | — | | 56.4 |
| + Fair value inventory step-up charges | 2.5 | | 9.1 | | — | | — | | 11.6 |
| + Restructuring expenses and asset impairments | 4.5 | | 1.7 | | 0.5 | | 2.6 | | 9.3 |
| + Corporate transaction indemnity | — | | — | | — | | 3.5 | | 3.5 |
| + Loss on early debt redemption | — | | — | | — | | 8.6 | | 8.6 |
| + Termination of the U.S. pension plan, net of curtailment | 6.3 | | — | | 1.8 | | 0.5 | | 8.6 |
| Adjusted EBITDA | $ | 297.0 | | $ | 355.9 | | $ | 185.7 | | $ | (73.2) | | $ | 765.4 |
| | | | | | | | | |
| Net sales (eliminations) | $ | 998.7 | | $ | 1,121.8 | | $ | 647.9 | | $ | (3.6) | | $ | 2,764.8 |
| | | | | | | | | |
| Net income margin | | | | | | | | | 16.3 | % |
| Adjusted EBITDA margin | 29.7 | % | | 31.7 | % | | 28.7 | % | | n/m | | 27.7 | % |
| | | | | | | | | | | | | | | | | | | | | | | | | | | | | |
| For the Year Ended December 31, 2020 |
| FMT | | HST | | FSDP | | Corporate | | IDEX |
| Reported net income | $ | — | | $ | — | | $ | — | | $ | — | | $ | 377.8 |
| + Provision for income taxes | — | | — | | — | | — | | 92.5 |
| + Interest expense | — | | — | | — | | — | | 44.8 |
| - Other income (expense) - net | — | | — | | — | | — | | (5.6) |
| Operating income (loss) | 235.0 | | 206.4 | | 144.2 | | (64.9) | | 520.7 |
| + Other income (expense) - net | 0.9 | | — | | (0.4) | | (6.1) | | (5.6) |
| + Depreciation | 14.8 | | 17.8 | | 8.5 | | 0.6 | | 41.7 |
| + Amortization | 11.1 | | 24.0 | | 6.7 | | — | | 41.8 |
| + Fair value inventory step-up charges | 4.1 | | — | | — | | — | | 4.1 |
| + Restructuring expenses and asset impairments | 5.6 | | 2.7 | | 2.5 | | 1.0 | | 11.8 |
| + Loss on early debt redemption | — | | — | | — | | 8.4 | | 8.4 |
| Adjusted EBITDA | $ | 271.5 | | $ | 250.9 | | $ | 161.5 | | $ | (61.0) | | $ | 622.9 |
| | | | | | | | | |
| Net sales (eliminations) | $ | 896.3 | | $ | 896.0 | | $ | 562.9 | | $ | (3.6) | | $ | 2,351.6 |
| | | | | | | | | |
| Net income margin | | | | | | | | | 16.1 | % |
| Adjusted EBITDA margin | 30.3 | % | | 28.0 | % | | 28.7 | % | | n/m | | 26.5 | % |
Item 7A. Quantitative and Qualitative Disclosures About Market Risk.
The Company is subject to market risk associated with changes in foreign currency exchange rates and interest rates as well as inflationary factors. The Company may, from time to time, enter into foreign currency forward contracts and interest rate swaps on its debt when it believes there is a financial advantage in doing so. A treasury risk management policy, adopted by the Board of Directors, describes the procedures and controls over derivative financial and commodity instruments, including foreign currency forward contracts and interest rate swaps. Under the policy, the Company does not use financial or commodity derivative instruments for trading purposes and the use of these instruments is subject to strict approvals by senior officers. Typically, the use of derivative instruments is limited to foreign currency forward contracts and interest rate swaps on the
Company’s outstanding long-term debt. As of December 31, 2022,2023, the Company did not have any derivative instruments outstanding.
Foreign Currency Exchange Rates
The Company’s foreign currency exchange rate risk is limited principally to the Euro, Swiss Franc, Canadian Dollar, British Pound, Canadian Dollar, Indian Rupee, Chinese Renminbi, Swedish Krona and Brazilian Real. The Company manages its foreign exchange risk principally through invoicing customers in the same currency as the source of products. The foreign currency transaction losses (gains) losses for the periods ended December 31, 2023, 2022 and 2021 and 2020 were $7.3 million, $(0.8) million, and $1.1 million and $3.0 million, respectively, and are reported within Other (Income) Expenseexpense (income) - Netnet on the Consolidated Statements of Income. See Note 1 in Part II, Item 8, “Financialthe Notes to Consolidated Financial Statements and Supplementary Data,” for further discussion.
Interest Rate Fluctuations
The Company has interest rate exposure due to $277.7$131.0 million of the $1,477.8$1,333.3 million debt outstanding at December 31, 20222023 being floating rate debt. The Company’s Revolving Facility and Term Facility both bear interest at either an alternate base rate or adjusted Term SOFR (or appropriate alternative currency reference rates) plus, in each case, an applicable margin based on the lower of the Company’s senior, unsecured, long-term debt rating or the Company’s applicable leverage ratio. At December 31, 2022,2023, there was $77.7$81.0 million outstanding under the Revolving Facility with an interest rate of 3.32%5.00% and $200.0$50.0 million outstanding under the Term Facility with an interest rate of 5.83%6.59%.
Inflation Risk
We source a wide variety of materials and components from a network of global suppliers. While materials are typically available from numerous suppliers, they are subject to price fluctuations, which could have a negative impact on our results. We seek to minimize the effects of inflation and changing prices through price increases to maintain reasonable gross margins.
Item 8. Financial Statements and Supplementary Data.
MANAGEMENT’S REPORT ON INTERNAL CONTROL OVER FINANCIAL REPORTING
Management is responsible for establishing and maintaining adequate internal control over financial reporting. Internal control over financial reporting is a process to provide reasonable assurance regarding the reliability of financial reporting and the preparation of financial statements for external purposes in accordance with accounting principles generally accepted in the United States of America, and as defined in Exchange Act Rule 13a-15(f).
Internal control over financial reporting cannot provide absolute assurance of achieving financial reporting objectives because of its inherent limitations. Because of such limitations, there is a risk that material misstatements may not be prevented or detected on a timely basis by internal control over financial reporting.
Management has used the framework set forth in the report entitled “Internal Control — Integrated Framework” (2013) issued by the Committee of Sponsoring Organizations of the Treadway Commission to assess the effectiveness of the Company’s internal control over financial reporting. Management excluded Nexsight, KZValveIridian Spectral Technologies and Muon Group (Note 2 - Acquisitions and Divestitures)STC Material Solutions from its assessment of internal controls over financial reporting as these acquisitions occurred in 2022.2023 (see Note 2 in the Notes to the Consolidated Financial Statements for further detail). This exclusion is in accordance with the general guidance from the Staff of the Securities and Exchange Commission that an assessment of a recently acquired business may be omitted from the scope of management’s assessment of internal control over financial reporting for one year following the acquisition. The total assets (excluding goodwill and intangible assets) and net sales of current year acquisitions represented were each approximately 3approximately one percent and zero percent, respectively, of the Consolidated Financial Statement amounts as of and for the year ended December 31, 2022.2023. Based on that assessment, management has concluded that the Company’s internal control over financial reporting was effective as of December 31, 2022.2023.
The effectiveness of the Company’s internal control over financial reporting as of December 31, 2022,2023, has been audited by Deloitte & Touche LLP, an independent registered public accounting firm, as stated in their report which appears herein.
REPORT OF INDEPENDENT REGISTERED PUBLIC ACCOUNTING FIRM
To the shareholders and the Board of Directors of IDEX Corporation
Opinion on Internal Control over Financial Reporting
We have audited the internal control over financial reporting of IDEX Corporation and subsidiaries (the “Company”) as of December 31, 2022,2023, based on criteria established in Internal Control -— Integrated Framework (2013) issued by the Committee of Sponsoring Organizations of the Treadway Commission (COSO). In our opinion, the Company maintained, in all material respects, effective internal control over financial reporting as of December 31, 2022,2023, based on criteria established in Internal Control - — Integrated Framework (2013) issued by COSO.
We have also audited, in accordance with the standards of the Public Company Accounting Oversight Board (United States) (PCAOB), the consolidated financial statements as of and for the year ended December 31, 2022,2023, of the Company and our report dated February 23, 2023,22, 2024, expressed an unqualified opinion on those financial statements.
As described in Management’s Report on Internal Control over Financial Reporting, management excluded Nexsight, KZValveIridian Spectral Technologies and Muon GroupSTC Material Solutions from its assessment of internal control over financial reporting as these acquisitions occurred in the twelve months ended December 31, 2022.2023. The combined total assets and net sales and total assets of these acquisitions represented approximately 3one percent for eachand zero percent, respectively, of the consolidated financial statement amounts as of and for the year ended December 31, 2022.2023. Accordingly, our audit did not include the internal control over financial reporting at these acquired companies.
Basis for Opinion
The Company’s management is responsible for maintaining effective internal control over financial reporting and for its assessment of the effectiveness of internal control over financial reporting, included in the accompanying Management’s Report on Internal Control Over Financial Reporting. Our responsibility is to express an opinion on the Company’s internal control over financial reporting based on our audit. We are a public accounting firm registered with the PCAOB and are required to be independent with respect to the Company in accordance with the U.S. federal securities laws and the applicable rules and regulations of the Securities and Exchange Commission and the PCAOB.
We conducted our audit in accordance with the standards of the PCAOB. Those standards require that we plan and perform the audit to obtain reasonable assurance about whether effective internal control over financial reporting was maintained in all material respects. Our audit included obtaining an understanding of internal control over financial reporting, assessing the risk that a material weakness exists, testing and evaluating the design and operating effectiveness of internal control based on the assessed risk, and performing such other procedures as we considered necessary in the circumstances. We believe that our audit provides a reasonable basis for our opinion.
Definition and Limitations of Internal Control over Financial Reporting
A company’s internal control over financial reporting is a process designed to provide reasonable assurance regarding the reliability of financial reporting and the preparation of financial statements for external purposes in accordance with generally accepted accounting principles. A company’s internal control over financial reporting includes those policies and procedures that (1) pertain to the maintenance of records that, in reasonable detail, accurately and fairly reflect the transactions and dispositions of the assets of the company; (2) provide reasonable assurance that transactions are recorded as necessary to permit preparation of financial statements in accordance with generally accepted accounting principles, and that receipts and expenditures of the company are being made only in accordance with authorizations of management and directors of the company; and (3) provide reasonable assurance regarding prevention or timely detection of unauthorized acquisition, use, or disposition of the company’s assets that could have a material effect on the financial statements.
Because of its inherent limitations, internal control over financial reporting may not prevent or detect misstatements. Also, projections of any evaluation of effectiveness to future periods are subject to the risk that controls may become inadequate because of changes in conditions, or that the degree of compliance with the policies or procedures may deteriorate.
| | | | | |
| /s/ DELOITTE & TOUCHE LLP | |
| |
| |
| Chicago, Illinois | |
February 23, 202322, 2024 | |
REPORT OF INDEPENDENT REGISTERED PUBLIC ACCOUNTING FIRM
To the shareholders and the Board of Directors of IDEX Corporation
Opinion on the Financial Statements
We have audited the accompanying consolidated balance sheets of IDEX Corporation and subsidiaries (the "Company") as of December 31, 20222023 and 2021,2022, the related consolidated statements of income, comprehensive income, equity, and cash flows, for each of the three years in the period ended December 31, 2022,2023, and the related notes (collectively referred to as the "financial statements"). In our opinion, the financial statements present fairly, in all material respects, the financial position of the Company as of December 31, 20222023 and 2021,2022, and the results of its operations and its cash flows for each of the three years in the period ended December 31, 2022,2023, in conformity with accounting principles generally accepted in the United States of America.
We have also audited, in accordance with the standards of the Public Company Accounting Oversight Board (United States) (PCAOB), the Company's internal control over financial reporting as of December 31, 2022,2023, based on criteria established in Internal Control - — Integrated Framework (2013) issued by the Committee of Sponsoring Organizations of the Treadway Commission and our report dated February 23, 2023,22, 2024, expressed an unqualified opinion on the Company's internal control over financial reporting.
Basis for Opinion
These financial statements are the responsibility of the Company's management. Our responsibility is to express an opinion on the Company's financial statements based on our audits. We are a public accounting firm registered with the PCAOB and are required to be independent with respect to the Company in accordance with the U.S. federal securities laws and the applicable rules and regulations of the Securities and Exchange Commission and the PCAOB.
We conducted our audits in accordance with the standards of the PCAOB. Those standards require that we plan and perform the audit to obtain reasonable assurance about whether the financial statements are free of material misstatement, whether due to error or fraud. Our audits included performing procedures to assess the risks of material misstatement of the financial statements, whether due to error or fraud, and performing procedures that respond to those risks. Such procedures included examining, on a test basis, evidence regarding the amounts and disclosures in the financial statements. Our audits also included evaluating the accounting principles used and significant estimates made by management, as well as evaluating the overall presentation of the financial statements. We believe that our audits provide a reasonable basis for our opinion.
Critical Audit Matter
The critical audit matter communicated below is a matter arising from the current-period audit of the financial statements that was communicated or required to be communicated to the audit committee and that (1) relates to accounts or disclosures that are material to the financial statements and (2) involved our especially challenging, subjective, or complex judgments. The communication of critical audit matters does not alter in any way our opinion on the financial statements, taken as a whole, and we are not, by communicating the critical audit matter below, providing a separate opinion on the critical audit matter or on the accounts or disclosures to which it relates.
Revenue -— Disaggregation of Revenue -— Refer to Note 5 to the Financial Statementsfinancial statements
Critical Audit Matter Description
The Company is a highly diversified business with a wide range of products and services that are offered in various markets throughout the world. The Company’s business activities are carried out by numerous individual business units, which offer a unique set of products and include niche markets within specific geographic areas.
We identified revenue as a critical audit matter given the disaggregated nature of the Company’s operations and business units generating revenue. This required extensive audit effort due to the volume of the underlying transactions and distinctiveness of each individual business unit. High levels of auditor judgment were necessary to determine the nature, timing, and extent of audit procedures and the level of disaggregation within the Company at which to perform such procedures, especially given limited market data for certain products or geographic areas.
How the Critical Audit Matter Was Addressed in the Audit
Our audit procedures related to the Company’s revenue transactions included the following, among others:
•We tested internal controls within the relevant revenue business processes, including controls over revenue recognition and controls over the review of significant revenue transactions and operating results.
•For a sample of revenue transactions, we performed detail transaction testing by agreeing the amounts recorded to source documents and determined that revenue was recognized appropriately.
•For the revenue populations subject to detail testing, we tested the completeness of revenue by making selections from reciprocal populations (e.g., cash receipts) and determined whether the transaction was recorded as a sale in the general ledger.
•For revenue transactions not subject to detail transaction testing, we aggregated the revenue transactions at the reporting unit level and performed substantive analytical procedures. We developed independent expectations of revenue based on data derived from published industry indices and market and customer trends and compared our independent expectations to the revenue recorded by management.
| | | | | |
| /s/ DELOITTE & TOUCHE LLP | |
| |
| |
| Chicago, Illinois | |
February 23, 202322, 2024 | |
We have served as the Company’s auditor since 1987.
IDEX CORPORATION
CONSOLIDATED BALANCE SHEETS
| | | | | | | | | | | |
| | As of December 31, |
| | 2022 | | 2021 |
| | (Dollars in millions except
per share amounts) |
| ASSETS | | | |
| Current assets | | | |
| Cash and cash equivalents | $ | 430.2 | | | $ | 855.4 | |
| Receivables - net | 442.8 | | | 356.4 | |
| Inventories | 470.9 | | | 370.4 | |
| Other current assets | 55.4 | | | 95.8 | |
| Total current assets | 1,399.3 | | | 1,678.0 | |
| Property, plant and equipment - net | 382.1 | | | 327.3 | |
| Goodwill | 2,638.1 | | | 2,167.7 | |
| Intangible assets - net | 947.8 | | | 597.3 | |
| Other noncurrent assets | 144.6 | | | 146.9 | |
| Total assets | $ | 5,511.9 | | | $ | 4,917.2 | |
| LIABILITIES AND EQUITY | | | |
| Current liabilities | | | |
| Trade accounts payable | $ | 208.9 | | | $ | 178.8 | |
| Accrued expenses | 289.1 | | | 259.8 | |
| Dividends payable | 45.6 | | | 41.4 | |
| Total current liabilities | 543.6 | | | 480.0 | |
| Long-term borrowings | 1,468.7 | | | 1,190.3 | |
| Deferred income taxes | 264.2 | | | 196.4 | |
| Other noncurrent liabilities | 195.8 | | | 247.4 | |
| Total liabilities | 2,472.3 | | | 2,114.1 | |
Commitments and contingencies (Note 11) | | | |
| Shareholders’ equity | | | |
| Preferred stock: | | | |
| Authorized: 5,000,000 shares, $.01 per share par value; Issued: None | — | | | — | |
| Common stock: | | | |
| Authorized: 150,000,000 shares, $.01 per share par value | | | |
| Issued: 90,064,988 shares at December 31, 2022 and 90,067,996 shares at December 31, 2021 | 0.9 | | | 0.9 | |
| Additional paid-in capital | 817.2 | | | 795.6 | |
| Retained earnings | 3,531.7 | | | 3,126.5 | |
| Treasury stock at cost: 14,451,032 shares at December 31, 2022 and 13,872,555 shares at December 31, 2021 | (1,184.3) | | | (1,050.3) | |
| Accumulated other comprehensive loss | (126.2) | | | (69.6) | |
| Total shareholders’ equity | 3,039.3 | | | 2,803.1 | |
| Noncontrolling interest | 0.3 | | | — | |
| Total equity | 3,039.6 | | | 2,803.1 | |
| Total liabilities and equity | $ | 5,511.9 | | | $ | 4,917.2 | |
See Notes to Consolidated Financial Statements.
IDEX CORPORATION
CONSOLIDATED STATEMENTS OF INCOME
(In millions, except per share amounts)
| | | | For the Year Ended December 31, |
| | | 2022 | | 2021 | | 2020 | | For the Year Ended December 31, |
| | | (In millions except per share amounts) | | 2023 | | 2022 | | 2021 |
| Net sales | Net sales | $ | 3,181.9 | | | $ | 2,764.8 | | | $ | 2,351.6 | |
| Cost of sales | Cost of sales | 1,755.0 | | | 1,540.3 | | | 1,324.2 | |
| Gross profit | Gross profit | 1,426.9 | | | 1,224.5 | | | 1,027.4 | |
| Selling, general and administrative expenses | Selling, general and administrative expenses | 652.7 | | | 578.2 | | | 494.9 | |
| Restructuring expenses and asset impairments | Restructuring expenses and asset impairments | 22.8 | | | 9.3 | | | 11.8 | |
| Operating income | Operating income | 751.4 | | | 637.0 | | | 520.7 | |
| Gain on sale of business | (34.8) | | | — | | | — | |
| Other (income) expense - net | (3.9) | | | 16.2 | | | 5.6 | |
| Gain on sale of businesses - net | |
| Other expense (income) - net | |
| Interest expense | Interest expense | 40.7 | | | 41.0 | | | 44.8 | |
| Income before income taxes | Income before income taxes | 749.4 | | | 579.8 | | | 470.3 | |
| Provision for income taxes | Provision for income taxes | 162.7 | | | 130.5 | | | 92.5 | |
| Net income | Net income | 586.7 | | | 449.3 | | | 377.8 | |
| Net loss attributable to noncontrolling interest | Net loss attributable to noncontrolling interest | 0.2 | | | 0.1 | | | — | |
| Net income attributable to IDEX | Net income attributable to IDEX | $ | 586.9 | | | $ | 449.4 | | | $ | 377.8 | |
| | Earnings per common share: | Earnings per common share: | |
| Earnings per common share: | |
| Earnings per common share: | |
| Basic earnings per common share attributable to IDEX | |
| Basic earnings per common share attributable to IDEX | |
| Basic earnings per common share attributable to IDEX | Basic earnings per common share attributable to IDEX | $ | 7.74 | | | $ | 5.91 | | | $ | 4.98 | |
| Diluted earnings per common share attributable to IDEX | Diluted earnings per common share attributable to IDEX | $ | 7.71 | | | $ | 5.88 | | | $ | 4.94 | |
| | Share data: | Share data: | |
| Share data: | |
| Share data: | |
| Basic weighted average common shares outstanding | |
| Basic weighted average common shares outstanding | |
| Basic weighted average common shares outstanding | Basic weighted average common shares outstanding | 75.7 | | | 76.0 | | | 75.7 | |
| Diluted weighted average common shares outstanding | Diluted weighted average common shares outstanding | 76.0 | | | 76.4 | | | 76.4 | |
See Notes to Consolidated Financial Statements.
IDEX CORPORATION
CONSOLIDATED STATEMENTS OF COMPREHENSIVE INCOME
(In millions)
| | | | | | | | | | | | | | | | | |
| | For the Year Ended December 31, |
| | 2023 | | 2022 | | 2021 |
| Net income | $ | 595.6 | | | $ | 586.7 | | | $ | 449.3 | |
| Other comprehensive loss: | | | | | |
| Reclassification adjustments for derivatives, net of tax | — | | | — | | | 2.5 | |
| Pension and other postretirement adjustments, net of tax | (7.4) | | | 18.3 | | | 17.0 | |
| Cumulative translation adjustment | 87.8 | | | (74.9) | | | (75.6) | |
| Other comprehensive income (loss) | 80.4 | | | (56.6) | | | (56.1) | |
| Comprehensive income | 676.0 | | | 530.1 | | | 393.2 | |
| Comprehensive loss attributable to noncontrolling interest | 0.5 | | | 0.2 | | | — | |
| Comprehensive income attributable to IDEX | $ | 676.5 | | | $ | 530.3 | | | $ | 393.2 | |
See Notes to Consolidated Financial Statements.
IDEX CORPORATION
CONSOLIDATED STATEMENTS OF COMPREHENSIVE INCOMEBALANCE SHEETS
(Dollars in millions, except per share amounts) | | | | | | | | | | | | | | | | | |
| | For the Year Ended December 31, |
| | 2022 | | 2021 | | 2020 |
| | (In millions) |
| Net income | $ | 586.7 | | | $ | 449.3 | | | $ | 377.8 | |
| Other comprehensive (loss) income: | | | | | |
| Reclassification adjustments for derivatives, net of tax | — | | | 2.5 | | | 4.6 | |
| Pension and other postretirement adjustments, net of tax | 18.3 | | | 17.0 | | | 1.4 | |
| Cumulative translation adjustment | (74.9) | | | (75.6) | | | 107.8 | |
| Other comprehensive (loss) income | (56.6) | | | (56.1) | | | 113.8 | |
| Comprehensive income | 530.1 | | | 393.2 | | | 491.6 | |
| Comprehensive loss attributable to noncontrolling interest | 0.2 | | | — | | | — | |
| Comprehensive income attributable to IDEX | $ | 530.3 | | | $ | 393.2 | | | $ | 491.6 | |
| | | | | | | | | | | |
| | As of December 31, |
| | 2023 | | 2022 |
| ASSETS | | | |
| Current assets | | | |
| Cash and cash equivalents | $ | 534.3 | | | $ | 430.2 | |
| Receivables - net | 427.8 | | | 442.8 | |
| Inventories - net | 420.8 | | | 470.9 | |
| Other current assets | 63.4 | | | 55.4 | |
| Total current assets | 1,446.3 | | | 1,399.3 | |
| Property, plant and equipment - net | 430.3 | | | 382.1 | |
| Goodwill | 2,838.3 | | | 2,638.1 | |
| Intangible assets - net | 1,011.8 | | | 947.8 | |
| Other noncurrent assets | 138.5 | | | 144.6 | |
| Total assets | $ | 5,865.2 | | | $ | 5,511.9 | |
| LIABILITIES AND EQUITY | | | |
| Current liabilities | | | |
| Trade accounts payable | $ | 179.7 | | | $ | 208.9 | |
| Accrued expenses | 271.5 | | | 289.1 | |
| Current portion of long-term borrowings | 0.6 | | | — | |
| Dividends payable | 48.5 | | | 45.6 | |
| Total current liabilities | 500.3 | | | 543.6 | |
| Long-term borrowings - net | 1,325.1 | | | 1,468.7 | |
| Deferred income taxes | 291.9 | | | 264.2 | |
| Other noncurrent liabilities | 206.7 | | | 195.8 | |
| Total liabilities | 2,324.0 | | | 2,472.3 | |
Commitments and contingencies (Note 10) | | | |
| Shareholders’ equity | | | |
| Preferred stock: | | | |
| Authorized: 5,000,000 shares, $.01 per share par value; Issued: None | — | | | — | |
| Common stock: | | | |
| Authorized: 150,000,000 shares, $.01 per share par value | | | |
| Issued: 90,073,413 shares at December 31, 2023 and 90,064,988 shares at December 31, 2022 | 0.9 | | | 0.9 | |
| Additional paid-in capital | 839.0 | | | 817.2 | |
| Retained earnings | 3,934.3 | | | 3,531.7 | |
| Treasury stock at cost: 14,344,820 shares at December 31, 2023 and 14,451,032 shares at December 31, 2022 | (1,187.0) | | | (1,184.3) | |
| Accumulated other comprehensive loss | (45.8) | | | (126.2) | |
| Total shareholders’ equity | 3,541.4 | | | 3,039.3 | |
| Noncontrolling interest | (0.2) | | | 0.3 | |
| Total equity | 3,541.2 | | | 3,039.6 | |
| Total liabilities and equity | $ | 5,865.2 | | | $ | 5,511.9 | |
See Notes to Consolidated Financial Statements.
IDEX CORPORATION
CONSOLIDATED STATEMENTS OF EQUITY
(Dollars in millions except share and per share amounts)
| | | | | | | | | | | | | | | | | | | | | | | | | | | | | | | | | | | | | | | | | | | | | | | | | | | | | |
| | Common
Stock and
Additional
Paid-In Capital | | Retained
Earnings | | Accumulated Other Comprehensive Loss | | Treasury
Stock | | Total
Shareholders’
Equity | | Noncontrolling Interest | | Total Equity |
| | Cumulative
Translation
Adjustment | | Retirement
Benefits
Adjustments | | Cumulative
Unrealized
Gain (Loss)
on
Derivatives | |
| | (Dollars in millions except share and per share amounts) |
| Balance, December 31, 2019 | $ | 761.3 | | | $ | 2,615.1 | | | $ | (94.4) | | | $ | (25.8) | | | $ | (7.1) | | | $ | (985.9) | | | $ | 2,263.2 | | | $ | — | | | $ | 2,263.2 | |
| Net income | — | | | 377.8 | | | — | | | — | | | — | | | — | | | 377.8 | | | — | | | 377.8 | |
| Cumulative translation adjustment | — | | | — | | | 107.8 | | | — | | | — | | | — | | | 107.8 | | | — | | | 107.8 | |
| Net change in retirement obligations (net of tax of $0.1) | — | | | — | | | — | | | 1.4 | | | — | | | — | | | 1.4 | | | — | | | 1.4 | |
| Net change on derivatives designated as cash flow hedges (net of tax of $1.4) | — | | | — | | | — | | | — | | | 4.6 | | | — | | | 4.6 | | | — | | | 4.6 | |
| Issuance of 688,563 shares of common stock from issuance of unvested shares, performance share units and exercise of stock options (net of tax of $5.0) | — | | | — | | | — | | | — | | | — | | | 44.6 | | | 44.6 | | | — | | | 44.6 | |
| Repurchase of 876,423 shares of common stock | — | | | | | | | | | | | (110.3) | | | (110.3) | | | — | | | (110.3) | |
| Share-based compensation | 14.8 | | | — | | | — | | | — | | | — | | | — | | | 14.8 | | | — | | | 14.8 | |
| Shares surrendered for tax withholding | — | | | — | | | — | | | — | | | — | | | (12.3) | | | (12.3) | | | — | | | (12.3) | |
| Cash dividends declared - $2.00 per common share outstanding | — | | | (151.4) | | | — | | | — | | | — | | | — | | | (151.4) | | | — | | | (151.4) | |
| Contributions received from joint venture partner | — | | | — | | | — | | | — | | | — | | | — | | | — | | | 0.1 | | | 0.1 | |
| Balance, December 31, 2020 | $ | 776.1 | | | $ | 2,841.5 | | | $ | 13.4 | | | $ | (24.4) | | | $ | (2.5) | | | $ | (1,063.9) | | | $ | 2,540.2 | | | $ | 0.1 | | | $ | 2,540.3 | |
| Net income (loss) | — | | | 449.4 | | | — | | | — | | | — | | | — | | | 449.4 | | | (0.1) | | | 449.3 | |
| Cumulative translation adjustment | — | | | — | | | (75.6) | | | — | | | — | | | — | | | (75.6) | | | — | | | (75.6) | |
| Net change in retirement obligations (net of tax of $5.3) | — | | | — | | | — | | | 17.0 | | | — | | | — | | | 17.0 | | | — | | | 17.0 | |
| Net change on derivatives designated as cash flow hedges (net of tax of $0.8) | — | | | — | | | — | | | — | | | 2.5 | | | — | | | 2.5 | | | — | | | 2.5 | |
| Issuance of 258,875 shares of common stock from issuance of unvested shares, performance share units and exercise of stock options (net of tax of $3.1) | — | | | — | | | — | | | — | | | — | | | 19.7 | | | 19.7 | | | — | | | 19.7 | |
| Share-based compensation | 20.4 | | | — | | | — | | | — | | | — | | | — | | | 20.4 | | | — | | | 20.4 | |
| Shares surrendered for tax withholding | — | | | — | | | — | | | — | | | — | | | (6.1) | | | (6.1) | | | — | | | (6.1) | |
| Cash dividends declared - $2.16 per common share outstanding | — | | | (164.4) | | | — | | | — | | | — | | | — | | | (164.4) | | | — | | | (164.4) | |
| Balance, December 31, 2021 | $ | 796.5 | | | $ | 3,126.5 | | | $ | (62.2) | | | $ | (7.4) | | | $ | — | | | $ | (1,050.3) | | | $ | 2,803.1 | | | $ | — | | | $ | 2,803.1 | |
| Net income (loss) | — | | | 586.9 | | | — | | | — | | | — | | | — | | | 586.9 | | | (0.2) | | | 586.7 | |
| Cumulative translation adjustment | — | | | — | | | (74.9) | | | — | | | — | | | — | | | (74.9) | | | — | | | (74.9) | |
| Net change in retirement obligations (net of tax of $6.8) | — | | | — | | | — | | | 18.3 | | | — | | | — | | | 18.3 | | | — | | | 18.3 | |
| Issuance of 243,895 shares of common stock from issuance of unvested shares, performance share units and exercise of stock options (net of tax of $3.1) | — | | | — | | | — | | | — | | | — | | | 19.3 | | | 19.3 | | | — | | | 19.3 | |
| Repurchase of 795,423 shares of common stock | — | | | — | | | — | | | — | | | — | | | (148.1) | | | (148.1) | | | — | | | (148.1) | |
| Share-based compensation | 21.6 | | | — | | | — | | | — | | | — | | | — | | | 21.6 | | | — | | | 21.6 | |
| Shares surrendered for tax withholding | — | | | — | | | — | | | — | | | — | | | (5.2) | | | (5.2) | | | — | | | (5.2) | |
| Cash dividends declared - $2.40 per common share outstanding | — | | | (181.7) | | | — | | | — | | | — | | | — | | | (181.7) | | | — | | | (181.7) | |
| Contributions received from joint venture partner | — | | | — | | | — | | | — | | | — | | | — | | | — | | | 0.5 | | | 0.5 | |
| Balance, December 31, 2022 | $ | 818.1 | | | $ | 3,531.7 | | | $ | (137.1) | | | $ | 10.9 | | | $ | — | | | $ | (1,184.3) | | | $ | 3,039.3 | | | $ | 0.3 | | | $ | 3,039.6 | |
| | | | | | | | | | | | | | | | | | | | | | | | | | | | | | | | | | | | | | | | | | | | | | | | | | | | | |
| Common Stock and Additional Paid-In Capital | | Retained
Earnings | | Accumulated Other Comprehensive Loss | | Treasury
Stock | | Total Shareholders’ Equity | | Noncontrolling Interest | | Total Equity |
| | | | Cumulative
Translation
Adjustment | | Retirement
Benefits
Adjustments | | Cumulative
Unrealized
Gain (Loss)
on
Derivatives | | | | |
| Balance, December 31, 2020 | $ | 776.1 | | | $ | 2,841.5 | | | $ | 13.4 | | | $ | (24.4) | | | $ | (2.5) | | | $ | (1,063.9) | | | $ | 2,540.2 | | | $ | 0.1 | | | $ | 2,540.3 | |
| Net income (loss) | — | | | 449.4 | | | — | | | — | | | — | | | — | | | 449.4 | | | (0.1) | | | 449.3 | |
| Cumulative translation adjustment | — | | | — | | | (75.6) | | | — | | | — | | | — | | | (75.6) | | | — | | | (75.6) | |
| Net change in retirement obligations (net of tax of $5.3) | — | | | — | | | — | | | 17.0 | | | — | | | — | | | 17.0 | | | — | | | 17.0 | |
| Net change on derivatives designated as cash flow hedges (net of tax of $0.8) | — | | | — | | | — | | | — | | | 2.5 | | | — | | | 2.5 | | | — | | | 2.5 | |
| Net issuance of 228,567 shares of common stock (net of tax of $3.1) | — | | | — | | | — | | | — | | | — | | | 13.6 | | | 13.6 | | | — | | | 13.6 | |
| Share-based compensation | 20.4 | | | — | | | — | | | — | | | — | | | — | | | 20.4 | | | — | | | 20.4 | |
| Cash dividends declared - $2.16 per common share outstanding | — | | | (164.4) | | | — | | | — | | | — | | | — | | | (164.4) | | | — | | | (164.4) | |
| Balance, December 31, 2021 | $ | 796.5 | | | $ | 3,126.5 | | | $ | (62.2) | | | $ | (7.4) | | | $ | — | | | $ | (1,050.3) | | | $ | 2,803.1 | | | $ | — | | | $ | 2,803.1 | |
| Net income (loss) | — | | | 586.9 | | | — | | | — | | | — | | | — | | | 586.9 | | | (0.2) | | | 586.7 | |
| Cumulative translation adjustment | — | | | — | | | (74.9) | | | — | | | — | | | — | | | (74.9) | | | — | | | (74.9) | |
| Net change in retirement obligations (net of tax of $6.8) | — | | | — | | | — | | | 18.3 | | | — | | | — | | | 18.3 | | | — | | | 18.3 | |
| Net issuance of 216,946 shares of common stock (net of tax of $3.1) | — | | | — | | | — | | | — | | | — | | | 14.1 | | | 14.1 | | | — | | | 14.1 | |
| Repurchase of 795,423 shares of common stock | — | | | — | | | — | | | — | | | — | | | (148.1) | | | (148.1) | | | — | | | (148.1) | |
| Share-based compensation | 21.6 | | | — | | | — | | | — | | | — | | | — | | | 21.6 | | | — | | | 21.6 | |
| Cash dividends declared - $2.40 per common share outstanding | — | | | (181.7) | | | — | | | — | | | — | | | — | | | (181.7) | | | — | | | (181.7) | |
| Contributions received from joint venture partner | — | | | — | | | — | | | — | | | — | | | — | | | — | | | 0.5 | | | 0.5 | |
| Balance, December 31, 2022 | $ | 818.1 | | | $ | 3,531.7 | | | $ | (137.1) | | | $ | 10.9 | | | $ | — | | | $ | (1,184.3) | | | $ | 3,039.3 | | | $ | 0.3 | | | $ | 3,039.6 | |
| Net income (loss) | — | | | 596.1 | | | — | | | — | | | — | | | — | | | 596.1 | | | (0.5) | | | 595.6 | |
| Cumulative translation adjustment | — | | | — | | | 87.8 | | | — | | | — | | | — | | | 87.8 | | | — | | | 87.8 | |
| Net change in retirement obligations (net of tax of $(2.3)) | — | | | — | | | — | | | (7.4) | | | — | | | — | | | (7.4) | | | — | | | (7.4) | |
| Net issuance of 230,812 shares of common stock (net of tax of $2.8) | — | | | — | | | — | | | — | | | — | | | 21.5 | | | 21.5 | | | — | | | 21.5 | |
| Repurchase of 124,600 shares of common stock | — | | | — | | | — | | | — | | | — | | | (24.2) | | | (24.2) | | | — | | | (24.2) | |
| Share-based compensation | 21.8 | | | — | | | — | | | — | | | — | | | — | | | 21.8 | | | — | | | 21.8 | |
| Cash dividends declared - $2.56 per common share outstanding | — | | | (193.5) | | | — | | | — | | | — | | | — | | | (193.5) | | | — | | | (193.5) | |
| Balance, December 31, 2023 | $ | 839.9 | | | $ | 3,934.3 | | | $ | (49.3) | | | $ | 3.5 | | | $ | — | | | $ | (1,187.0) | | | $ | 3,541.4 | | | $ | (0.2) | | | $ | 3,541.2 | |
See Notes to Consolidated Financial Statements.
IDEX CORPORATION
CONSOLIDATED STATEMENTS OF CASH FLOWS | | | | | | | | | | | | | | | | | |
| | For the Year Ended December 31, |
| | 2022 | | 2021 | | 2020 |
| | (In millions) |
| Cash flows from operating activities | | | | | |
| Net income | $ | 586.7 | | | $ | 449.3 | | | $ | 377.8 | |
| Adjustments to reconcile net income to net cash provided by operating activities: | | | | | |
| Gains on sales of assets | (3.5) | | | — | | | — | |
| Gain on sale of business | (34.8) | | | — | | | — | |
| Asset impairments | 17.4 | | | 0.8 | | | 3.1 | |
| Depreciation | 50.7 | | | 46.6 | | | 41.7 | |
| Amortization of intangible assets | 69.0 | | | 56.4 | | | 41.8 | |
| Amortization of debt issuance expenses | 1.7 | | | 1.7 | | | 1.7 | |
| Share-based compensation expense | 21.6 | | | 20.4 | | | 14.8 | |
| Deferred income taxes | (18.5) | | | (6.1) | | | 8.2 | |
| Non-cash interest expense associated with forward starting swaps | — | | | 3.3 | | | 6.0 | |
| Termination of the U.S. pension plan, net of curtailment | — | | | 8.6 | | | — | |
| Changes in (net of the effect from acquisitions/divestitures and foreign exchange): | | | | | |
| Receivables | (71.7) | | | (49.4) | | | 20.9 | |
| Inventories | (72.4) | | | (46.1) | | | 36.5 | |
| Other current assets | (0.5) | | | 9.0 | | | (10.3) | |
| Trade accounts payable | 17.6 | | | 22.9 | | | 2.7 | |
| Deferred revenue | (25.0) | | | 19.8 | | | 39.0 | |
| Accrued expenses | 16.6 | | | 25.8 | | | (13.7) | |
| Other - net | 2.5 | | | 2.3 | | | (0.9) | |
| Net cash flows provided by operating activities | 557.4 | | | 565.3 | | | 569.3 | |
| Cash flows from investing activities | | | | | |
| Purchases of property, plant and equipment | (68.0) | | | (72.7) | | | (51.6) | |
| Acquisition of businesses, net of cash acquired | (945.6) | | | (577.4) | | | (123.1) | |
| Note receivable from collaborative partner | (3.0) | | | (4.2) | | | — | |
| Proceeds from disposal of fixed assets | 8.9 | | | — | | | — | |
| Proceeds from sale of business, net of cash remitted | 49.4 | | | — | | | — | |
| Purchase of marketable securities | — | | | (45.2) | | | — | |
| Proceeds from sale of marketable securities | 39.7 | | | — | | | — | |
| Other - net | 1.4 | | | 1.4 | | | 2.1 | |
| Net cash flows used in investing activities | (917.2) | | | (698.1) | | | (172.6) | |
| Cash flows from financing activities | | | | | |
| Borrowings under revolving credit facilities | 210.4 | | | — | | | 150.0 | |
| Payments under revolving credit facilities | (135.0) | | | — | | | (150.0) | |
| Proceeds from issuance of long-term borrowings | 200.0 | | | 499.4 | | | 499.1 | |
| Payment of long-term borrowings | — | | | (350.1) | | | (300.4) | |
| Payment of make-whole redemption premium | — | | | (6.7) | | | (6.8) | |
| Debt issuance costs | (2.3) | | | (4.6) | | | (4.7) | |
| Dividends paid | (177.4) | | | (161.1) | | | (151.8) | |
| Proceeds from stock option exercises | 19.3 | | | 19.7 | | | 44.6 | |
| Repurchases of common stock | (148.1) | | | — | | | (110.3) | |
| Shares surrendered for tax withholding | (5.2) | | | (6.1) | | | (12.3) | |
| Contributions received from joint venture partner | 0.5 | | | — | | | — | |
| Net cash flows used in financing activities | (37.8) | | | (9.5) | | | (42.6) | |
| Effect of exchange rate changes on cash and cash equivalents | (27.6) | | | (28.2) | | | 39.2 | |
| Net (decrease) increase in cash and cash equivalents | (425.2) | | | (170.5) | | | 393.3 | |
| Cash and cash equivalents at beginning of year | 855.4 | | | 1,025.9 | | | 632.6 | |
| Cash and cash equivalents at end of year | $ | 430.2 | | | $ | 855.4 | | | $ | 1,025.9 | |
| Supplemental cash flow information | | | | | |
| Cash paid for: | | | | | |
| Interest | $ | 37.1 | | | $ | 36.0 | | | $ | 35.2 | |
| Income taxes - net | 175.6 | | | 118.2 | | | 87.2 | |
(In millions)
| | | | | | | | | | | | | | | | | |
| | For the Year Ended December 31, |
| | 2023 | | 2022 | | 2021 |
| Cash flows from operating activities | | | | | |
| Net income | $ | 595.6 | | | $ | 586.7 | | | $ | 449.3 | |
| Adjustments to reconcile net income to net cash flows provided by operating activities: | | | | | |
| Gain on sale of businesses - net | (84.7) | | | (34.8) | | | — | |
| Asset impairments | 0.8 | | | 17.4 | | | 0.8 | |
| Credit loss on note receivable from collaborative partner | 7.7 | | | — | | | — | |
| Depreciation | 57.2 | | | 50.7 | | | 46.6 | |
| Amortization of intangible assets | 94.9 | | | 69.0 | | | 56.4 | |
| Share-based compensation expense | 21.8 | | | 21.6 | | | 20.4 | |
| Deferred income taxes | (14.7) | | | (18.5) | | | (6.1) | |
| Non-cash interest expense associated with forward starting swaps | — | | | — | | | 3.3 | |
| Termination of the U.S. pension plan, net of curtailment | — | | | — | | | 8.6 | |
| Changes in (net of the effect from acquisitions/divestitures and foreign currency translation): | | | | | |
| Receivables - net | 20.5 | | | (71.7) | | | (49.4) | |
| Inventories - net | 66.2 | | | (72.4) | | | (46.1) | |
| Other current assets | (6.5) | | | (0.5) | | | 9.0 | |
| Trade accounts payable | (25.3) | | | 17.6 | | | 22.9 | |
| Deferred revenue | 12.7 | | | (25.0) | | | 19.8 | |
| Accrued expenses | (34.8) | | | 16.6 | | | 25.8 | |
| Other - net | 5.3 | | | 0.7 | | | 4.0 | |
| Net cash flows provided by operating activities | 716.7 | | | 557.4 | | | 565.3 | |
| Cash flows from investing activities | | | | | |
| Capital expenditures | (89.9) | | | (68.0) | | | (72.7) | |
| Acquisition of businesses, net of cash acquired | (311.8) | | | (945.6) | | | (577.4) | |
| Proceeds from sale of businesses, net of cash remitted | 118.6 | | | 49.4 | | | — | |
| Purchases of marketable securities | (29.0) | | | — | | | (45.2) | |
| Proceeds from sale of marketable securities | 24.8 | | | 39.7 | | | — | |
| Other - net | 3.5 | | | 7.3 | | | (2.8) | |
| Net cash flows used in investing activities | (283.8) | | | (917.2) | | | (698.1) | |
| Cash flows from financing activities | | | | | |
| Borrowings under revolving credit facilities | — | | | 210.4 | | | — | |
| Payments under revolving credit facilities | — | | | (135.0) | | | — | |
| Proceeds from issuance of long-term borrowings | 100.0 | | | 200.0 | | | 499.4 | |
| Payment of long-term borrowings | (250.0) | | | — | | | (350.1) | |
| Payment of make-whole redemption premium | — | | | — | | | (6.7) | |
| Cash dividends paid to shareholders | (190.7) | | | (177.4) | | | (161.1) | |
| Proceeds from share issuances, net of shares withheld for taxes | 21.5 | | | 14.1 | | | 13.6 | |
| Repurchases of common stock | (24.2) | | | (148.1) | | | — | |
| Other | (1.3) | | | (1.8) | | | (4.6) | |
| Net cash flows used in financing activities | (344.7) | | | (37.8) | | | (9.5) | |
| Effect of exchange rate changes on cash and cash equivalents | 15.9 | | | (27.6) | | | (28.2) | |
| Net increase (decrease) in cash and cash equivalents | 104.1 | | | (425.2) | | | (170.5) | |
| Cash and cash equivalents at beginning of year | 430.2 | | | 855.4 | | | 1,025.9 | |
| Cash and cash equivalents at end of year | $ | 534.3 | | | $ | 430.2 | | | $ | 855.4 | |
| Supplemental cash flow information | | | | | |
| Cash paid for: | | | | | |
| Interest | $ | 50.8 | | | $ | 37.1 | | | $ | 36.0 | |
| Income taxes - net | 199.5 | | | 175.6 | | | 118.2 | |
See Notes to Consolidated Financial Statements.
IDEX CORPORATION
NOTES TO CONSOLIDATED FINANCIAL STATEMENTS
(Dollars in millions, except per share amounts)
1.Significant Accounting Policies
Business
IDEX is an applied solutions provider specializing in the manufacturemanufacturing of fluid and metering technologies, health and science technologies and fire, safety and other diversified products built to customers’ specifications. IDEX’s products are sold in niche markets across a wide range of industries throughout the world. The Company’s products and services include positive displacement pumps, valves, small volume provers, flow meters, injectors and other fluid-handling pump modules and systems, flow monitoring and other services, precision fluidics, powder and liquid processing technologies, drying systems, micro-precision components, rotary lobe pumps, roll compaction and drying systems, pneumatic components and sealing solutions, including very high precision, low-flow rate pumping solutions, high performance molded and extruded sealing components, custom mechanical and shaft seals, engineered hygienic mixers and valves, biocompatible medical devices and implantables, air compressors and blowers, optical components and coatings, laboratory and commercial equipment, precision photonic solutions, precision gear and peristaltic pump technologies, firefighting pumps, valves and controls, rescue tools, lifting bags and other components and systems for the fire and rescue industry, engineered stainless steel banding and clamping devices and precision equipment for dispensing, metering and mixing colorants and paints. These products and services are grouped into three reportable segments: Fluid & Metering Technologies (“FMT”), Health & Science Technologies (“HST”) and Fire & Safety/Diversified Products (“FSDP”).
Principles of Consolidation
The Consolidated Financial Statements include the Company and its subsidiaries. All intercompany transactions and accounts have been eliminated.
Use of Estimates
The preparation of financial statements in conformity with accounting principles generally accepted in the United States of America (“U.S. GAAP”) requires management to make estimates and judgments that affect the reported amounts of assets and liabilities, disclosure of contingent assets and liabilities and reported amounts of revenue and expenses during the reporting period. Actual results could differ from those estimates. The principal areas of estimation reflected in the financial statements are revenue recognition, sales returns and allowances, allowance for credit losses, inventory valuation, recoverability of long-lived assets, valuation of goodwill and intangible assets, income taxes, product warranties, contingencies and litigation, insurance-related items, defined benefit retirement plans and purchase accounting related to acquisitions.
Revenue Recognition
The Company accounts for a contract with a customer when it has approval from both parties, the rights and payment terms are identified, the contract has commercial substance and collectability of the consideration is probable. The Company determines the appropriate revenue recognition by analyzing the terms and conditions of the contract. Revenue, or Net sales, is recognized when control of the products or services is transferred to a customer inat an amount that reflects the consideration the Company expects to be entitled to in exchange for transferring the products or providing the services. Control is transferred to customers when performance obligations within a contract are satisfied. A performance obligation is a promise to transfer a distinct product or service to a customer.
The majority of the Company's contracts have a single performance obligation which represents, in most cases, the product being sold to the customer. Some contracts include multiple performance obligations such as a product and related installation, extended warranty, software and/or maintenance services. For contracts with multiple performance obligations, the Company allocates the total transaction price to each performance obligation in an amount based on the estimated relative standalone selling prices of the promised products or services underlying each performance obligation.
The Company’s performance obligations are satisfied at either a point in time or over time as work progresses. For performance obligations satisfied at a point in time, revenue is recognized when control transfers to the customer, typically upon shipment. For performance obligations in which the Company transfers control of a product or service over time, revenue is recognized over time as work is performed. Typically, this results when the Company performs services over time or the Company creates a product with no alternative use and has an enforceable right to payment for its performance to date.
For contracts that require complex design, manufacturing and installation activities, certain performance obligations may not be separately identifiable and, therefore, not distinct. As a result, the entire contract is accounted for as a single performance obligation. For contracts that include distinct products or services that are substantially the same and have the same pattern of transfer to the customer over time, they are recognized as a series of distinct products or services. For product sales, each product sold to a customer generally represents a distinct performance obligation. Certain contracts have multiple performance obligations for which the Company allocates the transaction price to each performance obligation using an estimate of the standalone selling price of each distinct product or service and recognizes as revenue when, or as, the performance obligation is satisfied. For product sales, each product sold to a customer generally represents a distinct performance obligation. In such cases, the observable standalone sales are used to determine the standalone selling price. In certain cases, the Company may be required to estimate the standalone selling price using the expected cost plus margin approach, under which it forecasts the expected costs of satisfying a performance obligation and then adds an appropriate margin for the distinct product or service.
The Company’s performance obligations are satisfied at either a point in time or over time as work progresses. Revenue recognized at a point in time is approximately 96% while revenue recognized over time is approximately 4%. For performance obligations satisfied at a point in time, generally revenue recognition occurs with the transfer of control of the asset, which is in line with shipping terms. For performance obligations satisfied over time, revenue is recognized as work is performed based on the relationship between actual costs incurred to date for each contract and the total estimated costs for such contract at completion of the performance obligation (i.e. the cost-to-cost method) or ratably over the contract term for service revenue. The Company defines service revenue as revenue from activities that are not associated with the design, development or manufacture of a product or the delivery of a software license.
When accounting for over-time contracts, the Company uses an input measure to determine the extent of progress towards completion of the performance obligation. The Company believes this measure of progress best depicts the transfer of control to the customer which occurs as the Company incurs costs on its contracts. Incurred cost represents work performed, which corresponds with the transfer of control to the customer. Contract costs include labor, material and overhead. Revenue is recognized based on the relationship between actual costs incurred to date for each contract and the total estimated costs for such contract at completion of the performance obligation. Contract estimates are based on various assumptions to project the outcome of future events. These assumptions include labor productivity and availability; the complexity of the work to be performed; the cost and availability of materials; the performance of subcontractors; and the availability and timing of funding from the customer. Revenues, including estimated fees or profits, are recorded proportionally as costs are incurred.
As a significant change in one or more of these estimates could affect the profitability of the Company’s contracts, the Company reviews and updates its estimates regularly. Due to uncertainties inherent in the estimation process, it is reasonably possible that completion costs, including those arising from contract penalty provisions and final contract settlements, will be revised. Such revisions to costs and income are recognized in the period in which the revisions are determined as a cumulative catch-up adjustment. The impact of the adjustment on profit recorded to date on a contract is recognized in the period the adjustment is identified. Revenue and profit in future periods of contract performance are recognized using the adjusted estimate. If at any time the estimate of contract profitability indicates an anticipated loss on the contract, the Company recognizes provisions for estimated losses on incomplete contracts in the period in which such losses are determined.
The Company records allowances for discounts and product returns at the time of sale as a reduction of revenue as such allowances can be reliably estimated based on historical experience and known trends. The Company also offers product warranties (primarily assurance-type) and accrues its estimated exposure for warranty claims at the time of sale based upon the length of the warranty period, warranty costs incurred and any other related information known to the Company.
Contract Assets and Liabilities
The timing of billings and cash collections can result in customer receivables, billings in excess of revenue recognized, advance payments or deposits. Customer receivables include both amounts billed and currently due from customers as well as unbilled amounts (contract assets) and are included in Receivables - net on the Consolidated Balance Sheets. Amounts are billed in accordance with contractual terms or as work progresses. Unbilled amounts arise when the timing of billing differs from the timing of revenue recognized, such as when contract provisions require specific milestones to be met before a customer can be billed. Unbilled amounts primarily relate to performance obligations satisfied over time when the cost-to-cost method is utilized and the revenue recognized exceeds the amount billed to the customer as there is not yet a right to invoice in accordance with contractual terms. Unbilled amounts are recorded as a contract asset when the revenue associated with the contract is recognized prior to billing and derecognized when billed in accordance with the terms of the contract.
Contract liabilities include advance payments, deposits and billings in excess of revenue recognized and are included in deferred revenue which is classified as current or noncurrent based on the timing of when the Company expects to recognize the revenue. The current portion is included in Accrued expenses and the noncurrent portion is included in Other noncurrent liabilities on the Consolidated Balance Sheets. Advance payments and deposits represent contract liabilities and are recorded when customers remit contractual cash payments in advance of us satisfying performance obligations under contractual arrangements, including those with performance obligations satisfied over time. The Company generally receives advance payments from customers related to maintenance services which are recognized ratably over the service term. The Company also receives deposits from customers on certain orders which the Company recognizes as revenue at a point in time. Billings in excess of revenue recognized represent contract liabilities and primarily relate to performance obligations satisfied over time when the cost-to-cost method is utilized and revenue cannot yet be recognized as the Company has not completed the
corresponding performance obligation. Contract liabilities are derecognized when revenue is recognized and the performance obligation is satisfied.
Shipping and Handling Costs
Shipping and handling costs are included in Cost of Salessales and are recognized as a period expense during the period in which they are incurred.
Advertising Costs
Advertising costs of $14.9$15.9 million,, $14.9 million and $10.7 million for 2023, 2022 and $9.9 million for 2022, 2021, and 2020, respectively, are expensed as incurred within Selling, general and administrative expenses.
Cash and Cash Equivalents
The Company considers all highly liquid instruments purchased with an original maturity of 3 months or less to be cash and cash equivalents.
Marketable Securities
From time to time, the Company may hold investments in marketable securities, which are recorded in Other current assets in the Consolidated Balance Sheets. These investments are recorded at fair value, with gains and losses, dividends and interest income included in Other expense (income) expense - net in the Consolidated Statements of Income. See Note 98 for further discussion on the marketable securities held by the Company.
Accounts Receivable and Allowance for Credit Losses
Accounts receivable are recorded at face amount less an allowance for credit losses. The allowance is an estimate based on historical collection experience, current and future economic and market conditions and a review of the current status of each customer's trade accounts receivable. Management evaluates the aging of the accounts receivable balances and the financial
condition of its customers and all other forward-looking information that is reasonably available to estimate the amount of accounts receivable that may not be collected in the future and records the appropriate provision.
Inventories
The Company states inventories at the lower of cost or net realizable value. Cost, which includes material, labor and overhead, is determined on a first in, first out basis. The Company makes adjustments to reduce the cost of inventory to its net realizable value, if required, for estimated excess, obsolete, zero usage or impaired balances. Factors influencing these adjustments include changes in market demand, product life cycle and engineering changes.
Impairment of Long-Lived Assets
A long-lived asset is reviewed for impairment if an event occurs or circumstances change that would more likely than not reduce the fair value of the asset below its carrying value, as measured by comparing its net book value to the projected undiscounted future cash flows generated by its use. The Company groups and evaluates these long-lived assets for impairment at the lowest level at which individual cash flows can be identified. A long-lived asset impairment exists when the carrying value of the asset group exceeds its fair value. The amount and timing of the impairment charge for an asset group requires the estimation of future cash flows, which are then discounted to determine the fair value of the asset.asset group. An impaired asset group is recorded at its estimated fair value based on a discounted cash flow analysis.value. Refer to Note 1514 for further discussion on impairment of long-lived assets.
Goodwill and Indefinite-Lived Intangible Assets
Accounting Standards Codification (“ASC”) 350, Goodwill and Other Intangible Assets (“ASC 350”), requires that the Company review the carrying value of goodwill and indefinite-lived intangible assets annually, or if an event occurs or circumstances change that would more likely than not reduce the fair value of a reporting unit below its carrying value. The Company evaluates the recoverability of these assets as of October 31 based on the estimated fair value of each of the 13 reporting unitsunit and the indefinite-lived intangible assets. See Note 6 for further discussion on goodwill and indefinite-lived intangible assets.
Borrowing Expenses
Expenses incurred in securing and issuing debt are capitalized and included as a reduction of Long-term borrowings.borrowings - net. These amounts are amortized over the life of the related borrowing and the related amortization is included in Interest expense in the Consolidated Statements of Income.
Earnings per Common Share
Diluted earnings per common share (“EPS”) attributable to IDEX is computed by dividing Net income attributable to IDEX by the weighted average number of common shares of common stockoutstanding (basic) plus common stock equivalents outstanding (diluted) during the year. Common stock equivalents consist of restricted stock, performance share units and stock options, which have been included in the calculation of weighted average common shares outstanding using the treasury stock method, restricted stock and performance share units.method.
ASC 260, Earnings perPer Share,, concludes that all outstanding unvested share-based payment awards that contain rights to non-forfeitable dividends participate in undistributed earnings with common shareholders. If awards are considered participating securities, the Company is required to apply the two-class method of computing basic and diluted earnings per share. The Company has determined that its outstanding shares of restricted stock are participating securities. Accordingly, Diluted EPS attributable to IDEX was computed using the two-class method prescribed by ASC 260.
Basic weighted average common shares outstanding reconciles to diluted weighted average common shares outstanding as follows:
| | 2022 | | 2021 | | 2020 |
| 2023 | | | 2023 | | 2022 | | 2021 |
| | | (In millions) | | (In millions) |
| Basic weighted average common shares outstanding | Basic weighted average common shares outstanding | 75.7 | | | 76.0 | | | 75.7 | |
| Dilutive effect of stock options, restricted stock and performance share units | 0.3 | | | 0.4 | | | 0.7 | |
| Dilutive effect of restricted stock, performance share units and stock options | |
| Diluted weighted average common shares outstanding | Diluted weighted average common shares outstanding | 76.0 | | | 76.4 | | | 76.4 | |
Options to purchase approximately 0.5 million, 0.3 million and 0.3 million shares of common stock in 2022, 2021 and 2020, respectively,that were not included in the computation of dilutedDiluted EPS attributable to IDEX because the effect of their inclusion would have been antidilutive.antidilutive were as follows:
Table of Contents | | | | | | | | | | | | | | | | | |
| 2023 | | 2022 | | 2021 |
| Antidilutive shares not included in Diluted EPS attributable to IDEX | 0.2 | | | 0.5 | | | 0.3 | |
Share-Based Compensation
The Company accounts for share-based payments in accordance with ASC 718, Compensation-Stock Compensation. Accordingly, the Company expenses the fair value of the awards madegranted under its share-based compensation plans. That cost is recognized in the Consolidated Financial Statements over the requisite service period of the grants. See Note 1615 for further discussion on share-based compensation.
Depreciation and Amortization
Property and equipment are stated at cost, with depreciation and amortization provided using the straight-line method over the following estimated useful lives:
| | | | | |
| Land improvements | 8 to 12 years |
| Buildings and improvements | 8 to 30 years |
| Machinery, equipment and other | 3 to 12 years |
| Office and transportation equipment | 2 to 10 years |
Certain identifiable intangible assets are amortized over their estimated useful lives using the straight-line method. The estimated useful lives used in the computation of amortization of identifiable intangible assets are as follows:
| | | | | |
| Patents | 5 to 20 years |
| Trade names | 515 to 20 years |
| Customer relationships | 5 to 20 years |
| Unpatented technology | 78 to 20 years |
| Software | 5 years |
Research and Development Expenditures
Costs associated with engineering activities, including research and development, are expensed in the period incurred and are included in Cost of sales.
Total engineering expenses, which include research and development as well as application and support engineering, were $107.5 million, $95.4 million and $82.9 million in 2023, 2022 and $82.3 million in 2022, 2021, and 2020, respectively. Research and development expenses, which include costs associated with developing new products and major improvements to existing products, were $68.4 million, $61.4 million and $50.1 million in 2023, 2022 and $48.2 million in 2022, 2021, and 2020, respectively.
Foreign Currency Translation and Transaction
The functional currency of substantially all operations outside the United States is the respective local currency. Accordingly, those foreign currency balance sheet accounts have been translated using the exchange rates in effect as of the balance sheet date and the income statement amounts have been translated using the average monthly exchange rates for the year. Translation adjustments from year to year have been reported in Accumulated other comprehensive loss in the Consolidated Balance Sheets. Foreign currency transaction gains and losses from transactions denominated in a currency other than the functional currency of the subsidiary involved are reported within Other expense (income) expense - net in the Consolidated Statements of Income. Net transaction loss (gain) loss for the years ended December 31, 2023, 2022 and 2021 and 2020 was $(0.8)$7.3 million,, $(0.8) million and $1.1 million, and $3.0 million, respectively.
Income Taxes
Income tax expense includes U.S., state, local and international income taxes. Deferred tax assets and liabilities are recognized for the tax consequences of temporary differences between the financial reporting and the tax bases of existing assets and liabilities and for loss carryforwards. The tax rate used to determine the deferred tax assets and liabilities is the enacted tax rate for the year and the manner in which the differences are expected to reverse. Valuation allowances are recorded to reduce deferred tax assets to the amount that will more likely than not be realized. See Note 1312 for further discussion on income taxes.
Concentration of Credit Risk
The Company is not dependent on a single customer as its largest customer accounted for less than 3% of net sales for all years presented.
Recently Adopted Accounting Standards
In NovemberOctober 2021, the Financial Accounting Standards Board (“FASB”) issued Accounting Standards Update (“ASU”) 2021-10, Government Assistance (ASC 832): Disclosures by Business Entities about Government Assistance, which requires entities to provide certain annual disclosures when they (1) have received government assistance and (2) use a grant or contribution accounting model by analogy to other accounting guidance. The Company adopted this standard on a prospective basis for the annual period beginning January 1, 2022. The adoption of this standard did not have a material impact on the Company’s Consolidated Financial Statements.
Recently Issued Accounting Standards
In October 2021, the FASB issued ASU 2021-08, Business Combinations (Topic 805): Accounting for Contract Assets and Contract Liabilities from Contracts with Customers, which adds contract assets and contract liabilities to the list of exceptions to the recognition and measurement principles that apply to business combinations and requires that an acquirer recognize and measure contract assets and contract liabilities acquired in a business combination in accordance with revenue recognition guidance. The Company adopted this standard on a prospective basis for the annual period beginning January 1, 2023. The adoption of this standard did not have a material impact on the Company’s Consolidated Financial Statements.
Recently Issued Accounting Standards
In November 2023, the FASB issued ASU 2021-082023-07, Segment Reporting (Topic 280): Improvements to Reportable Segment Disclosures, which improves the disclosures required for reportable segments in the Company’s annual and interim financial
statements, primarily through enhanced disclosures about significant segment expenses. ASU 2023-07 is effective for annual periods beginning after December 15, 20222023 and interim periods therein.within fiscal years beginning after December 15, 2024. Adoption of this ASU should be applied retrospectively to all prior periods presented in the financial statements. Early adoption is permitted. Entities should applyThe Company is currently evaluating the ASU’s provisions prospectively to business combinations occurring on or after the effective dateimpact of the amendments. The adoption of this standard is not expected to have a material impact on the Company’s Consolidated Financial Statements.Statements and disclosures.
In December 2023, the FASB issued ASU 2023-09, Improvements to Income Tax Disclosures, which requires public entities, on an annual basis, to provide disclosures of specific categories in the rate reconciliation, additional information for reconciling items that meet a quantitative threshold and income taxes paid disaggregated by jurisdiction. ASU 2023-09 is effective for annual periods beginning after December 15, 2024. Early adoption is permitted. The Company is currently evaluating the impact of the adoption of this standard on the Company’s Consolidated Financial Statements and disclosures.
2. Acquisitions and Divestitures
All of the Company’s acquisitions of businesses have been accounted for under ASC 805, Business Combinations. Accordingly, the assets and liabilities of the acquired companies, after adjustments to reflect the fair values assigned to the assets and liabilities, have been included in the Company’s Consolidated Financial StatementsBalance Sheets from their respective dates of acquisition. The results of operations of Flow Management Devices, LLC (“Flow MD”) (acquired February 28, 2020), Qualtek Manufacturing, Inc. (“Qualtek”) (acquired November 23, 2020), ABEL Pumps, L.P. and certain of its affiliates (“ABEL”) (acquired March 10, 2021), Airtech Group, Inc., US Valve Corporation and related entities (“Airtech”) (acquired June 14, 2021), Nexsight, LLC and its businesses Envirosight, WinCan, MyTana and Pipeline Renewal Technologies (“Nexsight”) (acquired February 28, 2022), KZ CO. (“KZValve”) (acquired May 2, 2022) and Muon B.V. and its subsidiaries (“Muon Group”) (acquired November 18, 2022)acquired have been included in the Company’s Consolidated Financial Statements of Income since the respective dates of acquisition. The results of operations of Knightdivestitures have been included in the Company’s Consolidated Financial Statements of Income through the daterespective dates of disposition on September 9, 2022.disposition. Supplemental pro forma information has not been provided as the acquisitions and divestiture did not have a material impact on the Company’s Consolidated Financial Statements individually or in the aggregate. In addition, the divestitures did not represent a strategic shift that had a major effect on operations and financial results and, therefore, did not qualify for presentation as discontinued operations.
2023 Acquisitions
Iridian
On May 19, 2023, the Company acquired Iridian Spectral Technologies (“Iridian”) in a stock acquisition. Iridian is a global leader in designing and manufacturing thin-film, multi-layer optical filters serving the laser communications, telecommunications and life sciences markets and expands the Company’s array of optical technology offerings. Headquartered in Ottawa, Canada, Iridian operates in the Company’s Scientific Fluidics & Optics reporting unit within the HST segment. Iridian was acquired for cash consideration of $109.8 million. The entire purchase price was funded with cash on hand. Goodwill and intangible assets recognized as part of this transaction were $52.7 million and $45.6 million, respectively. The goodwill is not deductible for tax purposes.
The Company made a preliminary allocation of the purchase price for the Iridian acquisition as of the acquisition date based on its understanding of the fair value of the acquired assets and assumed liabilities. These nonrecurring fair value measurements are classified as Level 3 in the fair value hierarchy. As the Company continues to obtain additional information, primarily related to the valuations of these assets and liabilities, and continues to integrate the newly acquired business, the Company will refine the estimates of fair value and more accurately allocate the purchase price. Only items identified as of the acquisition date are considered for subsequent adjustment. The Company will continue to make required adjustments to the purchase price allocation prior to the completion of the measurement period.
The preliminary allocation of the purchase price to the assets acquired and liabilities assumed, based on their estimated fair values at the acquisition date, is as follows:
| | | | | |
| Total |
| Current assets, net of cash acquired | $ | 10.6 | |
| Property, plant and equipment | 19.9 | |
| Goodwill | 52.7 |
| Intangible assets | 45.6 |
| Other noncurrent assets | 5.4 |
| Total assets acquired | 134.2 |
| Current liabilities | (1.2) | |
| Deferred income taxes | (18.3) | |
| Other noncurrent liabilities | (4.9) | |
Net assets acquired(1) | $ | 109.8 | |
(1) During the fourth quarter of 2023, the Company finalized the net working capital of the assets and liabilities acquired, resulting in a $0.5 million adjustment to reduce the purchase price of the Iridian business.
Acquired intangible assets consist of trade names, customer relationships and unpatented technology. The goodwill recorded for the acquisition reflects the strategic fit, revenue and earnings growth potential of this business.
The acquired intangible assets and weighted average amortization periods are as follows:
| | | | | | | | | | | |
| Total | | Weighted Average Life |
| Trade names | $ | 5.2 | | | 15 |
| Customer relationships | 29.3 | | | 12 |
| Unpatented technology | 11.1 | | | 11 |
| Acquired intangible assets | $ | 45.6 | | | |
STC
On December 14, 2023, the Company acquired STC Material Solutions (“STC”) in a stock acquisition. STC specializes in the design and manufacturing of technical ceramics and hermetic sealing products for the most extreme, mission critical applications in the semiconductor, aerospace and defense, industrial technology, medical technology and energy markets. Headquartered in St. Albans, Vermont, with additional operations in Santa Ana, California, STC operates in the Company’s Scientific Fluidics & Optics reporting unit within the HST segment. STC was acquired for cash consideration of $202.0 million. The entire purchase price was funded with cash on hand. Goodwill and intangible assets recognized as part of this transaction were $104.0 million and $95.3 million, respectively. The goodwill is not deductible for tax purposes.
The Company made a preliminary allocation of the purchase price for the STC acquisition as of the acquisition date based on its understanding of the fair value of the acquired assets and assumed liabilities. These nonrecurring fair value measurements are classified as Level 3 in the fair value hierarchy. As the Company continues to obtain additional information, primarily related to the valuations of these assets and liabilities, and continues to integrate the newly acquired business, the Company will refine the estimates of fair value and more accurately allocate the purchase price. Only items identified as of the acquisition date are considered for subsequent adjustment. The Company will continue to make required adjustments to the purchase price allocation prior to the completion of the measurement period.
The preliminary allocation of the purchase price to the assets acquired and liabilities assumed, based on their estimated fair values at the acquisition date, is as follows:
| | | | | |
| Total |
| Current assets, net of cash acquired | $ | 16.7 | |
| Property, plant and equipment | 12.5 | |
| Goodwill | 104.0 | |
| Intangible assets | 95.3 | |
| Other noncurrent assets | 3.1 | |
| Total assets acquired | 231.6 | |
| Current liabilities | (5.4) | |
| Deferred income taxes | (21.7) | |
| Other noncurrent liabilities | (2.5) | |
| Net assets acquired | $ | 202.0 | |
Acquired intangible assets consist of trade names, customer relationships and unpatented technology. The goodwill recorded for the acquisition reflects the strategic fit, revenue and earnings growth potential of this business.
The acquired intangible assets and weighted average amortization periods are as follows:
| | | | | | | | | | | |
| Total | | Weighted Average Life |
| Trade names | $ | 9.3 | | | 15 |
| Customer relationships | 66.0 | | | 15 |
| Unpatented technology | 20.0 | | | 11 |
| Acquired intangible assets | $ | 95.3 | | | |
2022 Acquisitions
Nexsight
On February 28, 2022, the Company acquired Nexsight, LLC and its businesses Envirosight, WinCan, MyTana and Pipeline Renewal Technologies (“Nexsight”) in a partial stock and partial asset acquisition. Nexsight complements and creates synergies with the Company’s existing iPEK and ADS business units that design and create sewer crawlers, inspection and monitoring systems and software applications that allow teams to identify, anticipate and correct wastewater system issues remotely. Headquartered in Randolph, New Jersey, Nexsight operates in the Company’s Water reporting unit within the FMT segment. Nexsight was acquired for cash consideration of $112.5 million. The entire purchase price was funded with cash on hand. Goodwill and intangible assets recognized as part of this transaction were $56.5$54.7 million and $49.8 million, respectively. The goodwill is partially deductible for tax purposes.
The Company made a preliminaryfinalized the allocation of the purchase price for the Nexsight acquisition as of the acquisition date based on its understanding of the fair value of the acquired assets and assumed liabilities. These nonrecurring fair value measurements are classified as Level 3 in the fair value hierarchy. As the Company continues to obtain additional information about these assets and liabilities, and continues to integrate the newly acquired business, the Company will refine the estimates of fair value and more accurately allocate the purchase price. Only items identified as of the acquisition date are considered for subsequent adjustment. The Company will continue to make required adjustments to the purchase price allocation prior to the completion of the measurement period.
The preliminaryfinal allocation of the purchase price to the assets acquired and liabilities assumed, based on their estimated fair values at the acquisition date, is as follows:
| | | | | |
| (In millions)Total |
| Current assets, net of cash acquired | $ | 16.6 | |
| Property, plant and equipment | 2.0 | |
| Goodwill | 56.554.7 |
| Intangible assets | 49.8 |
| Other noncurrent assets | 4.44.3 |
| Total assets acquired | 129.3127.4 |
| Current liabilities | (11.2)(9.2) | |
| Deferred income taxes | (1.8)(1.9) | |
| Other noncurrent liabilities | (3.8) | |
| Net assets acquired | $ | 112.5 | |
Acquired intangible assets consist of trade names, customer relationships and software. The goodwill recorded for the acquisition reflects the strategic fit, revenue and earnings growth potential of this business.
The acquired intangible assets and weighted average amortization periods are as follows:
| | (In millions, except weighted average life) | Total | | Weighted Average Life |
| Total | | | Total | | Weighted Average Life |
| Trade names | Trade names | $ | 13.5 | | | 15 | Trade names | $ | 13.5 | | | 15 | | 15 |
| Customer relationships | Customer relationships | 31.5 | | | 10 | Customer relationships | 31.5 | | | 10 | | 10 |
| Software | Software | 4.8 | | | 5 | Software | 4.8 | | | 5 | | 5 |
| Acquired intangible assets | Acquired intangible assets | $ | 49.8 | | |
KZValve
On May 2, 2022, the Company acquired KZValveKZ CO. (“KZValve”) in an asset acquisition. KZValve is a leading manufacturer of electric valves and controllers used primarily in agricultural applications. KZValve augments and expands IDEX’s agricultural portfolio, complementing Banjo’s current fluid management solutions for these applications. Headquartered in Greenwood, Nebraska, KZValve operates in the Company’s Agriculture reporting unit within the FMT segment. KZValve was acquired for cash consideration of $120.1 million. The entire purchase was funded with cash on hand. Goodwill and intangible assets recognized as part of this transaction were $56.4 million and $52.0 million, respectively. The goodwill is deductible for tax purposes.
The Company made a preliminaryfinalized the allocation of the purchase price for the KZValve acquisition as of the acquisition date based on its understanding of the fair value of the acquired assets and assumed liabilities. These nonrecurring fair value measurements are classified as Level 3 in the fair value hierarchy. As the Company continues to obtain additional information about these assets and liabilities, and continues to integrate the newly acquired business, the Company will refine the estimates of fair value and more accurately allocate the purchase price. Only items identified as of the acquisition date are considered for subsequent adjustment. The Company will continue to make required adjustments to the purchase price allocation prior to the completion of the measurement period.
The preliminaryfinal allocation of the purchase price to the assets acquired and liabilities assumed, based on their estimated fair values at the acquisition date, is as follows:
| | | | | |
| (In millions)Total |
| Current assets, net of cash acquired | 9.7 | |
| Property, plant and equipment | 1.8 | |
| Goodwill | 56.4 | |
| Intangible assets | 52.0 | |
| Deferred income taxes | 0.2 | |
| Other noncurrent assets | 1.0 | |
| Total assets acquired | 121.1 | |
| Current liabilities | (1.0) | |
| Net assets acquired | $ | 120.1 | |
Acquired intangible assets consist of trade names, customer relationships and unpatented technology. The goodwill recorded for the acquisition reflects the strategic fit, revenue and earnings growth potential of this business.
The acquired intangible assets and weighted average amortization periods are as follows:
| | (In millions, except weighted average life) | Total | | Weighted Average Life |
| Total | | | Total | | Weighted Average Life |
| Trade names | Trade names | $ | 7.5 | | | 15 | Trade names | $ | 7.5 | | | 15 | | 15 |
| Customer relationships | Customer relationships | 36.0 | | | 13 | Customer relationships | 36.0 | | | 13 | | 13 |
| Unpatented technology | Unpatented technology | 8.5 | | | 10 | Unpatented technology | 8.5 | | | 10 | | 10 |
| Acquired intangible assets | Acquired intangible assets | $ | 52.0 | | |
Muon Group
On November 18, 2022, the Company acquired the stock of Muon Group.B.V. and its subsidiaries (“Muon Group”). Muon Group manufactures highly precise flow paths in a variety of materials that enable the movement of various liquids and gases in critical applications for medical, semiconductor, food processing, digital printing and filtration technologies. Muon Group maintains operations in Hapert, the Netherlands; Eerbeek, the Netherlands; Wijchen, the Netherlands; Dorset, in the United KingdomEngland and Pune, India and operates in the Company’s Scientific Fluidics & Optics reporting unit within the HST segment. Muon Group was acquired for cash consideration of $713.0 million. The purchase price was funded with $342.6 million of cash on hand, $170.4 million of proceeds from the Company's Revolving Facility (as defined below) and $200.0 million of proceeds from the Company's Term Facility.Facility (as defined below). Goodwill and intangible assets recognized as part of this transaction were $391.1$396.6 million and $319.1 million, respectively. The goodwill is not deductible for tax purposes.
The Company made a preliminaryfinalized the allocation of the purchase price for the Muon Group acquisition as of the acquisition date based on its understanding of the fair value of the acquired assets and assumed liabilities. These nonrecurring fair value measurements are classified as Level 3 in the fair value hierarchy. As the Company continues to obtain additional information about these assets and liabilities, including intangible asset appraisals, and continues to integrate the newly acquired business, the Company will refine the estimates of fair value and more accurately allocate the purchase price. Only items identified as of the acquisition date are considered for subsequent adjustment. The Company will continue to make required adjustments to the purchase price allocation prior to the completion of the measurement period.
The preliminaryfinal allocation of the purchase price to the assets acquired and liabilities assumed, based on their estimated fair values at the acquisition date, is as follows:
| | | | | |
| (In millions)Total |
| Current assets, net of cash acquired | $ | 53.051.4 | |
| Property, plant and equipment | 61.657.6 | |
| Goodwill | 391.1396.6 | |
| Intangible assets | 319.1 | |
| Other noncurrent assets | 7.49.6 | |
| Total assets acquired | 832.2834.3 | |
| Current liabilities | (25.9)(26.8) | |
| Deferred income taxes | (83.9)(83.5) | |
| Other noncurrent liabilities | (9.4)(11.0) | |
| Net assets acquired | $ | 713.0 | |
| |
Acquired intangible assets consist of trade names, customer relationships and unpatented technology. The goodwill recorded for the acquisition reflects the strategic fit, revenue and earnings growth potential of this business.
The acquired intangible assets and weighted average amortization periods are as follows:
| | | | | | | | | | | |
| (In millions, except weighted average life) | Total | | Weighted Average Life |
| Trade names | $ | 38.3 | | | 15 |
| Customer relationships | 212.4 | | | 13 |
| Unpatented technology | 68.4 | | | 11 |
| Acquired intangible assets | $ | 319.1 | | | |
The Company incurred $6.8 million of acquisition-related costs in 2022. These costs were recorded in Selling, general and administrative expenses and were related to completed transactions, pending transactions and potential transactions, including transactions that ultimately were not completed. The Company also recorded $0.1 million, $0.3 million, and $8.1 million of fair value inventory step-up charges associated with the completed 2022 acquisitions of Nexsight, KZValve and Muon Group, respectively, in Cost of sales for the year ended December 31, 2022. | | | | | | | | | | | |
| Total | | Weighted Average Life |
| Trade names | $ | 38.3 | | | 15 |
| Customer relationships | 212.4 | | | 13 |
| Unpatented technology | 68.4 | | | 11 |
| Acquired intangible assets | $ | 319.1 | | | |
2021 Acquisitions
ABEL
On March 10, 2021, the Company acquired the stock of ABEL.ABEL Pumps, L.P. and certain of its affiliates (“ABEL”). ABEL designs and manufactures highly engineered reciprocating positive displacement pumps for a variety of end markets, including mining, marine, power, water, wastewater and other general industries. Headquartered in Büchen, Germany, with sales and service locations in Madrid, Spain, and subsequent to the acquisition, with operations in Mansfield, Ohio, ABEL operates in the Company’s Pumps reporting unit within the FMT segment. ABEL was acquired for cash consideration of $106.3 million. The entire purchase price was funded with cash on hand. Goodwill and intangible assets recognized as part of this transaction were $42.7 million and $46.0 million, respectively. The goodwill is not deductible for tax purposes.
The Company finalized the allocation of the purchase price for the ABEL acquisition as of the acquisition date based on its understanding of the fair value of the acquired assets and assumed liabilities. These nonrecurring fair value measurements are classified as Level 3 in the fair value hierarchy.
The final allocation of the purchase price to the assets acquired and liabilities assumed, based on their estimated fair values at the acquisition date, is as follows:
| | | | | |
| (In millions)Total |
| Current assets, net of cash acquired | $ | 18.1 | |
| Property, plant and equipment | 4.0 | |
| Goodwill | 42.7 | |
| Intangible assets | 46.0 | |
| Deferred income taxes | 2.6 | |
| Other noncurrent assets | 0.1 | |
| Total assets acquired | 113.5 | |
| Current liabilities | (7.1) | |
| Other noncurrent liabilities | (0.1) | |
| Net assets acquired | $ | 106.3 | |
Acquired intangible assets consist of trade names, customer relationships and unpatented technology. The goodwill recorded for the acquisition reflects the strategic fit, revenue and earnings growth potential of this business.
The acquired intangible assets and weighted average amortization periods are as follows:
| | (In millions, except weighted average life) | Total | | Weighted Average Life |
| Total | | | Total | | Weighted Average Life |
| Trade names | Trade names | $ | 9.0 | | | 15 | Trade names | $ | 9.0 | | | 15 | | 15 |
| Customer relationships | Customer relationships | 30.0 | | | 13 | Customer relationships | 30.0 | | | 13 | | 13 |
| Unpatented technology | Unpatented technology | 7.0 | | | 11 | Unpatented technology | 7.0 | | | 11 | | 11 |
| Acquired intangible assets | Acquired intangible assets | $ | 46.0 | | |
Airtech
On June 14, 2021, the Company acquired the stock of Airtech.Airtech Group, Inc., US Valve Corporation and related entities (“Airtech”). Airtech designs and manufactures a wide range of highly-engineered pressure technology products, including vacuum pumps, regenerative blowers, compressor systems and valves for a variety of end markets, including alternative energy, food processing, medical, packaging and transportation. Headquartered in Rutherford, New Jersey, with primary manufacturing operations in Werneck, Germany and Shenzhen, China, Airtech operates in the Company’s Performance Pneumatic Technologies reporting unit within the HST segment. Airtech was acquired for cash consideration of $471.0 million. The entire purchase price was funded with cash on hand. Goodwill and intangible assets recognized as part of this transaction were $268.5 million and $202.3 million, respectively. The goodwill is not deductible for tax purposes.
The Company finalized the allocation of the purchase price for the Airtech acquisition as of the acquisition date based on its understanding of the fair value of the acquired assets and assumed liabilities. These nonrecurring fair value measurements are classified as Level 3 in the fair value hierarchy.
The final allocation of the purchase price to the assets acquired and liabilities assumed, based on their estimated fair values at the acquisition date, is as follows:
| | | | | |
| Total |
| Current assets, net of cash acquired | $ | 45.3 | |
| Property, plant and equipment | 4.8 | |
| Goodwill | 268.5 | |
| Intangible assets | 202.3 | |
| Other noncurrent assets | 10.2 | |
| Total assets acquired | 531.1 | |
| Current liabilities | (11.8) | |
| Deferred income taxes | (39.9) | |
| Other noncurrent liabilities | (8.4) | |
| Net assets acquired | $ | 471.0 | |
Acquired intangible assets consist of trade names, customer relationships and unpatented technology. The goodwill recorded for the acquisition reflects the strategic fit, revenue and earnings growth potential of this business.
The acquired intangible assets and weighted average amortization periods are as follows:
| | | | | | | | | | | |
| Total | | Weighted Average Life |
| Trade names | $ | 15.4 | | | 15 |
| Customer relationships | 162.9 | | | 13 |
| Unpatented technology | 24.0 | | | 11 |
| Acquired intangible assets | $ | 202.3 | | | |
Acquisition-Related Costs
The Company incurred $6.5 million of acquisition-relatedacquisition costs in 2021.related to completed, pending and potential acquisitions, including those that ultimately were not completed. These costs were recorded in Selling, general and administrative expenses and were related to completed transactions, pending transactions and potential transactions, including transactions that ultimately were not completed.expenses. The Company also recorded $2.5 million and $9.1 million ofincurred fair value inventory step-up charges associated with the completed 2021 acquisitions of ABEL and Airtech, respectively,acquisitions. These costs were recorded in Cost of sales forsales. A summary of the yearacquisition costs and the fair value inventory step-up charges recorded in the years ended December 31, 2021.2023, 2022 and 2021 are presented in the following table:
2020 Acquisitions | | | | | | | | | | | | | | | | | | | | |
| | 2023 | | 2022 | | 2021 |
| Acquisition costs | | $ | 7.3 | | | $ | 6.8 | | | $ | 6.5 | |
| Fair value inventory step-up charges | | $ | 1.6 | | | $ | 8.5 | | | $ | 11.6 | |
Flow MD
On February 28, 2020, the Company acquired the membership interests of Flow MD, a privately held provider of flow measurement systems that ensure custody transfer accuracy in the oil and gas industry. Flow MD engineers and manufactures small volume provers. Headquartered in Phoenix, Arizona, with operations in Houston, Texas and Pittsburgh, Pennsylvania, Flow MD operates in the Company’s Energy reporting unit within the FMT segment. Flow MD was acquired for cash consideration of $121.2 million. The entire purchase price was funded with cash on hand. Goodwill and intangible assets recognized as part of this transaction were $60.0 million and $53.0 million, respectively. The goodwill is deductible for tax purposes.
The Company finalized the allocation of the purchase price for the Flow MD acquisition as of the acquisition date based on its understanding of the fair value of the acquired assets and assumed liabilities. These nonrecurring fair value measurements are classified as Level 3 in the fair value hierarchy.
The final allocation of the purchase price to the assets acquired and liabilities assumed, based on their estimated fair values at the acquisition date, is as follows:
| | | | | |
| Total |
Current assets, net of cash acquired | $ | 32.9 | |
Property, plant and equipment | 4.2 | |
Goodwill | 60.0 | |
Intangible assets | 53.0 | |
Deferred income taxes | 2.5 | |
Other noncurrent assets | 1.3 | |
Total assets acquired | 153.9 | |
Current liabilities | (32.3) | |
Other noncurrent liabilities | (0.4) | |
Net assets acquired | $ | 121.2 | |
Acquired intangible assets consist of trade names, customer relationships and unpatented technology. The goodwill recorded for the acquisition reflects the strategic fit, revenue and earnings growth potential of this business.
The acquired intangible assets and weighted average amortization periods are as follows:
| | | | | | | | | | | |
| Total | | Weighted Average Life |
| Trade names | $ | 6.0 | | | 15 |
| Customer relationships | 31.5 | | | 10 |
| Unpatented technology | 15.5 | | | 20 |
| Acquired intangible assets | $ | 53.0 | | | |
Qualtek
On November 23, 2020, the Company acquired Qualtek, a manufacturer of high quality specialty metal components and parts by providing vertically integrated tool and die, metal stamping and metal finishing services. Headquartered in Colorado Springs, Colorado, Qualtek operates in the BAND-IT reporting unit within the FSDP segment. Qualtek was acquired for cash consideration of $1.9 million. The entire purchase price was funded with cash on hand. Goodwill recognized as part of this transaction was $1.1 million. The goodwill recorded for the acquisition reflects the strategic fit, revenue and earnings growth potential of this business. The goodwill is deductible for tax purposes.
The Company finalized its allocation of the purchase price for the Qualtek acquisition as of the acquisition date based on its understanding of the fair value of the acquired assets. These nonrecurring fair value measurements are classified as Level 3 in the fair value hierarchy.
The Company incurred $4.3 million of acquisition-related costs in 2020. These costs were recorded in Selling, general and administrative expenses and were related to completed transactions, pending transactions and potential transactions, including transactions that ultimately were not completed. The Company also recorded $4.1 million and $0.1 million of fair value inventory step-up charges associated with the completed 2020 acquisitions of Flow MD and Qualtek, respectively, in Cost of sales for the year ended December 31, 2020.
Divestitures
The Company periodically reviews its operations for businesses which may no longer be aligned withrelative to its strategic objectives and its focus on core business and customers.customers and evaluates if refinements may be needed. As such, from time to time, the Company may sell various businesses or assets for a variety of reasons. Any resulting gain or loss recognized due to divestitures is recorded within Gain on sale of businesses - net in the Consolidated Statements of Income.
TableOn December 29, 2023, the Company completed the sale of ContentsNovotema, SpA (“Novotema”) for proceeds of $8.3 million, net of cash remitted, resulting in a loss on the sale of $9.1 million. There was no income tax impact associated with this transaction in the Consolidated Statements of Income due to the participation exemption of its consolidated group. The results of Novotema were reported in the Sealing Solutions reporting unit within the HST segment.
On August 3, 2023, the Company completed the sale of Micropump, Inc. (“Micropump”) for proceeds of $110.3 million, net of cash remitted, resulting in a pre-tax gain on the sale of $93.8 million. The divestiture resulted in $22.7 million of income tax expense in the Consolidated Statements of Income during the year ended December 31, 2023. Micropump was its own reporting unit and its results were reported within the HST segment.
On September 9, 2022, the Company completed the sale of Knight LLC (“Knight”) for proceeds of $49.4 million, net of cash remitted, resulting in a pre-tax gain on the sale of $34.8 million, which was recorded to Gain on sale of businessmillion. The divestiture resulted in the Consolidated Statements of Income. The Company recorded $5.5 million of income tax expense associated with this transaction as Provision for income taxes in the Consolidated Statements of Income through the date of disposition during the year ended December 31, 2022. The results of Knight were reported in the Water reporting unit within the FMT segment. The Company concluded that this divestiture did not meet the criteria for reporting the results of Knight as a discontinued operation.
3. Collaborative Investments
On May 12, 2020, a subsidiary of IDEX entered into a joint venture agreement with a third party to form a limited liability company (the “Joint Venture”) that manufactures and sells high performance elastomer seals for the oil and gas industry to customers within the Kingdom of Saudi Arabia as well as exports these high performance elastomer seals outside of the Kingdom of Saudi Arabia. The Joint Venture is headquarteredmaintains operations in Dammam, Saudi Arabia and operates in the Company’s Sealing Solutions reporting unit within the HST segment. During the year ended December 31, 2020, theThe Company has contributed $0.10.7 million for for 55% of the share capital while the third partythird-party partner has contributed $0.10.6 million for 45% of the share capital. During the year ended December 31, 2021, the Company contributed an additional $0.6 million and during the year ended December 31, 2022, the third party partner contributed an additional $0.5 million. The Joint Venture has incurred start-up expenses and began sales inbeen selling since July 2022. Since IDEX controls the entity, IDEX has consolidated the Joint Venture and recorded a Noncontrolling interest in its Consolidated Financial Statements.
On June 29,During 2021 and 2022, a subsidiary of IDEX funded a $4.2total of $7.2 million convertible in promissory note tonotes as an investment in a start-up company that provides communication technology to improve individual performance and team coordination for firefighters’ responses. The investmentresponses, which aligns with theIDEX’s FSDP segment’s strategic plan to reduce response timeplan. On a quarterly basis, the Company evaluates whether an allowance for credit losses is required for these promissory notes and greatly increase life-safety outcomes and is an extensionmeasures the allowance using the current expected credit loss model. During the second quarter of FSDP’s smart and connected products. The note bears paid-in-kind interest at2023, IDEX determined that its investment may no longer be recoverable. As a rateresult, IDEX recorded a credit loss of 5% per annum and is secured by the Company’s interest$7.7 million in Other expense (income) - net in the intellectual propertyConsolidated Statements of the start-up company. Unless earlier converted, the principal amount outstandingIncome and the related accrued interest are due upon the earliest of (a) June 28, 2024, (b) a change in control or (c) when declared due and payable by the Company upon an event of default. On December 22, 2022, the subsidiary of IDEX funded an additional $3.0 million promissory note, which bears paid-in-kind interest at a rate of 5% per annum and is secured by the Company’s interest in the intellectual property of the start-up company. The principal amount outstanding and the related accrued interest are due upon the earliest of (a) December 21, 2025, (b) a change in control or (c) when declared due and payable by the Company upon an event of default.
The notes are includedreserve in Other noncurrent assets on the Company’s Consolidated Balance Sheets. In addition, the Company recorded $0.3 million and $0.1 million of accrued interest in Other noncurrent assets on the Company’s Consolidated Balance Sheets for the years ended December 31, 2022full amount of the principal and 2021, respectively. The Company measuresaccrued interest outstanding. During the allowance for credit losses underfourth quarter of 2023, IDEX converted the current expected credit loss model. As of December 31, 2022 and 2021, no allowance for credit losses was recorded.promissory notes to equity, resulting in a cost method investment with zero value.
4. Balance Sheet Components
| | | | | | | | | | | |
| | December 31, |
| | 2022 | | 2021 |
| | (In millions) |
| RECEIVABLES | | | |
| Customers | $ | 431.3 | | | $ | 354.9 | |
| Other | 19.5 | | | 8.7 | |
| Total | 450.8 | | | 363.6 | |
| Less allowance for credit losses | 8.0 | | | 7.2 | |
| Total receivables - net | $ | 442.8 | | | $ | 356.4 | |
| INVENTORIES | | | |
| Raw materials and components parts | $ | 301.2 | | | $ | 229.4 | |
| Work in process | 54.3 | | | 47.4 | |
| Finished goods | 115.4 | | | 93.6 | |
| Total inventories | $ | 470.9 | | | $ | 370.4 | |
| PROPERTY, PLANT AND EQUIPMENT | | | |
| Land and improvements | $ | 35.2 | | | $ | 39.1 | |
| Buildings and improvements | 214.2 | | | 197.9 | |
| Machinery, equipment and other | 492.4 | | | 467.8 | |
| Office and transportation equipment | 100.6 | | | 96.7 | |
| Construction in progress | 56.4 | | | 30.5 | |
| Total | 898.8 | | | 832.0 | |
| Less accumulated depreciation and amortization | 516.7 | | | 504.7 | |
| Total property, plant and equipment - net | $ | 382.1 | | | $ | 327.3 | |
| ACCRUED EXPENSES | | | |
| Payroll and related items | $ | 102.7 | | | $ | 91.5 | |
| Management incentive compensation | 26.4 | | | 25.0 | |
| Income taxes payable | 30.2 | | | 17.9 | |
| Insurance | 11.2 | | | 11.0 | |
| Warranty | 8.1 | | | 7.6 | |
| Deferred revenue | 44.7 | | | 49.0 | |
| Lease liability | 21.6 | | | 17.6 | |
| Restructuring | 1.4 | | | 2.8 | |
| Accrued interest | 5.5 | | | 3.6 | |
| Pension and retiree medical obligations | 3.3 | | | 3.5 | |
| Other | 34.0 | | | 30.3 | |
| Total accrued expenses | $ | 289.1 | | | $ | 259.8 | |
| OTHER NONCURRENT LIABILITIES | | | |
| Pension and retiree medical obligations | $ | 55.1 | | | $ | 82.2 | |
| Transition tax payable | 9.1 | | | 14.1 | |
| Deferred revenue | 15.0 | | | 32.2 | |
| Lease liability | 96.6 | | | 93.4 | |
| Other | 20.0 | | | 25.5 | |
| Total other noncurrent liabilities | $ | 195.8 | | | $ | 247.4 | |
4. Balance Sheet Components
| | | | | | | | | | | |
| | December 31, |
| | 2023 | | 2022 |
| RECEIVABLES - NET | | | |
| Customers | $ | 419.0 | | | $ | 431.3 | |
| Other | 16.3 | | | 19.5 | |
| Total | 435.3 | | | 450.8 | |
| Less allowance for credit losses | 7.5 | | | 8.0 | |
| Total receivables - net | $ | 427.8 | | | $ | 442.8 | |
| INVENTORIES - NET | | | |
| Raw materials and components parts | $ | 268.1 | | | $ | 301.2 | |
| Work in process | 44.5 | | | 54.3 | |
| Finished goods | 108.2 | | | 115.4 | |
| Total inventories - net | $ | 420.8 | | | $ | 470.9 | |
| PROPERTY, PLANT AND EQUIPMENT - NET | | | |
| Land and improvements | $ | 30.8 | | | $ | 35.2 | |
| Buildings and improvements | 234.7 | | | 214.2 | |
| Machinery, equipment and other | 551.0 | | | 492.4 | |
| Office and transportation equipment | 106.0 | | | 100.6 | |
| Construction in progress | 53.5 | | | 56.4 | |
| Total | 976.0 | | | 898.8 | |
| Less accumulated depreciation and amortization | 545.7 | | | 516.7 | |
| Total property, plant and equipment - net | $ | 430.3 | | | $ | 382.1 | |
| ACCRUED EXPENSES | | | |
| Payroll and related items | $ | 97.1 | | | $ | 102.7 | |
| Management incentive compensation | 16.4 | | | 26.4 | |
| Income taxes payable | 18.5 | | | 30.2 | |
| Insurance | 11.4 | | | 11.2 | |
| Warranty | 9.1 | | | 8.1 | |
| Deferred revenue | 55.9 | | | 44.7 | |
| Lease liability | 22.0 | | | 21.6 | |
| Restructuring | 2.1 | | | 1.4 | |
| Accrued interest | 4.5 | | | 5.5 | |
| Pension and retiree medical obligations | 3.4 | | | 3.3 | |
| Other | 31.1 | | | 34.0 | |
| Total accrued expenses | $ | 271.5 | | | $ | 289.1 | |
| OTHER NONCURRENT LIABILITIES | | | |
| Pension and retiree medical obligations | $ | 65.1 | | | $ | 55.1 | |
| Transition tax payable | 5.0 | | | 9.1 | |
| Deferred revenue | 17.3 | | | 15.0 | |
| Lease liability | 98.1 | | | 96.6 | |
| Other | 21.2 | | | 20.0 | |
| Total other noncurrent liabilities | $ | 206.7 | | | $ | 195.8 | |
The valuation and qualifying account activity for the years ended December 31, 20222023 and 20212022 is as follows:
| | 2022 | | 2021 | |
| | (In millions) |
| 2023 | |
| 2023 | |
| 2023 | |
| ALLOWANCE FOR CREDIT LOSSES | |
| ALLOWANCE FOR CREDIT LOSSES | |
| ALLOWANCE FOR CREDIT LOSSES | ALLOWANCE FOR CREDIT LOSSES | | |
| Beginning balance January 1 | Beginning balance January 1 | $ | 7.2 | | | $ | 6.1 | | |
| Charged to costs and expenses, net of recoveries | Charged to costs and expenses, net of recoveries | 2.2 | | | 1.5 | | |
| Charged to costs and expenses, net of recoveries | |
| Charged to costs and expenses, net of recoveries | |
| Utilization | Utilization | (1.2) | | | (0.9) | | |
| Other adjustments, including acquisitions and currency translation | (0.2) | | | 0.5 | | |
| Utilization | |
| Utilization | |
| Other adjustments, including acquisitions and Foreign currency translation | |
| Other adjustments, including acquisitions and Foreign currency translation | |
| Other adjustments, including acquisitions and Foreign currency translation | |
| Ending balance December 31 | Ending balance December 31 | $ | 8.0 | | | $ | 7.2 | | |
| Ending balance December 31 | |
| Ending balance December 31 | |
5. Revenue
Disaggregation of Revenue
The Company has a comprehensive offering of products, including technologies, built to customers’ specifications that are sold in niche markets throughout the world. The Company disaggregates revenue from contracts with customers by reporting unit and geographical region for each segment as the Company believes it best depicts how the amount, nature, timing and uncertainty of its revenue and cash flows are affected by economic factors. Revenue, or Net sales, was attributed to geographical region based on the location of the customer. The following tables present revenue disaggregated by reporting unit and geographical region.
Revenue by reporting unit for the years ended December 31, 2023, 2022 2021 and 20202021 was as follows:
| | For the Year Ended December 31, |
| 2022 | | 2021 | | 2020 |
| (In millions) |
| For the Year Ended December 31, | | | For the Year Ended December 31, |
| 2023 | | | 2023 | | 2022 | | 2021 |
| Pumps | Pumps | $ | 396.5 | | | $ | 345.1 | | | $ | 265.3 | |
| Water | Water | 307.8 | | | 255.3 | | | 225.3 | |
| Energy | Energy | 191.3 | | | 169.0 | | | 200.0 | |
| Agriculture | Agriculture | 152.8 | | | 107.4 | | | 87.1 | |
| Valves | Valves | 118.9 | | | 121.9 | | | 118.6 | |
| Intersegment elimination | Intersegment elimination | (1.1) | | | (0.7) | | | (0.9) | |
| Fluid & Metering Technologies | Fluid & Metering Technologies | 1,166.2 | | | 998.0 | | | 895.4 | |
Scientific Fluidics & Optics(1) | Scientific Fluidics & Optics(1) | 639.0 | | | 508.0 | | | 415.8 | |
| Performance Pneumatic Technologies | |
| Sealing Solutions | Sealing Solutions | 266.0 | | | 264.2 | | | 207.6 | |
| Performance Pneumatic Technologies | 257.6 | | | 182.2 | | | 122.9 | |
| Material Processing Technologies | Material Processing Technologies | 138.1 | | | 134.5 | | | 120.0 | |
| Micropump | 38.5 | | | 32.9 | | | 29.7 | |
Micropump(2) | |
| Intersegment elimination | Intersegment elimination | (2.4) | | | (2.8) | | | (2.6) | |
| Health & Science Technologies | Health & Science Technologies | 1,336.8 | | | 1,119.0 | | | 893.4 | |
| Fire & Safety | Fire & Safety | 400.1 | | | 377.5 | | | 376.3 | |
| Dispensing | Dispensing | 167.5 | | | 169.6 | | | 98.5 | |
| BAND-IT | BAND-IT | 111.6 | | | 100.8 | | | 88.1 | |
| Intersegment elimination | Intersegment elimination | (0.3) | | | (0.1) | | | (0.1) | |
| Fire & Safety/Diversified Products | Fire & Safety/Diversified Products | 678.9 | | | 647.8 | | | 562.8 | |
| Total net sales | Total net sales | $ | 3,181.9 | | | $ | 2,764.8 | | | $ | 2,351.6 | |
(1) The year ended December 31, 2022 includes the acceleration of $17.9 million of previously deferred revenue related toof $17.9 million as a result of a customer’s decision to discontinue further investment in commercializing its COVID-19 testing application. See Note 1514 for further detail.
(2) Revenue from Micropump (sold on August 3, 2023) has been included in the Company’s Consolidated Statements of Income through the date of disposition. See Note 2 for further detail.
Revenue by geographical region for the years ended December 31, 2023, 2022 2021 and 20202021 was as follows:
| | For the Year Ended December 31, 2022 |
| FMT | | HST | | FSDP | | IDEX |
| (In millions) |
U.S.(1) | $ | 660.8 | | | $ | 646.9 | | | $ | 343.3 | | | $ | 1,651.0 | |
| For the Year Ended December 31, 2023 | | | For the Year Ended December 31, 2023 |
| FMT | | | FMT | | HST | | FSDP | | IDEX |
| U.S. | |
| North America, excluding U.S. | North America, excluding U.S. | 71.5 | | | 25.8 | | | 35.3 | | | 132.6 | |
Europe(1) | 194.6 | | | 379.7 | | | 160.9 | | | 735.2 | |
| Europe | |
| Asia | Asia | 157.8 | | | 261.3 | | | 104.2 | | | 523.3 | |
Other (2) | 82.6 | | | 25.5 | | | 35.5 | | | 143.6 | |
Other(1) | |
| Intersegment elimination | Intersegment elimination | (1.1) | | | (2.4) | | | (0.3) | | | (3.8) | |
| Total net sales | Total net sales | $ | 1,166.2 | | | $ | 1,336.8 | | | $ | 678.9 | | | $ | 3,181.9 | |
| | For the Year Ended December 31, 2021 |
| FMT | | HST | | FSDP | | IDEX |
| (In millions) |
| U.S. | $ | 532.9 | | | $ | 489.7 | | | $ | 317.0 | | | $ | 1,339.6 | |
| For the Year Ended December 31, 2022 | | | For the Year Ended December 31, 2022 |
| FMT | | | FMT | | HST | | FSDP | | IDEX |
U.S.(2) | |
| North America, excluding U.S. | North America, excluding U.S. | 61.6 | | | 23.7 | | | 28.5 | | | 113.8 | |
| Europe | 197.2 | | | 341.0 | | | 161.5 | | | 699.7 | |
Europe(2) | |
| Asia | Asia | 143.7 | | | 241.8 | | | 110.0 | | | 495.5 | |
Other (2) | 63.3 | | | 25.6 | | | 30.9 | | | 119.8 | |
Other(1) | |
| Intersegment elimination | Intersegment elimination | (0.7) | | | (2.8) | | | (0.1) | | | (3.6) | |
| Total net sales | Total net sales | $ | 998.0 | | | $ | 1,119.0 | | | $ | 647.8 | | | $ | 2,764.8 | |
| | For the Year Ended December 31, 2020 |
| FMT | | HST | | FSDP | | IDEX |
| (In millions) |
| For the Year Ended December 31, 2021 | | | For the Year Ended December 31, 2021 |
| FMT | | | FMT | | HST | | FSDP | | IDEX |
| U.S. | U.S. | $ | 505.8 | | | $ | 387.6 | | | $ | 269.9 | | | $ | 1,163.3 | |
| North America, excluding U.S. | North America, excluding U.S. | 52.8 | | | 21.3 | | | 23.2 | | | 97.3 | |
| Europe | Europe | 174.9 | | | 249.8 | | | 149.2 | | | 573.9 | |
| Asia | Asia | 109.1 | | | 221.2 | | | 94.2 | | | 424.5 | |
Other (2) | 53.7 | | | 16.1 | | | 26.4 | | | 96.2 | |
Other(1) | |
| Intersegment elimination | Intersegment elimination | (0.9) | | | (2.6) | | | (0.1) | | | (3.6) | |
| Total net sales | Total net sales | $ | 895.4 | | | $ | 893.4 | | | $ | 562.8 | | | $ | 2,351.6 | |
(1)Other includes: South America, Middle East, Australia and Africa.
(2) The HST revenuesegment includes the acceleration of $17.9 million of previously deferred revenue related toas a result of a customer’s decision to discontinue further investment in commercializing its COVID-19 testing application, of which $9.5 million was recognized in the U.S. and $8.4 million was recognized in Europe in the year ended December 31, 2022. See Note 1514 for further detail.
(2) Other includes: South America, Middle East, Australia and Africa.
Performance Obligations
The Company’s performance obligations are satisfied either at a point in time or over time as work progresses. Revenue from products and services transferred to customers at a point in time approximated 96% of total revenues in the year ended December 31, 2022was approximately 95% and 95% of total revenuesover time was approximately 5% in each of the years ended December 31, 2021 and 2020. Revenue from products and services transferred to customers over time approximated 4% of total revenues in the year ended December 31,2023, 2022, and 5% of total revenues in each of the years ended December 31, 2021 and 2020.
Contract Balances
The timing of revenue recognition, billings and cash collections can result in customer receivables, advance payments or billings in excess of revenue recognized. Customer receivables include both amounts billed and currently due from customers as well as unbilled amounts (contract assets) and are included in Receivables - net on the Consolidated Balance Sheets. Amounts are billed in accordance with contractual terms or as work progresses. Unbilled amounts arise when the timing of billing differs from the timing of revenue recognized, such as when contract provisions require specific milestones to be met before a customer can be billed. Unbilled amounts primarily relate to performance obligations satisfied over time when the cost-to-cost method is utilized and the revenue recognized exceeds the amount billed to the customer as there is not yet a right to invoice in accordance with contractual terms. Unbilled amounts are recorded as a contract asset when the revenue associated with the contract is recognized prior to billing and derecognized when billed in accordance with the terms of the contract.
The composition of customer receivables was as follows:
| | | | | | | | | | | |
| December 31, 2022 | | December 31, 2021 |
| (In millions) |
| Billed receivables | $ | 421.3 | | | $ | 344.0 | |
| Unbilled receivables | 10.0 | | | 10.9 | |
| Total customer receivables | $ | 431.3 | | | $ | 354.9 | |
Advance payments, deposits and billings in excess of revenue recognized are included in deferred revenue which is classified as current or noncurrent based on the timing of when the Company expects to recognize the revenue. The current portion is included in Accrued expenses and the noncurrent portion is included in Other noncurrent liabilities on the Consolidated Balance Sheets. Advance payments and deposits represent contract liabilities and are recorded when customers remit contractual cash payments in advance of us satisfying performance obligations under contractual arrangements, including those with performance obligations satisfied over time. The Company generally receives advance payments from customers related to maintenance services which are recognized ratably over the service term. The Company also receives deposits from customers on certain orders which the Company recognizes as revenue at a point in time. Billings in excess of revenue recognized represent contract liabilities and primarily relate to performance obligations satisfied over time when the cost-to-cost method is utilized and revenue cannot yet be recognized as the Company has not completed the corresponding performance obligation. Contract liabilities are derecognized when revenue is recognized and the performance obligation is satisfied.
The composition of deferred revenue was as follows:
| | | | | | | | | | | |
| December 31, 2022 | | December 31, 2021 |
| (In millions) |
| Deferred revenue - current | $ | 44.7 | | | $ | 49.0 | |
| Deferred revenue - noncurrent | 15.0 | | | 32.2 | |
Total deferred revenue(1) | $ | 59.7 | | | $ | 81.2 | |
(1) The balance as of December 31, 2022 has been reduced by the acceleration of previously deferred revenue of $17.9 million related to a customer’s decision to discontinue further investment in commercializing its COVID-19 testing application. See Note 15 for further detail.
Contract Balances
The composition of customer receivables was as follows:
| | | | | | | | | | | |
| December 31, 2023 | | December 31, 2022 |
| Billed receivables | $ | 408.1 | | | $ | 421.3 | |
| Unbilled receivables | 10.9 | | | 10.0 | |
| Total customer receivables | $ | 419.0 | | | $ | 431.3 | |
The composition of deferred revenue was as follows:
| | | | | | | | | | | |
| December 31, 2023 | | December 31, 2022 |
| Deferred revenue - current | $ | 55.9 | | | $ | 44.7 | |
| Deferred revenue - noncurrent | 17.3 | | | 15.0 | |
| Total deferred revenue | $ | 73.2 | | | $ | 59.7 | |
6. Goodwill and Intangible Assets
The changes in the carrying amount of goodwill for 20222023 and 2021,2022, by reportable business segment, were as follows:
| | FMT | | HST | | FSDP | | Total |
| (In millions) |
| FMT | | | FMT | | HST | | FSDP | | Total |
| Goodwill | Goodwill | $ | 670.4 | | | $ | 1,012.5 | | | $ | 413.3 | | | $ | 2,096.2 | |
| Accumulated goodwill impairment losses | Accumulated goodwill impairment losses | (20.7) | | | (149.8) | | | (30.1) | | | (200.6) | |
| Balance at January 1, 2021 | 649.7 | | | 862.7 | | | 383.2 | | | 1,895.6 | |
| Balance at January 1, 2022 | |
| Foreign currency translation | Foreign currency translation | (10.7) | | | (15.7) | | | (11.0) | | | (37.4) | |
| Acquisitions | Acquisitions | 42.4 | | | 267.6 | | | — | | | 310.0 | |
| Disposition of businesses | — | | | (0.1) | | | — | | | (0.1) | |
| Acquisition adjustments | (0.4) | | | — | | | — | | | (0.4) | |
| Balance at December 31, 2021 | 681.0 | | | 1,114.5 | | | 372.2 | | | 2,167.7 | |
| Measurement period adjustments | |
| Divestitures | |
| Balance at December 31, 2022 | |
| Foreign currency translation | Foreign currency translation | (8.4) | | | (11.5) | | | (9.3) | | | (29.2) | |
| Acquisitions | Acquisitions | 112.9 | | | 391.1 | | | — | | | 504.0 | |
| Disposition of businesses | (5.6) | | | — | | | — | | | (5.6) | |
| Acquisition adjustments | 0.3 | | | 0.9 | | | — | | | 1.2 | |
| Balance at December 31, 2022 | $ | 780.2 | | | $ | 1,495.0 | | | $ | 362.9 | | | $ | 2,638.1 | |
| Measurement period adjustments | |
| Divestitures | |
| Balance at December 31, 2023 | |
Goodwill represents the purchase price in excess of the net amount assigned to the assets acquired and liabilities assumed and was tested for impairment at each of the Company’s 13 reporting units as determined in accordance with ASC 350 as of October 31, 2022,2023, the Company’s annual impairment test date.date, with no impairment noted. In assessing the fair value of the reporting units, the Company considers both the market approach and the income approach. Under the market approach, the fair value of the reporting unit is determined by the respective trailing 12 month EBITDAearnings before interest, income taxes, depreciation and amortization (“EBITDA”) and the forward looking 20232024 EBITDA (50% each), based on multiples of comparable public companies. The market approach is dependent on a number of significant management assumptions including forecasted EBITDA and selected market multiples. Under the income approach, the fair value of the reporting unit is determined based on the present value of estimated future cash flows. The income approach is dependent on a number of significant management assumptions including estimates of operating results, capital expenditures, net working capital requirements, long-term growth rates and discount rates. Weighting was equally attributed to both the market and the income approaches (50% each) in arriving at the fair value of the reporting units. In 20222023 and 2021,2022, there were no events or circumstances that would have required an interim impairment test.
The following table provides the gross carrying value and accumulated amortization for each major class of intangible asset at December 31, 20222023 and 2021:2022:
| | | | At December 31, 2022 | | | | At December 31, 2021 |
| | | Gross
Carrying
Amount | | Accumulated
Amortization | | Net | | Weighted
Average
Life | | Gross
Carrying
Amount | | Accumulated
Amortization | | Net | | At December 31, 2023 | | | | At December 31, 2022 |
| | | | | (In millions) | | | | | | | | (In millions) | | | | Gross
Carrying
Amount | | Accumulated
Amortization | | Net | | Weighted
Average
Life | | Gross
Carrying
Amount | | Accumulated
Amortization | | Net |
| Amortized intangible assets: | Amortized intangible assets: | |
| Patents | |
| Patents | |
| Patents | Patents | $ | 2.9 | | | $ | (1.8) | | | $ | 1.1 | | | 12 | | $ | 3.2 | | | $ | (2.0) | | | $ | 1.2 | |
| Trade names | Trade names | 186.5 | | | (71.4) | | | 115.1 | | | 15 | | 140.9 | | | (72.4) | | | 68.5 | |
| Customer relationships | Customer relationships | 772.2 | | | (184.9) | | | 587.3 | | | 13 | | 495.9 | | | (144.2) | | | 351.7 | |
| Unpatented technology | Unpatented technology | 207.1 | | | (57.8) | | | 149.3 | | | 12 | | 143.8 | | | (58.8) | | | 85.0 | |
| Software | Software | 4.8 | | | (0.7) | | | 4.1 | | | 5 | | — | | | — | | | — | |
| Total amortized intangible assets | Total amortized intangible assets | 1,173.5 | | | (316.6) | | | 856.9 | | | 783.8 | | | (277.4) | | | 506.4 | |
| Indefinite-lived intangible assets: | Indefinite-lived intangible assets: | |
| Banjo trade name | Banjo trade name | 62.1 | | | — | | | 62.1 | | | 62.1 | | | — | | | 62.1 | |
| Banjo trade name | |
| Banjo trade name | |
| Akron Brass trade name | Akron Brass trade name | 28.8 | | | — | | | 28.8 | | | 28.8 | | | — | | | 28.8 | |
| Total intangible assets | Total intangible assets | $ | 1,264.4 | | | $ | (316.6) | | | $ | 947.8 | | | $ | 874.7 | | | $ | (277.4) | | | $ | 597.3 | |
The Banjo trade name and the Akron Brass trade namenames are indefinite-lived intangible assets that were also tested for impairment as of October 31, 2022, the Company’s annual impairment test date.2023, with no impairments noted. These indefinite-lived intangible assets are tested for impairment on an annual basis in accordance with ASC 350 or more frequently if events or changes in circumstances indicate that the assets might be impaired. The Company uses the relief-from-royalty method, a form of the income approach, to determine the fair value of these trade names. The relief-from-royalty method is dependent on a number of significant management assumptions, including estimates of revenues, royalty rates and discount rates. In 20222023 and 2021,2022, there were no events or circumstances that would have required an interim impairment test.
Amortization of intangible assets was $69.0$94.9 million,, $69.0 million and $56.4 million in 2023, 2022 and $41.8 million in 2022, 2021, and 2020, respectively. Based on the intangible asset balances as of December 31, 2022,2023, expected amortization expense for the years 2024 through 2028 is expected to approximate $91.2 million in 2023, $86.7 million in 2024, $85.3 million in 2025, $83.6 million in 2026 and $79.8 million in 2027.as follows:
| | | | | | | | |
| Maturity of Intangible Assets | | Estimated Amortization |
| 2024 | | $ | 98.8 | |
| 2025 | | 97.3 | |
| 2026 | | 95.7 | |
| 2027 | | 92.4 | |
| 2028 | | 89.4 | |
7. Borrowings
Borrowings at December 31, 20222023 and 20212022 consisted of the following:
| | 2022 | | 2021 |
| | (In millions) |
3.20% Senior Notes, due June 2023(1) | $ | 100.0 | | | $ | 100.0 | |
| 3.37% Senior Notes, due June 2025 | 100.0 | | | 100.0 | |
| 3.00% Senior Notes, due May 2030 | 500.0 | | | 500.0 | |
| 2.625% Senior Notes, due June 2031 | 500.0 | | | 500.0 | |
| $800.0 million Revolving Credit Facility, due November 2027 | 77.7 | | | — | |
| $200.0 million Term Facility, due November 2027 | 200.0 | | | — | |
| 2023 | | | 2023 | | 2022 |
| 3.20% Senior Notes, repaid in June 2023 (the “3.20% Senior Notes”) | |
| 3.37% Senior Notes, due June 2025 (the “3.37% Senior Notes”) | |
| 5.13% Senior Notes, due June 2028 (the “5.13% Senior Notes”) | |
| 3.00% Senior Notes, due May 2030 (the “3.00% Senior Notes”) | |
| 2.625% Senior Notes, due June 2031 (the “2.625% Senior Notes”) | |
| $800.0 million Revolving Facility, due November 2027 (the “Revolving Facility”) | |
| $200.0 million Term Facility, due November 2027 (the “Term Facility”) | |
| Other borrowings | Other borrowings | 0.1 | | | 0.1 | |
| Total borrowings | Total borrowings | 1,477.8 | | | 1,200.1 | |
| Less current portion | Less current portion | — | | | — | |
| Less deferred debt issuance costs | Less deferred debt issuance costs | 7.9 | | | 8.4 | |
| Less unaccreted debt discount | Less unaccreted debt discount | 1.2 | | | 1.4 | |
| Long-term borrowings | Long-term borrowings | $ | 1,468.7 | | | $ | 1,190.3 | |
(1)As of December 31, 2022, the $100.0 million 3.20% Senior Notes, due in June 2023, have not been classified as Short-term borrowings on the Consolidated Balance Sheets as the Company has the ability and intent to either refinance or repay these Notes using the available borrowing capacity of the Revolving Facility, due November 2027. As a result, the 3.20% Senior Notes remain classified as Long-term borrowings on the Consolidated Balance Sheets as of December 31, 2022.
Revolving Credit Facility and Term Facility
On November 1, 2022, the Company entered into an amended and restated that certain five-year $800 million Credit Agreement, dated as of May 31, 2019 that was due to expire in May 2024 (the “Original Credit Agreement” and, ascredit agreement (as amended and restated, the “Credit Agreement”) along with certain of its subsidiaries, as borrowers (the “Borrowers”), Bank of America, N.A., as administrative agent, swing line lender and an issuer of letters of credit, withand other agents party thereto. The Credit Agreement consists of a revolving credit facility (the “Revolving Facility”) in an aggregate principal amount of $800 million and a term credit facility (the “Term Facility”) available to the Company in an aggregate principal amount of $200 million, both of which have a final maturity date of November 1, 2027. The maturity date of the Revolving Facility may be extended under certain conditions for an additional one-year term. Up to $100 million of the Revolving Facility is available for the issuance of letters of credit. Additionally, up to $50 million of the Revolving Facility is available to the Company for swing line loans, available on a same-day basis.
Proceeds of the Revolving Facility are available for use by the Borrowers for working capital and other general corporate purposes, including refinancing existing debt of the Company and its subsidiaries.subsidiaries and financing of acquisitions. The Company may request increases in the lending commitments under the Credit Agreement, but the aggregate lending commitments pursuant to such increases may not exceed $400 million. The Company has the right, subject to certain conditions set forth in the Credit Agreement, to designate certain foreign subsidiaries of the Company as borrowers under the Credit Agreement. In connection with any such designation, the Company is required to guarantee the obligations of any such subsidiaries under the Credit Agreement. Proceeds from the Credit Agreement were used byDuring 2023, the Company to pay a portionrepaid $150.0 million of the consideration for$200.0 million previously outstanding under the acquisition of Muon Group.
Borrowings under the Credit Agreement bear interest, at either an alternate base rate or Term SOFR rate (or appropriate alternative currency reference rates) plus, in each case, an applicable margin. Such applicable margin is based on the better of the Company’s senior, unsecured, long-term debt rating or the Company’s applicable leverage ratio and can range from 0.00% to 1.275%. Interest is payable (a) in the case of base rate loans, quarterly, and (b) in the case of Term SOFR rate loans, on the last day of the applicable interest period selected, or every three months from the effective date of such interest period for interest periods exceeding three months.
The Credit Agreement givesweighted-average interest rate for borrowings outstanding under the CompanyRevolving Facility was 4.22% during 2023 and 3.32% during 2022 for the option to enter into a future environmental, socialperiod following the issuance of the Revolving Facility. The weighted-average interest rate for borrowings outstanding under the Term Facility was 6.22% during 2023 and governance amendment by which pricing may be adjusted pursuant to5.83% during 2022 for the Company’s performance measured against certain key performance indicators agreed byperiod following the Company and BofA Securities, Inc., as sustainability coordinator.issuance of the Term Facility.
The Credit Agreement requires payment to the lenders of a facility fee based upon the amount of the lenders’ commitments under the credit facility from time to time, equal to the applicable interest rate times the actual daily amount of the Revolving Facility. Voluntary prepayments of any loans and voluntary reductions of the unutilized portion of the commitments under the credit facility are permissible without penalty, subject to break funding payments and minimum notice and minimum reduction amount requirements.
The Credit Agreement contains customary affirmativegives the Company the option to enter into a future environmental, social and negative covenants for suchgovernance amendment by which pricing may be adjusted pursuant to the Company’s performance measured against certain key performance indicators agreed by the Company and BofA Securities, Inc., as sustainability coordinator.
At December 31, 2023, there was $81.0 million outstanding under the Revolving Facility and $3.4 million of outstanding letters of credit, resulting in a net available borrowing capacity under the Revolving Facility of approximately $715.6 million.
Senior Notes
On June 13, 2023, the Company completed a private placement of $100.0 million aggregate principal amount of 5.13% Senior Notes due June 13, 2028 pursuant to a Note Purchase and Master Note Agreement, dated as of June 13, 2023, among the Company, NYL Investors LLC (“New York Life”) and certain affiliates of New York Life identified as Purchasers of the 5.13% Senior Notes therein. The 5.13% Senior Notes are unsecured obligations of the Company and rank pari passu in right of payment with all of the Company’s other unsecured, unsubordinated debt. The Company used the proceeds from the 5.13% Senior Notes issuance to repay the 3.20% Senior Notes due June 13, 2023.
Inclusive of the 5.13% Senior Notes, at December 31, 2023, the Company has $1.2 billion in senior notes outstanding at various interest rates detailed in the table above (the “Senior Notes”). Interest on the Senior Notes is payable semi-annually in arrears during the second and fourth quarters of the year. The Senior Notes are unsecured credit agreements. obligations of the Company and rank pari passu in right of payment with all of the Company’s other unsecured, unsubordinated debt. Subject to the terms of the respective indenture, the Company may redeem all or a portion of the Senior Notes at any time prior to maturity at the redemption prices set forth in the indenture. The terms of the 2.625% Senior Notes and the 3.00% Senior Notes also require the Company to make an offer to repurchase the 2.625% Senior Notes and the 3.00% Senior Notes upon a change of control triggering event (as defined in the indenture) at a price equal to 101% of the principal amount plus accrued and unpaid interest, if any. The terms of the 3.37% Senior Notes and the 5.13% Senior Notes also require the Company to make an offer to repurchase the 3.37% Senior Notes and the 5.13% Senior Notes upon a change of control (as defined in the note purchase agreement) of the Company at a price equal to 100% of the principal amount plus accrued and unpaid interest, if any.
Covenants
There are two key financial covenants that the Company is required to maintain in connection with the Credit Agreement and the Senior Notes, excluding the 3.00% Senior Notes and the 2.625% Senior Notes which have no financial covenants. Those two covenants include a minimum interest coverage ratio of 3.0 to 1 and a maximum leverage ratio of 3.50 to 1, which is the ratio of the Company’s consolidated total debt to its consolidated earnings before interest, income taxes, depreciation and amortization (“EBITDA”),EBITDA, both of which are tested quarterly and in the case of the leverage ratio, there is an option to increase the ratio to 4.00 for 12 months in connection with certain acquisitions. At December 31, 2022, the Company was in compliance with each financial covenant under the Credit Agreement and the Senior Notes, excluding the 3.00% Senior Notes and the 2.625% Senior Notes which have no financial covenants. While there are no financial covenants relating to the 3.00% Senior Notes and the 2.625% Senior Notes, they are subject to cross-default provisions. The negative covenants include restrictions on the Company’s ability to grant liens, enter into transactions resulting in fundamental changes (such as mergers or sales of all or substantially all of the assets of the Company), make certain subsidiary dividends or distributions, engage in materially different lines of businesses and allow subsidiaries to incur certain additional debt.
The Credit Agreement also contains customary events of default (subject to grace periods, as appropriate).
At December 31, 2022, there was $77.7 million outstanding under the Revolving Facility with an interest rate of 3.32% and $7.9 million of outstanding letters of credit, resulting in a net available borrowing capacity under the Revolving Facility of approximately $714.4 million. In addition, there was $200.0 million outstanding under the Term Facility with an interest rate of 5.83%.
Issuance of 2.625% Senior Notes in 2021
On May 28, 2021,2023, the Company completed a public offering of $500.0 millionwas in aggregate principal amount of 2.625% Senior Notes due June 2031 (the “2.625% Senior Notes”). The net proceeds from the offering were approximately $494.7 million, after deducting the issuance discount of $0.6 million, the underwriting commission of $3.3 million and offering expenses of $1.4 million. The net proceeds were used to redeem and repay the $350.0 million aggregate principal amount outstanding of its 4.20% Senior Notes due December 15, 2021 (the “4.20% Senior Notes”) and a $6.7 million make-whole redemption premium, with the remaining balance used for general corporate purposes. The 2.625% Senior Notes bear interest at a rate of 2.625% per annum, which is payable semi-annually in arrears on June 15 and December 15 of each year. The 2.625% Senior Notes mature on June 15, 2031. The 2.625% Senior Notes were issued under an Indenture, dated as of December 6, 2010 (the “Base Indenture”), between the Company and Wells Fargo Bank, National Association, as trustee (the “Trustee”), as supplemented by the Fourth Supplemental Indenture, dated as of May 28, 2021 (the “Supplemental Indenture” and, together with the Base Indenture and other supplements thereto, the “Indenture”), between the Company and the Trustee.
The Company may redeem all or a portion of the 2.625% Senior Notes at any time prior to maturity at the redemption prices set forth in the Indenture. The Indenture and the 2.625% Senior Notes contain covenants that limit the Company’s ability to, among other things, incur certain liens, enter into certain sale and leaseback transactions and enter into certain mergers, consolidations and transfers of substantially all of the Company’s assets. The terms of the 2.625% Senior Notes also require the Company to make an offer to repurchase the 2.625% Senior Notes upon a change of control triggering event (as defined in the Indenture) at a price equal to 101% of the principal amount plus accrued and unpaid interest, if any. The Indenture also
provides for customary events of default, which include nonpayment, breach of covenants or warranties in the Indenture and certain events of bankruptcy, insolvency or reorganization. Generally, if an event of default occurs, the Trustee or holders of at least 25% of the then outstanding 2.625% Senior Notes may declare the principal amount of all of the 2.625% Senior Notes to be due and payable immediately.
On May 17, 2021, the Company provided notice of its election to redeem early, on June 16, 2021, the $350.0 million aggregate principal amount outstanding of its 4.20% Senior Notes at a redemption price of $350.0 million plus a make-whole redemption premium of $6.7 million using proceeds from the Company’s 2.625% Senior Notes. In addition, the Company recognized the remaining $1.3 million of the pre-tax amount included in Accumulated other comprehensive loss in Shareholders’ equity related to the interest rate exchange agreement associated with the 4.20% Senior Notes and wrote off the remaining $0.1 million of deferred issuance costs and $0.1 million of the debt issuance discount associated with the 4.20% Senior Notes as well as $0.4 million of deferred taxes for a total loss on early debt redemption of $8.6 million which was recorded within Other (income) expense - net in the Consolidated Statements of Income.
Issuance of 3.00% Senior Notes in 2020
On April 29, 2020, the Company completed a public offering of $500.0 million in aggregate principal amount of 3.00% Senior Notes due May 2030 (the “3.00% Senior Notes”). The net proceeds from the offering were approximately $494.4 million, after deducting the issuance discount of $0.9 million, the underwriting commission of $3.3 million and offering expenses of $1.4 million. The net proceeds were used to redeem and repay the $300.0 million aggregate principal amount outstanding of its 4.50% Senior Notes due December 15, 2020 (the “4.50% Senior Notes”) and the related accrued interest and a make-whole redemption premium, with the remaining balance used for general corporate purposes. The 3.00% Senior Notes bear interest at a rate of 3.00% per annum, which is payable semi-annually in arrears on May 1 and November 1 of each year. The 3.00% Senior Notes mature on May 1, 2030.
The Company may redeem all or a portion of the 3.00% Senior Notes at any time prior to maturity at the redemption prices set forth in the Indenture governing the 3.00% Senior Notes. The Indenture and 3.00% Senior Notes contain covenants that limit the Company’s ability to, among other things, incur certain liens securing indebtedness, engage in certain sale-leaseback transactions and enter into certain consolidations, mergers, conveyances, transfers or leases of all or substantially all of the Company’s assets. The terms of the 3.00% Senior Notes also require the Company to make an offer to repurchase the 3.00% Senior Notes upon a change of control triggering event (as defined in the Indenture) at a price equal to 101% of the principal amount plus accrued and unpaid interest, if any. The Indenture also provides for customary events of default, which include nonpayment, breach of covenants in the Indenture and certain events of bankruptcy and insolvency. Generally, if an event of default occurs, the Trustee or holders of at least 25% of the then outstanding 3.00% Senior Notes may declare the principal amount of all of the 3.00% Senior Notes to be due and payable immediately.
On April 27, 2020, the Company provided notice of its election to redeem early, on May 27, 2020, the $300.0 million aggregate principal amount outstanding of its 4.50% Senior Notes at a redemption price of $300.0 million plus a make-whole redemption premium of $6.8 million and accrued and unpaid interest of $6.1 million using proceeds from the Company’s 3.00% Senior Notes. In addition, the Company recognized the remaining $1.4 million of the pre-tax amount included in Accumulated other comprehensive loss in Shareholders’ equity related to the interest rate exchange agreement associated with the 4.50% Senior Notes and wrote off the remaining $0.1 million of deferred issuance costs and $0.1 million of the debt issuance discount associated with the 4.50% Senior Notes for a total loss on early debt redemption of $8.4 million which was recorded within Other (income) expense - net in the Consolidated Statements of Income.
Issuance of 3.20% Senior Notes and 3.37% Senior Notes in 2016
On June 13, 2016, the Company completed a private placement of a $100 million aggregate principal amount of 3.20% Senior Notes due June 13, 2023 (the “3.20% Senior Notes”) and a $100 million aggregate principal amount of 3.37% Senior Notes due June 13, 2025 (the “3.37% Senior Notes” and together with the 3.20% Senior Notes, the “2016 Private Placement Notes”) pursuant to a Note Purchase Agreement dated June 13, 2016 (the “Purchase Agreement”). Each series of the 2016 Private Placement Notes bears interest at the stated amount per annum, which is payable semi-annually in arrears on each June 13th and December 13th. The 2016 Private Placement Notes are unsecured obligations of the Company and rank pari passu in right of paymentcompliance with all of the Company’s other unsecured, unsubordinated debt. The Company may at any time prepay all, or any portion of the 2016 Private Placement Notes, provided that such portion is greater than 5% of the aggregate principal amount of the 2016 Private Placement Notes then outstanding. In the event of a prepayment, the Company will pay an amount equal to par plus accrued interest plus a make-whole amount. In addition, the Company may repurchase the 2016 Private Placement Notes by making an offer to all holders of the 2016 Private Placement Notes, subject to certain conditions.
The Purchase Agreement contains certain covenants that restrict the Company’s ability to, among other things, transfer or sell assets, incur indebtedness, create liens, transact with affiliates and engage in certain mergers or consolidations or other change of control transactions. In addition, the Company must comply with the leverage ratio and interest coverage ratio described above and the Purchase Agreement also limits the outstanding principal amount of priority debt that may be incurred by the Company to 15% of consolidated assets. The Purchase Agreement provides for customary events of default. In the case of an event of default arising from specified events of bankruptcy or insolvency, all of the outstanding 2016 Private Placement Notes will become due and payable immediately without further action or notice. In the case of payment event of default, any holder of the 2016 Private Placement Notes affected thereby may declare all of the 2016 Private Placement Notes held by it due and payable immediately. In the case of any other event of default, a majority of the holders of the 2016 Private Placement Notes may declare all of the 2016 Private Placement Notes to be due and payable immediately.under our borrowing arrangements.
Total borrowings at December 31, 20222023 have scheduled maturities as follows:
| | | | | |
| (In millions) | |
| 2023 | $ | 100.0 | |
| 2024 | — | |
| 2025 | 100.1 | |
| 2026 | — | |
| 2027 | 277.7 | |
| Thereafter | 1,000.0 | |
| Total borrowings | $ | 1,477.8 | |
8. Derivative Instruments
The Company enters into cash flow hedges from time to time to reduce the exposure to variability in certain expected future cash flows. The types of cash flow hedges the Company enters into include foreign currency exchange contracts designed to minimize the earnings impact on certain intercompany loans as well as interest rate exchange agreements designed to reduce the impact of interest rate changes on future interest expense that effectively convert a portion of floating-rate debt to fixed-rate debt.
The effective portion of gains or losses on interest rate exchange agreements is reported in Accumulated other comprehensive loss in Shareholders’ equity and reclassified into net income in the same period or periods in which the hedged transaction affects net income. The remaining gain or loss in excess of the cumulative change in the present value of future cash flows or the hedged item, if any, is recognized in net income during the period of change. See Note 17 for the amount of loss reclassified into net income for interest rate contracts for the years ended December 31, 2021 and 2020. As of December 31, 2022, the Company did not have any interest rate contracts outstanding.
In 2010 and 2011, the Company entered into two separate forward starting interest rate exchange agreements in anticipation of the issuance of the 4.50% Senior Notes and the 4.20% Senior Notes. The Company cash settled these two interest rate contracts in 2010 and 2011 for a total of $68.9 million, which was being amortized into interest expense over the 10 year terms of the respective debt instruments. In conjunction with the early redemption of the 4.50% Senior Notes on May 27, 2020, the Company accelerated the recognition of the remaining $1.4 million of the pre-tax amount included in Accumulated other comprehensive loss in Shareholders’ equity related to the 4.50% Senior Notes and recorded it within Other (income) expense - net in the Consolidated Statements of Income during the year ended December 31, 2020. In conjunction with the early redemption of the 4.20% Senior Notes on June 16, 2021, the Company accelerated the recognition of the remaining $1.3 million of the pre-tax amount included in Accumulated other comprehensive loss in Shareholders’ equity related to the 4.20% Senior Notes and recorded it within Other (income) expense - net in the Consolidated Statements of Income during the year ended December 31, 2021. As of December 31, 2022 and 2021, there was no balance in Accumulated other comprehensive loss related to the cumulative unrealized gain (loss) on derivatives.
The amount of expense reclassified into interest expense for interest rate contracts for the years ended December 31, 2021 and 2020 was $3.3 million and $6.0 million, respectively.
| | | | | |
| Maturity of Borrowings | |
| 2024 | $ | 0.6 | |
| 2025 | 100.9 | |
| 2026 | 0.5 | |
| 2027 | 131.3 | |
| 2028 | 100.0 | |
| Thereafter | 1,000.0 | |
| Total borrowings | $ | 1,333.3 | |
9.8. Fair Value Measurements
ASC 820, Fair Value Measurements and Disclosures, defines fair value, provides guidance for measuring fair value and requires certain disclosures. This standard discusses valuation techniques, such as the market approach (comparable market prices), the income approach (present value of future income or cash flow) and the cost approach (cost to replace the service capacity of an asset or replacement cost). The standard utilizes a fair value hierarchy that prioritizes the inputs to valuation techniques used to measure fair value into three broad levels. The following is a brief description of those three levels:
•Level 1: Observable inputs such as quoted prices (unadjusted) in active markets for identical assets or liabilities.
•Level 2: Inputs, other than quoted prices that are observable for the asset or liability, either directly or indirectly. These include quoted prices for similar assets or liabilities in active markets and quoted prices for identical or similar assets or liabilities in markets that are not active.
•Level 3: Unobservable inputs that reflect the reporting entity’s own assumptions.
The following table summarizes the basis used to measure the Company’s financial assets (liabilities) at fair value on a recurring basis in the balance sheets at December 31, 20222023 and 2021:
| | | | | | | | | | | | | | | | | | | | | | | |
| | Basis of Fair Value Measurements |
| | Balance at December 31, 2022 | | Level 1 | | Level 2 | | Level 3 |
| | (In millions) |
Trading securities - mutual funds held in nonqualified SERP(1) | $ | 7.5 | | | $ | 7.5 | | | $ | — | | | $ | — | |
| | Basis of Fair Value Measurements | |
| Basis of Fair Value Measurements | | | Basis of Fair Value Measurements |
| | Balance at December 31, 2021 | | Level 1 | | Level 2 | | Level 3 | | | December 31, 2023 | | December 31, 2022 |
| | | (In millions) | | | Level 1 | | Level 1 |
Trading securities - mutual funds held in nonqualified SERP(1) | Trading securities - mutual funds held in nonqualified SERP(1) | $ | 11.6 | | | $ | 11.6 | | | $ | — | | | $ | — | | |
Available-for-sale securities - equities(2) | Available-for-sale securities - equities(2) | 45.3 | | | 45.3 | | | — | | | — | | |
(1) The Supplemental Executive Retirement Plan (“SERP”) investment assets are offset by a SERP liability which represents the Company’s obligation to distribute SERP funds to participants.
(2) At December 31, 2021,2023, the securities wereare included in Other current assets on the Company’s Consolidated Balance Sheets and wereare available for overnight cash settlement, if necessary, to fund current operations. During the fourth quarter of 2022, the Company sold the securities for €39.9 million (or $39.7 million) which were originally purchased for €40.0 million (or $45.3 million). The proceeds from the sale of these securities were used to contribute cash for the acquisition of Muon Group.
There were no transfers of assets or liabilities between Level 1 and Level 2 in 20222023 or 2021.2022.
The carrying values of the Company’s cash and cash equivalents, accounts receivable, marketable securities, accounts payable and accrued expenses approximate fair value because of the short term nature of these instruments. At December 31, 2022 and 2021,
The following table provides the fair value of the outstanding indebtedness described in NoteNote 7, which is based on quoted market prices and current market rates for debt with similar credit risk and maturity, was approximately $1,328.7 million and $1,219.9 million, respectively, compared toas well as the carrying value of $1,476.6 million and $1,198.7 million, respectively.value. These fair value measurements are classified as Level 2 within the fair value hierarchy since they are determined based upon significant inputs observable in the market, including interest rates on recent financing transactions to entities with a credit rating similar to the Company’s rating.
| | | | | | | | | | | | | | | | | | | | | | | |
| December 31, 2023 | | December 31, 2022 |
| Fair Value | | Carrying Amount | | Fair Value | | Carrying Amount |
| Total Borrowings, less unaccreted debt discount | $ | 1,203.5 | | | $ | 1,332.2 | | | $ | 1,328.7 | | | $ | 1,476.6 | |
10.9. Leases
The Company has commitments under operating leases for certain office facilities, warehouses, manufacturing plants, equipment (which includes both office and plant equipment) and vehicles under operating leases and certain plant equipment under financing leases.used in its operations. Leases with an initial term of 12 months or less are not recorded on the balance sheet;sheet and the Company recognizes lease expense for these leases on a straight-line basis over the lease term.
Certain leases include one or more options to renew. The exercise of lease renewal options is at the Company’s sole discretion. The Company does not include renewal periods in any of the leases’ terms until the renewal is executed as they are generally not reasonably certain of being exercised. The Company does not have any material purchase options.
Certain of the Company’s lease agreements contain provisions for future rent increases or have rental payments that are adjusted periodically for inflation or that are based on usage. The Company’s lease agreements do not contain any material residual value guarantees or material restrictive covenants.
The Company does not have any significant leases that have not yet commenced.
Supplemental balance sheet information related to leases as of December 31, 20222023 and 20212022 was as follows:
| | | | | | | | | | | | | | | | | |
| Balance Sheet Caption | | December 31, 2022 | | December 31, 2021 |
| | | (In millions) |
| Right-of-Use (“ROU”) Assets: | | | | | |
| Building ROU assets - net - operating | Other noncurrent assets | | $ | 104.4 | | | $ | 101.0 | |
| Equipment ROU assets - net - operating | Other noncurrent assets | | 5.6 | | | 6.2 | |
| Equipment ROU assets - net - financing | Property, plant and equipment - net | | 6.1 | | | — | |
| Total ROU assets - net | | | $ | 116.1 | | | $ | 107.2 | |
| Lease Liabilities: | | | | | |
| Current lease liabilities | Accrued expenses | | $ | 21.6 | | | $ | 17.6 | |
| Noncurrent lease liabilities | Other noncurrent liabilities | | 96.6 | | | 93.4 | |
| Total lease liabilities | | | $ | 118.2 | | | $ | 111.0 | |
Refer to Note 15 for discussion on impairment of building right-of-use assets. | | | | | | | | | | | | | | | | | |
| Balance Sheet Caption | | December 31, 2023 | | December 31, 2022 |
| Right-of-Use (“ROU”) Assets: | | | | | |
| Building ROU assets - net | Other noncurrent assets | | $ | 110.7 | | | $ | 104.4 | |
| Equipment ROU assets - net | Other noncurrent assets | | 7.6 | | | 5.6 | |
| Total ROU assets - net | | | $ | 118.3 | | | $ | 110.0 | |
| Lease Liabilities: | | | | | |
| Current lease liabilities | Accrued expenses | | $ | 22.0 | | | $ | 21.6 | |
| Noncurrent lease liabilities | Other noncurrent liabilities | | 98.1 | | | 96.6 | |
| Total lease liabilities | | | $ | 120.1 | | | $ | 118.2 | |
The components of lease cost for the years ended December 31, 2023, 2022 2021 and 20202021 were as follows:
| | 2022 | | 2021 | | 2020 |
| (In millions) |
| 2023 | | | 2023 | | 2022 | | 2021 |
Fixed lease cost (1) | Fixed lease cost (1) | $ | 30.8 | | | $ | 31.5 | | | $ | 29.5 | |
| Variable lease cost | Variable lease cost | 2.3 | | | 2.3 | | | 1.9 | |
| Total lease expense | Total lease expense | $ | 33.1 | | | $ | 33.8 | | | $ | 31.4 | |
(1) Includes short-term leases, which are immaterial.
Supplemental cash flow information related to leases for the years ended December 31, 2023, 2022 2021 and 20202021 was as follows:
| | 2022 | | 2021 | | 2020 |
| (In millions) |
| 2023 | | | 2023 | | 2022 | | 2021 |
| (In millions) | | | (In millions) |
| Cash paid for amounts included in the measurement of lease liabilities | Cash paid for amounts included in the measurement of lease liabilities | $ | 31.7 | | | $ | 31.2 | | | $ | 28.7 | |
| Right-of-use assets obtained in exchange for new lease liabilities | Right-of-use assets obtained in exchange for new lease liabilities | 19.0 | | | 16.0 | | | 40.4 | |
Other supplemental information related to leases as of December 31, 20222023 and 20212022 was as follows:
| | | | | | | | | | | | | |
| Lease Term and Discount Rate | December 31, 2022 | | December 31, 2021 | | |
| Weighted-average remaining lease term (years): | | | | | |
| Operating leases - building and equipment | 7.43 | | 8.50 | | |
| Operating leases - vehicles | 2.14 | | 2.34 | | |
| Financing leases - equipment | 2.05 | | — | | |
| Weighted-average discount rate: | | | | | |
| Operating leases - building and equipment | 3.41 | % | | 3.27 | % | | |
| Operating leases - vehicles | 1.70 | % | | 1.08 | % | | |
| Financing leases - equipment | 4.48 | % | | — | | |
| | | | | | | | | | | | | |
| Lease Term and Discount Rate | December 31, 2023 | | December 31, 2022 | | |
| Weighted-average remaining lease term (years): | | | | | |
| Building and equipment | 7.00 | | 7.43 | | |
| Vehicles | 2.63 | | 2.14 | | |
| Weighted-average discount rate: | | | | | |
| Building and equipment | 3.71 | % | | 3.41 | % | | |
| Vehicles | 3.43 | % | | 1.70 | % | | |
The Company uses its incremental borrowing rate to determine the present value of the lease payments.
Total lease liabilities at December 31, 20222023 have scheduled maturities as follows:
| | Maturity of Lease Liabilities | Maturity of Lease Liabilities | |
| | (In millions) |
| 2023 | | $ | 24.4 | |
| 2024 | |
| 2024 | |
| 2024 | 2024 | | 21.7 | |
| 2025 | 2025 | | 19.9 | |
| 2026 | 2026 | | 15.6 | |
| 2027 | 2027 | | 12.7 | |
| 2028 | |
| Thereafter | Thereafter | | 40.1 | |
| Total lease payments | Total lease payments | | 134.4 | |
| Less: Imputed interest | Less: Imputed interest | | (16.2) | |
| Present value of lease liabilities | Present value of lease liabilities | | $ | 118.2 | |
Total lease liabilities at December 31, 2021 had scheduled maturities as follows:
| | | | | | | | |
| Maturity of Lease Liabilities | | |
| | (In millions) |
| 2022 | | $ | 20.1 | |
| 2023 | | 18.3 | |
| 2024 | | 15.6 | |
| 2025 | | 13.3 | |
| 2026 | | 12.0 | |
| Thereafter | | 48.3 | |
| Total lease payments | | 127.6 | |
| Less: Imputed interest | | (16.6) | |
| Present value of lease liabilities | | $ | 111.0 | |
11.10. Commitments and Contingencies
Warranty costs are provided for at the time of sale. The warranty provision is based on historical costs and adjusted for specific known claims. A rollforward of the warranty reserve is as follows:
| | | | | | | | | | | | | | | | | |
| 2022 | | 2021 | | 2020 |
| | (In millions) |
| Beginning balance at January 1 | $ | 7.6 | | | $ | 7.4 | | | $ | 5.6 | |
| Provision for warranties | 3.0 | | | 3.4 | | | 3.0 | |
| Claim settlements | (4.1) | | | (3.8) | | | (2.7) | |
| Other adjustments, including acquisitions, divestitures and currency translation | 1.6 | | | 0.6 | | | 1.5 | |
| Ending balance at December 31 | $ | 8.1 | | | $ | 7.6 | | | $ | 7.4 | |
| | | | | | | | | | | | | | | | | |
| 2023 | | 2022 | | 2021 |
| Beginning balance, January 1 | $ | 8.1 | | | $ | 7.6 | | | $ | 7.4 | |
| Provision for warranties | 5.8 | | | 3.0 | | | 3.4 | |
| Claim settlements | (4.7) | | | (4.1) | | | (3.8) | |
| Other adjustments, including acquisitions, divestitures and foreign currency translation | (0.1) | | | 1.6 | | | 0.6 | |
| Ending balance, December 31 | $ | 9.1 | | | $ | 8.1 | | | $ | 7.6 | |
The Company and certain of its subsidiaries are involved in pending and threatened legal, regulatory and other proceedings arising in the ordinary course of business. These proceedings may pertain to matters such as product liability or contract disputes, and may also involve governmental inquiries, inspections, audits or investigations relating to issues such as tax matters, intellectual property, environmental, health and safety issues, governmental regulations, employment and other matters. Although the results of such legal proceedings cannot be predicted with certainty, the Company believes that the ultimate disposition of these matters will not have a material adverse effect, individually or in the aggregate, on the Company’s business, financial condition, results of operations or cash flows.
12.11. Share Repurchases
On March 17, 2020, the Company’s Board of Directors approved an increase of $500.0 million in the authorized level of repurchases of common stock. This approval is in addition to the prior repurchase authorizations of the Board of Directors of $300.0 million on December 1, 2015. These authorizations have no expiration date. Repurchases underDuring 2023, the program will be funded with future cash flow generation or borrowings available under the Revolving Facility.Company repurchased a total of 124,600 shares at a cost of $24.2 million. During 2022, the Company repurchased a total of 795,423 shares at a cost of $148.1 million. There were no share repurchases during 2021. During 2020, the Company repurchased a total of 876,423 shares at a cost of $110.3 million. As of December 31, 2022,2023, the amount of share repurchase authorization remaining was $563.8$539.7 million.
At December 31, 2022 and 2021, the Company had 150 million shares of authorized common stock, with a par value of $.01 per share, and five million shares of authorized preferred stock, with a par value of $.01 per share. No preferred stock was outstanding at December 31, 2022 or 2021.
13.12. Income Taxes
Pretax income for 2023, 2022 2021 and 20202021 was taxed in the following jurisdictions:
| | 2022 | | 2021 | | 2020 |
| | (In millions) |
| 2023 | | | 2023 | | 2022 | | 2021 |
| U.S. | U.S. | $ | 516.5 | | | $ | 350.2 | | | $ | 296.3 | |
| Foreign | Foreign | 232.9 | | | 229.6 | | | 174.0 | |
| Total | Total | $ | 749.4 | | | $ | 579.8 | | | $ | 470.3 | |
The provision (benefit) for income taxes for 2023, 2022 2021 and 20202021 was as follows:
| | 2022 | | 2021 | | 2020 |
| | (In millions) |
| 2023 | | | 2023 | | 2022 | | 2021 |
| Current | Current | |
| U.S. | |
| U.S. | |
| U.S. | U.S. | $ | 102.8 | | | $ | 64.7 | | | $ | 29.5 | |
| State and local | State and local | 14.5 | | | 11.0 | | | 4.6 | |
| Foreign | Foreign | 63.9 | | | 60.9 | | | 50.2 | |
| Total current | Total current | 181.2 | | | 136.6 | | | 84.3 | |
| Deferred | Deferred | |
| U.S. | U.S. | (12.2) | | | (4.1) | | | 10.1 | |
| U.S. | |
| U.S. | |
| State and local | State and local | (1.0) | | | (1.4) | | | 1.5 | |
| Foreign | Foreign | (5.3) | | | (0.6) | | | (3.4) | |
| Total deferred | Total deferred | (18.5) | | | (6.1) | | | 8.2 | |
| Total provision for income taxes | Total provision for income taxes | $ | 162.7 | | | $ | 130.5 | | | $ | 92.5 | |
Deferred tax assets (liabilities) at December 31, 20222023 and 20212022 were:
| | 2022 | | 2021 |
| | (In millions) |
| 2023 | | | 2023 | | 2022 |
| Allowances and accruals | Allowances and accruals | $ | 21.1 | | | $ | 10.3 | |
| Employee and retiree benefit plans | Employee and retiree benefit plans | 17.8 | | | 23.6 | |
| Inventories | Inventories | 12.0 | | | 11.7 | |
| Foreign tax credit and other carryforwards | Foreign tax credit and other carryforwards | 15.0 | | | 11.9 | |
| Lease liabilities | Lease liabilities | 26.9 | | | (24.8) | |
| Right of use assets | Right of use assets | (25.9) | | | 25.7 | |
| Depreciation and amortization | Depreciation and amortization | (301.3) | | | (222.0) | |
| Taxes on undistributed foreign earnings | |
| Other | Other | (12.8) | | | (16.6) | |
| Total gross deferred tax (liabilities) | Total gross deferred tax (liabilities) | (247.2) | | | (180.2) | |
| Valuation allowance | Valuation allowance | (15.0) | | | (11.9) | |
| Total deferred tax (liabilities), net of valuation allowances | Total deferred tax (liabilities), net of valuation allowances | $ | (262.2) | | | $ | (192.1) | |
The deferred tax assets and liabilities recognized in the Company’s Consolidated Balance Sheets as of December 31, 20222023 and 20212022 were:
| | 2022 | | 2021 |
| | (In millions) |
| 2023 | | | 2023 | | 2022 |
| Noncurrent deferred tax asset - Other noncurrent assets | Noncurrent deferred tax asset - Other noncurrent assets | $ | 2.0 | | | $ | 4.3 | |
| Noncurrent deferred tax liabilities - Deferred income taxes | Noncurrent deferred tax liabilities - Deferred income taxes | (264.2) | | | (196.4) | |
| Net deferred tax liabilities | Net deferred tax liabilities | $ | (262.2) | | | $ | (192.1) | |
The Company had prepaid income taxes, recorded within Other current assets on the Consolidated Balance Sheets, of $15.1$14.3 million and $9.1$15.1 million as of December 31, 20222023 and 2021,2022, respectively.
The Provisionprovision for income taxes differs from the amount calculated by applying the statutory federal income tax rate to pretax income. The calculated amount and the differences for 2023, 2022 2021 and 20202021 are shown in the following table:
| | 2022 | | 2021 | | 2020 |
| | (In millions) |
| 2023 | | | 2023 | | 2022 | | 2021 |
| Pretax income | Pretax income | $ | 749.4 | | | $ | 579.8 | | | $ | 470.3 | | |
| Provision for income taxes: | Provision for income taxes: | |
| Provision for income taxes: | |
| Provision for income taxes: | |
| Computed amount at statutory rate of 21% | |
| Computed amount at statutory rate of 21% | |
| Computed amount at statutory rate of 21% | Computed amount at statutory rate of 21% | $ | 157.4 | | | 21.0 | % | | $ | 121.8 | | | 21.0 | % | | $ | 98.8 | | | 21.0 | % | $ | 159.7 | | | 21.0 | | 21.0 | % | | $ | 157.4 | | | 21.0 | | 21.0 | % | | $ | 121.8 | | | 21.0 | | 21.0 | % |
| State and local income tax (net of federal tax benefit) | State and local income tax (net of federal tax benefit) | 11.4 | | | 1.5 | % | | 8.0 | | | 1.4 | % | | 5.9 | | | 1.3 | % | State and local income tax (net of federal tax benefit) | 12.6 | | | 1.7 | | 1.7 | % | | 11.4 | | | 1.5 | | 1.5 | % | | 8.0 | | | 1.4 | | 1.4 | % |
| Taxes on non-U.S. earnings-net of foreign tax credits | Taxes on non-U.S. earnings-net of foreign tax credits | 12.4 | | | 1.7 | % | | 9.2 | | | 1.6 | % | | 8.4 | | | 1.8 | % | Taxes on non-U.S. earnings-net of foreign tax credits | 10.8 | | | 1.4 | | 1.4 | % | | 12.4 | | | 1.7 | | 1.7 | % | | 9.2 | | | 1.6 | | 1.6 | % |
| Global Intangible Low-Taxed Income | Global Intangible Low-Taxed Income | 2.0 | | | 0.3 | % | | 0.4 | | | 0.1 | % | | (2.7) | | | (0.6 | %) | Global Intangible Low-Taxed Income | — | | | — | | — | % | | 2.0 | | | 0.3 | | 0.3 | % | | 0.4 | | | 0.1 | | 0.1 | % |
| Foreign-Derived Intangible Income Deduction | Foreign-Derived Intangible Income Deduction | (11.9) | | | (1.6 | %) | | (7.5) | | | (1.3 | %) | | (4.9) | | | (1.0 | %) | Foreign-Derived Intangible Income Deduction | (11.3) | | | (1.5 | | (1.5 | %) | | (11.9) | | | (1.6 | | (1.6 | %) | | (7.5) | | | (1.3 | | (1.3 | %) |
| Share-based payments | Share-based payments | (2.6) | | | (0.4 | %) | | (3.5) | | | (0.6 | %) | | (9.8) | | | (2.1 | %) | Share-based payments | (2.0) | | | (0.3 | | (0.3 | %) | | (2.6) | | | (0.4 | | (0.4 | %) | | (3.5) | | | (0.6 | | (0.6 | %) |
| Other | Other | (6.0) | | | (0.8 | %) | | 2.1 | | | 0.3 | % | | (3.2) | | | (0.7 | %) | Other | (5.1) | | | (0.6 | | (0.6 | %) | | (6.0) | | | (0.8 | | (0.8 | %) | | 2.1 | | | 0.3 | | 0.3 | % |
| Total provision for income taxes | Total provision for income taxes | $ | 162.7 | | | 21.7 | % | | $ | 130.5 | | | 22.5 | % | | $ | 92.5 | | | 19.7 | % | Total provision for income taxes | $ | 164.7 | | | 21.7 | | 21.7 | % | | $ | 162.7 | | | 21.7 | | 21.7 | % | | $ | 130.5 | | | 22.5 | | 22.5 | % |
The Company has $45.3$54.9 million and $40.6$45.3 million of permanently reinvested earnings of non-U.S. subsidiaries as of December 31, 20222023 and 2021,2022, respectively. No deferred U.S. income taxes have been provided on the $45.3$54.9 million of earnings that are considered to be permanently reinvested. The Company does not expect these earnings to incur U.S. taxes when ultimately repatriated other than potentially U.S. federal, state and local taxes on foreign exchange gains or losses recognized on the distribution of such earnings. Such distributions could also be subject to additional foreign withholding and foreign income taxes. The amount of unrecognized deferred income tax liabilities on currently permanently reinvested earnings is estimated to be $6.8$8.2 million and $6.1$6.8 million as of December 31, 20222023 and 2021,2022, respectively.
During the years ended December 31, 2023, 2022 2021 and 2020,2021, the Company repatriated $134.1 million, $199.9 million $116.0 million and $27.0$116.0 million of foreign earnings, respectively. These actual distributions resulted in no incremental income tax expense other than tax impacts on foreign exchange gains or losses. These repatriations represent distributions of previously taxed income.
A reconciliation of the beginning and ending amount of unrecognized tax benefits for 2023, 2022 2021 and 20202021 is as follows:
| | 2022 | | 2021 | | 2020 |
| | (In millions) |
| 2023 | | | 2023 | | 2022 | | 2021 |
| Beginning balance January 1 | Beginning balance January 1 | $ | 0.1 | | | $ | 1.1 | | | $ | 3.7 | |
| Gross increases for tax positions of prior years | Gross increases for tax positions of prior years | — | | | 0.1 | | | — | |
| Gross decreases for tax positions of prior years | Gross decreases for tax positions of prior years | — | | | (0.3) | | | — | |
| Settlements | Settlements | — | | | (0.2) | | | (2.6) | |
| Lapse of statute of limitations | Lapse of statute of limitations | (0.1) | | | (0.6) | | | — | |
| Ending balance December 31 | Ending balance December 31 | $ | — | | | $ | 0.1 | | | $ | 1.1 | |
As of December 31, 2022,2023, the Company has no remaining unrecognized tax benefits that would affect the Company’s effective tax rate. The tax years 2017-20212018-2022 remain open to examination by major taxing jurisdictions. Due to the potential federal, state and foreign examinations, it is reasonably possible that the Company’s gross unrecognized tax benefits balance may change.
As of December 31, 2022,2023, the Company has minimal deferred tax assets on non-U.S. and U.S. state net operating loss carryforwards of $0.1$0.3 million and $0.8$0.6 million, respectively. The entire balance of net operating losses across jurisdictions, the majority of which relates to acquisitions, is available to be carried forward indefinitely. There is no valuation allowance as it is more-likely-than-not that the net operating losses will be realized.
As of December 31, 2022,2023, the Company has deferred tax assets on non-U.S. capital loss carryforwards of $3.0$3.1 million with a full valuation allowance. The non-U.S. capital loss can be carried forward indefinitely.
As of December 31, 2022,2023, the Company has deferred tax assets with a full valuation allowance recorded against foreign tax credit carryforwards for U.S. federal purposes of approximately $11.9$10.6 million. The U.S. federal foreign tax credit carryforward will expire between 2029 and 2032.2033.
14.13. Business Segments and Geographic Information
IDEX has three reportable business segments: FMT, HST and FSDP. When determining these reportable segments, the Company aggregated operating segments based on their similar economic and operating characteristics.
The FMT segment designs, produces and distributes positive displacement pumps, valves, small volume provers, flow meters, injectors and other fluid-handling pump modules and systems and provides flow monitoring and other services for the food, chemical, general industrial, water and wastewater, agriculture and energy industries. FMT application-specific pump and metering solutions serve a diverse range of end markets, including industrial infrastructure (fossil fuels, refined and alternative fuels and water and wastewater), energy, chemical processing, agriculture, food and beverage, semiconductor, pulp and paper, automotive/transportation, plastics and resins, electronics and electrical, construction and mining, pharmaceutical and bio-pharmaceutical,biopharmaceutical, machinery and numerous other specialty niche markets.
The HST segment designs, produces and distributes a wide range of precision fluidics, rotary lobe pumps, centrifugal and positive displacement pumps, roll compactionpowder and liquid processing technologies, drying systems, micro-precision components, pneumatic components and sealing solutions, high performance molded and extruded sealing components, custom mechanical and shaft seals, engineered hygienic mixers and valves, biocompatible medical devices and implantables, air compressors and blowers, optical components and coatings, laboratory and commercial equipment and precision photonic solutions and precision gear and peristaltic pump technologies.solutions. HST serves a variety of end markets, including food and beverage, life sciences, analytical instruments, pharmaceutical and biopharmaceutical, industrial, semiconductor, digital printing, automotive/transportation, medical/dental, energy, cosmetics, marine, chemical, wastewater and water treatment, research and aerospace/defense markets.
The FSDP segment designs, produces and distributes firefighting pumps, valves and controls, rescue tools, lifting bags and other components and systems for the fire and rescue industry, engineered stainless steel banding and clamping devices used in a variety of industrial and commercial applications in the automotive, energy and industrial markets and precision equipment for dispensing, metering and mixing colorants and paints used in a variety of retail and commercial businesses in the paint and industrial markets around the world.
Information on the Company’s business segments is presented below based on the nature of the products and services offered. The Company uses Adjusted EBITDA as its principal measure of segment performance. Intersegment sales are accounted for at fair value as if the sales werecontracted with terms equivalent to third parties.those of an arm’s-length transaction.
During the fourth quarter of 2022, the Company changed the segment measure of profit and loss used by the Chief Operating Decision Maker ("CODM") in accordance with ASC 280, Segment Reporting, from operating income to Adjusted EBITDA. Adjusted EBITDA is defined as earnings before interest, taxes, depreciation and amortization, or EBITDA, before fair value inventory step-up charges, restructuring expenses and asset impairments, the impact from the exit of a COVID-19 testing application, the gain on sale of a business, the gains on sales of assets, the impact of the settlement of a corporate transaction indemnity, the loss on early debt redemption and the noncash loss related to the termination of the U.S. pension plan, net of curtailment. The change in segment measure of profit and loss aligns with how the CODM allocates resources and evaluates the performance of the business. It also allows the Company to better assess operating results over time since it excludes items that are not reflective of ongoing operations.
| | 2022 | | 2021 | | 2020 |
| | (In millions) |
| 2023 | | | 2023 | | 2022 | | 2021 |
| NET SALES | NET SALES | |
| Fluid & Metering Technologies | Fluid & Metering Technologies | |
| Fluid & Metering Technologies | |
| Fluid & Metering Technologies | |
| External customers | |
| External customers | |
| External customers | External customers | $ | 1,166.2 | | | $ | 998.0 | | | $ | 895.4 | |
| Intersegment sales | Intersegment sales | 1.1 | | | 0.7 | | | 0.9 | |
| Total segment sales | Total segment sales | 1,167.3 | | | 998.7 | | | 896.3 | |
| Health & Science Technologies | Health & Science Technologies | |
| External customers | External customers | 1,336.8 | | | 1,119.0 | | | 893.4 | |
| External customers | |
| External customers | |
| Intersegment sales | Intersegment sales | 2.4 | | | 2.8 | | | 2.6 | |
| Total segment sales | Total segment sales | 1,339.2 | | | 1,121.8 | | | 896.0 | |
| Fire & Safety/Diversified Products | Fire & Safety/Diversified Products | |
| External customers | |
| External customers | |
| External customers | External customers | 678.9 | | | 647.8 | | | 562.8 | |
| Intersegment sales | Intersegment sales | 0.3 | | | 0.1 | | | 0.1 | |
| Total segment sales | Total segment sales | 679.2 | | | 647.9 | | | 562.9 | |
| Intersegment eliminations | Intersegment eliminations | (3.8) | | | (3.6) | | | (3.6) | |
| Net sales | Net sales | $ | 3,181.9 | | | $ | 2,764.8 | | | $ | 2,351.6 | |
| ADJUSTED EBITDA | ADJUSTED EBITDA | | | | | |
| Fluid & Metering Technologies | Fluid & Metering Technologies | $ | 374.2 | | | $ | 297.0 | | | $ | 271.5 | |
| Fluid & Metering Technologies | |
| Fluid & Metering Technologies | |
| Health & Science Technologies | Health & Science Technologies | 411.8 | | | 355.9 | | | 250.9 | |
| Fire & Safety/Diversified Products | Fire & Safety/Diversified Products | 183.9 | | | 185.7 | | | 161.5 | |
| Segment Adjusted EBITDA | Segment Adjusted EBITDA | 969.9 | | | 838.6 | | | 683.9 | |
| Corporate and other | (85.7) | | | (73.2) | | | (61.0) | |
Corporate and other(1) | |
| Adjusted EBITDA | Adjusted EBITDA | 884.2 | | | 765.4 | | | 622.9 | |
| - Interest expense | (40.7) | | | (41.0) | | | (44.8) | |
| - Depreciation | (50.7) | | | (46.6) | | | (41.7) | |
| - Amortization | (69.0) | | | (56.4) | | | (41.8) | |
| - Fair value inventory step-up charges | (8.5) | | | (11.6) | | | (4.1) | |
| - Restructuring expenses and asset impairments | (4.5) | | | (9.3) | | | (11.8) | |
- Net impact from the exit of a COVID-19 testing application(1) | 1.1 | | | — | | | — | |
| - Corporate transaction indemnity | — | | | (3.5) | | | — | |
| + Gain on sale of business | 34.8 | | | — | | | — | |
| + Gain on sales of assets | 2.7 | | | — | | | — | |
| - Loss on early debt redemption | — | | | (8.6) | | | (8.4) | |
| - Termination of the U.S. pension plan, net of curtailment | — | | | (8.6) | | | — | |
| Interest expense | |
| Depreciation | |
| Amortization of intangible assets | |
| Fair value inventory step-up charges | |
| Restructuring expenses and asset impairments | |
Net impact from the exit of a COVID-19 testing application(2) | |
| Corporate transaction indemnity | |
| Gain on sale of businesses - net | |
| Gains on sales of assets | |
Credit loss on note receivable from collaborative partner(3) | |
| Loss on early debt redemption | |
| Termination of the U.S. pension plan, net of curtailment | |
| Income before income taxes | Income before income taxes | $ | 749.4 | | | $ | 579.8 | | | $ | 470.3 | |
(1) Corporate expenses that can be identified with a segment have been included in determining segment results. The remainder is included in Corporate and other.
(2)Represents the net impact of the acceleration of previously deferred revenue of $17.9 million, andnet of an impairment charge of $16.8 million as a result of a customer’s decision to discontinue further investment in commercializing its COVID-19 testing application.application in the HST segment in 2022 that did not reoccur in 2023. See Note 1514 in the Notes to Consolidated Financial Statements for further detail. (3) Represents a reserve recorded on an investment with a collaborative partner that may no longer be recoverable. See Note 3 in the Notes to Consolidated Financial Statements for further detail.
| | 2022 | | 2021 | | 2020 |
| | (In millions) |
| 2023 | | | 2023 | | 2022 | | 2021 |
| ASSETS | ASSETS | |
| Fluid & Metering Technologies | |
| Fluid & Metering Technologies | |
| Fluid & Metering Technologies | Fluid & Metering Technologies | $ | 1,676.9 | | | $ | 1,458.8 | | | $ | 1,387.0 | |
| Health & Science Technologies | Health & Science Technologies | 2,931.1 | | | 2,138.3 | | | 1,576.1 | |
| Fire & Safety/Diversified Products | Fire & Safety/Diversified Products | 771.8 | | | 892.5 | | | 891.9 | |
| Corporate and other | Corporate and other | 132.1 | | | 427.6 | | | 559.4 | |
| Total assets | Total assets | $ | 5,511.9 | | | $ | 4,917.2 | | | $ | 4,414.4 | |
DEPRECIATION AND AMORTIZATION (1) | | | | | |
| DEPRECIATION AND AMORTIZATION OF INTANGIBLE ASSETS | |
| Fluid & Metering Technologies | |
| Fluid & Metering Technologies | |
| Fluid & Metering Technologies | Fluid & Metering Technologies | $ | 36.9 | | | $ | 30.5 | | | $ | 25.9 | |
| Health & Science Technologies | Health & Science Technologies | 67.3 | | | 56.7 | | | 41.8 | |
| Fire & Safety/Diversified Products | Fire & Safety/Diversified Products | 15.0 | | | 15.3 | | | 15.2 | |
| Corporate and other | Corporate and other | 0.5 | | | 0.5 | | | 0.6 | |
| Total depreciation and amortization | Total depreciation and amortization | $ | 119.7 | | | $ | 103.0 | | | $ | 83.5 | |
| CAPITAL EXPENDITURES | CAPITAL EXPENDITURES | | | | | |
| Fluid & Metering Technologies | Fluid & Metering Technologies | $ | 25.3 | | | $ | 21.0 | | | $ | 11.9 | |
| Fluid & Metering Technologies | |
| Fluid & Metering Technologies | |
| Health & Science Technologies | Health & Science Technologies | 32.0 | | | 41.5 | | | 27.7 | |
| Fire & Safety/Diversified Products | Fire & Safety/Diversified Products | 10.5 | | | 9.5 | | | 8.9 | |
| Corporate and other | Corporate and other | 0.2 | | | 0.7 | | | 3.1 | |
| Total capital expenditures | Total capital expenditures | $ | 68.0 | | | $ | 72.7 | | | $ | 51.6 | |
(1) Excludes amortization of debt issuance expenses.
Information about the Company’s long-lived assets in different geographical regions for the years ended December 31, 2023, 2022 2021 and 20202021 is shown below.
| | 2022 | | 2021 | | 2020 |
| | (In millions) |
| 2023 | | | 2023 | | 2022 | | 2021 |
| LONG-LIVED ASSETS — PROPERTY, PLANT AND EQUIPMENT | LONG-LIVED ASSETS — PROPERTY, PLANT AND EQUIPMENT | |
| U.S. | |
| U.S. | |
| U.S. | U.S. | $ | 191.7 | | | $ | 188.3 | | | $ | 169.2 | |
| North America, excluding U.S. | North America, excluding U.S. | 4.7 | | | 5.4 | | | 5.0 | |
| Europe | Europe | 136.8 | | | 98.9 | | | 100.0 | |
| Asia | Asia | 48.8 | | | 34.5 | | | 24.0 | |
Other(1) | Other(1) | 0.1 | | | 0.2 | | | 0.1 | |
| Total long-lived assets - net | Total long-lived assets - net | $ | 382.1 | | | $ | 327.3 | | | $ | 298.3 | |
(1) Other includes: South America, Middle East, Australia and Africa.
15.14. Restructuring Expenses and Asset Impairments
During 2022, 2021 and 2020,From time to time, the Company incurred restructuring costsincurs expenses to facilitate long-term sustainable growth through cost reduction actions, consisting of employee reductions, facility rationalization and contract termination costs. RestructuringThese costs include severance costs, exit costs and asset impairments and are included in Restructuring expenses and asset impairments in the Consolidated Statements of Income. Severance costs primarily consist of severance benefits through payroll continuation, COBRA subsidies, outplacement services, conditional separation costs and employer tax liabilities, while exit costs primarily consist of lease exit and contract termination costs.
2023 Initiative
During the year ended December 31, 2023, the Company incurred severance costs related to employee reductions in conjunction with cost mitigation efforts as a result of current market conditions, contract termination costs and asset impairments.
Pre-tax Restructuring expenses and asset impairments by segment for the 2023 initiative were as follows:
| | | | | | | | | | | | | | | | | | | | | | | |
| Severance Costs | | Exit Costs | | Asset Impairments | | Total |
| Fluid & Metering Technologies | $ | 1.5 | | | $ | 0.6 | | | $ | 0.8 | | | $ | 2.9 | |
| Health & Science Technologies | 6.4 | | | 0.2 | | | — | | | 6.6 | |
| Fire & Safety/Diversified Products | 0.7 | | | 0.2 | | | — | | | 0.9 | |
| Corporate/Other | 0.5 | | | — | | | — | | | 0.5 | |
| Total restructuring costs | $ | 9.1 | | | $ | 1.0 | | | $ | 0.8 | | | $ | 10.9 | |
2022 Initiative
During the year ended December 31, 2022, the restructuring costs incurred by the Company primarily related to asset impairments. In addition, the Company also incurred severance costs related to employee reductions.
In the second quarter of 2020, the Company engaged in the development of a COVID-19 testing application with a customer at one of itsthe Company’s businesses in the HST segment. As part of this contract, the customer fully funded the $28.7 million investment needed to complete the development and production of microfluidic cartridges during 2020 and 2021. The costs incurred by the Company were primarily recorded as Property, plant and equipment – net in the Consolidated Balance Sheets and were being depreciated over the expected life of the assets, while the reimbursement was recorded as deferredDeferred revenue in the Consolidated Balance Sheets and was being recognized as units were shipped.
In the third quarter of 2022, the Company was informed by the customer of its decision to discontinue further investment in commercializing its COVID-19 testing application. This event was deemed a triggering event, which required an interim impairment test be performed on the property, plant and equipment related to this contract, resulting in an impairment charge of $16.8 million that was recorded as Restructuring expenses and asset impairments in the Consolidated Statements of Income during the year ended December 31, 2022. In addition, the Company accelerated previously deferred revenue of $17.9 million related to units that are no longer expected to be shipped and recorded it as Net sales in the Consolidated Statements of Income during the year ended December 31, 2022.
Pre-tax restructuringRestructuring expenses and asset impairments by segment for the 2022 initiative were as follows:
| | Severance Costs | | Exit Costs | | Asset Impairments | | Total |
| | (In millions) |
| Severance Costs | | | Severance Costs | | Exit Costs | | Asset Impairments | | Total |
| Fluid & Metering Technologies | Fluid & Metering Technologies | $ | 1.9 | | | $ | 0.3 | | | $ | 0.5 | | | $ | 2.7 | |
| Health & Science Technologies | Health & Science Technologies | 1.2 | | | — | | | 16.8 | | | 18.0 | |
| Fire & Safety/Diversified Products | Fire & Safety/Diversified Products | 1.7 | | | — | | | 0.1 | | | 1.8 | |
| Corporate/Other | Corporate/Other | 0.3 | | | — | | | — | | | 0.3 | |
| Total restructuring costs | Total restructuring costs | $ | 5.1 | | | $ | 0.3 | | | $ | 17.4 | | | $ | 22.8 | |
2021 Initiative
During the year ended year ended December 31, 2021, the Company incurred severance costs related to employee reductions. In addition, the Company consolidated certain facilities within the FMT segment which resulted in asset impairments of $0.8 million related to property, plant and equipment that was not relocated to the new locations.
Pre-tax restructuring expenses and asset impairments by segment for the 2021 initiative were as follows:
| | | | | | | | | | | | | | | | | | | | | | | |
| Severance Costs | | Exit Costs | | Asset Impairments | | Total |
| | (In millions) |
| Fluid & Metering Technologies | $ | 3.7 | | | $ | — | | | $ | 0.8 | | | $ | 4.5 | |
| Health & Science Technologies | 1.7 | | | — | | | — | | | 1.7 | |
| Fire & Safety/Diversified Products | 0.5 | | | — | | | — | | | 0.5 | |
| Corporate/Other | 2.6 | | | — | | | — | | | 2.6 | |
| Total restructuring costs | $ | 8.5 | | | $ | — | | | $ | 0.8 | | | $ | 9.3 | |
2020 Initiative
During the year ended December 31, 2020, the Company incurred severance costs related to employee reductions and exit costs related to early lease terminations. In addition, in the fourth quarter of 2020, the Company consolidated certain facilities within the FMT segment, which resulted in an impairment charge of $2.5 million. The Company also relocated its corporate office, which resulted in an impairment charge of $0.6 million.
Pre-tax restructuring expenses and asset impairments by segment for the 2020 initiative were as follows:
| | Severance Costs | | Exit Costs | | Asset Impairments | | Total |
| | (In millions) |
| Severance Costs | | | Severance Costs | | Exit Costs | | Asset Impairments | | Total |
| Fluid & Metering Technologies | Fluid & Metering Technologies | $ | 2.9 | | | $ | 0.2 | | | $ | 2.5 | | | $ | 5.6 | |
| Health & Science Technologies | Health & Science Technologies | 2.7 | | | — | | | — | | | 2.7 | |
| Fire & Safety/Diversified Products | Fire & Safety/Diversified Products | 2.5 | | | — | | | — | | | 2.5 | |
| Corporate/Other | Corporate/Other | 0.4 | | | — | | | 0.6 | | | 1.0 | |
| Total restructuring costs | Total restructuring costs | $ | 8.5 | | | $ | 0.2 | | | $ | 3.1 | | | $ | 11.8 | |
Restructuring accruals reflected in Accrued expenses in the Company’s Consolidated Balance Sheets are as follows:
| | | | | |
| Restructuring
Initiatives |
| (In millions) |
Balance at January 1, 20212022 | $ | 3.92.8 | |
Restructuring expenses(1) | 8.5 | |
Payments, utilization and other | (9.6) | |
Balance at December 31, 2021 | 2.8 | |
Restructuring expenses(2)
| 5.4 | |
| Payments, utilization and other | (6.8) | |
| Balance at December 31, 2022 | 1.4 | |
Restructuring expenses(2) | 10.1 | |
| Payments, utilization and other | (9.4) | |
| Balance at December 31, 2023 | $ | 1.42.1 | |
(1)Excludes $17.4 million of asset impairments related to property, plant and equipment.
(2) Excludes $0.8 million of asset impairments related to property, plant and equipment.
(2) Excludes $17.4 million of asset impairments related to property, plant and equipment.
16.15. Share-Based Compensation
The Company maintains two share-based compensation plans for executives, non-employee directors and certain key employees that authorize the granting of stock options, restricted stock, performance share units and stock options and other types of awards consistent with the purpose of the plans. The number of shares authorized for issuance under the Company’s plans as of December 31, 20222023 totaled 15.6 million, of which 2.01.7 million shares were available for future issuance.
The Company typically grants equity awards annually at its regularly scheduled first quarter meeting of the Board of Directors based on the recommendation from the Compensation Committee.
The Company’s policy is to recognize compensation cost on a straight-line basis, assuming forfeitures, over the requisite service period for the entire award. Classification of stock compensation cost within the Consolidated Statements of Income is consistent with the classification of cash compensation for the same employees.
Stock Options
Stock options granted under the Company’s plans are generally non-qualified and are granted with an exercise price equal to the market price of the Company’s stock on the date of grant. The fair value of each option grant was estimated on the date of the grant using the Binomial lattice option pricing model (for options granted before March 2021) or the Black Scholes valuation model (for options granted after February 2021). The adoption of the Black Scholes model in 2021 was driven by a review of option exercise history, which more closely aligned with the methodology of the Black Scholes model. Stock options generally vest ratably over four years, with vesting beginning one year from the date of grant, and generally expire 10 years
from the date of grant. The service period for certain retiree eligible participants is accelerated.
Weighted average stock option fair values and assumptions for the periods specifiedyears ended December 31, 2023, 2022, and 2021 are as follows:disclosed below:
| | | | Years Ended December 31, | | Years Ended December 31, |
| | | 2022 | | 2021 | | 2020 | | 2023 | | 2022 | | 2021 |
| Weighted average fair value of grants | Weighted average fair value of grants | $42.66 | | $38.88 | | $34.22 | Weighted average fair value of grants | $59.77 | | $42.66 | | $38.88 |
| Dividend yield | Dividend yield | 1.14% | | 1.01% | | 1.15% | Dividend yield | 1.09% | | 1.14% | | 1.01% |
| Volatility | Volatility | 25.23% | | 23.78% | | 22.04% | Volatility | 27.14% | | 25.23% | | 23.78% |
| Risk-free interest rate | Risk-free interest rate | 2.01% | | 0.12% - 1.54% | | 1.39% - 1.66% | Risk-free interest rate | 4.15% | | 2.01% | | 0.12% - 1.54% |
| Expected life (in years) | Expected life (in years) | 4.90 | | 5.70 | | 5.80 | Expected life (in years) | 4.50 | | 4.90 | | 5.70 |
The assumptions are as follows:
•The Company estimated volatility using its historical share price performance over the contractual term of the option (for the Binomial lattice option pricing model) or over the expected life of the option (for the Black Scholes valuation model).
•The Company uses historical data to estimate the expected life of the option. The expected life assumption for options granted before March 2021 is an output of the Binomial lattice option pricing model, which incorporates vesting provisions, rate of voluntary exercise and rate of post-vesting termination over the contractual life of the option to define expected employee behavior. The expected life assumption for options granted after March 2021 is based on IDEX’s own exercise and cancellation history, adjusted for current vesting schedules.
•The risk-free interest rate is based on the U.S. Treasury yield curve in effect at the time of grant for periods within the contractual life of the option (for the Binomial lattice option pricing model) or commensurate with the expected life of the option (for the Black Scholes valuation model). For options granted before March 2021, the Company presents the range of risk-free one-year forward rates, derived from the U.S. treasury yield curve, utilized in the Binomial lattice option pricing model. For options granted after March 2021, the Company presents the spot rate used in the Black Scholes valuation model.
•The expected dividend yield is based on the Company’s current dividend yield as the best estimate of projected dividend yield for periods within the contractual life of the option.
A summary of the Company’s stock option activity as of December 31, 2022,2023, and changes during the year ended December 31, 2022 is2023, are presented as follows:in the following table:
| | | | | | | | | | | | | | | | | | | | | | | |
| Shares | | Weighted
Average
Price | | Weighted-Average
Remaining
Contractual Term
(years) | | Aggregate
Intrinsic
Value |
| (Dollars in millions except weighted average price) |
| Stock Options | | | | | | | |
| Outstanding at January 1, 2022 | 1,008,586 | | | $ | 147.60 | | | 6.97 | | $ | 89.5 | |
| Granted | 288,855 | | | 190.43 | | | | | |
| Exercised | (171,061) | | | 112.67 | | | | | |
| Forfeited/Expired | (110,808) | | | 186.25 | | | | | |
| Outstanding at December 31, 2022 | 1,015,572 | | | $ | 161.45 | | | 6.94 | | $ | 67.9 | |
| Vested and expected to vest at December 31, 2022 | 982,705 | | | $ | 160.46 | | | 6.88 | | $ | 66.7 | |
| Exercisable at December 31, 2022 | 489,720 | | | $ | 134.20 | | | 5.41 | | $ | 46.1 | |
| | | | | | | | | | | | | | | | | | | | | | | |
| Shares | | Weighted
Average
Price | | Weighted-Average
Remaining
Contractual Term
(years) | | Aggregate
Intrinsic
Value |
| Stock Options | | | | | | | |
| Outstanding at January 1, 2023 | 1,015,572 | | | $ | 161.45 | | | 6.94 | | $ | 67.9 | |
| Granted | 246,195 | | | 222.52 | | | | | |
| Exercised | (196,050) | | | 133.90 | | | | | |
| Forfeited | (82,450) | | | 201.67 | | | | | |
| Outstanding at December 31, 2023 | 983,267 | | | $ | 178.86 | | | 6.88 | | $ | 39.3 | |
| Vested and expected to vest at December 31, 2023 | 954,222 | | | $ | 177.96 | | | 6.82 | | $ | 38.9 | |
| Exercisable at December 31, 2023 | 497,612 | | | $ | 153.99 | | | 5.47 | | $ | 31.5 | |
The intrinsic value for stock options outstanding and exercisable is defined as the difference between the market value of the Company’s common stock as of the end of the period and the grant price. The total intrinsic value of options exercised in 2023, 2022 and 2021 and 2020 was $14.9 million, $17.4 million $21.4 million and $41.3$21.4 million, respectively. In 2023, 2022 2021 and 2020,2021, cash received from options exercised was $26.3 million, $19.3 million $19.7 million and $44.6$19.7 million, respectively, while the actual tax benefit realized for the tax deductions from stock options exercised totaled $3.1 million, $3.7 million $4.5 million and $8.7$4.5 million, respectively.
Total compensation cost for stock options is recorded in the Consolidated Statements of Income as follows:
| | | | Years Ended December 31, | | Years Ended December 31, |
| | | 2022 | | 2021 | | 2020 | | 2023 | | 2022 | | 2021 |
| | (In millions) |
| Cost of goods sold | $ | 0.5 | | | $ | 0.5 | | | $ | 0.5 | |
| Selling, general and administrative expenses | 8.7 | | | 8.0 | | | 7.6 | |
| Cost of sales | |
Selling, general and administrative expenses(1) | |
| Total expense before income taxes | Total expense before income taxes | 9.2 | | | 8.5 | | | 8.1 | |
| Income tax benefit | Income tax benefit | (0.8) | | | (0.8) | | | (0.9) | |
| Total expense after income taxes | Total expense after income taxes | $ | 8.4 | | | $ | 7.7 | | | $ | 7.2 | |
(1) The year ended December 31, 2023 includes $0.5 million of lower expense due to executive forfeitures, largely offset by $0.4 million of higher expense due to timing of accelerated stock compensation costs for retiree eligible participants compared with 2022.
As of December 31, 2022,2023, there was $8.8$9.4 million of total unrecognized compensation cost related to stock options that is expected to be recognized over a weighted-average period of 1.31.4 years.
Restricted Stock
Restricted stock awards generally cliff vest after three years for employees and non-employee directors. The service period for certain retiree eligible participants is accelerated. Unvested restricted stock carries dividend and voting rights and the sale of the shares is restricted prior to the date of vesting. Dividends are paid on restricted stock awards and their fair value is equal to the market price of the Company’s stock at the date of the grant. A summary of the Company’s restricted stock activity as of December 31, 2022,2023, and changes during the year ended December 31, 2022 is as follows:2023, are presented in the following table:
| | | | | | | | | | | |
| Restricted Stock | Shares | | Weighted-Average
Grant Date Fair
Value |
| Unvested at January 1, 2022 | 107,475 | | | $ | 169.58 | |
| Granted | 56,200 | | | 192.72 | |
| Vested | (30,786) | | | 157.63 | |
| Forfeited | (28,507) | | | 191.95 | |
| Unvested at December 31, 2022 | 104,382 | | | $ | 179.45 | |
Table of Contents | | | | | | | | | | | |
| Restricted Stock | Shares | | Weighted-Average
Grant Date Fair
Value |
| Unvested at January 1, 2023 | 104,382 | | | $ | 179.45 | |
| Granted | 46,660 | | | 217.01 | |
| Vested | (24,076) | | | 175.42 | |
| Forfeited | (14,075) | | | 201.92 | |
| Unvested at December 31, 2023 | 112,891 | | | $ | 193.03 | |
Total compensation cost for restricted stock is recorded in the Consolidated Statements of Income as follows:
| | | | Years Ended December 31, | | Years Ended December 31, |
| | | 2022 | | 2021 | | 2020 | | 2023 | | 2022 | | 2021 |
| | (In millions) |
| Cost of goods sold | $ | 0.3 | | | $ | 0.4 | | | $ | 0.3 | |
| Selling, general and administrative expenses | 6.4 | | | 5.1 | | | 3.9 | |
| Cost of sales | |
Selling, general and administrative expenses(1) | |
| Total expense before income taxes | Total expense before income taxes | 6.7 | | | 5.5 | | | 4.2 | |
| Income tax benefit | Income tax benefit | (1.2) | | | (1.1) | | | (0.9) | |
| Total expense after income taxes | Total expense after income taxes | $ | 5.5 | | | $ | 4.4 | | | $ | 3.3 | |
(1) The year ended December 31, 2023 includes $0.5 million of lower expense due to timing of accelerated stock compensation costs for retiree eligible participants compared with 2022.
As of December 31, 2022,2023, there was $5.7$6.9 million of total unrecognized compensation cost related to restricted stock that is expected to be recognized over a weighted-average period of 1.0 year.1.1 years.
Cash-Settled Restricted Stock
The Company also maintains a cash-settled share based compensation plan for certain employees. Cash-settled restricted stock awards generally cliff vest after three years. The service period for certain retiree eligible participants is accelerated. Cash-settled restricted stock awards are recorded at fair value on a quarterly basis using the market price of the Company’s stock on the last day of the quarter. Dividend equivalents are paid on certain cash-settled restricted stock awards. A summary of
the Company’s unvested cash-settled restricted stock activity as of December 31, 2022,2023, and changes during the year ended December 31, 2022 is as follows:2023, are presented in the following table:
| | Cash-Settled Restricted Stock | Cash-Settled Restricted Stock | Shares | | Weighted-Average
Fair Value | Cash-Settled Restricted Stock | Shares | | Weighted-Average
Fair Value |
| Unvested at January 1, 2022 | 57,949 | | | $ | 236.32 | |
| Unvested at January 1, 2023 | |
| Granted | Granted | 27,375 | | | 196.20 | |
| Vested | Vested | (20,676) | | | 190.67 | |
| Forfeited | Forfeited | (7,292) | | | 228.33 | |
| Unvested at December 31, 2022 | 57,356 | | | $ | 228.33 | |
| Unvested at December 31, 2023 | |
Total compensation cost for cash-settled restricted stock is recorded in the Consolidated Statements of Income as follows:
| | Years Ended December 31, |
| 2022 | | 2021 | | 2020 |
| | (In millions) |
| Cost of goods sold | $ | 0.1 | | | $ | 0.7 | | | $ | 0.9 | |
| Years Ended December 31, | | | Years Ended December 31, |
| 2023 | | | 2023 | | 2022 | | 2021 |
| Cost of sales | |
| Selling, general and administrative expenses | Selling, general and administrative expenses | 2.6 | | | 4.3 | | | 3.7 | |
| Total expense before income taxes | Total expense before income taxes | 2.7 | | | 5.0 | | | 4.6 | |
| Income tax benefit | Income tax benefit | (0.2) | | | (0.4) | | | (0.4) | |
| Total expense after income taxes | Total expense after income taxes | $ | 2.5 | | | $ | 4.6 | | | $ | 4.2 | |
At December 31, 20222023 and 2021,2022, the Company has accrued $4.8$4.2 million and $5.9$4.8 million, respectively, for cash-settled restricted stock in Accrued expenses in the Consolidated Balance Sheets and has accrued $2.8$2.9 million and $2.8 million, respectively, for cash-settled restricted stock in Other noncurrent liabilities in the Consolidated Balance Sheets.
As of December 31, 2023, there was $4.1 million of total unrecognized compensation cost related to cash-settled restricted stock that is expected to be recognized over a weighted-average period of 1.0 year.
Performance Share Units
Beginning in 2013, the Company granted performance share units to selected key employees that may be earned based on IDEX total shareholder return over the three-year period following the date of grant. Performance share units are expected to be made annually and are paid out at the end of a three-year period based on the Company’s performance. Performance is measured by determining the percentile rank of the total shareholder return of IDEX common stock in relation to the total shareholder return of companies in the S&P 500 Index for the three-year period following the date of grant. The payment of awards following the three-year award period will be based on performance achieved in accordance with the scale set forth in
the plan agreement and may range from 0 percent to 250 percent of the initial grant. A target payout of 100 percent is earned if total shareholder return is equal to the 50th percentile of the peer group. Performance share units earn dividend equivalents for the award period, which will be paid to participants with the award payout at the end of the period based on the actual number of performance share units that are earned. Payments made at the end of the award period will be in the form of stock for performance share units and will be in cash for dividend equivalents. The Company’s performance share units are market condition awards, have been assessed at fair value on the date of grant using a Monte Carlo simulation model and are expensed ratably over the three-year term of the awards. The Company granted 31,370, 29,020 and 42,690 performance share units in 2022, 2021 and 2020, respectively.
Weighted average performance share unit fair values and assumptions for the period specifiedyears ended December 31, 2023, 2022, and 2021 are as follows:disclosed below:
| | Years Ended December 31, |
| Years Ended December 31, | | | Years Ended December 31, |
| | | 2022 | | 2021 | | 2020 | | 2023 | | 2022 | | 2021 |
| Weighted average fair value of grants | Weighted average fair value of grants | $235.54 | | $247.49 | | $224.14 | Weighted average fair value of grants | $308.18 | | $235.54 | | $247.49 |
| Dividend yield | Dividend yield | —% | | —% | | —% | Dividend yield | —% | | —% |
| Volatility | Volatility | 28.09% | | 28.60% | | 19.50% | Volatility | 27.00% | | 28.09% | | 28.60% |
| Risk-free interest rate | Risk-free interest rate | 1.73% | | 0.33% | | 1.30% | Risk-free interest rate | 4.37% | | 1.73% | | 0.33% |
| Expected life (in years) | Expected life (in years) | 2.93 | | 2.93 | | 2.94 | Expected life (in years) | 2.94 | | 2.93 |
The assumptions are as follows:
•The Company estimated volatility using its historical share price performance over the remaining performance period as of the grant date.
•The Company uses a Monte Carlo simulation model that uses an expected life commensurate with the performance period. As a result, the expected life of the performance share units was assumed to be the period from the grant date to the end of the performance period.
•The risk-free interest rate is based on the U.S. Treasury yield curve in effect at the time of grant with a term commensurate with the remaining performance period.
•Total Shareholder Return is determined assuming that dividends are reinvested in the issuing entity over the performance period, which is mathematically equivalent to utilizing a 0% dividend yield.
A summary of the Company’s performance share unit activity as of December 31, 2022,2023, and changes during the year ended December 31, 2022, is as follows:2023, are presented in the following table:
| | Performance Share Units | Performance Share Units | Shares | | Weighted-Average
Grant Date Fair
Value | Performance Share Units | Shares | | Weighted-Average
Grant Date Fair
Value |
| Unvested at January 1, 2022 | 52,025 | | | $ | 236.75 | |
| Unvested at January 1, 2023 | |
| Granted | Granted | 31,370 | | | 235.54 | |
Vested(1) | — | | | — | |
| Vested | |
| Forfeited | Forfeited | (12,480) | | | 235.88 | |
| Unvested at December 31, 2022 | 70,915 | | | $ | 236.66 | |
| Unvested at December 31, 2023 | |
(1)The performance period for the 20202021 grants ended as of January 31, 2023.2024. The 20202021 grants achieved a 173%50% payout factor and the Company issued 31,3349,606 common shares in February 20232024 for awards that vested in 2023.2024.
Total compensation cost for performance share units is recorded in the Consolidated Statements of Income as follows:
| | Years Ended December 31, |
| 2022 | | 2021 | | 2020 |
| (In millions) |
| Years Ended December 31, | | | Years Ended December 31, |
| 2023 | | | 2023 | | 2022 | | 2021 |
| Cost of goods sold | Cost of goods sold | $ | — | | | $ | — | | | $ | — | |
| Selling, general and administrative expenses | 6.0 | | | 6.4 | | | 2.6 | |
Selling, general and administrative expenses(1) | |
| Total expense before income taxes | Total expense before income taxes | 6.0 | | | 6.4 | | | 2.6 | |
| Income tax benefit | Income tax benefit | (0.2) | | | (0.3) | | | (0.2) | |
| Total expense after income taxes | Total expense after income taxes | $ | 5.8 | | | $ | 6.1 | | | $ | 2.4 | |
(1) The year ended December 31, 2023 includes $0.8 million of higher expense due to timing of accelerated stock compensation costs for retiree eligible participant, offset by $0.8 million of lower expense due to executive forfeitures compared with 2022.
As of December 31, 2022,2023, there was $3.5$2.5 million of total unrecognized compensation cost related to performance share units that is expected to be recognized over a weighted-average period of 0.9 years.1.0 year.
17.
16. Other Comprehensive Income (Loss) Income
The components of Other comprehensive income (loss) income are as follows:
| | | | For the Year Ended December 31, 2022 | | For the Year Ended December 31, 2021 |
| | | Pre-tax | | Tax | | Net of tax | | Pre-tax | | Tax | | Net of tax | | For the Year Ended December 31, 2023 | | For the Year Ended December 31, 2022 |
| | | (In millions) | | Pre-tax | | Tax | | Net of tax | | Pre-tax | | Tax | | Net of tax |
| Cumulative translation adjustment | Cumulative translation adjustment | $ | (74.9) | | | $ | — | | | $ | (74.9) | | | $ | (75.6) | | | $ | — | | | $ | (75.6) | |
| Pension and other postretirement adjustments | Pension and other postretirement adjustments | |
| Net gain (loss) arising during the year | 24.6 | | | (6.7) | | | 17.9 | | | 12.0 | | | (2.9) | | | 9.1 | |
Amortization and settlement loss, net of
curtailment gain | 0.5 | | | (0.1) | | | 0.4 | | | 10.3 | | | (2.4) | | | 7.9 | |
| Net (loss) gain arising during the year | |
| Net (loss) gain arising during the year | |
| Net (loss) gain arising during the year | |
| Amortization and settlement gain | |
| Pension and other postretirement adjustments | Pension and other postretirement adjustments | 25.1 | | | (6.8) | | | 18.3 | | | 22.3 | | | (5.3) | | | 17.0 | |
| Reclassification adjustments for derivatives | Reclassification adjustments for derivatives | — | | | — | | | — | | | 3.3 | | | (0.8) | | | 2.5 | |
| Total other comprehensive loss | $ | (49.8) | | | $ | (6.8) | | | $ | (56.6) | | | $ | (50.0) | | | $ | (6.1) | | | $ | (56.1) | |
| Total other comprehensive income (loss) | |
| | | | | | | | | | | | | | | | | |
| | For the Year Ended December 31, 2020 |
| | Pre-tax | | Tax | | Net of tax |
| | (In millions) |
| Cumulative translation adjustment | $ | 107.8 | | | $ | — | | | $ | 107.8 | |
| Pension and other postretirement adjustments | | | | | |
| Net (loss) gain arising during the year | (1.5) | | | 0.1 | | | (1.4) | |
| Amortization/recognition of settlement loss | 2.9 | | | (0.1) | | | 2.8 | |
| Pension and other postretirement adjustments | 1.4 | | | — | | | 1.4 | |
| Reclassification adjustments for derivatives | 6.0 | | | (1.4) | | | 4.6 | |
| Total other comprehensive income (loss) | $ | 115.2 | | | $ | (1.4) | | | $ | 113.8 | |
| | | | | | | | | | | | | | | | | |
| | For the Year Ended December 31, 2021 |
| | Pre-tax | | Tax | | Net of tax |
| Cumulative translation adjustment | $ | (75.6) | | | $ | — | | | $ | (75.6) | |
| Pension and other postretirement adjustments | | | | | |
| Net gain (loss) arising during the year | 12.0 | | | (2.9) | | | 9.1 | |
Amortization and settlement loss, net of
curtailment gain | 10.3 | | | (2.4) | | | 7.9 | |
| Pension and other postretirement adjustments | 22.3 | | | (5.3) | | | 17.0 | |
Reclassification adjustments for derivatives(1) | 3.3 | | | (0.8) | | | 2.5 | |
| Total other comprehensive (loss) | $ | (50.0) | | | $ | (6.1) | | | $ | (56.1) | |
(1) Includes the acceleration of $1.3 million of the remaining accumulated other comprehensive loss resulting from the cash settlement of a forward starting interest rate exchange agreement, which was cash settled in 2011. The amounts were recognized in Other expense (income) - net in the Consolidated Statements of Income during the year ended December 31, 2021 in connection with the early redemption of the related debt instrument.
The amounts reclassified from Accumulated Other Comprehensive (Loss) Incomeother comprehensive loss to Net Incomenet income are summarized as follows:
| | | | For the Year Ended December 31, | | |
| | | 2022 | | 2021 | | 2020 | | Income Statement Caption | | For the Year Ended December 31, | | |
| | (In millions) | | | | 2023 | | 2022 | | 2021 | | Income Statement Caption |
| Pension and other postretirement plans: | Pension and other postretirement plans: | |
| Amortization of service cost | $ | 0.5 | | | $ | 1.8 | | | $ | 2.9 | | | Other (income) expense - net |
| Settlement loss recognized | | 10.5 | | | — | | | Other (income) expense - net |
| Amortization of actuarial (gains) losses and prior service costs | |
| Amortization of actuarial (gains) losses and prior service costs | |
| Amortization of actuarial (gains) losses and prior service costs | | $ | (1.4) | | | $ | 0.5 | | | $ | 1.8 | | | Other expense (income) - net |
| Settlement (gain) loss recognized | | Settlement (gain) loss recognized | (0.1) | | | — | | | 10.5 | | | Other expense (income) - net |
| Curtailment gain recognized | Curtailment gain recognized | | (2.0) | | | — | | | Other (income) expense - net | Curtailment gain recognized | — | | | — | | — | | | (2.0) | | (2.0) | | | Other expense (income) - net | | Other expense (income) - net |
| Total before tax | Total before tax | 0.5 | | | 10.3 | | | 2.9 | | |
| Provision for income taxes | Provision for income taxes | (0.1) | | | (2.4) | | | (0.1) | | |
| Provision for income taxes | |
| Provision for income taxes | |
| Total net of tax | |
| Total net of tax | |
| Total net of tax | Total net of tax | $ | 0.4 | | | $ | 7.9 | | | $ | 2.8 | | |
| Derivatives: | Derivatives: | | | | | | |
| Reclassification adjustments | $ | — | | | $ | 3.3 | | | $ | 6.0 | | | Interest expense, Other (income) expense - net |
| Derivatives: | |
| Derivatives: | |
Reclassification adjustments(1) | |
Reclassification adjustments(1) | |
Reclassification adjustments(1) | | $ | — | | | $ | — | | | $ | 3.3 | | | Interest expense |
| Total before tax | Total before tax | — | | | 3.3 | | | 6.0 | | |
| Provision for income taxes | Provision for income taxes | — | | | (0.8) | | | (1.4) | | |
| Provision for income taxes | |
| Provision for income taxes | |
| Total net of tax | Total net of tax | $ | — | | | $ | 2.5 | | | $ | 4.6 | | |
| Total net of tax | |
| Total net of tax | |
(1) Includes the acceleration of $1.3 million of the remaining accumulated other comprehensive loss resulting from the cash settlement of a forward starting interest rate exchange agreement, which was cash settled in 2011. The amounts were recognized in Other expense (income) - net in the Consolidated Statements of Income during the year ended December 31, 2021 in connection with the early redemption of the related debt instrument.
18.17. Retirement Benefits
The Company sponsors several qualified and nonqualified defined benefit and defined contribution pension plans as well as other post-retirement plans for its employees. The Company uses a measurement date of December 31 for its defined benefit pension plans and post-retirement medical plans. The Company employs the measurement date provisions of ASC 715, Compensation-Retirement Benefits, which require the measurement date of plan assets and liabilities to coincide with the sponsor’s year end.
The IDEX Corporation Retirement Plan (“Plan”), a U.S. defined benefit plan, was terminated in May 2020. As a result of the termination, the settlement threshold was reached in early 2020 and the Company recorded a settlement charge of $0.9 million in Other (income) expense - net in the Consolidated Statements of Income for the year ended December 31, 2020. The settlement also triggered the remeasurement of net periodic benefit cost resulting in a reduction of $1.0 million to Other (income) expense - net in the Consolidated Statements of Income for the year ended December 31, 2020 as a result of significant decreases in discount rates and strong asset performance in 2020.
During the year ended December 31, 2021, the Company settled its remaining obligations under the IDEX Corporation Retirement Plan (“Plan”), a U.S. defined benefit plan which was terminated in May 2020, through a combination of lump-sum payments to eligible participants who elected them, and through the purchase of annuities from Legal and General, an A rated third-party insurer. The Company recognized a net loss of $9.7 million, which was recorded within Other expense (income) expense - net. The net loss consisted of $10.7 million related to previously deferred pension related costs, partially offset by $1.0 million related to an increase in plan assets remaining after the settlement. As of December 31, 2021, the Plan had surplus assets of approximately $10.2 million, representing cash equivalents held in a trust. These plan assets were included in Other current assets on the Company’s Consolidated Balance Sheets. These plan assets were used to fund other retirement benefit plans and were fully depleted as of December 31, 2022.
The following table provides a reconciliation of the changes in the benefit obligationsobligation and fair value of plan assets over the two-year period ended December 31, 20222023 and a statement of the funded status at December 31 for both years.
| | | | Pension Benefits | | Other Benefits |
| | | 2022 | | 2021 | | 2022 | | 2021 | | Pension Benefits | | Other Benefits |
| | | U.S. | | Non-U.S. | | U.S. | | Non-U.S. | | | | | | 2023 | | 2022 | | 2023 | | 2022 |
| | | (In millions) | | U.S. | | Non-U.S. | | U.S. | | Non-U.S. | | |
| CHANGE IN BENEFIT OBLIGATION | CHANGE IN BENEFIT OBLIGATION | CHANGE IN BENEFIT OBLIGATION |
| Obligation at January 1 | Obligation at January 1 | $ | 10.6 | | | $ | 104.3 | | | $ | 94.0 | | | $ | 115.7 | | | $ | 23.6 | | | $ | 24.2 | |
| Service cost | Service cost | 0.1 | | | 1.8 | | | 0.1 | | | 2.0 | | | 0.7 | | | 0.7 | |
| Interest cost | Interest cost | 0.2 | | | 1.0 | | | 0.3 | | | 0.7 | | | 0.5 | | | 0.4 | |
| Plan amendments | Plan amendments | — | | | — | | | — | | | (0.5) | | | — | | | — | |
| Benefits paid | Benefits paid | (0.6) | | | (0.8) | | | (3.3) | | | (3.0) | | | (1.0) | | | (0.7) | |
| Actuarial gain | (2.0) | | | (27.8) | | | (1.9) | | | (5.3) | | | (7.3) | | | (0.8) | |
| Actuarial loss (gain) | |
| Currency translation | Currency translation | — | | | (6.1) | | | — | | | (6.0) | | | (0.1) | | | — | |
| Settlements | Settlements | — | | | (0.1) | | | (78.6) | | | — | | | — | | | — | |
| Curtailments | Curtailments | — | | | — | | | — | | | — | | | — | | | (0.2) | |
| Acquisition/Divestiture | Acquisition/Divestiture | — | | | 2.7 | | | — | | | — | | | — | | | — | |
| Other | Other | — | | | 0.7 | | | — | | | 0.7 | | | — | | | — | |
| Obligation at December 31 | Obligation at December 31 | $ | 8.3 | | | $ | 75.7 | | | $ | 10.6 | | | $ | 104.3 | | | $ | 16.4 | | | $ | 23.6 | |
| CHANGE IN PLAN ASSETS | CHANGE IN PLAN ASSETS | | | | | | | | | | | |
| Fair value of plan assets at January 1 | |
| Fair value of plan assets at January 1 | |
| Fair value of plan assets at January 1 | Fair value of plan assets at January 1 | $ | 17.0 | | | $ | 46.1 | | | $ | 100.0 | | | $ | 42.2 | | | $ | — | | | $ | — | |
| Actual return on plan assets | Actual return on plan assets | (2.0) | | | (10.5) | | | (0.5) | | | 4.2 | | | — | | | — | |
| Employer contributions | Employer contributions | 0.4 | | | 2.8 | | | 0.4 | | | 2.9 | | | 1.0 | | | 0.7 | |
| Benefits paid | Benefits paid | (0.6) | | | (0.8) | | | (3.3) | | | (3.0) | | | (1.0) | | | (0.7) | |
| Currency translation | Currency translation | — | | | (2.5) | | | — | | | (0.9) | | | — | | | — | |
| Settlements | Settlements | — | | | (0.1) | | | (78.6) | | | — | | | — | | | — | |
| Acquisition/Divestiture | Acquisition/Divestiture | — | | | 2.0 | | | — | | | — | | | — | | | — | |
| Other | Other | (10.1) | | | 0.8 | | | (1.0) | | | 0.7 | | | — | | | — | |
| Fair value of plan assets at December 31 | Fair value of plan assets at December 31 | $ | 4.7 | | | $ | 37.8 | | | $ | 17.0 | | | $ | 46.1 | | | $ | — | | | $ | — | |
| Funded status at December 31 | Funded status at December 31 | $ | (3.6) | | | $ | (37.9) | | | $ | 6.4 | | | $ | (58.2) | | | $ | (16.4) | | | $ | (23.6) | |
| COMPONENTS ON THE CONSOLIDATED BALANCE SHEETS | COMPONENTS ON THE CONSOLIDATED BALANCE SHEETS | COMPONENTS ON THE CONSOLIDATED BALANCE SHEETS |
| Other current assets | Other current assets | $ | — | | | $ | — | | | $ | 10.2 | | | $ | — | | | $ | — | | | $ | — | |
| Other noncurrent assets | Other noncurrent assets | — | | | 0.5 | | | — | | | 0.1 | | | — | | | — | |
| Current liabilities | Current liabilities | (0.7) | | | (1.5) | | | (0.8) | | | (1.5) | | | (1.1) | | | (1.2) | |
| Other noncurrent liabilities | Other noncurrent liabilities | (2.9) | | | (36.9) | | | (3.0) | | | (56.8) | | | (15.3) | | | (22.4) | |
| Net asset (liability) at December 31 | Net asset (liability) at December 31 | $ | (3.6) | | | $ | (37.9) | | | $ | 6.4 | | | $ | (58.2) | | | $ | (16.4) | | | $ | (23.6) | |
The pension benefits actuarial gainloss in 20222023 was primarily driven by the increasedecrease in the discount rates from 20212022 to 2022.2023. The U.S.increase in the Eurozone inflation rate contributed further to the reported Non-U.S. pension actuarial gain was partially offset by a small experience loss. The non-U.S. pension actuarial gain was partially offset by inflation-related and small experience losses recognized during the year.
The other benefits actuarial gainloss in 20222023 was primarily driven by the increasedecrease in the discount rates from 20212022 to 20222023 with additional gainslosses from the updated participant data and claims experience, partially offset by updatedmedical trend assumptions for the U.S. plans.plans, partially offset by gains from updated participants data.
The accumulated benefit obligation for all defined benefit pension plans was $94.6 million and $81.9 million at December 31, 2023 and 2022, respectively.
The accumulated benefit obligation (“ABO”) for all defined benefit pension plans was $81.9 million and $110.7 million at December 31, 2022 and 2021, respectively.
The weighted average assumptions used in the measurement of the Company’s benefit obligation at December 31, 20222023 and 20212022 were as follows:
| | | | U.S. Plans | | Non-U.S. Plans | | Other Benefits | | U.S. Plans | | Non-U.S. Plans | | Other Benefits |
| | | 2022 | | 2021 | | 2022 | | 2021 | | 2022 | | 2021 | | 2023 | | 2022 | | 2023 | | 2022 | | 2023 | | 2022 |
| Discount rate | Discount rate | 5.17 | % | | 2.52 | % | | 3.75 | % | | 1.25 | % | | 5.21 | % | | 2.70 | % | Discount rate | 4.93 | % | | 5.17 | % | | 3.01 | % | | 3.75 | % | | 4.90 | % | | 5.21 | % |
| Rate of compensation increase | Rate of compensation increase | — | % | | — | % | | 2.44 | % | | 2.31 | % | | — | % | | — | % | Rate of compensation increase | — | % | | — | % | | 2.55 | % | | 2.44 | % | | — | % | | — | % |
| Cash balance interest credit rate | Cash balance interest credit rate | — | % | | — | % | | 2.42 | % | | 1.00 | % | | — | % | | — | % | Cash balance interest credit rate | — | % | | — | % | | 1.43 | % | | 2.42 | % | | — | % | | — | % |
The pretax amounts recognized in Accumulated other comprehensive loss on the Consolidated Balance Sheets as of December 31, 20222023 and 20212022 were as follows:
| | | | Pension Benefits | | Other Benefits |
| | | 2022 | | 2021 | | 2022 | | 2021 | | Pension Benefits | | Other Benefits |
| | | U.S. | | Non-U.S. | | U.S. | | Non-U.S. | | | | | | 2023 | | 2022 | | 2023 | | 2022 |
| | | (In millions) | | U.S. | | Non-U.S. | | U.S. | | Non-U.S. | | |
| Prior service cost (credit) | Prior service cost (credit) | $ | 0.1 | | | $ | (0.5) | | | $ | 0.1 | | | $ | (0.5) | | | $ | (0.4) | | | $ | (0.5) | |
| Net loss (gain) | Net loss (gain) | 1.9 | | | (5.5) | | | 2.1 | | | 12.6 | | | (9.9) | | | (3.0) | |
| Total | Total | $ | 2.0 | | | $ | (6.0) | | | $ | 2.2 | | | $ | 12.1 | | | $ | (10.3) | | | $ | (3.5) | |
The components of the net periodic cost (benefit) for the plans in 2023, 2022 2021 and 20202021 are as follows:
| | | | Pension Benefits |
| | | 2022 | | 2021 | | 2020 | | Pension Benefits |
| | | U.S. | | Non-U.S. | | U.S. | | Non-U.S. | | U.S. | | Non-U.S. | | 2023 | | 2022 | | 2021 |
| | | (In millions) | | U.S. | | Non-U.S. | | U.S. | | Non-U.S. | | U.S. | | Non-U.S. |
| Service cost | Service cost | $ | 0.1 | | | $ | 1.8 | | | $ | 0.1 | | | $ | 2.0 | | | $ | 0.1 | | | $ | 2.2 | |
| Interest cost | Interest cost | 0.2 | | | 1.0 | | | 0.3 | | | 0.7 | | | 1.3 | | | 1.1 | |
| Expected return on plan assets | Expected return on plan assets | (0.2) | | | (1.3) | | | (0.9) | | | (1.0) | | | (3.8) | | | (1.2) | |
| Settlement loss recognized | — | | | — | | | 10.5 | | | — | | | 0.9 | | | (0.4) | |
| Settlement (gain) loss recognized | |
| Net amortization | Net amortization | 0.3 | | | 0.6 | | | 0.4 | | | 2.1 | | | 1.2 | | | 1.7 | |
| Net periodic cost (benefit) | $ | 0.4 | | | $ | 2.1 | | | $ | 10.4 | | | $ | 3.8 | | | $ | (0.3) | | | $ | 3.4 | |
| Net periodic cost | |
| | | | Other Benefits |
| | | 2022 | | 2021 | | 2020 | | Other Benefits |
| | | (In millions) | | 2023 | | 2022 | | 2021 |
| Service cost | Service cost | $ | 0.7 | | | $ | 0.7 | | | $ | 0.6 | |
| Interest cost | Interest cost | 0.5 | | | 0.4 | | | 0.6 | |
| Curtailment gain recognized | Curtailment gain recognized | — | | | (2.0) | | | — | |
| Net amortization | Net amortization | (0.5) | | | (0.6) | | | (0.5) | |
| Net periodic cost (benefit) | Net periodic cost (benefit) | $ | 0.7 | | | $ | (1.5) | | | $ | 0.7 | |
The Company recognizes the service cost component in both Cost of sales and Selling, general and administrative expenses and Cost of sales in the Consolidated Statements of Income depending on the functional area of the underlying employees includedand the interest cost, expected return on plan assets and net amortization components in Other expense (income) - net in the plans.Consolidated Statements of Income.
The assumptions used in determining the net periodic cost (benefit) were as follows:
| | | | | | | | | | | | | | | | | | | | | | | | | | | | | | | | | | | |
| | U.S. Plans | | Non-U.S. Plans |
| | 2023 | | 2022 | | 2021 | | 2023 | | 2022 | | 2021 |
| Discount rate | 5.17 | % | | 2.52 | % | | 2.14 | % | | 3.75 | % | | 1.25 | % | | 0.95 | % |
| Expected return on plan assets | 4.65 | % | | 2.63 | % | | 2.40 | % | | 4.17 | % | | 2.87 | % | | 2.41 | % |
| Rate of compensation increase | — | % | | — | % | | — | % | | 2.44 | % | | 2.31 | % | | 2.32 | % |
| | | | | | | | | | | | | | | | | | | | | | | | | | | | | | | | | | | |
| | U.S. Plans | | Non-U.S. Plans |
| | 2022 | | 2021 | | 2020 | | 2022 | | 2021 | | 2020 |
| Discount rate | 2.52 | % | | 2.14 | % | | Various* | | 1.25 | % | | 0.95 | % | | 1.33 | % |
| Expected return on plan assets | 2.63 | % | | 2.40 | % | | 4.00 | % | | 2.87 | % | | 2.41 | % | | 3.00 | % |
| Rate of compensation increase | — | % | | — | % | | — | % | | 2.31 | % | | 2.32 | % | | 2.29 | % |
*For the IDEX Corporation Retirement Plan, a discount rate of 3.07% was used to determine the net periodic (benefit) cost for the period January 1, 2020 through March 31, 2020, a discount rate of 2.97% was used to determine the net periodic (benefit) cost for the period April 1, 2020 through June 30, 2020, a discount rate of 2.41% was used to determine the net periodic (benefit) cost for the period July 1, 2020 through September 30, 2020 and a discount rate of 2.36% was used to determine the net periodic (benefit) cost for the period October 1, 2020 through December 31, 2020 as a result of the quarterly remeasurements that occurred in conjunction with the termination of the Plan.
For the Pulsafeeder, Inc. Pension Plan for Hourly Employees at Rochester, New York, a discount rate of 3.21% was used to determine the net periodic (benefit) cost for the period January 1, 2020 through June 30, 2020 and a discount rate of 2.62% was used to determine the net periodic (benefit) cost for the period July 1, 2020 through December 31, 2020 as a result of the remeasurement that occurred in conjunction with the ratification of the collective bargaining agreement.
| | | | Other Benefits | | Other Benefits |
| | | 2022 | | 2021 | | 2020 | | 2023 | | 2022 | | 2021 |
| Discount rate | Discount rate | 2.70 | % | | 2.20 | % | | 3.09 | % | Discount rate | 5.21 | % | | 2.70 | % | | 2.20 | % |
| Expected return on plan assets | Expected return on plan assets | — | % | | — | % | | — | % | Expected return on plan assets | — | % | | — | % | | — | % |
| Rate of compensation increase | Rate of compensation increase | — | % | | — | % | | 4.00 | % | Rate of compensation increase | — | % | | — | % | | — | % |
The pretax change recognized in Accumulated other comprehensive loss on the Consolidated Balance Sheet in 20222023 is as follows: | | | | Pension Benefits | | Other
Benefits | | Pension Benefits | | Other
Benefits |
| | | U.S. | | Non-U.S. | | |
| | (In millions) |
| Net gain (loss) in current year | $ | (0.1) | | | $ | 16.0 | | | $ | 7.3 | |
| Net loss in current year | |
| Net loss in current year | |
| Net loss in current year | |
| Prior service cost | Prior service cost | — | | | — | | | — | |
| Amortization of prior service cost (credit) | 0.3 | | | (0.1) | | | (0.1) | |
| Amortization of prior service credit | |
| Amortization of net loss (gain) | Amortization of net loss (gain) | — | | | 0.8 | | | (0.3) | |
| Exchange rate effect on amounts in other comprehensive income | Exchange rate effect on amounts in other comprehensive income | — | | | 1.4 | | | (0.1) | |
| Total | Total | $ | 0.2 | | | $ | 18.1 | | | $ | 6.8 | |
The discount rates for the Company’s plans are derived by matching the plan’s cash flows to a yield curve that provides the equivalent yields on zero-coupon bonds for each maturity. The discount rate selected is the rate that produces the same present value of cash flows.
In selecting the expected rate of return on plan assets, the Company considers the historical returns and expected returns on plan assets. The expected returns are evaluated using asset return class, variance and correlation assumptions based on the plan’s target asset allocation and current market conditions.
Prior service costs are amortized on a straight-line basis over the average remaining service period of active participants. Gains and losses in excess of 10% of the greater of the benefit obligation or the market value of assets are amortized over the average remaining service period of active participants.
Costs of defined contribution plans were $16.8 million, $16.1 million and $12.8 million for 2023, 2022 and $12.5 million for 2022, 2021, and 2020, respectively.
The Company, through its subsidiaries, participates in certaina multi-employer pension plansplan covering approximately 216211 participants under U.S. collective bargaining agreements. None of these plans are considered individually significant to the Company as contributions to these plans totaled $0.9 million, $0.8 million, and $1.0 million for 2023, 2022 and $1.1 million for 2022, 2021, and 2020, respectively.
For measurement purposes, a 5.59%6.23% weighted average annual rate of increase in the per capita cost of covered health care benefits was assumed for 2022.2023. The rate was assumed to decrease gradually each year to a rate of 4.00% for 2040, and remain at that level thereafter.
Plan Assets
The Company’s pension plan weighted average asset allocations at December 31, 20222023 and 2021,2022, by asset category, were as follows:
| | U.S. Plans | | Non-U.S. Plans |
| 2022 | | 2021 | | 2022 | | 2021 |
| U.S. Plans | | | U.S. Plans | | Non-U.S. Plans |
| 2023 | | | 2023 | | 2022 | | 2023 | | 2022 |
| Equity securities | Equity securities | 9 | % | | 4 | % | | 13 | % | | 18 | % | Equity securities | 9 | % | | 9 | % | | 10 | % | | 13 | % |
| Fixed income securities | Fixed income securities | 84 | % | | 33 | % | | 19 | % | | 22 | % | Fixed income securities | 79 | % | | 84 | % | | 22 | % | | 19 | % |
| Cash/Commingled Funds/Other (1) | Cash/Commingled Funds/Other (1) | 7 | % | | 63 | % | | 68 | % | | 60 | % | Cash/Commingled Funds/Other (1) | 12 | % | | 7 | % | | 68 | % | | 68 | % |
| Total | Total | 100 | % | | 100 | % | | 100 | % | | 100 | % | Total | 100 | % | | 100 | % | | 100 | % | | 100 | % |
The basis used to measure the defined benefit plans’ assets at fair value at December 31, 20222023 and 20212022 is summarized as follows:
| | | | Basis of Fair Value Measurement | | Basis of Fair Value Measurement |
| | | Outstanding
Balances | | Level 1 | | Level 2 | | Level 3 | | Outstanding
Balances | | Level 1 | | Level 2 | | Level 3 |
| As of December 31, 2022 | (In millions) |
| As of December 31, 2023 | |
| Equity | Equity | |
| Equity | |
| Equity | |
| Equity | |
| Equity | |
| Equity | |
| Equity | |
| Equity | |
| Equity | |
| Equity | |
| Equity | |
| Equity | |
| Equity | |
| Equity | |
| Equity | |
| Equity | |
| Equity | |
| Equity | |
| Equity | |
| Equity | |
| Equity | |
| U.S. Large Cap | |
| U.S. Large Cap | |
| U.S. Large Cap | U.S. Large Cap | $ | 0.2 | | | $ | 0.2 | | | $ | — | | | $ | — | |
| U.S. Small / Mid Cap | U.S. Small / Mid Cap | 2.5 | | | — | | | 2.5 | | | — | |
| International | International | 2.5 | | | 0.8 | | | 1.7 | | | — | |
| Fixed Income | Fixed Income | |
| U.S. Intermediate | |
| U.S. Intermediate | |
| U.S. Intermediate | U.S. Intermediate | 1.6 | | | — | | | 1.6 | | | — | |
| U.S. Long Term | U.S. Long Term | 3.8 | | | — | | | 3.8 | | | — | |
| U.S. High Yield | U.S. High Yield | 0.4 | | | — | | | 0.4 | | | — | |
| International | International | 5.4 | | | 0.2 | | | 5.2 | | | — | |
Other Commingled Funds(1) | Other Commingled Funds(1) | 23.7 | | | — | | | — | | | 23.7 | |
| Cash and Equivalents | Cash and Equivalents | 1.0 | | | 0.4 | | | 0.6 | | | — | |
| Other | Other | 1.4 | | | — | | | 1.4 | | | — | |
| $ | 42.5 | | | $ | 1.6 | | | $ | 17.2 | | | $ | 23.7 | |
| $ | |
(1)Other commingled funds represent pooled institutional investments in non-U.S. plans.
| | | | Basis of Fair Value Measurement | | Basis of Fair Value Measurement |
| | | Outstanding
Balances | | Level 1 | | Level 2 | | Level 3 | | Outstanding
Balances | | Level 1 | | Level 2 | | Level 3 |
| As of December 31, 2021 | (In millions) |
| As of December 31, 2022 | |
| Equity | Equity | |
| Equity | |
| Equity | |
| Equity | |
| Equity | |
| Equity | |
| Equity | |
| Equity | |
| Equity | |
| Equity | |
| Equity | |
| Equity | |
| Equity | |
| Equity | |
| Equity | |
| Equity | |
| Equity | |
| Equity | |
| Equity | |
| Equity | |
| Equity | |
| U.S. Large Cap | |
| U.S. Large Cap | |
| U.S. Large Cap | U.S. Large Cap | $ | 0.3 | | | $ | 0.3 | | | $ | — | | | $ | — | |
| U.S. Small / Mid Cap | U.S. Small / Mid Cap | 4.6 | | | — | | | 4.6 | | | — | |
| International | International | 4.2 | | | 1.0 | | | 3.2 | | | — | |
| Fixed Income | Fixed Income | |
| U.S. Intermediate | |
| U.S. Intermediate | |
| U.S. Intermediate | U.S. Intermediate | 1.9 | | | — | | | 1.9 | | | — | |
| U.S. Long Term | U.S. Long Term | 5.4 | | | — | | | 5.4 | | | — | |
| U.S. High Yield | U.S. High Yield | 0.7 | | | — | | | 0.7 | | | — | |
| International | International | 7.5 | | | 0.3 | | | 7.2 | | | — | |
Other Commingled Funds(1) | Other Commingled Funds(1) | 23.7 | | | — | | | — | | | 23.7 | |
| Cash and Equivalents | Cash and Equivalents | 12.1 | | | 11.0 | | | 1.1 | | | — | |
| Other | Other | 2.7 | | | — | | | 2.7 | | | — | |
| $ | 63.1 | | | $ | 12.6 | | | $ | 26.8 | | | $ | 23.7 | |
| $ | |
(1)Other commingled funds represent pooled institutional investments in non-U.S. plans.
Equities that are valued using quoted prices are valued at the published market prices. Equities in a common collective trust or a registered investment company that are valued using significant other observable inputs are valued at the net asset value (“NAV”) provided by the fund administrator. The NAV is based on the value of the underlying assets owned by the fund minus its liabilities. Fixed income securities that are valued using significant other observable inputs are valued at prices obtained from independent financial service industry-recognized vendors.
Investment Policies and Strategies
The investment objective of the U.S. plan, consistent with prudent standards for preservation of capital and maintenance of liquidity, is to earn the highest possible total rate of return consistent with the plan’s tolerance for risk. The general asset allocation guidelines for plan assets are that “equities” will constitute 10% and “fixed income” obligations, including cash, will constitute 90% of the market value of total fund assets.
The investment objective of the UK plan, consistent with prudent standards for preservation of capital and maintenance of liquidity, is to earn a target return of UK Gilts plus approximately 3.1%2.6% per year. The general asset allocation guidelines for plan assets are that “equities” will constitute from 57%35% to 67%45% of the market value of total fund assets with a target of 62%40%, and “fixed income” obligations, including cash, will constitute from 33%55% to 43%65% with a target of 38%60%. The UK Planplan also has a framework in place such that if the funding position (which is monitored daily) improves to a certain level, the asset allocation will switch out of equities into fixed income assets in order to lower the level of risk of the investments.
The term “equities” includes common stock, while the term “fixed income” includes obligations with contractual payments and a specific maturity date. Diversification of assets is employed to ensure that adverse performance of one security or security class does not have an undue detrimental impact on the portfolio as a whole. Diversification is interpreted to include diversification by type, characteristic and number of investments as well as by investment style of designated investment fund managers. No restrictions are placed on the selection of individual investments by the investment fund managers. The total fund performance and the performance of the investment fund managers is reviewed on a regular basis using an appointed professional independent advisor.As of December 31, 2022,2023, there were no shares of the Company’s stock held in plan assets.
Cash Flows
The Company expects to contribute approximately $3.9$3.6 million to its defined benefit plans and $1.1 million to its other postretirement benefit plans in 2023.2024. The Company also expects to contribute approximately $16.2$17.3 million to its defined contribution plan and $12.1$13.5 million to its 401(k) savings plan in 20232024 using cash on hand.
Estimated Future Benefit Payments
The future estimated benefit payments for the next five years and the five years thereafter are as follows:
| | Estimated Future Benefits | Estimated Future Benefits | |
| | (In millions) |
| 2023 | | $ | 6.2 | |
| 2024 | |
| 2024 | |
| 2024 | 2024 | | 6.0 | |
| 2025 | 2025 | | 6.0 | |
| 2026 | 2026 | | 6.2 | |
| 2027 | 2027 | | 6.2 | |
| 2028 to 2032 | | 30.7 | |
| 2028 | |
| 2029 to 2033 | |
| Total Estimated Future Benefit Payments | Total Estimated Future Benefit Payments | | $ | 61.3 | |
Item 9. Changes in and Disagreements with Accountants on Accounting and Financial Disclosure.
None.
Item 9A. Controls and Procedures.
The Company maintains disclosure controls and procedures that are designed to ensure that information required to be disclosed in the Company’s Exchange Act reports is recorded, processed, summarized and reported within the time periods specified in the SEC’s rules and forms, and that such information is accumulated and communicated to the Company’s management, including its Chief Executive Officer and Chief Financial Officer, as appropriate, to allow timely decisions regarding required disclosure.
As required by SEC Rule 13a-15(b), the Company carried out an evaluation, under the supervision and with the participation of the Company’s management, including the Company’s Chief Executive Officer and Chief Financial Officer, of the effectiveness of the design and operation of the Company’s disclosure controls and procedures as of the end of the period covered by this report. Based on the foregoing, the Company’s Chief Executive Officer and Chief Financial Officer concluded that the Company’s disclosure controls and procedures were effective as of December 31, 2022.2023.
Management’s Report on Internal Control Over Financial Reporting appearing on page 3937 of this report is incorporated into this Item 9A by reference.
There has been no change in the Company’s internal control over financial reporting during the Company’s most recent fiscal quarter that has materially affected, or is reasonably likely to materially affect, the Company’s internal control over financial reporting.
Item 9B. Other Information.
None.During the year ended December 31, 2023, none of the Company’s directors or executive officers adopted or terminated any contract, instruction or written plan for the purchase or sale of Company securities that was intended to satisfy the affirmative defense conditions of Rule 10b5-1(c) or any “non-Rule 10b5-1 trading arrangement” as defined in Item 408 of Regulation S-K under the Securities Exchange Act of 1934, as amended.
Item 9C. Disclosure Regarding Foreign Jurisdictions that Prevent Inspections.
Not Applicable.
PART III
Item 10. Directors, Executive Officers and Corporate Governance.
Information under the headings “Election of Directors”; “Board Committees”; and “Corporate Governance”; and “Delinquent Section 16(a) Reports” in the 20232024 Proxy Statement is incorporated into this Item 10 by reference. Information regarding executive officers of the Company is located in Part I, Item 1, of this report under the caption “Information about Our Executive Officers.”
The Company has adopted a Code of Business Conduct and Ethics applicable to the Company’s directors, officers (including the Company’s principal executive officer, principal financial officer and principal accounting officer) and employees. The Code of Business Conduct and Ethics, along with the Audit Committee Charter, Nominating and Corporate Governance Committee Charter, Compensation Committee Charter and Corporate Governance Guidelines are available on the Company’s website at www.idexcorp.com under “Investors.” In the event the Company amends or waives any of the provisions of the Code of Business Conduct and Ethics applicable to the Company’s principal executive officer, principal financial officer or principal accounting officer, the Company intends to disclose the same on its website.
Item 11. Executive Compensation.
Information under the heading “Executive Compensation” in the 20232024 Proxy Statement is incorporated into this Item 11 by reference.
Item 12. Security Ownership of Certain Beneficial Owners and Management and Related Stockholder Matters.
Information under the heading “Security Ownership” in the 20232024 Proxy Statement is incorporated into this Item 12 by reference.
Equity Compensation Plan Information
Information with respect to the Company’s equity compensation plans as of December 31, 20222023 is as follows:
| | Plan Category | Plan Category | Number of Securities
To be Issued Upon
Exercise of
Outstanding Options,
Warrants and Rights | | Weighted-Average
Exercise Price of
Outstanding
Options, Warrants
and Rights | | Number of Securities Remaining Available for Future Issuance Under Equity Compensation Plans(1) | Plan Category | Number of Securities
To be Issued Upon
Exercise of
Outstanding Options,
Warrants and Rights | | Weighted-Average
Exercise Price of
Outstanding
Options, Warrants
and Rights | | Number of Securities Remaining Available for Future Issuance Under Equity Compensation Plans(1) |
| Equity compensation plans approved by the Company’s stockholders | Equity compensation plans approved by the Company’s stockholders | 1,216,910 | | | $ | 161.45 | | | 1,980,029 | |
| Equity compensations plans not approved by the Company’s stockholders | Equity compensations plans not approved by the Company’s stockholders | — | | | — | | | — | |
(1)Includes an indeterminate number of shares underlying deferred compensation units (“DCUs”) granted under the Directors Deferred Compensation Plan and Deferred Compensation Plan for Non-officer Presidents which are issuable under the Company’s Incentive Award Plan. Also includes an indeterminate number of shares underlying DCUs granted under the Deferred Compensation Plan for Officers, which shares are issuable under the Incentive Award Plan. The number of DCUs granted under these plans is determined by dividing the amount deferred by the closing price of the common stock the day before the date of deferral. The DCUs are entitled to receive dividend equivalents which are reinvested in DCUs based on the same formula for investment of a participant’s deferral.
Item 13. Certain Relationships and Related Transactions, and Director Independence.
Information under the headings, “Corporate Governance” and “Board Committees” in the 20232024 Proxy Statement is incorporated into this Item 13 by reference.
Item 14. Principal Accountant Fees and Services.
Information under the heading “Principal Accountant Fees and Services” in the 20232024 Proxy Statement is incorporated into this Item 14 by reference.
PART IV
Item 15. Exhibits and Financial Statement Schedules.
(A)1. Financial Statements
2. Financial Statement Schedules
Financial statement schedules are omitted because they are not applicable, not required, not material or because the required information is included in the Consolidated Financial Statements of the Company or the Notes thereto.
3. Exhibits
The exhibits filed with this report are listed on the “Exhibit Index,” which precedes the signature page of this report.
Item 16. Form 10-K Summary.
None.
Exhibit Index | | | | | | | | |
Exhibit
Number | | Description |
| |
| 3.1 | | | |
| |
| 3.2 | | | |
| | |
| 4.1 | | | |
| | |
| 4.2 | | | |
| | |
| 4.3 | | |
| | |
| 4.4 | | | |
| | |
| 4.5 | | | |
| | |
| 4.6 | | |
| | |
| 10.1** | | |
| | |
| 10.2** | | |
| | |
| 10.3** | | |
| | |
| 10.4** | | |
| | |
| 10.5** | | |
| | |
| 10.6** | | |
| | |
| 10.7** | | |
| | |
| 10.8** | | |
| | |
| | | | | | | | |
Exhibit
Number | | Description |
| |
| 10.9** | | |
| | | | | | | | |
Exhibit
Number | | Description |
| |
| 10.10** | | |
| | |
| 10.11** | | |
| | |
| 10.12** | | |
| | |
| 10.13** | | |
| | |
| 10.14** | | |
| | |
| 10.15** | | |
| | |
| 10.16** | | |
| | |
| | |
10.17** | | |
| | |
10.18*10.17** | | |
| | |
10.19** | | |
| | |
10.20*10.18** | | |
| | |
10.21*10.19** | | |
| | |
10.22*10.20** | | |
| | |
10.23*10.21** | | |
| | | | | | | | |
Exhibit
Number | | Description |
| | |
10.24*10.22** | | |
| | |
10.25*10.23** | | |
| | |
10.26*10.24** | | |
| | |
10.27*10.25** | | |
| | |
| | | | | | | | |
Exhibit
Number | | Description |
| | |
10.2810.26 | | | Amended and Restated Credit Agreement, dated as of November 1, 2022, which amends and restates the Credit Agreement, dated as of May 31, 2019, by and among IDEX Corporation and certain of its subsidiaries, as borrowers, Bank of America, N.A., as administrative agent, swing line lender and an issuer of letters of credit; JPMorgan Chase Bank, N.A. and Wells Fargo Bank, National Association, as co-syndication agents and issuers of letters of credit; HSBC Bank USA, National Association, Mizuho Bank, Ltd., and Bank of China, Chicago Branch, as co-documentation agents and the other lenders and financial institutions party thereto (incorporated by reference to Exhibit 10.1 to the Current Report on Form 8-K of IDEX Corporation filed on November 2, 2022) |
| | |
10.29*10.27** | |
|
| | |
10.30*10.28** | | |
| | |
10.31*, **10.29** | | |
| | |
10.32*10.30*, **** | | |
| | |
10.33*, **10.31** | | |
| | |
10.34*, **10.32** | | |
| | |
| 10.33** | | |
| | |
*2121* | | |
| |
*2323* | | |
| |
*31.131.1* | | |
| | |
*31.231.2* | | |
| | |
32.1****32.1 | | |
| |
32.2****32.2 | | |
| | |
| 97* | | |
| | | | | | | | |
| | |
| *,****101 | | The following materials from IDEX Corporation’s Annual Report on Form 10-K for the year ended December 31, 20222023 formatted in Inline XBRL (Extensible Business Reporting Language): (i) the Consolidated Balance Sheets at December 31, 20222023 and 2021,2022, (ii) the Consolidated Statements of Income for the three years ended December 31, 2022,2023, (iii) the Consolidated Statements of Comprehensive Income for the three years ended December 31, 2022,2023, (iv) the Consolidated Statements of Equity for the three years ended December 31, 2022,2023, (v) the Consolidated Statements of Cash Flows for the three years ended December 31, 2022,2023, and (vi) Notes to the Consolidated Financial Statements. |
| | |
| *,****104 | | Cover Page Interactive Data File (Formatted Inline XBRL and contained in Exhibit 101) |
* Filed herewith.
** Management contract or compensatory plan or agreement.
*** Furnished herewith.
**** In accordance with Rule 406T of Regulation S-T, the XBRL related information in Exhibits 101 and 104 to this Annual Report on Form 10-K shall not be deemed to be “filed” for purposes of Section 18 of the Exchange Act, or otherwise subject to the liability of that section, and shall not be part of any registration statement or other
document filed under the Securities Act or the Exchange Act, except as shall be expressly set forth by specific reference in such filing.
SIGNATURES
Pursuant to the requirements of Section 13 or 15(d) of the Securities Exchange Act of 1934, the Registrant has duly caused this report to be signed on its behalf by the undersigned, thereunto duly authorized.
| | | | | | | | |
| IDEX CORPORATION |
| | |
| By: | /s/ WILLIAM K. GROGANABHISHEK KHANDELWAL |
| | William K. GroganAbhishek Khandelwal |
| | Senior Vice President and Chief Financial Officer |
Date: February 23, 202322, 2024
Pursuant to the requirements of the Securities Exchange Act of 1934, this report has been signed below by the following persons on behalf of the Registrant and in the capacities and on the dates indicated.
| | | | | | | | | | | | | | |
| Signature | | Title | | Date |
| | |
| /s/ ERIC D. ASHLEMAN | | Chief Executive Officer,
President and Director
(Principal Executive Officer)
| | |
| Eric D. Ashleman | | | February 23, 202322, 2024 |
| | |
/s/ WILLIAM K. GROGANABHISHEK KHANDELWAL | | Senior Vice President and
Chief Financial
Officer (Principal Financial Officer) | | |
William K. GroganAbhishek Khandelwal | | | February 23, 202322, 2024 |
| | |
| /s/ ALLISON S. LAUSAS | | Vice President and
Chief Accounting Officer
(Principal Accounting Officer) | | |
| Allison S. Lausas | | | February 23, 202322, 2024 |
| | |
| /s/ MARK A. BECK | | Director | | |
| Mark A. Beck | | | February 23, 202322, 2024 |
| | | | |
| /s/ MARK A. BUTHMAN | | Director | | |
| Mark A. Buthman | | | February 23, 202322, 2024 |
| | | | |
| /s/ ALEJANDRO QUIROZ CENTENO | | Director | | |
| Alejandro Quiroz Centeno | | | February 23, 202322, 2024 |
| | | | |
| /s/ CARL R. CHRISTENSON | | Director | | |
| Carl R. Christenson | | | February 23, 202322, 2024 |
| | | | |
| /s/ LAKECIA N. GUNTER | | Director | | |
| Lakecia N. Gunter | | | February 23, 202322, 2024 |
| | | | |
| /s/ KATRINA L. HELMKAMP | | Non-Executive Chairman of the Board and Director | | |
| Katrina L. Helmkamp | | | February 23, 202322, 2024 |
| | | | |
| /s/ DAVID C. PARRY | | Director | | |
| David C. Parry | | | February 23, 202322, 2024 |
| | |
| /s/ LIVINGSTON L. SATTERTHWAITE | | Director | | |
| Livingston L. Satterthwaite | | | February 23, 202322, 2024 |
| | | | |
| /s/ L. PARIS WATTS-STANFIELD | | Director | | |
| L. Paris Watts-Stanfield | | | February 23, 202322, 2024 |
| | |
| | | | |
| | | |
| | | | |