| PART I | ||
| Item 1. | 2 | |
| Item 1A. | ||
| Item 1B. | ||
| Item 2. | ||
| Item 3. | ||
| Item 4. | ||
| 25 | ||
| PART II | ||
| Item 5. | ||
| Item 6. | ||
| Item 7. | ||
| Item 7A. | ||
| Item 8. | ||
| Item 9. | ||
| Item 9A. | ||
| Item 9B. | ||
| PART III | ||
| Item 10. | ||
| Item 11. | ||
| Item 12. | ||
| Item 13. | ||
| Item 14. | ||
| 42 | ||
| PART IV | ||
| Item 15. | ||
| 43 | ||
| F-1 | ||
| S-1 | ||
| E-1 | ||
i
PART I
This document and other public statements we make may contain statements that do not relate strictly to historical fact, any of which may be forward-looking statements within the meaning of the U.S. Private Securities Litigation Reform Act of 1995. When we use the words "anticipates," "plans," "expects" and similar expressions, we are identifying forward-looking statements. Forward-looking statements involve known and unknown risks and uncertainties which may cause our actual results, performance or achievements to be materially different from those expressed or implied by forward-looking statements. While it is impossible to identify or predict all such matters, these differences may result from, among other things, the inherent uncertainty of the timing and success of, and expense associated with, research, development, regulatory approval and commercialization of our products and product candidates, including the risks that clinical trials will not commence or proceed as planned; products appearing promising in early trials will not demonstrate efficacy or safety in larger-scale trials; clinical trial data on our products and product candidates will be unfavorable; our products will not receive marketing approval from regulators or, if approved, do not gain sufficient market acceptance to justify development and commercialization costs; competing products currently on the market or in development might reduce the commercial potential of our products; we, our collaborators or others might identify side effects after the product is on the market; or efficacy or safety concerns regarding marketed products, whether or not originating from subsequent testing or other activities by us, governmental regulators, other entities or organizations or otherwise, and whether or not scientifically justified, may lead to product recalls, withdrawals of marketing approval, reformulation of the product, additional pre-clinical testing or clinical trials, changes in labeling of the product, the need for additional marketing applications, declining sales or other adverse events.
We are also subject to risks and uncertainties associated with the actions of our corporate, academic and other collaborators and government regulatory agencies, including risks from market forces and trends; potential product liability; intellectual property, litigation and other dispute resolution, environmental and other risks; the risk that we may not be able to enter into favorable collaboration or other relationships or that existing or future relationships may not proceed as planned; the risk that current and pending patent protection for our products may be invalid, unenforceable or challenged, or fail to provide adequate market exclusivity, or that our rights to in-licensed intellectual property may be terminated for our failure to satisfy performance milestones; the risk of difficulties in, and regulatory compliance relating to, manufacturing products; and the uncertainty of our future profitability.
Risks and uncertainties also include general economic conditions, including interest and currency exchange-rate fluctuations and the availability of capital; changes in generally accepted accounting principles; the impact of legislation and regulatory compliance; the highly regulated nature of our business, including government cost-containment initiatives and restrictions on third-party payments for our products; trade buying patterns; the competitive climate of our industry; and other factors set forth in this document and other reports filed with the U.S. Securities and Exchange Commission (SEC). In particular, we cannot assure you that Relistor® will be commercially successful or be approved in the future in other formulations, indications or jurisdictions, or that any of our other programs will result in a commercial product.
We do not have a policy of updating or revising forward-looking statements and we assume no obligation to update any statements as a result of new information or future events or developments. It should not be assumed that our silence over time means that actual events are bearing out as expressed or implied in forward-looking statements.
Available Information
We file annual, quarterly and current reports, proxy statements and other documents with the SEC under the Securities Exchange Act of 1934. The SEC maintains an Internet website that contains reports, proxy and information statements and other information regarding issuers, including Progenics, that file electronically with the SEC. You may obtain documents that we file with the SEC at http://www.sec.gov, and read and copy them at the SEC's Public Reference Room at 100 F Street NE, Washington, DC 20549. You may obtain information on operation of the Public Reference Room by calling the SEC at 1-800-SEC-0330. We also make available our annual, quarterly and current reports and proxy materials on http://www.progenics.com.
Additional information concerning Progenics and its business may be available in press releases or other public announcements and quarterly and current reports and documents filed with the SEC. Information on or accessed through our website is not included in the Company's SEC filings.
In this document, Relistor, a registered trademark, refers to methylnaltrexone – the active ingredient of Relistor -- as it has been and is being developed and commercialized by or in collaboration with Progenics. Subcutaneous Relistor has received regulatory marketing approval for specific indications, and references to Relistor do not imply that any other form or possible use of the drug has received approval. Relistor's approved U.S. label and full U.S. prescribing information is available at www.Relistor.com. Other approved labels for Relistor apply in ex-U.S. markets. Azedra and Onalta are trademarks of our Molecular Insight Pharmaceuticals, Inc. subsidiary.
1
Progenics Pharmaceuticals develops innovative medicines for oncology. Our clinical development efforts center on late-stage oncology assets. An important focus for Progenics is targeted therapeutics and imaging agents. A significant partnumber of our research and development efforts centers oncandidates target prostate specific membrane antigen (PSMA), a protein found at high levels on the surface of prostate cancer cells and also on the neovasculature of a number of other types of solid tumors. We are conducting phase 2 clinical trials of two product candidates for prostate cancer: our therapeutic candidate, PSMA ADC, a fully human monoclonal antibody-drug conjugate (ADC) directed toward PSMA and designed to deliver targeted chemotherapy to cancer cells, and MIP-1404, an imaging agent candidate with potential to alter clinical practice in treating prostate cancer in development by Molecular Insight Pharmaceuticals, a clinical-stage biotechnology company we acquired this January. Among other assets in our pipeline of targeted radiotherapy and molecular imaging compounds from the acquisition are a group of small molecule therapeutics, MIP-1095, -1555 and -1558, in preclinical study for metastatic prostate cancer and other PSMA-expressing cancers, and Azedra™, an ultra-orphan radiotherapy candidate in phase 2 study for pheochromocytoma and potential additional indications.
.
| OUR PRODUCT CANDIDATES | ||||||||||
| Status | ||||||||||
| PSMA ADC | Treatment of prostate | Phase 2 testing in chemotherapy-experienced patients completed; a second cohort in chemotherapy-naïve patients ongoing | ||||||||
| Imaging agent for prostate cancer | Phase 2 testing | completed | ||||||||
| Azedra™ | Phase 2b registrational trial under Special Protocol Assessment (SPA) | |||||||||
RELISTOR® | ||||||||||
| Relistor-Subcutaneous injection | Treatment of opioid induced constipation (OIC) in advanced-illness patients receiving palliative care when laxative therapy has not been sufficient | Marketed in the U.S., E.U., Canada, Australia and elsewhere; | ||||||||
| Relistor-Subcutaneous injection | Treatment of OIC in patients with non-cancer pain | Complete Response Letter received in 2012 on pending | ||||||||
| Relistor-Oral | Treatment of OIC | Phase 3 testing completed | ||||||||
Oncology
Our principal clinical-stage product candidates in oncology are
| the PSMA protein. In | ||||||||
metastatic castration-resistant prostate cancer (mCRPC) and are conducting a second cohort of chemotherapy-naïve patients. | ||||||||
| · | 1404 (trofolastat), a radio-labeled small molecule which binds PSMA and acts as an imaging agent to diagnose and detect prostate cancer, including metastases in other soft tissue and bone. We have recently completed a global multicentered phase 2 study assessing the diagnostic accuracy of 1404 imaging in men with high-risk prostate cancer scheduled for radical prostectomy. |
| · | Azedra, a phase 2 radiotherapeutic product candidate in development as a treatment for pheochromocytoma -- rare tumors found primarily in the adrenal glands – and related paraganglioma tumors occurring in other tissues. Azedra has Orphan Drug designation and Fast Track status in the U.S. for pheochromocytoma and paraganglioma, with clinical study conducted under a 2009 Special Protocol Assessment (SPA) with the FDA. There is currently no FDA-approved therapeutic for the treatment of pheochromocytoma. |
See Clinical Trial Activities, below, for additional information concerning these studies and those for Relistor.
We have decided to move forward MIP-1095, a PSMA-targeted small molecule radiopharmaceutical originally developed by our Molecular Insight subsidiary, into clinical development, and expects to file an Investigational New Drug (IND) application in the U.S. later this year. Memorial Sloan-Kettering Cancer Center has agreed to serve as a study site for a phase 1 trial of this compound.
Relistor
Relistor, the first approved treatment for opioid-induced constipation (OIC) that addresses its underlying mechanism, decreases the constipating side effects induced by opioid pain medications such as morphine and codeine without diminishing their ability to relieve pain. Relistor subcutaneous injection is approved for sale in the U.S., E.U., Canada, Australia and elsewhere in pre-filled syringes, which are designed to ease preparation and administration for patients and caregivers. Under our License Agreement, Salix is responsible for developing and commercializing Relistor, including completing clinical development necessary to support regulatory marketing approvals for potential new indications (such as OIC in patients with chronic, non-cancer pain) and formulations of the drug (such as an oral formulation of methylnaltrexone, the active ingredient in Relistor). As previously announced, theThe U.S. Food and Drug Administration lastin July 2012 issued a Complete Response Letter for the supplemental New Drug Application for Relistor injection for subcutaneous use for the treatment of OIC in adult patients with chronic, non-cancer pain, in which the FDA requested additional clinical data. After an End-of-Review meeting in October of that year, the FDA's Division of Gastroenterology and Inborn Errors Products expressed a concern that there may be a risk associated with the chronic use of mu-opioid receptor antagonists in patients who are taking opioids for chronic pain, and, in order to understand this potential risk, the Division communicated that a very large, well-controlled, chronic administration trial will have to be conducted to assess the safety of any mu-opioid receptor antagonist prior to market approval for the treatment of patients with OIC who are taking opioids for chronic, non-cancer pain. Salix subsequently held discussions with the Division and expressed the view that the post-marketing, clinical and preclinical data currently available for Relistor adequately demonstrate an appropriate and expected safety profile sufficient to permit the approval of the current Relistor sNDA. In response to Salix's formal appeal of the FDA's complete response letter, the FDA informed Salix and Progenics are continuingin June 2013 that it will seek input from an Advisory Committee, which it originally scheduled for March 2014. The FDA has recently postponed this meeting and said it will convene in the near future. The FDA has also stated that it will take action under the appeal within 30 days after receiving input from the Committee.
We believe that some of the areas being considered for discussion during the meeting would include the potential for drugs in Relistor's class to work togethercause withdrawal symptoms; the strength of a potential cardiovascular signal seen with another drug in this class of drugs and the available safety data with Relistor in regards to a potential cardiovascular (CV) signal; and the need and timing (pre-approval vs. post-approval) of major adverse cardiac events (MACE) studies with drugs of this class. The FDA has communicated that it is convening the Advisory Committee for the following reasons: (i) the potential cardiovascular safety signal observed in the 12-month safety trial of another peripheral mu-opioid antagonist for the treatment of opioid-induced constipation in patients with chronic non-cancer pain raises concern for this class of drug products; (ii) the RELISTOR supplemental application contains only uncontrolled long-term safety data, and while there is no cardiovascular signal apparent in this data, the lack of a control population does not allow a definitive evaluation to be made to rule out a potential cardiovascular safety signal; and (iii) the FDA needs to generateprovide consistent advice regarding the need for MACE studies to applicants developing drug products in this class for this indication, and for this reason, a reasonable path forwardbroader discussion of the potential for cardiovascular events across the further development and regulatory review of Relistor, and while itdrug class is not possible to determine definitively the duration of discussions with the FDA regarding this matter, at this time Salix and Progenics anticipate a path forward could be reached with the FDA during 2013. necessary.
See Risk Factors.
Relistor net sales and related royalties earned during the years 2010-20122011-2013 are set forth below. Our recognition of royalty revenue for financial reporting purposes is explained in Management's Discussion and Analysis of Financial Condition and Results of Operations (MD&A) and our financial statements included elsewhere in this document. Royalties are based on net sales reported by commercialization collaborators.
First Quarter | Second Quarter | Third Quarter | Fourth Quarter | Full Year | First Quarter | Second Quarter | Third Quarter | Fourth Quarter | Full Year | |||||||||||||||||||||||||||||
| (in thousands) | (in thousands) | |||||||||||||||||||||||||||||||||||||
| 2013: | ||||||||||||||||||||||||||||||||||||||
| Net Sales | $ | 7,700 | $ | 7,900 | $ | 4,800 | $ | 19,000 | $ | 39,400 | ||||||||||||||||||||||||||||
| Royalties Earned | 1,155 | 1,174 | 719 | 2,847 | 5,895 | |||||||||||||||||||||||||||||||||
| 2012: | ||||||||||||||||||||||||||||||||||||||
| Net Sales | $ | 12,300 | $ | 10,800 | $ | 4,900 | $ | 5,200 | $ | 33,200 | $ | 12,300 | $ | 10,800 | $ | 4,900 | $ | 5,200 | $ | 33,200 | ||||||||||||||||||
| Royalties Earned | 1,834 | 1,619 | 728 | 782 | 4,963 | 1,834 | 1,619 | 728 | 782 | 4,963 | ||||||||||||||||||||||||||||
| 2011: | ||||||||||||||||||||||||||||||||||||||
| Net Sales | $ | 3,300 | $ | 5,200 | $ | 9,700 | $ | 8,800 | $ | 27,000 | $ | 3,300 | $ | 5,200 | $ | 9,700 | $ | 8,800 | $ | 27,000 | ||||||||||||||||||
| Royalties Earned | - | 527 | 1,240 | 1,279 | 3,046 | - | 527 | 1,240 | 1,279 | 3,046 | ||||||||||||||||||||||||||||
| 2010: | ||||||||||||||||||||||||||||||||||||||
| Net Sales | $ | 4,200 | $ | 3,800 | $ | 4,100 | $ | 4,000 | $ | 16,100 | ||||||||||||||||||||||||||||
| Royalties Earned | 625 | 581 | 620 | - | 1,826 | |||||||||||||||||||||||||||||||||
Clinical Trial Activities
Progenics' practice has been to announce commencement and results of all of its significant clinical trials in press releases, medical and scientific meetings and other venues. Following is a summary of current clinical trial activities involving our principal product candidates and Relistor.
PSMA ADC. In our open-label, multicenter U.S. phase 2 trial of PSMA ADC to assess anti-tumor activity and tolerability an initial cohort of chemotherapy experienced participants with metastatic castration-resistant prostate cancer (mCRPC) have received initial doses of drug starting at either 2.5 mg/kg or 2.3 mg/kg; in some cases subsequent doses were adjusted based on tolerability. The study endpoints evaluate the anti-tumor effect of the compound as measured by changes in prostate specific antigen (PSA) levels, number of circulating tumor cells (CTC), pain scores, and tumor size as measured under RECIST criteria. Safety is also being assessed. Progenics has completed enrollment of 83 patients in this cohort and is treating an additional trial cohort of up to 35 chemotherapy naive patients who have progressed on hormonal therapies.
Adverse events (AEs) associated with PSMA ADC observed in this phase 2 study through mid-2013 have been consistent with those observed in the phase 1 study noted below; the most common grade 3 or higher AEs in this study have been neutropenia (grade 4: 6.7% at 2.3 mg/kg and 11.4% at 2.5 mg/kg) and peripheral neuropathy (grade 3 or higher: 6.7% at 2.3 mg/kg and 5.7% at 2.5 mg/kg). Eight patients experienced serious adverse events (SAEs) which included febrile neutropenia, neutropenia, sinus tachycardia, gastrointestinal disorders, fatigue, infections and dehydration. Two deaths occurred after treatment with PSMA ADC. The first, a patient hospitalized ten days following his first dose of study drug (2.5 mg/kg) with febrile neutropenia and E. coli positive blood cultures, progressed despite treatment to septic shock and died; both the investigator and Progenics considered this patient's septic shock as probably related to PSMA ADC. The second patient developed a rash and fever and was hospitalized for neutropenic fever, where further assessment revealed Strep Viridans bacteria (suspected to be from a tunnel catheter) in blood. Approximately two weeks after receiving study drug (also 2.5 mg/kg), this patient was intubated due to hypoxia and respiratory failure, and died three days after being removed from a ventilator. The investigator considered sepsis as unlikely, bacteremia as probably, febrile neutropenia as definitely related to PSMA ADC; Progenics assessed sepsis as probably, bacteremia as unlikely, and febrile neutropenia as definitely related to PSMA ADC. A third patient died before receiving study drug.
The phase 2 trial was undertaken after review and analysis of results from a phase 1 dose-ranging study of the compound in 52 mCRPC patients whose cancer had progressed despite prior treatment with taxane-based chemotherapy regimens.
The initial 12-week clinical trial period of the phase 1 study evaluated up to four intravenous doses of PSMA ADC administered at three-week intervals. Following completion of the four doses, patients were offered, at their physicians' discretion, the option to continue treatment with PSMA ADC for up to an additional 39 weeks. The anti-tumor effect of the compound as measured by changes in PSA levels and number of CTCs was observed in the study across doses ranging from 1.8 mg/kg to 2.8 mg/kg, and durable responses were seen in some of these heavily pre-treated patients. PSMA ADC was generally well tolerated in patients at doses up to and including 2.5 mg/kg. Dose limiting toxicities, primarily neutropenia, were seen at 2.8 mg/kg. The most commonly reported AEs were anorexia and fatigue. Five patients experienced SAEs, two of which resulted in death. One patient dosed at 1.8 mg/kg died from multi-organ failure due to acute pancreatitis: while no data suggested this event was drug-related, a possible relationship could not be definitively ruled out. A second patient died 11 days after receiving study drug at 2.8 mg/kg: septic shock was cited as the cause of death. The investigator considered septic shock as probably related and febrile neutropenia as definitely related to PSMA ADC.
Through mid-2013, 14% of the 95 patients treated with PSMA ADC in these trials have reported SAEs, including acute pancreatitis, sepsis/septic shock (each as noted above), tachycardia, abnormal ECG, atrial fibrillation, chest pain, confusion, deep vein thrombosis, pulmonary embolism, hematuria, increased International Normalized Ratio (INR), leukopenia, metabolic acidosis, myocardial infarction, pneumonia and renal failure. In conducting these studies, Progenics has taken into account SAEs reported to date as treatment-related or possibly treatment-related; based on data currently available to it, the Company is continuing development of PSMA ADC and has not determined what effects, if any, treatment-related SAEs reported to date or that may be reported in the future may have on the development of PSMA ADC going forward. See Risk Factors.
1404. Molecular Insight conducted four phase 1 studies with 1404 to establish proof-of-concept and dosimetry, and to assess a simplified kit preparation as compared to multi-step preparation. It commenced a phase 2 safety and efficacy study in 2012 to assess the diagnostic accuracy of the compound imaging in men with high-risk prostate cancer scheduled for radical prostatectomy (RP) and extended pelvic lymph node dissection (EPLND) compared to histopathology. The primary objective of this phase 2 international multi-center, multi-reader, open-label trial is to assess clinical safety as well as the compound's ability to detect prostate cancer within the prostate gland. Patient enrollment has been completed with 105 participants dosed at 20 centers in the U.S. and Europe. An additional phase 1 study in 14 patients to assess safety and diagnostic accuracy of 1404 whole body and pelvic SPECT/CT imaging and pelvic MRI in normal healthy men without current evidence of prostate cancer has completed dosing. There have to date been no treatment related AEs reported in these studies, other than one mild injection site reaction.
Azedra. In 2006, Molecular Insight commenced a phase 1 study with Azedra in 11 patients with pheochromocytoma / paraganglioma and metastatic carcinoid tumors to assess the safety, radiation dosimetry, and distribution metabolism of a single imaging dose of this compound. Following completion of this study, two dose-finding studies were conducted to determine a maximum tolerated therapeutic dose, and to assess safety, dosimetry and preliminary efficacy of Azedra in 21 patients with pheochromocytoma / paraganglioma and 15 with high-risk neuroblastoma, respectively.
Molecular Insight subsequently commenced a phase 2 study of Azedra under the 2009 SPA regarding the design of this intended registrational phase 2 trial to evaluate the efficacy and safety of the administration of two therapeutic doses of the compound in patients with pheochromocytoma / paraganglioma. The primary objective of this U.S. study is to determine the clinical benefit of Azedra based on the proportion of study participants with a reduction of antihypertensive medication by at least 50% for at least six months. This phase 2 trial has enrolled 41 of the 58 patients required to be treated under the SPA, and the long-term follow up phase of the study is ongoing. To date 49% of patients receiving study drug reported SAEs, the most common of which were hematologic (12%); other SAEs included constipation, dyspnea and myelodysplastic syndrome (each at 4.5%).
This trial was suspended in late 2010 due to lack of funding. Progenics is now resuming this trial, and plans for patient recruitment to continue after making drug supply manufacturing arrangements for the trial.
Relistor. Salix and Progenics completed in 2011 a phase 3 U.S. trial to evaluate the efficacy and safety of oral methylnaltrexone for the treatment of opioid-induced constipation in patients with chronic, non-cancer pain. This 804-patient trial assessed a once-daily oral methylnaltrexone dose of 150, 300 or 450 mg compared to placebo for 12 weeks: patients received one daily dose during the first four weeks and dosing on an as needed basis for the remaining eight weeks. Both the 300 and 450 mg treatment arms demonstrated statistically significant results for the primary endpoint of average proportion of rescue-free bowel movements (RFBMs) per patient within four hours of administration over four weeks of dosing, when compared to the placebo treatment arm. Efficacy was also seen in both the 300 and 450 mg treatment groups for other endpoints, including change in weekly RFBMs from baseline over the first four weeks and one assessing response (responder/non-responder) to study drug during weeks one to four, where "responder" was defined as having three or more RFBMs per week, with an increase of at least one RFBM per week over baseline, for at least three out of the first four weeks. Overall, efficacy of oral methylnaltrexone in this study was comparable to that reported in clinical studies of subcutaneous methylnaltrexone in patients with chronic, non-cancer pain, and the overall observed safety profile seen in patients treated with oral methylnaltrexone was comparable to placebo.
The phase 3 trial was undertaken after review and analysis of results from clinical trials initiated by Progenics' former collaboration partner, Wyeth Pharmaceuticals, and Progenics utilizing formulations of oral methylnaltrexone in patients with chronic, non-cancer pain receiving opioid treatment.
In one of these trials, of the oral formulation utilized in the phase 3 trial described above, 48% of the 25 patients receiving methylnaltrexone tablets laxated within four hours of treatment. In this study, there were no drug related SAEs reported, and the most frequent AEs were nausea and headache (10.8% each); others were vomiting (4.6%), abdominal pain and muscle spasms (3.1% each). Based on the data from this study and other information regarding oral methylnaltrexone, Progenics concluded that the methylnaltrexone tablet was active and generally well tolerated and that its safety, pharmacokinetics and activity profiles were comparable to that of subcutaneous methylnaltrexone, and decided to commence the phase 3 trial described above.
For purposes of the foregoing summary, in general phase 1 trials are initial evaluations of safety in humans which study methods of action and metabolization; phase 2 trials evaluate safety, dosing and activity or efficacy, and continue safety evaluation; and phase 3 trials involve larger scale evaluations of safety, efficacy and dosage.
License and Other Agreements
Following is a summary of significant agreements relating to our pipeline.
Oncology
Our PSMA Development Company LLC subsidiary has a collaboration agreement with Seattle Genetics, Inc. under which SGI has granted us an exclusive worldwide license to its proprietary ADC technology. We have the right to use this technology, which is based in part on technology licensed by SGI from third parties, to link chemotherapeutic agents to our monoclonal antibodies that target prostate specific membrane antigen and will utilizeutilizing technology licensed to us, through Cytogen Corporation, from Sloan-Kettering.Sloan-Kettering Institute for Cancer Research. We are responsible for research, product development, manufacturing and commercialization of all products, and are obligated to make maintenance and milestone payments and to pay royalties to SGI and its licensors, as applicable, on a percentage of net sales. The SGI agreement terminates at the latest of (i) the tenth anniversary of the first commercial sale of each licensed product in each country or (ii) the latest date of expiration of patents underlying the licensed products. We may terminate the agreement upon advance written notice; SGI may terminate if we fail to cure a breach of an SGI in-license after written notice; and either party may terminate after written notice upon an uncured breach or in the event of the other party's bankruptcy.
PSMA LLC also has a worldwide exclusive licensing agreement with Abgenix (now Amgen Fremont, Inc.) to use its XenoMouse® technology for generating fully human antibodies to PSMA. We are obligated to make development and commercialization milestone payments with respect to products incorporating an antibody generated utilizing that technology, along with royalties based upon net sales of such products. Abgenix may terminate this agreement for cause, after an opportunity to cure, upon 30 days prior written notice; we have the right to terminate upon 30 days prior written notice. The agreement continues until the later of the expiration of specified patents or seven years from the first commercial sale of eligible products.
We acquired Molecular Insight in January 2013 by purchasing all of its outstanding capital stock for 4,566,210 shares of Progenics common stock (with 500,000 held in escrow)an escrow expiring in April 2014) in a private transaction. Under the agreement, we also agreed to pay to the former stockholders potential milestones, in cash or Progenics stock at our option, of up to $23 million contingent upon achieving specified commercialization events and up to $70 million contingent upon achieving specified sales targets relating to all MIPthe acquired company's products. The agreement contains customary representations and warranties, covenants, and indemnification and other provisions.
| · | A 2012 co-exclusive license agreement with the University of Zurich and the Paul Scherrer Institute for worldwide sublicensable rights to certain intellectual property related to production methodologies relevant to 1404. Under this agreement, we maintain related patent rights and are obligated to pay low single-digit royalties on products using the licensed technology, license maintenance fees creditable against royalties, an annual fee for an option to expand the license's field of use, and clinical and regulatory milestone payments aggregating approximately $1.2 million. The agreement may be terminated by the licensors upon certain material defaults by, and automatically terminates upon certain bankruptcy events relating to Molecular Insight, and may be terminated by us on prior written notice. |
| · | A 2000 exclusive license agreement with The University of Western Ontario for worldwide sublicensable rights to certain intellectual property related to production methodologies relevant to Azedra. Under this agreement, we maintain related patent rights and are obligated to pay low single-digit royalties on products using the licensed technology, minimum annual royalties creditable against royalties and clinical and regulatory milestone payments aggregating approximately $0.2 million. The agreement, which either party may terminate upon certain bankruptcy events or material defaults, continues through the last to expire of the related patent rights. |
| · | A 2006 agreement with Novartis Pharma AG for exclusive rights to certain technology relating to Onalta™, a compound which has been outlicensed to third parties which are obligated to make milestone payments and royalties consistent with Molecular's obligations under this agreement, including royalties and milestone payments, partially creditable against future royalties, totaling $4.6 million upon the attainment of certain regulatory approvals. Either party may terminate this agreement immediately upon the occurrence of bankruptcy proceedings relating to or in the event of an uncured material breach by the other party, and Novartis may terminate in the event Molecular Insight is acquired by a direct competitor of Novartis. |
Relistor
Under our License Agreement, Salix Pharmaceuticals is responsible for further developing and commercializing subcutaneous Relistor worldwide other than Japan, including completing clinical development necessary to support regulatory marketing approvals for potential new indications and formulations, and marketing and selling the product. Salix is marketing Relistor directly through its specialty sales force in the U.S., and outside the U.S., directly through distribution and marketing partners and sublicensing regional companies. Among the rights we have licensed to Salix are our exclusive rights to develop and commercialize methylnaltrexone, the active ingredient of Relistor, which we in-licensed from the University of Chicago and for which we are obligated to make milestone and royalty payments to the University. Salix is paying us royalties ranging from 15 to 19 percent on its net sales of Relistor as well as 60% of any upfront, milestone, reimbursement or other revenue (net of costs of goods sold and territory-specific research and development expense reimbursement) it receives from sublicensees in respect of any country outside the U.S. We are also eligible to receive (i) a development milestone of up to $40 million upon U.S. marketing approval for subcutaneous Relistor in chronic, non-cancer pain patients (the proposed indication addressed in the Complete Response Letter referred to above), (ii) a development milestone of up to $50 million upon U.S. marketing approval of an oral formulation of Relistor, and (iii) up to $200 million of commercialization milestone payments upon achievement of specified U.S. sales targets. In the event that either marketing approval is subject to a Black Box Warning or Risk Evaluation and Mitigation Strategy (REMS), payment of a substantial portion of specified milestone amounts would be deferred, and subject, to achievement of the first commercialization milestone payable upon annual U.S. sales first exceeding $100 million. See Risk Factors.
We have licensed to Ono Pharmaceutical the rights to subcutaneous Relistor in Japan, where Ono is responsible for developing and commercializing subcutaneous Relistor, including conducting clinical development to support regulatory marketing approval and will own the subcutaneous filings and approvals relating to Relistor.Japan. We are entitled to receive up to $20 million upon achievement of development milestones as well as royalties and commercialization milestones on sales of subcutaneous Relistor in Japan.milestones. Ono has the option to acquire the rights to develop and commercialize other formulations of Relistor in Japan, on terms to be negotiated separately. Supervision of and consultation with respect to Ono's development and commercialization responsibilities are carried out by joint committees. The Ono License contains, among other terms, provisions which permitlicense permits termination by either party upon the occurrence of certain events. Progenics in October 2013 commenced an arbitration with Ono, following a communication from Ono that it has determined to discontinue development because of "commercial concerns" that Ono contends would permit it to cease development and terminate the License. Ono's discontinuation of development and/or protracted dispute resolution proceedings could result in reduced or delayed, or in the elimination of, milestone and/or royalty revenue from subcutaneous Relistor development in Japan. Under our License Agreement with Salix, in the event the Ono license terminates or rights thereunder otherwise revert to Progenics, the Salix Agreement automatically without payment by Salix extends to the license grants, territory and other rights provided in the Ono license, as a result of which Salix and not Progenics would receive such rights.
Among the rights we have licensed to Salix are our exclusive rights to develop and commercialize methylnaltrexone, the active ingredient of Relistor, which we in-licensed from the University of Chicago. Our agreement with Chicago provides for an exclusive license to intellectual property in exchange for development and potential commercialization obligations, low single-digit royalties on commercial sales of resulting products and single-digit percentages of milestone and sublicensing revenues, and shared patent policing responsibilities. The Chicago agreement, as amended in connection with our Relistor collaborations, including substantially all of Progenics' payment obligations thereunder, expires by its terms upon the expiration of the last to expire of the patents licensed thereunder, the last-to-expire of which expires in 2017.
Patents and Proprietary Technology
Protection of our intellectual property rights is important to our business. We seek U.S. patent protection for many of our inventions, and generally file patent applications in Canada, Japan, European countries that are party to the European Patent Convention and other countries on a selective basis in order to protect inventions we consider to be important to the development of business in those areas. Generally, patents issued in the U.S. are effective for either (i) 20 years from the earliest asserted filing date, if the application was filed on or after June 8, 1995, or (ii) the longer of 17 years from the date of issue or 20 years from the earliest asserted filing date, if the application was filed prior to that date.
In certain instances, the U.S. patent term can be extended up to a maximum of five years to recapture a portion of the term during which FDA regulatory review was being conducted. The duration of foreign patents varies in accordance with the provisions of applicable local law, although most countries provide for patent terms of 20 years from the earliest asserted filing date and allow patent extensions similar to those permitted in the U.S.
Patents may not enable us to preclude competitors from commercializing drugs in direct competition with our products, and consequently may not provide us with any meaningful competitive advantage. See Risk Factors. We also rely on trade secrets, proprietary know-how and continuing technological innovation to develop and maintain a competitive position in our product areas. We require our employees, consultants and corporate partners who have access to our proprietary information to sign confidentiality agreements.
Information with respect to our current patent portfolio is set forth below.
| Clinical and Research | Number of Patents | Expiration | Number of Patent Applications | Number of Patents | Expiration | Number of Patent Applications | ||||||||||||||
| Candidates; Relistor | U.S. | International | Dates (1) | U.S. | International | U.S. | International | Dates (1) | U.S. | International | ||||||||||
| Oncology (PSMA; key MIP programs) | 13 | 7 | 2013-2029 | 20 | 90 | |||||||||||||||
| Development programs | 21 | 76 | 2015-2031 | 15 | 49 | |||||||||||||||
| Relistor | 10 | 34 | 2015-2030 | 26 | 206 | 19 | 112 | 2015-2031 | 23 | 218 | ||||||||||
| Other | 13 | 60 | 2016-2023 | 3 | 29 | 1 | 1 | 2029 | 4 | 19 | ||||||||||
(1) | Patent term extensions and pending patent applications may extend periods of patent protection. |
With respect to PSMA ADC, currently issued composition-of-matter patents comprising co-owned and in-licensed properties have expiration ranges of 2022 to 2023 in the U.S. and 2022 to 2026 ex-U.S. Corresponding patent applications as well as patent applications directed to methods of use (except for the U.S. patent expiring in 2023) are pending worldwide, which if issued would have expiration ranges from 2022 to 2029. We view all of these patents as significant.
Owned and in-licensed properties relating to 1404 have expiration ranges of 2020 to 2029; we view as most significant the composition-of-matter patent on the compound, as well as technetium-99 labeled forms, which expires in 2029. Owned properties relating to MIP-1095 have expiration ranges of 2027 to 2031; we view as most significant the composition-of-matter patent on this compound, as well as radiolabeled forms, which expires in 2027. Additional U.S. patents are directed to various inventions relating to these product candidates, and corresponding patent applications are pending worldwide.
With regard to our Relistor-related intellectual property, the composition-of-matter patent for the active ingredient of Relistor, methylnaltrexone, was invented in the 1970's and has expired. The University of Chicago, as well as Progenics and its collaborators, have extended the methylnaltrexone patent estate with additional patents and pending patent applications covering various inventions relating to the product. Salix has listed in the FDA Orange Book four U.S. patents relating to subcutaneous Relistor, which have expiration dates ranging from 2017 to 2030, and one patent (expiring in 2024) with Health Canada. A patent issued in September 2013 provides protection for the oral methylnaltrexone product until 2031.
We are aware of intellectual property rights held by third parties that relate to products or technologies we are developing. For example, we are aware of others investigating and developing technologies and drug candidates directed toward PSMA or related compounds as well as methylnaltrexone and other peripheral opioid antagonists, and of patents and applications held or filed by others in those areas. The validity of issued patents, patentability of claimed inventions in pending applications and applicability of any of them to our programs are uncertain and subject to change, and patent rights asserted against us could adversely affect our ability to commercialize or collaborate with others on specific products.
Research, development and commercialization of a biopharmaceutical product often require choosing between alternative development and optimization routes at various stages in the development process. Preferred routes depend upon current -- and may be affected by subsequent -- discoveries and test results and cannot be identified with certainty at the outset. There are numerous third-party patents in fields in which we work, and we may need to obtain license under patents of others in order to pursue a preferred development route of one or more of our product candidates. The need to obtain a license would decrease the ultimate value and profitability of an affected product. If we cannot negotiate such a license, we might have to pursue a less desirable development route or terminate the entire program altogether.
Government Regulation
Progenics and its product candidates are subject to comprehensive regulation by the U.S. FDA and comparable authorities in other countries. Pharmaceutical regulation currently is a topic of substantial interest in lawmaking and regulatory bodies in the U.S. and internationally, and numerous proposals exist for changes in FDA and non-U.S. regulation of pre-clinical and clinical testing, approval, safety, effectiveness, manufacturing, storage, recordkeeping, labeling, marketing, export, advertising, promotion and other aspects of biologics, small molecule drugs and medical devices, many of which, if adopted, could significantly alter our business and the current regulatory structure described below. See Risk Factors.
FDA Regulation. FDA approval, which involves review of scientific, clinical and commercial data, manufacturing processes and facilities, is required before a product candidate may be marketed in the U.S. This process is costly, time consuming and subject to unanticipated delays, and a drug candidate may fail to progress at any point.
None of our product candidates other than Relistor has received marketing approval from the FDA or any other regulatory authority. The process required by the FDA before product candidates may be approved for marketing in the U.S. generally involves:
| · | pre-clinical laboratory and animal tests; | |
| · | submission to and favorable review by the FDA of an investigational new drug application before clinical trials may begin; | |
| · | adequate and well-controlled human clinical trials to establish the safety and efficacy of the product for its intended indication (animal and other nonclinical studies also are typically conducted during each phase of human clinical trials); | |
| · | submission to the FDA of a marketing application; and | |
| · | FDA review of the marketing application in order to determine, among other things, whether the product is safe and effective for its intended uses. |
Pre-clinical tests include laboratory evaluation of product chemistry and animal studies to gain preliminary information about a compound's pharmacology and toxicology and to identify safety problems that would preclude testing in humans. ProductSince product candidates must generally be manufactured according to current Good Manufacturing Practices (cGMP), and pre-clinical safety tests must be conducted by laboratories that comply with FDA good laboratory practices regulations. Pre-clinical testing is preceded by initial research related to specific molecular targets, synthesis of new chemical entities, assay development and screening for identification and optimization of lead compound(s).
Results of pre-clinical tests are submitted to the FDA as part of an Investigational New Drug application (IND) which must become effective before clinical trials may commence. The IND submission must include, among other things, a description of the sponsor's investigational plan; protocols for each planned study; chemistry, manufacturing and control information; pharmacology and toxicology information and a summary of previous human experience with the investigational drug. Unless the FDA objects to, makes comments or raises questions concerning an IND, it becomes effective 30 days following submission, and initial clinical studies may begin. Companies often obtain affirmative FDA approval, however, before beginning such studies.
Clinical trials involve the administration of the investigational new drug to healthy volunteers or to individuals under the supervision of a qualified principal investigator. Clinical trials must be conducted in accordance with the FDA's Good Clinical Practice requirements under protocols submitted to the FDA that detail, among other things, the objectives of the study, parameters used to monitor safety and effectiveness criteria to be evaluated. Each clinical study must be conducted under the auspices of an Institutional Review Board, which considers, among other things, ethical factors, safety of human subjects, possible liability of the institution and informed consent disclosure which must be made to participants in the trial.
Clinical trials are typically conducted in three sequential phases, which may overlap. During phase 1, when the drug is initially administered to human subjects, the product is tested for safety, dosage tolerance, absorption, metabolism, distribution and excretion. Phase 2 involves studies in a limited population to evaluate preliminarily the efficacy of the product for specific, targeted indications, determine dosage tolerance and optimal dosage and identify possible adverse effects and safety risks.
When a product candidate is found in phase 2 evaluation to have an effect and an acceptable safety profile, phase 3 trials are undertaken in order to further evaluate clinical efficacy and test for safety within an expanded population. Safety studies are conducted in accordance with the FDA's International Conference on Harmonization (ICH) Guidelines. Phase 2 results do not guarantee a similar outcome in phase 3 trials. The FDA may suspend clinical trials at any point in this process if it concludes that clinical subjects are being exposed to an unacceptable health risk.
A New Drug Application, or NDA, is an application to the FDA to market a new drug. A Biologic License Application, or BLA, is an application to market a biological product. The new drug or biological product may not be marketed in the U.S. until the FDA has approved the NDA or issued a biologic license. The NDA must contain, among other things, information on chemistry, manufacturing and controls; non-clinical pharmacology and toxicology; human pharmacokinetics and bioavailability; and clinical data. The BLA must contain, among other things, data derived from nonclinical laboratory and clinical studies which demonstrate that the product meets prescribed standards of safety, purity and potency, and a full description of manufacturing methods. Supplemental NDAs (sNDAs) are submitted to obtain regulatory approval for additional indications for a previously approved drug, and are reviewed by the FDA in a similar manner.
The results of the pre-clinical studies and clinical studies, the chemistry and manufacturing data, and the proposed labeling, among other things, are submitted to the FDA in the form of an NDA or BLA. The FDA may refuse to accept the application for filing if certain administrative and content criteria are not satisfied, and even after accepting the application for review, the FDA may require additional testing or information before approval of the application, in either case based upon changes in applicable law or FDA policy during the period of product development and FDA regulatory review. The applicant's analysis of the results of clinical studies is subject to review and interpretation by the FDA, which may differ from the applicant's analysis, and in any event, the FDA must deny an NDA or BLA if applicable regulatory requirements are not ultimately satisfied. If regulatory approval of a product is granted, such approval may be made subject to various conditions, including post-marketing testing and surveillance to monitor the safety of the product, or may entail limitations on the indicated uses for which it may be marketed. Product approvals may also be withdrawn if compliance with regulatory standards is not maintained or if problems occur following initial marketing.
Underlying this process are FDA regulations relating to drug approval which are complex and multi-faceted. Two such policies which may apply to some of our current or future product candidates are "Fast Track" approval for new drugs or biologics intended for the treatment of serious or life-threatening conditions which demonstrate the potential to address unmet medical needs, and Orphan Drug designation, available under U.S., E.U. and other laws, for drug candidates intended to treat rare diseases or conditions, and which if approved are granted a period of market exclusivity, subject to various conditions. Orphan Drug designation does not shorten or otherwise convey any advantage in the regulatory approval process.
Both before and after approval is obtained, a product, its manufacturer and the sponsor of the marketing application for the product are subject to comprehensive regulatory oversight. Violations of existing or newly-adopted regulatory requirements at any stage, including the pre-clinical and clinical testing process, the approval process, or thereafter, may result in various adverse consequences, including FDA delay in approving or refusal to approve a product, withdrawal of an approved product from the market or the imposition of criminal penalties against the manufacturer or sponsor. Later discovery of previously unknown problems may result in restrictions on the product, manufacturer or sponsor, including withdrawal of the product from the market.
Regulation Outside the U.S. Whether or not FDA approval has been obtained, approval of a pharmaceutical product by comparable government regulatory authorities abroad must be obtained prior to marketing the product there. The approval procedure varies from country to country, and the time required may be longer or shorter than that required for FDA approval. The requirements for regulatory approval by governmental agencies in other countries prior to commercialization of products there can be rigorous, costly and uncertain, and approvals may not be granted on a timely basis or at all.
In E.U. countries, Canada, Australia and Japan, regulatory requirements and approval processes are similar in principle to those in the U.S. Regulatory approval in Japan requires that clinical trials of new drugs be conducted in Japanese patients. Depending on the type of drug for which approval is sought, there are currently two potential tracks for marketing approval in the E.U. countries: mutual recognition and the centralized procedure. These review mechanisms may ultimately lead to approval in all E.U. countries, but each method grants all participating countries some decision-making authority in product approval. The centralized procedure, which is mandatory for biotechnology derived products, results in a recommendation in all member states, while the E.U. mutual recognition process involves country-by-country approval.
In other countries, regulatory requirements may require additional pre-clinical or clinical testing regardless of whether FDA or European approval has been obtained. This is the case in Japan, where Ono is responsible for developing and commercializing the subcutaneous form of Relistor and where trials are required to involve patient populations which we and our other collaborators have not examined in detail. If a product is manufactured in the U.S., it is also subject to FDA and other U.S. export provisions. In most countries outside the U.S., coverage, pricing and reimbursement approvals are also required, which may affect the profitability of the affected product.
Other Regulation. In addition to regulations enforced by the FDA, we are also subject to regulation under the U.S. Occupational Safety and Health Act, Environmental Protection Act, Toxic Substances Control Act, Resource Conservation and Recovery Act and various other current and potential future U.S. federal, state or local regulations. In addition, Molecular Insight's research is dependent on maintenance of licenses from various authorities permitting the acquisition, use and storage of quantities of radioactive isotopes that are critical for its manufacture and testing of research products. Biopharmaceutical research and development generally involves the controlled use of hazardous materials, chemicals, viruses and various radioactive compounds. Even strict compliance with safety procedures for storing, handling, using and disposing of such materials prescribed by applicable regulations cannot completely eliminate the risk of accidental contaminations or injury from these materials, which may result in liability for resulting legal and regulatory violations as well as damages.
Manufacturing
Under our License Agreement, Salix is responsible for the manufacture and supply, at its expense, of all active pharmaceutical ingredient (API) and finished and packaged products for its Relistor commercialization efforts, including contracting with contract manufacturing organizations (CMOs) for supply of Relistor API and subcutaneous and oral finished drug product. See Risk Factors.
We expect to engage third-party CMOs to manufacture additional clinical trial supplies of our PSMA monoclonal antibody and to continue using CMOs for other portions of the PSMA ADC manufacturing process. We have engaged and are finalizing definitive manufacturing arrangements with third-party CMOs for clinical trial supplies of Azedra and 1404, and may in the future undertake such efforts with respect to other assets and programs. If we are unable to arrange for satisfactory CMO services, or otherwise were to determine to establish a new manufacturing capacity, we would need to expandundertake such responsibilities on our manufacturing staff and facilities or obtain new facilities. In order to establish a full-scale commercial manufacturing facility for anyown. See Risk Factors.
10
Sales and Marketing
We from time to time seek strategic collaborations and other funding support for product candidates in our pipeline. We expect that we would market other products for which we obtain regulatory approval through co-marketing, co-promotion, licensing and distribution arrangements with third-party collaborators, and might also consider contracting with professional detailing and sales organizations to perform promotional and/or medical-scientific support functions for them. See Risk Factors.
Competition
Competition in the biopharmaceutical industry is intense and characterized by ongoing research and development and technological change. We face competition from many for-profit companies and major universities and research institutions in the U.S. and abroad. We face competition from companies marketing existing products or developing new products for diseases targeted by our technologies. Many of our competitors have substantially greater resources, experience in conducting pre-clinical studies and clinical trials and obtaining regulatory approvals for their products, operating experience, research and development and marketing capabilities and production capabilities than we do. Our products and product candidates under development may not compete successfully with existing products or products under development by other companies, universities and other institutions. Drug manufacturers that are first in the market with a therapeutic for a specific indication generally obtain and maintain a significant competitive advantage over later entrants and therefore, the speed with which industry participants move to develop products, complete clinical trials, approve processes and commercialize products is an important competitive factor.
Relistor is the first FDA-approved product for any indication involving OIC. We are, however, aware of approved and marketed products, as well as candidates in pre-clinical or clinical development, that target the side effects of opioid pain therapy. Cubist Pharmaceuticals, which acquired Adolor Corporation in 2011, markets ENTEREG® (alvimopan) for the treatment of postoperative ileus, and is in phase 3 testing of a compound for OIC in chronic-pain patients. Sucampo Pharmaceuticals, Inc., in collaboration with Takeda Pharmaceutical Company Limited, markets AMITIZA® (lubiprostone), a selective chloride channel activator, for chronic idiopathic (non-opioid related) constipation, and has filed an sNDA, which has been granted priority review by thein April 2013 received FDA for approval of this drug for opioid-induced constipation. A Nektar Therapeutics-AstraZeneca PLC collaboration is conducting phase 3 efficacy and safety studiesThe FDA has also recently accepted for review, with a PDUFA date of September 14, 2014, an NDA for Naloxegol, an oral peripheral mu-opioid receptor antagonist infor patients with OIC andbeing developed by a Nektar Therapeutics-AstraZeneca PLC collaboration, which also has a related combination product in early stage development. Shionogi & Co. is developing Naldemedine, another mu-opioid receptor antagonist, for patients with OIC. Theravance, Inc. has completed phase 2 clinical testing of an oral peripheral mu-opioid antagonist. In Europe, Mundipharma International Limited markets TARGIN® (oxycodone/naloxone), a combination of an opioid and a systemic opioid antagonist. Other prescription as well as over-the-counter (OTC) constipation products are also prescribed first line for OIC.
As to our oncology pipeline,, radiation and surgery are two traditional forms of treatment for prostate cancer.cancer. If the disease spreads, hormone (androgen) suppression therapy is often used to slow the cancer's progression, but this form of treatment can eventually become ineffective. We are aware of several competitors who are developing or have received approval for alternative treatments for castration-resistant prostate cancer, some of which are directed against PSMA, including Johnson & Johnson subsidiary Janssen Biotech, Inc.'s Zytiga® (abiraterone acetate), approved in 2011 for use in combination with prednisone as a second-line (after treatment with docetaxel) advanced prostate cancer treatment, and in December 2012later for use with prednisone for metastatic castration-resistant disease before the use of chemotherapy);chemotherapy; Medivation, Inc.'s Xtandi® (enzalutamide), approved in August 2012 for patients with metastatic castration-resistant prostate cancer previously treated with docetaxel; and Algeta ASA's Alpharadin® (radium-223 chloride)dichloride) (marketed as Xofigo®), submitted in late 2012 for marketing authorization for therapy of bone metastases in prostate cancer patients. A competitive product to MIP-14041404 is Jazz Pharmaceuticals' ProstaScint®, which is approved for detection of metastatic prostate cancer or relapsed or high-risk prostate cancer patients.
A significant amount of research in the biopharmaceutical field is carried out at academic and government institutions. An element of our research and development strategy has been to in-license technology and product candidates from academic and government institutions. These institutions are sensitive to the commercial value of their findings and pursue patent protection and negotiate licensing arrangements to collect royalties for use of technology they develop. They may also market competitive commercial products on their own or in collaboration with competitors and compete with us in recruiting highly qualified scientific personnel, which may result in increased costs or decreased availability of technology or product candidates from these institutions to other industry participants.
Competition with respect to our technologies and products is based on, among other things, product efficacy, safety, reliability, method of administration, availability, price and clinical benefit relative to cost; timing and scope of regulatory approval; sales, marketing and manufacturing capabilities; collaborator capabilities; insurance and other reimbursement coverage; and patent protection. Competitive position in our industry also depends on a participant's ability to attract and retain qualified personnel, obtain patent protection or otherwise develop proprietary products or processes, and secure sufficient capital resources for the typically substantial period between technological conception and commercial sales.
Product Liability
The testing, manufacturing and marketing of our product candidates and products involves an inherent risk of product liability attributable to unwanted and potentially serious health effects. To the extent we elect to test, manufacture or market product candidates and products independently, we bear the risk of product liability directly. We maintain product liability insurance coverage in the amount of $10.0 million per occurrence, subject to a deductible and a $10.0 million aggregate limitation. Where local statutory requirements exceed the limits of our existing insurance or local policies of insurance are required, we maintain additional clinical trial liability insurance to meet these requirements. This insurance is subject to deductibles and coverage limitations. The availability and cost of maintaining insurance may change over time.
Human Resources
At December 31, 2012,2013, we had 7669 full-time employees, 1512 of whom hold Ph.D. degrees and one antwo of whom hold M.D. degree.degrees. At that date, 5749 employees were engaged in research and development, medical, regulatory affairs and manufacturing related activities and 1920 were engaged in finance, legal, administration and business development. We consider our relations with our employees to be good. None of our employees is covered by a collective bargaining agreement.
The future of our business and operations depends on the success of our Relistor collaborations and our oncology research and development programs, including the programs and product candidates we have recently acquired in the Molecular Insight transaction.programs.
Our business and operations entail a variety of serious risks and uncertainties and are inherently risky. The research and development programs on which we focus including those we have recently acquired in the Molecular Insight transaction, involve novel approaches to human therapeutics. Our principal product candidates including those we have recently acquired as part of MIP, are in pre-clinical or clinical development, and in some respects involve technologies with which we have limited prior experience. We are subject to the risks of failure inherent in the development of product candidates based on new technologies. There is little precedent for the successful commercialization of products based on our technologies, and there are a number of technological challenges that we must overcome to complete most of our development efforts. We may not be able successfully to develop further any of our product candidates. We and our Relistor and other collaborators must successfully complete clinical trials and obtain regulatory approvals for potential commercial products. Once approved, if at all, commercial product sales are subject to general and industry-specific local and international economic, pressures such as those experienced worldwide over the recent past. With our strategyregulatory, technological and policy developments and trends. The oncology space in which we operate presents numerous significant risks and uncertainties that may be expected to focus on oncology research and development, these risks continue to be significant and may increase to the extent the oncology spaceit becomes more competitive or less favored in the commercial healthcare marketplace.
We are dependent on Salix, Ono and other business partners to develop and commercialize Relistor, exposing us to significant risks.
We rely on Salix to complete development and obtain regulatory approvals for additional formulations of and indications for Relistor and, in the Japanese market, we rely on Ono to conduct clinical trials and obtain regulatory approvals. We are and will be dependent upon Salix, Ono and any other business partners with which we may collaborate in the future to perform and fund development, including clinical testing of Relistor, make related regulatory filings and manufacture and market products, including for new indications and in new formulations, in their respective territories. Revenue from the sale of Relistor depends entirely upon the efforts of Salix and its sublicensees, which have significant discretion in determining the efforts and resources they apply to sales of Relistor. Ono will have similar discretion with respect to sales in Japan. Neither may be effective in obtaining approvals for new indications or formulations, marketing existing or future products or arranging for necessary sublicense or distribution relationships. Our business relationships with Salix, Ono and other partners may not be scientifically, clinically or commercially successful. For example, Salix has a variety of marketed products. Salix is not, however, a large diversified pharmaceutical company and does not have resources commensurate with such companies. Salix has its own corporate objectives, which may not be consistent with our best interests, and may change its strategic focus or pursue alternative technologies in a manner that results in reduced or delayed revenue to us. Changes of this nature might also occur if Salix were acquired or if its management changed. We may have future disagreements with Salix or Ono, both of which have significantly greater financial and managerial resources which either could draw upon in the event of a dispute. Such disagreements could lead to lengthy and expensive litigation or other dispute-resolution proceedings as well as extensive financial and operational consequences to us and have a material adverse effect on our business, results of operations and financial condition. In addition, independent actions may be taken by Salix and/or Ono concerning product development, marketing strategies, manufacturing and supply issues, and rights relating to intellectual property, including, as discussed below, Relistor's path forward in light of the July 2012 Complete Response Letter from the FDA. For example,
As noted elsewhere in this document, Progenics in October 2013 commenced an arbitration with Ono under the provisions of the parties' License Agreement for development and commercialization of subcutaneous Relistor in Japan, following a communication from Ono that it has determined to discontinue development because of "commercial concerns" that Ono contends would permit it to cease development and terminate the Agreement. Ono's discontinuation of development and/or protracted dispute resolution proceedings could result in reduced or delayed, or in the elimination of, milestone and/or royalty revenue from subcutaneous Relistor development in Japan. Under our License Agreement with Salix, in the event our Agreement with Ono terminates or rights thereunder otherwise revert to Progenics, the Salix Agreement automatically without payment by Salix extends to the license grants, territory and other rights provided in the Ono Agreement, as a result of which Salix and not Progenics would receive such rights.
As a result of the FDA's Complete Response Letter on Relistor for chronic pain, the Relistor program may be discontinued or otherwise at risk.
As previously announced, and noted elsewhere in this document, the FDA in July 2012 issued a Complete Response Letter in response to Salix's supplemental New Drug Application for Relistor for the treatment of OIC in adult patients with chronic, non-cancer pain. This development may result in Salix and/or Ono taking independent actions concerning product development, marketing strategies or other matters for Relistor, including termination of their efforts to develop and commercialize the drug. At an End-of-Review meeting in October 2012, the FDA's Division of Gastroenterology and Inborn Errors Products has expressed a concern that there may be a risk associated with the chronic use of mu-opioid receptor antagonists in patients who are taking opioids for chronic pain, and, in order to understand this potential risk, the Division communicated that a very large, well-controlled, chronic administration trial will have to be conducted to assess the safety of any mu-opioid receptor antagonist prior to market approval for the treatment of patients with OIC who are taking opioids for chronic, non-cancer pain. In addition, the FDA informed Salix and Progenics in June 2013 that it will seek input from an Advisory Committee, which is now expected to convene in the near future, and at that time expressed our belief that some of the areas being considered for discussion during the meeting would include the potential for drugs in Relistor's class to cause withdrawal symptoms; the strength of a potential cardiovascular signal seen with another drug in this class of drugs and the available safety data with Relistor in regards to a potential cardiovascular signal; and the need and timing (pre-approval vs. post-approval) of major adverse cardiac events (MACE) studies with drugs of this class.
Salix has disclosed in regulatory filings that it might terminate its development program for Relistor subcutaneous injection for treatment of OIC in chronic non-cancer pain patients, and that additional information and additional guidance from the FDA could result in the termination of its oral OIC Relistor development program. As noted in our risk factor on regulatory approvals below, if clinical trials indicate, or regulatory bodies are concerned about, actual or possible serious problems with the safety or efficacy of a product candidate, such as the concerns expressed in the FDA's CRL and as described above, we or our collaborators may stop or significantly slow development or commercialization of affected products. As a result of such concerns, the development programs for subcutaneous and/or oral Relistor for chronic, non-cancer pain patients may be significantly delayed or terminated altogether. In such an event, we could be faced with either further developing and commercializing the drug on our own or with one or more substitute collaborators, either of which paths would subject us to the development, commercialization, collaboration and/or financing risks discussed in these risk factors. Any such significant action adverse to development and commercialization of Relistor could have a material adverse impact on our business, and on the price of our stock.
We are subject to extensive regulation, which can be costly and time consuming, may not lead to marketing approval for our product candidates, and can subject us to unanticipated fineslimitations, restrictions, delays and delays.fines.
Our business, products and product candidates are subject to comprehensive regulation by the FDA and comparable authorities in other countries. These agencies and other entities regulate the pre-clinical and clinical testing, safety, effectiveness, approval, manufacture, labeling, marketing, export, storage, recordkeeping, advertising, promotion and other aspects of our products and product candidates. We cannot guarantee that approvals of product candidates, processes or facilities will be granted on a timely basis, or at all. If we experience delays or failures in obtaining approvals, commercialization of our product candidates will be slowed or stopped.
For example, as described in Business – Clinical Trial Activities, in clinical studies of one of our principal product candidates, PSMA ADC, investigators have reported serious adverse events (SAEs), including three deaths, in a small proportion of patients treated with the drug. Based on data currently available to us, the Company is continuing development of PSMA ADC and has not determined what effects, if any, treatment-related SAEs reported to date or that may be reported in the future may have on the development of PSMA ADC going forward. If, however, we, together with or independently of investigators participating in our clinical trials, or regulators evaluating PSMA ADC were to determine that this candidate cannot safely be administered to patients with sufficient therapeutic effect, we may determine to attempt to reformulate or otherwise change the candidate and/or its administration to alleviate such concerns, which could result in costs and delays that could impair the value of the candidate. If such costs and delays were sufficiently large, we could determine to abandon the PSMA ADC program. Concerns about the safety and/or efficacy of PSMA ADC could also make it more difficult or impossible for us to enter into licensing, collaboration or other arrangements with third parties for further development and commercialization of PSMA ADC. Any of these possibilities could have material adverse effects on Progenics' business, its financial condition, and/or the price of our stock.
Even if we obtain regulatory approval for a product candidate, the approval may include significant limitations on indicated uses for which the product could be marketed or other significant marketing restrictions, such as a Risk Evaluation and Mitigation Strategy (REMS). For example, Relistor is only approved for OIC in patients with advanced illness and not for chronic, non-cancer pain.pain, and our product candidates, if approved at all, may be subject to those or other such limitations and restrictions.
If we or our collaborators violate regulatory requirements at any stage, whether before or after marketing approval is obtained, we or they may be subject to forced removal of a product from the market, product seizure, civil and criminal penalties and other adverse consequences. Under our license agreement with Salix, we are dependent on Salix for compliance with these regulatory requirements as they apply to Relistor. Salix has disclosed that in February 2013 it received a subpoena from the U.S. Attorney's Office for the Southern District of New York requesting documents regarding its sales and promotional practices for Relistor and certain of its other products, that it is in the process of responding to the subpoena and intends to cooperate fully with the subpoena and related government investigation, which has and will continue to increase its legal expenses, and might require management time and attention, and that at the time of its disclosure it cannot predict or determine the timing or outcome of the inquiry or its impact on Salix's financial condition or results of operations, and that the laws and regulations regarding off-label promotion and the authorities' interpretation of them might increase its expenses, impair its ability to effectively market its products, and limit its revenue.operations.
Our products may face regulatory, legal or commercial challenges even after approval.
Even if a product receives regulatory approval:
| · | It might not obtain labeling claims necessary to make the product commercially viable (in general, labeling claims define the medical conditions for which a drug product may be marketed, and are therefore very important to the commercial success of a product), or may be required to carry Boxed or other warnings that adversely affect its commercial success. |
| · | Approval may be limited to uses of the product for treatment or prevention of diseases or conditions that are relatively less financially advantageous to us than approval of greater or different scope or subject to an FDA-imposed REMS that imposes limits on the distribution or use of the product. |
| · | Side effects (including different or aggravated effects such as SAEs encountered in our PSMA ADC program) identified after the product is on the market might hurt sales or result in mandatory safety labeling changes, additional pre-clinical testing or clinical trials, imposition of a REMS, product recalls or withdrawals from the market. |
| · | Efficacy or safety concerns (including those arising from SAEs heretofore or hereafter encountered in our PSMA ADC program) regarding a marketed product, or manufacturing or other problems, may lead to a recall, withdrawal of marketing approval, reformulation of the product, additional pre-clinical testing or clinical trials, changes in labeling, imposition of a REMS, the need for additional marketing applications, declining sales or other adverse events. These potential consequences may occur whether or not the concerns originate from subsequent testing or other activities by us, governmental regulators, other entities or organizations or otherwise, and whether or not they are scientifically justified. If products lose previously received marketing and other approvals, our business, results of operations and financial condition would be materially adversely affected. |
We or our collaborators will be subject to ongoing FDA obligations and continuous regulatory review, and might be required to undertake post-marketing trials to verify the product's efficacy or safety or other regulatory obligations.
Competing products in development may adversely affect acceptance of our products.
We are aware of a number of products and product candidates described in this Annual Report under Business – Competition which compete or may potentially compete with Relistor. Any of these approved products or product candidates, or others which may be developed in the future may achieve a significant competitive advantage relative to Relistor, and, in any event, the existing or future marketing and sales capabilities of these competitors may impair Salix's and/or Ono's ability to compete effectively in the market.
We are also aware of competitors, including those described under Business – Competition, which are developing alternative treatments for disease targets to which our research and development programs are directed, any of which – or others which may be developed in the future – may achieve a significant competitive advantage relative to any product we may develop.
Developing product candidates including those we have acquired in the Molecular Insight transaction, will require us to obtain additional financing. Our access to capital funding is uncertain.
We expect to continue to incur significant development expenditures for our product candidates, and such expenditures will increase as a result of the Molecular Insight acquisition.candidates. We do not have committed external sources of funding for most of these projects. Our expenditures will be funded from cash on hand, or we may seek additional external funding for them, most likely through collaborative, license or royalty financing agreements with one or more pharmaceutical or other companies and equity securities issuances in public offerings, private placements or through our January 2014 Sales Agreement with Cantor Fitzgerald & Co., pursuant to which we may sell from time to time up to $50 million of our stock. We may also seek capital through debt financings or government grants or contracts. To the extent we raise additional capital by issuing equity securities in the future, existing stockholders could experience substantial dilution in addition to the dilution experienced as a result of our recent equity offeringofferings and the Molecular Insight acquisition, and new investors could have rights superior to existing stockholders.stockholders, if securities other than common stock were to be issued. Any debt financing that we are able to obtain may involve operating covenants that restrict our business and significant repayment obligations. To the extent that we raise additional funds through any new collaboration and licensing arrangements, we may be required to relinquish some rights to our technologies or product candidates, or grant licenses on terms that are not favorable to us.
We cannot predict when we will need additional funds, how much we will need, the form any financing may take or whether additional funds will be available at all, especially in light of current conditions in global credit and financial markets. Our need for future funding will depend on numerous factors, such as the availability of new product development projects; the achievement of events identified in our collaboration agreements that trigger payments to us from our collaboration partners, most of which are out of our control and rely entirely on the efforts of our partners; the progress and success of clinical trials and pre-clinical activities (including studies and manufacture of materials) of our product candidates conducted by our collaborators or us; the progress of research programs carried out by us; any changes in the breadth of our research and development programs; the progress of the research and development efforts of our collaborators; our ability to acquire or license other technologies or compounds that we seek to pursue; competing technological and market developments; the costs and timing of obtaining, enforcing and defending our patent and intellectual property rights; the costs and timing of regulatory approvals and filings by us and our collaborators; our ability to manage our growth; and any unforeseen litigation. These factors may be more important with respect to product candidates and programs that involve technologies with which we have limited prior experience, such as those we have acquired in theoriginally developed by Molecular Insight transaction.Insight. Insufficient funds may require us to delay, scale back or eliminate some or all of our research and development programs, to lose rights under existing licenses or to relinquish greater or all rights to product candidates at an earlier stage of development or on less favorable terms than we would otherwise choose or may adversely affect our ability to operate as a going concern. We may not be able at the necessary time to obtain additional funding on acceptable terms, or at all. Our inability to raise additional capital on terms reasonably acceptable to us would seriously jeopardize our business.
If we are unable to negotiate collaboration agreements, our cash burn rate could increase and our rate of product development could decrease.
Our ability to generate revenue in the near term depends on the timing of achievement, if any, of certain payment triggering events under our existing collaboration agreements and our ability to enter into additional collaboration agreements with third parties. We may not be successful in negotiating additional collaboration arrangements with pharmaceutical and biotechnology companies to develop and commercialize product candidates and technologies. If we do not enter into new collaboration arrangements, we would have to devote more of our resources to clinical product development and product launch activities the volume of which will increase as we continue research and development of candidates and programs acquired in the Molecular Insight transaction, and to seeking additional sources of capital to fund those activities. If we were not successful in seeking such capital, our cash burn rate would increase or we would need to take steps to reduce our rate of product development. Our ability to enter into new collaborations may be dependent on many factors, such as the results of clinical trials, competitive factors and the fit of our programs with the risk tolerance of a potential collaborator, including in relation to regulatory issues, the patent portfolio, the clinical pipeline, the stage of the available data, overall corporate goals and financial position. If we are not able to generate revenue under our collaborations when and in accordance with our expectations or the expectations of industry analysts, this failure could harm our business and have an immediate adverse effect on the trading price of our common stock.
Drug development is a long and inherently uncertain process with a high risk of failure at every stage of development.
Drug development is a highly uncertain scientific and medical endeavor, and failure can unexpectedly occur at any stage of clinical development. Typically, there is a high rate of attrition for product candidates in preclinical and clinical trials due to scientific feasibility, safety, efficacy, changing standards of medical care and other variables. The risk of failure increases for our product candidates that are based on new technologies, as well as technologies with which we have limited prior experience, such as those we have acquired in theoriginally developed by Molecular Insight transaction.Insight. Pre-clinical studies and clinical trials are long, expensive and highly uncertain processes that can take many years. It will take us, or our collaborators, several years to complete clinical trials and the time required for completing testing and obtaining approvals is uncertain. The start or end of a clinical trial is often delayed or halted due to changing regulatory requirements, manufacturing challenges, required clinical trial administrative actions, slower than anticipated patient enrollment, changing standards of care, availability or prevalence of use of a comparator drug or required prior therapy, clinical outcomes, or our and our partners' financial constraints. The FDA and other U.S. and foreign regulatory agencies have substantial discretion, at any phase of development, to terminate clinical trials, require additional clinical development or other testing, delay or withhold registration and marketing approval and mandate product withdrawals, including recalls. Results attained in early human clinical trials may not be indicative of results in later clinical trials. In addition, many of our investigational or experimental drugs are at an early stage of development, and successful commercialization of early stage product candidates requires significant research, development, testing and approvals by regulators, and additional investment. Our products in the research or pre-clinical development stage may not yield results that would permit or justify clinical testing. Our failure to demonstrate adequately the safety and efficacy of a product under development would delay or prevent marketing approval, which could adversely affect our operating results and credibility. The failure of one or more of our product candidates could have a material adverse effect on our business, financial condition and results of operations.
If we or our collaborators do not obtain regulatory approval for our product candidates on a timely basis, or at all, or if the terms of any approval impose significant restrictions or limitations on use, our business, results of operations and financial condition will be adversely affected. Setbacks in clinical development programs could have a material adverse effect on our business.
Regulatory approvals are necessary to market product candidates and require demonstration of a product's safety and efficacy through extensive pre-clinical and clinical trials. We or our collaborators may not obtain regulatory approval for product candidates on a timely basis, or at all, and the terms of any approval (which in some countries includes pricing approval) may impose significant restrictions, limitations on use or other commercially unattractive conditions. We, our collaborators or regulators may also amend, suspend or terminate clinical trials if we or they believe that the participating subjects are being exposed to unacceptable health risks, and after reviewing trial results, we or our collaborators may abandon projects which we previously believed to be promising for commercial or other reasons unrelated to patient risks. During this process, we may find, for example, that results of pre-clinical studies are inconclusive or not indicative of results in human clinical trials, clinical investigators or contract research organizations do not comply with protocols or applicable regulatory requirements, or that product candidates do not have the desired efficacy or have undesirable side effects or other characteristics that preclude marketing approval or limit their potential commercial use if approved. In such circumstances, the entire development program for that product candidate could be adversely affected, resulting in delays in trials or regulatory filings for further marketing approval and a possible need to reconfigure our clinical trial programs to conduct additional trials or abandon the program involved. Conducting additional clinical trials or making significant revisions to a clinical development plan would lead to delays in regulatory filings. If clinical trials indicate, or regulatory bodies are concerned about, actual or possible serious problems with the safety or efficacy of a product candidate, such as the concerns expressed in the FDA's July 2012 Complete Response Letter or during consideration of the oral Relistor development program, we or our collaborators may stop or significantly slow development or commercialization of affected products. As a result of such concerns, the development programs for subcutaneous and/or oral Relistor for chronic, non-cancer pain patients may be significantly delayed or terminated altogether.
Even if we agree to a path forward with Salix and the FDA, if the results of any future Relistor trials are not satisfactory or we or our collaborators encounter problems enrolling subjects, clinical trial supply issues, setbacks in developing drug formulations, including raw material-supply, manufacturing, stability or other difficulties, or issues complying with protocols or applicable regulatory requirements, the entire development program for Relistor could be adversely affected in a material manner. Such scenarios could also befall our other clinical-stage product candidates. If any of our collaborators breach or terminate its agreement with us or otherwise fail to conduct successfully and in a timely manner the collaborative activities for which they are responsible, the preclinical or clinical development or commercialization of the affected product candidate or research program could be delayed or terminated. We generally do not control the amount and timing of resources that our collaborators devote to our programs or product candidates. We also do not know whether current or future collaboration partners, if any, might pursue alternative technologies or develop alternative products either on their own or in collaboration with others, including our competitors, as a means for developing treatments for the diseases or conditions targeted by our collaborative arrangements. Setbacks of these types could have a material adverse effect on our business, results of operations and financial condition.
We or our collaborators must design and conduct successful clinical trials for our product candidates to obtain regulatory approval. We rely on third parties for conduct of clinical trials, which reduces our control over them and may expose us to conflicts of interest. Clinical trial results may be unfavorable or inconclusive, and often take longer than expected.
We have limited experience in conducting clinical trials, and we rely on or obtain the assistance of others to design, conduct, supervise or monitor some or all aspects of some of our clinical trials, including our ongoing phase 2 trialtrials of PSMA ADC.ADC and 1404. We have less control over the timing and other aspects of clinical trials for which we rely on third parties, such as CROs, clinical data management organizations, medical institutions or clinical investigators, than if we conducted them entirely on our own. These third parties may also have relationships with other entities, some of which may be our competitors. In all events, we are responsible for ensuring that each of our clinical trials is conducted in accordance with the general investigational plan and protocols for the trial. The FDA requires us to comply with good clinical practices for conducting and recording and reporting the results of clinical trials to assure that data and reported results are credible and accurate and that the rights, integrity and confidentiality of trial participants are protected. Our reliance on third parties that we do not control does not relieve us of these responsibilities and requirements.
To obtain regulatory approval of drug candidates, we must demonstrate through preclinical studies and clinical trials that they are safe and effective. Adverse or inconclusive clinical trial results concerning any of our drug candidates, or trials which regulators find deficient in scope, design or one or more other material respects, could require additional trials, resulting in increased costs, significantlysignificant delays in submissions of approval applications, approvals in narrower indications than originally sought, or denials of approval, none of which we can predict. As a result, any projections that we publicly announce of commencement and duration of clinical trials are not certain. We have experienced clinical trial delays in the past as a result of slower than anticipated enrollment and such delays may recur. Delays can be caused by, among other things, deaths or other adverse medical events; regulatory or patent issues; interim or final results of ongoing clinical trials; failure to enroll clinical sites as expected; competition for enrollment from other clinical trials; scheduling conflicts with participating clinicians and institutions; disagreements, disputes or other matters arising from collaborations; our inability to obtain necessary funding; or manufacturing problems.
Under our license agreement, Salix generally has responsibility for conducting Relistor clinical trials, including all trials outside of the U.S. other than Japan, where Ono has the responsibility for clinical trials.that responsibility. In addition, certain clinical trials for our product candidates may be conducted by government-sponsored agencies, and consequently will be dependent on governmental participation and funding. These arrangements expose us to the same considerations we face when contracting with third parties for our own trials.
Our product candidates may not obtain regulatory approvals needed for marketing.
None of our product candidates, other than Relistor for the treatment of OIC in patients with advanced illnesses, has been approved by applicable regulatory authorities for marketing. The process of obtaining FDA and foreign regulatory approvals often takes many years and can vary substantially based upon the type, complexity and novelty of the products involved. We have had only limited experience in filing and pursuing applications and other submissions necessary to gain marketing approvals. Products under development may never obtain marketing approval from the FDA or other regulatory authorities necessary for commercialization.
Even if our product candidates obtain marketing approval, our ability to generate revenue will be diminished if our products are not accepted in the marketplace or our collaboration partners fail to obtain acceptable prices or an adequate level of reimbursement for products from third-party payors or government agencies.
The commercial success of our products will depend upon their acceptance by the medical community and third-party payors as clinically useful, cost effective and safe. Market acceptance of approved products, such as Relistor for patients with advanced illnesses, is affected by the timing of regulatory approvals, product launches and reimbursement programs for existing and expanded uses or generic, over-the-counter or other competitors; price increases for the product and relative prices of competing products; product development efforts for new indications; availability of sufficient commercial quantities of the product; success in arranging for necessary sublicense or distribution relationships; and general and industry-specific local and international economic pressures such as those experienced worldwide over the last five years. If health care providers believe that patients can be managed adequately with alternative, currently available therapies, they may not prescribe our products, especially if the alternative therapies are viewed as more effective, as having a better safety or tolerability profile, as being more convenient to the patient or health care providers or as being less expensive. Third- partyThird-party insurance coverage may not be available to patients for any products we develop, alone or with collaborators. For pharmaceuticals administered in an institutional setting, the ability of the institution to be adequately reimbursed from government and health administration authorities, private health insurers and other third-party payors could also play a significant role in demand for our products. Significant uncertainty exists as to the reimbursement status of newly-approved pharmaceuticals. Government and other third-party payors increasingly are attempting to contain healthcare costs by limiting both coverage and the level of reimbursement for new drugs and by refusing, in some cases, to provide coverage for uses of approved products for indications for which the FDA has not granted labeling approval. In some foreign markets, pricing and profitability of prescription pharmaceuticals are subject to government control. In the U.S., we expect that there will continue to be a number of federal and state proposals to implement similar government control and that the emphasis on managed care in the U.S. will continue to put pressure on the pricing of pharmaceutical products. Cost control initiatives could decrease the price that our collaborators receive for any products in the future and adversely affect the ability of our collaborators to commercialize our products and our realization of royalties from commercialization. If any of our products do not achieve market acceptance, we will likely lose our entire investment in that product.
Marketplace acceptance depends in part on competition in our industry, which is intense, and competing products in development may adversely affect acceptance of our products.
The extent to which any of our products achieves market acceptance will depend on competitive factors. Competition in the biopharmaceutical industry is intense and characterized by ongoing research and development and technological change. We face competition from many for-profit companies and major universities and research institutions in the U.S. and abroad. We face competition from companies marketing existing products or developing new products for diseases and conditions targeted by our technologies. We are aware of a number of products and product candidates, including those described in this Annual Report under Business – Competition, which compete or may potentially compete with Relistor, PSMA ADC or our other product candidates. For instance, there are product candidates in pre-clinical or clinical development that target the side effects of opioid pain therapy, and a marketed product for the treatment of post-operative ileus could compete with Relistor. We are aware of several competitors, including those described under Business – Competition, which have received approval for or are developing alternative treatments or diagnostics for castration-resistant prostate cancer, some of which are directed against PSMA, MIP-1404 and our other product candidates.PSMA. Any of these competing approved products or product candidates, or others which may be developed in the future, may achieve a significant competitive advantage relative to Relistor, PSMA ADC, 1404, Azedra, MIP-1095 or any of our other product candidates.
Competition with respect to our technologies and products is based on, among other things, product efficacy, safety, reliability, method of administration, availability, price and clinical benefit relative to cost; timing and scope of regulatory approval; sales, marketing and manufacturing capabilities; collaborator capabilities; insurance and other reimbursement coverage; and patent protection. Competitive disadvantages in any of these factors could materially harm our business and financial condition. Many of our competitors have substantially greater research and development capabilities and experience and greater manufacturing, marketing, financial and managerial resources than we do. These competitors may develop products that are superior to those we are developing and render our products or technologies non-competitive or obsolete. Our products and product candidates under development may not compete successfully with existing products or product candidates under development by other companies, universities and other institutions. Drug manufacturers that are first in the market with a therapeutic for a specific indication generally obtain and maintain a significant competitive advantage over later entrants and therefore, the speed with which industry participants move to develop products, complete clinical trials, approve processes and commercialize products is an important competitive factor. If our product candidates receive marketing approval but cannot compete effectively in the marketplace, our operating results and financial position would suffer.
If we or our collaborators are unable to obtain sufficient quantities of the raw and bulk materials needed to make our product candidates or Relistor, development of our product candidates or commercialization of our approved product could be slowed or stopped.
Salix or Ono may not be able to fulfill manufacturing obligations for Relistor, a key raw material for which grows in Tasmania, either on their own or through third-party suppliers. A delay or disruption of supplies of Relistor would have a material adverse effect on the Relistor franchise, and therefore on our business as a whole. Our existing arrangements with suppliers for our other product candidates may not result in the supply of sufficient quantities of our product candidates needed to accomplish our clinical development programs, and we may not have the right and in any event do not currently have the capability to manufacture these products if our suppliers are unable or unwilling to do so. We currently arrange for supplies of critical raw materials used in production of our product candidates from single sources. We do not have long-term contracts with any of these suppliers. Any delay or disruption in the availability of raw materials would slow or stop product development and commercialization of the relevant product.
Manufacturing resources could limit or adversely affect our ability to commercialize products.
We or our collaborators engage third parties to manufacture our approved product and product candidates. We or our collaborators may not be able to obtain adequate supplies from third-party manufacturers in a timely fashion for development or commercialization purposes, and commercial quantities of products may not be available from contract manufacturers at acceptable costs. Under our license agreement with Salix, Salix is responsible for obtaining supplies of Relistor, including contracting with contract manufacturing organizations (CMOs) for supply of Relistor active pharmaceutical ingredient (API) and subcutaneous and oral finished drug product. These arrangements may not be on terms that are advantageous and, as a result of our royalty and other interests in Relistor's commercial success, will subject us to risks that the counterparties may not perform optimally in terms of quality or reliability. In engaging third parties for these activities, we do not control many aspects of the manufacturing process, including compliance with current Good Manufacturing Practices (cGMP) and other regulatory requirements. In order to commercialize our product candidates successfully, we or our collaborators need to be able to manufacture or arrange for the manufacture of products in commercial quantities, in compliance with regulatory requirements, at acceptable costs and in a timely manner. Manufacture of our product candidates can be complex, difficult to accomplish even in small quantities, difficult to scale-up for large-scale production and subject to delays, inefficiencies and low yields of quality products. The cost of manufacturing some of our product candidates may make them prohibitively expensive. If adequate supplies of any of our product candidates or related materials are not available on a timely basis or at all, our clinical trials could be seriously delayed, since these materials are time consuming to manufacture and cannot be readily obtained from third-party sources. If we were to decide to establish a commercial-scale manufacturing facility in the future, we would require substantial additional funds and be required to hire and train significant numbers of employees and comply with applicable regulations.
Failure of any manufacturer of Relistor or our product candidates to comply with applicable regulatory requirements could subject us to penalties and have a material adverse effect on supplies of our product or products candidates.
Third-party manufacturers are required to comply with cGMPscGMP or similar regulatory requirements outside of the U.S. If manufacturers of our product or product candidates cannot successfully manufacture material that conforms to the strict regulatory requirements of the FDA and any applicable foreign regulatory authority, they may not be able to obtain any required approval for their manufacturing facilities. If these facilities are not approved for commercial manufacture, we may need to find alternative manufacturing facilities, which could result in delays of several years in obtaining approval for a product candidate. We do not control the manufacturing process and are completely dependent on our third-party manufacturing partners or contractors for compliance with the applicable regulatory requirements for the manufacture of Relistor and our product candidates. Manufacturers are subject to ongoing periodic unannounced inspections by the FDA and corresponding state and foreign agencies for compliance with cGMPscGMP and similar regulatory requirements. Failure of any manufacturer of Relistor or any of our product candidates to comply with applicable cGMPscGMP or other regulatory requirements could result in sanctions being imposed on our collaborators or us, including fines, injunctions, civil penalties, delays, suspensions or withdrawals of approvals, operating restrictions, interruptions in supply and criminal prosecutions, any of which could significantly and adversely affect supplies of Relistor or such product candidate and have a material adverse impact on our business, financial condition and results of operations.
We are dependent on patents and other intellectual property rights.
The validity, enforceability and commercial value of theseour patents and other intellectual property rights are highly uncertain.
We own or have direct or sub-licenses to a number of issued patents. We must obtain, maintain and enforce patent and other rights to protect our intellectual property. The patent position of biotechnology and pharmaceutical firms is highly uncertain and involves many complex legal and technical issues. There are many laws, regulations and judicial decisions that dictate and otherwise influence the manner in which patent applications are filed and prosecuted and in which patents are granted and enforced.enforced, all of which are subject to change from time to time. There is no clear policy involving the breadth of claims allowed, or the degree of protection afforded, under patents in this area. In addition, we are aware of others who have patent applications or patents containing claims similar to or overlapping those in our patents and patent applications. Accordingly, patent applications owned by or licensed to us may not result in patents being issued. Even in relation to an issued patent thatif we own or license a relevant issued patent, we may not be able us to preclude competitors from commercializing drugs and consequentlythat may compete directly with one or more of our products or product candidates, in which event such rights may not provide us with any meaningful competitive advantage. Patents also expire by law. For example, we and Salix have no patent protection outside the U.S. for subcutaneous Relistor, our approved product, although we do have regulatory data exclusivity which provides a competitive barrier to generic entry for limited periods of time. In the absence or upon expirationsuccessful challenge of patent protection, drugs may be subject to generic competition, which could adversely affect pricing and sales volumes of the affected products.
It is generally difficult to determine the relative strength or scope of a biotechnology or pharmaceutical patent position in absolute terms at any given time. The issuance of a patent is not conclusive as to its validity or enforceability, which can be challenged in litigation.litigation or via administrative proceedings. The license agreements from which we derive or out-license intellectual property provide for various royalty, milestone and other payment, commercialization, sublicensing, patent prosecution and enforcement, insurance, indemnification and other obligations and rights, and are subject to certain reservations of rights. While we generally have the right to defend and enforce patents licensed to or by us, either in the first instance or if the licensor or licensee chooses not to do so, we must usually bear the cost of doing so. Under our license agreement with Salix, Salix generally has the first right to control the defense and enforcement of our Relistor patents. With respect to Japan, Ono has certain limited rights to prosecute, maintain and enforce relevant intellectual property. We may incur substantial costs in litigation seeking to uphold the validity of patents or to prevent infringement. If the outcome of litigationa dispute or contest is adverse to us, third parties may be able to use our patented invention without payment to us. Third parties may also avoid our patents through design innovation.
In addition to uncertainties as to scope, validity, enforceability and changes in law, patents by law have limited lives. Upon expiration of patent protection, our drug candidates and/or products may be subject to generic competition, which could adversely affect pricing and sales volumes of the affected products.
With respect to PSMA ADC, currently issued composition-of-matter patents comprising co-owned and in-licensed properties have expiration ranges of 2022 to 2023 in the U.S. and 2022 to 2026 ex-U.S. Corresponding patent applications as well as patent applications directed to methods of use (except for the U.S. patent expiring in 2023) are pending worldwide, which if issued would have expiration ranges from 2022 to 2029. We view all of these patents as significant.
19
Owned and in-licensed properties relating to the 1404 product candidate have expiration ranges of 2020 to 2029; we view as most significant the composition-of-matter patent on the compound, as well as technetium-99 labeled forms, which expires in 2029. Additional U.S. patents are directed to various inventions relating to the product candidate, and corresponding patent applications are pending worldwide.
With regard to our Relistor-related intellectual property, the composition-of-matter patent for the active ingredient of Relistor, methylnaltrexone, was invented in the 1970's and has expired. The University, as well as Progenics and its collaborators, have extended the methylnaltrexone patent estate with additional patents and pending patent applications covering various inventions relating to the product. Salix has listed in the FDA Orange Book four U.S. patents relating to subcutaneous Relistor, which have expiration dates ranging from 2017 to 2030, and one patent (expiring in 2024) with Health Canada. A patent issued in September 2013 provides protection for the oral methylnaltrexone product until 2031.
We depend on intellectual property licensed from third parties and unpatented technology, trade secrets and confidential information. If we lose any of these rights, including by failing to achieve milestone requirements or to satisfy other conditions, or if they or data embodying or relevant to them are compromised by disruptions or breaches of information or data security, our business, results of operations and financial condition could be harmed.
Most of our product candidates, including Relistor, incorporate intellectual property licensed from third parties. For example, PSMA ADC utilizes technology licensed to us from Sloan-Kettering Institute for Cancer Research, through Cytogen Corporation, and Seattle Genetics.Genetics, Inc. We can lose the right to patents and other intellectual property licensed to us if the related license agreement is terminated due to a breach by us or otherwise. Our ability, and that of our collaboration partners, to commercialize products incorporating licensed intellectual property would be impaired if the related license agreements were terminated. In addition, we are required to make substantial cash payments, achieve milestones and satisfy other conditions, including filing for and obtaining marketing approvals and introducing products, to maintain rights under our intellectual property licenses. Due to the nature of these agreements and the uncertainties of research and development, we may not be able to achieve milestones or satisfy conditions to which we have contractually committed, and as a result may be unable to maintain our rights under these licenses. If we do not comply with our license agreements, the licensors may terminate them, which could result in our losing our rights to, and therefore being unable to commercialize, related products.
We also rely on unpatented technology, trade secrets and confidential information. Third parties may independently develop substantially equivalent information and techniques or otherwise gain access to our technology or disclose our technology, and we may be unable to effectively protect our rights in unpatented technology, trade secrets and confidential information. We require each of our employees, consultants and advisors to execute a confidentiality agreement at the commencement of an employment or consulting relationship with us. These agreements may, however, not provide effective protection in the event of unauthorized use or disclosure of confidential information. Any loss of trade secret protection or other unpatented technology rights could harm our business, results of operations and financial condition.
Progenics and other businesses and organizations worldwide, and in particular technology-intensive activities such as biotechnology research and development, are increasingly dependent on critical, complex and interdependent information technology systems, including Internet-based systems, to facilitate or perform basic research and development functions, business processes, internal and external communications, and other critical functions. Progenics relies on such systems for most aspects of its business. The size and complexity of computer, communications and other electronic networked data generation, storage and transfer systems make them potentially vulnerable to breakdown, malicious intrusion, computer viruses and data security breaches by unauthorized third parties, employees or others. Such events may permit unauthorized persons to access, misappropriate and/or destroy sensitive data and result in the impairment or disruption of important business processes, loss of trade secrets or other proprietary intellectual property or public exposure of personal information (including sensitive personal information) of employees, business partners, clinical trial patients, customers and others. Any of the foregoing could have a material adverse effect on our business, prospects, operating results, and financial condition.
If we do not achieve milestones or satisfy conditions regarding some of our product candidates, we may not maintain our rights under related licenses.
We are required to make substantial cash payments, achieve milestones and satisfy other conditions, including filing for and obtaining marketing approvals and introducing products, to maintain rights under our intellectual property licenses. Due to the nature of these agreements and the uncertainties of research and development, we may not be able to achieve milestones or satisfy conditions to which we have contractually committed, and as a result may be unable to maintain our rights under these licenses. If we do not comply with our license agreements, the licensors may terminate them, which could result in our losing our rights to, and therefore being unable to commercialize, related products.
If we infringe third-party patent or other intellectual property rights, we may need to alter or terminate a product development program.
There may be patent or other intellectual property rights belonging to others that require us to alter our products, pay licensing fees or cease certain activities. If our products infringe patent or other intellectual property rights of others, the owners of those rights could bring legal actions against us claiming damages and seeking to enjoin manufacturing and marketing of the affected products. If these legal actions are successful, in addition to any potential liability for damages, we could be required to obtain a license in order to continue to manufacture or market the affected products. We may not prevail in any action brought against us, and any license required under any rights that we infringe may not be available on acceptable terms or at all. We are aware of intellectual property rights held by third parties that relate to products or technologies we are developing. For example, we are aware of other groups investigating PSMA or related compounds, monoclonal antibodies directed at PSMA and targets relevant to PSMA ADC, and methylnaltrexone and other peripheral opioid antagonists, and of patents held, and patent applications filed, by these groups in those areas. While the validity of these issued patents, patentability of these pending patent applications and applicability of any of them to our programs are uncertain, if asserted against us, any related patent or other intellectual property rights could adversely affect our ability to commercialize our products.
Research, development and commercialization of a biopharmaceutical often requires choosing between alternative development and optimization routes at various stages in the development process. Preferred routes depend on subsequent discoveries and test results and cannot be predicted with certainty at the outset. There are numerous third-party patents in our field, and we may need to obtain a license under a patent in order to pursue the preferred development route of one or more of our products or product candidates. The need to obtain a license would decrease the ultimate profitability of the applicable product. If we cannot negotiate a license, we might have to pursue a less desirable development route or terminate the program altogether.
We are dependent upon third parties for a variety of functions. These arrangements may not provide us with the benefits we expect.
We rely on third parties to perform a variety of functions. We are party to numerous agreements which place substantial responsibility on clinical research organizations, consultants and other service providers for the development of our approved product and our product candidates. We also rely on medical and academic institutions to perform aspects of our clinical trials of product candidates. In addition, an element of our research and development strategy has been to in-license technology and product candidates from academic and government institutions in order to minimize investments in early research. We have entered into agreements under which we are now dependent on Ono and Salix for the commercialization and development of Relistor. We may not be able to maintain our relationships with them, or establish new ones for Relistor or other product candidates on beneficial terms. We may not be able to enter new arrangements without undue delays or expenditures, and these arrangements may not allow us to compete successfully. Moreover, if third parties do not successfully carry out their contractual duties, meet expected deadlines or conduct clinical trials in accordance with regulatory requirements or applicable protocols, our product candidates may not be approved for marketing and commercialization or such approval may be delayed. If that occurs, we or our collaborators will not be able, or may be delayed in our efforts, to commercialize our product candidates.
We lack sales and marketing infrastructure and related staff, which will require significant investment to establish and in the meantime may make us dependent on third parties for their expertise in this area.
We have no established sales, marketing or distribution infrastructure. If we receive marketing approval for a pharmaceutical product, significant investment, time and managerial resources will be required to build the commercial infrastructure required to market, sell and support it. Should we choose to commercialize a product directly, we may not be successful in developing an effective commercial infrastructure or in achieving sufficient market acceptance. Alternatively, we may choose to market and sell products through distribution, co-marketing, co-promotion or licensing arrangements with third parties. We may also consider contracting with a third party professional pharmaceutical detailing and sales organization to perform the marketing function for one or more products. To the extent that we enter into distribution, co-marketing, co-promotion, detailing or licensing arrangements for the marketing and sale of product candidates, any revenues we receive will depend primarily on the efforts of third parties. We will not control the amount and timing of marketing resources these third parties devote to our products.
We are exposed to product liability claims, and in the future may not be able to obtain insurance against claims at a reasonable cost or at all.
Our business exposes us to product liability risks, which are inherent in the testing, manufacturing, marketing and sale of pharmaceutical products. We may not be able to avoid product liability exposure. If a product liability claim is successfully brought against us, our financial position may be adversely affected. Under our license agreement with Salix, we are responsible for product liability claims arising out of clinical trials that were conducted under our supervision. We are indemnified by Salix under our license agreement with Salix for product liability exposure arising from its marketing and sales of Relistor, and maintain our own product liability insurance coverage in the amount of $10.0 million per occurrence, subject to a deductible and a $10.0 million annual aggregate limitation and other clinical trial or other insurance as required by contract and local laws. Pursuant to our transition agreement with Wyeth Pharmaceuticals, Inc., we released Wyeth from its indemnification responsibility for product liability exposure arising from its marketing and sales of Relistor. Product liability insurance for the biopharmaceutical industry is generally expensive, when available at all, and may not be available to us at a reasonable cost in the future. Our current insurance coverage and indemnification arrangements may not be adequate to cover claims brought against us, and are in any event subject to the insuring or indemnifying entity discharging its obligations to us.
We handle hazardous materials and must comply with environmental laws and regulations, which can be expensive and restrict how we do business. If we are involved in a hazardous waste spill or other accident, we could be liable for damages, penalties or other forms of censure.
Our research and development work and manufacturing processes involve the use of hazardous, controlled and radioactive materials. We are subject to federal, state and local laws and regulations governing the use, manufacture, storage, handling and disposal of these materials. Despite procedures that we implement for handling and disposing of these materials, we cannot eliminate the risk of accidental contamination or injury. In the event of a hazardous waste spill or other accident, we could be liable for damages, penalties or other forms of censure. We may be required to incur significant costs to comply with environmental laws and regulations in the future.
If we lose key management and scientific personnel on whom we depend, our business could suffer.
We are dependent upon our key management and scientific personnel, the loss of whom could require us to identify and engage qualified replacements, and could cause our management and operations to suffer in the interim. Competition for qualified employees among companies in the biopharmaceutical industry is intense. Future success in our industry depends in significant part on the ability to attract, retain and motivate highly skilled employees, which we may not be successful in doing.
Heath care reform measures could adversely affect our operating results and our ability to obtain marketing approval of and to commercialize our product candidates.
In the U.S. and some foreign jurisdictions, there have been a number of legislative and regulatory changes and proposed changes regarding the health care system that could prevent or delay marketing approval of our product candidates, restrict or regulate post-approval activities and affect our ability to profitably sell any product candidates for which we obtain marketing approval. Legislative and regulatory proposals have been made to expand post-approval requirements and restrict sales and promotional activities for pharmaceutical products. In addition, increased scrutiny by the U.S. Congress of the FDA's approval process may significantly delay or prevent marketing approval, as well as subject us to more stringent product labeling and post-marketing testing and other requirements. In the U.S., federal legislation has changed the way Medicare covers and pays for pharmaceutical products. Cost reduction initiatives and other provisions of legislation have decreased coverage and reimbursement. Though such legislation applies only to drug benefits for Medicare beneficiaries, private payors often follow Medicare coverage policy and payment limitations in setting their own reimbursement rates. More recent legislation is intended to broaden access to health insurance, further reduce or constrain the growth of healthcare spending, enhance remedies against fraud and abuse, add new transparency requirements for health care and health insurance industries, and impose new taxes and fees on the health industry and additional health policy reforms. New laws impose significant annual fees on companies that manufacture or import branded prescription drug products, and contain substantial new compliance provisions, which in each case may affect our business practices with health care practitioners. Subject to federal and state agencies issuing regulations or guidance, it appears likely that new laws will continue to pressure pharmaceutical pricing, especially under the Medicare program, and may also increase regulatory burdens and operating costs. We cannot be sure whether additional legislative changes will be enacted, whether the FDA regulations, guidance or interpretations will be changed or what the impact of such changes on the marketing approvals of our product candidates, if any, may be.
Our and/or our collaborators' relationships with customers and third-party payors will be subject to applicable anti-kickback, fraud and abuse and other healthcare laws and regulations, which could expose us or them to criminal sanctions, civil penalties, program exclusion, contractual damages, reputational harm and diminished profits and future earnings.
Health care providers, physicians and third-party payors play a primary role in the recommendation and prescription of any product candidates for which we obtain marketing approval. Our or our collaboratorscollaborators' future arrangements with third-party payors and customers may expose us or them to broadly applicable fraud and abuse and other health care laws and regulations that may constrain the business or financial arrangements and relationships through which we or our collaborators market, sell and distribute our products that obtain marketing approval. Efforts to ensure that business arrangements comply with applicable health care laws and regulations involve substantial costs. It is possible that governmental authorities will conclude that our or our collaborators' business practices may not comply with current or future statutes, regulations or case law involving applicable fraud and abuse or other healthcare laws and regulations. If such operations are found to be in violation of any of these laws or other applicable governmental regulations, we or the collaborator may be subject to significant civil, criminal and administrative penalties, damages, fines, exclusion from government funded healthcare programs, such as Medicare and Medicaid, and the curtailment or restructuring of related operations. If physicians or other providers or entities involved with our products are found to be not in compliance with applicable laws, they may be subject to criminal, civil or administrative sanctions, including exclusions from government funded healthcare programs, which may adversely affect us.
We cannot rely onno longer derive significant funds from federal government grants and research contracts as a continuing source of funds.contracts.
Our future depends on the proper management of our current and future business operations, including those of Molecular Insight, and their associated expenses.
Our business strategy requires us to manage our business to provide for the continued development and potential commercialization of our proprietary and partnered product candidates. Our strategy also calls for us to undertake increased research and development activities and to manage an increasing number of relationships with partners and other third parties, while simultaneously managing the capital necessary to support this strategy. These tasks are significantly increased as a result of our acquisition of Molecular Insight. If we are unable to manage effectively our current operations and any growth we may experience, our business, financial condition and results of operations may be adversely affected. If we are unable to effectively manage our expenses, we may find it necessary to reduce our personnel-related costs through reductions in our workforce, which could harm our operations, employee morale and impair our ability to retain and recruit talent. Furthermore, if adequate funds are not available, we may be required to obtain funds through arrangements with partners or other sources that may require us to relinquish rights to certain of our technologies, products or future economic rights that we would not otherwise relinquish or require us to enter into other financing arrangements on unfavorable terms.
Progenics has a history of operating losses, as does Molecular Insight, which has also been reorganized under the U.S. Bankruptcy Code.
Progenics has incurred substantial losses throughout its history. A large portion of our revenue has historically consisted of upfront and milestone from licensing transactions. We have reported an operating losslosses for 2013 and 2012 and while we reported operating income for 2011, as a result of a one-time upfront payment from Salix, the timing and amount of any similar transactions in the future is highly unpredictable and uncertain. Without upfront or other such payments, we operate at a loss, due in large part to the significant research and development expenditures required to identify and validate new product candidates and pursue our development efforts. Moreover, we have derived no significant revenue from product sales and have only in the last several years derived revenue from royalties. We may not achieve significant product sales or royalty revenue for a number of years, if ever. We expect to incur net operating losses and negative cash flow from operations in the future, which could increase significantly if we expand our clinical trial programs and other product development efforts, including those attendant to the product candidates and programs we have acquired in theoriginally developed by Molecular Insight transaction.Insight. Our ability to achieve and sustain profitability is dependent in part on obtaining regulatory approval for and then commercializing our product candidates, either alone or with others. We may not be able to develop and commercialize products beyond subcutaneous Relistor.Relistor for OIC in patients with advanced illness. Our operations may not be profitable even if any of our other product candidates under development are commercialized.
Molecular Insight has incurred net losses every year from its inception in 1997 and generated no significant revenue from product sales and only limited revenue from licenses. In December 2010, Molecular Insight filed a voluntary petition in the United States Bankruptcy Court for the District of Massachusetts seeking relief under the provisions of Chapter 11 of the U.S. Bankruptcy Code (Case No. 10-23355). It operated its business and managed its properties as a debtor in possession under bankruptcy protection until emerging from bankruptcy in May 2011.
Our ability to use net operating losses to offset future taxable income is subject to certain limitations.
We currently have significant net operating losses (NOLs) that may be used to offset future taxable income. The U.S. Internal Revenue Code limits the amount of taxable income that may be offset annually by NOL carryforwards after a change in control (generally greater than 50% change in ownership) of a loss corporation, and our use of NOL carryforwards may be further limited as a result of any future equity transactions that result in an additional change of control.
Progenics' stock price has a history of volatility and may be affected by selling pressure, including in the event of substantial sales of Progenics stock by former Molecular Insight stockholders. You should consider an investment in Progenics stock as risky and invest only if you can withstand a significant loss.
Our stock price has a history of significant volatility. In 2012, itIt has varied between a high of $6.47 and a low of $2.53 in 2013 and between a high of $11.34 and a low of $1.41.$1.41 in 2012. Factors that may have a significant impact on the market price of our common stock include the results of clinical trials and pre-clinical studies undertaken by us or others; delays, terminations or other changes in development programs; developments in marketing approval efforts, such as the FDA's July 2012 Complete Response Letter with respect to the sNDA for Relistor subcutaneous injection for the treatment of OIC in adult patients with chronic, non-cancer pain; developments in collaborator or other business relationships, particularly regarding Relistor, PSMA ADC or other significant products or programs; technological innovation or product announcements by us, our collaborators or our competitors; patent or other proprietary rights developments; governmental regulation; changes in reimbursement policies or health care legislation; safety and efficacy concerns about products developed by us, our collaborators or our competitors; our ability to fund ongoing operations; fluctuations in our operating results; purchases we may make under a share repurchase program, or discontinuation of any such purchases; and general market conditions.conditions; and the reporting of or commentary on such matters by the press and others. At times, our stock price has been volatile even in the absence of significant news or developments. The stock prices of biotechnology companies and securities markets generally have been subject to dramatic price swings in recent years, and financial and market conditions during that period have resulted in widespread pressures on securities of issuers throughout the world economy.
Our stockholders may be diluted, and the price of our common stock may decrease, as a result of future issuances of securities, exercises of outstanding stock options, or sales of outstanding securities.
We expect to issue additional common stock in public offerings, private placements and/or through our January 2014 Sales Agreement with Cantor Fitzgerald & Co., pursuant to which we may sell from time to time up to $50 million of our stock, and to issue options to purchase common stock for compensation purposes. We may issue preferred stock, restricted stock units or securities convertible into or exercisable or exchangeable for our common stock. All such issuances would dilute existing investors and could lower the price of our common stock. Sales of substantial numbers of outstanding shares of common stock, includingsuch as sales by former Molecular Insight stockholders of unregistered Progenics shares they received in the acquisition (including shares held in a 15-month escrow which expires in April 2014), could also cause a decline in the market price of our stock. We require substantial external funding to finance our research and development programs and may seek such funding through the issuance and sale of our common stock, such as ourwhich we have recently done in follow-on primary offerings in late 2012, follow-on underwritten public offering.mid-2013 and February 2014. We have in placerecently established a new shelf registration statement, which we accessedused for thatour most recent offering and which may be used forto issue up to approximately an additional issuances$110 million of common stock preferred stock, debt securities, warrants and other rights units to investors.securities before any underwriter discounts, commissions and offering expenses. We also have in place and utilize registration statements registeringcovering shares issuable pursuant to our equity compensation plans. Salesplans, and sales of our securities pursuant to these registration statementsunder them could cause the market price of our stock to decline. Any salesSales by existing stockholders or holders of options or other rights may have an adverse effect on our ability to raise capital and may adversely affect the market price of our common stock.
Our principal stockholders are able to exert significant influence over matters submitted to stockholders for approval.
At 20122013 year end, our directors and executive officers together beneficially owned or controlled approximately ninesix percent of our outstanding common shares, including shares currently issuable upon option exercises, and our five largest other stockholders over half.approximately 52 percent. Should these parties choose to act alone or together, they could exert significant influence in determining the outcome of corporate actions requiring stockholder approval and otherwise control our business. This control could, among other things, have the effect of delaying or preventing a change in control of the Company, adversely affecting our stock price.
Anti-takeover provisions may make removal of our Board and/or management more difficult, discouraging hostile bids for control that may be beneficial to our stockholders.
Our Board is authorized, without further stockholder action, to issue from time to time shares of preferred stock in one or more designated series or classes. The issuance of preferred stock, as well as provisions in some outstanding stock options that provide for acceleration of exercisability upon a change of control, and Section 203 and other provisions of the Delaware General Corporation Law could make thea takeover or the removal of our Board or management more difficult; discourage hostile bids for control in which stockholders may receive a premium for their shares; and otherwise dilute the rights of common stockholders and depress the market price of our stock.
Progenics last October commenced an arbitration with Ono under the provisions of business, nonethe parties' License Agreement for development and commercialization of which we currently believe will havesubcutaneous Relistor in Japan, following a material adverse effect on our financial condition or resultscommunication from Ono that it has determined to discontinue development because of operations."commercial concerns" that Ono contends would permit it to cease development and terminate the Agreement. Progenics is not in default under the Agreement, and Ono has neither asserted that Progenics is, nor terminated the Agreement. See Item 1A, Risk Factors.
PART II
Item 5. Market for Registrant's Common Equity, Related Stockholder Matters and Issuer Purchases of Equity Securities
Price Range of Common Stock
Our common stock is quoted on The NASDAQ Stock Market LLC under the symbol PGNX. The following table sets forth, for the periods indicated, the high and low sales price per share of the common stock, as reported on NASDAQ.
| High | Low | ||||||||||||||
| 2013: | Fourth quarter | $ | 5.90 | $ | 3.45 | ||||||||||
| Third quarter | 6.47 | 4.36 | |||||||||||||
| Second quarter | 5.57 | 3.54 | |||||||||||||
| First quarter | 5.96 | 2.53 | |||||||||||||
| High | Low | ||||||||||||||
| 2012: | Fourth quarter | $ | 3.30 | $ | 1.41 | Fourth quarter | $ | 3.30 | $ | 1.41 | |||||
| Third quarter | 11.00 | 2.81 | Third quarter | 11.00 | 2.81 | ||||||||||
| Second quarter | 11.34 | 7.44 | Second quarter | 11.34 | 7.44 | ||||||||||
| First quarter | 10.50 | 8.32 | First quarter | 10.50 | 8.32 | ||||||||||
| 2011: | Fourth quarter | 9.19 | 5.01 | ||||||||||||
| Third quarter | 7.93 | 4.50 | |||||||||||||
| Second quarter | 8.69 | 5.97 | |||||||||||||
| First quarter | 6.50 | 5.32 | |||||||||||||
On March 8, 2013,7, 2014, the last sale price for our common stock, as reported by The NASDAQ Stock Market LLC, was $3.73.$4.70. There were approximately 11785 holders of record of our common stock as of that date.
Comparative Stock Performance Graph
The graph below compares, for the past five years, the cumulative stockholder return on our common stock with the cumulative stockholder return of (i) the NASDAQ Stock Market (U.S.) Index and (ii) the NASDAQ Pharmaceutical Index, assuming an investment in each of $100 on December 31, 2007.2008.
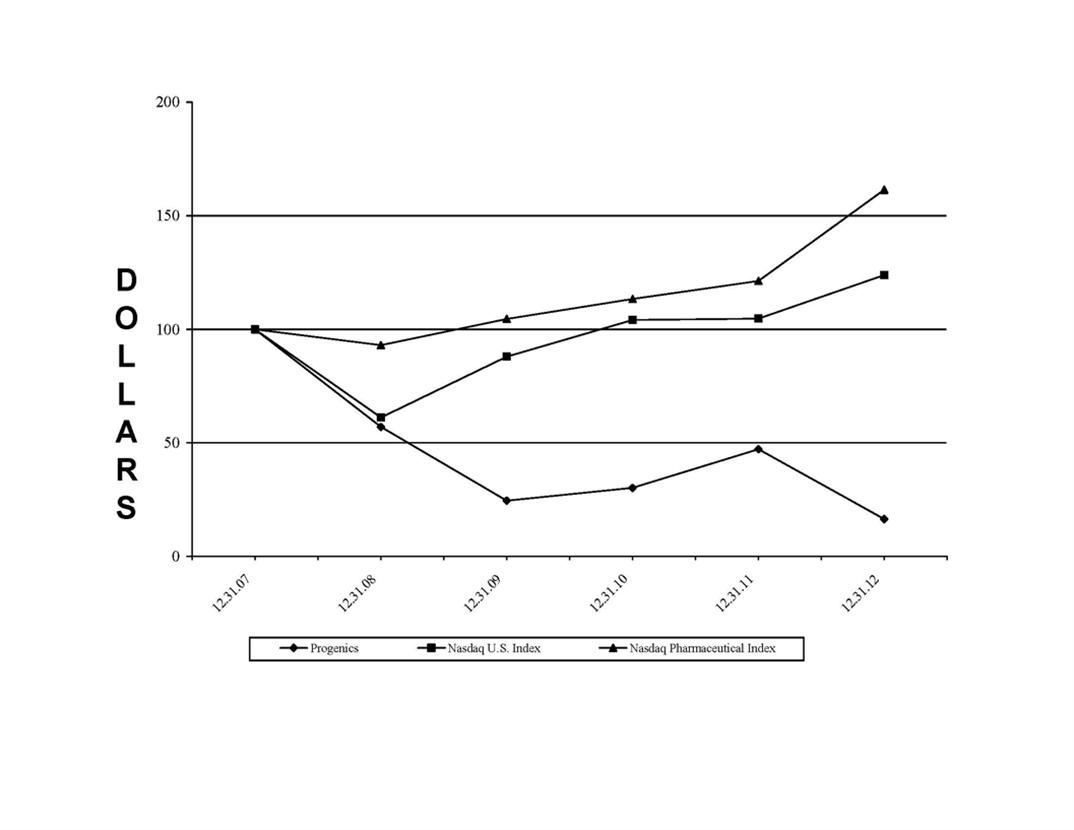
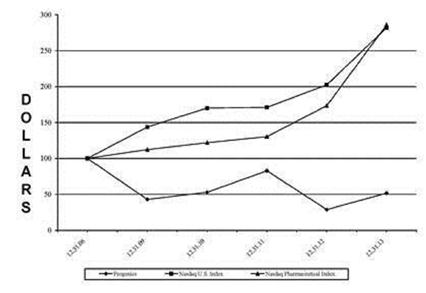
Effective January 2014, NASDAQ OMX, which provides us with total return values for the Comparative Stock Performance Graph, is replacing values prepared by the Center for Research in Security Prices (CRSP) at the University of Chicago "in an effort to provide a greater level of transparency and leverage [its] existing universe of indexes." As a result, our performance graphs going forward will be using the replacement indices provided by NASDAQ OMX Global Indexes: the NASDAQ U.S. Benchmark TR Index and the ICB: 4577 Pharmaceuticals (Subsector) Index. Please note that information for the NASDAQ Stock Market (U.S.) and the NASDAQ Pharmaceutical indices is provided only from December 31, 2008 through December 31, 2013, the last day this data was made available to us by NASDAQ OMX. The following graph compares, for the past five years, the cumulative stockholder return on our common stock with the cumulative stockholder return of the replacement indices, assuming an investment in each of $100 on December 31, 2008.
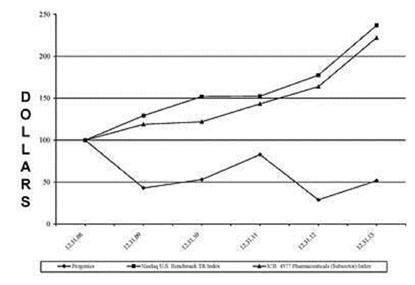
Dividends
Progenics has never paid any dividends, and we currently anticipate that all earnings, if any, will be retained for development of our business and no dividends will be declared in the foreseeable future.
The selected financial data presented below as of December 31, 20122013 and 20112012 and for each of the three years in the period ended December 31, 20122013 are derived from our audited financial statements, included elsewhere herein. The selected financial data presented below with respect to the balance sheet data as of December 31, 2011, 2010 2009 and 20082009 and for each of the two years in the period ended December 31, 20092010 are derived from our audited financial statements not included herein. The data set forth below should be read in conjunction with Management's Discussion and Analysis of Financial Condition and Results of Operations and the Financial Statements and related Notes included elsewhere herein.
| Years Ended December 31, | Years Ended December 31, | |||||||||||||||||||||||||||||||||||||||
| 2012 | 2011 | 2010 | 2009 | 2008 | 2013 | 2012 | 2011 | 2010 | 2009 | |||||||||||||||||||||||||||||||
| (in thousands, except per share data) | (in thousands, except per share data) | |||||||||||||||||||||||||||||||||||||||
| Statement of Operations Data: | ||||||||||||||||||||||||||||||||||||||||
| Revenues: | ||||||||||||||||||||||||||||||||||||||||
| Royalty income | $ | 4,963 | $ | 3,046 | $ | 1,826 | $ | 2,372 | $ | 146 | $ | 5,923 | $ | 4,963 | $ | 3,046 | $ | 1,826 | $ | 2,372 | ||||||||||||||||||||
| Collaboration revenue | 8,525 | 76,764 | 1,413 | 44,351 | 59,885 | 1,595 | 8,525 | 76,764 | 1,413 | 44,351 | ||||||||||||||||||||||||||||||
| Research grants and contract | 488 | 4,810 | 4,573 | 1,968 | 7,460 | |||||||||||||||||||||||||||||||||||
| Research grants | 275 | 488 | 4,810 | 4,573 | 1,968 | |||||||||||||||||||||||||||||||||||
| Other revenues | 72 | 176 | 140 | 256 | 180 | 69 | 72 | 176 | 140 | 256 | ||||||||||||||||||||||||||||||
| Total revenues | 14,048 | 84,796 | 7,952 | 48,947 | 67,671 | 7,862 | 14,048 | 84,796 | 7,952 | 48,947 | ||||||||||||||||||||||||||||||
| Expenses: | ||||||||||||||||||||||||||||||||||||||||
| Research and development | 31,840 | 53,183 | 50,640 | 49,798 | 82,290 | 33,903 | 31,840 | 53,183 | 50,640 | 49,798 | ||||||||||||||||||||||||||||||
| License fees - research and development | 1,170 | 578 | 1,270 | 1,058 | 2,830 | 567 | 1,170 | 578 | 1,270 | 1,058 | ||||||||||||||||||||||||||||||
| Royalty expense | 499 | 405 | 241 | 237 | 15 | 624 | 499 | 405 | 241 | 237 | ||||||||||||||||||||||||||||||
| General and administrative | 14,706 | 18,248 | 22,832 | 25,106 | 28,834 | 14,809 | 14,706 | 18,248 | 22,832 | 25,106 | ||||||||||||||||||||||||||||||
| Depreciation and amortization | 1,324 | 2,066 | 2,853 | 5,078 | 4,609 | 939 | 1,324 | 2,066 | 2,853 | 5,078 | ||||||||||||||||||||||||||||||
| Total expenses | 49,539 | 74,480 | 77,836 | 81,277 | 118,578 | 50,842 | 49,539 | 74,480 | 77,836 | 81,277 | ||||||||||||||||||||||||||||||
| Operating (loss) income | (35,491 | ) | 10,316 | (69,884 | ) | (32,330 | ) | (50,907 | ) | (42,980 | ) | (35,491 | ) | 10,316 | (69,884 | ) | (32,330 | ) | ||||||||||||||||||||||
| Other income: | �� | |||||||||||||||||||||||||||||||||||||||
| Interest income | 60 | 65 | 64 | 1,481 | 6,235 | 46 | 60 | 65 | 64 | 1,481 | ||||||||||||||||||||||||||||||
| Gain on sale of marketable securities | - | - | - | 237 | - | - | - | - | - | 237 | ||||||||||||||||||||||||||||||
| Total other income | 60 | 65 | 64 | 1,718 | 6,235 | 46 | 60 | 65 | 64 | 1,718 | ||||||||||||||||||||||||||||||
| Net (loss) income before income taxes | (35,431 | ) | 10,381 | (69,820 | ) | (30,612 | ) | (44,672 | ) | |||||||||||||||||||||||||||||||
| Net (loss) income before provision for income taxes | (42,934 | ) | (35,431 | ) | 10,381 | (69,820 | ) | (30,612 | ) | |||||||||||||||||||||||||||||||
| Income tax benefit | - | - | 95 | - | - | 362 | - | - | 95 | - | ||||||||||||||||||||||||||||||
| Net (loss) income | $ | (35,431 | ) | $ | 10,381 | $ | (69,725 | ) | $ | (30,612 | ) | $ | (44,672 | ) | $ | (42,572 | ) | $ | (35,431 | ) | $ | 10,381 | $ | (69,725 | ) | $ | (30,612 | ) | ||||||||||||
| Per share amounts on net (loss) income: | ||||||||||||||||||||||||||||||||||||||||
| Basic | $ | (1.02 | ) | $ | 0.31 | $ | (2.14 | ) | $ | (0.98 | ) | $ | (1.48 | ) | $ | (0.76 | ) | $ | (1.02 | ) | $ | 0.31 | $ | (2.14 | ) | $ | (0.98 | ) | ||||||||||||
| Diluted | $ | (1.02 | ) | $ | 0.31 | $ | (2.14 | ) | $ | (0.98 | ) | $ | (1.48 | ) | $ | (0.76 | ) | $ | (1.02 | ) | $ | 0.31 | $ | (2.14 | ) | $ | (0.98 | ) | ||||||||||||
| December 31, | December 31, | |||||||||||||||||||||||||||||||||||||||
| 2012 | 2011 | 2010 | 2009 | 2008 | 2013 | 2012 | 2011 | 2010 | 2009 | |||||||||||||||||||||||||||||||
| (in thousands) | (in thousands) | |||||||||||||||||||||||||||||||||||||||
| Balance Sheet Data: | ||||||||||||||||||||||||||||||||||||||||
| Cash and cash equivalents | $ | 58,838 | $ | 70,105 | $ | 47,918 | $ | 90,903 | $ | 56,186 | $ | 65,860 | $ | 58,838 | $ | 70,105 | $ | 47,918 | $ | 90,903 | ||||||||||||||||||||
| Auction Rate and marketable securities | 3,240 | 3,332 | 3,608 | 5,293 | 85,188 | 2,208 | 3,240 | 3,332 | 3,608 | 5,293 | ||||||||||||||||||||||||||||||
| Working capital | 58,805 | 65,890 | 42,207 | 95,388 | 85,983 | 64,055 | 58,805 | 65,890 | 42,207 | 95,388 | ||||||||||||||||||||||||||||||
| Total assets | 76,308 | 80,110 | 62,738 | 113,613 | 157,833 | 114,541 | 76,308 | 80,110 | 62,738 | 113,613 | ||||||||||||||||||||||||||||||
| Deferred revenue - current | 838 | 204 | - | - | - | - | 838 | 204 | - | - | ||||||||||||||||||||||||||||||
| Deferred revenue - long term | - | 162 | - | - | - | - | - | 162 | - | - | ||||||||||||||||||||||||||||||
| Other liabilities - long term | 1,078 | 1,497 | 1,635 | - | 266 | 28,935 | 1,078 | 1,497 | 1,635 | - | ||||||||||||||||||||||||||||||
| Total stockholders' equity | 66,568 | 71,801 | 51,308 | 107,607 | 119,369 | 78,979 | 66,568 | 71,801 | 51,308 | 107,607 | ||||||||||||||||||||||||||||||
Item 7. Management's Discussion and Analysis of Financial Condition and Results of Operations (MD&A)
Overview
General. Progenics Pharmaceuticals develops innovative medicines for oncology. As discussed in Business, above, a significant part of our research and development efforts centers on prostate specific membrane antigen (PSMA), where we are conducting phase 2 clinical trials of two product candidates for prostate cancer: our therapeutic candidate, PSMA ADC, and MIP-1404, an imaging agent candidate in development by our Molecular Insight Pharmaceuticals subsidiary. Among other assets in our pipeline of targeted radiotherapy and molecular imaging compounds are a group of small molecule therapeutics, MIP-1095, -1555 and -1558, in preclinical study for metastatic prostate cancer, and other PSMA-expressing cancers, and Azedra,resuming a pivotal phase 2 trial of an ultra-orphan radiotherapy candidate for pheochromocytoma. We have also decided to move forward MIP-1095, a compound originally developed by Molecular Insight, into clinical development, and expect to file an IND application in phase 2 study, for pheochromocytoma and potential additional indications. For the U.S. later this year.
Our acquisition last year of the privately-held Molecular Insight we issued its then-stockholders a total of 4.6 million sharesincluded the issuance of Progenics common stock in an unregistereda private transaction pursuantnot taxable to SEC Regulation D,Progenics, and agreedits agreement to pay potential milestones, in cash or Progenics stock at Progenics'its option, of up to $23 million, contingent upon achieving specified commercialization events and up to $70 million contingent upon achieving specified sales targets relating to all Molecular Insightthe acquired company's products. As noted below, Molecular Insight is notdescribed in Note 2 to the Consolidated Financial Statements, the acquisition was accounted for using the acquisition method of accounting, under which the acquired company's assets and liabilities were recorded at their estimated respective fair values as of the acquisition date in our consolidated financial statements. The difference between the estimated fair value of the acquisition consideration and fair value of the identifiable net assets represents potential future economic benefits arising from combining the companies, and has been recorded as goodwill. The results of operations of the acquired company's business from January 18, 2013, the closing date of the acquisition, the estimated fair market values of the assets acquired and liabilities assumed, and goodwill are included in our consolidated financial statements since the date of the acquisition and are included in the discussion and analysis in this Item 7.below.
Our current principal sources of revenue from operations are upfront,royalty, commercialization milestone royalty and revenue-sharing payments from Salix's Relistor operations. Royalty and milestone payments from Relistor depend on success in development and commercialization, which is dependent on many factors, such as the actions of Salix and Ono,Salix's efforts, decisions by the FDA and other regulatory bodies such as the Complete Response Letter mentioned in Business and Risk Factors, competition from drugs for the same or similar indications, and the outcome of clinical and other testing of Relistor. As previously reported, Progenics in October 2013 commenced an arbitration with Ono under the provisions of the parties' License Agreement, following a communication from Ono that it has determined to discontinue development of subcutaneous Relistor in Japan because of "commercial concerns" that Ono contends would permit it to cease development and toterminate the extent requested by our collaboration partners, our own efforts.Agreement. Progenics is not in default under the Agreement, and Ono has neither asserted that Progenics is, nor terminated the Agreement. See Risk Factors.
At December 31, 2012,2013, we held $58.8 million$65,860 in cash and cash equivalents, a decreasean increase of $11.3 million$7,022 from $70.1 million$58,838 at 20112012 year-end. We expect that this amount, together with the additional 2014 public offering proceeds, will be sufficient to fund operations as currently anticipated beyond one year. We may require additional funding inexpect to incur operating losses during the future,near term. At December 31, 2013, cash, cash equivalents and ifauction rate securities increased $5,990 to $68,068 from $62,078 at December 31, 2012.
If we do not realize sufficient royalty or other revenue from Relistor, or are unable to concludeenter into favorable collaboration, license, asset sale, capital raising or other financing transactions, we will have to reduce, delay or eliminate spending on some current operations,certain programs, and/or reduce salary andtake other overhead expenses, to extend our remaining operations. We expect to incur operating losses during the near term. At December 31, 2012, cash, cash equivalents and auction rate securities decreased $11.3 million to $62.1 million from $73.4 million at 2011 year-end.
Relistor has been approved by regulatory authorities in the U.S., countries in the E.U., Canada and Australia since 2008 for treatment of OIC in advanced-illness patients receiving palliative care when laxative therapy has not been sufficient. Salix is responsible for further developing and commercializing Relistor, including completing clinical development necessary to support regulatory marketing approvals for potential new indications (such as chronic pain) and formulations of the drug, such as oral methylnaltrexone. Under our Agreement with Salix, we are eligible to receive (i) a development milestone of up to $40 million upon U.S. marketing approval for subcutaneous Relistor in non-cancer pain patients (the proposed indication addressed in the Complete Response Letter mentioned above), (ii) a development milestone of up to $50 million upon U.S. marketing approval of an oral formulation of Relistor, (iii) up to $200 million of commercialization milestone payments upon achievement of specified U.S. sales targets, (iv) royalties ranging from 15 to 19 percent of net sales by Salix and its affiliates, and (v) 60% of any upfront, milestone, reimbursement or other revenue (net of costs of goods sold, as defined, and territory-specific research and development expense reimbursement) Salix receives from sublicensees outside the U.S. In the event either marketing approval is subject to a Black Box Warning or Risk Evaluation and Mitigation Strategy (REMS), payment of a substantial portion of the milestone amount would be deferred, and subject, to achievement of the first commercialization milestone (payable on annual U.S. sales first exceeding $100 million).
Salix has secured distribution for Relistor in the European territory and has licensed Link Medical Products Pty Limited for distribution in Australia, New Zealand, South Africa and certain other markets in Asia. Salix is continuing efforts to secure additional distribution partners and/or sublicensees in Europe and elsewhere.
Results of Operations (amounts in thousands unless otherwise noted)
| 2012 | 2011 | 2010 | 2012 vs. 2011 | 2011 vs. 2010 | 2013 | 2012 | 2011 | 2013 vs. 2012 | 2012 vs. 2011 | |||||||||||||||||||||||||||||||
| Percent Change | Percent Change | |||||||||||||||||||||||||||||||||||||||
| Revenues | $ | 14,048 | $ | 84,796 | $ | 7,952 | (83 | %) | 966 | % | $ | 7,862 | $ | 14,048 | $ | 84,796 | (44 | %) | (83 | %) | ||||||||||||||||||||
| Expenses | (49,539 | ) | (74,480 | ) | (77,836 | ) | (33 | %) | (4 | %) | (50,842 | ) | (49,539 | ) | (74,480 | ) | 3 | % | (33 | %) | ||||||||||||||||||||
| Operating (loss) income | (35,491 | ) | 10,316 | (69,884 | ) | (444 | %) | (115 | %) | (42,980 | ) | (35,491 | ) | 10,316 | 21 | % | (444 | %) | ||||||||||||||||||||||
| Other income | 60 | 65 | 64 | (8 | %) | 2 | % | 46 | 60 | 65 | (23 | %) | (8 | %) | ||||||||||||||||||||||||||
| Income tax benefit | - | - | 95 | N/ | A | (100 | %) | 362 | - | - | 100 | % | N/ | A | ||||||||||||||||||||||||||
| Net (loss) income | $ | (35,431 | ) | $ | 10,381 | $ | (69,725 | ) | (441 | %) | (115 | %) | $ | (42,572 | ) | $ | (35,431 | ) | $ | 10,381 | 20 | % | (441 | %) | ||||||||||||||||
Revenues:
| Sources of Revenue | 2012 | 2011 | 2010 | 2012 vs. 2011 | 2011 vs. 2010 | 2013 | 2012 | 2011 | 2013 vs. 2012 | 2012 vs. 2011 | ||||||||||||||||||||||||||||||
| Percent Change | Percent Change | |||||||||||||||||||||||||||||||||||||||
| Royalty income | $ | 4,963 | $ | 3,046 | $ | 1,826 | 63 | % | 67 | % | $ | 5,923 | $ | 4,963 | $ | 3,046 | 19 | % | 63 | % | ||||||||||||||||||||
| Collaboration revenue | 8,525 | 76,764 | 1,413 | (89 | %) | 5,333 | % | 1,595 | 8,525 | 76,764 | (81 | %) | (89 | %) | ||||||||||||||||||||||||||
| Research grants | 488 | 4,810 | 4,573 | (90 | %) | 5 | % | 275 | 488 | 4,810 | (44 | %) | (90 | %) | ||||||||||||||||||||||||||
| Other revenues | 72 | 176 | 140 | (59 | %) | 26 | % | 69 | 72 | 176 | (4 | %) | (59 | %) | ||||||||||||||||||||||||||
| Total | $ | 14,048 | $ | 84,796 | $ | 7,952 | (83 | %) | 966 | % | $ | 7,862 | $ | 14,048 | $ | 84,796 | (44 | %) | (83 | %) | ||||||||||||||||||||
Royalty income. We began earning royalties from net sales of subcutaneous Relistor by our former collaborator Wyeth (now a Pfizer Inc. subsidiary) in June 2008. Under a 2009 transition agreement, Wyeth continued to distribute Relistor inDuring the U.S. until April 1, 2011, in Europe until October 1, 2011, and in Australia until December 1, 2011, at which times Salix assumed those responsibilities. Beginning in the fourth quarter of 2010, no royalties were payable to uslast three years, we recognized royalty income primarily based on the net sales of Relistor by Wyeth.
| Relistor Net Sales Reported by Collaborators | Relistor Net Sales Reported by Collaborators | ||||||||||||||||||||||
| Years Ended December 31, | Years Ended December 31, | ||||||||||||||||||||||
| 2012 | 2011 | 2010 | 2013 | 2012 | 2011 | ||||||||||||||||||
| U.S. | $ | 29,200 | $ | 21,500 | $ | 9,500 | $ | 35,000 | $ | 29,200 | $ | 21,500 | |||||||||||
| Ex-U.S. | 4,000 | 5,500 | 6,600 | 4,400 | 4,000 | 5,500 | |||||||||||||||||
| Global | $ | 33,200 | $ | 27,000 | $ | 16,100 | $ | 39,400 | $ | 33,200 | $ | 27,000 | |||||||||||
Collaboration revenue:
During 2013, we recognized revenue from upfront and reimbursement payments from partnering arrangements consisting of (i) $676 from amortization of upfront payments for partnering the Company's PRO 140 and C. difficile programs, (ii) $420 from amortization of upfront payment and expense reimbursement for licensing 1404 in Japan, (iii) $295 from amortization of upfront payment and expense reimbursement for licensing Relistor, and (iv) a $189 upfront payment from another licensee.
During 2012, we recognized $7,949 of revenue from upfront and reimbursement payments from partnering our PRO 140 and C. difficile programs.partnering. As of December 31, 2012, $676 is recorded in deferred revenue – current.
During 2012 and 2011, we recognized $558 and $75,091, respectively, of revenue from Salix, which includes $204 and $59,634, respectively, from the $60,000 upfront cash payment under our License Agreement, $225 in 2011 in respect of Salix ex-U.S. sublicensee revenue and $354 and $15,232, respectively, as reimbursement of our expenses, in accordance with the License Agreement. expenses. As of December 31, 2012, $162 is recorded in deferred revenue – current. During 2011 and 2010, we recognized $1,630 and $1,383, respectively, of revenue from Wyeth,a former collaborator as reimbursement of expenses under oura transition agreement. Weagreement; we received no such reimbursement in 2013 or 2012.
During 2013, 2012 2011 and 2010,2011, we recognized $13, $18 $43 and $30,$43, respectively, of reimbursement revenue for activities requested by Ono.
a collaborator.
Research grants. During 2012 and 2011,the last three years, we recognized $488 and $4,810, respectively,the amounts in the above table as revenue from federal government grants byfrom the NIH to support research and development programs. The decreaseDecreases in grant revenue resulted from lower reimbursable expenses in 2012 than in 2011. NIH grantyear-to-year. We do not expect to recognize revenue increased from 2010 to 2011, from $4,573 to $4,810, as a result of new grant awards and higher reimbursable expenses in 2011 than in 2010. We expect NIH reimbursable expenses to continue to decline from the 2012 level.NIH in the near future.
Other revenues, primarily from orders for research reagents, decreased to $72 for 2012 from $176 for 2011 and $140 for 2010.as shown in the above table.
Expenses:
Research and Development Expenses include scientific labor, clinical trial costs, supplies, product manufacturing costs, consulting, license fees, royalty payments and other operating expenses. Research and development expenses decreasedincreased to $35,094 for 2013 from $33,509 for 2012 and decreased from $54,166 for 2011, and from $52,151 for 2010. 2011. During 2012,2013, the decreaseincrease in research and development expenses compared to those in 20112012 was primarily due to lower (i)higher clinical trial costs from activities related to oral methylnaltrexone phase 3 studyPSMA ADC and regulatory filing fees for the submission of the sNDA for subcutaneous Relistor, (ii) purchases of manufacturing supplies on behalf of Salix, (iii) compensation expense1404, and (iv) rent expense, partially offset by higherlower compensation, contract manufacturing and subcontracting and license fee and clinical trial expenses related to PSMA ADC. expenses. See Liquidity and Capital Resources – Uses of Cash, for details of the changes in these expenses by project. Primarily in 2011, Salix reimbursed us for development expenses we incurred related to Relistor.Relistor; most of these expenses were incurred and reimbursed in 2011. Portions of our expenses areduring the periods presented were funded through grants from the NIH (see Revenues- Research Grants). Company-wide headcount as of December 31, 2012 declined to 76 from 105 as of December 31, 2011 and 159 as of December 31, 2010. The changes in research and development expense, by category of expense, are as follows:
| 2012 | 2011 | 2010 | 2012 vs. 2011 | 2011 vs. 2010 | ||||||||||||||||
| Percent change | ||||||||||||||||||||
| Salaries and benefits | $ | 15,372 | $ | 18,658 | $ | 18,469 | (18 | %) | 1 | % | ||||||||||
| 2013 | 2012 | 2011 | 2013 vs. 2012 | 2012 vs. 2011 | ||||||||||||||||
| Percent change | ||||||||||||||||||||
| Salaries and benefits | $ | 12,481 | $ | 15,372 | $ | 18,658 | (19 | %) | (18 | %) | ||||||||||
2013 vs. 2012 Salaries and benefits decreased due to a decline in average headcount, and reflecting a non-recurring retirement expense of $1,804 incurred in the first quarter of 2012.
2012 vs. 2011 Salaries and benefits decreased due to a decline in average headcount to 62 from 104 in the research and development departments (see below for decline in average general and administrative headcount) and lower accrued bonus expense, in 2012, partially offset by an increase in expenses of $1,804 incurred in the first quarter of 2012 in connection with a former senior executiveabove non-recurring retirement expense and accrued severance expense related to the additional headcount reductions in the third quarter.
| 2013 | 2012 | 2011 | 2013 vs. 2012 | 2012 vs. 2011 | ||||||||||||||||
| Percent change | ||||||||||||||||||||
| Share-based compensation | $ | 2,524 | $ | 4,568 | $ | 4,499 | (45 | %) | 2 | % | ||||||||||
| 2012 | 2011 | 2010 | 2012 vs. 2011 | 2011 vs. 2010 | ||||||||||||||||
| Percent change | ||||||||||||||||||||
| Share-based compensation | $ | 4,568 | $ | 4,499 | $ | 5,091 | 2 | % | (12 | %) | ||||||||||
2012 vs. 2011 Share-based compensation increased for 2012 compared to 2011 primarily due to the acceleration of options and restricted stock expenses of $1,638 resulting from a former senior executive retirement, partially offset by lower restricted stock expenses and noelimination of employee stock purchase plan expenses resulting from the 2011 termination of those plans.
For 2011, share-based compensation included restricted stock and option plan expenses from (i) accelerated vesting of outstanding awards to non-management employees in connection with a change in program eligibility and termination of the Company's employee stock purchase plans (the latter of which resulted in a decline in share-based compensation), and (ii) a shift in headcount from general and administrative departments to research and development. See Critical Accounting Policies − Share-Based Payment Arrangements.
| 2013 | 2012 | 2011 | 2013 vs. 2012 | 2012 vs. 2011 | ||||||||||||||||
| Percent change | ||||||||||||||||||||
| Clinical trial costs | $ | 8,862 | $ | 2,692 | $ | 10,099 | 229 | % | (73 | %) | ||||||||||
| 2012 | 2011 | 2010 | 2012 vs. 2011 | 2011 vs. 2010 | ||||||||||||||||
| Percent change | ||||||||||||||||||||
| Clinical trial costs | $ | 2,692 | $ | 10,099 | $ | 7,056 | (73 | %) | 43 | % | ||||||||||
2013 vs. 2012 Clinical trial costs increased primarily due to higher expenses for Oncology ($6,214), partially offset by decreased expenses in Other programs ($27) and Relistor ($17).
2012 vs. 2011 Clinical trial costs decreased primarily due to (i) Relistor ($9,132), resulting from lower clinical trial activities related to oral methylnaltrexone study,Relistor ($9,132), partially offset by increased expenses in Oncology ($1,700), primarily related to PSMA ADC and Other ($25).
| 2013 | 2012 | 2011 | 2013 vs. 2012 | 2012 vs. 2011 | ||||||||||||||||
| Laboratory and manufacturing | Percent change | |||||||||||||||||||
| supplies and equipment | $ | 632 | $ | 592 | $ | 4,203 | 7 | % | (86 | %) | ||||||||||
| 2012 | 2011 | 2010 | 2012 vs. 2011 | 2011 vs. 2010 | ||||||||||||||||
| Laboratory and manufacturing | Percent change | |||||||||||||||||||
| supplies | $ | 592 | $ | 4,203 | $ | 2,388 | (86 | %) | 76 | % | ||||||||||
2012 vs. 2011 Laboratory and manufacturing supplies and equipment decreased due to lower expenses in (i) Relistor ($2,197), (ii) Oncology ($388), resulting fromreflecting a decline in manufacturing supplies for PSMA ADC, and (iii) Other ($1,026).
| 2013 | 2012 | 2011 | 2013 vs. 2012 | 2012 vs. 2011 | ||||||||||||||||
| Contract manufacturing and | Percent change | |||||||||||||||||||
| subcontractors | $ | 2,042 | $ | 3,111 | $ | 6,713 | (34 | %) | (54 | %) | ||||||||||
| 2012 | 2011 | 2010 | 2012 vs. 2011 | 2011 vs. 2010 | ||||||||||||||||
| Contract manufacturing and | Percent change | |||||||||||||||||||
| subcontractors | $ | 3,111 | $ | 6,713 | $ | 6,853 | (54 | %) | (2 | %) | ||||||||||
2012 vs. 2011 Contract manufacturing and subcontractors decreased due to lower expenses for Relistor ($2,399), resulting fromreflecting a decrease in purchases of subcutaneous Relistor related products, and Other ($1,596), partially offset by an increase in Oncology ($393).
Expenses in this category relate to the conduct of clinical trials, including manufacture by third parties of drug materials, testing, analysis, formulation and toxicology services, and vary as the timing and level of such services are required.
31
| 2012 | 2011 | 2010 | 2012 vs. 2011 | 2011 vs. 2010 | ||||||||||||||||
| Percent change | ||||||||||||||||||||
| Consultants | $ | 330 | $ | 1,270 | $ | 3,310 | (74 | %) | (62 | %) | ||||||||||
| 2013 | 2012 | 2011 | 2013 vs. 2012 | 2012 vs. 2011 | ||||||||||||||||
| Percent change | ||||||||||||||||||||
| Consultants | $ | 905 | $ | 330 | $ | 1,270 | 174 | % | (74 | %) | ||||||||||
2013 vs. 2012 Consultants expense increased primarily due to higher expenses for Oncology ($613), partially offset by lower expenses for Other programs ($27) and Relistor ($11).
2012 vs. 2011 Consultants expense decreased due to lower expenses in 2012 for Relistor regulatory and other activities ($816)816), primarily related to the sNDA submission for subcutaneous Relistor in non-cancer pain patients, Oncology ($18) and Other programs ($106).
Expenses in this category relate to monitoring ongoing clinical trials and reviewing data from completed trials including the preparation of filings and vary as the timing and level of such services are required.
| 2012 | 2011 | 2010 | 2012 vs. 2011 | 2011 vs. 2010 | ||||||||||||||||
| Percent change | ||||||||||||||||||||
| License fees | $ | 1,170 | $ | 578 | $ | 1,270 | 102 | % | (54 | %) | ||||||||||
| 2013 | 2012 | 2011 | 2013 vs. 2012 | 2012 vs. 2011 | ||||||||||||||||
| Percent change | ||||||||||||||||||||
| License fees | $ | 567 | $ | 1,170 | $ | 578 | (52 | %) | 102 | % | ||||||||||
2013 vs. 2012 License fees decreased due to lower expenses for Oncology ($573) and Other programs ($30).
2012 vs. 2011 License fees increased due to higher expenses for clinical trial initiation in Oncology ($902)902), due to the initiation of a phase 2 trial, partially offset by lower expenses for Relistor ($156) and Other programs ($154).
| 2013 | 2012 | 2011 | 2013 vs. 2012 | 2012 vs. 2011 | ||||||||||||||||
| Percent change | ||||||||||||||||||||
| Royalty expense | $ | 624 | $ | 499 | $ | 405 | 25 | % | 23 | % | ||||||||||
| 2012 | 2011 | 2010 | 2012 vs. 2011 | 2011 vs. 2010 | ||||||||||||||||
| Percent change | ||||||||||||||||||||
| Royalty expense | $ | 499 | $ | 405 | $ | 241 | 23 | % | 68 | % | ||||||||||
2012 vs. 2011 The increase in royalty expense iswas due to higher net sales of Relistor in 2012.
| 2013 | 2012 | 2011 | 2013 vs. 2012 | 2012 vs. 2011 | ||||||||||||||||
| Percent change | ||||||||||||||||||||
| Other operating expenses | $ | 6,457 | $ | 5,175 | $ | 7,741 | 25 | % | (33 | %) | ||||||||||
| 2012 | 2011 | 2010 | 2012 vs. 2011 | 2011 vs. 2010 | ||||||||||||||||
| Percent change | ||||||||||||||||||||
| Other operating expenses | $ | 5,175 | $ | 7,741 | $ | 7,473 | (33 | %) | 4 | % | ||||||||||
2012 vs. 2011 Other operating expenses decreased primarily due to decreases in rent ($1,943), travel ($111), insurance ($55) and other operating expenses ($489), partially offset by increases in expenses for facilities ($32).
General and Administrative Expenses decreasedincreased to $14,809 for 2013 from $14,706 for 2012 and decreased from $18,248 for 2011, and from $22,832 for 2010, as follows:
| 2012 | 2011 | 2010 | 2012 vs. 2011 | 2011 vs. 2010 | ||||||||||||||||
| Percent change | ||||||||||||||||||||
| Salaries and benefits | $ | 6,493 | $ | 7,228 | $ | 8,086 | (10 | %) | (11 | %) | ||||||||||
| 2013 | 2012 | 2011 | 2013 vs. 2012 | 2012 vs. 2011 | ||||||||||||||||
| Percent change | ||||||||||||||||||||
| Salaries and benefits | $ | 4,821 | $ | 6,493 | $ | 7,228 | (26 | %) | (10 | %) | ||||||||||
2013 vs. 2012 Salaries and benefits decreased primarily due to 2012 accrued severance expense resulting from headcount reductions, while the average headcount remained unchanged.
2012 vs. 2011 Salaries and benefits decreased due to a decline in average headcount to 24 from 32, in the general and administrative departments and lower accrued bonus expense in 2012, partially offset by an increase in accrued severance expense related to additional headcount reductions in the third quarter.
| 2013 | 2012 | 2011 | 2013 vs. 2012 | 2012 vs. 2011 | ||||||||||||||||
| Percent change | ||||||||||||||||||||
| Share-based compensation | $ | 1,022 | $ | 1,968 | $ | 1,863 | (48 | %) | 6 | % | ||||||||||
| 2012 | 2011 | 2010 | 2012 vs. 2011 | 2011 vs. 2010 | ||||||||||||||||
| Percent change | ||||||||||||||||||||
| Share-based compensation | $ | 1,968 | $ | 1,863 | $ | 4,424 | 6 | % | (58 | %) | ||||||||||
2012 vs. 2011 Share-based compensation increased due to higher stock option expenses in connection with the third quarter 2012 restructuring, partially offset by lower restricted stock and elimination of employee stock purchase plans expenses as a resultresulting from the 2011 termination of their termination in 2011.
For 2011, share-based compensation reflected accelerated vesting in connection with termination of our employee stock purchase plans, as described under research and development expenses, above.plans.
| 2012 | 2011 | 2010 | 2012 vs. 2011 | 2011 vs. 2010 | ||||||||||||||||
| Percent change | ||||||||||||||||||||
| Consulting and professional fees | $ | 2,362 | $ | 4,389 | $ | 5,843 | (46 | %) | (25 | %) | ||||||||||
| 2013 | 2012 | 2011 | 2013 vs. 2012 | 2012 vs. 2011 | ||||||||||||||||
| Percent change | ||||||||||||||||||||
| Consulting and professional fees | $ | 3,922 | $ | 2,362 | $ | 4,389 | 66 | % | (46 | %) | ||||||||||
2013 vs. 2012 Consulting and professional fees increased due to higher consulting ($697), patent ($457), legal ($256), audit ($101) and other fees ($49).
2012 vs. 2011 Consulting and professional fees decreased due to lower consulting ($1,246), audit ($297), patent ($294), accounting ($91), legal ($63) and other fees ($36).
| 2013 | 2012 | 2011 | 2013 vs. 2012 | 2012 vs. 2011 | ||||||||||||||||
| Percent change | ||||||||||||||||||||
| Other operating expenses | $ | 4,325 | $ | 3,883 | $ | 4,768 | 11 | % | (19 | %) | ||||||||||
| 2012 | 2011 | 2010 | 2012 vs. 2011 | 2011 vs. 2010 | ||||||||||||||||
| Percent change | ||||||||||||||||||||
| Other operating expenses | $ | 3,883 | $ | 4,768 | $ | 4,479 | (19 | %) | 6 | % | ||||||||||
2012 vs. 2011 Other operating expenses decreased due to lower expenses for rent ($646), investor relations ($63), taxes ($30), and other operating expenses ($359), partially offset by an increases in recruiting ($137), computer software ($66) and travel ($10).
| 2013 | 2012 | 2011 | 2013 vs. 2012 | 2012 vs. 2011 | ||||||||||||||||
| Percent change | ||||||||||||||||||||
| Depreciation and amortization | $ | 939 | $ | 1,324 | $ | 2,066 | (29 | %) | (36 | %) | ||||||||||
| 2012 | 2011 | 2010 | 2012 vs. 2011 | 2011 vs. 2010 | ||||||||||||||||
| Percent change | ||||||||||||||||||||
| Depreciation and amortization | $ | 1,324 | $ | 2,066 | $ | 2,853 | (36 | %) | (28 | %) | ||||||||||
2012 vs. 2011 Depreciation and amortization expense decreased to $1,324 for 2012 from $2,066 for 2011, primarily due to lower machinery and equipment fixed asset balances.
2013 As of December 31, 2013 indefinite-lived intangible assets decreased by $919, from $32.3 million to $31.4 million, resulting from our annual impairment testing, with the corresponding expense decreasedrecorded in the general and administrative expenses in the Consolidated Statements of Operations. This impairment was the result of change in the estimated timing of beginning cash inflows from 2014 to $2,0662018 and an increase in discount rate from 15% to 18% for 2011the Onalta intangible asset. In addition, the fourth quarter review of the contingent consideration liability fair value resulted in a $200 decrease, from $2,853 for 2010, primarily$15.9 million to $15.7 million, which has also been recorded in the general and administrative expenses in the Consolidated Statements of Operations. The decrease in contingent consideration liability was due to lower leasehold improvement amortization expenses.an increase in the discount period.
Other income:
| 2012 | 2011 | 2010 | 2012 vs. 2011 | 2011 vs. 2010 | ||||||||||||||||
| Percent change | ||||||||||||||||||||
| Interest income | $ | 60 | $ | 65 | $ | 64 | (8 | %) | 2 | % | ||||||||||
| 2013 | 2012 | 2011 | 2013 vs. 2012 | 2012 vs. 2011 | ||||||||||||||||
| Percent change | ||||||||||||||||||||
| Interest income | $ | 46 | $ | 60 | $ | 65 | (23 | %) | (8 | %) | ||||||||||
2013 vs. 2012 Interest income decreased due to lower average interest rates in 2013 than in 2012, partially offset by increases resulting from higher average balances of cash equivalents.
2012 vs. 2011 Interest income decreased to $60 for 2012 from $65 for 2011.
Interest income, as reported, is primarily the result of investment income from our auction rate securities decreasedheld by the amortization of premiums we paid or increased by the amortization of discounts we received for those securities.us.
Income Taxes:
For 2013, income tax benefit of $362 resulted from the change in the difference between carrying amounts of in-process research and development assets for financial reporting purposes and the amounts used for income tax purposes. For 2012 and 2010, our2011, there was no provision for income taxes due to a pre-tax loss was $35,431for 2012 and $69,820. Forthe 2011 we recognized $10,381 in pre-tax income primarily as a result of the $60,000 Salix upfront cash payment, which has beenamount was completely offset fully withby our available net operating loss carry-forwards.We received a federal tax refund of $95 in 2010 from new legislation permitting the carryback of NOLs to 2005 as well as permitting the suspension of limitations on alternative minimum tax NOL utilization.
Net Income (Loss): Income:
Liquidity and Capital Resources
We have to date funded operations principally through payments received from private placements of equity securities, public offerings of common stock, collaborations, grants and contracts, royalties, interest on investments and proceeds from the exercise of outstanding options and warrants,warrants.
We received in 2013 a $5,000 upfront payment from partnering of the C. difficile program and through September 30, 2011, salesare eligible to receive future milestone and royalty payments. This receipt resulted in the reversal in 2013 of our common stock under our two employee stock purchase plans (Purchase Plans) which were terminated during 2011.deferred tax assets and liabilities established in 2012 to reflect the net tax effects of temporary differences between the carrying amounts of certain assets and liabilities for financial reporting purposes and the amounts used for income tax purposes.
We received in 2012 a $3,500 payment upon sale of our PRO 140 program and are eligible to receive future milestone and royalty payments in respect of this asset.
Under the Salix License Agreement, we received in 2011 a $60,000 upfront cash payment and $225 in respect of Salix ex-U.S. sublicensee revenue and are eligible to receive development and commercialization milestone payments plus royalties on net sales and 60% of any upfront, milestone, reimbursement or other revenue (net of costs of goods sold, as defined, and territory-specific research and development expense reimbursement) Salix receives from ex-U.S. sublicensees.
Our expenses and reimbursement revenue related to Relistor have declined substantially since Salix assumed direct responsibility for expenses under third-party contracts we have assigned to it. Under the Salix License Agreement, we are reimbursed for Salix approved full-time equivalents (FTE) and third-party development expenses incurred and paid by us after February 3, 2011.
At December 31, 2012,2013, we held $58,838$65,860 in cash and cash equivalents, a decreasean increase of $11,267$7,022 from $70,105$58,838 at December 31, 2011.2012. We expect that this amount will be sufficient to fund operations as currently anticipated beyond one year. In addition, at December 31, 20122013 and 2011,2012, our investment in auction rate securities classified as long-term assets on the Consolidated Balance Sheets amounted to $3,240$2,208 and $3,332,$3,240, respectively.
If we do not realize sufficient royalty or other revenue from Relistor or are unable to enter into favorableother collaboration, license, asset sale, capital raising or other financing transactions, we will have to reduce, delay or eliminate spending on certain programs, and/or reduce headcount andtake other overhead expenses.economic measures.
Cash used in operating activities for 2013 and 2012 was $36,107 and 2010 was $34,644, and $46,410, respectively, due to excess of expenditures on our research and development programs and general and administrative costs over cash received from collaborators and government grants. Our cash flow from operating activities was positive for 2011, due to the receipt of a $60,000 Salix upfront payment, $225 in respect of Salix ex-U.S. sublicensee revenue and $16,289 in reimbursement payments from Salix and Wyeth, partially offset by expenditures on our research and development programs and general and administrative costs. See Risk Factors.
Sources of Cash
Operating Activities. During 2013 we received $9,686 under our collaborations, primarily consisting of (i) $5,125 in upfront and reimbursement payments from partnering of the C. difficile program, (ii) $3,952 in royalties and reimbursements from Salix, (iii) payments totaling $224 from out-licenses of other assets, and (iv) $385 in reimbursement payments relating to 1404. During 2012 we received $9,393 under collaborations, out-licenses and sale of assets, consisting of (i) $404 in reimbursement payments under the Salix License Agreement, (ii) $5,461 in royalties from Salix, (iii) $3,500 from the sale of our PRO 140 program and (iv) $28 under the License Agreement with Ono.another out-license. During 2011 we received $79,998 under our collaborations, consisting of (i) $60,000 Salix upfront cash payment and $225 in respect of Salix ex-U.S. sublicensee revenue, (ii) $14,659 in reimbursement payments under the Salix License Agreement, (iii) $1,767 in royalties from Salix, (iv) $3,317 under the Transition Agreementpursuant to our former collaboration with Wyeth Pharmaceuticals and (v) $30 under the License Agreement with Ono. During 2010 we received $10,351 from Wyeth, consisting of (i) $0 as reimbursements payments under the 2005 Wyeth collaboration, (ii) $7,906 under the Transition Agreement, (iii) $2,415 in royalties and (iv) $30 under the License Agreement with Ono.another out-license.
We have in the past partially funded research programs through awards from the NIH.NIH, which we do not expect to receive in the foreseeable future. For 2013, 2012 2011 and 2010,2011, we received $287, $576 $5,178 and $4,315,$5,178, respectively, of revenue from all of our NIH awards. We expect a further decline in NIH reimbursable expenses.
Changes in Accounts receivable and Accounts payable for 2013, 2012 2011 and 20102011 resulted from the timing of receipts from Salix, Wyeth, Ono, Fuji, other partnering transactions, and NIH, and payments made to trade vendors in the normal course of business.
Investing Activities. Of $58,838Approximately 92% of our $65,860 in cash and cash equivalents primarilyat December 31, 2013 was invested in money market funds of which, at December 31, 2012, $51,127 is guaranteed by the U.S. Treasury or Federal Deposit Insurance Corporation's guarantee program. Our auctionfunds. Auction rate securities of $3,240 include $2,300$2,208 consist of securities collateralized by student loan obligations subsidized by the U.S. government, $100$1,100 of which was redeemed at par during the first quarterand second quarters of 2012.2013. These investments, whileauction rate securities are rated investment grade by the Standard & Poor's and Moody's rating agencies and predominantly havinghave scheduled maturities greater than ten years, are heavily concentrated in the U.S. financial sector.years. During 2012,2013, we realized $174 of proceeds from sales of fixed assets were $390.assets.
Financing Activities. During 2012,2013, net cash provided by financing activities includes $23,348included $40,078 in net proceeds that we received forfrom the issuance of approximately 12.79.775 million shares of our common stock. In addition, during 2013, 2012 2011 and 2010,2011, we received cash of $71, $306 $3,726 and $3,896,$3,726, respectively, from exercise of stock options, sales of common stock in satisfaction of severance obligations (in 2012) and under the now-discontinued employee stock purchase plans (in 2011) and exercise of stock options.. The amount of cash we receive from these sources fluctuates commensurate with headcount levels and changes in the price of our common stock price on the grant date for options exercised, and on the sale date for shares sold under the now-terminated employee stock purchase plans.
Unless we obtain regulatory approval from the FDA for additional product candidates and/or enter into agreements with corporate collaborators with respect to our additional technologies,other proprietary assets, we will be required to fund our operations in the future through sales of common stock or other securities or royalty or other financing agreements and/or grants and government contracts.agreements. Adequate additional funding may not be available to us on acceptable terms or at all. Our inability to raise additional capital on terms reasonably acceptable to us may seriously jeopardize the future success of our business.
Uses of Cash
Operating Activities. The majority of our cash has been used to advance our research and development programs,, including conducting pre-clinical studies and clinical trials, pursuing regulatory approvals for product candidates, filing and prosecuting patent applications and defending patent claims. Our expenses for research and development for 2012, 2011 and 2010, were $33,509, $54,166 and $52,151, respectively.claims. Included in the 2012 period presented below is $2,073 of cash disbursements incurred in connection with a former senior executive first quarter retirement. For various reasons, including the early stage of certain of our programs, the timing and results of our clinical trials, our dependence in certain instances on third parties, many of which are outside of our control, we cannot estimate the total remaining costs to be incurred and timing to complete all our research and development programs.
| 2012 | 2011 | 2010 | 2013 | 2012 | 2011 | ||||||||||||||||||
| Oncology | $ | 29.1 | $ | 22.2 | $ | 17.4 | $ | 33.4 | $ | 29.1 | $ | 22.2 | |||||||||||
| Relistor | 1.7 | 23.2 | 23.4 | 0.9 | 1.7 | 23.2 | |||||||||||||||||
| Other programs | 2.7 | 8.8 | 11.4 | 0.8 | 2.7 | 8.8 | |||||||||||||||||
| Total | $ | 33.5 | $ | 54.2 | $ | 52.2 | $ | 35.1 | $ | 33.5 | $ | 54.2 | |||||||||||
We maywill require additional funding to continue our research and product development programs, conduct pre-clinical studies and clinical trials, fund operating expenses, pursue regulatory approvals for our product candidates, file and prosecute patent applications and enforce or defend patent claims, if any, fund other operating expenses, and fund product in-licensing and any possible acquisitions.
Investing Activities. During 2012, 2011 and 2010,the past three years, we have spent $137, $767 $226 and $2,171,$226, respectively, on capital expenditures.
Contractual Obligations
Our funding requirements, both for the next 12 months and beyond, will include required payments under operating leases and fixed and contingent payments under licensing, collaboration and collaborationother agreements, including those to which our Molecular Insight subsidiary is a party. The following table summarizes our contractual obligations as of December 31, 20122013 for future payments under ourthese agreements, and does not include MIPincluding Molecular obligations:
| Payments due by Year-end | Payments due by Year-end | ||||||||||||||||||||||||||||||||||||||
| Total | 2013 | 2014-2015 | 2016-2017 | Thereafter | Total | 2014 | 2015-2016 | 2017-2018 | Thereafter | ||||||||||||||||||||||||||||||
| (in millions) | (in millions) | ||||||||||||||||||||||||||||||||||||||
| Operating leases | $ | 20.6 | $ | 2.4 | $ | 4.9 | $ | 5.1 | $ | 8.2 | $ | 13.9 | $ | 1.9 | $ | 3.8 | $ | 4.0 | $ | 4.2 | |||||||||||||||||||
| License, collaboration and other agreements: | |||||||||||||||||||||||||||||||||||||||
| Fixed payments | 0.5 | - | 0.2 | 0.3 | - | 1.3 | 0.3 | 0.4 | 0.6 | - | |||||||||||||||||||||||||||||
| Contingent payments (1) | 72.1 | - | 2.3 | 3.0 | 66.8 | 105.7 | - | 2.3 | 7.7 | 95.7 | |||||||||||||||||||||||||||||
| Total | $ | 93.2 | $ | 2.4 | $ | 7.4 | $ | 8.4 | $ | 75.0 | $ | 120.9 | $ | 2.2 | $ | 6.5 | $ | 12.3 | $ | 99.9 | |||||||||||||||||||
_______________
(1) | Based on assumed achievement of milestones covered under each agreement, the timing and payment of which is highly uncertain. |
We periodically assess the scientific progress and merits of each of our programs to determine if continued research and development is commercially and economically viable. Certain of our programs have been terminated due to the lack of scientific progress and prospects for ultimate commercialization. Because of the uncertainties associated with research and development in these programs, the duration and completion costs of our research and development projects are difficult to estimate and are subject to considerable variation. Our inability to complete research and development projects in a timely manner or failure to enter into collaborative agreements could significantly increase capital requirements and adversely affect our liquidity.
Our cash requirements may vary materially from those now planned because of results of research and development and product testing, changes in existing relationships or new relationships with licensees, licensors or other collaborators, changes in the focus and direction of our research and development programs, competitive and technological advances, the cost of filing, prosecuting, defending and enforcing patent claims, the regulatory approval process, manufacturing and marketing and other costs associated with the commercialization of products following receipt of regulatory approvals and other factors.
The above discussion contains forward-looking statements based on our current operating plan and the assumptions on which it relies. There could be deviations from that plan that would consume our assets earlier than planned.
Off-Balance Sheet Arrangements and Guarantees
We have no obligations under off-balance sheet arrangements and do not guarantee the obligations of any other unconsolidated entity.
Critical Accounting Policies
We prepare our financial statements in conformity with accounting principles generally accepted in the U.S. Our significant accounting policies are disclosed in Note 23 to our financial statements included in this Annual Report on Form 10-K for 2012.Report. The selection and application of these accounting principles and methods requires us to make estimates and assumptions that affect the reported amounts of assets, liabilities, revenues and expenses, as well as certain financial statement disclosures. OnWe evaluate these estimates on an ongoing basis, we evaluate our estimates.basis. We base ourthese estimates on historical experience and on various other assumptions that are believed to bewe believe reasonable under the circumstances. The results of our evaluationthese evaluations form the basis for making judgments about the carrying values of assets and liabilities that are not otherwise readily apparent. While we believe that the estimates and assumptions we use in preparing the financial statements are appropriate, these estimates and assumptionsthey are subject to a number of factors and uncertainties regarding their ultimate outcome and, therefore, actual results could differ from these estimates.
Revenue Recognition. We recognize revenue from all sources based on the provisions of the SEC's Staff Accounting Bulletin (SAB) No. 104 (SAB 104) and ASC 605 Revenue Recognition.
Royalty revenue is recognized based upon net sales of related licensed products. Royalty revenueproducts, and is recognized in the period the sales occur, provided that the royalty amounts are fixed or determinable, collection of the related receivable is reasonably assured and we have no remaining performance obligations under the arrangement providing for the royalty.
Amounts not expected to be recognized within one year of the balance sheet date are classified as long-term deferred revenue. The estimate of the classification of deferred revenue as short-term or long-term is based upon the periods in which we expect to perform joint committee services and/orour collaboration arrangement obligations including non-reimbursable technical assistance.
Share-Based Payment Arrangements. Our share-based compensation toof employees includes non-qualified stock options and restricted stock, and shares issued under our Purchase Plans, which are compensatory under ASC 718 Compensation – Stock Compensation. We account for share-based compensation to non-employees, including non-qualified stock options and restricted stock, in accordance with ASC 505 Equity.
The fair value of each non-qualified stock option award is estimated on the date of grant using the Black-Scholes option pricing model. The model requires input assumptions with respect to (i) expected volatility of our common stock, which is based upon the daily quoted market prices on The NASDAQ Stock Market LLC over a period equal to the expected term, (ii) the period of time over which employees, officers, directors and non-employee consultants are expected to hold their options prior to exercise, (iii) zero expected dividend yield (zero in our case due to never having paid dividends and not expecting to pay dividends in the future,future), and (iv) risk-free interest rates for periods within the expected term of the options, which are based on the U.S. Treasury yield curve in effect at the time of grant.
Historical volatilities are based upon daily quoted market prices of our common stock on The NASDAQ Stock Market LLC over a period equal to the expected term of the related equity instruments. We rely only on historical volatility since we believe it providesis generally viewed as providing the most reliable indication of future volatility. FutureIn estimating expected future volatility, is expected towe assume it will be consistent with historical; we calculate historical volatility is calculated using a simple average calculation; we use available historical data is available for the length of the option's expected term, and we consistently use a sufficient number of price observations are used consistently.observations. Since our stock options are not traded on a public market, we do not use implied volatility.
The expected term of options granted represents the period of time that options granted are expected to be outstanding based upon historical data related to exercise and post-termination cancellation activity. The expected term of stock options granted to our Chief Executive Officer (CEO) and non-employee directors, consultants and consultantsofficers are calculated separately from stock options granted to employees and other officers.employees.
We apply a forfeiture rate to the number of unvested awards in each reporting period in order to estimate the number of awards that are expected to vest. Estimated forfeiture rates are based upon historical data on vesting behavior of employees. We adjust the total amount of compensation cost recognized for each award, in the period in which each award vests, to reflect the actual forfeitures related to that award. Changes in our estimated forfeiture rate will result in changes in the rate at which compensation cost for an award is recognized over its vesting period.
Changes in the assumptions used to compute the fair value of the option awards are likely to affect thetheir fair value of the non-qualified stock option awards and the amount of compensation expense recognized in future periods. A higher volatility, longer expected term and higher risk-free rate increases the resulting compensation expense recognized in future periods as compared to prior periods. Conversely, a lower volatility, shorter expected term and lower risk-free rate decreases the resulting compensationsuch expense recognized in future periods as compared to prior periods.
For performance-based stock option awards vesting of a defined portion of each award will occur earlier if a defined performance condition is achieved; more than one condition may be achieved in any period. We estimate the probability of achievement of each performance condition and use those probabilities to determine the requisite service period of each award. The requisite service period for the award is the shortest of the explicit or implied service periods. For performance and market-based stock option awards to our CEO (consisting of options(awarded in 2010)2012 and 2011 only), vesting occurs on the basis of the achievement of specified performance or market-based milestones. The options have an exercise price equal to the closing price on our common stock on the date of grant. The awards are valued using a Monte Carlo simulation model and the expense related to these grants will be recognized over the shortest estimated time for the achievement of the performance or market conditions. On July 1, 2011, we granted an option to our CEO which vests on the basis of theupon achievement of specified performance-based milestones. The option hasawards, which have an exercise price equal to the closing price of our common stock on the date of grant. The award isgrant, are valued using the Black-Scholes option pricing model andmodel: the expense related to this grant will bethese grants is recognized during the period, if any, in which one of theeach performance milestonesmilestone is achieved. The awards will not vest unless one of the performance milestones is achieved or the market condition is met. Changes in the estimate of probability of achievement of any performance or market condition will be reflected in compensation expense of the period of change and future periods affected by the change.
Clinical Trial and Other Research and Development Expenses Including Clinical Trial Expenses. Clinical trial expenses, which are included in research and development expenses, represent obligations resulting from our contracts with various clinical investigators and clinical research organizations in connection with conducting clinical trials for our product candidates. Such costs are expensed as incurred, and are generally based on the total number of patients in the trial, the rate at which the patients enter the trial and the period over which the clinical investigators and clinical research organizations to provide services. We believe that this method best approximatesaligns the efforts expended on a clinical trial with the expenses we record. We adjust our rate of clinical expense recognition if actual results differ from our estimates. In addition to clinical trial expenses, we estimate the amounts of other research and development expenses, for which invoices have not been received at the end of a period, based upon communication with third parties that have provided services or goods during the period. Such estimates are subject to change as additional information becomes available.
Fair Value Measurements. Our available-for-sale investment portfolio consists of money market funds and $2.4 million face amount of auction rate securities (ARS), and is recorded at fair value in the accompanying Consolidated Balance Sheets in accordance with ASC 320 Investments – Debt and Equity Securities. The change in the fair value of these investments is recorded as a component of other comprehensive income (loss).
We expect to recover the amortized cost of all of our investments at maturity. Currently, weWe currently do not anticipate having to sell these securities in order to operate our business and we believe that it is not more likely than not that we will be required to sell these securities before recovery of principal. We do not believe the carrying values of our ARS investments are other than temporarily impaired and therefore expect the positions will eventually be liquidated without significant loss. We monitor markets for our investments and consider the impact, if any, of market conditions on the fair market value of our investments.
Valuation of securities is subject to uncertainties that are difficult to predict, such as changes to credit ratings of the securities and/or the underlying assets supporting them, default rates applicable to the underlying assets, underlying collateral value, discount rates, counterparty risk, ongoing strength and quality of market credit and liquidity and general economic and market conditions. The valuation of the auction rate securities we holdARS in our portfolio is based on an internal analysis of timing of expected future successful auctions, collateralization of underlying assets of the security and credit quality of the security.
Contingent Consideration Liability. The estimated fair value of the contingent consideration liability, initially measured and recorded on the acquisition date, is considered to be a Level 3 instrument and is reviewed quarterly, or whenever events or circumstances occur that indicate a change in fair value. The contingent consideration liability is recorded at fair value at the end of each period.
Our primary investment objective is to preserve principal. Our money market funds and auction rate securitiesARS have interest rates that were variable and totaled $59,464$62,572 at December 31, 2012.2013. As a result, we do not believe that these investment balances have a material exposure to interest-rate risk.
At December 31, 2012,that date, we continue to holdheld approximately $3,240 (5.4%$2,208 (3.53% of assets measured at fair value) carrying amount of auction rate securities,ARS, in respect of which we have received all scheduled interest payments. The principal amount of these remaining auction rate securitiesARS will not be accessible until the issuer calls or restructures the underlying security, the underlying security matures and is paid or a buyer outside the auction process emerges.
We continue to monitor the market for auction rate securitiesARS and consider the impact, if any, of market conditions on the fair market value of ourthese investments. We believe that the failed auctions experienced to date are not a result of the deterioration of the underlying credit quality of these securities, although valuation of them is subject to uncertainties that are difficult to predict, such as changes to credit ratings of the securities and/or the underlying assets supporting them, default rates applicable to the underlying assets, underlying collateral value, discount rates, counterparty risk, ongoing strength and quality of market credit and liquidity, and general economic and market conditions. We do not believe the carrying values of these auction rate securitiesthe ARS that we hold are other than temporarily impaired and therefore expect the positions will eventually be liquidated without significant loss.
The valuation of the auction rate securitiesARS we hold is based on an internal analysis of timing of expected future successful auctions, collateralization of underlying assets of the security and credit quality of the security. We re-evaluatedAs a result of re-evaluating the valuation of these securities as of December 31, 2012 and2013, we reduced the temporary impairment amount decreased $8to $192 from $268$260 at December 31, 2011 to $260.2012. A 100 basis point increase to our internal analysis would result in a $35$24 increase in the temporary impairment of these securities as of December 31, 2012.2013.
See page F-1, Index to Consolidated Financial Statements.
None.
Evaluation of Disclosure Controls and Procedures
We maintain disclosure controls and procedures that are designed to ensure that information required to be disclosed in our Exchange Act reports is recorded, processed, summarized and reported within the timelines specified in the SEC's rules and forms, and that such information is accumulated and communicated to our management, including our Chief Executive Officer (CEO) and Treasurer,Principal Financial Officer (PFO), as appropriate, to allow timely decisions regarding required disclosure. In designing and evaluating the disclosure controls and procedures, management recognized that any controls and procedures, no matter how well designed and operated, can only provide reasonable assurance of achieving the desired control objectives, and in reaching a reasonable level of assurance, management necessarily was required to apply its judgment in evaluating the cost-benefit relationship of possible controls and procedures. We have a Disclosure Committee consisting of members of our senior management which monitors and implements our policy of disclosing material information concerning the Company in accordance with applicable law.
As required by SEC Rule 13a-15(e), we carried out an evaluation, under the supervision and with the participation of our management, including our CEO and Treasurer,PFO, of the effectiveness of the design and operation of our disclosure controls and procedures as of the end of the period covered by this report. Based on the foregoing, our CEO and TreasurerPFO concluded that our current disclosure controls and procedures, as designed and implemented, were effective at the reasonable assurance level.
Changes in Internal Control over Financial Reporting
There have been no changes in our internal control over financial reporting, as such term is defined in the Exchange Act Rules 13a-15(f) and 15d-15(f) during our fiscal quarter ended December 31, 20122013 that have materially affected, or are reasonably likely to materially affect, our internal control over financial reporting.
Management's Report on Internal Control Over Financial Reporting
Internal control over financial reporting is a process designed by, or under the supervision of, our principal executiveCEO and principal financial officersPFO and effected by our Board, management and other personnel to provide reasonable assurance regarding the reliability of financial reporting and the preparation of financial statements for external purposes in accordance with generally accepted accounting principles. Our management is responsible for establishing and maintaining adequate internal control over financial reporting and itwhich includes policies and procedures that:
| · | Pertain to the maintenance of records that in reasonable detail accurately and fairly reflect the transactions and dispositions of |
| · | Provide reasonable assurance that transactions are recorded as necessary to permit preparation of financial statements in accordance with generally accepted accounting principles, and that |
| · | Provide reasonable assurance regarding prevention or timely detection of unauthorized acquisition, use or disposition of |
Because of its inherent limitations, internal control over financial reporting may not prevent or detect misstatements. Projections of any evaluation of effectiveness to future periods are subject to the risk that controls may become inadequate because of changes in conditions, or that the degree of compliance with the policies or procedures may deteriorate.
Management has used the framework set forth in the report entitled Internal Control – Integrated Framework issued by the Committee of Sponsoring Organizations of the Treadway Commission (1992 framework), known as COSO, to evaluate the effectiveness of our internal control over financial reporting. Management has concluded that our internal control over financial reporting was effective as of December 31, 2012.2013. The effectiveness of our internal control over financial reporting has been audited by Ernst & Young LLP, an independent registered public accounting firm, as of December 31, 20122013 as stated in their report which is provided below.
Report of Independent Registered Public Accounting Firm
The Board of Directors and Stockholders of Progenics Pharmaceuticals, Inc.
We have audited Progenics Pharmaceuticals, Inc.'s internal control over financial reporting as of December 31, 2012,2013, based on criteria established in Internal Control—Integrated Framework issued by the Committee of Sponsoring Organizations of the Treadway Commission (1992 framework) (the COSO criteria). Progenics Pharmaceuticals, Inc.'s management is responsible for maintaining effective internal control over financial reporting, and for its assessment of the effectiveness of internal control over financial reporting included in the accompanying Management's Report on Internal Control Over Financial Reporting. Our responsibility is to express an opinion on the Company's internal control over financial reporting based on our audit.
We conducted our audit in accordance with the standards of the Public Company Accounting Oversight Board (United States). Those standards require that we plan and perform the audit to obtain reasonable assurance about whether effective internal control over financial reporting was maintained in all material respects. Our audit included obtaining an understanding of internal control over financial reporting, assessing the risk that a material weakness exists, testing and evaluating the design and operating effectiveness of internal control based on the assessed risk, and performing such other procedures as we considered necessary in the circumstances. We believe that our audit provides a reasonable basis for our opinion.
A company's internal control over financial reporting is a process designed to provide reasonable assurance regarding the reliability of financial reporting and the preparation of financial statements for external purposes in accordance with generally accepted accounting principles. A company's internal control over financial reporting includes those policies and procedures that (1) pertain to the maintenance of records that, in reasonable detail, accurately and fairly reflect the transactions and dispositions of the assets of the company; (2) provide reasonable assurance that transactions are recorded as necessary to permit preparation of financial statements in accordance with generally accepted accounting principles, and that receipts and expenditures of the company are being made only in accordance with authorizations of management and directors of the company; and (3) provide reasonable assurance regarding prevention or timely detection of unauthorized acquisition, use, or disposition of the company's assets that could have a material effect on the financial statements.
Because of its inherent limitations, internal control over financial reporting may not prevent or detect misstatements. Also, projections of any evaluation of effectiveness to future periods are subject to the risk that controls may become inadequate because of changes in conditions, or that the degree of compliance with the policies or procedures may deteriorate.
In our opinion, Progenics Pharmaceuticals, Inc. maintained, in all material respects, effective internal control over financial reporting as of December 31, 2012,2013, based on the COSO criteria.
We also have audited, in accordance with the standards of the Public Company Accounting Oversight Board (United States), the consolidated balance sheetsheets of Progenics Pharmaceuticals, Inc. as of December 31, 2013 and 2012, and the related consolidated statementstatements of income andoperations, comprehensive (loss) income, stockholders' equity, and cash flows for the yearyears then ended December 31, 2012 of Progenics Pharmaceuticals, Inc. and our report dated March 15, 201313, 2014 expressed an unqualified opinion thereon.
/s/ Ernst & Young LLP
Hartford, Connecticut
March 15, 201313, 2014
None.
PART III
The information required by the Form 10-K Items listed in the following table will be included under the respective headings specified for such Items in our definitive proxy statement for our 20132014 Annual Meeting of Stockholders to be filed with the SEC:
| Item of Form 10-K | Location in | |
| Directors, Executive Officers and Corporate Governance | Election of Directors. Code of Section 16(a) Beneficial Ownership Reporting and Compliance. *The full text of our | |
| Executive Compensation | Executive Compensation. Compensation Committee Report. Compensation Committee Interlocks and Insider Participation. | |
| Security Ownership of Certain Beneficial Owners and Management and Related Stockholder Matters | Equity Compensation Plan Information. Security Ownership of Certain Beneficial Owners and Management. | |
| Certain Relationships and Related Transactions, and Director Independence | Certain Relationships and Related Transactions. Affirmative Determinations Regarding Director Independence and Other Matters. | |
| Principal Accounting Fees and Services | Fees Billed for Services Rendered by our Independent Registered Public Accounting Firm. Pre-approval of Audit and Non-Audit Services by the Audit Committee. |
PART IV
The following documents or the portions thereof indicated are filed as a part of this Annual Report.
| (a) | Documents filed as part of this Annual Report: |
Consolidated Financial Statements of Progenics Pharmaceuticals, Inc.:
Reports of Independent Registered Public Accounting Firms
Consolidated Balance Sheets at December 31, 20122013 and 20112012
Consolidated Statements of Operations for the years ended December 31, 2013, 2012 2011 and 20102011
Consolidated Statements of Comprehensive (Loss) Income for the years ended December 31, 2013, 2012 2011 and 20102011
Consolidated Statements of Stockholders' Equity for the years ended December 31, 2013, 2012 2011 and 20102011
Consolidated Statements of Cash Flows for the years ended December 31, 2013, 2012 2011 and 20102011
Notes to Consolidated Financial Statements
| (b) | Financial Statement Schedules |
Financial statement schedules referred to in Item 12-01 of Regulation S-X and not listed above are inapplicable and therefore have been omitted.
| (c) | Item 601 Exhibits |
Exhibits required to be filed by Item 601 of Regulation S-K are listed in the Exhibit Index immediately following the signature page of this Report and incorporated herein by reference.
PROGENICS PHARMACEUTICALS, INC.
| Page | |
| F-2 | |
| Financial Statements: | |
| F-3 | |
| F-4 | |
| F-5 | |
| F-6 | |
| F-7 | |
| F-8 |
The Board of Directors and Stockholders of Progenics Pharmaceuticals, Inc.
We have audited the accompanying consolidated balance sheetsheets of Progenics Pharmaceuticals, Inc. as of December 31, 2013 and 2012, and the related consolidated statementstatements of operations, and comprehensive loss,(loss) income, stockholders' equity, and cash flows for the year ended December 31, 2012.years then ended. Our audits also included the financial statement schedule listed in the Index at Item 15(b). These financial statements and schedule are the responsibility of the Company's management. Our responsibility is to express an opinion on these financial statements and schedule based on our audit.audits.
We conducted our auditaudits in accordance with the standards of the Public Company Accounting Oversight Board (United States). Those standards require that we plan and perform the audit to obtain reasonable assurance about whether the financial statements are free of material misstatement. An audit includes examining, on a test basis, evidence supporting the amounts and disclosures in the financial statements. An audit also includes assessing the accounting principles used and significant estimates made by management, as well as evaluating the overall financial statement presentation. We believe that our audit providesaudits provide a reasonable basis for our opinion.
In our opinion, the financial statements referred to above present fairly, in all material respects, the consolidated financial position of Progenics Pharmaceuticals, Inc. at December 31, 2013 and 2012, and the consolidated results of its operations and its cash flows for the yearyears then ended, December 31, 2012, in conformity with U.S. generally accepted accounting principles. Also, in our opinion, the related financial statement schedule, when considered in relation to the basic financial statements taken as a whole, presents fairly in all material respects information set forth therein.
We also have audited, in accordance with the standards of the Public Company Accounting Oversight Board (United States), Progenics Pharmaceuticals, Inc.'s internal control over financial reporting as of December 31, 2012,2013, based on criteria established in Internal Control-Integrated Framework issued by the Committee of Sponsoring Organizations of the Treadway Commission (1992 framework) and our report dated March 15, 201313, 2014 expressed an unqualified opinion thereon.
/s/ Ernst & Young LLP
Hartford, Connecticut
March 15, 201313, 2014
REPORT OF INDEPENDENT REGISTERED PUBLIC ACCOUNTING FIRM
To the Board of Directors and Stockholders of Progenics Pharmaceuticals, Inc.
In our opinion, the consolidated balance sheet as of December 31, 2011 and the related consolidated statements of operations, and comprehensive income (loss), of stockholders' equity and of cash flows for each of the two years in the periodyear ended December 31, 2011 present fairly, in all material respects, the financial positionresults of operations and cash flows of Progenics Pharmaceuticals, Inc. and its subsidiaries at December 31, 2011, andfor the results of their operations and their cash flows for each of the two years in the periodyear ended December 31, 2011, in conformity with accounting principles generally accepted in the United States of America. These financial statements are the responsibility of the Company's management. Our responsibility is to express an opinion on these financial statements based on our audits.audit. We conducted our auditsaudit of these statements in accordance with the standards of the Public Company Accounting Oversight Board (United States). Those standards require that we plan and perform the auditsaudit to obtain reasonable assurance about whether the financial statements are free of material misstatement. An audit includes examining, on a test basis, evidence supporting the amounts and disclosures in the financial statements, assessing the accounting principles used and significant estimates made by management, and evaluating the overall financial statement presentation. We believe that our audits provideaudit provides a reasonable basis for our opinion.
/s/ PricewaterhouseCoopers LLP
New York, New York
March 15, 2012
PROGENICS PHARMACEUTICALS, INC.
(amounts in thousands, except for par value and share amounts)
| December 31, | December 31, | |||||||||||||||
| 2012 | 2011 | 2012 | 2012 | |||||||||||||
Assets | ||||||||||||||||
| Assets | ||||||||||||||||
| Current assets: | ||||||||||||||||
| Cash and cash equivalents | $ | 58,838 | $ | 70,105 | $ | 65,860 | $ | 58,838 | ||||||||
| Accounts receivable | 6,937 | 1,516 | ||||||||||||||
| Accounts receivable, net | 2,879 | 6,937 | ||||||||||||||
| Other current assets | 1,692 | 919 | 1,943 | 1,692 | ||||||||||||
| Total current assets | 67,467 | 72,540 | 70,682 | 67,467 | ||||||||||||
| Auction rate securities | 3,240 | 3,332 | 2,208 | 3,240 | ||||||||||||
| Fixed assets, at cost, net of accumulated depreciation and amortization | 3,399 | 4,038 | 2,413 | 3,399 | ||||||||||||
| Intangible assets, net (Note 3) | 31,379 | - | ||||||||||||||
| Goodwill | 7,702 | - | ||||||||||||||
| Deferred tax assets – long term | 2,052 | - | - | 2,052 | ||||||||||||
| Other assets | 150 | 200 | 157 | 150 | ||||||||||||
| Total assets | $ | 76,308 | $ | 80,110 | $ | 114,541 | $ | 76,308 | ||||||||
Liabilities and Stockholders' Equity | ||||||||||||||||
| Liabilities and Stockholders' Equity | ||||||||||||||||
| Current liabilities: | ||||||||||||||||
| Accounts payable and accrued expenses | $ | 5,640 | $ | 6,331 | $ | 6,512 | $ | 5,640 | ||||||||
| Deferred tax liability - current | 2,069 | - | - | 2,069 | ||||||||||||
| Deferred revenue - current | 838 | 204 | - | 838 | ||||||||||||
| Other current liabilities | 115 | 115 | 115 | 115 | ||||||||||||
| Total current liabilities | 8,662 | 6,650 | 6,627 | 8,662 | ||||||||||||
| Deferred revenue - long term | - | 162 | ||||||||||||||
| Contingent consideration liability | 15,700 | - | ||||||||||||||
| Deferred tax liability - long term | 12,321 | - | ||||||||||||||
| Other liabilities | 1,078 | 1,497 | 914 | 1,078 | ||||||||||||
| Total liabilities | 9,740 | 8,309 | 35,562 | 9,740 | ||||||||||||
| Commitments and contingencies (Note 9) | ||||||||||||||||
| Commitments and contingencies (Note 10) | ||||||||||||||||
| Stockholders' equity: | ||||||||||||||||
| Preferred stock, $.001 par value; 20,000,000 shares authorized; issued and outstanding – none | - | - | - | - | ||||||||||||
| Common stock, $.0013 par value; 80,000,000 shares authorized; issued – 46,765,472 in 2012 and 34,046,409 in 2011 | 61 | 44 | ||||||||||||||
| Common stock, $.0013 par value; shares authorized - 160,000,000 in 2013 and 80,000,000 in 2012; issued – 61,025,404 in 2013 and 46,765,472 in 2012 | 79 | 61 | ||||||||||||||
| Additional paid-in capital | 493,613 | 463,440 | 548,510 | 493,613 | ||||||||||||
| Accumulated deficit | (424,105 | ) | (388,674 | ) | (466,677 | ) | (424,105 | ) | ||||||||
| Accumulated other comprehensive loss | (260 | ) | (268 | ) | (192 | ) | (260 | ) | ||||||||
| Treasury stock, at cost (200,000 shares in 2012 and 2011) | (2,741 | ) | (2,741 | ) | ||||||||||||
| Treasury stock, at cost (200,000 shares in 2013 and 2012) | (2,741 | ) | (2,741 | ) | ||||||||||||
| Total stockholders' equity | 66,568 | 71,801 | 78,979 | 66,568 | ||||||||||||
| Total liabilities and stockholders' equity | $ | 76,308 | $ | 80,110 | $ | 114,541 | $ | 76,308 | ||||||||
The accompanying notes are an integral part of the financial statements.
PROGENICS PHARMACEUTICALS, INC.
(amounts in thousands, except net (loss) income per share)
| Years Ended December 31, | Years Ended December 31, | |||||||||||||||||||||||
| 2012 | 2011 | 2010 | 2013 | 2012 | 2011 | |||||||||||||||||||
| Revenues: | ||||||||||||||||||||||||
| Royalty income | $ | 4,963 | $ | 3,046 | $ | 1,826 | $ | 5,923 | $ | 4,963 | $ | 3,046 | ||||||||||||
| Collaboration revenue | 8,525 | 76,764 | 1,413 | 1,595 | 8,525 | 76,764 | ||||||||||||||||||
| Research grants | 488 | 4,810 | 4,573 | 275 | 488 | 4,810 | ||||||||||||||||||
| Other revenues | 72 | 176 | 140 | 69 | 72 | 176 | ||||||||||||||||||
| Total revenues | 14,048 | 84,796 | 7,952 | 7,862 | 14,048 | 84,796 | ||||||||||||||||||
| Expenses: | ||||||||||||||||||||||||
| Research and development | 31,840 | 53,183 | 50,640 | 33,903 | 31,840 | 53,183 | ||||||||||||||||||
| License fees – research and development | 1,170 | 578 | 1,270 | 567 | 1,170 | 578 | ||||||||||||||||||
| Royalty expense | 499 | 405 | 241 | 624 | 499 | 405 | ||||||||||||||||||
| General and administrative | 14,706 | 18,248 | 22,832 | 14,809 | 14,706 | 18,248 | ||||||||||||||||||
| Depreciation and amortization | 1,324 | 2,066 | 2,853 | 939 | 1,324 | 2,066 | ||||||||||||||||||
| Total expenses | 49,539 | 74,480 | 77,836 | 50,842 | 49,539 | 74,480 | ||||||||||||||||||
| Operating (loss) income | (35,491 | ) | 10,316 | (69,884 | ) | (42,980 | ) | (35,491 | ) | 10,316 | ||||||||||||||
| Other income: | ||||||||||||||||||||||||
| Interest income | 60 | 65 | 64 | 46 | 60 | 65 | ||||||||||||||||||
| Total other income | 60 | 65 | 64 | 46 | 60 | 65 | ||||||||||||||||||
| Net (loss) income before income taxes | (35,431 | ) | 10,381 | (69,820 | ) | |||||||||||||||||||
| Net (loss) income before provision for income taxes | (42,934 | ) | (35,431 | ) | 10,381 | |||||||||||||||||||
| Income tax benefit | - | - | 95 | 362 | - | - | ||||||||||||||||||
| Net (loss) income | $ | (35,431 | ) | $ | 10,381 | $ | (69,725 | ) | $ | (42,572 | ) | $ | (35,431 | ) | $ | 10,381 | ||||||||
| Net (loss) income per share - basic | $ | (1.02 | ) | $ | 0.31 | $ | (2.14 | ) | $ | (0.76 | ) | $ | (1.02 | ) | $ | 0.31 | ||||||||
| Weighted-average shares - basic | 34,754 | 33,375 | 32,590 | 55,798 | 34,754 | 33,375 | ||||||||||||||||||
| Net (loss) income per share - diluted | $ | (1.02 | ) | $ | 0.31 | $ | (2.14 | ) | $ | (0.76 | ) | $ | (1.02 | ) | $ | 0.31 | ||||||||
| Weighted-average shares - diluted | 34,754 | 33,494 | 32,590 | 55,798 | 34,754 | 33,494 | ||||||||||||||||||
The accompanying notes are an integral part of the financial statements.
PROGENICS PHARMACEUTICALS, INC.
(amounts in thousands)
| Years Ended December 31, | ||||||||||||||||||||||||
| 2012 | 2011 | 2010 | Years Ended December 31, | |||||||||||||||||||||
| 2013 | 2012 | 2011 | ||||||||||||||||||||||
| Net (loss) income | $ | (35,431 | ) | $ | 10,381 | $ | (69,725 | ) | $ | (42,572 | ) | $ | (35,431 | ) | $ | 10,381 | ||||||||
| Other comprehensive income: | ||||||||||||||||||||||||
| Net change in unrealized loss on auction rate securities | 8 | 24 | 15 | 68 | 8 | 24 | ||||||||||||||||||
| Total other comprehensive income | 8 | 24 | 15 | 68 | 8 | 24 | ||||||||||||||||||
| Comprehensive (loss) income | $ | (35,423 | ) | $ | 10,405 | $ | (69,710 | ) | $ | (42,504 | ) | $ | (35,423 | ) | $ | 10,405 | ||||||||
The accompanying notes are an integral part of the financial statements.
PROGENICS PHARMACEUTICALS, INC.
For the Years Ended December 31, 2013, 2012 2011 and 2010
2011
2011
(amounts in thousands)
| Common Stock | Additional | Accumulated Other | Treasury Stock | Common Stock | Additional | Accumulated Other | Treasury Stock | |||||||||||||||||||||||||||||||||||||||||||||||||||||||||
| Shares | Amount | Paid-In Capital | Accumulated Deficit | Comprehensive Income (Loss) | Shares | Amount | Total | Shares | Amount | Paid-In Capital | Accumulated Deficit | Comprehensive Income (Loss) | Shares | Amount | Total | |||||||||||||||||||||||||||||||||||||||||||||||||
| Balance at December 31, 2009 | 32,142 | $ | 42 | $ | 439,943 | $ | (329,330 | ) | $ | (307 | ) | (200 | ) | $ | (2,741 | ) | $ | 107,607 | ||||||||||||||||||||||||||||||||||||||||||||||
| Balance at December 31, 2010 | 33,326 | $ | 43 | $ | 453,353 | $ | (399,055 | ) | $ | (292 | ) | (200 | ) | $ | (2,741 | ) | $ | 51,308 | ||||||||||||||||||||||||||||||||||||||||||||||
| Net loss | - | - | - | (69,725 | ) | - | - | - | (69,725 | ) | - | - | - | 10,381 | - | - | - | 10,381 | ||||||||||||||||||||||||||||||||||||||||||||||
| Other comprehensive income | - | - | - | - | 15 | - | - | 15 | ||||||||||||||||||||||||||||||||||||||||||||||||||||||||
| Compensation expenses for share-based payment arrangements | - | - | 9,515 | - | - | - | - | 9,515 | ||||||||||||||||||||||||||||||||||||||||||||||||||||||||
| Issuance of restricted stock, net of forfeitures | 173 | - | - | - | - | - | - | - | ||||||||||||||||||||||||||||||||||||||||||||||||||||||||
| Sale of common stock under employee stock purchase plans and exercise of stock options | 1,011 | 1 | 3,895 | - | - | - | - | 3,896 | ||||||||||||||||||||||||||||||||||||||||||||||||||||||||
| Balance at December 31, 2010 | 33,326 | 43 | 453,353 | (399,055 | ) | (292 | ) | (200 | ) | (2,741 | ) | 51,308 | ||||||||||||||||||||||||||||||||||||||||||||||||||||
| Net income | - | - | - | 10,381 | - | - | - | 10,381 | ||||||||||||||||||||||||||||||||||||||||||||||||||||||||
| Other comprehensive income | - | - | - | - | 24 | - | - | 24 | - | - | - | - | 24 | - | - | 24 | ||||||||||||||||||||||||||||||||||||||||||||||||
| Compensation expenses for share-based payment arrangements | - | - | 6,362 | - | - | - | - | 6,362 | - | - | 6,362 | - | - | - | - | 6,362 | ||||||||||||||||||||||||||||||||||||||||||||||||
| Forfeitures of restricted stock | (38 | ) | - | - | - | - | - | - | - | (38 | ) | - | - | - | - | - | - | - | ||||||||||||||||||||||||||||||||||||||||||||||
| Sale of common stock under employee stock purchase plans and exercise of stock options | 758 | 1 | 3,725 | - | - | - | - | 3,726 | 758 | 1 | 3,725 | - | - | - | - | 3,726 | ||||||||||||||||||||||||||||||||||||||||||||||||
| Balance at December 31, 2011 | 34,046 | 44 | 463,440 | (388,674 | ) | (268 | ) | (200 | ) | (2,741 | ) | 71,801 | 34,046 | 44 | 463,440 | (388,674 | ) | (268 | ) | (200 | ) | (2,741 | ) | 71,801 | ||||||||||||||||||||||||||||||||||||||||
| Net loss | - | - | - | (35,431 | ) | - | - | - | (35,431 | ) | ||||||||||||||||||||||||||||||||||||||||||||||||||||||
| Net income | - | - | - | (35,431 | ) | - | - | - | (35,431 | ) | ||||||||||||||||||||||||||||||||||||||||||||||||||||||
| Other comprehensive income | - | - | - | - | 8 | - | - | 8 | - | - | - | - | 8 | - | - | 8 | ||||||||||||||||||||||||||||||||||||||||||||||||
| Compensation expenses for share-based payment arrangements | - | - | 6,536 | - | - | - | - | 6,536 | - | - | 6,536 | - | - | - | - | 6,536 | ||||||||||||||||||||||||||||||||||||||||||||||||
| Sale of common stock in public offering, net of underwriting discounts and commissions ($1,518) and offering expenses ($434) | 12,650 | 17 | 23,331 | - | - | - | - | 23,348 | 12,650 | 17 | 23,331 | - | - | - | - | 23,348 | ||||||||||||||||||||||||||||||||||||||||||||||||
| Forfeitures of restricted stock | (6 | ) | - | - | - | - | - | - | - | (6 | ) | - | - | - | - | - | - | - | ||||||||||||||||||||||||||||||||||||||||||||||
| Sale of common stock under stock incentive plan and exercise of stock options | 75 | - | 306 | - | - | - | - | 306 | ||||||||||||||||||||||||||||||||||||||||||||||||||||||||
| Sale of common stock under employee stock purchase plans and exercise of stock options | 75 | - | 306 | - | - | - | - | 306 | ||||||||||||||||||||||||||||||||||||||||||||||||||||||||
| Balance at December 31, 2012 | 46,765 | $ | 61 | $ | 493,613 | $ | (424,105 | ) | $ | (260 | ) | (200 | ) | $ | (2,741 | ) | $ | 66,568 | 46,765 | 61 | 493,613 | (424,105 | ) | (260 | ) | (200 | ) | (2,741 | ) | 66,568 | ||||||||||||||||||||||||||||||||||
| Net loss | - | - | - | (42,572 | ) | - | - | - | (42,572 | ) | ||||||||||||||||||||||||||||||||||||||||||||||||||||||
| Other comprehensive income | - | - | - | - | 68 | - | - | 68 | ||||||||||||||||||||||||||||||||||||||||||||||||||||||||
| Compensation expenses for share-based payment arrangements | - | - | 3,546 | - | - | - | - | 3,546 | ||||||||||||||||||||||||||||||||||||||||||||||||||||||||
| Acquisition of subsidiary, net of issuance costs | 4,472 | 6 | 11,214 | - | - | - | - | 11,220 | ||||||||||||||||||||||||||||||||||||||||||||||||||||||||
| Sale of common stock in public offering, net of underwriting discounts and commissions ($2,581) and offering expenses ($351) | 9,775 | 12 | 40,066 | - | - | - | - | 40,078 | ||||||||||||||||||||||||||||||||||||||||||||||||||||||||
| Forfeitures of restricted stock | (1 | ) | - | - | - | - | - | - | - | |||||||||||||||||||||||||||||||||||||||||||||||||||||||
| Exercise of stock options | 14 | - | 71 | - | - | - | - | 71 | ||||||||||||||||||||||||||||||||||||||||||||||||||||||||
| Balance at December 31, 2013 | 61,025 | $ | 79 | $ | 548,510 | $ | (466,677 | ) | $ | (192 | ) | (200 | ) | $ | (2,741 | ) | $ | 78,979 | ||||||||||||||||||||||||||||||||||||||||||||||
The accompanying notes are an integral part of the financial statements.
PROGENICS PHARMACEUTICALS, INC.
(amounts in thousands)
| Years Ended December 31, | Years Ended December 31, | |||||||||||||||||||||||
| 2012 | 2011 | 2010 | 2013 | 2012 | 2011 | |||||||||||||||||||
| Cash flows from operating activities: | ||||||||||||||||||||||||
| Net (loss) income | $ | (35,431 | ) | $ | 10,381 | $ | (69,725 | ) | $ | (42,572 | ) | $ | (35,431 | ) | $ | 10,381 | ||||||||
| Adjustments to reconcile net (loss) income to net cash (used in) provided by operating activities: | ||||||||||||||||||||||||
| Depreciation and amortization | 1,324 | 2,066 | 2,853 | 939 | 1,324 | 2,066 | ||||||||||||||||||
| Gains on sales of fixed assets | (327 | ) | - | - | ||||||||||||||||||||
| Losses (gains) on sales of fixed assets | 204 | (327 | ) | - | ||||||||||||||||||||
| Intangible impairment charge | 919 | - | - | |||||||||||||||||||||
| Deferred income tax | (362 | ) | - | - | ||||||||||||||||||||
| Change in contingent consideration liability | (200 | ) | - | - | ||||||||||||||||||||
| Expenses for share-based compensation awards | 6,536 | 6,362 | 9,515 | 3,546 | 6,536 | 6,362 | ||||||||||||||||||
| Changes in assets and liabilities: | ||||||||||||||||||||||||
| (Increase) decrease in accounts receivable | (5,421 | ) | 767 | 5,239 | ||||||||||||||||||||
| (Increase) decrease in other current assets | (754 | ) | 882 | (333 | ) | |||||||||||||||||||
| (Increase) decrease in deferred tax and other assets | (2,002 | ) | 1,050 | 617 | ||||||||||||||||||||
| (Decrease) increase in accounts payable and accrued expenses | (691 | ) | (3,352 | ) | 3,847 | |||||||||||||||||||
| Increase in deferred revenue – current | 634 | 204 | - | |||||||||||||||||||||
| Increase (decrease) in deferred tax and other current liabilities | 2,069 | 3 | (58 | ) | ||||||||||||||||||||
| Decrease (increase) in accounts receivable | 4,114 | (5,421 | ) | 767 | ||||||||||||||||||||
| Decrease (increase) in other current assets | 336 | (754 | ) | 882 | ||||||||||||||||||||
| Decrease (increase) in deferred tax and other assets | 2,044 | (2,002 | ) | 1,050 | ||||||||||||||||||||
| (Decrease) in accounts payable and accrued expenses | (1,956 | ) | (691 | ) | (3,352 | ) | ||||||||||||||||||
| (Decrease) increase in deferred revenue – current | (886 | ) | 634 | 204 | ||||||||||||||||||||
| (Decrease) increase in deferred tax and other current liabilities | (2,069 | ) | 2,069 | 3 | ||||||||||||||||||||
| (Decrease) increase in deferred revenue - long term | (162 | ) | 162 | - | - | (162 | ) | 162 | ||||||||||||||||
| (Decrease) increase in other liabilities | (419 | ) | (138 | ) | 1,635 | |||||||||||||||||||
| (Decrease) in other liabilities | (164 | ) | (419 | ) | (138 | ) | ||||||||||||||||||
| Net cash (used in) provided by operating activities | (34,644 | ) | 18,387 | (46,410 | ) | (36,107 | ) | (34,644 | ) | 18,387 | ||||||||||||||
| Cash flows from investing activities: | ||||||||||||||||||||||||
| Cash acquired in acquisition of subsidiary | 1,888 | - | - | |||||||||||||||||||||
| Capital expenditures | (767 | ) | (226 | ) | (2,171 | ) | (137 | ) | (767 | ) | (226 | ) | ||||||||||||
| Proceeds from sales of fixed assets | 390 | - | - | 174 | 390 | - | ||||||||||||||||||
| Proceeds from redemption of auction rate securities | 100 | 300 | 1,700 | 1,100 | 100 | 300 | ||||||||||||||||||
| Net cash (used in) provided by investing activities | (277 | ) | 74 | (471 | ) | |||||||||||||||||||
| Net cash provided by (used in) investing activities | 3,025 | (277 | ) | 74 | ||||||||||||||||||||
| Cash flows from financing activities: | ||||||||||||||||||||||||
| Equity issuance costs in connection with acquisition of subsidiary | (45 | ) | - | - | ||||||||||||||||||||
| Proceeds from public offering of common stock, net of underwriting discounts and commissions and offering expenses | 23,348 | - | - | 40,078 | 23,348 | - | ||||||||||||||||||
| Proceeds from the exercise of stock options and sale of common stock under the employee stock purchase plans | 306 | 3,726 | 3,896 | 71 | 306 | 3,726 | ||||||||||||||||||
| Net cash provided by financing activities | 23,654 | 3,726 | 3,896 | 40,104 | 23,654 | 3,726 | ||||||||||||||||||
| Net (decrease) increase in cash and cash equivalents | (11,267 | ) | 22,187 | (42,985 | ) | |||||||||||||||||||
| Net increase (decrease) in cash and cash equivalents | 7,022 | (11,267 | ) | 22,187 | ||||||||||||||||||||
| Cash and cash equivalents at beginning of period | 70,105 | 47,918 | 90,903 | 58,838 | 70,105 | 47,918 | ||||||||||||||||||
| Cash and cash equivalents at end of period | $ | 58,838 | $ | 70,105 | $ | 47,918 | $ | 65,860 | $ | 58,838 | $ | 70,105 | ||||||||||||
| Supplemental disclosure of cash flow information: | ||||||||||||||||||||||||
| Contingent consideration liability | $ | 15,700 | $ | - | $ | - | ||||||||||||||||||
| Stock acquisition consideration | $ | 11,265 | $ | - | $ | - | ||||||||||||||||||
The accompanying notes are an integral part of the financial statements.
F-7
1. Organization and Business
Progenics Pharmaceuticals, Inc. ("Progenics," "we" or "us") develops innovative medicines for oncology. A significant part of our research andoncology. Our clinical development efforts centerscenter on prostate specific membrane antigen (PSMA), a protein found at high levels on the surface of prostate cancer cells and also on the neovasculature of a number of other types of solid tumors.late-stage oncology assets. We are conducting phase 2 clinical trials of two product candidates for prostate cancer: our therapeutic candidate, PSMA ADC, a fully human monoclonal antibody-drug conjugate (ADC) directed toward PSMA,, and MIP-1404,1404 (trofolastat), an imaging agent candidate, in developmentand resuming a pivotal phase 2 clinical trial of Azedra™, our ultra-orphan radiotherapy candidate for pheochromocytoma. We have also decided to move forward MIP-1095, a compound originally developed by Molecular Insight, Pharmaceuticals, a clinical-stage biotechnology company we acquiredinto clinical development, and expect to file an IND application in January 2013 (see Note 15). Among other assets in our pipeline of targeted radiotherapy and molecular imaging compounds from the acquisition are a group of small molecule therapeutics, MIP-1095, -1555 and -1558, in preclinical study for metastatic prostate cancer and other PSMA-expressing cancers, and Azedra™, an ultra-orphan radiotherapy candidate in phase 2 study for pheochromocytoma and potential additional indications.U.S. later this year.
Our current principal sources of revenue from operations are upfront,royalty, commercialization milestone royalty and revenue-sharing payments from Salix's Relistor operations. Royalty and milestone payments from Relistor depend on success in development and commercialization, which is dependent on many factors, such as the actions of Salix and Ono,Salix's efforts, decisions by the FDA and other regulatory bodies such as the July 2012 Complete Response Letter mentioned below,in respect of the Relistor chronic pain sNDA, competition from drugs for the same or similar indications, and the outcome of clinical and other testing of Relistor, and, to the extent requested by our collaboration partners, our own efforts. We and Salix have sought to expand the availability of subcutaneous Relistor to patients taking opioids for non-cancer pain and who suffer from OIC as a result, and to develop an oral formulation of methylnaltrexone for use by such patients. As previously announced, the FDA in July 2012 issued a Complete Response Letter for the supplemental New Drug Application for Relistor injection for subcutaneous use for the treatment of OIC in adult patients with chronic, non-cancer pain. Salix and Progenics are continuing to work together with the FDA to generate a reasonable path forward for the further development and regulatory review of Relistor, and while is not possible to determine definitively the duration of discussions with the FDA regarding this matter, at this time Salix and Progenics anticipate a path forward could be reached with the FDA during 2013.Relistor.
Progenics commenced principal operations in 1988, became publicly traded in 1997 and throughout has been engaged primarily in research and development efforts, establishing corporate collaborations and related activities. Certain of our intellectual property rights are held by wholly owned subsidiaries. None of our subsidiaries other than PSMA Development Company LLC (PSMA LLC) had operations during 2012, 2011 or 2010. All of our operations are conducted at our facilities in Tarrytown, New York. We operate under a single research and development segment.
Funding and Financial Matters. At December 31, 2012,2013, we held $58.8$65.9 million in cash and cash equivalents, a decreasean increase of $11.3$7.1 million from $70.1$58.8 million at December 31, 2011.2012. We expect that this amount, together with the additional 2014 public offering proceeds, will be sufficient to fund operations as currently anticipated beyond one year. We may require additional funding in the future, and ifif we are unable to conclude favorable collaboration, license, asset sale, capital raising or other financing transactions, we will have to reduce, delay or eliminate spending on some current operations, and/or reduce salary and other overhead expenses, to extend our remaining operations. We expect to incur operating losses during the near term. At December 31, 2012,2013, cash, cash equivalents and auction rate securities decreased $11.3increased $6.0 million to $62.1$68.1 million from $73.4$62.1 million at December 31, 2011.2012.
2. Acquisition of Molecular Insight Pharmaceuticals, Inc.
Molecular Insight's operations from January 18, 2013, the date we acquired this subsidiary which significantly expanded the Company's focus on PSMA as an oncology target while broadening the oncology pipeline, are included in the Consolidated Financial Statements. The acquisition consideration included 4,566,210 shares (500,000 of which were placed in an escrow expiring in April 2014) of Progenics common stock in a private transaction not taxable to Progenics. (The closing NASDAQ market price of Progenics' freely transferable common shares on January 18, 2013 was $2.83 per share.) Under the acquisition agreement, Progenics also agreed to pay to the stockholders potential milestones, in cash or Progenics stock at Progenics' option, of up to $23 million contingent upon achieving specified commercialization events and up to $70 million contingent upon achieving specified sales targets relating to all MIP products. Of the 500,000 placed in escrow, shares have been returned to Progenics to date pursuant to financial adjustment provisions of the agreement.
F-8
PROGENICS PHARMACEUTICALS, INC.
NOTES TO CONSOLIDATED FINANCIAL STATEMENTS ¾- continued
(amounts in thousands, except per share amounts or as otherwise noted)
Purchase Price Allocation: We have accounted for the Molecular Insight acquisition by allocating our estimate of the fair market value of the consideration we paid to the fair values of the assets acquired and liabilities assumed at the effective date of the acquisition, estimated using the valuation models summarized below. Given the uniqueness of and uncertainties attendant to the assets and liabilities, the derived values do not reflect actual transactions or quoted prices. Acquired intangible assets, including goodwill, are not deductible for tax purposes.
| Amount | ||||
| Consideration: | ||||
| Progenics common stock consideration paid | $ | 11,265 | ||
| Contingent consideration (pursuant to future milestone obligations) | 15,900 | |||
| Total consideration | 27,165 | |||
| Tangible assets acquired and liabilities assumed: | ||||
| Cash and cash equivalents | 1,888 | |||
| Accounts receivable | 56 | |||
| Other current assets | 529 | |||
| Fixed assets | 249 | |||
| Accounts payable, accrued expenses and deferred revenue - current | (2,876 | ) | ||
| Deferred tax liability – long term | (12,683 | ) | ||
| Total tangible assets acquired and liabilities assumed | (12,837 | ) | ||
| Intangible assets – in process research and development | 32,300 | |||
| Total tangible and intangible assets acquired and liabilities assumed | 19,463 | |||
| Goodwill | $ | 7,702 | ||
Intangible assets and goodwill: In connection with the acquisition of Molecular Insight, in process research and development and goodwill are initially measured at estimated fair value and capitalized as an intangible asset. We perform an impairment test for these intangibles annually in the fourth quarter, unless impairment indicators require an earlier evaluation. Upon and subject to commercialization of the Company's product candidates, the IPR&D will be amortized over its estimated useful life.
We valued as intangible assets the in process research and development projects acquired as follows:
(i) 1404, an imaging agent in phase 2 development, at an estimated fair value of $23.2 million resulting from a probability adjusted discounted cash flow model which includes estimates of significant cash inflows beginning in 2017 and a 18% discount rate;
F-9
PROGENICS PHARMACEUTICALS, INC.
NOTES TO CONSOLIDATED FINANCIAL STATEMENTS - continued
(amounts in thousands, except per share amounts or as otherwise noted)
(ii) Azedra, a small molecule candidate for the treatment of pheochromocytoma and paraganglioma in phase 2b development, and for neuroblastoma in phase 2a development, at an estimated fair value of $4.9 million resulting from a probability adjusted discounted cash flow model which includes estimates of significant cash inflows beginning in 2017 and a 15% discount rate;
(iii) small molecule candidate MIP-1095, in preclinical development for the treatment of prostate cancer, at an estimated fair value of $2.7 million resulting from a probability adjusted discounted cash flow model which includes estimates of significant cash inflows beginning in 2021 and a 20% discount rate; and
(iv) Onalta, a drug candidate in phase 2 development for the treatment of metastatic carcinoid and pancreatic neuroendocrine tumors, at an estimated fair value of $1.5 million resulting from a probability adjusted discounted cash flow model which includes estimates of significant cash inflows beginning in 2014 and a 15% discount rate.
On the acquisition date, we recorded a contingent consideration liability at an estimated fair value of $15.9 million resulting from probability adjusted discounted cash flow and Monte Carlo simulation models which include estimates of significant milestone payments to former MIP stockholders under the acquisition agreement ranging from 2016 to 2022 and risk adjusted discount rates ranging from 10% to 12.5%.
Pro forma financial information (unaudited): The following unaudited pro forma information presents the results of operations of the combined companies for the periods indicated as if the acquisition had been consummated on January 1, 2012, combining the respective historical results of Progenics and MIP for each period. Non-recurring transaction expenses of $790, incurred in the year ended December 31, 2013, are reflected in the pro forma information as if these were incurred in the corresponding 2012 period, due to the pro forma assumption of January 1, 2012 as the date of the acquisition consummation.
Three Months Ended December 31, | Year Ended December 31, | |||||||||||||||
| 2013 | 2012 | 2013 | 2012 | |||||||||||||
| Revenues | $ | 2,968 | $ | 12,801 | $ | 7,867 | $ | 18,235 | ||||||||
| Net loss | (8,551 | ) | (3,458 | ) | (43,736 | ) | (57,877 | ) | ||||||||
| Basic and diluted loss per share | (0.14 | ) | (0.08 | ) | (0.78 | ) | (1.48 | ) | ||||||||
3. Summary of Significant Accounting Policies
Basis of Presentation
The consolidated financial statements have been prepared on the basis of accounting principles generally accepted in the U.S. (GAAP). The preparation of financial statements in conformity with GAAP requires management to make estimates and assumptions that affect the amounts reported in the financial statements and the accompanying notes. On an ongoing basis, the Company evaluates its estimates, including but not limited to those related to collectability of receivables, intangible assets and contingencies. As additional information becomes available or actual amounts become determinable, the recorded estimates are revised and reflected in the operating results. Actual results could differ from those estimates.
Consolidation
The consolidated financial statements include the accounts of Progenics and PSMA LLC, as of and for the years ended December 31, 2013, 2012 and 2011 and 2010.Molecular from January 18, 2013, the date we acquired this subsidiary. Inter-company transactions have been eliminated in consolidation.
Revenue Recognition
We recognize revenue from all sources based on the provisions of the SEC's Staff Accounting Bulletin (SAB) No. 104 (SAB 104) and ASC 605 Revenue Recognition. Under ASC 605, delivered items are separate units of accounting, provided (i) the delivered items have value to a collaborator on a stand-alone basis, and (ii) if the arrangement includes a general right of return relative to the delivered item, delivery or performance of the undelivered items is considered probable and substantially in our control. A separate update to ASC 605 provides guidance on the criteria that should be met when determining whether the milestone method of revenue recognition is appropriate.
F-10
PROGENICS PHARMACEUTICALS, INC.
NOTES TO CONSOLIDATED FINANCIAL STATEMENTS - continued
(amounts in thousands, except per share amounts or as otherwise noted)
If we are involved in a steering or other committee as part of a multiple-deliverable arrangement, we assess whether our involvement constitutes a performance obligation or a right to participate. For those committees that are deemed obligations, we will evaluate our participation along with other obligations in the arrangement and will attribute revenue to our participation through the period of our committee responsibilities. We recognize revenue for payments that are contingent upon performance solely by our collaborator immediately upon the achievement of the defined event if we have no related performance obligations. Reimbursement of costs is recognized as revenue provided the provisions of ASC 605 are met, the amounts are determinable and collection of the related receivable is reasonably assured.
Amounts received prior to satisfying the above revenue recognition criteria are recorded as deferred revenue. Amounts not expected to be recognized within one year of the balance sheet date are classified as long-term. The estimate of the classification of deferred revenue as short- or long-term is based upon the period in which we expect to perform joint committee services.
Royalty revenue is recognized in the period the sales occur, provided the royalty amounts are fixed or determinable, collection of the related receivable is reasonably assured and we have no remaining performance obligations under the arrangement providing for the royalty.
During 2012, 2011 and 2010,the past three years, we also recognized revenue from sales of research reagents and from government research grants, awarded to us by the National Institutes of Health (NIH), which we used in proprietary research programs. NIH grant revenue is recognized as efforts are expended and as related program costs are incurred. We performperformed work under the NIH grants on a best-effort basis.
Under Molecular's 2013 license of certain research, development and commercialization rights to Onalta™, we received a $0.2 million in upfront payment and are eligible for future milestone and royalty payments. In consideration for the upfront payment, we have delivered relevant know-how (including patent rights), inventory and non-reimbursable services.
In the fourth quarter of 2012, we out-licensed our C. difficile program to MedImmune, LLC for a $5.0 million upfront payment, which has been included in Accounts Receivable at December 31, 2012, and the right to receive potential future milestone and royalty payments.payments. In consideration for the upfront payment, we are responsible for deliveringhave delivered relevant know-how (including patent rights) and non-reimbursable services. As of December 31, 2012, we have delivered the know-how and portion of the non-reimbursable services and as a result $4,997 has been recognized as revenue, with the remaining $3 related to the remaining portion of non- reimbursable services recorded in deferred revenue – current.
Under our 2012 agreement with CytoDyn Inc. for our PRO 140 program, we received in 2012 a $3.5 million payment and are eligible for future milestone and royalty payments. In consideration for the upfront payment, we are responsible for deliveringhave delivered relevant know-how (including patent rights), inventory and non-reimbursable services. Of these deliverables, which have a stand-alone value and represent separate units of accounting, we determined that the know-how and patent rights were delivered for revenue recognition purposes as of December 31, 2012, and we recognized $2,827 as revenue from the $3.5 million upfront payment received. As of December 31, 2012, $673 is recorded in deferred revenue – current, which relates to the transfer of the inventory and the non-reimbursable services.
Under our license agreement, Salix is responsible for further developing and commercializing Relistor worldwide other than Japan, including completing clinical development necessary to support regulatory marketing approvals for potential new indications and formulations. WeJapan. In consideration of the $60.0 million upfront payment from Salix, we have granted Salix an exclusive license of relevant know-how, patent rights and technology, assigned relevant third-party contracts, and performed substantially all of our other transition-related activities as of June 30, 2011. During the second quarter of 2011, we and Salix completed a number of tasks involved in enabling Salix to distribute Relistor in the U.S. and Europe, as well as clinical and regulatory development related activities, and have agreed with Salix on research and development services we are to perform at Salix's direction. We have not performed any significant research and development activities during 2012 or the third and fourth quarters of 2011.
These deliverables, which have stand-alone value and represent separate units of accounting, include (i) the exclusive license which was delivered for revenue recognition purposes during the 2011 second quarter, (ii) performing reimbursable development services at Salix's direction during the 2011 second quarter, the period in which we and Salix finalized the development plan, and (iii) joint committee services, which we expect to performhave been performed through 2013. We determined that the license has stand-alone value as the license was delivered to Salix for revenue recognition purposes in the second quarter of 2011 and Salix is responsible for continuing research and development.
We developed a best estimate of selling price for each deliverable as vendor-specific objective evidence and third-party evidence was not available. We allocated the best estimate of selling price, on a relative basis, to each of the three units of accounting as the $60.0 million upfront payment was the only payment from Salix which was fixed and determinable at the inception of the arrangement. As a result, $58.4 million, $1.1 million and $0.5 million was allocated to the license, reimbursable development services and our participation in the joint committees as provided in the License Agreement, respectively. We recognized $58.4 million for the license and relevant know-how, patent rights and technology and $1.1 million for the reimbursable development services, respectively, during the second quarter of 2011, the period in which we delivered these items and performed the development services. We recognized $0.2 million, $0.2 million and $59.6 million during 2013, 2012 and 2011, respectively. At December 31, 2012, and 2011, the remaining deferred revenue of $0.2 million, and $0.4 million, respectively, pertaining to joint committee services, iswas recognized inas collaboration revenue in 2013, as such activities are performedwere performed.
F-11
PROGENICS PHARMACEUTICALS, INC.
NOTES TO CONSOLIDATED FINANCIAL STATEMENTS - continued
(amounts in the future.thousands, except per share amounts or as otherwise noted)
Ono is responsible for developing and commercializing subcutaneous Relistor in Japan, including conducting the clinical development necessary to support regulatory marketing approval. Ono will own the filings and approvals related to subcutaneous Relistor in Japan. In addition to the $15.0 million upfront payment from Ono, we are entitled to receive up to an additional $20.0 million, payable upon achievement by Ono of its development milestones. Ono is also obligated to pay to us royalties and commercialization milestones on sales by Ono of subcutaneous Relistor in Japan. Ono has the option to acquire from us the rights to develop and commercialize in Japan other formulations of Relistor, including intravenous and oral forms, on terms to be negotiated separately. Ono may request us to perform activities related to its development and commercialization responsibilities, beyond our participation in joint committees and specified technology transfer-related tasks, at its expense payable at the time we perform such services. Revenue earned from activities we perform for Ono is recorded in collaboration revenue. See Note 10.
Research and Development Expenses
Research and development expenses include costs directly attributable to the conduct of research and development programs, including the cost of salaries, payroll taxes, employee benefits, materials, supplies, maintenance of research equipment, costs related to research collaboration and licensing agreements, the purchase of in-process research and development, the cost of services provided by outside contractors, including services related to our clinical trials, the full cost of manufacturing drug for use in research, pre-clinical development and clinical trials. All costs associated with research and development are expensed as incurred.
At each period end, we evaluate the accrued expense balance related to these activities based upon information received from the suppliers and estimated progress towards completion of the research or development objectives to ensure that the balance is reasonably stated. Such estimates are subject to change as additional information becomes available.
Use of Estimates
Significant estimates include useful lives of fixed assets, the periods over which certain revenues and expenses will be recognized, including collaboration revenue recognized from non-refundable up-front licensing payments and expense recognition of certain clinical trial costs which are included in research and development expenses, the amount of non-cash compensation costs related to share-based payments to employees and non-employees and the periods over which those costs are expensed, and the likelihood of realization of deferred tax assets.assets and the assumptions used in the valuations of in-process research and development and contingent consideration liability.
Patents
As a result of research and development efforts conducted by us, we have applied, or are applying, for a number of patents to protect proprietary inventions. All costs associated with patents are expensed as incurred.
Net (Loss) Income Per Share
We prepare earnings per share (EPS) data in accordance with ASC 260 Earnings Per Share. Basic net (loss) income per share amounts have been computed by dividing net (loss) income by the weighted-average number of common shares outstanding during the period. For 20122013 and 2010,2012, we reported net losses and, therefore, potential common shares, amounts of unrecognized compensation expense and windfall tax benefits have been excluded from diluted net loss per share since they would be anti-dilutive. For 2011, we reported net income, and the computation of diluted earnings per share is based upon the weighted-average number of our common shares and dilutive effect, determined using the treasury stock method, of potential common shares outstanding including amounts of unrecognized compensation expense. As of December 31, 2012 and 2011, 28 and 2010, our 28, 98, and 341, respectively, shares of unvested restricted stock outstanding have non-forfeitable rights to dividends.dividends; all such shares were vested at the end of December 31, 2013. The allocation of 20122013 and 20102012 net losses and the 2011 net income to these participating securities pursuant to the two-class method is not material to both basic and diluted earnings per share.
Concentrations of Credit Risk
Financial instruments thatwhich potentially subject Progenics to concentrations of credit risk consist principally of cash, cash equivalents, auction rate securities and receivables from out-licensing and disposition of assets, Salix, Ono or the NIH.receivables. We invest our excess cash in money market funds. We have established guidelines that relate to credit quality, diversification and maturity and that limit exposure to any one issue of securities. We hold no collateral for these financial instruments.
F-12
PROGENICS PHARMACEUTICALS, INC.
NOTES TO CONSOLIDATED FINANCIAL STATEMENTS - continued
(amounts in thousands, except per share amounts or as otherwise noted)
Cash and Cash Equivalents
We consider all highly liquid investments which have maturities of three months or less, when acquired, to be cash equivalents. The carrying amount reported in the balance sheet for cash and cash equivalents approximates its fair value. Cash and cash equivalents subject us to concentrations of credit risk. At December 31, 20122013 and 2011,2012, we have invested approximately $56,224$60,364 and $64,068,$56,224, respectively, in cash equivalents in the form of money market funds with one major investment company and held approximately $2,614$4,898 and $6,037,$2,614, respectively, in a single commercial bank.
Auction Rate Securities
In accordance with ASC 320 Investments – Debt and Equity Securities, investments are classified as available-for-sale. Available-for-sale securities are carried at fair value, with the unrealized gains and losses reported in comprehensive (loss) income. The amortized cost of debt securities is adjusted for amortization of premiums and accretion of discounts to maturity. Such amortization is included in interest income or expense. Realized gains and losses and declines in value judged to be other-than-temporary, if any, on available-for-sale securities are included in other income or expense. In computing realized gains and losses, we compute the cost of its investments on a specific identification basis. Such cost includes the direct costs to acquire the securities, adjusted for the amortization of any discount or premium. The fair value of auction rate securities has been estimated based on a three-level hierarchy for fair value measurements. Interest and dividends on securities classified as available-for-sale are included in interest income (see Note 3)4).
At December 31, 20122013 and 2011,2012, our investment in auction rate securities in the(recorded as long-term assets section ofin the Consolidated Balance SheetsSheets) amounted to $3,240$2,208 and $3,332,$3,240, respectively. Valuation of securities is subject to uncertainties that are difficult to predict, such as changes to credit ratings of the securities and/or the underlying assets supporting them, default rates applicable to the underlying assets, underlying collateral value, discount rates, counterparty risk, ongoing strength and quality of market credit and liquidity and general economic and market conditions. The valuation of the auction rate securities we hold is based on an internal analysis of timing of expected future successful auctions, collateralization of underlying assets of the security and credit quality of the security. We re-evaluated the valuation of these securities as of December 31, 20122013 and the temporary impairment amount decreased $8$68 from $268$260 at December 31, 20112012 to $260.$192. All income generated from these investments was recorded as interest income (see Note 3)4).
In-Process Research and Development and Goodwill
The fair values of in-process research and development (IPR&D) acquired in business combinations are capitalized. The Company utilizes the "income method," which applies a probability weighting that considers the risk of development and commercialization to the estimated future net cash flows that are derived from projected sales revenues and estimated costs. These projections are based on factors such as relevant market size, patent protection, historical pricing of similar products and expected industry trends. The estimated future net cash flows are then discounted to the present value using an appropriate discount rate. This analysis is performed for each project independently. These assets are treated as indefinite-lived intangible assets until completion or abandonment of the projects, at which time the assets are amortized over the remaining useful life or written off, as appropriate. IPR&D intangible assets which are determined to have a decline in their fair value are adjusted downward and an expense is recognized as part of the general and administrative expenses in the Consolidated Statements of Operations. These are tested at least annually or when a triggering event occurs that could indicate a potential impairment.
Goodwill represents excess consideration in a business combination over the fair value of identifiable net assets acquired. Goodwill is not amortized, but is subject to impairment testing at least annually or when a triggering event occurs that could indicate a potential impairment. The Company determines whether goodwill may be impaired by comparing the fair value of the reporting unit, calculated as the product of shares outstanding and the share price as of the end of a period, to its carrying value. No goodwill impairment has been recognized as of December 31, 2013. The Company has determined that it has only one reporting unit, which includes the acquired Molecular Insight.
F-13
PROGENICS PHARMACEUTICALS, INC.
NOTES TO CONSOLIDATED FINANCIAL STATEMENTS - continued
(amounts in thousands, except per share amounts or as otherwise noted)
The following table reflects the components of the finite lived intangible assets as of December 31, 2013:
Gross Amount | Accumulated Amortization | Net Carrying Value | ||||||||||
| Finite lived intangible assets | $ | 21 | $ | 2 | $ | 19 | ||||||
| Total | $ | 21 | $ | 2 | $ | 19 | ||||||
The weighted-average remaining life of the finite lived intangible assets is five years at December 31, 2013.
Amortization expense is calculated on a straight-line basis over the estimated useful life of the asset. Amortization expense for the period from January 18, 2013 to December 31, 2013 was $2. Estimated amortization expense related to intangible assets existing as of December 31, 2013 is approximately $4 annually for each of the succeeding five years.
The following table summarizes the activity related to the Company's goodwill and indefinite lived IPR&D:
| Goodwill | IPR&D | |||||||
| Balance at January 1, 2013 | $ | - | $ | - | ||||
| Increase related to MIP acquisition | 7,702 | 32,300 | ||||||
| Reclassification to finite lived IPR&D | - | (21 | ) | |||||
| Impairment | - | (919 | ) | |||||
| Balance at December 31, 2013 | $ | 7,702 | $ | 31,360 | ||||
Fair Value Measurements
In accordance with ASC 820 Fair Value Measurements and Disclosures, we use a three-level hierarchy for fair value measurements of certain assets and liabilities for financial reporting purposes that distinguishes between market participant assumptions developed from market data obtained from outside sources independent of the reporting entity (observable inputs) and the reporting entity'sour own assumptions about market participant assumptions developed from the best information available to us in the circumstances (unobservable inputs). TheWe assign hierarchy level assignedlevels to each security inassets constituting our available-for-sale portfolio isand to our contingent consideration liability arising from the MIP acquisition based on our assessment of the transparency and reliability of the inputs used in the valuation of such instrument atvaluation. ASC 820 defines the measurement date. The three hierarchy levels are defined as follows:as:
| · | Level 1 - Valuations based on unadjusted quoted market prices in active markets for identical securities. |
| · | Level 2 - Valuations based on observable inputs other than Level 1 prices, such as quoted prices for similar assets at the measurement date, quoted prices in markets that are not active or other inputs that are observable, either directly or indirectly. |
| · | Level 3 - Valuations based on unobservable inputs that are |
Recurring Fair Value Measurements
We believe the carrying amounts of the Company's cash equivalents, accounts receivable, other current assets, other assets (restricted cash providing collateral for a letter of credit securing lease obligations) and accounts payable and accrued expenses approximated their fair values as of December 31, 2013 and 2012, due to their short-term nature; we consider them Level 1 instruments.
The fair value of the contingent consideration liability, consisting of future potential milestone payments related to the MIP acquisition was $15.7 million as of December 31, 2013 and $15.9 million as January 18, 2013, the acquisition date (see Note 2). The fair value of the contingent consideration liability is categorized as a Level 3 instrument, as displayed in Note 4. The Company records the contingent consideration liability at fair value with changes in estimated fair values recorded in general and administrative expenses in the Consolidated Statements of Operations. As of December 31, 2013, we reassessed the fair value of the contingent consideration and recorded a $0.2 million decrease, due to an increase in the discount period, and a corresponding credit in the general and administrative expenses in the fourth quarter of 2013. The December 31, 2013 contingent consideration of $15.7 million results from probability adjusted discounted cash flow and Monte Carlo simulation models which include estimates of significant milestone payments to former MIP stockholders under the acquisition agreement ranging from 2017 to 2022 and risk adjusted discount rates ranging from 10% to 12.5%.
F-14
PROGENICS PHARMACEUTICALS, INC.
NOTES TO CONSOLIDATED FINANCIAL STATEMENTS - continued
(amounts in thousands, except per share amounts or as otherwise noted)
Nonrecurring Fair Value Measurements
The Company's non-financial assets, such as intangible assets and property and equipment, are measured and recorded at fair value on the acquisition date, and if indicators of impairment exist, we assess recoverability by measuring the amount of any impairment by comparing the carrying value of the asset to its then-current estimated fair value (for intangible assets) or to market prices for similar assets (for property and equipment). If the carrying value is not recoverable we record an impairment charge as a general and administrative expense in the Consolidated Statements of Operations. The company reassessed the value of the indefinite lived intangible assets and recorded a non-cash charge to earnings of $919 in the fourth quarter of 2013. This impairment was the result of change in the Level 3 assumptions: (i) the timing of the estimated beginning of cash inflows from 2014 to 2018 and (ii) an increase in discount rate from 15% to 18% for the Onalta intangible asset. In connection with the second quarter amendment of the Company's Tarrytown lease, we recognized impairment losses of $347 on leasehold improvements and machinery and equipment removed from service which are included in Research and development expenses in our accompanying Consolidated Statements of Operations for the year ended December 31, 2013. As a result of closing our biologics pilot facilities in 2011, an impairment loss of $22 was included in Research and development expenses in our accompanying Consolidated Statement of Operations during 2011. No impairments occurred for the year ended December 31, 2012.
Other current assets are comprised of prepaid expenses, interest, deferred tax asset and other receivables of $1,692$1,943 and $919$1,692 at December 31, 20122013 and 2011,2012, respectively, which are expected to be settled within one year. Restricted cash of $157 and $150 at December 31, 2013 and 2012, and $200 at December 31, 2011,respectively, consists of collateral for a letter of credit securing lease obligations. We believe thatthe carrying value of thosethese assets approximates fair value.
Fixed Assets
Leasehold improvements, furniture and fixtures, and equipment are stated at cost. Furniture, fixtures and equipment are depreciated on a straight-line basis over their estimated useful lives. Leasehold improvements are amortized on a straight-line basis over the life of the lease or of the improvement, whichever is shorter. Costs of construction of long-lived assets are capitalized but are not depreciated until the assets are placed in service.
Expenditures for maintenance and repairs which do not materially extend the useful lives of the assets are charged to expense as incurred. The cost and accumulated depreciation of assets retired or sold are removed from the respective accounts and any gain or loss is recognized in operations. The estimated useful lives of fixed assets are as follows:
| Computer equipment | 3 years |
| Machinery and equipment | 5-7 years |
| Furniture and fixtures | 5 years |
| Leasehold improvements | Earlier of life of improvement or lease |
Deferred Lease Liability and Incentive
Our lease agreements include fixed escalations of minimum annual lease payments and we recognize rental expense on a straight-line basis over the lease terms and record the difference between rent expense and current rental payments as deferred rent. Deferred lease incentive includes a construction allowance from our landlord which is amortized as a reduction to rental expense on a straight-line basis over the lease term. As of December 31, 20122013 and 2011,2012, the Consolidated Balance Sheets include the following:
F-15
| 2012 | 2011 | ||||||
| Other current liabilities: | |||||||
| Deferred lease incentive | $ | 115 | $ | 115 | |||
| Total other current liabilities | $ | 115 | $ | 115 | |||
| Other liabilities: | |||||||
| Deferred lease liability | $ | 273 | $ | 577 | |||
| Deferred lease incentive | 805 | 920 | |||||
| Total other liabilities | $ | 1,078 | $ | 1,497 | |||
PROGENICS PHARMACEUTICALS, INC.
(amounts in thousands, except per share amounts or changes in circumstances indicate that the carrying amount of an asset may not be recoverable. In accordance with ASC 360 Property, Plant, and Equipment – Impairment or Disposal of Long-Lived Assets, if indicators of impairment exist, we assess the recoverability of the affected long-lived assets by determining whether the carrying value of such assets can be recovered through undiscounted future operating cash flows. If the carrying amount is not recoverable, we measure the amount of any impairment by comparing the carrying value of the asset to market prices for similar assets. As a result of closing our biologics pilot facilities in 2011, an impairment loss of $22 was included in Research and development expenses in our accompanying Consolidated Statement of Operations during 2011. No impairments occurred as of December 31, 2012 or 2010.otherwise noted)
| 2013 | 2012 | |||||||
| Other current liabilities: | ||||||||
| Deferred lease incentive | $ | 115 | $ | 115 | ||||
| Total other current liabilities | $ | 115 | $ | 115 | ||||
| Other liabilities: | ||||||||
| Deferred lease liability | $ | 224 | $ | 273 | ||||
| Deferred lease incentive | 690 | 805 | ||||||
| Total other liabilities | $ | 914 | $ | 1,078 | ||||
Income Taxes
We account for income taxes in accordance with the provisions of ASC 740 Income Taxes, which requires that we recognize deferred tax liabilities and assets for the expected future tax consequences of events that have been included in the financial statements or tax returns. Under this method, deferred tax assets and liabilities are determined on the basis of the difference between the tax basis of assets and liabilities and their respective financial reporting amounts (temporary differences) at enacted tax rates in effect for the years in which the temporary differences are expected to reverse. A valuation allowance is established for deferred tax assets for which realization is uncertain.
In accordance with ASC 718 Compensation – Stock Compensation and ASC 505 Equity, we have made a policy decision related to intra-period tax allocation, to account for utilization of windfall tax benefits based on provisions in the tax law that identify the sequence in which amounts of tax benefits are used for tax purposes (i.e., tax law ordering).
Uncertain tax positions are accounted for in accordance with ASC 740 Income Taxes, which prescribes a comprehensive model for the manner in which a company should recognize, measure, present and disclose in its financial statements all material uncertain tax positions that we have taken or expect to take on a tax return. ASC 740 applies to income taxes and is not intended to be applied by analogy to other taxes, such as sales taxes, value-add taxes, or property taxes. We review our nexus in various tax jurisdictions and our tax positions related to all open tax years for events that could change the status of our ASC 740 liability, if any, or require an additional liability to be recorded. Such events may be the resolution of issues raised by a taxing authority, expiration of the statute of limitations for a prior open tax year or new transactions for which a tax position may be deemed to be uncertain. Those positions, for which management's assessment is that there is more than a 50 percent probability of sustaining the position upon challenge by a taxing authority based upon its technical merits, are subjected to the measurement criteria of ASC 740. We record the largest amount of tax benefit that is greater than 50 percent likely of being realized upon ultimate settlement with a taxing authority having full knowledge of all relevant information. Any ASC 740 liabilities for which we expect to make cash payments within the next twelve months are classified as "short term." In the event that we conclude that we are subject to interest and/or penalties arising from uncertain tax positions, we will record interest and penalties as a component of income taxes (see Note 12).
Risks and Uncertainties
We have to date relied principally on external funding, collaborations with Salix, WyethFuji and others, out-licensing and asset sale arrangements, royalty and product revenue to finance our operations. There can be no assurance that our research and development will be successfully completed, that any products developed will obtain necessary marketing approval by regulatory authorities or that any approved products will be commercially viable. In addition, we operate in an environment of rapid change in technology, and we are dependent upon satisfactory relationships with our partners and the continued services of our current employees, consultants and subcontractors. We are also dependent upon Salix, Fuji and Ono fulfilling their manufacturing obligations, either on their own or through third-party suppliers. For 2013, 2012 2011 and 2010,2011, the primary sources of our revenues were Salix, Wyeth, Ono, Fuji, asset out-licensing and disposition, and research grant revenues from the NIH. There can be no assurance that revenues from asset out-licensing and disposition, Salix, Ono and OnoFuji or from research awards will continue. Substantially all of our accounts receivable at December 31, 20122013 and 20112012 were from the above-named sources.
Comprehensive (Loss) Income
Comprehensive (loss) income represents the change in net assets of a business enterprise during a period from transactions and other events and circumstances from non-owner sources. Our comprehensive (loss) income includes net (loss) income adjusted for the change in net unrealized gain or loss on auction rate securities. The disclosures required by ASC 220 Comprehensive Income for 2013, 2012 2011 and 20102011 have been included in the Consolidated Statements of Comprehensive (Loss) Income. There was no income tax expense/benefit allocated to any component of Other Comprehensive (Loss) Income (see Note 12)13).
F-16
PROGENICS PHARMACEUTICALS, INC.
NOTES TO CONSOLIDATED FINANCIAL STATEMENTS - continued
(amounts in thousands, except per share amounts or as otherwise noted)
Impact of Recently Adopted Accounting Standards
In June 2011, the FASB issued ASU No. 2011-05, which requires that comprehensive income and the related components be presented in a single continuous statement or in two separate but consecutive statements. The ASU was effective beginning January 1, 2012. We adopted this new standard, presenting comprehensive income in two separate but consecutive statements, and applied it retrospectively on January 1, 2012. As this guidance relates to presentation only, the adoption of this standard had no material impact on our consolidated financial statements.
The following tables present our money market funds, included in cash and cash equivalents, and auction rate securities assets and contingent consideration liability measured at fair value on a recurring basis as of December 31, 2012 and 2011,the dates indicated, classified by valuation hierarchy:
| Fair Value Measurements at December 31, 2013 | ||||||||||||||||
Balance at December 31, 2013 | Quoted Prices in Active Markets for Identical Assets (Level 1) | Significant Other Observable Inputs (Level 2) | Significant Unobservable Inputs (Level 3) | |||||||||||||
| Assets: | ||||||||||||||||
| Money market funds | $ | 60,364 | $ | 60,364 | $ | - | $ | - | ||||||||
| Auction rate securities | 2,208 | - | - | 2,208 | ||||||||||||
| Total Assets | $ | 62,572 | $ | 60,364 | $ | - | $ | 2,208 | ||||||||
| Liability: | ||||||||||||||||
| Contingent consideration | $ | 15,700 | $ | - | $ | - | $ | 15,700 | ||||||||
| Total Liability | $ | 15,700 | $ | - | $ | - | $ | 15,700 | ||||||||
| Fair Value Measurements at December 31, 2012 | ||||||||||||||||
Balance at December 31, 2012 | Quoted Prices in Active Markets for Identical Assets (Level 1) | Significant Other Observable Inputs (Level 2) | Significant Unobservable Inputs (Level 3) | |||||||||||||
| Money market funds | $ | 56,224 | $ | 56,224 | $ | - | $ | - | ||||||||
| Auction rate securities | 3,240 | - | - | 3,240 | ||||||||||||
| Total | $ | 59,464 | $ | 56,224 | $ | - | $ | 3,240 | ||||||||
| Fair Value Measurements at December 31, 2011 | |||||||||||||||
Balance at December 31, 2011 | Quoted Prices in Active Markets for Identical Assets (Level 1) | Significant Other Observable Inputs (Level 2) | Significant Unobservable Inputs (Level 3) | ||||||||||||
| Money market funds | $ | 64,068 | $ | 64,068 | $ | - | $ | - | |||||||
| Auction rate securities | 3,332 | - | - | 3,332 | |||||||||||
| Total | $ | 67,400 | $ | 64,068 | $ | - | $ | 3,332 | |||||||
At December 31, 2012,2013, we hold $3,240$2,208 in auction rate securities which are classified as Level 3. The fair value of these securities includes $2,300$2,208 of U.S. government subsidized securities collateralized by student loan obligations, with maturities greater than 10 years, and $940 of investment company perpetual preferred stock, without a stated maturity. Auction rate securities are collateralized long-term instruments that were intended to provide liquidity through an auction process that resets interest rates at pre-determined intervals.years. We will not realize cash in respect of the principal amount of these securities until the issuer calls or restructures the security, the security reaches any scheduled maturity and is paid, or a buyer outside the auction process emerges. As of December 31, 2012,2013, we have received all scheduled interest payments on these securities, which, in the event of auction failure, are reset according to the contractual terms in the governing instruments.
F-17
PROGENICS PHARMACEUTICALS, INC.
NOTES TO CONSOLIDATED FINANCIAL STATEMENTS - continued
(amounts in thousands, except per share amounts or as otherwise noted)
The valuation of auction rate securities we hold is based on Level 3 unobservable inputs which consist of our internal analysis of (i) timing of expected future successful auctions or issuer calls of the securities, (ii) collateralization of underlying assets of the security and (iii) credit quality of the security. We use a discounted cash flow model to estimate the value of these auction rate securities and the unobservable inputs consist of a redemption period ranging from four to 15 years (weighted-average: 5.9 years) and discount rates ranging from 0.125% to 2.102% (weighted-average: 0.71%). Significant increases (decreases) in the redemption period or discount rates would result in a significantly lower (higher) fair value measurement. In re-evaluating the valuation of these securities as of December 31, 2012,2013, the temporary impairment amount, the duration of which is greater than 12 months, decreased $8 from $268$260 at December 31, 2011,2012, to $260,$192, which is reflected as a part of accumulated other comprehensive loss on our accompanying Consolidated Balance Sheets and based on such re-evaluation, we believe that we have the ability to hold these securities until recovery of fair value. Due to the uncertainty related to the liquidity in the auction rate security market and therefore when individual positions may be liquidated, we have classified these auction rate securities as long-term assets on our accompanying Consolidated Balance Sheets. We continue to monitor markets for our investments and consider the impact, if any, of market conditions on the fair market value of our investments. We do not believe the carrying values of our investments are other than temporarily impaired and therefore expect the positions will eventually be liquidated without significant loss.
The estimated fair value of the contingent consideration liability of $15.7 million represents future potential milestone payments to former MIP stockholders. The Company considers this liability a Level 3 instrument (one with significant unobservable inputs) in the fair value hierarchy. The estimated fair value was determined based on probability adjusted discounted cash flow and Monte Carlo simulation models that included significant estimates and assumptions pertaining to commercialization events and sales targets. The most significant unobservable inputs were the probabilities of achieving regulatory approval of the development projects and subsequent commercial success, and discount rates. Significant changes in any of the probabilities of success would result in a significantly higher or lower fair value measurement, respectively. Significant changes in the probabilities as to the periods in which milestones will be achieved would result in a significantly lower or higher fair value measurement, respectively. The Company records the contingent consideration liability at fair value with changes in estimated fair values recorded in general and administrative expenses in the Consolidated Statements of Operations.
The following table presents quantitative information pertaining to the fair value measurement of the Level 3 inputs:
F-18
PROGENICS PHARMACEUTICALS, INC.
NOTES TO CONSOLIDATED FINANCIAL STATEMENTS ¾- continued
(amounts in thousands, except per share amounts or as otherwise noted)
Fair Value as of December 31, 2013 | Valuation Technique | Unobservable Input | Range (Weighted Average) | ||||||||
| Asset: | |||||||||||
| Auction Rate Securities | $ | 2,208 | Discounted cash flow model | Redemption period | 5 to 15 years (6 years) | ||||||
| Discount rate | 0.25% - 3.00% (1.55%) | ||||||||||
Contingent consideration liability: | |||||||||||
| Azedra commercialization | $ | 2,300 | Probability adjusted discounted cash flow model | Probability of success | 40% | ||||||
| Period of milestone expected achievement | 2017 | ||||||||||
| Discount rate | 10% | ||||||||||
| 1404 commercialization | $ | 2,000 | Probability adjusted discounted cash flow model | Probability of success | 31% | ||||||
| Period of milestone expected achievement | 2018 | ||||||||||
| Discount rate | 10% | ||||||||||
| MIP-1095 commercialization | $ | 500 | Probability adjusted discounted cash flow model | Probability of success | 19% | ||||||
| Period of milestone expected achievement | 2021 | ||||||||||
| Discount rate | 10% | ||||||||||
| Net sales targets | $ | 10,900 | Monte-Carlo simulation | Probability of success | 19% - 40% (32.8%) | ||||||
| Period of milestone expected achievement | 2018 - 2022 | ||||||||||
| Discount rate | 12.5% | ||||||||||
| Fair Value as of December 31, 2012 | Valuation Technique | Unobservable Input | Range (Weighted Average) | ||||||||
| Asset: | |||||||||||
| Auction Rate Securities | $ | 3,240 | Discounted cash flow model | Redemption period | 4 to 15 years (5.9 years) | ||||||
| Discount rate | 0.125% - 2.102% (0.71%) | ||||||||||
F-19
PROGENICS PHARMACEUTICALS, INC.
NOTES TO CONSOLIDATED FINANCIAL STATEMENTS - continued
(amounts in thousands, except per share amounts or as otherwise noted)
For ourthose financial instruments with significant Level 3 inputs, (all of which are auction rate securities), the following table summarizes the activities for 2012 and 2011:the periods indicated:
Fair Value Measurements Using Significant Unobservable Inputs (Level 3) | Asset – Auction Rate Securities Fair Value Measurements Using Significant Unobservable Inputs (Level 3) | |||||||||||||||
| Description | 2012 | 2011 | 2013 | 2012 | ||||||||||||
| Balance at beginning of period | $ | 3,332 | $ | 3,608 | $ | 3,240 | $ | 3,332 | ||||||||
| Transfers into Level 3 | - | - | - | - | ||||||||||||
| Total realized/unrealized gains (losses) | ||||||||||||||||
| Included in net income (loss) | - | - | - | - | ||||||||||||
| Included in comprehensive income (loss) | 8 | 24 | 68 | 8 | ||||||||||||
| Settlements | (100 | ) | (300 | ) | (1,100 | ) | (100 | ) | ||||||||
| Balance at end of period | $ | 3,240 | $ | 3,332 | $ | 2,208 | $ | 3,240 | ||||||||
| Total amount of unrealized gains (losses) for the period included in other comprehensive loss attributable to the change in fair market value of related assets still held at the reporting date | $ | - | $ | - | $ | - | $ | - | ||||||||
Liability – Contingent Consideration Fair Value Measurements Using Significant Unobservable Inputs (Level 3) | ||||||||
| Description | 2013 | 2012 | ||||||
| Balance at beginning of period | $ | - | $ | - | ||||
| Fair value of contingent consideration – acquisition of Molecular Insight | 15,900 | - | ||||||
| Fair value adjustment to contingent consideration included in net loss | (200 | ) | - | |||||
| Balance at end of period | $ | 15,700 | $ | - | ||||
| Changes in unrealized gains or losses for the period included in earnings (or changes in net assets) for liabilities held at the end of the reporting period | $ | (200 | ) | $ | - | |||
The following tables summarize the amortized cost basis, the aggregate fair value and gross unrealized holding gains and losses at December 31, 20122013 and 2011:2012:
| Amortized | Fair | Unrealized Holding | ||||||||||||||||||
| 2013: | Cost Basis | Value | Gains | (Losses) | Net | |||||||||||||||
| Maturities greater than ten years: | ||||||||||||||||||||
| Auction rate securities | $ | 2,400 | $ | 2,208 | $ | - | $ | (192 | ) | $ | (192 | ) | ||||||||
| $ | 2,400 | $ | 2,208 | $ | - | $ | (192 | ) | $ | (192 | ) | |||||||||
| Amortized | Fair | Unrealized Holding | ||||||||||||||||||
| 2012: | Cost Basis | Value | Gains | (Losses) | Net | |||||||||||||||
| Maturities greater than ten years: | ||||||||||||||||||||
| Auction rate securities | $ | 2,500 | $ | 2,300 | $ | - | $ | (200 | ) | $ | (200 | ) | ||||||||
| Investments without stated maturity dates: | ||||||||||||||||||||
| Auction rate securities | 1,000 | 940 | - | (60 | ) | (60 | ) | |||||||||||||
| $ | 3,500 | $ | 3,240 | $ | - | $ | (260 | ) | $ | (260 | ) | |||||||||
| Amortized | Fair | Unrealized Holding | ||||||||||||||||||
| 2011: | Cost Basis | Value | Gains | (Losses) | Net | |||||||||||||||
| Maturities greater than ten years: | ||||||||||||||||||||
| Auction rate securities | $ | 2,600 | $ | 2,392 | $ | - | $ | (208 | ) | $ | (208 | ) | ||||||||
| Investments without stated maturity dates: | ||||||||||||||||||||
| Auction rate securities | 1,000 | 940 | - | (60 | ) | (60 | ) | |||||||||||||
| $ | 3,600 | $ | 3,332 | $ | - | $ | (268 | ) | $ | (268 | ) | |||||||||
We compute the cost of its investments on a specific identification basis. Such cost includes the direct costs to acquire the securities, adjusted for the amortization of any discount or premium.
F-20
PROGENICS PHARMACEUTICALS, INC.
NOTES TO CONSOLIDATED FINANCIAL STATEMENTS - continued
(amounts in thousands, except per share amounts or as otherwise noted)
The following table shows the gross unrealized losses and fair value of our auction rate securities with unrealized losses that are not deemed to be other-than-temporarily impaired, aggregated by investment category and length of time that individual securities have been in a continuous unrealized loss position, at December 31, 20122013 and 2011.
| 2012: | Less than 12 Months | 12 Months or Greater | Total | |||||||||||||||||||||||||||||||||||||||||||||
| 2013: | Less than 12 Months | 12 Months or Greater | Total | |||||||||||||||||||||||||||||||||||||||||||||
| Description of Securities | Fair Value | Unrealized Losses | Fair Value | Unrealized Losses | Fair Value | Unrealized Losses | Fair Value | Unrealized Losses | Fair Value | Unrealized Losses | Fair Value | Unrealized Losses | ||||||||||||||||||||||||||||||||||||
| Auction rate securities | $ | - | $ | - | $ | 3,240 | $ | (260 | ) | $ | 3,240 | $ | (260 | ) | $ | - | $ | - | $ | 2,208 | $ | (192 | ) | $ | 2,208 | $ | (192 | ) | ||||||||||||||||||||
| Total | $ | - | $ | - | $ | 3,240 | $ | (260 | ) | $ | 3,240 | $ | (260 | ) | $ | - | $ | - | $ | 2,208 | $ | (192 | ) | $ | 2,208 | $ | (192 | ) | ||||||||||||||||||||
| 2011: | Less than 12 Months | 12 Months or Greater | Total | |||||||||||||||||||||||||||||||||||||||||||||
| 2012: | Less than 12 Months | 12 Months or Greater | Total | |||||||||||||||||||||||||||||||||||||||||||||
| Description of Securities | Fair Value | Unrealized Losses | Fair Value | Unrealized Losses | Fair Value | Unrealized Losses | Fair Value | Unrealized Losses | Fair Value | Unrealized Losses | Fair Value | Unrealized Losses | ||||||||||||||||||||||||||||||||||||
| Auction rate securities | $ | - | $ | - | $ | 3,332 | $ | (268 | ) | $ | 3,332 | $ | (268 | ) | $ | - | $ | - | $ | 3,240 | $ | (260 | ) | $ | 3,240 | $ | (260 | ) | ||||||||||||||||||||
| Total | $ | - | $ | - | $ | 3,332 | $ | (268 | ) | $ | 3,332 | $ | (268 | ) | $ | - | $ | - | $ | 3,240 | $ | (260 | ) | $ | 3,240 | $ | (260 | ) | ||||||||||||||||||||
Other-than-temporary impairment analysis on auction rate securities. The unrealized losses on our auction rate securities resulted from an internal analysis of timing of expected future successful auctions, collateralization of underlying assets of the security and credit quality of the security. At December 31, 20122013 there was one and 2011,at December 31, 2012, there were two securities with a gross unrealized loss position of $192 and $260 ($2,208 and $268 ($3,240 and $3,332$3,240 of the total fair value), respectively.
The severity of the unrealized losses for auction rate securities at December 31, 2013 and 2012 and 2011 ranged from 6 percent towas 8 percent below amortized cost, and the weighted average duration of the unrealized losses for these securities was 5870 and 4658 months, respectively.
We have evaluated our individual auction rate securities holdings for other-than-temporary impairment and determined that the unrealized losses as of December 31, 20122013 and 20112012 are attributable to uncertainty in the liquidity of the auction rate security market.market. Because we do not intend to sell these securities, and believe it is not more likely than not that we would be required to sell these securities before recovery of principal, we do not consider these securities to be other-than-temporarily impaired at December 31, 20122013 and 2011.2012.
Our accounts receivable represent amounts due to Progenics from collaborators, royalties, research grants and the sales of research reagents. These amounts are considered to be short-term as they are expected to be collected within one yearreagents and we believe carrying value approximates fair value. Accounts receivable as of December 31, 20122013 and 2011,2012, consisted of the following:
| 2012 | 2011 | 2013 | 2012 | ||||||||||||
| Collaborators | $ | 6,125 | $ | 77 | $ | 12 | $ | 6,125 | |||||||
| Royalties | 781 | 1,279 | 2,862 | 781 | |||||||||||
| Research grants | 12 | 100 | - | 12 | |||||||||||
| Other | 19 | 60 | 12 | 19 | |||||||||||
| 2,886 | 6,937 | ||||||||||||||
| Less, allowance for doubtful accounts | (7 | ) | - | ||||||||||||
| Total | $ | 6,937 | $ | 1,516 | $ | 2,879 | $ | 6,937 | |||||||
PROGENICS PHARMACEUTICALS, INC.
NOTES TO CONSOLIDATED FINANCIAL STATEMENTS ¾- continued
(amounts in thousands, except per share amounts or as otherwise noted)
Fixed assets as of December 31, 20122013 and 20112012 consisted of the following:
| 2012 | 2011 | 2013 | 2012 | |||||||||||||
| Computer equipment | $ | 2,166 | $ | 2,133 | $ | 2,234 | $ | 2,166 | ||||||||
| Machinery and equipment | 8,031 | 12,035 | 7,091 | 8,031 | ||||||||||||
| Furniture and fixtures | 133 | 230 | 170 | 133 | ||||||||||||
| Leasehold improvements | 5,327 | 11,526 | 5,020 | 5,327 | ||||||||||||
| Construction in progress and other | 12 | 175 | ||||||||||||||
| Other | 16 | 12 | ||||||||||||||
| 15,669 | 26,099 | 14,531 | 15,669 | |||||||||||||
| Less, accumulated depreciation and amortization | (12,270 | ) | (22,061 | ) | (12,118 | ) | (12,270 | ) | ||||||||
| Total | $ | 3,399 | $ | 4,038 | $ | 2,413 | $ | 3,399 | ||||||||
At December 31, 2013 and 2012, $2.0 million and $2.6 million, respectively, of leasehold improvements, net were being amortized over periods of 8.5-10.8 years, under leases with terms through December 31, 2020. At December 31, 2011, $2.3 million of leasehold improvements, net were being amortized over periods of 1.3-10.8 years, under leases with terms through December 31, 2020.
The carrying value of our accounts payable and accrued expenses approximates fair value, as it represents amounts due to vendors and employees, which will be satisfied within one year. Accounts payable and accrued expenses as of December 31, 20122013 and 2011,2012, consisted of the following:
| 2012 | 2011 | 2013 | 2012 | ||||||||||||
| Accrued consulting and clinical trial costs | $ | 2,193 | $ | 1,637 | $ | 2,672 | $ | 2,193 | |||||||
| Accrued payroll and related costs | 1,552 | 3,149 | 2,123 | 1,552 | |||||||||||
| Restructuring accrual | 813 | 731 | - | 813 | |||||||||||
| Legal and professional fees | 774 | 371 | 608 | 774 | |||||||||||
| Accounts payable | 229 | 309 | 793 | 229 | |||||||||||
| Other | 79 | 134 | 316 | 79 | |||||||||||
| Total | $ | 5,640 | $ | 6,331 | $ | 6,512 | $ | 5,640 | |||||||
We reduced headcount in the third and fourth quarters of 2011, resulting in a restructuring accrual of $1.3 million for severance and related benefits which were paid through August 2012. We incurred other exit and contract termination costs, including expenses related to a lease amendment and consolidation of employees within reduced facility space.
We completed an additionalalso reduced headcount reduction in the third quarter of 2012, resulting in a restructuring accrual of $1.9 million which is beingwas paid through August 2013, and the first quarter of 2013, resulting in an approximately $1.5 million restructuring accrual which we intend to pay up to $1.2 million in shareswas paid through the end of common stock issued pursuant to the Company's 2005 Stock Incentive Plan.2013. During the fourthsecond quarter of 2012,2013, we issued $0.1 million of common stockincurred other exit and at the closing market price of the Company's common stock on December 31, 2012, up to 174 shares may be issued in satisfaction of the remaining obligation.contract termination costs, including lease termination and amendment and consolidation expenses ($1,359).
Activity in the restructuring accrual, which is included in accounts payable and accrued expenses in our Consolidated Balance Sheets, and in research and development and general and administrative expenses in the Consolidated Statements of Operations, is specified below.
PROGENICS PHARMACEUTICALS, INC.
NOTES TO CONSOLIDATED FINANCIAL STATEMENTS ¾- continued
(amounts in thousands, except per share amounts or as otherwise noted)
| Severance and Related Benefits | Other Exit Costs | Contract Termination Costs | Total Restructuring Accrual | |||||||||||||
| Balance at December 31, 2010 | $ | - | $ | - | $ | - | $ | - | ||||||||
| Additions, net | 1,341 | 8 | 292 | 1,641 | ||||||||||||
| Payments | (770 | ) | (2 | ) | (138 | ) | (910 | ) | ||||||||
| Balance at December 31, 2011 | 571 | 6 | 154 | 731 | ||||||||||||
| Additions, net | 1,905 | 184 | 3 | 2,092 | ||||||||||||
| Payments | (1,663 | ) | (190 | ) | (157 | ) | (2,010 | ) | ||||||||
| Balance at December 31, 2012 | 813 | - | - | 813 | ||||||||||||
| Additions, net | 1,492 | 15 | 1,359 | 2,866 | ||||||||||||
| Payments | (2,305 | ) | (15 | ) | (1,359 | ) | (3,679 | ) | ||||||||
| Balance at December 31, 2013 | $ | - | $ | - | $ | - | $ | - | ||||||||
| Severance and Related Benefits | Other Exit Costs | Contract Termination Costs | Total Restructuring Accrual | |||||||||||||
| Balance at December 31, 2011 | $ | 571 | $ | 6 | $ | 154 | $ | 731 | ||||||||
| Additions, net | 1,905 | 184 | 3 | 2,092 | ||||||||||||
| Payments | (1,663 | ) | (190 | ) | (157 | ) | (2,010 | ) | ||||||||
| Balance at December 31, 2012 | $ | 813 | $ | - | $ | - | $ | 813 | ||||||||
We are authorized to issue 80.0160.0 million shares of Common Stock, par value $.0013, and 20.0 million shares of preferred stock, par value $.001. The Board of Directors has the authority to issue common and preferred shares, in series, with rights and privileges as determined by the Board of Directors. In December 2012,July 2013, we completed a public offering of 12,6509,775 shares of common stock, with net proceeds of approximately $23.3$40.1 million.
a. Operating Leases
As of December 31, 2012,2013, we leased office, manufacturing and laboratory space, under lease agreements expiring in December 2020.
Rental payments are recognized as rent expense on a straight-line basis over the term of the lease. In addition to rents due under these agreements, we are obligated to pay additional facilities charges, including utilities, taxes and operating expenses. We also lease certain office equipment under non-cancelable operating leases, which expire at various times through April 2013.
As of December 31, 2012,2013, future minimum annual payments under all operating lease agreements are as follows:
| Years ending December 31, | Minimum Annual Payments | Minimum Annual Payments | |||||
| 2013 | $ | 2,410 | |||||
| 2014 | 2,410 | $ | 1,841 | ||||
| 2015 | 2,470 | 1,887 | |||||
| 2016 | 2,532 | 1,934 | |||||
| 2017 | 2,595 | 1,983 | |||||
| 2018 | 2,032 | ||||||
| Thereafter | 8,182 | 4,218 | |||||
| Total | $ | 20,599 | $ | 13,895 | |||
Rental expense totaled approximately $3,548, $2,074 and $3,475 for 2013, 2012 and $3,544 for 2012, 2011, and 2010, respectively. For 2013 and 2012, amounts paid exceeded rent expense by $164 and $419, respectively, due to the recognition of lease incentives. For 2011, and 2010, we recognized rent expense in excess of amounts paid of $63, and $181, respectively, due to the recognition of escalation clauses and lease incentives. Additional facility charges, including utilities, taxes and operating expenses, for 2013, 2012 2011 and 20102011 were approximately $2,330, $2,845 $4,033 and $3,645,$4,033, respectively.
PROGENICS PHARMACEUTICALS, INC.
NOTES TO CONSOLIDATED FINANCIAL STATEMENTS ¾- continued
(amounts in thousands, except per share amounts or as otherwise noted)
b. Licensing, Service Supply and Related PartySupply Agreements
Progenics hasand its subsidiaries have entered into intellectual property-based license and service agreements in connection with its product development programs. Progenics hasprograms, and have recognized milestone, license and sublicense fees and supply costs, which are included in research and development expenses, totaling approximately $567, $1,170 and $578 and $1,266 for 2012, 2011 and 2010,during the last three years, respectively.
| Agreement | Paid from inception to December 31, 2012 | Future (1) Commitments | Terms | |||||||||||||||
| Paid from inception to December 31, 2013 | Future (1) Commitments | Terms | Progenics agreements with: | |||||||||||||||
| Lonza Sales AG | $ | 909 | $ | 808 | Annual license fee payments, milestones and royalties, as applicable, in respect of oncology and other products. | $ | 909 | $ | 824 | Annual license fee payments, milestones and royalties, as applicable, in respect of oncology and other products. | ||||||||
| PSMA LLC agreements with: | ||||||||||||||||||
| Seattle Genetics, Inc. | 4,400 | 13,800 | Milestone and periodic maintenance payments to use ADC technology to link chemotherapeutic agents to monoclonal antibodies that target prostate specific membrane antigen. ADC technology is based in part on technology licensed by SGI from third parties. | 4,400 | 13,900 | Milestone and periodic maintenance payments to use ADC technology to link chemotherapeutic agents to monoclonal antibodies that target prostate specific membrane antigen. ADC technology is based in part on technology licensed by SGI from third parties. | ||||||||||||
| Amgen Fremont, Inc. (formerly Abgenix) | 1,350 | 5,750 | Milestones and royalties to use XenoMouse® technology for generating fully human antibodies to PSMA LLC's PSMA antigen. | |||||||||||||||
| Former member of PSMA LLC | 278 | 52,188 | Annual minimum royalty payments and milestones to use technology related to PSMA. | |||||||||||||||
| Amgen Fremont, Inc. (formerly Abgenix) | 1,350 | 5,750 | Milestones and royalties to use XenoMouse® technology for generating fully human antibodies to PSMA LLC's PSMA antigen. | |||||||||||||||
| Paid from acquisition date to December 31, 2013 | Future (1) Commitments | Terms | ||||||||||||||||
| Former member of PSMA LLC | 241 | 52,216 | Annual minimum royalty payments and milestones to use technology related to PSMA. | |||||||||||||||
MIP agreements with: | ||||||||||||||||||
| University of Zurich and the Paul Scherrer Institute | 65 | 1,225 | Annual maintenance and license fee payments, milestones and royalties in respect of licensed technology related to 1404. | |||||||||||||||
| University of Western Ontario | 4 | 374 | Annual minimum royalty, administration and milestone payments in respect of licensed technology related to Azedra. | |||||||||||||||
| Novartis Pharma AG and other interests | - | 4,600 | Milestone and royalty payments in respect of licensed technology related to Onalta. | |||||||||||||||
| Bayer Schering Pharma AG | - | 9,000 | Milestone and royalty payments in respect of licensed technology related to a MIP asset. | |||||||||||||||
(1) Amounts based on known contractual obligations as specified in the respective license agreements, which are dependent on the achievement or occurrence of future milestones or events and exclude amounts for royalties which are dependent on future sales and are unknown.
We are seeking to out-license or terminate non-germane Molecular Insight licenses and service agreements, as to which we have paid $216 through December 31, 2013, and have future commitments of $3,453, subject to occurrence of future milestones or events.
c. Consulting Agreements
As part of our research and development efforts, we have from time to time entered into consulting agreements with external scientific specialists. These agreements contain various terms and provisions, including fees to be paid by us and royalties, in the event of future sales, and milestone payments, upon achievement of defined events, payable by us. Certain of these scientists are advisors to Progenics, and some have purchased our Common Stock or received stock options which are subject to vesting provisions. Two members of our Board formerly had consulting agreements; no payments in respect of these agreements have been made since 2010. We have recognized expenses with regard to the consulting agreements of $39, $8 and $27 for 2013, 2012 and $179 for 2012, 2011, and 2010, respectively. Those expenses include the fair value of stock options granted during 20112013 and 2010,2011, which were fully vested at grant date, of approximately $11$7 and $42,$11, respectively. Such amounts of fair value are included in research and development expense for each year presented (see Note 10)11).
F-24
PROGENICS PHARMACEUTICALS, INC.
NOTES TO CONSOLIDATED FINANCIAL STATEMENTS - continued
(amounts in thousands, except per share amounts or as otherwise noted)
d. Retirement Agreement
On March 14, 2012, Progenics and company founder Paul J. Maddon entered into an agreement providing for his retirement as Chief Science Officer. In connection with Dr. Maddon's retirement and termination of his employment agreement, Progenics agreed to pay him an amount equal to $1,789 and provide other benefits under the agreement.
e. Related Party Agreement
In December 2012, Progenics entered into a financial advisory agreement with MTS Health Partners, L.P., of which the Company's Board Chair is a Senior Managing Director and partner, on customary terms and conditions, whereby, in 2013, MTS will receive ahas received monthly retainer of $10retainers totaling $55 during the term of the agreement (which may be terminated by either party on 30 days notice),and $300 for MTS' services in connection with the Molecular Insight acquisition described in Note 15,2. This agreement was terminated in June 2013.
f. Legal Proceedings
Progenics is a party to a proceeding brought by a former employee complaining that the Company violated the anti-retaliation provisions of the federal Sarbanes-Oxley law by terminating the former employee. The Company believes the former employee's claims are without merit and is contesting the matter vigorously. The federal District Court hearing the case issued in connection with other transactions, if any, asJuly 2013 an order denying our motion for summary judgment dismissing the former employee's complaint, making it likely that the proceeding will continue to which MTS provides servicestrial. Given the inherent uncertainty attendant to the Company, such other amounts asproceeding, it is not possible at this time to estimate the parties may mutually agree.
October 2013 commenced an arbitration with Ono under the provisions of the parties' License Agreement, following a communication from Ono that it has determined to discontinue development of subcutaneous Relistor in Japan because of "commercial concerns" that Ono contends would permit it to cease development and terminate the Agreement. Under our Agreement with Ono, Ono may cease development of subcutaneous Relistor only if it terminates the License Agreement, which it may do unilaterally only if Progenics is in material default. Progenics is not in default under the Agreement, and Ono has neither asserted that Progenics is, nor terminated the Agreement.
Our share-based compensation to employees includes non-qualified stock options, restricted stock and shares issued under our Purchase Plans, which are compensatory under ASC 718 Compensation – Stock Compensation. During the second quarter of 2011, we accelerated the vesting of outstanding awards to non-management employees in connection with a change in program eligibility and termination of the Company's employee stock purchase plans. We account for share-based compensation to non-employees, including non-qualified stock options and restricted stock, in accordance with ASC 505 Equity.
Compensation cost for share-based awards will be recognized in our financial statements over the related requisite service periods; usually the vesting periods for awards with a service condition. We have made an accounting policy decision to use the straight-line method of attribution of compensation expense, under which the grant date fair value of share-based awards will be recognized on a straight-line basis over the total requisite service period for the total award.
We have adopted two stock incentive plans, the 1996 Amended Stock Incentive Plan (terminated in 2006) and the 2005 Stock Incentive Plan. Under these Plans as amended, up to 5,000 and 8,450 shares of common stock, respectively, have been reserved for the issuance of awards to employees, consultants, directors and other individuals who render services to Progenics (collectively, Awardees). The Plans contain anti-dilution provisions in the event of a stock split, stock dividend or other capital adjustment as defined. Each Plan provides for the Board or Committee to grant to Awardees stock options, stock appreciation rights, restricted stock, performance awards or phantom stock, as defined (collectively, Awards). The Committee is also authorized to determine the term and vesting of each Award and the Committee may in its discretion accelerate the vesting of an Award at any time. Stock options granted under the Plans generally vest pro rata over three to five years and have terms of ten years. Restricted stock issued under either Plan usually vestsgenerally vested annually over three to five years, unless specified otherwise by the Committee. The exercise price of outstanding non-qualified stock options is usually equal to the fair value of our common stock on the date of grant. The exercise price of non-qualified stock options granted from the 2005 Plan and incentive stock options (ISO) granted from the Plans may not be lower than the fair value of our common stock on the dates of grant. At December 31, 2013, 2012 2011 and 2010,2011, all outstanding stock options were non-qualified options. The 2005 Plan will terminate in April 2015; options granted before termination of the Plans will continue under the respective Plans until exercised, cancelled or expired.
F-25
PROGENICS PHARMACEUTICALS, INC.
NOTES TO CONSOLIDATED FINANCIAL STATEMENTS - continued
(amounts in thousands, except per share amounts or as otherwise noted)
We apply a forfeiture rate to the number of unvested awards in each reporting period in order to estimate the number of awards that are expected to vest. Estimated forfeiture rates are based upon historical data on vesting behavior of employees. We adjust the total amount of compensation cost recognized for each award, in the period in which each award vests, to reflect the actual forfeitures related to that award. Changes in our estimated forfeiture rate will result in changes in the rate at which compensation cost for an award is recognized over its vesting period.
Under ASC 718 Compensation – Stock Compensation,, the fair value of each non-qualified stock option award is estimated on the date of grant using the Black-Scholes option pricing model, which requires input assumptions noted in the following table. Ranges of assumptions for inputs are disclosed where the value of such assumptions varied during the related period. Historical volatilities are based upon daily quoted market prices of our common stock on The NASDAQ Stock Market LLC over a period equal to the expected term of the related equity instruments. We rely only on historical volatility since it provides the most reliable indication of future volatility. Future volatility is expected to be consistent with historical; historical volatility is calculated using a simple average calculation; historical data is available for the length of the option's expected term and a sufficient number of price observations are used consistently. Since our stock options are not traded on a public market, we do not use implied volatility. For 2013, 2012 2011 and 20102011 our expected term was calculated based upon historical data related to exercise and post-termination cancellation activity. Accordingly,activity; accordingly, for grants issued to employees and directors and officers (excluding our former CEO in 2011 and 2010)2011), we are using expected terms of 5.45.3 and 7.4 years, 5.35.4 and 7.4 years and 5.3 and 7.37.4 years, respectively. The expected term of stock options granted to our former CEO in 2011 and 2010 was calculated separately from stock options granted to employees and directors and officers, and was 8 years for 2011 and 2010.2011. The expected term for options granted to non-employees was also calculated separately from stock options granted to employees and directors and officers and was ten years, which is the contractual term of those options. We have never paid dividends and do not expect to pay dividends in the future. Therefore, our dividend rate is zero. The risk-free rate for periods within the expected term of the options is based on the U.S. Treasury yield curve in effect at the time of grant. The following table presents assumptions used in computing the fair value of option grants during 2013, 2012 2011 and 2010:2011:
| 2013 | 2012 | 2011 | ||||||||||
| Expected volatility | 73% – 90 | % | 70% – 85 | % | 68% – 78 | % | ||||||
| Expected dividends | Zero | Zero | Zero | |||||||||
| Expected term (years) | 5.3 – 10 | 5.3 – 10 | 5.3 – 10 | |||||||||
| Weighted average expected term (years) | 5.96 | 6.11 | 6.17 | |||||||||
| Risk-free rate | 0.76% – 2.83 | % | 0.57% – 1.71 | % | 0.77% – 2.97 | % | ||||||
A summary of option activity under the Plans as of December 31, 2013 and changes during the year then ended is presented below:
| Options | Shares | Weighted Average Exercise Price | Weighted Average Remaining Contractual Term (Yr.) | Aggregate Intrinsic Value | ||||||||||||
| Outstanding at January 1, 2013 | 5,366 | $ | 12.27 | |||||||||||||
| Granted | 1,018 | 5.13 | ||||||||||||||
| Exercised | (14 | ) | 5.08 | |||||||||||||
| Forfeited | (608 | ) | 10.63 | |||||||||||||
| Expired | (463 | ) | 14.70 | |||||||||||||
| Outstanding at December 31, 2013 | 5,299 | 10.89 | 5.82 | $ | 304 | |||||||||||
| Exercisable at December 31, 2013 | 3,875 | $ | 12.45 | 4.86 | $ | 118 | ||||||||||
PROGENICS PHARMACEUTICALS, INC.
NOTES TO CONSOLIDATED FINANCIAL STATEMENTS ¾- continued
(amounts in thousands, except per share amounts or as otherwise noted)
| 2012 | 2011 | 2010 | ||||
| Expected volatility | 70% – 85% | 68% – 78% | 68% – 87% | |||
| Expected dividends | Zero | zero | zero | |||
| Expected term (years) | 5.3 – 10 | 5.3 – 10 | 5.3 – 10 | |||
| Weighted average expected term (years) | 6.11 | 6.17 | 6.92 | |||
| Risk-free rate | 0.57% – 1.71% | 0.77% – 2.97% | 1.21% – 3.09% |
| Options | Shares | Weighted Average Exercise Price | Weighted Average Remaining Contractual Term (Yr.) | Aggregate Intrinsic Value | |||||||||||
| Outstanding at January 1, 2012 | 5,597 | $ | 12.60 | ||||||||||||
| Granted | 814 | 9.54 | |||||||||||||
| Exercised | (38 | ) | 5.28 | ||||||||||||
| Forfeited or expired | (1,007 | ) | 12.16 | ||||||||||||
| Outstanding at December 31, 2012 | 5,366 | $ | 12.27 | 5.61 | $ | 1 | |||||||||
| Exercisable at December 31, 2012 | 3,970 | $ | 13.72 | 4.77 | $ | 1 | |||||||||
The weighted average grant-date fair value of options granted under the Plans during 2013, 2012 and 2011 was $3.74, $6.38 and 2010 was $6.38, $5.51, and $3.10, respectively. The total intrinsic value of options exercised during 2013, 2012 and 2011 was $11, $174 and 2010 was $174, $345, and $0, respectively.
The options granted under the Plans, described above, include 33, 113, 38, 75, 145 and 113 non-qualified stock options granted to our former CEO on July 1, 2002, 2003, 2004 and 2005, on July 3, 2006 and on July 2, 2007, respectively, which cliff vest after nine years and 11 months from the respective grant date. All but the 2006 awards are fully vested. Vesting of a defined portion of each award will occur earlier if a defined performance condition is achieved; more than one condition may be achieved in any period. In accordance with ASC 718 Compensation – Stock Compensation, at the end of each reporting period, we will estimate the probability of achievement of each performance condition and will use those probabilities to determine the requisite service period of each award.2006. For the 2006 award, the requisite service period is the shortest of the explicit or implied service periods and the explicit service period for this award is nine years and 11 months from the grant date. The implied service periods related to the performance conditions were the estimated times for each performance condition to be achieved. Thus, compensation expense was recognized over the shortest estimated time for the achievement of performance conditions for that award (assuming that the performance conditions were to be achieved before the cliff vesting occurred). On July 1, 2008, 2009 and 2010, we granted awards to our former CEO (consisting of options in 2010 and 2009 and options and restricted stock in 2008) and on July 1, 2010 to our CEO (consisting of options) which vest on the basis of the achievement of specified performance or market-based milestones. In connection with our former CEO's retirement in 2012 the 2004, 2007, 2008, 2009 and 2010 performance or market-based awards have been fully vested as a result of accelerated vesting during 2012. The options have an exercise price equal to the closing price of our common stock on the date of grant. The awards are valued using a Monte Carlo simulation model. On July 1, 2011 and March 1, 2012, we granted option awards to our CEO which vests on the basis of the achievement of specified performance-based milestones. The options have exercise prices equal to the closing price of our common stock on the dates of grant. The awards are valued using the Black-Scholes option pricing model. The expense related to the grants with performance and market-based milestones will be recognized over the shortest estimated time for the achievement of the performance or market conditions. The awards will not vest unless one of the milestones is achieved or the market condition is met. Changes in the estimate of probability of achievement of any performance or market condition will be reflected in compensation expense of the period of change and future periods affected by the change.
At December 31, 2012,2013, the estimated requisite service periods for the 2006, 2010, 2011 and 2012 awards, described above, were 3.5,2.5, 1.0 2.0 and 2.01.0 years, respectively. For 2013, 2012 2011 and 2010,2011, the total compensation expense recognized for the performance-based options was $0.1 million, $2.0 million $0.4 million and $1.1$0.4 million, respectively.
A summary of the status of our outstanding restricted stock awarded under the Plans which has not yet vested as of December 31, 20122013 and changes during the year then ended is presented below:
| Restricted Stock Awards | Shares | Weighted Average Grant-Date Fair Value | ||||||
| Nonvested at January 1, 2013 | 28 | $ | 5.35 | |||||
| Granted | - | - | ||||||
| Vested | (27 | ) | 5.35 | |||||
| Forfeited | (1 | ) | 5.35 | |||||
| Nonvested at December 31, 2013 | - | $ | - | |||||
| Restricted Stock Awards | Shares | Weighted Average Grant-Date Fair Value | |||||
| Nonvested at January 1, 2012 | 98 | $ | 7.40 | ||||
| Granted | - | - | |||||
| Vested | (64 | ) | 8.50 | ||||
| Forfeited | (6 | ) | 5.35 | ||||
| Nonvested at December 31, 2012 | 28 | $ | 5.35 | ||||
Two employee stock purchase plans (the Purchase Plans), the 1998 Employee Stock Purchase Plan (the Qualified Plan) and the 1998 Non-Qualified Employee Purchase Plan (the Non-Qualified Plan), as amended, provided for the issuance of up to 4,400 and 1,100 shares of common stock, respectively. Issuances of common stock under the Purchase Plans, terminated by the Company during the second quarter of 2011, provided for the grant to all employees of options to use an amount equal to 25% of their quarterly compensation, as such percentage was determined by the Board of Directors prior to the date of grant, to purchase shares of our common stock at a price per share equal to the lesser of the fair market value of the common stock on the date of grant or 85% of the fair market value on the date of exercise. Options were granted automatically on the first day of each fiscal quarter and expired six months after the date of grant. The Qualified Plan was not available to employees owning more than five percent of the common stock and imposed certain other quarterly limitations on option grants. Options under the Non-Qualified Plan were granted to the extent that option grants were restricted under the Qualified Plan.
The fair value of shares purchased under the Purchase Plans was estimated on the date of grant in accordance with ASC 718 Compensation – Stock Compensation, via the same option valuation model used for options granted under the Plans, but with the following assumptions during 2011 and 2010:2011:
| 2011 | 2010 | |||
| Expected volatility | 43% – 51% | 45% – 72% | ||
| Expected dividends | zero | zero | ||
| Expected term | 6 months | 6 months | ||
| Risk-free rate | 0.06% – 0.22% | 0.11% – 0.18% |
| 2011 | ||||
| Expected volatility | 43% – 51 | % | ||
| Expected dividends | zero | |||
| Expected term | 6 months | |||
| Risk-free rate | 0.06% – 0.22 | % | ||
F-27
PROGENICS PHARMACEUTICALS, INC.
NOTES TO CONSOLIDATED FINANCIAL STATEMENTS - continued
(amounts in thousands, except per share amounts or as otherwise noted)
Purchases of common stock under the Purchase Plans during 2011 and 2010 are summarized as follows:
| Qualified Plan | Non-Qualified Plan | ||||||||||||||||||||||
| Shares Purchased | Price Range | Weighted Average Grant-Date Fair Value | Shares Purchased | Price Range | Weighted Average Grant-Date Fair Value | ||||||||||||||||||
| 2011 | 428 | $ | 4.62 – $5.65 | $ | 0.88 | 162 | $ | 4.62 – $5.65 | $ | 0.84 | |||||||||||||
| 2010 | 802 | $ | 3.50 – $4.56 | $ | 0.94 | 208 | $ | 3.75 – $4.56 | $ | 0.96 | |||||||||||||
| Qualified Plan | Non-Qualified Plan | |||||||||||||||||||||||
| Shares Purchased | Price Range | Weighted Average Grant-Date Fair Value | Shares Purchased | Price Range | Weighted Average Grant-Date Fair Value | |||||||||||||||||||
| 2011 | 428 | $ | 4.62 – $5.65 | $ | 0.88 | 162 | $ | 4.62 – $5.65 | $ | 0.84 | ||||||||||||||
The total compensation expense of shares, granted to both employees and non-employees, under all of our share-based payment arrangements that was recognized in operations during 2013, 2012 2011 and 20102011 was:
| 2012 | 2011 | 2010 | 2013 | 2012 | 2011 | ||||||||||||||||||
| Recognized as: | |||||||||||||||||||||||
| Research and Development | $ | 4,568 | $ | 4,499 | $ | 5,091 | $ | 2,524 | $ | 4,568 | $ | 4,499 | |||||||||||
| General and Administrative | 1,968 | 1,863 | 4,424 | 1,022 | 1,968 | 1,863 | |||||||||||||||||
| Total | $ | 6,536 | $ | 6,362 | $ | 9,515 | $ | 3,546 | $ | 6,536 | $ | 6,362 | |||||||||||
No tax benefit was recognized related to such compensation cost because of the Company's net operating losses and the related deferred tax assets were fully offset by valuation allowance. Accordingly, no amounts related to windfall tax benefits have been reported in cash flows from operations or cash flows from financing activities for the periods presented.
As of December 31, 2012,2013, there was $5.1 million and $0.1$4.4 million of total unrecognized compensation cost related to non-vested stock options under the 1996 and 2005 Plans and non-vested restricted shares, respectively.Plans. Those costs are expected to be recognized over a weighted average periodsperiod of 1.8 years and 0.5 years, respectively.2.1 years. Cash received from exercises under all share-based payment arrangements for 20122013 was $0.3$0.1 million. We issue new shares of our common stock upon share option exercise and share purchase.exercises.
In applying the treasury stock method for the calculation of diluted EPS, amounts of unrecognized compensation expense and windfall tax benefits are required to be included in the assumed proceeds in the denominator of the diluted EPS calculation unless they are anti-dilutive. We incurred net losses for 20122013 and 20102012 and, therefore, such amounts have not been included in the calculations for those periods since they would be anti-dilutive. As a result, basic and diluted EPS are the same for the 20122013 and 20102012 periods. We reported net income for 2011 and included the dilutive effect of unrecognized compensation expense in the assumed proceeds in the denominator of the diluted EPS calculation. We have made an accounting policy decision to calculate windfall tax benefits/shortfalls, for purposes of diluted EPS calculation, excluding the impact of deferred tax assets. This policy decision will apply when we have net income and windfall tax benefits/shortfalls are realizable.
The terms of the amended and restated Progenics Pharmaceuticals 401(k) Plan (the Amended Plan), among other things, allow eligible employees to participate in the Amended Plan by electing to contribute to the Amended Plan a percentage of their compensation to be set aside to pay their future retirement benefits. During the three years ended December 31, 2012,2013, we matched 50% of those employee contributions that are equal to 5%-8% of compensation and are made by eligible employees to the Amended Plan (the Matching Contribution). In addition, we may also make a discretionary contribution each year on behalf of all participants who are non-highly compensated employees. We made Matching Contributions of approximately $330, $535 $597 and $594$597 to the Amended Plan for 2013, 2012 2011 and 2010,2011, respectively. No discretionary contributions were made during those years.
We account for income taxes using the liability method in accordance with ASC 740 Income Taxes. Deferred income taxes reflect the net tax effects of temporary differences between the carrying amounts of assets and liabilities for financial reporting purposes and the amounts used for income tax purposes.
PROGENICS PHARMACEUTICALS, INC.
NOTES TO CONSOLIDATED FINANCIAL STATEMENTS ¾- continued
(amounts in thousands, except per share amounts or as otherwise noted)
There is no provision or benefit for federal or state income taxes for 2013, 2012 and 2011, or 2010 other than a federal$0.4 million income tax refundbenefit in 2013, resulting from the change in the temporary difference between carrying amounts of $95 we received in 2010 from new legislation permittingin-process research and development assets for financial reporting purposes and the carryback of net operating losses (NOLs) to 2005 as well as permitting the suspension of limitations on alternative minimumamounts used for income tax NOL utilization.purposes. We have completed a calculation through March 31, 2011, under Internal Revenue Code Section 382, the results of which indicate that past ownership changes will limit utilization of NOLs in the future. Ownership changes subsequent to March 31, 2011, may further limit the future utilization of net operating loss and tax credit carry-forwards as defined by the federal and state tax codes.
Deferred tax assets and liabilities as of December 31, 20122013 and 2011,2012, consisted of the following:
| 2012 | 2011 | 2013 | 2012 | |||||||||||||
| Deferred tax assets: | ||||||||||||||||
| Depreciation and amortization | $ | 6,497 | $ | 6,865 | $ | 6,165 | $ | 6,497 | ||||||||
| R&E tax credit carry-forwards | 11,843 | 11,966 | 5,129 | 11,843 | ||||||||||||
| NYS investment tax credit carry-forwards | 1,084 | 1,088 | 1,095 | 1,084 | ||||||||||||
| AMT credit carry-forwards | 211 | 211 | 211 | 211 | ||||||||||||
| Net operating loss carry-forwards | 112,966 | 85,110 | 190,263 | 112,966 | ||||||||||||
| Capitalized research and development expenditures | 30,884 | 43,113 | 25,231 | 30,884 | ||||||||||||
| Stock compensation | 14,436 | 13,789 | 13,826 | 14,436 | ||||||||||||
| Other items | 2,193 | 3,600 | 1,097 | 2,193 | ||||||||||||
| Total gross deferred tax assets | 180,114 | 165,742 | 243,017 | 180,114 | ||||||||||||
| Less: Valuation allowance | (178,045 | ) | (165,742 | ) | (243,017 | ) | (178,045 | ) | ||||||||
| Deferred tax assets | 2,069 | - | - | 2,069 | ||||||||||||
| Deferred tax liability - current | (2,069 | ) | - | - | (2,069 | ) | ||||||||||
| Net deferred tax asset (liability) | $ | - | $ | - | ||||||||||||
| Deferred tax liability – long term | (12,321 | ) | - | |||||||||||||
| Net deferred tax liability | $ | (12,321 | ) | $ | - | |||||||||||
We do not recognize deferred tax assets considering our history of taxable losses and the uncertainty regarding our ability to generate sufficient taxable income in the future to utilize these deferred tax assets. For 2013 and 2012, we incurred net losses for tax purposes. For 2011, we had income for tax purposes and such amount was offset completely by our available net operating loss carry-forwards. We recognized a full tax valuation against deferred taxes at December 31, 2012 and 2011.2013. In 2012, we recognized deferred income tax assets, net of a valuation allowance, of $2,069 ($17 in current assets and $2,052 in non-current assets) and in 2013 and 2012 we recognized deferred income tax liabilities of $12,321 and $2,069, respectively to reflect the net tax effects of temporary differences between the carrying amounts of certain assets and liabilities for financial reporting purposes and the amounts used for income tax purposes. The recognition of these deferred income tax assets and liabilities had no effect on our net loss for 2012.2012, however, it resulted in $362 income tax benefit for 2013.
F-29
PROGENICS PHARMACEUTICALS, INC.
NOTES TO CONSOLIDATED FINANCIAL STATEMENTS - continued
(amounts in thousands, except per share amounts or as otherwise noted)
The following is a reconciliation of income taxes computed at the Federal statutory income tax rate to the actual effective income tax provision during 2013, 2012 2011 and 2010:2011:
| 2012 | 2011 | 2010 | 2013 | 2012 | 2011 | |||||||||||||
| U.S. Federal statutory rate | (35.0)% | 35.0% | (34.0)% | (34.0 | )% | (35.0 | )% | 35.0 | % | |||||||||
| State income taxes, net of Federal benefit | (5.4) | 8.0 | (5.1) | (4.9 | ) | (5.4 | ) | 8.0 | ||||||||||
| Research and experimental tax credit | - | (4.1) | (1.7) | (3.6 | ) | - | (4.1 | ) | ||||||||||
| Change in valuation allowance | 34.7 | (22.6) | 38.2 | 11.4 | 34.7 | (22.6 | ) | |||||||||||
| Effect of federal tax rate bracket change on valuation allowance | - | (34.8) | - | 8.7 | - | (34.8 | ) | |||||||||||
| Equity compensation | 4.2 | 17.0 | 2.3 | 3.1 | 4.2 | 17.0 | ||||||||||||
| Investment tax credit | - | (0.1) | 0.1 | (0.1 | ) | - | (0.1 | ) | ||||||||||
| NOL expiration – Section 382 | 18.6 | - | - | |||||||||||||||
| Other | 1.5 | 1.6 | 0.1 | - | 1.5 | 1.6 | ||||||||||||
| Income tax provision (benefit) | 0.0% | 0.0% | (0.1)% | (0.8 | )% | 0.0 | % | 0.0 | % | |||||||||
As of December 31, 2012,2013, we had available, for tax return purposes, unused federal NOLs of approximately $298.0$513.8 million, which will expire in various years from 20212018 to 2032,2033, $18.2 million of which were generated from deductions post January 1, 2006 that, when realized, will reduce taxes payable and will increase paid-in-capital and are not reflected in our deferred tax assets above. Additionally, $11.4$11.2 million of the valuation allowance relates to NOLs attributable to excess tax deductions for equity compensation pre January 1, 2006. When realized this will also be reflected as an increase to paid-in-capital. Also, we had available, for tax return purposes, unused state NOLs of approximately $453.1 million, which will expire in various years from 2019 to 2033.
We have reviewed our nexus in various tax jurisdictions and our tax positions related to all open tax years for events that could change the status of our ASC 740 Income Taxes liability, if any, or require an additional liability to be recorded. During 2013, 2012 2011 and 2010,2011, we had no unrecognized tax benefits resulting from tax positions during a prior or current period, settlements with taxing authorities or the expiration of the applicable statute of limitations.limitations, except for the $0.4 million income tax benefit recognized in 2013, resulting from the change in the difference between carrying amounts of in-process research and development assets for financial reporting purposes and the amounts used for income tax purposes. We have not, as of yet, conducted a study of our research and development credit carry-forwards. Such a study might result in an adjustment to our research and development credit carry-forwards, but until a study is completed and any adjustment is known, no amounts are being presented as an uncertain tax position under ASC 740-10. A full valuation allowance has been provided against the Company's research and development credits and, if an adjustment is required, this adjustment would be offset by an adjustment to the valuation allowance. Thus, there would be no impact to the statements of operations and comprehensive loss if an adjustment was required.
As of December 31, 2012,2013, we are subject to federal and state income tax in the U.S. Open tax years relate to years in which unused net operating losses were generated or, if used, for which the statute of limitation for examination by taxing authorities has not expired. Our open tax years extend back to 1995, with the exception of 1997 and 2011, during which we reported net income.1996. No amounts of interest or penalties were recognized in our Consolidated Statements of Operations or Consolidated Balance Sheets as of and for 2013, 2012 2011 and 2010.2011.
Our research and experimental (R&E) tax credit carry-forwards of approximately $11.8$5.1 million at December 31, 20122013 expire in various years from 2018 to 2032.2033. During 2012,2013, research and experimental tax credit carry-forwards of approximately $125$20 expired. The American Taxpayer Relief Act of 2012, enacted on January 2, 2013, retroactively reinstated the federal research and development credit for 2012 and extended these credits through 2013.
F-30
PROGENICS PHARMACEUTICALS, INC.
(amounts in thousands, except per share amounts or as otherwise noted)
As of December 31, 2013, we have not recognized any liability for uncertain tax positions, because of our full valuation allowance. We will recognize interest and penalties related to these positions, should such costs be assessed. As of December 31, 2013, we have not recognized interest and penalties. The recognition of unrecognized tax benefits would not affect our effective tax rate because the tax benefit would be offset by an increase in our valuation allowance.
The following is a tabular reconciliation of the total amounts of unrecognized tax benefits for the year ended December 31, 2013.
| 2013 | |||
| Beginning uncertain tax benefits | $ | 2,661 | |
| Current year - increases | - | ||
| Current year - decreases | - | ||
| Settlements | - | ||
| Expired statuses | - | ||
| Ending uncertain tax benefits | $ | 2,661 | |
14. Net Income (Loss) Per Share
Our basic net (loss) income per share amounts have been computed by dividing net (loss) income by the weighted-average number of common shares outstanding during the period. For 20122013 and 2010,2012, we reported net losses and, therefore, potential common shares were not included since such inclusion would have been anti-dilutive. For 2011, we reported net income, and the computation of diluted earnings per share is based upon the weighted-average number of our common shares and dilutive effect, determined using the treasury stock method, of potential common shares outstanding. As of December 31, 2012 2011 and 2010,2011, our 28 98 and 341,98, respectively, shares of unvested restricted stock outstanding havewith non-forfeitable rights to dividends.dividends were outstanding; all such shares were vested at the end of December 31, 2013. The allocation of 2012 and 2010 net losses and the 2011 net income to these participating securities pursuant to the two-class method is not material to both basic and diluted earnings per share. The calculations of net loss per share, basic and diluted, are as follows:
Net (Loss) Income (Numerator) | Weighted Average Common Shares (Denominator) | Per Share Amount | Net (Loss) Income (Numerator) | Weighted Average Common Shares (Denominator) | Per Share Amount | |||||||||||||||||||
| 2013: | ||||||||||||||||||||||||
| Basic and diluted | $ | (42,572 | ) | 55,798 | $ | (0.76 | ) | |||||||||||||||||
| 2012: | ||||||||||||||||||||||||
| Basic and diluted | $ | (35,431 | ) | 34,754 | $ | (1.02 | ) | $ | (35,431 | ) | 34,754 | $ | (1.02 | ) | ||||||||||
| 2011: | ||||||||||||||||||||||||
| Basic | $ | 10,381 | 33,375 | $ | 0.31 | $ | 10,381 | 33,375 | $ | 0.31 | ||||||||||||||
| Dilutive effect of stock options | - | 66 | - | 66 | ||||||||||||||||||||
| Dilutive effect of restricted stock | - | 53 | - | 53 | ||||||||||||||||||||
| Diluted | $ | 10,381 | 33,494 | $ | 0.31 | $ | 10,381 | 33,494 | $ | 0.31 | ||||||||||||||
| 2010: | ||||||||||||||||||||||||
| Basic and diluted | $ | (69,725 | ) | 32,590 | $ | (2.14 | ) | |||||||||||||||||
During 2013, 2012 2011 and 2010,2011, anti-dilutive common shares excluded from diluted per share amounts consist of the following:
| 2012 | 2011 | 2010 | |||||||||||||||||||||
Weighted Average Number | Weighted Average Exercise Price | Weighted Average Number | Weighted Average Exercise Price | Weighted Average Number | Weighted Average Exercise Price | ||||||||||||||||||
| Options | 5,947 | $ | 12.32 | 4,543 | $ | 14.92 | 5,037 | $ | 15.17 | ||||||||||||||
| Restricted stock | 60 | 45 | 45 | ||||||||||||||||||||
| Total | 6,007 | 4,588 | 5,082 | ||||||||||||||||||||
PROGENICS PHARMACEUTICALS, INC.
NOTES TO CONSOLIDATED FINANCIAL STATEMENTS ¾- continued
(amounts in thousands, except per share amounts or as otherwise noted)
| 2013 | 2012 | 2011 | |||||||||||||||||||||
Weighted Average Number | Weighted Average Exercise Price | Weighted Average Number | Weighted Average Exercise Price | Weighted Average Number | Weighted Average Exercise Price | ||||||||||||||||||
| Options | 5,969 | $ | 11.54 | 5,947 | $ | 12.32 | 4,543 | $ | 14.92 | ||||||||||||||
| Restricted stock | - | 60 | 45 | ||||||||||||||||||||
| Total | 5,969 | 6,007 | 4,588 | ||||||||||||||||||||
Summarized quarterly financial data during 20122013 and 20112012 are as follows:
| 2012 Quarter Ended | 2013 Quarter Ended | |||||||||||||||||||||||||||||||
| March 31 | June 30 | September 30 | December 31 | March 31 | June 30 | September 30 | December 31 | |||||||||||||||||||||||||
Revenues | $ | 2,226 | $ | 1,820 | $ | 1,117 | $ | 8,885 | $ | 2,226 | $ | 1,801 | $ | 867 | $ | 2,968 | ||||||||||||||||
| Net loss | (13,086 | ) | (10,720 | ) | (11,301 | ) | (324 | ) | (11,258 | ) | (12,263 | ) | (10,500 | ) | (8,551 | ) | ||||||||||||||||
| Net loss per share - basic and diluted | (0.39 | ) | (0.32 | ) | (0.33 | ) | (0.01 | ) | (0.22 | ) | (0.24 | ) | (0.17 | ) | (0.14 | ) | ||||||||||||||||
| 2011 Quarter Ended | ||||||||||||||||
| March 31 | June 30 | September 30 | December 31 | |||||||||||||
Revenues (2) | $ | 2,388 | $ | 74,407 | $ | 5,804 | $ | 2,197 | ||||||||
| Net income (loss) | (22,927 | ) | 55,486 | (11,432 | ) | (10,746 | ) | |||||||||
| Net income (loss) per share - basic | (0.69 | ) | 1.66 | (0.34 | ) | (0.32 | ) | |||||||||
| Net income (loss) per share - diluted | (0.69 | ) | 1.64 | (0.34 | ) | (0.32 | ) | |||||||||
| 2012 Quarter Ended | ||||||||||||||||
| March 31 | June 30 | September 30 | December 31 | |||||||||||||
Revenues (1) | $ | 2,226 | $ | 1,820 | $ | 1,117 | $ | 8,885 | ||||||||
| Net loss | (13,086 | ) | (10,720 | ) | (11,301 | ) | (324 | ) | ||||||||
| Net loss per share - basic and diluted | (0.39 | ) | (0.32 | ) | (0.33 | ) | (0.01 | ) | ||||||||
_______________
(1) | Revenues in the fourth quarter of 2012 include $5.0 million and $2.8 million from the MedImmune and CytoDyn Agreements, respectively. |
Allowance for Doubtful Accounts
| Year ended December 31, | Beginning Balance | Additions Charged to General and administrative expenses | Deductions Accounts Written Off During Period | Ending Balance | ||||||||||||
| (in thousands) | ||||||||||||||||
| 2013 | $ | - | $ | 7 | $ | - | $ | 7 | ||||||||
Pursuant to the requirements of Section 13 or 15(d) of the Securities Exchange Act of 1934, the registrant has duly caused this report to be signed on its behalf by the undersigned, thereunto duly authorized.
| PROGENICS PHARMACEUTICALS, INC. | ||
| By: | /s/ MARK R. BAKER | |
Mark R. Baker Chief Executive Officer and Director (Principal Executive Officer) | ||
Date: March 14, 201313, 2014
Pursuant to the requirements of the Securities Exchange Act of 1934, this report has been signed below by the following persons on behalf of the registrant in the capacities and on the dates indicated.
Signature | Capacity | Date | |
/s/ PETER J. CROWLEY | Chairman | March | |
| Peter J. Crowley | |||
| /s/ PAUL J. MADDON | Vice Chairman | March | |
Paul J. Maddon, M.D., Ph.D. | |||
| /s/ MARK R. BAKER | Chief Executive Officer and Director | March | |
| Mark R. Baker | (Principal Executive Officer) | ||
| /s/ | Director | March | |
| /s/ | Director | March | |
| /s/ DAVID A. SCHEINBERG | Director | March | |
| David A. Scheinberg, M.D., Ph.D. | |||
| /s/ NICOLE S. WILLIAMS | Director | March | |
| Nicole S. Williams | |||
| /s/ ANGELO W. LOVALLO, JR. | March | ||
| Angelo W. Lovallo, Jr. | (Principal Financial and Accounting Officer) | ||
| Exhibit | ||
| Number * | Description | |
| 3.1(1) | Amended and Restated Certificate of Incorporation of the Registrant. | |
| 3.2(2) | Amended and Restated By-laws of the Registrant. | |
| 4.1(3) | Specimen Certificate for Common Stock, $0.0013 par value per share, of the Registrant. | |
| 10.5(4) | Amended and Restated 1996 Stock Incentive Plan‡ | |
| 10.6.3(5) | Amended 2005 Stock Incentive Plan ‡ | |
| 10.6.4(6) | Form of Non-Qualified Stock Option Award Agreement ‡ | |
| 10.6.5(6) | Form of Restricted Stock Award Agreement ‡ | |
| 10.7(7) | Form of Indemnification Agreement‡ | |
| Retirement Agreement, dated as of March 14, 2012, between the Registrant and Dr. Paul J. Maddon‡ | ||
| 10.9(3) | Letter dated August 25, 1994 between the Registrant and Dr. Robert J. Israel‡ | |
| Development and License Agreement, dated April 30, 1999, between Protein Design Labs, Inc. and the Registrant. | ||
| Letter Agreement, dated November 24, 2003, relating to the Development and License Agreement between Protein Design Labs, Inc. and the Registrant. | ||
| Exclusive Sublicense Agreement, dated September 21, 2001, between the Registrant and UR Labs, Inc. | ||
| Amendment to Exclusive Sublicense Agreement, dated September 21, 2001, between the Registrant and UR Labs, Inc. | ||
| Amended and Restated Agreement of Lease, dated October 28, 2009, between BMR-Landmark at Eastview LLC and the Registrant. | ||
| 10.23 | Information concerning compensation of the Registrant's non-employee directors is included in the Registrant's proxy material for its September 12, 2013 and is incorporated herein by reference.‡ | |
| Option and License Agreement, dated May 8, 1985, by and between the University of Chicago and UR Labs, Inc., as amended by (i) Amendment to Option and License Agreement, dated September 17, 1987, by and between the University of Chicago and UR Labs, Inc., (ii) Second Amendment to Option and License Agreement, dated March 3, 1989, by and among the University of Chicago, ARCH Development Corporation and UR Labs, Inc., and (iii) Letter Agreement Related to Progenics' Relistor In-License dated, December 22, 2005, by and among the University of Chicago, acting on behalf of itself and ARCH Development Corporation, the Registrant, Progenics Pharmaceuticals Nevada, Inc. and Wyeth, acting through its Wyeth Pharmaceuticals Division. | ||
| Membership Interest Purchase Agreement, dated April 20, 2006, between the Registrant Inc. and Cytogen Corporation. | ||
| Amended and Restated PSMA/PSMP License Agreement, dated April 20, 2006, by and among the Registrant, Cytogen Corporation and PSMA Development Company LLC. | ||
| License Agreement, dated as of October 16, 2008, by and among Ono Pharmaceutical Co., Ltd. and the Registrant. | ||
| Partial Termination and License Agreement, dated October 16, 2008, by and among Wyeth, acting through Wyeth Pharmaceuticals Division, Wyeth-Whitehall Pharmaceuticals, Inc. and Wyeth-Ayerst Lederle, Inc. and the Registrant and Progenics Pharmaceuticals Nevada, Inc. | ||
| Consent, Acknowledgment and Agreement, dated as of October 16, 2008, by and among Wyeth, acting through Wyeth Pharmaceuticals Division, Wyeth-Whitehall Pharmaceuticals, Inc. and Wyeth-Ayerst Lederle, Inc., the Registrant and Ono Pharmaceutical Co., Ltd. | ||
| 2008 Agreement Related to Progenics' MNTX In-License, dated October 16, 2008, by and among the University of Chicago, acting on behalf of itself and ARCH Development Corporation, the Registrant, Progenics Pharmaceuticals Nevada, Inc. and Ono Pharmaceutical Co., Ltd. | ||
| Collaboration Agreement, effective June 14, 2005, by and between Seattle Genetics, Inc. and PSMA Development Company, LLC. | ||
| 10.37(9) † | License Agreement dated as of February 3, 2011, by and between Salix Pharmaceuticals, Inc., the Registrant, Progenics Pharmaceuticals Nevada, Inc. and Excelsior Life Sciences Ireland Limited. | |
| 10.37.1(9) † | 2010 Agreement Related to Progenics' MNTX In-License, dated February 3, 2011, by and among the University of Chicago, acting on behalf of itself and ARCH Development Corporation, the Registrant, Progenics Pharmaceuticals Nevada, Inc. and Salix Pharmaceuticals, Inc. | |
| 10.38(18) † | Stock Purchase and Sale Agreement, dated January 16, 2013, by and between Molecular Insight Pharmaceuticals, Inc., its Stockholders, the Registrant, and Highland Capital Management, L.P., as Stockholders Representative. | |
| 10.39(18) † | License Agreement, dated September 1, 2012, by and between FUJIFILM RI Pharma Co., Ltd. and Molecular Insight Pharmaceuticals, Inc. | |
| 10.40 †† | License Agreement, dated May 2, 2012, between Molecular Insight Pharmaceuticals, Inc., the University of Zurich and the Paul Scherrer Institute. | |
| 10.41(19) | License Agreement, dated as of December 15, 2000, between Molecular Insight Pharmaceuticals, Inc. and The Board of Governors of the University of Western Ontario. | |
| 10.42(19) | License Agreement, dated as of November 3, 2006, between Molecular Insight Pharmaceuticals, Inc. and Novartis Pharma AG, together with First Amendment, dated January 4, 2007, thereto. | |
| 10.43(20) | Controlled Equity OfferingSM Sales Agreement dated as of January 23, 2014, by and between the Registrant and Cantor Fitzgerald & Co. (filed as Exhibit 1.1 to Registration Statement on Form S-3, Commission File No. 333-193521. | |
| 12.1 | Statement re computation of ratio of earnings (loss) to combined fixed charges and preferred stock dividends. | |
| 21.1 | Subsidiaries of the Registrant. | |
| 23.1 | Consent of PricewaterhouseCoopers LLP. | |
| 23.2 | Consent of Ernst & Young LLP. | |
| 31.1 | Certification of Mark R. Baker, Chief Executive Officer of the Registrant pursuant to 13a-14(a) and Rule 15d-14(a) under the Securities Exchange Act of 1934, as amended. | |
| 31.2 | Certification of Angelo W. Lovallo, Jr., | |
| 32.1 | Certification of Mark R. Baker, Chief Executive Officer of the Registrant pursuant to 18 U.S.C. Section 1350, as adopted pursuant to Section 906 of the Sarbanes-Oxley Act of 2002. | |
| 32.2 | Certification of Angelo W. Lovallo, Jr., | |
| 101 | Interactive Data File | |
| 101.INS | XBRL Instance Document | |
| 101.SCH | XBRL Taxonomy Extension Schema | |
| 101.CAL | XBRL Taxonomy Extension Calculation Linkbase | |
| 101.LAB | XBRL Taxonomy Extension Label Linkbase | |
| 101.PRE | XBRL Taxonomy Extension Presentation Linkbase | |
| 101.DEF | XBRL Taxonomy Extension Definition Document |
| * | Exhibits footnoted as previously filed have been filed as an exhibit to the document of the Registrant or other registrant referenced in the footnote below, and are incorporated by reference herein. | |
| (1) | Previously filed in | |
| (2) | Previously filed in Current Report on Form 8-K filed on March 16, 2012. | |
| (3) | Previously filed in Registration Statement on Form S-1, Commission File No. 333-13627. | |
| (4) | Previously filed in Registration Statement on Form S-8, Commission File No. 333-120508. | |
| (5) | Previously filed in Current Report on Form 8-K filed on | |
| (6) | Previously filed in Current Report on Form 8-K filed on July 8, 2008. | |
| (7) | Previously filed in Quarterly Report on Form 10-Q for the | |
| Previously filed in Quarterly Report on Form 10-Q for the quarter ended March 31, 2012. | ||
| Previously filed in Quarterly Report on Form 10-Q for the | ||
| Previously filed in Annual Report on Form 10-K for the year ended December 31, 2004. | ||
| Previously filed in Annual Report on Form 10-K for the year ended December 31, 2002. | ||
| Previously filed in Current Report on Form 8-K filed on September 20, 2004. | ||
| Previously filed in Current Report on Form 8-K filed on November 28, 2012. | ||
| Previously filed in Annual Report on Form 10-K for the year ended December 31, 2005. |
| Previously filed in Quarterly Report on Form 10-Q for the | ||
| Previously filed in Annual Report on Form 10-K for the year ended December 31, 2008. | ||
| Previously filed in Amendment No. 2 to Annual Report on Form 10-K/A for the year ended December 31, 2009. | ||
| (18) | Previously filed in Quarterly Report on Form 10-Q for the quarter ended March 31, 2013. | |
| (19) | Previously filed in Registration Statement on Form S-1, Commission File No. 333-129570 filed by Molecular Insight Pharmaceuticals, Inc. | |
| (20) | Previously incorporated in Current Report on Form 8-K filed on January 24, 2014 by reference to Exhibit 1.1 to Registration Statement on Form S-3, Commission File No. 333-193521. | |
| † | Confidential treatment granted as to certain portions omitted and filed separately with the Commission. | |
| †† | Confidential treatment requested as to certain portions omitted and filed separately with the Commission. | |
| ‡ | Management contract or compensatory plan or arrangement. | |