| Title of each class | Name of each exchange on which registered | |||
| Common Stock, $.01 par value per share | New York Stock Exchange | |||
| None | ||||
Indicate by check mark if the Registrantregistrant is a well-known seasoned issuer, as defined in Rule 405 of the Securities Act. Yes x No ¨
Indicate by check mark if the Registrantregistrant is not required to file reports pursuant to Section 13 or Section 15(d) of the Act. Yes ¨ No x
Indicate by check mark whether the Registrantregistrant (1) has filed all reports required to be filed by Section 13 or 15(d) of the Securities Exchange Act of 1934 during the preceding 12 months (or for such shorter period that the Registrantregistrant was required to file such reports), and (2) has been subject to such filing requirements for the past 90 days. Yes x No ¨
Indicate by check mark whether the registrant has submitted electronically and posted on its corporate Web site, if any, every Interactive Data File required to be submitted and posted pursuant to Rule 405 of Regulation S-T (§232.405 of this chapter) during the preceding 12 months (or for such shorter period that the registrant was required to submit and post such files). Yes x No ¨
Indicate by check mark if disclosure of delinquent filers pursuant to Item 405 of Regulation S-K (§ 229.405 of this chapter) is not contained herein, and will not be contained, to the best of Registrant’sregistrant’s knowledge, in definitive proxy or information statements incorporated by reference in Part III of this Form 10-K or any amendment to this Form 10-K. x
Indicate by check mark whether the Registrantregistrant is a large accelerated filer, an accelerated filer, a non-accelerated filer, or a smaller reporting company, or an emerging growth company. See the definitions of “large accelerated filer,” “accelerated filer” andfiler,” “smaller reporting company”company,” and "emerging growth company" in Rule 12b-2 of the Exchange Act.
Large accelerated filer | ý | Accelerated filer | o | |
| Non-accelerated filer | ||||
Smaller reporting company | o | |||
| Emerging growth company | o | |||
If an emerging growth company, indicate by check mark if the registrant has elected not to use the extended transition period for complying with any new or revised financial accounting standards provided pursuant to Section 13(a) of the Exchange Act. ¨
Indicate by check mark whether the Registrantregistrant is a shell company (as defined in Rule 12b-2 of the Act). Yes ¨ No x
As of June 30, 2016,29, 2018, the aggregate market value of the Registrant’sregistrant’s common stock held by nonaffiliates of the Registrantregistrant was $951,274,715$1,769,386,515 based on the closing sales price of the Registrant’sregistrant’s common stock as reported on the New York Stock Exchange. Such amount was calculated by excluding all shares held by directors and executive officers and shares held in treasury, without conceding that any of the excluded parties are “affiliates” of the Registrantregistrant for purposes of the federal securities laws.
As of January 31, 2017,2019, the number of shares outstanding of the Registrant’sregistrant’s common stock, $.01 par value, was 94,583,972.94,511,178.
DOCUMENTS INCORPORATED BY REFERENCE
Part III incorporates certain information by reference from the Registrant’sregistrant’s Definitive Proxy Statement to be filed with the Securities and Exchange Commission ("SEC" or “Commission”) pursuant to Regulation 14A in connection with the Registrant’s 2017registrant’s 2019 Annual Meeting of Shareholders, which is scheduled to be held on May 2, 2017.7, 2019. Such Definitive Proxy Statement will be filed with the Commission not later than 120 days after the conclusion of the Registrant’sregistrant’s fiscal year ended December 31, 2016.2018.
Important Notice to Investors Regarding Forward-Looking Statements: This report contains "forward-looking statements" as defined under the Private Securities Litigation Reform Act of 1995. Forward-looking statements can be identified by words such as: "may," "should," "will," "could," "would," "anticipate," "plan," "believe," "project," "estimate," "expect," "strategy," "future," "likely," "on track," and similar references to future periods. Forward-looking statements include, among others, statements that relate to future plans, events, liquidity, financial results or performance including, but not limited to, statements relating to future stock repurchases, cash flows and liquidity, compliance with debt covenants, estimated unrecognized stock compensation expense, projected capital expenditures and depreciation and amortization expense, market conditions, future contractual obligations, the realization of deferred tax assets, including loss and credit carryforwards, future income tax expense, the future impact of new accounting standards, the integration of the OGIO International, IncJW Stargazer Holding GmbH ("OGIO"Jack Wolfskin") acquisition, and the related financial impact of the future business and prospects of Callaway Golfthe Company, TravisMathew, LLC ("TravisMathew"), OGIO International, Inc. ("OGIO") and OGIO, andJack Wolfskin, the expected continued financial impact of the Company's joint venture in Japan.Japan and the impact of the 2017 Tax Cuts and Jobs Act (the "Tax Act"), which includes a broad range of provisions that could have a material impact on the Company's tax provision in future periods. These statements are based upon current information and the Company's current beliefs, expectations and assumptions regarding the future of the Company's business, future plans and strategies, projections, anticipated events and trends, the economy and other future conditions. Because forward-looking statements relate to the future, they are subject to inherent uncertainties, risks and changes in circumstances that are difficult to predict and many of which are outside of the Company's control. As a result of these uncertainties and because the information on which these forward-looking statements is based may ultimately prove to be incorrect, actual results may differ materially from those anticipated. Important factors that could cause actual results to differ include, among others, the following:
certain risks and uncertainties, including changes in capital market or economic conditions;
consumer acceptance of and demand for the Company’s products;
future retailer purchasing activity, which can be significantly affected by adverse industry conditions and overall retail inventory levels;
any unfavorable changes in U.S. trade, tax or other policies, including restrictions on imports or an increase in import tariffs;
the level of promotional activity in the marketplace;
future consumer discretionary purchasing activity, which can be significantly adversely affected by unfavorable economic or market conditions;
significant fluctuations in foreign currency exchange rates;rates and the degree of effectiveness of the Company’s hedging programs;
the ability of the Company to manage international business risks;
adverse changes in the credit markets or continued compliance with the terms of the Company’s credit facilities;
delays, difficulties or increased costs in the supply of components needed to manufacture the Company’s products or in manufacturing the Company’s products, including the Company's dependence on a limited number of suppliers for some of its products;
adverse weather conditions and seasonality;
any rule changes or other actions taken by the USGA or other golf association that could have an adverse impact upon demand or supply of the Company’s products;
the ability of the Company to protect its intellectual property rights;
a decrease in participation levels in golf;
the effect of terrorist activity, armed conflict, natural disasters or pandemic diseases on the economy generally, on the level of demand for the Company’s products or on the Company’s ability to manage its supply and delivery logistics in such an environment; and
the general risks and uncertainties applicable to the Company and its business.
information or events or circumstances after the date hereof or to reflect the occurrence of unanticipated events. Investors should also be aware that while the Company from time to time does communicate with securities analysts, it is against the Company’s policy to disclose to them any material non-public information or other confidential commercial information. Furthermore, the Company has a policy against distributing or confirming financial forecasts or projections issued by analysts and
any reports issued by such analysts are not the responsibility of the Company. Investors should not assume that the Company agrees with any report issued by any analyst or with any statements, projections, forecasts or opinions contained in any such report.
For details concerning these and other risks and uncertainties, see Part I, Item IA, “Risk Factors” contained in this report, as well as the Company’s quarterly reports on Form 10-Q and current reports on Form 8-K subsequently filed with the Commission from time to time.
Callaway Golf Company Trademarks: The following marks and phrases, among others, are trademarks of Callaway Golf Company: Apex-Apex Tour-APW-Aqua Dry-Arm Lock-Backstryke-Big Bertha-BigApex, Apex Tour, APW, Aqua Dry, Arm Lock, Backstryke, Big Bertha, Alpha-Big T-Black Series-Callaway-Callaway Golf-Big Bertha Alpha, Big T, Black Series, Bounty Hunter, C, C Grind, Callaway, Callaway Capital, Callaway Golf, Callaway Media Productions-Callaway Supersoft-C Grind-Chev-Chev 18-Chevron Device-Chrome Soft-Comfort Tech-CXR-Cup 360-360Productions, Callaway Supersoft, Chev, Chev 18, Chevron Device, Chrome Soft, Cirrus, Comfort Tech, CUATER, Cuater C logo, Cup 360, CXR, 360 Face Cup-D.A.R.T.-Dawn Patrol-Divine-Eagle-Engage-Epic-ERC-Exo-Cage-FTiZ-FT Optiforce-FastCup, D.A.R.T., Dawn Patrol, Demonstrably Superior And Pleasingly Different, Divine, Double Wide, Eagle, Engage, Epic, Epic Flash, ERC, ERC Soft, Exo, Cage, Fast Tech Mantle-FT Performance-FT Tour-Fusion-Fusion RX-GBB-Gems-Gravity Core-Great Big Bertha-GreatMantle, Flash Face Technology, FT Optiforce, FT Performance, FT Tour, FTiZ, Fusion, Fusion Zero, GBB, GBB Epic, Gems, Gravity Core, Great Big Bertha, Epic-Heavenwood-Hex Aerodynamics-Hex Chrome-Hex Solaire-HX-Hyper Dry-Hyper Lite-HyperGreat Big Bertha Epic, Griptac, Grom, Groove, In, Groove Technology, Heavenwood, Hex Aerodynamics, Hex Chrome, Hex Solaire, High Energy Core, HX, Hyper Dry, Hyper, Lite, Hyper Speed Face-IMIX-InnovateFace, I, MIX, Innovate or Die, design-Ion X-Jailbird-Jailbreak-KingsIon-X, Jack Wolfskin, Jailbird, Jailbreak, Kings of Distance-Legacy-LongerDistance, Legacy, Longer From Everywhere-Mack Daddy-MarXman-MD3 Milled-MicrohingeEverywhere, Mack Daddy, Magna, Majestic, MarXman, MD3 Milled, MD4 Tactical, MD5, Metal-X, Microhinge Face Insert-MetalX-NumberInsert, New Graphene Dual Softfast Core, NipIt, Number One Putter in Golf-Odyssey-Odyssey Works-O Works-OptiFit-Opti Flex-Opti Grip-Opti Shield-Opti Therm-ORG 14-ORG 15-ProType-∙R∙-Rossie-R Moto-RSX-S2H2-Sabertooth-SoftFast-Solaire-Speed Regime-Speed Step-SR1-SR2-SR3-Steelhead-Steehlead XR-Strata-Strata Jet-Stronomic-Sub Zero-Superhot-Tank-Tank Cruiser-Teron-Tech Series-TiHot-Toe Up-Toulon-TourGolf, O OGIO, O Works, Odyssey, Odyssey Works, Ogio, OGIO ALPHA, OGIO ARORA, OGIO CLUB, OGIO FORGE, OGIO ME, OGIO MY EXPRESSION, OGIO RENEGADE, OGIO SAVAGE, OGIO SHADOW, Opti Flex, Opti Grip, Opti Shield, Opti Therm, OptiFit, Opti Vent, ORG 14, ORG 15, Paw Print, PRESTIGE 7, ProType, ∙R∙, R Ball, R-Moto, Renegade, Rig 9800, Rossie, RSX, S2H2, Sabertooth, Shredder, SLED, SoftFast, Solaire, Speed Regime, Speed Step, SR1, SR2, SR3, Steelhead XR, Steelhead, Strata, Strata Jet, Stroke Lab, Stronomic, Sub Zero, Superhot, T M, Tank, Tank Cruiser, Tech Series, Teron, Texapore, TI, HOT, TMCA, Toe Up, Toulon, Toulon Garage, Tour Authentic, -TradeTour Tested, Trade In! Trade Up!-Trionomer Cover-Tru Bore-udesign-Uptown-Versa-Warbird-Weather Series-Wedgeducation-W Grind-White Hot-White, TRAVISMATHEW, Trionomer Cover, Truvis, Truvis Pattern, Tyro, udesign, Uptown, Versa, VFT, W Grind, Warbird, Weather Series, Wedgeducation, White Hot, Tour-White Hot Pro-WhiteWhite Hot Pro, Havok-White Ice-World's Friendliest-X-12-X-14-X-16-X-18-X-20- X-22-X-24-X Act-X Hot-XWhite Hot Pro-X² Hot-XR 16-XR design-X Series-XSPANN-XtraPro Havok, White Hot Tour, White Ice, World's Friendliest, X-12, X-14, X-16, X-18, X-20, X-22, X-24, X-ACT, X Face VFT, X Hot, X Hot Pro, X² Hot, X Series, XR, XR 16, XSPANN, Xtra Traction Technology-XTT-XtraTechnology, Xtra Width Technology-2-Ball-3Technology, XTT, 2-Ball, 3 Deep.
CALLAWAY GOLF COMPANY
INDEX
PART I
Item 1. Business Overview
Callaway Golf Company (the “Company” or “Callaway Golf”) was incorporated in California in 1982 with the main purpose of designing, manufacturing and selling high quality golf clubs. The Company became a publicly traded corporation in 1992, and in 1999, reincorporated in the State of Delaware. The Company has evolved over time from a manufacturer of golf clubs to onea leading manufacturer and distributor of premium golf equipment and active lifestyle apparel, equipment and accessories. Over the past two and a half years, the Company grew its golf apparel and accessories business with the completion of the leading manufacturersgolf apparel joint venture in Japan in July 2016. In January and distributorsAugust of 2017, the Company completed the acquisitions of OGIO international, Inc. ("OGIO") and TravisMathew, LLC ("TravisMathew"), respectively, which expanded its soft goods business to include lifestyle product lines that are complimentary to golf. OGIO products offer premium storage gear for sport and personal use as well as performance outerwear. TravisMathew offers a full line of golf equipmentpremium lifestyle apparel, footwear and accessories. Both these acquisitions provided a platform for the Company to grow its lifestyle products business. In January 2019, the Company completed the acquisition of JW Stargazer Holding GmbH, the owner of the international, premium outdoor apparel, footwear and equipment brand, Jack Wolfskin ("Jack Wolfskin"). This acquisition is expected to further enhance and grow the Company's lifestyle category and provide a platform for future growth in the active outdoor and urban outdoor categories. With these recent acquisitions, the Company is transforming the way it views its business as it carries out its plans to invest strategically in areas complimentary to golf, with a focus on establishing synergies and realizing efficiencies for the benefit of all of the Company's brands.
Financial Information about Segments and Geographic Areas
Information regarding the Company’s segments and geographic areas in which the Company operates is contained in Note 18 in the Notes to the Company’s Consolidated Financial Statements for the years ended December 31, 2018, 2017 and 2016, and is included as part of Item 8—“Financial Statements and Supplementary Data.”
The Company has three operating and reportable segments, namely Golf Clubs, Golf Balls and Gear, Accessories and Other as of December 31, 2018. The Golf Clubs operating segment consists of Callaway Golf woods, hybrids, irons and wedges, Odyssey putters, including Toulon Design putters by Odyssey, packaged sets and sales of pre-owned golf clubs. At the product category level, sales of packaged sets are included within irons, and sales of pre-owned golf clubs are included in the respective woods, irons and putters product categories. The Golf Balls segment consists of Callaway Golf and Strata golf balls that are designed, manufactured and sold by the Company. The Gear, Accessories and Other operating segment consist of soft goods products, which include golf apparel and footwear, golf bags, golf gloves, travel gear, headwear and other golf-related accessories, OGIO and TravisMathew branded products, and royalties from licensing of the Company’s trademarks and service marks for various soft goods products. Due to the recent acquisition of Jack Wolfskin in January 2019, the Company is anticipating significant growth in its soft goods business, and as such, it will be evaluating its global business platform, including its management structure, operations, supply chain and distribution, which may result in changes in the composition of its operating and reportable segments.
Products
The Company designs, manufactures and sells a full line of high quality golf equipment, including golf clubs and golf balls, golf bags and other golf-related accessories.balls. The Company designs its golf products to be technologically advanced and in this regard invests a considerable amount in research and development each year. The Company’sCompany designs its golf products are designed for golfers of all skill levels, both amateur and professional, and are generally designed to conform to the Rules of Golf as published by the United States Golf Association ("USGA") and the ruling authority known as The R&A. The Company has two reportable operating segments that are organized on the basis of products, namely the golf clubs segment and golf balls segment. The golf clubs segment consists of Callaway Golf woods, hybrids, irons and wedges and Odyssey putters, including Toulon Design by Odyssey. This segment also includes other golf-related accessories, royalties from licensing of the Company’s trademarks and service marks and sales of pre-owned golf clubs. The golf balls segment consists of Callaway Golf and Strata balls that are designed, manufactured and sold by the Company.
1
The following table sets forth the contribution to net sales attributable to the Company's principal product groups for the periods indicated:
| Years Ended December 31, | Years Ended December 31, | |||||||||||||||||||||||||||||||||||||||
| 2016 | 2015 | 2014 | 2018 | 2017 | 2016 | |||||||||||||||||||||||||||||||||||
| (Dollars in millions) | (Dollars in millions) | |||||||||||||||||||||||||||||||||||||||
| Woods | $ | 201.8 | 24 | % | $ | 222.2 | 27 | % | $ | 269.5 | 31 | % | $ | 304.4 | 24.5 | % | $ | 307.9 | 29.4 | % | $ | 216.1 | 24.7 | % | ||||||||||||||||
| Irons | 211.9 | 24 | % | 205.5 | 24 | % | 200.2 | 23 | % | 316.5 | 25.5 | % | 250.6 | 23.9 | % | 278.6 | 32.0 | % | ||||||||||||||||||||||
| Putters | 86.0 | 10 | % | 86.3 | 10 | % | 81.1 | 9 | % | 96.4 | 7.8 | % | 84.6 | 8.0 | % | 87.7 | 10.1 | % | ||||||||||||||||||||||
| Golf balls | 152.3 | 17 | % | 143.1 | 17 | % | 137.0 | 15 | % | 195.6 | 15.7 | % | 162.5 | 15.5 | % | 152.3 | 17.5 | % | ||||||||||||||||||||||
| Accessories and other | 219.2 | 25 | % | 186.7 | 22 | % | 199.1 | 22 | % | |||||||||||||||||||||||||||||||
| Gear, accessories and other | 329.9 | 26.5 | % | 243.1 | 23.2 | % | 136.5 | 15.7 | % | |||||||||||||||||||||||||||||||
| Net sales | $ | 871.2 | 100 | % | $ | 843.8 | 100 | % | $ | 886.9 | 100 | % | $ | 1,242.8 | 100.0 | % | $ | 1,048.7 | 100.0 | % | $ | 871.2 | 100.0 | % | ||||||||||||||||
For a detailed discussion regarding the changes in net sales for each product group from 20162018 to 20152017 and from 20152017 to 2014,2016, see below, “Management’s Discussion and Analysis of Financial Condition and Results of Operations—Results of Operations” contained in Item 7.
The Company’s current principal products by product group are described below:
Woods. This product category includes sales of the Company’s drivers, fairway woods and hybrid products, which are sold under the Callaway Golf brand.brand, in addition to sales of pre-owned wood products. These products are generally made of metal (either titanium or steel) or a combination of metal and a composite material. The Company’s products compete at various price levels in the woods category. The Company’s drivers, fairway woods and hybrid products are available in a variety of lofts, shafts and other specifications to accommodate the preferences and skill levels of all golfers.
Irons. This product category includes sales of the Company’s irons, wedges and wedges,packaged sets, which are sold under the Callaway Golf brand.brand, in addition to sales of pre-owned irons products. The Company’s irons are generally made of metal (either titanium, steel or special alloy) or a composite material (a combination of metal and polymer materials). The Company’s products compete at various price levels in the irons category. The Company’s irons are available in a variety of designs, shafts and other specifications to accommodate the preferences and skill levels of all golfers.
Putters. This product category includes sales of the Company’s putters, which are sold under the Odyssey brand, including Toulon Design by Odyssey.Odyssey, as well as sales of pre-owned putter products. The Company’s products compete at multiple price levels in the putters category. The Company’s putters are available in a variety of styles, shafts and other specifications to accommodate the preferences and skill levels of all golfers.
Golf Balls. This product category includes sales of the Company’s golf balls, which are sold under the Callaway Golf and Strata brands. The Company’s golf balls are generally either a 2-piece golf ball (consisting of a core and cover) or a multilayer golf ball (consisting of two or more components in addition to the cover). The Company’s golf ball products include covers that incorporate a traditional dimple pattern as well as covers that incorporate innovative designs, including the Company’s proprietary HEX Aerodynamics (i.e., a lattice of tubes that form hexagons and pentagons)., Hybrid Cover and Triple Track Technology, which promotes ball speed and higher spin, and Truvis balls, which have colored symmetrical patterns on the cover that improve vision of movement and depth perception. The Company’s products compete at multiple price levels in the golf ball category.
Gear, Accessories and Other. This product category includes sales of packaged sets,golf apparel and footwear, golf bags, golf gloves, golf footwear, golf apparel, travel gear, headwear towels, umbrellas, eyewear and other golf-related accessories, including sales of pre-owned products through the Company's website, www.callawaygolfpreowned.com. Additionally, this product category includesOGIO branded storage gear, outerwear and accessories, TravisMathew branded apparel, footwear and accessories, and royalties from licensing of the Company’s trademarks and service marks onfor various soft goods products including golf apparel and footwear, golf gloves, prescription eyewear and practice aids.
Product Design and Development
Product design at the Company is a result of the integrated efforts of its brand management, research and development, manufacturing and sales departments, all of which work together to generate new ideas for golf equipment. The Company designs its products to be technologically advanced and has not limited itself in its research efforts by trying to duplicate designs that are traditional or conventional. The Company believes it has created a work environment in which new ideas are valued and explored. In 2016, 20152018, 2017 and 2014,2016, the Company invested $33.3$40.8 million, $33.2$36.6 million and $31.3$33.3 million, respectively, in research and
2
development. The Company intends to continue to invest substantial amounts in its research and development activities in connection with its development of new products.
The Company has the ability to create and modify product designs by using computer aided design (“CAD”) software, computer aided manufacturing (“CAM”finite element analysis (”FEA”) software and computer numerical control milling equipment. CAD software enables designers to develop computer models of new product designs. CAM software is then used by engineers to translate the digital output from CAD computer models so that physical prototypes can be produced.structural optimization techniques employing Artificial Intelligence methods. Further, the Company utilizes a variety of testing equipment and computer software, including golf robots, launch monitors, a proprietary virtual test center, a proprietary performance analysis system, an indoor test range and other methods to develop and test its products. Through the use of these technologies, the Company has been able to accelerateinnovate and make more efficientenhance product performance at the same time accelerating the design, development and testing of new golf clubs and golf balls.
The Company's soft goods under the Callaway, OGIO and TravisMathew brands are designed and developed internally. Design specifications are sent to contract manufacturers who source the raw materials and build the products according to the specifications.
For certain risks associated with product design and development, see below, “Risk Factors” contained in Item 1A.
Manufacturing and Distribution
The Company has its primary golf club assembly facility in Monterrey, Mexico, and maintains limited golf club assembly in its facilities in Carlsbad, California.California and Roanoke, Texas. The Company's golf clubs are also assembled in Tokyo, Japan, Swindon, England, Melbourne, Australia and other local markets based on regional demand for custom clubs. In addition, the Company utilizes golf club contract manufacturers in China.
China and Vietnam.
In 2016, 20152018, 2017 and 2014,2016, most of the Company’s golf club assembly volume was made in regions outside of the United States. Overall, the golf club assembly process is fairly labor intensive, and requires extensive global supply chain coordination and utilizes raw materials that are obtained from suppliers both internationally and within the United States.
The Company has a golf ball manufacturing facility in Chicopee, Massachusetts, and also utilizes golf ball contract manufacturers in Taiwan and China. In 2016, 2015each of 2018, 2017 and 2014,2016, approximately 60% of the golf ball productionunit volume was manufactured in regions outside of the United States. The overall golf ball manufacturing process utilizes raw materials that are obtained from suppliers both internationally and within the United States.
The Company utilizes third-party contract manufacturers for its Callaway, OGIO and TravisMathew soft goods products located in Vietnam, Indonesia, China, Thailand, and Peru.
The Company has its primary distribution center in Roanoke, Texas for the distribution of goods in North America, in addition to distribution centers in Huntington Beach, California, Toronto, Canada, Swindon, England and Melbourne, Australia, and third-party logistical operations in Evansville, Indiana, Tokyo, Japan, Shanghai, China, and Seoul, Korea to support the distribution needs of markets they serve.
Starting in January 2019, in connection with the completion of the Jack Wolfskin acquisition, the Company has a distribution center in Hamburg, Germany.
Raw Materials
The Company periodically contracts purchases of raw materials from domestic and international suppliers in order to meet scheduled production needs. Raw materials include steel, titanium alloys, and carbon fiber and various thermoplastic and thermoset materials for the manufacturing of golf clubs, and synthetic rubber, thermoplastics, zinc stearate, zinc oxide and lime stone for the manufacturing of golf balls. For certain risks associated with golf club and golf ball manufacturing, see “Risk Factors” contained in Item 1A.
Sales and Marketing
The Company generally sells its products to retailers, directly and through its wholly-owned subsidiaries, and to third-party distributors. The Company sells pre-owned golf products through its website www.callawaygolfpreowned.com. In addition, the Company sells Callaway Golf and Odyssey products, including Toulon Design by Odyssey, as well as OGIO and TravisMathew branded soft goods products directly to consumers through its websites www.callawaygolf.com, www.odysseygolf.com, www.ogio.com and www.travismathew.com. The Company also licenses its trademarks and service marks in exchange for a royalty fee to third parties for use on golf related accessories, including Callaway Golf golf apparel, footwear, golf gloves, prescription eyewear and practice aids as well as OGIO branded bags. In addition, the Company has TravisMathew retail locations in the United
3
States and retail, outlet and store-in-store locations in Japan in connection with the apparel joint venture which sells Callaway branded apparel, gear and accessories directly to consumers. The Company’s products are sold in the United States and in over 100 countries around the world. In January 2019, the Company acquired Jack Wolfskin, which sells Jack Wolfskin-branded apparel, gear and accessories through its retail locations throughout Europe and China, and through its website www.jack-wolfskin.com.
Sales in the United States
Of the Company’s total net sales, approximately 51%57%, 53%54% and 48%51% was derived from sales to customers within the United States in 2016, 20152018, 2017 and 2014,2016, respectively. The Company primarily sells its golf equipment and active lifestyle apparel, equipment and accessories under the Callaway, OGIO and TravisMathew brands to both on- and off-course golf retailers and sporting goods retailers who sell quality golf and lifestyle products and who can also provide a level of customer service appropriate for the sale of such products. The Companygolf equipment. TravisMathew branded apparel and accessories are also sellssold at certain department stores and at its products through Internet retailers, as well as certain products to mass merchants.retail locations. Sales of the Company’s products in the United States are made and supported by full-time regional field representatives and in-house sales and customer service representatives. Most regions in the United States are covered by both a field representative and a dedicated in-house sales representative who work together to initiate and maintain relationships with customers through frequent telephone calls and in-person visits. The Company also sells its products through Internet retailers, and certain products to mass merchants.
In addition, other dedicated sales representatives provide servicethe Company sells to corporate customers who want their corporate logo imprinted on certain of the Company’s golf balls, putters orequipment, as well as on golf bags. The Company imprints the logos on the majority of these corporate products, thereby retaining control over the quality of the process and final product. The Company also pays a commission to certain on- and off-course professionals and retailers with whom it has a relationship for corporate sales that originate through such professionals and retailers.
The Company also has a separate team of club fitting specialists who focus on the Company’s custom club sales. A portion of the Company’s custom club sales are generated from the utilization of club fitting programs, such as performance centers, which utilize high-speed cameras and precision software to capture relevant swing data. All performance centers and participating on- and off-course retail stores are equipped with custom fitting systems that incorporate the use of an extensive variety of clubhead and shaft combinations in order to find a set of golf clubs that fits a golfer’s personal specifications. The Company believes that offering golfers the opportunity to increase performance with custom club specifications increases sales and promotes brand loyalty.
The Company maintains various sales programs, including a Preferred Retailer Program. The Preferred Retailer Program offers longer payment terms during the initial sell-in period, as well as potential rebates and discounts for participating retailers in exchange for providing certain benefits to the Company, including the maintenance of agreed upon inventory levels, prime product placement and retailer staff training.
Sales Outside of the United States
Of the Company’s total net sales, approximately 49%43%, 47%46% and 52%49% were derived from sales for distribution outside of the United States in 2016, 20152018, 2017 and 2014,2016, respectively. The Company does business (either directly or through its subsidiaries and distributors) in over 100 countries around the world. The Company sells its full line of Callaway Golf and Odyssey golf equipment as well as OGIO branded products internationally. In addition, the Company sells Callaway Golf apparel, accessories and certain golf products at its retail locations in Japan through the apparel joint venture.
The majority of the Company’s international sales are made through its wholly-owned subsidiaries located in Japan, Europe, Korea, Canada, Australia, China and India. In addition to sales through its subsidiaries, the Company also sells through its network of distributors in over 7060 foreign countries, including Singapore, Indonesia, the Philippines, South Africa, and in numerous countries
in Central and South America. Prices of golf clubs and balls for sales by distributors outside of the United States generally reflect an export pricing discount to compensate international distributors for selling and distribution costs. A change in the Company’s relationship with significant distributors could negatively impact the volume of the Company’s international sales.
The Company’s sales programs in foreign countries are specifically designed based upon local laws and competitive conditions. Some of the sales programs utilized include the custom club fitting experiences and the Preferred Retailer Program or variations of those programs employed in the United States as described above.
Conducting business outside of the United States subjects the Company to increased risks inherent in international business. These risks include but are not limited to foreign currency risks, increased difficulty in protecting the Company’s intellectual property rights and trade secrets, unexpected government action or changes in legal or regulatory requirements, including any incremental restrictions on imports or increased import tariffs, and social, economic or political instability. For a completefurther discussion of the risks associated with conducting business outside of the United States, see “Risk Factors” contained in Item 1A.
4
Sales of Pre-Owned Clubs and Online Store
The Company sells certified pre-owned golf products in addition to golf-related accessories through its website www.callawaygolfpreowned.com. The Company generally acquires the pre-owned products through the Company’s Trade In! Trade Up! program, which gives golfers the opportunity to trade in their used Callaway Golf clubs and certain competitor golf clubs at authorized Callaway Golf retailers or through the Callaway Golf Pre-Owned website for credit toward the purchase of new or pre-owned Callaway Golf equipment.
Direct to Consumer Sales
The Company also offers the full line of Callaway Golf and Odyssey golf equipment products, including drivers, fairway woods, hybrids, irons, putters and golf balls, andin addition to golf-related accessories, through its websites www.callawaygolf.com and www.odysseygolf.com. The Company also sells Callaway-branded apparel, gear and accessories at retail, outlet and store-in-store locations in Japan through its apparel joint venture. In January 2017,addition, the Company completedsells the acquisition of OGIO, which will offer a full line of high qualityOGIO-branded bags accessories and apparel in the golf and other lifestyle categoriesaccessories through its website www.ogio.com.at www.ogio.com, and TravisMathew-branded apparel and accessories at its retail locations throughout the United States and through its website at www.travismathew.com. In 2019, the Company's consumer-direct sales will also include Jack Wolfskin-branded apparel, gear and accessories sold through its retail locations throughout Europe and China, and through its website at www.jack-wolfskin.com.
Advertising and Promotion
The Company develops and executes its advertising and promotional campaigns for its products based on the Company’s global brand principles. Within the United States, the Company has focused its advertising efforts mainly on television commercials, primarily on The Golf Channel and on network television during golf telecasts, web-based advertising, and printed advertisements in national magazines, such as Golf Magazine, Sports Illustrated and Golf Digest, as well as in-store advertising. The Company also engages in non-traditional marketing activities through strategic investments in third parties including Topgolf International, Inc. doing business as the Topgolf Entertainment Group ("Topgolf").
Advertising of the Company’s products outside of the United States is generally handled by the Company’s subsidiaries, and while it is based on the Company’s global brand principles, the local execution is tailored to each region based on its unique consumer market and lifestyles.
In addition, the Company establishes relationships with professional golfers in order to promote the Company’s products. The Company has entered into endorsement arrangements with members of the various professional golf tours to promote the Company’s golf club and golf ball products as well as golf bags and various golf accessories. For certain risks associated with such endorsements, see “Risk Factors” contained in Item 1A.
Competition
The golf club markets in which the Company competes are highly competitive and are served by a number of well-established and well-financed companies with recognized brand names. With respect to drivers, fairway woods and irons, the Company’s major competitors are TaylorMade, Ping, Acushnet (Titleist brand), Puma (Cobra brand), SRI Sports Limited (Cleveland and Srixon brands), Mizuno, Bridgestone, and Bridgestone.Parsons Xtreme Golf (PXG). For putters, the Company’s major competitors are Acushnet (Titleist brand), Ping and TaylorMade. The Company believes that it is a technological leader in every golf club market in which it competes.
The golf ball business is also highly competitive. There are a number of well-established and well-financed competitors, including Acushnet (Titleist and Pinnacle brands), SRI Sports Limited (Dunlop and Srixon brands), Bridgestone (Bridgestone and Precept brands), TaylorMade and others. These competitors compete for market share in the golf ball business, with Acushnet having a market share of over 50% of the golf ball business in the United States and a leading position in certain other regions outside the United States. The Company believes that it is a technological leader in the golf ball category.
For both golf clubs and golf balls, the Company generally competes on the basis of technology, quality, performance, customer service and price. In order to gauge the effectiveness of the Company’s response to such factors, management receives and evaluates Company-generated market trends for U.S. and foreign markets, as well as periodic public and customized market research for the U.S. and U.K. markets from Golf Datatech that include trends from certain on- and off-course retailers. In addition, the Company utilizes GfK Group for the markets in Japan.
5
In addition, the Company's competitors in the soft goods market, including apparel, gear and golf accessories, are generally other golf companies and premium golf apparel companies, as well as specialty retailers.
For certain risks associated with competition, see “Risk Factors” contained in Item 1A.
Seasonality of Company's Business
Golf Club and Golf Balls
In most of the regions where the Company doesconducts business, the game of golf is played primarily on a seasonal basis. Weather conditions in most parts of the world generally restrict golf from being played year-round, except in a few markets, with many of the Company’s on-course customers closing duringfor the cold weather months. The Company’s business isgolf club and golf ball businesses are therefore subject to seasonal fluctuations. In general, during the first quarter, the Company begins selling its golf club and golf ball products into the golf retail channel for the new golf season. This initial sell-in generally continues into the second quarter. The Company’s second-quarterSecond-quarter sales are significantly affected by the amount of reorder business of the products sold during the first quarter. The Company’s third-quarterThird-quarter sales are generally dependent on reorder business but are generally lesscan also include smaller new product launches, typically resulting in lower sales than the second quarter as many retailers begin decreasing their inventory levels in anticipation of the end of the golf season. The Company’s fourth-quarterFourth-quarter sales are generally less than the other quarters due to the end of the golf season in many of the Company’s key markets.regions. However, third-quarter sales can be affected by a mid-year product launch, of product, and fourth-quarter sales can be affected from time to time by the early launch of product introductions related to the new golf season of the subsequent year. This seasonality, and therefore quarter-to-quarter fluctuations, can be affected by many factors, including the timing of new product introductions as well as weather conditions. In general, however, because of this seasonality, a majority of the Company’s sales from its Golf Clubs and Golf Balls operating segments and most, if not all, of its profitability from these segments generally occurs during the first half of the year.
Gear, Accessories and Other
Sales of the Company's golf gear and accessories generally follow the same seasonality as golf clubs and golf balls, and are therefore generally higher during the first half of the year when the game of golf is mostly played. Sales of lifestyle gear and apparel are generally higher in the second and third quarters during the spring/summer season. Golf apparel sales are higher in the third and fourth quarters due to a strong fall/winter season in Japan. With the recent acquisition of Jack Wolfskin in January 2019, the Company anticipates increased sales of lifestyle apparel in the third and fourth quarters related to the fall/winter season.
Environmental and Social Responsibility
By being active and visible in the community and by embracing the principles of environmental stewardship, the Company believes it is acting in an environmentally and socially responsible manner.
Environmental Matters
The Company’s operations are subject to federal, state and local environmental laws and regulations that impose limitations on the discharge of pollutants into the environment and establish standards for the handling, generation, emission, release, discharge, treatment, storage and disposal of certain materials, substances and wastes and the remediation of environmental contaminants (collectively, “Environmental Laws”). In the ordinary course of its manufacturing processes, the Company uses paints, chemical solvents and other materials, and generates waste by-products that are subject to these Environmental Laws. In addition, in connection with the Company's Top-Flite asset acquisition in 2003, the Company assumed certain monitoring and remediation obligations at its manufacturing facility in Chicopee, Massachusetts. In February 2013, the Company sold this facility and leased back a reduced portion of the square footage that it believes is adequate for its ongoing golf ball manufacturing operations. As part of the terms of this sale, the Company assumed certain ongoing environmental remediation obligations.
The Company endeavors to adhere to all applicable Environmental Laws and takes action as necessary to comply with these laws. The Company maintains an environmental and safety program and employs full-time environmental, health and safety professionals at its facilities located in Carlsbad, California, Chicopee, Massachusetts and Monterrey, Mexico. The environmental and safety program includes obtaining environmental permits as required, capturing and appropriately disposing of any waste by-products, tracking hazardous waste generation and disposal, air emissions, safety situations, material safety data sheet management, storm water management and recycling, and auditing and reporting on its compliance. The Company also conducts third party Social, Safety and Environmental Responsibility Audits of its global supply chain. The audits ensure compliance with applicable Environmental Laws and that responsible manufacturing practices are maintained within the global supply chain.
6
Historically, the costs of environmental compliance have not had a material adverse effect on the Company’s business. The Company believes that its operations are in substantial compliance with all applicable Environmental Laws.
Sustainability
The Company believes it is important to conduct its business in an environmentally, economically and socially sustainable manner. In this regard, the Company has an environmental sustainability program which focuses on the reductions of volatile organic compound (VOC) emissions, reductions of hazardous waste, reductions in water usage, improved recycling and development programs which involve the elimination or reduction of undesirable chemicals and solvents in favor of safer and environmentally preferred alternatives. These efforts cross divisional lines and are visible in the following areas within the Company:
Facilities through the partnership with local utilities to implement energy reduction initiatives such as energy efficient lighting, demand response energy management and heating, ventilation and air conditioning optimization;
Manufacturing through lean initiatives and waste minimization;
Product development through specification of environmentally preferred substances;
Logistics improvements and packaging minimization; and
Supply chain management through Social, Safety and Environmental Responsibility audits of suppliers.
Callaway participates in the UPS Smartway program, which promotes cost effective and environmentally efficient freight transportation.
Community Giving
The Company also has two existing programs focusing on the community: the Callaway Golf Company Foundation and the Callaway Golf Company Employee Community Giving Program. Through these programs the Company and its employees are able to give back to the community through monetary donations and by providing community services. Information on both of these programs is available on the Company’s website www.callawaygolf.com. By being active and visible in the community and by embracing the principles of environmental stewardship, the Company believes it is acting in an environmentally and socially responsible manner.
Intellectual Property
The Company is the owner of approximately 3,0003,500 U.S. and foreign trademark registrations and over 1,3001,600 U.S. and foreign patents relating to the Company’s products, product designs, manufacturing processes and research and development concepts. Other patent and trademark applications are pending and await registration. In addition, the Company owns various other protectable rights under copyright, trade dress and other statutory and common laws. The Company’s intellectual property rights are very important to the Company, and the Company seeks to protect such rights through the registration of trademarks and utility and design patents, the maintenance of trade secrets and the creation of trade dress. When necessary and appropriate, the Company enforces its rights through litigation. Information regarding current litigation matters in connection with intellectual property is contained in Note 1012 “Commitments & Contingencies—Legal Matters” in the Notes to Consolidated Financial Statements in this Form 10-K.
The Company’s patents are generally in effect for up to 20 years from the date of the filing of the patent application. The Company’s trademarks are generally valid as long as they are in use and their registrations are properly maintained and have not been found to become generic. For certain risks associated with intellectual property, see “Risk Factors” contained in Item 1A.
Licensing
The Company, in exchange for a royalty fee, licenses its trademarks and service marks to third parties for use on products such as golf apparel and footwear, golf gloves, prescription eyewear and practice aids. With respect to its line of golf apparel, the Company has current licensing arrangements with Perry Ellis International for a complete line of men’s and women’s apparel for distribution in certain retail channels in the United States, Canada, Latin America, Europe, Middle East and Africa. With respect to OGIO-branded bags, the Company has a licensing arrangement with SanMar Corporation for OGIO products and SanMar-designed, OGIO-branded products for distribution in the corporate channel in the United States, Canada and Mexico. In addition, the Company licenses its trademark to its joint venture in Japan for a full line of Callaway Golf apparel, footwear and other select items. With respect to the footwear lines, the Company has a licensing arrangement with Klone Lab, LLC for a complete line of men’s and women’s golf footwear for distribution in certain retail channels in the United States and Canada.
In addition, the Company has also licensed its trademarks to, among others, (i) IZZO Golf for practice aids (ii) SM Global, LLC for golf gloves sold exclusively to Costco Wholesale Corp. and (iii)sunglasses and (ii) Walman Optical for a line of prescription Callaway eyewear.
7
Employees
As of December 31, 20162018 and 2015,2017, the Company and its subsidiaries had approximately 1,7002,400 and 2,100 full-time and part-time employees.employees, respectively. The increase in the Company's headcount was primarily due to business growth in 2018. The Company employs temporary manufacturing workers as needed based on labor demands that fluctuate with the Company's seasonality.
The Company’s golf ball manufacturing employees in Chicopee, Massachusetts are unionized and are covered under a collective bargaining agreement, which expires on September 30, 2017.2022. In addition, certain of the Company’s production employees in Australia and Mexico are also unionized. The Company considers its employee relations to be good.
Executive Officers of the Registrant
Biographical information concerning the Company’s executive officers is set forth below.
| Name | Age | Position(s) Held | |
| Oliver G. Brewer III | 55 | President and Chief Executive Officer, Director | |
| Mark F. Leposky | |||
| Richard H. Arnett | |||
| 57 | |||
Oliver G. Brewer III is a Director and President and Chief Executive Officer of the Company and has served in such capacity since March 2012. Since 2012 Mr. Brewer has served as a Director of Topgolf International, Inc. in which Callaway Golf has a minority ownership interest. Additionally, Mr. Brewer serves on the National Golf Foundation's Board. Before joining Callaway Golf, Mr. Brewer served as the President and Chief Executive Officer of Adams Golf, Inc. beginning in January 2002. He was President and Chief Operating Officer of Adams Golf from August 2000 to January 2002 and Senior Vice President of Sales and Marketing of Adams Golf from September 1998 to August 2000. Mr. Brewer also served on the Board of Directors of Adams Golf from 2000 until his resignation effective February 2012. Mr. Brewer has an M.B.A. from Harvard University and a B.S. in Economics from the College of William and Mary.
Glenn Hickey is Executive Vice President, Callaway Golf and has served in such capacity since January 2019. Mr. Hickey leads the Company’s golf business for the three primary global regions, namely the Americas, Europe, Middle East and Asia. Mr. Hickey joined Callaway Golf in 1991 and was a top-producing Inside Sales Representative for seven years prior to being promoted to Inside Sales - National Account Manager in March 1997, Regional Sales Manager - East U.S. in November 2002, Director of Special Markets in June 2006, Vice President, Special Markets and Mass Merchants in August 2008, and Senior Vice President, Americas Sales in July 2012. Prior to joining Callaway Golf, Mr. Hickey was a bond trader for four years in the Los Angeles and New York offices of First Interstate Bank through its transition to Wedbush Securities. He completed a Financial Analysis for Non-Financial Managers certification from the University of Chicago, Graduate School of Business. He currently serves as a board member for the San Diego Junior Golf Association. Mr. Hickey received a B.S. in Business Administration from San Diego State University.
Mark F. Leposky is SeniorExecutive Vice President of Global Operations and has served in suchthis capacity since January 2019. He served as Senior Vice President, Global Operations since April 2012. Mr. Leposky is responsible for all areas of the Company’s global manufacturing, program management, sourcing, logistics operations and strategy, and golf accessories. Prior to joining Callaway, Mr. Leposky served from 2005-2011 as co-founder, President and Chief Executive Officer of Gathering Storm Holding
8
Company, LLC/ TMAX Gear LLC (collectively, “TMAX”), which, as exclusive licensee, designed, developed, manufactured, and distributed accessory products for TaylorMade-Adidas Golf. When the license agreement was terminated in 2011, TMAX exited the business and TMAX entered into a general assignment for the benefit of
creditors. Prior to that, Mr. Leposky served in various operations roles for Fisher Scientific International, TaylorMade-Adidas Golf, the Coca-Cola Company and the United Parcel Service Company. Mr. Leposky began his career serving as a U.S. Army and Army National Guard Infantry Officer (Rank Major). Mr. Leposky received an M.B.A. from the Keller Graduate School of Management and a B.S. in Industrial Technology from Southern Illinois University.
Richard H. Arnett is the Executive Vice President of Global Marketing and Callaway Brands and has served in such capacity since January 2019 with responsibility for global Marketing, OGIO, Callaway Golf Interactive, TravisMathew and Jack Wolfskin’s North America operations. Prior to 2019 Mr. Arnett served as Senior Vice President of Global Marketing and he has servedPresident of OGIO which was acquired in such capacity sinceJanuary 2017. Since June 2012. In this role,2012, Mr. Arnett leadshas led the Company'sCompany’s global marketing, communications and go-to-market functions, while also overseeing its category management function. Prior to joining Callaway, Mr. Arnett served as Vice President of Global Marketing, TaylorMade, adidasAdidas and Ashworth Golf, and prior to TaylorMade he served in a marketing leadership role at Russell Corporation. Mr. Arnett received an M.B.A. from Duke University and a B.A. in English from Emory University. In addition, Mr. Arnett assumed the position of President, OGIO International, Inc, which was acquired by the Company
Melody Harris-Jensbach is Chief Executive Officer, Jack Wolfskin. Ms. Harris-Jensbach joined Jack Wolfskin as Chief Executive Officer in January 2017.
Information with respect to the Company’s employment agreements with its Chief Executive Officer, Chief Financial Officer and other three most highly compensated executive officers will be contained in the Company’s definitive Proxy Statement in connection with the 20172019 Annual Meeting of Shareholders. In addition, copies of the employment agreements for all the executive officers are included as exhibits to this report.
Access to SEC Filings through Company Website
Interested readers can access the Company’s annual reports on Form 10-K, quarterly reports on Form 10-Q, current reports on Form 8-K, and any amendments to those reports filed or furnished pursuant to Section 13(a) or 15(d) of the Securities Exchange Act of 1934 (the “Exchange Act”) through the Investor Relations section of the Company’s website at www.callawaygolf.com. These reports can be accessed free of charge from the Company’s website as soon as reasonably practicable after the Company electronically files such materials with, or furnishes them to the Commission. In addition, the Company’s Corporate Governance Guidelines, Code of Conduct and the written charters of the committees of the Board of Directors are available in the Corporate Governance portion of the Investor Relations section of the Company’s website and are available in print to any shareholder who requests a copy. The information contained on the Company’s website shall not be deemed to be incorporated into this report.
Item 1A. Risk Factors
Certain Factors Affecting Callaway Golf Company
The Company’s business, operations and financial condition are subject to various risks and uncertainties. The Company urges you to carefully consider the risks and uncertainties described below, together with all of the other information in this Annual Report on Form 10-K, including those risks set forth under the heading entitled “Important Notice to Investors Regarding Forward-Looking Statements,” and in other documents that the Company files with the Commission, before making any investment decision with respect to the Company’s securities. If any of the risks or uncertainties actually occur or develop, the Company’s business, financial condition, results of operations and future growth prospects could be adversely affected. Under these circumstances, the trading prices of the Company’s securities could decline, and you could lose all or part of your investment in the Company’s securities.
9
A reduction in the number of rounds of golf played or in the number of golf participants could adversely affect the Company’s sales.
The Company generates substantially alla large majority of its revenues from the sale of golf-related products, including golf clubs, golf balls and golf accessories. The demand for golf-related products in general, and golf balls in particular, is directly related to the number of golf participants and the number of rounds of golf being played by these participants. If golf participation continues to decrease or the number of rounds of golf played decreases, sales of the Company’s products may be adversely affected. In the future, the overall dollar volume of the market for golf-related products may not grow or may decline.
In addition, the demand for golf products is also directly related to the popularity of magazines, cable channels and other media dedicated to golf, television coverage of golf tournaments and attendance at golf events. The Company depends on the exposure of its products through advertising and the media or at golf tournaments and events. Any significant reduction in television coverage of, or attendance at, golf tournaments and events or any significant reduction in the popularity of golf magazines or golf television channels, could reduce the visibility of the Company’s brand and could adversely affect the Company’s sales.
The Company may have limited opportunities for future growth in sales of golf clubs and golf balls.
In order for the Company to significantly grow its sales of golf clubs or golf balls, the Company must either increase its share of the market for golf clubs or golf balls, develop markets in geographic regions historically underrepresented by the Company’s products, or the overall market for golf clubs or golf balls must grow. The Company already has a significant share of worldwide sales of golf clubs and golf balls and the golf industry is very competitive. As such, gaining incremental market share quickly or at all is difficult. Therefore, opportunities for additional market share may be limited given the challenging competitive nature of the golf industry, and the overall dollar volume of worldwide sales of golf clubs or golf balls may not grow or may decline.
The Company plans its manufacturing capacity based uponCompany’s golf-related products are recreational in nature and are therefore discretionary purchases for consumers. Consumers are generally more willing to make discretionary purchases of golf products during favorable economic conditions and when consumers are feeling confident and prosperous. Discretionary spending is also affected by many other factors, including general business conditions, interest rates, the forecasted demand for its products. Forecasting the demand for the Company's products is very difficult given the manufacturing lead timeavailability of consumer credit, taxes and the amount of specification involved. For example, the Company must forecast wellconsumer confidence in advance not only how many drivers it will sell, but also (1) the quantity of each driver model, (2) the quantity of the different lofts in each driver model, and (3) for each driver model and loft, the number of left handed and right handed versions. The nature of the Company’s business makes it difficult to adjust quickly its manufacturing capacity if actual demand for its products exceeds or is less than forecasted demand. If actual demand for its products exceeds the forecasted demand, the Company may not be able to produce sufficient quantities of new products in time to fulfill actual demand, which could limit the Company’s sales and adversely affect its financial performance. On the other hand, if actual demand is less than the forecasted demand for its products, the Company could produce excess quantities, resulting in excess inventories and related obsolescence charges that could adversely affect the Company’s financial performance.
conditions. A significant disruptionor prolonged decline in the operations of the Company’s golf club assembly and golf ball manufacturing and assembly facilities could have a material adverse effect on the Company’s sales, profitability and results of operations.
The Company primarily sells its products to retailers directly and through wholly-owned domestic and foreign subsidiaries, and to foreign distributors. The Company performs ongoing credit evaluations of materials usedits customers’ financial condition and generally requires no collateral from these customers. However, a severe or prolonged downturn in the Company’s products. There may only be a limited numbergeneral economy could adversely affect the retail market which in turn, would negatively impact the liquidity and cash flows of suppliers offering “conflict free” conflict minerals, and the Company cannot be certain that it will be ableCompany's customers, including the ability of such customers to obtain necessary “conflict free” conflict minerals from such suppliers in sufficient quantities or at competitive prices. Because the Company’s supply chain is complex, the Company may also not be ablecredit to sufficiently verify the originsfinance purchases of the relevant minerals usedCompany's products and to pay their trade obligations. This could result in the Company’s products through the due diligence procedures that the Company implements, which may harm the Company’s reputation.
The Company faces intense competition in each of its markets and if it is unable to maintain a competitive advantage, loss of market share, revenue, or profitability may result.
Golf Clubs. The golf club business is highly competitive, and is served by a number of well-established and well-financed companies with recognized brand names. New product introductions, price reductions, consignment sales, extended payment terms, “closeouts,” including closeouts of products that were recently commercially successful, and significant tour and advertising spending by competitors continue to generate intense market competition. Furthermore, continued downward pressure on pricing in the market for new clubs could have a significant adverse effect on the Company’s pre-owned club business as the gap narrows
10
between the cost of a new club and a pre-owned club. Successful marketing activities, discounted pricing, consignment sales, extended payment terms or new product introductions by competitors could negatively impact the Company’s future sales.
Golf Balls. The golf ball business is also highly competitive. There are a number of well-established and well-financed competitors, including one competitor with an estimated U.S. market share of over 50%. The Company’s competitors continue to incur significant costs in the areas of advertising, tour and other promotional support. The Company believes that to be competitive, the Company also needs to continue to incur significant expenses in tour, advertising and promotional support. Unless there is a change in competitive conditions, these competitive pressures and increased costs will continue to adversely affect the profitability of the Company’s golf ball business.
The Company’s expanding apparel business, and operation of related retail locations, is subject to various risks and uncertainties, and the Company’s growth and strategic plans may not be fully realized.
The Company has been expanding its focus over the last several years to include soft goods and apparel, in addition to its core golf business, primarily through the acquisitions of OGIO and TravisMathew in 2017 and Jack Wolfskin in January 2019. Jack Wolfskin is an international, premium outdoor apparel, footwear and equipment brand, and it designs products targeted at the active outdoor and urban outdoor customer categories. The scale and global scope of the Jack Wolfskin acquisition involves various risks and uncertainties described throughout this Annual Report on Form 10-K, including in this “Risk Factors” section, as well as the following:
Maintaining its market share in its key markets such as Germany, Austria and Switzerland and China in the face of increasing competition and new competitors;
Difficulties in developing the Jack Wolfskin brand in the North American and other target markets;
Significant competition from existing premium outdoor apparel companies in target markets;
Continually changing consumer preferences; and
Difficulties in managing or realizing sustainable profitability from Jack Wolfskin’s large global franchise system, consisting of hundreds of franchised locations.
Additionally, as a result of the Company’s golf apparel joint venture in Japan in July 2016 and the acquisitions of TravisMathew in August 2017 and Jack Wolfskin in January 2019, the Company now maintains over 150 retail locations around the world. The Company’s retail operations are subject to various factors that pose risks and uncertainties and which could adversely impact the Company’s financial condition and operating results. Such factors include, but are not limited to, macro-economic factors that could have an adverse effect on retail activity generally; the Company’s ability to successfully manage retail operations and a disparate retail workforce across various jurisdictions; to manage costs associated with retail store operations and fluctuations in the value of retail inventory; to manage relationships with existing retail partners; and to obtain and renew leases in quality retail locations at a reasonable cost and on reasonable and customary terms.
If the Company fails to realize the expected benefits from its expansion into soft goods and apparel or is unsuccessful in its operation of its retail locations, the Company’s growth and strategic plans may not be fully realized, and its business, financial condition and results of operations could be adversely affected.
If the Company is unable to successfully manage the frequent introduction of new products that satisfy changing consumer preferences, it could significantly and adversely impact its financial performance and prospects for future growth.
The Company’s main golf equipment products, like those of its competitors, generally have life cycles of two years or less, with sales occurring at a much higher rate in the first year than in the second. Factors driving these short product life cycles include the rapid introduction of competitive products and consumer demands for the latest technology. In this marketplace, a substantial portion of the Company’s annual revenues is generated each year by products that are in their first year of their product life cycle. The Company’s expanding apparel business is also subject to similar pressures in terms of changing consumer preferences on a global level and the Company’s ability to timely introduce products that anticipate and/or satisfy such preferences.
11
These marketplace conditions raise a number of issues that the Company must successfully manage. For example, the Company must properly anticipate consumer preferences and design products that meet those preferences while also complying with significant restrictions imposed on golf equipment by the Rules of Golf (see further discussion of the Rules of Golf below) or its new products will not achieve sufficient market success to compensate for the usual decline in sales experienced by products already in the market. Second, the Company’s research and development and supply chain groups face constant pressures to design, develop, source and supply new products that perform better than their predecessors many of which incorporate new or otherwise untested technology, suppliers or inputs. Third, for new products to generate equivalent or greater revenues than their predecessors, they must either maintain the same or higher sales levels with the same or higher pricing, or exceed the performance of their predecessors in one or both of those areas. Fourth, the relatively short window of opportunity for launching and selling new products requires great precision in forecasting demand and assuring that supplies are ready and delivered during the critical selling periods. Finally, the rapid changeover in products creates a need to monitor and manage the closeout of older products both at retail and in the Company’s own inventory. Should the Company not successfully manage the frequent introduction of new products that satisfy consumer demand, the Company’s results of operations, financial condition and cash flows could be significantly adversely affected.
The Company’s golf club, and golf ball, and gear and accessories business has a concentrated customer base. The loss of one or more of the Company’s top customers could have a significant effect on the Company’s golf club, and golf ball, and gear and accessories sales.
On a consolidated basis, no onesingle customer that distributes golf clubs or golf balls in the United States accounted for more than 8%, 9% and 8%10% of the Company’s consolidated revenues in 2016, 2015both 2018 and 2014, respectively.2017, and 8% in 2016. The Company's top five customers accounted for approximately 22% of the Company's consolidated revenues in each of 2018 and 2016, 26%and 21% of the Company's consolidated revenues in 2015 and 25% in 2014. On a segment basis,2017.
With respect to the Company's segments, the Company's top five golf club
Golf Club customers accounted for approximately 23%25%, 20% and 26% of total consolidated golf clubGolf Club sales in 2018, 2017 and 2016, and approximately 25% of total consolidated golf club sales in each of 2015 and 2014. The top five golf ballrespectively;
Golf Ball customers accounted for approximately 29%, 30% and 28% of total consolidated golf ballGolf Ball sales in 2018, 2017 and 2016, respectively; and
Gear and 30%Accessories customers accounted for approximately 19%, 15% and 18% of total consolidated Gear and Accessories sales in each of 20152018, 2017 and 2014. 2016, respectively.
A loss of one or more of these customers wouldcould have a significant adverse effect on the Company's net sales.
Consolidation of retailers or concentration of retail market share among a few retailers may increase and concentrate the Company’s credit risk, putting pressure on its margins and its ability to sell products.
The off‑course golf clubequipment retail markets in some countries, including the United States, are dominated by a few large retailers. Certain of these retailers have in the past increased their market share and golf ballmay continue to do so in the future by expanding through acquisitions and construction of additional stores. Industry consolidation has occurred in recent years, and additional consolidation is possible. These situations may result in a concentration of the Company’s credit risk with respect to its sales to such retailers, and, if any of these retailers were to experience a shortage of liquidity or other financial difficulties, or file for bankruptcy, it would increase the risk that their outstanding payables to the Company may not be paid. This consolidation may also result in larger retailers gaining increased leverage, which may impact the Company’s margins. In addition, increasing market share concentration among one or a few retailers in a particular country or region increases the risk that if any one of them substantially reduces their purchases of the Company’s products, the Company may be unable to find a sufficient number of other retail outlets for the Company’s products to sustain the same level of sales. Any reduction in sales by the Company’s retailers could materially adversely affect the Company’s business, financial condition and results of operations.
The Company’s business depends on strong brands, and if the Company is not able to maintain and enhance the Company’s brands, its sales may be adversely affected.
The Company’s brands have worldwide recognition, and the Company’s success depends in large part on its ability to maintain and enhance its brand image and reputation. Maintaining, promoting and enhancing the Company’s brands may require the Company to make substantial investments in areas such as product innovation, product quality, intellectual property protection, marketing and employee training, and these investments may not have the desired impact on the Company’s brand image and reputation. The Company’s business could be adversely impacted if the Company fails to achieve any of these objectives or if the reputation
12
or image of any of the Company’s brands is tarnished or receives negative publicity. In addition, adverse publicity about regulatory or legal action against the Company could damage its reputation and brand image, undermine consumer confidence in the Company and reduce long‑term demand for its products, even if the regulatory or legal action is unfounded or not material to its operations. Also, as the Company seeks to grow its presence in existing, and expand into new, geographic or product markets, consumers in these markets may not accept the Company’s brand image and may not be willing to pay a premium to purchase the Company’s products as compared to other brands. The Company anticipates that as it continues to grow its presence in existing markets and expand into new markets, further developing the Company’s brands may become increasingly difficult and expensive. If the Company is unable to maintain or further develop the image of the Company’s brands, it could materially adversely affect the Company’s business, financial condition and results of operations.
International political instability and terrorist activities may decrease demand for the Company’s products and disrupt its business.
Terrorist activities and armed conflicts could have an adverse effect on the United States or worldwide economy and could cause decreased demand for the Company’s products as consumers’ attention and interests are diverted from golf and become focused on issues relating to these events. If such events disrupt domestic or international air, ground or sea shipments, or the operation of the Company’s manufacturing facilities, the Company’s ability to obtain the materials necessary to manufacture its products and to deliver customer orders would be harmed, which would have a significant adverse effect on the Company’s results of operations, financial condition and cash flows. Such events can also negatively impact tourism, which could adversely affect the Company’s sales to retailers at resorts and other vacation destinations. In addition, the occurrence of political instability and/or terrorist activities generally restricts travel to and from the affected areas, making it more difficult in general to manage the company’sCompany’s international operations.
The Company’s business could be harmed by the occurrence of natural disasters or pandemic diseases.
The occurrence of a natural disaster, such as an earthquake, tsunami, fire, flood or hurricane, or the outbreak of a pandemic disease, could significantly adversely affect the Company’s business. A natural disaster or a pandemic disease could significantly
adversely affect both the demand for the Company’s products as well as the supply of the components used to make the Company’s products. Demand for golf products also could be negatively affected as consumers in the affected regions restrict their recreational activities and as tourism to those areas declines. If the Company’s suppliers experienced a significant disruption in their business as a result of a natural disaster or pandemic disease, the Company’s ability to obtain the necessary components to make its products could be significantly adversely affected. In addition, the occurrence of a natural disaster or the outbreak of a pandemic disease generally restricts travel to and from the affected areas, making it more difficult in general to manage the Company’s international operations.
The Company’s business and operating results are subject to seasonal fluctuations, which could result in fluctuations in its operating results and stock price.
The Company’s business is subject to seasonal fluctuations. The Company’s first-quarter sales generally represent the Company’s sell-in to the golf retail channel of its golf club products for the new golf season. The Company’s second and third-quarter sales generally represent reorder business for golf clubs. Sales of golf clubs during the second and third quarters are significantly affected not only by the sell-through of the Company’s products that were sold into the channel during the first quarter but also by the sell-through of products by the Company’s competitors. Retailers are sometimes reluctant to reorder the Company’s products in significant quantities when they already have excess inventory of products of the Company or its competitors. The Company’s sales of golf balls are generally associated with the level of rounds played in the areas where the Company’s products are sold. Therefore, golf ball sales tend to be greater in the second and third quarters, when the weather is good in most of the Company’s key regions and the number of rounds played are up.increase. Golf ball sales are also stimulated by product introductions as the retail channel takes on initial supplies. Like those of golf clubs, reorders of golf balls depend on the rate of sell-through. The Company’s golf-related sales during the fourth quarter are generally significantly less than those of the other quarters because in many of the Company’s key regions fewer people are playing golf during that time of year due to cold weather. Furthermore, the Company generally announces its new golf product line in the fourth quarter to allow retailers to plan for the new golf season. Such early announcements of new products could cause golfers, and therefore the Company’s customers, to defer purchasing additional golf equipment until the Company’s new products are available. Such deferments could have a material adverse effect on sales of the Company’s current products or result in closeout sales at reduced prices.
The Company’s expanding apparel business is expected to experience stronger revenue during different times of the year than the Company’s golf-related business. The Company’s newly acquired Jack Wolfskin business focuses primarily on outerwear
13
and consequently experiences stronger sales for such products during the cold-weather months and the corresponding prior sell-in periods.
The seasonality of the Company’s business could be exacerbated by the adverse effects of unusual or severe weather conditions as well as by severe weather conditions caused by climate change on the Company’s business.
Due to the seasonality of the Company’s business, the Company’s business can be significantly adversely affected by unusual or severe weather conditions and by severe weather conditions caused by climate change. Unfavorable weather conditions generally result in fewer golf rounds played, which generally results in reduced demand for all golf products, and in particular, golf balls. Furthermore, catastrophic storms can negatively affect golf rounds played both during the storms and afterward, as storm damaged golf courses are repaired and golfers focus on repairing the damage to their homes, businesses and communities. The Company’s apparel business may also be adversely impacted by weather conditions, such as an unusually warm or short winter period. Consequently, sustained adverse weather conditions especially during the warm weather months, could materially affect the Company’s sales.
Changes in equipment standards under applicable Rules of Golf could adversely affect the Company’s business.
The Company seeks to have its new golf club and golf ball products satisfy the standards published by the USGA and The R&A in the Rules of Golf because these standards are generally followed by golfers, both professional and amateur, within their respective jurisdictions. The USGA publishes rules that are generally followed in the United States, Canada and Mexico, and The R&A publishes rules that are generally followed in most other countries throughout the world. However, the Rules of Golf as published by The R&A and the USGA are virtually the same and are intended to be so pursuant to a Joint Statement of Principles issued in 2001.
In the future, existing USGA and/or R&A standards may be altered in ways that adversely affect the sales of the Company’s current or future products. If a change in rules were adopted and caused one or more of the Company’s current or future products to be nonconforming, the Company’s sales of such products would be adversely affected.
The Company’s sales and business could be materially and adversely affected if professional golfers do not endorse or use the Company’s products.
The Company establishes relationships with professional golfersathletes, celebrities and other endorsers in order to evaluate and promote Callaway Golf, Odyssey, OGIO and OGIOTravisMathew branded products. The Company has entered into endorsement arrangements with members of the various professional tours, including the Champions Tour, the PGA Tour, the LPGA Tour, the PGA European Tour, the Japan Golf Tour and the Web.com Tour. While most professional golfersendorsers fulfill their contractual obligations, some have been known to stop using a sponsor’s products despite contractual commitments. If certain of the Company’s professional endorsers were to stop using the Company’s products contrary to their endorsement agreements, the Company’s business could be adversely affected in a material way by the negative publicity or lack of endorsement.
The Company believes that professional usage of its golf clubs and golf balls contributes to retail sales. The Company therefore spends a significant amount of money to secure professional usage of its products. Many other companies, however, also aggressively seek the patronage of these professionals and offer many inducements, including significant cash incentives and specially designed products. There is a great deal of competition to secure the representation of tour professionals. As a result, it is expensive to attract and retain such tour professionals. The inducements offered by other companies could result in a decrease in usage of the Company’s products by professional golfers or limit the Company’s ability to attract other tour professionals. A decline in the level of professional usage of the Company’s products, or a significant increase in the cost to attract or retain endorsers, could have a material adverse effect on the Company’s sales and business.
Any significant changes in U.S. trade, tax or other policies that restrict imports or increase import tariffs could have a material adverse effect on the Company’s results of operations.
A significant amount of the Company’s products are manufactured in Mexico, China and other regions outside of the United States. The Trump administration has called for substantial changes to U.S. trade and tax policies, which may include import restrictions, increased import tariffs and/or changes in U.S. participation in multilateral trade agreements such as the North American Free Trade Agreement (NAFTA) and any successor agreements, such as the United States-Mexico-Canada Agreement (USMCA). Restrictions on imports could prevent or make it difficult or more expensive for the Company to obtain the components needed for new products which would affect the Company’s sales. Increased tariffs would require the Company to increase its prices which likely would decrease customer demand for its products. Other countries might retaliate through the imposition of their own restrictions and or increased tariffs which would affect the Company’s ability to export products and therefore adversely
14
affect its sales. Any significant changes in current U.S. trade, tax or other policies could have a material adverse effect upon the Company’s results of operations.
Risks Related to Operations, Manufacturing, and Technology
The Company has significant international operations and is exposed to risks associated with doing business globally.
The Company sells and distributes its products directly in many key international markets in Europe, Asia, North America and elsewhere around the world. These activities have resulted and will continue to result in investments in inventory, accounts receivable, employees, corporate infrastructure and facilities. In addition, there are a limited number of suppliers of golf club components in the United States, and the Company is dependent on suppliers and vendors located outside of the United States. The operation of foreign distribution in the Company’s international markets, as well as the management of relationships with international suppliers and vendors, will continue to require the dedication of management and other Company resources. The Company manufactures most of its products outside of the United States.
As a result of this international business, the Company is exposed to increased risks inherent in conducting business outside of the United States. These risks include the following:
Adverse changes in foreign currency exchange rates can have a significant effect upon the Company's results of operations, financial condition and cash flows;
Increased difficulty in protecting the Company’s intellectual property rights and trade secrets;
Unexpected government action or changes in legal or regulatory requirements;
Social, economic or political instability;
The effects of any anti-American sentiments on the Company’s brands or sales of the Company’s products;
Increased difficulty in ensuring compliance by employees, agents and contractors with the Company’s policies as well as with the laws of multiple jurisdictions, including but not limited to the U.S. Foreign Corrupt Practices Act, local international environmental, health and safety laws, and increasingly complex regulations relating to the conduct of international commerce;
Increased difficulty in controlling and monitoring foreign operations from the United States, including increased difficulty in identifying and recruiting qualified personnel for its foreign operations; and
Increased exposure to interruptions in air carrier or ship services.
Any significant adverse change in these and other circumstances or conditions relating to international operations could have a significant adverse effect on the Company’s operations, financial performance and condition.
Any difficulties from strategic acquisitions that the Company pursues or consummates, including its recent acquisition of Jack Wolfskin, could adversely affect its business, financial condition and results of operations.
The Company may acquire companies, businesses and products that complement or augment its existing business. For example, in January 2019, the Company completed the acquisition of Jack Wolfskin. The Company may not be able to integrate this business or any other business that it may acquire in the future successfully or operate such acquired business profitably. Integrating any newly acquired business could be expensive and time-consuming. Integration efforts often take a significant amount of time, place a significant strain on managerial, operational and financial resources and could prove to be more difficult or expensive than predicted. The diversion of management's attention and any delay or difficulties encountered in connection with any such acquisitions could result in the disruption of on-going business or inconsistencies in standards and controls that could negatively affect the Company’s ability to maintain third-party relationships. Moreover, the Company incurred substantial indebtedness to finance the Jack Wolfskin acquisition and may need to raise additional funds through public or private debt or equity financing, or issue additional shares, to acquire any future businesses or products, which may result in dilution for stockholders or the incurrence of indebtedness.
As part of the Company’s efforts to acquire companies, business or products or to enter into other significant transactions, the Company conducts business, legal and financial due diligence with the goal of identifying and evaluating material risks involved in the transaction. Despite the Company’s efforts, the Company ultimately may be unsuccessful in ascertaining or evaluating all such risks and, as a result, might not realize the intended advantages of the transaction. If the Company fails to realize the expected benefits from previous acquisitions or other acquisitions it may consummate in the future, whether as a result of unidentified risks, integration difficulties, litigation with current or former employees and other events, the Company’s business, financial condition and results of operations could be adversely affected.
15
The Company has significant international sales and purchases, and unfavorable changes in foreign currency exchange rates could have a significant negative impact on the Company’s results of operations.
A significant portion of the Company’s purchases and sales is international. In 2019, more than half of the Company's sales are expected to occur outside of the United States. As a result, the Company conducts transactions in various currencies worldwide. Following the completion of the Jack Wolfskin acquisition in January 2019, the Company continues to expect its international business, and the number of transactions that it conducts in foreign currencies, to expand. Conducting business in such currencies exposes the Company to fluctuations in foreign currency exchange rates relative to the U.S. dollar.
The Company’s financial results are reported in U.S. dollars, and as a result, transactions conducted in foreign currencies must be translated into U.S. dollars for reporting purposes based upon the applicable foreign currency exchange rates. Fluctuations in these foreign currency exchange rates therefore may positively or negatively affect the Company’s reported financial results and can significantly affect period-over-period comparisons.
The effect of the translation of foreign currencies on the Company’s financial results can be significant. The Company therefore engages in certain hedging activities to mitigate the annual impact of the translation of foreign currencies on the Company’s financial results. The Company’s hedging activities can reduce, but will not eliminate, the effects of foreign currency fluctuations. The extent to which the Company’s hedging activities mitigate the effects of foreign currency translation varies based upon many factors, including the amount of transactions being hedged. Other factors that could affect the effectiveness of the Company’s hedging activities include accuracy of sales forecasts, volatility of currency markets and the availability of hedging instruments. Since the hedging activities are designed to reduce volatility, they not only reduce the negative impact of a stronger U.S. dollar but also reduce the positive impact of a weaker U.S. dollar. The Company’s future financial results could be significantly affected by the value of the U.S. dollar in relation to the foreign currencies in which the Company conducts business.
Foreign currency fluctuations can also affect the prices at which products are sold in the Company’s international markets. The Company therefore adjusts its pricing based in part upon fluctuations in foreign currency exchange rates. Significant unanticipated changes in foreign currency exchange rates make it more difficult for the Company to manage pricing in its international markets. If the Company is unable to adjust its pricing in a timely manner to counteract the effects of foreign currency fluctuations, the Company’s pricing may not be competitive in the marketplace and the Company’s financial results in its international markets could be adversely affected.
If the Company inaccurately forecasts demand for its products, it may manufacture either insufficient or excess quantities, which, in either case, could adversely affect its financial performance.
The Company plans its manufacturing capacity based upon the forecasted demand for its products. Forecasting the demand for the Company's products is very difficult given the manufacturing lead time and the amount of specification involved. For example, the Company must forecast well in advance not only how many drivers it will sell, but also (1) the quantity of each driver model, (2) the quantity of the different lofts in each driver model, and (3) for each driver model and loft, the number of left handed and right handed versions. Forecasting demand for specific apparel products can also be challenging due to changing consumer preferences and competitive pressures. The nature of the Company’s business makes it difficult to adjust quickly its manufacturing capacity if actual demand for its products exceeds or is less than forecasted demand. If actual demand for its products exceeds the forecasted demand, the Company may not be able to produce sufficient quantities of new products in time to fulfill actual demand, which could limit the Company’s sales and adversely affect its financial performance. On the other hand, if actual demand is less than the forecasted demand for its products, the Company could produce excess quantities, resulting in excess inventories and related obsolescence charges that could adversely affect the Company’s financial performance.
The Company depends on single source or a limited number of suppliers for some of the components of its products, and the loss of any of these suppliers could harm its business.
The Company is dependent on a limited number of suppliers for its clubheads and shafts, some of which are single sourced. Furthermore, some of the Company’s products require specially developed manufacturing techniques and processes which make it difficult to identify and utilize alternative suppliers quickly. In addition, many of the Company’s suppliers are not well capitalized and prolonged unfavorable economic conditions could increase the risk that they will go out of business. If current suppliers are unable to deliver clubheads, shafts or other components, or if the Company is required to transition to other suppliers, the Company could experience significant production delays or disruption to its business. The Company also depends on a single or a limited number of suppliers for the materials it uses to make its golf balls. Many of these materials are customized for the Company. Any delay or interruption in such supplies could have a material adverse impact on the Company’s golf ball business. If the Company
16
A significant disruption in the future. The lossoperations of one or more of these senior officersthe Company’s golf club assembly and golf ball manufacturing and assembly facilities could have a material adverse effect on the Company’s sales, profitability and results of operations.
A significant disruption at any of the Company’s golf club or golf ball manufacturing facilities or distribution centers in the United States or in regions outside the United States could materially and adversely affect the Company’s sales, profitability and results of operations.
A disruption in the service or a significant increase in the cost of the Company’s primary delivery and shipping services for its products and component parts or a significant disruption at shipping ports could have a material adverse effect on the Company’s business.
The Company uses United Parcel Service (“UPS”) for substantially all ground shipments of products to its U.S. customers. The Company uses air carriers and ocean shipping services for most of its international shipments of products. Furthermore, many of the components the Company uses to build its golf clubs, including clubheads and shafts, are shipped to the Company via air carrier and ship services. If there is any significant interruption in service by such providers or at airports or shipping ports, the Company may be unable to engage alternative suppliers or to receive or ship goods through alternate sites in order to deliver its products or components in a timely and cost-efficient manner. As a result, the Company could experience manufacturing delays, increased manufacturing and shipping costs and lost sales as a result of missed delivery deadlines and product demand cycles. Any significant interruption in UPS services, air carrier services, ship services or at airports or shipping ports could have a material adverse effect on the Company’s business. Furthermore, if the cost of delivery or shipping services were to increase significantly and the additional costs could not be covered by product pricing, the Company’s operating results could be materially adversely affected.
The cost of raw materials and components could affect the Company’s operating results.
The materials and components used by the Company and its abilitysuppliers involve raw materials, including synthetic rubber, thermoplastics, zinc stearate, zinc oxide and lime stone for the manufacturing of the Company’s golf balls, titanium alloys carbon fiber and steel for the assembly of the Company’s golf clubs, and various fabrics used by suppliers in the Company’s apparel business. Significant price fluctuations or shortages in such raw materials or components, including the costs to achievetransport such materials or components, the uncertainty of currency fluctuations against the U.S. dollar, increases in labor rates, trade duties or tariffs, and/or the introduction of new and expensive raw materials, could materially adversely affect the Company’s business, financial condition and results of operations.
The Company may be subject to product warranty claims that require the replacement or repair of products sold. Such warranty claims could adversely affect the Company’s results of operations and relationships with its strategic goals.customers.
The Company manufactures and/or distributes a variety of golf-related products and has a stated two-year warranty policy for its golf clubs. From time to time, such products may contain manufacturing defects or design flaws that are not detected prior to sale, particularly in the case of new product introductions or upon design changes to existing products. The failure to identify and correct manufacturing defects and product design issues prior to the sale of those products could result in product warranty claims that result in costs to replace or repair any such defective products. Because many of the Company’s products are sold to retailers for broad consumer distribution and/or to customers who buy in large quantities, there could be significant costs associated with such product warranty claims, including the potential for customer dissatisfaction that may adversely affect the Company’s reputation and relationships with its customers, which may result in lost or reduced sales.
Failure to adequately enforce the Company’s intellectual property rights could adversely affect its reputation and sales.
The golf club industry, in general, has been characterized by widespread imitation of popular club designs. The Company has an active program of monitoring, investigating and enforcing its proprietary rights against companies and individuals who market or manufacture counterfeits and “knockoff” products. The Company asserts its rights against infringers of its copyrights, patents, trademarks and trade dress. However, these efforts may not be successful in reducing sales of golf products by these infringers. Additionally, other golf club manufacturers may be able to produce successful golf clubs which imitate the Company’s designs without infringing any of the Company’s copyrights, patents, trademarks or trade dress. With respect to the Company’s apparel business, counterfeits are known to exist in the industry, including in the premium outdoor apparel segment within which
17
Jack Wolfskin operates. The failure to prevent or limit such infringers or imitators could adversely affect the Company’s reputation and sales.
The Company may become subject to intellectual property claims or lawsuits that could cause it to incur significant costs or pay significant damages or that could prohibit it from selling its products.
The Company’s competitors also seek to obtain patent, trademark, copyright or other protection of their proprietary rights and designs for golf clubs, golf balls and other golf products. From time to time, third parties have claimed or may claim in the future that the Company’s products infringe upon their proprietary rights. The Company evaluates any such claims and, where appropriate, has obtained or sought to obtain licenses or other business arrangements. To date, there have been no significant interruptions in the Company’s business as a result of any claims of infringement. However, in the future, intellectual property claims could force the Company to alter its existing products or withdraw them from the market or could delay the introduction of new products.
Various patents have been issued to the Company’s competitors in the golf industry and these competitors may assert that the Company’s golf products infringe their patent or other proprietary rights. If the Company’s golf products are found to infringe third-party intellectual property rights, the Company may be unable to obtain a license to use such technology, and it could incur substantial costs to redesign its products, withdraw them from the market, and/or to defend legal actions.
The Company’s brands may be damaged by the actions of its licensees.
The Company licenses its trademarks to third-party licensees who produce, market and sell their products bearing the Company’s trademarks. The Company chooses its licensees carefully and imposes upon such licensees various restrictions on the products, and on the manner, on which such trademarks may be used. In addition, the Company requires its licensees to abide by certain standards of conduct and the laws and regulations of the jurisdictions in which they do business. However, if a licensee fails to adhere to these requirements, the Company’s brands could be damaged. The Company’s brands could also be damaged if a licensee becomes insolvent or by any negative publicity concerning a licensee or if the licensee does not maintain good relationships with its customers or consumers, many of which are also the Company’s customers and consumers.
Sales of the Company’s products by unauthorized retailers or distributors could adversely affect the Company’s authorized distribution channels and harm the Company’s reputation.
Some of the Company’s products find their way to unauthorized outlets or distribution channels. This “gray market” for the Company’s products can undermine authorized retailers and foreign wholesale distributors who promote and support the Company’s products, and can injure the Company’s image in the minds of its customers and consumers. On the other hand, stopping such commerce could result in a potential decrease in sales to those customers who are selling the Company’s products to unauthorized distributors or an increase in sales returns over historical levels. While the Company has taken some lawful steps to limit commerce of its products in the “gray market” in both the United States and abroad, it has not stopped such commerce.
The Company relies on research & development, technical innovation and high‑quality products to successfully compete.
The Company relies on complex information systems for management of its manufacturing, distribution, sales and other functions. If the Company’s information systems fail to perform these functions adequately or if the Company experiences an interruption in their operation, including a breach in cyber security, its business and results of operations could suffer.
All of the Company’s major operations, including manufacturing, distribution, sales and accounting, are dependent upon the Company’s complex information systems. The Company’s information systems are vulnerable to damage or interruption from:
Earthquake, fire, flood, hurricane and other natural disasters;
Power loss, computer systems failure, Internet and telecommunications or data network failure; and
Hackers, computer viruses, software bugs or glitches.
18
Any damage or significant disruption in the operation of such systems or the failure of the Company’s information systems to perform as expected would disrupt the Company’s business, which may result in decreased sales, increased overhead costs, excess inventory and product shortages and otherwise adversely affect the Company’s reputation, operations, financial performance and condition.
Cyber-attacks, unauthorized access to, or accidental disclosure of, consumer personally-identifiable information including credit card information, that the Company collects through its websites may result in significant expense and negatively impact the Company's reputation and business.
There is heightened concern and awareness over the security of personal information transmitted over the Internet, consumer identity theft and user privacy. While the Company has implemented security measures, the Company’s computer systems may nevertheless be susceptible to electronic or physical computer break-ins, viruses and other disruptions and security compromises. Any perceived or actual unauthorized or inadvertent disclosure of personally-identifiable information, whether through a compromise of the Company’s network by an unauthorized party, employee theft, misuse or error or otherwise, could harm the Company’s reputation, impair the Company’s ability to attract website visitors, or subject the Company to claims or litigation arising from damages suffered by consumers, and adversely affect the Company’s operations, financial performance and condition.
Risks Related to Regulations
Regulations related to “conflict minerals” require the Company to incur additional expenses and could limit the supply and increase the cost of certain metals used in manufacturing the Company’s products.
The Commission's rules require disclosure related to sourcing of specified minerals, known as conflict minerals, that are necessary to the functionality or production of products manufactured or contracted to be manufactured by public companies. The rules require companies to, under specified circumstances, undertake due diligence, disclose and report whether or not such minerals originated from the Democratic Republic of Congo or an adjoining country. The Company’s products may contain some of the specified minerals. As a result, the Company incurs additional expenses in connection with complying with the rules, including with respect to any due diligence that is required under the rules. In addition, the Commission's implementation of the rules could adversely affect the sourcing, supply and pricing of materials used in the Company’s products. There may only be a limited number of suppliers offering “conflict free” conflict minerals, and the Company cannot be certain that it will be able to obtain necessary “conflict free” minerals from such suppliers in sufficient quantities or at competitive prices. Because the Company’s supply chain is complex, the Company may also not be able to sufficiently verify the origins of the relevant minerals used in the Company’s products through the due diligence procedures that the Company implements, which may harm the Company’s reputation.
The Company could be adversely affected by any violations of the U.S. Foreign Corrupt Practices Act (“FCPA”), the U.K. Bribery Act, and other foreign anti-bribery laws.
The FCPA generally prohibits companies and their intermediaries from making improper payments to non-U.S. government officials for the purpose of obtaining or retaining business. Other countries in which the Company operates also have anti-bribery laws, some of which prohibit improper payments to government and non-government persons and entities, and others (e.g., the FCPA and the U.K. Bribery Act) extend their application to activities outside of their country of origin. The Company’s policies mandate compliance with all applicable anti-bribery laws. In certain regions of the world, strict compliance with anti-bribery laws may conflict with local customs and practices. In addition, the Company may conduct business in certain regions through intermediaries over whom the Company has less direct control, such as subcontractors, agents, and partners (such as joint venture partners). Although the Company has implemented policies, procedures, and, in certain cases, contractual arrangements designed to facilitate compliance with these anti-bribery laws, the Company’s officers, directors, employees, associates, subcontractors, agents, and partners may take actions in violation of the Company’s policies, procedures, contractual arrangements, and anti-bribery laws. Any such violation, even if prohibited by the Company’s policies, could subject the Company and such persons to criminal and/or substantial civil penalties or other sanctions, which could have a material adverse effect on the Company’s business, financial condition, cash flows, and reputation.
The Company is subject to environmental, health and safety laws and regulations, which could subject the Company to liabilities, increase its costs or restrict its operations in the future.
The Company’s properties and operations are subject to a number of environmental, health and safety laws and regulations in each of the jurisdictions in which the Company operates. These laws and regulations govern, among other things, air emissions, water discharges, handling and disposal of solid and hazardous substances and wastes, soil and groundwater contamination and
19
employee health and safety. The Company’s failure to comply with such environmental, health and safety laws and regulations could result in substantial civil or criminal fines or penalties or enforcement actions, including regulatory or judicial orders enjoining or curtailing operations or requiring remedial or corrective measures, installation of pollution control equipment or other actions.
The Company may also be subject to liability for environmental investigations and cleanups, including at properties that the Company currently or previously owned or operated, even if such contamination was not caused by the Company, and the Company may face claims alleging harm to health or property or natural resource damages arising out of contamination or exposure to hazardous substances. The Company may also be subject to similar liabilities and claims in connection with locations at which hazardous substances or wastes the Company has generated have been stored, treated, otherwise managed, or disposed. Environmental conditions at or related to the Company’s current or former properties or operations, and/or the costs of complying with current or future environmental, health and safety requirements (which have become more stringent and complex over time) could materially adversely affect the Company’s business, financial condition and results of operations.
Changes in, or any failure to comply with, privacy laws, regulations, and standards may adversely affect the Company’s business.
Personal privacy and data security have become significant issues in the United States, Europe, and in many other jurisdictions in which the Company operates. The regulatory framework for privacy and security issues worldwide is rapidly evolving and is likely to remain uncertain for the foreseeable future. Furthermore, federal, state, or foreign government bodies or agencies have in the past adopted, and may in the future adopt, laws and regulations affecting data privacy, all of which may be subject to invalidation by relevant foreign judicial bodies. Industry organizations also regularly adopt and advocate for new standards in this area. In the United States, these include rules and regulations promulgated under the authority of federal agencies and state attorneys general and legislatures and consumer protection agencies, including, but not limited to, the California Consumer Privacy Act (CCPA). Internationally, many jurisdictions in which the Company operates have established their own data security and privacy legal framework with which the Company or its customers must comply, including but not limited to, the European General Data Protection Regulation (GDPR), which imposes certain privacy-related obligations and potential penalties and risks upon the Company’s business. In many jurisdictions, enforcement actions and consequences for noncompliance are also rising. In addition to government regulation, privacy advocates and industry groups may propose new and different self-regulatory standards that either legally or contractually apply to the Company. Any inability or perceived inability to adequately address privacy and security concerns, even if unfounded, or comply with applicable privacy and data security laws, regulations, and policies, could result in additional cost and liability to the Company, damage its reputation and adversely affect its business.
Other Risks
Significant developments stemming from the U.K.’s decision to withdraw from the European Union could have a material adverse effect on the Company.
The United Kingdom has voted in favor of leaving the EU, and such withdrawal (commonly referred to as “Brexit”) is scheduled to take effect over the next year. This decision has created political and economic uncertainty, particularly in the United Kingdom and the EU, and this uncertainty may last for several years. The Company's business in the United Kingdom, the EU, and worldwide could be affected during this period of uncertainty, and perhaps longer, by the impact of Brexit. The pending withdrawal and its possible future consequences have caused and may continue to cause significant volatility in global financial markets, including in global currency and debt markets. This volatility could cause a slowdown in economic activity in the United Kingdom, Europe or globally, which could adversely affect the Company's operating results and growth prospects, or result in a further strengthening of the U.S. dollar which would also adversely affect the Company's reported operating results.
Changes in tax laws and unanticipated tax liabilities could adversely affect the Company's effective income tax rate and profitability.
The Company is subject to income taxes in the United States and numerous foreign jurisdictions. Although the Tax Act enacted in December 2017 lowered the U.S. corporate income tax rate, the Company's effective income tax rate in the future could be adversely affected by a number of factors, including: changes in the mix of earnings in countries with differing statutory tax rates, changes in the valuation of deferred tax assets and liabilities, changes in tax laws, the outcome of income tax audits in various jurisdictions around the world, and any repatriation of non-US earnings for which the Company has not previously provided for U.S. taxes. The Company regularly assesses all of these matters to determine the adequacy of its tax provision, which is subject to significant discretion.
The Tax Act is unclear in certain respects and could be subject to potential amendments and technical corrections, as well as interpretations and implementing regulations by the Treasury and Internal Revenue Service (IRS), any of which could lessen or
20
increase certain adverse impacts of the legislation. In addition, it is unclear how these U.S. federal income tax changes will affect state and local taxation, which often uses federal taxable income as a starting point for computing state and local tax liabilities. While some of the changes made by the tax legislation may adversely affect the Company in one or more reporting periods and prospectively, other changes may be beneficial on a going forward basis. The Company is still evaluating certain provisions included in the Tax Act and therefore not completed its full assessment. As such, there may be material adverse effects resulting from the Tax Act that the Company has not yet identified.
The Company’s ability to utilize all or a portion of its U.S. deferred tax assets may be limited significantly if the Company experiences an “ownership change.”
The Company has a significant amount of U.S. federal and state deferred tax assets, which include net operating loss carryforwards, other losses and credit carryforwards. The Company’s ability to utilize the losses and credits to offset future taxable income may be limited significantly if the Company were to experience an “ownership change” as defined in section 382 of the Internal Revenue Code of 1986, as amended (the “Code”). In general, an ownership change will occur if there is a cumulative change in ownership of the Company’s stock by “5-percent shareholders” (as defined in the Code) that exceeds 50 percentage points over a rolling three-year period. The determination of whether an ownership change has occurred for purposes of Section 382 is complex and requires significant judgment. The extent to which the Company’s ability to utilize the losses and credits is limited as a result of such an ownership change depends on many variables, including the value of the Company’s stock at the time of the ownership change. The Company continues to monitor changes in ownership. If such a cumulative increase did occur in any three-year period and the Company were limited in the amount of losses and credits it could use to offset taxable income, the Company’s results of operations and cash flows would be adversely impacted.
The Company’s obligations and certain financial covenants contained under its existing credit facilities expose it to risks that could materially and adversely affect its liquidity, business, operating results, financial condition and limit the Company’s flexibility in operating its business, including the ability to make any dividend or other payments on its capital stock.
The Company’s primary credit facility is a senior secured asset-based revolving credit facility (as amended, the “ABL Facility”), comprised of a U.S. facility, a Canadian facility and a United Kingdom facility, in each case subject to borrowing base availability under the applicable facility. The amounts outstanding under the ABL Facility are secured by certain assets, including cash (to the extent pledged by the Company), the Company's intellectual property, certain eligible real estate, inventory and accounts receivable of the Company’s subsidiaries in the United States, Canada and the United Kingdom. The maximum availability under the ABL Facility fluctuates with the general seasonality of the business, and increases and decreases with the changes in the Company's inventory and account receivable balances. The Company is also party to a Term Loan B facility (the “Term Loan Facility”), the proceeds of which were used to finance the Jack Wolfskin acquisition in January 2019. The Term Loan Facility is secured by certain assets of the Company and includes restrictions similar to those described below.
The ABL Facility includes certain restrictions including, among other things, restrictions on the incurrence of additional debt, liens, dividends, stock repurchases and other restricted payments, asset sales, investments, mergers, acquisitions and affiliate transactions. In addition, the ABL Facility imposes restrictions on the amount the Company could pay in annual cash dividends, including meeting certain restrictions on the amount of additional indebtedness and requirements to maintain a certain fixed charge coverage ratio under certain circumstances. If the Company experiences a decline in revenues or adjusted EBITDA, the Company may have difficulty paying interest and principal amounts due on its ABL Facility or other indebtedness and meeting certain of the financial covenants contained in the ABL Facility. If the Company is unable to make required payments under the ABL Facility, or if the Company fails to comply with the various covenants and other requirements of the ABL Facility or other indebtedness, the Company would be in default thereunder, which would permit the holders of the indebtedness to accelerate the maturity thereof. Any default under the ABL Facility or other indebtedness could have a significant adverse effect on the Company’s liquidity, business, operating results and financial condition and ability to make any dividend or other payments on the Company’s capital stock. See Note 5 “Financing Arrangements,” in the Notes to Consolidated Financial Statements in this Form 10-K for further discussion of the terms of the ABL Facility, the Term Loan Facility and the Company's Japan ABL Facility.
The Company’s ability to generate sufficient positive cash flows from operations is subject to many risks and uncertainties, including future economic trends and conditions, demand for the Company’s products, foreign currency exchange rates and other risks and uncertainties applicable to the Company and its business. No assurances can be given that the Company will be able to generate sufficient operating cash flows in the future or maintain or grow its existing cash balances. If the Company is unable to generate sufficient cash flows to make its required payment obligations under the Term Loan Facility or to fund its business, the Company will need to increase its reliance on its ABL Facility for needed liquidity. If its ABL Facility is not then available or
21
sufficient and the Company is not able to secure alternative financing arrangements, the Company’s future operations would be materially, adversely affected.
The Company may need to raise additional funds from time to time through public or private debt or equity financings in order to execute its growth strategy.
The Company may need to raise additional funds from time to time in order to take advantage of opportunities, including the expansion of its business or the acquisition of complementary products, technologies or businesses; develop new products; or respond to competitive pressures. Any additional capital raised through the sale of equity or securities convertible into equity will dilute the percentage ownership of holders of the Company’s common stock. Capital raised through debt financing would require the Company to make periodic interest payments and may impose restrictive covenants on the conduct of its business. Furthermore, additional financings may not be available on terms economically favorable to the Company, or at all, especially during periods of adverse economic conditions, which could make it more difficult or impossible for the Company to obtain funding for the operation of its business, for making additional investments in product development and for repaying outstanding indebtedness. A failure to obtain any necessary additional funding could prevent the Company from making expenditures that may be required to grow its business or maintain its operations.
Increases in interest rates could increase the cost of servicing the Company’s indebtedness and have an adverse effect on the Company’s results of operations and cash flows.
The Company’s indebtedness outstanding under certain of its credit facilities, including the ABL Facility and the Term Loan Facility, bears interest at variable rates. As a result, increases in interest rates would increase the cost of servicing the Company’s indebtedness and could materially reduce the Company’s profitability and cash flows. An increase in interest rates could also make it difficult for the Company to obtain financing at attractive rates, which could adversely impact the Company’s ability to execute its growth strategy or future acquisitions. Additionally, rising interest rates could have a dampening effect on overall economic activity, which could have an adverse effect on the Company’s business.
The Company’s current senior management team and other key executives are critical to the Company’s success, and the loss of, and failure to adequately replace, any such individual could significantly harm the Company’s business.
The Company’s ability to maintain its competitive position is dependent to a large degree on the efforts and skills of the senior officers of the Company. The Company’s executives are experienced and highly qualified with strong reputations in their industries, and the Company believes that its management team enables it to pursue the Company’s strategic goals. The success of the Company’s business is dependent upon the management and leadership skills of its senior management team and other key personnel. Competition for these individuals’ talents is intense, and the Company may not be able to attract and retain a sufficient number of qualified personnel in the future. The loss of one or more of these senior officers could have a material adverse effect on the Company and its ability to achieve its strategic goals.
The Company’s insurance policies may not provide adequate levels of coverage against all claims and the Company may incur losses that are not covered by its insurance.
The Company maintains insurance of the type and in amounts that the Company believes is commercially reasonable and that is available to businesses in its industry. The Company carries various types of insurance, including general liability, auto liability, workers’ compensation and excess umbrella, from highly rated insurance carriers. Market forces beyond the Company’s control could limit the scope of the insurance coverage that the Company can obtain in the future or restrict its ability to buy insurance coverage at reasonable rates. The Company cannot predict the level of the premiums that the Company may be required to pay for subsequent insurance coverage, the level of any deductible and/or self‑insurance retention applicable thereto, the level of aggregate coverage available or the availability of coverage for specific risks. In the event of a substantial loss, the insurance coverage that the Company carries may not be sufficient to compensate the Company for the losses the Company incurs or any costs the Company is responsible for.
Goodwill and intangible assets represent a significant portion of the Company’s total assets, and any impairment of these assets could negatively impact the Company's results of operations and shareholders’ equity.
The Company’s goodwill and intangible assets consist of goodwill from acquisitions, trade names, trademarks, service marks, trade dress, patents and other intangible assets. Accounting rules require the evaluation of the Company’s goodwill and intangible assets with indefinite lives for impairment at least annually or whenever events or changes in circumstances indicate that the
22
carrying value of such assets may not be recoverable. Such indicators include a sustained decline in the Company’s stock price or market capitalization, adverse changes in economic or market conditions or prospects, and changes in the Company’s operations.
An asset is considered to be impaired when its carrying value exceeds its fair value. The Company determines the fair value of an asset based upon the discounted cash flows expected to be realized from the use and ultimate disposition of the asset. If in conducting an impairment evaluation the Company determines that the carrying value of an asset exceeded its fair value, the Company would be required to record a non-cash impairment charge for the difference between the carrying value and the fair value of the asset. If a significant amount of the Company’s goodwill and intangible assets were deemed to be impaired, the Company’s results of operations and shareholders’ equity would be significantly adversely affected.
If the Company’s estimates or judgments relating to its critical accounting policies prove to be incorrect, its financial condition and results of operations could be adversely affected.
The preparation of financial statements in conformity with U.S. GAAP requires management to make estimates and assumptions that affect the amounts reported in the consolidated financial statements and accompanying notes. The Company bases its estimates on historical experience and on various other assumptions that the Company believes to be reasonable under the circumstances, as discussed below in “Management’s Discussion and Analysis of Financial Condition and Results of Operations,” contained in Item 7. The results of these estimates form the basis for making judgments about the carrying values of assets, liabilities and equity, and the amount of revenue and expenses that are not readily apparent from other sources. Significant assumptions and estimates used in preparing the Company’s consolidated financial statements include those related to revenue recognition; allowance for doubtful accounts; inventories; long-lived assets, goodwill and non-amortizing intangible assets; warranty policy; income taxes and provisional estimates due to the Tax Act enacted in December 2017; share-based compensation; and foreign currency translation. The Company’s financial condition and results of operations may be adversely affected if its assumptions change or if actual circumstances differ from those in its assumptions, which could cause its results of operations to fall below the expectations of securities analysts and investors, resulting in a decline in the price of its common stock.
Item 1B. Unresolved Staff Comments
None.
Item 2. Properties
The Company and its subsidiaries conduct operations in both owned and leased properties. The Company's principal properties include executive offices, golf club assembly, golf ball manufacturing, warehousing and distribution, and sales offices.
Principal Corporate Offices
The Company’s principal executive offices and domestic operations are located in Carlsbad, California. The Company owns two buildings comprised of approximately 269,000 square feet of space that are utilized in its Carlsbad operations, which include the Company's corporate offices, research and development manufacturing,and pro-tour club assembly, in addition to the Company’s performance center.
The Company leases a facility in Huntington Beach, California comprised of approximately 86,000 square feet that is utilized for the operations of TravisMathew, which includes corporate offices, warehousing and distribution of apparel. The lease term for small scale operations related to pro-tour, as well as the Company’s performance center.this facility expires in January 2024.
Golf Club and Golf Ball Manufacturing, Warehousing and Distribution facilities
The Company leases its golf ball manufacturing plant in Chicopee, Massachusetts comprised of approximately 293,000402,000 square feet, which the Company believes is adequate for its ongoing golf ball manufacturing operations at such facility.feet. The lease term for this facility expires in February 2028.
The Company leases a golf club manufacturing facility in Monterrey, Mexico comprised of approximately 180,000 square feet. The lease term for this facility expires in February 2018.May 2025.
The Company also leases a distribution center in Swindon, England comprised of approximately 101,000 square feet. The lease term for this facility expires in December 2025.
Sales Offices and Retail Stores
23
The Company owns and leases additional properties domestically and internationally for the sale and distribution of its products totaling approximately 366,000 square feet of space, including properties in the United States, Australia, Canada, Japan, Korea, the United Kingdom, China, and India. In addition, the Company has retail locations in the United States for the sale of its TravisMathew branded products comprised of approximately 21,000 square feet. The Company’s operations at eachlease terms for these facilities expire between June 2023 and September 2028. Following the Company's acquisition of these properties includes to some extent activities related to bothJack Wolfskin in January 2019, the golf clubCompany now has over 150 additional retail locations throughout Europe and golf ball businesses. The Company believes thatChina for the sale of its facilities currently are adequate to meet its requirements.Jack Wolfskin-branded products.
Item 3. Legal Proceedings
The information set forth in Note 1012 “Commitments & Contingencies,” in the Notes to Consolidated Financial Statements included in this Annual Report on Form 10-K is incorporated herein by this reference.
Item 4. Mine Safety Disclosures
Not applicable.
PART II
Item 5. Market for Registrant’s Common Equity, Related Shareholder Matters and Issuer Purchases of Equity Securities
The Company’s common stock is listed, and principally traded, on the New York Stock Exchange (“NYSE”). The Company’s symbol for its common stock is “ELY.” As of January 31, 2017,2019, the number of holders of record of the Company’s common stock was 5,473.5,028. The following table sets forth the range of high and low per share sales prices of the Company’s common stock and per share dividends for the periods indicated.
| Year Ended December 31, | Year Ended December 31, | |||||||||||||||||||||||||||||||||||||||||||||
| 2016 | 2015 | 2018 | 2017 | |||||||||||||||||||||||||||||||||||||||||||
| Period: | High | Low | Dividend | High | Low | Dividend | High | Low | Dividend | High | Low | Dividend | ||||||||||||||||||||||||||||||||||
| First Quarter | $ | 9.62 | $ | 8.27 | $ | 0.01 | $ | 9.78 | $ | 7.52 | $ | 0.01 | $ | 16.68 | $ | 13.49 | $ | 0.01 | $ | 12.00 | $ | 9.93 | $ | 0.01 | ||||||||||||||||||||||
| Second Quarter | $ | 10.58 | $ | 9.09 | $ | 0.01 | $ | 10.20 | $ | 8.84 | $ | 0.01 | $ | 20.82 | $ | 16.05 | $ | 0.01 | $ | 13.35 | $ | 10.93 | $ | 0.01 | ||||||||||||||||||||||
| Third Quarter | $ | 11.80 | $ | 10.19 | $ | 0.01 | $ | 9.46 | $ | 7.97 | $ | 0.01 | $ | 24.67 | $ | 18.41 | $ | 0.01 | $ | 14.49 | $ | 12.36 | $ | 0.01 | ||||||||||||||||||||||
| Fourth Quarter | $ | 12.50 | $ | 9.96 | $ | 0.01 | $ | 10.30 | $ | 8.13 | $ | 0.01 | $ | 24.41 | $ | 14.44 | $ | 0.01 | $ | 15.63 | $ | 13.60 | $ | 0.01 | ||||||||||||||||||||||
The Company intends to continue to pay quarterly dividends subject to liquidity, capital availability and quarterly determinations that cash dividends are in the best interests of its shareholders. Future dividends may be affected by, among other items, the Company’s views on potential future capital requirements, projected cash flows and needs, changes to the Company’s business model, and certain restrictions limiting dividends imposed by the ABL Facility (see Note 35 “Financing Arrangements,” in the Notes to Consolidated Financial Statements in this Form 10-K).
Performance Graph
The following graph presents a comparison of the cumulative total shareholder return of the Company’s common stock since December 31, 20112013 to two indices: the Standard & Poor’s 500 Index (“S&P 500”) and the Standard & Poor’s 600 Smallcap Index (“S&P 600”). The S&P 500 tracks the aggregate price performance of equity securities of 500 large-cap companies that are actively traded in the United States, and is considered to be a leading indicator of U.S. equity securities. The S&P 600 is a market value-weighted index that tracks the aggregate price performance of equity securities from a broad range of small-cap stocks traded in the United States. The graph assumes an initial investment of $100 at December 31, 20112013 and reinvestment of all dividends in ELY stock on the dividend payable date.
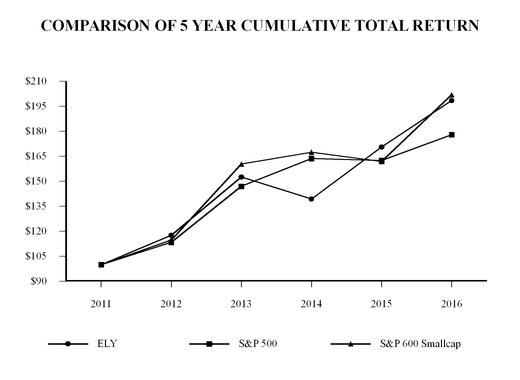
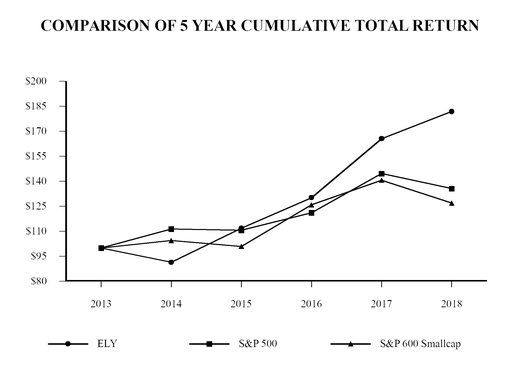
| 2011 | 2012 | 2013 | 2014 | 2015 | 2016 | 2013 | 2014 | 2015 | 2016 | 2017 | 2018 | |||||||||||||||||||||||||||||||||||
| Callaway Golf (NYSE: ELY) | $ | 100.00 | $ | 117.58 | $ | 152.54 | $ | 139.37 | $ | 170.55 | $ | 198.47 | $ | 100.00 | $ | 91.39 | $ | 111.86 | $ | 130.20 | $ | 165.60 | $ | 181.92 | ||||||||||||||||||||||
| S&P 500 | $ | 100.00 | $ | 113.41 | $ | 146.98 | $ | 163.72 | $ | 162.53 | $ | 178.02 | $ | 100.00 | $ | 111.39 | $ | 110.58 | $ | 121.13 | $ | 144.65 | $ | 135.63 | ||||||||||||||||||||||
| S&P 600 Smallcap | $ | 100.00 | $ | 114.86 | $ | 160.34 | $ | 167.46 | $ | 161.84 | $ | 201.88 | $ | 100.00 | $ | 104.44 | $ | 100.93 | $ | 125.91 | $ | 140.68 | $ | 126.96 | ||||||||||||||||||||||
The Callaway Golf Company cumulative total shareholder return is based upon the closing prices of Callaway Golf Company common stock on December 31, 2011, 2012, 2013, 2014, 2015, 2016, 2017 and 20162018 of $5.53, $6.50, $8.43, $7.70, $9.42, $10.96, $13.93 and $10.96,$15.30, respectively.
Purchases of Equity Securities by the Issuer and Affiliated Purchasers
In August 2014, the Company's Board of Directors authorized a $50.0 million share repurchase program (the "2014 Repurchase Program") under which the Company was authorized to repurchase shares of its common stock in the open market or in private transactions, subject to the Company’s assessment of market conditions and buying opportunities. Through April 2018, the Company had repurchased $46.9 million of its common stock under this program. The 2014 Repurchase Program remained in effect until May 8, 2018, at which time it was canceled by the Board of Directors and replaced by a new share repurchase program with a maximum cost to the Company of $50.0 million (the "2018 Repurchase Program"), under which the Company is authorized to repurchase shares of its common stock in the open market or in private transactions, subject to the Company’s assessment of market conditions and buying opportunities. The repurchases are made consistent with the terms of the Company's primary credit facilityABL Facility which limits the amount of stock that can be repurchased. The repurchase program will remain in effect until completed or until terminated by the Board of Directors.
The table below summarizes the Company's share repurchases during the fourth quarter of 2016.2018.
| Three Months Ended December 31, 2016 | |||||||||||||
Total Number of Shares Purchased | Weighted Average Price Paid per Share | Total Number of Shares Purchased as Part of Publicly Announced Programs | Maximum Dollar Value that May Yet Be Purchased Under the Programs | ||||||||||
| October 1, 2016—October 31, 2016 | — | $ | — | — | $ | 41,894,256 | |||||||
| November 1, 2016—November 30, 2016 | — | $ | — | $ | 41,894,256 | ||||||||
| December 1, 2016—December 31, 2016 | 934 | $ | 11.98 | 934 | $ | 41,883,066 | |||||||
| Total | 934 | $ | 11.98 | 934 | $ | 41,883,066 | |||||||
| Three Months Ended December 31, 2018 | |||||||||||||||||||||
Total Number of Shares Purchased | Weighted Average Price Paid per Share | Total Number of Shares Purchased as Part of Publicly Announced Programs | Maximum Dollar Value that May Yet Be Purchased Under the Programs | ||||||||||||||||||
| (in thousands, except per share data) | |||||||||||||||||||||
| October 1, 2018—October 31, 2018 | — | $ | — | — | $ | 49,801 | |||||||||||||||
| November 1, 2018—November 30, 2018 | — | $ | — | — | $ | 49,801 | |||||||||||||||
| December 1, 2018—December 31, 2018 | 4,833 | $ | 17.13 | 4,833 | $ | 49,719 | |||||||||||||||
| Total | 4,833 | $ | 17.13 | 4,833 | $ | 49,719 | |||||||||||||||
During 2016,2018, the Company repurchased approximately 572,0001,412,000 shares of its common stock under the 2014 repurchase programRepurchase Program and 2018 Repurchase Program at an average cost per share of $8.99$15.90 for a total cost of $5.1$22.5 million. Included in these repurchasesamounts are $6.1 million of shares the Company acquiredwithheld to satisfy the Company's tax withholding obligations in connection with the vesting and settlement of employee restricted stock unit awards. The Company’s repurchases of shares of common stock are recorded at cost and result in a reduction of shareholders’ equity. As of December 31, 2016,2018, the total amount remaining under the repurchase authorization2018 Repurchase Program was $41.9$49.7 million.
Item 6. Selected Financial Data
The following statements of operations data and balance sheet data for the five years ended December 31, 20162018 were derived from the Company’s audited consolidated financial statements. Consolidated balance sheets at December 31, 20162018 and 20152017 and the related consolidated statements of operations and cash flows for each of the three years in the period ended December 31, 20162018 and notes thereto appear elsewhere in this report. The following data should be read in conjunction with the annual consolidated financial statements, related notes and other financial information.
| Years Ended December 31, | Years Ended December 31, | |||||||||||||||||||||||||||||||||||||
2016(1)(2)(3) | 2015(4) | 2014(4) | 2013(4)(6) | 2012(4)(6)(7)(8) | 2018(1) | 2017(2)(3)(5) | 2016(4)(5)(6) | 2015(7) | 2014(7) | |||||||||||||||||||||||||||||
| Statement of Operations Data: | (In thousands, except per share data) | (In thousands, except per share data) | ||||||||||||||||||||||||||||||||||||
| Net sales | $ | 871,192 | $ | 843,794 | $ | 886,945 | $ | 842,801 | $ | 834,065 | $ | 1,242,834 | $ | 1,048,736 | $ | 871,192 | $ | 843,794 | $ | 886,945 | ||||||||||||||||||
| Cost of sales | 486,181 | 486,161 | 529,019 | 528,043 | 585,897 | 664,465 | 568,288 | 486,181 | 486,161 | 529,019 | ||||||||||||||||||||||||||||
| Gross profit | 385,011 | 357,633 | 357,926 | 314,758 | 248,168 | 578,369 | 480,448 | 385,011 | 357,633 | 357,926 | ||||||||||||||||||||||||||||
| Selling, general and administrative expenses | 307,525 | 297,477 | 295,893 | 294,583 | 334,861 | 409,175 | 365,043 | 307,525 | 297,477 | 295,893 | ||||||||||||||||||||||||||||
| Research and development expenses | 33,318 | 33,213 | 31,285 | 30,937 | 29,542 | 40,752 | 36,568 | 33,318 | 33,213 | 31,285 | ||||||||||||||||||||||||||||
| Income (loss) from operations | 44,168 | 26,943 | 30,748 | (10,762 | ) | (116,235 | ) | |||||||||||||||||||||||||||||||
| Income from operations | 128,442 | 78,837 | 44,168 | 26,943 | 30,748 | |||||||||||||||||||||||||||||||||
| Interest income | 621 | 388 | 438 | 558 | 550 | 594 | 454 | 621 | 388 | 438 | ||||||||||||||||||||||||||||
| Interest expense | (2,368 | ) | (8,733 | ) | (9,499 | ) | (9,123 | ) | (5,513 | ) | (5,543 | ) | (4,365 | ) | (2,368 | ) | (8,733 | ) | (9,499 | ) | ||||||||||||||||||
| Gain on sale of investments in golf-related ventures | 17,662 | — | — | — | — | — | — | 17,662 | — | — | ||||||||||||||||||||||||||||
| Other income (expense), net | (1,690 | ) | 1,465 | (48 | ) | 6,005 | 3,152 | 7,779 | (6,871 | ) | (1,690 | ) | 1,465 | (48 | ) | |||||||||||||||||||||||
| Income (loss) before income taxes | 58,393 | 20,063 | 21,639 | (13,322 | ) | (118,046 | ) | |||||||||||||||||||||||||||||||
| Income before income taxes | 131,272 | 68,055 | 58,393 | 20,063 | 21,639 | |||||||||||||||||||||||||||||||||
| Income tax (benefit) provision | (132,561 | ) | 5,495 | 5,631 | 5,599 | 4,900 | 26,018 | 26,388 | (132,561 | ) | 5,495 | 5,631 | ||||||||||||||||||||||||||
| Net income (loss) | 190,954 | 14,568 | 16,008 | (18,921 | ) | (122,946 | ) | |||||||||||||||||||||||||||||||
| Dividends on convertible preferred stock | — | — | — | 3,332 | 8,447 | |||||||||||||||||||||||||||||||||
| Net income | 105,254 | 41,667 | 190,954 | 14,568 | 16,008 | |||||||||||||||||||||||||||||||||
| Less: Net income attributable to non-controlling interests | $ | 1,054 | $ | — | $ | — | $ | — | $ | — | 514 | 861 | 1,054 | — | — | |||||||||||||||||||||||
| Net income (loss) allocable to common shareholders | $ | 189,900 | $ | 14,568 | $ | 16,008 | $ | (22,253 | ) | $ | (131,393 | ) | ||||||||||||||||||||||||||
| Earnings (loss) per common share: | ||||||||||||||||||||||||||||||||||||||
| Net income allocable to common shareholders | $ | 104,740 | $ | 40,806 | $ | 189,900 | $ | 14,568 | $ | 16,008 | ||||||||||||||||||||||||||||
| Earnings per common share: | ||||||||||||||||||||||||||||||||||||||
| Basic | $ | 2.02 | $ | 0.18 | $ | 0.21 | $ | (0.31 | ) | $ | (1.96 | ) | $ | 1.11 | $ | 0.43 | $ | 2.02 | $ | 0.18 | $ | 0.21 | ||||||||||||||||
| Diluted | $ | 1.98 | $ | 0.17 | $ | 0.20 | $ | (0.31 | ) | $ | (1.96 | ) | $ | 1.08 | $ | 0.42 | $ | 1.98 | $ | 0.17 | $ | 0.20 | ||||||||||||||||
| Dividends paid per common share | $ | 0.04 | $ | 0.04 | $ | 0.04 | $ | 0.04 | $ | 0.04 | $ | 0.04 | $ | 0.04 | $ | 0.04 | $ | 0.04 | $ | 0.04 | ||||||||||||||||||
| December 31, | December 31, | |||||||||||||||||||||||||||||||||||||
2016(1)(2)(3)(5) | 2015(4)(5) | 2014(4) | 2013(4)(6) | 2012(4)(6)(7) | 2018 | 2017(2)(3)(5) | 2016(4)(5)(6)(8) | 2015(7)(8) | 2014(7) | |||||||||||||||||||||||||||||
| Balance Sheet Data: | (In thousands) | (In thousands) | ||||||||||||||||||||||||||||||||||||
| Cash and cash equivalents | $ | 125,975 | $ | 49,801 | $ | 37,635 | $ | 36,793 | $ | 52,003 | $ | 63,981 | $ | 85,674 | $ | 125,975 | $ | 49,801 | $ | 37,635 | ||||||||||||||||||
| Working capital | $ | 273,571 | $ | 212,851 | $ | 199,905 | $ | 195,407 | $ | 225,430 | $ | 221,669 | $ | 151,610 | $ | 273,571 | $ | 212,851 | $ | 199,905 | ||||||||||||||||||
| Total assets | $ | 801,282 | $ | 631,224 | $ | 624,811 | $ | 663,863 | $ | 637,636 | $ | 1,052,944 | $ | 991,157 | $ | 801,282 | $ | 631,224 | $ | 624,811 | ||||||||||||||||||
| Long-term liabilities | $ | 5,828 | $ | 39,643 | $ | 149,149 | $ | 153,048 | $ | 154,362 | $ | 15,399 | $ | 17,408 | $ | 5,828 | $ | 39,643 | $ | 149,149 | ||||||||||||||||||
| Total Callaway Golf Company shareholders’ equity | $ | 598,906 | $ | 412,945 | $ | 291,534 | $ | 284,619 | $ | 318,990 | $ | 724,574 | $ | 649,631 | $ | 598,906 | $ | 412,945 | $ | 291,534 | ||||||||||||||||||
| (1) | In January 2019, the Company completed the acquisition of Jack Wolfskin. The Company's consolidated statement of operations includes the recognition $3.7 million in transaction costs, which was recorded in general and administrative expenses, offset by an unrealized gain of $4.4 million recorded in other income from the re-measurement of a foreign currency forward contract that was put in place to mitigate the risk of foreign currency fluctuations on the purchase price, which was denominated in Euros. In January 2019, the Company realized a $3.6 million net loss upon the settlement of this contract. For further discussion, see Note 4 "Business Combinations" in the Notes to the Consolidated Financial Statements in this Form 10-K. |
| (2) | In 2017, the Company completed the acquisitions of OGIO and TravisMathew. The Company's consolidated statement of operations includes the recognition of $3.1 million and $2.4 million in transaction and transition costs for OGIO and TravisMathew, respectively. The Company's consolidated balance sheet includes the addition of $66.0 million and $124.6 million in total net assets related to OGIO and TravisMathew, respectively. |
| (3) | In December 2017, the Tax Act was enacted into legislation, which includes a broad range of provisions affecting businesses. The Tax Act significantly revises how companies compute their U.S corporate tax liability by, among other provisions, reducing the corporate tax rate from 35% to 21% for tax years beginning after December 31, 2017. Pursuant to the Tax Act, the Company recorded net tax expense of $7.5 million, which was comprised of $11.1 million of income tax expense related to the revaluation of deferred tax assets, partially offset by a tax benefit of $3.6 million as a result of the mandatory deemed repatriation on earnings and profits of U.S.-owned foreign subsidiaries. For further discussion see Note 11 "Income Taxes" in the Notes to the Consolidated Financial Statements in this Form 10-K. |
| (4) | The Company's tax provision, total assets and long-term liabilities were significantly impacted in 2016 by the reversal of the Company's valuation allowance on its U.S. deferred tax assets. In the fourth quarter of 2016, the Company performed an analysis to determine the realization of its deferred tax assets and concluded that it was more likely than not that the majority of its U.S. deferred tax assets will be realized, which resulted in a one-time, non-cash benefit of $156.6 million related to the reversal of the Company's valuation allowance on its U.S. deferred tax assets. This reversal was partially offset by the recognition of $16.0 million in income taxes that were retroactive for all of 2016 on the Company's U.S. business. For further discussion see Note |
| In July 2016, the Company contributed $10.6 million, primarily in cash, for a 52% ownership of the new joint venture, Callaway Apparel K.K. (see Note |
| In April 2016, the Company sold approximately 10.0% or $5.8 million (on a cost basis) of its preferred shares in Topgolf for $23.4 million, and recognized a gain of approximately $17.7 million in other income (expense) during the second quarter of 2016. See Note |
| In August 2012, the Company issued $112.5 million of 3.75% Convertible Senior Notes (the “convertible notes”) in exchange for cash and 0.6 million shares of the Company’s then-outstanding 7.50% Series B Cumulative Perpetual Convertible Preferred Stock in separate, privately negotiated exchange transactions. During the second half of 2015, the convertible notes were eliminated pursuant to certain exchange transactions and shareholder conversions, which resulted, among other things, in the issuance of approximately 15.0 million shares of common stock to the note holders (see Note |
28
| In December 2015, the Company early adopted Accounting Standards Update No 2015-17, "Income Taxes (Topic 740): Balance Sheet Classification of Deferred Taxes." This update eliminates the current requirement for organizations to present deferred tax liabilities and assets as current and noncurrent in a classified balance sheet, and instead classify all deferred tax assets and liabilities as noncurrent. The adoption of this update was made on a prospective basis as of December 31, 2015, and therefore working capital and long-term liabilities in 2015 as well as 2016 are not comparable to prior periods presented. |
Item 7. Management’s Discussion and Analysis of Financial Condition and Results of Operations
The following discussion should be read in conjunction with the Consolidated Financial Statements, the related notes and the section “Important Notice to Investors Regarding Forward-Looking Statements” that appear elsewhere in this report.
Critical Accounting Policies and Estimates
The Company’s discussion and analysis of its results of operations, financial condition and liquidity are based upon the Company’s consolidated financial statements, which have been prepared in accordance with accounting principles generally accepted in the United States ("GAAP)GAAP"). The preparation of these financial statements requires the Company to make estimates and judgments that affect the reported amounts of assets, liabilities, shareholders’ equity, sales and expenses, as well as related disclosures of contingent assets and liabilities. The Company bases its estimates on historical experience and on various other assumptions that management believes to be reasonable under the circumstances. Actual results may materially differ from these estimates under different assumptions or conditions. On an ongoing basis, the Company reviews its estimates to ensure that the estimates appropriately reflect changes in its business and new information as it becomes available.
Management believes the critical accounting policies discussed below affect its more significant estimates and assumptions used in the preparation of its consolidated financial statements. For a complete discussion of all of the Company’s significant accounting policies, see Note 2 “Summary of Significant Accounting Policies” in the Notes to Consolidated Financial Statements in this Form 10-K.
Revenue Recognition
The Company recognizes revenue from the sale of its products when it satisfies the terms of a sales order from a customer, and transfers control of the products ordered to the customer. Control transfers at a point in time when products are shipped, and in certain cases, when products are received by customers. In addition, the Company recognizes revenue at the point of sale on transactions with consumers at its retail locations. Royalty income is recognized over time in net sales as underlying product sales occur, subject to certain minimum royalties, in accordance with the related licensing arrangements and is included in the Company's Gear, Accessories and Other operating segment. Revenues from gift cards are deferred and recognized when the cards are redeemed. The Company’s gift cards have no expiration date. The Company recognizes revenue from unredeemed gift cards, otherwise known as breakage, when the likelihood of redemption becomes remote and under circumstances that comply with any applicable state escheatment laws.
The amount of revenue the Company recognizes is based on the amount of consideration it expects to receive from customers. The amount of consideration is the sales price adjusted for estimates of variable consideration, including sales returns, discounts and allowances as well as sales programs, sales promotions and price concessions that are offered by the Company as described below. These estimates are based on the amounts earned or to be claimed by customers on the related sales, and are therefore recorded as reductions to sales and trade accounts receivable.
The Company’s primary sales program, the “Preferred Retailer Program,” offers potential rebates and discounts, for participating retailers in exchange for providing certain benefits to the Company, including the maintenance of agreed upon inventory levels, prime product placement and retailer staff training. Under this program, qualifying retailers can earn either discounts or rebates based upon the amount of product purchased. Discounts are applied and recorded at the time of sale. For rebates, the Company estimates the amount of variable consideration related to the rebate at the time of sale based on the customer’s estimated qualifying current year product purchases. The estimate is based on the historical level of purchases, adjusted for any factors expected to affect the current year purchase levels. The estimated year-end rebate is adjusted quarterly based on actual purchase levels, as necessary. The Preferred Retailer Program is generally short-term in nature and the actual amount of rebate to be paid under this program is known as of the end of the year and paid to customers shortly after year-end. Historically, the Company's actual amount of variable consideration related to its Preferred Retailer Program has not been materially different from its estimates.
30
The Company also offers short-term sales program incentives, which include sell-through promotions and price concessions or price reductions. Sell-through promotions are generally offered throughout a product's life cycle of approximately two years, and price concessions or price reductions are generally offered at the end of a product's life cycle. The estimated variable consideration related to these programs is based on a rate that includes historical and forecasted data. The Company records a reservereduction to net sales using this rate at the time of the sale. The Company monitors this rate against actual results and forecasted estimates, and adjusts the rate as deemed necessary in order to reflect the amount of consideration it expects to receive from its customers. There were no material changes to the rate during the twelve months ended December 31, 2018, and the Company's actual amount of variable consideration related to these sales programs has historically not been materially different from its estimates. However, if the actual variable consideration is significantly different than the accrued estimates, the Company may be exposed to adjustments to revenue that could be material. Assuming there had been a 10% increase over the accrued estimated variable consideration for 2018 sales program incentives, pre-tax income for the year ended December 31, 2018 would have decreased by approximately $2.0 million.
The Company records an estimate for anticipated returns throughas a reduction of sales and cost of sales, and accounts receivable in the period that the related sales are recorded. Sales returns are estimated based upon historical returns, current economic trends, changes in customer demands and sell-through of products. In addition, from time to time, theThe Company also offers its customers sales programs that allow for specific returns. The Company records a reservereturn liability for anticipated returns related to these sales programs at the time of the sale based on the terms of the sales program. Historically, the Company’s actual sales returns have not been materially different from management’s original estimates. The Company does not believe there is a reasonable likelihood that there will be a material change in the future estimates or assumptions used to calculate the allowance for sales returns. However, if the actual costs of sales returns are significantly different than the recorded estimated allowance, the Company may be exposed to losses or gains that could be material. Assuming there had been a 10% increase over the recorded estimated allowance for 20162018 sales returns, pre-tax income for the year ended December 31, 20162018 would have decreased by approximately $0.9$2.5 million.
Allowance for Doubtful Accounts
The Company maintains an allowance for estimated losses resulting from the failure of its customers to make required payments. An estimate of uncollectible amounts is made by management based upon historical bad debts, current customer receivable balances, age of customer receivable balances, the customer’s financial condition and current economic trends, all of which are subject to change. If the actual uncollected amounts significantly exceed the estimated allowance, the Company’s operating results would be significantly adversely affected. Assuming there had been a 10% increase in uncollectible accounts over the 20162018 recorded estimated allowance for doubtful accounts, pre-tax income for the year ended December 31, 20162018 would have decreased by approximately $0.6 million.
Inventories
Inventories are valued at the lower of cost or fair marketnet realizable value. Cost is determined using the first-in, first-out (FIFO) method. The inventory balance, which includes material, labor and manufacturing overhead costs, is recorded net of an estimated allowance for obsolete or unmarketable inventory. The estimated allowance for obsolete or unmarketable inventory is based upon current inventory levels, sales trends and historical experience as well as management’s understanding of market conditions and forecasts of future product demand, all of which are subject to change.
The calculation of the Company’s allowance for obsolete or unmarketable inventory requires management to make assumptions and to apply judgment regarding inventory aging, forecasted consumer demand and pricing, regulatory (USGA and R&A) rule changes, the promotional environment and technological obsolescence. The Company does not believe there is a reasonable likelihood that there will be a material change in the future estimates or assumptions used to calculate the allowance. However, if estimates regarding consumer demand are inaccurate or changes in technology affect demand for certain products in an unforeseen manner,change, the Company may need to increase its inventory allowance, which could significantly adversely affect the Company’s operating results. Assuming there had been a 10% increase in obsolete or unmarketable inventory over the 20162018 recorded estimated allowance for obsolete or unmarketable inventory, pre-tax income for the year ended December 31, 20162018 would have decreased by approximately $1.7$1.5 million.
Long-Lived Assets, Goodwill and Non-Amortizing Intangible Assets
In the normal course of business, the Company acquires tangible and intangible assets. The Company periodically evaluates the recoverability of the carrying amount of its long-lived assets, including property, plant and equipment and amortizing intangible assets, and investments whenever events or changes in circumstances indicate that the carrying amount of the asset may not be fully recoverable or exceeds its fair value. The Company evaluates the recoverability of its goodwill and non-amortizing intangible
31
assets at least annually or more frequently whenever indicators are present that the carrying amounts of these assets may not be fully recoverable. Determining whether an impairment has occurred typically requires various estimates and assumptions, including determining the amount of undiscounted cash flows directly related to the potentially impaired asset, the useful life over which cash flows will occur, the timing of the impairment test, and the asset’s residual value, if any.
To determine fair value, the Company uses its internal cash flow estimates discounted at an appropriate rate, quoted market prices, royalty rates when available and independent appraisals as appropriate. Any required impairment loss is measured as the amount by which the carrying amount of the asset exceeds its fair value and is recorded as a reduction in the carrying value of the asset and a charge to earnings.
The Company uses its best judgment based on current facts and circumstances related to its business when making these estimates. However, if actual results are not consistent with the Company’s estimates and assumptions used in calculating future cash flows and asset fair values, the Company may be exposed to losses that could be material. The Company completed its annual impairment test and fair value analysis of goodwill and other indefinite-lived intangible assets as of December 31, 2016,2018, and the estimated fair values of the Company’s reporting units, in the United States, United Kingdom, Canada and Korea, as well as the estimated fair values of certain trade names and trademarks, significantly exceeded their carrying values. As a result, no impairment was recorded as of December 31, 2016.
2018.
Warranty Policy
The Company has a stated two-year warranty policy for its golf clubs. The Company’s policy is to accrue the estimated cost of satisfying future warranty claims at the time the sale is recorded. In estimating its future warranty obligations, the Company considers various relevant factors, including the Company’s stated warranty policies and practices, the historical frequency of claims, and the cost to replace or repair its products under warranty.
The Company’s estimates for calculating the warranty reserve are principally based on assumptions regarding the warranty costs of each club product line over the expected warranty period. Where little or no claims experience may exist, the Company’s warranty obligation calculation is based upon long-term historical warranty rates of similar products until sufficient data is available. As actual model-specific rates become available, the Company’s estimates are modified to ensure that the forecast is within the range of likely outcomes.
Historically, the Company’s actual warranty claims have not been materially different from management’s original estimated warranty obligation. The Company does not believe there is a reasonable likelihood that there will be a material change in the future estimates or assumptions used to calculate the warranty obligation. However, if the number of actual warranty claims or the cost of satisfying warranty claims were to significantly exceed the estimated warranty reserve, the Company may be exposed to losses that could be material. Assuming there had been a 10% increase in warranty claims over the 20162018 recorded estimated allowance for warranty obligations, pre-tax income for the year ended December 31, 20162018 would have decreased by approximately $0.5$0.8 million.
Income Taxes
Current income tax expense or benefit is the amount of income taxes expected to be payable or receivable for the current year. A deferred income tax asset or liability is established for the difference between the tax basis of an asset or liability computed pursuant to ASC Topic 740 "Income Taxes," and its reported amount in the financial statements that will result in taxable or deductible amounts in future years when the reported amount of the asset or liability is recovered or settled, respectively. TheIn accordance with the applicable accounting rules, the Company maintains a valuation allowance for a deferred tax asset when it is deemed to be more likely than not that some or all of the deferred tax assetassets will not be realized. In evaluating whether a valuation allowance is required under such rules, the Company considers all available positive and negative evidence, including prior operating results, the nature and reason for any losses, its forecast of future taxable income, and the dates on which any deferred tax assets are expected to expire. These assumptions require a significant amount of judgment.judgment, including estimates of future taxable income. These estimates are based on the Company’s best judgment at the time made based on current and projected circumstances and conditions. In 2011, as a result of this evaluation, the Company recorded a valuation allowance against its U.S. deferred tax assets. During the fourth quarter of 2016, the Company reversed a significant portion of the valuation allowance on those deferred tax assets. For further discussioninformation, see Note 911 “Income Taxes” in the Notes to Consolidated Financial Statements in this Form 10-K.Taxes.”
Pursuant to ASC Topic 740-25-6, the Company is required to accrue for the estimated additional amount of taxes for uncertain tax positions if it is deemed to be more likely than not that the Company would be required to pay such additional taxes. The Company is required to file federal and state income tax returns in the United States and various other income tax returns in foreign jurisdictions. The preparation of these income tax returns requires the Company to interpret the applicable tax laws and regulations in effect in such jurisdictions, which could affect the amount of tax paid by the Company. The Company accrues an amount for its estimate of additional tax liability, including interest and penalties in income tax expense, for any uncertain tax positions taken
32
or expected to be taken in an income tax return. The Company reviews and updates the accrual for uncertain tax positions as more definitive information becomes available. Historically, additional taxes paid as a result of the resolution of the Company’s uncertain tax positions have not been materially different from the Company’s expectations. The Company recognizes interest and/or penalties related to income tax matters in income tax expense. For further information, see Note 11 “Income Taxes.”
In December 2017, the U.S. government enacted comprehensive tax legislation referred to as the Tax Cuts and Jobs Act (the "Tax Act"). Shortly after the Tax Act was enacted, the SEC issued Staff Accounting Bulletin No. 118, Income Tax Accounting Implications of the Tax Cuts and Jobs Act ("SAB 118"), which provides guidance on accounting for the Tax Act’s impact. SAB 118 provides a measurement period, during which a company acting in good faith may complete the accounting for the impacts of the Tax Act under ASC Topic 740. The measurement period began in the reporting period that includes the Tax Act’s enactment date and ended when the Company obtained, prepared, and analyzed the information that was needed in order to complete the accounting requirements under ASC Topic 740. The Company provided a reasonable estimate for the impact of the Tax Act for the year ended December 31, 2017. The measurement period ended on December 22, 2018 and the Company recorded additional expense of $0.9 million related to the transition tax. No other significant adjustments were made relating to the Act. Additionally, the Company has elected to treat global intangible low taxed income (GILTI) as a period cost and will expense GILTI in the period it is incurred. For further information, see Note 11 “Income Taxes” in the Notes to Consolidated Financial Statements in this Form 10-K.
Share-based Compensation
The Company grants stock options, stock appreciation rights, restricted stock awards, restricted stock units, performance share units and other equity-based awards to the Company’s officers, employees, consultants and certain other non-employees who provide services to the Company. The Company accounts for share-based compensation arrangements in accordance with ASC Topic 718, “Stock Compensation,” which requires the measurement and recognition of compensation expense for all share-based payment awards to employees and non-employees based on estimated fair values. ASC Topic 718 further requires a reduction in share-based compensation expense by an estimated forfeiture rate. The forfeiture rate used by the Company is based on historical
forfeiture trends. If actual forfeitures are not consistent with the Company’s estimates, the Company may be required to increase or decrease compensation expenses in future periods.
Performance share units are stock-based awards in which the number of shares ultimately received depends on the Company's performance against specified goals that are measured over a designated performance period from the date of grant. These performance goals are established by the Company at the beginning of the performance period. At the end of the performance period, the number of shares of stock that could be issued is fixed based upon the degree of achievement of the performance goals. The number of shares that could be issued can range from 0% to 200% of the participant's target award. Performance share units are initially valued at the Company's closing stock price on the date of grant. Compensation expense, net of estimated forfeitures, is recognized over the vesting period and will vary based on the anticipated performance level during the performance period. If the performance goals are not probable of achievement during the performance period, compensation expense would be reversed. The awards are canceled if the performance goals are not achieved as of the end of the performance period. The performance units vest in full at the end of a three-year period.
The Company uses the Black-Scholes option valuation model to estimate the fair value of its stock options and stock appreciation rights (“SARs”) at the date of grant. The Black-Scholes option valuation model requires the inputAs of highly subjective assumptions including the Company’s expectedDecember 31, 2018, all stock price volatility, the expected dividend yield, the expected term of an option or SARoptions were fully vested and the risk-free interest rate, which is based on the U.S. Treasury yield curve in effect at the time of grant.all SARs were fully settled. The Company uses historical data to estimatedid not grant stock options or SARs in the expected price volatility and the expected term. The Company uses forecasted dividends to estimate the expected dividend yield. Changes in subjective input assumptions can materially affect the fair value estimates of an optionyears ended December 31, 2018, 2017 or SAR. Furthermore, the estimated fair value of an option or SAR does not necessarily represent the value that will ultimately be realized by an employee. Compensation expense is recognized on a straight-line basis over the vesting period for stock options. Compensation expense for SARs is recognized on a straight-line basis over the vesting period based on an award’s estimated fair value, which is remeasured at the end of each reporting period. Once vested, SARs continued to be remeasured to fair value until they are exercised.2016.
The Company records compensation expense for restricted stock awards and restricted stock units (collectively “restricted stock”) based on the estimated fair value of the award on the date of grant. The estimated fair value is determined based on the closing price of the Company’s common stock on the date of grant multiplied by the number of shares underlying the award. Compensation expense is recognized on a straight-line basis over the vesting period, reduced by an estimated forfeiture rate.
A significant portion of the Company’s business is conducted outside of the United States in currencies other than the U.S. dollar. As a result, changes in foreign currency exchange rates can have a significant effect on the Company’s financial results. Revenues and expenses that are denominated in foreign currencies are translated using the average exchange rate for the period. Assets and liabilities are translated at the rate of exchange on the balance sheet date. Gains and losses from assets and liabilities denominated in a currency other than the functional currency of the entity on which they reside are generally recognized currently
33
in the Company's statements of operations. Gains and losses from translation of foreign subsidiary financial statements into U.S. dollars are included in accumulated other comprehensive income or loss.
As part of the Company's overall strategy to manage its level of exposure to the risk of fluctuations in foreign currency exchange rates, the Company enters into foreign currency forward contracts. While these foreign currency forward contracts can mitigate the effects of changes in foreign currency exchange rates, they do not eliminate those effects, which can be significant. For all contracts that qualify as cash flow hedges, the Company records gains and losses in other comprehensive income or loss. These gains and losses are released from other comprehensive income or loss and recognized in net sales or cost of goods sold in the period in which the underlying hedged transaction is recognized. Gains and losses on derivatives that are not elected for hedge accounting treatment or that do not meet hedge accounting requirements are recorded immediately in other income (expense).
Recent Accounting Pronouncements
Information regarding recent accounting pronouncements is contained in Note 2 “Summary of Significant Accounting Policies” in the Notes to Consolidated Financial Statements in this Form 10-K, which is incorporated herein by this reference.
Discussion of Non-GAAP Measures
In addition to the financial results contained in this report, which have been prepared and presented in accordance with GAAP, the Company has also included supplemental information concerning the Company’s financial results on a non-GAAP basis. This non-GAAP information includes certain of the Company’s financial results on a constant currency basis.basis for the comparative years ended December 31, 2018 and 2017. This constant currency information estimates what the Company’s financial results would have been without changes in foreign currency exchange rates. This information is calculated by taking the current period local currency results for 2018 and translating them into U.S. Dollarsdollars based upon the foreign currency exchange rates for the applicable comparable prior period. It does not include any other effect of changes in foreign currency rates on the Company’sCompany's results or business. ThisIn addition, this non-GAAP information also includes certain of the Company's financial results excludingwithout transaction costs and transition costs associated with the Jack Wolfskin acquisition for the year ended December 31, 2018, transaction and transition costs associated with the OGIO and TravisMathew acquisitions as well as the impact of the new tax legislation for the year ended December 31, 2017, and it excludes the effects of the reversal of the deferred tax valuation allowance and the gain on the sale of a portion of the Company's Topgolf investment.investment for the year ended December 31, 2016.
The Company has included in this report information to reconcile this non-GAAP information to the most directly correlatedcomparable GAAP information. The non-GAAP information presented in this report should not be considered in isolation or as a substitute for any measure derived in accordance with GAAP. The non-GAAP information may also be inconsistent with the manner in which similar measures are derived or used by other companies. Management uses such non-GAAP information for financial and operational decision-making purposes and as a means to evaluate period over period comparisons of the underlying performance of its business and in forecasting the Company’s business going forward. Management believes that the presentation of such non-GAAP information, when considered in conjunction with the most directly comparable GAAP information, provides additional useful comparative information for investors in their assessment of the underlying performance of the Company’s business.
Results of Operations
Overview of Business, Seasonality and Foreign Currency
The Company designs, manufactures and sells a full line of high quality golf equipment, including golf clubs and golf balls, golf bags and other golf-related accessories.balls. The Company designs its golf products to be technologically advanced and in this regard invests a considerable amount in research and development each year. The Company’sCompany designs its golf products are designed for golfers of all skill levels, both amateur and professional.
34
outdoor categories. The Company's soft goods under the Callaway, OGIO, TravisMathew and Jack Wolfskin brands are designed and developed internally.
Operating and Reportable Segments
As of December 31, 2018, the Company has twothree operating and reportable operating segments, that are organized on the basis of products, namely the golf clubs segmentGolf Clubs, Golf Balls and golf balls segment.Gear, Accessories and Other. The golf clubsGolf Clubs operating segment consists of Callaway Golf woods, hybrids, irons and wedges, and Odyssey putters, including Toulon Design putters. Thisputters by Odyssey, packaged sets and sales of pre-owned golf clubs. At the product category level, sales of packaged sets are included within irons, and sales of pre-owned golf clubs are included in the respective woods, irons and putters product categories. The Golf Balls operating segment also includes packaged sets,consists of Callaway Golf and Strata golf balls that are designed, manufactured and sold by the Company. The Gear, Accessories and Other operating segment consists of soft goods products, which include golf apparel and footwear, golf bags, golf gloves, golf footwear, golf apparel, travel gear, headwear towels, umbrellas, eyewear and other golf-related accessories, as well asOGIO and TravisMathew branded products, and royalties from licensing of the Company’s trademarks and service marks for various soft goods products. Due to the recent acquisition of Jack Wolfskin in January 2019, the Company is anticipating significant growth in its soft goods business, and as well as salessuch, it will be evaluating its global business platform, including its management structure, operations, supply chain and distribution, which may result in changes in the composition of pre-owned golf clubs. The golf balls segment consists of Callaway Golfits operating and Strata balls that are designed, manufactured and sold by the Company. reportable segments.
As discussed in Note 1618 “Segment Information” in the Notes to Consolidated Financial Statements in this Form 10-K, the Company’s operating segments exclude a significant amount of corporate general administrative expenses and other income (expense) not utilized by management in determining segment profitability.
Cost of Sales.Sales
The Company’s cost of sales is comprised primarily of material and component costs, distribution and warehousing costs, and overhead. A large percentageAs a result of the actions taken to improve manufacturing efficiencies, over 85% of the Company's manufacturing costs, primarily material and component costs, are variable in nature and will fluctuate with sales volumes. With respect to the Company's operating segments, variable costs for golf clubs represent approximately 85% to 95%as a percentage of cost of sales and for golf balls, approximately 75% to 85%. Of these variable costs, material and component costs represent approximatelyrange between 85% to 95% for golf clubsGolf Clubs and approximately 75% to 85% for golf balls. On a consolidated basis, over 85%Golf Balls. Variable costs for Gear, Accessories and Other are generally greater than 95% as fewer fixed costs are used in the manufacturing of total cost of sales is variable in nature, and of this amount, over 85% is comprised of material and component costs.the Company's soft goods products. Generally, the relative significance of the components of cost of sales does not vary materially from these percentages from period to period. See "Years Ended December 31, 20162018 and 2015 - 2017—Segment Profitability" and "Years Ended December 31, 20152017 and 2014 - 2016—Segment Profitability" below for further discussion of gross margins.
Golf Club and Golf Balls
In most of the regions where the Company doesconducts business, the game of golf is played primarily on a seasonal basis. Weather conditions generally restrict golf from being played year-round, except in a few markets, with many of the Company’s on-course customers closing for the cold weather months. The Company’s business isgolf club and golf ball businesses are therefore subject to seasonal fluctuations. In general, during the first quarter, the Company begins selling its golf club and golf ball products into the golf retail channel for the new golf season. This initial sell-in generally continues into the second quarter. The Company’s second-quarterSecond-quarter sales are significantly affected by the amount of reorder business of the products sold during the first quarter. The Company’s third-quarterThird-quarter sales are generally
dependent on reorder business but are generally lesscan also include smaller new product launches, typically resulting in lower sales than the second quarter as many retailers begin decreasing their inventory levels in anticipation of the end of the golf season. The Company’s fourth-quarterFourth-quarter sales are generally less than the other quarters due to the end of the golf season in many of the Company’s key markets.regions. However, third-quarter sales can be affected by a mid-year product launch, and fourth-quarter sales can be affected from time to time by the early launch of product introductions related to the new golf season of the subsequent year. This seasonality, and therefore quarter-to-quarter fluctuations, can be affected by many factors, including the timing of new product introductions as well as weather conditions. BecauseIn general, because of this seasonality, a majority of the Company’s sales from its Golf Clubs and Golf Balls operating segments and most, if not all, of its profitability from these segments generally occurs during the first half of the year.
35
Gear, Accessories and Other
Sales of the Company's golf gear and accessories generally follow the same seasonality as golf clubs and golf balls, and are therefore generally higher during the first half of the year when the game of golf is mostly played. Golf apparel sales are higher in the third and fourth quarters due to a strong fall/winter season in Japan. Sales of lifestyle gear and apparel are generally higher in the second and third quarters during the spring/summer season. With the recent acquisition of Jack Wolfskin in January 2019, the Company anticipates increased sales of lifestyle outdoor apparel in the third and fourth quarters related to the fall/winter season.
Foreign Currency.Currency
A significant portion of the Company’s business is conducted outside of the United States in currencies other than the U.S. dollar. As a result, changes in foreign currency rates can have a significant effect on the Company’s financial results. The Company enters into foreign currency forward contracts to mitigate the effects of changes in foreign currency rates. While these foreign currency forward contracts can mitigate the effects of changes in foreign currency rates, they do not eliminate those effects, which can be significant. These effects include (i) the translation of results denominated in foreign currency into U.S. dollars for reporting purposes, (ii) the mark-to-market adjustments of certain intercompany balance sheet accounts denominated in foreign currencies and (iii) the mark-to-market adjustments onof the Company’s foreign currency forward contracts. In general, the Company’s overall financial results are affected positively by a weaker U.S. dollar and are affected negatively by a stronger U.S. dollar as compared to the foreign currencies in which the Company conducts its business.
Executive Summary
The product launch cadence in 2016, particularly in Asia,2018 was heavily loaded toward the Company not only continuedfirst half of the year compared to demonstrate its ability to grow market share and increase net sales, profitability and cash from operations but also began executing its strategy of investing in growth opportunities in golf and in areas tangential to golf. In 2016, the Company acquired Toulon Design putters and entered into a new apparel joint venture in Japan. These investment activities continued into 2017, when the Company completed its acquisition of OGIO International Inc. (“OGIO”), a leading manufacturer in high quality bags, accessories and apparel in the golf and lifestyle categories. This acquisition both enhanced the Company’s presence in golf and provided a platform for future growth in the lifestyle category.which affects quarterly comparisons.
The Company’s improved profitability and outlook also allowed the Company to reverseresults of operations for 2018 include a significant portion of its deferred tax valuation allowance. During the fourth quarter of 2016, the Company performed an analysis to determine the likelihood of realizing its deferred tax assets. This analysis consistedfull year of the evaluationresults of all available positiveoperations from the TravisMathew apparel business, which was acquired in August 2017.
The Company’s operating expenses for 2018 include transaction and negative evidence, includingtransition expenses related to the Jack Wolfskin acquisition completed in January 2019 of $3.7 million, and other income includes a $4.4 million gain from the re-measurement of a foreign currency forward contract that was put in place to mitigate the risk of foreign currency fluctuations on the purchase price, which was denominated in Euros. By comparison, 2017 includes transaction and transition expenses of $2.6 million and $8.8 million, respectively, related to the OGIO and TravisMathew acquisitions completed in January 2017 and August 2017, respectively.
The U.S. corporate income tax rate was reduced from 35% to 21% for tax years beginning after December 31, 2017 due to the Tax Cuts and Jobs Act (the "Tax Act") enacted in December 2017.
Due to the strength of the Company's improved profitability2018 product line led by increases in 2015irons, putters and 2016 (which resultedgolf balls, as well as in gear, accessories and other largely due to the Company having three years of cumulative income on its U.S. business as of December 31, 2016), combined with future projections of profitability. Because of this analysis, the Company concluded that it was more likely than not that the majority of its U.S. deferred tax assets will be realized, and therefore reversed mostaddition of the valuation allowance. This reversal resultedTravisMathew business in a one-time, non-cash income tax benefit of $156.6 million partially offset byAugust 2017, the recognition of $16.0 million in income taxes that were retroactive for all of 2016 on the Company’s U.S. business earnings for a net benefit of $140.6 million. For further discussion, see Note 9 "Income Taxes" to the Notes to Consolidated Financial Statements in this Form 10-K.
The Company’s gross margin for 2016in 2018 improved by 18070 basis points to 44.2%46.5% compared to 2015.45.8% in 2017. This increase was primarily due to operational efficiencies resulting from the many initiatives implemented over the last few years related to its manufacturing and supply chain functions, combined with higheran increase in average selling prices and a favorable shift in all major hard goods categories. This increase wasproduct mix, including the addition of the TravisMathew business, which is accretive to the Company's gross margins, partially offset by an increase in promotional activity comparedcost due to the same period in 2015.technology incorporated into current year products.
Operating expenses increased $10.2$48.3 million or 3.1% and were flat as a percentage of net sales12.0% in 20162018 compared to 2015. The increase in 2016 was2017, primarily relateddue to incremental expenses relatedfrom the TravisMathew business, an increase in employee costs resulting from increased headcount and inflationary pressures, higher variable expenses due to the Japan joint venture combined with increasesincrease in legal expenses relatednet sales as well as increased investments in the business to corporate development activities, partially offset bysustain the Company's growth, including investments in R&D, marketing and tour, and in the OGIO and TravisMathew businesses.
The provision for income taxes decreased $0.4 million to $26.0 million in 2018 compared to 2017, despite an increase of $63.2 million in pre-tax income to $131.3 million in 2018 compared to 2017. The decrease in the provision resulted primarily from a decrease in stock compensation expense.
Years Ended December 31, 20162018 and 20152017
Net sales for the year ended December 31, 20162018 increased $27.4$194.1 million (3.2%(18.5%) to $871.2$1,242.8 million compared to $843.8$1,048.7 million for the year ended December 31, 2015. Despite softer than anticipated market2017. This improvement was driven by an increase in net sales in all operating segments and across all major geographical regions primarily due to continued brand momentum and the strength of the Company's 2018 product line, improved industry and macroeconomic conditions, in 2016, the Company improved its market shareas well as incremental apparel sales due to the continued strength of its brand, resultingTravisMathew acquisition completed in increased sales in both the Company's golf clubs and golf balls operating segments. Overall,August 2017. In addition, net sales were favorably impacted by an increase in average selling prices across all product categories, partially offset by a declinedecrease in sales volumes. In addition, the Company'spromotions and incentives in 2018 compared to 2017. Fluctuations in foreign currencies had a favorable impact on net sales of accessories and other products were favorably impacted by the completion of its joint venture in Japan during the second quarter of 2016, resulting in the formation of Callaway Apparel KK, which has been consolidated with the Company's results since July 1, 2016. Changes in foreign currency rates were favorable to the Company's net sales in 2016. Had the Company used 2015 foreign currency exchange rates to translate net sales for 2016, the Company's net sales for 2016 would have been lower by 0.9%.$14.2 million.
The Company’s net sales by operating segment are presented below (dollars in millions):
Years Ended December 31, | Growth | Constant Currency Growth vs. 2015 | ||||||||||||||
| 2016 | 2015 | Dollars | Percent | Percent | ||||||||||||
| Net sales: | ||||||||||||||||
| Golf clubs | $ | 718.9 | $ | 700.7 | $ | 18.2 | 2.6 | % | 1.4% | |||||||
| Golf balls | 152.3 | 143.1 | 9.2 | 6.4 | % | 6.4% | ||||||||||
| $ | 871.2 | $ | 843.8 | $ | 27.4 | 3.2 | % | 2.3% | ||||||||
Years Ended December 31, | Growth | |||||||||||||
| 2018 | 2017 | Dollars | Percent | |||||||||||
| Net sales: | ||||||||||||||
| Golf Clubs | $ | 717.3 | $ | 643.1 | $ | 74.2 | 11.5 | % | ||||||
| Golf Balls | 195.6 | 162.5 | 33.1 | 20.4 | % | |||||||||
| Gear, Accessories and Other | 329.9 | 243.1 | 86.8 | 35.7 | % | |||||||||
| $ | 1,242.8 | $ | 1,048.7 | $ | 194.1 | 18.5 | % | |||||||
For further discussion of each operating segment’s results, see “Golf Clubs Segment”"Operating Segment Results for the Years Ended December 31, 2018 and “Golf Balls Segment” results2017" below.
Net sales information by region is summarized as follows (dollars in millions):
Years Ended December 31, | Growth / (Decline) | Constant Currency Growth/(Decline) vs. 2015 | Years Ended December 31, | Growth | Constant Currency Growth vs. 2017 | |||||||||||||||||||||||||||
| 2016 | 2015 | Dollars | Percent | Percent | 2018 | 2017(1) | Dollars | Percent | Percent | |||||||||||||||||||||||
| Net sales: | ||||||||||||||||||||||||||||||||
| United States | $ | 447.6 | $ | 446.5 | $ | 1.1 | 0.2 | % | 0.2% | $ | 706.3 | $ | 564.6 | $ | 141.7 | 25.1 | % | 25.1% | ||||||||||||||
| Europe | 122.8 | 125.1 | (2.3 | ) | (1.8 | )% | 2.8% | 149.6 | 140.9 | 8.7 | 6.2 | % | 1.1% | |||||||||||||||||||
| Japan | 170.8 | 138.0 | 32.8 | 23.8 | % | 10.6% | 223.7 | 199.4 | 24.3 | 12.2 | % | 10.0% | ||||||||||||||||||||
| Rest of Asia | 67.1 | 70.3 | (3.2 | ) | (4.6 | )% | (2.1)% | 92.0 | 76.5 | 15.5 | 20.3 | % | 16.9% | |||||||||||||||||||
| Other foreign countries | 62.9 | 63.9 | (1.0 | ) | (1.6 | )% | 1.9% | 71.2 | 67.3 | 3.9 | 5.8 | % | 5.5% | |||||||||||||||||||
| $ | 871.2 | $ | 843.8 | $ | 27.4 | 3.2 | % | 2.3% | $ | 1,242.8 | $ | 1,048.7 | $ | 194.1 | 18.5 | % | 17.2% | |||||||||||||||
(1) Prior period amounts have been reclassified to conform to the current year presentation of regional sales related to OGIO-branded products.
Net sales in the United States increased $1.1$141.7 million (0.2%(25.1%) to $447.6$706.3 million during 20162018 compared to $446.5$564.6 million in 2015,2017. Net sales in regions outside of the United States increased $52.4 million (10.8%) to $536.5 million in 2018 compared to $484.1 million in 2017. Fluctuations in foreign currencies had a favorable impact on international net sales of $14.2 million in 2018 relative to the prior year. The increase in net sales across all major regions reflects increases in all operating segments compared to 2017 primarily as a result of the success of the 2018 product line. In addition, the increase in net sales by region includes the following:
In the United States, the increase reflects stronger market conditions as well as $60.6 million in incremental apparel sales resulting from the TravisMathew acquisition that was completed in August 2017.
In Japan, the increase reflects the successful launch of region-specific iron models in 2018, in addition to an increase in apparel sales due to the opening of new retail and outlet locations in 2018 under the apparel joint venture.
37
The increase in Rest of Asia was primarily driven by a 22% increase in sales in Korea year over year due to continued brand strength.
The increase in Europe was primarily due to the favorable impact of foreign currency changes combined with a slight increase in net sales year over year. Net sales were adversely affected in 2018 due to poor weather conditions which resulted in a slow start to the golf season.
Gross profit increased $98.0 million to $578.4 million in 2018 from $480.4 million in 2017. Gross profit as a percent of net sales ("gross margin") increased 70 basis points to 46.5% in 2018 from 45.8% in 2017. The increase in gross margin was primarily due an increase of 300 basis points in price and product mix partially offset by a 250 basis point increase in cost. The increase in price and product mix was primarily due to higher priced and higher margin products in the woods and golf ball product categories, combined with incremental sales of TravisMathew apparel, which was accretive to the Company's overall gross margin. The increase in cost was driven by higher priced materials and technology incorporated into current year products combined with increased manufacturing costs associated with the technology incorporated into current year golf ball products. For a further discussion of gross margin, see "Segment Profitability" below.
Selling expenses increased by $37.8 million to $308.7 million (24.8% of net sales) in 2018 compared to $270.9 million (25.8% of net sales) in 2017. This increase reflects $14.4 million of incremental costs resulting from the addition of the TravisMathew business, in addition to increases of $12.2 million in marketing and tour expenses and $6.2 million in employee costs, as well as an increase in variable expenses due to higher net sales period over period.
General and administrative expenses increased by $6.3 million to $100.5 million (8.1% of net sales) in 2018 compared to $94.2 million (9.0% of net sales) in 2017. This increase was primarily due to $6.4 million of incremental costs in 2018 resulting from the addition of the TravisMathew business, a $2.8 million increase in legal and professional fees, and a $2.0 million increase in bad debt expense, partially offset by a $5.2 million decrease in transaction and transition costs associated with the acquisitions of TravisMathew and OGIO in 2017 compared to the pre-acquisition costs incurred in 2018 in connection with the Jack Wolfskin acquisition completed in January 2019.
Research and development expenses increased by $4.2 million to $40.8 million (3.3% of net sales) in 2018 compared to $36.6 million (3.5% of net sales) in 2017, primarily due to an increase in employee costs.
Interest expense increased by $1.1 million to $5.5 million in 2018 compared to $4.4 million in 2017 primarily due to an increase in average outstanding borrowings under the Company's credit facilities at higher interest rates period over period as a result of the TravisMathew acquisition, combined with the interest paid on the Company's long-term equipment note (see Note 5 "Financing Arrangements" to the Notes to Consolidated Financial Statements in this Form 10-K).
Other income (expense), net increased by $14.7 million to other income of $7.8 million in 2018 compared to other expense of $6.9 million in 2017. This improvement was due to a $14.1 million increase in net foreign currency gains primarily from foreign currency forward contracts not designated as hedging instruments, which includes an unrealized gain of $4.4 million recorded in 2018 from the re-measurement of a foreign currency forward contract that was put in place to mitigate the risk of foreign currency fluctuations on the acquisition of Jack Wolfskin, which was denominated in Euros.
The Company recorded an income tax provision of $26.0 million in 2018, compared to $26.4 million in 2017. As a percentage of pre-tax income, the Company’s income tax rate declined to 19.8% in 2018 compared to 38.7% in 2017. This decline was primarily due to the Tax Act enacted in December 2017, which reduced the U.S. corporate income tax rate from 35% to 21% for tax years beginning after December 31, 2017, combined with an increase in R&D tax credits in 2018. For further discussion, see Note 11 "Income Taxes" to the Notes to Consolidated Financial Statements in this Form 10-K.
Net income in 2018 increased 151.1% to $104.7 million compared to $41.7 million in 2017. Diluted earnings per share increased to $1.08 on 97.2 million diluted shares outstanding in 2018 compared to $0.42 on 96.6 million diluted shares outstanding in 2017. On a non-GAAP basis, excluding pre-acquisition transaction costs as well as certain hedging gains associated with the purchase price of Jack Wolfskin, which netted to $0.6 million in 2018, and excluding after-tax acquisition costs of $7.1 million and the net impact of the new tax legislation of $3.4 million in 2017, the Company's net income and diluted earnings per share for 2018 would have been $104.1 million and $1.07 per share, respectively, compared to $51.3 million or $0.53 per share in 2017.
38
The table below presents a reconciliation of the Company's results under GAAP for the year ended December 31, 2018 and 2017 to the Company's non-GAAP results as defined above for the same periods (in millions).
| Year Ended December 31, 2018 | Year Ended December 31, 2017 | ||||||||||||||||||||||||||
| As Reported | Acquisition Costs, net(1) | Non-GAAP | As Reported | Acquisition Costs(2) | Non-Cash Tax Adjustment(3) | Non-GAAP | |||||||||||||||||||||
| Net income (loss) attributable to Callaway Golf Company | $ | 104.7 | $ | 0.6 | $ | 104.1 | $ | 40.8 | $ | (7.1 | ) | $ | (3.4 | ) | $ | 51.3 | |||||||||||
| Diluted earnings (loss) per share | $ | 1.08 | $ | 0.01 | $ | 1.07 | $ | 0.42 | $ | (0.07 | ) | $ | (0.04 | ) | $ | 0.53 | |||||||||||
| Weighted-average shares outstanding | 97.2 | 97.2 | 97.2 | 96.6 | 96.6 | 96.6 | 96.6 | ||||||||||||||||||||
| (1) | Represents net transaction costs associated with the acquisition of Jack Wolfskin completed in January 2019, which were more than offset by a net gain recognized from the re-measurement of a foreign currency forward contract in connection with the transaction. |
| (2) | Represents transaction and transition costs associated with the acquisition of OGIO in January 2017 and transaction costs associated with the acquisition of TravisMathew in August 2017. The income tax benefit of $3.6 million associated with these costs was based on the Company's statutory tax rate for 2017. |
| (3) | Represents the impact of the Tax Act as discussed above, which resulted in $7.5 million of income tax expense, offset by a non-recurring, non-cash $4.1 million tax benefit related to taxes on intercompany transactions, resulting from the 2016 release of the valuation allowance against the Company’s U.S. deferred tax assets. |
Operating Segment Results for the Years Ended December 31, 2018 and 2017
Golf Clubs
Golf Club sales increased $74.2 million (11.5%) to $717.3 million in 2018 compared to $643.1 million in 2017. This increase was primarily due to the strength of the 2018 product line combined with improved market conditions. Additionally, in 2018, net sales were favorably impacted by a decline in the amount of variable consideration recognized for sales promotions and incentives under the new revenue recognition rules in 2018 compared to 2017. Net sales for 2018 reflect $9.7 million of favorable foreign currency fluctuations.
Net sales information for the Golf Clubs segment by product category is summarized as follows (dollars in millions):
Years Ended December 31, | Growth/(Decline) | |||||||||||||
| 2018 | 2017 | Dollars | Percent | |||||||||||
| Net sales: | ||||||||||||||
| Woods | $ | 304.4 | $ | 307.9 | $ | (3.5 | ) | (1.1 | )% | |||||
| Irons | 316.5 | 250.6 | 65.9 | 26.3 | % | |||||||||
| Putters | 96.4 | 84.6 | 11.8 | 13.9 | % | |||||||||
| $ | 717.3 | $ | 643.1 | $ | 74.2 | 11.5 | % | |||||||
Net sales of woods decreased $3.5 million (1.1%) to $304.4 million in 2018 compared to 2017 primarily due to a 4.2% decrease in sales volume, partially offset by a 3.2% increase in average selling prices. The decrease in sales volume was primarily due a small decline in market share combined with a decrease in sales of closeout products year-over year. The increase in average selling prices was primarily due to an increase in launch prices for fairway woods and hybrid products launched in 2018 compared to the products launched in 2017, combined with a decline in sales of closeout products year over year.
Net sales of irons increased $65.9 million (26.3%) to $316.5 million in 2018 compared to 2017, primarily due to increases of 19.0% in sales volume and 6.1% in average selling prices. The increase in sales volume was due to the success of the Rogue line of irons in 2018 relative to the Epic line of irons in 2017 and the Mack Daddy 4 wedges which were launched in the fourth quarter of 2017. The increase in average selling prices resulted from higher average selling prices on the Rogue line of irons in 2018 relative to the Steelhead line of irons sold in 2017.
39
Net sales of putters increased $11.8 million (13.9%) to $96.4 million in 2018 compared to 2017, due to an increase of 13.8% in average selling prices resulting primarily from the 2018 launch of the Odyssey EXO putters, as well as the continued success of the Odyssey Works Red and Black putter models launched in 2017.
Golf Balls
Net sales information for the Golf Balls segment is summarized as follows (dollars in millions):
Years Ended December 31, | Growth | |||||||||||||
| 2018 | 2017 | Dollars | Percent | |||||||||||
| Net sales: | ||||||||||||||
| Golf Balls | $ | 195.6 | $ | 162.5 | $ | 33.1 | 20.4 | % | ||||||
Net sales of Golf Balls increased $33.1 million (20.4%) to $195.6 million for in 2018 compared to 2017, primarily due to increases of 11.6% in average selling prices and 7.8% in sales volume. These increases were primarily due to an overall increase in market share resulting from the successful launch of the 2018 Chrome Soft and Superhot 18 lines of golf balls at higher average selling prices compared to the Chrome Soft and Superhot models launched in the prior year, combined with the continued success of the Supersoft 17 line of golf balls.
Gear, Accessories and Other
Net sales information for the Gear, Accessories and Other segment is summarized as follows (dollars in millions):
| Years Ended December 31, | Growth | |||||||||||||
| 2018 | 2017 | Dollars | Percent | |||||||||||
| Net sales: | ||||||||||||||
| Gear, Accessories and Other | $ | 329.9 | $ | 243.1 | $ | 86.8 | 35.7 | % | ||||||
Net sales of Gear, Accessories and Other increased $86.8 million (35.7%) to $329.9 million in 2018 compared to 2017. This increase was primarily due to incremental sales of $60.6 million for TravisMathew apparel as a result of the acquisition completed in August 2017, in addition to increased sales of accessories, golf bags and OGIO travel gear.
Segment Profitability
Profitability by operating segment is summarized as follows (dollars in millions):
Years Ended December 31, | Growth | |||||||||||||
| 2018 | 2017 | Dollars | Percent | |||||||||||
| Income before income taxes: | ||||||||||||||
| Golf Clubs | $ | 104.2 | $ | 77.0 | $ | 27.2 | 35.3 | % | ||||||
| Golf Balls | 27.9 | 26.9 | 1.0 | 3.7 | % | |||||||||
| Gear, Accessories and Other | 56.6 | 30.6 | 26.0 | 85.0 | % | |||||||||
Reconciling items(1) | (57.4 | ) | (66.4 | ) | 9.0 | (13.6 | )% | |||||||
| $ | 131.3 | $ | 68.1 | $ | 63.2 | 92.8 | % | |||||||
| (1) | Reconciling items represent corporate general and administrative expenses and other income (expense) not included by management in determining segment profitability. |
Pre-tax income in the Company’s Golf Clubs operating segment improved to $104.2 million in 2018 from $77.0 million in 2017, primarily due to a $36.0 million increase in gross profit resulting from a $74.2 million increase in net sales as discussed above, partially offset by a $8.8 million increase in operating expenses. Gross margins remained relatively flat year over year. The increase in operating expenses was primarily due to increases in marketing, tour expense and employee costs, in addition to an increase in variable selling expenses due to higher sales year over year.
40
Pre-tax income in the Company’s Golf Balls operating segment improved to $27.9 million in 2018 from $26.9 million in 2017. This increase was primarily due to an $11.3 million increase in gross profit resulting from a $33.1 million increase in net sales as discussed above, partially offset by a $10.2 million increase in operating expenses primarily due to an increase in variable expenses resulting from higher sales year over year. Gross margin decreased 190 basis points in 2018 compared to 2017 as a result of the technology incorporated into golf ball models launched in 2018 compared to models launched in 2017, combined with higher manufacturing costs associated with the complexity of managing production while incorporating major capital improvements.
Pre-tax income in the Company's Gear, Accessories and Other operating segment increased to $56.6 million in 2018 from $30.6 million in 2017. This increase was primarily due to an increase in operating income for TravisMathew due to incremental sales and expenses as a result of the acquisition completed in August 2017, in addition to an increase in operating income for OGIO due to the improved financial performance of the brand period over period.
Years Ended December 31, 2017 and 2016
Net sales for the year ended December 31, 2017 increased $177.5 million (20.4%) to $1,048.7 million compared to $871.2 million for the year ended December 31, 2016. This improvement was driven by an increase in net sales in all three of the Company's operating segments. The increase in gear, accessories and other was largely due to the Company's newly acquired businesses, OGIO and TravisMathew, and the Company's apparel joint venture in Japan which contributed to incremental sales of bags, accessories and apparel in the golf and lifestyle categories. The increase in net sales in the Golf Clubs and Golf Balls operating segments was driven by the success of the Epic line of drivers and fairway woods and the Supersoft and Chrome Soft lines of golf balls, respectively.
The Company’s net sales by operating segment are presented below (dollars in millions):
Years Ended December 31, | Growth | |||||||||||||
| 2017 | 2016 | Dollars | Percent | |||||||||||
| Net sales: | ||||||||||||||
| Golf Clubs | $ | 643.1 | $ | 582.4 | $ | 60.7 | 10.4 | % | ||||||
| Golf Balls | 162.5 | 152.3 | 10.2 | 6.7 | % | |||||||||
| Gear, Accessories and Other | 243.1 | 136.5 | 106.6 | 78.1 | % | |||||||||
| $ | 1,048.7 | $ | 871.2 | $ | 177.5 | 20.4 | % | |||||||
For further discussion of each operating segment’s results, see "Operating Segment Results for the Years Ended December 31, 2017 and 2016" below.
Net sales information by region is summarized as follows (dollars in millions):
Years Ended December 31, | Growth | |||||||||||||
| 2017 | 2016 | Dollars | Percent | |||||||||||
| Net sales: | ||||||||||||||
| United States | $ | 566.4 | $ | 447.6 | $ | 118.8 | 26.5 | % | ||||||
| Europe | 139.5 | 122.8 | 16.7 | 13.6 | % | |||||||||
| Japan | 199.3 | 170.8 | 28.5 | 16.7 | % | |||||||||
| Rest of Asia | 76.5 | 67.1 | 9.4 | 14.0 | % | |||||||||
| Other foreign countries | 67.0 | 62.9 | 4.1 | 6.5 | % | |||||||||
| $ | 1,048.7 | $ | 871.2 | $ | 177.5 | 20.4 | % | |||||||
Net sales in the United States increased $118.8 million (26.5%) to $566.4 million during 2017 compared to $447.6 million in 2016, primarily due to the continued strengthsuccess of the brand.Company's new Epic line of drivers and fairway woods, combined with increased sales of bags, gear and apparel due to the Company's acquisition of OGIO and TravisMathew during the current year. The Company’s sales in regions outside of the United States increased $26.3$58.8 million (6.6%(13.9%) to $482.4 million in 2017 compared
41
to $423.6 million in 2016, compared to $397.3 million in 2015, primarily due to the formation of the Company's apparel joint venture in Japan beginning in the third quarter of 2016. In addition, foreign2016 combined with the continued success of the Company's Epic line of woods and irons. Foreign currency exchange rates had a favorablean unfavorable impact of $8.4$9.9 million on the Company's net sales denominated in foreign currencies. This increase was partially offset by softer than anticipated market conditions in Asia.
Gross profit increased $27.4$95.4 million to $480.4 million in 2017 from $385.0 million in 2016 from $357.6 million in 2015.2016. Gross profit as a percent of net sales ("gross margin") increased 180160 basis points to 45.8% in 2017 from 44.2% in 2016 from 42.4% in 2015. This2016. The increase in gross margin was primarily due to an increase of 143a 410 basis points resulting from improved operational efficiencies, combined with an increase of 84 basis pointspoint favorable shift in price and product mix asin the woods product category due to the success of the current year Epic drivers, which have higher margins compared to the XR 16 drivers sold in the prior year, combined with a result of angeneral increase in average selling prices within the golf balls, irons and woods categories,across most product categories. This increase was partially offset by a decrease of approximately 180 basis points primarily due to (i) an increase in promotional activity on someclub component costs due to the higher cost of materials and technology incorporated into current year products, (ii) higher freight costs resulting from more air shipments to meet the high demand of the Company's ironscurrent year products, period over periodas well as (iii) the slightly dilutive impact of the Company's newly acquired OGIO and TravisMathew businesses, which in the unfavorable impact (47aggregate had lower gross margins relative to the Company's core business. On a full year basis, points) of changes in foreignthe gross margin for the TravisMathew business would be expected to be accretive to the Company's overall gross margin. Foreign currency exchange rates primarily from inventory held in foreign regions.also had an unfavorable impact of approximately 70 basis points on the Company's gross margins during the current year. For a further discussion of gross margin, see "Segment Profitability" below.
Selling expenses increased by $6.6$35.3 million to $270.9 million (25.8% of net sales) in 2017 compared to $235.6 million (27.0% of net sales) for the year ended December 31, 2016 compared to $228.9 million (27.1% of net sales) in the comparable period of 2015, primarily due tothe formation of the Company's apparel joint venture in Japan which resulted in $6.4 million of additional selling expenses.
General and administrative expenses increased by $22.2 million to $94.2 million (9.0% of net sales) in 2017 compared to $72.0 million (8.3% of net sales) in 2016. This increase was primarily due to $8.8 million of non-recurring transaction and transition costs incurred in connection with the acquisitions of OGIO and TravisMathew, $9.3 million of incremental general and administrative costs resulting from the consolidation of the Company's new businesses, a $5.7 million increase in employee costs due to increases in accrued employee incentive compensation expense and stock compensation expense, and $1.0 million in legal expenses. These increases were partially offset by a $1.5decrease of $1.8 million decrease in stock compensation expense as a result of the payout of cash-settled stock awards period over period.bad debt expense.
Research and development expenses increased by $0.1$3.3 million to $36.6 million (3.5% of net sales) in 2017 compared to $33.3 million (3.8% of net sales) for the year ended December 31,in 2016, comparedprimarily due to $33.2a $1.7 million (3.9% of net sales)increase in the comparable period of 2015.employee costs due to increases in accrued employee incentive compensation expense and stock compensation expense, combined with increases in research expenses and professional fees.
Interest expense decreasedincreased by $6.3$2.0 million to $4.4 million in 2017 compared to $2.4 million for the year ended December 31,in 2016 compared to $8.7 million in the comparable period of 2015 primarily due to the savings realized in connection with the retirementrefinancing of the Company's convertible notes into shares of common stockABL Credit Facility during the second halffourth quarter of 2015, including the acceleration of debt issuance costs2017 (see Note 3 "Financing Arrangements"5. Financing Arrangements to the Notes to Consolidated Financial Statements in this Form 10-K).
During 2016, the Company sold approximately 10.0% of its preferred shares in Topgolf International, Inc. doing business as the Topgolf Entertainment Group ("Topgolf") for $23.4 million and recognized a $17.7 million gain in other income. See Note 67 “Investments” to the Notes to Consolidated Financial Statements in this Form 10-K.
instruments.
The Company recorded an income tax benefitprovision of $132.6$26.4 million for the year ended December 31, 2016,in 2017, compared to an income tax provisionbenefit of $5.5$132.6 million in the comparable period of 2015.2016. The income tax benefit for 2016 includes a one-time, non-cash benefit of $156.6 million related to the reversal of a signification portion of the Company's valuation allowance on its U.S. deferred tax assets. This reversal was partially offset by the recognition of $16.0 million in income taxes that were retroactive for all of 2016 on the Company's earnings in the U.S. business earnings.
As of December 31, 2017, the Company recorded income tax expense of $7.5 million as a result of the Tax Act, which was comprised of $11.1 million of income tax expense as a result of the re-measurement of deferred tax assets and liabilities at the new lower statutory tax rate of 21%, partially offset by a net tax benefit of $3.6 million as a result of the mandatory deemed repatriation on earnings and profits of U.S.-owned foreign subsidiaries, which generated foreign tax credits in excess of the tax expense recognized on the deemed repatriation. The Company used an effective U.S. incomeelected to record the mandatory repatriation and re-measurement of deferred taxes as a provisional amount for the year ended December 31, 2017, which the Company believed was then a reasonable
42
estimate in accordance with the Tax Act. Due to the complexity and considerable amount of changes in tax rate that is closelaw, the Company monitored its estimates and further refined its tax calculations during the measurement period, as necessary, as changes to statutory rates to assessinterpretations and further guidance around the income tax provision on its U.S. business.newly enacted provisions were issued by the Internal Revenue Service. For further discussion, see Note 910 "Income Taxes" to the Notes to Consolidated Financial Statements in this Form 10-K.
Net income for the year ended December 31, 2016 increasedin 2017 decreased to $189.9$40.8 million compared to $14.6$191.0 million in the comparable period of 2015.2016. Diluted earnings per share increaseddecreased to $0.42 on 96.6 million diluted shares outstanding in 2017 compared to $1.98 on 95.8 million diluted shares outstanding in 2016 from $0.17 on 84.62016. On a non-GAAP basis, excluding after-tax acquisition costs of $7.1 million diluted shares outstanding in 2015. As discussed above, duringand the fourth quarterimpact of 2016, the Company reversednew tax legislation of $3.4 million for the year ended December 31, 2017, and the impact of the reversal of a significant portion of the Company's valuation allowance on its U.S. deferred tax assetsof $156.6 million and recognized income taxes that were retroactive for allthe Topgolf gain of 2016 on the Company's U.S. business earnings, which resulted in a net favorable impact to net income of $140.6 million ($1.47 per share). In addition, net income for 2016 includes a $17.7 million ($0.18 per share) pre-tax gain, as discussed above, fromduring the sale preferred shares in Topgolf. Excluding the impact of the valuation allowance reversal, the recognition of additional income taxes and the gain recognized on the sale of a portion of the Company's investment in Topgolf,year ended December 31, 2016, the Company's net income would have been $31.6 million, a 116.4% increase compared to 2015, and diluted earnings per share for 2017 would have been $0.33, a 94.1% increaseincreased by $28.5 million or 125% to $51.3 million and by $0.29 or 121% to $0.53 for 2017, respectively, compared to 2015.2016.
The table below presents a reconciliation of the Company's results under GAAP for the years ended December 31, 2017 and 2016, to the Company's non-GAAP results as defined above for the same periods (in millions).
| Year Ended December 31, 2017 | Year Ended December 31, 2016 | ||||||||||||||||||||||||||||||
| As Reported | Acquisition Costs(1) | Non-Cash Tax Adjustment(2) | Non-GAAP | As Reported | Release of Tax VA(3) | Topgolf Gain(4) | Non-GAAP | ||||||||||||||||||||||||
| Net income (loss) attributable to Callaway Golf Company | $ | 40.8 | $ | (7.1 | ) | $ | (3.4 | ) | $ | 51.3 | $ | 189.9 | $ | 156.6 | $ | 10.5 | $ | 22.8 | |||||||||||||
| Diluted earnings (loss) per share | $ | 0.42 | $ | (0.07 | ) | $ | (0.04 | ) | $ | 0.53 | $ | 1.98 | $ | 1.63 | $ | 0.11 | $ | 0.24 | |||||||||||||
| Weighted-average shares outstanding | 96.6 | 96.6 | 96.6 | 96.6 | 95.8 | 95.8 | 95.8 | 95.8 | |||||||||||||||||||||||
| (1) | Represents transaction and transition costs associated with the acquisition of OGIO in January 2017 and transaction costs associated with the acquisition of TravisMathew in August 2017. The income tax benefit of $3.6 million associated with these costs was based on the Company's statutory tax rate for 2017. |
| (2) | Represents the impact of the Tax Act as discussed above, which resulted in $7.5 million of income tax expense, offset by a non-recurring, non-cash $4.1 million tax benefit related to taxes on intercompany transactions, resulting from the 2016 release of the valuation allowance against the Company’s U.S. deferred tax assets. |
| (3) | Non-cash tax benefit due to the reversal of a significant portion of the Company's deferred tax valuation allowance in the fourth quarter of 2016. |
| (4) | Gain recognized on the sale of approximately 10.0% of the Company's investment in Topgolf in the second quarter of 2016. |
Operating Segment Results for the Years Ended December 31, 2017 and 2016
Golf Clubs Segment
Golf club sales increased $18.2$60.7 million (2.6%(10.4%) to $718.9$643.1 million in 20162017 compared to $700.7$582.4 million in 2015.2016. This increase was primarily due to the formationsuccess of the Company's apparel joint venture in Japan during the third quartercurrent year Epic line of 2016, combined with an increase in average selling prices across all product categories, partiallydrivers and fairway woods, offset by a decrease in net sales volumes in the woods,of irons and putters categories.due to the timing of product launches.
Net sales information for the golf clubsGolf Clubs segment by product category is summarized as follows (dollars in millions):
Years Ended December 31, | Growth/(Decline) | Years Ended December 31, | Growth/(Decline) | |||||||||||||||||||||||||
| 2016 | 2015 | Dollars | Percent | 2017 | 2016 | Dollars | Percent | |||||||||||||||||||||
| Net sales: | ||||||||||||||||||||||||||||
| Woods | $ | 201.8 | $ | 222.2 | $ | (20.4 | ) | (9.2 | )% | $ | 307.9 | $ | 216.1 | $ | 91.8 | 42.5 | % | |||||||||||
| Irons | 211.9 | 205.5 | 6.4 | 3.1 | % | 250.6 | 278.6 | (28.0 | ) | (10.1 | )% | |||||||||||||||||
| Putters | 86.0 | 86.3 | (0.3 | ) | (0.3 | )% | 84.6 | 87.7 | (3.1 | ) | (3.5 | )% | ||||||||||||||||
| Accessories and other | 219.2 | 186.7 | 32.5 | 17.4 | % | |||||||||||||||||||||||
| $ | 718.9 | $ | 700.7 | $ | 18.2 | 2.6 | % | $ | 643.1 | $ | 582.4 | $ | 60.7 | 10.4 | % | |||||||||||||
43
Net sales of woods decreased $20.4increased $91.8 million (9.2%(42.5%) to $201.8$307.9 million for the year ended December 31, 2016in 2017 compared to the prior year,2016, primarily due to a 12.9% decline32.9% improvement in average selling prices and a 7.2% improvement in sales volumesvolume. The increase in average selling prices and sales volume was primarily due to the success of the current year Epic line of higher priced premium drivers and fairway woods, which outpaced sales of the lower priced XR 16 line of woods in 2016. In addition, average selling prices were favorably impacted by a decrease in promotional activity year over year. The increase in sales volume was partially offset by a 4.3%shift in launch timing of the Company's new hybrid products.
Net sales of irons decreased $28.0 million (10.1%) to $250.6 million in 2017 compared to 2016, primarily due to a 15.4% decrease in sales volume, partially offset by a 6.4% increase in average selling prices. The declinedecrease in sales volumesvolume was primarily due to a shift in launchthe timing of product launches, resulting in fewer woodsirons products launched during 2016in 2017 compared to the prior year.2016. The increase in average selling prices was primarily due to a favorable shift in product mix resulting from the launch of the premium Epic line of irons in 2017, which have a higher average selling price increase on the Company's XR 16 drivers and fairway woods launched in 2016, relativecompared to the lower priced Steelhead XR woodsand XR OS core line of irons launched in the prior year.
Net sales of putters decreased $0.3$3.1 million (0.3%(3.5%) to $86.0$84.6 million for the year December 31, 2016in 2017 compared to the prior year,2016, primarily due to a 1.7%10.2% decline in sales volumes partially offset by a 1.4%7.4% increase in average selling prices. The decline in sales volume was primarily due to the 2016 launchtiming of the Company's White Hot RX putters,product launches which was a smaller launch compared
Golf Balls Segment
Net sales information for the golf ballsGolf Balls segment is summarized as follows (dollars in millions):
Years Ended December 31, | Growth | Years Ended December 31, | Growth | |||||||||||||||||||||||||
| 2016 | 2015 | Dollars | Percent | 2017 | 2016 | Dollars | Percent | |||||||||||||||||||||
| Net sales: | ||||||||||||||||||||||||||||
| Golf balls | $ | 152.3 | $ | 143.1 | $ | 9.2 | 6.4 | % | $ | 162.5 | $ | 152.3 | $ | 10.2 | 6.7 | % | ||||||||||||
Net sales of golf balls increased $9.2$10.2 million (6.4%(6.7%) to $152.3$162.5 million for the year ended December 31, 2016in 2017 compared to the prior year, primarily due to a 10.3% increase in average selling prices, partially offset by a 3.6% decrease in sales volumes. The increase in average selling prices was2016, primarily due to an 8.7% increase in the sales price of the Company's 2016 Chrome Soft golf balls combinedvolume with sales of the Company's higher priced Truvis golf balls during the current year.relatively flat average selling prices. The declineincrease in sales volume was primarily due to a decrease in salesthe success of the Company's lower priced special marketnew Supersoft and Chrome Soft X golf balls launched in 20162017, combined with the continued success of the Chrome Soft golf balls launched in 2016.
Gear, Accessories and Other
Net sales information for the Gear, Accessories and Other segment is summarized as follows (dollars in millions):
| Years Ended December 31, | Growth | |||||||||||||
| 2017 | 2016 | Dollars | Percent | |||||||||||
| Net sales: | ||||||||||||||
| Gear, accessories and other | $ | 243.1 | $ | 136.5 | $ | 106.6 | 78.1 | % | ||||||
Net sales of gear, accessories and other increased $106.6 million (78.1%) to $243.1 million in 2017 compared to 2015.2016. This increase was primarily due to incremental sales of gear, accessories and apparel of approximately $100.0 million as a result of the Company's acquisitions of OGIO in January 2017 and TravisMathew in August 2017, and the Company's apparel joint venture in Japan, which was established during the third quarter of 2016. Additionally, sales of Callaway gloves, headwear, and footwear increased in 2017 compared to 2016.
44
Segment Profitability
Profitability by operating segment is summarized as follows (dollars in millions):
Years Ended December 31, | Growth | Years Ended December 31, | Growth | |||||||||||||||||||||||||
| 2016 | 2015 | Dollars | Percent | 2017 | 2016 | Dollars | Percent | |||||||||||||||||||||
| Income before income taxes: | ||||||||||||||||||||||||||||
| Golf clubs | $ | 65.0 | $ | 53.0 | $ | 12.0 | 22.6 | % | $ | 77.0 | $ | 48.5 | $ | 28.5 | 58.8 | % | ||||||||||||
| Golf balls | 25.6 | 17.7 | 7.9 | 44.6 | % | 26.9 | 23.9 | 3.0 | 12.6 | % | ||||||||||||||||||
| Gear, accessories and other | 30.6 | 18.2 | 12.4 | 68.1 | % | |||||||||||||||||||||||
Reconciling items(1) | (32.2 | ) | (50.6 | ) | 18.4 | (36.4 | )% | (66.4 | ) | (32.2 | ) | (34.2 | ) | 106.2 | % | |||||||||||||
| $ | 58.4 | $ | 20.1 | $ | 38.3 | 190.5 | % | $ | 68.1 | $ | 58.4 | $ | 9.7 | 16.6 | % | |||||||||||||
| (1) | Reconciling items represent corporate general and administrative expenses and other income (expense) not included by management in determining segment profitability. The |
Pre-tax income in the Company’s golf clubsGolf Clubs operating segment improved to $65.0$77.0 million for 20162017 from $53.0$48.5 million for 2015. This increase was primarily due to an $18.3 million increase in net sales (as discussed above) which contributed to a $17.2 million increase in gross profit (or increase of 117 basis points in gross margin), partially offset by an increase of $5.2 million in operating expenses. The improvement in gross margin was primarily due to an increase of 129 basis points due to a reduction in costs, driven primarily by the favorable sourcing of raw materials, combined with improved operational efficiencies resulting from reduced fixed charges. Sales price and mix improved by 30 basis points primarily due to an increase in average selling prices, primarily within the irons category, partially offset by an increase in promotional activity year over year. Foreign currency translation had a negative impact to gross margin of 42 basis points due to the impact of changes in foreign currency rates on inventory held at foreign regions. The increase in operating expenses was primarily due to the Company's new apparel joint venture in Japan established during the third quarter of 2016.
Years Ended December 31, | Growth/(Decline) | Constant Currency Growth/(Decline) vs. 2014 | ||||||||||||||
| 2015 | 2014 | Dollars | Percent | Percent | ||||||||||||
| Net sales: | ||||||||||||||||
| Golf clubs | $ | 700.7 | $ | 749.9 | $ | (49.2 | ) | (6.6 | )% | (0.4)% | ||||||
| Golf balls | 143.1 | 137.0 | 6.1 | 4.5 | % | 9.8% | ||||||||||
| $ | 843.8 | $ | 886.9 | $ | (43.1 | ) | (4.9 | )% | 1.1% | |||||||
Years Ended December 31, | Growth / (Decline) | Constant Currency Growth/(Decline) vs. 2014 | ||||||||||||||
| 2015 | 2014 | Dollars | Percent | Percent | ||||||||||||
| Net sales: | ||||||||||||||||
| United States | $ | 446.5 | $ | 421.8 | $ | 24.7 | 5.9 | % | 5.9% | |||||||
| Europe | 125.1 | 134.4 | (9.3 | ) | (6.9 | )% | 7.0% | |||||||||
| Japan | 138.0 | 166.1 | (28.1 | ) | (16.9 | )% | (5.0)% | |||||||||
| Rest of Asia | 70.3 | 89.6 | (19.3 | ) | (21.5 | )% | (17.0)% | |||||||||
| Other foreign countries | 63.9 | 75.0 | (11.1 | ) | (14.8 | )% | (2.0)% | |||||||||
| $ | 843.8 | $ | 886.9 | $ | (43.1 | ) | (4.9 | )% | 1.1% | |||||||
Years Ended December 31, | Growth/(Decline) | Constant Currency Growth (Decline) vs. 2014 | ||||||||||||||
| 2015 | 2014 | Dollars | Percent | Percent | ||||||||||||
| Net sales: | ||||||||||||||||
| Woods | $ | 222.2 | $ | 269.5 | $ | (47.3 | ) | (17.6 | )% | (12.0)% | ||||||
| Irons | 205.5 | 200.2 | 5.3 | 2.6 | % | 9.0% | ||||||||||
| Putters | 86.3 | 81.1 | 5.2 | 6.4 | % | 13.9% | ||||||||||
| Accessories and other | 186.7 | 199.1 | (12.4 | ) | (6.2 | )% | (0.1)% | |||||||||
| $ | 700.7 | $ | 749.9 | $ | (49.2 | ) | (6.6 | )% | (0.4)% | |||||||
Years Ended December 31, | Growth | Constant Currency Growth vs. 2014 | ||||||||||||||
| 2015 | 2014 | Dollars | Percent | Percent | ||||||||||||
| Net sales: | ||||||||||||||||
| Golf balls | $ | 143.1 | $ | 137.0 | $ | 6.1 | 4.5 | % | 9.8% | |||||||
Years Ended December 31, | Growth/(Decline) | |||||||||||||
| 2015 | 2014 | Dollars | Percent | |||||||||||
| Income before income taxes: | ||||||||||||||
| Golf clubs | $ | 53.0 | $ | 50.9 | $ | 2.1 | 4.1 | % | ||||||
| Golf balls | 17.7 | 15.2 | 2.5 | 16.4 | % | |||||||||
Reconciling items(1) | (50.6 | ) | (44.5 | ) | (6.1 | ) | 13.7 | % | ||||||
| $ | 20.1 | $ | 21.6 | $ | (1.5 | ) | (6.9 | )% | ||||||
Pre-tax income in the Company’s Golf Balls operating segment improved to $26.9 million for 2017 from $24.0 million in 2016. This increase was primarily due to a $4.0 million increase in marketing spending on golf balls periodgross profit with relatively flat gross margins year over period,year, partially offset by favorable changesa $1.1 million increase in foreign currency exchange rates onoperating expenses.
Pre-tax income in the Company's Gear, Accessories and Other operating segment increased to $30.6 million for 2017 from $18.2 million for 2016. This increase was primarily due to a $48.5 million increase in gross profit, offset by a $36.1 million increase in operating expenses, both due to the incremental sales and expenses from the acquisitions of OGIO in January 2017 and TravisMathew in August 2017, in addition to the Company's apparel joint venture in Japan established during the third quarter of 2016.
Financial Condition
The Company’s cash and cash equivalents increased $76.2decreased $21.7 million to $126.0$64.0 million at December 31, 2016,2018, from $49.8$85.7 million at December 31, 2015. 2017 as the Company used a significant amount of its cash in 2018 to repay its asset-based credit facilities. The Company's outstanding balance under its asset-based credit facilities declined $47.5 million to $40.3 million from $87.8 million at December 31, 2017. As such, the Company's net cash position (cash less amounts outstanding under its asset-based credit facilities) improved $25.8 million at December 31, 2018 compared to December 31, 2017.
Cash generated from operating activities improveddecreased to $77.7$92.3 million during 20162018 compared to $30.6$117.7 million during 2015. This improvement was2017 primarily due to the timing of inventory purchases as a result of a shift in product launch timing, improved inventory management and an overall improvement in the Company's cash conversion cyclecollections on accounts receivable year over year. During 2016,2018, the Company used its cash and cash equivalents and proceeds of $23.4 millioncash from the sale of approximately 10.0% of its preferred shares in Topgolf, in addition to cash from operating activities to pay down outstandingrepay $49.6 million in borrowings on the ABL Facility as well as tounder its credit facilities and long-term debt, fund $12.2$36.8 million in capital expenditures and $1.4repurchase $22.5 million in golf-related ventures.shares of its common
45
stock. Management expects to fund the Company’s future operations from current cash balances and cash provided by its operating activities combined with borrowings under its current and future credit facilities, as deemed necessary (see Note 35 "Financing Arrangements" in the Notes to Consolidated Financial Statements in this Form 10-K for further information on the ABL Facility). In January 2017, the Company completed its acquisition of OGIO for $75.5 million subject to customary working capital adjustments (for further discussion see "Executive Summary" within Results of Operations above).
The Company’s accounts receivable balance fluctuates throughout the year as a result of the general seasonality of the Company’s business. The Company’s accounts receivable balance will generally be at its highest during the first and second quarters due to the seasonal peak in the golf season, and it will generally decline significantly during the third and fourth quarters as a result of an increase in cash collections and lower sales. As of December 31, 2016,2018, the Company’s net accounts receivable increaseddecreased to $127.9$71.4 million from $115.6$94.7 million as of December 31, 2015.2017. This $12.3$23.3 million increase was primarily attributable to an increasedecrease reflects the decrease in net sales induring the fourth quarter of 2016 compared to the fourth quarter of 2015.year over year and an improvement in cash collections.
The Company’s inventory balance also fluctuates throughout the year as a result of the general seasonality of the Company’s business.business and is also affected by the timing of new product launches. Generally, the Company’s buildup of inventory levels begins during the fourth quarter and continues heavily into the first quarter as well as into the beginning of the second quarter in order to meet demand during the height of the golf season. Inventory levels start to decline toward the end of the second quarter and are at their lowest during the third quarter. Inventory levels are also impacted by the timing of new product launches. The Company’s inventories decreasedincreased to $189.4$338.1 million as of December 31, 20162018 from $208.9$262.5 million as of December 31, 2015.2017. This $19.5$75.6 million decreaseincrease was primarily attributable to improved inventory management combined with the increase in the size of the Company's business and timing of inventory purchases as a result of a shiftrelated to products launched period over period, combined with an increase in product launch timing.in-transit inventory. Inventories as a percentage of the trailing 12 months net sales decreasedincreased to 21.7%27.2% as of December 31, 20162018 compared to 24.8%25.0% as of December 31, 2015.2017.
Liquidity and Capital Resources
The information set forth in Note 35 “Financing Arrangements,” in the Notes to Consolidated Financial Statements in this Form 10-K, is incorporated herein by this reference.
Liquidity
The Company’s principal sources of liquidity consist of its existing cash balances, funds expected to be generated from operations and its credit facilities. Based upon the Company’s current cash balances, its estimates of funds expected to be generated from operations in 2017,2019, and current and projected availability under its current or future credit facilities, the Company believes that it will be able to finance current and planned operating requirements, capital expenditures, debt repayments and contractual obligations and commercial commitments for at least the next 12 months.months from the issuance of this Form 10-K.
The Company’s ability to generate sufficient positive cash flows from operations is subject to many risks and uncertainties, including future economic trends and conditions, demand for the Company’s products, foreign currency exchange rates, and other risks and uncertainties applicable to the Company and its business (see “Risk Factors” contained in Part I, Item 1A in this Form 10-K). If the Company is unable to generate sufficient cash flows to fund its business due to a decline in sales or otherwise and is unable to reduce its manufacturing costs and operating expenses to offset such decline, the Company will need to increase its reliance on its credit facilities for needed liquidity. If the credit facilities are not then available or sufficient and the Company could not secure alternative financing arrangements, the Company’s future operations would be materially adversely affected.
In January 2019, the Company entered into a Credit Agreement (the “Credit Agreement”) with Bank of America, N.A. as administrative agent and other termslenders (the "Term Lenders") in order to fund the acquisition of Jack Wolfskin. The Credit Agreement provides for the Term Loan Facility in an aggregate principal amount of $480.0 million, which can be determinedincreased in maximum
46
increments of $225.0 million, or an unlimited amount subject to certain financial covenants. The Term Loan Facility is due in January 2026.
Loans under the Term Loan Facility are subject to interest at a rate per annum equal to either, at the timeCompany's option, the LIBOR rate or the base rate, plus 4.50% or 3.50%, respectively, and any amounts outstanding are secured by the Company's assets. Principal payments of $1.2 million are due quarterly, however the Company has the option to prepay any outstanding loan balance in whole or in part without premium or penalty. In addition, the Term Loan Facility requires excess cash flow payments beginning after December 31, 2019.
Loans outstanding under this facility are guaranteed by the Company's domestic subsidiaries. The loans and guaranties are secured by substantially all the assets of the offering. The registration statement is scheduled to expire on August 11, 2017.
Company and guarantors. In April 2016,connection with the Credit Agreement, the Company sold approximately 10.0%, or $5.8 million,amended its ABL Facility (the "Second Amendment to Third Amended and Restated Loan and Security Agreement") to expand the security interest granted to the ABL Lenders to match the security interest of its preferred shares in Topgolf in connection with Topgolf's share repurchase program,the Term Lenders. The Credit Agreement contains customary representations and received cash proceeds of $23.4 million. warranties and customary affirmative and negative covenants.
For further discussion,information on the Company's credit facilities and long-term borrowings see Note 6 "Investments"5 "Financing Arrangements" in the Notes to Consolidated Financial Statements in this Form 10-K.10-K, which is incorporated herein by this reference.
As of December 31, 2016,2018, approximately 43%97% of the Company’s total cash iswas held in regions outside of the United States. IfDue to changes enacted by the Tax Act in December 2017, incremental U.S. federal income tax is no longer a consideration if the Company were to repatriate cash to the United States outside of settling intercompany balances. However, if the Company were to repatriate such cash, outsideit may need to pay incremental foreign withholding taxes. During the second quarter of settling intercompany balances during2018, the normal course of operations,Company evaluated its permanent reinvestment assertion with respect to its Canadian subsidiary in conjunction with the Company's operating plans and forecasts as well as its short-term and long-term financial requirements, and determined that it would needrepatriate a portion of the earnings of its Canadian subsidiary. Therefore, the Company repatriated cash from its Canadian subsidiary and remitted the Canadian withholding tax. The distribution was not material to accrue and pay incremental U.S. federal and state income taxes, reduced by the current amountCompany's overall liquidity or tax expense. Prospectively, the Company will no longer consider the future earnings of available U.S. federal and state net operating loss and tax credit carryforwards. Theits Canadian subsidiary to be indefinitely reinvested. However, at this time the Company hasdoes not nor does it intend to repatriate additional funds to the United States to satisfy domestic liquidity needs arising in the ordinary course of business, including liquidity needs associated with its domestic debt service requirements. In 2015 and 2014, the Company ceased its business operations in Thailand and Malaysia, respectively, and accordingly, the Company no longer maintains a permanent reinvestment assertion with respect to
Share Repurchases
In August 2014, the Company's Board of Directors authorized athe $50.0 million share 2014 Repurchase Program under which the Company was authorized to repurchase shares of its common stock in the open market or in private transactions, subject to the Company’s assessment of market conditions and buying opportunities. Through April 2018, the Company had repurchased $46.9 million of its common stock under this program. The 2014 Repurchase Program remained in effect until May 8, 2018, at which time it was canceled by the Board of Directors and replaced by the new 2018 Repurchase program with a maximum cost to the Company of $50.0 million, under which the Company is authorized to repurchase shares of its common stock in the open market or in private transactions, subject to the Company’s assessment of market conditions and buying opportunities. The repurchases are made consistent with the terms of the Company's ABL Facility which defineslimits the amount of stock that can be repurchased. The repurchase program2018 Repurchase Program will remain in effect until completed or until terminated by the Board of Directors.
During 2016,2018, the Company repurchased approximately 572,0001,412,000 shares of its common stock under the 2014 repurchase programRepurchase Program and the 2018 Repurchase Program at an average cost per share of $8.99$15.90 for a total cost of $5.1$22.5 million. Included in these repurchasesamounts are $6.1 million of shares the Company acquiredwithheld to satisfy the Company's tax withholding obligations in connection with the vesting and settlement of employee restricted stock unit awards. The Company’s repurchases of shares of common stock are recorded at cost and result in a reduction of shareholders’ equity. As of December 31, 2016,2018, the total amount remaining under the repurchase authorization was $41.9$49.7 million.
47
Significant Obligations
The following table summarizes certain significant cash obligations as of December 31, 20162018 that will affect the Company’s future liquidity (in millions):
| Payments Due By Period | Payments Due By Period | |||||||||||||||||||||||||||||||||||||
| Total | Less than 1 Year | 1-3 Years | 3-5 Years | More than 5 Years | Total | Less than 1 Year | 1-3 Years | 3-5 Years | More than 5 Years | |||||||||||||||||||||||||||||
| Japan ABL Facility | 12.0 | 12.0 | — | — | — | |||||||||||||||||||||||||||||||||
| ABL Facility | $ | 40.3 | 40.3 | — | — | — | ||||||||||||||||||||||||||||||||
Capital Leases(1) | 0.5 | 0.2 | 0.2 | 0.1 | — | 0.6 | 0.2 | 0.3 | 0.1 | — | ||||||||||||||||||||||||||||
Operating leases(2) | 25.6 | 6.2 | 6.8 | 3.8 | 8.8 | 60.6 | 10.1 | 17.6 | 15.0 | 17.9 | ||||||||||||||||||||||||||||
Unconditional purchase obligations(3) | 49.3 | 36.2 | 10.9 | 2.2 | — | 51.2 | 33.7 | 15.2 | 2.3 | — | ||||||||||||||||||||||||||||
Uncertain tax contingencies(4) | 3.8 | 0.3 | 1.0 | 0.3 | 2.2 | 4.4 | 0.4 | 1.2 | 0.8 | 2.0 | ||||||||||||||||||||||||||||
Employee incentive compensation(5) | 18.3 | 18.3 | — | — | — | 21.5 | 21.5 | — | — | — | ||||||||||||||||||||||||||||
| Other long-term liabilities | 0.4 | 0.4 | — | — | — | |||||||||||||||||||||||||||||||||
Equipment Note(6) | 9.6 | — | — | 9.6 | — | |||||||||||||||||||||||||||||||||
| Interest on equipment note | 0.8 | 0.3 | 0.4 | 0.1 | — | |||||||||||||||||||||||||||||||||
| Other long term liabilities | 0.6 | — | — | — | 0.6 | |||||||||||||||||||||||||||||||||
| Total | $ | 109.9 | $ | 73.6 | $ | 18.9 | $ | 6.4 | $ | 11.0 | $ | 189.6 | $ | 106.5 | $ | 34.7 | $ | 27.9 | $ | 20.5 | ||||||||||||||||||
| (1) | Amounts represent future minimum lease payments. Capital lease obligations are included in accounts payable and accrued expenses and other long-term liabilities in the accompanying consolidated balance sheets. |
| (2) | The Company leases certain warehouse, distribution and office facilities, vehicles and office equipment under operating leases. The amounts presented in this line item represent commitments for minimum lease payments under non-cancelable operating leases. |
| (3) | During the normal course of its business, the Company enters into agreements to purchase goods and services, including purchase commitments for production materials, endorsement agreements with professional golfers and other endorsers, employment and consulting agreements, and intellectual property licensing agreements pursuant to which the Company is required to pay royalty fees. It is not possible to determine the amounts the Company will ultimately be required to pay under these agreements as they are subject to many variables including performance-based bonuses, severance arrangements, the Company’s sales levels, and reductions in payment obligations if designated minimum performance criteria are not achieved. The amounts listed approximate minimum purchase obligations, base compensation, and guaranteed minimum royalty payments the Company is obligated to pay under these agreements. The actual amounts paid under some of these agreements may be higher or lower than the amounts included. In the aggregate, the actual amount paid under these obligations is likely to be higher than the amounts listed as a result of the variable nature of these obligations. In addition, the Company also enters into unconditional purchase obligations with various vendors and suppliers of goods and services in the normal course of operations through purchase orders or other documentation or that are undocumented except for an invoice. Such unconditional purchase obligations are generally outstanding for periods less than a year and are settled by cash payments upon delivery of goods and services and are not reflected in this line item. |
| (4) | Amount represents the current and non-current portions of uncertain income tax positions as recorded on the Company's consolidated balance sheet as of December 31, |
| (5) | Amount represents accrued employee incentive compensation expense earned in |
| (6) | In December 2017, the Company entered into a long-term financing agreement (the "Equipment Note") secured by certain equipment at the Company's golf ball manufacturing facility. As of December 31, 2018, the Company had $9,628,000 outstanding under this agreement. For further discussion, see Note 5 "Financing Arrangements" in the Notes to Consolidated Financial Statements in this Form 10-K. |
In January 2019, to fund the purchase price under the Jack Wolfskin Purchase Agreement, the Company entered into the Credit Agreement with Bank of America, N.A. The Credit Agreement provides for the Term Loan Facility in an aggregate principal amount of $480.0 million, which was issued less $9.6 million in original issue discount. For further discussion, see Note 5 "Financing Arrangements" in the Notes to Consolidated Financial Statements in this Form 10-K.
During its normal course of business, the Company has made certain indemnities, commitments and guarantees under which it may be required to make payments in relation to certain transactions. These include (i) intellectual property indemnities to the
48
Company’s customers and licensees in connection with the use, sale and/or license of Company products or trademarks, (ii) indemnities to various lessors in connection with facility leases for certain claims arising from such facilities or leases, (iii) indemnities to vendors and service providers pertaining to the goods or services provided to the Company or based on the negligence or willful misconduct of the Company, and (iv) indemnities involving the accuracy of representations and warranties in certain contracts. In addition, the Company has made contractual commitments to each of its officers and certain other employees providing for severance payments upon the termination of employment. The Company also has consulting agreements that provide for payment of nominal fees upon the issuance of patents and/or the commercialization of research results. The Company has also issued guarantees in the form of a standby lettersletter of credit in the amount of $0.8$1.2 million as security for contingent liabilities under certain workers’ compensation insurance policies.
The duration of these indemnities, commitments and guarantees varies, and in certain cases may be indefinite. The majority of these indemnities, commitments and guarantees do not provide for any limitation on the maximum amount of future payments the Company could be obligated to make. Historically, costs incurred to settle claims related to indemnities have not been material to the Company’s financial position, results of operations or cash flows. In addition, the Company believes the likelihood is remote that payments under the commitments and guarantees described above will have a material effect on the Company’s financial condition. The fair value of indemnities, commitments and guarantees that the Company issued during the fiscal year ended December 31, 20162018 was not material to the Company’s financial position, results of operations or cash flows.
In addition to the contractual obligations listed above, the Company’s liquidity could also be adversely affected by an unfavorable outcome with respect to claims and litigation that the Company is subject to from time to time. See Note 1012 “Commitments & Contingencies” in the Notes to Consolidated Financial Statements in this Form 10-K.
Capital Resources
The Company does not currently have any material commitments for capital expenditures.
Off-Balance Sheet Arrangements
The Company has no material off-balance sheet arrangements as defined in Item 303(a)(4)(ii) of Regulation S-K .
Item 7A. Quantitative and Qualitative Disclosures about Market Risk
The Company uses derivative financial instruments to mitigate its exposure to changes in foreign currency exchange rates. Transactions involving these financial instruments are with creditworthy banks, including one of the bankbanks that is party to the Company’s ABL Facility (see Note 35 “Financing Arrangements” in the Notes to the Consolidated Financial Statements in this Form 10-K). The use of these instruments exposes the Company to market and credit risk which may at times be concentrated with certain counterparties, although counterparty nonperformance is not anticipated. The Company is also exposed to interest rate risk from its credit facilities.
Foreign Currency Fluctuations
As part of the Company’s risk management procedure, a sensitivity analysis model is used to measure the potential loss in future earnings of market-sensitive instruments resulting from one or more selected hypothetical changes in interest rates or foreign currency values. The sensitivity analysis model quantifies the estimated potential effect of unfavorable movements of 10% in foreign currencies to which the Company was exposed at December 31, 20162018 through its foreign currency forward contracts.
The estimated maximum one-day loss from the Company’s foreign currency forward contracts, calculated using the sensitivity analysis model described above, was $2.9is $50.0 million at December 31, 2016.2018 primarily related to the hedge executed in connection with the purchase price of Jack Wolfskin. The Company believes that such a hypothetical loss from its foreign currency forward contracts would be partially offset by increases in the value of the underlying transactions being hedged.
The sensitivity analysis model is a risk analysis tool and does not purport to represent actual losses in earnings that will be incurred by the Company, nor does it consider the potential effect of favorable changes in market rates. It also does not represent the maximum possible loss that may occur. Actual future gains and losses will differ from those estimated because of changes or differences in market rates and interrelationships, hedging instruments and hedge percentages, timing and other factors.
49
Interest Rate Fluctuations
The Company is exposed to interest rate risk from its credit facilities. Outstanding borrowings under the Company'sthese credit facilities accrue interest as described in Note 35 “Financing Arrangements” in the Notes to Consolidated Financial Statements in this Form 10-K. As part of the Company’s risk management procedures, a sensitivity analysis was performed to determine the impact of unfavorable changes in interest rates on the Company’s cash flows. The sensitivity analysis quantified that the incremental expense incurred by a 10% increase in interest rates would be $0.1$0.4 million over athe 12-month period.period ending on December 31, 2018.
Item 8. Financial Statements and Supplementary Data
The Company’s Consolidated Financial Statements as of December 31, 20162018 and 20152017 and for each of the three years in the period ended December 31, 2016,2018, together with the report of the Company's independent registered public accounting firm, are included in this Annual Report on Form 10-K beginning on page F-1.
Item 9. Changes in and Disagreements with Accountants on Accounting and Financial Disclosure
None.
Item 9A. Controls and Procedures
Disclosure Controls and Procedures. The Company carried out an evaluation, under the supervision and with the participation of the Company’s management, including the Company’s Chief Executive Officer and Chief Financial Officer, of the effectiveness, as of December 31, 2016,2018, of the Company’s disclosure controls and procedures (as defined in Rules 13a-15(e) and 15d-15(e) under the Exchange Act). Based upon that evaluation, the Chief Executive Officer and Chief Financial Officer concluded that the Company’s disclosure controls and procedures were effective as of December 31, 2016.2018.
Management’s Report on Internal Control over Financial Reporting. The Company’s management is responsible for establishing and maintaining effective internal control over financial reporting (as defined in Rules 13a-15(f) and 15d-15(f) of the Exchange Act). Management assessed the effectiveness of the Company’s internal control over financial reporting as of December 31, 2016.2018. In making this assessment, management used the criteria set forth by the Committee of Sponsoring Organizations of the Treadway Commission (“COSO”) in its report entitled Internal Control—Integrated Framework (2013). Based on that assessment, management concluded that as of December 31, 2016,2018, the Company’s internal control over financial reporting was effective based on the COSO criteria.
Changes in Internal Control over Financial Reporting. During the fourth quarter ended December 31, 2016,2018, there were no changes in the Company’s internal control over financial reporting that have materially affected, or are reasonably likely to materially affect, the Company’s internal control over financial reporting.
Because of the inherent limitations of internal control over financial reporting, including the possibility of collusion or improper management override of controls, material misstatements due to error or fraud may not be prevented or detected on a timely basis. Also, projections of any evaluation of the effectiveness of the internal control over financial reporting to future periods are subject to the risk that the controls may become inadequate because of changes in conditions, or that the degree of compliance with the policies or procedures may deteriorate.
The effectiveness of the Company’s internal control over financial reporting as of December 31, 20162018 has been audited by Deloitte & Touche LLP, the Company’s independent registered public accounting firm, as stated in its report which is included herein.
Item 9B. Other Information
None.
REPORT OF INDEPENDENT REGISTERED PUBLIC ACCOUNTING FIRM
To the Board of Directors and Shareholders of
Callaway Golf Company
Carlsbad, California
Opinion on Internal Control over Financial Reporting
We have audited the internal control over financial reporting of Callaway Golf Company and its subsidiaries (the “Company”) as of December 31, 2018, based on criteria established in Internal Control-Integrated Framework (2013) issued by the Committee of Sponsoring Organizations of the Treadway Commission (COSO). In our opinion, the Company maintained, in all material respects, effective internal control over financial reporting as of December 31, 2018, based on criteria established in Internal Control - Integrated Framework (2013) issued by COSO.
We have also audited, in accordance with the standards of the Public Company Accounting Oversight Board (United States) (PCAOB), the consolidated financial statements as of and for the year ended December 31, 2018, of the Company and our report dated February 28, 2019 expressed an unqualified opinion on those financial statements.
Basis for Opinion
The Company’s management is responsible for maintaining effective internal control over financial reporting and for its assessment of the effectiveness of internal control over financial reporting, included in the accompanying Management’s Report on Internal Control over Financial Reporting. Our responsibility is to express an opinion on the Company’s internal control over financial reporting based on our audit. We are a public accounting firm registered with the PCAOB and are required to be independent with respect to the Company in accordance with the U.S. federal securities laws and the applicable rules and regulations of the Securities and Exchange Commission and the PCAOB.
We conducted our audit in accordance with the standards of the PCAOB. Those standards require that we plan and perform the audit to obtain reasonable assurance about whether effective internal control over financial reporting was maintained in all material respects. Our audit included obtaining an understanding of internal control over financial reporting, assessing the risk that a material weakness exists, testing and evaluating the design and operating effectiveness of internal control based on the assessed risk, and performing such other procedures as we considered necessary in the circumstances. We believe that our audit provides a reasonable basis for our opinion.
Definition and Limitations of Internal Control over Financial Reporting
A company’s internal control over financial reporting is a process designed to provide reasonable assurance regarding the reliability of financial reporting and the preparation of financial statements for external purposes in accordance with generally accepted accounting principles. A company’s internal control over financial reporting includes those policies and procedures that (1) pertain to the maintenance of records that, in reasonable detail, accurately and fairly reflect the transactions and dispositions of the assets of the company; (2) provide reasonable assurance that transactions are recorded as necessary to permit preparation of financial statements in accordance with generally accepted accounting principles, and that receipts and expenditures of the company are being made only in accordance with authorizations of management and directors of the company; and (3) provide reasonable assurance regarding prevention or timely detection of unauthorized acquisition, use, or disposition of the company’s assets that could have a material effect on the financial statements.
Because of its inherent limitations, internal control over financial reporting may not prevent or detect misstatements. Also, projections of any evaluation of effectiveness to future periods are subject to the risk that the controls may become inadequate because of changes in conditions, or that the degree of compliance with the policies or procedures may deteriorate.
/s/ DELOITTE & TOUCHE LLP
Costa Mesa, California
February 28, 2019
51
PART III
Item 10. Directors, Executive Officers and Corporate Governance
Certain information concerning the Company’s executive officers is included under the caption “Executive Officers of the Registrant” following Part I, Item 1 of this Form 10-K. The other information required by Item 10 will be included in the Company’s definitive Proxy Statement under the captions "Proposal No. 1 - Election of Directors," “Section 16(a) Beneficial Ownership Reporting Compliance” and “Board of Directors and Corporate Governance,” to be filed with the Commission within 120 days after the end of fiscalcalendar year 20162018 pursuant to Regulation 14A, which information is incorporated herein by this reference.
Item 11. Executive Compensation
The Company maintains employee benefit plans and programs in which its executive officers are participants. Copies of certain of these plans and programs are set forth or incorporated by reference as Exhibits to this report. Information required by Item 11 will be included in the Company’s definitive Proxy Statement under the captions “Executive Officer Compensation,” “Executive Officer Compensation - Compensation Committee Report” and “Board of Directors and Corporate Governance,” to be filed with the Commission within 120 days after the end of fiscalcalendar year 20162018 pursuant to Regulation 14A, which information is incorporated herein by this reference.
Item 12. Security Ownership of Certain Beneficial Owners and Management and Related Shareholder Matters
The information required by Item 12 will be included in the Company’s definitive Proxy Statement under the caption “Beneficial Ownership of the Company’s Securities,” to be filed with the Commission within 120 days after the end of fiscalcalendar year 20162018 pursuant to Regulation 14A, which information is incorporated herein by this reference.
Securities Authorized for Issuance under Equity Compensation Plans
The following table provides information about the number of stock options and shares underlying restricted stock units and performance share units outstanding and authorized for issuance under all equity compensation plans of the Company as of December 31, 2016.2018. See Note 1214 “Share-Based Employee Compensation” in the Notes to Consolidated Financial Statements in this Form 10-K for further discussion of the equity plans of the Company.
Equity Compensation Plan Information
| Plan Category | Number of Shares to be Issued Upon Exercise of Outstanding Options and Vesting of Restricted Stock Units and Performance Share Units(3) | Weighted Average Exercise Price of Outstanding Options(4) | Number of Shares Remaining Available for Future Issuance | Number of Shares to be Issued Upon Exercise of Outstanding Options and Vesting of Restricted Stock Units and Performance Share Units(3) | Weighted Average Exercise Price of Outstanding Options(4) | Number of Shares Remaining Available for Future Issuance | ||||||||||||||||||||||
| (In thousands, except dollar amounts) | (In thousands, except dollar amounts) | |||||||||||||||||||||||||||
Equity Compensation Plans Approved by Shareholders(1) | 4,791(2) | $ | 7.92 | 5,040 | 3,055(2) | $ | 6.54 | 10,402 | ||||||||||||||||||||
| (1) | Consists of the following plans: Callaway Golf Company Amended and Restated 2004 Incentive Plan ("2004 Incentive Plan") and 2013 Non-Employee Directors Stock Incentive Plan ("2013 Directors Plan"). The 2004 Incentive Plan permits the award of stock options, restricted stock awards, restricted stock units, performance share units and various other stock-based awards. The 2013 Directors Plan permits the award of stock options, restricted stock and restricted stock units. |
| (2) | Includes |
| (3) | Outstanding shares underlying restricted stock units granted under the 2004 Incentive Plan and 2013 Directors Plan include |
| (4) | Does not include shares underlying restricted stock units and performance share units, which do not have an exercise price. |
Item 13. Certain Relationships, Related Transactions and Director Independence
The information required by Item 13 will be included in the Company’s definitive Proxy Statement under the captions “Transactions with Related Persons” and “Board of Directors and Corporate Governance,” to be filed with the Commission within 120 days after the end of fiscalcalendar year 20162018 pursuant to Regulation 14A, which information is incorporated herein by this reference.
Item 14. Principal Accountant Fees and Services
The information included in Item 14 will be included in the Company’s definitive Proxy Statement under the caption “Information Concerning Independent Registered Public Accounting Firm” to be filed with the Commission within 120 days after the end of fiscalcalendar year 20162018 pursuant to Regulation 14A, which information is incorporated herein by this reference.
PART IV
Item 15. Exhibits and Financial Statement Schedules
Documents filed as part of this report:
1. Financial Statements. The following consolidated financial statements of Callaway Golf Company and its subsidiaries required to be filed pursuant to Part II, Item 8 of this Form 10-K, are included in this Annual Report on Form 10-K beginning on page F-1:
•Report of Independent Registered Public Accounting Firm;
•Consolidated Balance Sheets as of December 31, 20162018 and 2015;2017;
•Consolidated Statements of Operations for the years ended December 31, 2016, 20152018, 2017 and 2014;2016;
•Consolidated Statements of Comprehensive Income (Loss) for the years ended December 31, 2016, 20152018, 2017 and 2014;2016;
•Consolidated Statements of Cash Flows for the years ended December 31, 2016, 20152018, 2017 and 2014;2016;
•Consolidated Statements of Shareholders’ Equity for the years ended December 31, 2016, 20152018, 2017 and 2014;2016; and
•Notes to Consolidated Financial Statements.
2. Financial statement schedules are omitted because they are not applicable or the required information is shown in the Consolidated Financial Statements or notes thereto.
3. Exhibits.
A copy of any of the following exhibits will be furnished to any beneficial owner of the Company’s common stock, or any person from whom the Company solicits a proxy, upon written request and payment of the Company’s reasonable expenses in furnishing any such exhibit. All such requests should be directed to the Company’s Investor Relations Department at Callaway Golf Company, 2180 Rutherford Road, Carlsbad, CA 92008.
| 2.1 | |||
| 2.2 | |||
| 3.1 | Certificate of Incorporation, incorporated herein by this reference to Exhibit 3.1 to the Company's Current Report on Form 8-K, as filed with the Commission on July 1, 1999 (file no. 1-10962). | ||
| 3.2 | |||
| 4.1 | |||
| Executive Compensation Contracts/Plans | |||
| 10.1 | |||
| 10.2 | |||
| 10.3 | |||
| 10.7 | |||
| 10.8 | |||
| 10.15 | |||
| 10.16 | |||
| 10.17 | |||
55
| 10.18 | |||
| 10.20 | |||
| 10.21 | |||
| 10.22 | |||
| 10.23 | |||
| 10.24 | |||
| 10.25 | |||
| 10.26 | |||
| Indemnification Agreement, effective June 7, 2001, between Callaway Golf and Ronald S. Beard, incorporated herein by this reference to Exhibit | |||
| 10.34 | |||
56
| 10.35 | |||
| 10.36 | |||
| Other Contracts | |||
| 10.37 | |||
| 10.38 | |||
| 10.39 | |||
| 10.40 | |||
| 10.41 | |||
| 10.42 | |||
| 10.43 | |||
57
| 10.45 | |||
| 10.46 | |||
| 10.47 | |||
| 10.48 | |||
| 10.49 | |||
| 10.50 | |||
| 10.51 | |||
| 21.1 | |||
| 23.1 | |||
| 24.1 | |||
| 31.1 | |||
| 31.2 | |||
58
| 32.1 | |||
| 101.1 | XBRL Instance Document † | ||
| 101.2 | XBRL Taxonomy Extension Schema Document † | ||
| 101.3 | XBRL Taxonomy Extension Calculation Linkbase Document † | ||
| 101.4 | XBRL Taxonomy Extension Definition Linkbase Document † | ||
| 101.5 | XBRL Taxonomy Extension Label Linkbase Document † | ||
| 101.6 | XBRL Taxonomy Extension Presentation Linkbase Document † | ||
† Included in this report
SIGNATURES
Pursuant to the requirements of Section 13 or 15(d) of the Securities Exchange Act of 1934, the Registrant has duly caused this report to be signed on its behalf by the undersigned, thereunto duly authorized.
| CALLAWAY GOLF COMPANY | |||
| By: | /S/ OLIVER G. BREWER III | ||
| Oliver G. Brewer III | |||
| President and Chief Executive Officer | |||
Date: February 24, 201728, 2019
Pursuant to the requirements of the Securities Exchange Act of 1934, this report has been signed by the following persons on behalf of the registrant and in the capacities and as of the dates indicated.
| Signature | Title | Dated as of | |
| Principal Executive Officer: | |||
| /S/ OLIVER G. BREWER III | President and Chief Executive Officer, Director | February | |
| Oliver G. Brewer III | |||
| Principal Financial Officer: | |||
| /S/ | February | ||
| Principal Accounting Officer: | |||
| /S/ JENNIFER THOMAS | Vice President and Chief Accounting Officer | February | |
| Jennifer Thomas | |||
| Non-Management Directors: | |||
| * | Director | February | |
| Samuel H. Armacost | |||
| * | Chairman of the Board | February | |
| Ronald S. Beard | |||
| * | Director | February | |
| John C. Cushman, III | |||
| * | Director | February | |
| Laura J. Flanagan | |||
| * | Director | February 28, 2019 | |
| Russell L. Fleischer | |||
| * | Director | February 28, 2019 | |
| John F. Lundgren | |||
| * | Director | February | |
| Adebayo O. Ogunlesi | |||
| * | Director | February | |
| Linda B. Segre | |||
| * | Director | February | |
| Anthony S. Thornley | |||
| *By: | /S/ | |
| Attorney-in-fact | ||
INDEX TO CONSOLIDATED FINANCIAL STATEMENTS
F-1
REPORT OF INDEPENDENT REGISTERED PUBLIC ACCOUNTING FIRM
To the Board of Directors and Shareholders of
Callaway Golf Company
Carlsbad, California
Opinion on the Financial Statements
We have audited the accompanying consolidated balance sheets of Callaway Golf Company and subsidiaries (the “Company”) as of December 31, 20162018 and 2015,2017, and the related consolidated statements of operations, comprehensive income, cash flows and shareholders' equity, for each of the three years in the period ended December 31, 2016. 2018, and the related notes (collectively referred to as the “financial statements”). In our opinion, the financial statements present fairly, in all material respects, the financial position of the Company as of December 31, 2018 and 2017, and the results of its operations and its cash flows for each of the three years in the period ended December 31, 2018, in conformity with accounting principles generally accepted in the United States of America.
We have also audited, in accordance with the standards of the Public Company Accounting Oversight Board (United States) (PCAOB), the Company’s internal control over financial reporting as of December 31, 2018, based on the criteria established in Internal Control-Integrated Framework (2013) issued by the Committee of Sponsoring Organizations of the Treadway Commission and our report dated February 28, 2019, expressed an unqualified opinion on the Company’s internal control over financial reporting.
Basis for Opinion
These financial statements are the responsibility of the Company’s management. Our responsibility is to express an opinion on thesethe Company's financial statements based on our audits. We are a public accounting firm registered with the PCAOB and are required to be independent with respect to the Company in accordance with the U.S. federal securities laws and the applicable rules and regulations of the Securities and Exchange Commission and the PCAOB.
We conducted our audits in accordance with the standards of the Public Company Accounting Oversight Board (United States).PCAOB. Those standards require that we plan and perform the audit to obtain reasonable assurance about whether the financial statements are free of material misstatement. An audit includesmisstatement, whether due to error or fraud. Our audits included performing procedures to assess the risks of material misstatement of the financial statements, whether due to error or fraud, and performing procedures that respond to those risks. Such procedures included examining, on a test basis, evidence supportingregarding the amounts and disclosures in the financial statements. An auditOur audits also includes assessingincluded evaluating the accounting principles used and significant estimates made by management, as well as evaluating the overall presentation of the financial statement presentation.statements. We believe that our audits provide a reasonable basis for our opinion.
/s/ DELOITTE & TOUCHE LLP
Costa Mesa, California
February 24, 201728, 2019
We have served as the Company’s auditor since 2002.
F-2
CALLAWAY GOLF COMPANY
CONSOLIDATED BALANCE SHEETS
(In thousands, except share and per share data)
| December 31, | December 31, | |||||||||||||
| 2016 | 2015 | 2018 | 2017 | |||||||||||
| ASSETS | ||||||||||||||
| Current assets: | ||||||||||||||
| Cash and cash equivalents | $ | 125,975 | $ | 49,801 | $ | 63,981 | $ | 85,674 | ||||||
| Accounts receivable, net | 127,863 | 115,607 | 71,374 | 94,725 | ||||||||||
| Inventories | 189,400 | 208,883 | 338,057 | 262,486 | ||||||||||
| Income taxes receivable | 637 | 487 | 713 | 542 | ||||||||||
| Other current assets | 16,550 | 16,709 | 50,781 | 22,557 | ||||||||||
| Total current assets | 460,425 | 391,487 | 524,906 | 465,984 | ||||||||||
| Property, plant and equipment, net | 54,475 | 55,808 | 88,472 | 70,227 | ||||||||||
| Intangible assets, net | 88,731 | 88,782 | 224,692 | 225,758 | ||||||||||
| Goodwill | 25,593 | 26,500 | 55,816 | 56,429 | ||||||||||
| Deferred taxes, net | 114,707 | 6,962 | 75,079 | 91,398 | ||||||||||
| Investment in golf-related ventures (Note 7) | 48,997 | 53,315 | ||||||||||||
| Investment in golf-related ventures (Note 8) | 72,238 | 70,495 | ||||||||||||
| Other assets | 8,354 | 8,370 | 11,741 | 10,866 | ||||||||||
| Total assets | $ | 801,282 | $ | 631,224 | $ | 1,052,944 | $ | 991,157 | ||||||
| LIABILITIES AND SHAREHOLDERS’ EQUITY | ||||||||||||||
| Current liabilities: | ||||||||||||||
| Accounts payable and accrued expenses | $ | 132,521 | $ | 122,620 | $ | 208,653 | $ | 176,127 | ||||||
| Accrued employee compensation and benefits | 32,568 | 33,518 | 43,172 | 40,173 | ||||||||||
| Asset-based credit facility | 11,966 | 14,969 | 40,300 | 87,755 | ||||||||||
| Accrued warranty expense | 5,395 | 5,706 | 7,610 | 6,657 | ||||||||||
| Equipment note, short-term | 2,411 | 2,367 | ||||||||||||
| Income taxes payable | 4,404 | 1,823 | 1,091 | 1,295 | ||||||||||
| Total current liabilities | 186,854 | 178,636 | 303,237 | 314,374 | ||||||||||
| Long-term liabilities: | ||||||||||||||
| Income tax liability | 3,608 | 3,476 | 4,430 | 4,602 | ||||||||||
| Deferred taxes, net | 1,596 | 35,093 | 1,796 | 1,822 | ||||||||||
| Equipment note, long-term | 7,218 | 9,448 | ||||||||||||
| Long-term other | 624 | 1,074 | 1,955 | 1,536 | ||||||||||
| Commitments & contingencies (Note 10) | ||||||||||||||
| Commitments & contingencies (Note 12) | ||||||||||||||
| Shareholders’ equity: | ||||||||||||||
| Preferred stock, $.01 par value, 3,000,000 shares authorized, 0 shares issued and outstanding at both December 31, 2016 and 2015 | — | — | ||||||||||||
| Common stock, $.01 par value, 240,000,000 shares authorized, 94,214,295 shares and 93,769,199 shares issued at December 31, 2016 and 2015, respectively | 942 | 938 | ||||||||||||
| Preferred stock, $.01 par value, 3,000,000 shares authorized, 0 shares issued and outstanding at both December 31, 2018 and 2017 | — | — | ||||||||||||
| Common stock, $.01 par value, 240,000,000 shares authorized, 95,648,648 shares and 95,042,557 shares issued at December 31, 2018 and 2017, respectively | 956 | 950 | ||||||||||||
| Additional paid-in capital | 330,206 | 322,793 | 341,241 | 335,222 | ||||||||||
| Retained earnings | 287,129 | 101,047 | 413,799 | 324,081 | ||||||||||
| Accumulated other comprehensive loss | (18,466 | ) | (11,813 | ) | (13,700 | ) | (6,166 | ) | ||||||
| Less: Common stock held in treasury, at cost, 97,837 shares and 2,075 shares at December 31, 2016 and 2015, respectively | (905 | ) | (20 | ) | ||||||||||
| Less: Common stock held in treasury, at cost, 1,137,470 shares and 411,013 shares at December 31, 2018 and 2017, respectively | (17,722 | ) | (4,456 | ) | ||||||||||
| Total Callaway Golf Company shareholders’ equity | 598,906 | 412,945 | 724,574 | 649,631 | ||||||||||
| Non-controlling interest in consolidated entity (Note 7) | 9,694 | — | ||||||||||||
| Non-controlling interest in consolidated entity (Note 9) | 9,734 | 9,744 | ||||||||||||
| Total shareholders’ equity | 608,600 | 412,945 | 734,308 | 659,375 | ||||||||||
| Total liabilities and shareholders’ equity | $ | 801,282 | $ | 631,224 | $ | 1,052,944 | $ | 991,157 | ||||||
The accompanying notes are an integral part of these consolidated financial statements.
F-3
CALLAWAY GOLF COMPANY
CONSOLIDATED STATEMENTS OF OPERATIONS
(In thousands, except per share data)
| Year Ended December 31, | Year Ended December 31, | |||||||||||||||||||||
| 2016 | 2015 | 2014 | 2018 | 2017 | 2016 | |||||||||||||||||
| Net sales | $ | 871,192 | $ | 843,794 | $ | 886,945 | $ | 1,242,834 | $ | 1,048,736 | $ | 871,192 | ||||||||||
| Cost of sales | 486,181 | 486,161 | 529,019 | 664,465 | 568,288 | 486,181 | ||||||||||||||||
| Gross profit | 385,011 | 357,633 | 357,926 | 578,369 | 480,448 | 385,011 | ||||||||||||||||
| Selling expenses | 235,556 | 228,910 | 234,231 | 308,709 | 270,890 | 235,556 | ||||||||||||||||
| General and administrative expenses | 71,969 | 68,567 | 61,662 | 100,466 | 94,153 | 71,969 | ||||||||||||||||
| Research and development expenses | 33,318 | 33,213 | 31,285 | 40,752 | 36,568 | 33,318 | ||||||||||||||||
| Total operating expenses | 340,843 | 330,690 | 327,178 | 449,927 | 401,611 | 340,843 | ||||||||||||||||
| Income from operations | 44,168 | 26,943 | 30,748 | 128,442 | 78,837 | 44,168 | ||||||||||||||||
| Interest income | 621 | 388 | 438 | 594 | 454 | 621 | ||||||||||||||||
| Interest expense | (2,368 | ) | (8,733 | ) | (9,499 | ) | (5,543 | ) | (4,365 | ) | (2,368 | ) | ||||||||||
| Gain on sale of investments in golf-related ventures | 17,662 | — | — | — | — | 17,662 | ||||||||||||||||
| Other income (expense), net | (1,690 | ) | 1,465 | (48 | ) | 7,779 | (6,871 | ) | (1,690 | ) | ||||||||||||
| Income before income taxes | 58,393 | 20,063 | 21,639 | 131,272 | 68,055 | 58,393 | ||||||||||||||||
| Income tax (benefit) provision | (132,561 | ) | 5,495 | 5,631 | ||||||||||||||||||
| Income tax provision (benefit) | 26,018 | 26,388 | (132,561 | ) | ||||||||||||||||||
| Net income | 190,954 | 14,568 | 16,008 | 105,254 | 41,667 | 190,954 | ||||||||||||||||
| Less: Net income attributable to non-controlling interests | 1,054 | — | — | 514 | 861 | 1,054 | ||||||||||||||||
| Net income attributable to Callaway Golf Company | $ | 189,900 | $ | 14,568 | $ | 16,008 | $ | 104,740 | $ | 40,806 | $ | 189,900 | ||||||||||
| Earnings per common share: | ||||||||||||||||||||||
| Basic | $ | 2.02 | $ | 0.18 | $ | 0.21 | $ | 1.11 | $ | 0.43 | $ | 2.02 | ||||||||||
| Diluted | $ | 1.98 | $ | 0.17 | $ | 0.20 | $ | 1.08 | $ | 0.42 | $ | 1.98 | ||||||||||
| Weighted-average common shares outstanding: | ||||||||||||||||||||||
| Basic | 94,045 | 83,116 | 77,559 | 94,579 | 94,329 | 94,045 | ||||||||||||||||
| Diluted | 95,845 | 84,611 | 78,385 | 97,153 | 96,577 | 95,845 | ||||||||||||||||
| Dividends paid per common share | $ | 0.04 | $ | 0.04 | $ | 0.04 | ||||||||||||||||
The accompanying notes are an integral part of these consolidated financial statements.
F-4
CALLAWAY GOLF COMPANY
CONSOLIDATED STATEMENTS OF COMPREHENSIVE INCOME
(In thousands)
| Year Ended December 31, | Year Ended December 31, | |||||||||||||||||||||
| 2016 | 2015 | 2014 | 2018 | 2017 | 2016 | |||||||||||||||||
| Net income | $ | 189,900 | $ | 14,568 | $ | 16,008 | $ | 105,254 | $ | 41,667 | $ | 190,954 | ||||||||||
| Other comprehensive income (loss): | ||||||||||||||||||||||
| Change in fair value of derivative instruments | 1,976 | 525 | — | |||||||||||||||||||
| Change in derivative instruments | 153 | (2,492 | ) | 1,976 | ||||||||||||||||||
| Foreign currency translation adjustments | (8,831 | ) | (11,542 | ) | (12,973 | ) | (7,672 | ) | 14,361 | (8,831 | ) | |||||||||||
| Comprehensive income, before income tax on other comprehensive income items | 183,045 | 3,551 | 3,035 | 97,735 | 53,536 | 184,099 | ||||||||||||||||
| Income tax expense on other comprehensive income items | (902 | ) | — | — | ||||||||||||||||||
| Income tax expense (benefit) on derivative instruments | 282 | 594 | (902 | ) | ||||||||||||||||||
| Comprehensive income | 182,143 | 3,551 | 3,035 | 98,017 | 54,130 | 183,197 | ||||||||||||||||
| Less: Comprehensive income (loss) attributable to non-controlling interests | (1,104 | ) | — | — | 297 | 163 | (1,104 | ) | ||||||||||||||
| Comprehensive income attributable to Callaway Golf Company | $ | 183,247 | $ | 3,551 | $ | 3,035 | $ | 97,720 | $ | 53,967 | $ | 184,301 | ||||||||||
The accompanying notes are an integral part of these consolidated financial statements.
F-5
CALLAWAY GOLF COMPANY
CONSOLIDATED STATEMENTS OF CASH FLOWS
(In thousands)
| Year Ended December 31, | Year Ended December 31, | |||||||||||||||||||||
| 2016 | 2015 | 2014 | 2018 | 2017 | 2016 | |||||||||||||||||
| Cash flows from operating activities: | ||||||||||||||||||||||
| Net income | $ | 189,900 | $ | 14,568 | $ | 16,008 | $ | 105,254 | $ | 41,667 | $ | 190,954 | ||||||||||
| Adjustments to reconcile net income to net cash provided by operating activities: | ||||||||||||||||||||||
| Depreciation and amortization | 16,586 | 17,379 | 21,236 | 19,948 | 17,605 | 16,586 | ||||||||||||||||
| Inventory step-up from acquisitions | — | 3,112 | — | |||||||||||||||||||
| Deferred taxes | (141,447 | ) | 128 | 604 | 21,705 | 24,594 | (141,447 | ) | ||||||||||||||
| Share-based compensation | 8,965 | 7,542 | 5,740 | 13,530 | 12,647 | 8,965 | ||||||||||||||||
| Gain on disposal of long-lived assets and deferred gain amortization | (116 | ) | (1,006 | ) | (1,331 | ) | ||||||||||||||||
| (Gain) loss on disposal of long-lived assets and deferred gain amortization | (13 | ) | 1,490 | (116 | ) | |||||||||||||||||
| Gain on sale of investments in golf-related ventures | (17,662 | ) | — | — | — | — | (17,662 | ) | ||||||||||||||
| Unrealized gains on foreign currency forward contracts | (683 | ) | — | — | ||||||||||||||||||
| Net income attributable to non-controlling interests | 1,054 | — | — | |||||||||||||||||||
| Discount amortization on convertible notes | — | 531 | 739 | |||||||||||||||||||
| Changes in assets and liabilities: | ||||||||||||||||||||||
| Unrealized (gains) losses on foreign currency forward contracts | (4,585 | ) | 1,023 | (683 | ) | |||||||||||||||||
| Changes in assets and liabilities, net of effects of acquisitions: | ||||||||||||||||||||||
| Accounts receivable, net | (16,965 | ) | (11,591 | ) | (23,314 | ) | (2,109 | ) | 51,618 | (16,965 | ) | |||||||||||
| Inventories | 24,251 | (5,347 | ) | 47,334 | (78,017 | ) | (52,010 | ) | 24,251 | |||||||||||||
| Other assets | 168 | 7,060 | 2,884 | (9,975 | ) | (6,533 | ) | 168 | ||||||||||||||
| Accounts payable and accrued expenses | 12,553 | 5,382 | (30,578 | ) | 22,268 | 15,414 | 12,553 | |||||||||||||||
| Accrued employee compensation and benefits | (489 | ) | (3,395 | ) | 6,328 | 3,148 | 7,021 | (489 | ) | |||||||||||||
| Income taxes receivable and payable | 2,493 | (370 | ) | (4,125 | ) | 82 | (2,155 | ) | 2,493 | |||||||||||||
| Accrued warranty expense | (311 | ) | 99 | (799 | ) | 953 | 1,262 | (311 | ) | |||||||||||||
| Other liabilities | (587 | ) | (399 | ) | (3,846 | ) | 93 | 944 | (587 | ) | ||||||||||||
| Net cash provided by operating activities | 77,710 | 30,581 | 36,880 | 92,282 | 117,699 | 77,710 | ||||||||||||||||
| Cash flows from investing activities: | ||||||||||||||||||||||
| Acquisitions, net of cash acquired | — | (183,478 | ) | — | ||||||||||||||||||
| Capital expenditures | (36,825 | ) | (26,203 | ) | (16,152 | ) | ||||||||||||||||
| Investment in golf-related ventures | (1,743 | ) | (21,499 | ) | (1,448 | ) | ||||||||||||||||
| Proceeds from sale of property, plant and equipment | 43 | 587 | 20 | |||||||||||||||||||
| Proceeds from sale of investments in golf-related ventures | 23,429 | — | — | — | — | 23,429 | ||||||||||||||||
| Investment in golf-related ventures | (1,448 | ) | (940 | ) | (14,771 | ) | ||||||||||||||||
| Note receivable | 3,104 | (3,104 | ) | — | — | — | 3,104 | |||||||||||||||
| Capital expenditures | (16,152 | ) | (14,369 | ) | (10,753 | ) | ||||||||||||||||
| Proceeds from sale of property, plant and equipment | 20 | 2 | 458 | |||||||||||||||||||
| Net cash provided by (used in) investing activities | 8,953 | (18,411 | ) | (25,066 | ) | |||||||||||||||||
| Net cash (used in) provided by investing activities | (38,525 | ) | (230,593 | ) | 8,953 | |||||||||||||||||
| Cash flows from financing activities: | ||||||||||||||||||||||
| (Repayments of) proceeds from credit facilities, net | (47,455 | ) | 75,789 | (3,003 | ) | |||||||||||||||||
| (Repayments of) proceeds from long-term debt | (2,186 | ) | 11,815 | — | ||||||||||||||||||
| Exercise of stock options | 2,637 | 6,565 | 2,291 | 1,636 | 5,362 | 2,637 | ||||||||||||||||
| Acquisition of treasury stock | (22,456 | ) | (16,617 | ) | (5,144 | ) | ||||||||||||||||
| Dividends paid, net | (3,764 | ) | (3,391 | ) | (3,105 | ) | (3,788 | ) | (3,773 | ) | (3,764 | ) | ||||||||||
| Acquisition of treasury stock | (5,144 | ) | (1,960 | ) | (1,006 | ) | ||||||||||||||||
| Repayment of asset-based credit facilities, net | (3,003 | ) | (266 | ) | (10,425 | ) | ||||||||||||||||
| Credit facility amendment costs | — | — | (608 | ) | — | (2,246 | ) | — | ||||||||||||||
| Distributions to non-controlling interest | (821 | ) | (974 | ) | — | |||||||||||||||||
| Other financing activities | 20 | — | (33 | ) | — | — | 20 | |||||||||||||||
| Net cash (used in) provided by financing activities | (9,254 | ) | 948 | (12,886 | ) | (75,070 | ) | 69,356 | (9,254 | ) | ||||||||||||
| Effect of exchange rate changes on cash and cash equivalents | (1,235 | ) | (952 | ) | 1,914 | (380 | ) | 3,237 | (1,235 | ) | ||||||||||||
| Net increase in cash and cash equivalents | 76,174 | 12,166 | 842 | |||||||||||||||||||
| Net (decrease) increase in cash and cash equivalents | (21,693 | ) | (40,301 | ) | 76,174 | |||||||||||||||||
| Cash and cash equivalents at beginning of year | 49,801 | 37,635 | 36,793 | 85,674 | 125,975 | 49,801 | ||||||||||||||||
| Cash and cash equivalents at end of year | $ | 125,975 | $ | 49,801 | $ | 37,635 | $ | 63,981 | $ | 85,674 | $ | 125,975 | ||||||||||
| Supplemental disclosures: | ||||||||||||||||||||||
| Cash paid for interest and fees | $ | 1,626 | $ | 6,641 | $ | 8,124 | $ | 4,990 | $ | 4,594 | $ | 1,626 | ||||||||||
| Cash paid for income taxes, net | $ | 6,143 | $ | 5,454 | $ | 8,098 | $ | 9,564 | $ | 10,788 | $ | 6,143 | ||||||||||
| Noncash investing and financing activities: | ||||||||||||||||||||||
| Conversion of convertible notes to common stock, net of discount (Note 3) | $ | — | $ | 109,105 | $ | — | ||||||||||||||||
| Accrued capital expenditures at period end | $ | 2,672 | $ | 2,007 | $ | 736 | ||||||||||||||||
| Issuance of treasury stock and common stock for compensatory stock awards released from restriction | $ | 916 | $ | 3,762 | $ | 86 | $ | 5,744 | $ | 5,813 | $ | 920 | ||||||||||
| Accrued capital expenditures at period end | $ | 736 | $ | 2,255 | $ | 466 | ||||||||||||||||
| Acquisition of treasury stock for minimum statutory withholding taxes | $ | — | $ | — | $ | 7 | ||||||||||||||||
The accompanying notes are an integral part of these consolidated financial statements.
F-6
CALLAWAY GOLF COMPANY
CONSOLIDATED STATEMENTS OF SHAREHOLDERS’SHAREHOLDERS' EQUITY
(In thousands)
| Callaway Golf Shareholders | Callaway Golf Shareholders | |||||||||||||||||||||||||||||||||||||||||||||||||||||||||||||||||||||||||||||||||
| Common Stock | Additional Paid-in Capital | Retained Earnings | Accumulated Other Comprehensive Income (Loss) | Treasury Stock | Total Callaway Golf Company Shareholders' Equity | Non-controlling Interest | Total | Common Stock | Additional Paid-in Capital | Retained Earnings | Accumulated Other Comprehensive Loss | Treasury Stock | Total Callaway Golf Company Shareholders' Equity | Non-controlling Interest | Total | |||||||||||||||||||||||||||||||||||||||||||||||||||||||||||||||||||
| Shares | Amount | Shares | Amount | Shares | Amount | Shares | Amount | |||||||||||||||||||||||||||||||||||||||||||||||||||||||||||||||||||||||||||
| Balance, December 31, 2013 | 78,315 | $ | 783 | $ | 205,712 | $ | 77,038 | $ | 12,177 | (967 | ) | $ | (11,091 | ) | $ | 284,619 | $ | — | $ | 284,619 | ||||||||||||||||||||||||||||||||||||||||||||||||||||||||||||||
| Equity issuance costs | — | — | (7 | ) | — | — | — | — | (7 | ) | — | (7 | ) | |||||||||||||||||||||||||||||||||||||||||||||||||||||||||||||||||||||
| Balance, December 31, 2015 | 93,769 | $ | 938 | $ | 322,793 | $ | 101,047 | $ | (11,813 | ) | (2 | ) | $ | (20 | ) | $ | 412,945 | $ | — | $ | 412,945 | |||||||||||||||||||||||||||||||||||||||||||||||||||||||||||||
| Acquisition of treasury stock | — | — | — | — | — | (133 | ) | (1,013 | ) | (1,013 | ) | — | (1,013 | ) | — | — | — | — | — | (572 | ) | (5,144 | ) | (5,144 | ) | (5,144 | ) | |||||||||||||||||||||||||||||||||||||||||||||||||||||||
| Exercise of stock options | — | — | (1,284 | ) | — | — | 312 | 3,575 | 2,291 | — | 2,291 | — | — | (697 | ) | — | — | 374 | 3,334 | 2,637 | — | 2,637 | ||||||||||||||||||||||||||||||||||||||||||||||||||||||||||||
| Tax deficit from exercise of stock options and compensatory stock | — | — | (26 | ) | — | — | — | — | (26 | ) | — | (26 | ) | — | — | 20 | — | — | — | — | 20 | — | 20 | |||||||||||||||||||||||||||||||||||||||||||||||||||||||||||
| Compensatory awards released from restriction | 58 | 1 | (87 | ) | — | — | 8 | 86 | — | — | — | 440 | 4 | (920 | ) | — | — | 101 | 916 | — | — | — | ||||||||||||||||||||||||||||||||||||||||||||||||||||||||||||
| Share-based compensation | — | — | 5,740 | — | — | — | — | 5,740 | — | 5,740 | — | — | 8,965 | — | — | — | — | 8,965 | — | 8,965 | ||||||||||||||||||||||||||||||||||||||||||||||||||||||||||||||
| Stock dividends | 1 | — | 9 | (9 | ) | — | — | — | — | — | — | 5 | — | 45 | (54 | ) | — | 1 | 9 | — | — | — | ||||||||||||||||||||||||||||||||||||||||||||||||||||||||||||
| Cash dividends | — | — | — | (3,105 | ) | — | — | — | (3,105 | ) | — | (3,105 | ) | |||||||||||||||||||||||||||||||||||||||||||||||||||||||||||||||||||||
| Cash dividends ($0.04 per share) | — | — | — | (3,764 | ) | — | — | — | (3,764 | ) | — | (3,764 | ) | |||||||||||||||||||||||||||||||||||||||||||||||||||||||||||||||||||||
| Equity adjustment from foreign currency translation | — | — | — | — | (12,973 | ) | — | — | (12,973 | ) | — | (12,973 | ) | — | — | — | — | (7,727 | ) | — | — | (7,727 | ) | (1,104 | ) | (8,831 | ) | |||||||||||||||||||||||||||||||||||||||||||||||||||||||
| Non-controlling interest | — | — | — | — | — | — | — | — | 9,744 | 9,744 | ||||||||||||||||||||||||||||||||||||||||||||||||||||||||||||||||||||||||
| Equity adjustment from derivative instruments, net of tax | — | — | — | — | 1,074 | — | — | 1,074 | — | 1,074 | ||||||||||||||||||||||||||||||||||||||||||||||||||||||||||||||||||||||||
| Net income | — | — | — | 16,008 | — | — | — | 16,008 | — | 16,008 | — | — | — | 189,900 | — | — | — | 189,900 | 1,054 | 190,954 | ||||||||||||||||||||||||||||||||||||||||||||||||||||||||||||||
| Balance, December 31, 2014 | 78,374 | $ | 784 | $ | 210,057 | $ | 89,932 | $ | (796 | ) | (780 | ) | $ | (8,443 | ) | $ | 291,534 | $ | — | $ | 291,534 | |||||||||||||||||||||||||||||||||||||||||||||||||||||||||||||
| Convertible notes to common stock exchange | 15,000 | 150 | 108,955 | — | — | — | — | 109,105 | — | 109,105 | ||||||||||||||||||||||||||||||||||||||||||||||||||||||||||||||||||||||||
| Balance, December 31, 2016 | 94,214 | 942 | 330,206 | 287,129 | (18,466 | ) | (98 | ) | (905 | ) | 598,906 | 9,694 | 608,600 | |||||||||||||||||||||||||||||||||||||||||||||||||||||||||||||||||||||
| Acquisition of treasury stock | — | — | — | — | — | (217 | ) | (1,960 | ) | (1,960 | ) | — | (1,960 | ) | — | — | — | — | — | (1,536 | ) | (16,617 | ) | (16,617 | ) | — | (16,617 | ) | ||||||||||||||||||||||||||||||||||||||||||||||||||||||
| Exercise of stock options | 277 | 3 | (5 | ) | — | — | 637 | 6,567 | 6,565 | — | 6,565 | — | — | (1,899 | ) | — | — | 681 | 7,261 | 5,362 | — | 5,362 | ||||||||||||||||||||||||||||||||||||||||||||||||||||||||||||
| Tax deficit from exercise of stock options | — | — | (1 | ) | — | — | — | — | (1 | ) | — | (1 | ) | |||||||||||||||||||||||||||||||||||||||||||||||||||||||||||||||||||||
| Compensatory awards released from restriction | 110 | 1 | (3,763 | ) | — | — | 353 | 3,762 | — | — | — | 825 | 8 | (5,813 | ) | — | — | 542 | 5,805 | — | — | — | ||||||||||||||||||||||||||||||||||||||||||||||||||||||||||||
| Share-based compensation | — | — | 7,542 | — | — | — | — | 7,542 | — | 7,542 | — | — | 12,647 | — | — | — | — | 12,647 | — | 12,647 | ||||||||||||||||||||||||||||||||||||||||||||||||||||||||||||||
| Stock dividends | 8 | — | 8 | (62 | ) | — | 5 | 54 | — | — | — | 4 | — | 81 | (81 | ) | — | — | — | — | — | — | ||||||||||||||||||||||||||||||||||||||||||||||||||||||||||||
| Cash dividends | — | — | — | (3,391 | ) | — | — | — | (3,391 | ) | — | (3,391 | ) | |||||||||||||||||||||||||||||||||||||||||||||||||||||||||||||||||||||
| Cash dividends ($0.04 per share) | — | — | — | (3,773 | ) | — | — | — | (3,773 | ) | — | (3,773 | ) | |||||||||||||||||||||||||||||||||||||||||||||||||||||||||||||||||||||
| Equity adjustment from foreign currency translation | — | — | — | — | (11,542 | ) | — | — | (11,542 | ) | — | (11,542 | ) | — | — | — | — | 14,198 | — | — | 14,198 | 163 | 14,361 | |||||||||||||||||||||||||||||||||||||||||||||||||||||||||||
| Equity adjustment from derivative instruments | — | — | — | — | 525 | — | — | 525 | — | 525 | ||||||||||||||||||||||||||||||||||||||||||||||||||||||||||||||||||||||||
| Equity adjustment from derivative instruments, net of tax | — | — | — | — | (1,898 | ) | — | — | (1,898 | ) | — | (1,898 | ) | |||||||||||||||||||||||||||||||||||||||||||||||||||||||||||||||||||||
| Distributions to non-controlling interests | — | — | — | — | — | — | — | — | (974 | ) | (974 | ) | ||||||||||||||||||||||||||||||||||||||||||||||||||||||||||||||||||||||
| Net income | — | — | — | 14,568 | — | — | — | 14,568 | — | 14,568 | — | — | — | 40,806 | — | — | — | 40,806 | 861 | 41,667 | ||||||||||||||||||||||||||||||||||||||||||||||||||||||||||||||
| Balance, December 31, 2015 | 93,769 | $ | 938 | $ | 322,793 | $ | 101,047 | $ | (11,813 | ) | (2 | ) | $ | (20 | ) | $ | 412,945 | $ | — | $ | 412,945 | |||||||||||||||||||||||||||||||||||||||||||||||||||||||||||||
| Balance, December 31, 2017 | 95,043 | 950 | 335,222 | 324,081 | (6,166 | ) | (411 | ) | (4,456 | ) | 649,631 | 9,744 | 659,375 | |||||||||||||||||||||||||||||||||||||||||||||||||||||||||||||||||||||
| Adoption of accounting standard (Note 3) | — | — | — | (11,185 | ) | — | — | — | (11,185 | ) | — | (11,185 | ) | |||||||||||||||||||||||||||||||||||||||||||||||||||||||||||||||||||||
| Acquisition of treasury stock | — | — | — | — | — | (572 | ) | (5,144 | ) | (5,144 | ) | (5,144 | ) | — | — | — | — | — | (1,412 | ) | (22,456 | ) | (22,456 | ) | (22,456 | ) | ||||||||||||||||||||||||||||||||||||||||||||||||||||||||
| Exercise of stock options | — | — | (697 | ) | — | — | 374 | 3,334 | 2,637 | — | 2,637 | — | — | (1,734 | ) | — | — | 231 | 3,370 | 1,636 | — | 1,636 | ||||||||||||||||||||||||||||||||||||||||||||||||||||||||||||
| Tax benefit from exercise of stock options | — | — | 20 | — | — | — | 20 | — | 20 | |||||||||||||||||||||||||||||||||||||||||||||||||||||||||||||||||||||||||
| Compensatory awards released from restriction | 440 | 4 | (920 | ) | — | — | 101 | 916 | — | — | — | 606 | 6 | (5,744 | ) | — | — | 451 | 5,738 | — | — | — | ||||||||||||||||||||||||||||||||||||||||||||||||||||||||||||
| Share-based compensation | — | — | 8,965 | — | — | — | — | 8,965 | — | 8,965 | — | — | 13,530 | — | — | — | — | 13,530 | — | 13,530 | ||||||||||||||||||||||||||||||||||||||||||||||||||||||||||||||
| Stock dividends | 5 | — | 45 | (54 | ) | — | 1 | 9 | — | — | — | — | — | (33 | ) | (49 | ) | — | 3 | 82 | — | — | — | |||||||||||||||||||||||||||||||||||||||||||||||||||||||||||
| Cash dividends | — | — | — | (3,764 | ) | — | — | — | (3,764 | ) | — | (3,764 | ) | |||||||||||||||||||||||||||||||||||||||||||||||||||||||||||||||||||||
| Cash dividends ($0.04 per share) | — | — | — | (3,788 | ) | — | — | — | (3,788 | ) | — | (3,788 | ) | |||||||||||||||||||||||||||||||||||||||||||||||||||||||||||||||||||||
| Equity adjustment from foreign currency translation | — | — | — | — | (7,727 | ) | — | (7,727 | ) | (1,104 | ) | (8,831 | ) | — | — | — | — | (7,969 | ) | — | — | (7,969 | ) | 297 | (7,672 | ) | ||||||||||||||||||||||||||||||||||||||||||||||||||||||||
| Equity adjustment from derivative instruments | — | — | — | — | 1,074 | — | — | 1,074 | — | 1,074 | ||||||||||||||||||||||||||||||||||||||||||||||||||||||||||||||||||||||||
| Non-controlling interests (see Note 7) | — | — | — | — | — | — | — | — | 9,744 | 9,744 | ||||||||||||||||||||||||||||||||||||||||||||||||||||||||||||||||||||||||
| Equity adjustment from derivative instruments, net of tax | — | — | — | — | 435 | — | — | 435 | — | 435 | ||||||||||||||||||||||||||||||||||||||||||||||||||||||||||||||||||||||||
| Distributions to non-controlling interests (see Note 9) | — | — | — | — | — | — | — | — | (821 | ) | (821 | ) | ||||||||||||||||||||||||||||||||||||||||||||||||||||||||||||||||||||||
| Net income | — | — | — | 189,900 | — | — | — | 189,900 | 1,054 | 190,954 | — | — | — | 104,740 | — | — | — | 104,740 | 514 | 105,254 | ||||||||||||||||||||||||||||||||||||||||||||||||||||||||||||||
| Balance, December 31, 2016 | 94,214 | $ | 942 | $ | 330,206 | $ | 287,129 | $ | (18,466 | ) | (98 | ) | $ | (905 | ) | $ | 598,906 | $ | 9,694 | $ | 608,600 | |||||||||||||||||||||||||||||||||||||||||||||||||||||||||||||
| Balance, December 31, 2018 | 95,649 | 956 | 341,241 | 413,799 | (13,700 | ) | (1,138 | ) | (17,722 | ) | 724,574 | 9,734 | 734,308 | |||||||||||||||||||||||||||||||||||||||||||||||||||||||||||||||||||||
The accompanying notes are an integral part of these consolidated financial statements.
F-7
CALLAWAY GOLF COMPANY
NOTES TO CONSOLIDATED FINANCIAL STATEMENTS
Note 1. The Company
Callaway Golf Company (“Callaway Golf” or the “Company”), a Delaware corporation, together with its subsidiaries, designs, manufactures and sells high quality golf clubs (drivers, fairway woods, hybrids, irons, wedges and putters), golf balls, golf bags and other golf-related accessories. The Company generally sells its golf-related products to golf retailers (including pro shops at golf courses and off-course retailers), sporting goods retailers, Internet retailers and mass merchants, directly and through its wholly-owned subsidiaries, and to third-party distributors in the United States and in over 100 countries around the world. The Company also sells pre-owned Callaway Golfgolf products through its website www.callawaygolfpreowned.com and sells new Callaway Golfgolf products through its websites www.callawaygolf.com and www.odysseygolf.com. In 2016, the Company further expanded its business into golf and lifestyle apparel and accessories with the completion of the golf apparel joint venture in Japan in July 2016. In 2017, the Company acquired OGIO International, Inc. ("OGIO"), a leading manufacturer of high quality bags, accessories and apparel in the golf and lifestyle categories, and TravisMathew, LLC ("TravisMathew"), a golf and lifestyle apparel company. These acquisitions are expected to enhance the Company's presence in golf while also providing a platform for future growth in the lifestyle category. In connection with the apparel joint venture in Japan and the TravisMathew acquisition, the Company now has retail locations in Japan and the U.S. that sell Callaway and TravisMathew branded apparel, gear and other golf accessories directly to consumers. In addition, the Company licenses its trademarks and service marks in exchange for a royalty fee to third parties for use on golf related accessories including golf apparel and footwear, golf gloves, prescription eyewear and practice aids. aids as well as OGIO branded gear and accessories.
In January 20172019, the Company completed the acquisition of OGIO International, Inc.,JW Stargazer Holding GmbH, the owner of the international, premium outdoor apparel, footwear and equipment brand, Jack Wolfskin ("Jack Wolfskin") for €460,000,000 or approximately $525,000,000, subject to working capital adjustments. The Company financed the acquisition with a leading manufacturer of high quality bags, accessories and apparelTerm Loan B facility in the golfaggregate principal amount of $480,000,000 (see Note 5). Jack Wolfskin designs premium products targeted at the active outdoor and lifestyleurban outdoor customer categories. This acquisition is expected to further enhance the Company's presence in golf while also providinglifestyle category and provide a platform for future growth in the lifestyle category.active outdoor and urban outdoor categories, which the Company believes are complementary to its portfolio of brands and product capabilities.
Note 2. Summary of Significant Accounting Policies
Principles of Consolidation
The accompanying consolidated financial statements include the accounts of the Company and its domestic and foreign subsidiaries. All intercompany transactions and balances have been eliminated in consolidation.
Use of Estimates
The preparation of financial statements in conformity with accounting principles generally accepted in the United States ("GAAP") requires management to make estimates and judgments that affect the reported amounts of assets and liabilities and disclosure of contingent assets and liabilities as of the date of the financial statements and the reported amounts of revenues and expenses during the reporting period. The Company bases its estimates on historical experience and on various other assumptions that are believed to be reasonable under the circumstances. Examples of such estimates include provisions for warranty, uncollectible accounts receivable, inventory obsolescence, sales returns, tax contingencies and estimates related to the Tax Cuts and Jobs Act (the "Tax Act") enacted in December 2017, estimates on the valuation of share-based awards and recoverability of long-lived assets and investments. Actual results may materially differ from these estimates. On an ongoing basis, the Company reviews its estimates to ensure that these estimates appropriately reflect changes in its business or as new information becomes available.
Recent Accounting Standards
In March 2016,August 2018, the Financial Accounting Standards Board ("FASB") issued Accounting Standards Update ("ASU") No. 2016-09, "Compensation—Stock Compensation2018-13, "Fair Value Measurement (Topic 718)820): ImprovementsDisclosure Framework—Changes to Employee Share-Based Payment Accounting.the Disclosure Requirements for Fair Value Measurement." This amendment is intended to simplify several aspects of the accounting for share-based payment transactions, including the income tax consequences, classification of awards as either equity or liabilities, and classification on the statement of cash flows. The amendment is effective for annual periods beginning after December 15, 2016, and interim periods therein. Early application is permitted. The Company anticipates that the adoption ofamendments in this ASU will impactremove, modify or add to the Company's effective tax rate as a result of the recognition of excess tax benefits or deficienciesdisclosure requirements for fair value measurements in the income tax provision rather than in additional paid in capital in the period in which share-based payment transactions vest,ASC Topic 820, "Fair Value Measurement" ("ASC Topic 820). The amendments are settled or expire. In addition, the classification of excess tax benefits or deficiencies on the statement of cash flows will be included in operating activities and will no longer be classified separately as a financing activity. The adoption of this ASU could also impact the number of shares that the Company would need to repurchase for employee payroll tax withholding purposes. The Company does not expect to change its accounting policy on the recognition of estimated forfeitures.
F-8
public companies until the effective date of this ASU. The Company is currently evaluating the impact this ASU will have on its consolidated financial statements and disclosures.
In August 2017, the FASB issued ASU No. 2017-12, "Derivatives and Hedging (Topic 815): Targeted Improvements to Accounting for Hedging Activities." The new standard is designed to refine and expand hedge accounting for both financial (e.g., interest rate) and commodity risks. Its provisions create more transparency around how economic results are presented, both on the face of the financial statements and in the footnotes. It also makes certain targeted improvements to simplify the application of hedge accounting guidance. The new standard is effective for public business entities for fiscal years beginning after December 15, 2018, and interim periods within those fiscal years. The Company will adopt this ASU on January 1, 2019 and, based on the Company's evaluation, this ASU will not have a material impact on the Company'sits consolidated financial statements. As of December 31, 2016, the Company had $1,273,000 of deferred revenue related to unredeemed gift cards.statements and disclosures.
In February 2016, the FASB issued ASU No. 2016-02, "Leases (Topic 842).," as amended by ASU 2018-11 issued in July 2018, which provides entities with an additional (and optional) transition method to adopt the new lease standard, as well as a practical expedient for lessors on non-lease components. Under the new guidance, lessees will be required to recognize the following for all leases (with the exception of short-term leases) at the commencement date:(i) a lease liability, which is a lessee's obligation to make lease payments arising from a lease, measured on a discounted basis; and(ii) a right-of-use asset, which is an asset that represents the lessee’s right to use, or control the use of, a specified asset for the lease term.Under the new guidance, lessor accounting is largely unchanged and lessees will no longer be provided with a source of off-balance sheet financing. This ASU 2016-02 is effective for fiscal years beginning after December 15, 2018, including interim periods within those fiscal years. Early adoption is permitted.Lessees (for capital and operating leases) and lessors (for sales-type, direct financing, and operating leases) must apply a modified retrospective transition approach for leases existing at, or entered into, after the beginning of the earliest comparative period presented in the financial statements. The modified retrospective approach would not require any transition accounting for leases that expired before the earliest comparative period presented. LesseesIn July 2018, the FASB issued ASU 2018-11, under which entities have the option to not restate the comparative periods in the period of adoption when transitioning to Topic 842, and lessors may not applyrecognize a full retrospective transition approach.cumulative-effect adjustment to the opening balance of retained earnings in the period of adoption. The Company plans to adopt ASU 2016-02 and the transition amendments provided by ASU 2018-11, on the effective date of January 1, 2019. The Company plans to elect transition-related accounting policies under ASU 2016-02, which allow entities to not reassess, as of the adoption date, (1) any expired or existing contracts that are leases or contain leases, (2) the classification of any expired or existing leases and (3) initial direct costs for any existing leases. The Company has a significant number of operating leases that are classified as off-balance sheet commitments under the current accounting rules. On January 4, 2019, the Company completed the acquisition of Jack Wolfskin and due to the timing of this acquisition, the Company is currentlystill evaluating Jack Wolfskin's lease portfolio under ASU 2016-02. Based on the impactCompany's completed assessment of its existing lease portfolio, the Company estimates it will record right of use assets and lease liabilities in the range of $55,000,000 and $65,000,000 upon the adoption of this standard, which does not include the leases for Jack Wolfskin. These estimates will change as the Company continues to progress with the implementation and its assessment of the Jack Wolfskin lease portfolio. The addition of the Jack Wolfskin leases will more than double the Company's combined lease portfolio and therefore, the Company expects the addition of the Jack Wolfskin leases to significantly increase the estimated amount of its right of use assets and lease liabilities. On a consolidated basis, the adoption of this ASU will have a significant, material impact on the Company's consolidated balance sheet. The Company anticipates the impact to its consolidated statement of operations and statement of shareholders' equity to be immaterial.
Adoption of New Accounting Standards
On January 1, 2018, the Company adopted ASU No. 2014-09, "Revenue from Contracts with Customers (Topic 606)" using the modified retrospective approach, and applied this guidance to all contracts as of the adoption date as discussed in Note 3 below. This new standard requires companies to identify contractual performance obligations and determine whether revenue should be recognized at a point in time or over time based on when control of goods and services transfers to a customer. In addition, it requires companies to determine the transaction price for a contract, which is the price used to recognize revenue as well as the amount of consideration companies expect to collect from its customers in exchange for the promised goods or services in the contract. Because the transaction price can vary as a result of variable consideration for items such as sales returns, discounts, rebates, price concessions and incentives, companies are required to include an estimate of variable consideration in the transaction price. The adoption of this new standard accelerated the timing of when the Company recognizes variable consideration for certain sales program incentives, which include sell-through promotions and price concessions or price reductions that it offers to its customers. As a result, the Company now estimates the variable consideration related to these sales programs at the time of the sale based on a rate that includes historical and forecasted data, as opposed to when these programs are approved and announced. Upon the adoption of Topic 606, the Company recorded a cumulative adjustment to beginning retained earnings of $11,185,000, as noted in the table below, which reflects the estimated amount of variable consideration related to future sales programs for
F-9
revenue recognized in prior periods. In addition, under Topic 606, the liability for sales returns is now recorded separately from the cost recovery of inventory. As a result, the Company now records the cost recovery in other current assets. The liability for sales returns continues to be recorded as a reduction to accounts receivable. Prior period information that is presented for comparative purposes has not been restated and continues to be reported under the accounting standards that were in effect in those periods.
| Balance Sheet | Balance at December 31, 2017 | Adjustments Due To Topic 606 | Balance at January 1, 2018 | ||||||||
| Accounts receivable, net | $ | 94,725 | $ | (31,881 | ) | $ | 62,844 | ||||
| Deferred taxes, net | $ | 91,398 | $ | 4,971 | $ | 96,369 | |||||
| Other current assets | $ | 22,557 | $ | 15,725 | $ | 38,282 | |||||
| Retained earnings | $ | 324,081 | $ | (11,185 | ) | $ | 312,896 | ||||
The impact of adopting the new revenue standard on the Company's consolidated statements of operations for the year ended December 31, 2018 was as follows:
| December 31, 2018 | |||||||||||
| As Reported | Balances Without Adoption of Topic 606 | Effect of Change Increase/(Decrease) | |||||||||
| Net Sales | $ | 1,242,834 | $ | 1,244,612 | $ | (1,778 | ) | ||||
| Income tax provision | $ | 26,018 | $ | 26,627 | $ | (609 | ) | ||||
| Net income | $ | 104,740 | $ | 105,909 | $ | (1,169 | ) | ||||
The impact of adopting the new revenue standard on the Company's consolidated balance sheet as of December 31, 2018 was as follows:
| December 31, 2018 | |||||||||||
| As Reported | Balances Without Adoption of Topic 606 | Effect of Change Increase/(Decrease) | |||||||||
| Assets | |||||||||||
| Accounts receivable, net | $ | 71,374 | $ | 103,847 | $ | (32,473 | ) | ||||
| Deferred taxes, net | $ | 75,079 | $ | 69,981 | $ | 5,098 | |||||
| Other current assets | $ | 50,781 | $ | 36,242 | $ | 14,539 | |||||
| Liabilities and Equity | |||||||||||
| Income tax liability | $ | 1,091 | $ | 1,573 | $ | (482 | ) | ||||
| Retained earnings | $ | 413,799 | $ | 426,153 | $ | (12,354 | ) | ||||
On January 1, 2018, the Company early adopted ASU No. 2018-02 “Income Statement—Reporting Comprehensive Income (Topic 220): Reclassification of Certain Tax Effects from Accumulated Other Comprehensive Income,” which provides financial statementsstatement preparers with an option to reclassify stranded tax effects within accumulated other comprehensive income to retained earnings in each period in which the effect of the change in the U.S. federal corporate income tax rate resulting from the Tax Act (or portion thereof) resulted in a disproportionate tax effect. The amendments are effective for all organizations for fiscal years beginning after December 15, 2018, and disclosures.interim periods within those fiscal years. The Company adopted this policy using the specific identification method, and the adoption of this policy did not have a material impact on the Company’s consolidated financial statements.
On January 1, 2018, the Company adopted ASU No. 2016-04, "Liabilities—Extinguishment of Liabilities (Subtopic 405-20): Recognition of Breakage for Certain Prepaid Stored-Value Products," which clarifies when it is acceptable to recognize the unredeemed portion of prepaid gift cards into income. The adoption of this ASU did not change the Company's accounting for gift
F-10
cards, and therefore did not impact the Company's consolidated financial statements. As of December 31, 2018, the Company had $1,096,000 of deferred revenue related to unredeemed gift cards.
On January 1, 2018, the Company adopted No. 2016-01, "Financial Instruments─Instruments - Overall (Subtopic 825-10): Recognition and Measurement of Financial Assets and Financial Liabilities." The amendment requires (i) equity investments (except those accounted for under the equity method of accounting, or those that result in consolidation of the investee) to be measured at fair value with changes in fair value recognized in net income, (ii) public business entities to use the exit price notion when measuring the fair value of financial instruments for disclosure purposes, and (iii) separate presentation of financial assets and financial liabilities by measurement category and form of financial asset (i.e., securities or loans and receivables). This amendment eliminates the requirement for public business entities to disclose the method(s) and significant assumptions used to estimate the fair value that is required to be disclosed for financial instruments measured at amortized cost. This amendment is effective for public companies for fiscal years beginning after December 15, 2017, including interim periods within those fiscal years. As of December 31, 2016,2018, the Company had an investment in Topgolf International, Inc. of $48,997,000 that was$72,238,000, consisting of common stock and various classes of preferred stock. Because Topgolf is a privately held company, the Company's investment in Topgolf is accounted for at cost inless impairments, if any, as this investment is without a readily determinable fair value. In accordance with ASC Topic 325, “Investments—Other.” TheASU No. 2016-01, if there is an observable price change as a result of an orderly transaction for the identical or similar investment of the same issuer, the Company believeswould be required to assess the fair value impact, if any, on each identified or similar class of Topgolf stock held by the Company, and write such stock up or down to its investment in Topgolf to be significantly higher than its cost basis (see Note 6).estimated fair value. If there are any observable price changes related to this investment, or a similar investment of the same issuer in fiscal years beginning after December 15, 2017, the Company would be requiredadjustment to writemeasure this investment up or down to its estimatedat fair value which could have a significantmaterial effect on the Company's financial position and results of operations.
| Years Ended December 31, | |||||||||||
| 2016 | 2015 | 2014 | |||||||||
| (In thousands) | |||||||||||
| Beginning balance | $ | 8,148 | $ | 8,944 | $ | 7,334 | |||||
| Provision | 38,444 | 35,746 | 36,980 | ||||||||
| Sales returns | (37,251 | ) | (36,542 | ) | (35,370 | ) | |||||
| Ending balance | $ | 9,341 | $ | 8,148 | $ | 8,944 | |||||
Warranty Policy
The Company has a stated two-year warranty policy for its golf clubs. The Company’s policy is to accrue the estimated cost of satisfying future warranty claims at the time the sale is recorded. In estimating its future warranty obligations, the Company considers various relevant factors, including the Company’s stated warranty policies and practices, the historical frequency of claims, and the cost to replace or repair its products under warranty.
The increase in warranty expense and the claims paid in 2018 and 2017 compared to 2016 was primarily due to additional claims related to certain 2015 putter models. The Company believes it has resolved the quality issues related to these older putters.
The following table provides a reconciliation of the activity related to the Company’s reserve foraccrued warranty expense:
| Years Ended December 31, | Years Ended December 31, | |||||||||||||||||||||
| 2016 | 2015 | 2014 | 2018 | 2017 | 2016 | |||||||||||||||||
| (In thousands) | (In thousands) | |||||||||||||||||||||
| Beginning balance | $ | 5,706 | $ | 5,607 | $ | 6,406 | $ | 6,657 | $ | 5,395 | $ | 5,706 | ||||||||||
| Provision | 5,493 | 5,220 | 4,724 | 9,437 | 9,434 | 5,493 | ||||||||||||||||
| Claims paid/costs incurred | (5,804 | ) | (5,121 | ) | (5,523 | ) | (8,484 | ) | (8,172 | ) | (5,804 | ) | ||||||||||
| Ending balance | $ | 5,395 | $ | 5,706 | $ | 5,607 | $ | 7,610 | $ | 6,657 | $ | 5,395 | ||||||||||
Fair Value Measurements
Fair value is defined as the price that would be received to sell an asset or the price paid to transfer a liability (the exit price) in the principal and most advantageous market for the asset or liability in an orderly transaction between market participants. The Company measures and discloses the fair value of nonfinancial and financial assets and liabilities utilizing a hierarchy of valuation techniques based on whether the inputs to a fair value measurement are considered to be observable or unobservable in a marketplace. Observable inputs reflect market data obtained from independent sources, while unobservable inputs reflect the Company’s market assumptions. This hierarchy requires the use of observable market data when available. The measurement of assets and liabilities at fair value are classified using the following three-tier hierarchy:
Level 1: Quoted market prices in active markets for identical assets or liabilities;
F-11
Level 2: Quoted prices for similar instruments in active markets; quoted prices for identical or similar instruments in markets that are not active; and model-derived valuations in which significant inputs and significant value drivers are observable in active markets; and
Level 3: Fair value measurements derived from valuation techniques in which one or more significant inputs or significant value drivers are unobservable.
The Company measures fair value using a set of standardized procedures that are outlined herein for all assets and liabilities which are required to be measured at fair value. When available, the Company utilizes quoted market prices from an independent third-party source to determine fair value and classifies such items in Level 1. In some instances where a market price is available, but the instrument is in an inactive or over-the-counter market, the Company consistently applies the dealer (market maker) pricing estimate and uses a midpoint approach on bid and ask prices from financial institutions to determine the reasonableness of these estimates. Assets and liabilities subject to this fair value valuation approach are typically classified as Level 2.
Items valued using internally-generated valuation techniques are classified according to the lowest level input that is significant to the fair value measurement. As a result, the asset or liability could be classified in either Level 2 or Level 3 even though there may be some significant inputs that are readily observable. The Company utilizes a discounted cash flow valuation model whenever applicable to derive a fair value measurement on long-lived assets and goodwill and intangible assets. The Company uses its internal cash flow estimates discounted at an appropriate rate, quoted market prices, royalty rates when available and independent appraisals as appropriate. The Company also considers its counterparty’s and own credit risk on derivatives and other liabilities measured at their fair value.
Advertising Costs
The Company's primary advertising costs are from television and print media advertisements. The Company’s policy is to expense advertising costs, including production costs, as incurred. Advertising expenses for 2018, 2017 and 2016 2015were $72,164,000, $62,898,000 and 2014 were $59,003,000, $57,392,000 and $55,502,000, respectively.
Research and Development Costs
Research and development costs are expensed as incurred. Research and development costs for 2018, 2017 and 2016 2015were $40,752,000, $36,568,000 and 2014 were $33,318,000, $33,213,000 and $31,285,000, respectively.
Foreign Currency Translation and Transactions
A significant portion of the Company’s business is conducted outside of the United States in currencies other than the U.S. dollar. As a result, changes in foreign currency exchange rates can have a significant effect on the Company’s financial results. Revenues and expenses that are denominated in foreign currencies are translated using the average exchange rate for the period. Assets and liabilities are translated at the rate of exchange on the balance sheet date. Gains and losses from assets and liabilities denominated in a currency other than the functional currency of the entity onin which they reside are generally recognized currently in the Company's statements of operations. Gains and losses from the translation of foreign subsidiary financial statements into U.S. dollars are included in accumulated other comprehensive income or loss (see Accumulated Other Comprehensive Income policy below).
The Company recorded a net gainloss in foreign currency transactions of $226,000$2,824,000 in 2018, and net gains of $808,000 and $226,000 in 2017 and 2016, and a net loss of $1,611,000 and $6,198,000 in 2015 and 2014, respectively.respectively,
Derivatives and Hedging
In order to mitigate the impact of foreign currency translation on transactions, the Company uses foreign currency forward contracts that are accounted for as non-designated and designated hedges pursuant to ASC Topic 815, “Derivatives and Hedging” ("ASC Topic 815"). ASC Topic 815 requires that an entity recognize all derivatives as either assets or liabilities in the balance sheet, measure those instruments at fair value and recognize changes in the fair value of derivatives in earnings in the period of change unless the derivative qualifies as designated cash flow hedge that offsets certain exposures. Certain criteria must be satisfied in order for derivative financial instruments to be classified and accounted for as a cash flow hedge. Gains and losses from the remeasurement of qualifying cash flow hedges are recorded as a component of other comprehensive income and released into earnings as a component of cost of goods sold or net sales during the period in which the hedged transaction takes place. Gains and losses on the ineffective portion of hedges (hedges that do not meet accounting requirements due to ineffectiveness) and
F-12
derivatives that are not elected for hedge accounting treatment are immediately recorded in earnings as a component of other income (expense).
Cash and Cash Equivalents
Cash equivalents are highly liquid investments purchased with original maturities of three months or less.
Trade Accounts Receivable
The Company records itsCompany's trade accounts receivable are recorded at net realizable value. This value, which includes an appropriate allowance for estimated uncollectible accountscredit losses, as well as liabilities related to reflect any loss anticipated on the trade accounts receivable balancesproduct returns and charged to the provision for doubtful accounts. Ansales programs as described below in Note 3. The estimate of uncollectible amountscredit losses is made by management based upon historical bad debts, current customer receivable balances, age of customer receivable balances, the customer’s financial condition and current economic trends, all of which are subject to change. Actual uncollected amounts have historically been generally consistent with the Company’s expectations. In general,The Company's payment terms on its receivables from customers are generally 60 days or less.
From time to time, dependent upon the cost, the Company haspurchases trade insurance to mitigate the risk of uncollectible accounts on its outstanding accounts receivable. The Company considers thisany available insurance coverage when estimating its provision for uncollectible accounts. Insurance claim recoveries from this trade insurance are applied to the Company’s outstanding accounts receivable or are recorded as a reduction to bad debt expense in the period in which the claim is received. In October 2016, the Company’s trade insurance policy expired and as of December 31, 2016, the Company did not have trade insurance on its outstanding accounts receivable.
estimated credit losses.
| Years Ended December 31, | |||||||||||
| 2016 | 2015 | 2014 | |||||||||
| (In thousands) | |||||||||||
| Beginning balance | $ | 5,645 | $ | 6,460 | $ | 11,655 | |||||
| Provision | 2,398 | 992 | 2,143 | ||||||||
| Write-off of uncollectible amounts, net of recoveries | (2,315 | ) | (1,807 | ) | (7,338 | ) | |||||
| Ending balance | $ | 5,728 | $ | 5,645 | $ | 6,460 | |||||
| Years Ended December 31, | |||||||||||
| 2018 | 2017 | 2016 | |||||||||
| (In thousands) | |||||||||||
| Beginning balance | $ | 4,447 | $ | 5,728 | $ | 5,645 | |||||
| Provision for credit losses | 2,257 | 2,335 | 2,398 | ||||||||
| Write-off of uncollectible amounts, net of recoveries | (1,094 | ) | (3,616 | ) | (2,315 | ) | |||||
| Ending balance | $ | 5,610 | $ | 4,447 | $ | 5,728 | |||||
Inventories
Inventories are valued at the lower of cost or marketnet realizable value. Cost is determined using the first-in, first-out (FIFO) method. The inventory balance, which includes material, labor and manufacturing overhead costs, is recorded net of an estimate for obsolete or unmarketable inventory. This estimate is based upon current inventory levels, sales trends and historical experience as well as management’s estimates of market conditions and forecasts of future product demand, all of which are subject to change.
Property, Plant and Equipment
Property, plant and equipment are stated at cost less accumulated depreciation. Depreciation is computed using the straight-line method over estimated useful lives generally as follows:
| Buildings and improvements | 10-30 years |
| Machinery and equipment | 5-10 years |
| Furniture, computers and equipment | 3-5 years |
| Production molds | 2-5 years |
Normal repairs and maintenance costs are expensed as incurred. Expenditures that materially increase values, change capacities or extend useful lives are capitalized. The related costs and accumulated depreciation of disposed assets are eliminated and any resulting gain or loss on disposition is included in net income/(loss). Construction in-process consists primarily of costs associated with building improvements, machinery and equipment that have not yet been placed into service, unfinished molds as well as in-process internally developedinternal-use software.
In accordance with ASC Topic 350-40, “Internal-Use Software,” the Company capitalizes certain costs incurred in connection with developing or obtaining internal use software. Costs incurred in the preliminary project stage are expensed. All direct external costs incurred to develop internal-use software during the development stage are capitalized and amortized using the straight-line method over the remaining estimated useful lives. Costs such as maintenance and training are expensed as incurred.
F-13
Long-Lived Assets
In accordance with ASC Topic 360-10-35, “Impairment or Disposal of Long-Lived Assets”, the Company assesses potential impairments of its long-lived assets whenever events or changes in circumstances indicate that the asset’s carrying value may not be recoverable. An impairment charge would be recognized when the carrying amount of a long-lived asset or asset group is not recoverable and exceeds its fair value. The carrying amount of a long-lived asset or asset group is not recoverable if it exceeds the sum of the undiscounted cash flows expected to result from the use and eventual disposition of the asset or asset group.
Goodwill and Intangible Assets
Goodwill and intangible assets, which consist of trade names, trademarks, service marks, trade dress, patents and other intangible assets, were acquired in connection with the acquisition of Odyssey Sports, Inc. in 1997, FrogTrader, Inc. in 2004, OGIO in January 2017, TravisMathew in August 2017, and certain foreign distributors. The Company expects to record goodwill and other intangible assets related to the acquisition of Jack Wolfskin in January 2019.
In accordance with ASC Topic 350, “Intangibles—Goodwill and Other,” goodwill and intangible assets with indefinite lives are not amortized but instead are measured for impairment at least annually or more frequently when events indicate that an impairment exists. The Company calculates impairment as the excess of the carrying value of goodwill and other indefinite-lived intangible assets over their estimated fair value. If the carrying value exceeds the estimate of fair value a write-down is recorded. To determine fair value, the Company uses its internal discounted cash flow estimates, quoted market prices, royalty rates when available and independent appraisals when appropriate. The Company completed its annual impairment test and fair value analysis of goodwill and other indefinite-lived intangible assets as of December 31, 2016,2018, and the estimated fair values of the Company’s reporting units, in the United States, United Kingdom, Canada and Korea, as well as the estimated fair values of certain trade names and trademarks, significantly exceeded their carrying values. As a result, no impairment was recorded as of December 31, 2016.2018.
Intangible assets that are determined to have definite lives are amortized over their estimated useful lives and are measured for impairment only when events or circumstances indicate the carrying value may be impaired in accordance with ASC Topic 360-10-35 discussed above. See Note 57 for further discussion of the Company’s goodwill and intangible assets.
Investments
The Company determines the appropriate classification of its investments at the time of acquisition and reevaluates such classification at each balance sheet date. Investments that do not have readily determinable fair values are stated at cost. The Company monitors investments for impairment whenever events or changes in accordance with ASC Topic 325-35-2, “Impairment” and ASC Topic 320-35-17 through 35-35, “Scope of Impairment Guidance.”circumstances indicate that the investment's carrying value may not be recoverable. An impairment charge would be recognized when the carrying amount exceeds its fair value. See Note 68 for further discussion of the Company’s investments.
Share-Based Compensation
The Company accounts for its share-based compensation arrangements in accordance with ASC Topic 718, “Compensation—Stock Compensation” (“ASC Topic 718”), which requires the measurement and recognition of compensation expense for all share-based payment awards to employees and non-employees based on estimated fair values. ASC Topic 718 further requires a reduction in share-based compensation expense by an estimated forfeiture rate. The forfeiture rate used by the Company is based on historical forfeiture trends. If actual forfeiture rates are not consistent with the Company’s estimates, the Company may be required to increase or decrease compensation expenses in future periods.
Performance share units are stock-based awards in which the number of shares ultimately received depends on the Company's performance against specified goals that are measured over a designated performance period from the date of grant. These performance goals are established by the Company at the beginning of the performance period. At the end of the performance period, the number of shares of stock that could be issued is fixed based upon the degree of achievement of the performance goals. The number of shares that could be issued can range from 0% to 200% of the participant's target award. Performance share units are initially valued at the Company's closing stock price on the date of grant. Compensation expense, net of estimated forfeitures, is recognized over the vesting period and will vary based on the anticipated performance level during the performance period. If the performance goals are not probable of achievement during the performance period, compensation expense would be reversed. The awards are forfeited if the performance goals are not achieved as of the end of the performance period. The performance units vest in full at the end of a three-year period.
F-14
The Company uses the Black-Scholes option valuation model to estimate the fair value of its stock options and stock appreciation rights (“SARs”) at the date of grant. The Black-Scholes option valuation model requires the inputAs of subjective assumptions to calculate the value ofDecember 31, 2018, all stock options/SARs.options were fully vested and all SARs were fully settled. The Company uses historical data among other information to estimatedid not grant stock options or SARs in the expected price volatility, expected term and forfeiture rate. The Company uses forecasted dividends to estimate the expected dividend yield. The risk-free interest rate is based on the U.S. Treasury yield curve in effect at the time of grant. Compensation expense is recognized on a straight-line basis over the vesting period for stock options. Compensation expense for SARs is recognized on a straight-line basis over the vesting period based on an estimated fair value, which is remeasured at the end of each reporting period. Once vested, the SARs continue to be remeasured to fair value until they are exercised.years ended December 31, 2018, 2017 or 2016.
The Company records compensation expense for restricted stock awards and restricted stock units (collectively “restricted stock”) based on the estimated fair value of the award on the date of grant. The estimated fair value is determined based on the closing price of the Company’s common stock on the award date multiplied by the number of shares underlying the restricted stock awarded. Total compensation expense is recognized on a straight-line basis over the vesting period.
Income Taxes
Current income tax expense or benefit is the amount of income taxes expected to be payable or receivable for the current year. A deferred income tax asset or liability is established for the difference between the tax basis of an asset or liability computed pursuant to ASC Topic 740 and its reported amount in the financial statements that will result in taxable or deductible amounts in future years when the reported amount of the asset or liability is recovered or settled, respectively. TheIn accordance with the applicable accounting rules, the Company maintains a valuation allowance for a deferred tax asset when it is deemed to be more likely than not that some or all of the deferred tax assetassets will not be realized. In evaluating whether a valuation allowance is required under such rules, the Company considers all available positive and negative evidence, including prior operating results, the nature and reason for any losses, its forecast of future taxable income, and the dates on which any deferred tax assets are expected to expire. These assumptions require a significant amount of judgment, including estimates of future taxable income. These estimates are based on the Company’s best judgment at the time made based on current and projected circumstances and conditions. In 2011, as a result of this evaluation, the Company recorded
Pursuant to ASC Topic 740-25-6, the Company is required to accrue for the estimated additional amount of taxes for uncertain tax positions if it is deemed to be more likely than not that the Company would be required to pay such additional taxes. The Company is required to file federal and state income tax returns in the United States and various other income tax returns in foreign jurisdictions. The preparation of these income tax returns requires the Company to interpret the applicable tax laws and regulations in effect in such jurisdictions, which could affect the amount of tax paid by the Company. The Company accrues an amount for its estimate of additional tax liability, including interest and penalties in income tax expense, for any uncertain tax positions taken or expected to be taken in an income tax return. The Company reviews and updates the accrual for uncertain tax positions as more definitive information becomes available. Historically, additional taxes paid as a result of the resolution of the Company’s uncertain tax positions have not been materially different from the Company’s expectations. The Company recognizes interest and/or penalties related to income tax matters in income tax expense. For further information, see Note 911 “Income Taxes.”
In December 2017, the U.S. government enacted comprehensive tax legislation referred to as the Tax Cuts and Jobs Act (the "Tax Act"). Shortly after the Tax Act was enacted, the SEC issued Staff Accounting Bulletin No. 118, Income Tax Accounting Implications of the Tax Cuts and Jobs Act ("SAB 118"), which provides guidance on accounting for the Tax Act’s impact. SAB 118 provides a measurement period, during which a company acting in good faith may complete the accounting for the impacts of the Tax Act under ASC Topic 740. The measurement period began in the reporting period that includes the Tax Act’s enactment date and ended when the Company obtained, prepared, and analyzed the information that was needed in order to complete the accounting requirements under ASC Topic 740. The Company provided a reasonable estimate for the impact of the Tax Act for the year ended December 31, 2017. The measurement period ended on December 22, 2018 and the Company recorded additional expense of $906,000 related to the transition tax. No other significant adjustments were made relating to the Act. Additionally, the Company has elected to treat global intangible low taxed income ("GILTI") as a period cost and will expense GILTI in the period it is incurred. For further information, see Note 11 “Income Taxes.”
Other Income (Expense), Net
Other income (expense), net primarily includes gains and losses on foreign currency forward contracts and foreign currency transactions. The components of other income (expense), net are as follows:
F-15
| Years Ended December 31, | Years Ended December 31, | |||||||||||||||||||||
| 2016 | 2015 | 2014 | 2018 | 2017 | 2016 | |||||||||||||||||
| (In thousands) | (In thousands) | |||||||||||||||||||||
| Foreign currency forward contract gain (loss), net | $ | (2,917 | ) | $ | 2,877 | $ | 6,356 | $ | 10,085 | $ | (7,688 | ) | $ | (2,917 | ) | |||||||
| Foreign currency transaction gain (loss), net | 226 | (1,611 | ) | (6,198 | ) | (2,824 | ) | 808 | 226 | |||||||||||||
| Other | 1,001 | 199 | (206 | ) | 518 | 9 | 1,001 | |||||||||||||||
| $ | (1,690 | ) | $ | 1,465 | $ | (48 | ) | $ | 7,779 | $ | (6,871 | ) | $ | (1,690 | ) | |||||||
Accumulated Other Comprehensive Income (Loss)
Accumulated other comprehensive income (loss) includes the impact of foreign currency translation adjustments and activity related to derivative instruments designated for hedge accounting. The total equity adjustment from foreign currency translation included in accumulated other comprehensive income were losses of $7,969,000 and $7,727,000 as of December 31, 2018 and 2016, respectively and gains of $14,198,000 as of December 31, 2017. With the exception of the Company's entitiesentity in Thailand and Malaysia,Canada, the Company has met the permanent reinvestment criteria and as such it does not accrue income taxes on foreign currency translation adjustments (see Note 911 for further discussion). The total equity adjustment from foreign currency translation included in accumulated other comprehensive income were losses of $7,727,000, $11,542,000 and $12,973,000 as of December 31, 2016, 2015 and 2014, respectively. The total equity adjustment from activity related to derivative instruments was a net gaingains of $1,074,000$435,000 and $525,000$1,074,000 as of December 31, 2018 and 2016, respectively, and 2015, respectively. The Company did not have derivative instruments that qualified for hedge accountinga net loss of $1,898,000 as of December 31, 2014.2017. For further information see Note 15.
17 "Derivatives and Hedging."
The following table details the amounts reclassified from accumulated other comprehensive lossincome to cost of goods sold, as well as changes in foreign currency translation for the years ended December 31, 2016, 20152018, 2017 and 20142016 (in thousands).
| Accumulated other comprehensive income, December 31, 2013 | $ | 12,177 | ||
| Foreign currency translation adjustments | (12,973 | ) | ||
| Accumulated other comprehensive loss, December 31, 2014 | (796 | ) | ||
| Change in fair value of derivative instruments | 2,892 | |||
| Amounts reclassified from accumulated other comprehensive loss to other income (expense) due to hedge instrument ineffectiveness | (576 | ) | ||
| Amounts reclassified from accumulated other comprehensive income to cost of goods sold | (1,791 | ) | ||
| Foreign currency translation adjustments | (11,542 | ) | ||
| Accumulated other comprehensive loss, December 31, 2015 | (11,813 | ) | ||
| Change in fair value of derivative instruments | (538 | ) | ||
| Amounts reclassified from accumulated other comprehensive income to cost of goods sold | 1,500 | |||
| Amounts reclassified from accumulated other comprehensive income to net sales | 1,014 | |||
| Foreign currency translation adjustments | (8,831 | ) | ||
| Accumulated other comprehensive loss, December 31, 2016, before tax | (18,668 | ) | ||
| Income tax expense related to items of other comprehensive income | (902 | ) | ||
| Less: Comprehensive income attributable to non-controlling interest | 1,104 | |||
| Accumulated other comprehensive loss, December 31, 2016, after tax and non-controlling interest | $ | (18,466 | ) | |
| Derivative Instruments | Foreign Currency Translation | Total | |||||||||
| Accumulated other comprehensive loss, December 31, 2015 | 525 | (12,338 | ) | (11,813 | ) | ||||||
| Change in derivative instruments | (567 | ) | — | (567 | ) | ||||||
| Net losses reclassified to cost of goods sold | 1,500 | — | 1,500 | ||||||||
| Net losses reclassified to net sales | 1,014 | — | 1,014 | ||||||||
| Foreign currency translation adjustments | — | (7,698 | ) | (7,698 | ) | ||||||
| Income tax expense | (902 | ) | — | (902 | ) | ||||||
| Accumulated other comprehensive loss, December 31, 2016, after tax | 1,570 | (20,036 | ) | (18,466 | ) | ||||||
| Change in derivative instruments | (2,679 | ) | — | (2,679 | ) | ||||||
| Net losses reclassified to cost of goods sold | 187 | — | 187 | ||||||||
| Foreign currency translation adjustments | — | 14,198 | 14,198 | ||||||||
| Income tax expense | 594 | — | 594 | ||||||||
| Accumulated other comprehensive loss, December 31, 2017, after tax | (328 | ) | (5,838 | ) | (6,166 | ) | |||||
| Change in derivative instruments | 389 | — | 389 | ||||||||
| Net gains reclassified to cost of goods sold | (236 | ) | — | (236 | ) | ||||||
| Foreign currency translation adjustments | — | (7,969 | ) | (7,969 | ) | ||||||
| Income tax expense | 282 | — | 282 | ||||||||
| Accumulated other comprehensive loss, December, 2018, after tax | $ | 107 | $ | (13,807 | ) | $ | (13,700 | ) | |||
Segment Information
The Company’sCompany has three operating and reportable segments, are organized on the basisnamely Golf Clubs, Golf Balls and Gear, Accessories and Other as of products and consist of golf clubs and golf balls.December 31, 2018. The golf clubsGolf Clubs operating segment consists primarily of Callaway Golf woods, hybrids, irons and wedges, Odyssey putters, including Toulon Design putters by Odyssey, packaged sets and sales of pre-owned golf clubs. At the product category level, sales of packaged sets are included within irons, and sales of pre-owned golf clubs are included in the respective woods, irons and putters as well as Odyssey putters, pre-owned clubs, golf-related accessories and royalties from licensing of the Company’s trademarks and service marks.product categories. The golf ballsGolf Balls segment consists of Callaway Golf and Strata golf balls that are designed, manufactured and sold by the Company. The Gear, Accessories and Other operating segment consist of soft goods products which include golf apparel and footwear, golf bags, golf gloves, travel gear, headwear and other golf-related accessories, retail apparel sales from the Company's joint venture in Japan, OGIO branded gear products and TravisMathew golf and lifestyle apparel and accessories. Also included in this operating segment are licensing revenues from the licensing of the Company’s trademarks and
F-16
service marks for various soft goods. Due to the recent acquisition of Jack Wolfskin in January 2019 (Note 4), the Company also disclosesis anticipating significant growth in its soft goods business, and as such, it will be evaluating its global business platform, including its management structure, operations, supply chain and distribution, which may result in changes in the composition of its operating and reportable segments.
This information, as well as information about the Company's geographic areas. This informationareas, is presented in Note 1618 “Segment Information.”
Concentration of Risk
The Company operates in the golf equipment industry and has a concentrated customer base, which is primarily comprised of golf equipment retailers (including pro shops at golf courses and off-course retailers), sporting goods retailers and mass merchants and foreign distributors. On a consolidated basis, no single customer accounted for more than 8%, 9% and 8%10% of the Company’s consolidated revenues in 2016, 20152018 and 2014, respectively.2017, and 8% in 2016. The Company's top five customers accounted for approximately 22% of the Company's consolidated revenues in each of 2018 and 2016, 26%and 21% in 2015 and 25% in 2014. 2017.
With respect to the Company's segments, the Company's top five golf club
Golf Club customers accounted for approximately 23%25%, 20% and 26% of total consolidated golf clubGolf Club sales in 2018, 2017 and 2016, and approximately 25% of total consolidated golf club sales in each of 2015 and 2014. The top five golf ballrespectively;
Golf Ball customers accounted for approximately 29%, 30% and 28% of total consolidated golf ballGolf Ball sales in 2018, 2017 and 2016, respectively; and
Gear and 30%Accessories customers accounted for approximately 19%, 15% and 18% of total consolidated Gear and Accessories sales in each of 20152018, 2017 and 2014. 2016, respectively.
A loss of one or more of these customers could have a significant effect on the Company's net sales.
With respect to the Company's trade receivables, the Company performs ongoing credit evaluations of its customers’ financial condition and generally requires no collateral from these customers. The Company maintains reserves for estimated credit losses, which it considers adequate to cover any such losses. At December 31, 2016,2018 one customer represented 12% of the Company's outstanding accounts receivable balance. At December 31, 2017, no single customer represented over 9% of the Company’s outstanding accounts receivable balance. At December 31, 2015, the Company had one customer with an outstanding balance greater than 10% of the Company's outstanding consolidated accounts receivable. Managing customer-related credit risk is more difficult in regions outside of the United States. Of the Company’s total net sales, approximately 49%43%, 47%46% and 52%49% were derived from sales outside of the United States in 2016, 20152018, 2017 and 2014,2016, respectively. Prolonged unfavorable economic conditions could significantly increase the Company’s credit risk with respect to its outstanding accounts receivable.
The Company is dependent on a limited number of suppliers for its clubheads and shafts, some of which are single sourced. Furthermore, some of the Company’s products require specially developed manufacturing techniques and processes which make it difficult to identify and utilize alternative suppliers quickly. In addition, many of the Company’s suppliers are not well capitalized and prolonged unfavorable economic conditions could increase the risk that they will go out of business. If current suppliers are unable to deliver clubheads, shafts or other components, or if the Company is required to transition to other suppliers, the Company
could experience significant production delays or disruption to its business. The Company also depends on a single or a limited number of suppliers for the materials it uses to make its golf balls. Many of these materials are customized for the Company. Any delay or interruption in such supplies could have a material adverse impact on the Company’s golf ball business. If the Company were to experience any such delays or interruptions, the Company may not be able to find adequate alternative suppliers at a reasonable cost or without significant disruption to its business.
The Company’s financial instruments that are subject to concentrations of credit risk consist primarily of cash equivalents, trade receivables and foreign currency forward contracts.
From time to time, the Company invests its excess cash in money market accounts and short-term U.S. government securities and has established guidelines relative to diversification and maturities in an effort to maintain safety and liquidity. These guidelines are periodically reviewed and modified to take advantage of trends in yields and interest rates.
The Company enters into foreign currency forward contracts for the purpose of hedging foreign exchange rate exposures on existing or anticipated transactions. In the event of a failure to honor one of these contracts by one of the banks with which the Company has contracted, management believes any loss would be limited to the exchange rate differential from the time the contract was made until the time it was settled.
F-17
Note 3. Revenue Recognition
The Company recognizes revenue from the sale of its products, which include golf clubs, golf balls, golf bags and other lifestyle and golf-related apparel and accessories. The Company sells its products to customers, which include on- and off-course golf shops and national retail stores, as well as to consumers through its e-commerce business and at its apparel retail locations. In addition, the Company recognizes royalty income from the sale by third-party licensees of certain soft goods products, as well as revenue from the sale of gift cards.
The Company's contracts with customers are generally in the form of a purchase order. In certain cases, the Company enters into sales agreements containing specific terms, discounts and allowances. In addition, the Company enters into licensing agreements with certain distributors.
The following table presents the Company's revenue disaggregated by major product category and operating and reportable segment (in thousands):
| Year Ended December 31, 2018 | |||||||||||||||
| Operating and Reportable Segments | |||||||||||||||
| Golf Clubs | Golf Balls | Gear, Accessories & Other | Total | ||||||||||||
| Major product category: | |||||||||||||||
| Woods | $ | 304,459 | $ | — | $ | — | $ | 304,459 | |||||||
| Irons | 316,463 | — | — | 316,463 | |||||||||||
| Putters | 96,371 | — | — | 96,371 | |||||||||||
| Golf Balls | — | 195,654 | — | 195,654 | |||||||||||
| Gear, Accessories and Other | — | — | 329,887 | 329,887 | |||||||||||
| $ | 717,293 | $ | 195,654 | $ | 329,887 | $ | 1,242,834 | ||||||||
The Company sells its golf clubs and golf ball products as well as its gear and accessories in the United States and internationally, with its principal international regions being Japan and Europe. Sales of golf clubs, golf balls and gear and accessories in each region are generally proportional to the Company's consolidated net sales by operating segment as a percentage of total consolidated net sales. Sales of gear and accessories in Japan are proportionally higher relative to the size of that region due to sales from the Company's apparel joint venture in Japan. See Note 18 for information on revenue by major geographic region.
Product Sales
The Company recognizes revenue from the sale of its products when it satisfies the terms of a sales order from a customer, and transfers control of the products ordered to the customer. Control transfers when products are shipped, and in certain cases, when products are received by customers. In addition, the Company recognizes revenue at the point of sale on transactions with consumers at its retail locations. Sales taxes, value added taxes and other taxes that are collected in connection with revenue transactions are withheld and remitted to the respective taxing authorities. As such, these taxes are excluded from revenue. The Company elected to account for shipping and handling as activities to fulfill the promise to transfer the good. Therefore, shipping and handling fees that are billed to customers are recognized in revenue and the associated shipping and handling costs are recognized in cost of goods sold as soon as control of the goods transfers to the customer.
Royalty Income
Royalty income is recognized over time in net sales as underlying product sales occur, subject to certain minimum royalties, in accordance with the related licensing arrangements and is included in the Company's Gear, Accessories and Other operating segment. Total royalty income for the years ended December 31, 2018, 2017 and 2016 was $19,021,000, $18,622,000 and $7,622,000 respectively. The increase in royalty income in 2018 and 2017 compared to 2016 was primarily due to royalties recognized in connection with OGIO branded products.
Gift Cards
Revenues from gift cards are deferred and recognized when the cards are redeemed. The Company’s gift cards have no expiration date. The Company recognizes revenue from unredeemed gift cards, otherwise known as breakage, when the likelihood of redemption becomes remote and under circumstances that comply with any applicable state escheatment laws. To determine when redemption is remote, the Company analyzes an aging of unredeemed cards (based on the date the card was last used or the
F-18
activation date if the card has never been used) and compares that information with historical redemption trends. The Company uses this historical redemption rate to recognize breakage on unredeemed gift cards over the redemption period. The Company does not believe there is a reasonable likelihood that there will be a material change in the future estimates or assumptions used to determine the timing of recognition of gift card revenues. As of December 31, 2018 and 2017, the total amount of deferred revenue on gift cards was $1,096,000 and $971,000, respectively, and is reflected in accounts payable and accrued expenses on the accompanying consolidated balance sheets. The Company recognized $1,518,000 and $1,455,000 of deferred gift card revenue during the year ended December 31, 2018 and 2017, respectively.
Variable Consideration
The amount of revenue the Company recognizes is based on the amount of consideration it expects to receive from customers. The amount of consideration is the sales price adjusted for estimates of variable consideration, including sales returns, discounts and allowances as well as sales programs, sales promotions and price concessions that are offered by the Company as described below. These estimates are based on the amounts earned or to be claimed by customers on the related sales, and are therefore recorded as reductions to sales and trade accounts receivable.
The Company’s primary sales program, the “Preferred Retailer Program,” offers potential rebates and discounts for participating retailers in exchange for providing certain benefits to the Company, including the maintenance of agreed upon inventory levels, prime product placement and retailer staff training. Under this program, qualifying retailers can earn either discounts or rebates based upon the amount of product purchased. Discounts are applied and recorded at the time of sale. For rebates, the Company estimates the amount of variable consideration related to the rebate at the time of sale based on the customer’s estimated qualifying current year product purchases. The estimate is based on the historical level of purchases, adjusted for any factors expected to affect the current year purchase levels. The estimated year-end rebate is adjusted quarterly based on actual purchase levels, as necessary. The Preferred Retailer Program is generally short-term in nature and the actual amount of rebate to be paid under this program is known as of the end of the year and paid to customers shortly after year-end. Historically, the Company's actual amount of variable consideration related to its Preferred Retailer Program has not been materially different from its estimates.
The Company also offers short-term sales program incentives, which include sell-through promotions and price concessions or price reductions. Sell-through promotions are generally offered throughout the product's life cycle of approximately two years, and price concessions or price reductions are generally offered at the end of the product's life cycle. The estimated variable consideration related to these programs is based on a rate that includes historical and forecasted data. The Company records a reduction to net sales using this rate at the time of the sale. The Company monitors this rate against actual results and forecasted estimates, and adjusts the rate as deemed necessary in order to reflect the amount of consideration it expects to receive from its customers. There were no material changes to the rate during the twelve months ended December 31, 2018. Historically, the Company's actual amount of variable consideration related to these sales programs has not been materially different from its estimates.
The Company records an estimate for anticipated returns as a reduction of sales and cost of sales, and accounts receivable, in the period that the related sales are recorded. Sales returns are estimated based upon historical returns, current economic trends, changes in customer demands and sell-through of products. The Company also offers its customers sales programs that allow for specific returns. The Company records a return liability for anticipated returns related to these sales programs at the time of the sale based on the terms of the sales program. As a result of the adoption of Topic 606, the liability for sales returns is now recorded separately from the cost recovery of inventory, which is now recorded in other current assets. The increase in the provision for 2018, as compared to 2017 and 2016, reflects this change. Historically, the Company’s actual sales returns have not been materially different from management’s original estimates.
The following table provides a reconciliation of the activity related to the Company’s allowance for sales returns:
| Years Ended December 31, | |||||||||||
| 2018 | 2017 | 2016 | |||||||||
| (In thousands) | |||||||||||
| Beginning balance | $ | 15,470 | $ | 9,341 | $ | 8,148 | |||||
| Provision | 52,088 | 37,521 | 38,444 | ||||||||
| Sales returns | (43,036 | ) | (31,392 | ) | (37,251 | ) | |||||
| Ending balance | $ | 24,522 | $ | 15,470 | $ | 9,341 | |||||
F-19
Note 4. Business Combinations
During 2017, the Company completed the acquisitions of OGIO and TravisMathew. The purchase price of each acquisition was allocated to the underlying assets acquired and liabilities assumed based upon their estimated fair values as of the date of acquisition in accordance with ASC Topic 820. The excess between the purchase price and the fair value of the net identifiable tangible and intangible assets acquired and liabilities assumed was allocated to goodwill. The Company determined the estimated fair values after review and consideration of relevant information, including discounted cash flows, quoted market prices and estimates made by management. The Company may retrospectively adjust the fair value of the identifiable assets acquired and the liabilities assumed, as necessary, during the measurement period of up to one year from the acquisition date, to reflect new information about circumstances existing at the acquisition date affecting the measurement of those amounts at that date, and any additional assets or liabilities existing at that date.
Valuations of acquired intangible assets and inventory are subject to fair value measurements that were based primarily on significant inputs not observable in the market and thus represent Level 3 measurements (see Note 16).
Both acquisitions were treated as asset purchases for income tax purposes and, as such, the Company expects to deduct all of the intangible assets, including goodwill, from taxable income over time.
Acquisition of OGIO International, Inc.
In January 2017, the Company acquired all of the outstanding shares of capital stock of OGIO, a leading manufacturer of high quality bags, accessories and apparel in the golf and lifestyle categories, in a cash transaction pursuant to the terms of a Share Purchase Agreement, by and among the Company, OGIO, and each of the shareholders and option holders of OGIO.
The acquired furniture, fixtures, office equipment, leasehold improvements, computer equipment and warehouse equipment were all valued at their estimated replacement cost, which the Company determined approximated the net book value of the assets on the date of the acquisition. Inventory was valued using the net realizable value approach, which was based on the estimated selling price in the ordinary course of business less reasonable disposal costs and profit on the disposal effort. The customer and distributor relationships were valued under the income approach based on the present value of future earnings. The trade name was valued under the royalty savings income approach method, which is equal to the present value of the after-tax royalty savings attributable to owning the trade name as opposed to paying a third party for its use. For this valuation, the Company used a royalty rate of 7.5%, which is reflective of royalty rates paid in market transactions, and a discount rate of 14.0% on the future cash flows generated by the net after-tax savings. Goodwill arising from the acquisition consists largely of the synergies expected from combining the operations of the Company and OGIO. For segment reporting purposes, goodwill is reported in the Gear, Accessories and Other operating segment.
The total purchase price was valued at $65,951,000. The Company incurred transaction costs of approximately $3,052,000, of which $1,805,000 was recognized in general and administrative expenses during the year ended December 31, 2017. The remainder was recognized in 2016.
F-20
The following table summarizes the fair values of the assets acquired and liabilities assumed as of the acquisition date based on the purchase price allocation (in thousands):
| At January 11, 2017 | ||||
| Assets Acquired | ||||
| Cash | $ | 8,061 | ||
| Accounts receivable | 7,696 | |||
| Inventory | 7,092 | |||
| Other current assets | 328 | |||
| Property and equipment | 2,369 | |||
| Intangibles - trade name | 49,700 | |||
| Intangibles - customer & distributor relationships | 1,500 | |||
| Intangibles - non-compete agreements | 150 | |||
| Goodwill | 5,885 | |||
| Total assets acquired | 82,781 | |||
| Liabilities Assumed | ||||
| Accounts Payable and accrued liabilities | 16,830 | |||
| Net assets acquired | $ | 65,951 | ||
Acquisition of TravisMathew, LLC
In August 2017, the Company acquired TravisMathew, a golf and lifestyle apparel company in an all-cash transaction pursuant to the terms of an Agreement and Plan of Merger, by and among the Company, TravisMathew, OTP LLC, a California limited liability company and wholly-owned subsidiary of the Company (“Merger Sub”), and a representative of the equity holders of TravisMathew. The Company acquired TravisMathew by way of a merger of Merger Sub with and into TravisMathew, with TravisMathew surviving as a wholly-owned subsidiary of the Company. The primary reason for this acquisition was to enhance the Company's presence in golf while also providing a platform for future growth in the lifestyle category.
The acquired furniture, fixtures, office equipment, leasehold improvements, computer equipment and warehouse equipment were all valued at their estimated replacement cost, which the Company determined approximated the net book value of the assets on the date of the acquisition. Inventory was valued using the net realizable value approach, which was based on the estimated selling price in the ordinary course of business less reasonable disposal costs and profit on the disposal effort. The licensing agreement was valued under the income approach based on the projected royalty income from the distributors. The customer and distributor relationships were valued under the income approach based on the present value of future earnings. The trade name was valued under the royalty savings income approach method, which is equal to the present value of the after-tax royalty savings attributable to owning the trade name as opposed to paying a third party for its use. For this valuation, the Company used a royalty rate of 8.0%, which is reflective of royalty rates paid in market transactions, and a discount rate of 11.0% on the future cash flows generated by the net after-tax savings. Goodwill associated with this acquisition is related to the operational synergies the Company expects to realize in future periods. For segment reporting purposes, goodwill is reported in the Gear, Accessories and Other operating segment.
The total purchase price was valued at $124,578,000. In connection with the acquisition, during the year ended December 31, 2017, the Company recognized transaction costs of approximately $2,521,000 in general and administrative expenses.
F-21
The following table summarizes the preliminary estimated fair values of the assets acquired and liabilities assumed as of the acquisition date based on the purchase price allocation (in thousands):
| At August 17, 2017 | ||||
| Assets Acquired | ||||
| Cash | $ | 663 | ||
| Accounts receivable | 9,715 | |||
| Inventory | 11,909 | |||
| Other current assets | 549 | |||
| Property and equipment | 4,327 | |||
| Other assets | 117 | |||
| Intangibles - trade name | 78,400 | |||
| Intangibles - licensing agreement | 1,100 | |||
| Intangibles - customer & distributor relationships | 4,450 | |||
| Intangibles - non-compete agreements | 600 | |||
| Goodwill | 23,748 | |||
| Total assets acquired | 135,578 | |||
| Liabilities Assumed | ||||
| Accounts Payable and accrued liabilities | 11,000 | |||
| Net assets acquired | $ | 124,578 | ||
Supplemental Pro-Forma Information (Unaudited)
The following table presents supplemental pro-forma net sales and net income for the years ended December 31, 2017 and 2016 for the OGIO and TravisMathew acquisitions as if they had occurred on January 1, 2016 and were consolidated with the Company as of January 1, 2016. These amounts were calculated after applying the Company's accounting policies and were based upon available information at the time. For this analysis, the Company assumed that costs associated with the acquisitions, including the amortization of intangible assets and the step-up of inventory, as well as the tax effect on those costs, were recognized as of January 1, 2016. Pre-acquisition net sales and net income amounts for OGIO and TravisMathew were derived from the books and records of OGIO and TravisMathew prepared prior to the respective acquisition and are presented for informational purposes only and do not purport to be indicative of the results of future operations or of the results that would have occurred had the acquisition taken place as of the dates noted below. The Company's net sales and net income for the year ended December 31, 2018 include a full year of results for both OGIO and TravisMathew and are therefore not presented in the pro-forma information below.
| Years Ended December 31, | |||||||
| 2017 | 2016 | ||||||
| (in thousands) | |||||||
| Net sales | $ | 1,086,593 | $ | 964,514 | |||
| Net income attributable to Callaway Golf Company | $ | 52,514 | $ | 188,117 | |||
For the year ended December 31, 2017, the Company's consolidated net sales included $66,670,000 attributable to OGIO and TravisMathew, and the Company's consolidated net income included a net loss of $1,721,000 related to TravisMathew. The Company integrated the OGIO brand into its consolidated operations as of December 31, 2017, therefore net income information related to OGIO could not be determined.
Acquisition of JW Stargazer Holding GmbH
In January 2019, the Company completed the acquisition of JW Stargazer Holding GmbH, the owner of the international, premium outdoor apparel, footwear and equipment brand, Jack Wolfskin for €460,000,000 or approximately $525,000,000, subject to working capital adjustments. The Company financed the acquisition with a Term Loan B facility in the aggregate principal amount of $480,000,000 (see Note 5). Jack Wolfskin is an international, premium outdoor apparel, footwear and equipment brand. Jack Wolfskin designs premium products targeted at the active outdoor and urban outdoor customer categories. This acquisition
F-22
is expected to further enhance the Company's lifestyle category and provide a platform for future growth in the active outdoor and urban outdoor categories, which the Company believes are complimentary to its portfolio of brands and product capabilities.
In connection with the acquisition, during the year ended December 31, 2018, the Company recognized transaction costs of approximately $3,661,000 in general and administrative expenses, and an unrealized gain of $4,409,000 in other income (expense) from the re-measurement of a foreign currency forward contract that was put in place to mitigate the risk of foreign currency fluctuations on the purchase price, which was denominated in Euros. In January 2019, the Company realized a $3,215,000 net loss upon the settlement of this contract. Due to the timing of this acquisition, it was impracticable for the Company to compile pro-forma financial information and preliminary purchase accounting estimates in accordance with ASC 805 "Business Combinations."
Note 3.5. Financing Arrangements
In addition to cash on hand, as well as cash generated from operations, the Company relies on its primary and Japan asset-based revolving credit facilities to manage seasonal fluctuations in liquidity and to provide additional liquidity when the Company’s operating cash flows are not sufficient to fund the Company’s requirements. As of December 31, 2016,2018, the Company had $11,966,000$40,300,000 outstanding under these facilities, $823,000$1,187,000 in outstanding letters of credit, and $125,975,000$63,981,000 in cash and cash equivalents. The combined maximum amount that could have been outstandingAs of December 31, 2018, the Company's available liquidity, which is comprised of cash on hand and amounts available under both facilities, on December 31, 2016, after letters of credit was $99,241,000, resulting$256,393,000. At December 31, 2017 the Company had $87,755,000 outstanding under these facilities, $887,000 in totaloutstanding letters of credit, and $85,674,000 in cash and cash equivalents. As of December 31, 2017, the Company's available liquidity includingwas $238,884,000, which is comprised of cash on hand and amounts available under both facilities, after letters of $225,216,000. The maximum amount that could have beencredit and outstanding under the Company's primary asset-based revolving credit facility on December 31, 2015 was $105,492,000, and total available liquidity, including cash on hand of $155,293,000.borrowings.
Primary Asset-Based Revolving Credit Facility
As of December 31, 2016,2018, the Company had no$40,300,000 in borrowings outstanding under the ABL Facility and $823,000$1,187,000 in outstanding letters of credit. The maximum amount of additional indebtedness (as defined by the ABL Facility) that could have been outstanding on December 31, 2016, after outstanding borrowings and letters of credit, was approximately $87,275,000. The maximum availabilityAmounts available under the ABL Facility fluctuatesfluctuate with the general seasonality of the business and increasesincrease and decreasesdecrease with changes in the Company’s inventory and accounts receivable balances. The maximum availability is at its highestInventory balances are generally higher in the fourth and first quarters to meet demand during the height of the golf season, and accounts receivable are generally higher during the first half of the year when the Company’s inventory and accounts receivable balancessales are higher and is lower during the second half of the year when the Company's inventory levels decrease and its accounts receivable decrease as a result of cash collections and lower sales.higher. Average outstanding borrowings during the year ended December 31, 20162018 were $18,795,000,$81,850,000, and average amounts available under the ABL Facility during the year ended December 31, 2016,2018, after outstanding borrowings and letters of credit, was approximately $99,669,000.$188,574,000. Amounts borrowed under the ABL Facility may be repaid and borrowed as needed. The entire outstanding principal amount (if any) is due and payable at June 23, 2019.on November 19, 2022.
The ABL Facility includes certain restrictions including, among other things, restrictions on the incurrence of additional debt, liens, stock repurchases and other restricted payments, asset sales, investments, mergers, acquisitions and affiliate transactions. In addition, the ABL Facility imposes restrictions on the amount the Company could pay in annual cash dividends, including meeting certain restrictions on the amount of additional indebtedness and requirements to maintain a certain fixed charge coverage ratio under certain circumstances.circumstances.. These restrictions do not materially limit the Company's ability to pay future dividends at the current dividend rate. As of December 31, 2016, the maximum amount that the Company could have paid out in dividends was $52,775,000. As of December 31, 2016,2018, the Company was in compliance with all financial covenants of the ABL Facility. Additionally, the Company is subject to compliance with a fixed charge coverage ratio covenant during, and continuing
30 days after, any period in which the Company’s borrowing base availability, as amended, falls below $23,000,000.10% of the maximum facility amount or $33,000,000. The Company’s borrowing base availability was above $23,000,000$33,000,000 during the year ended December 31, 2016,2018, and the Company was in compliance with the fixed charge coverage ratio as of December 31, 2016.2018. Had the Company not
F-23
been in compliance with the fixed charge coverage ratio as of December 31, 2016,2018, the Company's maximum amount of additional indebtedness that could have been outstanding on December 31, 20162018 would have been reduced by $23,000,000.$33,000,000.
The interest rate applicable to outstanding loans under the ABL Facility fluctuates depending on the Company’s “availability ratio," which is expressed as a percentage of (i) the average daily availability under the ABL Facility to (ii) the sum of the Canadian, the U.K. and the U.S. borrowing bases, as adjusted. The applicable margin for any month will be reduced by 0.25% if the Company’s availability ratio is greater than or equal to 67% and the Company’s “leverage ratio” (as defined below) is less than 4.0 to 1.0 as of the last day of the month for which financial statements have been delivered, so long as no default or event of default exists. The Company’s “leverage ratio” is the ratio of the amount of debt for borrowed money to the 12-month trailing EBITDA (as defined in the ABL Facility), each determined on a consolidated basis. At December 31, 2016,2018, the Company’s trailing 12-month average interest rate applicable to its outstanding loans under the ABL Facility was 2.56%4.30%.
The fees incurred in connection with the origination and amendment of the ABL Facility totaled $4,991,000,$2,336,000, which will beare amortized into interest expense over the term of the ABL Facility agreement. Unamortized origination fees as of December 31, 20162018 and 20152017 were $1,297,000$1,825,000 and $1,781,000,$2,197,000, respectively, of which $519,000$476,000 and $509,000,$454,000, respectively, were included in other current assets and $778,000$1,349,000 and $1,272,000,$1,743,000, respectively, were included in other long-term assets in the accompanying consolidated balance sheets.
Japan ABL Facility
2018. The Japan ABL Facility is subject to an effective interest rate equal to TIBOR plus 0.25% andalso includes certain restrictions including covenants related to certain pledged assets and financial performance metrics. As of December 31, 2016,2018, the Company was in compliance with these covenants. At December 31, 2016, the trailing 12-month average interest rate applicable to the Company's outstanding loans under theThe Japan ABL Facility wasis subject to an effective interest rate of 0.34%equal to the Tokyo interbank offered rate plus 0.80%. The agreementaverage interest rate during 2018 was 0.86%. The facility expires onin January 22, 2018.2021.
In 2012,December 2017, the Company issued $112,500,000 of 3.75% Convertible Senior Notesentered into a long-term financing agreement (the “convertible notes”"Equipment Note"). The convertible notes were convertible, secured by certain equipment at the option of the note holder, at any time on or prior to the close of business on the business day immediately preceding August 15, 2019, into shares of common stock at an initial conversion rate of 133.3333 shares per $1,000 principal amount of convertible notes, which is equal to an aggregate of 15,000,000 shares of common stock at a conversion price of approximately $7.50 per share, subject to customary anti-dilution adjustments. In connection with these convertible notes, the Company incurred transactional fees of $3,537,000.
The Equipment Note is subject to compliance with the financial covenants in the Company's ABL Facility. As of December 31, 20162018, the Company was in compliance with these covenants.
Term Loan B Facility
In January 2019, to fund the purchase price of the Jack Wolfskin acquisition, the Company entered into a Credit Agreement (the “Credit Agreement”) with Bank of America, N.A and 2015.other lenders party to the Credit Agreement (the "Term Lenders"). The Credit Agreement provides for a Term Loan B facility (the “Term Loan Facility”) in an aggregate principal of $480,000,000, which was issued less $9,600,000 in original issue discount and other transaction fees. Such amount may be increased pursuant to incremental facilities in the form of additional tranches of term loans or new commitments, up to a maximum incremental amount of $225,000,000, or an unlimited amount subject to compliance with a first lien net leverage ratio of 2.25 to 1.00. The Term Loan Facility is due in January 2026.
In connection with the retirementTerm Loan Facility, the Company entered into agreements with the lenders party to the Credit Agreement to mitigate the interest rate on $200,357,000 of the convertible notestotal principal outstanding under the Term Loan Facility, from a floating rate of LIBOR plus 4.50% to a fixed rate of 4.60%. This was achieved by entering into an interest rate hedge agreement and a cross-currency debt swap agreement, converting the $200,357,000 principal into €176,200,000, both of which mature in 2015,January 2025.
Loans under the Term Loan Facility are subject to interest at a rate per annum equal to either, at the Company's option, the LIBOR rate or the base rate, plus 4.50% or 3.50%, respectively, and any amounts outstanding are secured by the Company's assets. Principal payments of $1,200,000 are due quarterly, however the Company acceleratedhas the amortization of transaction fees duringoption to prepay any outstanding loan balance in whole or in part without premium or penalty. In addition, the second half of 2015. There were no transaction fees remaining to be amortized atTerm Loan Facility requires excess cash flow payments beginning after December 31, 2016. Total interest and amortization expense recognized during the years ended December 31, 2015 and 2014 was $3,158,000 and $4,957,000, respectively.2019.
Loans outstanding under this facility are guaranteed by the Company's domestic subsidiaries. The loans and guaranties are secured by substantially all the assets of the Company and guarantors. In connection with the Credit Agreement, the Company amended its ABL Facility (the "Second Amendment to Third Amended and Restated Loan and Security Agreement") to expand the security interest granted to the ABL Lenders to match the security interest of the Term Lenders.
The Credit Agreement contains customary representations and warranties and customary affirmative and negative covenants, including, among other things, restrictions on incurrence of additional debt, liens, dividends and other restricted payments, asset sales, investments, mergers, acquisitions and affiliate transactions. Events of default permitting acceleration under the Credit Agreement include, among others, nonpayment of principal or interest, covenant defaults, material breaches of representations and warranties, bankruptcy and insolvency events, certain cross defaults or a change of control.
Note 4.6. Earnings per Common Share
Basic earnings per common share is computed by dividing net income by the weighted-average number of common shares outstanding for the period.
Diluted earnings per common share reflectstakes into account the potential dilution that could occur if convertiblecertain dilutive securities or other contracts to issue common stock, were exercised or converted into common stock.exercised. Dilutive securities are included in the calculation of diluted earnings per common share using the treasury stock method and the if-converted method in accordance with ASC Topic 260, “Earnings per Share.” Dilutive securities include convertible notes,outstanding stock options, granted pursuant to the Company’s stock option plans and outstanding restricted stock units and performance share units granted to employees and non-employee directors (see Note 12)14).
Weighted-average common shares outstanding—diluted is the same as weighted-average common shares outstanding—basic in periods when a net loss is reported or in periods when anti-dilution occurs.
The following table summarizes the computation of basic and diluted earnings per share:
| Years Ended December 31, | Years Ended December 31, | |||||||||||||||||||||
| 2016 | 2015 | 2014 | 2018 | 2017 | 2016(1) | |||||||||||||||||
| (In thousands, except per share data) | (In thousands, except per share data) | |||||||||||||||||||||
| Earnings per common share—basic | ||||||||||||||||||||||
| Net income attributable to Callaway Golf Company | $ | 189,900 | $ | 14,568 | $ | 16,008 | $ | 104,740 | $ | 40,806 | $ | 189,900 | ||||||||||
| Weighted-average common shares outstanding—basic | 94,045 | 83,116 | 77,559 | 94,579 | 94,329 | 94,045 | ||||||||||||||||
| Basic earnings per common share | $ | 2.02 | $ | 0.18 | $ | 0.21 | $ | 1.11 | $ | 0.43 | $ | 2.02 | ||||||||||
| Earnings per common share—diluted | ||||||||||||||||||||||
| Net income attributable to Callaway Golf Company | $ | 189,900 | $ | 14,568 | $ | 16,008 | $ | 104,740 | $ | 40,806 | $ | 189,900 | ||||||||||
| Weighted-average common shares outstanding—basic | 94,045 | 83,116 | 77,559 | 94,579 | 94,329 | 94,045 | ||||||||||||||||
| Options and restricted stock | 1,800 | 1,495 | 826 | 2,574 | 2,248 | 1,800 | ||||||||||||||||
| Weighted-average common shares outstanding—diluted | 95,845 | 84,611 | 78,385 | 97,153 | 96,577 | 95,845 | ||||||||||||||||
| Dilutive earnings per common share | $ | 1.98 | $ | 0.17 | $ | 0.20 | ||||||||||||||||
Diluted earnings per common share(1) | $ | 1.08 | $ | 0.42 | $ | 1.98 | ||||||||||||||||
| (1) | During the fourth quarter of 2016, the Company reversed a significant portion of the valuation allowance on its U.S. deferred tax assets. This resulted in a favorable impact to net income of $156,600,000 ($1.63 per share), partially offset by $15,974,000 ($0.16 per share) as the result of the recognition of income taxes that were retroactive for all of 2016 on the Company's U.S. business (see Note |
Earnings per share—diluted, reflects the potential dilution that could occur if convertible securities, or other contracts to issue common stock, were exercised or converted into common stock. Options with an exercise price in excess of the average market value of the Company's common stock during the period have been excluded from the calculation as their effect would be antidilutive.
Antidilutive securities excluded from the earnings per share computation are summarized as follows:
For the year ended December 31, 2016,2018, there were no securities excluded from the calculation of earnings per common share—diluted.
F-25
For the year ended December 31, 2017, securities outstanding totaling approximately 313,000, comprised129,000, compromised of anti-dilutive options.
For the year ended December 31, 2015,2016, securities outstanding totaling approximately 10,812,000, including common shares underlying convertible senior notes313,000, compromised of 10,248,000, in addition to anti-dilutive options.
Note 5.7. Goodwill and Intangible Assets
Goodwill at December 31, 20162018 decreased to $25,593,000$55,816,000 from $26,500,000$56,429,000 at December 31, 20152017 due to $907,000 in foreign currency fluctuations. Gross goodwill before impairments at December 31, 2016fluctuations of $721,000. Goodwill in 2017 includes additions of $5,885,000 and 2015 was $27,342,000$23,748,000 as a result of the acquisitions of OGIO completed in January 2017 and $28,249,000,TravisMathew completed in August 2017, respectively. The Company's goodwill is reported within the Golf Clubs and Gear, Accessories and Other operating segmentsegments (see Note 16)18).
In accordance with ASC Topic 350, “Intangibles—Goodwill and Other,” the Company’s goodwill and certain intangible assets are not amortized, but are subject to an annual impairment test. The following sets forth the intangible assets by major asset class:
Useful Life (Years) | December 31, 2016 | December 31, 2015 | Useful Life (Years) | December 31, 2018 | December 31, 2017 | |||||||||||||||||||||||||||||||||||||||||||||||||||||
| Gross | Accumulated Amortization | Net Book Value | Gross | Accumulated Amortization | Net Book Value | Gross | Accumulated Amortization | Net Book Value | Gross | Accumulated Amortization | Net Book Value | |||||||||||||||||||||||||||||||||||||||||||||||
| (In thousands) | (In thousands) | (In thousands) | (In thousands) | |||||||||||||||||||||||||||||||||||||||||||||||||||||||
| Indefinite-lived: | ||||||||||||||||||||||||||||||||||||||||||||||||||||||||||
| Trade name, trademark and trade dress and other | NA | $ | 88,590 | $ | — | $ | 88,590 | $ | 88,590 | $ | — | $ | 88,590 | NA | $ | 218,364 | $ | — | $ | 218,364 | $ | 218,364 | $ | — | $ | 218,364 | ||||||||||||||||||||||||||||||||
| Amortizing: | ||||||||||||||||||||||||||||||||||||||||||||||||||||||||||
| Patents | 2-16 | 31,581 | 31,440 | 141 | 31,581 | 31,389 | 192 | 2-16 | 31,581 | 31,543 | 38 | 31,581 | 31,491 | 90 | ||||||||||||||||||||||||||||||||||||||||||||
| Developed technology and other | 1-9 | 7,981 | 7,981 | — | 7,961 | 7,961 | — | |||||||||||||||||||||||||||||||||||||||||||||||||||
| Customer and distributor relationships, and other | 1-9 | 15,780 | 9,490 | 6,290 | 15,780 | 8,476 | 7,304 | |||||||||||||||||||||||||||||||||||||||||||||||||||
| Total intangible assets | $ | 128,152 | $ | 39,421 | $ | 88,731 | $ | 128,132 | $ | 39,350 | $ | 88,782 | $ | 265,725 | $ | 41,033 | $ | 224,692 | $ | 265,725 | $ | 39,967 | $ | 225,758 | ||||||||||||||||||||||||||||||||||
Aggregate amortization expense on intangible assets was approximately $71,000, $51,000$1,066,000, $546,000 and $68,000$71,000 for the years ended December 31, 2016, 20152018, 2017 and 2014,2016, respectively. Amortization expense related to intangible assets at December 31, 20162018 in each of the next threefive fiscal years and beyond is expected to be incurred as follows (in thousands):
| 2017 | $ | 51 | |
| 2018 | 51 | ||
| 2019 | 39 | ||
| $ | 141 | ||
| 2019 | $ | 1,053 | |
| 2020 | 966 | ||
| 2021 | 910 | ||
| 2022 | 734 | ||
| 2023 | 595 | ||
| Thereafter | 2,069 | ||
| $ | 6,327 | ||
Note 6.8. Investments
Investment in Topgolf International, Inc.
The Company owns a minority interest of approximately 14.0% in Topgolf International, Inc., doing business as the Topgolf Entertainment Group (“Topgolf”("Topgolf"), the owner and operator of Topgolf entertainment centers, which ownership consists of common stock and various classes of preferred stock. In connection with this investment, the Company has a preferred partner agreement with Topgolf in which the Company has preferred signage rights, rights as the preferred supplier of golf products used or offered for use at Topgolf facilities at prices no less than those paid by the Company’s customers, preferred retail positioning in the Topgolf retail stores, access to consumer information obtained by Topgolf, and other rights incidental to those listed above.
Topgolf is a privately held company, and as such, the common and preferred shares comprising the Company’s investment are illiquid and their fair value is not readily determinable. On January 1, 2018, the Company adopted ASU No. 2016-01, which requires equity securities without a readily determinable fair value to be measured at cost, less impairments if any, plus or minus
F-26
changes resulting from observable price changes in orderly transactions for the identical or similar investment of the same issuer. Since the adoption of ASU 2016-01, there has been no observable transactions which would provide an estimate of fair value.
As of December 31, 2018 and 2017, the Company's total investment in Topgolf was $72,238,000 and $70,495,000, respectively. The Company invested $1,742,000, $21,499,000 and $1,448,000 $940,000 and $14,771,000 in preferred shares of Topgolf in 2018, 2017 and 2016, 2015respectively. The shares that were purchased in 2018 from other Topgolf shareholders were not acquired in orderly transactions as these transactions were not exposed to the market and 2014, respectively. In addition,were not subject to marketing activities. As such, at December 31, 2018, the Company continues to account for its investment in Topgolf at cost less impairments in accordance with ASU No. 2016-01. As of December 2015,31, 2018, the Company has not recorded any impairments with respect to this investment. If in the future there is an observable price change as a result of an orderly transaction for the identical or similar investment in Topgolf, the Company would be required to assess the fair value impact, if any, on each identified or similar class of Topgolf stock held by the Company, and write such stock up or down to its estimated fair value, which could have a material effect on the Company's financial position and results of operations.
In December 2017, Topgolf entered intocompleted a shareholder loan agreement,private placement led by Fidelity Management and Research Company (the "Fidelity Investment"), in which resultedthe Company invested $20,000,000 in a note receivable fromseries F preferred shares of Topgolf. Due to the nature and timing of this transaction, the Company determined that the carrying value of the series F preferred shares that it purchased in this private placement approximated the fair value for such series as of December 31, 2017. At the time, the Company was not able to estimate the fair value of its other series of Topgolf preferred stock or common stock due to the dissimilar nature of conversion rights, liquidation features and other preferred terms of these shares relative to the series F preferred shares. Accordingly, the Company accounted for $3,200,000. The loan was subject to an annual interest rate of 10%, and was due and payable on March 30, 2016. The loan was paidthis investment at cost in fullaccordance with the accounting rules in February 2016.effect at the time.
In February 2016, Topgolf announced that Providence Equity Partners L.L.C. (“Providence Equity”) made a significant minority preferred stock investment in Topgolf (the “Providence Equity Investment”). As required by the terms of the Providence Equity Investment, Topgolf used a portion of the proceeds it received to repurchase shares from its existing shareholders, other than Providence Equity (the “Topgolf Repurchase Program”). In April 2016, the Company sold approximately 10.0% or $5,767,000 (on a cost basis) of its preferred shares in Topgolf under the Topgolf Repurchase Program for $23,429,000, and recognized a gain of approximately $17,662,000 in other income (expense) during the second quarter.
Note 7.9. Joint Venture
As a result of the consolidation, during the yearyears ended December 31, 2018, 2017 and 2016, the Company recorded net income attributable to the non-controlling interest of $514,000, $861,000, and $1,054,000, in its consolidated statement of operations. Atrespectively. During the years ended December 31, 2016,2018 and 2017, the Company recognizedjoint venture paid dividends to TSI of $821,000 and $974,000, respectively, which were recorded as a reduction in non-controlling interest of $9,694,000interests in itsthe consolidated financial statements. Total non-controlling interests on the Company's consolidated balance sheetsheets and consolidated statementstatements of shareholders' equity.equity was $9,734,000 and $9,744,000 at December 31, 2018 and 2017, respectively.
Note 8.10. Selected Financial Statement Information
| December 31, | December 31, | |||||||||||||
| 2016 | 2015 | 2018 | 2017 | |||||||||||
| (In thousands) | (In thousands) | |||||||||||||
| Accounts receivable, net: | ||||||||||||||
| Trade accounts receivable | $ | 142,932 | $ | 129,400 | $ | 108,547 | $ | 120,066 | ||||||
| Allowance for sales returns | (9,341 | ) | (8,148 | ) | ||||||||||
| Liability for sales returns | (24,522 | ) | (15,470 | ) | ||||||||||
| Accrued variable consideration for sales program incentives | (7,041 | ) | (5,424 | ) | ||||||||||
| Allowance for doubtful accounts | (5,728 | ) | (5,645 | ) | (5,610 | ) | (4,447 | ) | ||||||
| $ | 127,863 | $ | 115,607 | $ | 71,374 | $ | 94,725 | |||||||
| Inventories: | ||||||||||||||
| Raw materials | $ | 46,451 | $ | 53,876 | $ | 80,474 | $ | 67,785 | ||||||
| Work-in-process | 739 | 703 | 815 | 868 | ||||||||||
| Finished goods | 142,210 | 154,304 | 256,768 | 193,833 | ||||||||||
| $ | 189,400 | $ | 208,883 | $ | 338,057 | $ | 262,486 | |||||||
| Property, plant and equipment, net: | ||||||||||||||
| Land | $ | 7,251 | $ | 7,260 | $ | 7,232 | $ | 7,322 | ||||||
| Buildings and improvements | 67,945 | 63,754 | 75,070 | 71,692 | ||||||||||
| Machinery and equipment | 110,799 | 107,495 | 111,055 | 98,116 | ||||||||||
| Furniture, computers and equipment | 102,421 | 96,674 | 111,793 | 108,706 | ||||||||||
| Production molds | 19,843 | 19,478 | 4,804 | 19,604 | ||||||||||
| Construction-in-process | 4,724 | 5,507 | 17,026 | 10,665 | ||||||||||
| 312,983 | 300,168 | 326,980 | 316,105 | |||||||||||
| Accumulated depreciation | (258,508 | ) | (244,360 | ) | (238,508 | ) | (245,878 | ) | ||||||
| $ | 54,475 | $ | 55,808 | $ | 88,472 | $ | 70,227 | |||||||
| Accounts payable and accrued expenses: | ||||||||||||||
| Accounts payable | $ | 54,574 | $ | 54,789 | $ | 42,468 | $ | 63,204 | ||||||
| Accrued expenses | 57,478 | 46,933 | 127,135 | 87,925 | ||||||||||
| Accrued goods in-transit | 20,469 | 20,898 | 39,050 | 24,998 | ||||||||||
| $ | 132,521 | $ | 122,620 | $ | 208,653 | $ | 176,127 | |||||||
| Accrued employee compensation and benefits: | ||||||||||||||
| Accrued payroll and taxes | $ | 23,133 | $ | 24,118 | $ | 31,559 | $ | 29,363 | ||||||
| Accrued vacation and sick pay | 8,722 | 8,408 | 10,606 | 9,781 | ||||||||||
| Accrued commissions | 713 | 992 | 1,007 | 1,029 | ||||||||||
| $ | 32,568 | $ | 33,518 | $ | 43,172 | $ | 40,173 | |||||||
Note 9.11. Income Taxes
The Company’s income (loss) before income tax provision was subject to taxes in the following jurisdictions for the following periods (in thousands):
| Years Ended December 31, | Years Ended December 31, | |||||||||||||||||||||
2016(1) | 2015 | 2014 | 2018 | 2017 | 2016(1) | |||||||||||||||||
| United States | $ | 38,268 | $ | 6,864 | $ | 6,981 | $ | 100,031 | $ | 50,706 | $ | 38,268 | ||||||||||
| Foreign | 20,125 | 13,199 | 14,658 | 31,241 | 17,349 | 20,125 | ||||||||||||||||
| $ | 58,393 | $ | 20,063 | $ | 21,639 | $ | 131,272 | $ | 68,055 | $ | 58,393 | |||||||||||
The expense (benefit) for income taxes is comprised of (in thousands):
| Years Ended December 31, | Years Ended December 31, | |||||||||||||||||||||
2016(2) | 2015 | 2014 | 2018 | 2017 | 2016(2) | |||||||||||||||||
| Current tax provision: | ||||||||||||||||||||||
| Federal | $ | 541 | $ | 271 | $ | 496 | $ | 736 | $ | 610 | $ | 541 | ||||||||||
| State | 543 | 431 | 612 | 1,880 | 1,259 | 543 | ||||||||||||||||
| Foreign | 7,289 | 4,393 | 4,930 | 6,577 | 6,135 | 7,289 | ||||||||||||||||
| 8,373 | 5,095 | 6,038 | 9,193 | 8,004 | 8,373 | |||||||||||||||||
| Deferred tax expense (benefit): | ||||||||||||||||||||||
| Federal | (129,405 | ) | (41 | ) | (1,549 | ) | 14,844 | 20,746 | (129,405 | ) | ||||||||||||
| State | (10,693 | ) | 113 | 70 | 1,086 | (1,127 | ) | (10,693 | ) | |||||||||||||
| Foreign | (836 | ) | 328 | 1,072 | 895 | (1,235 | ) | (836 | ) | |||||||||||||
| (140,934 | ) | 400 | (407 | ) | 16,825 | 18,384 | (140,934 | ) | ||||||||||||||
| Income tax provision | $ | (132,561 | ) | $ | 5,495 | $ | 5,631 | $ | 26,018 | $ | 26,388 | $ | (132,561 | ) | ||||||||
| (1) | Income before income taxes in 2016 includes a gain of $17,662,000 that was recognized in connection with the sale of preferred shares of the Company's investment in Topgolf. See Note |
| (2) | The income tax benefit for 2016 includes the reversal of a significant portion of the valuation allowance on the Company's deferred tax assets in the U.S. See further discussion below. |
In December 2017, the Tax Act was enacted into legislation, which includes a broad range of provisions affecting businesses. The Tax Act significantly revises how companies compute their U.S corporate tax liability by, among other provisions, reducing the corporate tax rate from 35% to 21% for tax years beginning after December 31, 2017, implementing a territorial tax system, and requiring a mandatory one-time tax on U.S. owned undistributed foreign earnings and profits known as the toll charge or transition tax.
Pursuant to the SEC Staff Accounting Bulletin ("SAB") No. 118, "Income Tax Accounting Implications of the Tax Cuts and Jobs Act" ("SAB 118"), a company may select among one of three scenarios to reflect the impact of the Tax Act in its financial statements within a measurement period. Those scenarios are (i) a final estimate which effectively closes the measurement period; (ii) a reasonable estimate leaving the measurement period open for future revisions; and (iii) no estimate as the law is still being analyzed in which case a company continues to apply its accounting on the basis of the provisions of the tax laws that were in effect immediately before the enactment of the Tax Act. SAB 118 allows for the reporting provisional of amounts for certain income tax effects in scenarios (ii) and (iii). The measurement period began in the reporting period that includes the Tax Act’s enactment date and ended when the Company obtained, prepared, and analyzed the information that was needed in order to complete the accounting requirements under ASC Topic 740. The Company provided a reasonable estimate for the impact of the Tax Act for the year ended December 31, 2017. The measurement period ended on December 22, 2018 and the Company recorded additional expense of $906,000 related to the transition tax. No other significant adjustments were made relating to the Tax Act.
Additionally, the Company has elected to treat GILTI as a period cost and will expense GILTI in the period it is incurred.
As of December 31, 2018 significant guidance with respect to the Tax Act remains proposed or outstanding. As such, many components of the 2018 tax expense remain estimates and are primarily based on proposed regulations and other guidance as released by the IRS and United States Treasury. The most significant estimate relates to foreign derived intangible income ("FDII").
The Company recorded $3,562,000 of tax benefit related to FDII which was calculated based on the Company’s best interpretation of the Tax Act and is not expected to differ materially if guidance differs from the Company's assumptions.
Significant components of the Company’s deferred tax assets and liabilities as of December 31, 20162018 and 20152017 are as follows (in thousands):
| December 31, | December 31, | |||||||||||||
| 2016 | 2015 | 2018 | 2017 | |||||||||||
| Deferred tax assets: | ||||||||||||||
| Reserves and allowances not currently deductible for tax purposes | $ | 15,506 | $ | 14,292 | $ | 13,495 | $ | 12,783 | ||||||
| Basis difference related to fixed assets | 9,697 | 10,170 | 5,342 | 5,946 | ||||||||||
| Compensation and benefits | 9,273 | 8,964 | 8,416 | 7,807 | ||||||||||
| Basis difference for inventory valuation | 2,100 | 1,764 | 1,784 | 1,612 | ||||||||||
| Compensatory stock options and rights | 5,715 | 3,659 | 3,988 | 3,869 | ||||||||||
| Deferred revenue and other | 226 | 169 | 120 | 175 | ||||||||||
| Operating loss carryforwards | 75,110 | 96,067 | 7,191 | 21,799 | ||||||||||
| Tax credit carryforwards | 32,730 | 19,787 | 54,219 | 62,668 | ||||||||||
| Basis difference related to intangible assets with a definite life | 13,993 | 16,617 | 12,767 | 7,061 | ||||||||||
| Other | 389 | (162 | ) | 5,678 | 634 | |||||||||
| Total deferred tax assets | 164,739 | 171,327 | 113,000 | 124,354 | ||||||||||
| Valuation allowance for deferred tax assets | (16,515 | ) | (164,616 | ) | (13,408 | ) | (11,114 | ) | ||||||
| Deferred tax assets, net of valuation allowance | $ | 148,224 | $ | 6,711 | $ | 99,592 | $ | 113,240 | ||||||
| Deferred tax liabilities: | ||||||||||||||
| Prepaid expenses | (1,082 | ) | (868 | ) | (1,181 | ) | (773 | ) | ||||||
| Basis difference related to intangible assets with an indefinite life | (34,031 | ) | (33,974 | ) | (25,128 | ) | (22,891 | ) | ||||||
| Total deferred tax liabilities | (35,113 | ) | (34,842 | ) | (26,309 | ) | (23,664 | ) | ||||||
| Net deferred tax liabilities | $ | 113,111 | $ | (28,131 | ) | |||||||||
| Net deferred tax assets | $ | 73,283 | $ | 89,576 | ||||||||||
| Net deferred tax assets (liabilities) are shown on the accompanying consolidated balance sheets as follows: | ||||||||||||||
| Non-current deferred tax assets | $ | 114,707 | $ | 6,962 | $ | 75,079 | $ | 91,398 | ||||||
| Non-current deferred tax liabilities | (1,596 | ) | (35,093 | ) | (1,796 | ) | (1,822 | ) | ||||||
| Net deferred tax assets (liabilities) | $ | 113,111 | $ | (28,131 | ) | |||||||||
| Net deferred tax assets | $ | 73,283 | $ | 89,576 | ||||||||||
The net change in net deferred taxes in 20162018 of $141,242,000$16,292,000 is primarily comprised of athe utilization of net deferredoperating losses and tax benefit of $148,100,000 related to the change in valuation allowance, a net deferred tax expense of $6,511,000 related to current year deferred tax changes, and an expense of $348,000 related to foreign currency translation adjustments. The $148,100,000 change in the valuation allowance is comprised of a $156,600,000 one-time benefit related to the valuation allowance reversal,credits through profitable operations offset by $8,500,000the generation of current year generated valuation allowanceR&D credits and certain adjustments.the foreign derived intangible income deduction.
Deferred tax assets and liabilities result from temporary differences between the financial reporting and tax bases of assets and liabilities and are measured using the enacted tax rates and laws that are anticipated to be in effect at the time the differences are expected to reverse. The realization of the deferred tax assets, including loss and credit carry forwards, is subject to the Company generating sufficient taxable income during the periods in which the temporary differences become realizable. In accordance with the applicable accounting rules, the Company maintains a valuation allowance for a deferred tax asset when it is deemed to be more likely than not that some or all of the deferred tax assets will not be realized. In evaluating whether a valuation allowance is required under such rules, the Company considers all available positive and negative evidence, including prior operating results, the nature and reason for any losses, its forecast of future taxable income, and the dates on which any deferred tax assets are expected to expire. These assumptions require a significant amount of judgment, including estimates of future taxable income. These estimates are based on the Company’s best judgment at the time made based on current and projected circumstances and conditions.
In 2011, the Company established a valuation allowance against its U.S. deferred tax assets. During the fourth quarter of 2016, the Company evaluated all available positive and negative evidence, including the Company's improved profitability in 2015 and 2016, (which resulted in the Company having three years of cumulative income on its U.S. business as of December 31, 2016), combined with future projections of profitability. As a result, the Company determined that the majority of its U.S. deferred tax assets were more likely than not to be realized and reversed a significant portion of the valuation allowance against those deferred
tax assets accordingly. The remaining valuation allowance on the Company's U.S. deferred tax assets as of December
F-30
31, 20162018 and 2017 relate primarily to state net operating loss carryforwards and credits the Company estimates it may not be able to utilize in future periods. With respect to non-U.S. entities, there continues to be sufficient positive evidence to conclude that realization of its deferred tax assets is more likely than not under applicable accounting rules, and no significant allowances have been established.
At December 31, 2016,2018, the Company had federal and state income tax credit carryforwards of $23,812,000$62,806,000 and $13,897,000,$18,335,000, respectively, which will expire if unused at various dates beginning in 2021.on December 31, 2024. Such credit carryforwards expire as follows (in thousands):
| U.S. foreign tax credit | $ | 15,793 | 2021 - 2026 | $ | 47,407 | 2024 - 2028 | ||||
| U.S. research tax credit | $ | 7,819 | 2031 - 2036 | $ | 15,374 | 2030 - 2038 | ||||
| U.S. business tax credits | $ | 21 | 2031 - 2036 | $ | 25 | 2030 - 2038 | ||||
| U.S. AMT credits | $ | 179 | Do not expire | |||||||
| State investment tax credits | $ | 820 | Do not expire | $ | 1,031 | Do not expire | ||||
| State research tax credits | $ | 13,077 | Do not expire | $ | 17,304 | Do not expire | ||||
The Company has recorded a deferred tax asset reflecting the benefit of operating loss carryforwards. The net operating losses expire as follows (in thousands):
| U.S. loss carryforwards | $ | 187,696 | 2032 - 2035 | $ | — | N/A | ||||
| State loss carryforwards | $ | 146,674 | 2017 - 2036 | $ | 105,771 | 2021 - 2035 |
The Company’s ability to utilize the losses and credits to offset future taxable income may be deferred or limited significantly if the Company were to experience an “ownership change” as defined in section 382 of the Internal Revenue Code of 1986, as amended (the “Code”). In general, an ownership change will occur if there is a cumulative change in ownership of the Company’s stock by “5-percent shareholders” (as defined in the Code) that exceeds 50 percentage points over a rolling three-year period. The Company determined that no ownership change has occurred for purposes of Section 382 for the period ended December 31, 2016.2018.
A reconciliation of the effective tax rate on income or loss and the statutory tax rate is as follows:
| Years Ended December 31, | Years Ended December 31, | |||||||||||||||
| 2016 | 2015 | 2014 | 2018 | 2017 | 2016 | |||||||||||
| Statutory U.S. tax rate | 35.0 | % | 35.0 | % | 35.0 | % | 21.0 | % | 35.0 | % | 35.0 | % | ||||
| State income taxes, net of U.S. tax benefit | 3.1 | % | 3.5 | % | 1.9 | % | 2.0 | % | 2.6 | % | 3.1 | % | ||||
| Federal and State tax credits, net of U.S. tax benefit | (5.0 | )% | (11.5 | )% | (9.8 | )% | (6.0 | )% | (4.1 | )% | (5.0 | )% | ||||
| Foreign income taxed at other than U.S. statutory rate | 1.8 | % | (2.4 | )% | (13.4 | )% | 1.7 | % | (0.2 | )% | 1.8 | % | ||||
| Effect of foreign rate changes | 0.5 | % | 0.9 | % | 1.3 | % | (0.1 | )% | 0.2 | % | 0.5 | % | ||||
| Foreign tax credit | (11.3 | )% | (12.0 | )% | (13.5 | )% | (0.8 | )% | (1.3 | )% | (11.3 | )% | ||||
| Basis differences of intangibles with an indefinite life | 0.1 | % | 0.1 | % | 0.1 | % | — | % | 0.1 | % | 0.1 | % | ||||
| Change in deferred tax valuation allowance | (262.4 | )% | 0.3 | % | 35.3 | % | 0.5 | % | (1.9 | )% | (262.4 | )% | ||||
| Accrual for interest and income taxes related to uncertain tax positions | 2.9 | % | (0.3 | )% | (7.3 | )% | 1.8 | % | 2.2 | % | 2.9 | % | ||||
| Income (loss) from flowthrough entities | (0.2 | )% | (2.0 | )% | (1.9 | )% | 0.6 | % | 1.0 | % | (0.2 | )% | ||||
| Meals and entertainment | 1.5 | % | 3.4 | % | 3.3 | % | 0.6 | % | 1.1 | % | 1.5 | % | ||||
| Group loss relief | (1.6 | )% | (3.7 | )% | (2.6 | )% | (0.4 | )% | (0.6 | )% | (1.6 | )% | ||||
| Stock option compensation | 0.2 | % | (1.9 | )% | 2.3 | % | (1.1 | )% | (2.0 | )% | 0.2 | % | ||||
| Foreign dividends and earnings inclusion | 9.9 | % | 7.1 | % | (0.9 | )% | 0.2 | % | 0.7 | % | 9.9 | % | ||||
| Foreign tax withholding | 0.6 | % | 1.4 | % | 2.4 | % | 0.5 | % | 0.9 | % | 0.6 | % | ||||
| Executive compensation limitation | 0.7 | % | 4.3 | % | — | % | 0.7 | % | 0.5 | % | 0.7 | % | ||||
| Intra-entity asset transfers | 0.8 | % | (6.3 | )% | — | % | ||||||||||
| Enactment of the Tax Cuts and Jobs Act | 0.3 | % | 11.1 | % | — | % | ||||||||||
| Foreign Derived Intangible Income Deduction | (2.7 | )% | — | % | — | % | ||||||||||
| Other | (2.8 | )% | 5.2 | % | (6.2 | )% | 0.2 | % | (0.2 | )% | (2.8 | )% | ||||
| Effective tax rate | (227.0 | )% | 27.4 | % | 26.0 | % | 19.8 | % | 38.8 | % | (227.0 | )% | ||||
A reconciliation of the beginning and ending amount of unrecognized tax benefits is as follows (in thousands):
| 2016 | 2015 | 2014 | 2018 | 2017 | 2016 | |||||||||||||||||
| Balance at January 1 | $ | 7,090 | $ | 6,559 | $ | 11,851 | $ | 9,300 | $ | 8,256 | $ | 7,090 | ||||||||||
| Additions based on tax positions related to the current year | 969 | 1,120 | 638 | 1,354 | 1,061 | 969 | ||||||||||||||||
| Additions for tax positions of prior years | 542 | 132 | 121 | 1,624 | 233 | 542 | ||||||||||||||||
| Reductions for tax positions of prior years | (80 | ) | (255 | ) | (3,691 | ) | (148 | ) | (192 | ) | (80 | ) | ||||||||||
| Settlement of tax audits | — | — | (258 | ) | — | (33 | ) | — | ||||||||||||||
| Reductions due to lapsed statute of limitations | (265 | ) | (466 | ) | (2,102 | ) | (298 | ) | (25 | ) | (265 | ) | ||||||||||
| Balance at December 31 | $ | 8,256 | $ | 7,090 | $ | 6,559 | $ | 11,832 | $ | 9,300 | $ | 8,256 | ||||||||||
As of December 31, 2016,2018, the gross liability for income taxes associated with uncertain tax benefits was $8,256,000.$11,832,000. This liability could be reduced by $1,335,000$1,620,000 of offsetting tax benefits associated with the correlative effects of potential transfer pricing adjustments, which was recorded as a long-term income tax receivable, as well as $5,620,000$4,090,000 of deferred taxes. The net amount of $1,301,000,$6,122,000, if recognized, would affect the Company’s financial statements and favorably affect the Company’s effective income tax rate.
The Company does not expect changes to the unrecognized tax benefits in the next 12 months to have a material impact on its results of operations or its financial position.
The Company recognizes interest and/or penalties related to income tax matters in income tax expense. The Company recognized a tax expense of approximately $258,000 for the year ended December 31, 2016,$42,000, $301,000, and tax benefits of approximately $2,000 and $101,000$258,000 for the years ended December 31, 20152018, 2017, and 2014, respectively, related to interest and penalties in the provision for income taxes.2016, respectively. As of December 31, 20162018 and 2015,2017, the gross amount of accrued interest and penalties included in income taxes payable in the accompanying consolidated balance sheets was $1,317,000$1,660,000 and $1,060,000,$1,618,000, respectively.
The Company or one of its subsidiaries files income tax returns in the U.S. federal jurisdiction and various states and foreign jurisdictions. The Company is generally no longer subject to income tax examinations by tax authorities in its major jurisdictions as follows:
| Major Tax Jurisdiction | Years No Longer Subject to Audit |
| U.S. federal | 2010 and prior |
| California (U.S.) | 2008 and prior |
| Canada | |
| Japan | |
| South Korea | |
| United Kingdom | |
As of December 31, 2016,2018, the Company didhad $129,347,000 of undistributed foreign earnings and profits. Pursuant to the Tax Act, the Company’s undistributed foreign earnings and profits were deemed repatriated as of December 31, 2017 and 2018 foreign profits are not provideexpected to be subject to U.S. income tax. The Company has not provided deferred tax liabilities for United States income taxes or foreign withholding taxes and certain state income taxes on a cumulative total of $108,600,000 ofthe undistributed earnings and profits from certain non-U.S. subsidiaries that will be permanently reinvested outside the United States.
Upon remittance,the distribution of foreign earnings and profits, certain foreign countries impose withholding taxes, subject to certain limitations, for use as credits against the Company’s U.S. tax liability, if any. If the foreign earnings and profits were remitted,distributed, the Company would need to accrue an additional income tax liability. However, the Company wouldmay also be allowed a credit against substantially all the Company’s U.S. tax liability for the taxes paid in foreign jurisdictions. The Company expects the net impact on the Company’s U.S. tax liability to be insignificant.
Note 10.12. Commitments & Contingencies
Legal Matters
The Company is subject to routine legal claims, proceedings and investigations incident to its business activities, including claims, proceedings, and investigations relating to commercial disputes and employment matters. The Company also receives from time to time information claiming that products sold by the Company infringe or may infringe patent, trademark or other intellectual property rights of third parties. One or more such claims of potential infringement could lead to litigation, the need to obtain
F-32
licenses, the need to alter a product to avoid infringement, a settlement or judgment or some other action or material loss by the Company, which also could adversely affect the Company’s overall ability to protect its product designs and ultimately limit its future success in the marketplace. In addition, the Company is occasionally subject to non-routine claims, proceedings or investigations.
The Company regularly assesses such matters to determine the degree of probability that the Company will incur a material loss as a result of such matters as well as the range of possible loss. An estimated loss contingency is accrued in the Company’s financial statements if it is probable the Company will incur a loss and the amount of the loss can be reasonably estimated. The Company reviews all claims, proceedings and investigations at least quarterly and establishes or adjusts any accruals for such matters to reflect the impact of negotiations, settlements, advice of legal counsel and other information and events pertaining to a particular matter. All legal costs associated with such matters are expensed as incurred.
Historically, the claims, proceedings and investigations brought against the Company, individually and in the aggregate, have not had a material adverse effect on the consolidated results of operations, cash flows or financial position of the Company. The Company believes that it has valid legal defenses to the matters currently pending against the Company. These matters are inherently unpredictable and the resolutions of these matters are subject to many uncertainties and the outcomes are not predictable with assurance. Consequently, management is unable to estimate the ultimate aggregate amount of monetary loss, amounts covered by insurance or the financial impact that will result from such matters. In addition, the Company cannot assure that it will be able to successfully defend itself in those matters or that any amounts accrued are sufficient. The Company does not believe that the matters currently pending against the Company will have a material adverse effect on the Company's consolidated business, financial condition, cash flows or results of operations on an annual basis.
Lease Commitments
The Company leases certain warehouse, distribution and office facilities, vehicles and office equipment under operating leases, and certain office equipment under capital leases. Lease terms range from one to ten years expiring at various dates through December 2025, with options to renew operating leases at varying terms. Commitments for minimum lease payments under non-cancelable operating and capital leases as of December 31, 20162018 are as follows (in thousands):
| Operating Leases | Capital Leases | Operating Leases | Capital Leases | |||||||||||
| 2017 | $ | 6,218 | $ | 202 | ||||||||||
| 2018 | 3,851 | 203 | ||||||||||||
| 2019 | 2,942 | 50 | $ | 10,184 | $ | 163 | ||||||||
| 2020 | 2,211 | 2 | 9,345 | 117 | ||||||||||
| 2021 | 1,627 | 1 | 8,193 | 116 | ||||||||||
| 2022 | 7,750 | 113 | ||||||||||||
| 2023 | 7,250 | 3 | ||||||||||||
| Thereafter | 8,775 | — | 17,832 | — | ||||||||||
| $ | 25,624 | $ | 458 | $ | 60,554 | $ | 512 | |||||||
Rent expense for the Company’s operating lease commitments for the years ended December 31, 2018, 2017 and 2016 2015was $19,379,000, $16,382,000 and 2014 was $13,516,000, $13,245,000 and $12,479,000, respectively. At December 31, 2016,2018, the minimum rental payments under capital leases totaled $458,000.$512,000. Minimum rental payments under operating leases with initial or remaining terms of one year or more totaled $25,624,000,$60,554,000, net of sublease receipts of $1,149,000$419,000 at December 31, 2016.2018.
Unconditional Purchase Obligations
During the normal course of its business, the Company enters into agreements to purchase goods and services, including purchase commitments for production materials, endorsement agreements with professional golfers and other endorsers, employment and consulting agreements, and intellectual property licensing agreements pursuant to which the Company is required to pay royalty fees. It is not possible to determine the amounts the Company will ultimately be required to pay under these agreements
as they are subject to many variables including performance-based bonuses, severance arrangements, the Company’s sales levels, and reductions in payment obligations if designated minimum performance criteria are not achieved. As of December 31, 2016,2018, the Company has entered into many of these contractual agreements with terms ranging from one to fivefour years. The aggregate minimum obligations that the Company is required to pay under these agreements is $49,264,000$51,159,000 over the next five years. In the aggregate, the actual amount paid under these obligations is likely to be higher than the amounts listed as a result of the variable nature of these obligations. In addition, the Company also enters into unconditional purchase obligations with various vendors and suppliers of goods and services in the normal course of operations through purchase orders or other documentation or that are
F-33
undocumented except for an invoice. Such unconditional purchase obligations are generally outstanding for periods less than a year and are settled by cash payments upon delivery of goods and services and are not reflected in this total.line item. Future purchase commitments as of December 31, 2016,2018, are as follows (in thousands):
| 2017 | $ | 36,238 | ||||
| 2018 | 7,791 | |||||
| 2019 | 3,107 | $ | 33,724 | |||
| 2020 | 1,642 | 10,075 | ||||
| 2021 | 481 | 5,077 | ||||
| Thereafter | 5 | |||||
| 2022 | 2,283 | |||||
| $ | 49,264 | $ | 51,159 | |||
Other Contingent Contractual Obligations
During its normal course of business, the Company has made certain indemnities, commitments and guarantees under which it may be required to make payments in relation to certain transactions. These include (i) intellectual property indemnities to the Company’s customers and licensees in connection with the use, sale and/or license of Company product or trademarks, (ii) indemnities to various lessors in connection with facility leases for certain claims arising from such facilities or leases, (iii) indemnities to vendors and service providers pertaining to the goods and services provided to the Company or based on the negligence or willful misconduct of the Company and (iv) indemnities involving the accuracy of representations and warranties in certain contracts. In addition, the Company has consulting agreements that provide for payment of nominal fees upon the issuance of patents and/or the commercialization of research results. The Company has also issued guarantees in the form of standby letters of credit of $823,000$1,187,000 as of December 31, 2016.2018.
The duration of these indemnities, commitments and guarantees varies, and in certain cases, may be indefinite. The majority of these indemnities, commitments and guarantees do not provide for any limitation on the maximum amount of future payments the Company could be obligated to make. Historically, costs incurred to settle claims related to indemnities have not been material to the Company’s financial position, results of operations or cash flows. In addition, the Company believes the likelihood is remote that payments under the commitments and guarantees described above will have a material effect on the Company’s financial condition. The fair value of indemnities, commitments and guarantees that the Company issued during and as of the year ended December 31, 20162018 was not material to the Company’s financial position, results of operations or cash flows.
Employment Contracts
In addition, the Company has made contractual commitments to each of its officers and certain other employees providing for severance payments, including salary continuation, upon the termination of employment by the Company without substantial cause or by the officer for good reason or non-renewal. In addition, in order to assure that the officers would continue to provide independent leadership consistent with the Company’s best interest, the contracts also generally provide for certain protections in the event of a change in control of the Company. These protections include the payment of certain severance benefits, such as salary continuation, upon the termination of employment following a change in control.
Note 11.13. Capital Stock
Common Stock and Preferred Stock
As of December 31, 2016,2018, the Company has an authorized capital of 243,000,000 shares, $0.01 par value, of which 240,000,000 shares are designated common stock, and 3,000,000 shares are designated preferred stock. Of the preferred stock, 240,000 shares are designated Series A Junior Participating Preferred Stock and the remaining shares of preferred stock are undesignated as to series, rights, preferences, privileges or restrictions.
The holders of common stock are entitled to one vote for each share of common stock on all matters submitted to a vote of the Company’s shareholders. Although to date no shares of Series A Junior Participating preferred stock have been issued, if such shares were issued, each share of Series A Junior Participating Preferred Stock would entitle the holder thereof to 1,000 votes on all matters submitted to a vote of the shareholders of the Company. The holders of Series A Junior Participating Preferred Stock and the holders of common stock shall generally vote together as one class on all matters submitted to a vote of the Company’s shareholders. Shareholders entitled to vote for the election of directors are entitled to vote cumulatively for one or more nominees.
F-34
Treasury Stock and Stock Repurchases
In August 2014, the Company's Board of Directors authorized a $50,000,000 share repurchase program (the "2014 Repurchase Program") under which the Company was authorized to repurchase shares of its common stock in the open market or in private transactions, subject to the Company’s assessment of market conditions and buying opportunities. Through April 2018, the Company had repurchased $46,900,000 of its common stock under this program. The 2014 Repurchase Program remained in effect until May 8, 2018, at which time it was canceled by the Board of Directors and replaced by a new share repurchase program with a maximum cost to the Company of $50,000,000 (the "2018 Repurchase Program"), under which the Company is authorized to repurchase shares of its common stock in the open market or in private transactions, subject to the Company’s assessment of market conditions and buying opportunities. The repurchases are made consistent with the terms of the Company's credit facilityABL Facility which defineslimits the amount of stock that can be repurchased. The repurchase program will remain in effect until completed or until terminated by the Board of Directors.
During 2016,2018, the Company repurchased approximately 572,0001,412,000 shares of its common stock under the 2014 and 2018 repurchase programprograms at an average cost per share of $8.99,$15.90, for a total cost of $5,144,000.$22,456,000. Included in these amounts are $6,081,000 of shares the Company withheld to satisfy the Company's tax withholding obligations in connection with the vesting and settlement of employee restricted stock unit awards and performance share units. The Company’s repurchases of shares of common stock are recorded at cost and result in a reduction of shareholders’ equity. As of December 31, 2016,2018, the total amount remaining under the repurchase authorization was $41,883,000.$49,719,000.
Note 12.14. Share-Based Employee Compensation
The Company accounts for its share-based compensation arrangements in accordance with ASC Topic 718, which requires the measurement and recognition of compensation expense for all share-based payment awards to employees and directors based on estimated fair values. ASC Topic 718 further requires a reduction in share-based compensation expense by an estimated forfeiture rate. The forfeiture rate used by the Company is based on historical forfeiture trends. If actual forfeiture rates are not consistent with the Company’s estimates, the Company may be required to increase or decrease compensation expenses in future periods.
Stock Plans
As of December 31, 2016,2018, the Company had two shareholder approved stock plans under which shares were available for equity-based awards: the Callaway Golf Company Amended and Restated 2004 Incentive Plan (the "2004 Incentive Plan") and the 2013 Non-Employee Directors Stock Incentive Plan (the "2013 Directors Plan").
The 2004 Incentive Plan permits the granting of stock options, stock appreciation rights, restricted stock awards, restricted stock units, performance share units and other equity-based awards to the Company’s officers, employees, consultants and certain other non-employees who provide services to the Company. All grants under the 2004 Incentive Plan are discretionary, although no participant may receive awards in any one year in excess of 2,000,000 shares. The maximum number of shares issuable over the term of the 2004 Incentive Plan is 24,000,000.33,000,000.
The 2013 Directors Plan permits the granting of stock options, restricted stock awards and restricted stock units to eligible directors serving on the Company's Board of Directors. The Directors may receive a one-time grant upon their initial appointment to the Board and thereafter an annual grant upon being re-elected at each annual meeting of shareholders, not to exceed 50,000 shares within any calendar year. The maximum number of shares issuable over the term of the 2013 Directors Plan is 1,000,000.1,000,000.
The following table presents shares authorized, available for future grant and outstanding under each of the Company’s plans as of December 31, 2016:2018:
| Authorized | Available | Outstanding(1) | Authorized | Available | Outstanding(1) | |||||||||||
| (In thousands) | (In thousands) | |||||||||||||||
| 2004 Incentive Plan | 24,000 | 4,232 | 4,747 | 33,000 | 9,706 | 3,004 | ||||||||||
| 2013 Directors Plan | 1,000 | 808 | 44 | 1,000 | 696 | 51 | ||||||||||
| Total | 25,000 | 5,040 | 4,791 | 34,000 | 10,402 | 3,055 | ||||||||||
| (1) | Includes |
Stock Options
All stock option grants made under the 2004 Incentive Plan are made at exercise prices no less than the Company’s closing stock price on the date of grant. Outstanding stock options generally vest over a three-year period from the grant date and generally expire up to 10 years after the grant date. The Company recorded $146,000, $1,396,000$14,000, $34,000 and $1,907,000$146,000 of compensation expense relating to outstanding stock options for the years ended December 31, 2016, 20152018, 2017 and 2014,2016, respectively.
The Company records compensation expense for employee stock options based on the estimated fair value of the options on the date of grant using the Black-Scholes option-pricing model. The model uses various assumptions, including a risk-free interest rate, the expected term of the options, the expected stock price volatility, and the expected dividend yield. Compensation expense for employee stock options is recognized over the vesting term and is reduced by an estimate for forfeitures, which is based on the Company’s historical forfeitures of unvested options and awards. The Company did not grant stock options during the years ended December 31, 2016, 20152018, 2017 and 2014.2016. For the years ended December 31, 2016, 20152018 and 2014,2017, the weighted average estimated forfeiture rate used was 3.7%, 6.2%,1.7% and 6.5%, respectively.3.7% at December 31, 2016.
The Company uses forecasted dividends to estimate the expected dividend yield. The expected volatility is based on the historical volatility of the Company’s stock. The risk-free interest rate is based on the U.S. Treasury yield curve at the date of grant with maturity dates approximately equal to the expected term of the options at the date of the grant. The expected life of the Company’s options is based on evaluations of historical employee exercise behavior, forfeitures, cancellations and other factors. The valuation model applied in this calculation utilizes highly subjective assumptions that could potentially change over time. Changes in the subjective input assumptions can materially affect the fair value estimates of an option. Furthermore, the estimated fair value of an option does not necessarily represent the value that will ultimately be realized by the employee holding the option.
The following table summarizes the Company’s stock option activities for the year ended December 31, 20162018 (in thousands, except price per share and contractual term):
| Options | Number of Shares | Weighted- Average Exercise Price Per Share | Weighted- Average Remaining Contractual Term | Aggregate Intrinsic Value | Number of Shares | Weighted- Average Exercise Price Per Share | Weighted- Average Remaining Contractual Term | Aggregate Intrinsic Value | ||||||||||||||||
| Outstanding at January 1, 2016 | 2,425 | $ | 8.55 | |||||||||||||||||||||
| Outstanding at January 1, 2018 | 980 | $ | 7.15 | |||||||||||||||||||||
| Granted | — | $ | — | — | $ | — | ||||||||||||||||||
| Exercised | (375 | ) | $ | 7.04 | (232 | ) | $ | 7.05 | ||||||||||||||||
| Forfeited | — | $ | — | — | $ | — | ||||||||||||||||||
| Expired | (267 | ) | $ | 14.86 | (57 | ) | $ | 14.92 | ||||||||||||||||
| Outstanding at December 31, 2016 | 1,783 | $ | 7.92 | 4.64 | $ | 6,353 | ||||||||||||||||||
| Vested and expected to vest in the future at December 31, 2016 | 1,782 | $ | 7.92 | 4.64 | $ | 6,350 | ||||||||||||||||||
| Exercisable at December 31, 2016 | 1,759 | $ | 7.93 | 4.62 | $ | 6,258 | ||||||||||||||||||
| Outstanding at December 31, 2018 | 691 | $ | 6.54 | 4.05 | $ | 6,053 | ||||||||||||||||||
| Vested and expected to vest in the future at December 31, 2018 | 691 | $ | 6.54 | 4.05 | $ | 6,053 | ||||||||||||||||||
| Exercisable at December 31, 2018 | 691 | $ | 6.54 | 4.05 | $ | 6,053 | ||||||||||||||||||
At December 31, 2016,2018, there was $48,000 of totalno unrecognized compensation expense related to options granted to employees under the Company’s share-based payment plans. That cost is expected to be recognized over a weighted-average period of 1.4 years. The amount of unrecognized compensation expense noted above does not necessarily represent the amount that will ultimately be realized by the Company in its consolidated statement of operations.
The total intrinsic value for options exercised during the years ended December 31, 2018, 2017 and 2016 2015was $2,621,000, $3,546,000 and 2014 was $1,005,000, $2,151,000 and $569,000, respectively. Cash received from the exercise of stock options for the years ended December 31, 2018, 2017 and 2016 2015was $1,636,000, $5,362,000 and 2014 was $2,637,000, $6,565,000 and $2,291,000, respectively.
F-36
Restricted Stock Units
Restricted stock units awarded under the 2004 Incentive Plan and the 2013 Directors Plan are recorded at the Company’s closing stock price on the date of grant. Restricted stock units generally vest over a one- to three-year period. At December 31, 2016, 20152018, 2017 and 2014,2016, the weighted average grant-date fair value of restricted stock units granted was $9.36, $8.33$15.30, $10.94 and $8.21,$9.36, respectively. The Company recorded $4,283,000, $3,539,000$5,949,000, $5,537,000 and $2,530,000$4,283,000 of compensation expense related to restricted stock units in 2016, 20152018, 2017 and 2014,2016, respectively.
The table below is a roll-forward of the activity for restricted stock units during the 12 months ended December 31, 20162018 (in thousands, except fair value amounts):
| Restricted Stock Units | Units | Weighted- Average Grant-Date Fair Value | Units | Weighted- Average Grant-Date Fair Value | ||||||||
| Nonvested at January 1, 2016 | 1,268 | $ | 7.77 | |||||||||
| Nonvested at January 1, 2018 | 1,276 | $ | 10.09 | |||||||||
| Granted | 707 | 9.36 | 424 | 15.30 | ||||||||
| Vested | (541 | ) | 7.12 | (451 | ) | 9.28 | ||||||
| Forfeited | (15 | ) | 8.24 | (10 | ) | 11.32 | ||||||
Nonvested at December 31, 20161 | 1,419 | $ | 8.81 | |||||||||
Nonvested at December 31, 20181 | 1,239 | $ | 12.16 | |||||||||
| (1) | Excludes |
At December 31, 2016,2018, there was $6,831,000$8,918,000 of total unrecognized compensation expense related to nonvested restricted stock units granted to employees under the Company’s share-based payment plans. That cost is expected to be recognized over a weighted-average period of 1.92.2 years.
Performance Share Units
Performance share units granted under the 2004 Incentive Plan are stock-based awards in which the number of shares ultimately received depends on the Company's performance against specified metrics which are generally over a one- to three-year performance period from the date of grant. These performance metrics are established by the Company at the beginning of the performance period. At the end of the performance period, the number of shares of stock that could be issued is fixed based upon the degree of achievement of the performance goals. The number of shares that could be issued can range from 0% to 200% of the participant's target award. Performance share units are initially valued at the Company's closing stock price on the date of grant. CompensationStock compensation expense, net of estimated forfeitures, is recognized on a straight-line basis over the vesting period. The expense recognized over the vesting period and will varyis adjusted up or down based on the anticipated performance level during the performance period. If the performance metrics are not probable of achievement during the performance period, compensation expense would be reversed. The awards are forfeited if the threshold performance metrics are not achieved as of the end of the performance period. The performance share units generally cliff-vest in full on the third anniversary ofthree years from the date of grant.
The Company granted 420,000, 510,000307,000, 462,000 and 453,000420,000 performance share units during the years ended December 31, 2018, 2017 and 2016, 2015 and 2014, respectively,at a weighted average grant-date fair value of $8.61, $7.96$14.80, $10.68 and $8.20$8.61 per share, respectively. TheThese awards granted in 2016 are subject to a three-year performance period provided that (i) if certain first year performance goals are achieved, the participant could earn up to 50% of the three-year target award shares, subject to continued service through the vesting date, and (ii) if certain cumulative first and second year performance goals are achieved, the participant could earn up to an aggregate of 80% of the three-year target award shares (which includes any shares earned during the first year), subject to continued service through the vesting date. Based on the Company’s performance, in 2016, participants earned a minimum of 50% of the target award shares granted in 2017, and 80% of the target award shares granted in 2016, subject to continued service through the vesting date. The awards granted in 2014 and 2015 were subject to a one-year performance period, subject to continued service through the vesting date. Based on the Company's performance in 2015 and 2014, the participants earned 130.2% and 131.5% of the target award, respectively. dates.
During the years ended December 31, 2016, 20152018, 2017 and 2014,2016, the Company recognized total compensation expense, net of estimated forfeitures, of $4,536,000, $2,607,000$7,567,000, $7,075,000 and $1,302,000,$4,536,000, respectively, for performance share units. At December 31, 2016,2018, the unamortized
compensation expense related to these awards was $5,465,000,$10,066,000, which is expected to be recognized over a weighted-average period of 1.1 years.
F-37
The table below is a roll-forward of the activity for performance share units during the 12 months ended December 31, 20162018 (in thousands, except fair value amounts):
| Performance Share Units | Units | Weighted- Average Grant-Date Fair Value | Units | Weighted- Average Grant-Date Fair Value | ||||||||
Nonvested at January 1, 20161 | 1,177 | $ | 8.07 | |||||||||
Nonvested at January 1, 20181 | 1,433 | $ | 9.05 | |||||||||
| Granted | 420 | 8.61 | 307 | 14.80 | ||||||||
| Vested | — | — | (606 | ) | 7.87 | |||||||
| Forfeited | (18 | ) | 7.97 | (15 | ) | 10.68 | ||||||
| Nonvested at December 31, 2016 | 1,579 | $ | 8.24 | |||||||||
| Nonvested at December 31, 2018 | 1,119 | $ | 11.10 | |||||||||
| (1) | Nonvested performance share units as of January 1, |
Stock Appreciation Rights
Cash settled stock appreciation rights ("SARs") granted under the 2004 Incentive Plan are valued using the Black-Scholes option-pricing model on the date of grant. SARs are subsequently remeasured at each interim reporting period based on a revised Black-Scholes value until they are exercised. SARs vest over a three-year period. As of December 31, 2016, the outstanding SARs were fully vested.
| Stock Appreciation Rights | Units | Weighted- Average Exercise Price Per Share | ||||
| Nonvested and Outstanding at January 1, 2016 | 498 | $ | 6.51 | |||
| Granted | — | — | ||||
| Exercised | (448 | ) | 6.51 | |||
| Forfeited | — | — | ||||
| Outstanding at December 31, 2016 | 50 | $ | 6.48 | |||
Share-Based Compensation Expense
The table below summarizes the amounts recognized in the financial statements for the years ended December 31, 2016, 20152018, 2017 and 20142016 for share-based compensation, including expense for stock options, restricted stock units, performance share units phantom stock units and cash settled stock appreciation rights (in thousands):
| 2016 | 2015 | 2014 | 2018 | 2017 | 2016 | |||||||||||||||||
| Cost of sales | $ | 704 | $ | 754 | $ | 240 | $ | 976 | $ | 907 | $ | 704 | ||||||||||
| Operating expenses | 8,581 | 10,466 | 5,087 | 12,554 | 11,708 | 8,581 | ||||||||||||||||
| Total cost of employee share-based compensation included in income (loss) before income tax | $ | 9,285 | $ | 11,220 | $ | 5,327 | ||||||||||||||||
| Total cost of employee share-based compensation included in income before income tax | $ | 13,530 | $ | 12,615 | $ | 9,285 | ||||||||||||||||
Note 13.15. Employee Benefit Plan
The Company has a voluntary deferred compensation plan under Section 401(k) of the Internal Revenue Code (the “401(k) Plan”) for all employees who satisfy the age and service requirements under the 401(k) Plan. Each participant may elect to contribute up to 75% of annual compensation, up to the maximum permitted under federal law, and the Company is obligated to contribute annually an amount equal to 50% of the participant’s contributions up to 6% of their eligible annual compensation.
The portion of the participant’s account attributable to elective deferral contributions and rollover contributions are 100% vested and nonforfeitable. Participants vest in employer contributions at a rate of 50% per year, becoming fully vested after the completion of two years of service. In accordance with the provisions of the 401(k) Plan, the Company matched employee contributions in the amount of $2,340,000, $1,927,000 and $1,842,000 $1,744,000during 2018, 2017 and $1,687,000 during 2016, 2015 and 2014, respectively.
Note 14.16. Fair Value of Financial Instruments
Certain of the Company’s financial assets and liabilities are measured at fair value on a recurring and nonrecurring basis. Fair value is defined as the price that would be received to sell an asset or the price paid to transfer a liability (the exit price) in the principal and most advantageous market for the asset or liability in an orderly transaction between market participants. Assets and liabilities carried at fair value are classified using the three-tier hierarchy (see Note 2).
F-38
The following table summarizes the valuation of the Company’s foreign currency forward contracts (see Note 15)17) that are measured at fair value on a recurring basis as of December 31, 20162018 and 20152017 (in thousands):
Fair Value | Level 1 | Level 2 | Level 3 | Fair Value | Level 1 | Level 2 | Level 3 | |||||||||||||||||||||||
| 2016 | ||||||||||||||||||||||||||||||
| 2018 | ||||||||||||||||||||||||||||||
| Foreign currency forward contracts —asset position | $ | 3,524 | $ | — | $ | 3,524 | $ | — | $ | 4,539 | $ | — | $ | 4,539 | $ | — | ||||||||||||||
| Foreign currency forward contracts —liability position | (85 | ) | — | (85 | ) | — | (236 | ) | — | (236 | ) | — | ||||||||||||||||||
| $ | 3,439 | $ | — | $ | 3,439 | $ | — | $ | 4,303 | $ | — | $ | 4,303 | $ | — | |||||||||||||||
| 2015 | ||||||||||||||||||||||||||||||
| 2017 | ||||||||||||||||||||||||||||||
| Foreign currency forward contracts —asset position | $ | 680 | $ | — | $ | 680 | $ | — | $ | 179 | $ | — | $ | 179 | $ | — | ||||||||||||||
| Foreign currency forward contracts —liability position | (342 | ) | — | (342 | ) | — | (239 | ) | — | (239 | ) | — | ||||||||||||||||||
| $ | 338 | $ | — | $ | 338 | $ | — | $ | (60 | ) | $ | — | $ | (60 | ) | $ | — | |||||||||||||
The fair value of the Company’s foreign currency forward contracts is based on observable inputs that are corroborated by market data. Observable inputs include broker quotes, daily market foreign currency rates and forward pricing curves. Remeasurement gains and losses on foreign currency forward contracts designated as cash flow hedges are recorded in other comprehensive income, and in other income (expense) for non-designated foreign currency forward contracts (see Note 15)17).
Disclosures about the Fair Value of Financial Instruments
The carrying values of cash and cash equivalents, trade accounts receivable and trade accounts payable at December 31, 20162018 and 20152017 are categorized within Level 1 of the fair value hierarchy due to the short-term nature of these balances. The table below illustrates information about fair value relating to the Company’s financial assets and liabilities that are recognized in the accompanying consolidated balance sheets as of December 31, 20162018 and 2015,2017, as well as the fair value of contingent contracts that represent financial instruments (in thousands).
| December 31, 2016 | December 31, 2015 | December 31, 2018 | December 31, 2017 | |||||||||||||||||||||||||||
Carrying Value | Fair Value | Carrying Value | Fair Value | Carrying Value | Fair Value | Carrying Value | Fair Value | |||||||||||||||||||||||
Money market funds(1) | $ | 69,081 | $ | 69,081 | $ | — | $ | — | ||||||||||||||||||||||
Primary Asset-Based Revolving Credit Facility(2) | $ | 40,300 | $ | 40,300 | $ | 74,000 | $ | 74,000 | ||||||||||||||||||||||
Japan ABL Facility | $ | 11,966 | $ | 11,966 | $ | 14,969 | $ | 14,969 | $ | — | $ | — | $ | 13,755 | $ | 13,755 | ||||||||||||||
| Primary Asset-Based Revolving Credit Facility | $ | — | $ | — | $ | — | $ | — | ||||||||||||||||||||||
Equipment Note(2) | $ | 9,629 | $ | 9,629 | $ | 11,815 | $ | 11,815 | ||||||||||||||||||||||
Standby letters of credit(3) | $ | 823 | $ | 823 | $ | 1,030 | $ | 1,030 | $ | 1,187 | $ | 1,187 | $ | 887 | $ | 887 | ||||||||||||||
| (1) | The carrying value of |
| (2) | In December 2017, the Company entered into the Equipment Note secured by certain equipment at the Company's golf ball manufacturing facility. As of December 31, 2018, the Company had $9,629,000 outstanding under the Equipment Note. The fair value of this debt is categorized within Level 2 of the fair value hierarchy. See Note 5 for further information. |
| (3) | The carrying value of the Company's standby letters of credit approximates the fair value as they represent the Company’s contingent obligation to perform in accordance with the underlying contracts. |
Nonrecurring Fair Value Measurements
The Company measures certain assets at fair value on a nonrecurring basis at least annually or when certain indicators are present. These assets include long-lived assets, goodwill and non-amortizing intangible assets that are written down to fair value when they are held for sale or determined to be impaired. In 2016, 2015,each of 2018, 2017, and 2014,2016, the Company did not have any significant assets or liabilities that were measured at fair value on a nonrecurring basis in periods subsequent to initial recognition.
F-39
Note 15.17. Derivatives and Hedging
In the normal course of business, the Company is exposed to gains and losses resulting from fluctuations in foreign currency exchange rates relating to transactions of its international subsidiaries. As part of its strategy to manage the level of exposure to the risk of fluctuations in foreign currency exchange rates, the Company uses designated cash flow hedges and non-designated hedges in the form of foreign currency forward contracts to mitigate the impact of foreign currency translation on transactions that are denominated primarily in Japanese Yen, British Pounds, Euros, Canadian Dollars, Australian Dollars and Korean Won.
The Company accounts for its foreign currency forward contracts in accordance with ASC Topic 815.815, "Derivatives and Hedging" ("ASC Topic 815"). ASC Topic 815 requires the recognition of all derivative instruments as either assets or liabilities on the balance sheet, the measurement of those instruments at fair value and the recognition of changes in the fair value of derivatives in earnings in the period of change, unless the derivative qualifies as a designated cash flow hedge that offsets certain exposures. Certain criteria must be satisfied in order for derivative financial instruments to be classified and accounted for as a cash flow hedge. Gains and losses from the remeasurement of qualifying cash flow hedges are recorded as a component of other comprehensive income and released into earnings as a component of cost of goods sold or net sales during the period in which the hedged transaction takes place. Gains and losses on the ineffective portion of hedges (hedges that do not meet accounting requirements due to ineffectiveness) and derivatives that are not elected for hedge accounting treatment are immediately recorded in earnings as a component of other income (expense).
Foreign currency forward contracts are used only to meet the Company’s objectives of minimizing variability in the Company’s operating results arising from foreign exchange rate movements. The Company does not enter into foreign currency forward
contracts for speculative purposes. The Company utilizes counterparties for its derivative instruments that it believes are credit-worthy at the time the transactions are entered into and the Company closely monitors the credit ratings of these counterparties.
The following table summarizes the fair value of the Company's foreign currency forward contracts as well as the location of the asset and/or liability on the consolidated balance sheets at December 31, 20162018 and 20152017 (in thousands):
| Asset Derivatives | Asset Derivatives | |||||||||||||||||||||
| December 31, 2016 | December 31, 2015 | December 31, 2018 | December 31, 2017 | |||||||||||||||||||
| Balance Sheet Location | Fair Value | Balance Sheet Location | Fair Value | Balance Sheet Location | Fair Value | Balance Sheet Location | Fair Value | |||||||||||||||
| Derivatives designated as cash flow hedging instruments: | ||||||||||||||||||||||
| Foreign currency forward contracts | Other current assets | $ | 2,660 | Other current assets | $ | 520 | Other current assets | $ | 54 | Other current assets | $ | 168 | ||||||||||
| Derivatives not designated as hedging instruments: | ||||||||||||||||||||||
| Foreign currency forward contracts | Other current assets | $ | 864 | Other current assets | $ | 160 | Other current assets | $ | 4,485 | Other current assets | $ | 11 | ||||||||||
| Liability Derivatives | Liability Derivatives | |||||||||||||||||||||
| December 31, 2016 | December 31, 2015 | December 31, 2018 | December 31, 2017 | |||||||||||||||||||
| Balance Sheet Location | Fair Value | Balance Sheet Location | Fair Value | Balance Sheet Location | Fair Value | Balance Sheet Location | Fair Value | |||||||||||||||
| Derivatives designated as cash flow hedging instruments: | ||||||||||||||||||||||
| Foreign currency forward contracts | Accounts payable and accrued expenses | $ | 28 | Accounts payable and accrued expenses | $ | 296 | Accounts payable and accrued expenses | $ | 39 | Accounts payable and accrued expenses | $ | 194 | ||||||||||
| Derivatives not designated as hedging instruments: | ||||||||||||||||||||||
| Foreign currency forward contracts | Accounts payable and accrued expenses | $ | 57 | Accounts payable and accrued expenses | $ | 46 | Accounts payable and accrued expenses | $ | 197 | Accounts payable and accrued expenses | $ | 45 | ||||||||||
The Company's foreign currency forward contracts are subject to a master netting agreement with each respective counterparty bank and are therefore net settled at their maturity date. Although the Company has the legal right of offset under the master netting agreements, the Company has elected not to present these contracts on a net settlement amount basis, and therefore present these contracts on a gross basis on the accompanying consolidated balance sheets at December 31, 20162018 and 2015.2017.
F-40
Cash Flow Hedging Instruments
As of December 31, 2016,2018, the Company recorded a net lossgain of $538,000$389,000 in other comprehensive income (loss) related to its hedging activities. Of this amount, for the year ended December 31, 2016,2018, net lossesgains of $1,500,000$236,000 were relieved from other comprehensive income and recognized in cost of goods sold for the underlying intercompany sales that were recognized, and net losses of $1,014,000 were relieved from other comprehensive income and recognized in net sales for the underlying third party sales.recognized. There were no ineffective gains or losses recognized during 2016. During 2015, the Company recognized $1,149,000 in
The Company recognized a net loss of $187,000 in cost of goods sold in the year ended December 31, 2017.
The following tables summarize the net effect of all cash flow hedges on the consolidated financial statements for the year ended December 31, 20162018, 2017, and 20152016 (in thousands):
Net Gain (Loss) Recognized in Other Comprehensive Income (Effective Portion) | Net Gain (Loss) Recognized in Other Comprehensive Income (Effective Portion) | |||||||||||||||||||
| Year Ended December 31, | Year Ended December 31, | |||||||||||||||||||
| Derivatives designated as cash flow hedging instruments | 2016 | 2015 | 2018 | 2017 | 2016 | |||||||||||||||
| Foreign currency forward contracts | $ | (538 | ) | $ | 2,316 | $ | 389 | $ | (2,679 | ) | $ | (538 | ) | |||||||
Net Gain (Loss) Reclassified from Other Comprehensive Income into Earnings (Effective Portion) | Net Gain (Loss) Reclassified from Other Comprehensive Income into Earnings (Effective Portion) | |||||||||||||||||||
| Year Ended December 31, | Year Ended December 31, | |||||||||||||||||||
| Derivatives designated as cash flow hedging instruments | 2016 | 2015 | 2018 | 2017 | 2016 | |||||||||||||||
| Foreign currency forward contracts | $ | (2,514 | ) | $ | 1,791 | $ | 236 | $ | (187 | ) | $ | (2,514 | ) | |||||||
Net Gain Recognized in Other Income (Expense) (Ineffective Portion) | ||||||||
| Year Ended December 31, | ||||||||
| Derivatives designated as cash flow hedging instruments | 2016 | 2015 | ||||||
| Foreign currency forward contracts | $ | — | $ | 1,149 | ||||
Foreign Currency Forward Contracts Not Designated as Hedging Instruments
The Company uses foreign currency forward contracts that are not designated as qualified hedging instruments to mitigate certain balance sheet exposures (payables and receivables denominated in foreign currencies), as well as gains and losses resulting from the translation of the operating results of the Company’s international subsidiaries into U.S. dollars for financial reporting purposes. These contracts generally mature within 12 months from their inception. At December 31, 2016, 20152018, 2017 and 2014,2016, the notional amounts of the Company’s foreign currency forward contracts used to mitigate the exposures discussed above were approximately $14,821,000, $43,098,000$459,600,000, $4,821,000 and $62,866,000,$14,821,000, respectively. The decreasesignificant increase in 2018 includes a foreign currency forward contracts reflectscontract that was put in place to mitigate the general timingrisk of whenforeign currency fluctuations in connection with the Company enters into these contracts.acquisition of Jack Wolfskin, which was denominated in Euros (see Note 4). The Company estimates the fair values of foreign currency
F-41
forward contracts based on pricing models using current market rates, and records all derivatives on the balance sheet at fair value with changes in fair value recorded in the statement of operations. The foreign currency contracts are classified under Level 2 of the fair value hierarchy (see Note 14)16).
The following table summarizes the location of gains and losses on the consolidated statements of operations that were recognized during the years ended December 31, 2016, 20152018, 2017 and 2014,2016, respectively, in addition to the derivative contract type (in thousands):
| Amount of Gain (Loss) Recognized in Income on Derivative Instruments | |||||||||||||
| Derivatives not designated as hedging instruments | Location of gain(loss) recognized in income on derivative instruments | Years Ended December 31, | |||||||||||
| 2016 | 2015 | 2014 | |||||||||||
| Foreign currency forward contracts | Other income (expense), net | $ | (6,563 | ) | $ | 1,322 | $ | 6,356 | |||||
| Amount of Gain (Loss) Recognized in Income on Derivative Instruments | |||||||||||||
| Derivatives not designated as hedging instruments | Location of gain (loss) recognized in income on derivative instruments | Years Ended December 31, | |||||||||||
| 2018 | 2017 | 2016 | |||||||||||
| Foreign currency forward contracts | Other income (expense), net | $ | 9,705 | $ | (7,958 | ) | $ | (6,563 | ) | ||||
In addition, during the year ended December 31, 2016, the Company recognized net foreign currency gains of $226,000 related to transactions with foreign subsidiaries. During the years ended December 31, 20152018, 2017, and 2014,2016, the Company recognized net foreign currency losses of $1,611,000$2,824,000 and $6,198,000,gains of $808,000, $226,000, respectively, related to transactions with foreign subsidiaries.subsidiaries, respectively.
Note 16.18. Segment Information
The Company has twothree operating and reportable segments that are organized on the basis of products, namely the golf clubs segment(i) Golf Clubs, (ii) Golf Balls and golf balls segment.(iii) Gear, Accessories and Other. The golf clubsGolf Clubs segment consists of Callaway Golf drivers and fairway woods, hybrids, irons and wedges, and Odyssey putters, including Toulon Design putters by Odyssey. ThisOdyssey, packaged sets and sales of pre-owned golf clubs. At the product category level, sales of packaged sets are included within irons, and sales of pre-owned golf clubs are included in the respective woods, irons and putters product categories. The Golf Balls segment also includesconsists of Callaway Golf and Strata golf balls that are designed, manufactured and sold by the Company. The Gear, Accessories and Other segment consists of golf apparel and footwear, golf bags, golf gloves, travel gear, headwear and other lifestyle and golf-related apparel, gear and accessories, in addition toOGIO branded personal storage gear and accessories, TravisMathew branded apparel, and royalties from licensing of the Company’s trademarks and service marks and sales of pre-owned golf clubs. The golf balls segment consists of Callaway Golf and Strata balls thatfor various soft goods products. There are designed, manufactured and sold by the Company. There were no significant intersegment transactions.
Due to the recent acquisition of Jack Wolfskin in January 2019 (Note 4), significant growth in the Company's soft goods business is anticipated, and as such, it will be evaluating its global business platform, including its management structure, operations, supply chain and distribution, which may result in changes in the composition of its operating and reportable segments.
F-42
The table below contains information utilized by management to evaluate its operating segments.
| Years Ended December 31, | Years Ended December 31, | |||||||||||||||||||||
| 2016 | 2015 | 2014 | 2018 | 2017 | 2016 | |||||||||||||||||
| (In thousands) | (In thousands) | |||||||||||||||||||||
| Net sales: | ||||||||||||||||||||||
| Golf Clubs | $ | 718,935 | $ | 700,649 | $ | 749,956 | $ | 717,293 | $ | 643,096 | $ | 582,381 | ||||||||||
| Golf Balls | 152,257 | 143,145 | 136,989 | 195,654 | 162,546 | 152,261 | ||||||||||||||||
| Gear, Accessories and Other | 329,887 | 243,094 | 136,550 | |||||||||||||||||||
| $ | 871,192 | $ | 843,794 | $ | 886,945 | $ | 1,242,834 | $ | 1,048,736 | $ | 871,192 | |||||||||||
| Income (loss) before income tax: | ||||||||||||||||||||||
| Golf Clubs | $ | 65,023 | $ | 52,999 | $ | 50,891 | $ | 104,177 | $ | 77,018 | $ | 48,489 | ||||||||||
| Golf Balls | 25,642 | 17,724 | 15,222 | 27,887 | 26,854 | 23,953 | ||||||||||||||||
| Gear, Accessories and Other | 56,620 | 30,631 | 18,223 | |||||||||||||||||||
Reconciling items(1) | (32,272 | ) | (50,660 | ) | (44,474 | ) | (57,412 | ) | (66,448 | ) | (32,272 | ) | ||||||||||
| $ | 58,393 | $ | 20,063 | $ | 21,639 | $ | 131,272 | $ | 68,055 | $ | 58,393 | |||||||||||
Identifiable assets:(2) | ||||||||||||||||||||||
| Golf Clubs | $ | 295,601 | $ | 316,079 | $ | 316,710 | $ | 343,506 | $ | 321,265 | $ | 276,654 | ||||||||||
| Golf Balls | 37,006 | 37,394 | 37,445 | 94,098 | 57,120 | 45,758 | ||||||||||||||||
Reconciling items(2) | 468,675 | 277,751 | 270,656 | |||||||||||||||||||
| Gear, Accessories and Other | 269,432 | 236,515 | 35,788 | |||||||||||||||||||
Reconciling items(3) | 345,908 | 376,257 | 443,082 | |||||||||||||||||||
| $ | 801,282 | $ | 631,224 | $ | 624,811 | $ | 1,052,944 | $ | 991,157 | $ | 801,282 | |||||||||||
Additions to long-lived assets:(3) | ||||||||||||||||||||||
| Golf Clubs | $ | 9,503 | $ | 14,111 | $ | 9,425 | $ | 9,176 | $ | 11,396 | $ | 6,163 | ||||||||||
| Golf Balls | 5,295 | 2,154 | 327 | 18,602 | 12,178 | 6,585 | ||||||||||||||||
| Gear, Accessories and Other | 9,712 | 3,790 | 2,050 | |||||||||||||||||||
| $ | 14,798 | $ | 16,265 | $ | 9,752 | $ | 37,490 | $ | 27,364 | $ | 14,798 | |||||||||||
| Goodwill: | ||||||||||||||||||||||
| Golf Clubs | $ | 25,593 | $ | 26,500 | $ | 27,821 | $ | 26,183 | $ | 26,904 | $ | 25,593 | ||||||||||
| Golf Balls | — | — | — | — | — | — | ||||||||||||||||
Gear, Accessories and Other(4) | 29,633 | 29,525 | — | |||||||||||||||||||
| $ | 25,593 | $ | 26,500 | $ | 27,821 | $ | 55,816 | $ | 56,429 | $ | 25,593 | |||||||||||
| Depreciation and amortization: | ||||||||||||||||||||||
| Golf Clubs | $ | 14,914 | $ | 13,084 | $ | 18,505 | $ | 3,239 | $ | 8,769 | $ | 8,509 | ||||||||||
| Golf Balls | 1,672 | 4,295 | 2,731 | 7,926 | 4,496 | 4,355 | ||||||||||||||||
| Gear, Accessories and Other | 8,783 | 4,340 | 3,722 | |||||||||||||||||||
| $ | 16,586 | $ | 17,379 | $ | 21,236 | $ | 19,948 | $ | 17,605 | $ | 16,586 | |||||||||||
| (1) | Reconciling items represent the deduction of corporate general and administration expenses and other income (expenses), which are not utilized by management in determining segment profitability. |
| (2) | Identifiable assets are comprised of net inventory, certain property, plant and equipment, intangible assets and goodwill. Reconciling items represent unallocated corporate assets not segregated between the |
F-43
to fund the OGIO and TravisMathew acquisitions in 2017, combined with a $23,535,000 decrease in net deferred tax assets primarily due to the utilization of net operating losses and the reevaluation of deferred tax assets as a result of the Tax Act.
| (3) | Additions to long-lived assets are comprised of purchases of property, plant and |
| (4) | The $30,836,000 increase in goodwill in 2017 compared to 2016 was primarily as a result of the acquisitions of OGIO and TravisMathew in 2017. |
The Company’s net sales by product category are as follows:
| Years Ended December 31, | Years Ended December 31, | |||||||||||||||||||||
| 2016 | 2015 | 2014 | 2018 | 2017 | 2016 | |||||||||||||||||
| (In thousands) | (In thousands) | |||||||||||||||||||||
| Net sales: | ||||||||||||||||||||||
| Woods | $ | 201,813 | $ | 222,193 | $ | 269,468 | $ | 304,459 | $ | 307,865 | $ | 216,094 | ||||||||||
| Irons | 211,947 | 205,522 | 200,174 | 316,463 | 250,636 | 278,562 | ||||||||||||||||
| Putters | 86,042 | 86,293 | 81,161 | 96,371 | 84,595 | 87,725 | ||||||||||||||||
| Golf Balls | 152,257 | 143,145 | 136,989 | 195,654 | 162,546 | 152,261 | ||||||||||||||||
| Accessories and Other | 219,133 | 186,641 | 199,153 | 329,887 | 243,094 | 136,550 | ||||||||||||||||
| $ | 871,192 | $ | 843,794 | $ | 886,945 | $ | 1,242,834 | $ | 1,048,736 | $ | 871,192 | |||||||||||
The Company markets its products in the United States and internationally, with its principal international markets being Japan and Europe. The tables below contain information about the geographical areas in which the Company operates. Revenues are attributed to the location to which the product was shipped. Long-lived assets are based on location of domicile.
| Sales | Long-Lived Assets(1) | Sales | Long-Lived Assets(1) | |||||||||||
| (In thousands) | ||||||||||||||
| 2018 | ||||||||||||||
| United States | $ | 706,332 | $ | 422,803 | ||||||||||
| Europe | 149,602 | 6,855 | ||||||||||||
| Japan | 223,707 | 8,723 | ||||||||||||
| Rest of Asia | 92,026 | 4,200 | ||||||||||||
| Other foreign countries | 71,167 | 10,378 | ||||||||||||
| $ | 1,242,834 | $ | 452,959 | |||||||||||
2017(2) | ||||||||||||||
| United States | $ | 564,648 | $ | 403,493 | ||||||||||
| Europe | 140,947 | 7,681 | ||||||||||||
| Japan | 199,372 | 7,635 | ||||||||||||
| Rest of Asia | 76,530 | 3,717 | ||||||||||||
| Other foreign countries | 67,239 | 11,248 | ||||||||||||
| (In thousands) | $ | 1,048,736 | $ | 433,774 | ||||||||||
| 2016 | ||||||||||||||
| United States | $ | 447,613 | $ | 199,617 | $ | 447,613 | $ | 199,617 | ||||||
| Europe | 122,805 | 7,260 | 122,805 | 7,260 | ||||||||||
| Japan | 170,760 | 6,201 | 170,760 | 6,201 | ||||||||||
| Rest of Asia | 67,099 | 2,668 | 67,099 | 2,668 | ||||||||||
| Other foreign countries | 62,915 | 10,405 | 62,915 | 10,405 | ||||||||||
| $ | 871,192 | $ | 226,151 | $ | 871,192 | $ | 226,151 | |||||||
| 2015 | ||||||||||||||
| United States | $ | 446,474 | $ | 205,952 | ||||||||||
| Europe | 125,116 | 8,414 | ||||||||||||
| Japan | 138,031 | 4,445 | ||||||||||||
| Rest of Asia | 70,315 | 2,868 | ||||||||||||
| Other foreign countries | 63,858 | 11,096 | ||||||||||||
| $ | 843,794 | $ | 232,775 | |||||||||||
| 2014 | ||||||||||||||
| United States | $ | 421,773 | $ | 210,152 | ||||||||||
| Europe | 134,401 | 7,070 | ||||||||||||
| Japan | 166,162 | 4,873 | ||||||||||||
| Rest of Asia | 89,603 | 2,936 | ||||||||||||
| Other foreign countries | 75,006 | 13,402 | ||||||||||||
| $ | 886,945 | $ | 238,433 | |||||||||||
| (1) | Long-lived assets include all non-current assets of the Company except deferred tax assets. |
| (2) | Prior period amounts have been reclassified to conform to current year presentation of regional sales related to OGIO-branded products. |
Note 17.19. Transactions with Related Parties
The Callaway Golf Company Foundation (the “Foundation”) oversees and administers charitable giving and makes grants to selected organizations. Officers of the Company also serve as directors of the Foundation and the Company’s employees provide accounting and administrative services for the Foundation. DuringIn each of 2018, 2017 and 2016, and 2015, the Company recognized charitable contribution expense of $750,000 and $1,000,000 for the Foundation. During 2014, the Company did not make any contributions to the Foundation.
Note 18.20. Summarized Quarterly Data (Unaudited)
| Fiscal Year 2016 Quarters | Fiscal Year 2018 Quarters | |||||||||||||||||||||||||||||||||||||
| 1st | 2nd | 3rd | 4th(2) | Total(2) | 1st | 2nd | 3rd | 4th | Total | |||||||||||||||||||||||||||||
| (In thousands, except per share data) | (In thousands, except per share data) | |||||||||||||||||||||||||||||||||||||
| Net sales | $ | 274,053 | $ | 245,594 | $ | 187,850 | $ | 163,695 | $ | 871,192 | $ | 403,191 | $ | 396,311 | $ | 262,654 | $ | 180,678 | $ | 1,242,834 | ||||||||||||||||||
| Gross profit | $ | 132,392 | $ | 110,633 | $ | 78,875 | $ | 63,111 | $ | 385,011 | $ | 200,462 | $ | 192,697 | $ | 115,239 | $ | 69,971 | $ | 578,369 | ||||||||||||||||||
| Net income (loss) | $ | 38,390 | $ | 34,105 | $ | (5,739 | ) | $ | 124,198 | $ | 190,954 | $ | 62,731 | $ | 60,934 | $ | 9,740 | $ | (28,151 | ) | $ | 105,254 | ||||||||||||||||
| Less: Net income attributable to non-controlling interests | $ | — | $ | — | $ | 127 | $ | 927 | $ | 1,054 | $ | (124 | ) | $ | 67 | $ | 223 | $ | 348 | $ | 514 | |||||||||||||||||
| Net income (loss) attributable to Callaway Golf Company | $ | 38,390 | $ | 34,105 | $ | (5,866 | ) | $ | 123,271 | $ | 189,900 | $ | 62,855 | $ | 60,867 | $ | 9,517 | $ | (28,499 | ) | $ | 104,740 | ||||||||||||||||
Earnings (loss) per common share(1) | ||||||||||||||||||||||||||||||||||||||
| Basic | $ | 0.41 | $ | 0.36 | $ | (0.06 | ) | $ | 1.31 | $ | 2.02 | $ | 0.66 | $ | 0.65 | $ | 0.10 | $ | (0.30 | ) | $ | 1.11 | ||||||||||||||||
| Diluted | $ | 0.40 | $ | 0.36 | $ | (0.06 | ) | $ | 1.28 | $ | 1.98 | $ | 0.65 | $ | 0.63 | $ | 0.10 | $ | (0.30 | ) | $ | 1.08 | ||||||||||||||||
| Fiscal Year 2015 Quarters | Fiscal Year 2017 Quarters | |||||||||||||||||||||||||||||||||||||
| 1st | 2nd | 3rd | 4th | Total | 1st | 2nd | 3rd | 4th | Total | |||||||||||||||||||||||||||||
| (In thousands, except per share data) | (In thousands, except per share data) | |||||||||||||||||||||||||||||||||||||
| Net sales | $ | 284,179 | $ | 230,504 | $ | 175,780 | $ | 153,331 | $ | 843,794 | $ | 308,927 | $ | 304,548 | $ | 243,604 | $ | 191,657 | $ | 1,048,736 | ||||||||||||||||||
| Gross profit | $ | 127,266 | $ | 101,697 | $ | 77,602 | $ | 51,068 | $ | 357,633 | $ | 147,715 | $ | 148,165 | $ | 104,902 | $ | 79,666 | $ | 480,448 | ||||||||||||||||||
| Net income (loss) | $ | 35,819 | $ | 12,818 | $ | (3,617 | ) | $ | (30,452 | ) | $ | 14,568 | $ | 25,880 | $ | 31,474 | $ | 3,089 | $ | (18,776 | ) | $ | 41,667 | |||||||||||||||
| Net income (loss) allocable to common shareholders | $ | 35,819 | $ | 12,818 | $ | (3,617 | ) | $ | (30,452 | ) | $ | 14,568 | ||||||||||||||||||||||||||
| Less: Net income attributable to non-controlling interests | $ | 191 | $ | 31 | $ | 29 | $ | 610 | $ | 861 | ||||||||||||||||||||||||||||
| Net income (loss) attributable to Callaway Golf Company | $ | 25,689 | $ | 31,443 | $ | 3,060 | $ | (19,386 | ) | $ | 40,806 | |||||||||||||||||||||||||||
Earnings (loss) per common share(1) | ||||||||||||||||||||||||||||||||||||||
| Basic | $ | 0.46 | $ | 0.16 | $ | (0.04 | ) | $ | (0.33 | ) | $ | 0.18 | $ | 0.27 | $ | 0.33 | $ | 0.03 | $ | (0.20 | ) | $ | 0.43 | |||||||||||||||
| Diluted | $ | 0.39 | $ | 0.15 | $ | (0.04 | ) | $ | (0.33 | ) | $ | 0.17 | $ | 0.27 | $ | 0.33 | $ | 0.03 | $ | (0.20 | ) | $ | 0.42 | |||||||||||||||
| (1) | Earnings per share is computed individually for each of the quarters presented; therefore, the sum of the quarterly earnings per share may not necessarily equal the total for the year. |