UNITED STATES SECURITIES AND EXCHANGE COMMISSION
Washington, D.C. 20549
FORM 10-K
(Mark One)
| | | | | |
| ☒ | ANNUAL REPORT PURSUANT TO SECTION 13 OR 15(D) OF THE SECURITIES EXCHANGE ACT OF 1934 |
For the fiscal year ended December 31, 2020.2023.
| | | | | |
| ☐ | TRANSITION REPORT PURSUANT TO SECTION 13 OR 15(D) OF THE SECURITIES EXCHANGE ACT OF 1934 |
For the transition period from to .
Commission file number: 1-11311
(Exact name of registrant as specified in its charter)
| | | | | | | | |
| Delaware | | 13-3386776 |
(State or other jurisdiction of
incorporation or organization) | | (I.R.S. Employer
Identification No.) |
21557 Telegraph Road, Southfield, MI 48033
(Address of principal executive offices)
(248) 447-1500
(Registrant's telephone number including areasarea code)
| | | | | | | | | | | | | | |
| Securities registered pursuant to Section 12(b) of the Act: |
| Title of each class | | Trading Symbol(s) | | Name of each exchange on which registered |
| Common Stock, par value $0.01 per share | | LEA | | New York Stock Exchange |
Securities registered pursuant to Section 12(g) of the Act: None
Indicate by check mark if the registrant is a well-known seasoned issuer, as defined in Rule 405 of the Securities Act. Yes ☒ No ☐
Indicate by check mark if the registrant is not required to file reports pursuant to Section 13 or Section 15(d) of the Act. Yes ☐ No ☒
Indicate by check mark whether the registrant (1) has filed all reports required to be filed by Section 13 or 15(d) of the Act during the preceding 12 months (or for such shorter period that the registrant was required to file such reports) and (2) has been subject to such filing requirements for the past 90 days. Yes ☒ No ☐
Indicate by check mark whether the registrant has submitted electronically every Interactive Data File required to be submitted pursuant to Rule 405 of Regulation S-T (§232.405 of this chapter) during the preceding 12 months (or for such shorter period that the registrant was required to submit such files). Yes ☒ No ☐
Indicate by check mark whether the registrant is a large accelerated filer, an accelerated filer, a non-accelerated filer, a smaller reporting company, or an emerging growth company. See definitions of "large accelerated filer," "accelerated filer," "smaller reporting company" and "emerging growth company" in Rule 12b-2 of the Exchange Act.
| | | | | | | | | | | | | | | | | | | | | | | |
| Large accelerated filer | ☒ | | | Accelerated filer | ☐ | | Emerging growth company | ☐ |
| Non-accelerated filer | ☐ | | | Smaller reporting company | ☐ |
| Emerging growth company | ☐ | | | |
If an emerging growth company, indicate by check mark if the registrant has elected not to use the extended transition period for complying with any new or revised financial accounting standards provided pursuant to Section 13(a) of the Exchange Act. ¨
Indicate by check mark whether the registrant has filed a report on and attestation to its management’smanagement's assessment of the effectiveness of its internal control over financial reporting under Section 404(b) of the Sarbanes-Oxley Act (15 U.S.C. 7262(b)) by the registered public accounting firm that prepared or issued its audit report. ☒
If securities are registered pursuant to Section 12(b) of the Act, indicate by check mark whether the financial statements of the registrant included in the filing reflect the correction of an error to previously issued financial statements. ☐
Indicate by check mark whether any of those error corrections are restatements that required a recovery analysis of incentive-based compensation received by any of the registrant’s executive officers during the relevant recovery period pursuant to §240.10D-1(b). ☐
Indicate by check mark whether the registrant is a shell company (as defined in Rule 12b-2 of the Act). Yes ☐ No ☒
As of July 4, 2020,1, 2023, the aggregate market value of the registrant’sregistrant's common stock, par value $0.01 per share, held by non-affiliates of the registrant was $6,453,113,027.$8,417,302,017. The closing price of the common stock on July 2, 2020,1, 2023, as reported on the New York Stock Exchange, was $107.88$143.55 per share.
As of February 8, 2021,5, 2024, the number of shares outstanding of the registrant’sregistrant's common stock was 60,115,01457,033,998 shares.
DOCUMENTS INCORPORATED BY REFERENCE
Certain sections of the registrant’sregistrant's Notice of Annual Meeting of Stockholders and Definitive Proxy Statement on Schedule 14A for its Annual Meeting of Stockholders to be held in May 2021,2024, as described in the Cross Reference Sheet and Table of Contents included herewith, are incorporated by reference into Part III of this Report.
LEAR CORPORATION AND SUBSIDIARIES
CROSS REFERENCE SHEET AND TABLE OF CONTENTS
| | | | | | | | |
| | | Page Number or Reference |
|
| ITEM 1. | | |
| ITEM 1A. | | |
| ITEM 1B. | | |
| ITEM 1C. | | |
| ITEM 2. | | |
| ITEM 3. | | |
| ITEM 4. | | |
| SUPPLEMENTARY ITEM. | | |
|
| ITEM 5. | | |
| ITEM 6. | | |
| ITEM 7. | | |
| ITEM 7A. | | |
| ITEM 8. | | |
| ITEM 9. | | |
| ITEM 9A. | | |
| ITEM 9B. | | |
| ITEM 9C. | | |
|
| ITEM 10. | | |
| ITEM 11. | | |
| ITEM 12. | | |
| ITEM 13. | | |
| ITEM 14. | | |
|
| ITEM 15. | | |
| ITEM 16. | | |
________________________
(1)Certain information is incorporated by reference, as indicated below, to the registrant’sregistrant's Definitive Proxy Statement on Schedule 14A for its Annual Meeting of Stockholders to be held in May 20212024 (the "Proxy Statement").
(2)A portion of the information required is incorporated by reference to the Proxy Statement sections entitled "Election of Directors" and "Directors and Corporate Governance."
(3)Incorporated by reference to the Proxy Statement sections entitled "Directors and Corporate Governance — Director Compensation," "Compensation Discussion and Analysis," "Executive Compensation," "Compensation Committee Interlocks and Insider Participation" and "Compensation Committee Report."
(4)A portion of the information required is incorporated by reference to the Proxy Statement section entitled "Directors and Corporate Governance — Security Ownership of Certain Beneficial Owners, Directors and Management."
(5)Incorporated by reference to the Proxy Statement sections entitled "Certain Relationships and Related Party Transactions" and "Directors and Corporate Governance — Independence of Directors."
(6)Incorporated by reference to the Proxy Statement section entitled "Fees of Independent Accountants."
PART I
ITEM 1 – BUSINESS
In this Annual Report on Form 10-K (this "Report"), when we use the terms the "Company," "Lear," "we," "us" and "our," unless otherwise indicated or the context otherwise requires, we are referring to Lear Corporation and its consolidated subsidiaries. A substantial portion of the Company’sCompany's operations are conducted through subsidiaries controlled by Lear Corporation. The Company is also a party to various joint venture arrangements. Certain disclosures included in this Report constitute forward-looking statements that are subject to risks and uncertainties. See Item 1A, "Risk Factors," and Part II — Item 7, "Management’s"Management's Discussion and Analysis of Financial Condition and Results of Operations — Forward-Looking Statements."
BUSINESS OF THE COMPANY
General
Lear Corporation is a leading Tier 1 vertically integrated supplier to the global automotive industry.technology leader in Seating and E-Systems, enabling superior in-vehicle experiences for consumers around the world. We supply seating,complete seat systems, key seat components, complete electrical distribution and connection systems, high-voltage power distribution products, including battery disconnect units ("BDUs"), low-voltage power distribution products, electronic systems,controllers and software and connected services, toother electronic products to all of the world's major automotive manufacturers. At Lear, we are Making every drive betterTM by providing technology for safer, smarter and more comfortable journeys, while adhering to our values — Be Inclusive. Be Inventive. Get Results the Right Way.
We have 251265 manufacturing, engineering and administrative locations in 38 countries. We continue to grow our business in allevery major automotive producing regionsregion of the world, both organically and through complementary acquisitions. We continue to restructure our manufacturing footprint to optimize our cost structure with 68% of our manufacturing facilities and 86% of our employees located in low costlow-cost countries.
BuiltLear is built on a foundation and strong culture of innovation, operational excellence, and engineering and program management capabilities, wecapabilities. We use our product, design and technological expertise, as well as our global reach and competitive manufacturing footprint, to achieve the following financial goals and objectives:
•Continue to deliver profitable growth, balancing risks and returns;
•Invest in innovation to drive business growth and profitability;
•Maintain a strong balance sheet with investment grade credit metrics; and
•Consistently return excess cashcapital to our stockholders.
Our business is organized under two reporting segments: Seating and E-Systems. Each of these segments has a varied product and technology rangeportfolio across a number of component categories:categories. Further, we continuously evaluate this portfolio, aligning it with industry trends while balancing risk-adjusted returns, which allows us to offer value-added solutions to our customers.
•Seating— — Our Seating segment consists of the design, development, engineering and manufacture of complete seat systems seat subsystems and key seat components. Our capabilities in operations and supply chain management enable synchronized (just-in-time) assembly and just-in-time delivery of high volumes of complex complete seat systems at high volumes to our customers.
Included in our complete seat system and subsystem solutions are advanced comfort, wellness, safety and sound offerings, as well as configurable seating product technologies, all of which are compatible with traditional internal combustion engine ("ICE") architectures and the full range of hybrid, plug-in hybrid and battery electric architectures. Our advanced comfort, wellness, safety and sound offerings are facilitated by our system, component and integration capabilities, together with our in-house electronics, sensor, software and algorithm competencies. As the most vertically integrated global seat supplier, our key seat component product offerings include seat trim covers,covers; surface materials such as leather and fabric,fabric; seat mechanisms,mechanisms; seat foamfoam; thermal comfort systems such as seat heating, ventilation, active cooling, pneumatic lumbar and massage products; and headrests. All of these products are compatible with traditional internal combustion engine ("ICE") architectures and electrified powertrains, including the full range of hybrid, plug-in hybrid and battery electric architectures. Our thermal comfort systems are facilitated by our seat system, component and integration capabilities, together with our competencies in electronics, sensors, software and algorithms.
•E-Systems— — Our E-Systems segment consists of the design, development, engineering and manufacture of complete electrical distribution and connection systems,systems; high-voltage power distribution products, including BDUs; and low-voltage power distribution products, electronic systems,controllers and software and connected services. The unique combination of theseother electronic products. These capabilities enablesenable us to provide our customers with customizable solutions with optimized designs at a competitive cost.costs for both low-voltage and high-voltage vehicle architectures.
Electrical distribution and connection systems utilize low voltage, high voltage, high speedlow-voltage and high-voltage wire, high-speed data cables and flat wiring to connect networks and electrical signals and manage electrical power within the vehicle for all types of powertrains – from traditional ICE architectures to the full range of hybrid, plug-in hybridelectrified powertrains that require management of higher voltage and battery electric architectures.power. Key components inof our electrical distribution and connection systems portfolio include wire harnesses, terminals and connectors, high-voltage battery connection systems and engineered components for both ICE and electrified vehicle architectures that require management of higher voltage and power.components. High-voltage
Electronicbattery connection systems include intercell connect boards, bus bars and main battery connection systems. High-voltage power distribution products control the flow and distribution of high-voltage power throughout electrified vehicles and include BDUs which control all electrical energy flowing into and out of high-voltage batteries in electrified vehicles. Low-voltage power distribution products, electronic controllers and other electronic products facilitate signal, data andand/or power management within the vehicle and include the associated software required to facilitate these functions. Key components inof our other electronic systemsproducts portfolio include zone control modules, body domain control modules and products specific to electrificationlow-voltage and connectivity trends. Electrification products include on-board battery chargers, power conversion modules, high voltage battery management systems and high voltagehigh-voltage power distribution systems. Connectivity products include gateway modules and communication modules to manage both wired and wireless networks and data in vehicles. In addition to electronic modules, we offer software that includes cybersecurity, advanced vehicle positioning for automated and autonomous driving applications and full capabilities in both dedicated short-range communication and cellular protocols for vehicle connectivity.
modules. Our software and connected services offerings include embedded control, cybersecurity software and cloud and mobile device-based software and services.to control hardware devices. Our customers traditionally have sourced our electronic hardware together with the software that we embed in it, but such software may also be sourced by our customers independently of the hardware. Our connected services software solutions include award-winning Xevo Market, an in-vehicle commerce and service platform that connects customers with their favorite brands and services by delivering highly-contextual sales offers through vehicle touch screens and vehicle-branded mobile applications.it.
We serve all of the world's major automotive manufacturers acrossthrough both our Seating and E-Systems businesses, and we have automotive content on more than 400475 vehicle nameplates worldwide. It is common for us to have both seating and electrical and/or electronic content on the same and multiple vehicle platforms with a single customer. Further, with the seat becoming a more dynamic and integrated system requiring increased levels of electrical and electronic integration, the combined capabilities of our Seating and E-Systems businesses are a competitive advantage.platform.
Our businesses benefit globally from leveraging common operating standards and disciplines, including world-class product development and manufacturing processes, as well as common customer support and regional infrastructures, all of which contribute to our reputation for operational excellence. Our core capabilities are shared across component categories and include high-precision manufacturing and assembly with short lead times, management of complex, global supply chains,chain management, global engineering and program management, skills, the agility to establish and/or transfer production between facilities quickly, and a unique, customer-focused culture. In select instances, we are able to manufacture both Seating and E-Systems components in the same facility. Our businesses also utilize proprietary, industry-specific processes and standards, leverage common low-cost engineering centers and share centralized operating support functions. These functions include health and safety, logistics, quality, supply chain management and all major administrative functions, such as logistics, supply chain management,corporate finance, executive administration, human resources, information technology and legal. We continue to build on our reputation for operational excellence through investment in Industry 4.0 technologies. Industry 4.0 refers to the current era of digital transformation in manufacturing. It involves the integration of new technologies, such as Industrial Internet of Things (IIoT), cloud computing, artificial intelligence (AI), machine learning and advanced automation, into production facilities and business operations. These technologies enable smart and automated machines and smart factories to communicate, analyze and optimize processes and products, resulting in higher efficiency, quality and health and safety, as well as all major administrative functions.
We are focused on profitably growing our businesses and have implemented a strategy designedresponsiveness to deliver industry-leading, long-term financial returns. This strategy includes disciplined investment in our business to grow and enhance our product offerings, strategically focusing our portfolio on products and technologies to support emerging trends, such as autonomy, connectivity, electrification and shared mobility, and leveraging an industry-leading cost structure to expand our operating margins.customers.
Responsible and sustainable environmental, social and governance ("ESG") principles and practices are integrated into our strategy and operations. Our ESG strategy and initiatives are developed by a cross-functional team of senior subject matter experts, reviewed and approved by senior management and overseen by the Nominating and Corporate Governance Committee of our Board of Directors. We are continuously working to embed ESG into our key business processes, including corporate strategy, enterprise risk management and product and process development and innovation. Our ESG efforts demonstrate how we live our core value of Get Results the Right Way, and in 2020, we reinforced this commitment by becoming a signatory of the United Nations Global Compact.
From an environmental standpoint, our global operations drive the efficient use of energy to reduce greenhouse gas emissions, the prevention of pollution and safe and sustainable production processes. During 2020, we published ambitious carbon reduction goals that we intend to achieve by 2030, including 100% usage of renewable energy and a 50% reduction in carbon emissions at our manufacturing facilities, as well as an aspiration to be carbon neutral by 2050.
We are innovating, developing and manufacturing products that contribute to a more sustainable economy and future mobility. These range from "green" products such as SoyFoamTM, a substitute for certain petroleum-based products, and seat coverings made from recycled ocean plastics, to on-board battery chargers, battery management systems, high voltage wiring, and terminals and connectors that facilitate hybrid and electric vehicles. Additionally, our intelligent and reconfigurable seats and electronic modules and software offerings enhance connectivity and support the trend of shared mobility.
We believe the best way to deliver the highest quality products and services is to maintain a work environment that prioritizes safety and fosters collaboration, inclusion, tolerance and respect for our 175,000 employees around the world. Our key human capital management resource initiatives are set forth in "— Human Capital Management" below.
We are especially proud of our employee volunteer efforts to support our global communities, such as the educational campaign, "Focus on the Drive," to increase awareness and decrease the incidence of distracted driving. Through our Operation GIVE campaign, more than $1 million in employee contributions benefited local programs focused on economic well-being,
education and the environment in 2020. During 2020, we also reinforced our commitment to human rights, publishing a Human Rights Policy that clearly defines how we approach, govern and defend the dignity of people throughout our operations, our global supply chain and the communities in which we operate.
Our governance activities help ensure that our business and operations are conducted in compliance with all applicable laws as well as Lear’s policies and procedures, particularly our Code of Business Conduct and Ethics, which addresses conflicts of interest, bribery and corruption, political contributions and information technology security, among other things. Our Board of Directors, and its Audit and Nominating and Corporate Governance Committees, oversee our compliance and governance activities. Our expectations related to conducting business in a sustainable and ethical manner extend to our supply base. Suppliers must meet the requirements of our Supplier Sustainability Policy and Supplier Code of Conduct. We monitor their compliance both internally and through the use of a third party.
Available Information on our Website
Our website address is http://www.lear.com. We make available on our website, free of charge, the periodic reports that we file with or furnish to the Securities and Exchange Commission ("SEC"), as well as all amendments to these reports, as soon as reasonably practicable after such reports are filed with or furnished to the SEC. We also make available on our website or in printed form upon request, free of charge, our Corporate Governance Guidelines, Code of Business Conduct and Ethics, (which includes specific provisions for our executive officers), charters for the standing committees of our Board of Directors (the "Board") and other information related to the Company. We are not including the information contained on our website as a part of, or incorporating it by reference into, this Report.
The SEC maintains an internet site (http://www.sec.gov) that contains reports, proxy and information statements and other information related to issuers that file electronically with the SEC.
History
Lear was founded in Detroit in 1917 as American Metal Products, a manufacturer of seating assemblies and other components for the automotive and aircraft industries, and was incorporated in Delaware in 1987. Through a management-led buyout in 1988, Lear Corporation established itself as a privately-heldprivately held seat assembly operation for the North American automobile market with annual sales of approximately $900 million. We completed an initial public offering in 1994 and developed into a global supplier through organic growth and a series of acquisitions.
In May 1999, we acquired UT Automotive, Inc. ("UT Automotive") from United Technologies Corporation. UT Automotive was a leading supplier of automotive electrical distribution systems. The acquisition of UT Automotive represented our entry into automotive electrical and electronic systems and wasformed the basis for our current E-Systems segment.
We have subsequently augmented our internalorganic growth plans with selective acquisitions and investments to expand our component capabilities and global footprint, as well as expand our technology portfolio:Industry 4.0 technologies and automation capabilities, including the following:
•In May 2012, we acquired Guilford Mills, a leading supplier of automotive seat and interior fabric, for approximately $243 million.
•In January 2015, we acquired Everett Smith Group, Ltd., the parent company of Eagle Ottawa, LLC ("Eagle Ottawa"), the world's leading provider of leather for the automotive industry, for approximately $844 million.
•In November 2015, we acquired Arada Systems Inc., an automotive technology company that specializes in vehicle-to-vehicle ("V2V") and vehicle-to-infrastructure ("V2I" and together with V2V, "V2X") communications.
•In April 2017, we acquired Grupo Antolin's automotive seating business for approximately $292 million.
•In January 2018,March 2021, we acquired Israel-based EXO Technologies, a leading developerM&N Plastics, an injection molding specialist and manufacturer of differentiated GPS technology providing high-accuracy positioning solutionsengineered plastic components for autonomousautomotive electrical distribution applications. This acquisition enabled the significant expansion of our footprint and connected vehicle applications.capabilities with respect to engineered components and enhanced our vertical integration capabilities in connection systems.
•In January 2019,February 2022, we launched Lear Innovation Venturesacquired substantially all of Kongsberg Automotive's Interior Comfort Systems business unit ("LIV"Kongsberg ICS") for approximately $188 million. Kongsberg ICS specializes in thermal comfort systems, including seat massage, lumbar, heat and ventilation products. This acquisition enhances our seat component capabilities by adding specialized thermal comfort seating solutions and further differentiates our product offerings by improving the seat system's performance and packaging.
•In May 2022, we acquired Romanian-based Thagora Technology SRL ("Thagora") to supplementaccess scalable smart-manufacturing technology. Thagora's proprietary solutions complement our internal innovation efforts. LIV provides ussustainable manufacturing processes by improving the production yield of our Seating segment's surface materials operations and lowering energy usage during production. In addition, Thagora's Industry 4.0 technologies bring significant advances to our manufacturing operations through engineering and logistics enhancements, including improved material traceability and facility footprint utilization capabilities.
•In November 2022, we acquired InTouch Automation ("InTouch"), a supplier of Industry 4.0 technologies and complex automated testing equipment critical in the production of automotive seats. InTouch's product portfolio is aligned with a frameworkour Industry 4.0 strategy to invest in advanced development teams, partnershipsimplement technologies designed to automate the testing and early stage technologies by working with venture capital firms, acceleratorsvalidation of seat components and incubators, as well as by providing direct capital to start-ups and internal innovation initiatives.complete seats.
•In April 2019,2023, we acquired Xevo Inc.completed the acquisition of I.G. Bauerhin ("Xevo"IGB"), a Seattle-based, global leaderprivately held supplier of automotive seat heating, ventilation and active cooling, steering wheel heating, seat sensors and electronic control modules, headquartered in connected car software,Grundau-Rothenbergen, Germany, for approximately $322$175 million. Xevo isThe acquisition furthers our comprehensive strategy to develop and integrate a suppliercomplete portfolio of software solutionsthermal comfort systems for automotive seating. IGB provides active cooling, as well as additional scale to our seat heating and ventilation capabilities and complements the cloud, vehicleslumbar and mobile devices that are deployed in millionsmassage capabilities obtained with our acquisition of vehicles worldwide.Kongsberg ICS.
Industry and Strategy
We supply all vehicle segments of the automotive light vehicle original equipment market in every major automotive producing region in the world. Our sales are driven by the number of vehicles produced by the automotive manufacturers, which is ultimately dependent on consumer demand for automotive vehicles and the availability of raw materials and components, and our content per vehicle. GlobalIn 2020, the automotive industry experienced a significant decline in global production volumes declined 6% in 2019 and another 17% in 2020 to 72.6 million units, largely due toas a result of the COVID-19 pandemic. In 2022, industry production recovered modestly, increasing 8% compared to 2021. In 2023, industry production increased 9% compared to 2022. This reflects a return to 2019 pre-pandemic production levels but remains 5% below 2017 peak levels. Since 2020, the global economy, as well as the automotive industry, have been influenced directly and indirectly by macroeconomic events resulting in unfavorable conditions, including shortages of semiconductor chips and other components, elevated inflation levels on commodities and labor, higher interest rates, and labor and energy shortages in certain markets. Beginning in the third quarter of 2023 and continuing into the fourth quarter of 2023, the automotive industry was impacted by labor strikes and related disruptions at certain facilities in the United States. Certain of these factors, among others, continue to impact consumer demand, as well as the ability of automotive manufacturers to produce vehicles to meet demand. Our strategy to mitigate these impacts encompasses our comprehensive cost management process, including cost technology optimization, actions to further align our manufacturing capacity to the current industry production environment and investments in Industry 4.0 technologies. This will allow us to enhance operational efficiencies, improve the utilization of existing facilities and equipment to reduce future expenditures, and streamline and automate administrative functions. For a description of risks related to macroeconomic events, see Item 1A, "Risk Factors."
Details on light vehicle production volumes in certain key regions for 20202023 and 20192022 are provided below. Our actual results are impacted by the specific volume mix of products within each market, as well as other factors described in Item 1A, "Risk Factors."
| | (In thousands of units) | (In thousands of units) | 2020 (1) | | 2019 (1) (2) | | % Change | (In thousands of units) | 2023 (1) | | 2022(1) (2) | | % Change |
| North America | North America | 13,027.3 | | | 16,314.4 | | | (20%) | North America | 15,647.8 | | | 14,296.2 | | 14,296.2 | | | 9% | | 9% |
| Europe and Africa | Europe and Africa | 16,873.9 | | | 21,703.8 | | | (22%) | Europe and Africa | 18,259.5 | | | 16,218.7 | | 16,218.7 | | | 13% | | 13% |
| Asia | Asia | 39,257.7 | | | 44,651.8 | | | (12%) | Asia | 50,147.8 | | | 46,049.2 | | 46,049.2 | | | 9% | | 9% |
| South America | South America | 2,163.5 | | | 3,128.5 | | | (31%) | South America | 2,817.9 | | | 2,716.5 | | 2,716.5 | | | 4% | | 4% |
| Other | Other | 1,323.5 | | | 1,417.0 | | | (7%) | Other | 1,746.2 | | | 1,769.1 | | 1,769.1 | | | (1%) | | (1%) |
| Total | Total | 72,645.9 | | | 87,215.5 | | | (17%) | Total | 88,619.2 | | | 81,049.7 | | 81,049.7 | | | 9% | | 9% |
(1)Production data based on IHS Markit.S&P Global Mobility.
(2)Production data for 20192022 has been updated from our 2019 Annual Report on Form 10-K to reflect actual production levels.
Details on light vehicle production in certain emerging markets for 2020 and 2019 are provided below.
| | | | | | | | | | | | | | | | | |
| (In thousands of units) | 2020 (1) | | 2019 (1) (2) | | % Change |
| China | 21,899.5 | | | 23,133.2 | | | (5%) |
| India | 3,199.3 | | | 4,166.5 | | | (23%) |
| Brazil | 1,904.7 | | | 2,803.8 | | | (32%) |
| Russia | 1,324.7 | | | 1,597.7 | | | (17%) |
(1)Production data based on IHS Markit.
(2)Production data for 2019 has been updated from our 20192022 Annual Report on Form 10-K to reflect actual production levels.
Details on our sales in certain key regions for 20202023 and 20192022 are provided below.below:
| | (In millions) | (In millions) | 2020 | | 2019 | | % Change | (In millions) | 2023 | | 2022 | | % Change |
| North America | North America | $ | 6,630.5 | | | $ | 7,365.5 | | | (10%) | North America | $ | 9,503.4 | | | $ | | $ | 8,910.7 | | | 7% | | 7% |
| Europe and Africa | Europe and Africa | 6,240.3 | | | 7,785.5 | | | (20%) | Europe and Africa | 8,612.6 | | | 6,946.0 | | 6,946.0 | | | 24% | | 24% |
| Asia | Asia | 3,655.3 | | | 3,968.3 | | | (8%) | Asia | 4,445.0 | | | 4,183.2 | | 4,183.2 | | | 6% | | 6% |
| South America | South America | 519.4 | | | 691.0 | | | (25%) | South America | 905.9 | | | 851.6 | | 851.6 | | | 6% | | 6% |
| Total | Total | $ | 17,045.5 | | | $ | 19,810.3 | | | (14%) | Total | $ | 23,466.9 | | | $ | | $ | 20,891.5 | | | 12% | | 12% |
| | China (consolidated) | China (consolidated) | $ | 2,592.7 | | | $ | 2,579.7 | | | 1% |
| China (consolidated) | |
| China (consolidated) | | $ | 3,044.9 | | | $ | 2,976.1 | | | 2% |
| China (non-consolidated) | China (non-consolidated) | 1,210.2 | | | 1,166.6 | | | 4% | China (non-consolidated) | 1,867.4 | | | 1,750.0 | | 1,750.0 | | | 7% | | 7% |
Key trends affectingThe automotive industry, and our business, include electrification, connectivity and autonomy. In addition, our business is affectedcontinue to be shaped by the consolidationbroad trend of automotive manufacturers, as well as new non-traditional entrants to the automotive industry, the collaboration of automotive manufacturers on commonized vehicle platforms, increasing demand for luxury and performance features, including increasing levels of electrical and electronic content, and China’s emergence as the largest automotive market in the world. In particular, we believe that we have a significant opportunity for growth in China with both global and domestic automotive manufacturers.
Another key trend benefiting our business is the shift toward crossover and sport utility vehicles. Our content on such vehicles, especially those for which our Seating segment supplies products, can be significantly higher than our average content per vehicle. Crossover and sport utility vehicle production has grown to approximately 40% of total vehicle production in 2020, up from 27% of total vehicle production five years ago. China has been a major driver of this trend, where crossover and sport utility vehicle production now comprises approximately 43% of total vehicle production, up from 28% of total vehicle production five years ago.
Our strategy addresses these trends and the major imperatives for success as an automotive supplier: quality, service, cost and efficiency, and innovation and technology. We have expanded key component and software capabilities through organic investment and acquisitions to ensure a full complement of the best solutions for our customers. We have restructured, and continue to align, our manufacturing and engineering footprint to attain a leading competitive cost position globally. We have established or expanded activities in new and growing markets, especially China, in support of our customers’ growth initiatives and in pursuit of opportunities with new customers. These initiatives have helped us achieve our financial goals overall, as well as a more balanced regional, customer and vehicle segment diversification in our business.
In addition, we believe that demand for energy efficiency and reduced carbon emissions, as well as the demand for enhanced communications and safety, are driving the technology trends of electrification, connectivity and autonomy. We are focused on those trends which provide us with significant business opportunities where we have competitive differentiation and innovative technology. While both of our businesses are powertrain agnostic, we are well positioned to capitalize on the following technology trends, each of which is likely to be at the forefront of ourthe industry for the foreseeable future in light of the long-term convergence toward electric, connected and autonomous vehicles:
•Electrification –future. Demand for, moreand regulatory developments related to, improved energy efficient vehicles is increasing, both from automotive manufacturersefficiency and sustainability (e.g., government mandates related to meet stricter fuel economy and emissions standardscarbon emissions) are significant drivers of this trend.
In 2024, the battery electric vehicle market is expected to represent 15% of global light vehicle production (based on January 2024 S&P Global Mobility projections), as compared to 12% in 2023 and 10% in 2022. Battery electric vehicle production increased to 10.2 million units in 2023 from 8.1 million units in 2022, primarily driven by growth in China. Increasing demand for electrified vehicles is driven by numerous product offerings from both traditional and non-traditional automotive manufacturers, government requirements and incentives, automotive manufacturers' internal targets and a growing segment of end consumers who wishare seeking alternatives to reduce the carbon impact of automobiles. Thisvehicles with traditional ICE architectures. Meeting this demand requires further use of electronically controlled and assisted powertrains and related components to improveimprove fuel efficiency,efficiency; the adoption of alternative energy powertrains, such as 48-volt mild hybrid, full hybrid, plug-in hybrid and pure battery electric powertrains that facilitate electrification of the vehicle,vehicle; and the use of lighter weight materials throughout the vehicle.
•Connectivity – Customer and consumer demands for continuous communication and information exchange with the vehicle are increasing. What began with consumer demand to extend and integrate mobile connectivity into the vehicle by connecting mobile devices with vehicle infotainment systems is evolving such that the vehicle has an embedded, direct line of wireless communication connecting it with various networks (e.g., cellular, infrastructure, satellite, etc.) and other vehicles. We expect these trends to continue, making the vehicle a constantly connected device, receiving and transmitting data through a variety of signals which communicate directly with on-board vehicle systems, and facilitating delivery of content and services for consumers and automotive manufacturers.
•Autonomy/Advanced Driver Assistance – Customer and consumer demands are evolving from safety features and systems that protect vehicle occupants when a crash occurs to advanced driver assistance systems that help prevent crashes by assisting in the vehicle’s operation under certain conditions. The development of automated intervention uses many of the same core technologies that will enable vehicles to drive autonomously under an increasing variety of driving conditions.
•Shared Mobility – As vehicle utilization increases and ride-sharing becomes more relevant, customer and consumer demands for more services, enhanced personalization and an improved mobility experience are also increasing.
RegulationOur business is also influenced by vehicle segment trends that continue to experience a major influenceshift in consumer preference toward crossover and sport utility vehicles. This trend positively impacts our business as content per vehicle on these trends, as government mandates (e.g., forsuch vehicles, to meet minimum fuel economyespecially within our Seating business, can be significantly higher. Crossover and emissions standards or be equipped with certain safety-related components) are driving vehicle design and technology plans.
We are well positioned with respect to these trends as we design and manufacture products across our entire E-Systems portfolio that are aligned with the trends toward electrification, connectivity, autonomy and shared mobility. Our product lines offer growth opportunities that are aligned with these trends but are ultimately dependent on globalsport utility vehicle production volumes.has grown to approximately 46% of total vehicle production in 2023, up from 33% five years ago.
Strategy
Furthermore,Through our seats are an active part of the occupant experienceproducts, technology and the vehicle safety system. As a result of our innovative product design and technology capabilities, we are able to provide seats with enhanced safety features, such as the active head restraint and seat mechanisms that withstand collision impact in excess of what is demanded by regulatory agencies. We have developed products and materials to reduce cost and enhance seat design and packaging flexibility, including our mini recliners and micro adjust tracks. Additionally, we have focused our innovation efforts on the configurability of seat positioning, which provides consumers with advanced seating features and functionality and has resulted in the development of our ConfigurE+TM configurable seat system. Another way in whichstrategic initiatives, we are well positioned to benefit from this trend-relatedcapitalize on business growth opportunities. We are focused on profitably growing our businesses and have implemented a strategy designed to deliver industry-leading, long-term financial returns. This strategy is based on the following four pillars designed to drive growth and profitability in both of our belief that the seat system will become increasingly more sophisticated, dynamicbusiness segments:
•Extend our market leadership position in Seating with priceable features;
•Transform our E-Systems business through accelerated growth in connection systems, vehicle architecture evolution and connected to both the occupantselectrification, and the vehicle. The seat is the logical focal pointrationalization of our product portfolio to improve profitability;
•Build on our reputation for monitoring the driver and passengers and for facilitating feedback between the vehicle and the occupants.
We believe that the convergence of these technology trends and eventual proliferation of autonomous vehicles will benefit both our Seating and E-Systems segments. We believe that autonomous vehicles will have seat designs and requirements that are far more flexible and demandingoperational excellence through investment in both autonomous and piloted driving states. Further, more active monitoring of the driver and the driver’s position and physical state will be required to manage the transitions between autonomous and piloted driving conditions. A demand for mobility services and on-demand transportation from providers such as Uber, Lyft and Didi (in China)Industry 4.0 technologies; and
is helping•Prioritize people and the planet through our sustainability initiatives to drive interestbusiness growth, cost reductions and growth in these technology trends, particularly fully autonomous vehicles. The increasing prevalenceimproved employee retention.
In our Seating business, key attributes of mobility services will potentially create a new segment of autonomous vehicle fleetthe seat design are evolving as the market continues to pivot toward electrified vehicles, providing us with an opportunity to offer value added solutions to our customers with unique vehicle technologythrough our products and design needs, including more flexible, durableto use our leading market position to capture additional market share. Our products include seat heating, ventilation, active cooling, pneumatic lumbar and connected seating solutions for a wide range of passengers. Not only will autonomous vehicles need to be fully connected and networked to maximize their safety and efficiency, their power consumption will be significantly higher to support the array of sensors and processing power required to operate such vehicles. This will allow us to take further advantage of our ability to design and offer efficient power management solutions.massage products through INTUTM Thermal Comfort, the latest addition to our Intelligent Seating and ConfigurE+(INTUTM Seating) offerings, and seat reconfigurability through Configurable Seating Architecture (ConfigurE+TM). In thermal comfort systems, we are integrating our existing capabilities with those realized through our acquisitions of Kongsberg ICS and IGB. Further, we are enhancing product design through the integration of multiple thermal comfort features into a module which offers fewer parts, reduced complexity, improved packaging and significant performance improvements. Finally, we have leveraged our complete seat system and component expertise and capabilities to develop a complete thermal comfort solution that combines this thermal comfort module with FlexAirTM, our 100% recyclable non-foam alternative, and the seat trim cover. Our newly designed thermal comfort seat system can reduce sub-components by 50% and increase airflow directly to the occupant by 40%, as compared to currently available designs. Our design enables heating and ventilation of the occupant rather than the entire cabin, which can improve energy efficiency, resulting in improved battery range for electric vehicles. With our Seating segmentthermal comfort systems expertise, we are poised to capitalize on the market trends in electric vehicles, second and third row comfort, and ride sharing, while also providing greater design, cost, production and energy efficiency for our customers.
In our E-Systems business, our broad capabilities in connectivity,electrical distribution and connection systems; high-voltage power distribution products, including gateway modules,BDUs; and the featureslow-voltage power distribution products, electronic controllers and functions facilitated by Xevo market in our E-Systems segment are well-aligned withother electronic products support the trend toward autonomous vehicles.electrification, as well as the evolution toward zone-based vehicle electrical architectures for both ICE and electrified powertrains. We are investing in and expanding our electrical distribution and connection systems business. This business is benefiting from expanded content per vehicle in line with higher circuit counts supporting high-speed data movement within the vehicle, as well as high-voltage wire harnesses and high-voltage battery components such as intercell connect boards on electrified powertrains. In addition, we have enhanced our vertical integration capabilities in connection systems through the acquisition of M&N Plastics. Our high-voltage power distribution business, including our BDU business, and our low-voltage power distribution business are benefiting from the increased adoption of electrified powertrains and the expansion of longer range, larger format (trucks and SUVs) and higher performance electrified vehicles, where we provide market-leading solutions. Differentiation through higher power management capacity, lighter weight solutions, and optimized and vertically integrated manufacturing solutions provide us with a competitive advantage in the electrification market. Our electronic controllers and other electronic products business is benefiting from the adoption of new vehicle electrical architectures with more integrated power management and control, which is aligned with our strong history of providing highly complex and integrated electronics to our customers. We have rationalized our electronics product portfolio to align with this trend, focusing future investments on those products where we believe that we have a competitive advantage and we can achieve industry-leading financial returns. Further, we are de-emphasizing and exiting those product lines where we do not see a path to sustainable risk-adjusted financial returns.
We are building on our reputation for operational excellence within the automotive industry with the establishment of our Lear Forward Plan, which will enhance operational efficiencies across our business, and our investments in Industry 4.0 technologies, including the 2022 acquisitions of Thagora and InTouch. Our acquisition of Thagora provides us with scalable smart-manufacturing technology that improves the production yield of our Seating segment's surface materials operations and lowers energy usage during production. Our acquisition of InTouch provides us with complex testing equipment that automates the testing and validation of seat components and complete seats.
We continue to embed responsible and sustainable principles into our key business processes and operations. We have developed products such as FlexAirTM,ReNewKnitTM, a sustainable sueded alternative material that is fully recyclable at its end of life and composed of 100% recycled plastic bottles, and SoyFoamTM, a substitute for certain petroleum-based products. We also have improved energy efficiency in our operations and established climate goals to reduce carbon emissions and increase the use of renewable energy.
Seating Segment
Lear is a recognized global leader in complete automotiveseat systems. Based on independent market studies and management estimates, we believe that we hold the #2 position in complete seat systems realizingglobally on the basis of revenue with strong positions in all major markets and a 23%25% global market share in 2020. Additionally, Lear is2023. We are also a recognized leader in key individual seat components. Thecomponents produced for complete seat systems.
Our Seating segment consists of the design, development, engineering, just-in-time assembly and just-in-time delivery of complete seat systems, as well as the design, development, engineering and manufacture of all major seat components, including seat covers andtrim covers; surface materials such as leather and fabric,fabric; seat mechanisms,mechanisms; seat foamfoam; thermal comfort systems such as seat heating, ventilation, active cooling, pneumatic lumbar and massage products; and headrests. Our extensive system levelsystem-level knowledge and component level capabilities,component-level capabilities, including internal
development of sensor and control algorithms, have provided a solidstrong foundation for innovation and commercialization of advancedthermal comfort wellnesssystems and convenience features. We believebelieve that we have the most completewith our comprehensive set of component offerings, of any automotive seating supplier andwe are a leader in every automotive producing market in the world. Further, our INTUTM Seating and ConfigurE+TM offerings, in addition to our light weight and more environmentally friendly products, are well-aligned with the trends toward electrification, connectivity and autonomy.global market. Overall, our global manufacturing and engineering expertise, low-cost footprint, complete component capabilities, quality leadership and strong customer relationships provide us with a solid platformcatalyst for both organic and inorganic growth opportunities to enable us to reach our mid-term target global market share of 28%29% in complete automotive seat systems.
We produce seat systems that are fully assembled and ready for installation in automobiles and light trucks.vehicles globally. Seat systems are generally designed and engineered for specific vehicle models or platforms. We develop seat systems and components for all vehicle segments from compact cars to pick-up trucks and full-size sport utility vehicles. We are the world leader in luxury and performance automotive seating, providing craftsmanship, elegance in design, use of innovative materials and industry-leading technology requiredrequired by premium brands and vehicles, including those produced by Alfa Romeo, Aston Martin, Audi, BMW, Cadillac, Chevrolet, Ferrari, GMC, Jaguar, Lamborghini, Land Rover, Lamborghini, Lincoln, Maserati, Mercedes-Benz, NIO, Polestar, Porsche and Porsche.Volvo.
We are continuing to executeexecuting on our strategy to extend our leadership position in the market through unique product offerings and selective vertical integration. Our acquisition of Kongsberg ICS provided us with capabilities in seat massage, lumbar, heating and ventilation. Our acquisition of IGB provided us with capabilities in seat heating, ventilation and active cooling, steering wheel heating, seat sensors and electronic control modules. ConfigurE+ is a wireless powered rail system that allows for easy repositioning of seats within vehicles. Further, selective vertical integration of key seat components to enhanceis enhancing growth improve quality, increaseand increasing profitability, and support our current market position in just-in-time seat assembly.as well as improving quality. In this regard, our capabilities in seat mechanisms include complete development and manufacturing capabilities in key locations to supply every major automotive producing region in the world. In addition, wewe have developed standardized seat mechanisms that can be used across multiple vehicle programs to minimize investment costs. Our seat mechanisms are developed and manufactured in key locations to supply every major automotive producing region in the world. We believe that our precision-engineered seat mechanism expertise and low-cost manufacturing footprint inprovide us with a competitive advantage.
Our seat mechanisms and our precision engineered seat mechanism expertise are competitive advantages.
Wecover operations have continued to grow our seat cover operationsexpand in low-cost markets, including precision cutting, assembly, sewing and lamination. We are also continuing to develop our fabric business (originally secured through our acquisition of Guilford Performance Textiles), and ourOur acquisition of Eagle Ottawa has affordedprovided us an industry-leading market share in automotive leather globally. Our capabilities in leather design, development and manufacturing allow us to deliver the most luxurious, durable and performance-tested leathers to our customers. Our acquisition of Guilford Mills provided us with Guilford Performance Textiles, a line of automotive seat and interior fabrics. On a global basis, we can provide a full range of seat cover capabilities, including design and surface coating solutions, as well as unique leather and fabric applications. We believe that the combination of these capabilities in seatingseat surface materials differentiates us and provides us with a competitive advantage facilitating our leadership position in the industry.
We are committed to sustainability and reducing the environmental footprint of our products, operations and supply chain as a means to meet current needs without compromising future generations. With a diverse team, we workdrive business growth and reduce costs. We are working to improve the sustainability of our operations through identification and reduction of generated waste, reuse of materials whenever possible and recycling. Our sustainability efforts leverage available technology to substitutereplace certain petroleum-based products with "green" productsmore sustainable alternatives, such as SoyFoamTM and, more recently, FlexAirTM, our 100% recyclable non-foam alternative that is anticipated to manufacturereduce both CO2 emissions and mass as compared to traditional foam offerings, as well as improve breathability, resulting in better performance. In addition, we have focused development efforts on commercializing a range of fabrics that contain recycled, renewable or recyclable yarns that reduce our environmental impact. For example, we manufacture fabricThese fabrics include our ReNewKnitTM sustainable sueded alternative material, which is a first-to-market automotive textile that is fully recyclable at its end of life and composed of 100% recycled plastic bottles. ReNewKnitTM fibers are spun from polyester yarn and finished with a foam-free recycled content,fleece backing.
Thermal Comfort Systems
Our thermal comfort systems consist largely of seat heating, ventilation, active cooling, pneumatic lumbar and massage products, together with other thermal products such as recycled polyester derived from post-consumer waste, through grindingpanel and re–extruding processes. Ocean Waste yarnssteering wheel heating. Our thermal comfort systems strategy consists of three phases: business integration, component modularity and delivery of the most efficient and feature-packed seat in the industry. Over the past decade, we have dedicated significant engineering resources to designing, developing and advancing the future of thermal comfort systems. Our recent acquisitions of Kongsberg ICS and IGB further expanded our unique capabilities with experienced engineering and manufacturing leaders to accelerate the execution of our thermal comfort systems strategy and provide purchasing, logistics, administrative and footprint synergies to improve our cost competitiveness. Through component modularity efforts, we are sourced from plastic ocean garbageinnovating and enhancing product design by combining multiple functions that collectswere previously provided across multiple components into modular solutions. Traditionally, heating, ventilation, lumbar and massage products have been designed as independent systems in fishing nets. After segregation, PET plastic bottlesa multi-layered model. We have designed a single module that combines these thermal comfort features and other plastic waste are recycled intouses fewer parts. This module provides a high-quality polymer, which is usedmore efficient system, reduces complexity, improves packaging size and delivers significant performance improvements. Finally, we have leveraged all of our complete seat systems and seat component expertise and capabilities to produce 100% recycled polyester yarn for fabric production.develop a complete thermal comfort system that combines our thermal comfort module, FlexAir
complexity, mass and package size (allowing for easier adoption in second and third rows) and significantly improves the final seat assembly process while providing a more efficient system with improved performance (including reduced time to sensation) and enhanced comfort for the occupant. In addition, our complete thermal comfort module can be supplied to any seat supplier and is compatible with any seat structure with traditional foam or FlexAirTM. We believe that we are the only supplier with the complete capabilities necessary to realize these modular concepts, providing a unique value proposition to our customers.
Advanced Seating Craftsmanship and Innovation
We believe that our broad portfolio of capabilities, including advanced design and material integration skills, isprovide us with a differentiating competitive advantage for us.advantage. Our team of experts at our Center for Craftsmanship in Southfield, Michigan has developed a portfolio of product technologies that deliver sustainable products, differentiated design, craftsmanship and comfort, as well as sustainable products.comfort. Through this dedicated studio, we are leveraging our unique position to be an industry leader in differentiated design and facilitating customer interactions with designers and engineers working collaboratively to create innovative solutions early in the design process. The breadth of our portfolio and depth of our design expertise allowallows us to have early involvement in the automotive manufacturer’s design process and the opportunity to better integrate all seatingseat components to provideand bring innovative designs into production with the highest level of craftsmanship, providing differentiated design comfort, quality and overall value forto the end consumer. We believe that our unmatched component capabilities, design know-how,expertise, global manufacturing presence, and our portfolio of enabling and sustainable technologies uniquely position usprovide a unique value proposition to bring innovative designs into production with the highest level of craftsmanship.our customers and will drive market share gains for our business.
We believe that we are the only fully integrated seatingseat supplier with global capabilities in critical seat components, together with global electronics (including software)software design, integration and manufacturing expertise. To maintain our competitive advantage, we continue to drive advanced seating innovations through a combination of comprehensive product capabilities aligned with industry mega trends and early customer engagement. The result is a broad portfolio of innovative, sustainable solutions enabling our intelligent seating offerings for today and tomorrow. Examples of our advanced technology offerings can be found in our Intelligent Seating (INTUTM Seating) systems and Configurable Seating Architecture (ConfigurE+TM) products.consumers.
Intelligent Seating (INTUTM Seating)
The seat offers a direct connection between the driver, passengers and vehicle systems. Our development of INTUTM technologies provides the driver and passengers with intelligent, intuitive seat system options that offer enhanced wellness, safety,advanced comfort and sound performance.solutions, including thermal products, as well as configurable seating product technologies. Our extensive knowledge in consumer ergonomics and comfort, in combination with our electronics’electronics capabilities, facilitated the development of our INTUTM seat features, which are capable of being programmed to identify certain key occupant inputs and automatically adjust the appropriate seat parameters to provide consumers with a better, highly personalized, in-vehicle experience. Our suite of INTUTM technologies includes comfort, wellness, sound and safety.
Our INTUTM Comfort features were developed to improve comfort throughout long drives. Derived from our research, INTUTM Comfort deploys proprietary technology and in-house developed analytical processes to identify the optimal seat position for the occupant given certain conditions. For example, on extended trips, the lumbar support is continuously adjusted for optimal comfort, and seat bolsters automatically adjust during sharp curves to provide the driver with optimal support. The latest addition to the INTUTM Comfort features is our INTUTM Thermal Comfort system. We have developed and drivendesigned efficiencies into individual seat components and full system integration to outperform existing systems. Continued advancements in our INTUTM Thermal Comfort system are targeted to optimize the overall thermal performance of the vehicle interior,interior, which may reduce vehicle energy consumption of bothfor vehicles with ICE and electric vehicles.architectures, as well as those with electrified powertrains.
Configurable Seating Architecture (ConfigurE+TM)
The abilityThrough our ConfigurE+TM configurable seating architecture, we are able to provide flexible seat positioning while offering consumers advanced seatingseat features and functions is now achievable through our ConfigurE+TM configurable seating architecture.functions. Winner of aan Automotive News PACE Award (Automotive News annual award for innovation in the automotive industry),2019, ConfigurE+TM with its configurable powered rail system enables selective seat positioning and/orand seat removal for virtually limitless configurations while maintaining the functionality of the seat’sseat's electronic features. By providing power without a wire harness, seats can be easily removed for cargo management, and vehicle cabins can be quickly customized, for traditional passenger or conference configurations, cargo, etc. providing flexibility for personal, autonomous, ride-share and public transportation needs. Further, the potential market for ConfigurE+TM includes commercial trucks as well as light vehicles.
Other Core Capabilities
With capabilities unmatched by any seat supplier in the industry, we consistently produce world-class seat systems to meet or exceed the expectations of every type of driver and passenger. Our designs incorporate intelligent features, and our patented modular sub-assemblies with embedded technologies have the potential to transform the seating market.
We maintain state-of-the-art testing, instrumentation and data analysis capabilities. We possesshave in-house, industry-leading seat validation test centers featuring crashworthiness,crash worthiness, durability and full acoustic and sound quality testing capabilities. Together
with computer-controlled data acquisition and analysis capabilities, these centers provide precisely controlled laboratory conditions for sophisticated testing of parts, materials and systems. In addition, we incorporate many convenience, comfort and safety features into our designs, including advanced whiplash prevention concepts, integrated restraint seat systems and side impact airbags. We also invest in our computer-aided engineering design and computer-aided manufacturing systems.
systems to facilitate a more efficient design process. We have developed products and materials to improve comfort and ease of adjustment, promote customization and styling flexibility, increase durability and reliability, enhance safety, expand the usage of environmentally friendly materials and reduce cost and weight.
Our core capabilities extend into key seat components as well, including:
•Leather and Fabric – We deliver the most luxurious, durable and performance-tested leathers to more automotive brands globally than any other automotive leather supplier, while ensuringpromoting sustainable and responsible sourcing practices. Our premium leathers are designed for seamless integration with our industry leadingindustry-leading secondary operations, exceeding customer expectations for quality and service. Our Eagle Ottawa premium leather group has developed and launched, in both Europe and North America, a new technology that allows for the creation of highly customizable designs with new levels of definition and pillowing, improving the comfort and style of the seat while retainingenabling the necessary air flow necessary for ventilated seats. This technology has already been launched in Europe with additional program awards to launch in North America in 2021. Additionally, our proprietary anti-soiling performance leather finishing technology, Ansolé™TM, improves durability and protects against staining and fading.
Our Guilford Premium SuedeWith respect to fabrics, we have focused development efforts on commercializing a range of fabrics that contain recycled, renewable or recyclable yarns that reduce our environmental impact. These fabrics include our ReNewKnitTM sustainable sueded alternative material that is a market-driven unique product positioned to compete with premium non-woven materials by providing a light weight, cost effective solution with improved functionality. Guilford Premium Suede is a luxury, premium materialfully recyclable at its end of life and composed of 100% recycled plastic bottles, which is versatile and suitable for various interior applications, providing increased elongation and improved moldability for manufacturing processes.scheduled to launch with a global automotive manufacturer in 2024. Our branded TexstyleTeXstyleTM surface material coatings and treatment technologies enhance cleanability by releasing and repelling stains; prevent the growth of bacteria and mildew through the addition of antimicrobial treatments, including silver ion technologies; protect fabric against water and oil-based stains; minimize soiling of light colors; and are anti-static and anti-dusting.
•Seat Mechanisms –We supply world-class front-rowfront and rear seat systems, recliners, tracks, latches and other products in a scalable modular family. Our seat architectures are a core component of our industry-leading vertical integration capabilities around the world. Smaller, low-weight and low-noise materials deliver high performance, safety and functionality.
Our high-speed smart fold technology is a regulated folding adjustment mechanism that delivers premium convenience while maintaining leading safety and comfort benefits. Our mini recliners and micro adjust tracks are seat mechanisms whichthat provide precision movement and facilitate interior packaging space flexibility. Our ECO Structures utilize an innovative hub and spoke concept offering economic solutions for developing markets.
•Zero Gravity Seat – Zero gravity seats (i.e., seats designed to replicate the sensation of weightlessness) have become increasingly more important in the local China market as they provide an enhanced comfort experience for the second row occupants. We have developed a zero gravity seat for second row occupants that includes a 65 degree recline, a raising calf rest for lower leg support, an adaptive arm rest and occupant body pressure distribution, together with various comfort features, including integrated pneumatic neck support and heated back massage. Production for our first award is expected to launch in 2024.
•Foam and Comfort – Self-blended, custom foam formulations are at the heart of our seats. Our highly engineered low-profile foam, low-emission foam and our first-to-market, U.S.-sourced SoyFoam™SoyFoamTM are break-through innovations in comfort, safety and sustainability. Our FlexAirTM technologies offer a 100% recyclable non-foam alternative to traditional foam.
Manufacturing LeadershipLeadership
Our continued focus on expanding our expertise and capabilities in materials, logistics and manufacturing is a key enabler in providing our customers with world-class seat system products. Our unique proprietary processes and employee engagement initiatives will continue to provide us with a competitive advantage.
We pioneered just-in-time ("JIT") seat assembly. Typically located adjacent to or near our customers’customers' manufacturing and assembly sites, our JITjust-in-time facilities deliver finished productsassembled seats matching our customers’customers' exact build specifications for a particular day, shift and sequence. Our expertise in logistics and lean manufacturing processes enable us to meet our customers’customers' delivery requirements while maintaining inventories at optimum levels.
Believed to beWe believe that we are the world’sworld's most vertically integrated manufacturer of complete seat systems, weproviding us with a competitive advantage in terms of cost and quality. We utilize the latest industry innovations and automated technologies to facilitate our continuous improvement efforts. Our recent investments in Industry 4.0, including the 2022 acquisitions of Thagora and InTouch, have resulted in operational efficiencies in the manufacturing process. Moreover, we have continued to expand our employee engagement initiatives, achieving global scalability and successfully driving cultural advances. Our
initiatives have resulted in increased first-timeimprovements in quality, decreasedlower employee absenteeism, material cost reductionssavings and decreaseda reduction in average assembly build times per vehicle.seat set.
Customers
The top five customers of our Seating segment are: General Motors, Daimler,Mercedes-Benz, Stellantis, (reflective of the 2021 merger of PSA and Fiat Chrysler), Volkswagen and Ford.
Competition
Based on independent market studies and management estimates, we believe that we hold the #2 position in seat systems assembly globally on the basis of revenue with strong positions in all major markets. We are a leading supplier of various components produced for complete seat systems.
Our primary competitors in this segment globally are Adient plc, Faurecia S.A.,Forvia SE, Magna International Inc., Toyota Boshoku Corporation, and TS Tech Co., Ltd. and Yanfeng Automotive Systems Co., Ltd., which have varying market presence depending on the region, country or automotive manufacturer. Peugeot S.A., Toyota Motor Corporation and Honda Motor Co. Ltd. hold equity ownership positions in Faurecia S.A., Toyota Boshoku Corporation and TS Tech Co., Ltd., respectively. OtherA limited number of other automotive manufacturers maintain a presence in the seat systemssystem market through wholly owned subsidiaries or in-house operations. In seat components, we compete with the seat systemssystem suppliers identified above, as well as certain suppliers that specialize in particular components.
For additional factors that may impact our Seating segment’ssegment's business, financial condition, operating results and/or cash flows, see Item 1A, "Risk Factors."
E-Systems Segment
TheOur E-Systems segment consists of the design, development, engineering and manufacture of complete electrical distribution and connection systems,systems; high-voltage power distribution products, including BDUs; and low-voltage power distribution products, electronic systems,controllers and software and connected servicesother electronic products for light vehicles globally. We are a leader in signal distribution and power management within the vehicle for all types of powertrains – from traditional ICE architectures to the full range of hybrid, plug-in hybridelectrified powertrains. Our expertise and battery electricproduct portfolio support new vehicle electrical architectures, including the adoption of high-voltage electrified vehicle architectures and the transition to zone-based vehicle electrical architectures. We have connectivity hardwareare expanding our capabilities and software capabilities,introducing new product lines, primarily within our electrical distribution and connections systems business and including cybersecurity expertise, that facilitate secure, wireless communication betweenintercell connect boards, BDUs, engineered components, high-voltage wire, high-speed data cables and zone control modules. Further, we are de-emphasizing and exiting certain electronics product lines, including audio modules, lighting modules, on-board chargers, telematics control units and niche electronic controllers, where we do not see a path to sustainable risk-adjusted financial returns.
In our E-Systems business, the vehicle’selectrification of the vehicle powertrain adds significant content per vehicle for our products, including high-voltage wire harnesses, high-voltage battery connection systems (intercell connect boards, bus bars and main battery connection systems) and BDUs. Higher performance and larger format electrified vehicles, including trucks and SUVs, as well as electrified vehicles with longer range, further increase content per vehicle and aligns favorably with our products, including high power-to-size ratio terminal systems, high performance BDUs and intercell connect boards.
In addition, the continuing evolution of the vehicle electrical architecture is introducing more highly integrated power management and control electronics (or zone control modules) and greatly expanding the use of high-speed data within the vehicle. Our customers are adopting these new architectures on both ICE and electrified powertrains to enable continued integration of more electrical and electronic architecturecontent and external networks, as well as mobile devicesto enable future software-defined functionality. These market demands align favorably with our expertise in zone control modules and other vehicles. We also offer softwarehigh-speed data cables.
Our product portfolio strategy enables increased leverage of our investments across a focused product portfolio and services for the cloud, vehicles and mobile devices that enable consumer e-commerce, multi-media applications and enterprise services among other new and emerging applications.
As the only automotive supplier with both electrical distribution and electronic capabilities for all vehicle architectures, we havecreates a competitive advantage as we are able to offer our customers customized solutions optimized to provide complete architecture benefits. Our component designs contemplateconsider the performance of the complete architecture, performance, creating superior value for our customers and providing us with a competitive advantage.customers. Our investments in electrification over the past twelvefifteen years are providing us with a significant growth opportunity with respect to this trend. Further, electrified vehicle architectures represent a significant content per vehicle expansion opportunity for us, with two to three times the potential content per vehicle opportunity of traditional ICE architectures.us.
Electrical Distribution and Connection Systems
Electrical distribution and connection systems route networksnetwork and electrical signals and manage electrical power within the vehicle for all types of powertrains, including traditional ICE architectures and the full range of hybrid, plug-in hybrid and battery electric architectures,electrified powertrains, supporting the current industry trend toward electrification. Key components in theof electrical distribution and connection systemsystems include wire harnesses, terminals and connectors, high voltage battery connection systems and engineered components for both ICE architectures and electrified vehicle architecturespowertrains that require management of higher voltage and power.
Wire harness assemblies, are a collection of wiring, terminals and connectors, and engineered components thattogether with connection systems, link all of the various electrical and electronic devices within the vehicle to each other and/or to a power source. Our wire harnesses provide low voltagelow-voltage (12 volts /and 48 volts) and high voltage (60high-voltage
(60 volts – 800 volts) power distribution. Low voltageLow-voltage wire harnesses are used on all light duty vehicles, and high voltage wire harnesses are used on hybrid, plug-in hybrid and battery electric vehicles.vehicles with electrified powertrains. Wire harness assemblies are a collection of individual circuits fabricated from raw and insulated wire, which is automatically cut to length and terminated during the manufacturing process. Individual circuits are assembled together, inserted into connectors and wrapped or taped to form wire harness assemblies. The assembly process is labor intensive, and as a result, production is generally performed in low-cost labor sites in Mexico, Honduras, Brazil, Eastern Europe, Africa, China and the Philippines.
Connection systems include conductive metalterminals and connectors, high-voltage battery connection systems and engineered components and connector housings that join wire harness assembliesharnesses together at their respective end points or connect electronic devices to wire harness assemblies.harnesses. Connection systems can vary significantly in size and complexity depending on the amount of power or data being transferred and the number of connections being made at any particular point in the electrical distribution system. Terminals and connectorsConnection systems support both low voltage (12 volts / 48 volts)low-voltage and high voltage (60 volts – 800 volts). Low voltage terminals and connectorshigh-voltage power distribution. Low-voltage connection systems are applicableused on all light duty vehicles and high voltage terminals and connectorshigh-voltage connection systems are applicableused on hybrid, plug-in hybrid and battery electric vehicles.vehicles with electrified powertrains. Our terminals and connectorsconnection systems are produced byusing highly automated processes, including stamping, injection molding and automated assembly processes. In 2021, we entered into a partnership with Hu Lane Associate Inc., a world-class manufacturer of automotive connector products, to expand our business opportunities in connection systems through access to a broader catalog of product-enabling solutions for our customers. Our terminals and connectorsconnection systems are currently manufactured in Germany, Eastern Europe,the Czech Republic, Morocco, China and the United States. Key material inputs to our terminals and connectorsconnection systems business include metals, such as copper and aluminum, and various resins.
stamped and molded components and assemblies that provide connections between battery cells, from the battery pack to the vehicle electrical architecture, and between other electrical components within the high-voltage battery pack. High-voltage battery connection systems can vary in size and design to accommodate various high-voltage battery architectures and enable safe and efficient electrified powertrain battery packs. Specific products include intercell connect boards, bus bars and main battery connection systems. These products are produced using highly automated processes, including stamping, bending, molding and assembly. We leverage our metal stamping capabilities in our Seating business to provide a competitive advantage for these products through vertical integration and supply chain management. Our established capabilities in connection systems and engineered components facilitate our ability to produce these products. Our high-voltage battery connection systems are produced in Germany, the United States, the Czech Republic, Mexico and China. Key material inputs to our high-voltage battery connection systems business include metals, such as copper, aluminum, and steel, and various resins. Engineered components consist of molded components included as part of ain wire harness or electronic assembly thatassemblies. These components perform specific engineered functions, such as protection, routing, sealing or covering, to ensure that the wire harness or electronic assembly properly performs its function. In 2021, we acquired M&N Plastics, a privately owned injection molding specialist and manufacturer of engineered plastic components for automotive electrical distribution applications, which enabled the significant expansion of our footprint and capabilities with respect to engineered components. Engineered component capabilities are a significant contributor to vertically integrated product assemblies and enable business growth across electrical distribution and connection systems and our Seating business due to increased control of product cost and quality, as well as the supply chain. Engineered components are applicable onto all vehicle architectures and are produced using molding processes. Our engineered components are currently manufactured in Germany, the Czech Republic, Morocco, China and the United States and China.States. Key material inputs to our engineered components are various resins.
Electronic SystemsHigh-Voltage Power Distribution Products, including BDUs
In our E-Systems segment, we also design, develop, engineer and manufacture electronic systems,high-voltage power distribution products, including BDUs. These products control the flow and distribution of high-voltage power throughout electrified vehicles and include BDUs which control various functions within the vehicle, as well as developall electrical energy flowing into and integrate the associated software for these electronic systems. Our embedded software solutions have traditionally been sourced as a systemout of high-voltage batteries in electrified vehicles. More than fifteen years of experience in high-voltage power distribution products, together with our electronic hardware offerings. Although this trend continues, customers are beginningexpertise in areas integral to source software separately from the related hardware. Our established capabilities in embedded control software will allow usperformance of BDUs, such as power and thermal management and electrical architecture integration, have contributed to capitalize on such opportunities. Our electronic modules include body domain control modules, smartour well-established market position and passive junction boxesour ability to effectively and gateway and communication modules thatcompetitively supply BDUs. High-voltage power distribution products are applicable to all electrified powertrain vehicles, but the size, complexity and configuration can vary widely dependent upon the power requirements of individual vehicle types. As a result of twelve years of investmentplatforms. Our high-voltage power distribution products are currently manufactured in electrification,Mexico, China, Spain and Morocco. Key material inputs to our electronic systems business also includes electronic modules that are specific to hybridhigh-voltage power distribution products include metals, including copper and electric vehicles,aluminum, various resins, and power components, such as on-board battery chargers,fuses, e-fuses and contactors.
Low-Voltage Power Distribution Products, Electronic Controllers and Other Electronic Products
In our E-Systems segment, we also design, develop, engineer and manufacture low-voltage power conversiondistribution products, electronic controllers and other electronic products that control various functions and power distribution within the vehicle. Our
electronic product offerings include zone control modules, high voltage battery management systemsbody domain modules and high voltagelow-voltage power distribution. Our engineeringdistribution units. These units are typically purchased with embedded software to manage vehicle functions, control power distribution and development activities for electronics are in the United States (Southfield, Michigan), Germany, Spain, China and India.ensure vehicle network connection. We assemble these modules using capital-intensive,specialized, high-speed surface mount placement equipment and assembly processes in Mexico, Europe, Northern Africa and China. Electronic system products and their applications include:
•Body Domain Control Modules – Body domain control modules primarily control vehicle interior functions outside of the vehicle’s head unit or infotainment system. Depending on the vehicle’s electrical and electronic architecture, these modules can be either highly integrated, consolidating multiple functional controls into a single module, or focus on a specific function, such as seat position and comfort controls or the door zone control module which controls features such as window lift, door lock and power mirrors. Key components include various semiconductor devices, passive electronic components and printed circuit boards.
•Smart and Passive Junction Boxes – Passive junction boxes are centrally located modules within the vehicle that contain fuses and/or relays for circuit and device protection and serve as a connection point for multiple wire harnesses. Smart junction boxes represent the integration of junction boxes with certain body domain control module functions, which can provide higher efficiency solutions for packaging size, mass and assembly in certain vehicle electrical architectures. Certain materials, particularly certain specialized electronic components, are available from a limited number of suppliers.
•Gateway and Communication Modules – We develop and produce gateway modules, which facilitate secure access to, and communication with, all of the vehicle systems at a central point and translate various signals to facilitate data exchange across various vehicle domains. Our connectivity capabilities include communication modules which manage wireless communications over cellular (including 5G), V2X, Bluetooth and WiFi and are connected to the vehicle networks. We develop and provide hardware and software for these products. We also have capabilities in high accuracy vehicle positioning through a cloud-computing-based system combined with software in vehicles to achieve high precision navigation solutions for our customers’ V2X and automated vehicle platforms. Key components include semiconductor devices, passive electronic components and printed circuit boards.
•Integrated Power Modules – Integrated power modules are power electronics products used on hybrid, plug-in hybrid and battery electric vehicles that have at least two, but typically three, functions integrated into a single module to achieve efficiencies, including packaging size, reduced electrical connections and reduced mass. Our offerings are focused on the integration of on-board battery chargers, DC/DC converters and high voltage power distribution. Each of these products can be integrated into a single integrated power module or purchased independently depending on the automotive manufacturer’s architectural preferences.
–On-board battery chargers are electronic modules that convert power from the electrical grid to high voltage direct current power to charge high voltage batteries for plug-in hybrid and battery electric vehicles. These are applicable on all plug-in hybrid and battery electric vehicles. Key components include semiconductor electronic components, passive electronic components, printed circuit boards and aluminum castings.
–DC/DC converters are electronic modules that convert voltage levels of power between high voltage and 12V electrical architectures. DC/DC converters are applicable on hybrid, plug-in hybrid and battery electric vehicle types. Key components include semiconductors, passive electronic components, printed circuit boards and aluminum castings.
–High voltage power distribution units are electronic control modules that provide switching of high voltage power between the different loads and sources within a high voltage electrical architecture. Battery
disconnect units are a specialized type of high voltage power distribution unit that may be packaged inside the vehicle’s high voltage battery. High voltage power distribution units are applicable on hybrid, plug-in hybrid and battery electric vehicles. Key components include copper bus bars, contactors and molded housings.
•High Voltage Battery Management Systems – High voltage battery management systems are a system of multiple electronic control modules comprised of sensing modules and computing modules that provide sensing and assessment of the high voltage battery’s condition, performance and status, as well as calculate appropriate control adjustments to battery temperature control, amperage draw and charge rate to ensure proper performance of the system. These systems are applicable on hybrid, plug-in hybrid and battery electric vehicles. Key components include semiconductors, application specific integrated circuits and passive electronic components.
Software and Connected Services
Our software offerings include embedded software which is impacted by the increased complexity and processing power in electronic systems and is driving rapid increases in software requirements associated with these systems. Accordingly, we continue to build on our knowledge and capabilities in software in order to design and develop more complex and integrated electronic systems capable of more efficiently managing the distribution of power and data signals through the vehicle.
Software arising from our electronic systems product lines, where our customers' sourcing practices are beginning to consider software independent from hardware, include certain capabilities in body, connectivity and electrification domains of the vehicle. New modular software architectures, developed by us and others, enable software to be potentially sourced independent of hardware. We are beginning to offer our software solutions in this way. Software is applicable on all light duty vehicles and is developed in Germany, the United States and India using processes dependent on highly skilled and specialized labor.
Our connected services software solutions include award-winning Xevo Market, an in-vehicle commerce and service platform that connects customers with their favorite brands and services by delivering highly-contextual sales offers through vehicle touch screens and vehicle-branded mobile applications. Connected services are applicable on all light duty vehicles and are developed in the United States and Japan using processes dependent on highly skilled and specialized labor.
Customers
The top five customers of our E-Systems segment are: Ford, Volkswagen, Renault-Nissan, Jaguar Land Rover and Geely.
Competition
Our major competitors in electrical distribution and connection systems include Aptiv PLC, Leoni AG, Molex Incorporated (a subsidiary of Koch Industries Inc.), Sumitomo Corporation, TE Connectivity and Yazaki Corporation. Our major competitors in electronic modules, including connectivity solutions, include Aptiv PLC, Continental AG, Denso Corporation, Harman International Industries, Incorporated (a subsidiary of Samsung Electronics Co. Ltd.), Hella AG, Robert Bosch GmbH, Valeo S.A. and Visteon Corporation.
Technology
Our complete electrical distribution and connection system design capabilities, coupled with certain market-leading component technologies, allow early access to our customers’customers' product development teams, which provides an early indication of our customers’customers' product needs and enables us to develop system design efficiencies. Our ability to design and integrate electronic modules creates a competitive advantage as we support customers with complete electrical architecture development. The E-Systems segment is technology driven and typically requires higher investment as a percentage of sales than our Seating segment. Our expertise is developed and delivered by approximately 2,6002,200 engineers across sixteenfourteen countries and is led by sixfour global technology centers of excellence in Belgium, China, Germany, Spain and the United States (Southfield, MI and Seattle, WA) for each of our major product lines in this segment, which are described below.segment.
In electrical distribution and connection systems, our technology includes expertise in the design and use of alternative conductor materials, such as aluminum, copper-clad steel and other hybrid alloys. Alternative conductor materials can enable the use of ultra small gauge conductors, which reduce the weight and packaging size of electrical distribution and connection systems. We also have developed proprietary manufacturing process technologies, such as our vertical manufacturing system that features three dimensional wire harness assembly boards. Our expertise in terminals and connectorsconnection system technology facilitates our ability to implement these small gauge and alternative alloy conductors. We have developed advanced capabilities in aluminum terminals and aluminum wire termination, ultra small gauge termination and high voltagehigh-voltage terminals and connectors. We have developed high packaging density in-line connectors and new small gauge terminals that will enable wire gauge reduction and provide our customers with smaller and lower cost solutions. Our high voltage terminals and connectors are a part of our advanced efficiencyIn high-voltage battery connection systems, capabilities, and we have established a leading capability in power density (power per
packaging size) that is being adopted by multiple automotive manufacturers. WeIn addition, we have approximately 650 patents issued or applied for indeveloped highly integrated and highly automated solutions to improve the advanced efficiency systems product technology area.performance of high-voltage batteries. These technologies are supported by our proprietary virtual proving grounds, which is an industry-leading suite of in-house developed tools and processes to significantly reduce the design, development and validation testing time and expense. Our ongoing and accelerating investments in Industry 4.0 technologies, including the automation of wire harness manufacturing, design for automation and digital transformation, will yield future efficiencies and flexibility to our operations.
In high-voltage power distribution products, including BDUs, and low-voltage power distribution products, we have developed many patented or patent pending technologies that enable management of higher power levels and efficient thermal management. Our technology and capabilities were awarded an Automotive News PACE Award for technological excellence in 2021. In addition, we partnered with BASF and General Motors to develop the BDU in the 2022 GMC Hummer EV and won the Society of Plastics Engineers Automotive Innovation Award for the electric and autonomous vehicle systems category in 2023. Our BDU capabilities enable the highest power large-format vehicles by utilizing innovative technologies, including flat-flex wires to quickly dissipate heat. Our product achieves a 20% weight reduction, 32% size reduction and 135% gain in current-carrying capability across 400 volt and 800 volt architectures, as compared to currently available architecture offerings. These technologies are also scalable to achieve superior performance for vehicles with lower power requirements.
In our electronic systems,controllers and other electronic products, we are a market leader in smart junction boxzone control, body domain control and power distribution technology and began production of our Automotive News PACE Award winningAward-winning Solid State Smart Junction Box™BoxTM in 2016. WeFurther, our expertise in e-fuse technology is leading to new power distribution business awards as new architectures are a leader in gateway module technologyadopted and have capabilities to enable our gateway and other electronic control modules to efficiently and securely manage the increasing amount of both wired and wireless signals running throughout, as well as outside of, the vehicle, including being first-to-market with an ethernet-enabled gateway module. In high power electronics, we offer high efficiency battery chargers, which charge vehicles faster, high voltage battery management systems, which optimize battery performance for longer range and faster charging, and highly integrated power modules, which reduce cost, weight and size while reducing time to charge and extending electric vehicle range. Our connectivity technologies include full software capabilities in-house, 5G cellular expertise, vehicle-to-vehicle communications and cybersecurity.
functional safety requirements increase. Software remainsis a critical element of our E-Systemsother electronic products business. Software capabilities are becoming more important in the management of complex and highly sophisticated electricalelectronic architectures. Software within the vehicle is rapidly growing as a key element of technological innovation and a cost effective way to provide new features and functions. We currently employ approximately 900software engineers globally and are pursuing expansion of specialized capabilities in vehicle networking, control algorithms, cybersecurity and connectivity platforms and protocols.
For additional factors that may impact our E-Systems segment’ssegment's business, financial condition, operating results and/or cash flows, see Item 1A, "Risk Factors."
Customers
The top five customers of our E-Systems segment are: Ford, Geely (including Polestar and Volvo), Renault-Nissan, Jaguar Land Rover and Volkswagen.
Competition
Our major competitors in electrical distribution and connection systems include Aptiv PLC, Leoni AG, Molex Incorporated (a subsidiary of Koch Industries Inc.), Sumitomo Corporation, TE Connectivity and Yazaki Corporation. Our major competitors in BDUs include Contemporary Amperex Technology Co. Limited, Delta Electronics, Inc., LG Energy Systems, Ltd., Panasonic Holdings Corporation and Yazaki Corporation. Our major competitors in other electronic products include Aptiv PLC,
Continental AG, Denso Corporation, Harman International Industries, Incorporated (a subsidiary of Samsung Electronics Co. Ltd.), Hella (a subsidiary of Forvia SE), Robert Bosch GmbH, Valeo S.A. and Visteon Corporation.
Sustainability
Sustainability initiatives provide the opportunity to gain competitive advantages. For example, we believe that growing customer and consumer demand for sustainable products provides opportunities for growth, and the more efficient use of energy and natural resources provides the potential to lower our operating costs while reducing our impact on the environment. We are continuously working to embed responsible and sustainable principles into our key business processes and operations, including enterprise risk management, innovation, procurement, product and process development, and sales. Our sustainability strategy and initiatives are developed by a cross-functional team of senior subject matter experts, reviewed and approved by senior management and overseen by the Governance and Sustainability Committee of our Board. We actively communicate our goals and activities to our investors in our public disclosures available on our website and in our SEC filings. Our sustainability efforts demonstrate how we live our core value to Get Results the Right Way, which we have reinforced by recommitting to the United Nations Global Compact each year since becoming a participant in 2020.
Energy Efficiency and Carbon Reduction Efforts at Lear
•How We Are Driving Sustainability in Our Production Processes
We employ standardized processes globally that are designed to drive the efficient use of energy to reduce energy costs and greenhouse gas emissions, prevention of pollution and use of safe and sustainable production processes. We have published carbon reduction goals that we intend to achieve by 2030, including 100% usage of renewable energy for our electricity consumption and a 50% reduction in carbon emissions at our sites globally, as well as an aspiration to be carbon neutral by 2050.
We are implementing a multifaceted approach to achieve these goals. In our internal operations, we are focused in large part on increasing our usage of renewable energy, as well as on efforts to reduce energy consumption and use energy more efficiently. In particular, we have developed, and are implementing, a comprehensive renewable energy strategy which includes the following:
–On-site renewable energy generation at certain sites (we currently have solar arrays operating at 14 sites in Europe, South America and China);
–Virtual power purchase agreements, where viable, to support new renewable energy projects; and
–Purchasing energy attribution certifications from energy providers, whether bundled with existing energy purchases or unbundled in certain regions.
Our operations globally use our Energy Efficiency, Water Usage and Waste Generation Playbooks to promote sustainable practices within our facilities, while at the same time increasing operational efficiency and reducing costs. As an example, leveraging the best practices outlined in our Energy Efficiency Playbook, our global teams completed 170 energy efficiency projects, potentially saving nearly 6 million kWh of energy globally. In addition, our facilities' specifications for new construction and significant building refurbishments require the consideration of more energy efficient systems, such as heating and cooling systems, wherever practicable.
While the foregoing efforts will help us drive toward the elimination of carbon emissions in those areas we directly control (Scope 1 and 2 emissions), we are also progressing toward our longer-term overall goal of carbon neutrality across our value chain (including Scope 3 emissions). In terms of our supply chain, we are communicating our carbon and renewable energy goals, as well as our expectation that our suppliers have, and follow, their own internal policies regarding the conservation and efficient use of natural resources, including energy.
•How We Are Driving Sustainable Products
The automotive industry remains focused on the development of sustainable transportation solutions, particularly in light of the continued focus on climate change and environmental sustainability among governments, non-governmental organizations, consumers and other stakeholders. This focus is increasing the expectations, and in some cases, leading to regulatory requirements, that the automotive industry reduce the carbon emissions generated by vehicles, which is expected to increase the adoption of electric vehicles in the coming years.
Certain of our product offerings are designed to capitalize on these evolving regulatory requirements and consumer preferences, such as electrical distribution and connection systems and BDUs designed for high-voltage applications, providing growth opportunities for our business. Our thermal comfort systems can increase the efficiency of a vehicle's HVAC system and, in turn, potentially facilitate an increased range for electric vehicles. In addition, our lightweight
components and vertical integration capabilities can facilitate weight reductions and other performance efficiencies in our products, in turn enabling lower emissions and increased battery driving range.
Our customers' focus on sustainability is aligned with our efforts to develop products that are more environmentally sustainable. These products include, without limitation, FlexAirTM, our 100% recyclable non-foam alternative, ReNewKnitTM, our sustainable sueded alternative material that is fully recyclable at its end of life and composed of 100% recycled material, and SoyFoamTM, a substitute for certain petroleum-based products.
We are also committed to working with our suppliers and customers to source raw materials, including leather, in a sustainable manner. Our leather operations source cattle hides as a byproduct of the beef industry and are helping to protect forests by working to eliminate purchases of such hides from cattle farms involved in deforestation and forest degradation. Our No Deforestation Policy aligns with industry standards and requires of our suppliers:
–Supply chain transparency, so that all materials supplied to us are from legal sources;
–Land is not clear-cut or burned for production or development; and
–Compliance with governmental laws, regulations and guidelines regarding deforestation.
With respect to the Amazon rainforest, 100% of the direct Brazilian suppliers to our leather operations use georeferencing technology to confirm that their suppliers did not directly buy cattle from farms involved in deforestation, invasion of indigenous and protected areas or other human rights violations. To monitor our suppliers' compliance with these requirements, we may conduct audits or assessments and/or require third-party verification.
Other Sustainability And Governance Initiatives
We are especially proud of our employees’ efforts to support our global communities. Through our Operation GIVE campaign at our Southfield, Michigan headquarters, nearly $1 million in employee contributions benefited local programs focused on economic well-being, education and the environment in 2023. In addition, our teams completed numerous volunteer projects to support the global communities where we live and work.
Our commitment to human rights is set forth in our Human Rights Policy which clearly defines how we approach, govern and defend the dignity of people throughout our operations, our global supply chain and our communities.
Our governance activities help ensure that our business and operations are conducted in compliance with all applicable laws, as well as Lear's policies and procedures, particularly our Code of Business Conduct and Ethics. Our Board and its Audit and Governance and Sustainability Committees oversee our compliance and governance activities. Our expectations related to conducting business in a sustainable and ethical manner extend to our supply base. Suppliers must meet the requirements of our Supplier Sustainability Policy and Global Requirements Manual and Code of Conduct for Suppliers. We monitor and assess their compliance both internally and through the use of a third party.
Human Capital Management
Our human capital management strategy is based on our belief that an important factor in delivering the highest quality products and services is to maintain a work environment that prioritizes safety and fosters collaboration, inclusion, tolerance and respect for our 186,600 employees around the world. Our Board and its People and Compensation Committee oversee this strategy.
As of December 31, 2023 and 2022, our employment levels worldwide were approximately as follows:
| | | | | | | | | | | |
| Region | 2023 | | 2022 |
| United States and Canada | 11,600 | | 10,200 |
| Mexico | 56,400 | | 51,000 |
| Central and South America | 23,700 | | 22,700 |
| Europe and Africa | 68,400 | | 59,000 |
| Asia | 26,500 | | 25,800 |
| Total | 186,600 | | 168,700 |
Our compensation and benefits strategy is designed to be competitive in the countries in which we operate to motivate our employees to perform to the best of their abilities, to achieve our objectives and to align the interests of our employees with the interests of our stakeholders. Our compensation package includes salary and both performance-based and long-term incentive programs, as appropriate for each role. We also provide a multitude of market-competitive benefits, which may include medical, life and disability insurance, contributory retirement savings plan, paid time off, paid parental leave and tuition reimbursement.
A substantial number of our employees are members of industrial trade unions or national trade organizations. We have collective bargaining agreements with several North American unions, including the United Auto Workers, Unifor, International Brotherhood of Electrical Workers and Workers United. In the United States and Canada, each of our unionized facilities has a separate collective bargaining agreement with the union that represents the workers at such facility, with each such agreement having an expiration date that is independent of the other agreements. The majority of our employees in Mexico and Europe are members of industrial trade union organizations or confederations within their respective countries. Many of these organizations and confederations operate under national contracts, which are not specific to any one employer. We have infrequently experienced labor disputes at our plants. We have been able to resolve all such labor disputes and believe that our relations with our employees are generally good.
See Item 1A, "Risk Factors — A significant labor dispute involving us or one or more of our customers or suppliers or that could otherwise affect our operations could adversely affect our financial performance," and Part II — Item 7, "Management's Discussion and Analysis of Financial Condition and Results of Operations — Forward-Looking Statements."
Ethics and Compliance
We are committed to conducting our business with integrity and in compliance with all applicable laws of the cities, states and countries in which we operate, and we have established a Code of Business Conduct and Ethics to assist employees in this regard. In 2022, we updated our Code of Business Conduct and Ethics to include additional or enhanced sections on certain of these topics, as well as on topics such as social media, human rights, and diversity and inclusion. We encourage employees to report concerns through a variety of channels, including a compliance and ethics toll-free number, an online form and a mobile app, each of which allows for anonymous reporting. Our ethics and compliance team reviews every report and, when appropriate, conducts an investigation. We also maintain an Anti-Retaliation Policy such that any employee who reports a concern in good faith is protected from harassment, retaliation or adverse employment consequences.
Health and Safety
Our health and safety programs are designed around global standards with appropriate variations to address the multiple jurisdictions and unique working environments of our manufacturing operations. Our health and safety management system is compliant with the International Organization for Standardization ("ISO") 45001 standard, and we are currently implementing a more comprehensive program which combines ISO 14001 and 45001 requirements to improve efficiency and performance. Each of our locations performs regular safety audits to ensure that proper safety policies are in place and appropriate safety training is provided. In addition, we engage an independent third-party conformity assessment and certification vendor to audit selected operations for adherence to our global health and safety standards.
Our employees also support healthier lifestyles through our Driving Wellness campaign. Local teams around the world plan activities, such as mental health awareness events, first aid training and on-site physical fitness initiatives, that are focused on promoting increased physical, emotional and mental wellness. This program has been expanded globally since its inception in 2022.
Diversity, Equity and Inclusion ("DEI")
We strive to build a culture of diversity, equity and inclusion not only through our human resource policies and practices but also by actively monitoring pay equity and working to eliminate discrimination and harassment in all of its forms. Since 2022, our employees participated in more than 200,000 hours of DEI and anti-harassment training. In addition, our global executives and U.S. managers at our Southfield, Michigan headquarters have completed our Connecting with Others DEI training, which helps our employees identify barriers to inclusion and learn behaviors that both promote inclusion and establish stronger connections. Our Together We Belong program continues to help our employees learn to navigate difficult conversations, support our colleagues and celebrate the many facets of diversity.
In 2021, we introduced Together We Grow, a merit-based program designed to help future leaders from historically underrepresented groups build their careers at Lear. This program provides participants with meaningful development and proactive career management. With an emphasis on engagement and relationship building, this program continues to support our next generation of leaders, maximizing their full potential. We are currently working to expand the program globally.
In 2023, we launched our JumpStart program, attracting mid-career professionals who had previously chosen to pause their careers for a variety of personal reasons. Leveraging our internal referral process, we found participants that were eager to update their skills and, with support, ready to return to full-time employment. During the 12-week program, participants receive custom onboarding, attend professional development and technical training workshops, and are assigned a job coach.
We are also proud of our six employee resource groups, representing 15 countries. Each employee-led resource group is supported by an executive sponsor and is open to all employees, with a goal of fostering a culture where everyone in our
diverse and global workforce feels engaged, accepted and valued. Over the last two years, the employee resource groups have held over 1,300 events, including lunch and learns, trainings, and volunteer and social activities.
Talent, Education and Development
We are committed to the continued development of our employees. In 2023, we delivered more than seven million hours of safety, development, leadership, quality, continuous improvement, lean manufacturing, and ISO and IATF certification training. We offer several professional development and leadership programs in the United States, Europe, Asia, Mexico and South America. Our CEO Academy is our premier leadership development opportunity. Twice per year, a select group of leaders representing diverse functions and backgrounds are invited to participate in a week-long leadership immersion event, during which each participant presents a bold business idea to help drive Lear's success.
Employee Engagement and Culture
Launched in 2017, Together We Win ("TWW") is Lear's global employee engagement program focused on driving cultural change in our operations. Plants advance through four segments — leadership, work environment, employee involvement and team empowerment. TWW unites manufacturing employees across the globe in achieving excellence based on key operations and employee engagement metrics, such as quality, absenteeism, health and safety performance, and operational efficiency. Our approach towards employee engagement has evolved into an employee experience framework based on three main chapters of the employee lifecycle: attract and recruit, learn and grow, and perform and reward.
Champions of Lear celebrates our global operations and our hourly and salaried employees who represent the best-of-the-best in our company. Individuals, teams or plants submit an application which is reviewed by a diverse panel of judges, including Lear leadership. Award categories honor achievements in engagement, customer appreciation, innovation, supply chain, quality, safety, operational excellence, sustainability and continuous improvement.
Customers
In 2020,2023, General Motors, and Ford, twoone of the largest automotive and light truck manufacturers in the world, accounted for 19% and 13%20% of our net sales, respectively.sales. In addition, Ford and Volkswagen each accounted for 11%, and Mercedes-Benz and Stellantis (reflectiveeach accounted for 10%, of our 2023 net sales. Through acquisitions and organic growth, we strive to diversify our customer base to be reflective of the 2021 merger of PSA and Fiat Chrysler) accounted for 11% of our 2020 net sales.evolving regional markets in which we operate. We supply and have expertise in all vehicle segments of the automotive market. Our sales content tends to be higher on those vehicle platforms and segments which offer more features and functionality. The popularity of particular vehicle platforms and segments varies over time and by regional market. We expect to continue to win new business and grow sales at a greater rate than overall automotive industry production. For further information related to our customers and domestic and foreign sales and operations, see Note 15, "Segment Reporting," to the consolidated financial statements included in this Report.
Our customers award business to their suppliers in a number of ways, including the award of complete systems, which allows suppliers either to manufacture components internally or to purchase components from other suppliers at their discretion. Certain of our customers also elect to award certain components directly to component suppliers and independent of the award of the complete system. We have been selectively expandingexpanded certain of our product offerings and component capabilities and investingcontinue to invest in manufacturing capacity in low-cost regions in order to enhance our cost competitive structure and maximizeincrease our vertical integration opportunities and participation in suchour customers' direct component sourcing by our customers.sourcing.
Our customers typically award contracts several years before actual production is scheduled to begin. Each year, the automotive manufacturers introduce new models, update existing models and discontinue certain models and, periodically, even complete brands. In this process, we may be selected as the supplier on a new model, we may continue as the supplier on an updated model or we may lose the business on a new or updated model to a competitor. Our core sales backlog reflects our estimated net sales over the next three years from formally awarded new programs, less lost and discontinued programs. This measure excludes the sales backlog at our non-consolidated joint ventures.ventures and the impact of the wind down of non-core products in our E-Systems business. As of January 2021,2024, our 20212024 to 20232026 sales backlog is $2.8 billion, an increase of 4% as compared to our sales backlog as of January 2020.billion. Our current sales backlog reflects $1.0$1.2 billion related to 20212024, of which 58% and 68% and 32%42% is related to our Seating and E-Systems segments, respectively. In addition, our 20212024 to 20232026 sales backlog at our non-consolidated joint ventures is approximately $400$650 million. Our current sales backlog assumes volumes based on the independent industry projections of IHS MarkitS&P Global Mobility as of December 20202023 and internal estimates, a Euro exchange rate of $1.18/$1.09/Euro and a Chinese RMBrenminbi exchange rate of 6.65/7.15/$. This sales backlog is generally subject to a number of risks and uncertainties, including vehicle production volumes on new and replacement programs and foreign exchange rates, as well as the timing of production launches and changes in customer development plans. For additional information regarding risks that may affect our sales backlog, see Item 1A, "Risk Factors," and Part II — Item 7, "Management’s"Management's Discussion and Analysis of Financial Condition and Results of Operations — Forward-Looking Statements."
We receive purchase orders from our customers that generally provide for the supply of a customer’scustomer's annual requirements for a particular vehicle model and assembly plant, or in some cases, for the supply of a customer’scustomer's requirements for the life of a particular vehicle model, rather than for the purchase of a specified quantity of products. Although most purchase orders may be terminated by our customers at any time, such terminations have been infrequent and have not had a material impact on our
operating results. We are subject to risks that an automotive manufacturer will produce fewer units of a vehicle model than anticipated or that an automotive manufacturer will not award us a replacement program following the life of a vehicle model. To reduce our reliance on any one vehicle model, we produce automotive systems and components for a broad cross-section of both new and established models. However, larger cars and light trucks, as well as vehicle platforms that offer more features and functionality, such as luxury, sport utility and crossover vehicles, typically have more content and, therefore, tend to have a more significant impact on our operating performance. Our net sales for the year ended December 31, 2020,2023, consisted of 31%27% passenger cars, 52%54% crossover and sport utility vehicles and 17%19% trucks and vans.
Our agreements with our major customers generally provide for an annual productivity price reduction. Historically, cost reductions through product design changes, increased manufacturing productivity and similar programs with our suppliers have generally offset these customer-imposed price reduction requirements. However, raw material, energy, commodity, product component and commoditylabor costs can be volatile. Although we have developed and implemented strategies to mitigate the impact of higher raw material, energy and commoditysuch costs, these strategies, together with commercial negotiations with our customers and suppliers, typically offset only a portion of the adverse impact. Certain of these strategies also may limit our opportunities in a declining commodity price environment. In addition, we are exposed to increasing market risk associated with fluctuations in foreign exchange as a result of our low-cost footprint and vertical integration strategies. We use derivative financial instruments to reduce our exposure to fluctuations in foreign exchange rates. For additional information regarding our foreign exchange and commodity price risk, see Part II — Item 7, "Management’s"Management's Discussion and Analysis of Financial Condition and Results of Operations — Liquidity and Financial ConditionCapital Resources — Commodity Prices" and Item 7A, "Quantitative and Qualitative Disclosures about Market Risk — Market Risk Sensitivity — Foreign Exchange" and "— Commodity Prices.Exchange."
Seasonality
Our principal operations are directly related to the automotive industry. Consequently, we may experience seasonal fluctuations to the extent automotive vehicle production slows, such as in the summer months when many customer plants close for holidays and/or model year changeovers, as well as in December when many customer plants close for the holidays and during periods of high vehicle inventory. See Note 17, "Quarterly Financial Data," to the consolidated financial statements included in this Report.holidays.
Raw Materials
The principal raw materials used in our seat systems, electrical distribution and connection systems, BDUs and other electronic systemsproducts are generally available and obtained from multiple suppliers under various types of supply agreements. Components such as seat trim covers, surface materials such as leather and fabric, foam, leather, seat mechanisms, terminalsseat foam, thermal comfort systems such as seat heating, ventilation, active cooling, pneumatic lumbar and connectors,massage products, headrests, connection systems and certain other components are either manufactured by us internally or purchased from multiple suppliers under various types of supply agreements.agreements (certain of which are sourced by our customers and certain of which are sourced by us). The majority of the steel used in our products is comprised of fabricated components that are integrated into a seat system, such as seat frames, recliner mechanisms, seat tracks and other mechanical components. Therefore, our exposure to changes in steel prices is primarily indirect, through these purchased components. With the exception of certain terminals and connectors,connection systems, the materials that we use to manufacture wire harness assemblies are substantially purchased from suppliers, including extruded and insulated wire and cable. The majority of our copper purchases are comprised of extruded wire and cable that we integrate into electrical wire harnesses. In general, our copper purchases, as well as a significant portion of our leather purchases, are subject to price index agreements with our customers and suppliers. We utilize a combination of short-term and long-term supply contracts to purchase key components. We generally retain the right to terminate these agreements if our supplier does not remain competitive in terms of cost, quality, delivery, technology or customer support.
Human Capital Management
As of December 31, 2020 and 2019, our employment levels worldwide were approximately as follows:
| | | | | | | | | | | |
| Region | 2020 | | 2019 |
| United States and Canada | 10,600 | | 10,100 |
| Mexico | 55,200 | | 50,400 |
| Central and South America | 20,900 | | 17,000 |
| Europe and Africa | 56,500 | | 56,800 |
| Asia | 31,400 | | 29,800 |
| Total | 174,600 | | 164,100 |
A substantial number of our employees are members of unions or national trade organizations. We have collective bargaining agreements with several North American unions, including the United Auto Workers, Unifor, International Brotherhood of Electrical Workers and Workers United. Each of our unionized facilities in the United States and Canada has a separate collective bargaining agreement with the union that represents the workers at such facility, with each such agreement having an expiration date that is independent of the other agreements. The majority of our employees in Mexico and Europe are members
of industrial trade union organizations or confederations within their respective countries. Many of these organizations and confederations operate under national contracts, which are not specific to any one employer. We have occasionally experienced labor disputes at our plants. We have been able to resolve all such labor disputes and believe our relations with our employees are generally good.
See Item 1A, "Risk Factors — A significant labor dispute involving us or one or more of our customers or suppliers or that could otherwise affect our operations could adversely affect our financial performance," and Part II — Item 7, "Management’s Discussion and Analysis of Financial Condition and Results of Operations — Forward-Looking Statements."
Compliance and Ethics
We are committed to conducting our business with integrity and in compliance with all applicable laws of the cities, states and countries in which we operate and have established a Code of Business Conduct and Ethics to assist employees in this regard. We encourage employees to report concerns through a variety of channels, including a compliance and ethics line which allows for anonymous reporting. All reports are investigated and resolved. We also maintain an anti-retaliation policy such that any employee who reports a concern in good faith is protected from harassment, retaliation or adverse employment consequences.
Health and Safety
Our health and safety programs are designed around global standards with appropriate variations to address the multiple jurisdictions and unique working environments of our manufacturing operations. We maintain a health and safety management system that is compliant with the ISO 45001 standard. Each of our locations performs regular safety audits to ensure that proper safety policies are in place and appropriate safety training is provided. In addition, we engage an independent third-party conformity assessment and certification vendor to audit selected operations for adherence to our global health and safety standards.
In 2020, in response to the COVID-19 pandemic, we created a Safe Work Playbook, which provides a standardized approach for each of our facilities to create a consistent and safe work environment and offers insights into navigating operational challenges related to the COVID-19 pandemic. The playbook is publicly available and includes health and safety information related to plant operating protocols; employee education, training and feedback; facility assessments; and phased reopening of engineering and administrative centers.
Diversity, Equity and Inclusion
We strive to build a culture of diversity and inclusion through our human resource practices and policies and work to eliminate discrimination and harassment in all of its forms. In 2020, we committed to invest in initiatives that address racial inequality and discrimination. The investment will be a combination of grants to external organizations, as well as internal investments to educate and engage our employees. We formed an Executive Diversity Council to develop a comprehensive diversity, equity and inclusion strategy, prioritize activities and drive accountability and results. Our recently launched Together We Belong campaign will include employee training, virtual events and a global survey to drive awareness and engagement. Additionally, we support employee resource groups, which are employee-led volunteer groups open to all employees with the goal to improve attraction, retention, inclusion and engagement of a diverse and global workforce.
Training and Talent Development
We are committed to the continued development of our employees. Since 2019, we have delivered more than 3.7 million hours of safety, development, leadership, quality, continuous improvement, lean manufacturing and ISO and IATF certification training. In 2020, we launched Leads Self Lite, a leadership development program offered to early to mid-career employees. The program inspires career ownership and growth by leveraging internal leadership development tools and insights. Our Emerging Leaders Development Program is a twelve-month leadership and business course designed to develop high-potential managers and directors. Our CEO Academy is our premier leadership development opportunity. Twice per year, a select group of leaders representing diverse functions and backgrounds are invited to participate in a week-long leadership immersion event, during which each participant presents a bold business idea to help drive Lear’s success. In addition, formal talent reviews and succession planning occur annually – globally and across all business areas. Senior leadership provides annual updates on succession and talent development to the board of directors.
Intellectual Property
Worldwide, we have approximately 2,3002,600 patents and patent applications pending. While we believe that our patent portfolio is a valuable asset, no individual patent or group of patents is critical to the success of our business. We also license selected technologies to automotive manufacturers and to other automotive suppliers. We continually strive to identify and implement new technologies for use in the design and development of our products.
Advanced technology development is conducted worldwide at our nineseven advanced technology centers and at our product engineering centers. At these centers, we engineer our products to comply with applicable safety standards, meet quality and durability standards, respond to environmental conditions and conform to customer and consumer requirements. Our global innovation and technology center located in Southfield, Michigan, develops and integrates new concepts and is our central location for consumer research, benchmarking, craftsmanship and industrial design activity.
We have numerous registered trademarks in the United States and in many foreign countries. The most important of these marks include LEAR CORPORATION® (including our stylized version thereof) and LEAR®, which are widely used in connection with our products and services. Our other principal brands include XEVO®, GUILFORD® and EAGLE OTTAWA®. ConfigurE+TM seating, FlexAirTM non-foam alternative, INTUTM seating, LEAR CONNEXUSTM signal and data communications, EXOTM high-accuracy positioning, JOURNEYWARE® software, ProTec® active head restraints, ReNewKnitTM fabrics, SMART JUNCTION BOXTM technology, SoyFoamTM foam substitute, STRUCSURETM systems AVENTINO® leather and TeXstyleTM fabrics are some of our other trademarks used in connection with certain of our product lines.
Government Regulations and Environmental Matters
We are subject to a variety of federal, state, local and foreign laws and regulations, including those related to health, safety and environmental matters. Costs incurred to comply with these governmental regulations are not material to our capital expenditures, financial performance or competitive position. Additional information about the impact of government regulations on Lear’sour business is included in Item 1A, "Risk Factors," under the heading "Legal and Regulatory Risks."
We are committed to sustainability in our operations and products. We adhere to local, state, federal and foreign laws, regulations and ordinances which govern activities or operations that may have adverse environmental effects. These laws, regulations and ordinances may impose liability for clean-up costs resulting from past spills, disposals or other releases of hazardous wastes. For a description of our outstanding environmental matters and other legal proceedings, see Note 14, "Commitments"Legal and Other Contingencies," to the consolidated financial statements included in this Report.
In addition, our customers are subject to significant environmentally focused state, federal and foreign laws and regulations that regulate vehicle emissions, fuel economy and other matters related to the environmental impact of vehicles. To the extent that such laws and regulations ultimately increase or decrease automotive vehicle production, such laws and regulations would likely impact our business. See Item 1A, "Risk Factors."
Furthermore, we currently offer products with green technology,that advance sustainability, such as ReNewKnitTM, FlexAirTM and SoyFoamTM, and are creating technologies that facilitate environmentally friendly transportation alternatives, such as hybrid and electric vehicles. Our expertise, capabilities and environmental leadership are allowing us to expand our product offerings in this area.
Joint Ventures and Noncontrolling Interests
We form joint ventures in order to gain entry into new markets, expand our product offerings and broaden our customer base. In particular, we believe that certain joint ventures have provided us, and will continue to provide us, with the opportunity to expand our business relationships with Asian automotive manufacturers, particularly in emerging markets. We also partner with companies having significant local experience in commerce and customs, as well as capacity, to reduce our financial risk and enhance our potential for achieving expected financial returns. In some cases, these joint ventures may be located in North America or Europe and used to expand our customer relationships.
As of December 31, 2020,2023, we had thirteensixteen operating joint ventures located in five countries. Of these joint ventures, foursix are consolidated, and nineten are accounted for using the equity method of accounting. ElevenFourteen of the joint ventures operate in Asia, and two operate in North America (both of which are dedicated to serving Asian automotive manufacturers). Net sales of our consolidated joint ventures accounted for approximately 8%7% of our net sales in 2020.2023. As of December 31, 2020,2023, our investments in non-consolidated joint ventures totaled $143$217 million.
A summary of our non-consolidated operating joint ventures, including ownership percentages, is shown below. For further information related to our joint ventures, see Note 6, "Investments in Affiliates and Other Related Party Transactions," to the consolidated financial statements included in this Report.
| | | | | | | | |
| Country | Name | Ownership
Percentage |
| China | Beijing BHAP Lear Automotive Systems Co., Ltd. | 50% |
| China | Beijing Lear Hyundai Transys Co., Ltd. | 50 |
| China | Guangzhou Lear Automotive Components Co., Ltd. | 50 |
| China | Jiangxi Jiangling Lear Interior Systems Co., Ltd. | 50 |
| China | Lear Dongfeng Automotive Seating Co., Ltd. | 50 |
| China | Changchun Lear FAWSN Automotive Seat Systems Co., Ltd. | 49 |
| China | BeijingShenyang Jinbei Lear Hyundai TransysAutomotive Seating Co., Ltd. | 4049 |
| | |
| Honduras | Honduras Electrical Distribution Systems S. de R.L. de C.V. | 49 |
| United States | Kyungshin-Lear Sales and Engineering LLC | 49 |
| India | Hyundai Transys Lear Automotive Private Limited | 35 |
United States | Kyungshin-Lear Sales and Engineering LLC | 49 |
ITEM 1A – RISK FACTORS
Our business, financial condition, operating results and cash flows may be impacted by a number of factors. In addition to the factors affecting our business identified elsewhere in this Report, the material risk factors affecting our operations include the following:
Risks Related to Our Business
•Our industry is cyclical and a decline in the production levels of our major customers, particularly with respect to models for which we are a significant supplier, or the financial distress of one or more of our major customers could adversely affect our financial performance.
Our sales are driven by the number of vehicles produced by our automotive manufacturer customers, which is ultimately dependent on consumer demand for automotive vehicles and the availability of raw materials and components, and our content per vehicle. The automotive industry is cyclical and sensitive to general economic conditions, including the global credit markets, interest rates, consumer credit andinflation, consumer spending levels and preferences.geopolitical issues. Automotive sales and production can also be affected by the age of the vehicle fleet and related scrappage rates, labor relations issues and shortages, fuel prices, regulatory requirements, government initiatives, trade agreements, tariffs and other non-tariff trade barriers, the availability and cost of credit, the availability and cost of critical components needed to complete the production of vehicles, logistics issues, restructuring actions of our customers and suppliers, facility closures and increased competition, as well as consumer preferences regarding vehicle powertrains (including preferences regarding hybrid and electric vehicles), size, configuration and features, including alternative fuel vehicles, changing consumer attitudes toward vehicle ownership and usage, such as ride sharing and on-demand transportation, andamong other factors.
Due to the overall global economic conditions in 2020, largely as a result of the COVID-19 pandemic, the automotive industry experienced a decline in global customer sales and production volumes. In 2020, global vehicle production decreased 17% as compared to 2019. In Asia, vehicle production decreased 12%, including 5% in China and 23% in India. Vehicle production also decreased 20% and 22% in North America and Europe and Africa, respectively. As a result, we have experienced and may continue to experience reductions in orders from our customers in certain regions. An economic downturn or other adverse industry conditions that result in a decline in the production levels of our major customers, particularly with respect to models for which we are a significant supplier, or the financial distress of one or more of our major customers could reduce our sales or otherwise adversely affect our financial condition, operating results and cash flows. Further, our ability to reduce the risks inherent in certain concentrations of business, and thereby maintain our financial performance in the future, will depend, in part, on our ability to continue to diversify our sales on a customer, product, platform and geographic basis to reflect the market overall. We may not be successful in such diversification.
•Pandemics or disease outbreaks, such as COVID-19, have disrupted,Increases in the costs and may continue to disrupt, our business, whichrestrictions on the availability of raw materials, energy, commodities, product components and labor could adversely affect our financial performance.performance.
Pandemics or disease outbreaks,Raw material, energy, commodity, product component and labor costs can be volatile. Although we have developed and implemented strategies to mitigate the impact of such as COVID-19, have disrupted,costs, these strategies, together with commercial negotiations with our customers and may continue to disrupt, the global economy. The COVID-19 pandemic led to a dramatic reduction in economic activity worldwide. International, federal, state and local public health and governmental authorities have taken and may continue to take extraordinary actions to contain and combat the outbreak and spread of COVID-19 throughout most regionssuppliers, do not typically offset all of the world,adverse impact. Certain of these strategies also may limit our opportunities in a declining price environment. In addition, the availability of raw materials, energy, commodities, product components and labor fluctuates from time to time due to factors outside of our control, including travel bans, quarantines, "stay-at-home" orderstrade laws and similar mandates that have caused many individualsrestrictions, natural disasters and other supply chain disruptions, which may impact our ability to substantially restrict their daily activities and many businesses to curtail or cease normal operations.
The automotive industry was particularly negatively impacted bymeet the situation with a sudden and sharp decline in consumer demand and automotive manufacturers suspending or severely limiting automobile production globally during portionsdemands of 2020. In 2020, we experienced, and we may continue to experience, reductions in orders from our customers globally, which in turn adversely affected, and may continue to affect, our financial performance. This reduction in orders may be further exacerbated by a continued global economic downturn resulting from the pandemic, which could decrease consumer demand for vehicles or resultcustomers. Increases in the financial distresscosts of oneraw materials, energy, commodities, product components and labor, or more of our customers or suppliers. As described in more detail under "Our industry is cyclical and a decline inrestrictions on the production levels of our major customers, particularly with respect to models for which we are a significant supplier, or the financial distress of one or more of our major customersavailability thereof, could adversely affect our financial performance" abovecondition, operating results and "Adverse developments affecting or the financial distress of one or more of our suppliers could adversely affect our financial performance" below, decreases in consumer demand for automotive vehicles, declines in the production levels of our major customers, financial distress of one or more of our major customers or suppliers or other adverse developments affecting one or more of our suppliers, could adversely affect our financial performance. In addition, if COVID-19 were to affect a significant amount of the workforce employed or operating at our facilities, we could experience delays or the inability to produce and deliver products to our customers on a timely basis.
Unprecedented industry disruptions related to the COVID-19 pandemic impacted operations in every region of the world. As described in more detail under "Our substantial international operations make us vulnerable to risks associated with doing business in foreign countries" below, our substantial international operations make us vulnerable to risks associated with doing business in foreign countries.
While all of our global manufacturing plants have resumed production, we may experience unexpected delays or obstacles, such as higher employee absenteeism, supply chain disruptions or government mandates, that may hamper our ability to operate our facilities. Further, we may not be able to operate at optimal levels of efficiency given new work rules and procedures implemented to protect our employees. The suspension of production at our manufacturing facilities, or difficulties or inefficiencies in production, would likely adversely impact our future results of operations, financial condition and liquidity, and that impact may be material.
During the COVID-19 pandemic, our reliance on internet technology has increased due to the number of employees working remotely. This reliance has resulted in increased cybersecurity risks, including the risk that we fail to appropriately maintain the security of the data we hold. See "A disruption in our information technology systems, or those of our customers or suppliers, including a disruption related to cybersecurity, could adversely affect our financial performance" below.
As described in more detail under "Our existing indebtedness and the inability to access capital markets could restrict our business activities or our ability to execute our strategic objectives or adversely affect our financial performance" below, the volatility created by COVID-19 could adversely affect our access to the debt and capital markets. In addition, our ability to continue implementing important strategic initiatives and capital expenditures may be reduced as we devote time and other resources to responding to the impacts of the COVID-19 pandemic.
COVID-19 continues to spread in most regions of the world and the extent to which our financial performance will be adversely affected will depend on future developments, which are highly uncertain and cannot be predicted, including, but not limited to, the duration and spread of the pandemic, its severity, the effectiveness of actions to vaccinate populations, contain the virus or treat its impact and how quickly and to what extent normal economic and operating conditions can resume. Even after the COVID-19 pandemic has subsided, we may continue to experience adverse impacts on our business and financial performance as a result of its global economic impact, including a recession that has occurred or may occur in the future, which will likely result in lower demand for new vehicles for a period of time, as new vehicle sales are typically correlated with positive consumer confidence and low unemployment.
The COVID-19 pandemic may also exacerbate other risks disclosed herein, including, but not limited to, our competitiveness, demand for our products and shifting consumer preferences.cash flows.
•The loss of business with respect to, or the lack of commercial success of or an increase in directed component sourcing for a vehicle model for which we are a significant supplier could adversely affect our financial performance.
We receive purchase orders from our customers, which generally provide for the supply of a customer’s annualcustomer's requirements for a particular vehicle model and assembly plant or, in some cases, for the supply of a customer’s requirements for the life of a particular vehicle model,program, rather than for the purchase of a specific quantity of products. In addition, itIt is possible that a particular vehicle model is not successful with consumers or that our customers could elect to manufacture our products internally, purchase our products from other suppliers or increase the extent to which they require us to utilize specific suppliers or materials in the manufacture of our products. The loss of business with respect to, the lack of commercial success of or an increase in directed component sourcing for a vehicle model for which we are a significant supplier could reduce our sales or margins and thereby adversely affect our financial condition, operating results and cash flows.
•Our inability to achieve product cost reductions to offset customer-imposed price reductions could adversely affect our financial performance.
Downward pricing pressure by automotive manufacturers is a characteristic of the automotive industry. Our customer contracts generally provide for annual price reductions over the production life of the vehicle, while requiring us to assume significant responsibility for the design, development and engineering of our products. Prices may also be adjusted on an ongoing basis to reflect changes in product content/costs and other commercial factors. Our financial performance is
largely dependent on our ability to achieve product cost reductions through product design enhancementenhancements and supply chain management, as well as manufacturing efficiencies and restructuring actions. We also seek to enhance our financial performance by investing in product development, design capabilities and new product initiatives that respond to the needs and preferences of our customers and consumers. We continually evaluate operational and strategic alternatives to align our business with the changing needs of our customers and improve our business structure by investing in vertical integration opportunities globally.globally and rationalizing our product portfolio to improve profitability. Our inability to achieve product cost reductions that offset customer-imposed price reductions could adversely affect our financial condition, operating results and cash flows.
•Increases in the costs and restrictions on the availability of raw materials, energy, commodities and product components could adversely affect our financial performance.
Raw material, energy and commodity costs can be volatile. Although we have developed and implemented strategies to mitigate the impact of higher raw material, energy and commodity costs, these strategies, together with commercial negotiations with our customers and suppliers, typically offset only a portion of the adverse impact. Certain of these strategies also may limit our opportunities in a declining commodity environment. In addition, the availability of raw materials, commodities and product components fluctuates from time to time due to factors outside of our control, including trade laws and tariffs. If the costs of raw materials, energy, commodities and product components increase or the availability thereof is restricted, it could adversely affect our financial condition, operating results and cash flows.
•Adverse developments affecting or the financial distress of one or more of our suppliers could adversely affect our financial performance.
We obtain components and other products and services from numerous Tier 2 automotive suppliers and other vendors throughout the world. We are responsible for managing our supply chain, including suppliers that may be the sole sources of products that we require, that our customers direct us to use or that have unique capabilities that would make it difficult and/or expensive to re-source. In certain instances, entire industries may experience short-term capacity constraints. Additionally, our production capacity, and that of our customers and suppliers, may be adversely affected by natural disasters.disasters or other significant disruptions. Any such significant disruption could adversely affect our financial performance. Furthermore, unfavorable economic or industry conditions could result in financial distress within our supply base, thereby increasing the risk of supply disruption. An economic downturn or other unfavorable industry conditions in one or more of the regions in which we operate could cause a supply disruption and thereby adversely affect our financial condition, operating results and cash flows.
•Our substantial international operations make us vulnerable to risks associated with doing business in foreign countries.
As a result of our global presence, a significant portion of our revenues and expenses are denominated in currencies other than the U.S. dollar. We have substantial manufacturing and distribution facilities in many foreign countries, including Mexico and countries in Africa, Asia, Central and South America and Europe. International operations are subject to certain risks inherent in doing business abroad, including:
•exposure to local economic conditions;
•political, economic and civil instability and uncertainty (including acts of terrorism, civil unrest, drug-cartel related and other forms of violence and outbreaks of war);
•labor unrest;
•expropriation and nationalization;
•currency exchange rate fluctuations, currency controls and the ability to economically hedge currencies;
•withholding and other taxes on remittances and other payments by subsidiaries;
•investment restrictions or requirements;
•repatriation restrictions or requirements;
•export and import restrictions and increases in duties and tariffs;
•concerns about human rights, working conditions and other labor rights and conditions and the environmental impact in foreign countries where our products are produced and raw materials and/or components are sourced, as well as changing labor, environmental and other laws in these countries;
•pandemic illness;
•increases in working capital requirements related to long supply chains; and
•global sovereign fiscal matters and creditworthiness, including potential defaults and the related impacts on economic activity, including the possible effects on credit markets, currency values, monetary unions, international treaties and fiscal policies.
Expanding our sales and operations in Asia and our manufacturing operations in lower-cost regions are important elements of our strategy. As a result, our exposure to the risks described above is substantial. The likelihood of such occurrences and their potential effect on us vary from country to country and are unpredictable. However, any such occurrences could adversely affect our financial condition, operating results and cash flows.
•We operate in a highly competitive industry and efforts by our competitors, as well as new non-traditional entrants to the industry, to gain market share could adversely affect our financial performance.
We operate in a highly competitive industry. We and most of our competitors are seeking to expand market share with new and existing customers, including in Asia and other potential high growth regions. Our customers award business based on, among other things, price, quality, service and technology. Our competitors’ efforts to grow market share could exert downward pressure on our product pricing and margins. In addition, the automotive industry has attracted, and will continue to attract, non-traditional entrants as a result of the evolving nature of the automotive vehicle market, including autonomous vehicles, ride sharing and on-demand transportation. Further, the global automotive industry is experiencing a period of significant technological change, including a focus on environmentally sustainable vehicles and subcomponents. As a result, the success of portions of our business requires us to develop, acquire and/or incorporate new technologies and depends not only on our customers' ability to execute their strategies to exploit these technologies but also on the adoption of such technologies by end consumers. Such technologies are subject to rapid obsolescence. Our inability to maintain access to these technologies (through development, acquisition or licensing) may adversely affect our ability to compete. If we are unable to differentiate our products, maintain a low-cost footprint or compete effectively with technology-focused new market entrants, we may lose market share or be forced to reduce prices, thereby lowering our margins. Any such occurrences could adversely affect our financial condition, operating results and cash flows.
•A significant labor dispute involving us or one or more of our customers or suppliers or that could otherwise affect our operations could adversely affect our financial performance.
A substantial number of our employees and the employees of our largest customers and suppliers are members of industrial trade unions and are employed under the terms of various labor agreements. We have labor agreements covering approximately 82,50088,000 employees globally. In the United States and Canada, each of our unionized facilities has a separate collective bargaining agreement with the union that represents the workers at such facility, with each such agreement having an expiration date that is independent of the other agreements. Labor agreements covering approximately 85%86% of our global unionized work force, including labor agreements in the United States and Canada covering approximately 1%2% of our global unionized workforce, are scheduled to expire in 2021.2024. There can be no assurances that these upcoming negotiations or any other future negotiations with the unions will be resolved favorably or that we will not experience a work stoppage or disruption that could adversely affect our financial condition, operating results and cash flows. A labor dispute involving us, any of our customers or suppliers or any other suppliers to our customers or that otherwise affects our operations, or the inability by us, any of our customers or suppliers or any other suppliers to our customers to negotiate, upon the expiration of a labor agreement, an extension of such agreement or a new agreement on satisfactory terms could adversely affect our financial condition, operating results and cash flows. In addition, if any of our significant customers experience a material work stoppage, such as the General Motors labor strike in the fall of 2019, that customer may halt or limit the purchase of our products. This could require us to shut down or significantly reduce production at facilities relating to such products, which could adversely affect our financial condition and operating results.
•Our ability to attract, develop, engage and retain qualified employees could affect our ability to execute our strategy.
Our success depends, in part, on our ability to identify and attract qualified candidates with the requisite education, background and experience, as well as our ability to develop, engage and retain qualified employees. Failure to attract, develop, engage and retain qualified employees, whether as a result of an insufficient number of qualified applicants, difficulty in recruiting new employees or inadequate resources to train, integrate and retain qualified employees, could impair our ability to execute our business strategy and harmcould adversely affect our profitability.business. In addition, while we strive to reduce the impact of the departure of employees, our operations and our ability to execute our business strategy and meet our business objectives may be affected by the loss of employees, particularly when departures involve larger numbers of employees. Higher rates of employee separations may adversely affect us through decreased employee morale, the loss of knowledge of departing employees and the devotion of resources to recruiting and onboarding new employees.
•Our substantial international operations make us vulnerable to risks associated with doing business in foreign countries.
We have substantial international operations, with manufacturing and distribution facilities in many foreign countries, including Mexico and countries in Africa, Asia, Central and South America, and Europe. Some of the markets in which we
do business may have volatile economic and/or political environments. This may expose us to heightened risks as a result of economic, geopolitical or other events, including:
–exposure to local economic conditions;
–political, economic and civil instability and uncertainty (including acts of terrorism, civil unrest, drug cartel-related and other forms of violence, and outbreaks of war, such as the actions taken by Russia in Ukraine);
–labor unrest;
–expropriation, governmental takeover and nationalization;
–currency exchange rate fluctuations, currency controls and the ability to economically hedge currencies;
–withholding and other taxes on remittances and other payments by subsidiaries;
–investment restrictions or requirements;
–repatriation restrictions or requirements;
–trade wars;
–concerns about human rights, working conditions and other labor rights and conditions and the environmental impact in foreign countries where our products are produced and raw materials and/or components are sourced, as well as changing labor, environmental and other laws in these countries;
–pandemic illness;
–increases in working capital requirements related to long supply chains; and
–global sovereign fiscal matters and creditworthiness, including potential defaults and the related impacts on economic activity, including the possible effects on credit markets, currency values, monetary unions, international treaties and fiscal policies.
Expanding our sales and operations in lower-cost regions are important elements of our strategy. As a result, our exposure to the risks described above is substantial. The likelihood of such occurrences and their potential effect on us vary from country to country and are unpredictable. However, any such occurrences could adversely affect our financial condition, operating results and cash flows.
•Certain of our operations are conducted through joint ventures which have unique risks.
Certain of our operations, particularly in emerging markets,Asia, are conducted through joint ventures. With respect to our joint ventures, we may share ownership and management responsibilities with one or more partners that may not share our goals and objectives. Operating a joint venture requires us to operate the business pursuant to the terms of the agreement that we entered into with our partners, includingwhich may require additional organizational formalities, as well as to sharethe sharing of information and decision making. Additional risks associated with joint ventures include one or more partners failing to satisfy contractual obligations, the ability to enforce such obligations, conflicts arising between us and any of our partners, a change in the ownership of any of our partners and less of an ability to control compliance with applicable rules and regulations, including the Foreign Corrupt Practices Act and related rules and regulations. Additionally, our ability to sell our interest in a joint venture may be subject to contractual and other limitations. Accordingly, any such occurrences could adversely affect our financial condition, operating results and cash flows.
•Our failure to execute our strategic objectives could adversely affect our financial performance.
Our financial performance depends, in part, on our ability to successfully execute our strategic objectives. Our strategy is based on four pillars designed to drive growth and profitability: (1) extend our market leadership position in Seating with priceable features; (2) transform our E-Systems business through accelerated growth in connection systems, vehicle architecture evolution and electrification, and the rationalization of our product portfolio to improve profitability; (3) build on our reputation for operational excellence through investment in Industry 4.0 technologies; and (4) prioritize people and the planet through our sustainability initiatives to drive business growth, cost reductions and improved employee retention. Various factors, including the industry environment and the other matters described herein and in Part II — Item 7, "Management's Discussion and Analysis of Financial Condition and Results of Operations," including "— Forward-Looking Statements," could adversely affect our ability to execute our strategic objectives. These risk factors include our failure to identify suitable opportunities for organic investment and/or acquisitions, our inability to successfully develop such opportunities or complete such acquisitions or our inability to successfully utilize or integrate the investments in our
operations. Our failure to execute our strategic objectives could adversely affect our financial condition, operating results and cash flows. Moreover, there can be no assurances that, even if implemented, our strategic objectives will be successful.
•Our inability to effectively manage the timing, quality and costs of new program launches could adversely affect our financial performance.
In connection with the award of new business, we obligate ourselves to deliver new products and services that are subject to our customers’customers' timing, performance and quality standards. Additionally, as a Tier 1 supplier, we must effectively coordinate the activities of numerous suppliers in order for the program launches of our products to be successful. Given the complexity of new program launches, we may experience difficulties managing product quality, timeliness and associated costs. In addition, new program launches require a significant ramp up of costs; however, our sales related to these new programs generally are dependent upon the timing and success of our customers’customers' introduction of new vehicles.
Our inability to effectively manage the timing, quality and costs of these new program launches could adversely affect our financial condition, operating results and cash flows.
•We operate in a highly competitive industry and efforts by our competitors, as well as new non-traditional entrants to the industry, to gain market share could adversely affect our financial performance.
We operate in a highly competitive industry. We and most of our competitors are seeking to expand market share with new and existing customers, including in high growth regions. Our customers award business based on, among other things, price, quality, service and technology. Our competitors' efforts to grow market share could exert downward pressure on our product pricing and margins. In addition, the automotive industry has attracted, and will continue to attract, non-traditional entrants as a result of the evolving nature of the automotive vehicle market, including the increasing adoption of hybrid and electric vehicles. Further, the global automotive industry is experiencing a period of significant technological change, including a focus on environmentally sustainable vehicles and subcomponents. As a result, the success of portions of our business requires us to develop, acquire and/or incorporate new technologies and depends not only on our customers' ability to execute their strategies to exploit these technologies but also on the adoption of such technologies by end consumers. Such technologies may be subject to rapid obsolescence. Our inability to maintain access to these technologies (through development, acquisition or licensing) may adversely affect our ability to compete. If we are unable to differentiate our products, maintain a low-cost footprint or compete effectively with technology-focused new market entrants, we may lose market share or be forced to reduce prices, thereby lowering our margins. Any such occurrences could adversely affect our financial condition, operating results and cash flows.
•If we do not respond appropriately, the evolution of the global transportation industry toward electrification could adversely affect our business.
The global transportation industry is increasingly focused on the development of more fuel-efficient solutions to meet demands from consumers and governments worldwide to address climate change and an increased desire for environmentally sustainable solutions. The impacts of these changes on us are uncertain and could ultimately prove dramatic. If we do not respond appropriately, the evolution toward electrification and other energy sources could adversely affect our business. The increased adoption of electrified and other non-internal combustion-based powertrains, such as fuel cells, may result in lower demand for some of our products. The evolution of the industry toward electrification has also attracted increased competition from entrants outside of the traditional light vehicle industry, some of whom may seek to provide products which compete with ours. Failure to innovate and to develop or acquire new and compelling products that capitalize upon new technologies in response to these evolving consumer preferences and demands could adversely affect our financial condition, operating results and cash flows.
•A disruption in our information technology systems, or those of our customers, suppliers, sub-suppliers or other contract parties, including a disruption related to cybersecurity, could adversely affect our financial performance.
We rely on the accuracy, capacity and security of our information technology networks. Despite the security measures that we have implemented, including those measures related to cybersecurity, our operational systems (including business, financial, accounting, human resources, product development and manufacturing processes), as well as those of our customers, suppliers and other service providers, and certain of our connected vehicle systems and components that may collect and store sensitive end-user data (which could include personally identifiable information) could be breached or damaged by computer viruses, malware, phishing attacks, denial-of-service attacks, human error, natural or man-made incidents or disasters or unauthorized physical or electronic access. These types of incidents have become more prevalent and pervasive across industries, including our industry, and are expected to continue, if not increase, in the future. The secure operation of our information technology networks, and the processing and maintenance of information by these networks, is critical to our operations and strategy. A breach could result in business disruption, including the vehicle
systems and components that we supply to our customers or our plant operations, theft of our intellectual property, trade secrets or customer information or unauthorized access to personal information, such as that of our employees or end consumers of vehicles that contain certain of our connected vehicle systems or components. Although cybersecurity and the continued development and enhancement of our controls, processes and practices designed to protect our operational systems and products from attack, damage or unauthorized access are a high priority for us, our actions and investments may not be deployed quickly enough or successfully protect our systems against all vulnerabilities, including technologies developed to bypass our security measures. In addition, outside parties may attempt to fraudulently induce employees or customers to disclose access credentials or other sensitive information in order to gain access to our secure systems and networks. There are no assurances that our actions and investments to improve the maturity of our systems, processes and risk management framework or remediate vulnerabilities will be sufficient or deployed quickly enough to prevent or limit the impact of any cyber intrusion or security breach. For this reason, we maintain cyber liability insurance to provide additional support during significant events, as well as a level of financial protection in the event of certain cybersecurity-related losses. Moreover, because the techniques used to gain access to or sabotage systems often are not recognized until launched against a target, we may be unable to anticipate the methods necessary to defend against these types of attacks, and we cannot predict the extent, frequency or impact these attacks may have on us. To the extent that our business is interrupted, including the vehicle systems and components that we supply to our customers or our plant operations, or data is lost, destroyed or inappropriately used or disclosed, such disruptions could adversely affect our competitive position, relationships with our customers, financial condition, operating results and cash flows and/or subject us to regulatory actions, including those contemplated by data privacy laws and regulations like the European Union General Data Privacy Regulation and California Consumer Privacy Act, or litigation. In addition, we may be required to incur significant costs to protect against the damage caused by these disruptions or security breaches in the future.
We are also dependent on security measures that some of our customers, suppliers and other third-party service providers take to protect their own systems and infrastructures. Any security breach of any of these third-parties' systems could result in unauthorized access to our or our customers' or suppliers' sensitive data or our own information technology systems, cause us to be non-compliant with applicable laws or regulations, subject us to legal claims or proceedings, disrupt our operations, damage our reputation or cause a loss of confidence in our products or services, any of which could adversely affect our financial performance.
•Pandemics, epidemics, disease outbreaks and other public health crises, such as the COVID-19 pandemic, have disrupted our business and operations, and future public health crises could adversely affect our business, financial condition and operating results.
Pandemics, epidemics or disease outbreaks in the United States or globally, including the COVID-19 pandemic, have disrupted, and may disrupt in the future, our business, which could materially affect our financial condition including liquidity, operating results and future expectations. Any such events may adversely impact our global supply chain and global manufacturing operations and cause us to again suspend our operations. In particular, we could experience among other things: (1) continued or additional global supply disruptions, including component and material shortages; (2) labor disruptions; (3) an inability to manufacture; (4) a decline in consumer demand; and (5) an impaired ability to access credit and capital markets. Any future public health crises, could adversely affect our business, financial condition, operating results and cash flows going forward.
•Perspectives on global climate change and other sustainability matters by various stakeholders could adversely affect our business.
Customer, investor, employee and other stakeholder expectations of us and our supply base in areas such as the environment, social matters and corporate governance continue to evolve. The enhanced stakeholder focus on sustainability requires continuous monitoring of various and evolving standards and their associated requirements, and may result in potentially differing perspectives on these topics among stakeholders. Our failure, or that of our supply base, to adequately meet stakeholder expectations or address stakeholder concerns, including concerns about environmental impacts and similar matters, may result in, among other things, negative sentiment toward us or our products, the loss of business, diluted market valuation, an inability to attract customers or an inability to attract and retain top talent.
•Global climate change could adversely affect our business.
The effects of climate change, such as extreme weather conditions, could impact our business. Such effects could disrupt our operations by, among other things, impacting the availability and cost of materials needed for manufacturing and could increase insurance and other operating costs. These factors may impact our decisions to construct new facilities or maintain existing facilities in areas most prone to physical climate risks, as well as our decisions regarding business strategy, capital allocation and innovation. We could also experience indirect financial risks passed through the supply chain and disruptions that could result in increased prices for our products and the resources needed to produce them.
•Impairment charges relating to our goodwill and long-lived assets could adversely affect our financial performance.
We regularly monitor our goodwill and long-lived assets for impairment indicators. In conducting our goodwill impairment testing, we may first perform a qualitative assessment of whether it is more likely than not that a reporting unit's fair value is less than its carrying amount. If not, no further goodwill impairment testing is required. If it is more likely than not that a reporting unit's fair value is less than its carrying amount, or if we elect not to perform a qualitative assessment of a reporting unit, we then compare the fair value of the reporting unit to the related net book value. If the net book value of a reporting unit exceeds its fair value, an impairment loss is measured and recognized. In conducting our impairment analysis of long-lived assets, we compare the undiscounted cash flows expected to be generated from the long-lived assets to the related net book values. Changes in economic or operating conditions impacting our estimates and assumptions could result in the impairment of our goodwill or long-lived assets. In the event that we determine that our goodwill or long-lived assets are impaired, we may be required to record a significant charge to earnings that could adversely affect our financial condition and operating results.
•Significant changes in discount rates, the actual return on pension assets and other factors related to our global defined benefit plans could adversely affect our financial performance.
Our earnings may be positively or negatively impacted by the amount of income or expense recorded related to our global defined benefit plans. Accounting principles generally accepted in the United States require that income or expense related to the defined benefit plans be calculated at the annual measurement date using actuarial calculations, which reflect certain assumptions. The most significant of these assumptions relate to interest rates, the capital markets and other economic conditions. These assumptions, as well as the actual value of pension assets at the measurement date, will impact the calculation of pension and other postretirement benefit expense for the year. Although pension expense and pension contributions are not directly related, the key economic indicators that affect pension expense also affect the amount of cash that we will contribute to our pension plans. Because interest rates and the values of these pension assets have fluctuated and will continue to fluctuate in response to changing market conditions, pension and other postretirement benefit expense in subsequent periods, the funded status of our pension plans and the future minimum required pension contributions, if any, could adversely affect our financial condition, operating results and cash flows.
•Impairment charges relatingUnanticipated changes in our effective tax rate, the adoption of new tax legislation or exposure to our goodwill and long-lived assetsadditional income tax liabilities could adversely affect our financial performance.profitability.
We regularly monitor our goodwillare subject to income taxes in the United States and long-livednumerous international jurisdictions. Our effective tax rate and cash tax liability in the future could be adversely affected by the enactment of new tax legislation, changes in the level and mix of earnings in countries with differing statutory tax rates, changes in the valuation of deferred tax assets for impairment indicators. In conducting our goodwill impairment testing, we may first perform a qualitative assessment of whether it is more likely than not that a reporting unit’s fair value is less than itsand liabilities, and changes in tax holiday status. The carrying amount. If not, no further goodwill impairment testing is required. If it is more likely than not that a reporting unit’s fair value is less than its carrying amount, or if we elect not to perform a qualitative assessment of a reporting unit, we then compare the fair value of the reporting unit to the related net book value. If the net book value of a reporting unit exceeds its fair value, an impairment loss is measured and recognized. In conducting our impairment analysis of long-liveddeferred tax assets, we compare the undiscounted cash flows expected to be generated from the long-lived assets to the related net book values. Changes in economic or operating conditions impacting our estimates and assumptions could resultwhich are predominantly in the impairment of our goodwill or long-lived assets. In the event that we determine that our goodwill or long-lived assets are impaired, we may be required to record a significant charge to earnings that could adversely affect our financial condition and operating results.
•Our failure to execute our strategic objectives could adversely affect our financial performance.
Our financial performance depends, in part,United Sates, is dependent on our ability to successfully executegenerate future taxable income in the United States. We are also subject to ongoing tax audits globally. These audits can involve complex issues, which may require an extended period of time to resolve and can be highly judgmental. Tax authorities may disagree with certain of our strategic objectives. Our objectives aretax reporting positions and, as a result, assess additional taxes against us. We regularly assess the likely outcomes of these audits to deliver superior long-term stockholder value by investingdetermine the appropriateness of our gross unrecognized tax benefits. The amounts ultimately paid upon resolution of current and future tax audits could be materially different from the amounts previously included in innovationour income tax provision and, therefore, could have a material impact on our income tax provision.
The Organization for Economic Cooperation and Development ("OECD") issued new guidelines, known as "Pillar Two," to drive business growthimplement a 15% global corporate minimum tax to address gaps in current tax laws and profitability, while maintainingensure that large multinational enterprises pay a strong balance sheetminimum level of tax in the countries in which they operate. Countries may implement the OECD Pillar Two model rules as issued, in a modified form or not at all. A number of countries have passed legislation enacting certain parts of the OECD’s Pillar Two framework effective in 2024. As a result of the uncertainty, OECD Pillar Two could have a material impact on our effective tax rate and returning excessresult in higher cash to our stockholders. Various factors, including the industry environment and the other matters described hereintax liabilities depending on which countries enact minimum tax legislation and in Part II — Item 7, "Management’s Discussion and Analysis of Financial Condition and Results of Operations," including "— Forward-Looking Statements," could adversely affect our ability to execute our strategic objectives. These risk factors include our failure to identify suitable opportunities for organic investment and/or acquisitions, our inability to successfully develop such opportunities or complete such acquisitions or our inability to successfully utilize or integrate the investments in our operations. Our failure to execute our strategic objectives could adversely affect our financial condition, operating results and cash flows. Moreover, there can be no assurances that, even if implemented, our strategic objectives will be successful.what manner.
Risks Related to Our Indebtedness
•Our existing indebtedness and the inability to access capital markets could restrict our business activities or our ability to execute our strategic objectives or adversely affect our financial performance.
As of December 31, 2020,2023, we had approximately $2.3$2.7 billion of outstanding indebtedness, as well as $1.75$2.0 billion available for borrowing under our revolving credit facility. As of December 31, 2020,2023, there were no amounts outstanding under our revolving credit facility. The debt instruments governing our indebtedness contain covenants that may restrict our business activities or our ability to execute our strategic objectives, and our failure to comply with these covenants could result in a default under our indebtedness. We also lease certain buildings and equipment under non-cancelable lease agreements with
terms exceeding one year, which are accounted for as operating leases. Additionally, any downgrade in the ratings that rating agencies assign to us and our debt may ultimately impact our access to capital markets. Our inability to generate sufficient cash flow to satisfy our debt and lease obligations, to refinance our debt obligations or to access capital markets on commercially reasonable terms could adversely affect our financial condition, operating results and cash flows.
•Changes affecting the availability of the London Inter-bank Offered Rate ("LIBOR") may have consequences for us that cannot yet be reasonably predicted.
We have outstanding debt with variable interest rates based on LIBOR. Advances under our revolving credit facility and our term loan facility generally bear interest based on (i) the Eurocurrency Rate (as defined in our credit agreement and calculated using LIBOR) or (ii) the ABR (as defined in our credit agreement). The LIBOR benchmark has been the subject of national, international and other regulatory guidance and proposals to reform. In July 2017, the United Kingdom Financial Conduct Authority (the authority that regulates LIBOR) announced that it intends to stop compelling banks to submit rates for the calculation of LIBOR after 2021. These reforms may cause LIBOR to perform differently than it has in the past, and LIBOR may ultimately cease to exist after 2021. Alternative benchmark rates may replace LIBOR and could affect our debt securities, debt payments and receipts. At this time, it is not possible to predict the effect of any changes to LIBOR, any phase out of LIBOR or any establishment of alternative benchmark rates. Any new benchmark rate will likely not replicate LIBOR exactly, which could impact our contracts that terminate after 2021. There is uncertainty about how applicable law and the courts will address the replacement of LIBOR with alternative rates on variable rate retail loan contracts and other contracts that do not include alternative rate fallback provisions. If LIBOR ceases to exist after 2021, the interest rates on our revolving credit facility and our term loan facility will be based on the ABR, which may result in higher interest rates. In addition, any changes to benchmark rates may have an uncertain impact on our cost of funds and our access to the capital markets, which could impact our results of operations and cash flows. Uncertainty as to the nature of such potential changes may also adversely affect the trading market for our securities.
Legal and Regulatory Risks
•A disruption in our information technology systems, or those of our customers or suppliers, including a disruption related to cybersecurity, could adversely affect our financial performance.
We rely on the accuracy, capacity and security of our information technology networks. Despite the security measures that we have implemented, including those measures related to cybersecurity, our operational systems (including business, financial, accounting, human resources, product development and manufacturing processes), as well as those of our customers, suppliers and other service providers, and certain of our connected vehicle systems and components that may collect and store sensitive end-user data (which could include personally identifiable information) could be breached or damaged by computer viruses, malware, phishing attacks, denial-of-service attacks, human error, natural or man-made incidents or disasters or unauthorized physical or electronic access. These types of incidents have become more prevalent and pervasive across industries, including our industry, and are expected to continue in the future. The secure operation of our information technology networks, and the processing and maintenance of information by these networks, is critical to our operations and strategy. A breach could result in business disruption, including the vehicle systems and components that we supply to our customers or our plant operations, theft of our intellectual property, trade secrets or customer information or unauthorized access to personal information, such as that of our employees or end consumers of vehicles that contain certain of our connected vehicle systems or components. Although cybersecurity and the continued development and enhancement of our controls, processes and practices designed to protect our operational systems and products from attack, damage or unauthorized access are a high priority for us, our actions and investments may not be deployed quickly enough or successfully protect our systems against all vulnerabilities, including technologies developed to bypass our security measures. In addition, outside parties may attempt to fraudulently induce employees or customers to disclose access credentials or other sensitive information in order to gain access to our secure systems and networks. There are no assurances that our actions and investments to improve the maturity of our systems, processes and risk management framework or remediate vulnerabilities will be sufficient or deployed quickly enough to prevent or limit the impact of any cyber intrusion or security breach. Moreover, because the techniques used to gain access to or sabotage systems often are not recognized until launched against a target, we may be unable to anticipate the methods necessary to defend against these types of attacks, and we cannot predict the extent, frequency or impact these attacks may have on us. To the extent that our business is interrupted, including the vehicle systems and components that we supply to our customers or our plant operations, or data is lost, destroyed or inappropriately used or disclosed, such disruptions could adversely affect our competitive position, relationships with our customers, financial condition, operating results and cash flows and/or subject us to regulatory actions, including those contemplated by data privacy laws and regulations like the European Union General Data Privacy Regulation and California Consumer Privacy Act, or litigation. In addition, we may be required to incur significant costs to protect against the damage caused by these disruptions or security breaches in the future.
We are also dependent on security measures that some of our customers, suppliers and other third-party service providers take to protect their own systems and infrastructures. Any security breach of any of these third-parties' systems could result in unauthorized access to our or our customers’ or suppliers' sensitive data or our own information technology systems, cause us to be non-compliant with applicable laws or regulations, subject us to legal claims or proceedings, disrupt our
operations, damage our reputation or cause a loss of confidence in our products or services, any of which could adversely affect our financial performance.
•A significant product liability lawsuit, warranty claim or product recall involving us or one of our major customers could adversely affect our financial performance.
In the event that our products fail to perform as expected, regardless of fault, and such failure results in, or is alleged to result in, bodily injury and/or property damage or other losses, we may be subject to product liability lawsuits and other claims or weclaims. Our customers may be required or requested by our customers to participate in a recall or other corrective action involving such products. We also are a party to agreements with certain of our customers, whereby these customers may pursue claims against us for contribution of all or a portion of the amounts sought in connection with product liability, warranty and warranty claims.recall claims related to our products. We carry insurance for certain product liability claims, but such coverage may be limited. We do not maintain insurance for product warranty or recall matters. In addition, we may not be successful in recovering amounts from third parties, including sub-suppliers, in connection with these claims. These types of claims could adversely affect our financial condition, operating results and cash flows.
•We are involved from time to time in various legal and regulatory proceedings and claims, which could adversely affect our financial performance.
We are involved in various legal and regulatory proceedings and claims that, from time to time, are significant. These are typically claims that arise in the normal course of business, including, without limitation, commercial or contractual disputes, including disputes with our customers, suppliers or competitors, intellectual property matters, personal injury claims, environmental matters, tax matters, employment matters and antitrust matters. No assurances can be given that such proceedings and claims will not adversely affect our financial condition, operating results and cash flows.
•The continuing focus on human rights and environmental laws and regulations, as well as related customer requirements, globally could cause us to incur significant costs.
Concerns over human rights, environmental pollution and climate change have produced significant legislative and regulatory efforts globally. In addition, our customers have imposed various requirements on their suppliers, including us, in response to these concerns. We expect that these regulatory and customer requirements will continue to increase in number and breadth of scope for the foreseeable future, thereby affecting our business. Complying with these requirements will likely require us to incur costs, make investments in new innovations and/or change product and production processes, certain of which could be significant. If we fail to comply with these requirements, we could be subject to lost business opportunities and/or future liabilities, which could adversely affect our reputation, business, financial condition, operating results and cash flows.
•New laws or regulations or changes in existing laws or regulations could adversely affect our financial performance.
We and the automotive industry are subject to a variety of federal, state, local and foreign laws and regulations, including those related to health, safety and, environmentalincreasingly, sustainability matters. Governmental regulations also affect taxes and levies, capital markets, healthcare costs, energy usage, data privacy, international trade and immigration, human rights and other labor issues (including labor costs), all of which may have a direct or indirect effect on our business and the businesses of our customers and suppliers. We cannot predict the substance or impact of pending or future legislation or regulations, or the application thereof. The introduction of new laws or regulations or changes in existing laws or regulations, or the interpretation thereof, could increase the costs of doing business for us or our customers or suppliers or restrict our actions and adversely affect our financial condition, operating results and cash flows.
•We are subjectmay incur fines or penalties, damage to regulation of our international operations that could adversely affectreputation or other adverse consequences if our financial performance.employees, suppliers, sub-suppliers or other contract parties, agents or business partners violate anti-bribery, competition, export and import, trade sanctions, data privacy, environmental, human rights or other laws.
We are subject to manyregulation under a wide variety of U.S. federal and state and non-U.S. laws, governing our international operations, such as those that pertainregulations and policies, including laws related to anti-corruption, human rights, anti-bribery, export and import compliance, trade sanctions, data privacy, anti-trust and money laundering, due to our domestic and global operations. In particular, the U.S. Foreign Corrupt Practices Act, the U.K. Bribery Act and similar anti-bribery laws in other jurisdictions generally prohibit companies and their intermediaries from making improper payments to government officials and restrict where we can dofor the purpose of obtaining or retaining business, and what informationwe operate in many parts of the world that have experienced government corruption to some degree. We cannot provide assurance our internal controls will always protect us from the improper conduct of our employees,
suppliers, sub-suppliers or products we can supply to or purchase from certain countries or thirdother contract parties, including but not limited to the Foreign Corrupt Practices Actagents and the U.S. Export Administration Act.business partners. Violations of these laws, which are complex, may conflict with laws of other jurisdictions and often are difficult to interpret and apply, could resultsubject us to civil or criminal investigations in significant fines,the United States and other jurisdictions, could lead to substantial civil or criminal, monetary and non-monetary penalties or sanctions thatand related stockholder lawsuits, could adversely affectlead to increased costs of compliance and could damage our reputation, business, financial condition, operating results and cash flows.
•We are required to comply with environmental laws and regulations that could cause us to incur significant costs.
Our manufacturing facilities are subject to numerous laws and regulations designed to protect the environment, and we expect that additional requirements with respect to environmental matters will be imposed on us and our customers in the future. Material future expenditures may be necessary if compliance standards change or material unknown conditions that require remediation are discovered. Environmental laws could also restrict our ability to expand our facilities or could require us to acquire costly equipment or to incur other significant expenses in connection with our business. If we fail to comply with present and future environmental laws and regulations, we could be subject to future liabilities, which could adversely affect our financial condition, operating results and cash flows.
•Developments or assertions by or against us relating to intellectual property rights could adversely affect our financial performance.
We own significant intellectual property, including a large number of patents, trademarks, copyrights and trade secrets, and we are involved in numerous licensing arrangements. Our intellectual property plays an important role in maintaining our competitive position in a number of the markets that we serve. Developments or assertions by or against us relating to intellectual property rights could adversely affect our financial condition, operating results and cash flows.
•Changes in U.S. administrative policy,International trade policies, including changes to existingprotectionist trade agreementspolicies, such as tariffs and any resulting changes in international relations,sanctions, could adversely affect our financial performance.
As a resultBecause of the interconnectedness of the global economy, policy changes to U.S. administrative policy, among other possible changes, there may bein one area of the world can have an immediate and material adverse impact on markets around the world. Changes in international trade policies, including: (i) changes in policies pertaining to the environment; (ii) changes to existing trade agreements; (iii) greater restrictions on free trade generally; and (iv) significant increases in customs duties and tariffs on goods imported into the United States. The United States, Mexicocan adversely affect our financial condition and Canada signed a new trade agreement, theoperating results.
The United States-Mexico-Canada Agreement ("USMCA"), which serves as the successor agreement to the North American Free Trade Agreement, ("NAFTA"). The USMCA became effective on July 1, 2020. There can be no assurance that the ongoing transition from NAFTA to the higher North American automotive content requirements in the USMCA will not adversely affect our business. The United States still maintains significant tariffs on most imports from China.In addition, China presents unique risks to U.S. automotive manufacturers due to the strain in U.S.-China relations, China’s unique regulatory landscape and the level of integration with key components in our global supply chain. It remains unclear what specific actions the newcurrent U.S. administration may take to resolve trade-related issues with China and other countries. A trade war,
Further, the U.S. government, other governmental action related togovernments and international organizations could impose additional tariffs, sanctions or international trade agreements, changesexport controls that could restrict us from doing business directly or indirectly in U.S. social, political, regulatoryor with certain countries or parties, which could include affiliates. Any of the above could impact our supply chain, as well as our operations, and economic conditions or in laws and policies governing foreign trade, manufacturing, development and investment in the territories and countries where we currently manufacture and sell products or any resulting negative sentiments towards the United States could adversely affect our business, financial condition and operating results and cash flows.
•Changes in the United Kingdom's economic and other relationships with the European Union could adversely affect us.
In December 2020, the United Kingdom finalized a free trade agreement with the European Union, the EU-UK Trade and Cooperation Agreement ("TCA"), to manage future bilateral trade and formally completed its withdrawal from the European Union. Thus, effective January 1, 2021, trade between the European Union and the United Kingdom is now subject to border controls and imported goods must meet bilateral content rules as set out in the TCA to qualify for duty-free trade.
We have significant operations in both the European Union and the United Kingdom. In 2020, our European Union (excluding the United Kingdom) and United Kingdom sales totaled $4.5 billion and $0.6 billion, respectively. Our supply chain and that of our customers are highly integrated across the European Union and the United Kingdom, and we are highly dependent on the free flow of goods in those regions. We have implemented procedures to manage our supply chains with the new border controls and to comply with the TCA’s bilateral content rules. However, there can be no assurance that the new border controls and content rules will not adversely impact our competitive position, supplier and customer relationships and financial performance.results.
ITEM 1B – UNRESOLVED STAFF COMMENTS
None.
ITEM 1C – CYBERSECURITY
Risk Management and Strategy
We have implemented and maintain multiple layers of physical, administrative and technical security processes designed to protect our manufacturing facilities from disruptions that may result from cybersecurity incidents, as well as safeguard the confidentiality of our critical systems, and data residing on those systems, including employee data, customer data and intellectual property. Our risk assessment and management of material risks from cybersecurity threats is integrated into our overall enterprise risk management process, as well as our information systems processes. Our strategy includes regular formal risk assessments, dynamic risk and threat analysis, utilization of security tools, regular cybersecurity-related tabletop and phishing exercises designed to simulate cybersecurity incidents, and frequent security awareness and technical security trainings. We conduct periodic internal and third-party assessments to evaluate our cybersecurity posture and test and assess our incident response program, incident roles and responsibilities, material impact evaluation, and decision-making processes in the event of a cybersecurity incident. We use our risk and security assessments to enhance our information security capabilities. We also have an internal employee network of hundreds of security awareness ambassadors from diverse functions throughout our global locations who inform our personnel concerning threat awareness and cybersecurity risk mitigation.
Depending on the environment, we implement and maintain various technical, physical and organizational measures, processes, standards and policies designed to manage and mitigate material risks from cybersecurity threats to our information systems and data, including an incident response policy, plan, procedures and scenario-based playbooks, an incident detection and response program, a vulnerability management program, disaster recovery and business continuity plans, risk assessment processes, security standards, network security controls, access controls, systems monitoring, employee awareness training and cybersecurity insurance. We have obtained Trusted Information Security Assessment Exchange (TISAX) certification labels at multiple global locations.
Our internal information security team oversees and works collaboratively with various information security service providers. Our cybersecurity program incorporates external guidance and expertise through the use of third-party service providers to assist in the identification, assessment and management of risks specific to cybersecurity threats, including vendors providing threat intelligence, risk mitigation, dark web monitoring, external scanning and scoring, threat and reputation monitoring, forensics, cyber-insurance, advisory services and legal counsel. We use a managed security service provider to augment our internal information security team and to provide additional monitoring capabilities. We also have a vendor management program addressing cybersecurity risk associated with application providers, hosting services and information technology support services we may retain. This program includes security questionnaires, review of vendor security programs, review of security assessments and assurance reports, vulnerability scans, and direct inquiries and collaboration with our vendors’ security personnel. Our vendor management process involves different levels of assessment depending on the services provided by the vendor, the sensitivity of the related information systems and data, and the identity of the provider. It is designed to help identify cybersecurity risks associated with a provider and impose contractual obligations related to cybersecurity on the provider.
We have an incident response plan that includes scenario-based playbooks for managing cybersecurity incidents and associated crisis communication procedures designed to facilitate coordination across the Company and with our partners, customers, the public and others.
For the year ended December 31, 2023, there have been no risks from cybersecurity threats that have materially affected or are reasonably likely to materially affect our business strategy, results of operations or financial condition. For a description of risks related to our information technology systems, including cybersecurity threats, see Item 1A, "Risk Factors."
In addition, we have product cybersecurity risk assessment and management processes in place within our E-Systems business, where our products are more susceptible to cybersecurity threats, that align our internal policies, standards and development practices with customer requirements and industry standards, including the International Organization for Standardization ("ISO") 21434 control framework specific to road vehicle cybersecurity engineering. We received our ISO 21434 Road Vehicle Cybersecurity Engineering certification in 2023.
Governance
Our Board of Directors (the "Board") addresses our cybersecurity risk management as part of its general oversight function. The Audit Committee of the Board (the "Audit Committee") is responsible for overseeing our cybersecurity risk management processes, including our assessment and mitigation of material risks from cybersecurity threats. The Audit Committee receives regular reports, summaries or presentations related to cybersecurity threats, risk, mitigation and related processes from the Chief Information Officer ("CIO") and Chief Information Security Officer ("CISO"). In addition, on at least an annual basis, the Board receives reports, summaries or presentations related to cybersecurity threats, risk, mitigation and related processes.
Our cybersecurity risk assessment and management processes are implemented and maintained by our CIO and CISO, who are supported by other members of management, as necessary. Our CIO and CISO are responsible for approving budgets,
cybersecurity incident preparedness, approving cybersecurity processes, reviewing security assessments and other security-related reports, and providing the Chief Financial Officer ("CFO") with regular updates on cybersecurity-related matters. Our CIO has served in this role for three years and has more than 28 years of relevant experience, including previous roles as the CIO for two companies and the divisional information technology leader for two companies. Our CISO, who reports to the CIO, has served in this role for two years and has more than 28 years of relevant experience, including a focus on information security and cybersecurity for the last 15 years. Our CISO was previously the CISO for another automotive supplier. In addition, our CISO is very engaged in the cybersecurity community through current and past involvement with organizations such as the chair of General Motors Supplier Automotive Community and a member of Automotive Information Sharing and Analysis Center, Michigan Infragard, Domestic Security Alliance Council and the European Association of Automotive Suppliers cybersecurity workgroup. In addition, we have an information security team comprised of dozens of employees dedicated to cybersecurity with extensive experience and relevant certifications. The CIO and CISO are responsible for hiring appropriate personnel, assisting with the integration of cybersecurity risk considerations into our overall risk management strategy, communicating key priorities to relevant personnel, and mitigating and remediating in the event of a cybersecurity incident. Our product cybersecurity risk assessment and management processes are implemented and maintained by E-Systems management, including the Division President; Vice President of Global Strategy, Product Management and Electronics Engineering; and Vice President of Product Integrity and Technology. Our product security team within our E-Systems business consists of a team of employees dedicated to product cybersecurity engineering.
Our cybersecurity incident response and vulnerability management programs are designed to escalate certain cybersecurity incidents to various levels of management depending on the circumstances, including our CIO, CISO, General Counsel, Division Presidents, CFO and/or Chief Executive Officer (collectively, "Senior Management") and, in the instance of product cybersecurity, our E-Systems Safety Committee. Senior Management works with our incident response team to help mitigate and remediate certain escalated cybersecurity incidents. In addition, our incident response and vulnerability management programs include reporting certain cybersecurity incidents to the Audit Committee and, in certain circumstances, to the Board.
ITEM 2 – PROPERTIES
As of December 31, 2020,2023, our operations were conducted through 251 facilities, some of which are used for multiple purposes, including 78properties include just-in-time manufacturing facilities, 127 dedicated component manufacturing facilities, 5 sequencing and distribution sites, 32and dedicated administrative/technical support facilities in 38 countries. A summary of these properties by operating segment and 9by region is shown below:
| | | | | | | | | | | | | | | | | | | | | | | | | | | | | |
| North America | | Europe and Africa | | Asia | | South America | | Total |
| Seating | 62 | | 75 | | 41 | | 10 | | 188 |
| E-Systems | 17 | | 26 | | 17 | | 4 | | 64 |
| 79 | | 101 | | 58 | | 14 | | 252 |
In addition, we have 13 general administrative/technical support facilities. Our properties include seven advanced technology centers in 38 countries. Our(one at our corporate headquarters is located in Southfield, Michigan.Michigan, one additional in North America, two in Europe and three in Asia). Of our 265 total properties, 96 are owned and 169 are leased.
| | | | | | | | | | | | | | | | | |
Seating |
Argentina | Czech Republic | Indonesia | Mexico (continued) | Romania | United Kingdom |
Escobar, BA | Kolin | Cikarang | Nuevo Casas | Iasi | Alfreton |
Ferreyra, CBA | Stribro | Italy | Grandes, CH | Russia | Coventry |
Belgium | Dominican Republic | Caivano, NA | Queretaro, QE | Kaluga | Redditch |
Brussels | Santo Domingo | Cassino, FR | Panzacola, TL | Nizhny Novgorod | Sunderland |
Brazil | France | Grugliasco, TO | Piedras Negras, CO | Slovak Republic | United States |
Betim | Feignies | Melfi, PZ | Ramos Arizpe, CO | Presov | Columbia City, IN |
Caçapava | Herblay | Pozzo d’Adda, MI | Saltillo, CO | Voderady | Detroit, MI |
Joinville | Jarney | Macedonia | San Felipe, GU | South Africa | Duncan, SC |
Pernambuco | Roche La Moliere | Tetovo | San Luis Potosi, SL | East London | Farwell, MI |
São Bernardo | Germany | Malaysia | Silao, GO | Port Elizabeth | Flint, MI |
Canada | Besigheim | Behrang Stesen | Toluca, MX | South Korea | Grand Prairie, TX |
Ajax, ON | Bremen | Mexico | Villa Ahumada, CH | Gyeongju | Grand Rapids, MI |
China | Eisenach | Arteaga, CA | Moldova | Spain | Hammond, IN |
Beijing | Ginsheim- | Ascension, CH | Ungheni | Barcelona | Hebron, OH |
Boading | Gustavsburg | Cuautlancingo, PU | Morocco | Burgos | Kenansville, NC |
Changshu | Rietberg | Fresnillo, ZA | Kenitra | Epila | Louisville, KY |
Chongqing | Hungary | Hermosillo, SO | Tangier | Martorell | Montgomery, AL |
Hangzhou | Györ | Huamantla, TL | Poland | O Porrino | Morristown, TN |
Liuzhou | Szolnok | Juarez, CH | Bierun | Valencia | Pine Grove, PA |
Pinghu | India | Leon, GT | Jaroslaw | Vigo | Roscommon, MI |
Rui’an | Chennai | Meoqui, CH | Legnica | Vitoria | Selma, AL |
Shanghai | Haridwar | Mexico City, DF | Tychy | Thailand | Tuscaloosa, AL |
Shenyang | Nasik | Monclova, CO | Portugal | Mueang Nakhon | Wentzville, MO |
Wuhan | Pune | Naucalpan de | Mangualde | Ratchasima | Vietnam |
Wuhu | Tijara | Juarez, MX | Valenca | Rayong | Hai Phong City |
Yangzhou | | | | | |
| | | | | |
E-Systems |
Argentina | China (continued) | Germany | Mexico | Poland | Spain |
Pacheco, BA | Chongqing | Bersenbrueck | Apodaca, NL | Mielec | Almussafes |
San Francisco, | KunShan HuaQiao | Kronach | Chihuahua, CH | Romania | Valls |
CBA | Shanghai | Puttlingen | Juarez, CH | Campulung | Thailand |
Brazil | SuiNing | Wismar | Torreon, CA | Pitesti | Kabin Buri |
Camanducaia | TianJin | Honduras | Morocco | Serbia | United States |
Navegantes | Wuhan | Naco | Kenitra | Novi Sad | Bellevue, WA |
China | Yangzhou | Hungary | Salé Al-Jadida | South Africa | Plymouth, IN |
Changchun | Czech Republic | Gödöllö | Tangier | Port Elizabeth | Traverse City, MI |
| Vyskov | Japan | Philippines | | |
| | Tokyo | Lapu-Lapu City | | |
|
Administrative/Technical |
Belgium | France | India | Japan (continued) | Philippines | United Kingdom |
Leuven | Vélizy- | Pune | Tokyo | Lapu-Lapu City | Coventry |
Brazil | Villacoublay | Israel | Yokohama | Singapore | United States |
São Paulo | Germany | Tel Aviv | Malaysia | South Korea | Ann Arbor, MI |
China | Cologne | Italy | Klang | Seoul | El Paso, TX |
Shanghai | Korntal- | Grugliasco, TO | Mexico | Spain | Rochester Hills, MI |
Czech Republic | Münchingen | Japan | Juarez, CH | Valls | Southfield, MI |
Brno | Remscheid | Hiroshima | Netherlands | Sweden | Sparta, MI |
Pilsen | Schwaig-Oberding | Kariya | Hilversum | Gothenburg | Wilmington, NC |
| Sindelfingen | Nagoya | | Thailand | |
| Wolfsburg | | | Bangkok | |
| | | | | |
| | | | | |
ITEM 3 – LEGAL PROCEEDINGS
Legal and Environmental Matters
We are involved from time to time in various legal proceedings and claims, including, without limitation, commercial or contractual disputes, product liability claims, and environmental and other matters. For a description of risks related to various legal proceedings and claims, see Item 1A, "Risk Factors." For a description of our outstanding material legal proceedings, see Note 14, "Commitments"Legal and Other Contingencies," to the consolidated financial statements included in this Report.
ITEM 4 – MINE SAFETY DISCLOSURES
None.Not applicable.
SUPPLEMENTARY ITEM – INFORMATION ABOUT OUR EXECUTIVE OFFICERS
The following table sets forth the names, ages and positions of our executive officers. Executive officers are appointed annually by our Board of Directors (the "Board") and serve at the pleasure of our Board.
| | | | | | | | |
| Name | Age | Position |
Shari L. Burgess | 62 | Vice President and Treasurer |
| Jason M. Cardew | 5053 | Senior Vice President and Chief Financial Officer |
| Alicia J. Davis | 50 | Senior Vice President, Corporate Development and Investor Relations |
Thomas A. DiDonato | 6253 | Senior Vice President and Chief AdministrativeStrategy Officer |
| Amy A. Doyle | 5356 | Vice President and Chief Accounting Officer |
| Carl A. Esposito | 5356 | Senior Vice President and President, E-Systems |
| Harry A. Kemp | 4548 | Senior Vice President, Chief Administrative Officer and General Counsel and Corporate Secretary |
| Frank C. Orsini | 4851 | Executive Vice President and President, Seating |
| Raymond E. Scott | 5558 | President and Chief Executive Officer |
| Marianne Vidershain | 44 | Vice President and Treasurer |
Set forth below is a description of the business experience of each of our executive officers.
| | | | | |
Shari L. Burgess | Ms. Burgess is the Company’s Vice President and Treasurer, a position she has held since August 2002. Ms. Burgess previously served as the Company’s Vice President, Treasurer and Chief Diversity Officer from January 2014 to May 2018 and in various financial roles since joining the Company in 1992. Prior to joining the Company, Ms. Burgess served as the corporate controller for Victor International Corporation and as an audit manager for Ernst & Young LLP. |
| |
| Jason M. Cardew | Mr. Cardew is the Company’sCompany's Senior Vice President and Chief Financial Officer, a position he has held since November 2019. Mr. Cardew most recently served as the Company's Vice President, Finance - Seating and E-Systems since September 2018. Prior to that, he served as the Company's Vice President, Finance - Seating since April 2012. Previously, he served as the Company's Vice President and Interim Chief Financial Officer since September 2011, Vice President, Finance - Financial Planning and Analysis since April 2010, Vice President, Finance - Seating since 2008, Vice President - Finance since 2003 and in various financial roles since joining the Company in 1992. |
| |
| Alicia J. Davis | Ms. Davis is the Company's Senior Vice President and Chief Strategy Officer, a position she has held since May 2021. Ms. Davis most recently served as the Company's Senior Vice President, Corporate Development and Investor Relations a position she has held since September 2019. Ms. Davis most recentlyPrior to that, she served as the Company's Vice President, Investor Relations since joining the Company in August 2018. Prior to joining the Company, Ms. Davis was on the faculty at the University of Michigan Law School since June 2004, where she most recently served as an unpaid, tenured professora Professor and the Associate Dean for Strategic Initiatives. Ms. Davis continues to teach at the University of Michigan Law School as a Professor from Practice. Previous to that, she was a lawyer at Kirkland & Ellis since June 2002, a Vice President at Raymond James & Associates since August 1999 and an Investment Banking Analyst at Goldman Sachs from August 1993 to June 1995. |
| |
| | | | | |
Thomas A. DiDonato | Mr. DiDonato is the Company’s Senior Vice President and Chief Administrative Officer, a position he has held since January 2019. Mr. DiDonato most recently served as the Company's Senior Vice President, Human Resources since joining the Company in April 2012. Prior to joining the Company, Mr. DiDonato served as Executive Vice President, Human Resources for American Eagle Outfitters, Inc. since 2005, Chief People Officer for H.J. Heinz from April 2004 to July 2005 and Senior Vice President, Human Resources for Heinz North America from July 2001 to April 2004. Earlier experiences include directing human resources for a $14 billion division of Merck & Co. and heading worldwide staffing for Pepsico. Mr. DiDonato began his career at General Foods Corporation and moved up to manage the personnel at its largest manufacturing facility. |
| |
| Amy A. Doyle | Ms. Doyle is the Company’sCompany's Vice President and Chief Accounting Officer, a position she has held since May 2017. Ms. Doyle most recently served as the Company’sCompany's Assistant Corporate Controller since September 2006. Previously, she served in positions of increasing responsibility at the Company, including Director, Financial Reporting since 2003 and Manager, Financial Reporting since joining the Company in 1999. Prior to joining the Company, Ms. Doyle served as an audit manager for Arthur Andersen LLP. |
| |
| Carl A. Esposito | Mr. Esposito is the Company’sCompany's Senior Vice President and President, E-Systems, a position he has held since joining the Company in September 2019. Prior to joining the Company, Mr. Esposito served at Honeywell Aerospace, a division of Honeywell International Inc., as President of the Electronic Solutions Strategic Business Unit from January 2017 to July 2019 and at Honeywell International Inc. as Vice President of Aerospace Marketing, Product Management and Strategy since December 2010, Vice President of Avionics Systems Marketing and Product Management since December 2009, Vice President of Global Business Aviation Sales and EMEAI Customer Support since January 2007 and in various other roles since 1990. |
| |
| | | | | |
| Harry A. Kemp | Mr. Kemp is the Company's Senior Vice President, Chief Administrative Officer and General Counsel, a position he has held since January 2023. In this role, Mr. Kemp has responsibility for the Company's Compliance and Environmental, Social and Governance activities. Mr. Kemp most recently served as the Company's Senior Vice President, General Counsel and Corporate Secretary a position he has held since August 2019. In this role,Prior to that, Mr. Kemp has responsibility for the Company’s Compliance and Environmental, Social and Governance activities. Mr. Kemp most recently served as the Company's Vice President and Corporate Counsel since January 2019. Previously, he served as the Company's Vice President and Divisional Counsel - Seating since September 2016 and Vice President and Divisional Counsel - E-Systems since joining the Company in December 2009. Prior to joining the Company, Mr. Kemp was a partner at Bodman PLC since 2003 and served as an engagement manager at McKinsey and Company, a global management consulting firm, since 2000. |
| |
| Frank C. Orsini | Mr. Orsini is the Company’sCompany's Executive Vice President and President, Seating, a position he has held since March 2018. Mr. Orsini most recently served as the Company’sCompany's Senior Vice President and President, E-Systems since September 2012. Prior to that, he served as the Company's Vice President and Interim President, E-Systems since October 2011. Previously, he served as the Company’sCompany's Vice President, Operations, E-Systems since 2009, Vice President, Sales, Program Management & Manufacturing, E-Systems since 2008, Vice President, North America Seating Operations since 2005 and in various other management positions for the Company since joining the Company in 1994. |
| |
| Raymond E. Scott | Mr. Scott is the Company’sCompany's President and Chief Executive Officer, a position he has held since March 2018. Mr. Scott most recently served as the Company’sCompany's Executive Vice President and President, Seating since November 2011. Prior to that, he served as the Company’sCompany's Senior Vice President and President, E-Systems since February 2008. Previously, he served as the Company’sCompany's Senior Vice President and President, North American Seat Systems Group since August 2006, Senior Vice President and President, North American Customer Group since June 2005, President, European Customer Focused Division since June 2004 and President, General Motors Division since November 2000. |
| |
| Marianne Vidershain | Ms. Vidershain is the Company's Vice President and Treasurer, a position she has held since February 2021. Ms. Vidershain most recently served as the Company's Assistant Treasurer since January 2018. Prior to that, she served as the Company's Director, Global Financial Planning & Analysis since January 2015. Previously, she served as the Company's Director, Finance – Global Purchasing since February 2014, Director, Capital Markets and Subsidiary Finance since April 2010, Treasury Manager since January 2007 and in various other treasury positions since joining the Company in 2004. |
PART II
ITEM 5 – MARKET FOR THE COMPANY’SCOMPANY'S COMMON EQUITY,
RELATED STOCKHOLDER MATTERS AND ISSUER PURCHASES OF EQUITY SECURITIES
Market Information
Our common stock is listed on the New York Stock Exchange under the symbol "LEA."
Dividends
We currently expect to pay quarterly cash dividends in the future, although such payments are at the discretion of our Board of
Directors (the "Board") and will depend upon our financial condition, results of operations, capital requirements, alternative uses of capital and other factors that our Board of Directors may consider at its discretion. See Item 7, "Management’s"Management's Discussion and Analysis of Financial Condition and Results of Operations — Forward-Looking Statements," and Note 12, "Capital Stock, Accumulated Other Comprehensive Loss and Equity," to the consolidated financial statements included in this Report.
Holders of Common Stock
The Transfer Agent and Registrar for our common stock is Computershare Trust Company, N.A., located in Canton, Massachusetts. On January 31, 2021,February 5, 2024, there were 251219 registered holders of record of our common stock.
For certain information regarding our equity compensation plans, see Part III — Item 12, "Security Ownership of Certain Beneficial Owners and Management and Related Stockholder Matters — Equity Compensation Plan Information."
Common Stock Share Repurchase Program
Since the first quarter of 2011, our Board of Directors has authorized $6.1 billion in share repurchases under our common stock share repurchase program. As of December 31, 2020,2023, we have repurchased, in aggregate, $5.2 billion of our outstanding common stock, at an average price of $93.43 per share, excluding commissions and related fees, and have a remaining repurchase authorization of $1.4$0.9 billion, which will expireexpires on December 31, 2022. In March 2020, as a proactive measure in response to the COVID-19 pandemic, we suspended share repurchases under our share repurchase program.2024.
We may implement our share repurchases through a variety of methods, including, but not limited to, open market purchases, accelerated stock repurchase programs and structured repurchase transactions. The extent to which we willmay repurchase our outstanding common stock and the timing of such repurchases will depend upon our financial condition, results of operations, capital requirements, prevailing market conditions, alternative uses of capital and other factors. See Item 7, "Management’s"Management's Discussion and Analysis of Financial Condition and Results of Operations — Forward-Looking Statements," and Note 12, "Capital Stock, Accumulated Other Comprehensive Loss and Equity," to the consolidated financial statements included in this Report.
As of December 31, 2020, we have paid $4.7 billion in aggregate for repurchases of our outstanding common stock, at an average price of $90.07 per share, excluding commissions and related fees, since the first quarter of 2011.
A summary of the shares of our common stock repurchased during the fiscal quarter ended December 31, 2020,2023, is shown below:
| | | | | | | | | | | | | | | | | | | | | | | |
Period | | | | | | | | | | | | | | | | | | | | | | | | | Period | Total Number
of Shares
Purchased | | Average
Price Paid
per Share | | Total Number of Shares
Purchased as Part of
Publicly Announced
Plans or Programs | | Approximate Dollar
Value of Shares that
May Yet be Purchased
Under the Program
(in millions) | | October 1, 2023 through October 28, 2023 | — | | | $ | — | | | — | | | $ | 1,091.4 | | | October 29, 2023 through November 25, 2023 | 474,550 | | $ | 130.75 | | | 474,550 | | 1,029.4 | | | November 26, 2023 through December 31, 2023 | 816,089 | | | $ | 138.53 | | | 816,089 | | | 916.3 | | | Total | 1,290,639 | | $ | 135.67 | | | 1,290,639 | | $ | 916.3 | |
| Total Number
of Shares
Purchased | | Average
Price Paid
per Share | | Total Number of Shares
Purchased as Part of
Publicly Announced
Plans or Programs | | Approximate Dollar
Value of Shares that
May Yet be Purchased
Under the Program
(in millions) |
October 4, 2020 through October 31, 2020 | — | | | $ | — | | | — | | | $ | 1,430.0 | |
November 1, 2020 through November 28, 2020 | — | | — | | | — | | 1,430.0 | |
November 29, 2020 through December 31, 2020 | — | | | — | | | — | | | 1,430.0 | |
Total | — | | $ | — | | | — | | $ | 1,430.0 | |
Performance Graph
The following graph compares the cumulative total stockholder return from December 31, 20152018 through December 31, 2020,2023, for our common stock, the S&P 500 Index and a peer group(1) of companies that we have selected for purposes of this comparison. We have assumed that dividends have been reinvested, and the returns of each company in the S&P 500 Index and the peer group have been weighted to reflect relative stock market capitalization. The graph below assumes that $100 was invested on December 31, 2015,2018, in each of our common stock, the stocks comprising the S&P 500 Index and the stocks comprising the peer group.
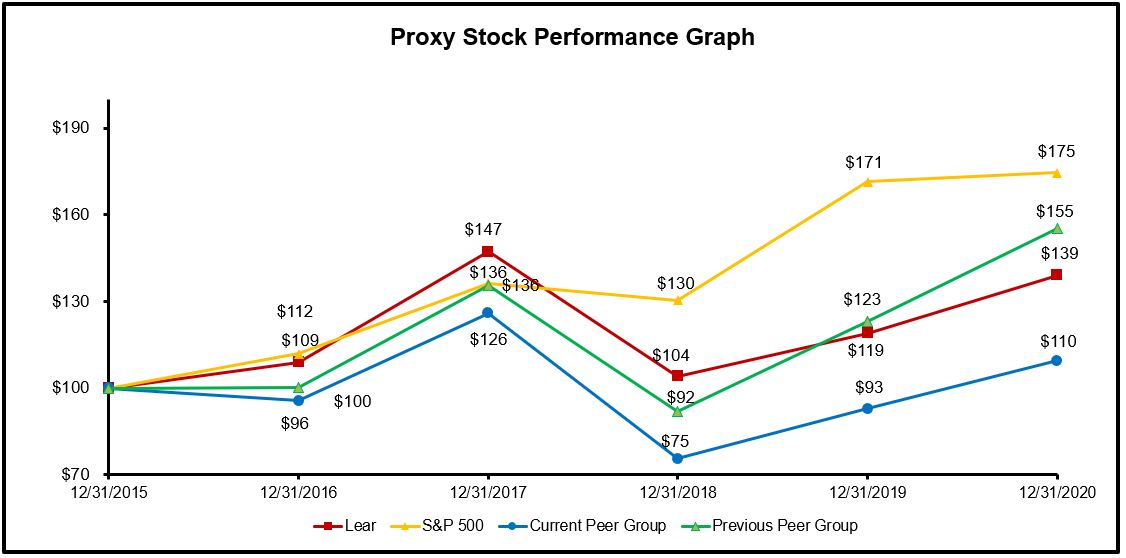

| | December 31,
2015 | | December 31,
2016 | | December 31,
2017 | | December 31,
2018 | | December 31,
2019 | | December 31,
2020 |
| | December 31,
2018 | | | | December 31,
2018 | | December 31,
2019 | | December 31,
2020 | | December 31,
2021 | | December 31,
2022 | | December 31,
2023 |
| Lear Corporation | Lear Corporation | | $ | 100.00 | | | $ | 108.88 | | | $ | 147.22 | | | $ | 104.10 | | | $ | 119.05 | | | $ | 139.18 | |
| S&P 500 | S&P 500 | | $ | 100.00 | | | $ | 111.95 | | | $ | 136.38 | | | $ | 130.39 | | | $ | 171.44 | | | $ | 174.68 | |
Current Peer Group (1) | Current Peer Group (1) | | $ | 100.00 | | | $ | 95.59 | | | $ | 125.89 | | | $ | 75.43 | | | $ | 92.92 | | | $ | 109.54 | |
Previous Peer Group (1) | Previous Peer Group (1) | | $ | 100.00 | | | $ | 100.31 | | | $ | 135.64 | | | $ | 91.79 | | | $ | 123.23 | | | $ | 155.37 | |
|
(1)We do not believe that there is a single published industry or line of business index that is appropriate for comparing stockholder returns. As a result, we have selected a peer group comprised of representative independent automotive suppliers whose common stock is publicly traded. Our current peer group, referenced in the graph above, consists of Adient plc, American Axle & Manufacturing Holdings Inc., Aptiv PLC, Autoliv, Inc., BorgWarner Inc., Continental AG, Dana Incorporated, Forvia SE (formerly known as Faurecia), Gentex Corporation, Gentherm Incorporated, Magna International, Inc., Valeo and Visteon Corporation, which we believe provides a more meaningful comparison of stock performance than our previous peer group. Our previous group, referenced in the graph above, consisted of Adient plc, American Axle & Manufacturing Holdings Inc., Aptiv PLC, Autoliv, Inc., BorgWarner Inc., Continental AG, Cooper-Standard Holdings Inc., Dana Incorporated, Faurecia, Gentex Corporation, Gentherm Incorporated, Magna International, Inc., Tenneco Inc., Valeo and Visteon Corporation, which we believe provides a more meaningful comparison of stock performance than our previous peer group. Our previous peer group, referenced in the graph above, consisted of Adient plc, American Axle & Manufacturing Holdings Inc., Aptiv PLC, BorgWarner Inc., Dana Incorporated, Gentex Corporation, Magna International, Inc., Superior Industries International, Inc., Tenneco Inc. and Visteon Corporation.
ITEM 6 – SELECTED FINANCIAL DATA
The following statement of operations, statement of cash flows and balance sheet data were derived from our consolidated financial statements. Our consolidated financial statements for the years ended December 31, 2020, 2019, 2018, 2017 and 2016, have been audited by Ernst & Young LLP. The selected financial data below should be read in conjunction with Item 7, "Management’s Discussion and Analysis of Financial Condition and Results of Operations," and our consolidated financial statements and the notes thereto included in this Report.
| | | | | | | | | | | | | | | | | | | | | | | | | | | | | |
| For the year ended December 31, | 2020 (1) | | 2019 (2) | | 2018 (3) | | 2017 (4) | | 2016 (5) |
Income Statement: (in millions) (6) | | | | | | | | | |
| Net sales | $ | 17,045.5 | | | $ | 19,810.3 | | | $ | 21,148.5 | | | $ | 20,467.0 | | | $ | 18,557.6 | |
| Gross profit | 1,108.9 | | | 1,737.5 | | | 2,318.3 | | | 2,291.1 | | | 2,122.6 | |
| Selling, general and administrative expenses | 588.9 | | | 605.0 | | | 612.8 | | | 635.2 | | | 608.2 | |
| Amortization of intangible assets | 65.9 | | | 62.3 | | | 51.4 | | | 47.6 | | | 53.0 | |
| Interest expense | 99.6 | | | 92.0 | | | 84.1 | | | 85.7 | | | 82.5 | |
Other (income) expense, net (7) | 55.2 | | | 24.6 | | | 31.6 | | | (4.1) | | | 40.6 | |
| Consolidated income before provision for income taxes and equity in net income of affiliates | 299.3 | | | 953.6 | | | 1,538.4 | | | 1,526.7 | | | 1,338.3 | |
| Provision for income taxes | 93.9 | | | 146.1 | | | 311.9 | | | 197.5 | | | 370.2 | |
| Equity in net income of affiliates | (28.5) | | | (23.2) | | | (20.2) | | | (51.7) | | | (72.4) | |
| Consolidated net income | 233.9 | | | 830.7 | | | 1,246.7 | | | 1,380.9 | | | 1,040.5 | |
| Net income attributable to noncontrolling interests | 75.4 | | | 77.1 | | | 96.9 | | | 67.5 | | | 65.4 | |
| Net income attributable to Lear | $ | 158.5 | | | $ | 753.6 | | | $ | 1,149.8 | | | $ | 1,313.4 | | | $ | 975.1 | |
| | | | | | | | | | | | | | | | | | | | | | | | | | | | | |
| For the year ended December 31, | 2020 (1) | | 2019 (2) | | 2018 (3) | | 2017 (4) | | 2016 (5) |
| Income Statement Data: | | | | | | | |
| Basic net income per share available to Lear common stockholders | $ | 2.63 | | | $ | 12.80 | | | $ | 17.35 | | | $ | 18.79 | | | $ | 13.48 | |
| Diluted net income per share available to Lear common stockholders | $ | 2.62 | | | $ | 12.75 | | | $ | 17.22 | | | $ | 18.59 | | | $ | 13.33 | |
Weighted average shares outstanding –
basic | 60,254,380 | | | 61,697,192 | | | 65,672,164 | | | 68,542,563 | | | 72,345,436 | |
| Weighted average shares outstanding – diluted | 60,426,962 | | | 61,923,528 | | | 66,161,816 | | | 69,277,981 | | | 73,124,949 | |
| Dividends per share | $ | 1.02 | | | $ | 3.00 | | | $ | 2.80 | | | $ | 2.00 | | | $ | 1.20 | |
Statement of Cash Flows Data: (in millions) | | | | | | | | | |
| Cash flows from operating activities | $ | 663.1 | | | $ | 1,284.3 | | | $ | 1,779.8 | | | $ | 1,783.1 | | | $ | 1,619.3 | |
| Cash flows from investing activities | (468.8) | | | (922.4) | | | (693.5) | | | (868.6) | | | (637.1) | |
| Cash flows from financing activities | (411.7) | | | (361.9) | | | (1,030.5) | | | (742.0) | | | (872.9) | |
| Capital expenditures | 452.3 | | | 603.9 | | | 677.0 | | | 594.5 | | | 528.3 | |
| | | | | | | | | | | | | | | | | | | | | | | | | | | | | |
| As of or for the year ended December 31, | 2020 | | 2019 | | 2018 | | 2017 | | 2016 |
Balance Sheet Data: (in millions) | | | | | | | | | |
| Current assets | $ | 6,776.7 | | | $ | 6,406.7 | | | $ | 6,280.5 | | | $ | 6,613.0 | | | $ | 5,649.3 | |
| Total assets | 13,198.6 | | | 12,680.7 | | | 11,600.7 | | | 11,945.9 | | | 9,900.6 | |
| Current liabilities | 5,076.7 | | | 4,666.2 | | | 4,500.6 | | | 4,854.3 | | | 4,182.3 | |
| Long-term debt | 2,300.3 | | | 2,293.7 | | | 1,941.0 | | | 1,951.5 | | | 1,898.0 | |
| Equity | 4,614.9 | | | 4,501.1 | | | 4,360.6 | | | 4,292.6 | | | 3,192.9 | |
Other Data (unaudited): | | | | | | | | | |
| Employees at year end | 174,600 | | 164,100 | | | 169,000 | | | 165,000 | | | 148,400 | |
North American content per vehicle (8) | $ | 509 | | | $ | 451 | | | $ | 452 | | | $ | 456 | | | $ | 422 | |
North American vehicle production (in millions) (9) | 13.0 | | | 16.3 | | | 17.0 | | | 17.1 | | | 17.8 | |
European content per vehicle (10) | $ | 370 | | | $ | 359 | | | $ | 385 | | | $ | 354 | | | $ | 316 | |
European vehicle production (in millions) (11) | 16.9 | | | 21.7 | | | 22.6 | | | 23.0 | | | 22.3 | |
(1)2020 results include $149.9 million of restructuring and related manufacturing inefficiency charges (including $23.3 million of asset impairment charges), $21.1 million loss on the extinguishment of debt, $4.0 million impairment of an investment, $33.8 million of tax benefits related to restructuring charges and various other items, a $15.5 million tax benefit related to the U.S. deferred tax effect of our foreign branches and $28.9 million of tax expense related to a net increase in valuation allowances on deferred tax assets.
(2)2019 results include $189.7 million of restructuring and related manufacturing inefficiency charges (including $9.5 million of asset impairment charges), $1.6 million of transaction costs, $1.1 million loss related to litigation, $1.6 million related to a favorable indirect tax ruling in a foreign jurisdiction, $10.6 million loss on the extinguishment of debt, $5.0 million impairment of an investment, $4.0 million gain related to the deconsolidation of an affiliate, $1.6 million gain related to an affiliate and $122 million of net tax benefits related to an increase in research and development tax credits for the years 2013 through 2018, changes in the tax status of certain affiliates, the U.S. tax impact of the foreign tax credit regulations issued in the fourth quarter of 2019, net reductions in tax reserves, share-based compensation, various tax-related items, including the release of valuation allowances, tax rate changes and audit adjustments, restructuring charges and various other special items partially offset by the establishment of valuation allowances on the deferred tax assets of foreign subsidiaries.
(3)2018 results include $104.3 million of restructuring and related manufacturing inefficiency charges (including $4.7 million of fixed asset impairment charges), $0.5 million of transaction costs, $5.4 million pension settlement charge, $17.1 million gain related to litigation, $15.8 million related to a favorable indirect tax ruling in a foreign jurisdiction, $10.0 million gain related to obtaining control of an affiliate, $8.9 million loss related to affiliates and $49.1 million of net tax benefits related to the reversal of valuation allowances on the deferred tax assets of certain foreign subsidiaries, share-based compensation, a tax rate change in a foreign subsidiary, an adjustment to the 2017 provisional income tax expense, restructuring charges and various other items partially offset by an increase in foreign withholding tax on certain undistributed foreign earnings and the establishment of valuation allowances on the deferred tax assets of certain foreign subsidiaries and various other items.
(4)2017 results include $74.5 million of restructuring and related manufacturing inefficiency charges (including $1.3 million of fixed asset impairment charges), $3.8 million of transaction costs, $5.0 million charge due to an acquisition-related inventory fair value adjustment, $15.4 million litigation charge, $21.2 million loss on the extinguishment of debt, $54.2 million gain related to obtaining control of an affiliate and $214.8 million of net tax benefits related to U.S. corporate tax reform and its associated transition tax, foreign tax credits on repatriated earnings, the reversal of valuation allowances on the deferred tax assets of certain foreign subsidiaries, share-based compensation, an incentive tax credit in a foreign subsidiary, the redemption of senior notes due 2023, restructuring charges and various other items.
(5)2016 results include $69.6 million of restructuring and related manufacturing inefficiency charges (including $4.7 million of fixed asset impairment charges), $34.2 million non-cash pension settlement charge, $1.3 million of transaction costs, $30.3 million gain related to obtaining control of an affiliate and $23.6 million of net tax benefits related to restructuring charges, a non-cash pension settlement charge and various other items.
(6)The income statement for 2016 has been restated to reflect a non-cash pension settlement charge as other (income) expense, net in conjunction with the 2018 adoption of Accounting Standards Update 2017-07, "Improving the Presentation of Net Periodic Pension Cost and Net Periodic Postretirement Benefit Cost." As a result, gross profit
increased $20.5 million, selling, general and administrative expenses decreased $13.7 million, and other expense, net increased $34.2 million.
(7)Includes non-income related taxes, foreign exchange gains and losses, gains and losses related to certain derivative instruments and hedging activities, losses on the extinguishment of debt, gains and losses on the disposal of fixed assets, gains and losses on the consolidation and deconsolidation of affiliates, the non-service cost components of net periodic benefit cost and other miscellaneous income and expense.
(8)"North American content per vehicle" is our net sales in North America divided by total North American vehicle production. Content per vehicle data excludes business conducted through non-consolidated joint ventures. Content per vehicle data for 2019 has been updated to reflect actual production levels.
(9)"North American vehicle production" includes car and light truck production in the United States, Canada and Mexico based on IHS Markit. Production data for 2019 has been updated to reflect actual production levels.
(10)"European content per vehicle" is our net sales in Europe and Africa divided by total European and African vehicle production. Content per vehicle data excludes business conducted through non-consolidated joint ventures. Content per vehicle data for 2019 has been updated to reflect actual production levels.
(11)"European vehicle production" includes car and light truck production with gross vehicle weights up to 3.5 tons in Austria, Belarus, Belgium, Bosnia, Bulgaria, Czech Republic, Finland, France, Germany, Hungary, Italy, Morocco, Netherlands, Norway, Poland, Portugal, Romania, Russia, Serbia, Slovakia, Slovenia, South Africa, Spain, Sweden, Turkey, Ukraine and the United Kingdom based on IHS Markit. Production data for 2019 has been updated to reflect actual production levels.RESERVED
ITEM 7 – MANAGEMENT’SMANAGEMENT'S DISCUSSION AND ANALYSIS OF FINANCIAL CONDITION AND RESULTS OF OPERATIONS
Executive Overview
We areLear Corporation is a leading Tier 1 vertically integrated supplier to the global automotive industry.technology leader in Seating and E-Systems, enabling superior in-vehicle experiences for consumers around the world. We supply seating,complete seat systems, key seat components, complete electrical distribution and connection systems, high-voltage power distribution products, including battery disconnect units ("BDUs"), low-voltage power distribution products, electronic systems,controllers and software and connected services,other electronic products to all of the world's major automotive manufacturers.
BuiltLear is built on a foundation and strong culture of innovation, operational excellence, and engineering and program management capabilities, wecapabilities. We use our product, design and technological expertise, as well as our global reach and competitive manufacturing footprint, to achieve our financial goals and objectives ofobjectives. These include continuing to deliver profitable growth (balancingbalancing risks and returns),returns, investing in innovation to drive business growth and profitability, maintaining a strong balance sheet with investment grade credit metrics, and consistently returning excess cashcapital to our stockholders. Further, we have aligned our strategy with key trends affecting our business — primarily electrification. At Lear, we are Making every drive betterTM by providing technology for safer, smarter and more comfortable journeys, while adhering to our values — Be Inclusive. Be Inventive. Get Results the Right Way.
Our business is organized under two reporting segments: Seating and E-Systems. Each of these segments has a varied product and technology rangeportfolio across a number of component categories.
Our Seating business consists of the design, development, engineering and manufacture of complete seat systems seat subsystems and key seat components. Our capabilities in operations and supply chain management enable synchronized (just-in-time) assembly and just-in-time delivery of high volumes of complex complete seat systems at high volumes to our customers. Included in our complete seat system and subsystem solutions are advanced comfort, wellness, safety and sound offerings, as well as configurable seating product technologies, all of which are compatible with traditional internal combustion engine ("ICE") architectures and the full range of hybrid, plug-in hybrid and battery electric architectures. Our advanced comfort, wellness, safety and sound offerings are facilitated by our system, component and integration capabilities, together with our in-house electronics, sensor, software and algorithm competencies. As the most vertically integrated global seat supplier, our key seat component product offerings include seat trim covers,covers; surface materials such as leather and fabric,fabric; seat mechanisms,mechanisms; seat foamfoam; thermal comfort systems such as seat heating, ventilation, active cooling, pneumatic lumbar and massage products; and headrests. All of these products are compatible with traditional internal combustion engine ("ICE") architectures and electrified powertrains, including the full range of hybrid, plug-in hybrid and battery electric architectures. Our thermal comfort systems are facilitated by our seat system, component and integration capabilities, together with our competencies in electronics, sensors, software and algorithms.
Our E-Systems business consists of the design, development, engineering and manufacture of complete electrical distribution and connection systems,systems; high-voltage power distribution products, including BDUs; and low-voltage power distribution products, electronic systems,controllers and software and connected services. The unique combination of theseother electronic products. These capabilities enablesenable us to provide our customers with customizable solutions with optimized designs at a competitive cost.costs for both low-voltage and high-voltage vehicle architectures. Electrical distribution and connection systems utilize low voltage, high voltage, high speedlow-voltage and high-voltage wire, high-speed data cables and flat wiring to connect networks and electrical signals and manage electrical power within the vehicle for all types of powertrains – from traditional ICE architectures to the full range of hybrid, plug-in hybrid and battery electric architectures. Key components in our electrical distribution portfolio include wire harnesses, terminals and connectors, and engineered components for both ICE and electrified vehicle architecturespowertrains that require management of higher voltage and power. ElectronicKey components of our electrical distribution and connection systems portfolio include wire harnesses, terminals and connectors, high-voltage battery connection systems and engineered components. High-voltage battery connection systems include intercell connect boards, bus bars and main battery connection systems. High-voltage power distribution products control the flow and distribution of high-voltage power throughout electrified vehicles and include BDUs which control all electrical energy flowing into and out of high-voltage batteries in electrified vehicles. Low-voltage power distribution products, electronic controllers and other electronic products facilitate signal, data andand/or power management within the vehicle and include the associated software required to facilitate these functions. Key components inof our other electronic systemsproducts portfolio include zone control modules, body domain control modules and products specific to electrificationlow-voltage and connectivity trends. Electrification products include on-board battery chargers, power conversion modules, high voltage battery management systems and high voltagehigh-voltage power distribution systems. Connectivity products include gateway modules and communication modules to manage both wired and wireless networks and data in vehicles. In addition to electronic modules, we offer software that includes cybersecurity, advanced vehicle positioning for automated and autonomous driving applications and full capabilities in both dedicated short-range communication and cellular protocols for vehicle connectivity.modules. Our software and connected services offerings include embedded control, cybersecurity software and cloud and mobile device-based software and services.to control hardware devices. Our customers traditionally have sourced our electronic hardware together with the software that we embed in it, but such software may also be sourced by our customers independently of the hardware. Our connected services software solutions include award-winning Xevo Market, an in-vehicle commerce and service platform that connects customers with their favorite brands and services by delivering highly-contextual sales offers through vehicle touch screens and vehicle-branded mobile applications.it.
We serve all of the world's major automotive manufacturers acrossthrough both our Seating and E-Systems businesses, and we have automotive content on more than 400475 vehicle nameplates worldwide. It is common for us to have both seating and electrical and/or electronic content on the same and multiple vehicle platforms with a single customer. Further, with the seat becoming a more dynamic and integrated system requiring increased levels of electrical and electronic integration, the combined capabilities of our Seating and E-Systems businesses are a competitive advantage. platform.
Our businesses benefit globally from leveraging common operating standards and disciplines, including world-class product development and manufacturing processes, as well as common customer support and regional infrastructures, all of which contribute to our reputation for operational excellence. Our core capabilities are shared across component categories and include high-precision manufacturing and assembly with short lead times, management of complex, global supply chains,chain management, global engineering and program management, skills, the agility to establish and/or transfer production between facilities quickly, and a unique, customer-focused culture. In select instances, we are able to manufacture both Seating and E-Systems components in the same facility. Our businesses also utilize proprietary, industry-specific processes and standards, leverage common low-cost engineering centers and share centralized operating support functions. These functions such as logistics, supply chain management, quality andinclude health and safety, as well as all major administrative functions.logistics,
COVID-19 Pandemic
Our sales are driven by the number of vehicles produced by the automotive manufacturers, which is ultimately dependentquality, supply chain management and all major administrative functions, such as corporate finance, executive administration, human resources, information technology and legal. We continue to build on consumer demandour reputation for automotive vehicles, and our content per vehicle. Unprecedented industry disruptions relatedoperational excellence through investment in Industry 4.0 technologies. Industry 4.0 refers to the COVID-19 pandemic impacted operationscurrent era of digital transformation in every regionmanufacturing. It involves the integration of the world. Global automotive industrynew technologies, such as Industrial Internet of Things (IIoT), cloud computing, artificial intelligence (AI), machine learning and advanced automation, into production volumes in 2020, as compared to 2019, are shown below (in thousands of units):
| | | | | | | | | | | | | | | | | |
| 2020 (1) | | 2019 (1) (2) | | % Change |
| North America | 13,027.3 | | | 16,314.4 | | | (20 | %) |
| Europe and Africa | 16,873.9 | | | 21,703.8 | | | (22 | %) |
| Asia | 39,257.7 | | | 44,651.8 | | | (12 | %) |
| South America | 2,163.5 | | | 3,128.5 | | | (31 | %) |
| Other | 1,323.5 | | | 1,417.0 | | | (7 | %) |
| Global light vehicle production | 72,645.9 | | | 87,215.5 | | | (17 | %) |
(1)Production data based on IHS Markit.
(2)Production data for 2019 has been updated from our 2019 Annual Report on Form 10-K to reflect actual production levels.
Our operations in China were impacted first, with most plants in the country closed for several weeks during the first quarter. At the end of the first quarter, all of our facilities in China were operating and capacity utilization was increasing. Beginning in mid-March, our operations in Europe, North America, South America and Asia (outside of China) were impacted, with virtually all of our plants closed at the end of the first quarter and closures continuing throughout April and, in most cases, a portion of May. Although manufacturing resumed gradually, most of our plants in our major markets were operating at pre-COVID-19 levels at the end of the second quarter and throughout the second half of 2020. We experienced significant inefficiencies and incremental costs related to the COVID-19 pandemic in the first half of the year, which diminished toward the end of the second quarter. In the second half of 2020, we experienced less significant but ongoing costs related to personal protective equipment, employee transportation and higher labor costs reflecting an increase in absenteeism.
Although industry production has returned to pre-COVID-19 levels, partially due to our customers' need to replenish inventory levels, it is likely that, for a period of time, the global automotive industry will experience lower demand for new vehicles as a result of the global economic slowdown caused by the COVID-19 pandemic, as new vehicle sales are typically correlated with positive consumer confidence and low unemployment. We are also continuing to monitor our supply base, as well as related production constraints imposed by various governments, to minimize the impact on our manufacturing operations. Further, a resurgence of the virus with corresponding shelter-in-place orders impacting industry production in 2021 could also impact our financial results.
Liquidity actions
In response to the COVID-19 pandemic, we took a number of proactive steps to preserve cash and maximize our financial flexibility, including the reduction of discretionary spending, the implementation of salary reductions and deferrals, the reduction of capital expenditures, the aggressive management of working capital and the suspension of share repurchases and quarterly dividends. We are also continuing to seek opportunities offered under government incentive programs throughout the world. In March 2020, we borrowed $1.0 billion under our revolving credit facility, which was repaid in full in September 2020. With $1.3 billion of cash on hand at the end of the 2020, $1.75 billion of availability under our revolving credit facility and no near-term debt maturities, we believe that we are well positioned to withstand the continuing effects of the COVID-19 pandemic.
Employee protection
Our top priority is to ensure the health and safety of our employees. We have restricted business travel, established protocols for visitors entering our facilities, enhanced disinfection and cleaning procedures at our facilities and promoted social distancing. We have created a Safe Work Playbook, which provides a standardized approach for each of our facilitiesbusiness operations. These technologies enable smart and automated machines and smart factories to create a consistentcommunicate, analyze and safe work environmentoptimize processes and offers insights into navigating operational challenges relatedproducts, resulting in higher efficiency, quality and responsiveness to the COVID-19 pandemic. The playbook is publicly available and includes health and safety information related to plant operating protocols; employee education, training and feedback; facility assessments; and phased reopening of engineering and administrative centers.customers.
For risks related to the COVID-19 pandemic, see Part I — Item 1A, "Risk Factors — Pandemics or disease outbreaks, such as COVID-19, have disrupted, and may continue to disrupt, our business, which could adversely affect our financial performance."
Industry Overview
Our sales are driven by the number of vehicles produced by the automotive manufacturers, which is ultimately dependent on consumer demand for automotive vehicles and the availability of raw materials and components, and our content per vehicle. In 2020, the automotive industry experienced a significant decline in global production volumes as a result of the COVID-19 pandemic. In 2022, industry production recovered modestly, increasing 8% compared to 2021. In 2023, industry production increased 9%compared to 2022. This reflects a return to 2019 pre-pandemic production levels but remains 5% below 2017 peak levels. Since 2020, the global economy, as well as the automotive industry, have been influenced directly and indirectly by macroeconomic events resulting in unfavorable conditions, including shortages of semiconductor chips and other components, elevated inflation levels on commodities and labor, higher interest rates, and labor and energy shortages in certain markets. Beginning in the third quarter of 2023 and continuing into the fourth quarter of 2023, the automotive industry was impacted by labor strikes and related disruptions at certain facilities in the United States. Certain of these factors, among others, continue to impact consumer demand, as well as the ability of automotive manufacturers to produce vehicles to meet demand. Our strategy to mitigate these impacts encompasses our comprehensive cost management process, including cost technology optimization, actions to further align our manufacturing capacity to the current industry production environment and investments in Industry 4.0 technologies. This will allow us to enhance operational efficiencies, improve the utilization of existing facilities and equipment to reduce future expenditures, and streamline and automate administrative functions. For a description of risks related to macroeconomic events, see Item 1A, "Risk Factors."
Global automotive industry production volumes in 2023, as compared to 2022, are shown below (in thousands of units):
| | | | | | | | | | | | | | | | | |
| 2023 (1) | | 2022 (1) (2) | | % Change |
| North America | 15,647.8 | | | 14,296.2 | | | 9 | % |
| Europe and Africa | 18,259.5 | | | 16,218.7 | | | 13 | % |
| Asia | 50,147.8 | | | 46,049.2 | | | 9 | % |
| South America | 2,817.9 | | | 2,716.5 | | | 4 | % |
| Other | 1,746.2 | | | 1,769.1 | | | (1 | %) |
| Global light vehicle production | 88,619.2 | | | 81,049.7 | | | 9 | % |
(1) Production data based on S&P Global Mobility.
(2) Production data for 2022 has been updated from our 2022 Annual Report on Form 10-K to reflect actual production levels.
Automotive sales and production can also be affected by the age of the vehicle fleet and related scrappage rates, labor relations issues and shortages, fuel prices, regulatory requirements, government initiatives, trade agreements, tariffs and other non-tariff trade barriers, the availability and cost of credit, the availability and cost of critical components needed to complete the production of vehicles, logistics issues, restructuring actions of our customers and suppliers, facility closures changingand increased competition, as well as consumer attitudes towardpreferences regarding vehicle ownershippowertrains (including preferences regarding hybrid and usageelectric vehicles), size, configuration and features, among other factors. Our operating results are also significantly impacted by the overall commercial success of the vehicle platforms for which we supply particular products, as well as the profitability of the products, including the level of vertical integration, that we supply for these platforms. The loss of business with respect to any vehicle model for which we are a significant supplier, or a decrease in the production levels of any such models, could adversely affect our operating results. In addition, larger cars and light trucks, as well as vehicle platforms that offer more features and functionality, such as luxury, sport utility and crossover vehicles, typically have more content and, therefore, tend to have a more significant impact on our operating results.
Our percentage of consolidated net sales by region in 20202023 and 20192022 is shown below:
| | 2020 | | 2019 |
| 2023 | | | 2023 | | 2022 |
| North America | North America | 39 | % | | 37 | % | North America | 40 | % | | 43 | % |
| Europe and Africa | Europe and Africa | 37 | % | | 39 | % | Europe and Africa | 37 | % | | 33 | % |
| Asia | Asia | 21 | % | | 20 | % | Asia | 19 | % | | 20 | % |
| South America | South America | 3 | % | | 4 | % | South America | 4 | % | | 4 | % |
| Total | Total | 100 | % | | 100 | % | Total | 100 | % | | 100 | % |
Our ability to reduce the risks inherent in certain concentrations of our business, and thereby maintain our financial performance in the future, will depend, in part, on our ability to continue to diversify our sales on a customer, product, platform and geographic basis to reflect the market overall.
Key trends affectingThe automotive industry, and our business, include electrification, connectivity and autonomy. In addition, our business is affectedcontinue to be shaped by the consolidationbroad trend of automotive manufacturers, as well as new non-traditional entrants to the automotive industry, the collaboration of automotive manufacturers on commonized vehicle platforms, increasing demand for luxury and performance features, including increasing levels of electrical and electronic content, and China’s emergence as the largest automotive market in the world. In particular, we believe that we have a significant opportunity for growth in China with both global and domestic automotive manufacturers. Another key trend benefiting our business is the shift toward crossover and sport utility vehicles, where our content can be significantly higher than our average content per vehicle.
In addition, we believe that demand for energy efficiency and reduced carbon emissions, as well as the demand for enhanced communications and safety, are driving the technology trends of electrification, connectivity and autonomy. We are focused on those trends which provide us with significant business opportunities where we have competitive differentiation and innovative technology. While both of our businesses are powertrain agnostic, we are well positioned to capitalize on these technology trends, each of which is likely to be at the forefront of ourthe industry for the foreseeable future in lightfuture. Demand for, and regulatory developments related to, improved energy efficiency and sustainability (e.g., government mandates related to fuel economy and carbon emissions) are significant drivers of thethis trend.
Through our products, technology and strategic initiatives, we are well positioned to capitalize on business growth opportunities. We are focused on profitably growing our businesses and have implemented a strategy designed to deliver industry-leading, long-term convergence toward electric, connected and autonomous vehicles.
Our sales and marketing approach addresses these trends, while ourfinancial returns. This strategy focusesis based on the major imperatives for success as an automotive supplier: quality, service, costfollowing four pillars designed to drive growth and efficiency, and innovation and technology. We have expanded key component and software capabilities through organic investment and acquisitions to ensure a full complement of the best solutions for our customers. We have restructured, and continue to align, our manufacturing and engineering footprint to attain a leading competitive cost position globally. We have established or expanded activitiesprofitability in new and growing markets, especially China, in supportboth of our customers’business segments:
•Extend our market leadership position in Seating with priceable features;
•Transform our E-Systems business through accelerated growth in connection systems, vehicle architecture evolution and electrification, and the rationalization of our product portfolio to improve profitability;
•Build on our reputation for operational excellence through investment in Industry 4.0 technologies; and
•Prioritize people and the planet through our sustainability initiatives to drive business growth, cost reductions and in pursuit of opportunities with new customers. These initiatives have helped us achieve our financial goals overall, as well as a more balanced regional, customer and vehicle segment diversification in our business.improved employee retention.
For further information related to these trends and our strategy, see Part 1 — Item 1, "Business — IndustryIndustry" and "— Strategy."
Our customers typically require us to reduce our prices over the life of a vehicle model and, at the same time, assume significant responsibility for the design, development and engineering of our products. Our financial performance is largely dependent on our ability to achieveoffset these price reductions with product cost reductions through product design enhancement, and supply chain management, as well as manufacturing efficiencies and restructuring actions. We also seek to enhance our financial performance by investing in product development, design capabilities and new product initiatives that respond to and anticipate the needs of our customers and consumers. We continually evaluate operational and strategic alternatives to improve our business structure and align our business with the changing needs of our customers and major industry trends affecting our business.
Our material cost as a percentage of net sales was 64.3%65.2% in 2020,2023, as compared to 65.0%66.1% in 20192022 and 64.4%65.4% in 2018.2021. Raw material, energy, commodity and commodityproduct component costs can be volatile, reflecting, among other things, changes in supply and demand, andlogistics issues, global trade and tariff policies.policies, and geopolitical issues. Our primary commodity cost exposures relate to steel, copper and leather. We have developed and implemented strategies to mitigate the impact of higher raw material, energy and commoditysuch costs such asthrough the selective in-sourcing of components, the continued consolidation of our supply base, longer-term purchase commitments, contractual recovery mechanisms and the selective expansion of low-cost country sourcing and engineering, as well as value engineering and product benchmarking. However, these strategies, together with commercial negotiationsFurther, our exposure to changes in steel prices is primarily indirect, through purchased components, and a significant portion of our copper, leather and direct steel purchases are subject to price index agreements with our customers and suppliers, typically offset only a portion of the adverse impact.suppliers. Certain of these strategies also may limit our opportunities in a declining price environment. In the current environment of elevated raw material, energy, commodity environment.and product component costs, these strategies, together with commercial negotiations with our customers and suppliers, have offset a significant portion of the adverse impact. In addition, the availability of raw materials, energy, commodities and product components fluctuates from time to time due to factors outside of our control. If these costs increase or availability is restricted, it could have an adverse impact on our operating results in the foreseeable future. See Part I — Item 1A, "Risk Factors — Increases in the costs and restrictions on the availability of raw materials, energy, commodities, and product components and labor could adversely affect our financial performance," and "— Forward-Looking Statements" below.
Financial Measures
In evaluating our financial condition and operating performance, we focus primarily on earnings, operating margins, cash flows and return on invested capital. In addition to maintaining andOur strategy includes expanding our business with ournew and existing customers in our more established markets, our expansion plans are focused primarily on emerging markets. Asia, and China in particular, continues to present long-term growth opportunities, as we focus on expanding our market share and content per vehicle, as demand for luxury and performance features increases in this region. In addition to our wholly owned locations, we currentlyglobally through new products, including those aligned with the trend toward electrification. We have eleven operating joint ventures with operations in Asia, as well as two additional joint ventures in North America dedicated to serving Asian automotive manufacturers. We also have aggressively pursued this strategy by selectively increasingincreased our vertical integration capabilities globally, as well as expandingexpanded our component manufacturing capacity in Asia, Brazil, Eastern Europe, Mexico and Northern Africa. Furthermore, we have expandedAfrica and our low-cost engineering capabilities in Asia, Eastern Europe and Northern Africa.
Our success in generating cash flow will depend, in part, on our ability to manage working capital effectively. Working capital can be significantly impacted by the timing of cash flows from sales and purchases. Historically, we generally have been successful in aligning our vendorsupplier payment terms with our customer payment terms. However, our ability to continue to do so may be impacted by adverse automotive industry conditions, including inconsistent production schedules due to supply shortages, changes to our customers’customers' payment terms and the financial condition of our suppliers, as well as our financial condition.suppliers. In addition, our cash flow is impacted by our ability to manage our inventory and capital spending effectively. We utilize return on invested capital as a measure of the efficiency with which our assets generate earnings. Improvements in our return on invested capital will depend on our ability to maintain an appropriate asset base for our business and to increase productivity and operating efficiency.
AcquisitionAcquisitions
Xevo2023
In April 2019,2023, we completed the acquisition of Xevo Inc.I.G. Bauerhin ("Xevo"IGB"), a Seattle-based,privately held supplier of automotive seat heating, ventilation and active cooling, steering wheel heating, seat sensors and electronic control modules, headquartered in Grundau-Rothenbergen, Germany. IGB has more than 4,600 employees at nine manufacturing plants in seven countries. The acquisition furthers our comprehensive strategy to develop and integrate a complete portfolio of thermal comfort systems for automotive seating. IGB provides active cooling, as well as additional scale to our seat heating and ventilation capabilities and complements the lumbar and massage capabilities obtained with our acquisition of Kongsberg Automotive's Interior Comfort Systems business unit ("Kongsberg ICS") in February 2022. Further, the vertical integration opportunities provided by this acquisition help support our goal of achieving global leadermarket share gains in connected car software, by acquiring all of Xevo's outstanding shares for $322seat systems. We paid approximately $175 million, net of cash acquired. Xevo is a supplieracquired, in connection with the acquisition. On May 1, 2023, we borrowed $150 million under our delayed-draw term loan facility (the "Term Loan") to finance, in part, the acquisition of software solutions for the cloud, vehicles and mobile devices that are deployed in millions of vehicles worldwide.
IGB. For further information, see Note 4, "Acquisition,"Acquisitions," to the consolidated financial statements included in this Report.
2022
In February 2022, we completed the acquisition of substantially all of Kongsberg ICS, which specializes in thermal comfort systems. With almost 50 years of experience in thermal comfort systems, Kongsberg ICS has leading technology, a well-balanced customer portfolio built on longstanding relationships with leading premium automotive manufacturers, and an experienced team. The Kongsberg ICS acquisition is advancing our seat component capabilities into specialized thermal comfort systems, such as seat heating, ventilation, lumbar and massage products that further differentiate our product offerings and improve vehicle performance and packaging — important features across various vehicle segments. We paid approximately $188 million, on a cash and debt free basis, in connection with the acquisition. For further information, see Note 4, "Acquisitions," to the consolidated financial statements included in this Report.
In May 2022, we completed the acquisition of Thagora Technology SRL ("Thagora"), a privately held company based in Iasi, Romania, to access scalable smart-manufacturing technology. Thagora's proprietary solutions complement our sustainable manufacturing processes by improving the production yield of our Seating segment's surface materials operations and lowering energy usage during production. In addition, Thagora's Industry 4.0 technologies bring significant advances to our manufacturing operations through engineering and logistics enhancements, including improved material traceability and facility footprint utilization capabilities. The acquisition is not material to the consolidated financial statements included in this Report.
In November 2022, we completed the acquisition of InTouch Automation ("InTouch"), a privately held supplier of Industry 4.0 technologies and complex automated testing equipment critical in the production of automotive seats. InTouch's product portfolio is aligned with our Industry 4.0 strategy to implement technologies designed to automate the testing and validation of seat components and complete seats. The acquisition is not material to the consolidated financial statements included in this Report.
Operational Restructuring
In 2020,2023, we incurred pretax restructuring costs of $145$133 million and related manufacturing inefficiency charges of $5approximately $1 million, as compared to pretax restructuring costs of $184$154 million and related manufacturing inefficiency charges of $6approximately $5 million in 2019. The decrease in restructuring costs in 2020, as compared to 2019, is primarily related to reduced customer actions. None2022. None of the individual restructuring actions initiated during 2020in 2023 were material.
Further, there have been no changes in previously initiated restructuring actions that have resulted (or will result) in a material change to our restructuring costs.
Our restructuring actions include plant closures and workforce reductions and are initiated to maintain our competitive footprint or are in response to customer initiatives or changes in global and regional automotive markets. Our restructuring actions are designed to maintain or improve our operating results and profitability throughout the automotive industry cycles. Restructuring actions are generally funded within twelve months of initiation and are funded by cash flows from operating activities and existing cash balances. There have been no changes in previously initiated restructuring actions that have resulted (or will result) in a material change to our restructuring costs. We expect to incur approximately $18$76 million of additional restructuring costs related to activities initiated as of December 31, 2020,2023, all of which are expected to be incurred byin the end of 2021.next twelve months. We plan to implement additional restructuring actions in order to align our manufacturing capacity and other costs with prevailing regional automotive production levels. Such future restructuring actions are dependent on market conditions, customer actions and other factors.
For further information, see Note 5, "Restructuring," and Note 15, "Segment Reporting," to the consolidated financial statements included in this Report.
Financing Transactions
Senior Notes
In February 2020, we issued $350 million in aggregate principal amount at maturity of 2030 notes (the "2030 Notes") and an additional $300 million in aggregate principal amount at maturity of 2049 notes (the "2049 Notes"). The 2030 Notes have a stated coupon rate of 3.5% and were issued at 99.774% of par, resulting in a yield to maturity of 3.525%. The 2049 Notes have a stated coupon rate of 5.25% and were issued at 106.626% of par, resulting in a yield to maturity of 4.821%.
The net proceeds from the offering were $669 million after original issue discount. The proceeds were used to redeem the $650 million in aggregate principal amount of 2025 notes (the "2025 Notes") at a redemption price equal to 102.625% of the principal amount of such 2025 Notes, plus accrued interest.
In connection with these transactions, we recognized a loss of $21 million on the extinguishment of debt and paid related issuance costs of $6 million.
In May 2019,2023, we issued $375borrowed $150 million in aggregate principal amount at maturity of senior unsecured notes due in 2029 (the "2029 Notes") and $325 million in aggregate principal amount at maturity of 2049 Notes. The 2029 Notes have a stated coupon rate of 4.25% and were issued at 99.691% of par, resulting in a yield to maturity of 4.288%. The 2049 Notes have a stated coupon rate of 5.25% and were issued at 98.32% of par, resulting in a yield to maturity of 5.363%.
The net proceeds from the offering were $693 million after original issue discount. The proceeds were used to redeem the $325 million in aggregate principal amount of senior unsecured notes due in 2024 (the "2024 Notes") at a redemption price equal to 102.688% of the principal amount of such 2024 Notes, plus accrued interest, as well asunder our Term Loan to finance, in part, the acquisition of Xevo and for general corporate purposes.IGB.
In connection with these transactions,November 2023, we recognized a lossextended the maturity date of $11 million on the extinguishment of debt and paid related issuance costs of $7 million.our revolving credit facility by one year to October 28, 2027.
For further information related to our acquisition of IGB, see Note 4, "Acquisitions," to the consolidated financial statement included in this Report. For further information related to our Term Loan and our revolving credit facility, see "— Liquidity and Financial ConditionCapital Resources — Capitalization — Senior Notes"Credit Agreement" and "— Term Loan" below and Note 7, "Debt," to the consolidated financial statements included in this Report.
Credit Agreement
Our unsecured credit agreement (the "Credit Agreement"), dated August 8, 2017, consists of a $1.75 billion revolving credit facility (the "Revolving Credit Facility") and a $250 million term loan facility (the "Term Loan Facility"). In February 2020, we entered into an agreement to extend the maturity date of the Revolving Credit Facility by one year to August 8, 2024, and paid related issuance costs of $1 million. The maturity date of the Term Loan Facility is August 8, 2022.
In March 2020, as a proactive measure in response to the COVID-19 pandemic, we borrowed $1.0 billion under the Revolving Credit Facility, which was repaid in full in September 2020, resulting in availability of $1.75 billion as of December 31, 2020.
For further information, see "— Liquidity and Financial Condition — Capitalization — Credit Agreement" below and Note 7, "Debt," to the consolidated financial statements included in this Report.
Share Repurchase Program and Quarterly Cash Dividends
We may implement share repurchases through a variety of methods, including, but not limited to, open market purchases, accelerated stock repurchase programs and structured repurchase transactions. The extent to which we may repurchase our outstanding common stock and the timing of such repurchases will depend upon our financial condition, results of operations, capital requirements, prevailing market conditions, alternative uses of capital and other factors. (see "— Forward-Looking Statements" below).
Since the first quarter of 2011, our Board of Directors (the "Board") has authorized $6.1 billion in share repurchases under our common stock share repurchase program. In March 2020, as a proactive measure in response to the COVID-19 pandemic, we suspended share repurchases under our share repurchase program. Prior to the suspension,2023, we repurchased $70$313 million of shares in 2020 andshares. As of December 31, 2023, we have a remaining repurchase authorization of $1.4 billion,$916 million, which will expireexpires on December 31, 2022.2024.
In March 2020, as2023 and 2022, our Board declared a proactive measure in response to the COVID-19 pandemic, we suspended our quarterly cash dividend. Prior to the suspension,dividend of $0.77 per share of common stock in all quarters. In 2021, our Board of Directors declared a quarterly cash dividend of $0.25 per share of common stock in the first and second quarters, a quarterly cash dividend of $0.50 per share of common stock in the third quarter and a quarterly cash dividend of $0.77 per share of common stock in the first quarter of 2020. The quarterly cash dividend was reinstated in the fourth quarter of 2020 at $0.25 per share of common stock.quarter.
For further information related to our common stock share repurchase program and our quarterly cash dividends, see Item 5, "Market for the Company’sCompany's Common Equity, Related Stockholder Matters and Issuer Purchases of Equity Securities," "— Liquidity and Financial ConditionCapital Resources — Capitalization" below and Note 12, "Capital Stock, Accumulated Other Comprehensive Loss and Equity," to the consolidated financial statements included in this Report.
Other Matters
In 2020,2023, we recognized net tax benefits of $35 million related to restructuring charges, the release of valuation allowances on deferred tax assets of foreign subsidiaries, the release of tax reserves at several foreign subsidiaries and various other items.
In 2022, we recognized net tax benefits of $34 million related to restructuring charges and various other items and $15 million related to the U.S. deferred tax effect of our foreign branches, partially offset by tax expense of $29 million related to a net increase in valuation allowances on deferred tax assets.items.
In 2019,2021, we recognized tax benefits of $29 million related to an increase in our research and development tax credits for the years 2013 through 2018, $18 million related to changes in the tax status of certain affiliates, $14 million related to the U.S. tax impact of the foreign tax credit regulations issued in the fourth quarter of 2019, $5 million related to net reductions in tax reserves, $3 million related to share-based compensation, $12 million related to various tax-related items, including the release of valuation allowances, tax rate changes and audit adjustments, and $52$39 million related to restructuring charges and various other items, partially offset by tax expense of $11$17 million related to the establishment ofnet increase in valuation allowances on the deferred tax assets of foreign subsidiaries.
In 2018, we acquired an additional 20% interest in Changchun Lear FAWSN Automotive Electricalsubsidiaries and Electronics Co., Ltd. ("Lear FAWSN") from$8 million on a joint venture partner and amended the existing joint venture agreement to eliminate the substantive participating rights of the remaining joint venture partner. Prior to the amendment, Lear FAWSN was accounted for under the equity method. In conjunction with obtaining control of Lear FAWSN and the valuation of our prior equity investment in Lear FAWSN at fair value, we recognized a$45 million gain of approximately $10 million.
In 2018, we recognized a $5 million settlement charge in connection with our annuity purchase for certain terminated vested plan participants of our U.S. defined benefit pension plans.
In 2018, we recognized tax benefits of $83 million related to the reversal of valuation allowances on the deferreda favorable indirect tax assets of certain foreign subsidiaries, share-based compensation, a tax rate changeruling in a foreign subsidiary, an adjustment to the 2017 provisional income tax expense, restructuring charges and various other items, offset by tax expensejurisdiction.
As discussed above, our results for the years ended December 31, 2020, 20192023, 2022 and 2018,2021, reflect the following items (in millions):
| | | | | | | | | | | | | | | | | |
| For the year ended December 31, | 2020 | | 2019 | | 2018 |
| Costs related to restructuring actions, including manufacturing inefficiencies of $5 million in 2020, $6 million in 2019 and $16 million in 2018 | $ | 150 | | | $ | 190 | | | $ | 104 | |
| Acquisition and other related costs | — | | | 2 | | | 1 | |
| Pension settlement charge | — | | | — | | | 5 | |
| Litigation | — | | | 1 | | | (17) | |
| Favorable indirect tax ruling in a foreign jurisdiction | — | | | (2) | | | (16) | |
| Loss on extinguishment of debt | 21 | | | 11 | | | — | |
| (Gain) loss related to investments, net | 4 | | | (1) | | | (1) | |
| Tax benefits, net | (20) | | | (122) | | | (49) | |
| | | | | | | | | | | | | | | | | |
| For the year ended December 31, | 2023 | | 2022 | | 2021 |
| Costs related to restructuring actions, including manufacturing inefficiencies of $1 million in 2023, $5 million in 2022 and $12 million in 2021 | $ | 134 | | | $ | 159 | | | $ | 113 | |
| Acquisition costs | 1 | | | 10 | | | — | |
| Acquisition-related inventory fair value adjustment | 2 | | | 1 | | | — | |
| Impairments related to Russian operations | 2 | | | 19 | | | — | |
| Intangible asset impairment | 2 | | | 9 | | | 9 | |
| Insurance (recoveries) costs related to typhoon in the Philippines, net | (7) | | | (1) | | | 13 | |
| Foreign exchange (gains) losses due to foreign exchange rate volatility related to Russia | (2) | | | 10 | | | — | |
| Favorable indirect tax ruling in a foreign jurisdiction | (1) | | | — | | | (45) | |
| Gain on acquisition-related foreign exchange contracts | — | | | (2) | | | — | |
| Loss on extinguishment of debt | — | | | — | | | 25 | |
| Loss related to investments | 7 | | | — | | | 2 | |
| Tax benefits, net | (35) | | | (34) | | | (14) | |
For further information regarding these items, see Note 3, "Summary of Significant Accounting Policies," Note 4, "Acquisition,"Acquisitions," Note 5, "Restructuring," Note 6, "Investments in Affiliates and Other Related Party Transactions," Note 7, "Debt," Note 9, "Income Taxes,8, "Leases," and Note 10, "Pension and Other Postretirement Benefit Plans,9, "Income Taxes," to the consolidated financial statements included in this Report. This section includes forward-looking statements that are subject to risks and uncertainties. For further information regarding these and other factors that have had, or may have in the future, a significant impact on our business, financial condition or results of operations, see Part I — Item 1A, "Risk Factors," and "— Forward-Looking Statements" below.
Results of Operations
A summary of our operating results in millions of dollars and as a percentage of net sales is shown below:
| | For the year ended December 31, | For the year ended December 31, | 2020 | | 2019 | | 2018 | For the year ended December 31, | 2023 | | 2022 | | 2021 |
| Net sales | Net sales | |
| Seating | |
| Seating | |
| Seating | Seating | $ | 12,712.7 | | | 74.6 | % | | $ | 15,097.2 | | | 76.2 | % | | $ | 16,021.9 | | | 75.8 | % | $ | 17,548.8 | | | 74.8 | | 74.8 | % | | $ | 15,711.2 | | | 75.2 | | 75.2 | % | | $ | 14,411.4 | | | 74.8 | | 74.8 | % |
| E-Systems | E-Systems | 4,332.8 | | | 25.4 | | | 4,713.1 | | | 23.8 | | | 5,126.6 | | | 24.2 | |
| Net sales | Net sales | 17,045.5 | | | 100.0 | | | 19,810.3 | | | 100.0 | | | 21,148.5 | | | 100.0 | |
| Cost of sales | Cost of sales | 15,936.6 | | | 93.5 | | | 18,072.8 | | | 91.2 | | | 18,830.2 | | | 89.0 | |
| Gross profit | Gross profit | 1,108.9 | | | 6.5 | | | 1,737.5 | | | 8.8 | | | 2,318.3 | | | 11.0 | |
| Selling, general and administrative expenses | Selling, general and administrative expenses | 588.9 | | | 3.5 | | | 605.0 | | | 3.1 | | | 612.8 | | | 2.9 | |
| Amortization of intangible assets | Amortization of intangible assets | 65.9 | | | 0.4 | | | 62.3 | | | 0.3 | | | 51.4 | | | 0.2 | |
| Interest expense | 99.6 | | | 0.6 | | | 92.0 | | | 0.5 | | | 84.1 | | | 0.4 | |
| Interest expense, net | |
| Other expense, net | Other expense, net | 55.2 | | | 0.3 | | | 24.6 | | | 0.1 | | | 31.6 | | | 0.2 | |
| Provision for income taxes | Provision for income taxes | 93.9 | | | 0.6 | | | 146.1 | | | 0.7 | | | 311.9 | | | 1.5 | |
| Equity in net income of affiliates | Equity in net income of affiliates | (28.5) | | | (0.2) | | | (23.2) | | | (0.1) | | | (20.2) | | | (0.1) | |
| Net income attributable to noncontrolling interests | Net income attributable to noncontrolling interests | 75.4 | | | 0.4 | | | 77.1 | | | 0.4 | | | 96.9 | | | 0.5 | |
| Net income attributable to Lear | Net income attributable to Lear | $ | 158.5 | | | 0.9 | % | | $ | 753.6 | | | 3.8 | % | | $ | 1,149.8 | | | 5.4 | % | Net income attributable to Lear | $ | 572.5 | | | 2.4 | | 2.4 | % | | $ | 327.7 | | | 1.6 | | 1.6 | % | | $ | 373.9 | | | 1.9 | | 1.9 | % |
Year Ended December 31, 2020,2023, Compared With Year Ended December 31, 20192022
Net sales for the year ended December 31, 20202023 were $17.0$23.5 billion, as compared to $19.8$20.9 billion for the year ended December 31, 2019, a decrease2022, an increase of $2.8$2.6 billion or 14%12%. LowerHigher production volumes on Lear platforms globally, largely due to the COVID-19 pandemic, negativelyand new business in every region favorably impacted net sales by more than $3.3 billion. This decrease was partially offset by the impact of new business in all regions, which increased net sales by more than $0.7 billion.$1.4 billion and $0.9 billion, respectively.
| | (in millions) | (in millions) | | Cost of Sales | (in millions) | | Cost of Sales |
| 2019 | | $ | 18,072.8 | |
| 2022 | |
| Material cost | Material cost | | (1,915.9) | |
| Labor and other | Labor and other | | (246.7) | |
| Depreciation | Depreciation | | 26.4 | |
| 2020 | | $ | 15,936.6 | |
| 2023 | |
Cost of sales in 20202023 was $15.9$21.8 billion, as compared to $18.1$19.5 billion in 2019. Lower2022. Higher production volumes on Lear platforms globally, largely due to the COVID-19 pandemic, reduced cost of sales by nearly $2.6 billion. This decrease was partially offset by the impact ofand new business in all regions, which increaseevery region increased cost of sales by nearly $0.7 billion.sales.
Gross profit and gross margin were $1.1$1.7 billion and 6.5%7.3% of net sales in 2020,2023, as compared to $1.7$1.4 billion and 8.8%6.7% of net sales in 2019. Lower2022. Higher production volumes on Lear platforms globally, largely due to the COVID-19 pandemic, and costs related to the COVID-19 pandemic negativelynew business positively impacted gross profit by $792$308 million. FavorableThe impact of favorable operating performance, including the benefit of operational restructuring actions, and lower restructuring costs were partiallywas offset by the impact of selling price reductions. These factors had a corresponding impact on gross margin.
Selling, general and administrative expenses, including engineering and development expenses, were $589$715 million for the year ended December 31, 2020,2023, as compared to $605$685 million for the year ended December 31, 2019.2022, primarily reflecting higher sales and our acquisition of IGB in 2023. As a percentage of net sales, selling, general and administrative expenses were 3.5%3.0% in 2020,2023, as compared to 3.1%3.3% in 2019, reflecting the significant decrease in net sales in 2020.2022.
Amortization of intangible assets was $66$63 million in 2020,2023, including an impairment charge of $2 million, as compared to $62$71 million in 2019.2022, including an impairment charge of $9 million.
Interest expense, net was $100$101 million in 2020,2023, as compared to $92$99 million in 2019.2022.
Other expense, net, which includes non-income related taxes, foreign exchange gains and losses, gains and losses related to certain derivative instruments and hedging activities, losses on the extinguishment of debt, gains and losses on the disposal of fixed assets, gains and losses on the consolidation and deconsolidation of affiliates, the non-service cost components of net
periodic benefit cost and other miscellaneous income and expense, was $55 million in 2020,2023, as compared to $25$46 million in 2019.2022. In 2020,2023, we recognized foreign exchange losses of $21$53 million, including $31 million related to the extinguishmenthyper-inflationary environment and significant currency devaluation in Argentina, and losses of debt, $13$7 million related to a pension settlementimpairments of affiliates. In 2023, we also recognized gains of $18 million related to the sales of fixed assets and $4 million related to the impairment of an investment.insurance recoveries. In 2019,2022, we recognized foreign exchange losses of $11$30 million, including losses of $10 million related to the extinguishmentforeign exchange rate volatility in Russia and gains of debt and $5$2 million related to foreign exchange contracts on the impairment of an investment and€140 million IGB purchase price. In 2022, we also recognized a gain of $4$1 million related to the deconsolidation of an affiliate.insurance recoveries.
In 2020,2023, the provision for income taxes was $94$181 million, representing an effective tax rate of 31.4%23.3% on pretax income before equity in net income of affiliates of $299$777 million. In 2019,2022, the provision for income taxes was $146$134 million, representing an effective tax rate of 15.3%26.3% on pretax income before equity in net income of affiliates of $954$509 million.
In 20202023 and 2019,2022, the provision for income taxes was primarily impacted by the level and mix of earnings among tax jurisdictions. In 2020,2023, we recognized net tax benefits of $35 million related to restructuring charges, the release of valuation allowances on deferred tax assets of foreign subsidiaries, the release of tax reserves at several foreign subsidiaries and various other items. In 2022, we recognized net tax benefits of $34 million related to restructuring charges and various other items and $15 million related to the U.S. deferred tax effect of our foreign branches and tax expense of $29 million related to a net increase in valuation allowances on deferred tax assets. In 2019, we recognized tax benefits of $29 million related to an increase in our research and development tax credits for the years 2013 through 2018, $18 million related to changes in the tax status of certain affiliates, $14 million related to the U.S. tax impact of the foreign tax credit regulations issued in the fourth quarter of 2019, $5 million related to net reductions in tax reserves, $3 million related to share-based compensation, $12 million related to various tax-related items, including the release of valuation allowances, tax rate changes and audit adjustments, and $52 million related to restructuring charges and various other items, offset by tax expense of $11 million related to the establishment of valuation allowances on the deferred tax assets of foreign subsidiaries. In addition, we recognized a gain of $4 million related to the deconsolidation of an affiliate, for which no tax expense was provided.items.
For information related to our valuation allowances, see "Other"— Other Matters — Significant Accounting Policies and Critical Accounting Estimates — Income Taxes" below.
Equity in net income of affiliates was $29$49 million for the year ended December 31, 2020,2023, as compared to $23$33 million for the year ended December 31, 2019.2022, primarily reflecting the higher earnings of certain of our joint ventures in Asia.
Net income attributable to Lear was $159$573 million, or $2.62$9.68 per diluted share, in 2020,2023, as compared to $754$328 million, or $12.75$5.47 per diluted share, in 2019.2022. Net income and diluted net income per share decreasedincreased for the reasons described above. In addition, diluted net income per share was impacted by the decrease in average shares outstanding between periods.
Reportable Operating Segments
We have two reportable operating segments: Seating and E-Systems. For a description of our reportable operating segments, see "Executive Overview" above.
The financial information presented below is for our two reportable operating segments and our other category for the periods presented. The other category includes unallocated costs related to corporate headquarters, regional headquarters and the elimination of intercompany activities, none of which meets the requirements for being classified as an operating segment. Corporate and regional headquarters costs include various support functions, such as information technology, advanced research and development, corporate finance, legal, executive administration and human resources. Financial measures regarding each segment’ssegment's pretax income before equity in net income of affiliates, interest expense, net and other expense, net ("segment earnings") and segment earnings divided by net sales ("margin") are not measures of performance under accounting principles generally accepted in the United States ("GAAP"). Segment earnings and the related margin are used by management to evaluate the performance of our reportable operating segments. Segment earnings should not be considered in isolation or as a substitute for net income attributable to Lear, net cash provided by operating activities or other income statement or cash flow statement data prepared in accordance with GAAP or as measures of profitability or liquidity. In addition, segment earnings, as we determine it, may not be comparable to related or similarly titled measures reported by other companies.
For a reconciliation of consolidated segment earnings to consolidated income before provision for income taxes and equity in net income of affiliates, see Note 15, "Segment Reporting," to the consolidated financial statements included in this Report.
Seating —
A summary of financial measures for our Seating segment is shown below (dollar amounts in millions):
| | For the year ended December 31, | For the year ended December 31, | 2020 | | 2019 | For the year ended December 31, | 2023 | | 2022 |
| Net sales | Net sales | $ | 12,712.7 | | | $ | 15,097.2 | |
Segment earnings (1) | Segment earnings (1) | 590.5 | | | 961.2 | |
| Margin | Margin | 4.6 | % | | 6.4 | % | Margin | 6.1 | % | | 5.7 | % |
(1)See definition above.
Seating net sales were $12.7$17.5 billion for the year ended December 31, 2020,2023, as compared to $15.1$15.7 billion for the year ended December 31, 2019, a decrease2022, an increase of $2.4$1.8 billion or (16%)12%. LowerHigher production volumes on Lear platforms globally, largely due to the COVID-19 pandemic, negativelyand new business favorably impacted net sales by nearly $2.7 billion. This decrease was partially offset by the impact$1.0 billion and $0.6 billion, respectively. Our acquisitions of new business, whichIGB and Kongsberg ICS also increased net sales by more than $0.4$0.2 billion.
Segment earnings, including restructuring costs, and the related margin on net sales were $591 million$1.1 billion and 4.6%6.1% in 2020,2023, as compared to $961$893 million and 6.4%5.7% in 2019. Lower2022. Higher production volumes on Lear platforms globally, largely due to the COVID-19 pandemic, and costs related to the COVID-19 pandemic negativelynew business positively impacted segment earnings by $586$215 million. FavorableThe impact of selling price reductions and higher restructuring costs were offset by favorable operating performance, including the benefit of commodity recoveries and operational restructuring actions, and lower restructuring costs were partially offset by the impact of selling price reductions.actions.
E-Systems —
A summary of financial measures for our E-Systems segment is shown below (dollar amounts in millions):
| | For the year ended December 31, | For the year ended December 31, | 2020 | | 2019 | For the year ended December 31, | 2023 | | 2022 |
| Net sales | Net sales | $ | 4,332.8 | | | $ | 4,713.1 | |
Segment earnings (1) | Segment earnings (1) | 98.1 | | | 366.3 | |
| Margin | Margin | 2.3 | % | | 7.8 | % | Margin | 3.9 | % | | 1.4 | % |
(1)See definition above.
E-Systems net sales were $4.3$5.9 billion for the year ended December 31, 2020,2023, as compared to $4.7$5.2 billion for the year ended December 31, 2019, a decrease2022, an increase of $0.4 billion$738 million or 8%14%. LowerHigher production volumes on Lear platforms globally, largely due to the COVID-19 pandemic, negativelyand new business favorably impacted net sales by more than $0.6 billion. This decrease was partially offset by the impact of new business, which increased net sales by nearly$0.4 billion and $0.3 billion.billion, respectively.
Segment earnings, including restructuring costs, and the related margin on net sales were $98$229 million and 2.3%3.9% in 2020,2023, as compared to $366$74 million and 7.8%1.4% in 2019. Lower2022. Higher production volumes on Lear platforms globally, largely due to the COVID-19 pandemic, and costs related to the COVID-19 pandemic negativelynew business positively impacted segment earnings by $234$93 million. ImprovedThe impact of favorable operating performance, including the benefit of operational restructuring actions, and lower restructuring costs was more thanpartially offset by the impact of selling price reductions and, to a lesser extent, higher restructuring costs.reductions.
Other —
A summary of financial measures for our other category, which is not an operating segment, is shown below (dollar amounts in millions):
| | For the year ended December 31, | For the year ended December 31, | 2020 | | 2019 | For the year ended December 31, | 2023 | | 2022 |
| Net sales | Net sales | $ | — | | | $ | — | |
Segment earnings (1) | Segment earnings (1) | (234.5) | | | (257.3) | |
| Margin | Margin | N/A | | N/A | Margin | N/A | | N/A |
(1)See definition above.
Segment earnings related to our other category were ($235)363) million in 2020,2023, as compared to ($257)313) million in 2019,2022, primarily reflecting lowerhigher compensation-related costs and costs related to our efficiency initiatives including investments in 2020.information technology.
Year Ended December 31, 2019,2022, Compared With Year Ended December 31, 20182021
For a discussion of our results of operations for the year ended December 31, 2019,2022, compared with the year ended December 31, 2018,2021, refer to our Annual Report on Form 10-K for the year ended December 31, 2019.2022.
Liquidity and Financial ConditionCapital Resources
Our primary liquidity needs are to fund general business requirements, including working capital requirements, capital expenditures, operational restructuring actions and debt service requirements. Our principal sources of liquidity are cash flows from operating activities, borrowings under available credit facilities and our existing cash balance.
Cash Provided by Subsidiaries
A substantial portion of our operating income is generated by our subsidiaries. As a result, we are dependent on the earnings and cash flows of and the combination of dividends, royalties, intercompany loan repayments and other distributions and advances from our subsidiaries to provide the funds necessary to meet our obligations.
As of December 31, 2023 and 2022, cash and cash equivalents of $803 million and $790 million, respectively, were held in foreign subsidiaries and can be repatriated, primarily through the repayment of intercompany loans and the payment of dividends. There are no material restrictions on the ability of our subsidiaries to pay dividends or make other distributions to Lear.
For further information regarding potential dividends from our non-U.S. subsidiaries, see "— Adequacy of Liquidity Sources" below and Note 9, "Income Taxes," to the consolidated financial statements included in this Report.
Adequacy of Liquidity Sources
As of December 31, 2020,2023, we had approximately $1.3$1.2 billion of cash and cash equivalents on hand and $1.75$2.0 billion in available borrowing capacity under our Revolving Credit Facility.credit agreement. Together with cash provided by operating activities, we believe that this will enable us to meet our liquidity needs for the foreseeable future and to satisfy ordinary course business obligations.
In response to the COVID-19 pandemic, we took a number of proactive steps to preserve cash and maximize our financial flexibility in order to efficiently manage through the COVID-19 pandemic, including:
•Aggressively reducing operating costs, capital expenditures and working capital, including reducing discretionary spending
•Reducing salaried employee costs throughout the organization through salary reductions and deferrals
•Suspending share repurchases and quarterly dividends
•Maximizing opportunities offered under government incentive programs throughout the world
•Reducing the compensation of the Board of Directors
•Reducing hourly factory worker costs through temporary layoffs
•Delaying planned pension funding and deferring other retirement plan contributions
In the second half of the year, we reversed certain of the employee-related austerity measures as industry production recovered and financial performance improved. Further, we announced the restoration of compensation levels for our Board of Directors and executive officers and reinstated the quarterly cash dividend at $0.25 per share of common stock.
In addition, we expect to continue to pay quarterly cash dividends and resume share repurchasesrepurchase shares of our common stock pursuant to our authorized common stock share repurchase program, (see Item 5, "Market foralthough such actions are at the Company’s Common Equity, Related Stockholder Mattersdiscretion of our Board and Issuer Purchaseswill depend upon our financial condition, results of Equity Securities"). operations, capital requirements, prevailing market conditions, alternative uses of capital and other factors that our Board may consider at its discretion.
Our future financial results and our ability to continue to meet our liquidity needs are subject to, and will be affected by, cash flows from operations, including the continuing effects of the COVID-19 pandemic, as well as restructuring activities, automotive industry conditions, the financial condition of our customers and suppliers, supply chain disruptions and other related factors. Additionally, an economic downturn or further reduction in production levels could negatively impact our financial condition.
For further discussion of the risks and uncertainties affecting our cash flows from operations and our overall liquidity, see Part I — Item 1A, "Risk Factors," and "— Executive Overview" above and "— Forward-Looking Statements" below.
Cash Provided by Subsidiaries
A substantial portion of our operating income is generated by our subsidiaries. As a result, we are dependent on the earnings and cash flows of and the combination of dividends, royalties, intercompany loan repayments and other distributions and advances from our subsidiaries to provide the funds necessary to meet our obligations.
As of December 31, 2020 and 2019, cash and cash equivalents of $780 million and $895 million, respectively, were held in foreign subsidiaries and can be repatriated, primarily through the repayment of intercompany loans and the payment of dividends, without creating additional income tax expense. There are no significant restrictions on the ability of our subsidiaries to pay dividends or make other distributions to Lear. For further information regarding potential dividends from our non-U.S. subsidiaries, see "— Adequacy of Liquidity Sources" above and Note 9, "Income Taxes," to the consolidated financial statements included in this Report.
Cash Flows
Year Ended December 31, 2020,2023, Compared with Year Ended December 31, 20192022
A summary of net cash provided by operating activities is shown below (in millions):
| | For the year ended December 31, | For the year ended December 31, | 2020 | | 2019 | | Increase (Decrease) in Operating
Cash Flow | For the year ended December 31, | 2023 | | 2022 | | Increase (Decrease) in
Cash Flow |
| Consolidated net income and depreciation and amortization | Consolidated net income and depreciation and amortization | $ | 774 | | | $ | 1,341 | | | $ | (567) | |
| Net change in working capital items: | Net change in working capital items: | |
| Accounts receivable | |
| Accounts receivable | |
| Accounts receivable | Accounts receivable | (165) | | | (116) | | | (49) | |
| Inventory | Inventory | (108) | | | (69) | | | (39) | |
| Other current assets | Other current assets | (63) | | | 71 | | | (134) | |
| Accounts payable | Accounts payable | 214 | | | (6) | | | 220 | |
| Accrued liabilities | Accrued liabilities | 55 | | | 94 | | | (39) | |
| Net change in working capital items | Net change in working capital items | (67) | | | (26) | | | (41) | |
| Other | Other | (44) | | | (31) | | | (13) | |
| Net cash provided by operating activities | Net cash provided by operating activities | $ | 663 | | | $ | 1,284 | | | $ | (621) | |
| | Net cash used in investing activities | |
| Net cash used in investing activities | |
| Net cash used in investing activities | |
| | Net cash used in financing activities | |
| Net cash used in financing activities | |
| Net cash used in financing activities | |
In 2020 and 2019, netNet cash provided by operating activitiesactivities was $663 million and $1,284 million, respectively. $1.2 billion in 2023, as compared to $1.0 billion in 2022. The overall decreaseincrease in operating cash flows of $621 million wasflow primarily attributable to lowerreflects our higher earnings in 2020. Increases in accounts receivable, inventory and accounts payable primarily reflect higher production volumes at the end of 2020,2023 as compared to the end of 2019.2022.
Net cash used in investing activities was $469$762 million in 2020,2023, as compared to $922$830 million in 2019.2022. In 2019,2023, we paid $322$175 million for theour IGB acquisition. In 2022, we paid $188 million for our Kongsberg ICS acquisition of Xevo.and $15 million related to investments in affiliates. In 2020,2023, capital spending was $452$627 million, reflecting a delay in certain program launches and a reduction in discretionary spending in response to the COVID-19 pandemic, as compared to $604$638 million in 2019.2022. Capital spending in 2021 is estimated at $600 million.to be approximately $675 million in 2024.
Net cash used in financing activities was $412$420 million in 2020,2023, as compared to $362$387 million in 2019. As a proactive measure in response to the COVID-19 pandemic,2022. In 2023, we borrowed $1.0 billion$150 million under the Revolving Credit Facility in the first quarter of 2020, which was repaid in full in the third quarter of 2020. In 2020, we received net proceeds of $669 million related to the issuance of 2030 and 2049 Notesour Term Loan and paid $6 million of related issuance costs and $667 million related to the redemption of the outstanding 2025 Notes. Also in 2020, we paid $70$297 million for repurchases of our common stock, $67$182 million ofin dividends to Lear stockholders and $123$79 million ofin dividends to noncontrolling interest holders. In 2019, we received net proceeds of $693 million related to the issuance of 2029 and 2049 Notes and paid $7 million of related issuance costs and $334 million related to the redemption of the outstanding 2024 Notes. Also in 2019,2022, we paid $385$100 million for repurchases of our common stock, $186 million ofin dividends to Lear stockholders and $79$85 million ofin dividends to noncontrolling interest holders.
For further information regarding our 20202023 and 20192022 financing transactions, see "— Capitalization" below and Note 7, "Debt," and Note 12, "Capital Stock, Accumulated Other Comprehensive Loss and Equity," to the consolidated financial statements included in this Report.
Year Ended December 31, 2019,2022, Compared with Year Ended December 31, 20182021
For a discussion of our cash flows for the year ended December 31, 2019,2022, compared with the year ended December 31, 2018,2021, refer to our Annual Report on Form 10-K for the year ended December 31, 2019.2022.
Capitalization
From time to time, weShort-Term Borrowings
We utilize uncommitted lines of credit to fundas needed for our capital expenditures andshort-term working capital requirements at certain of our foreign subsidiaries, in addition to cash provided by operating activities.fluctuations. As of December 31, 2020,2023 and 2022, we had no short-term debt balances outstanding. lines of credit from banks totaling $338 million and $298 million, respectively. As of December 31, 2019,2023 and 2022, we had short-term debt balances outstanding related to draws on our lines of $19 million. credit of $28 million and $10 million, respectively.
The availability of uncommitted lines of credit may be affected by our financial performance, credit ratings and other factors.
Senior Notes
As of December 31, 2020,2023, our senior notes (collectively, the "Notes") consist of the amounts shown below (in millions, except stated coupon rates):
| | Note | Note | | Aggregate Principal Amount at Maturity | | Stated Coupon Rate | Note | | Aggregate Principal Amount at Maturity | | Stated Coupon Rate |
| Senior unsecured notes due 2027 (the "2027 Notes") | Senior unsecured notes due 2027 (the "2027 Notes") | | $ | 750 | | | 3.80% | Senior unsecured notes due 2027 (the "2027 Notes") | | $ | 550 | | | 3.80% | | 3.80% |
| Senior unsecured notes due 2029 (the "2029 Notes") | Senior unsecured notes due 2029 (the "2029 Notes") | | 375 | | | 4.25% | Senior unsecured notes due 2029 (the "2029 Notes") | | 375 | | | 4.25% | | 4.25% |
| 2030 Notes | | 350 | | | 3.50% |
| 2049 Notes | | 625 | | | 5.25% |
| $ | 2,100 | | | |
| Senior unsecured notes due 2030 (the "2030 Notes") | | Senior unsecured notes due 2030 (the "2030 Notes") | | 350 | | | 3.50% |
| Senior unsecured notes due 2032 (the "2032 Notes") | | Senior unsecured notes due 2032 (the "2032 Notes") | | 350 | | | 2.60% |
| Senior unsecured notes due 2049 (the "2049 Notes") | | Senior unsecured notes due 2049 (the "2049 Notes") | | 625 | | | 5.25% |
| Senior unsecured notes due 2052 (the "2052 Notes") | | Senior unsecured notes due 2052 (the "2052 Notes") | | 350 | | | 3.55% |
| | $ | |
The issue, maturity and interest payment dates of the Notes are shown below:
| | | | | | | | | | | | | | | | | | | | |
| Note | | Issuance Date | | Maturity Date | | Interest Payment Dates |
| 2027 Notes | | August 2017 | | September 15, 2027 | | March 15 and September 15 |
| 2029 Notes | | May 2019 | | May 15, 2029 | | May 15 and November 15 |
| 2030 Notes | | February 2020 | | May 30, 2030 | | May 30 and November 30 |
| 2032 Notes | | November 2021 | | January 15, 2032 | | January 15 and July 15 |
| 2049 Notes | | May 2019 and February 2020 | | May 15, 2049 | | May 15 and November 15 |
| 2052 Notes | | November 2021 | | January 15, 2052 | | January 15 and July 15 |
In 2020,2021, we issued $350 million in aggregate principal amount at maturity of 20302032 Notes and an additional $300$350 million in aggregate principal amount at maturity of 20492052 Notes. The 20302032 Notes have a stated coupon rate of 3.5%2.6% and were issued at 99.774%99.782% of par, resulting in a yield to maturity of 3.525%2.624%. The 20492052 Notes have a stated coupon rate of 5.25%3.55% and were issued at 106.626%99.845% of par, resulting in a yield to maturity of 4.821%3.558%.
The net proceeds from the offering were $669of $699 million, after original issue discount. The proceedsdiscount, were used, in part, to redeemfund the $650tender of $200 million in aggregate principal amount of 20252027 Notes at a redemption price equaland the repayment in full of $206 million outstanding on our term loan facility under our credit agreement (see "— Credit Agreement" below). The remaining net proceeds were used to 102.625%finance the 2022 acquisition of Kongsberg ICS and for general corporate purposes. For further information related to the principal amount of such 2025 Notes, plus accrued interest.Kongsberg ICS acquisition, see Note 4, "Acquisitions," to the consolidated financial statements included in this Report.
In connection with these transactions, we recognized a loss of $21$24 million on the extinguishment of debt and paid related issuance costs of $6$7 million.
The indentures governing the Notes contain certain restrictive covenants and customary events of default. As of December 31, 2020,2023, we were in compliance with all covenants under the indentures governing the Notes.
For further information related to the Notes, including information on early redemption, covenants and events of default, see Note 7, "Debt," to the consolidated financial statements included in this Report and the indentures governing the Notes, which have been incorporated by reference as exhibits to this Report.
Credit Agreement
Our Credit Agreement,unsecured credit agreement, dated August 8, 2017, consistsconsisted of a $1.75 billion Revolvingrevolving credit facility (the "Revolving Credit FacilityFacility") and a $250 million Termterm loan facility (the "Term Loan Facility. Facility").
In 2020,October 2021, we entered into an amended and restated credit agreement (the "Credit Agreement") that increased the Revolving Credit Facility to extend$2.0 billion and extended the maturity date to October 28, 2026. In November 2021, we repaid in full $206 million outstanding on the Term Loan Facility. In connection with these transactions, we recognized a loss of approximately $1 million on the extinguishment of debt and paid related issuance costs of approximately $3 million.
In November 2023, we extended the maturity date of the Revolving Credit Facility by one year to August October 28, 2024,2027.
In 2023 and paid related issuance costs of $12021, there were no borrowings or repayments under the Revolving Credit Facility. In 2022, aggregate borrowings and repayments under the Revolving Credit Facility were $65 million. The maturity date of the Term Loan Facility is August 8, 2022. As of December 31, 20202023 and 2019,2022, there were no borrowings outstanding under the Revolving Credit Facility and $220 million and $234 million, respectively, outstanding under the Term Loan Facility.
In March 2020, as a proactive measure in response to the COVID-19 pandemic, we borrowed $1.0 billion under the Revolving Credit Facility, which was repaid in full in September 2020.
The Credit Agreement contains various financial and other covenants that require us to remain below a maximum leverage coverage ratio. As of December 31, 2020,2023, we were in compliance with all covenants under the Credit Agreement. Although we expect to maintain compliance with all covenants, the impact of the COVID-19 pandemic may negatively affect our ability to comply with certain of these covenants. In the event that we are unable to maintain compliance with such covenants, we expect to obtain an amendment or waiver from our lenders, refinance the indebtedness subject to the covenants or take other mitigating actions prior to a potential breach.Agreement.
For further information related to the Credit Agreement, including information on pricing, covenants and events of default, see Note 7, "Debt," to the consolidated financial statements included in this Report and the amended and restated credit agreement,Credit Agreement, which has been incorporated by reference as an exhibit to this Report.
Accounts Receivable FactoringTerm Loan
DuringIn May 2023, we borrowed $150 million under our Term Loan to finance, in part, the acquisition of IGB.
The Term Loan contains the same covenants as the Credit Agreement. As of December 31, 2023, we were in compliance with all covenants under the Term Loan.
For further information related to our acquisition of IGB, see Note 4, "Acquisitions," to the consolidated financial statements included in this Report. For further information related to our Term Loan, see Note 7, "Debt," to the consolidated financial statements included in this Report.
Common Stock Share Repurchase Program
See Item 5, "Market for the Company's Common Equity, Related Stockholder Matters and Issuer Purchases of Equity Securities."
Dividends
In 2023 and 2022, our Board declared a quarterly cash dividend of $0.77 per share of common stock in all quarters. In 2021, our Board declared a quarterly cash dividend of $0.25 per share of common stock in the first and second quarters, a quarterly cash dividend of $0.50 per share of common stock in the third quarter and a quarterly cash dividend of 2020, we entered into an uncommitted factoring arrangement which provides for aggregate$0.77 per share of common stock in the fourth quarter.
We expect to continue to pay quarterly cash dividends in the future, although such payments are at the discretion of our Board and will depend upon our financial condition, results of operations, capital requirements, prevailing market conditions, alternative uses of capital and other factors that our Board may consider at its discretion. See "— Forward-Looking Statements" below and Note 7, "Debt," to the consolidated financial statements included in this Report.
Commodity Prices
Raw material, energy and commodity costs can be volatile, reflecting, among other things, changes in supply and demand, logistics issues, global trade and tariff policies, and geopolitical issues. We have commodity price risk with respect to purchases of specified customer accountscertain raw materials, including steel, copper, diesel fuel, chemicals, resins and leather. Our primary commodity cost exposures relate to steel, copper and leather. We have developed and implemented strategies to mitigate the impact of such costs through the selective in-sourcing of components, the continued consolidation of our supply base, longer-term purchase commitments, contractual recovery mechanisms and the selective expansion of low-cost country sourcing and engineering, as well as value engineering and product benchmarking. Further, the majority of the steel used in North America. The factoring arrangementour products is comprised of fabricated components that are integrated into a seat system, such as seat frames, recliner mechanisms, seat tracks and other mechanical components. Therefore, our exposure to changes in steel prices is primarily indirect, through purchased components. Additionally, approximately 91%of our copper purchases and a significant portion of our leather and direct steel purchases are subject to price index agreements with our customers and suppliers. Certain of these strategies also may limit our opportunities in a declining commodity price environment. In the current environment of elevated raw material, energy and commodity costs, these strategies, together with commercial negotiations with our customers and suppliers, have offset a significant portion of the adverse impact. If these costs increase, it could have an adverse impact on our operating results in true sales of the factored receivables, which are excluded from amounts reportedforeseeable future.
See Part I — Item 1A, "Risk Factors — Increases in the costs and restrictions on the availability of raw materials, energy, commodities, product components and labor could adversely affect our financial performance," and "— Forward-Looking Statements" below.
For further information related to the financial instruments described above, see Note 16, "Financial Instruments," to the consolidated balance sheets when the receivables are factoredfinancial statements included in accordance with ASC 860, "Transfers and Servicing." There were no receivables factored during 2020. We cannot provide any assurances that the factoring arrangement will be available or utilized in the future.this Report.
Contractual Obligations and Cash Requirements
The scheduled maturitiesOur material cash requirements include the following contractual and other obligations:
Debt obligations and interest expense associated with debt obligations
As of the Notes, obligationsDecember 31, 2023, we had $2.6 billion of outstanding senior unsecured notes maturing in 2027 through 2052 and a $150 million outstanding Term Loan maturing in 2026, as well as $2.0 billion in available borrowing capacity under theour Revolving Credit Agreement and scheduled interest paymentsFacility maturing in 2027.
Interest on the Notes as of December 31, 2020,is due biannually at varying dates. Scheduled interest payments are shown below (in millions):
| | | | | | | | | | | | | | | | | | | | | | | | | | | | | | | | | | | | | | | | | |
| 2021 | | 2022 | | 2023 | | 2024 | | 2025 | | Thereafter | | Total |
| Senior notes | $ | — | | | $ | — | | | $ | — | | | $ | — | | | $ | — | | | $ | 2,100 | | | $ | 2,100 | |
| Credit agreement — term loan facility | 14 | | | 206 | | | — | | | — | | | — | | | — | | | 220 | |
| Scheduled interest payments | 90 | | | 90 | | | 90 | | | 90 | | | 90 | | | 937 | | | 1,387 | |
| Total | $ | 104 | | | $ | 296 | | | $ | 90 | | | $ | 90 | | | $ | 90 | | | $ | 3,037 | | | $ | 3,707 | |
| | | | | | | | | | | | | | | | | | | | | | | | | | | | | | | | | | | | | | | | | |
| 2024 | | 2025 | | 2026 | | 2027 | | 2028 | | Thereafter | | Total |
| Scheduled interest payments | $ | 103 | | | $ | 103 | | | $ | 103 | | | $ | 103 | | | $ | 83 | | | $ | 1,024 | | | $ | 1,519 | |
For further information related to our debt, see "— Capitalization — Senior Notes," "— Credit Agreement" and "— Term Loan" above and Note 7, "Debt," to the consolidated financial statements included in this Report.
Purchase obligations
We enter into agreements with our customers to produce products at the beginning of a vehicle’svehicle's life cycle. Although suchthese agreements do not provide for a specified quantity of products, once we enterentered into, such agreements, we are generally required to fulfill our customers’customers' purchasing requirements for the production life of the vehicle. Prior to being formally awarded a program, we typically work closely with our customers in the early stages of the design and engineering of a vehicle’svehicle's systems. Failure to complete the design and engineering work related to a vehicle’svehicle's systems, or to fulfill a customer’s contract,customer agreement, could have a material adverse impact on our business.
We also enter into agreements with suppliers to assist us in meeting our customers’customers' production needs. These agreements vary as to duration and quantity commitments. Historically, most have been short-term agreements, which do not provide for minimum purchases, or are requirements-based contracts.agreements.
Leases
The Company has operating leases for production, office and warehouse facilities, manufacturing and office equipment, and vehicles with future lease obligations ranging from 2024 through 2047. Maturities of operating leases obligations are shown below (in millions):
| | | | | | | | | | | | | | | | | | | | | | | | | | | | | | | | | | | | | | | | | |
| 2024 | | 2025 | | 2026 | | 2027 | | 2028 | | Thereafter | | Total |
| Operating lease obligations | $ | 178 | | | $ | 156 | | | $ | 131 | | | $ | 109 | | | $ | 88 | | | $ | 213 | | | $ | 875 | |
For further information related to our lease obligations, see Note 8, "Leases," to the consolidated financial statements included in this Report.
Taxes
We may be required to make significant cash outlays related to our unrecognized tax benefits, including interest and penalties. As of December 31, 2023, we had unrecognized tax benefits, including interest and penalties, of $45 million. However, due to the uncertainty of the timing of future cash flows associated with our unrecognized tax benefits, we are unable to make reasonably reliable estimates of the period of cash settlement, if any, with the respective taxing authorities. Accordingly, unrecognized tax benefits, including interest and penalties, of $49 million as of December 31, 2020, have been excluded from the contractual obligations table above.
For further information related to our unrecognized tax benefits, see Note 9, "Income Taxes," to the consolidated financial statements included in this Report.
Pension and postretirement obligations
We also have minimum funding requirements with respect to certain of our pension obligation.benefit obligations. We may elect to make contributions in excess of the minimum funding requirements in response to investment performance or changes in interest rates or when we believe that it is financially advantageous to do so and based on our other cash requirements. Our minimum funding requirements after 20212024 will depend on several factors, including investment performance and interest rates. Our minimum funding requirements may also be affected by changes in applicable legal requirements. Our minimum required contributionsContributions to our domestic and foreign pension plans, including distributions to participants in certain of our non-qualified defined benefit pension plans are expected to be approximately $5 million to $10$2 million in 2021. We also have payments due with respect to our postretirement benefit obligation. 2024.
We do not fund our postretirement benefit obligation.obligations and certain of our pension benefit obligations. Rather, benefit payments
are made to eligible participants as costs are incurred by covered retirees.incurred. We expect benefit payments related to our unfunded pension and postretirement benefit obligationobligations to be approximately $5$7 million and $4 million, respectively, in 2021.2024.
For further information related to our pension and other postretirement benefit plans, see "— Other Matters — Pension and Other Postretirement Benefit Plans" below and Note 10, "Pension and Other Postretirement Benefit Plans," to the consolidated financial statements included in this Report.
Common Stock Share Repurchase Program
See Item 5, "Market for the Company’s Common Equity, Related StockholderOther Matters
Legal and Issuer Purchases of Equity Securities."
Dividends
In March 2020, as a proactive measure in response to the COVID-19 pandemic, we suspended our quarterly cash dividend. Prior to the suspension, our Board of Directors declared a cash dividend of $0.77 per share of common stock in the first quarter of 2020. The quarterly cash dividend was reinstated in the fourth quarter of 2020 at $0.25 per share of common stock. In 2019 and 2018, our Board of Directors declared quarterly cash dividends of $0.75 and $0.70, respectively, per share of common stock.Environmental Matters
We currently expectare involved from time to pay quarterly cash dividendstime in various legal proceedings and claims, including, without limitation, commercial and contractual disputes, product liability claims, and environmental and other matters. As of December 31, 2023, we had recorded reserves for pending legal disputes, including commercial and contractual disputes, product liability claims and other legal matters, of $14 million. In addition, as of December 31, 2023, we had recorded reserves for warranty and recall matters of $32 million and environmental matters of $5 million. Although these reserves were determined in accordance with GAAP, the future, although such paymentsultimate outcomes of these matters are at the discretioninherently uncertain, and actual results may differ significantly from current estimates. For a description of risks related to various legal proceedings and claims, see Part I — Item 1A, "Risk Factors." For a more complete description of our Board of Directorsoutstanding material legal proceedings, see Note 14, "Legal and will depend upon our financial condition, results of operations, capital requirements, alternative uses of capital and other factors that our Board of Directors may consider at its discretion. See "— Forward-Looking Statements" below and Note 7, "Debt,Other Contingencies," to the consolidated financial statements included in this Report.
Critical Accounting Estimates
Certain of our accounting policies require management to make estimates and assumptions that affect the reported amounts of assets and liabilities as of the date of the consolidated financial statements and the reported amounts of revenues and expenses during the reporting period. These estimates and assumptions are based on our historical experience, the terms of existing contracts, our evaluation of trends in the industry, information provided by our customers and suppliers and information available from other outside sources, as appropriate. However, these estimates and assumptions are subject to an inherent degree of uncertainty. Accordingly, actual results in these areas may differ significantly from our estimates.
We consider an accounting estimate to be critical if it requires us to make assumptions about matters that were uncertain at the time the estimate was made and changes in the estimate would have had a significant impact on our consolidated financial position or results of operations.
Revenue Recognition
We enter into contracts with our customers to provide production parts generally at the beginning of a vehicle's life cycle. Typically, these contracts do not provide for a specified quantity of products, but once entered into, we are often expected to fulfill our customers' purchasing requirements for the production life of the vehicle. Many of these contracts may be terminated by our customers at any time. Historically, terminations of these contracts have been infrequent. We receive purchase orders from our customers, which provide the commercial terms for a particular production part, including price (but not quantities). Contracts may also provide for annual price reductions over the production life of the vehicle, and prices may be adjusted on an ongoing basis to reflect changes in product content/cost and other commercial factors.
Revenue is recognized at a point in time when control of the product is transferred to the customer under standard commercial terms, as we do not have an enforceable right to payment prior to such transfer. The amount of revenue recognized reflects the consideration that we expect to be entitled to in exchange for those products based on the current purchase orders, annual price reductions and ongoing price adjustments. Our customers pay for products received in accordance with payment terms that are customary within the industry. Our contracts with our customers do not have significant financing components. We record a contract liability for advances received from our customers.
Amounts billed to customers related to shipping and handling costs are included in net sales in the consolidated statements of income. Shipping and handling costs are accounted for as fulfillment costs and are included in cost of sales in the consolidated statements of income.
Taxes assessed by a governmental authority that are both imposed on and concurrent with a specific revenue-producing transaction that we collect from a customer are excluded from revenue.
Income Taxes
We account for income taxes in accordance with GAAP. Deferred tax assets and liabilities are recognized for the future tax consequences attributable to temporary differences between financial statement carrying amounts of existing assets and liabilities and their respective tax bases and tax loss and credit carryforwards. Deferred tax assets and liabilities are measured
using enacted tax rates expected to apply to taxable income for the years in which those temporary differences are expected to be recovered or settled.
Our current and future provision for income taxes is impacted by the initial recognition of and changes in valuation allowances in certain countries. We intend to maintain these allowances until it is more likely than not that the deferred tax assets will be realized. Our future provision for income taxes will include no tax benefit with respect to losses incurred and, except for certain jurisdictions, no tax expense with respect to income generated in these countries until the respective valuation allowances are eliminated. Accordingly, income taxes are impacted by changes in valuation allowances and the mix of earnings among jurisdictions. We evaluate the realizability of our deferred tax assets on a quarterly basis. In completing this evaluation, we consider all available evidence in order to determine whether, based on the weight of the evidence, a valuation allowance for our deferred tax assets is necessary. Such evidence includes historical results, future reversals of existing taxable temporary differences and expectations for future taxable income (exclusive of the reversal of temporary differences and carryforwards), as well as the implementation of feasible and prudent tax planning strategies. If, based on the weight of the evidence, it is more likely than not that all or a portion of our deferred tax assets will not be realized, a valuation allowance is recorded.
As of December 31, 2023, we had a valuation allowance related to tax loss and credit carryforwards and other deferred tax assets of $31 million in the United States and $398 million in several international jurisdictions. If operating results improve or decline on a continual basis in a particular jurisdiction, our decision regarding the need for a valuation allowance could change, resulting in either the initial recognition or reversal of a valuation allowance in that jurisdiction, which could have a significant impact on income tax expense in the period recognized and subsequent periods. In determining the provision for income taxes for financial statement purposes, we make certain estimates and judgments, which affect our evaluation of the carrying value of our deferred tax assets, as well as our calculation of certain tax liabilities.
The calculation of our gross unrecognized tax benefits and liabilities includes uncertainties in the application of, and changes in, complex tax regulations in a multitude of jurisdictions across our global operations. We recognize tax benefits and liabilities based on our estimate of whether, and the extent to which, additional taxes will be due. We adjust these benefits and liabilities based on changing facts and circumstances; however, due to the complexity of these uncertainties and the impact of tax audits, the ultimate resolutions may differ significantly from our estimates.
For further information, see "— Forward-Looking Statements" below and Note 9, "Income Taxes," to the consolidated financial statements included in this Report.
Use of Estimates
The preparation of the consolidated financial statements in conformity with GAAP requires management to make estimates and assumptions that affect the reported amounts of assets and liabilities as of the date of the consolidated financial statements and the reported amounts of revenues and expenses during the reporting period. During 2023, there were no material changes in the methods or policies used to establish estimates and assumptions. Other matters subject to estimation and judgment include amounts related to accounts receivable realization, inventory obsolescence, asset impairments, useful lives of fixed and intangible assets, unsettled pricing discussions with customers and suppliers, restructuring accruals, deferred tax asset valuation allowances and income taxes, pension and other postretirement benefit plan assumptions, accruals related to litigation, and warranty and environmental remediation costs. Actual results may differ significantly from our estimates.
Recently Issued Accounting Pronouncements
For information on the impact of recently issued accounting pronouncements, see Note 17, "Accounting Pronouncements," to the consolidated financial statements included in this Report.
Forward-Looking Statements
The Private Securities Litigation Reform Act of 1995 provides a safe harbor for forward-looking statements made by us or on our behalf. The words "will," "may," "designed to," "outlook," "believes," "should," "anticipates," "plans," "expects," "intends," "estimates," "forecasts" and similar expressions identify certain of these forward-looking statements. We also may provide forward-looking statements in oral statements or other written materials released to the public. All such forward-looking statements contained or incorporated in this Report or in any other public statements which address operating performance, events or developments that we expect or anticipate may occur in the future, including, without limitation, statements related to business opportunities, awarded sales contracts, sales backlog and ongoing commercial arrangements, or statements expressing views about future operating results, are forward-looking statements. Actual results may differ materially from any or all forward-looking statements made by us. Important factors, risks and uncertainties that may cause actual results to differ materially from anticipated results include, but are not limited to:
•general economic conditions in the markets in which we operate, including changes in interest rates or currency exchange rates;
•changes in actual industry vehicle production levels from our current estimates;
•fluctuations in the production of vehicles or the loss of business with respect to, or the lack of commercial success of, a vehicle model for which we are a significant supplier;
•the outcome of customer negotiations and the impact of customer-imposed price reductions;
•increases in the costs and restrictions on the availability of raw materials, energy, commodities, product components and labor and our ability to mitigate such costs and insufficient availability;
•disruptions in relationships with our suppliers;
•the financial condition of and adverse developments affecting our customers and suppliers;
•risks associated with conducting business in foreign countries, including the risk of war or other geopolitical conflicts;
•currency controls and the ability to economically hedge currencies;
•global sovereign fiscal matters and creditworthiness, including potential defaults and the related impacts on economic activity, including the possible effects on credit markets, currency values, monetary unions, international treaties and fiscal policies;
•competitive conditions impacting us and our key customers and suppliers;
•labor disputes, including disruptions, involving us or our significant customers or suppliers or that otherwise affect us;
•the consequences of violations of law by our employees, agents or business partners, including violations related to anti-bribery, competition, export and import, trade sanctions, data privacy, environmental, human rights and other laws;
•the operational and financial success of our joint ventures;
•our ability to attract, develop, engage and retain qualified employees;
•our ability to respond to the evolution of the global transportation industry;
•the outcome of an increased emphasis on global climate change and other sustainability matters by stakeholders;
•the impact of global climate change;
•the impact of pandemics, epidemics, disease outbreaks and other public health crises on our business;
•the impact and timing of program launch costs and our management of new program launches;
•changes in discount rates and the actual return on pension assets;
•impairment charges initiated by adverse industry or market developments;
•our ability to execute our strategic objectives;
•limitations imposed by our existing indebtedness and our ability to access capital markets on commercially reasonable terms;
•disruptions to our information technology systems, or those of our customers or suppliers, including those related to cybersecurity;
•increases in our warranty, product liability or recall costs;
•the outcome of legal or regulatory proceedings to which we are or may become a party;
•the impact of pending legislation and regulations or changes in existing federal, state, local or foreign laws or regulations;
•the impact of regulations on our foreign operations;
•costs associated with compliance with environmental laws and regulations;
•developments or assertions by or against us relating to intellectual property rights;
•the impact of changes in our effective tax rate, the adoption of new tax legislation or exposure to additional income tax liabilities on our profitability;
•the impact of administrative policy, including protectionist trade policies, in the United States and related actions by countries in which we do business; and
•other risks, described in Part I — Item 1A, "Risk Factors," as well as the risks and information provided from time to time in our other filings with the Securities and Exchange Commission.
The forward-looking statements in this Report are made as of the date hereof, and we do not assume any obligation to update, amend or clarify them to reflect events, new information or circumstances occurring after the date hereof.
ITEM 7A — QUANTITATIVE AND QUALITATIVE DISCLOSURES ABOUT MARKET RISK
Market Risk SensitivityLegal and Environmental Matters
In the normal courseWe are involved from time to time in various legal proceedings and claims, including, without limitation, commercial or contractual disputes, product liability claims, and environmental and other matters. For a description of business, we are exposed to market risks associated with fluctuations in foreign exchange rates, interest rates and commodity prices. We manage a portion of these risks through the use of derivative financial instruments in accordance with our policies. We enter into all hedging transactions for periods consistent with the underlying exposures. We do not enter into derivative instruments for trading purposes.
Foreign Exchange
Operating results may be impacted by our buying, selling and financing in currencies other than the functional currency of our operating companies ("transactional exposure"). We may mitigate a portion of this risk by entering into forward foreign exchange, futures and option contracts. The foreign exchange contracts are executed with banks that we believe are creditworthy. Gains and losses related to foreign exchange contracts are deferred where appropriatevarious legal proceedings and included in the measurement of the foreign currency transaction subject to the hedge. Gains and losses incurred related to foreign exchange contracts are generally offset by the direct effects of currency movements on the underlying transactions.
A summary of the notional amount and estimated aggregate fair valueclaims, see Item 1A, "Risk Factors." For a description of our outstanding foreign exchange contracts is shown below (in millions):
| | | | | | | | | | | |
| December 31, | 2020 | | 2019 |
| Notional amount (contract maturities < 24 months) | $ | 2,494 | | | $ | 2,163 | |
| Fair value | 48 | | | 50 | |
Currently, our most significant foreign currency transactional exposures relatematerial legal proceedings, see Note 14, "Legal and Other Contingencies," to the Mexican peso, various European currencies,consolidated financial statements included in this Report.
ITEM 4 – MINE SAFETY DISCLOSURES
Not applicable.
SUPPLEMENTARY ITEM – INFORMATION ABOUT OUR EXECUTIVE OFFICERS
The following table sets forth the Chinese renminbi, the Thai baht, the Japanese yen, the Brazilian realnames, ages and the Honduran lempira. A sensitivity analysispositions of our net transactional exposure is shown below (in millions):
| | | | | | | | | | | | | | | | | |
| | | Potential Earnings Benefit (Adverse Earnings Impact) |
| December 31, | Hypothetical Strengthening % (1) | | 2020 | | 2019 |
U.S. dollar | 10% | | $ | 23 | | | $ | (16) | |
| Euro | 10% | | (4) | | | 19 | |
(1) Relative to all other currencies to which it is exposed for a twelve-month period.
A sensitivity analysis related toexecutive officers. Executive officers are appointed annually by our Board of Directors (the "Board") and serve at the aggregate fair valuepleasure of our outstanding foreign exchange contractsBoard.
| | | | | | | | |
| Name | Age | Position |
| Jason M. Cardew | 53 | Senior Vice President and Chief Financial Officer |
| Alicia J. Davis | 53 | Senior Vice President and Chief Strategy Officer |
| Amy A. Doyle | 56 | Vice President and Chief Accounting Officer |
| Carl A. Esposito | 56 | Senior Vice President and President, E-Systems |
| Harry A. Kemp | 48 | Senior Vice President, Chief Administrative Officer and General Counsel |
| Frank C. Orsini | 51 | Executive Vice President and President, Seating |
| Raymond E. Scott | 58 | President and Chief Executive Officer |
| Marianne Vidershain | 44 | Vice President and Treasurer |
Set forth below is shown below (in millions):a description of the business experience of each of our executive officers.
| | | | | | | | | | | | | | | | | |
| | | Estimated Change in Fair Value |
| December 31, | Hypothetical Change % (2) | | 2020 | | 2019 |
| U.S. dollar | 10% | | $ | 80 | | | $ | 50 | |
| Euro | 10% | | 59 | | | 69 | |
(2)Relative to all other currencies to which it is exposed. | | | | | |
| Jason M. Cardew | Mr. Cardew is the Company's Senior Vice President and Chief Financial Officer, a position he has held since November 2019. Mr. Cardew most recently served as the Company's Vice President, Finance - Seating and E-Systems since September 2018. Prior to that, he served as the Company's Vice President, Finance - Seating since April 2012. Previously, he served as the Company's Vice President and Interim Chief Financial Officer since September 2011, Vice President, Finance - Financial Planning and Analysis since April 2010, Vice President, Finance - Seating since 2008, Vice President - Finance since 2003 and in various financial roles since joining the Company in 1992. |
| |
| Alicia J. Davis | Ms. Davis is the Company's Senior Vice President and Chief Strategy Officer, a position she has held since May 2021. Ms. Davis most recently served as the Company's Senior Vice President, Corporate Development and Investor Relations since September 2019. Prior to that, she served as the Company's Vice President, Investor Relations since joining the Company in August 2018. Prior to joining the Company, Ms. Davis was on the faculty at the University of Michigan Law School since June 2004, where she most recently served as a Professor and the Associate Dean for Strategic Initiatives. Ms. Davis continues to teach at the University of Michigan Law School as a Professor from Practice. Previous to that, she was a lawyer at Kirkland & Ellis since June 2002, a Vice President at Raymond James & Associates since August 1999 and an Investment Banking Analyst at Goldman Sachs from August 1993 to June 1995. |
| |
| Amy A. Doyle | Ms. Doyle is the Company's Vice President and Chief Accounting Officer, a position she has held since May 2017. Ms. Doyle most recently served as the Company's Assistant Corporate Controller since September 2006. Previously, she served in positions of increasing responsibility at the Company, including Director, Financial Reporting since 2003 and Manager, Financial Reporting since joining the Company in 1999. Prior to joining the Company, Ms. Doyle served as an audit manager for Arthur Andersen LLP. |
| |
| Carl A. Esposito | Mr. Esposito is the Company's Senior Vice President and President, E-Systems, a position he has held since joining the Company in September 2019. Prior to joining the Company, Mr. Esposito served at Honeywell Aerospace, a division of Honeywell International Inc., as President of the Electronic Solutions Strategic Business Unit from January 2017 to July 2019 and at Honeywell International Inc. as Vice President of Aerospace Marketing, Product Management and Strategy since December 2010, Vice President of Avionics Systems Marketing and Product Management since December 2009, Vice President of Global Business Aviation Sales and EMEAI Customer Support since January 2007 and in various other roles since 1990. |
| |
There are certain shortcomings inherent | | | | | |
| Harry A. Kemp | Mr. Kemp is the Company's Senior Vice President, Chief Administrative Officer and General Counsel, a position he has held since January 2023. In this role, Mr. Kemp has responsibility for the Company's Compliance and Environmental, Social and Governance activities. Mr. Kemp most recently served as the Company's Senior Vice President, General Counsel and Corporate Secretary since August 2019. Prior to that, Mr. Kemp served as the Company's Vice President and Corporate Counsel since January 2019. Previously, he served as the Company's Vice President and Divisional Counsel - Seating since September 2016 and Vice President and Divisional Counsel - E-Systems since joining the Company in December 2009. Prior to joining the Company, Mr. Kemp was a partner at Bodman PLC since 2003 and served as an engagement manager at McKinsey and Company, a global management consulting firm, since 2000. |
| |
| Frank C. Orsini | Mr. Orsini is the Company's Executive Vice President and President, Seating, a position he has held since March 2018. Mr. Orsini most recently served as the Company's Senior Vice President and President, E-Systems since September 2012. Prior to that, he served as the Company's Vice President and Interim President, E-Systems since October 2011. Previously, he served as the Company's Vice President, Operations, E-Systems since 2009, Vice President, Sales, Program Management & Manufacturing, E-Systems since 2008, Vice President, North America Seating Operations since 2005 and in various other management positions since joining the Company in 1994. |
| |
| Raymond E. Scott | Mr. Scott is the Company's President and Chief Executive Officer, a position he has held since March 2018. Mr. Scott most recently served as the Company's Executive Vice President and President, Seating since November 2011. Prior to that, he served as the Company's Senior Vice President and President, E-Systems since February 2008. Previously, he served as the Company's Senior Vice President and President, North American Seat Systems Group since August 2006, Senior Vice President and President, North American Customer Group since June 2005, President, European Customer Focused Division since June 2004 and President, General Motors Division since November 2000. |
| |
| Marianne Vidershain | Ms. Vidershain is the Company's Vice President and Treasurer, a position she has held since February 2021. Ms. Vidershain most recently served as the Company's Assistant Treasurer since January 2018. Prior to that, she served as the Company's Director, Global Financial Planning & Analysis since January 2015. Previously, she served as the Company's Director, Finance – Global Purchasing since February 2014, Director, Capital Markets and Subsidiary Finance since April 2010, Treasury Manager since January 2007 and in various other treasury positions since joining the Company in 2004. |
PART II
ITEM 5 – MARKET FOR THE COMPANY'S COMMON EQUITY,
RELATED STOCKHOLDER MATTERS AND ISSUER PURCHASES OF EQUITY SECURITIES
Market Information
Our common stock is listed on the New York Stock Exchange under the symbol "LEA."
Dividends
We currently expect to pay quarterly cash dividends in the sensitivity analyses above. The analyses assumefuture, although such payments are at the discretion of our Board of
Directors (the "Board") and will depend upon our financial condition, results of operations, capital requirements, alternative uses of capital and other factors that all currencies would uniformly strengthen or weaken relativeour Board may consider at its discretion. See Item 7, "Management's Discussion and Analysis of Financial Condition and Results of Operations — Forward-Looking Statements," and Note 12, "Capital Stock, Accumulated Other Comprehensive Loss and Equity," to the U.S. dollarconsolidated financial statements included in this Report.
Holders of Common Stock
The Transfer Agent and Registrar for our common stock is Computershare Trust Company, N.A., located in Canton, Massachusetts. On February 5, 2024, there were 219 registered holders of record of our common stock.
For certain information regarding our equity compensation plans, see Part III — Item 12, "Security Ownership of Certain Beneficial Owners and Management and Related Stockholder Matters — Equity Compensation Plan Information."
Common Stock Share Repurchase Program
Since the first quarter of 2011, our Board has authorized $6.1 billion in share repurchases under our common stock share repurchase program. As of December 31, 2023, we have repurchased, in aggregate, $5.2 billion of our outstanding common stock, at an average price of $93.43 per share, excluding commissions and related fees, and have a remaining repurchase authorization of $0.9 billion, which expires on December 31, 2024.
We may implement share repurchases through a variety of methods, including, but not limited to, open market purchases, accelerated stock repurchase programs and structured repurchase transactions. The extent to which we may repurchase our outstanding common stock and the timing of such repurchases will depend upon our financial condition, results of operations, capital requirements, prevailing market conditions, alternative uses of capital and other factors. See Item 7, "Management's Discussion and Analysis of Financial Condition and Results of Operations — Forward-Looking Statements," and Note 12, "Capital Stock, Accumulated Other Comprehensive Loss and Equity," to the consolidated financial statements included in this Report.
A summary of the shares of our common stock repurchased during the fiscal quarter ended December 31, 2023, is shown below:
| | | | | | | | | | | | | | | | | | | | | | | |
| Period | Total Number
of Shares
Purchased | | Average
Price Paid
per Share | | Total Number of Shares
Purchased as Part of
Publicly Announced
Plans or Programs | | Approximate Dollar
Value of Shares that
May Yet be Purchased
Under the Program
(in millions) |
| October 1, 2023 through October 28, 2023 | — | | | $ | — | | | — | | | $ | 1,091.4 | |
| October 29, 2023 through November 25, 2023 | 474,550 | | $ | 130.75 | | | 474,550 | | 1,029.4 | |
| November 26, 2023 through December 31, 2023 | 816,089 | | | $ | 138.53 | | | 816,089 | | | 916.3 | |
| Total | 1,290,639 | | $ | 135.67 | | | 1,290,639 | | $ | 916.3 | |
Performance Graph
The following graph compares the cumulative total stockholder return from December 31, 2018 through December 31, 2023, for our common stock, the S&P 500 Index and a peer group(1)of companies that we have selected for purposes of this comparison. We have assumed that dividends have been reinvested, and the returns of each company in the S&P 500 Index and the peer group have been weighted to reflect relative stock market capitalization. The graph below assumes that $100 was invested on December 31, 2018, in each of our common stock, the stocks comprising the S&P 500 Index and the stocks comprising the peer group.
| | | | | | | | | | | | | | | | | | | | | | | | | | | | | | | | | | | | | | |
| | December 31,
2018 | | December 31,
2019 | | December 31,
2020 | | December 31,
2021 | | December 31,
2022 | | December 31,
2023 |
| Lear Corporation | | $ | 100.00 | | | $ | 114.38 | | | $ | 133.71 | | | $ | 155.37 | | | $ | 107.67 | | | $ | 125.33 | |
| S&P 500 | | $ | 100.00 | | | $ | 131.47 | | | $ | 155.65 | | | $ | 200.29 | | | $ | 163.98 | | | $ | 207.04 | |
Current Peer Group (1) | | $ | 100.00 | | | $ | 125.73 | | | $ | 148.12 | | | $ | 161.40 | | | $ | 108.05 | | | $ | 119.97 | |
Previous Peer Group (1) | | $ | 100.00 | | | $ | 124.93 | | | $ | 147.09 | | | $ | 160.01 | | | $ | 107.01 | | | $ | 118.99 | |
| | | | | | | | | | | | |
(1) We do not believe that there is a single published industry or Euro. In reality, some currencies may strengthenline of business index that is appropriate for comparing stockholder returns. As a result, we have selected a peer group comprised of representative independent automotive suppliers whose common stock is publicly traded. Our peer group, referenced in the graph above, consists of Adient plc, American Axle & Manufacturing Holdings Inc., Aptiv PLC, Autoliv, Inc., BorgWarner Inc., Continental AG, Dana Incorporated, Forvia SE (formerly known as Faurecia), Gentex Corporation, Gentherm Incorporated, Magna International, Inc., Valeo and Visteon Corporation, which we believe provides a more meaningful comparison of stock performance than our previous peer group. Our previous group, referenced in the graph above, consisted of Adient plc, American Axle & Manufacturing Holdings Inc., Aptiv PLC, Autoliv, Inc., BorgWarner Inc., Continental AG, Cooper-Standard Holdings Inc., Dana Incorporated, Faurecia, Gentex Corporation, Gentherm Incorporated, Magna International, Inc., Valeo and Visteon Corporation.
ITEM 6 – RESERVED
ITEM 7 – MANAGEMENT'S DISCUSSION AND ANALYSIS OF FINANCIAL CONDITION AND RESULTS OF OPERATIONS
Executive Overview
Lear Corporation is a global automotive technology leader in Seating and E-Systems, enabling superior in-vehicle experiences for consumers around the world. We supply complete seat systems, key seat components, complete electrical distribution and connection systems, high-voltage power distribution products, including battery disconnect units ("BDUs"), low-voltage power distribution products, electronic controllers and other electronic products to all of the world's major automotive manufacturers.
Lear is built on a foundation and strong culture of innovation, operational excellence, and engineering and program management capabilities. We use our product, design and technological expertise, as well as our global reach and competitive manufacturing footprint, to achieve our financial goals and objectives. These include continuing to deliver profitable growth balancing risks and returns, investing in innovation to drive business growth and profitability, maintaining a strong balance sheet with investment grade credit metrics, and consistently returning capital to our stockholders. Further, we have aligned our strategy with key trends affecting our business — primarily electrification. At Lear, we are Making every drive betterTM by providing technology for safer, smarter and more comfortable journeys, while others may weaken, causingadhering to our values — Be Inclusive. Be Inventive. Get Results the earnings impactRight Way.
Our business is organized under two reporting segments: Seating and E-Systems. Each of these segments has a varied product and technology portfolio across a number of component categories.
Our Seating business consists of the design, development, engineering and manufacture of complete seat systems and key seat components. Our capabilities in operations and supply chain management enable synchronized assembly and just-in-time delivery of complex complete seat systems at high volumes to increase our customers. As the most vertically integrated global seat supplier, our key seat component product offerings include seat trim covers; surface materials such as leather and fabric; seat mechanisms; seat foam; thermal comfort systems such as seat heating, ventilation, active cooling, pneumatic lumbar and massage products; and headrests. All of these products are compatible with traditional internal combustion engine ("ICE") architectures and electrified powertrains, including the full range of hybrid, plug-in hybrid and battery electric architectures. Our thermal comfort systems are facilitated by our seat system, component and integration capabilities, together with our competencies in electronics, sensors, software and algorithms.
Our E-Systems business consists of the design, development, engineering and manufacture of complete electrical distribution and connection systems; high-voltage power distribution products, including BDUs; and low-voltage power distribution products, electronic controllers and other electronic products. These capabilities enable us to provide our customers with customizable solutions with optimized designs at competitive costs for both low-voltage and high-voltage vehicle architectures. Electrical distribution and connection systems utilize low-voltage and high-voltage wire, high-speed data cables and flat wiring to connect networks and electrical signals and manage electrical power within the vehicle for all types of powertrains – from traditional ICE architectures to the full range of electrified powertrains that require management of higher voltage and power. Key components of our electrical distribution and connection systems portfolio include wire harnesses, terminals and connectors, high-voltage battery connection systems and engineered components. High-voltage battery connection systems include intercell connect boards, bus bars and main battery connection systems. High-voltage power distribution products control the flow and distribution of high-voltage power throughout electrified vehicles and include BDUs which control all electrical energy flowing into and out of high-voltage batteries in electrified vehicles. Low-voltage power distribution products, electronic controllers and other electronic products facilitate signal, data and/or decrease dependingpower management within the vehicle and include the associated software required to facilitate these functions. Key components of our other electronic products portfolio include zone control modules, body domain control modules and low-voltage and high-voltage power distribution modules. Our software offerings include embedded control, cybersecurity software and software to control hardware devices. Our customers traditionally have sourced our electronic hardware together with the software that we embed in it.
We serve all of the world's major automotive manufacturers through both our Seating and E-Systems businesses, and we have automotive content on more than 475 vehicle nameplates worldwide. It is common for us to have both seating and electrical and/or electronic content on the currencysame vehicle platform.
Our businesses benefit globally from leveraging common operating standards and disciplines, including world-class product development and manufacturing processes, as well as common customer support and regional infrastructures, all of which contribute to our reputation for operational excellence. Our core capabilities are shared across component categories and include high-precision manufacturing and assembly with short lead times, complex, global supply chain management, global engineering and program management, the agility to establish and/or transfer production between facilities quickly, and a unique, customer-focused culture. In select instances, we are able to manufacture both Seating and E-Systems components in the same facility. Our businesses also utilize proprietary, industry-specific processes and standards, leverage common low-cost engineering centers and share centralized operating support functions. These functions include health and safety, logistics,
quality, supply chain management and all major administrative functions, such as corporate finance, executive administration, human resources, information technology and legal. We continue to build on our reputation for operational excellence through investment in Industry 4.0 technologies. Industry 4.0 refers to the current era of digital transformation in manufacturing. It involves the integration of new technologies, such as Industrial Internet of Things (IIoT), cloud computing, artificial intelligence (AI), machine learning and advanced automation, into production facilities and business operations. These technologies enable smart and automated machines and smart factories to communicate, analyze and optimize processes and products, resulting in higher efficiency, quality and responsiveness to customers.
Industry Overview
Our sales are driven by the number of vehicles produced by the automotive manufacturers, which is ultimately dependent on consumer demand for automotive vehicles and the directionavailability of raw materials and components, and our content per vehicle. In 2020, the automotive industry experienced a significant decline in global production volumes as a result of the rate movement.
COVID-19 pandemic. In addition2022, industry production recovered modestly, increasing 8% compared to 2021. In 2023, industry production increased 9%compared to 2022. This reflects a return to 2019 pre-pandemic production levels but remains 5% below 2017 peak levels. Since 2020, the global economy, as well as the automotive industry, have been influenced directly and indirectly by macroeconomic events resulting in unfavorable conditions, including shortages of semiconductor chips and other components, elevated inflation levels on commodities and labor, higher interest rates, and labor and energy shortages in certain markets. Beginning in the third quarter of 2023 and continuing into the fourth quarter of 2023, the automotive industry was impacted by labor strikes and related disruptions at certain facilities in the United States. Certain of these factors, among others, continue to impact consumer demand, as well as the ability of automotive manufacturers to produce vehicles to meet demand. Our strategy to mitigate these impacts encompasses our comprehensive cost management process, including cost technology optimization, actions to further align our manufacturing capacity to the transactional exposure described above,current industry production environment and investments in Industry 4.0 technologies. This will allow us to enhance operational efficiencies, improve the utilization of existing facilities and equipment to reduce future expenditures, and streamline and automate administrative functions. For a description of risks related to macroeconomic events, see Item 1A, "Risk Factors."
Global automotive industry production volumes in 2023, as compared to 2022, are shown below (in thousands of units):
| | | | | | | | | | | | | | | | | |
| 2023 (1) | | 2022 (1) (2) | | % Change |
| North America | 15,647.8 | | | 14,296.2 | | | 9 | % |
| Europe and Africa | 18,259.5 | | | 16,218.7 | | | 13 | % |
| Asia | 50,147.8 | | | 46,049.2 | | | 9 | % |
| South America | 2,817.9 | | | 2,716.5 | | | 4 | % |
| Other | 1,746.2 | | | 1,769.1 | | | (1 | %) |
| Global light vehicle production | 88,619.2 | | | 81,049.7 | | | 9 | % |
(1) Production data based on S&P Global Mobility.
(2) Production data for 2022 has been updated from our 2022 Annual Report on Form 10-K to reflect actual production levels.
Automotive sales and production can also be affected by the age of the vehicle fleet and related scrappage rates, labor relations issues and shortages, fuel prices, regulatory requirements, government initiatives, trade agreements, tariffs and other non-tariff trade barriers, the availability and cost of credit, the availability and cost of critical components needed to complete the production of vehicles, logistics issues, restructuring actions of our customers and suppliers, facility closures and increased competition, as well as consumer preferences regarding vehicle powertrains (including preferences regarding hybrid and electric vehicles), size, configuration and features, among other factors. Our operating results are also significantly impacted by the translation of our foreign operating income into U.S. dollars ("translational exposure"). In 2020, net sales outsideoverall commercial success of the United States accountedvehicle platforms for 79%which we supply particular products, as well as the profitability of the products, including the level of vertical integration, that we supply for these platforms. The loss of business with respect to any vehicle model for which we are a significant supplier, or a decrease in the production levels of any such models, could adversely affect our operating results. In addition, larger cars and light trucks, as well as vehicle platforms that offer more features and functionality, such as luxury, sport utility and crossover vehicles, typically have more content and, therefore, tend to have a more significant impact on our operating results.
Our percentage of consolidated net sales althoughby region in 2023 and 2022 is shown below:
| | | | | | | | | | | |
| 2023 | | 2022 |
| North America | 40 | % | | 43 | % |
| Europe and Africa | 37 | % | | 33 | % |
| Asia | 19 | % | | 20 | % |
| South America | 4 | % | | 4 | % |
| Total | 100 | % | | 100 | % |
Our ability to reduce the risks inherent in certain non-U.S.concentrations of our business, and thereby maintain our financial performance in the future, will depend, in part, on our ability to continue to diversify our sales on a customer, product, platform and geographic basis to reflect the market overall.
The automotive industry, and our business, continue to be shaped by the broad trend of electrification, which is likely to be at the forefront of the industry for the foreseeable future. Demand for, and regulatory developments related to, improved energy efficiency and sustainability (e.g., government mandates related to fuel economy and carbon emissions) are U.S. dollar denominated.significant drivers of this trend.
Through our products, technology and strategic initiatives, we are well positioned to capitalize on business growth opportunities. We do not enter into foreign exchange contractsare focused on profitably growing our businesses and have implemented a strategy designed to mitigatedeliver industry-leading, long-term financial returns. This strategy is based on the following four pillars designed to drive growth and profitability in both of our translational exposure.business segments:
•Extend our market leadership position in Seating with priceable features;
Commodity Prices•Transform our E-Systems business through accelerated growth in connection systems, vehicle architecture evolution and electrification, and the rationalization of our product portfolio to improve profitability;
•Build on our reputation for operational excellence through investment in Industry 4.0 technologies; and
•Prioritize people and the planet through our sustainability initiatives to drive business growth, cost reductions and improved employee retention.
For further information related to our strategy, see Part 1 — Item 1, "Business — Industry" and "— Strategy."
Our customers typically require us to reduce our prices over the life of a vehicle model and, at the same time, assume significant responsibility for the design, development and engineering of our products. Our financial performance is largely dependent on our ability to offset these price reductions with product cost reductions through product design enhancement, supply chain management, manufacturing efficiencies and restructuring actions. We also seek to enhance our financial performance by investing in product development, design capabilities and new product initiatives that respond to and anticipate the needs of our customers and consumers. We continually evaluate operational and strategic alternatives to improve our business structure and align our business with the changing needs of our customers and major industry trends affecting our business.
Our material cost as a percentage of net sales was 65.2% in 2023, as compared to 66.1% in 2022 and 65.4% in 2021. Raw material, energy, commodity and commodityproduct component costs can be volatile, reflecting, among other things, changes in supply and demand, andlogistics issues, global trade and tariff policies.policies, and geopolitical issues. Our primary commodity cost exposures relate to steel, copper and leather. We have developed and implemented strategies to mitigate the impact of higher raw material, energy and commoditysuch costs such asthrough the selective in-sourcing of components, the continued consolidation of our supply base, longer-term purchase commitments, contractual recovery mechanisms and the selective expansion of low-cost country sourcing and engineering, as well as value engineering and product benchmarking. However, these strategies, together with commercial negotiationsFurther, our exposure to changes in steel prices is primarily indirect, through purchased components, and a significant portion of our copper, leather and direct steel purchases are subject to price index agreements with our customers and suppliers, typically offset only a portion of the adverse impact.suppliers. Certain of these strategies also may limit our opportunities in a declining price environment. In the current environment of elevated raw material, energy, commodity cost environment.and product component costs, these strategies, together with commercial negotiations with our customers and suppliers, have offset a significant portion of the adverse impact. In addition, the availability of raw materials, energy, commodities and product components fluctuates from time to time due to factors outside of our control. If these costs increase or availability is restricted, it could have an adverse impact on our operating results in the foreseeable future. See Part I — Item 1A, "Risk Factors — Increases in the costs and restrictions on the availability of raw materials, energy, commodities, and product components and labor could adversely affect our financial performance," and "— Forward-Looking Statements" below.
Financial Measures
In evaluating our financial condition and operating performance, we focus primarily on earnings, operating margins, cash flows and return on invested capital. Our strategy includes expanding our business with new and existing customers globally through new products, including those aligned with the trend toward electrification. We have also increased our vertical integration capabilities globally, as well as expanded our component manufacturing capacity in Asia, Eastern Europe, Mexico and Northern Africa and our low-cost engineering capabilities in Asia, Eastern Europe and Northern Africa.
Our success in generating cash flow will depend, in part, on our ability to manage working capital effectively. Working capital can be significantly impacted by the timing of cash flows from sales and purchases. Historically, we generally have been successful in aligning our supplier payment terms with our customer payment terms. However, our ability to continue to do so may be impacted by adverse automotive industry conditions, including inconsistent production schedules due to supply shortages, changes to our customers' payment terms and the financial condition of our suppliers. In addition, our cash flow is impacted by our ability to manage our inventory and capital spending effectively. We utilize return on invested capital as a measure of the efficiency with which our assets generate earnings. Improvements in our return on invested capital will depend on our ability to maintain an appropriate asset base for our business and to increase productivity and operating efficiency.
Acquisitions
2023
In April 2023, we completed the acquisition of I.G. Bauerhin ("IGB"), a privately held supplier of automotive seat heating, ventilation and active cooling, steering wheel heating, seat sensors and electronic control modules, headquartered in Grundau-Rothenbergen, Germany. IGB has more than 4,600 employees at nine manufacturing plants in seven countries. The acquisition furthers our comprehensive strategy to develop and integrate a complete portfolio of thermal comfort systems for automotive seating. IGB provides active cooling, as well as additional scale to our seat heating and ventilation capabilities and complements the lumbar and massage capabilities obtained with our acquisition of Kongsberg Automotive's Interior Comfort Systems business unit ("Kongsberg ICS") in February 2022. Further, the vertical integration opportunities provided by this acquisition help support our goal of achieving global market share gains in seat systems. We paid approximately $175 million, net of cash acquired, in connection with the acquisition. On May 1, 2023, we borrowed $150 million under our delayed-draw term loan facility (the "Term Loan") to finance, in part, the acquisition of IGB. For further information, see Note 4, "Acquisitions," to the consolidated financial statements included in this Report.
2022
In February 2022, we completed the acquisition of substantially all of Kongsberg ICS, which specializes in thermal comfort systems. With almost 50 years of experience in thermal comfort systems, Kongsberg ICS has leading technology, a well-balanced customer portfolio built on longstanding relationships with leading premium automotive manufacturers, and an experienced team. The Kongsberg ICS acquisition is advancing our seat component capabilities into specialized thermal comfort systems, such as seat heating, ventilation, lumbar and massage products that further differentiate our product offerings and improve vehicle performance and packaging — important features across various vehicle segments. We paid approximately $188 million, on a cash and debt free basis, in connection with the acquisition. For further information, see Note 4, "Acquisitions," to the consolidated financial statements included in this Report.
In May 2022, we completed the acquisition of Thagora Technology SRL ("Thagora"), a privately held company based in Iasi, Romania, to access scalable smart-manufacturing technology. Thagora's proprietary solutions complement our sustainable manufacturing processes by improving the production yield of our Seating segment's surface materials operations and lowering energy usage during production. In addition, Thagora's Industry 4.0 technologies bring significant advances to our manufacturing operations through engineering and logistics enhancements, including improved material traceability and facility footprint utilization capabilities. The acquisition is not material to the consolidated financial statements included in this Report.
In November 2022, we completed the acquisition of InTouch Automation ("InTouch"), a privately held supplier of Industry 4.0 technologies and complex automated testing equipment critical in the production of automotive seats. InTouch's product portfolio is aligned with our Industry 4.0 strategy to implement technologies designed to automate the testing and validation of seat components and complete seats. The acquisition is not material to the consolidated financial statements included in this Report.
Operational Restructuring
In 2023, we incurred pretax restructuring costs of $133 million and related manufacturing inefficiency charges of approximately $1 million, as compared to pretax restructuring costs of $154 million and related manufacturing inefficiency charges of approximately $5 million in 2022. None of the individual restructuring actions initiated in 2023 were material.
Further, there have been no changes in previously initiated restructuring actions that have resulted (or will result) in a material change to our restructuring costs.
Our restructuring actions include plant closures and workforce reductions and are initiated to maintain our competitive footprint or are in response to customer initiatives or changes in global and regional automotive markets. Our restructuring actions are designed to maintain or improve our operating results and profitability throughout the automotive industry cycles. Restructuring actions are generally funded within twelve months of initiation and are funded by cash flows from operating activities and existing cash balances. We expect to incur approximately $76 million of additional restructuring costs related to activities initiated as of December 31, 2023, all of which are expected to be incurred in the next twelve months. We plan to implement additional restructuring actions in order to align our manufacturing capacity and other costs with prevailing regional automotive production levels. Such future restructuring actions are dependent on market conditions, customer actions and other factors.
For further information, see Note 5, "Restructuring," to the consolidated financial statements included in this Report.
Financing Transactions
In May 2023, we borrowed $150 million under our Term Loan to finance, in part, the acquisition of IGB.
In November 2023, we extended the maturity date of our revolving credit facility by one year to October 28, 2027.
For further information related to our acquisition of IGB, see Note 4, "Acquisitions," to the consolidated financial statement included in this Report. For further information related to our Term Loan and our revolving credit facility, see "— Liquidity and Capital Resources — Capitalization — Credit Agreement" and "— Term Loan" below and Note 7, "Debt," to the consolidated financial statements included in this Report.
Share Repurchase Program and Quarterly Cash Dividends
We may implement share repurchases through a variety of methods, including, but not limited to, open market purchases, accelerated stock repurchase programs and structured repurchase transactions. The extent to which we may repurchase our outstanding common stock and the timing of such repurchases will depend upon our financial condition, results of operations, capital requirements, prevailing market conditions, alternative uses of capital and other factors. (see "— Forward-Looking Statements" below).
Since the first quarter of 2011, our Board of Directors (the "Board") has authorized $6.1 billion in share repurchases under our common stock share repurchase program. In 2023, we repurchased $313 million of shares. As of December 31, 2023, we have a remaining repurchase authorization of $916 million, which expires on December 31, 2024.
In 2023 and 2022, our Board declared a quarterly cash dividend of $0.77 per share of common stock in all quarters. In 2021, our Board declared a quarterly cash dividend of $0.25 per share of common stock in the first and second quarters, a quarterly cash dividend of $0.50 per share of common stock in the third quarter and a quarterly cash dividend of $0.77 per share of common stock in the fourth quarter.
For further information related to our common stock share repurchase program and our quarterly cash dividends, see Item 5, "Market for the Company's Common Equity, Related Stockholder Matters and Issuer Purchases of Equity Securities," "— Liquidity and Capital Resources — Capitalization" below and Note 12, "Capital Stock, Accumulated Other Comprehensive Loss and Equity," to the consolidated financial statements included in this Report.
Other Matters
In 2023, we recognized net tax benefits of $35 million related to restructuring charges, the release of valuation allowances on deferred tax assets of foreign subsidiaries, the release of tax reserves at several foreign subsidiaries and various other items.
In 2022, we recognized net tax benefits of $34 million related to restructuring charges and various other items.
In 2021, we recognized tax benefits of $39 million related to restructuring charges and various other items, partially offset by tax expense of $17 million related to the net increase in valuation allowances on deferred tax assets of foreign subsidiaries and $8 million on a $45 million gain related to a favorable indirect tax ruling in a foreign jurisdiction.
As discussed above, our results for the years ended December 31, 2023, 2022 and 2021, reflect the following items (in millions):
| | | | | | | | | | | | | | | | | |
| For the year ended December 31, | 2023 | | 2022 | | 2021 |
| Costs related to restructuring actions, including manufacturing inefficiencies of $1 million in 2023, $5 million in 2022 and $12 million in 2021 | $ | 134 | | | $ | 159 | | | $ | 113 | |
| Acquisition costs | 1 | | | 10 | | | — | |
| Acquisition-related inventory fair value adjustment | 2 | | | 1 | | | — | |
| Impairments related to Russian operations | 2 | | | 19 | | | — | |
| Intangible asset impairment | 2 | | | 9 | | | 9 | |
| Insurance (recoveries) costs related to typhoon in the Philippines, net | (7) | | | (1) | | | 13 | |
| Foreign exchange (gains) losses due to foreign exchange rate volatility related to Russia | (2) | | | 10 | | | — | |
| Favorable indirect tax ruling in a foreign jurisdiction | (1) | | | — | | | (45) | |
| Gain on acquisition-related foreign exchange contracts | — | | | (2) | | | — | |
| Loss on extinguishment of debt | — | | | — | | | 25 | |
| Loss related to investments | 7 | | | — | | | 2 | |
| Tax benefits, net | (35) | | | (34) | | | (14) | |
For further information regarding these items, see Note 3, "Summary of Significant Accounting Policies," Note 4, "Acquisitions," Note 5, "Restructuring," Note 6, "Investments in Affiliates and Other Related Party Transactions," Note 7, "Debt," Note 8, "Leases," and Note 9, "Income Taxes," to the consolidated financial statements included in this Report. This section includes forward-looking statements that are subject to risks and uncertainties. For further information regarding these and other factors that have had, or may have in the future, a significant impact on our business, financial condition or results of operations, see Part I — Item 1A, "Risk Factors," and "— Forward-Looking Statements" below.
Results of Operations
A summary of our operating results in millions of dollars and as a percentage of net sales is shown below:
| | | | | | | | | | | | | | | | | | | | | | | | | | | | | | | | | | | |
| For the year ended December 31, | 2023 | | 2022 | | 2021 |
| Net sales | | | | | | | | | | | |
| Seating | $ | 17,548.8 | | | 74.8 | % | | $ | 15,711.2 | | | 75.2 | % | | $ | 14,411.4 | | | 74.8 | % |
| E-Systems | 5,918.1 | | | 25.2 | | | 5,180.3 | | | 24.8 | | | 4,851.7 | | | 25.2 | |
| Net sales | 23,466.9 | | | 100.0 | | | 20,891.5 | | | 100.0 | | | 19,263.1 | | | 100.0 | |
| Cost of sales | 21,756.5 | | | 92.7 | | | 19,481.6 | | | 93.3 | | | 17,871.2 | | | 92.8 | |
| Gross profit | 1,710.4 | | | 7.3 | | | 1,409.9 | | | 6.7 | | | 1,391.9 | | | 7.2 | |
| Selling, general and administrative expenses | 714.7 | | | 3.0 | | | 684.8 | | | 3.3 | | | 643.2 | | | 3.3 | |
| Amortization of intangible assets | 62.5 | | | 0.3 | | | 70.8 | | | 0.3 | | | 73.3 | | | 0.4 | |
| Interest expense, net | 101.1 | | | 0.4 | | | 98.6 | | | 0.5 | | | 91.8 | | | 0.5 | |
| Other expense, net | 54.9 | | | 0.3 | | | 46.4 | | | 0.2 | | | 0.1 | | | — | |
| Provision for income taxes | 180.8 | | | 0.8 | | | 133.7 | | | 0.6 | | | 137.7 | | | 0.7 | |
| Equity in net income of affiliates | (49.3) | | | (0.2) | | | (33.1) | | | (0.2) | | | (15.8) | | | (0.1) | |
| Net income attributable to noncontrolling interests | 73.2 | | | 0.3 | | | 81.0 | | | 0.4 | | | 87.7 | | | 0.5 | |
| Net income attributable to Lear | $ | 572.5 | | | 2.4 | % | | $ | 327.7 | | | 1.6 | % | | $ | 373.9 | | | 1.9 | % |
Year Ended December 31, 2023, Compared With Year Ended December 31, 2022
Net sales for the year ended December 31, 2023 were $23.5 billion, as compared to $20.9 billion for the year ended December 31, 2022, an increase of $2.6 billion or 12%. Higher production volumes on Lear platforms and new business in every region favorably impacted net sales by $1.4 billion and $0.9 billion, respectively.
| | | | | | | | |
| (in millions) | | Cost of Sales |
| 2022 | | $ | 19,481.6 | |
| Material cost | | 1,492.8 | |
| Labor and other | | 748.3 | |
| Depreciation | | 33.8 | |
| 2023 | | $ | 21,756.5 | |
Cost of sales in 2023 was $21.8 billion, as compared to $19.5 billion in 2022. Higher production volumes on Lear platforms and new business in every region increased cost of sales.
Gross profit and gross margin were $1.7 billion and 7.3% of net sales in 2023, as compared to $1.4 billion and 6.7% of net sales in 2022. Higher production volumes on Lear platforms and new business positively impacted gross profit by $308 million. The impact of favorable operating performance, including the benefit of restructuring actions, was offset by selling price reductions. These factors had a corresponding impact on gross margin.
Selling, general and administrative expenses, including engineering and development expenses, were $715 million for the year ended December 31, 2023, as compared to $685 million for the year ended December 31, 2022, primarily reflecting higher sales and our acquisition of IGB in 2023. As a percentage of net sales, selling, general and administrative expenses were 3.0% in 2023, as compared to 3.3% in 2022.
Amortization of intangible assets was $63 million in 2023, including an impairment charge of $2 million, as compared to $71 million in 2022, including an impairment charge of $9 million.
Interest expense, net was $101 million in 2023, as compared to $99 million in 2022.
Other expense, net, which includes non-income related taxes, foreign exchange gains and losses, gains and losses related to certain derivative instruments and hedging activities, gains and losses on the disposal of fixed assets, the non-service cost components of net periodic benefit cost and other miscellaneous income and expense, was $55 million in 2023, as compared to $46 million in 2022. In 2023, we recognized foreign exchange losses of $53 million, including $31 million related to the hyper-inflationary environment and significant currency devaluation in Argentina, and losses of $7 million related to impairments of affiliates. In 2023, we also recognized gains of $18 million related to the sales of fixed assets and $4 million related to insurance recoveries. In 2022, we recognized foreign exchange losses of $30 million, including losses of $10 million related to foreign exchange rate volatility in Russia and gains of $2 million related to foreign exchange contracts on the €140 million IGB purchase price. In 2022, we also recognized a gain of $1 million related to insurance recoveries.
In 2023, the provision for income taxes was $181 million, representing an effective tax rate of 23.3% on pretax income before equity in net income of affiliates of $777 million. In 2022, the provision for income taxes was $134 million, representing an effective tax rate of 26.3% on pretax income before equity in net income of affiliates of $509 million.
In 2023 and 2022, the provision for income taxes was primarily impacted by the level and mix of earnings among tax jurisdictions. In 2023, we recognized net tax benefits of $35 million related to restructuring charges, the release of valuation allowances on deferred tax assets of foreign subsidiaries, the release of tax reserves at several foreign subsidiaries and various other items. In 2022, we recognized net tax benefits of $34 million related to restructuring charges and various other items.
For information related to our valuation allowances, see "— Other Matters — Significant Accounting Policies and Critical Accounting Estimates — Income Taxes" below.
Equity in net income of affiliates was $49 million for the year ended December 31, 2023, as compared to $33 million for the year ended December 31, 2022, primarily reflecting the higher earnings of certain of our joint ventures in Asia.
Net income attributable to Lear was $573 million, or $9.68 per diluted share, in 2023, as compared to $328 million, or $5.47 per diluted share, in 2022. Net income and diluted net income per share increased for the reasons described above.
Reportable Operating Segments
We have two reportable operating segments: Seating and E-Systems. For a description of our reportable operating segments, see "Executive Overview" above.
The financial information presented below is for our two reportable operating segments and our other category for the periods presented. The other category includes unallocated costs related to corporate headquarters, regional headquarters and the elimination of intercompany activities, none of which meets the requirements for being classified as an operating segment. Corporate and regional headquarters costs include various support functions, such as information technology, advanced research and development, corporate finance, legal, executive administration and human resources. Financial measures regarding each segment's pretax income before equity in net income of affiliates, interest expense, net and other expense, net ("segment earnings") and segment earnings divided by net sales ("margin") are not measures of performance under accounting principles generally accepted in the United States ("GAAP"). Segment earnings and the related margin are used by management to evaluate the performance of our reportable operating segments. Segment earnings should not be considered in isolation or as a substitute for net income attributable to Lear, net cash provided by operating activities or other income statement or cash flow statement data prepared in accordance with GAAP or as measures of profitability or liquidity. In addition, segment earnings, as we determine it, may not be comparable to related or similarly titled measures reported by other companies.
For a reconciliation of consolidated segment earnings to consolidated income before provision for income taxes and equity in net income of affiliates, see Note 15, "Segment Reporting," to the consolidated financial statements included in this Report.
Seating —
A summary of financial measures for our Seating segment is shown below (dollar amounts in millions):
| | | | | | | | | | | |
| For the year ended December 31, | 2023 | | 2022 |
| Net sales | $ | 17,548.8 | | | $ | 15,711.2 | |
Segment earnings (1) | 1,066.9 | | | 893.0 | |
| Margin | 6.1 | % | | 5.7 | % |
(1) See definition above.
Seating net sales were $17.5 billion for the year ended December 31, 2023, as compared to $15.7 billion for the year ended December 31, 2022, an increase of $1.8 billion or 12%. Higher production volumes on Lear platforms and new business favorably impacted net sales by $1.0 billion and $0.6 billion, respectively. Our acquisitions of IGB and Kongsberg ICS also increased net sales $0.2 billion.
Segment earnings, including restructuring costs, and the related margin on net sales were $1.1 billion and 6.1% in 2023, as compared to $893 million and 5.7% in 2022. Higher production volumes on Lear platforms and new business positively impacted segment earnings by $215 million. The impact of selling price reductions and higher restructuring costs were offset by favorable operating performance, including the benefit of commodity recoveries and operational restructuring actions.
E-Systems —
A summary of financial measures for our E-Systems segment is shown below (dollar amounts in millions):
| | | | | | | | | | | |
| For the year ended December 31, | 2023 | | 2022 |
| Net sales | $ | 5,918.1 | | | $ | 5,180.3 | |
Segment earnings (1) | 228.9 | | | 74.4 | |
| Margin | 3.9 | % | | 1.4 | % |
(1) See definition above.
E-Systems net sales were $5.9 billion for the year ended December 31, 2023, as compared to $5.2 billion for the year ended December 31, 2022, an increase of $738 million or 14%. Higher production volumes on Lear platforms and new business favorably impacted net sales by $0.4 billion and $0.3 billion, respectively.
Segment earnings, including restructuring costs, and the related margin on net sales were $229 million and 3.9% in 2023, as compared to $74 million and 1.4% in 2022. Higher production volumes on Lear platforms and new business positively impacted segment earnings by $93 million. The impact of favorable operating performance, including the benefit of operational restructuring actions, and lower restructuring costs was partially offset by selling price reductions.
Other —
A summary of financial measures for our other category, which is not an operating segment, is shown below (dollar amounts in millions):
| | | | | | | | | | | |
| For the year ended December 31, | 2023 | | 2022 |
| Net sales | $ | — | | | $ | — | |
Segment earnings (1) | (362.6) | | | (313.1) | |
| Margin | N/A | | N/A |
(1) See definition above.
Segment earnings related to our other category were ($363) million in 2023, as compared to ($313) million in 2022, primarily reflecting higher compensation-related costs and costs related to our efficiency initiatives including investments in information technology.
Year Ended December 31, 2022, Compared With Year Ended December 31, 2021
For a discussion of our results of operations for the year ended December 31, 2022, compared with the year ended December 31, 2021, refer to our Annual Report on Form 10-K for the year ended December 31, 2022.
Liquidity and Capital Resources
Our primary liquidity needs are to fund general business requirements, including working capital requirements, capital expenditures, operational restructuring actions and debt service requirements. Our principal sources of liquidity are cash flows from operating activities, borrowings under available credit facilities and our existing cash balance.
Cash Provided by Subsidiaries
A substantial portion of our operating income is generated by our subsidiaries. As a result, we are dependent on the earnings and cash flows of and the combination of dividends, royalties, intercompany loan repayments and other distributions and advances from our subsidiaries to provide the funds necessary to meet our obligations.
As of December 31, 2023 and 2022, cash and cash equivalents of $803 million and $790 million, respectively, were held in foreign subsidiaries and can be repatriated, primarily through the repayment of intercompany loans and the payment of dividends. There are no material restrictions on the ability of our subsidiaries to pay dividends or make other distributions to Lear.
For further information regarding potential dividends from our non-U.S. subsidiaries, see "— Adequacy of Liquidity Sources" below and Note 9, "Income Taxes," to the consolidated financial statements included in this Report.
Adequacy of Liquidity Sources
As of December 31, 2023, we had approximately $1.2 billion of cash and cash equivalents on hand and $2.0 billion in available borrowing capacity under our credit agreement. Together with cash provided by operating activities, we believe that this will enable us to meet our liquidity needs for the foreseeable future and to satisfy ordinary course business obligations. In addition, we expect to continue to pay quarterly cash dividends and repurchase shares of our common stock pursuant to our authorized common stock share repurchase program, although such actions are at the discretion of our Board and will depend upon our financial condition, results of operations, capital requirements, prevailing market conditions, alternative uses of capital and other factors that our Board may consider at its discretion.
Our future financial results and our ability to continue to meet our liquidity needs are subject to, and will be affected by, cash flows from operations, as well as restructuring activities, automotive industry conditions, the financial condition of our customers and suppliers, supply chain disruptions and other related factors. Additionally, an economic downturn or further reduction in production levels could negatively impact our financial condition.
For further discussion of the risks and uncertainties affecting our cash flows from operations and our overall liquidity, see Part I — Item 1A, "Risk Factors," and "— Executive Overview" above and "— Forward-Looking Statements" below.
Cash Flows
Year Ended December 31, 2023, Compared with Year Ended December 31, 2022
A summary of net cash provided by operating activities is shown below (in millions):
| | | | | | | | | | | | | | | | | |
| For the year ended December 31, | 2023 | | 2022 | | Increase (Decrease) in
Cash Flow |
| Consolidated net income and depreciation and amortization | $ | 1,250 | | | $ | 985 | | | $ | 265 | |
| Net change in working capital items: | | | | | |
| Accounts receivable | (148) | | | (519) | | | 371 | |
| Inventory | (118) | | | (30) | | | (88) | |
| Other current assets | (17) | | | (17) | | | — | |
| Accounts payable | 162 | | | 369 | | | (207) | |
| Accrued liabilities | 165 | | | 179 | | | (14) | |
| Net change in working capital items | 44 | | | (18) | | | 62 | |
| Other | (45) | | | 54 | | | (99) | |
| Net cash provided by operating activities | $ | 1,249 | | | $ | 1,021 | | | $ | 228 | |
| | | | | |
| Net cash used in investing activities | $ | (762) | | | $ | (830) | | | $ | 68 | |
| | | | | |
| Net cash used in financing activities | $ | (420) | | | $ | (387) | | | $ | (33) | |
Net cash provided by operating activities was $1.2 billion in 2023, as compared to $1.0 billion in 2022. The overall increase in operating cash flow primarily reflects our higher earnings in 2023 as compared to 2022.
Net cash used in investing activities was $762 million in 2023, as compared to $830 million in 2022. In 2023, we paid $175 million for our IGB acquisition. In 2022, we paid $188 million for our Kongsberg ICS acquisition and $15 million related to investments in affiliates. In 2023, capital spending was $627 million, as compared to $638 million in 2022. Capital spending is estimated to be approximately $675 million in 2024.
Net cash used in financing activities was $420 million in 2023, as compared to $387 million in 2022. In 2023, we borrowed $150 million under our Term Loan and paid $297 million for repurchases of our common stock, $182 million in dividends to Lear stockholders and $79 million in dividends to noncontrolling interest holders. In 2022, we paid $100 million for repurchases of our common stock, $186 million in dividends to Lear stockholders and $85 million in dividends to noncontrolling interest holders.
For further information regarding our 2023 and 2022 financing transactions, see "— Capitalization" below and Note 7, "Debt," and Note 12, "Capital Stock, Accumulated Other Comprehensive Loss and Equity," to the consolidated financial statements included in this Report.
Year Ended December 31, 2022, Compared with Year Ended December 31, 2021
For a discussion of our cash flows for the year ended December 31, 2022, compared with the year ended December 31, 2021, refer to our Annual Report on Form 10-K for the year ended December 31, 2022.
Capitalization
Short-Term Borrowings
We utilize uncommitted lines of credit as needed for our short-term working capital fluctuations. As of December 31, 2023 and 2022, we had lines of credit from banks totaling $338 million and $298 million, respectively. As of December 31, 2023 and 2022, we had short-term debt balances outstanding related to draws on our lines of credit of $28 million and $10 million, respectively.
The availability of uncommitted lines of credit may be affected by our financial performance, credit ratings and other factors.
Senior Notes
As of December 31, 2023, our senior notes (collectively, the "Notes") consist of the amounts shown below (in millions, except stated coupon rates):
| | | | | | | | | | | | | | |
| Note | | Aggregate Principal Amount at Maturity | | Stated Coupon Rate |
| Senior unsecured notes due 2027 (the "2027 Notes") | | $ | 550 | | | 3.80% |
| Senior unsecured notes due 2029 (the "2029 Notes") | | 375 | | | 4.25% |
| Senior unsecured notes due 2030 (the "2030 Notes") | | 350 | | | 3.50% |
| Senior unsecured notes due 2032 (the "2032 Notes") | | 350 | | | 2.60% |
| Senior unsecured notes due 2049 (the "2049 Notes") | | 625 | | | 5.25% |
| Senior unsecured notes due 2052 (the "2052 Notes") | | 350 | | | 3.55% |
| | $ | 2,600 | | | |
The issue, maturity and interest payment dates of the Notes are shown below:
| | | | | | | | | | | | | | | | | | | | |
| Note | | Issuance Date | | Maturity Date | | Interest Payment Dates |
| 2027 Notes | | August 2017 | | September 15, 2027 | | March 15 and September 15 |
| 2029 Notes | | May 2019 | | May 15, 2029 | | May 15 and November 15 |
| 2030 Notes | | February 2020 | | May 30, 2030 | | May 30 and November 30 |
| 2032 Notes | | November 2021 | | January 15, 2032 | | January 15 and July 15 |
| 2049 Notes | | May 2019 and February 2020 | | May 15, 2049 | | May 15 and November 15 |
| 2052 Notes | | November 2021 | | January 15, 2052 | | January 15 and July 15 |
In 2021, we issued $350 million in aggregate principal amount at maturity of 2032 Notes and $350 million in aggregate principal amount at maturity of 2052 Notes. The 2032 Notes have a stated coupon rate of 2.6% and were issued at 99.782% of par, resulting in a yield to maturity of 2.624%. The 2052 Notes have a stated coupon rate of 3.55% and were issued at 99.845% of par, resulting in a yield to maturity of 3.558%.
The net proceeds from the offering of $699 million, after original issue discount, were used, in part, to fund the tender of $200 million in aggregate principal amount of 2027 Notes and the repayment in full of $206 million outstanding on our term loan facility under our credit agreement (see "— Credit Agreement" below). The remaining net proceeds were used to finance the 2022 acquisition of Kongsberg ICS and for general corporate purposes. For further information related to the Kongsberg ICS acquisition, see Note 4, "Acquisitions," to the consolidated financial statements included in this Report.
In connection with these transactions, we recognized a loss of $24 million on the extinguishment of debt and paid related issuance costs of $7 million.
The indentures governing the Notes contain certain restrictive covenants and customary events of default. As of December 31, 2023, we were in compliance with all covenants under the indentures governing the Notes.
For further information related to the Notes, including information on early redemption, covenants and events of default, see Note 7, "Debt," to the consolidated financial statements included in this Report and the indentures governing the Notes, which have been incorporated by reference as exhibits to this Report.
Credit Agreement
Our unsecured credit agreement, dated August 8, 2017, consisted of a $1.75 billion revolving credit facility (the "Revolving Credit Facility") and a $250 million term loan facility (the "Term Loan Facility").
In October 2021, we entered into an amended and restated credit agreement (the "Credit Agreement") that increased the Revolving Credit Facility to $2.0 billion and extended the maturity date to October 28, 2026. In November 2021, we repaid in full $206 million outstanding on the Term Loan Facility. In connection with these transactions, we recognized a loss of approximately $1 million on the extinguishment of debt and paid related issuance costs of approximately $3 million.
In November 2023, we extended the maturity date of the Revolving Credit Facility by one year to October 28, 2027.
In 2023 and 2021, there were no borrowings or repayments under the Revolving Credit Facility. In 2022, aggregate borrowings and repayments under the Revolving Credit Facility were $65 million. As of December 31, 2023 and 2022, there were no borrowings outstanding under the Revolving Credit Facility.
The Credit Agreement contains various financial and other covenants that require us to remain below a maximum leverage coverage ratio. As of December 31, 2023, we were in compliance with all covenants under the Credit Agreement.
For further information related to the Credit Agreement, including information on pricing, covenants and events of default, see Note 7, "Debt," to the consolidated financial statements included in this Report and the Credit Agreement, which has been incorporated by reference as an exhibit to this Report.
Term Loan
In May 2023, we borrowed $150 million under our Term Loan to finance, in part, the acquisition of IGB.
The Term Loan contains the same covenants as the Credit Agreement. As of December 31, 2023, we were in compliance with all covenants under the Term Loan.
For further information related to our acquisition of IGB, see Note 4, "Acquisitions," to the consolidated financial statements included in this Report. For further information related to our Term Loan, see Note 7, "Debt," to the consolidated financial statements included in this Report.
Common Stock Share Repurchase Program
See Item 5, "Market for the Company's Common Equity, Related Stockholder Matters and Issuer Purchases of Equity Securities."
Dividends
In 2023 and 2022, our Board declared a quarterly cash dividend of $0.77 per share of common stock in all quarters. In 2021, our Board declared a quarterly cash dividend of $0.25 per share of common stock in the first and second quarters, a quarterly cash dividend of $0.50 per share of common stock in the third quarter and a quarterly cash dividend of $0.77 per share of common stock in the fourth quarter.
We expect to continue to pay quarterly cash dividends in the future, although such payments are at the discretion of our Board and will depend upon our financial condition, results of operations, capital requirements, prevailing market conditions, alternative uses of capital and other factors that our Board may consider at its discretion. See "— Forward-Looking Statements" below and Note 7, "Debt," to the consolidated financial statements included in this Report.
Commodity Prices
Raw material, energy and commodity costs can be volatile, reflecting, among other things, changes in supply and demand, logistics issues, global trade and tariff policies, and geopolitical issues. We have commodity price risk with respect to purchases of certain raw materials, including steel, copper, diesel fuel, chemicals, resins and leather. Our mainprimary commodity cost exposures relate to steel, copper and leather. TheWe have developed and implemented strategies to mitigate the impact of such costs through the selective in-sourcing of components, the continued consolidation of our supply base, longer-term purchase commitments, contractual recovery mechanisms and the selective expansion of low-cost country sourcing and engineering, as well as value engineering and product benchmarking. Further, the majority of the steel used in our products is comprised of fabricated components that are integrated into a seat system, such as seat frames, recliner mechanisms, seat tracks and other mechanical components. Therefore, our exposure to changes in steel prices is primarily indirect, through these purchased components. Approximately 92% Additionally, approximately 91%of our copper purchases and a significant portion of our leather and direct steel purchases are subject to price index agreements with our customers and suppliers. Certain of these strategies also may limit our opportunities in a declining commodity price environment. In the current environment of elevated raw material, energy and commodity costs, these strategies, together with commercial negotiations with our customers and suppliers, have offset a significant portion of the adverse impact. If these costs increase, it could have an adverse impact on our operating results in the foreseeable future.
See Part I — Item 1A, "Risk Factors — Increases in the costs and restrictions on the availability of raw materials, energy, commodities, product components and labor could adversely affect our financial performance," and "— Forward-Looking Statements" below.
For further information related to the financial instruments described above, see Note 16, "Financial Instruments," to the consolidated financial statements included in this Report.
Contractual Obligations and Cash Requirements
Our material cash requirements include the following contractual and other obligations:
Debt obligations and interest expense associated with debt obligations
As of December 31, 2023, we had $2.6 billion of outstanding senior unsecured notes maturing in 2027 through 2052 and a $150 million outstanding Term Loan maturing in 2026, as well as $2.0 billion in available borrowing capacity under our Revolving Credit Facility maturing in 2027.
Interest on the Notes is due biannually at varying dates. Scheduled interest payments are shown below (in millions):
| | | | | | | | | | | | | | | | | | | | | | | | | | | | | | | | | | | | | | | | | |
| 2024 | | 2025 | | 2026 | | 2027 | | 2028 | | Thereafter | | Total |
| Scheduled interest payments | $ | 103 | | | $ | 103 | | | $ | 103 | | | $ | 103 | | | $ | 83 | | | $ | 1,024 | | | $ | 1,519 | |
For further information related to our debt, see "— Capitalization — Senior Notes," "— Credit Agreement" and "— Term Loan" above and Note 7, "Debt," to the consolidated financial statements included in this Report.
Purchase obligations
We enter into agreements with our customers to produce products at the beginning of a vehicle's life cycle. Although these agreements do not provide for a specified quantity of products, once entered into, we are generally required to fulfill our customers' purchasing requirements for the production life of the vehicle. Prior to being formally awarded a program, we typically work closely with our customers in the early stages of the design and engineering of a vehicle's systems. Failure to complete the design and engineering work related to a vehicle's systems, or to fulfill a customer agreement, could have a material adverse impact on our business.
We also enter into agreements with suppliers to assist us in meeting our customers' production needs. These agreements vary as to duration and quantity commitments. Historically, most have been short-term agreements, which do not provide for minimum purchases, or are requirements-based agreements.
Leases
The Company has operating leases for production, office and warehouse facilities, manufacturing and office equipment, and vehicles with future lease obligations ranging from 2024 through 2047. Maturities of operating leases obligations are shown below (in millions):
| | | | | | | | | | | | | | | | | | | | | | | | | | | | | | | | | | | | | | | | | |
| 2024 | | 2025 | | 2026 | | 2027 | | 2028 | | Thereafter | | Total |
| Operating lease obligations | $ | 178 | | | $ | 156 | | | $ | 131 | | | $ | 109 | | | $ | 88 | | | $ | 213 | | | $ | 875 | |
For further information related to our lease obligations, see Note 8, "Leases," to the consolidated financial statements included in this Report.
Taxes
We may be required to make significant cash outlays related to our unrecognized tax benefits, including interest and penalties. As of December 31, 2023, we had unrecognized tax benefits, including interest and penalties, of $45 million. However, due to the uncertainty of the timing of future cash flows associated with our unrecognized tax benefits, we are unable to make reasonably reliable estimates of the period of cash settlement, if any, with the respective taxing authorities.
For further information related to our unrecognized tax benefits, see Note 9, "Income Taxes," to the consolidated financial statements included in this Report.
Pension and postretirement obligations
We have minimum funding requirements with respect to certain of our pension benefit obligations. We may elect to make contributions in excess of the minimum funding requirements in response to investment performance or changes in interest rates or when we believe that it is financially advantageous to do so and based on our other cash requirements. Our minimum funding requirements after 2024 will depend on several factors, including investment performance and interest rates. Our minimum funding requirements may also be affected by changes in applicable legal requirements. Contributions to our defined benefit pension plans are expected to be approximately $2 million in 2024.
We do not fund our postretirement benefit obligations and certain of our pension benefit obligations. Rather, benefit payments
are made to eligible participants as incurred. We expect benefit payments related to our unfunded pension and postretirement benefit obligations to be approximately $7 million and $4 million, respectively, in 2024.
For further information related to our pension and other postretirement benefit plans, see "— Other Matters — Pension and Other Postretirement Benefit Plans" below and Note 10, "Pension and Other Postretirement Benefit Plans," to the consolidated financial statements included in this Report.
Other Matters
Legal and Environmental Matters
We are involved from time to time in various legal proceedings and claims, including, without limitation, commercial and contractual disputes, product liability claims, and environmental and other matters. As of December 31, 2023, we had recorded reserves for pending legal disputes, including commercial and contractual disputes, product liability claims and other legal matters, of $14 million. In addition, as of December 31, 2023, we had recorded reserves for warranty and recall matters of $32 million and environmental matters of $5 million. Although these reserves were determined in accordance with GAAP, the ultimate outcomes of these matters are inherently uncertain, and actual results may differ significantly from current estimates. For a description of risks related to various legal proceedings and claims, see Part I — Item 1A, "Risk Factors." For a more complete description of our outstanding material legal proceedings, see Note 14, "Legal and Other Contingencies," to the consolidated financial statements included in this Report.
Critical Accounting Estimates
Certain of our accounting policies require management to make estimates and assumptions that affect the reported amounts of assets and liabilities as of the date of the consolidated financial statements and the reported amounts of revenues and expenses during the reporting period. These estimates and assumptions are based on our historical experience, the terms of existing contracts, our evaluation of trends in the industry, information provided by our customers and suppliers and information available from other outside sources, as appropriate. However, these estimates and assumptions are subject to an inherent degree of uncertainty. Accordingly, actual results in these areas may differ significantly from our estimates.
We consider an accounting estimate to be critical if it requires us to make assumptions about matters that were uncertain at the time the estimate was made and changes in the estimate would have had a significant impact on our consolidated financial position or results of operations.
Revenue Recognition
We enter into contracts with our customers to provide production parts generally at the beginning of a vehicle's life cycle. Typically, these contracts do not provide for a specified quantity of products, but once entered into, we are often expected to fulfill our customers' purchasing requirements for the production life of the vehicle. Many of these contracts may be terminated by our customers at any time. Historically, terminations of these contracts have been infrequent. We receive purchase orders from our customers, which provide the commercial terms for a particular production part, including price (but not quantities). Contracts may also provide for annual price reductions over the production life of the vehicle, and prices may be adjusted on an ongoing basis to reflect changes in product content/cost and other commercial factors.
Revenue is recognized at a point in time when control of the product is transferred to the customer under standard commercial terms, as we do not have an enforceable right to payment prior to such transfer. The amount of revenue recognized reflects the consideration that we expect to be entitled to in exchange for those products based on the current purchase orders, annual price reductions and ongoing price adjustments. Our customers pay for products received in accordance with payment terms that are customary within the industry. Our contracts with our customers do not have significant financing components. We record a contract liability for advances received from our customers.
Amounts billed to customers related to shipping and handling costs are included in net sales in the consolidated statements of income. Shipping and handling costs are accounted for as fulfillment costs and are included in cost of sales in the consolidated statements of income.
Taxes assessed by a governmental authority that are both imposed on and concurrent with a specific revenue-producing transaction that we collect from a customer are excluded from revenue.
Income Taxes
We account for income taxes in accordance with GAAP. Deferred tax assets and liabilities are recognized for the future tax consequences attributable to temporary differences between financial statement carrying amounts of existing assets and liabilities and their respective tax bases and tax loss and credit carryforwards. Deferred tax assets and liabilities are measured
using enacted tax rates expected to apply to taxable income for the years in which those temporary differences are expected to be recovered or settled.
Our current and future provision for income taxes is impacted by the initial recognition of and changes in valuation allowances in certain countries. We intend to maintain these allowances until it is more likely than not that the deferred tax assets will be realized. Our future provision for income taxes will include no tax benefit with respect to losses incurred and, except for certain jurisdictions, no tax expense with respect to income generated in these countries until the respective valuation allowances are eliminated. Accordingly, income taxes are impacted by changes in valuation allowances and the mix of earnings among jurisdictions. We evaluate the realizability of our deferred tax assets on a quarterly basis. In completing this evaluation, we consider all available evidence in order to determine whether, based on the weight of the evidence, a valuation allowance for our deferred tax assets is necessary. Such evidence includes historical results, future reversals of existing taxable temporary differences and expectations for future taxable income (exclusive of the reversal of temporary differences and carryforwards), as well as the implementation of feasible and prudent tax planning strategies. If, based on the weight of the evidence, it is more likely than not that all or a portion of our deferred tax assets will not be realized, a valuation allowance is recorded.
As of December 31, 2023, we had a valuation allowance related to tax loss and credit carryforwards and other deferred tax assets of $31 million in the United States and $398 million in several international jurisdictions. If operating results improve or decline on a continual basis in a particular jurisdiction, our decision regarding the need for a valuation allowance could change, resulting in either the initial recognition or reversal of a valuation allowance in that jurisdiction, which could have a significant impact on income tax expense in the period recognized and subsequent periods. In determining the provision for income taxes for financial statement purposes, we make certain estimates and judgments, which affect our evaluation of the carrying value of our deferred tax assets, as well as our calculation of certain tax liabilities.
The calculation of our gross unrecognized tax benefits and liabilities includes uncertainties in the application of, and changes in, complex tax regulations in a multitude of jurisdictions across our global operations. We recognize tax benefits and liabilities based on our estimate of whether, and the extent to which, additional taxes will be due. We adjust these benefits and liabilities based on changing facts and circumstances; however, due to the complexity of these uncertainties and the impact of tax audits, the ultimate resolutions may differ significantly from our estimates.
For further information, see "— Forward-Looking Statements" below and Note 9, "Income Taxes," to the consolidated financial statements included in this Report.
Use of Estimates
The preparation of the consolidated financial statements in conformity with GAAP requires management to make estimates and assumptions that affect the reported amounts of assets and liabilities as of the date of the consolidated financial statements and the reported amounts of revenues and expenses during the reporting period. During 2023, there were no material changes in the methods or policies used to establish estimates and assumptions. Other matters subject to estimation and judgment include amounts related to accounts receivable realization, inventory obsolescence, asset impairments, useful lives of fixed and intangible assets, unsettled pricing discussions with customers and suppliers, restructuring accruals, deferred tax asset valuation allowances and income taxes, pension and other postretirement benefit plan assumptions, accruals related to litigation, and warranty and environmental remediation costs. Actual results may differ significantly from our estimates.
Recently Issued Accounting Pronouncements
For information on the impact of recently issued accounting pronouncements, see Note 17, "Accounting Pronouncements," to the consolidated financial statements included in this Report.
Forward-Looking Statements
The Private Securities Litigation Reform Act of 1995 provides a safe harbor for forward-looking statements made by us or on our behalf. The words "will," "may," "designed to," "outlook," "believes," "should," "anticipates," "plans," "expects," "intends," "estimates," "forecasts" and similar expressions identify certain of these forward-looking statements. We also may provide forward-looking statements in oral statements or other written materials released to the public. All such forward-looking statements contained or incorporated in this Report or in any other public statements which address operating performance, events or developments that we expect or anticipate may occur in the future, including, without limitation, statements related to business opportunities, awarded sales contracts, sales backlog and ongoing commercial arrangements, or statements expressing views about future operating results, are forward-looking statements. Actual results may differ materially from any or all forward-looking statements made by us. Important factors, risks and uncertainties that may cause actual results to differ materially from anticipated results include, but are not limited to:
•general economic conditions in the markets in which we operate, including changes in interest rates or currency exchange rates;
•changes in actual industry vehicle production levels from our current estimates;
•fluctuations in the production of vehicles or the loss of business with respect to, or the lack of commercial success of, a vehicle model for which we are a significant supplier;
•the outcome of customer negotiations and the impact of customer-imposed price reductions;
•increases in the costs and restrictions on the availability of raw materials, energy, commodities, product components and labor and our ability to mitigate such costs and insufficient availability;
•disruptions in relationships with our suppliers;
•the financial condition of and adverse developments affecting our customers and suppliers;
•risks associated with conducting business in foreign countries, including the risk of war or other geopolitical conflicts;
•currency controls and the ability to economically hedge currencies;
•global sovereign fiscal matters and creditworthiness, including potential defaults and the related impacts on economic activity, including the possible effects on credit markets, currency values, monetary unions, international treaties and fiscal policies;
•competitive conditions impacting us and our key customers and suppliers;
•labor disputes, including disruptions, involving us or our significant customers or suppliers or that otherwise affect us;
•the consequences of violations of law by our employees, agents or business partners, including violations related to anti-bribery, competition, export and import, trade sanctions, data privacy, environmental, human rights and other laws;
•the operational and financial success of our joint ventures;
•our ability to attract, develop, engage and retain qualified employees;
•our ability to respond to the evolution of the global transportation industry;
•the outcome of an increased emphasis on global climate change and other sustainability matters by stakeholders;
•the impact of global climate change;
•the impact of pandemics, epidemics, disease outbreaks and other public health crises on our business;
•the impact and timing of program launch costs and our management of new program launches;
•changes in discount rates and the actual return on pension assets;
•impairment charges initiated by adverse industry or market developments;
•our ability to execute our strategic objectives;
•limitations imposed by our existing indebtedness and our ability to access capital markets on commercially reasonable terms;
•disruptions to our information technology systems, or those of our customers or suppliers, including those related to cybersecurity;
•increases in our warranty, product liability or recall costs;
•the outcome of legal or regulatory proceedings to which we are or may become a party;
•the impact of pending legislation and regulations or changes in existing federal, state, local or foreign laws or regulations;
•the impact of regulations on our foreign operations;
•costs associated with compliance with environmental laws and regulations;
•developments or assertions by or against us relating to intellectual property rights;
•the impact of changes in our effective tax rate, the adoption of new tax legislation or exposure to additional income tax liabilities on our profitability;
•the impact of administrative policy, including protectionist trade policies, in the United States and related actions by countries in which we do business; and
•other risks, described in Part I — Item 1A, "Risk Factors," as well as the risks and information provided from time to time in our other filings with the Securities and Exchange Commission.
The forward-looking statements in this Report are made as of the date hereof, and we do not assume any obligation to update, amend or clarify them to reflect events, new information or circumstances occurring after the date hereof.
ITEM 7A — QUANTITATIVE AND QUALITATIVE DISCLOSURES ABOUT MARKET RISK
Legal and Environmental Matters
We are involved from time to time in various legal proceedings and claims, including, without limitation, commercial or contractual disputes, product liability claims, and environmental and other matters. For a description of risks related to various legal proceedings and claims, see Item 1A, "Risk Factors." For a description of our outstanding material legal proceedings, see Note 14, "Legal and Other Contingencies," to the consolidated financial statements included in this Report.
ITEM 4 – MINE SAFETY DISCLOSURES
Not applicable.
SUPPLEMENTARY ITEM – INFORMATION ABOUT OUR EXECUTIVE OFFICERS
The following table sets forth the names, ages and positions of our executive officers. Executive officers are appointed annually by our Board of Directors (the "Board") and serve at the pleasure of our Board.
| | | | | | | | |
| Name | Age | Position |
| Jason M. Cardew | 53 | Senior Vice President and Chief Financial Officer |
| Alicia J. Davis | 53 | Senior Vice President and Chief Strategy Officer |
| Amy A. Doyle | 56 | Vice President and Chief Accounting Officer |
| Carl A. Esposito | 56 | Senior Vice President and President, E-Systems |
| Harry A. Kemp | 48 | Senior Vice President, Chief Administrative Officer and General Counsel |
| Frank C. Orsini | 51 | Executive Vice President and President, Seating |
| Raymond E. Scott | 58 | President and Chief Executive Officer |
| Marianne Vidershain | 44 | Vice President and Treasurer |
Set forth below is a description of the business experience of each of our executive officers.
| | | | | |
| Jason M. Cardew | Mr. Cardew is the Company's Senior Vice President and Chief Financial Officer, a position he has held since November 2019. Mr. Cardew most recently served as the Company's Vice President, Finance - Seating and E-Systems since September 2018. Prior to that, he served as the Company's Vice President, Finance - Seating since April 2012. Previously, he served as the Company's Vice President and Interim Chief Financial Officer since September 2011, Vice President, Finance - Financial Planning and Analysis since April 2010, Vice President, Finance - Seating since 2008, Vice President - Finance since 2003 and in various financial roles since joining the Company in 1992. |
| |
| Alicia J. Davis | Ms. Davis is the Company's Senior Vice President and Chief Strategy Officer, a position she has held since May 2021. Ms. Davis most recently served as the Company's Senior Vice President, Corporate Development and Investor Relations since September 2019. Prior to that, she served as the Company's Vice President, Investor Relations since joining the Company in August 2018. Prior to joining the Company, Ms. Davis was on the faculty at the University of Michigan Law School since June 2004, where she most recently served as a Professor and the Associate Dean for Strategic Initiatives. Ms. Davis continues to teach at the University of Michigan Law School as a Professor from Practice. Previous to that, she was a lawyer at Kirkland & Ellis since June 2002, a Vice President at Raymond James & Associates since August 1999 and an Investment Banking Analyst at Goldman Sachs from August 1993 to June 1995. |
| |
| Amy A. Doyle | Ms. Doyle is the Company's Vice President and Chief Accounting Officer, a position she has held since May 2017. Ms. Doyle most recently served as the Company's Assistant Corporate Controller since September 2006. Previously, she served in positions of increasing responsibility at the Company, including Director, Financial Reporting since 2003 and Manager, Financial Reporting since joining the Company in 1999. Prior to joining the Company, Ms. Doyle served as an audit manager for Arthur Andersen LLP. |
| |
| Carl A. Esposito | Mr. Esposito is the Company's Senior Vice President and President, E-Systems, a position he has held since joining the Company in September 2019. Prior to joining the Company, Mr. Esposito served at Honeywell Aerospace, a division of Honeywell International Inc., as President of the Electronic Solutions Strategic Business Unit from January 2017 to July 2019 and at Honeywell International Inc. as Vice President of Aerospace Marketing, Product Management and Strategy since December 2010, Vice President of Avionics Systems Marketing and Product Management since December 2009, Vice President of Global Business Aviation Sales and EMEAI Customer Support since January 2007 and in various other roles since 1990. |
| |
| | | | | |
| Harry A. Kemp | Mr. Kemp is the Company's Senior Vice President, Chief Administrative Officer and General Counsel, a position he has held since January 2023. In this role, Mr. Kemp has responsibility for the Company's Compliance and Environmental, Social and Governance activities. Mr. Kemp most recently served as the Company's Senior Vice President, General Counsel and Corporate Secretary since August 2019. Prior to that, Mr. Kemp served as the Company's Vice President and Corporate Counsel since January 2019. Previously, he served as the Company's Vice President and Divisional Counsel - Seating since September 2016 and Vice President and Divisional Counsel - E-Systems since joining the Company in December 2009. Prior to joining the Company, Mr. Kemp was a partner at Bodman PLC since 2003 and served as an engagement manager at McKinsey and Company, a global management consulting firm, since 2000. |
| |
| Frank C. Orsini | Mr. Orsini is the Company's Executive Vice President and President, Seating, a position he has held since March 2018. Mr. Orsini most recently served as the Company's Senior Vice President and President, E-Systems since September 2012. Prior to that, he served as the Company's Vice President and Interim President, E-Systems since October 2011. Previously, he served as the Company's Vice President, Operations, E-Systems since 2009, Vice President, Sales, Program Management & Manufacturing, E-Systems since 2008, Vice President, North America Seating Operations since 2005 and in various other management positions since joining the Company in 1994. |
| |
| Raymond E. Scott | Mr. Scott is the Company's President and Chief Executive Officer, a position he has held since March 2018. Mr. Scott most recently served as the Company's Executive Vice President and President, Seating since November 2011. Prior to that, he served as the Company's Senior Vice President and President, E-Systems since February 2008. Previously, he served as the Company's Senior Vice President and President, North American Seat Systems Group since August 2006, Senior Vice President and President, North American Customer Group since June 2005, President, European Customer Focused Division since June 2004 and President, General Motors Division since November 2000. |
| |
| Marianne Vidershain | Ms. Vidershain is the Company's Vice President and Treasurer, a position she has held since February 2021. Ms. Vidershain most recently served as the Company's Assistant Treasurer since January 2018. Prior to that, she served as the Company's Director, Global Financial Planning & Analysis since January 2015. Previously, she served as the Company's Director, Finance – Global Purchasing since February 2014, Director, Capital Markets and Subsidiary Finance since April 2010, Treasury Manager since January 2007 and in various other treasury positions since joining the Company in 2004. |
PART II
ITEM 5 – MARKET FOR THE COMPANY'S COMMON EQUITY,
RELATED STOCKHOLDER MATTERS AND ISSUER PURCHASES OF EQUITY SECURITIES
Market Information
Our common stock is listed on the New York Stock Exchange under the symbol "LEA."
Dividends
We currently expect to pay quarterly cash dividends in the future, although such payments are at the discretion of our Board of
Directors (the "Board") and will depend upon our financial condition, results of operations, capital requirements, alternative uses of capital and other factors that our Board may consider at its discretion. See Item 7, "Management's Discussion and Analysis of Financial Condition and Results of Operations — Forward-Looking Statements," and Note 12, "Capital Stock, Accumulated Other Comprehensive Loss and Equity," to the consolidated financial statements included in this Report.
Holders of Common Stock
The Transfer Agent and Registrar for our common stock is Computershare Trust Company, N.A., located in Canton, Massachusetts. On February 5, 2024, there were 219 registered holders of record of our common stock.
For certain information regarding our equity compensation plans, see Part III — Item 12, "Security Ownership of Certain Beneficial Owners and Management and Related Stockholder Matters — Equity Compensation Plan Information."
Common Stock Share Repurchase Program
Since the first quarter of 2011, our Board has authorized $6.1 billion in share repurchases under our common stock share repurchase program. As of December 31, 2023, we have repurchased, in aggregate, $5.2 billion of our outstanding common stock, at an average price of $93.43 per share, excluding commissions and related fees, and have a remaining repurchase authorization of $0.9 billion, which expires on December 31, 2024.
We may implement share repurchases through a variety of methods, including, but not limited to, open market purchases, accelerated stock repurchase programs and structured repurchase transactions. The extent to which we may repurchase our outstanding common stock and the timing of such repurchases will depend upon our financial condition, results of operations, capital requirements, prevailing market conditions, alternative uses of capital and other factors. See Item 7, "Management's Discussion and Analysis of Financial Condition and Results of Operations — Forward-Looking Statements," and Note 12, "Capital Stock, Accumulated Other Comprehensive Loss and Equity," to the consolidated financial statements included in this Report.
A summary of the shares of our common stock repurchased during the fiscal quarter ended December 31, 2023, is shown below:
| | | | | | | | | | | | | | | | | | | | | | | |
| Period | Total Number
of Shares
Purchased | | Average
Price Paid
per Share | | Total Number of Shares
Purchased as Part of
Publicly Announced
Plans or Programs | | Approximate Dollar
Value of Shares that
May Yet be Purchased
Under the Program
(in millions) |
| October 1, 2023 through October 28, 2023 | — | | | $ | — | | | — | | | $ | 1,091.4 | |
| October 29, 2023 through November 25, 2023 | 474,550 | | $ | 130.75 | | | 474,550 | | 1,029.4 | |
| November 26, 2023 through December 31, 2023 | 816,089 | | | $ | 138.53 | | | 816,089 | | | 916.3 | |
| Total | 1,290,639 | | $ | 135.67 | | | 1,290,639 | | $ | 916.3 | |
Performance Graph
The following graph compares the cumulative total stockholder return from December 31, 2018 through December 31, 2023, for our common stock, the S&P 500 Index and a peer group(1)of companies that we have selected for purposes of this comparison. We have assumed that dividends have been reinvested, and the returns of each company in the S&P 500 Index and the peer group have been weighted to reflect relative stock market capitalization. The graph below assumes that $100 was invested on December 31, 2018, in each of our common stock, the stocks comprising the S&P 500 Index and the stocks comprising the peer group.
| | | | | | | | | | | | | | | | | | | | | | | | | | | | | | | | | | | | | | |
| | December 31,
2018 | | December 31,
2019 | | December 31,
2020 | | December 31,
2021 | | December 31,
2022 | | December 31,
2023 |
| Lear Corporation | | $ | 100.00 | | | $ | 114.38 | | | $ | 133.71 | | | $ | 155.37 | | | $ | 107.67 | | | $ | 125.33 | |
| S&P 500 | | $ | 100.00 | | | $ | 131.47 | | | $ | 155.65 | | | $ | 200.29 | | | $ | 163.98 | | | $ | 207.04 | |
Current Peer Group (1) | | $ | 100.00 | | | $ | 125.73 | | | $ | 148.12 | | | $ | 161.40 | | | $ | 108.05 | | | $ | 119.97 | |
Previous Peer Group (1) | | $ | 100.00 | | | $ | 124.93 | | | $ | 147.09 | | | $ | 160.01 | | | $ | 107.01 | | | $ | 118.99 | |
| | | | | | | | | | | | |
(1) We do not believe that there is a single published industry or line of business index that is appropriate for comparing stockholder returns. As a result, we have selected a peer group comprised of representative independent automotive suppliers whose common stock is publicly traded. Our peer group, referenced in the graph above, consists of Adient plc, American Axle & Manufacturing Holdings Inc., Aptiv PLC, Autoliv, Inc., BorgWarner Inc., Continental AG, Dana Incorporated, Forvia SE (formerly known as Faurecia), Gentex Corporation, Gentherm Incorporated, Magna International, Inc., Valeo and Visteon Corporation, which we believe provides a more meaningful comparison of stock performance than our previous peer group. Our previous group, referenced in the graph above, consisted of Adient plc, American Axle & Manufacturing Holdings Inc., Aptiv PLC, Autoliv, Inc., BorgWarner Inc., Continental AG, Cooper-Standard Holdings Inc., Dana Incorporated, Faurecia, Gentex Corporation, Gentherm Incorporated, Magna International, Inc., Valeo and Visteon Corporation.
ITEM 6 – RESERVED
ITEM 7 – MANAGEMENT'S DISCUSSION AND ANALYSIS OF FINANCIAL CONDITION AND RESULTS OF OPERATIONS
Executive Overview
Lear Corporation is a global automotive technology leader in Seating and E-Systems, enabling superior in-vehicle experiences for consumers around the world. We supply complete seat systems, key seat components, complete electrical distribution and connection systems, high-voltage power distribution products, including battery disconnect units ("BDUs"), low-voltage power distribution products, electronic controllers and other electronic products to all of the world's major automotive manufacturers.
Lear is built on a foundation and strong culture of innovation, operational excellence, and engineering and program management capabilities. We use our product, design and technological expertise, as well as our global reach and competitive manufacturing footprint, to achieve our financial goals and objectives. These include continuing to deliver profitable growth balancing risks and returns, investing in innovation to drive business growth and profitability, maintaining a strong balance sheet with investment grade credit metrics, and consistently returning capital to our stockholders. Further, we have aligned our strategy with key trends affecting our business — primarily electrification. At Lear, we are Making every drive betterTM by providing technology for safer, smarter and more comfortable journeys, while adhering to our values — Be Inclusive. Be Inventive. Get Results the Right Way.
Our business is organized under two reporting segments: Seating and E-Systems. Each of these segments has a varied product and technology portfolio across a number of component categories.
Our Seating business consists of the design, development, engineering and manufacture of complete seat systems and key seat components. Our capabilities in operations and supply chain management enable synchronized assembly and just-in-time delivery of complex complete seat systems at high volumes to our customers. As the most vertically integrated global seat supplier, our key seat component product offerings include seat trim covers; surface materials such as leather and fabric; seat mechanisms; seat foam; thermal comfort systems such as seat heating, ventilation, active cooling, pneumatic lumbar and massage products; and headrests. All of these products are compatible with traditional internal combustion engine ("ICE") architectures and electrified powertrains, including the full range of hybrid, plug-in hybrid and battery electric architectures. Our thermal comfort systems are facilitated by our seat system, component and integration capabilities, together with our competencies in electronics, sensors, software and algorithms.
Our E-Systems business consists of the design, development, engineering and manufacture of complete electrical distribution and connection systems; high-voltage power distribution products, including BDUs; and low-voltage power distribution products, electronic controllers and other electronic products. These capabilities enable us to provide our customers with customizable solutions with optimized designs at competitive costs for both low-voltage and high-voltage vehicle architectures. Electrical distribution and connection systems utilize low-voltage and high-voltage wire, high-speed data cables and flat wiring to connect networks and electrical signals and manage electrical power within the vehicle for all types of powertrains – from traditional ICE architectures to the full range of electrified powertrains that require management of higher voltage and power. Key components of our electrical distribution and connection systems portfolio include wire harnesses, terminals and connectors, high-voltage battery connection systems and engineered components. High-voltage battery connection systems include intercell connect boards, bus bars and main battery connection systems. High-voltage power distribution products control the flow and distribution of high-voltage power throughout electrified vehicles and include BDUs which control all electrical energy flowing into and out of high-voltage batteries in electrified vehicles. Low-voltage power distribution products, electronic controllers and other electronic products facilitate signal, data and/or power management within the vehicle and include the associated software required to facilitate these functions. Key components of our other electronic products portfolio include zone control modules, body domain control modules and low-voltage and high-voltage power distribution modules. Our software offerings include embedded control, cybersecurity software and software to control hardware devices. Our customers traditionally have sourced our electronic hardware together with the software that we embed in it.
We serve all of the world's major automotive manufacturers through both our Seating and E-Systems businesses, and we have automotive content on more than 475 vehicle nameplates worldwide. It is common for us to have both seating and electrical and/or electronic content on the same vehicle platform.
Our businesses benefit globally from leveraging common operating standards and disciplines, including world-class product development and manufacturing processes, as well as common customer support and regional infrastructures, all of which contribute to our reputation for operational excellence. Our core capabilities are shared across component categories and include high-precision manufacturing and assembly with short lead times, complex, global supply chain management, global engineering and program management, the agility to establish and/or transfer production between facilities quickly, and a unique, customer-focused culture. In select instances, we are able to manufacture both Seating and E-Systems components in the same facility. Our businesses also utilize proprietary, industry-specific processes and standards, leverage common low-cost engineering centers and share centralized operating support functions. These functions include health and safety, logistics,
quality, supply chain management and all major administrative functions, such as corporate finance, executive administration, human resources, information technology and legal. We continue to build on our reputation for operational excellence through investment in Industry 4.0 technologies. Industry 4.0 refers to the current era of digital transformation in manufacturing. It involves the integration of new technologies, such as Industrial Internet of Things (IIoT), cloud computing, artificial intelligence (AI), machine learning and advanced automation, into production facilities and business operations. These technologies enable smart and automated machines and smart factories to communicate, analyze and optimize processes and products, resulting in higher efficiency, quality and responsiveness to customers.
Industry Overview
Our sales are driven by the number of vehicles produced by the automotive manufacturers, which is ultimately dependent on consumer demand for automotive vehicles and the availability of raw materials and components, and our content per vehicle. In 2020, the automotive industry experienced a significant decline in global production volumes as a result of the COVID-19 pandemic. In 2022, industry production recovered modestly, increasing 8% compared to 2021. In 2023, industry production increased 9%compared to 2022. This reflects a return to 2019 pre-pandemic production levels but remains 5% below 2017 peak levels. Since 2020, the global economy, as well as the automotive industry, have been influenced directly and indirectly by macroeconomic events resulting in unfavorable conditions, including shortages of semiconductor chips and other components, elevated inflation levels on commodities and labor, higher interest rates, and labor and energy shortages in certain markets. Beginning in the third quarter of 2023 and continuing into the fourth quarter of 2023, the automotive industry was impacted by labor strikes and related disruptions at certain facilities in the United States. Certain of these factors, among others, continue to impact consumer demand, as well as the ability of automotive manufacturers to produce vehicles to meet demand. Our strategy to mitigate these impacts encompasses our comprehensive cost management process, including cost technology optimization, actions to further align our manufacturing capacity to the current industry production environment and investments in Industry 4.0 technologies. This will allow us to enhance operational efficiencies, improve the utilization of existing facilities and equipment to reduce future expenditures, and streamline and automate administrative functions. For a description of risks related to macroeconomic events, see Item 1A, "Risk Factors."
Global automotive industry production volumes in 2023, as compared to 2022, are shown below (in thousands of units):
| | | | | | | | | | | | | | | | | |
| 2023 (1) | | 2022 (1) (2) | | % Change |
| North America | 15,647.8 | | | 14,296.2 | | | 9 | % |
| Europe and Africa | 18,259.5 | | | 16,218.7 | | | 13 | % |
| Asia | 50,147.8 | | | 46,049.2 | | | 9 | % |
| South America | 2,817.9 | | | 2,716.5 | | | 4 | % |
| Other | 1,746.2 | | | 1,769.1 | | | (1 | %) |
| Global light vehicle production | 88,619.2 | | | 81,049.7 | | | 9 | % |
(1) Production data based on S&P Global Mobility.
(2) Production data for 2022 has been updated from our 2022 Annual Report on Form 10-K to reflect actual production levels.
Automotive sales and production can also be affected by the age of the vehicle fleet and related scrappage rates, labor relations issues and shortages, fuel prices, regulatory requirements, government initiatives, trade agreements, tariffs and other non-tariff trade barriers, the availability and cost of credit, the availability and cost of critical components needed to complete the production of vehicles, logistics issues, restructuring actions of our customers and suppliers, facility closures and increased competition, as well as consumer preferences regarding vehicle powertrains (including preferences regarding hybrid and electric vehicles), size, configuration and features, among other factors. Our operating results are also significantly impacted by the overall commercial success of the vehicle platforms for which we supply particular products, as well as the profitability of the products, including the level of vertical integration, that we supply for these platforms. The loss of business with respect to any vehicle model for which we are a significant supplier, or a decrease in the production levels of any such models, could adversely affect our operating results. In addition, larger cars and light trucks, as well as vehicle platforms that offer more features and functionality, such as luxury, sport utility and crossover vehicles, typically have more content and, therefore, tend to have a more significant impact on our operating results.
Our percentage of consolidated net sales by region in 2023 and 2022 is shown below:
| | | | | | | | | | | |
| 2023 | | 2022 |
| North America | 40 | % | | 43 | % |
| Europe and Africa | 37 | % | | 33 | % |
| Asia | 19 | % | | 20 | % |
| South America | 4 | % | | 4 | % |
| Total | 100 | % | | 100 | % |
Our ability to reduce the risks inherent in certain concentrations of our business, and thereby maintain our financial performance in the future, will depend, in part, on our ability to continue to diversify our sales on a customer, product, platform and geographic basis to reflect the market overall.
The automotive industry, and our business, continue to be shaped by the broad trend of electrification, which is likely to be at the forefront of the industry for the foreseeable future. Demand for, and regulatory developments related to, improved energy efficiency and sustainability (e.g., government mandates related to fuel economy and carbon emissions) are significant drivers of this trend.
Through our products, technology and strategic initiatives, we are well positioned to capitalize on business growth opportunities. We are focused on profitably growing our businesses and have implemented a strategy designed to deliver industry-leading, long-term financial returns. This strategy is based on the following four pillars designed to drive growth and profitability in both of our business segments:
•Extend our market leadership position in Seating with priceable features;
•Transform our E-Systems business through accelerated growth in connection systems, vehicle architecture evolution and electrification, and the rationalization of our product portfolio to improve profitability;
•Build on our reputation for operational excellence through investment in Industry 4.0 technologies; and
•Prioritize people and the planet through our sustainability initiatives to drive business growth, cost reductions and improved employee retention.
For further information related to our strategy, see Part 1 — Item 1, "Business — Industry" and "— Strategy."
Our customers typically require us to reduce our prices over the life of a vehicle model and, at the same time, assume significant responsibility for the design, development and engineering of our products. Our financial performance is largely dependent on our ability to offset these price reductions with product cost reductions through product design enhancement, supply chain management, manufacturing efficiencies and restructuring actions. We also seek to enhance our financial performance by investing in product development, design capabilities and new product initiatives that respond to and anticipate the needs of our customers and consumers. We continually evaluate operational and strategic alternatives to improve our business structure and align our business with the changing needs of our customers and major industry trends affecting our business.
Our material cost as a percentage of net sales was 65.2% in 2023, as compared to 66.1% in 2022 and 65.4% in 2021. Raw material, energy, commodity and product component costs can be volatile, reflecting, among other things, changes in supply and demand, logistics issues, global trade and tariff policies, and geopolitical issues. Our primary commodity cost exposures relate to steel, copper and leather. We have developed and implemented strategies to mitigate the impact of such costs through the selective in-sourcing of components, the continued consolidation of our supply base, longer-term purchase commitments, contractual recovery mechanisms and the selective expansion of low-cost country sourcing and engineering, as well as value engineering and product benchmarking. Further, our exposure to changes in steel prices is primarily indirect, through purchased components, and a significant portion of our copper, leather and direct steel purchases are subject to price index agreements with our customers and suppliers. Certain of these strategies also may limit our opportunities in a declining price environment. In the current environment of elevated raw material, energy, commodity and product component costs, these strategies, together with commercial negotiations with our customers and suppliers, have offset a significant portion of the adverse impact. In addition, the availability of raw materials, energy, commodities and product components fluctuates from time to time due to factors outside of our control. If these costs increase or availability is restricted, it could have an adverse impact on our operating results in the foreseeable future. See Part I — Item 1A, "Risk Factors — Increases in the costs and restrictions on the availability of raw materials, energy, commodities, product components and labor could adversely affect our financial performance," and "— Forward-Looking Statements" below.
Financial Measures
In evaluating our financial condition and operating performance, we focus primarily on earnings, operating margins, cash flows and return on invested capital. Our strategy includes expanding our business with new and existing customers globally through new products, including those aligned with the trend toward electrification. We have also increased our vertical integration capabilities globally, as well as expanded our component manufacturing capacity in Asia, Eastern Europe, Mexico and Northern Africa and our low-cost engineering capabilities in Asia, Eastern Europe and Northern Africa.
Our success in generating cash flow will depend, in part, on our ability to manage working capital effectively. Working capital can be significantly impacted by the timing of cash flows from sales and purchases. Historically, we generally have been successful in aligning our supplier payment terms with our customer payment terms. However, our ability to continue to do so may be impacted by adverse automotive industry conditions, including inconsistent production schedules due to supply shortages, changes to our customers' payment terms and the financial condition of our suppliers. In addition, our cash flow is impacted by our ability to manage our inventory and capital spending effectively. We utilize return on invested capital as a measure of the efficiency with which our assets generate earnings. Improvements in our return on invested capital will depend on our ability to maintain an appropriate asset base for our business and to increase productivity and operating efficiency.
Acquisitions
2023
In April 2023, we completed the acquisition of I.G. Bauerhin ("IGB"), a privately held supplier of automotive seat heating, ventilation and active cooling, steering wheel heating, seat sensors and electronic control modules, headquartered in Grundau-Rothenbergen, Germany. IGB has more than 4,600 employees at nine manufacturing plants in seven countries. The acquisition furthers our comprehensive strategy to develop and integrate a complete portfolio of thermal comfort systems for automotive seating. IGB provides active cooling, as well as additional scale to our seat heating and ventilation capabilities and complements the lumbar and massage capabilities obtained with our acquisition of Kongsberg Automotive's Interior Comfort Systems business unit ("Kongsberg ICS") in February 2022. Further, the vertical integration opportunities provided by this acquisition help support our goal of achieving global market share gains in seat systems. We paid approximately $175 million, net of cash acquired, in connection with the acquisition. On May 1, 2023, we borrowed $150 million under our delayed-draw term loan facility (the "Term Loan") to finance, in part, the acquisition of IGB. For further information, see Note 4, "Acquisitions," to the consolidated financial statements included in this Report.
2022
In February 2022, we completed the acquisition of substantially all of Kongsberg ICS, which specializes in thermal comfort systems. With almost 50 years of experience in thermal comfort systems, Kongsberg ICS has leading technology, a well-balanced customer portfolio built on longstanding relationships with leading premium automotive manufacturers, and an experienced team. The Kongsberg ICS acquisition is advancing our seat component capabilities into specialized thermal comfort systems, such as seat heating, ventilation, lumbar and massage products that further differentiate our product offerings and improve vehicle performance and packaging — important features across various vehicle segments. We paid approximately $188 million, on a cash and debt free basis, in connection with the acquisition. For further information, see Note 4, "Acquisitions," to the consolidated financial statements included in this Report.
In May 2022, we completed the acquisition of Thagora Technology SRL ("Thagora"), a privately held company based in Iasi, Romania, to access scalable smart-manufacturing technology. Thagora's proprietary solutions complement our sustainable manufacturing processes by improving the production yield of our Seating segment's surface materials operations and lowering energy usage during production. In addition, Thagora's Industry 4.0 technologies bring significant advances to our manufacturing operations through engineering and logistics enhancements, including improved material traceability and facility footprint utilization capabilities. The acquisition is not material to the consolidated financial statements included in this Report.
In November 2022, we completed the acquisition of InTouch Automation ("InTouch"), a privately held supplier of Industry 4.0 technologies and complex automated testing equipment critical in the production of automotive seats. InTouch's product portfolio is aligned with our Industry 4.0 strategy to implement technologies designed to automate the testing and validation of seat components and complete seats. The acquisition is not material to the consolidated financial statements included in this Report.
Operational Restructuring
In 2023, we incurred pretax restructuring costs of $133 million and related manufacturing inefficiency charges of approximately $1 million, as compared to pretax restructuring costs of $154 million and related manufacturing inefficiency charges of approximately $5 million in 2022. None of the individual restructuring actions initiated in 2023 were material.
Further, there have been no changes in previously initiated restructuring actions that have resulted (or will result) in a material change to our restructuring costs.
Our restructuring actions include plant closures and workforce reductions and are initiated to maintain our competitive footprint or are in response to customer initiatives or changes in global and regional automotive markets. Our restructuring actions are designed to maintain or improve our operating results and profitability throughout the automotive industry cycles. Restructuring actions are generally funded within twelve months of initiation and are funded by cash flows from operating activities and existing cash balances. We expect to incur approximately $76 million of additional restructuring costs related to activities initiated as of December 31, 2023, all of which are expected to be incurred in the next twelve months. We plan to implement additional restructuring actions in order to align our manufacturing capacity and other costs with prevailing regional automotive production levels. Such future restructuring actions are dependent on market conditions, customer actions and other factors.
For further information, see Note 5, "Restructuring," to the consolidated financial statements included in this Report.
Financing Transactions
In May 2023, we borrowed $150 million under our Term Loan to finance, in part, the acquisition of IGB.
In November 2023, we extended the maturity date of our revolving credit facility by one year to October 28, 2027.
For further information related to our acquisition of IGB, see Note 4, "Acquisitions," to the consolidated financial statement included in this Report. For further information related to our Term Loan and our revolving credit facility, see "— Liquidity and Capital Resources — Capitalization — Credit Agreement" and "— Term Loan" below and Note 7, "Debt," to the consolidated financial statements included in this Report.
Share Repurchase Program and Quarterly Cash Dividends
We may implement share repurchases through a variety of methods, including, but not limited to, open market purchases, accelerated stock repurchase programs and structured repurchase transactions. The extent to which we may repurchase our outstanding common stock and the timing of such repurchases will depend upon our financial condition, results of operations, capital requirements, prevailing market conditions, alternative uses of capital and other factors. (see "— Forward-Looking Statements" below).
Since the first quarter of 2011, our Board of Directors (the "Board") has authorized $6.1 billion in share repurchases under our common stock share repurchase program. In 2023, we repurchased $313 million of shares. As of December 31, 2023, we have a remaining repurchase authorization of $916 million, which expires on December 31, 2024.
In 2023 and 2022, our Board declared a quarterly cash dividend of $0.77 per share of common stock in all quarters. In 2021, our Board declared a quarterly cash dividend of $0.25 per share of common stock in the first and second quarters, a quarterly cash dividend of $0.50 per share of common stock in the third quarter and a quarterly cash dividend of $0.77 per share of common stock in the fourth quarter.
For further information related to our common stock share repurchase program and our quarterly cash dividends, see Item 5, "Market for the Company's Common Equity, Related Stockholder Matters and Issuer Purchases of Equity Securities," "— Liquidity and Capital Resources — Capitalization" below and Note 12, "Capital Stock, Accumulated Other Comprehensive Loss and Equity," to the consolidated financial statements included in this Report.
Other Matters
In 2023, we recognized net tax benefits of $35 million related to restructuring charges, the release of valuation allowances on deferred tax assets of foreign subsidiaries, the release of tax reserves at several foreign subsidiaries and various other items.
In 2022, we recognized net tax benefits of $34 million related to restructuring charges and various other items.
In 2021, we recognized tax benefits of $39 million related to restructuring charges and various other items, partially offset by tax expense of $17 million related to the net increase in valuation allowances on deferred tax assets of foreign subsidiaries and $8 million on a $45 million gain related to a favorable indirect tax ruling in a foreign jurisdiction.
As discussed above, our results for the years ended December 31, 2023, 2022 and 2021, reflect the following items (in millions):
| | | | | | | | | | | | | | | | | |
| For the year ended December 31, | 2023 | | 2022 | | 2021 |
| Costs related to restructuring actions, including manufacturing inefficiencies of $1 million in 2023, $5 million in 2022 and $12 million in 2021 | $ | 134 | | | $ | 159 | | | $ | 113 | |
| Acquisition costs | 1 | | | 10 | | | — | |
| Acquisition-related inventory fair value adjustment | 2 | | | 1 | | | — | |
| Impairments related to Russian operations | 2 | | | 19 | | | — | |
| Intangible asset impairment | 2 | | | 9 | | | 9 | |
| Insurance (recoveries) costs related to typhoon in the Philippines, net | (7) | | | (1) | | | 13 | |
| Foreign exchange (gains) losses due to foreign exchange rate volatility related to Russia | (2) | | | 10 | | | — | |
| Favorable indirect tax ruling in a foreign jurisdiction | (1) | | | — | | | (45) | |
| Gain on acquisition-related foreign exchange contracts | — | | | (2) | | | — | |
| Loss on extinguishment of debt | — | | | — | | | 25 | |
| Loss related to investments | 7 | | | — | | | 2 | |
| Tax benefits, net | (35) | | | (34) | | | (14) | |
For further information regarding these items, see Note 3, "Summary of Significant Accounting Policies," Note 4, "Acquisitions," Note 5, "Restructuring," Note 6, "Investments in Affiliates and Other Related Party Transactions," Note 7, "Debt," Note 8, "Leases," and Note 9, "Income Taxes," to the consolidated financial statements included in this Report. This section includes forward-looking statements that are subject to risks and uncertainties. For further information regarding these and other factors that have had, or may have in the future, a significant impact on our business, financial condition or results of operations, see Part I — Item 1A, "Risk Factors," and "— Forward-Looking Statements" below.
Results of Operations
A summary of our operating results in millions of dollars and as a percentage of net sales is shown below:
| | | | | | | | | | | | | | | | | | | | | | | | | | | | | | | | | | | |
| For the year ended December 31, | 2023 | | 2022 | | 2021 |
| Net sales | | | | | | | | | | | |
| Seating | $ | 17,548.8 | | | 74.8 | % | | $ | 15,711.2 | | | 75.2 | % | | $ | 14,411.4 | | | 74.8 | % |
| E-Systems | 5,918.1 | | | 25.2 | | | 5,180.3 | | | 24.8 | | | 4,851.7 | | | 25.2 | |
| Net sales | 23,466.9 | | | 100.0 | | | 20,891.5 | | | 100.0 | | | 19,263.1 | | | 100.0 | |
| Cost of sales | 21,756.5 | | | 92.7 | | | 19,481.6 | | | 93.3 | | | 17,871.2 | | | 92.8 | |
| Gross profit | 1,710.4 | | | 7.3 | | | 1,409.9 | | | 6.7 | | | 1,391.9 | | | 7.2 | |
| Selling, general and administrative expenses | 714.7 | | | 3.0 | | | 684.8 | | | 3.3 | | | 643.2 | | | 3.3 | |
| Amortization of intangible assets | 62.5 | | | 0.3 | | | 70.8 | | | 0.3 | | | 73.3 | | | 0.4 | |
| Interest expense, net | 101.1 | | | 0.4 | | | 98.6 | | | 0.5 | | | 91.8 | | | 0.5 | |
| Other expense, net | 54.9 | | | 0.3 | | | 46.4 | | | 0.2 | | | 0.1 | | | — | |
| Provision for income taxes | 180.8 | | | 0.8 | | | 133.7 | | | 0.6 | | | 137.7 | | | 0.7 | |
| Equity in net income of affiliates | (49.3) | | | (0.2) | | | (33.1) | | | (0.2) | | | (15.8) | | | (0.1) | |
| Net income attributable to noncontrolling interests | 73.2 | | | 0.3 | | | 81.0 | | | 0.4 | | | 87.7 | | | 0.5 | |
| Net income attributable to Lear | $ | 572.5 | | | 2.4 | % | | $ | 327.7 | | | 1.6 | % | | $ | 373.9 | | | 1.9 | % |
Year Ended December 31, 2023, Compared With Year Ended December 31, 2022
Net sales for the year ended December 31, 2023 were $23.5 billion, as compared to $20.9 billion for the year ended December 31, 2022, an increase of $2.6 billion or 12%. Higher production volumes on Lear platforms and new business in every region favorably impacted net sales by $1.4 billion and $0.9 billion, respectively.
| | | | | | | | |
| (in millions) | | Cost of Sales |
| 2022 | | $ | 19,481.6 | |
| Material cost | | 1,492.8 | |
| Labor and other | | 748.3 | |
| Depreciation | | 33.8 | |
| 2023 | | $ | 21,756.5 | |
Cost of sales in 2023 was $21.8 billion, as compared to $19.5 billion in 2022. Higher production volumes on Lear platforms and new business in every region increased cost of sales.
Gross profit and gross margin were $1.7 billion and 7.3% of net sales in 2023, as compared to $1.4 billion and 6.7% of net sales in 2022. Higher production volumes on Lear platforms and new business positively impacted gross profit by $308 million. The impact of favorable operating performance, including the benefit of restructuring actions, was offset by selling price reductions. These factors had a corresponding impact on gross margin.
Selling, general and administrative expenses, including engineering and development expenses, were $715 million for the year ended December 31, 2023, as compared to $685 million for the year ended December 31, 2022, primarily reflecting higher sales and our acquisition of IGB in 2023. As a percentage of net sales, selling, general and administrative expenses were 3.0% in 2023, as compared to 3.3% in 2022.
Amortization of intangible assets was $63 million in 2023, including an impairment charge of $2 million, as compared to $71 million in 2022, including an impairment charge of $9 million.
Interest expense, net was $101 million in 2023, as compared to $99 million in 2022.
Other expense, net, which includes non-income related taxes, foreign exchange gains and losses, gains and losses related to certain derivative instruments and hedging activities, gains and losses on the disposal of fixed assets, the non-service cost components of net periodic benefit cost and other miscellaneous income and expense, was $55 million in 2023, as compared to $46 million in 2022. In 2023, we recognized foreign exchange losses of $53 million, including $31 million related to the hyper-inflationary environment and significant currency devaluation in Argentina, and losses of $7 million related to impairments of affiliates. In 2023, we also recognized gains of $18 million related to the sales of fixed assets and $4 million related to insurance recoveries. In 2022, we recognized foreign exchange losses of $30 million, including losses of $10 million related to foreign exchange rate volatility in Russia and gains of $2 million related to foreign exchange contracts on the €140 million IGB purchase price. In 2022, we also recognized a gain of $1 million related to insurance recoveries.
In 2023, the provision for income taxes was $181 million, representing an effective tax rate of 23.3% on pretax income before equity in net income of affiliates of $777 million. In 2022, the provision for income taxes was $134 million, representing an effective tax rate of 26.3% on pretax income before equity in net income of affiliates of $509 million.
In 2023 and 2022, the provision for income taxes was primarily impacted by the level and mix of earnings among tax jurisdictions. In 2023, we recognized net tax benefits of $35 million related to restructuring charges, the release of valuation allowances on deferred tax assets of foreign subsidiaries, the release of tax reserves at several foreign subsidiaries and various other items. In 2022, we recognized net tax benefits of $34 million related to restructuring charges and various other items.
For information related to our valuation allowances, see "— Other Matters — Significant Accounting Policies and Critical Accounting Estimates — Income Taxes" below.
Equity in net income of affiliates was $49 million for the year ended December 31, 2023, as compared to $33 million for the year ended December 31, 2022, primarily reflecting the higher earnings of certain of our joint ventures in Asia.
Net income attributable to Lear was $573 million, or $9.68 per diluted share, in 2023, as compared to $328 million, or $5.47 per diluted share, in 2022. Net income and diluted net income per share increased for the reasons described above.
Reportable Operating Segments
We have two reportable operating segments: Seating and E-Systems. For a description of our reportable operating segments, see "Executive Overview" above.
The financial information presented below is for our two reportable operating segments and our other category for the periods presented. The other category includes unallocated costs related to corporate headquarters, regional headquarters and the elimination of intercompany activities, none of which meets the requirements for being classified as an operating segment. Corporate and regional headquarters costs include various support functions, such as information technology, advanced research and development, corporate finance, legal, executive administration and human resources. Financial measures regarding each segment's pretax income before equity in net income of affiliates, interest expense, net and other expense, net ("segment earnings") and segment earnings divided by net sales ("margin") are not measures of performance under accounting principles generally accepted in the United States ("GAAP"). Segment earnings and the related margin are used by management to evaluate the performance of our reportable operating segments. Segment earnings should not be considered in isolation or as a substitute for net income attributable to Lear, net cash provided by operating activities or other income statement or cash flow statement data prepared in accordance with GAAP or as measures of profitability or liquidity. In addition, segment earnings, as we determine it, may not be comparable to related or similarly titled measures reported by other companies.
For a reconciliation of consolidated segment earnings to consolidated income before provision for income taxes and equity in net income of affiliates, see Note 15, "Segment Reporting," to the consolidated financial statements included in this Report.
Seating —
A summary of financial measures for our Seating segment is shown below (dollar amounts in millions):
| | | | | | | | | | | |
| For the year ended December 31, | 2023 | | 2022 |
| Net sales | $ | 17,548.8 | | | $ | 15,711.2 | |
Segment earnings (1) | 1,066.9 | | | 893.0 | |
| Margin | 6.1 | % | | 5.7 | % |
(1) See definition above.
Seating net sales were $17.5 billion for the year ended December 31, 2023, as compared to $15.7 billion for the year ended December 31, 2022, an increase of $1.8 billion or 12%. Higher production volumes on Lear platforms and new business favorably impacted net sales by $1.0 billion and $0.6 billion, respectively. Our acquisitions of IGB and Kongsberg ICS also increased net sales $0.2 billion.
Segment earnings, including restructuring costs, and the related margin on net sales were $1.1 billion and 6.1% in 2023, as compared to $893 million and 5.7% in 2022. Higher production volumes on Lear platforms and new business positively impacted segment earnings by $215 million. The impact of selling price reductions and higher restructuring costs were offset by favorable operating performance, including the benefit of commodity recoveries and operational restructuring actions.
E-Systems —
A summary of financial measures for our E-Systems segment is shown below (dollar amounts in millions):
| | | | | | | | | | | |
| For the year ended December 31, | 2023 | | 2022 |
| Net sales | $ | 5,918.1 | | | $ | 5,180.3 | |
Segment earnings (1) | 228.9 | | | 74.4 | |
| Margin | 3.9 | % | | 1.4 | % |
(1) See definition above.
E-Systems net sales were $5.9 billion for the year ended December 31, 2023, as compared to $5.2 billion for the year ended December 31, 2022, an increase of $738 million or 14%. Higher production volumes on Lear platforms and new business favorably impacted net sales by $0.4 billion and $0.3 billion, respectively.
Segment earnings, including restructuring costs, and the related margin on net sales were $229 million and 3.9% in 2023, as compared to $74 million and 1.4% in 2022. Higher production volumes on Lear platforms and new business positively impacted segment earnings by $93 million. The impact of favorable operating performance, including the benefit of operational restructuring actions, and lower restructuring costs was partially offset by selling price reductions.
Other —
A summary of financial measures for our other category, which is not an operating segment, is shown below (dollar amounts in millions):
| | | | | | | | | | | |
| For the year ended December 31, | 2023 | | 2022 |
| Net sales | $ | — | | | $ | — | |
Segment earnings (1) | (362.6) | | | (313.1) | |
| Margin | N/A | | N/A |
(1) See definition above.
Segment earnings related to our other category were ($363) million in 2023, as compared to ($313) million in 2022, primarily reflecting higher compensation-related costs and costs related to our efficiency initiatives including investments in information technology.
Year Ended December 31, 2022, Compared With Year Ended December 31, 2021
For a discussion of our results of operations for the year ended December 31, 2022, compared with the year ended December 31, 2021, refer to our Annual Report on Form 10-K for the year ended December 31, 2022.
Liquidity and Capital Resources
Our primary liquidity needs are to fund general business requirements, including working capital requirements, capital expenditures, operational restructuring actions and debt service requirements. Our principal sources of liquidity are cash flows from operating activities, borrowings under available credit facilities and our existing cash balance.
Cash Provided by Subsidiaries
A substantial portion of our operating income is generated by our subsidiaries. As a result, we are dependent on the earnings and cash flows of and the combination of dividends, royalties, intercompany loan repayments and other distributions and advances from our subsidiaries to provide the funds necessary to meet our obligations.
As of December 31, 2023 and 2022, cash and cash equivalents of $803 million and $790 million, respectively, were held in foreign subsidiaries and can be repatriated, primarily through the repayment of intercompany loans and the payment of dividends. There are no material restrictions on the ability of our subsidiaries to pay dividends or make other distributions to Lear.
For further information regarding potential dividends from our non-U.S. subsidiaries, see "— Adequacy of Liquidity Sources" below and Note 9, "Income Taxes," to the consolidated financial statements included in this Report.
Adequacy of Liquidity Sources
As of December 31, 2023, we had approximately $1.2 billion of cash and cash equivalents on hand and $2.0 billion in available borrowing capacity under our credit agreement. Together with cash provided by operating activities, we believe that this will enable us to meet our liquidity needs for the foreseeable future and to satisfy ordinary course business obligations. In addition, we expect to continue to pay quarterly cash dividends and repurchase shares of our common stock pursuant to our authorized common stock share repurchase program, although such actions are at the discretion of our Board and will depend upon our financial condition, results of operations, capital requirements, prevailing market conditions, alternative uses of capital and other factors that our Board may consider at its discretion.
Our future financial results and our ability to continue to meet our liquidity needs are subject to, and will be affected by, cash flows from operations, as well as restructuring activities, automotive industry conditions, the financial condition of our customers and suppliers, supply chain disruptions and other related factors. Additionally, an economic downturn or further reduction in production levels could negatively impact our financial condition.
For further discussion of the risks and uncertainties affecting our cash flows from operations and our overall liquidity, see Part I — Item 1A, "Risk Factors," and "— Executive Overview" above and "— Forward-Looking Statements" below.
Cash Flows
Year Ended December 31, 2023, Compared with Year Ended December 31, 2022
A summary of net cash provided by operating activities is shown below (in millions):
| | | | | | | | | | | | | | | | | |
| For the year ended December 31, | 2023 | | 2022 | | Increase (Decrease) in
Cash Flow |
| Consolidated net income and depreciation and amortization | $ | 1,250 | | | $ | 985 | | | $ | 265 | |
| Net change in working capital items: | | | | | |
| Accounts receivable | (148) | | | (519) | | | 371 | |
| Inventory | (118) | | | (30) | | | (88) | |
| Other current assets | (17) | | | (17) | | | — | |
| Accounts payable | 162 | | | 369 | | | (207) | |
| Accrued liabilities | 165 | | | 179 | | | (14) | |
| Net change in working capital items | 44 | | | (18) | | | 62 | |
| Other | (45) | | | 54 | | | (99) | |
| Net cash provided by operating activities | $ | 1,249 | | | $ | 1,021 | | | $ | 228 | |
| | | | | |
| Net cash used in investing activities | $ | (762) | | | $ | (830) | | | $ | 68 | |
| | | | | |
| Net cash used in financing activities | $ | (420) | | | $ | (387) | | | $ | (33) | |
Net cash provided by operating activities was $1.2 billion in 2023, as compared to $1.0 billion in 2022. The overall increase in operating cash flow primarily reflects our higher earnings in 2023 as compared to 2022.
Net cash used in investing activities was $762 million in 2023, as compared to $830 million in 2022. In 2023, we paid $175 million for our IGB acquisition. In 2022, we paid $188 million for our Kongsberg ICS acquisition and $15 million related to investments in affiliates. In 2023, capital spending was $627 million, as compared to $638 million in 2022. Capital spending is estimated to be approximately $675 million in 2024.
Net cash used in financing activities was $420 million in 2023, as compared to $387 million in 2022. In 2023, we borrowed $150 million under our Term Loan and paid $297 million for repurchases of our common stock, $182 million in dividends to Lear stockholders and $79 million in dividends to noncontrolling interest holders. In 2022, we paid $100 million for repurchases of our common stock, $186 million in dividends to Lear stockholders and $85 million in dividends to noncontrolling interest holders.
For further information regarding our 2023 and 2022 financing transactions, see "— Capitalization" below and Note 7, "Debt," and Note 12, "Capital Stock, Accumulated Other Comprehensive Loss and Equity," to the consolidated financial statements included in this Report.
Year Ended December 31, 2022, Compared with Year Ended December 31, 2021
For a discussion of our cash flows for the year ended December 31, 2022, compared with the year ended December 31, 2021, refer to our Annual Report on Form 10-K for the year ended December 31, 2022.
Capitalization
Short-Term Borrowings
We utilize uncommitted lines of credit as needed for our short-term working capital fluctuations. As of December 31, 2023 and 2022, we had lines of credit from banks totaling $338 million and $298 million, respectively. As of December 31, 2023 and 2022, we had short-term debt balances outstanding related to draws on our lines of credit of $28 million and $10 million, respectively.
The availability of uncommitted lines of credit may be affected by our financial performance, credit ratings and other factors.
Senior Notes
As of December 31, 2023, our senior notes (collectively, the "Notes") consist of the amounts shown below (in millions, except stated coupon rates):
| | | | | | | | | | | | | | |
| Note | | Aggregate Principal Amount at Maturity | | Stated Coupon Rate |
| Senior unsecured notes due 2027 (the "2027 Notes") | | $ | 550 | | | 3.80% |
| Senior unsecured notes due 2029 (the "2029 Notes") | | 375 | | | 4.25% |
| Senior unsecured notes due 2030 (the "2030 Notes") | | 350 | | | 3.50% |
| Senior unsecured notes due 2032 (the "2032 Notes") | | 350 | | | 2.60% |
| Senior unsecured notes due 2049 (the "2049 Notes") | | 625 | | | 5.25% |
| Senior unsecured notes due 2052 (the "2052 Notes") | | 350 | | | 3.55% |
| | $ | 2,600 | | | |
The issue, maturity and interest payment dates of the Notes are shown below:
| | | | | | | | | | | | | | | | | | | | |
| Note | | Issuance Date | | Maturity Date | | Interest Payment Dates |
| 2027 Notes | | August 2017 | | September 15, 2027 | | March 15 and September 15 |
| 2029 Notes | | May 2019 | | May 15, 2029 | | May 15 and November 15 |
| 2030 Notes | | February 2020 | | May 30, 2030 | | May 30 and November 30 |
| 2032 Notes | | November 2021 | | January 15, 2032 | | January 15 and July 15 |
| 2049 Notes | | May 2019 and February 2020 | | May 15, 2049 | | May 15 and November 15 |
| 2052 Notes | | November 2021 | | January 15, 2052 | | January 15 and July 15 |
In 2021, we issued $350 million in aggregate principal amount at maturity of 2032 Notes and $350 million in aggregate principal amount at maturity of 2052 Notes. The 2032 Notes have a stated coupon rate of 2.6% and were issued at 99.782% of par, resulting in a yield to maturity of 2.624%. The 2052 Notes have a stated coupon rate of 3.55% and were issued at 99.845% of par, resulting in a yield to maturity of 3.558%.
The net proceeds from the offering of $699 million, after original issue discount, were used, in part, to fund the tender of $200 million in aggregate principal amount of 2027 Notes and the repayment in full of $206 million outstanding on our term loan facility under our credit agreement (see "— Credit Agreement" below). The remaining net proceeds were used to finance the 2022 acquisition of Kongsberg ICS and for general corporate purposes. For further information related to the Kongsberg ICS acquisition, see Note 4, "Acquisitions," to the consolidated financial statements included in this Report.
In connection with these transactions, we recognized a loss of $24 million on the extinguishment of debt and paid related issuance costs of $7 million.
The indentures governing the Notes contain certain restrictive covenants and customary events of default. As of December 31, 2023, we were in compliance with all covenants under the indentures governing the Notes.
For further information related to the Notes, including information on early redemption, covenants and events of default, see Note 7, "Debt," to the consolidated financial statements included in this Report and the indentures governing the Notes, which have been incorporated by reference as exhibits to this Report.
Credit Agreement
Our unsecured credit agreement, dated August 8, 2017, consisted of a $1.75 billion revolving credit facility (the "Revolving Credit Facility") and a $250 million term loan facility (the "Term Loan Facility").
In October 2021, we entered into an amended and restated credit agreement (the "Credit Agreement") that increased the Revolving Credit Facility to $2.0 billion and extended the maturity date to October 28, 2026. In November 2021, we repaid in full $206 million outstanding on the Term Loan Facility. In connection with these transactions, we recognized a loss of approximately $1 million on the extinguishment of debt and paid related issuance costs of approximately $3 million.
In November 2023, we extended the maturity date of the Revolving Credit Facility by one year to October 28, 2027.
In 2023 and 2021, there were no borrowings or repayments under the Revolving Credit Facility. In 2022, aggregate borrowings and repayments under the Revolving Credit Facility were $65 million. As of December 31, 2023 and 2022, there were no borrowings outstanding under the Revolving Credit Facility.
The Credit Agreement contains various financial and other covenants that require us to remain below a maximum leverage coverage ratio. As of December 31, 2023, we were in compliance with all covenants under the Credit Agreement.
For further information related to the Credit Agreement, including information on pricing, covenants and events of default, see Note 7, "Debt," to the consolidated financial statements included in this Report and the Credit Agreement, which has been incorporated by reference as an exhibit to this Report.
Term Loan
In May 2023, we borrowed $150 million under our Term Loan to finance, in part, the acquisition of IGB.
The Term Loan contains the same covenants as the Credit Agreement. As of December 31, 2023, we were in compliance with all covenants under the Term Loan.
For further information related to our acquisition of IGB, see Note 4, "Acquisitions," to the consolidated financial statements included in this Report. For further information related to our Term Loan, see Note 7, "Debt," to the consolidated financial statements included in this Report.
Common Stock Share Repurchase Program
See Item 5, "Market for the Company's Common Equity, Related Stockholder Matters and Issuer Purchases of Equity Securities."
Dividends
In 2023 and 2022, our Board declared a quarterly cash dividend of $0.77 per share of common stock in all quarters. In 2021, our Board declared a quarterly cash dividend of $0.25 per share of common stock in the first and second quarters, a quarterly cash dividend of $0.50 per share of common stock in the third quarter and a quarterly cash dividend of $0.77 per share of common stock in the fourth quarter.
We expect to continue to pay quarterly cash dividends in the future, although such payments are at the discretion of our Board and will depend upon our financial condition, results of operations, capital requirements, prevailing market conditions, alternative uses of capital and other factors that our Board may consider at its discretion. See "— Forward-Looking Statements" below and Note 7, "Debt," to the consolidated financial statements included in this Report.
Commodity Prices
Raw material, energy and commodity costs can be volatile, reflecting, among other things, changes in supply and demand, logistics issues, global trade and tariff policies, and geopolitical issues. We have commodity price risk with respect to purchases of certain raw materials, including steel, copper, diesel fuel, chemicals, resins and leather. Our primary commodity cost exposures relate to steel, copper and leather. We have developed and implemented strategies to mitigate the impact of such costs through the selective in-sourcing of components, the continued consolidation of our supply base, longer-term purchase commitments, contractual recovery mechanisms and the selective expansion of low-cost country sourcing and engineering, as well as value engineering and product benchmarking. Further, the majority of the steel used in our products is comprised of fabricated components that are integrated into a seat system, such as seat frames, recliner mechanisms, seat tracks and other mechanical components. Therefore, our exposure to changes in steel prices is primarily indirect, through purchased components. Additionally, approximately 91%of our copper purchases and a significant portion of our leather and direct steel purchases are subject to price index agreements with our customers and suppliers. Certain of these strategies also may limit our opportunities in a declining commodity price environment. In the current environment of elevated raw material, energy and commodity costs, these strategies, together with commercial negotiations with our customers and suppliers, have offset a significant portion of the adverse impact. If these costs increase, it could have an adverse impact on our operating results in the foreseeable future.
See Part I — Item 1A, "Risk Factors — Increases in the costs and restrictions on the availability of raw materials, energy, commodities, product components and labor could adversely affect our financial performance," and "— Forward-Looking Statements" below.
For further information related to the financial instruments described above, see Note 16, "Financial Instruments," to the consolidated financial statements included in this Report.
Contractual Obligations and Cash Requirements
Our material cash requirements include the following contractual and other obligations:
Debt obligations and interest expense associated with debt obligations
As of December 31, 2023, we had $2.6 billion of outstanding senior unsecured notes maturing in 2027 through 2052 and a $150 million outstanding Term Loan maturing in 2026, as well as $2.0 billion in available borrowing capacity under our Revolving Credit Facility maturing in 2027.
Interest on the Notes is due biannually at varying dates. Scheduled interest payments are shown below (in millions):
| | | | | | | | | | | | | | | | | | | | | | | | | | | | | | | | | | | | | | | | | |
| 2024 | | 2025 | | 2026 | | 2027 | | 2028 | | Thereafter | | Total |
| Scheduled interest payments | $ | 103 | | | $ | 103 | | | $ | 103 | | | $ | 103 | | | $ | 83 | | | $ | 1,024 | | | $ | 1,519 | |
For further information related to our debt, see "— Capitalization — Senior Notes," "— Credit Agreement" and "— Term Loan" above and Note 7, "Debt," to the consolidated financial statements included in this Report.
Purchase obligations
We enter into agreements with our customers to produce products at the beginning of a vehicle's life cycle. Although these agreements do not provide for a specified quantity of products, once entered into, we are generally required to fulfill our customers' purchasing requirements for the production life of the vehicle. Prior to being formally awarded a program, we typically work closely with our customers in the early stages of the design and engineering of a vehicle's systems. Failure to complete the design and engineering work related to a vehicle's systems, or to fulfill a customer agreement, could have a material adverse impact on our business.
We also enter into agreements with suppliers to assist us in meeting our customers' production needs. These agreements vary as to duration and quantity commitments. Historically, most have been short-term agreements, which do not provide for minimum purchases, or are requirements-based agreements.
Leases
The Company has operating leases for production, office and warehouse facilities, manufacturing and office equipment, and vehicles with future lease obligations ranging from 2024 through 2047. Maturities of operating leases obligations are shown below (in millions):
| | | | | | | | | | | | | | | | | | | | | | | | | | | | | | | | | | | | | | | | | |
| 2024 | | 2025 | | 2026 | | 2027 | | 2028 | | Thereafter | | Total |
| Operating lease obligations | $ | 178 | | | $ | 156 | | | $ | 131 | | | $ | 109 | | | $ | 88 | | | $ | 213 | | | $ | 875 | |
For further information related to our lease obligations, see Note 8, "Leases," to the consolidated financial statements included in this Report.
Taxes
We may be required to make significant cash outlays related to our unrecognized tax benefits, including interest and penalties. As of December 31, 2023, we had unrecognized tax benefits, including interest and penalties, of $45 million. However, due to the uncertainty of the timing of future cash flows associated with our unrecognized tax benefits, we are unable to make reasonably reliable estimates of the period of cash settlement, if any, with the respective taxing authorities.
For further information related to our unrecognized tax benefits, see Note 9, "Income Taxes," to the consolidated financial statements included in this Report.
Pension and postretirement obligations
We have minimum funding requirements with respect to certain of our pension benefit obligations. We may elect to make contributions in excess of the minimum funding requirements in response to investment performance or changes in interest rates or when we believe that it is financially advantageous to do so and based on our other cash requirements. Our minimum funding requirements after 2024 will depend on several factors, including investment performance and interest rates. Our minimum funding requirements may also be affected by changes in applicable legal requirements. Contributions to our defined benefit pension plans are expected to be approximately $2 million in 2024.
We do not fund our postretirement benefit obligations and certain of our pension benefit obligations. Rather, benefit payments
are made to eligible participants as incurred. We expect benefit payments related to our unfunded pension and postretirement benefit obligations to be approximately $7 million and $4 million, respectively, in 2024.
For further information related to our pension and other postretirement benefit plans, see "— Other Matters — Pension and Other Postretirement Benefit Plans" below and Note 10, "Pension and Other Postretirement Benefit Plans," to the consolidated financial statements included in this Report.
Other Matters
Legal and Environmental Matters
We are involved from time to time in various legal proceedings and claims, including, without limitation, commercial and contractual disputes, product liability claims, and environmental and other matters. As of December 31, 2020,2023, we had recorded reserves for pending legal disputes, including commercial and contractual disputes, product liability claims and other legal matters, of $17$14 million. In addition, as of December 31, 2020,2023, we had recorded reserves for product liabilitywarranty and warranty claimsrecall matters of $32 million and environmental matters of $49 million and $9 million, respectively.$5 million. Although these reserves were determined in accordance with GAAP, the ultimate outcomes of these matters are inherently uncertain, and actual results may differ significantly from current estimates. For a description of risks related to various legal proceedings and claims, see Part I — Item 1A, "Risk Factors." For a more complete description of our outstanding material legal proceedings, see Note 14, "Commitments"Legal and Other Contingencies," to the consolidated financial statements included in this Report.
Significant Accounting Policies and Critical Accounting Estimates
Our significant accounting policies are more fully described in Note 3, "Summary of Significant Accounting Policies," to the consolidated financial statements included in this Report. Certain of our accounting policies require management to make estimates and assumptions that affect the reported amounts of assets and liabilities as of the date of the consolidated financial statements and the reported amounts of revenues and expenses during the reporting period. These estimates and assumptions are based on our historical experience, the terms of existing contracts, our evaluation of trends in the industry, information provided by our customers and suppliers and information available from other outside sources, as appropriate. However, these estimates and assumptions are subject to an inherent degree of uncertainty. Accordingly, actual results in these areas may differ significantly from our estimates.
We consider an accounting estimate to be critical if it requires us to make assumptions about matters that were uncertain at the time the estimate was made and changes in the estimate would have had a significant impact on our consolidated financial position or results of operations.
Revenue Recognition and Sales Commitments
We enter into contracts with our customers to provide production parts generally at the beginning of a vehicle’svehicle's life cycle. Typically, these contracts do not provide for a specified quantity of products, but once entered into, we are often expected to fulfill our customers’customers' purchasing requirements for the production life of the vehicle. Many of these contracts may be terminated by our customers at any time. Historically, terminations of these contracts have been infrequent. We receive purchase orders from our customers, which provide the commercial terms for a particular production part, including price (but not quantities). Contracts may also provide for annual price reductions over the production life of the vehicle, and prices may be adjusted on an ongoing basis to reflect changes in product content/cost and other commercial factors.
Revenue is recognized at a point in time when control of the product is transferred to the customer under standard commercial terms, as we do not have an enforceable right to payment prior to such transfer. The amount of revenue recognized reflects the consideration that we expect to be entitled to in exchange for those products based on the annualcurrent purchase orders, annual price reductions and ongoing price adjustments. Our customers pay for products received in accordance with payment terms that are customary within the industry. Our contracts with our customers do not have significant financing components. We record a contract liability for advances received from our customers.
Amounts billed to customers related to shipping and handling costs are included in net sales in the consolidated statements of income. Shipping and handling costs are accounted for as fulfillment costs and are included in cost of sales in the consolidated statements of income.
Taxes assessed by a governmental authority that are both imposed on and concurrent with a specific revenue-producing transaction that we collect from a customer are excluded from revenue.
Pension and Other Postretirement Benefit Plans
We provide certain pension and other postretirement benefits to our employees and retired employees, including pensions, postretirement health care benefits and other postretirement benefits.
Approximately6% of our active workforce is covered by defined benefit pension plans. Pension plans provide benefits based on plan-specific benefit formulas as defined by the applicable plan documents. Postretirement benefit plans generally provide for the continuation of medical benefits for eligible retirees. We also have contractual arrangements with certain employees which provide for supplemental retirement benefits. In general, our policy is to fund our pension benefit obligation based on legal requirements, tax and liquidity considerations and local practices. We do not fund our postretirement benefit obligation.
Plan assets and obligations are measured using various actuarial assumptions, such as discount rates, rate of compensation increase, mortality rates, turnover rates and health care cost trend rates, which are determined as of the current year measurement date. The measurement of net periodic benefit cost is based on various actuarial assumptions, including discount rates, expected return on plan assets and rate of compensation increase, which are determined as of the prior year measurement date. We review our actuarial assumptions on an annual basis and modify these assumptions when appropriate. As required by GAAP, the effects of the modifications are recorded currently or are amortized over future periods.
The determination of the discount rate is generally based on an index created from a hypothetical bond portfolio consisting of high-quality fixed income securities with durations that match the timing of expected benefit payments. Changes in the selected discount rate could have a material impact on the projected benefit obligations, unfunded status and related net periodic benefit cost of our pension and other postretirement benefit plans.
The expected return on plan assets is determined based on several factors, including adjusted historical returns, historical risk premiums for various asset classes and target asset allocations within the portfolio. Adjustments made to the historical returns are based on recent return experience in the equity and fixed income markets and the belief that deviations from historical returns are likely over the relevant investment horizon.
Key assumptions are shown below:
| | | | | | | | | | | |
| Pension | | Other Postretirement |
| Benefit obligations as of December 31, 2020 | $ | 1,094 | | | $ | 89 | |
| Discount rate - | | | |
| Domestic plans | 2.6 | % | | 2.4 | % |
| Foreign plans | 2.0 | % | | 2.5 | % |
| Net periodic benefit cost for the year ended December 31, 2020 | $ | 14 | | | $ | 1 | |
| Discount rate - | | | |
| Domestic plans | 3.4 | % | | 3.2 | % |
| Foreign plans | 2.6 | % | | 3.1 | % |
| Expected return on plan assets - | | | |
| Domestic plans | 5.8 | % | | N/A |
| Foreign plans | 5.4 | % | | N/A |
Net periodic benefit cost (credit) for the year ending December 31, 2021 (1) | $ | (2) | | | $ | 1 | |
| Discount rate - | | | |
| Domestic plans | 2.6 | % | | 2.4 | % |
| Foreign plans | 2.0 | % | | 2.5 | % |
| Expected return on plan assets - | | | |
| Domestic plans | 5.8 | % | | N/A |
| Foreign plans | 5.2 | % | | N/A |
(1) Forecasted.
The sensitivity to a 100 basis point ("bp") decrease in the discount rate and expected return on plan assets is shown below (in millions):
| | | | | | | | | | | | | | | | | | | | | | | |
| Increase in Benefit Obligation | | Increase in 2021
Net Periodic Benefit Cost |
| Pension | | Other Postretirement | | Pension | | Other Postretirement |
| 100 bp decrease in discount rate | $ | 176 | | | $ | 11 | | | $ | — | | | $ | — | |
| 100 bp decrease in expected return on plan assets | N/A | | N/A | | $ | 8 | | | N/A |
For further information related to our pension and other postretirement benefit plans, see "— Liquidity and Financial Condition — Capitalization — Contractual Obligations" above and Note 10, "Pension and Other Postretirement Benefit Plans," to the consolidated financial statements included in this Report.
Income Taxes
We account for income taxes in accordance with GAAP. Deferred tax assets and liabilities are recognized for the future tax consequences attributable to temporary differences between financial statement carrying amounts of existing assets and liabilities and their respective tax bases and tax loss and credit carryforwards. Deferred tax assets and liabilities are measured
using enacted tax rates expected to apply to taxable income infor the years in which those temporary differences are expected to be recovered or settled.
Our current and future provision for income taxes is impacted by the initial recognition of and changes in valuation allowances in certain countries. We intend to maintain these allowances until it is more likely than not that the deferred tax assets will be realized. Our future provision for income taxes will include no tax benefit with respect to losses incurred and, except for certain jurisdictions, no tax expense with respect to income generated in these countries until the respective valuation allowances are eliminated. Accordingly, income taxes are impacted by changes in valuation allowances and the mix of earnings among jurisdictions. We evaluate the realizability of our deferred tax assets on a quarterly basis. In completing this evaluation, we consider all available evidence in order to determine whether, based on the weight of the evidence, a valuation allowance for our deferred tax assets is necessary. Such evidence includes historical results, future reversals of existing taxable temporary differences and expectations for future taxable income (exclusive of the reversal of temporary differences and carryforwards),
as well as the implementation of feasible and prudent tax planning strategies. If, based on the weight of the evidence, it is more likely than not that all or a portion of our deferred tax assets will not be realized, a valuation allowance is recorded.
As of December 31, 2020,2023, we had a valuation allowance related to tax loss and credit carryforwards and other deferred tax assets of $19$31 million in the United States and $379$398 million in several international jurisdictions. If operating results improve or decline on a continual basis in a particular jurisdiction, our decision regarding the need for a valuation allowance could change, resulting in either the initial recognition or reversal of a valuation allowance in that jurisdiction, which could have a significant impact on income tax expense in the period recognized and subsequent periods. In determining the provision for income taxes for financial statement purposes, we make certain estimates and judgments, which affect our evaluation of the carrying value of our deferred tax assets, as well as our calculation of certain tax liabilities.
The calculation of our gross unrecognized tax benefits and liabilities includes uncertainties in the application of, and changes in, complex tax regulations in a multitude of jurisdictions across our global operations. We recognize tax benefits and liabilities based on our estimate of whether, and the extent to which, additional taxes will be due. We adjust these benefits and liabilities based on changing facts and circumstances; however, due to the complexity of these uncertainties and the impact of tax audits, the ultimate resolutions may differ significantly from our estimates.
For further information, see "— Forward-Looking Statements" below and Note 9, "Income Taxes," to the consolidated financial statements included in this Report.
Use of Estimates
The preparation of the consolidated financial statements in conformity with GAAP requires management to make estimates and assumptions that affect the reported amounts of assets and liabilities as of the date of the consolidated financial statements and the reported amounts of revenues and expenses during the reporting period. During 2020,2023, there were no material changes in the methods or policies used to establish estimates and assumptions. Other matters subject to estimation and judgment include amounts related to accounts receivable realization, inventory obsolescence, asset impairments, useful lives of fixed and intangible assets, unsettled pricing discussions with customers and suppliers, restructuring accruals, deferred tax asset valuation allowances and income taxes, pension and other postretirement benefit plan assumptions, accruals related to litigation, and warranty and environmental remediation costs and self-insurance accruals.costs. Actual results may differ significantly from our estimates.
Recently Issued Accounting Pronouncements
For information on the impact of recently issued accounting pronouncements, see Note 18,17, "Accounting Pronouncements," to the consolidated financial statements included in this Report.
Forward-Looking Statements
The Private Securities Litigation Reform Act of 1995 provides a safe harbor for forward-looking statements made by us or on our behalf. The words "will," "may," "designed to," "outlook," "believes," "should," "anticipates," "plans," "expects," "intends," "estimates," "forecasts" and similar expressions identify certain of these forward-looking statements. We also may provide forward-looking statements in oral statements or other written materials released to the public. All such forward-looking statements contained or incorporated in this Report or in any other public statements which address operating performance, events or developments that we expect or anticipate may occur in the future, including, without limitation, statements related to business opportunities, awarded sales contracts, sales backlog and ongoing commercial arrangements, or statements expressing views about future operating results, are forward-looking statements. Actual results may differ materially from any or all forward-looking statements made by us. Important factors, risks and uncertainties that may cause actual results to differ materially from anticipated results include, but are not limited to:
•general economic conditions in the markets in which we operate, including changes in interest rates or currency exchange rates;
•changes in actual industry vehicle production levels from our current estimates;
•fluctuations in the production of vehicles or the loss of business with respect to, or the lack of commercial success of, a vehicle model for which we are a significant supplier;
•the outcome of customer negotiations and the impact of customer-imposed price reductions;
•increases in the costcosts and restrictions on the availability of raw materials, energy, commodities, and product components and labor and our ability to mitigate such costs;costs and insufficient availability;
•disruptions in relationships with our suppliers;
•the financial condition of and adverse developments affecting our customers and suppliers;
•risks associated with conducting business in foreign countries;countries, including the risk of war or other geopolitical conflicts;
•currency controls and the ability to economically hedge currencies;
•global sovereign fiscal matters and creditworthiness, including potential defaults and the related impacts on economic activity, including the possible effects on credit markets, currency values, monetary unions, international treaties and fiscal policies;
•competitive conditions impacting us and our key customers and suppliers;
•labor disputes, including disruptions, involving us or our significant customers or suppliers or that otherwise affect us;
•the consequences of violations of law by our employees, agents or business partners, including violations related to anti-bribery, competition, export and import, trade sanctions, data privacy, environmental, human rights and other laws;
•the operational and financial success of our joint ventures;
•our ability to attract, develop, engage and retain qualified employees;
•our ability to respond to the evolution of the global transportation industry;
•the outcome of an increased emphasis on global climate change and other sustainability matters by stakeholders;
•the impact of global climate change;
•the impact of pandemics, epidemics, disease outbreaks and other public health crises on our business;
•the impact and timing of program launch costs and our management of new program launches;
•changes in discount rates and the actual return on pension assets;
•impairment charges initiated by adverse industry or market developments;
•our ability to execute our strategic objectives;
•limitations imposed by our existing indebtedness and our ability to access capital markets on commercially reasonable terms;
•changes affecting the availability of LIBOR;
•disruptions to our information technology systems, or those of our customers or suppliers, including those related to cybersecurity;
•increases in our warranty, product liability or recall costs;
•the outcome of legal or regulatory proceedings to which we are or may become a party;
•the impact of pending legislation and regulations or changes in existing federal, state, local or foreign laws or regulations;
•the impact of regulations on our foreign operations;
•costs associated with compliance with environmental laws and regulations;
•developments or assertions by or against us relating to intellectual property rights;
•the impact of potential changes in our effective tax andrate, the adoption of new tax legislation or exposure to additional income tax liabilities on our profitability;
•the impact of administrative policy, including protectionist trade policies, in the United States and related actions by countries in which we do business;
•the anticipated changes in economic and other relationships between the United Kingdom and the European Union; and
•other risks, described in Part I — Item 1A, "Risk Factors," as well as the risks and information provided from time to time in our other filings with the Securities and Exchange Commission.
The forward-looking statements in this Report are made as of the date hereof, and we do not assume any obligation to update, amend or clarify them to reflect events, new information or circumstances occurring after the date hereof.
ITEM 7A — QUANTITATIVE AND QUALITATIVE DISCLOSURES ABOUT MARKET RISK
Market Risk Sensitivity
In the normal course of business, we are exposed to market risks associated with fluctuations in foreign exchange rates, interest rates and commodity prices. We manage a portion of these risks through the use of derivative financial instruments in accordance with our policies. We enter into all hedging transactions for periods consistent with the underlying exposures. We do not enter into derivative instruments for trading purposes.
Foreign Exchange
Operating results may be impacted by our buying, selling and financing in currencies other than the functional currency of our operating companies ("transactional exposure"). We may mitigate a portion of this risk by entering into forward foreign exchange, futures and option contracts. The foreign exchange contracts are executed with banks that we believe are creditworthy. Gains and losses related to foreign exchange contracts are deferred where appropriate and included in the measurement of the foreign currency transaction subject to the hedge. Gains and losses incurred related to foreign exchange contracts are generally offset by the direct effects of currency movements on the underlying transactions.
A summary of the notional amount and estimated aggregate fair value of our outstanding foreign exchange contracts is shown below (in millions):
| | | | | | | | | | | |
| December 31, | 2023 | | 2022 |
| Notional amount (contract maturities < 24 months) | $ | 2,922 | | | $ | 2,306 | |
| Fair value | 159 | | | 63 | |
Currently, our most significant foreign currency transactional exposures relate to the Mexican peso, various European currencies, the Chinese renminbi, the Honduran lempira, the Brazilian real and the Japanese yen. A sensitivity analysis of our net transactional exposure is shown below (in millions):
| | | | | | | | | | | | | | | | | |
| | | Potential Earnings Benefit (Adverse Earnings Impact) |
| December 31, | Hypothetical Strengthening % (1) | | 2023 | | 2022 |
U.S. dollar | 10% | | $ | 15 | | | $ | 8 | |
| Euro | 10% | | 34 | | | 19 | |
(1) Relative to all other currencies to which it is exposed for a twelve-month period.
A sensitivity analysis related to the aggregate fair value of our outstanding foreign exchange contracts is shown below (in millions):
| | | | | | | | | | | | | | | | | |
| | | Estimated Change in Fair Value |
| December 31, | Hypothetical Change % (2) | | 2023 | | 2022 |
| U.S. dollar | 10% | | $ | 156 | | | $ | 84 | |
| Euro | 10% | | 98 | | | 70 | |
(2) Relative to all other currencies to which it is exposed.
There are certain shortcomings inherent in the sensitivity analyses above. The analyses assume that all currencies would uniformly strengthen or weaken relative to the U.S. dollar or Euro. In reality, some currencies may strengthen while others may weaken, causing the earnings impact to increase or decrease depending on the currency and the direction of the rate movement.
In addition to the transactional exposure described above, our operating results are impacted by the translation of our foreign operating income into U.S. dollars ("translational exposure"). In 2023, net sales outside of the United States accounted for 79% of our consolidated net sales, although certain non-U.S. sales are U.S. dollar denominated. We do not enter into foreign exchange contracts to mitigate our translational exposure.
Interest Rates
Our variable rate obligations are sensitive to changes in interest rates. As of December 31, 2023, we had $150 million outstanding under our Term Loan. Advances under the Term Loan generally bear interest based on the Daily or Term SOFR (as defined in the Term Loan agreement) plus a margin, determined in accordance with a pricing grid, that ranges from 1.00% to 1.525%. As of December 31, 2023, the interest rate was 6.575%.
A hypothetical 100 basis point increase in the interest rate on our Term Loan would increase annual interest expense and related cash interest payments by approximately $2 million.
ITEM 8 – CONSOLIDATED FINANCIAL STATEMENTS AND
SUPPLEMENTARY DATA
INDEX TO CONSOLIDATED FINANCIAL STATEMENTS
Report of Independent Registered Public Accounting Firm
To the Stockholders and the Board of Directors of Lear Corporation
Opinion on the Financial Statements
We have audited the accompanying consolidated balance sheets of Lear Corporation and subsidiaries (the Company) as of December 31, 20202023 and 2019,2022, the related consolidated statements of income, comprehensive income, equity and cash flows for each of the three years in the period ended December 31, 2020,2023, and the related notes and financial statement schedule listed in the Index at Item 15(a) (collectively referred to as the "consolidated financial statements"). In our opinion, the consolidated financial statements present fairly, in all material respects, the financial position of the Company at December 31, 20202023 and 2019,2022, and the results of its operations and its cash flows for each of the three years in the period ended December 31, 2020,2023, in conformity with U.S. generally accepted accounting principles.
We also have audited, in accordance with the standards of the Public Company Accounting Oversight Board (United States) (PCAOB), the Company's internal control over financial reporting as of December 31, 2020,2023, based on criteria established in Internal Control-Integrated Framework issued by the Committee of Sponsoring Organizations of the Treadway Commission (2013 framework), and our report dated February 10, 2021,8, 2024 expressed an unqualified opinion thereon.
Basis for Opinion
These financial statements are the responsibility of the Company's management. Our responsibility is to express an opinion on the Company’sCompany's financial statements based on our audits. We are a public accounting firm registered with the PCAOB and are required to be independent with respect to the Company in accordance with the U.S. federal securities laws and the applicable rules and regulations of the Securities and Exchange Commission and the PCAOB.
We conducted our audits in accordance with the standards of the PCAOB. Those standards require that we plan and perform the audit to obtain reasonable assurance about whether the financial statements are free of material misstatement, whether due to error or fraud. Our audits included performing procedures to assess the risks of material misstatement of the financial statements, whether due to error or fraud, and performing procedures that respond to those risks. Such procedures included examining, on a test basis, evidence regarding the amounts and disclosures in the financial statements. Our audits also included evaluating the accounting principles used and significant estimates made by management, as well as evaluating the overall presentation of the financial statements. We believe that our audits provide a reasonable basis for our opinion.
Critical Audit Matter
The critical audit matter communicated below is a matter arising from the current period audit of the consolidated financial statements that was communicated or required to be communicated to the audit committee and that: (1) relates to accounts or disclosures that are material to the consolidated financial statements and (2) involved our especially challenging, subjective or complex judgments. The communication of the critical audit matter does not alter in any way our opinion on the consolidated financial statements, taken as a whole, and we are not, by communicating the critical audit matter below, providing a separate opinion on the critical audit matter or on the account or disclosure to which it relates.
| | | | | |
| Revenue recognition |
| Description of the Matter | As discussed in Note 3, Summary of Significant Accounting Policies, the Company’sCompany's sales contracts with its customers may provide for annual price reductions over the production life of the vehicle. Prices may also be adjusted on an ongoing basis to reflect changes in product content, product cost and other commercial factors. Some of these price adjustments are non-routine in nature. The amount of revenue recognized by the Company reflects the consideration that the Company expects to be entitled to in exchange for its products based on annualthe current purchase orders, annual price reductions and ongoing price adjustments.
Auditing the consideration that the Company expects to be entitled to in exchange for certain of its products which are subject to non-routine price adjustments is highly judgmental as it relates to evaluating the sufficiency of evidence available from commercial negotiations to support the ultimate consideration that the Company is entitled to in exchange for those products. |
| | | | | |
| How We Addressed the Matter in Our Audit | We identified and tested controls over the identification and evaluation of product sales with non-routine price adjustments, including management’s review of the evidence to support the Company’s measurement of revenue related to those product sales.
Our audit procedures included, among others, inspecting communications between the Company and its customers related to the pricing arrangements, auditing adjustments at period-end related to those product sales, performing retrospective reviews of management’s estimates to identify contrary evidence, if any, and performing inquiries of and obtaining written representations from executives, within the Company, responsible for the respective customer relationships. |
/s/ Ernst & Young LLP
We have served as the Company’sCompany's auditor since 2002.
Detroit, Michigan
February 10, 20218, 2024
Report of Independent Registered Public Accounting Firm
To the Stockholders and the Board of Directors of Lear Corporation
Opinion on Internal Control overOver Financial Reporting
We have audited Lear Corporation and subsidiaries’subsidiaries' internal control over financial reporting as of December 31, 2020,2023, based on criteria established in Internal Control - Integrated Framework issued by the Committee of Sponsoring Organizations of the Treadway Commission (2013 framework) (the COSO criteria). In our opinion, Lear Corporation and subsidiaries (the Company) maintained, in all material respects, effective internal control over financial reporting as of December 31, 2020,2023, based on the COSO criteria.
As indicated in the accompanying Management’s Annual Report on Internal Control over Financial Reporting, management’s assessment of and conclusion on the effectiveness of internal control over financial reporting did not include the internal controls of I.G. Bauerhin ("IGB"), which is included in the 2023 consolidated financial statements of the Company and constituted less than 2% of total assets as of December 31, 2023 and less than 1% of net sales for the year then ended. Our audit of internal control over financial reporting of the Company also did not include an evaluation of the internal control over financial reporting of IGB.
We also have audited, in accordance with the standards of the Public Company Accounting Oversight Board (United States) (PCAOB), the 20202023 consolidated financial statements of the Company and our report dated February 10, 2021,8, 2024 expressed an unqualified opinion thereon.
Basis for Opinion
The Company’sCompany's management is responsible for maintaining effective internal control over financial reporting and for its assessment of the effectiveness of internal control over financial reporting included in the accompanying Management’sManagement's Annual Report on Internal Control over Financial Reporting. Our responsibility is to express an opinion on the Company’sCompany's internal control over financial reporting based on our audit. We are a public accounting firm registered with the PCAOB and are required to be independent with respect to the Company in accordance with the U.S. federal securities laws and the applicable rules and regulations of the Securities and Exchange Commission and the PCAOB.
We conducted our audit in accordance with the standards of the PCAOB. Those standards require that we plan and perform the audit to obtain reasonable assurance about whether effective internal control over financial reporting was maintained in all material respects.
Our audit included obtaining an understanding of internal control over financial reporting, assessing the risk that a material weakness exists, testing and evaluating the design and operating effectiveness of internal control based on the assessed risk, and performing such other procedures as we considered necessary in the circumstances. We believe that our audit provides a reasonable basis for our opinion.
Definition and Limitations of Internal Control Over Financial Reporting
A company’scompany's internal control over financial reporting is a process designed to provide reasonable assurance regarding the reliability of financial reporting and the preparation of financial statements for external purposes in accordance with generally accepted accounting principles. A company’scompany's internal control over financial reporting includes those policies and procedures that (1) pertain to the maintenance of records that, in reasonable detail, accurately and fairly reflect the transactions and dispositions of the assets of the company; (2) provide reasonable assurance that transactions are recorded as necessary to permit preparation of financial statements in accordance with generally accepted accounting principles, and that receipts and expenditures of the company are being made only in accordance with authorizations of management and directors of the company; and (3) provide reasonable assurance regarding prevention or timely detection of unauthorized acquisition, use, or disposition of the company’scompany's assets that could have a material effect on the financial statements.
Because of its inherent limitations, internal control over financial reporting may not prevent or detect misstatements. Also, projections of any evaluation of effectiveness to future periods are subject to the risk that controls may become inadequate because of changes in conditions, or that the degree of compliance with the policies or procedures may deteriorate.
/s/ Ernst & Young LLP
Detroit, Michigan
February 10, 20218, 2024
LEAR CORPORATION AND SUBSIDIARIES
CONSOLIDATED BALANCE SHEETS
(In millions, except share data)
| | December 31, | December 31, | 2020 | | 2019 | December 31, | 2023 | | 2022 |
| Assets | Assets | |
| Current Assets: | Current Assets: | |
| Current Assets: | |
| Current Assets: | |
| Cash and cash equivalents | |
| Cash and cash equivalents | |
| Cash and cash equivalents | Cash and cash equivalents | $ | 1,306.7 | | | $ | 1,487.7 | |
| Accounts receivable | Accounts receivable | 3,269.2 | | | 2,982.6 | |
| Inventories | Inventories | 1,401.1 | | | 1,258.2 | |
| Other | Other | 799.7 | | | 678.2 | |
| Total current assets | Total current assets | 6,776.7 | | | 6,406.7 | |
| Long-Term Assets: | Long-Term Assets: | |
| Property, plant and equipment, net | Property, plant and equipment, net | 2,736.2 | | | 2,704.2 | |
| Property, plant and equipment, net | |
| Property, plant and equipment, net | |
| Goodwill | Goodwill | 1,655.8 | | | 1,614.3 | |
| Other | Other | 2,029.9 | | | 1,955.5 | |
| Total long-term assets | Total long-term assets | 6,421.9 | | | 6,274.0 | |
| Total assets | Total assets | $ | 13,198.6 | | | $ | 12,680.7 | |
| Liabilities and Equity | Liabilities and Equity | |
| Current Liabilities: | Current Liabilities: | |
| Current Liabilities: | |
| Current Liabilities: | |
| Short-term borrowings | |
| Short-term borrowings | |
| Short-term borrowings | Short-term borrowings | $ | 0 | | | $ | 19.2 | |
| Accounts payable and drafts | Accounts payable and drafts | 3,141.6 | | | 2,821.7 | |
| Accrued liabilities | Accrued liabilities | 1,920.9 | | | 1,811.2 | |
| Current portion of long-term debt | Current portion of long-term debt | 14.2 | | | 14.1 | |
| Total current liabilities | Total current liabilities | 5,076.7 | | | 4,666.2 | |
| Long-Term Liabilities: | Long-Term Liabilities: | |
| Long-term debt | Long-term debt | 2,300.3 | | | 2,293.7 | |
| Long-term debt | |
| Long-term debt | |
| Other | Other | 1,206.7 | | | 1,101.3 | |
| Total long-term liabilities | Total long-term liabilities | 3,507.0 | | | 3,395.0 | |
| | Redeemable noncontrolling interest | 0 | | | 118.4 | |
| | Equity: | Equity: | |
Preferred stock, 100,000,000 shares authorized (including 10,896,250 shares of Series A convertible preferred stock authorized); 0 shares outstanding | 0 | | | 0 | |
| Common stock, $0.01 par value, 300,000,000 shares authorized; 64,571,405 and 64,563,291 shares issued as of December 31, 2020 and 2019, respectively | 0.6 | | | 0.6 | |
Preferred stock, 100,000,000 shares authorized (including 10,896,250 shares of Series A convertible preferred stock authorized); no shares outstanding | |
Preferred stock, 100,000,000 shares authorized (including 10,896,250 shares of Series A convertible preferred stock authorized); no shares outstanding | |
Preferred stock, 100,000,000 shares authorized (including 10,896,250 shares of Series A convertible preferred stock authorized); no shares outstanding | |
| Common stock, $0.01 par value, 300,000,000 shares authorized; 64,571,405 shares issued as of December 31, 2023 and 2022 | |
| Additional paid-in capital | Additional paid-in capital | 963.6 | | | 969.1 | |
Common stock held in treasury, 4,519,891 and 4,127,806 shares as of December 31, 2020 and 2019, respectively, at cost | (598.6) | | | (563.1) | |
Common stock held in treasury, 7,592,473 and 5,493,211 shares as of December 31, 2023 and 2022, respectively, at cost | |
| Retained earnings | Retained earnings | 4,806.8 | | | 4,715.8 | |
| Accumulated other comprehensive loss | Accumulated other comprehensive loss | (705.1) | | | (772.7) | |
| Lear Corporation stockholders’ equity | 4,467.3 | | | 4,349.7 | |
| Lear Corporation stockholders' equity | |
| Noncontrolling interests | Noncontrolling interests | 147.6 | | | 151.4 | |
| Equity | Equity | 4,614.9 | | | 4,501.1 | |
| Total liabilities and equity | Total liabilities and equity | $ | 13,198.6 | | | $ | 12,680.7 | |
The accompanying notes are an integral part of these consolidated balance sheets.
LEAR CORPORATION AND SUBSIDIARIES
CONSOLIDATED STATEMENTS OF INCOME
(In millions, except share and per share data)
| | For the year ended December 31, | For the year ended December 31, | 2020 | | 2019 | | 2018 | For the year ended December 31, | 2023 | | 2022 | | 2021 |
| Net sales | Net sales | $ | 17,045.5 | | | $ | 19,810.3 | | | $ | 21,148.5 | |
| Cost of sales | Cost of sales | 15,936.6 | | | 18,072.8 | | | 18,830.2 | |
| Selling, general and administrative expenses | Selling, general and administrative expenses | 588.9 | | | 605.0 | | | 612.8 | |
| Amortization of intangible assets | Amortization of intangible assets | 65.9 | | | 62.3 | | | 51.4 | |
| Interest expense | 99.6 | | | 92.0 | | | 84.1 | |
| Interest expense, net | |
| Other expense, net | Other expense, net | 55.2 | | | 24.6 | | | 31.6 | |
| Consolidated income before provision for income taxes and equity in net income of affiliates | Consolidated income before provision for income taxes and equity in net income of affiliates | 299.3 | | | 953.6 | | | 1,538.4 | |
| Provision for income taxes | Provision for income taxes | 93.9 | | | 146.1 | | | 311.9 | |
| Equity in net income of affiliates | Equity in net income of affiliates | (28.5) | | | (23.2) | | | (20.2) | |
| Consolidated net income | Consolidated net income | 233.9 | | | 830.7 | | | 1,246.7 | |
| Less: Net income attributable to noncontrolling interests | Less: Net income attributable to noncontrolling interests | 75.4 | | | 77.1 | | | 96.9 | |
| Net income attributable to Lear | Net income attributable to Lear | $ | 158.5 | | | $ | 753.6 | | | $ | 1,149.8 | |
| | Basic net income per share available to Lear common stockholders | $ | 2.63 | | | $ | 12.80 | | | $ | 17.35 | |
| Basic net income per share attributable to Lear | |
| Basic net income per share attributable to Lear | |
| Basic net income per share attributable to Lear | |
| | Diluted net income per share available to Lear common stockholders | $ | 2.62 | | | $ | 12.75 | | | $ | 17.22 | |
| Diluted net income per share attributable to Lear | |
| Diluted net income per share attributable to Lear | |
| Diluted net income per share attributable to Lear | |
| | Average common shares outstanding | |
| Average common shares outstanding | |
| Average common shares outstanding | Average common shares outstanding | 60,254,380 | | | 61,697,192 | | | 65,672,164 | |
| | Average diluted shares outstanding | Average diluted shares outstanding | 60,426,962 | | | 61,923,528 | | | 66,161,816 | |
| Average diluted shares outstanding | |
| Average diluted shares outstanding | |
The accompanying notes are an integral part of these consolidated financial statements.
LEAR CORPORATION AND SUBSIDIARIES
CONSOLIDATED STATEMENTS OF COMPREHENSIVE INCOME
(In millions)
| | | | | | | | | | | | | | | | | |
| For the year ended December 31, | 2023 | | 2022 | | 2021 |
| Consolidated net income | $ | 645.7 | | | $ | 408.7 | | | $ | 461.6 | |
| Other comprehensive income (loss), net of tax: | | | | | |
| Defined benefit plan adjustments | (11.6) | | | 103.7 | | | 77.5 | |
| Derivative instruments and hedging activities | 74.5 | | | 52.0 | | | (31.2) | |
| Foreign currency translation adjustments | 50.9 | | | (198.1) | | | (108.3) | |
| Total other comprehensive income (loss) | 113.8 | | | (42.4) | | | (62.0) | |
| Consolidated comprehensive income | 759.5 | | | 366.3 | | | 399.6 | |
| Less: Comprehensive income attributable to noncontrolling interests | 70.7 | | | 73.5 | | | 90.8 | |
| Comprehensive income attributable to Lear | $ | 688.8 | | | $ | 292.8 | | | $ | 308.8 | |
The accompanying notes are an integral part of these consolidated financial statements.
LEAR CORPORATION AND SUBSIDIARIES
CONSOLIDATED STATEMENTS OF COMPREHENSIVE INCOME
(In millions)
| | | | | | | | | | | | | | | | | |
| For the year ended December 31, | 2020 | | 2019 | | 2018 |
| Consolidated net income | $ | 233.9 | | | $ | 830.7 | | | $ | 1,246.7 | |
| Other comprehensive income (loss), net of tax: | | | | | |
| Defined benefit plan adjustments | (59.3) | | | (44.8) | | | 11.2 | |
| Derivative instruments and hedging activities | 2.8 | | | 19.5 | | | 13.2 | |
| Foreign currency translation adjustments | 139.7 | | | (45.1) | | | (233.0) | |
| Total other comprehensive income (loss) | 83.2 | | | (70.4) | | | (208.6) | |
| Consolidated comprehensive income | 317.1 | | | 760.3 | | | 1,038.1 | |
| Less: Comprehensive income attributable to noncontrolling interests | 91.0 | | | 73.6 | | | 80.7 | |
| Comprehensive income attributable to Lear | $ | 226.1 | | | $ | 686.7 | | | $ | 957.4 | |
The accompanying notes are an integral part of these consolidated financial statements.
LEAR CORPORATION AND SUBSIDIARIES
CONSOLIDATED STATEMENTS OF EQUITY
(In millions, except share data)
| | | Redeemable Non-
controlling Interests | | | Common
Stock | | Additional Paid-in Capital | | Common
Stock Held in Treasury | | Retained
Earnings |
| Balance as of December 31, 2017 | $ | 153.4 | | | | $ | 0.7 | | | $ | 1,215.4 | | | $ | (724.1) | | | $ | 4,171.9 | |
| Common
Stock | |
| Common
Stock | |
| Common
Stock | | | Additional Paid-in Capital | | Common
Stock Held in Treasury | | Retained
Earnings |
| Balance as of December 31, 2020 | |
| Comprehensive income (loss): | Comprehensive income (loss): | — | | | | |
| Net income | Net income | 12.9 | | | | — | | | — | | | — | | | 1,149.8 | |
| Other comprehensive income (loss) | (9.4) | | | | — | | | — | | | — | | | — | |
| Total comprehensive income (loss) | 3.5 | | | | — | | | — | | | — | | | 1,149.8 | |
| Adoption of ASU 2016-16 (Note 9, "Income Taxes") | — | | | | — | | | — | | | — | | | 2.3 | |
| Stock-based compensation | — | | | | — | | | 41.4 | | | — | | | — | |
| Net issuances of 374,267 shares held in treasury in settlement of stock-based compensation | — | | | | — | | | (81.5) | | | 34.0 | | | — | |
| Repurchases of 4,308,418 shares of common stock at an average price of $163.69 per share | — | | | | — | | | — | | | (705.2) | | | — | |
| Retirement of 8,000,000 shares held in treasury at average price of $146.27 per share | — | | | | (0.1) | | | (155.9) | | | 1,170.2 | | | (1,014.2) | |
| Dividends declared to Lear Corporation stockholders | — | | | | — | | | — | | | — | | | (185.8) | |
| Dividends declared to noncontrolling interests | (9.2) | | | | — | | | — | | | — | | | — | |
| Affiliate transaction | — | | | | — | | | — | | | — | | | — | |
| Acquisition of outstanding noncontrolling interests | — | | | | — | | | (2.0) | | | — | | | — | |
Noncontrolling interests — other | — | | | | — | | | — | | | — | | | — | |
| Redeemable noncontrolling interest adjustment | 10.4 | | | | — | | | — | | | — | | | (10.4) | |
| Balance as of December 31, 2018 | $ | 158.1 | | | | $ | 0.6 | | | $ | 1,017.4 | | | $ | (225.1) | | | $ | 4,113.6 | |
| Comprehensive income (loss): | | | |
| Net income | |
| Net income | Net income | 1.8 | | | | — | | | — | | | — | | | 753.6 | |
| Other comprehensive income (loss) | Other comprehensive income (loss) | (1.8) | | | | — | | | — | | | — | | | — | |
| Total comprehensive income (loss) | Total comprehensive income (loss) | 0 | | | | — | | | — | | | — | | | 753.6 | |
| Stock-based compensation | Stock-based compensation | — | | | | — | | | 23.3 | | | — | | | — | |
| Net issuances of 314,953 shares held in treasury in settlement of stock-based compensation | — | | | | — | | | (71.6) | | | 42.4 | | | (2.1) | |
| Repurchases of 2,819,081 shares of common stock at an average price of $134.95 per share | — | | | | — | | | — | | | (380.4) | | | — | |
| Net issuances of 163,761 shares held in treasury in settlement of stock-based compensation | |
| Repurchases of 589,717 shares of common stock at an average price of $170.03 per share | |
| Dividends declared to Lear Corporation stockholders | Dividends declared to Lear Corporation stockholders | — | | | | — | | | — | | | — | | | (186.3) | |
| Dividends declared to noncontrolling interests | Dividends declared to noncontrolling interests | (2.7) | | | | — | | | — | | | — | | | — | |
Noncontrolling interests — other | — | | | | — | | | — | | | — | | | — | |
| Disposal of noncontrolling interests | — | | | | — | | | — | | | — | | | — | |
| Redeemable noncontrolling interest adjustment | (37.0) | | | | — | | | — | | | — | | | 37.0 | |
| Balance as of December 31, 2019 | $ | 118.4 | | | | $ | 0.6 | | | $ | 969.1 | | | $ | (563.1) | | | $ | 4,715.8 | |
| Affiliate transaction | |
| Balance as of December 31, 2021 | |
| Comprehensive income (loss): | Comprehensive income (loss): | | | |
| Net income | |
| Net income | |
| Net income | Net income | (3.5) | | | | — | | | — | | | — | | | 158.5 | |
| Other comprehensive income (loss) | Other comprehensive income (loss) | 7.7 | | | | — | | | — | | | — | | | — | |
| Total comprehensive income (loss) | Total comprehensive income (loss) | 4.2 | | | | — | | | — | | | — | | | 158.5 | |
| Adoption of ASU 2016-13 (Note 3, "Accounts Receivable") | — | | | | — | | | — | | | — | | | (0.8) | |
| Stock-based compensation | Stock-based compensation | — | | | | — | | | 40.0 | | | — | | | — | |
| Net issuances of 249,064 shares held in treasury in settlement of stock-based compensation | — | | | | — | | | (46.9) | | | 34.5 | | | (3.5) | |
| Repurchases of 641,149 shares of common stock at an average price of $109.22 per share | — | | | | — | | | — | | | (70.0) | | | — | |
| Net issuances of 215,945 shares held in treasury in settlement of stock-based compensation | |
| Repurchases of 763,309 shares of common stock at an average price of $131.37 per share | |
| Dividends declared to Lear Corporation stockholders | Dividends declared to Lear Corporation stockholders | — | | | | — | | | — | | | — | | | (62.1) | |
| Dividends declared to noncontrolling interests | Dividends declared to noncontrolling interests | (26.8) | | | | — | | | — | | | — | | | — | |
| Acquisition of outstanding noncontrolling interests | (96.9) | | | | — | | | 1.4 | | | — | | | — | |
| Redeemable noncontrolling interest adjustment | 1.1 | | | | — | | | — | | | — | | | (1.1) | |
| Balance as of December 31, 2020 | $ | 0 | | | | $ | 0.6 | | | $ | 963.6 | | | $ | (598.6) | | | $ | 4,806.8 | |
| Change in noncontrolling interests | |
| Balance as of December 31, 2022 | |
| Comprehensive income (loss): | |
| Net income | |
| Net income | |
| Net income | |
| Other comprehensive income (loss) | |
| Total comprehensive income (loss) | |
| Stock-based compensation | |
| Net issuances of 182,461 shares held in treasury in settlement of stock-based compensation | |
| Repurchases of 2,281,723 shares of common stock at an average price of $137.21 per share | |
| Dividends declared to Lear Corporation stockholders | |
| Dividends declared to noncontrolling interests | |
| | Balance as of December 31, 2023 | |
| Balance as of December 31, 2023 | |
| Balance as of December 31, 2023 | |
The accompanying notes are an integral part of these consolidated financial statements.
LEAR CORPORATION AND SUBSIDIARIES
CONSOLIDATED STATEMENTS OF EQUITY (continued)
(In millions, except share data)
| | | | Accumulated Other Comprehensive Loss, net of tax | | | |
| | | Defined
Benefit Plans | | Derivative
Instruments and
Hedge
Activities | | Cumulative
Translation
Adjustments | | Lear
Corporation
Stockholders’
Equity | | Non-controlling
Interests | | Equity | |
| Balance as of December 31, 2017 | $ | (184.0) | | | $ | (22.9) | | | $ | (306.5) | | | $ | 4,150.5 | | | $ | 142.1 | | | $ | 4,292.6 | | |
| | |
| | |
| | |
| | |
| Balance as of December 31, 2020 | |
| Balance as of December 31, 2020 | |
| Balance as of December 31, 2020 | |
| Comprehensive income (loss): | |
| Comprehensive income (loss): | |
| Comprehensive income (loss): | Comprehensive income (loss): | | |
| Net income | Net income | — | | | — | | | — | | | 1,149.8 | | | 84.0 | | | 1,233.8 | | |
| Net income | |
| Net income | |
| Other comprehensive income (loss) | |
| Other comprehensive income (loss) | |
| Other comprehensive income (loss) | Other comprehensive income (loss) | 11.2 | | | 13.2 | | | (216.8) | | | (192.4) | | | (6.8) | | | (199.2) | | |
| Total comprehensive income (loss) | Total comprehensive income (loss) | 11.2 | | | 13.2 | | | (216.8) | | | 957.4 | | | 77.2 | | | 1,034.6 | | |
| Adoption of ASU 2016-16 (Note 9, "Income Taxes") | — | | | — | | | — | | | 2.3 | | | — | | | 2.3 | | |
| Total comprehensive income (loss) | |
| Total comprehensive income (loss) | |
| Stock-based compensation | Stock-based compensation | — | | | — | | | — | | | 41.4 | | | — | | | 41.4 | | |
| Net issuances of 374,267 shares held in treasury in settlement of stock-based compensation | — | | | — | | | — | | | (47.5) | | | — | | | (47.5) | | |
| Repurchases of 4,308,418 shares of common stock at an average price of $163.69 per share | — | | | — | | | — | | | (705.2) | | | — | | | (705.2) | | |
| Retirement of 8,000,000 shares held in treasury at average price of $146.27 per share | — | | | — | | | — | | | 0 | | | — | | | 0 | | |
| Stock-based compensation | |
| Stock-based compensation | |
| Net issuances of 163,761 shares held in treasury in settlement of stock-based compensation | |
| Net issuances of 163,761 shares held in treasury in settlement of stock-based compensation | |
| Net issuances of 163,761 shares held in treasury in settlement of stock-based compensation | |
| Repurchases of 589,717 shares of common stock at an average price of $170.03 per share | |
| Repurchases of 589,717 shares of common stock at an average price of $170.03 per share | |
| Repurchases of 589,717 shares of common stock at an average price of $170.03 per share | |
| Dividends declared to Lear Corporation stockholders | |
| Dividends declared to Lear Corporation stockholders | |
| Dividends declared to Lear Corporation stockholders | Dividends declared to Lear Corporation stockholders | — | | | — | | | — | | | (185.8) | | | — | | | (185.8) | | |
| Dividends declared to noncontrolling interests | Dividends declared to noncontrolling interests | — | | | — | | | — | | | — | | | (70.0) | | | (70.0) | | |
| Dividends declared to noncontrolling interests | |
| Dividends declared to noncontrolling interests | |
| Affiliate transaction | Affiliate transaction | — | | | — | | | — | | | — | | | 14.0 | | | 14.0 | | |
| Acquisition of outstanding noncontrolling interests | — | | | — | | | — | | | (2.0) | | | — | | | (2.0) | | |
Noncontrolling interests — other | — | | | — | | | — | | | — | | | (3.4) | | | (3.4) | | |
| Redeemable noncontrolling interest adjustment | — | | | — | | | — | | | (10.4) | | | — | | | (10.4) | | |
| Balance as of December 31, 2018 | $ | (172.8) | | | $ | (9.7) | | | $ | (523.3) | | | $ | 4,200.7 | | | $ | 159.9 | | | $ | 4,360.6 | | |
| Affiliate transaction | |
| Affiliate transaction | |
| Balance as of December 31, 2021 | |
| Balance as of December 31, 2021 | |
| Balance as of December 31, 2021 | |
| Comprehensive income (loss): | |
| Comprehensive income (loss): | |
| Comprehensive income (loss): | Comprehensive income (loss): | | |
| Net income | Net income | — | | | — | | | — | | | 753.6 | | | 75.3 | | | 828.9 | | |
| Net income | |
| Net income | |
| Other comprehensive income (loss) | |
| Other comprehensive income (loss) | |
| Other comprehensive income (loss) | Other comprehensive income (loss) | (44.8) | | | 19.5 | | | (41.6) | | | (66.9) | | | (1.7) | | | (68.6) | | |
| Total comprehensive income (loss) | Total comprehensive income (loss) | (44.8) | | | 19.5 | | | (41.6) | | | 686.7 | | | 73.6 | | | 760.3 | | |
| Total comprehensive income (loss) | |
| Total comprehensive income (loss) | |
| Stock-based compensation | Stock-based compensation | — | | | — | | | — | | | 23.3 | | | — | | | 23.3 | | |
| Net issuances of 314,953 shares held in treasury in settlement of stock-based compensation | — | | | — | | | — | | | (31.3) | | | — | | | (31.3) | | |
| Repurchases of 2,819,081 shares of common stock at an average price of $134.95 per share | — | | | — | | | — | | | (380.4) | | | — | | | (380.4) | | |
| Stock-based compensation | |
| Stock-based compensation | |
| Net issuances of 215,945 shares held in treasury in settlement of stock-based compensation | |
| Net issuances of 215,945 shares held in treasury in settlement of stock-based compensation | |
| Net issuances of 215,945 shares held in treasury in settlement of stock-based compensation | |
| Repurchases of 763,309 shares of common stock at an average price of $131.37 per share | |
| Repurchases of 763,309 shares of common stock at an average price of $131.37 per share | |
| Repurchases of 763,309 shares of common stock at an average price of $131.37 per share | |
| Dividends declared to Lear Corporation stockholders | |
| Dividends declared to Lear Corporation stockholders | |
| Dividends declared to Lear Corporation stockholders | Dividends declared to Lear Corporation stockholders | — | | | — | | | — | | | (186.3) | | | — | | | (186.3) | | |
| Dividends declared to noncontrolling interests | Dividends declared to noncontrolling interests | — | | | — | | | — | | | — | | | (76.3) | | | (76.3) | | |
Noncontrolling interests — other | — | | | — | | | — | | | — | | | (0.2) | | | (0.2) | | |
| Disposal of noncontrolling interests | — | | | — | | | — | | | — | | | (5.6) | | | (5.6) | | |
| Redeemable noncontrolling interest adjustment | — | | | — | | | — | | | 37.0 | | | — | | | 37.0 | | |
| Balance as of December 31, 2019 | $ | (217.6) | | | $ | 9.8 | | | $ | (564.9) | | | $ | 4,349.7 | | | $ | 151.4 | | | $ | 4,501.1 | | |
| Dividends declared to noncontrolling interests | |
| Dividends declared to noncontrolling interests | |
| Change in noncontrolling interests | |
| Change in noncontrolling interests | |
| Change in noncontrolling interests | |
| Balance as of December 31, 2022 | |
| Balance as of December 31, 2022 | |
| Balance as of December 31, 2022 | |
| Comprehensive income (loss): | |
| Comprehensive income (loss): | |
| Comprehensive income (loss): | Comprehensive income (loss): | | |
| Net income | Net income | — | | | — | | | — | | | 158.5 | | | 78.9 | | | 237.4 | | |
| Net income | |
| Net income | |
| Other comprehensive income (loss) | |
| Other comprehensive income (loss) | |
| Other comprehensive income (loss) | Other comprehensive income (loss) | (59.3) | | | 2.8 | | | 124.1 | | | 67.6 | | | 7.9 | | | 75.5 | | |
| Total comprehensive income (loss) | Total comprehensive income (loss) | (59.3) | | | 2.8 | | | 124.1 | | | 226.1 | | | 86.8 | | | 312.9 | | |
| Adoption of ASU 2016-13 (Note 3, "Accounts Receivable") | — | | | — | | | — | | | (0.8) | | | — | | | (0.8) | | |
| Total comprehensive income (loss) | |
| Total comprehensive income (loss) | |
| Stock-based compensation | Stock-based compensation | — | | | — | | | — | | | 40.0 | | | — | | | 40.0 | | |
| Net issuances of 249,064 shares held in treasury in settlement of stock-based compensation | — | | | — | | | — | | | (15.9) | | | — | | | (15.9) | | |
| Repurchases of 641,149 shares of common stock at an average price of $109.22 per share | — | | | — | | | — | | | (70.0) | | | — | | | (70.0) | | |
| Stock-based compensation | |
| Stock-based compensation | |
| Net issuances of 182,461 shares held in treasury in settlement of stock-based compensation | |
| Net issuances of 182,461 shares held in treasury in settlement of stock-based compensation | |
| Net issuances of 182,461 shares held in treasury in settlement of stock-based compensation | |
| Repurchases of 2,281,723 shares of common stock at an average price of $137.21 per share | |
| Repurchases of 2,281,723 shares of common stock at an average price of $137.21 per share | |
| Repurchases of 2,281,723 shares of common stock at an average price of $137.21 per share | |
| Dividends declared to Lear Corporation stockholders | |
| Dividends declared to Lear Corporation stockholders | |
| Dividends declared to Lear Corporation stockholders | Dividends declared to Lear Corporation stockholders | — | | | — | | | — | | | (62.1) | | | — | | | (62.1) | | |
| Dividends declared to noncontrolling interests | Dividends declared to noncontrolling interests | — | | | — | | | — | | | — | | | (90.6) | | | (90.6) | | |
| Acquisition of outstanding noncontrolling interests | — | | | — | | | — | | | 1.4 | | | — | | | 1.4 | | |
| Redeemable noncontrolling interest adjustment | — | | | — | | | — | | | (1.1) | | | — | | | (1.1) | | |
| Balance as of December 31, 2020 | $ | (276.9) | | | $ | 12.6 | | | $ | (440.8) | | | $ | 4,467.3 | | | $ | 147.6 | | | $ | 4,614.9 | | |
| Dividends declared to noncontrolling interests | |
| Dividends declared to noncontrolling interests | |
| | Balance as of December 31, 2023 | |
| | Balance as of December 31, 2023 | |
| | Balance as of December 31, 2023 | |
The accompanying notes are an integral part of these consolidated financial statements.
LEAR CORPORATION AND SUBSIDIARIES
CONSOLIDATED STATEMENTS OF CASH FLOWS
(In millions)
| | For the year ended December 31, | For the year ended December 31, | 2020 | | 2019 | | 2018 | For the year ended December 31, | 2023 | | 2022 | | 2021 |
| Cash Flows from Operating Activities: | Cash Flows from Operating Activities: | |
| Consolidated net income | Consolidated net income | $ | 233.9 | | | $ | 830.7 | | | $ | 1,246.7 | |
| Consolidated net income | |
| Consolidated net income | |
| Adjustments to reconcile consolidated net income to net cash provided by operating activities – | Adjustments to reconcile consolidated net income to net cash provided by operating activities – | |
| Equity in net income of affiliates | Equity in net income of affiliates | (28.5) | | | (23.2) | | | (20.2) | |
| Loss on extinguishment of debt | 21.1 | | | 10.6 | | | 0 | |
| Equity in net income of affiliates | |
| Equity in net income of affiliates | |
| Impairment charges | Impairment charges | 31.9 | | | 14.5 | | | 6.1 | |
| Deferred tax (benefit) provision | (84.7) | | | (38.2) | | | 86.7 | |
| Deferred tax benefit | |
| Depreciation and amortization | Depreciation and amortization | 539.9 | | | 509.9 | | | 484.4 | |
| Stock-based compensation | Stock-based compensation | 40.0 | | | 23.3 | | | 41.4 | |
| Net change in recoverable customer engineering, development and tooling | Net change in recoverable customer engineering, development and tooling | (47.0) | | | (32.4) | | | 54.4 | |
| Net change in working capital items (see below) | Net change in working capital items (see below) | (66.9) | | | (25.5) | | | (118.9) | |
| Changes in other long-term assets | |
| Changes in other long-term liabilities | Changes in other long-term liabilities | 8.3 | | | 5.0 | | | (23.0) | |
| Changes in other long-term assets | (26.5) | | | (10.1) | | | (16.7) | |
| Loss on extinguishment of debt | |
| Other, net | Other, net | 41.6 | | | 19.7 | | | 38.9 | |
| Net cash provided by operating activities | Net cash provided by operating activities | 663.1 | | | 1,284.3 | | | 1,779.8 | |
| Cash Flows from Investing Activities: | Cash Flows from Investing Activities: | |
| Additions to property, plant and equipment | Additions to property, plant and equipment | (452.3) | | | (603.9) | | | (677.0) | |
| Acquisition of Xevo, net of cash acquired | 0 | | | (321.7) | | | 0 | |
| Additions to property, plant and equipment | |
| Additions to property, plant and equipment | |
| Acquisitions, net of cash acquired | |
| Other, net | Other, net | (16.5) | | | 3.2 | | | (16.5) | |
| Net cash used in investing activities | Net cash used in investing activities | (468.8) | | | (922.4) | | | (693.5) | |
| Cash Flows from Financing Activities: | Cash Flows from Financing Activities: | |
| Revolving credit facility borrowings | 1,000.0 | | | 0 | | | 0 | |
| Revolving credit facility repayments | (1,000.0) | | | 0 | | | 0 | |
| Short-term borrowings, net | |
| Short-term borrowings, net | |
| Short-term borrowings, net | |
| Term loan borrowings | |
| Repurchases of common stock | |
| Dividends paid to Lear Corporation stockholders | |
| Dividends paid to noncontrolling interests | |
| Term loan facility repayments | |
| Proceeds from the issuance of senior notes | Proceeds from the issuance of senior notes | 669.1 | | | 693.3 | | | 0 | |
| Redemption of senior notes | Redemption of senior notes | (667.1) | | | (333.7) | | | 0 | |
| Term loan repayments | (14.1) | | | (7.8) | | | (6.3) | |
| Short-term borrowings (repayments), net | (19.3) | | | 9.5 | | | 7.3 | |
| Payment of debt issuance and other financing costs | Payment of debt issuance and other financing costs | (7.0) | | | (6.5) | | | 0 | |
| Repurchase of common stock | (70.0) | | | (384.7) | | | (704.9) | |
| Dividends paid to Lear Corporation stockholders | (67.3) | | | (186.3) | | | (186.3) | |
| Dividends paid to noncontrolling interests | (123.3) | | | (78.9) | | | (79.1) | |
| | Other, net | |
| | Other, net | |
| | Other, net | Other, net | (112.7) | | | (66.8) | | | (61.2) | |
| Net cash used in financing activities | Net cash used in financing activities | (411.7) | | | (361.9) | | | (1,030.5) | |
| Effect of foreign currency translation | Effect of foreign currency translation | 21.5 | | | (9.4) | | | (36.4) | |
| Net Change in Cash, Cash Equivalents and Restricted Cash | Net Change in Cash, Cash Equivalents and Restricted Cash | (195.9) | | | (9.4) | | | 19.4 | |
| Cash, Cash Equivalents and Restricted Cash as of Beginning of Period | Cash, Cash Equivalents and Restricted Cash as of Beginning of Period | 1,510.4 | | | 1,519.8 | | | 1,500.4 | |
| Cash, Cash Equivalents and Restricted Cash as of End of Period | Cash, Cash Equivalents and Restricted Cash as of End of Period | $ | 1,314.5 | | | $ | 1,510.4 | | | $ | 1,519.8 | |
| Changes in Working Capital Items: | Changes in Working Capital Items: | |
| Accounts receivable | Accounts receivable | $ | (164.7) | | | $ | (116.2) | | | $ | 230.8 | |
| Accounts receivable | |
| Accounts receivable | |
| Inventories | Inventories | (107.7) | | | (69.1) | | | (32.5) | |
| Accounts payable | 214.0 | | | (5.5) | | | (199.3) | |
| Accounts payable (including $15.4 million of cash paid in 2023 in conjunction with the acquisition of IGB to settle pre-existing accounts payable) | |
| Accrued liabilities and other | Accrued liabilities and other | (8.5) | | | 165.3 | | | (117.9) | |
| Net change in working capital items | Net change in working capital items | $ | (66.9) | | | $ | (25.5) | | | $ | (118.9) | |
| Supplementary Disclosure: | Supplementary Disclosure: | |
| Cash paid for interest | Cash paid for interest | $ | 117.8 | | | $ | 104.4 | | | $ | 97.1 | |
| Cash paid for income taxes, net of refunds received of $32.5 million in 2020, $69.4 million in 2019 and $40.6 million in 2018 | $ | 141.5 | | | $ | 172.1 | | | $ | 279.2 | |
| Cash paid for interest | |
| Cash paid for interest | |
| Cash paid for income taxes, net of refunds received of $15.7 million in 2023, $17.1 million in 2022 and $40.7 million in 2021 | |
The accompanying notes are an integral part of these consolidated financial statements.
Lear Corporation and Subsidiaries
Notes to Consolidated Financial Statements
(1) Basis of Presentation
Lear Corporation ("Lear," and together with its consolidated subsidiaries, the "Company") and its affiliates design and manufacture automotive seating and electrical distribution systems and related components. The Company’sCompany's main customers are automotive original equipment manufacturers. The Company operates facilities worldwide.
The accompanying consolidated financial statements include the accounts of Lear, a Delaware corporation, and the wholly owned and less than wholly owned subsidiaries controlled by Lear.
(2) Impact of COVID-19 Pandemic
Unprecedented industry disruptions related to the COVID-19 pandemic impacted operations in every region of the world. The Company's operations in China were impacted first, with most plants in the country closed for several weeks during the first quarter. At the end of the first quarter, all of the Company's facilities in China were operating and capacity utilization was increasing. Beginning in mid-March, the Company's operations in Europe, North America, South America and Asia (outside of China) were impacted, with virtually all of its plants closed at the end of the first quarter and closures continuing throughout April and, in most cases, a portion of May. Although manufacturing resumed gradually, most of the Company's plants in its major markets were operating at pre-COVID-19 levels at the end of the second quarter and throughout the second half of 2020. The Company experienced significant inefficiencies and incremental costs related to the COVID-19 pandemic in the first half of the year, which diminished toward the end of the second quarter. In the second half of 2020, the Company experienced less significant but ongoing costs related to personal protective equipment, employee transportation and higher labor costs reflecting an increase in absenteeism.Current Operating Environment
Various government programs have been enacted to provide financial relief for businesses affected by the COVID-19 pandemic. In the year ended December 31, 2020, the Company recognized approximately $98 millionof government assistance primarily related to the reimbursement of certain employee costs. The Company recognizes such assistance as a reduction of the related costs as such costs are incurred and the Company is reasonably assured to receive payment.
Although industry production has returned to pre-COVID-19 levels, partially due to the customers' need to replenish inventory levels, it is likely that, for a period of time, the global automotive industry will experience lower demand for new vehiclesexperienced a significant decline in global production volumes as a result of the COVID-19 pandemic. Although industry production has recovered modestly and returned to 2019 pre-pandemic production levels in 2023, industry production remains below 2017 peak levels. Further, the global economic slowdown caused by the COVID-19 pandemic, as new vehicle sales are typically correlated with positive consumer confidence and low unemployment. The Company is also continuing to monitor its supply base,economy, as well as the automotive industry, have been influenced directly and indirectly by macroeconomic events resulting in unfavorable conditions, including shortages of semiconductor chips and other components, elevated inflation levels on commodities and labor, higher interest rates, and labor and energy shortages in certain markets. Beginning in the third quarter of 2023 and continuing into the fourth quarter of 2023, the automotive industry was impacted by labor strikes and related production constraints imposed by various governments,disruptions at certain facilities in the United States. Certain of these factors, among others, continue to minimizeimpact consumer demand, as well as the impact on its manufacturing operations. Further, a resurgenceability of the virus with corresponding shelter-in-place orders impacting industry production in 2021 could also impact the Company's financial results.automotive manufacturers to produce vehicles to meet demand.
The accompanying consolidated financial statements reflect estimates and assumptions made by management as of December 31, 2020,2023, and for the year then ended. Such estimates and assumptions affect, among other things, the Company's goodwill, long-lived asset and indefinite-lived intangible asset valuations;valuations, inventory valuations; valuationvaluations, valuations of deferred income taxes and income tax contingencies;contingencies, and credit losses related to ourthe Company's financial instruments. Events and circumstances arising after December 31, 2020, including those resulting from the impact of the COVID-19 pandemic,2023, will be reflected in management's estimates and assumptions in future periods.
For more information related to goodwill, long-lived assets, inventory and credit losses, see Note 3, "Summary of Significant Accounting Policies — Impairment of Goodwill and Intangible Assets.Policies." For more information related to income taxes, see Note 3, "Summary of Significant Accounting Policies — Income Taxes," and Note 9, "Income Taxes." For more information related to leases, see Note 8, "Leases."
(3) Summary of Significant Accounting Policies
Consolidation
Lear consolidates all entities, including variable interest entities, in which it has a controlling financial interest. Investments in affiliates in which Lear does not have control, but does have the ability to exercise significant influence over operating and financial policies, are accounted for under the equity method (Note 6, "Investments in Affiliates and Other Related Party Transactions").
Lear Corporation and Subsidiaries
Notes to Consolidated Financial Statements (continued)
Fiscal Period Reporting
The Company’sCompany's annual financial results are reported on a calendar year basis, and quarterly interim results are reported using a thirteen week reporting calendar.
Cash, Cash Equivalents and Restricted Cash
Cash and cash equivalents include all highly liquid investments with original maturities of ninety days or less. Restricted cash includes cash that is legally restricted as to use or withdrawal.
Accounts Receivable
The Company records accounts receivable as title is transferred to its customers. The Company’sCompany's customers are the world’sworld's major automotive manufacturers. Generally, the Company does not require collateral for its accounts receivable.
On January 1, 2020, the Company adopted Accounting Standards Update ("ASU") 2016-13, "Financial Instruments — Credit Losses (Topic 326), Measurement of Credit Losses on Financial Instruments," using a modified retrospective approach. The standard amends several aspects of the measurement of credit losses related to certain financial instruments, including the replacement of the existing incurred credit loss model and other models with the current expected credit losses ("CECL") model. The cumulative effect of adoption resulted in an increase of $0.8 million in the allowance for credit loss and a corresponding decrease in retained earnings as of January 1, 2020.
The Company’sCompany's allowance for credit losses on financial assets measured at amortized cost, primarily accounts receivable, reflects management’smanagement's estimate of credit losses over the remaining expected life of such assets, measured primarily using historical experience, as well as current conditions and forecasts that affect the collectability of the reported amount. Expected credit losses for newly recognized financial assets, as well as changes to expected credit losses during the period, are recognized
Lear Corporation and Subsidiaries
Notes to Consolidated Financial Statements (continued)
in earnings. The Company also considers geographic and segment specific risk factors in the development of expected credit losses. As of December 31, 20202023 and 2019,2022, accounts receivable are reflected net of reserves of $35.3$35.6 million and $36.0$35.3 million, respectively. Changes in expected credit losses were not significant during the year ended December 31, 2020.2023.
The Company receives bank notes from its customers, which are classified as other current assets in the consolidated balance sheets, for certain amounts of accounts receivable, primarily in Asia. The Company may hold such bank notes until maturity, exchange them with suppliers to settle liabilities or sell them to third-party financial institutions in exchange for cash.
Inventories
Inventories are stated at the lower of cost or net realizable value. Cost is determined using thestandard costing, which approximates actual cost on a first-in, first-out method. Finished goods and work-in-process inventories include material, labor and manufacturing overhead costs. The Company records reserves for inventory in excess of production and/or forecasted requirements and for obsolete inventory in production and service inventories. A summary of inventories is shown below (in millions):
| | December 31, | December 31, | 2020 | | 2019 | December 31, | 2023 | | 2022 |
| Raw materials | Raw materials | $ | 1,051.6 | | | $ | 906.3 | |
| Work-in-process | Work-in-process | 109.8 | | | 107.0 | |
| Finished goods | Finished goods | 396.9 | | | 380.4 | |
| Reserves | Reserves | (157.2) | | | (135.5) | |
| Inventories | Inventories | $ | 1,401.1 | | | $ | 1,258.2 | |
Engineering and Development ("E&D") and Tooling Costs
In 2020,2023, the Company recordedincurred E&D costs of $557.0$611.4 million, including $280.7$375.8 million (or 2% of related sales) in its Seating business, $259.8segment, $230.5 million (or 6%4% of related sales) in its E-Systems businesssegment and $16.5$5.1 million at its headquarters location.
Pre-Production Costs Related to Long-Term Supply Agreements
The Company incurs pre-production E&D and tooling costs related to the products produced for its customers under long-term supply agreements. The Company expenses all pre-production E&D costs for which reimbursement is not contractually guaranteed by the customer. In addition, the Company expenses all pre-production tooling costs related to customer-owned tools for which reimbursement is not contractually guaranteed by the customer or for which the Company does not have a non-cancelable right to use the tooling.
Lear CorporationDuring 2023 and Subsidiaries
Notes to Consolidated Financial Statements (continued)
During 2020 and 2019,2022, the Company capitalized $229.7$291.8 million and $211.2$249.5 million, respectively, of pre-production E&D costs for which reimbursement is contractually guaranteed by the customer. During 20202023 and 2019,2022, the Company also capitalized $174.0$162.8 million and $231.6$185.3 million, respectively, of pre-production tooling costs related to customer-owned tools for which reimbursement is contractually guaranteed by the customer or for which the Company has a non-cancelable right to use the tooling. These amounts are included in other current and long-term assets in the accompanying consolidated balance sheets as of December 31, 20202023 and 2019.2022. During 20202023 and 2019,2022, the Company collected $354.6$417.0 million and $408.3$435.8 million, respectively, of cash related to E&D and tooling costs.
The classification of recoverable customer E&D and tooling costs related to long-term supply agreements is shown below (in millions):
| | December 31, | December 31, | 2020 | | 2019 | December 31, | 2023 | | 2022 |
| Current | Current | $ | 212.0 | | | $ | 157.2 | |
| Long-term | Long-term | 121.4 | | | 113.8 | |
| Recoverable customer E&D and tooling | Recoverable customer E&D and tooling | $ | 333.4 | | | $ | 271.0 | |
Other E&D Costs
Costs incurred in connection with product launches, to the extent not recoverable from the Company’sCompany's customers, are recorded in cost of sales as incurred and totaled $135.0$138.8 million, $138.2$145.2 million and $140.4$139.5 million for the years ended December 31, 2020, 20192023, 2022 and 2018,2021, respectively.
All other E&D costs are recorded in selling, general and administrative expenses as incurred and totaled $192.3$180.8 million, $178.4$173.6 million and $156.2$170.7 million for the years ended December 31, 2020, 20192023, 2022 and 2018,2021, respectively.
Lear Corporation and Subsidiaries
Notes to Consolidated Financial Statements (continued)
Property, Plant and Equipment
Property, plant and equipment is stated at cost. Costs associated with the repair and maintenance of the Company’sCompany's property, plant and equipment are expensed as incurred. Costs associated with improvements which extend the life, increase the capacity or improve the efficiency or safety of the Company’sCompany's property, plant and equipment are capitalized and depreciated over the remaining useful life of the related asset. Depreciable property is depreciated over the estimated useful lives of the assets, using principally the straight-line method as follows:
| | | | | |
| Buildings and improvements | 10 to 40 years |
| Machinery and equipment | 5 to 10 years |
A summary of property, plant and equipment is shown below (in millions):
| | December 31, | December 31, | 2020 | | 2019 | December 31, | 2023 | | 2022 |
| Land | Land | $ | 114.1 | | | $ | 113.1 | |
| Buildings and improvements | Buildings and improvements | 880.7 | | | 831.3 | |
| Machinery and equipment | Machinery and equipment | 4,339.2 | | | 3,844.1 | |
| Construction in progress | Construction in progress | 311.1 | | | 382.4 | |
| Total property, plant and equipment | Total property, plant and equipment | 5,645.1 | | | 5,170.9 | |
| Less – accumulated depreciation | Less – accumulated depreciation | (2,908.9) | | | (2,466.7) | |
| Net property, plant and equipment | Net property, plant and equipment | $ | 2,736.2 | | | $ | 2,704.2 | |
For the years ended December 31, 2020, 20192023, 2022 and 2018,2021, depreciation expense was $474.0$541.9 million, $447.6$505.7 million and $433.0$500.6 million, respectively. As of December 31, 2020, 20192023, 2022 and 2018,2021, capital expenditures recorded in accounts payable totaled $118.4$133.1 million,$131.6 $150.2 million and $156.2$147.8 million, respectively.
Impairment of Goodwill
Goodwill is not amortized but is tested for impairment on at least an annual basis. Impairment testing is required more often than annually if an event or circumstance indicates that an impairment is more likely than not to have occurred. In conducting its annual impairment testing, the Company may first perform a qualitative assessment of whether it is more likely than not that a reporting unit’sunit's fair value is less than its carrying amount. If not, no further goodwill impairment testing is required. If it is more likely than not that a reporting unit’sunit's fair value is less than its carrying amount, or if the Company elects not to perform a
Lear Corporation and Subsidiaries
Notes to Consolidated Financial Statements (continued)
qualitative assessment of a reporting unit, the Company then compares the fair value of the reporting unit to the related net book value. If the net book value of a reporting unit exceeds its fair value, an impairment loss is measured and recognized.
The Company utilizes an income approach to estimate the fair value of each of its reporting units and a market valuation approach to further support this analysis. The income approach is based on projected debt-free cash flow which is discounted to the present value using discount factors that consider the timing and risk of cash flows. The Company believes that this approach is appropriate because it provides a fair value estimate based upon the reporting unit’sunit's expected long-term operating cash flow performance. This approach also mitigates the impact of cyclical trends that occur in the industry. Fair value is estimated using recent automotive industry and specific platform production volume projections, which are based on both third-party and internally developed forecasts, as well as commercial and discount rate assumptions. The discount rate used is the value-weighted average of the Company’sCompany's estimated cost of equity and of debt ("cost of capital") derived using both known and estimated customary market metrics. The Company’sCompany's weighted average cost of capital is adjusted by reporting unit to reflect a risk factor, if necessary. Other significant assumptions include terminal value growth rates, terminal value margin rates, future capital expenditures and changes in future working capital requirements. While there are inherent uncertainties related to the assumptions used and to management’smanagement's application of these assumptions to this analysis, the Company believes that the income approach provides a reasonable estimate of the fair value of its reporting units. The market valuation approach is used to further support the Company’sCompany's analysis and is based on recent transactions involving comparable companies.
The annual goodwill impairment assessment wasis completed as of the first day of the Company's fourth quarter. The Company performed a qualitative assessment for each reporting unit except for one within the Seating operating segment where a quantitative analysis was performed.unit. The qualitative assessments indicated that it was more likely than not that the fair value of each reporting unit exceeded its respective carrying value. The quantitative analysis indicated that the fair value
Lear Corporation and Subsidiaries
Notes to Consolidated Financial Statements (continued)
A summary of the changes in the carrying amount of goodwill for each of the periods in the two years ended December 31, 2020,2023, is shown below (in millions):
| | | | | | | | | | | | | | | | | |
| Seating | | E-Systems | | Total |
| Balance as of December 31, 2018 | $ | 1,244.3 | | | $ | 161.0 | | | $ | 1,405.3 | |
| Acquisition | 0 | | | 219.0 | | | 219.0 | |
| Foreign currency translation and other | (8.9) | | | (1.1) | | | (10.0) | |
| Balance as of December 31, 2019 | 1,235.4 | | | 378.9 | | | 1,614.3 | |
| Foreign currency translation and other | 33.4 | | | 8.1 | | | 41.5 | |
| Balance as of December 31, 2020 | $ | 1,268.8 | | | $ | 387.0 | | | $ | 1,655.8 | |
For further information related to the acquisition, see Note 4, "Acquisition." | | | | | | | | | | | | | | | | | |
| Seating | | E-Systems | | Total |
| Balance as of December 31, 2021 | $ | 1,249.3 | | | $ | 408.6 | | | $ | 1,657.9 | |
| Acquisition | 27.9 | | | — | | | 27.9 | |
| Foreign currency translation and other | (16.1) | | | (9.1) | | | (25.2) | |
| Balance as of December 31, 2022 | 1,261.1 | | | 399.5 | | | 1,660.6 | |
| Acquisition | 73.5 | | | — | | | 73.5 | |
| Foreign currency translation and other | 6.9 | | | (3.1) | | | 3.8 | |
| Balance as of December 31, 2023 | $ | 1,341.5 | | | $ | 396.4 | | | $ | 1,737.9 | |
Intangible Assets
As of December 31, 2020,2023, intangible assets consist primarily of certain intangible assets recorded in connection with the Company's acquisitions, including substantially all of Guilford Mills in 2012, the parent company of Eagle Ottawa, LLC in 2015, AccuMED Holdings Corp. in 2016, Grupo Antolin's automotive seatingKongsberg Automotive's Interior Comfort Systems business in 2017 and Xevo Inc.unit ("Xevo"Kongsberg ICS") in 20192022 and I.G. Bauerhin ("IGB") in 2023 (Note 4, "Acquisition""Acquisitions"). These intangible assets were recorded at their estimated fair value, based on independent appraisals, as of the transaction or acquisition date. The value assigned to technology intangibles is based on the royalty savings method, which applies a hypothetical royalty rate to projected revenues attributable to the identified technologies. Royalty rates were determined based primarily on analysis of market information. The customer-based intangible asset includes the acquired entity's established relationships with its customers and the ability of these customers to generate future economic profits for the Company. The value assigned to customer-based intangibles is based on the present value of future earnings attributable to the asset group after recognition of required returns to other contributory assets.
A summary of intangible assets as of December 31, 2023, is shown below (in millions):
| | | | | | | | | | | | | | | | | | | | | | | |
| Gross Carrying
Value | | Accumulated
Amortization | | Net Carrying
Value | | Weighted
Average Useful
Life (years) |
| Amortized intangible assets: | | | | | | | |
| Customer-based | $ | 518.2 | | | $ | (354.9) | | | $ | 163.3 | | | 12 |
| Licensing agreements | 71.0 | | | (66.3) | | | 4.7 | | | 5 |
| Technology | 24.6 | | | (3.7) | | | 20.9 | | | 12 |
| Other | 0.4 | | | (0.2) | | | 0.2 | | | 5 |
| Balance as of December 31, 2023 | $ | 614.2 | | | $ | (425.1) | | | $ | 189.1 | | | 11 |
A summary of intangible assets as of December 31, 2022, is shown below (in millions):
| | | | | | | | | | | | | | | | | | | | | | | |
| Gross Carrying
Value | | Accumulated
Amortization | | Net Carrying
Value | | Weighted
Average Useful
Life (years) |
| Amortized intangible assets: | | | | | | | |
| Customer-based | $ | 514.9 | | | $ | (313.3) | | | $ | 201.6 | | | 12 |
| Licensing agreements | 71.0 | | | (52.0) | | | 19.0 | | | 5 |
| Technology | 16.2 | | | (1.7) | | | 14.5 | | | 13 |
| Other | 0.4 | | | (0.1) | | | 0.3 | | | 5 |
| Balance as of December 31, 2022 | $ | 602.5 | | | $ | (367.1) | | | $ | 235.4 | | | 11 |
In 2023 and 2022, intangible assets with a gross carrying value of $1.3 million and $19.4 million, respectively, became fully amortized and are no longer included in the gross carrying value or accumulated amortization.
Lear Corporation and Subsidiaries
Notes to Consolidated Financial Statements (continued)
A summary of intangible assets as of December 31, 2020, is shown below (in millions):
| | | | | | | | | | | | | | | | | | | | | | | |
| Gross Carrying
Value | | Accumulated
Amortization | | Net Carrying
Value | | Weighted
Average Useful
Life (years) |
| Amortized intangible assets: | | | | | | | |
| Customer-based | $ | 528.0 | | | $ | (232.0) | | | $ | 296.0 | | | 11.8 |
| Licensing agreements | 71.9 | | | (24.4) | | | 47.5 | | | 5.0 |
| Technology | 35.1 | | | (21.2) | | | 13.9 | | | 7.2 |
| $ | 635.0 | | | $ | (277.6) | | | $ | 357.4 | | | 10.8 |
| Unamortized intangible assets: | | | | | | | |
| In-process research and development | 10.8 | | | — | | | 10.8 | | | |
| Balance as of December 31, 2020 | $ | 645.8 | | | $ | (277.6) | | | $ | 368.2 | | | |
Intangible assets with a gross carrying value of $25.6 million became fully amortized in 2020 and are no longer included in the gross carrying value or accumulated amortization as of December 31, 2020.
A summary of intangible assets as of December 31, 2019, is shown below (in millions):
| | | | | | | | | | | | | | | | | | | | | | | |
| Gross Carrying
Value | | Accumulated
Amortization | | Net Carrying
Value | | Weighted
Average Useful
Life (years) |
| Amortized intangible assets: | | | | | | | |
| Customer-based | $ | 531.9 | | | $ | (203.0) | | | $ | 328.9 | | | 11.6 |
| Licensing agreements | 75.0 | | | (10.2) | | | 64.8 | | | 5.0 |
| Technology | 35.0 | | | (15.9) | | | 19.1 | | | 7.0 |
| Other | 1.4 | | | (1.3) | | | 0.1 | | | 2.5 |
| $ | 643.3 | | | $ | (230.4) | | | $ | 412.9 | | | 10.5 |
| Unamortized intangible assets: | | | | | | | |
| In-process research and development | 10.8 | | | — | | | 10.8 | | | |
| Balance as of December 31, 2019 | $ | 654.1 | | | $ | (230.4) | | | $ | 423.7 | | | |
Excluding the impact of any future acquisitions, the Company’sCompany's estimated annual amortization expense for the five succeeding years is shown below (in millions):
| | Year | Year | Expense | Year | Expense |
| 2021 | $ | 65.3 | |
| 2022 | 64.4 | |
| 2023 | 62.9 | |
| 2024 | 2024 | 47.4 | |
| 2025 | 2025 | 19.8 | |
| 2026 | |
| 2027 | |
| 2028 | |
Impairment of Long-Lived Assets
The Company monitors its long-lived assets for impairment indicators on an ongoing basis in accordance with accounting principles generally accepted in the United States ("GAAP"). If impairment indicators exist, the Company performs the required impairment analysis by comparing the undiscounted cash flows expected to be generated from the long-lived assets to the related net book values. If the net book value exceeds the undiscounted cash flows, an impairment loss is measured and recognized. An impairment loss is measured as the difference between the net book value and the fair value of the long-lived assets. Fair value is estimatedestimates of long-lived assets are based uponon independent appraisals or discounted cash flows, giving consideration to the highest and best use of the assets. Key assumptions used in the appraisals are based on a combination of market and cost approaches, as appropriate.
For the years ended December 31, 2020, 20192023, 2022 and 2018,2021, the Company recognized fixed asset impairment charges of $21.3$5.1 million, $8.7$9.9 million and $4.7$4.2 million, respectively, in conjunction with its restructuring actions (Note 5, "Restructuring"). For the years ended December 31, 20202023, 2022 and 2018,2021, the Company recognized additional fixed asset impairment charges of $4.6$6.3 million, $5.7 million and $1.4$7.7 million, respectively. For the year ended December 31, 2022, additional asset impairment charges include $4.4 million related to the Company's Russian operations. Asset impairment charges are recorded in cost of sales in the accompanying consolidated statements of income for the years ended December 31, 2020, 20192023, 2022 and 2018.
Lear Corporation and Subsidiaries
Notes to Consolidated Financial Statements (continued)2021.
Impairment of Investments in Affiliates
The Company monitors its investments in affiliates for indicators of other-than-temporary declines in value on an ongoing basis in accordance with GAAP. If the Company determines that an other-than-temporary decline in value has occurred, it recognizes an impairment loss, which is measured as the difference between the recorded book value and the fair value of the investment. Fair value is generally determined using an income approach based on discounted cash flows or negotiated transaction values. For the years ended December 31, 2023 and 2021, the Company recognized impairment charges of $7.0 million and $1.0 million, respectively, related to its investments in affiliates. There were no impairment charges recognized related to the Company's investments in affiliates for the year ended December 31, 2022. The impairment charges are included in other expense, net in the accompanying consolidated statements of income for the years ended December 31, 2023 and 2021.
Accrued Liabilities
A summary of accrued liabilities as of December 31, 20202023 and 2019,2022, is shown below (in millions):
| | December 31, | December 31, | 2020 | | 2019 | December 31, | 2023 | | 2022 |
| Compensation and employee benefits | Compensation and employee benefits | $ | 297.7 | | | $ | 319.2 | |
| Income and other taxes payable | Income and other taxes payable | 287.7 | | | 256.6 | |
| Restructuring | 139.0 | | | 157.7 | |
| Current portion of lease obligations | Current portion of lease obligations | 116.3 | | | 113.9 | |
| Current portion of restructuring accrual | | Current portion of restructuring accrual | 104.7 | | 53.5 |
| Other | Other | 1,080.2 | | | 963.8 | |
| Accrued liabilities | Accrued liabilities | $ | 1,920.9 | | | $ | 1,811.2 | |
Lear Corporation and Subsidiaries
Notes to Consolidated Financial Statements (continued)
Leases
Accounting Policy
The Company determines if an arrangement contains a lease at inception. For all asset classes, the Company utilizes the short-term lease exemption as provided under GAAP. A short-term lease is a lease that, at the commencement date, has a term of twelve months or less and does not include an option to purchase the underlying asset. For all asset classes, the Company accounts for each lease component of a contract and its associated non-lease components as a single lease component, rather than allocating a standalone value to each component of a lease.
For purposes of calculating operating lease obligations under the standard, the Company's lease terms may include options to extend or terminate the lease when it is reasonably certain that the Company will exercise such option. The Company's leases do not contain material residual value guarantees or material restrictive covenants.
Operating lease expense is recognized on a straight-line basis over the lease terms.
Discount Rate
The discount rate used to measure a lease obligation should be the rate implicit in the lease; however, the Company’sCompany's operating leases generally do not provide an implicit rate. Accordingly, the Company uses its incremental borrowing rate at lease commencement to determine the present value of lease payments. The incremental borrowing rate is an entity-specific rate which represents the rate of interest a lessee would pay to borrow on a collateralized basis over a similar term with similar payments.
Revenue Recognition and Sales Commitments
The Company enters into contracts with its customers to provide production parts generally at the beginning of a vehicle’svehicle's life cycle. Typically, these contracts do not provide for a specified quantity of products, but once entered into, the Company is often expected to fulfill its customers’customers' purchasing requirements for the production life of the vehicle. Many of these contracts may be terminated by the Company’sCompany's customers at any time. Historically, terminations of these contracts have been infrequent. The Company receives purchase orders from its customers, which provide the commercial terms for a particular production part, including price (but not quantities). Contracts may also provide for annual price reductions over the production life of the vehicle, and prices may be adjusted on an ongoing basis to reflect changes in product content/cost and other commercial factors.
Revenue is recognized at a point in time when control of the product is transferred to the customer under standard commercial terms, as the Company does not have an enforceable right to payment prior to such transfer. The amount of revenue recognized reflects the consideration that the Company expects to be entitled to in exchange for those products based on the annualcurrent purchase orders, annual price reductions and ongoing price adjustments. In 2020 and 2019, revenueRevenue recognized related to prior years represented less thanapproximately 1% of consolidated net sales.sales during the years ended December 31, 2023, 2022 and 2021. The Company's customers pay for products received in accordance with payment terms that are customary within the industry. The Company's contracts with its customers do not have significant financing components.
Lear Corporation and Subsidiaries
Notes to Consolidated Financial Statements (continued)
The Company records a contract liability for advances received from its customers. As of December 31, 2020,2023 and 2022, there were 0no significant contract liabilities recorded. Further, there were 0no significant contract liabilities recognized in revenue during the yearyears ended December 31, 2020.2023, 2022 and 2021.
Amounts billed to customers related to shipping and handling costs are included in net sales in the consolidated statements of income. Shipping and handling costs are accounted for as fulfillment costs and are included in cost of sales in the consolidated statements of income.
Taxes assessed by a governmental authority that are both imposed on and concurrent with a specific revenue-producing transaction that are collected by the Company from a customer are excluded from revenue.
Cost of Sales and Selling, General and Administrative Expenses
Cost of sales includes material, labor and overhead costs associated with the manufacture and distribution of the Company’sCompany's products. Distribution costs include inbound freight costs, purchasing and receiving costs, inspection costs, warehousing costs and other costs of the Company’sCompany's distribution network. Selling, general and administrative expenses include selling, engineering and development and administrative costs not directly associated with the manufacture and distribution of the Company’sCompany's products.
Restructuring Costs
Restructuring costs include employee termination benefits, asset impairment charges and contract termination costs, as well as other incremental net costs resulting from the restructuring actions. Employee termination benefits are recorded based on existing union and employee contracts, statutory requirements, completed negotiations and Company policy. Other incremental net costs principally include equipment and personnel relocation costs.costs and gains and losses on the sales of facilities. In addition
Lear Corporation and Subsidiaries
Notes to Consolidated Financial Statements (continued)
to restructuring costs, the Company also incurs incremental manufacturing inefficiency costs at the operating locations impacted by the restructuring actions during the related restructuring implementation period. Restructuring costs are recognized in the Company’sCompany's consolidated financial statements in accordance with GAAP. Generally, charges are recorded as restructuring actions are approved, communicated and/or implemented.
Other Expense, Net
Other expense, net includes non-income related taxes, foreign exchange gains and losses, gains and losses related to certain derivative instruments and hedging activities, losses on the extinguishment of debt, gains and losses on the disposal of fixed assets, gains and losses on the consolidation and deconsolidation of affiliates, the non-service cost components of net periodic benefit cost and other miscellaneous income and expense. A summary of other expense, net is shown below (in millions):
| | For the year ended December 31, | For the year ended December 31, | 2020 | | 2019 | | 2018 | For the year ended December 31, | 2023 | | 2022 | | 2021 |
| Other expense | Other expense | $ | 72.2 | | | $ | 52.2 | | | $ | 43.8 | |
| Other income | Other income | (17.0) | | | (27.6) | | | (12.2) | |
| Other expense, net | Other expense, net | $ | 55.2 | | | $ | 24.6 | | | $ | 31.6 | |
Income Taxes
Deferred tax assets and liabilities are recognized for the future tax consequences attributable to temporary differences between financial statement carrying amounts of existing assets and liabilities and their respective tax bases and tax loss and credit carryforwards. Deferred tax assets and liabilities are measured using enacted tax rates expected to apply to taxable income infor the years in which those temporary differences are expected to be recovered or settled.
The Company’sCompany's current and future provision for income taxes is impacted by the initial recognition of and changes in valuation allowances in certain countries. The Company intends to maintain these allowances until it is more likely than not that the deferred tax assets will be realized. The Company’sCompany's future provision for income taxes will include no tax benefit with respect to losses incurred and, except for certain jurisdictions, no tax expense with respect to income generated in these countries until the respective valuation allowances are eliminated. Accordingly, income taxes are impacted by changes in valuation allowances and the mix of earnings among jurisdictions. The Company evaluates the realizability of its deferred tax assets on a quarterly basis. In completing this evaluation, the Company considers all available evidence in order to determine whether, based on the weight of the evidence, a valuation allowance for its deferred tax assets is necessary. Such evidence includes historical results, future reversals of existing taxable temporary differences and expectations for future taxable income (exclusive of the reversal of temporary differences and carryforwards), as well as the implementation of feasible and prudent tax planning strategies. If, based on the weight of the evidence, it is more likely than not that all or a portion of the Company’sCompany's deferred tax assets will not be realized, a valuation allowance is recorded. If operating results improve or decline on a continual basis in a particular jurisdiction, the Company’sCompany's decision regarding the need for a valuation allowance could change, resulting in either the initial
Lear Corporation and Subsidiaries
Notes to Consolidated Financial Statements (continued)
recognition or reversal of a valuation allowance in that jurisdiction, which could have a significant impact on income tax expense in the period recognized and subsequent periods. In determining the provision for income taxes for financial statement purposes, the Company makes certain estimates and judgments, which affect its evaluation of the carrying value of its deferred tax assets, as well as its calculation of certain tax liabilities.
The Company reclassifies taxes from accumulated other comprehensive loss to earnings as the items to which the tax effects relate are similarly reclassified.
The calculation of the Company’sCompany's gross unrecognized tax benefits and liabilities includes uncertainties in the application of, and changes in, complex tax regulations in a multitude of jurisdictions across its global operations. The Company recognizes tax benefits and liabilities based on its estimates of whether, and the extent to which, additional taxes will be due. The Company adjusts these benefits and liabilities based on changing facts and circumstances; however, due to the complexity of these uncertainties and the impact of tax audits, the ultimate resolutions may differ significantly from the Company’sCompany's estimates.
The Tax Cuts and Jobs Act (the "Act") enacted on December 22, 2017, created the global intangible low-tax income ("GILTI") provision that imposes U.S. tax on certain earnings of foreign subsidiaries that are subject to foreign tax below a certain threshold. GILTI taxes are recorded in current income tax expense as incurred.
Effective January 1, 2019, ASU 2018-02, "Reclassification of Certain Tax Effects from Accumulated Other Comprehensive Income," allows for the reclassification of "stranded" tax effects as a result of the Act from accumulated other comprehensive income to retained earnings. The Company elected not to reclassify such amounts. The Company reclassifies taxes from accumulated other comprehensive loss to earnings as the items to which the tax effects relate are similarly reclassified.
In December 2019, the Financial Accounting Standards Board ("FASB") issued ASU 2019-12, "Income Taxes (Topic 740): Simplifying the Accounting for Income Taxes." The standard simplifies the accounting for income taxes by eliminating certain exceptions to the general principles in Topic 740 and amends existing guidance to improve consistent application. The standard is effective for fiscal years, and interim periods within those fiscal years, beginning after December 15, 2020, with early adoption permitted. The Company did not early adopt this standard. The adoption of this standard is not expected to have a significant impact on the Company’s financial statements.
Foreign Currency
Assets and liabilities of foreign subsidiaries that use a functional currency other than the U.S. dollar are translated into U.S. dollars at the foreign exchange rates in effect at the end of the period. Revenues and expenses of foreign subsidiaries are translated into U.S. dollars using an average of the foreign exchange rates in effect during the period. Translation adjustments that arise from translating a foreign subsidiary’ssubsidiary's financial statements from the functional currency to the U.S. dollar are reflected in accumulated other comprehensive loss in the consolidated balance sheets.
Lear Corporation and Subsidiaries
Notes to Consolidated Financial Statements (continued)
Transaction gains and losses that arise from foreign exchange rate fluctuations on transactions denominated in a currency other than the functional currency, except certain long-term intercompany transactions, are included in the consolidated statements of income as incurred.
For the years ended December 31, 2020, 20192023, 2022 and 2018,2021, other expense, net includes net foreign currency transaction losses of $19.9$53.0 million, $20.6$30.4 million and $14.4$24.8 million, respectively. For the year ended December 31, 2023, net foreign currency transaction losses include $30.6 million related to the hyper-inflationary environment and significant currency devaluation in Argentina. For the year ended December 31, 2022, net foreign currency transaction losses include $9.6 million related to foreign exchange rate volatility following Russia's invasion of Ukraine.
Stock-Based Compensation
The Company measures stock-based employee compensation expense at fair value in accordance with GAAP and recognizes such expense over the vesting period of the stock-based employee awards.
Net Income Per Share Attributable to Lear
Basic net income per share availableattributable to Lear common stockholders is computed using the two-class method by dividing net income attributable to Lear after deducting the redemption adjustment related to redeemable noncontrolling interest, by the average number of common shares outstanding during the period. Common shares issuable upon the satisfaction of certain conditions pursuant to a contractual agreement are considered common shares outstanding and are included in the computation of basic net income per share availableattributable to Lear common stockholders.Lear.
Diluted net income per share availableattributable to Lear common stockholders is computed using the two-classtreasury stock method by dividing net income attributable to Lear after deducting the redemption adjustment related to redeemable noncontrolling interest, by the average number of common shares outstanding, including the dilutive effect of common stock equivalents computed using the treasury stock method and the average share price during the period.
Lear Corporation and Subsidiaries
Notes to Consolidated Financial Statements (continued)
A summary of information used to compute basic and diluted net income per share availableattributable to Lear common stockholders is shown below (in millions, except share and per share data):
| | | | | | | | | | | | | | | | | |
| For the year ended December 31, | 2020 | | 2019 | | 2018 |
| Net income attributable to Lear | $ | 158.5 | | | $ | 753.6 | | | $ | 1,149.8 | |
| Redeemable noncontrolling interest adjustment | 0 | | | 35.9 | | | (10.4) | |
| Net income available to Lear common stockholders | $ | 158.5 | | | $ | 789.5 | | | $ | 1,139.4 | |
| | | | | |
| Average common shares outstanding | 60,254,380 | | 61,697,192 | | 65,672,164 |
| Dilutive effect of common stock equivalents | 172,582 | | 226,336 | | 489,652 |
| Average diluted shares outstanding | 60,426,962 | | 61,923,528 | | 66,161,816 |
| | | | | |
| Basic net income per share available to Lear common stockholders | $ | 2.63 | | | $ | 12.80 | | | $ | 17.35 | |
| | | | | |
| Diluted net income per share available to Lear common stockholders | $ | 2.62 | | | $ | 12.75 | | | $ | 17.22 | |
For further information related to the redeemable noncontrolling interest adjustment, see Note 6, "Investments in Affiliates and Other Related Party Transactions." | | | | | | | | | | | | | | | | | |
| For the year ended December 31, | 2023 | | 2022 | | 2021 |
| Net income attributable to Lear | $ | 572.5 | | | $ | 327.7 | | | $ | 373.9 | |
| | | | | |
| Average common shares outstanding | 58,830,334 | | 59,674,488 | | 60,082,833 |
| Dilutive effect of common stock equivalents | 286,041 | | 246,041 | | 337,651 |
| Average diluted shares outstanding | 59,116,375 | | 59,920,529 | | 60,420,484 |
| | | | | |
| Basic net income per share attributable to Lear | $ | 9.73 | | | $ | 5.49 | | | $ | 6.22 | |
| | | | | |
| Diluted net income per share attributable to Lear | $ | 9.68 | | | $ | 5.47 | | | $ | 6.19 | |
Product Warranty
Losses from warranty obligations are accrued when it is probable that a liability has been incurred and the related amounts are reasonably estimable.
Segment Reporting
The Company has 2is organized under two reportable operating segments: Seating, which consists of the design, development, engineering and manufacture of complete seat systems seat subsystems and key seat components, and E-Systems, which consists of the design, development, engineering and manufacture of complete electrical distribution and connection systems,systems; high-voltage power distribution products, including battery disconnect units ("BDUs"); and low-voltage power distribution products, electronic systems,controllers and software and connected services. Key componentsother electronic products. Included in the Company's complete seat systemsystems and subsystem solutionscomponents are advancedthermal comfort wellness, safetysystems and sound offerings, as well as configurable seating product technologies, alltechnologies. All of whichthese products are compatible with traditional internal combustion engine ("ICE") architectures and electrified powertrains, including the full range of hybrid, plug-in hybrid and battery electric architectures. Key seat component product offerings include seat trim covers; surface materials such as leather and fabric; seat mechanisms; seat foam; thermal comfort systems such as seat heating, ventilation, active cooling, pneumatic lumbar and massage products; and headrests. Key components inof the Company's electrical distribution and connection systems portfolio include wire harnesses, terminals and connectors, high-voltage battery connection systems and engineered components for both ICEcomponents. High-voltage battery connection systems include intercell connect boards, bus bars and main battery connection
Lear Corporation and Subsidiaries
Notes to Consolidated Financial Statements (continued)
systems. High-voltage power distribution products control the flow and distribution of high-voltage power throughout electrified vehicles and include BDUs which control all electrical energy flowing into and out of high-voltage batteries in electrified vehicles. Low-voltage power distribution products, electronic controllers and other electronic products facilitate signal, data and/or power management within the vehicle architectures that require management of higher voltage and power.include the associated software required to facilitate these functions. Key components inof the Company's other electronic systemsproducts portfolio include zone control modules, body domain control modules and products specific to electrificationlow-voltage and connectivity trends. Electrification products include on-board battery chargers, power conversion modules, high voltage battery management systems and high voltagehigh-voltage power distribution systems. Connectivity products include gateway modules and communication modules to manage both wired and wireless networks and data in vehicles. In addition to electronic modules, the Company offers software that includes cybersecurity, advanced vehicle positioning for automated and autonomous driving applications and full capabilities in both dedicated short-range communication and cellular protocols for vehicle connectivity.modules. The Company's software and connected services offerings include embedded control, cybersecurity software and cloud and mobile device-based software and services.to control hardware devices. The Company's customers traditionally have sourced its electronic hardware together with the software that the Company embeds in it. The other category includes unallocated costs related to corporate headquarters, regional headquarters and the elimination of intercompany activities, none of which meets the requirements for being classified as an operating segment. Corporate and regional headquarters costs include various support functions, such as information technology, advanced research and development, corporate finance, legal, executive administration and human resources.
Each of the Company’sCompany's operating segments reports its results from operations and makes its requests for capital expenditures directly to the chief operating decision maker. The economic performance of each operating segment is driven primarily by automotive production volumes in the geographic regions in which it operates, as well as by the success of the vehicle platforms for which it supplies products. Also, each operating segment operates in the competitive Tier 1 automotive supplier environment and is continually working with its customers to manage costs and improve quality. The Company’sCompany's production processes generally make use of hourly labor, dedicated facilities, sequential manufacturing and assembly processes and commodity raw materials.
The Company evaluates the performance of its operating segments based primarily on (i) revenues from external customers, (ii) pretax income before equity in net income of affiliates, interest expense, net and other expense, net ("segment earnings") and (iii) cash flows, being defined as segment earnings less capital expenditures plus depreciation and amortization.
Lear Corporation and Subsidiaries
Notes to Consolidated Financial Statements (continued)
The accounting policies of the Company’sCompany's operating segments are the same as those described in this note to the consolidated financial statements.
Derivative Instruments and Hedge Activities
The Company has used derivative financial instruments, including forwards, futures, options, swaps and other derivative contracts, to reduce the effects of fluctuations in foreign exchange rates and interest rates and the resulting variability of the Company’sCompany's operating results. The Company is not a party to leveraged derivatives. The Company’sCompany's derivative financial instruments are subject to master netting arrangements that provide for the net settlement of contracts, by counterparty, in the event of default or termination. On the date that a derivative contract for a hedge instrument is entered into, the Company designates the derivative as either (1) a hedge of the exposure to changes in the fair value of a recognized asset or liability or of an unrecognized firm commitment (a fair value hedge), (2) a hedge of the exposure of a forecasted transaction or of the variability in the cash flows of a recognized asset or liability (a cash flow hedge), (3) a hedge of a net investment in a foreign operation (a net investment hedge) or (4) a contract not designated as a hedge instrument.
For a fair value hedge, the change in the fair value of the derivative is recorded in earnings and reflected in the consolidated statements of income on the same line as the gain or loss on the hedged item attributable to the hedged risk. For a cash flow hedge, the change in the fair value of the derivative is recorded in accumulated other comprehensive loss in the consolidated balance sheets. When the underlying hedged transaction is realized, the gain or loss included in accumulated other comprehensive loss is recorded in earnings and reflected in the consolidated statements of income on the same line as the gain or loss on the hedged item attributable to the hedged risk. For a net investment hedge, the change in the fair value of the derivative is recorded in cumulative translation adjustment, which is a component of accumulated other comprehensive loss in the consolidated balance sheets. When the related currency translation adjustment is required to be reclassified, usually upon the sale or liquidation of the investment, the gain or loss included in accumulated other comprehensive loss is recorded in earnings and reflected in other expense, net in the consolidated statements of income. Changes in the fair value of contracts not designated as hedge instruments are recorded in earnings and reflected in other expense, net in the consolidated statements of income. Cash flows attributable to derivatives used to manage foreign currency risks are classified on the same line as the hedged item attributable to the hedged risk in the consolidated statements of cash flows. Upon settlement, cash flows attributable to derivatives designated as net investment hedges are classified as investing activities in the consolidated statements of cash flows. Cash flows attributable to forward starting interest rate swaps are classified as financing activities in the consolidated statements of cash flows.
The Company formally documents its hedge relationships, including the identification of the hedge instruments and the related hedged items, as well as its risk management objectives and strategies for undertaking the hedge transaction. Derivatives are recorded at fair value in other current and long-term assets and other current and long-term liabilities in the consolidated
Lear Corporation and Subsidiaries
Notes to Consolidated Financial Statements (continued)
balance sheets. The Company also formally assesses whether a derivative used in a hedge transaction is highly effective in offsetting changes in either the fair value or the cash flows of the hedged item. When it is determined that a hedged transaction is no longer probable to occur, the Company discontinues hedge accounting.
On January 1, 2018, the Company early adopted ASU 2017-12, "Targeted Improvements to Accounting for Hedging Activities." The new standard eliminates the requirement to separately measure and report hedge ineffectiveness, due to a difference between the economic terms of the hedge instrument and the underlying transaction, and generally requires, for qualifying hedges, the entire change in the fair value of a hedge instrument to be presented in the same line as the hedged item in the consolidated statements of income. The standard also modifies the accounting for components excluded from the assessment of hedge effectiveness and simplifies the application of hedge accounting in certain situations. The provisions of the standard were applied on a modified retrospective basis, and the effects of adoption were not significant.
Use of Estimates
The preparation of the consolidated financial statements in conformity with GAAP requires management to make estimates and assumptions that affect the reported amounts of assets and liabilities as of the date of the consolidated financial statements and the reported amounts of revenues and expenses during the reporting period. During 2020,2023, there were no material changes in the methods or policies used to establish estimates and assumptions. Other matters subject to estimation and judgment include amounts related to accounts receivable realization, inventory obsolescence, asset impairments, useful lives of fixed and intangible assets and unsettled pricing negotiations with customers and suppliers (Note 3, "Summary of Significant Accounting Policies");, acquisitions (Note 4, "Acquisition""Acquisitions");, restructuring accruals (Note 5, "Restructuring");, deferred tax asset valuation allowances and income taxes (Note 9, "Income Taxes");, pension and other postretirement benefit plan assumptions (Note 10, "Pension and Other Postretirement Benefit Plans"); and accruals related to litigation,legal, warranty and environmental remediation costsmatters (Note 14, "Commitments"Legal and Other Contingencies"); and self-insurance accruals.. Actual results may differ significantly from the Company’sCompany's estimates.
(4) Acquisitions
I.G. Bauerhin
On April 26, 2023, the Company completed the acquisition of IGB, a privately held supplier of automotive seat heating, ventilation and active cooling, steering wheel heating, seat sensors and electronic control modules, headquartered in Grundau-Rothenbergen, Germany. IGB has more than 4,600 employees at nine manufacturing plants in seven countries with annual sales of approximately $290 million. The acquisition of IGB furthers the Company's comprehensive strategy to develop and integrate a complete portfolio of thermal comfort systems for automotive seating.
The acquisition of IGB was accounted for as a business combination, and accordingly, the assets acquired and liabilities assumed are included in the accompanying consolidated balance sheet as of December 31, 2023. The operating results and cash flows of IGB are included in the accompanying consolidated financial statements from the date of acquisition in the Company's Seating segment.
The preliminary purchase price and related allocation are shown below (in millions):
| | | | | | | | | | | | | | | | | | | | |
| | July 1,
2023 | | Adjustments | | December 31,
2023 |
| Preliminary purchase price, net of acquired cash | | $ | 174.5 | | | $ | — | | | $ | 174.5 | |
| | | | | | |
| Property, plant and equipment | | 49.7 | | | (2.2) | | | 47.5 | |
| Other assets purchased and liabilities assumed, net | | 37.9 | | | 0.2 | | | 38.1 | |
| Goodwill | | 69.9 | | | 3.6 | | | 73.5 | |
| Intangible assets | | 17.0 | | | (1.6) | | | 15.4 |
| Preliminary purchase price allocation | | $ | 174.5 | | | $ | — | | | $ | 174.5 | |
Goodwill recognized is primarily attributable to the assembled workforce and expected synergies related to future growth.
Intangible assets consist of amounts recognized for the fair value of developed technology and customer-based assets which were both based on an independent appraisal. Developed technology assets have a weighted average useful life of approximately nine years. Customer-based assets include IGB's established relationships with its customers and the ability of these customers to generate future economic profits for the Company and have a weighted average useful life of approximately thirteen years.
The purchase price and related allocation are preliminary and may be revised as a result of further adjustments made to the purchase price and additional information obtained regarding assets acquired and liabilities assumed, including, but not limited to, certain tax attributes and contingent liabilities.
For the years ended December 31, 2023 and 2022, the Company incurred transaction costs of $0.5 million and $1.2 million, respectively, which were expensed as incurred and are recorded in selling, general and administrative expenses in the accompanying consolidated statements of income.
Lear Corporation and Subsidiaries
Notes to Consolidated Financial Statements (continued)
(4) AcquisitionThe pro-forma effects of this acquisition do not materially impact the Company's reported results for any period presented.
For further information related to acquired assets measured at fair value, see Note 16, "Financial Instruments."
Kongsberg ICS
On April 17, 2019,February 28, 2022, the Company completed the acquisition of Xevo, a Seattle-based, global leaderKongsberg ICS. Kongsberg ICS specializes in connected car software, by acquiring allthermal comfort systems, including seat massage, lumbar, heat and ventilation products, with annual sales of Xevo's outstanding shares for $321.7approximately $300 million, net of cash acquired. Xevo is a supplier of software solutions for the cloud, vehicles and mobile devices thatwhich approximately 20% are deployed in millions of vehicles worldwide.intercompany.
The acquisition of Xevo has beenKongsberg ICS was accounted for as a business combination, and accordingly, the assets acquired and liabilities assumed are included in the accompanying consolidated balancesbalance sheets as of December 31, 20202023 and 2019.2022. The operating results and cash flows of XevoKongsberg ICS are included in the accompanying consolidated financial statements from the date of acquisition and in the Company's E-SystemsSeating segment.
The final purchase price and related allocation are shown below (in millions):
| | | | | | | | |
| | December 31,
2023 |
| Purchase price, net of acquired cash | | $ | 188.3 | |
| | |
| Property, plant and equipment | | 124.1 | |
| Other assets purchased and liabilities assumed, net | | 25.2 | |
| Goodwill | | 27.9 | |
| Intangible assets | | 11.1 |
| Purchase price allocation | | $ | 188.3 | |
Goodwill recognized is primarily attributable to the assembled workforce and expected synergies related to future growth.
Intangible assets consist of amounts recognized for the fair value of developed technology based on an independent appraisal. Developed technology assets have a weighted average useful life of approximately seventeen years.
For the year ended December 31, 2022, the Company incurred transaction costs of $1.6$10.0 million, which were expensed as incurred and are recorded in selling, general and administrative expenses in the accompanying consolidated statement of income for the year ended December 31, 2019.
The purchase price and allocation are shown below (in millions):
| | | | | | | | | | | |
| December 31,
2019 | Adjustments | December 31,
2020 |
| Net purchase price | $ | 321.7 | | $ | 0 | | $ | 321.7 | |
| | | |
| Other assets purchased and liabilities assumed, net | $ | 9.5 | | $ | 2.6 | | $ | 12.1 | |
| Goodwill | 219.0 | | 0.5 | | 219.5 | |
| Intangible assets | 93.2 | | (3.1) | | 90.1 | |
| Purchase price allocation | $ | 321.7 | | $ | 0 | | $ | 321.7 | |
Goodwill recognized in this transaction is primarily attributable to expected synergies related to future growth and commercialization opportunities and is not deductible for tax purposes.
Intangible assets consist primarily of amounts recognized for the fair value of licensing agreements and developed technology and are based on independent appraisals. Licensing agreements represent the fair values of the underlying licensing agreements with Xevo customers with estimated useful lives of approximately five years. Developed technology represents the fair value of Xevo's technology with an estimated useful life of approximately five years.income.
The pro-forma effects of this acquisition do not materially impact the Company's reported results for any period presented.
For further information related to acquired assets measured at fair value, see Note 16, "Financial Instruments."
(5) Restructuring
2020
In 2020, the CompanyCharges recorded charges of $144.9 million in connection with itsthe Company's restructuring actions. Theseactions are shown below (in millions):
| | | | | | | | | | | | | | | | | |
| For the year ended December 31, | 2023 | | 2022 | | 2021 |
| Employee termination benefits | $ | 119.2 | | | $ | 121.9 | | | $ | 85.1 | |
| Asset impairments | | | | | |
| Property, plant and equipment | 5.1 | | | 9.9 | | | 4.2 | |
| Right-of-use assets | 10.9 | | | 6.5 | | | 7.2 | |
| Contract termination costs | 5.7 | | | 4.5 | | | 0.3 | |
| Other related net costs | (8.2) | | | 11.4 | | | 4.1 | |
| $ | 132.7 | | | $ | 154.2 | | | $ | 100.9 | |
Lear Corporation and Subsidiaries
Notes to Consolidated Financial Statements (continued)
Restructuring charges consist of $122.3 million recorded as cost of sales, $16.4 million recorded as selling, general and administrative expenses and $6.2 million recorded as other expense. The restructuringby income statement account are shown below (in millions):
| | | | | | | | | | | | | | | | | |
| For the year ended December 31, | 2023 | | 2022 | | 2021 |
| Cost of sales | $ | 130.2 | | | $ | 129.7 | | | $ | 75.6 | |
| Selling, general and administrative expenses | 20.7 | | | 24.5 | | | 32.0 | |
| Other (income) expense, net | (18.2) | | | — | | | (6.7) | |
| $ | 132.7 | | | $ | 154.2 | | | $ | 100.9 | |
Restructuring charges consist of employee termination costs of $104.2 million, asset impairment charges of $23.3 million, contract termination costs of $2.0 million and pension benefit plan settlement losses of $12.9 million, as well as other related costs of $2.5 million. Asset impairment charges relate to the disposal of buildings, leasehold improvements and/or machinery and equipment with carrying values of $21.3 million in excess of related estimated fair values and the impairment of right-of-use-assets of $2.0 million.by operating segment are shown below (in millions):
| | | | | | | | | | | | | | | | | |
| For the year ended December 31, | 2023 | | 2022 | | 2021 |
| Seating | $ | 99.5 | | | $ | 65.3 | | | $ | 45.7 | |
| E-Systems | 30.5 | | | 82.8 | | | 47.7 | |
| Other | 2.7 | | | 6.1 | | | 7.5 | |
| $ | 132.7 | | | $ | 154.2 | | | $ | 100.9 | |
The Company expects to incur approximately $18$62 million and approximately $14 million of additional restructuring costs in its Seating and E-Systems segments, respectively, related to activities initiated as of December 31, 2020,2023, and expects that the components of such costs will be consistent with its historical experience. Any future
A summary of the changes in the Company's restructuring actions will depend upon market conditions, customer actionsreserves is shown below (in millions):
| | | | | | | | | | | |
| 2023 | | 2022 |
| Balance as of January 1, | $ | 82.9 | | | $ | 129.4 | |
| Provision for employee termination benefits | 119.2 | | | 121.9 | |
| Payments, utilizations and foreign currency | (80.5) | | | (168.4) | |
| Balance as of December 31, | $ | 121.6 | | | $ | 82.9 | |
(6) Investments in Affiliates and other factors.Other Related Party Transactions
| | | | | | | | | | | | | | | | | |
| December 31, | 2023 | | 2022 | | 2021 |
| Beijing BHAP Lear Automotive Systems Co., Ltd. (China) | 50% | | 50% | | 50% |
| Guangzhou Lear Automotive Components Co., Ltd. (China) | 50 | | 50 | | 50 |
| Jiangxi Jiangling Lear Interior Systems Co., Ltd. (China) | 50 | | 50 | | 50 |
| Lear Dongfeng Automotive Seating Co., Ltd. (China) | 50 | | 50 | | 50 |
| Beijing Lear Hyundai Transys Co., Ltd. (China) | 50 | | 50 | | 40 |
| Changchun Lear FAWSN Automotive Seat Systems Co., Ltd. (China) | 49 | | 49 | | 49 |
| Honduras Electrical Distribution Systems S. de R.L. de C.V. (Honduras) | 49 | | 49 | | 49 |
| Kyungshin-Lear Sales and Engineering LLC | 49 | | 49 | | 49 |
| Shenyang Jinbei Lear Automotive Seating Co. Ltd. (China) | 49 | | 49 | | 49 |
| Shenzhen Shinry Lear Electric Control Technology Co., Ltd. (China) | 49 | | 49 | | — |
| Hyundai Transys Lear Automotive Private Limited (India) | 35 | | 35 | | 35 |
| Techstars Corporate Partner 2017 LLC | 34 | | 34 | | 34 |
| RevoLaze, LLC | 20 | | 20 | | 20 |
| Maniv Mobility II A, L.P. | 7 | | 7 | | 7 |
| Trucks Venture Fund 2, L.P. | 7 | | 7 | | 5 |
| Autotech Fund II, L.P. | 3 | | 3 | | 4 |
| | | | | |
| | | | | |
| | | | | |
| | | | | |
Lear Corporation and Subsidiaries
Notes to Consolidated Financial Statements (continued)
A summary of 2020 activity, excluding the pension benefit plan settlement losses of $12.9 million, is shown below (in millions):
| | | | | | | | | | | | | | | | | | | | | | | | | | | | | |
| Accrual as of | | 2020 | | Utilization | | Accrual as of |
| January 1, 2020 | | Charges | | Cash | | Non-cash | | December 31, 2020 |
| Employee termination benefits | $ | 152.8 | | | $ | 104.2 | | | $ | (122.2) | | | $ | 0 | | | $ | 134.8 | |
| Asset impairments | 0 | | | 23.3 | | | 0 | | | (23.3) | | | 0 | |
| Contract termination costs | 4.9 | | | 2.0 | | | (2.7) | | | 0 | | | 4.2 | |
| Other related costs | 0 | | | 2.5 | | | (2.5) | | | 0 | | | 0 | |
| Total | $ | 157.7 | | | $ | 132.0 | | | $ | (127.4) | | | $ | (23.3) | | | $ | 139.0 | |
2019
In 2019, the Company recorded charges of $183.6 million in connection with its restructuring actions. These charges consist of $173.8 million recorded as cost of sales, $16.4 million recorded as selling, general and administrative expenses and $6.6 million recorded as other income.. The restructuring charges consist of employee termination costs of $167.8 million, asset impairment charges of $9.5 million, contract termination costs of $3.0 million and an other postretirement curtailment gain of $10.6 million, as well as other related costs of $13.9 million. Asset impairment charges relate to the disposal of buildings, leasehold improvements and/or machinery and equipment with carrying values of $8.7 million in excess of related estimated fair values and the impairment of right-of-use assets of $0.8 million.
A summary of 2019 activity, excluding the other postretirement curtailment gain of $10.6 million, is shown below (in millions):
| | | | | | | | | | | | | | | | | | | | | | | | | | | | | |
| Accrual as of | | 2019 | | Utilization | | Accrual as of |
| January 1, 2019 | | Charges | | Cash | | Non-cash | | December 31, 2019 |
| Employee termination benefits | $ | 103.3 | | | $ | 167.8 | | | $ | (118.3) | | | $ | 0 | | | $ | 152.8 | |
| Asset impairments | 0 | | | 9.5 | | | 0 | | | (9.5) | | | 0 | |
| Contract termination costs | 5.4 | | | 3.0 | | | (3.5) | | | 0 | | | 4.9 | |
| Other related costs | 0 | | | 13.9 | | | (13.9) | | | 0 | | | 0 | |
| Total | $ | 108.7 | | | $ | 194.2 | | | $ | (135.7) | | | $ | (9.5) | | | $ | 157.7 | |
2018
In 2018, the Company recorded charges of $88.0 million in connection with its restructuring actions. These charges consist of $63.7 million recorded as cost of sales, $24.0 million recorded as selling, general and administrative expenses and $0.3 million recorded as other expense. The restructuring charges consist of employee termination costs of $74.5 million, asset impairment charges of $4.7 million and contract termination costs of $1.5 million, as well as other related costs of $7.3 million. Asset impairment charges relate to the disposal of buildings, leasehold improvements and/or machinery and equipment with carrying values of $4.7 million in excess of related estimated fair values.
A summary of 2018 activity is shown below (in millions):
| | | | | | | | | | | | | | | | | | | | | | | | | | | | | |
| Accrual as of | | 2018 | | Utilization | | Accrual as of |
| January 1, 2018 | | Charges | | Cash | | Non-cash | | December 31, 2018 |
| Employee termination benefits | $ | 93.0 | | | $ | 74.5 | | | $ | (64.2) | | | $ | 0 | | | $ | 103.3 | |
| Asset impairments | 0 | | | 4.7 | | | 0 | | | (4.7) | | | 0 | |
| Contract termination costs | 5.0 | | | 1.5 | | | (1.1) | | | 0 | | | 5.4 | |
| Other related costs | 0 | | | 7.3 | | | (7.3) | | | 0 | | | 0 | |
| Total | $ | 98.0 | | | $ | 88.0 | | | $ | (72.6) | | | $ | (4.7) | | | $ | 108.7 | |
Lear Corporation and Subsidiaries
Notes to Consolidated Financial Statements (continued)
(6) Investments in Affiliates and Other Related Party Transactions
The Company’s beneficial ownership in affiliates accounted for under the equity method is shown below:
| | | | | | | | | | | | | | | | | |
| December 31, | 2020 | | 2019 | | 2018 |
| Beijing BHAP Lear Automotive Systems Co., Ltd. (China) | 50% | | 50% | | 50% |
| Jiangxi Jiangling Lear Interior Systems Co., Ltd. (China) | 50 | | 50 | | 50 |
| Lear Dongfeng Automotive Seating Co., Ltd. (China) | 50 | | 50 | | 50 |
| Guangzhou Lear Automotive Components Co., Ltd. (China) | 50 | | 50 | | 0 |
| Changchun Lear FAWSN Automotive Seat Systems Co., Ltd. (China) | 49 | | 49 | | 49 |
| Honduras Electrical Distribution Systems S. de R.L. de C.V. (Honduras) | 49 | | 49 | | 49 |
| Kyungshin-Lear Sales and Engineering LLC | 49 | | 49 | | 49 |
| Beijing Lear Hyundai Transys Co., Ltd. (China) | 40 | | 40 | | 40 |
| Hyundai Transys Lear Automotive Private Limited (India) | 35 | | 35 | | 35 |
| Techstars Corporate Partner 2017 LLC | 34 | | 38 | | 0 |
| RevoLaze, LLC | 20 | | 20 | | 20 |
| Maniv Mobility II A, L.P. | 9 | | 8 | | 0 |
| Autotech Fund II, L.P. | 4 | | 6 | | 0 |
| Trucks Venture Fund 2, L.P. | 3 | | 4 | | 0 |
| Dong Kwang Lear Yuhan Hoesa (Korea) | 0 | | 0 | | 50 |
| | | | | |
| | | | | |
| | | | | |
| | | | | |
Summarized group financial information for affiliates accounted for under the equity method as of December 31, 20202023 and 2019,2022, and for the years ended December 31, 2020, 20192023, 2022 and 2018,2021, is shown below (unaudited; in millions):
| | December 31, | December 31, | 2020 | | 2019 | December 31, | 2023 | | 2022 |
| Balance sheet data: | Balance sheet data: | |
| Current assets | Current assets | $ | 1,136.3 | | | $ | 856.3 | |
| Current assets | |
| Current assets | |
| Non-current assets | Non-current assets | 194.4 | | | 173.9 | |
| Current liabilities | Current liabilities | 901.7 | | | 739.5 | |
| Non-current liabilities | Non-current liabilities | 6.2 | | | 6.6 | |
| | For the year ended December 31, | For the year ended December 31, | 2020 | | 2019 | | 2018 | For the year ended December 31, | 2023 | | 2022 | | 2021 |
| Income statement data: | Income statement data: | |
| Net sales | Net sales | $ | 1,597.5 | | | $ | 1,670.0 | | | $ | 1,520.2 | |
| Net sales | |
| Net sales | |
| Gross profit | Gross profit | 83.0 | | | 89.2 | | | 75.9 | |
| Income before provision for income taxes | Income before provision for income taxes | 73.8 | | | 85.7 | | | 60.0 | |
| Net income attributable to affiliates | Net income attributable to affiliates | 44.8 | | | 53.5 | | | 42.2 | |
A summary of amounts recorded in the Company's consolidated balance sheets related to its affiliates is shown below (in millions):
| | | | | | | | | | | |
| December 31, | 2020 | | 2019 |
| Aggregate investment in affiliates | $ | 142.9 | | | $ | 119.5 | |
| Receivables due from affiliates (including notes and advances) | 142.0 | | | 170.5 | |
| Payables due to affiliates | 1.6 | | | 0.1 | |
Lear Corporation and Subsidiaries
Notes to Consolidated Financial Statements (continued)
| | | | | | | | | | | |
| December 31, | 2023 | | 2022 |
| Aggregate investment in affiliates | $ | 217.1 | | | $ | 196.7 | |
| Receivables due from affiliates (including notes and advances) | 170.7 | | | 182.5 | |
| Payables due to affiliates | 0.5 | | | 0.7 | |
A summary of transactions with affiliates accounted for under the equity method and other related parties is shown below (in millions):
| | For the year ended December 31, | For the year ended December 31, | 2020 | | 2019 | | 2018 | For the year ended December 31, | 2023 | | 2022 | | 2021 |
| Sales to affiliates | Sales to affiliates | $ | 656.4 | | | $ | 647.2 | | | $ | 603.0 | |
| Purchases from affiliates | Purchases from affiliates | 1.9 | | | 1.6 | | | 2.0 | |
| Management and other fees for services provided to affiliates | Management and other fees for services provided to affiliates | 28.3 | | | 35.5 | | | 29.6 | |
| Dividends received from affiliates | Dividends received from affiliates | 24.6 | | | 23.3 | | | 39.0 | |
The Company has certain investments with beneficial ownership interests of less than 20% that are accounted for under the equity method as the Company’sCompany's beneficial ownership interests in these entities are similar to partnership interests.
20192021
In 2019,2021, the Company deconsolidated Guangzhou Automobile Group Componentacquired a 49% interest in Shenyang Jinbei Lear Automotive Seating Co., Ltd. ("GACC"Shenyang Jinbei") as it no longer controls this entity. As a result,for $41.3 million. The investment is accounted for under the carrying values of the assets and liabilities of GACC are not reflected in the consolidated balance sheetequity method as of December 31, 2019. In addition, the Company recorded a gaindoes not control Shenyang Jinbei but does have the ability to exercise significant influence over certain operating and financial policies of $4.0 million related to the excess of the estimated fair value over the carrying value of its interestShenyang Jinbei. The acquisition cost is classified within cash flows used in GACC immediately prior to deconsolidation. The gain is included in other expense, netinvesting activities in the accompanying consolidated statement of incomecash flows for the year ended December 31, 2019.
2018
In 2018, the Company gained control of Changchun Lear FAWSN Automotive Electrical and Electronics Co., Ltd. ("Lear FAWSN") by acquiring an additional 20% interest from a joint venture partner and by amending the joint venture agreement to eliminate the substantive participating rights of the remaining joint venture partner. Prior to the amendment, Lear FAWSN was accounted for under the equity method.
This transaction was accounted for as a business combination, and accordingly, the assets acquired and liabilities assumed are included in the accompanying consolidated balance sheet as of December 31, 2018. The operating results and cash flows of Lear FAWSN are included in the accompanying consolidated financial statements from the effective date of the amended joint venture agreement and are reflected in the Company’s E-Systems segment.
A summary of the fair value of the assets acquired and liabilities assumed in conjunction with the transaction is shown below (in millions):
| | | | | |
Property, plant and equipment | $ | 11.0 | |
Other assets and liabilities assumed, net | 5.7 | |
Goodwill | 22.4 | |
Intangible assets | 7.5 | |
| $ | 46.6 | |
Recognized goodwill is attributable to the assembled workforce, expected synergies and other intangible assets that do not qualify for separate recognition.
Intangible assets consist of amounts recognized for the fair value of customer-based assets and were based on an independent appraisal. Customer-based assets include Lear FAWSN's established relationships with its customers and the ability of these customers to generate future economic profits for the Company. It is currently estimated that these intangible assets have a weighted average useful life of approximately ten years.
As of the effective date of the transaction, the fair value of the Company’s previously held equity interest in Lear FAWSN was $23.0 million, and the fair value of the noncontrolling interest in Lear FAWSN was $14.0 million. As a result of valuing the Company’s previously held equity interest in Lear FAWSN at fair value, the Company recognized a gain of $10.0 million, which is included in other expense, net in the accompanying consolidated statement of income for the year ended December 31, 2018.
The pro forma effects of this consolidation would not materially impact the Company’s reported results for any period presented.2021.
For further information related to acquired assets measured at fair value, see Note 16, "Financial Instruments."
Lear Corporation and Subsidiaries
Notes to Consolidated Financial Statements (continued)
(7) Debt
Short-Term Borrowings
The Company utilizes uncommitted lines of credit as needed for its short-term working capital fluctuations. As of December 31, 20202023 and 2019,2022, the Company had lines of credit from banks totaling $94.3$337.7 million and $94.6$298.2 million, respectively.
As of December 31, 2020, the Company had 0 short-term debt balances outstanding related to draws on the lines of credit. As of December 31, 2019,2023 and 2022, the Company had short-term debt balances outstanding related to draws on theits lines of credit of $19.2 million.$27.5 million and $9.9 million, respectively.
Lear Corporation and Subsidiaries
Notes to Consolidated Financial Statements (continued)
Long-Term Debt
A summary of long-term debt, net of unamortized debt issuance costs and unamortized original issue premium (discount) and the related weighted average interest rates is shown below (in millions):
| | December 31, | December 31, | 2020 | December 31, | 2023 |
| Debt Instrument | Debt Instrument | Long-Term Debt | | Unamortized Debt Issuance Costs | | Unamortized Original Issue Premium (Discount) | | Long-Term
Debt, Net | | Weighted
Average
Interest
Rate | Debt Instrument | Long-Term Debt | | Unamortized Debt Issuance Costs | | Unamortized Original Issue Premium (Discount) | | Long-Term
Debt, Net | | Weighted
Average
Interest
Rate |
| Credit Agreement — Term Loan Facility | $ | 220.3 | | | $ | (0.6) | | | $ | 0 | | | $ | 219.7 | | | 1.36% |
| Delayed-Draw Term Loan Facility (the "Term Loan") | | Delayed-Draw Term Loan Facility (the "Term Loan") | $ | 150.0 | | | $ | (0.5) | | | $ | — | | | $ | 149.5 | | | 6.575% |
| 3.8% Senior Notes due 2027 (the "2027 Notes") | 3.8% Senior Notes due 2027 (the "2027 Notes") | 750.0 | | | (4.1) | | | (3.5) | | | 742.4 | | | 3.885% | 3.8% Senior Notes due 2027 (the "2027 Notes") | 550.0 | | | (1.6) | | (1.6) | | | (1.4) | | (1.4) | | | 547.0 | | 547.0 | | | 3.885% | | 3.885% |
| 4.25% Senior Notes due 2029 (the "2029 Notes") | 4.25% Senior Notes due 2029 (the "2029 Notes") | 375.0 | | | (2.6) | | | (1.0) | | | 371.4 | | | 4.288% | 4.25% Senior Notes due 2029 (the "2029 Notes") | 375.0 | | | (1.7) | | (1.7) | | | (0.6) | | (0.6) | | | 372.7 | | 372.7 | | | 4.288% | | 4.288% |
| 3.5% Senior Notes due 2030 (the "2030 Notes") | 3.5% Senior Notes due 2030 (the "2030 Notes") | 350.0 | | | (2.6) | | | (0.7) | | | 346.7 | | | 3.525% | 3.5% Senior Notes due 2030 (the "2030 Notes") | 350.0 | | | (1.8) | | (1.8) | | | (0.5) | | (0.5) | | | 347.7 | | 347.7 | | | 3.525% | | 3.525% |
| 2.6% Senior Notes due 2032 (the "2032 Notes") | | 2.6% Senior Notes due 2032 (the "2032 Notes") | 350.0 | | | (2.5) | | | (0.7) | | | 346.8 | | | 2.624% |
| 5.25% Senior Notes due 2049 (the "2049 Notes") | 5.25% Senior Notes due 2049 (the "2049 Notes") | 625.0 | | | (6.3) | | | 14.2 | | | 632.9 | | | 5.103% | 5.25% Senior Notes due 2049 (the "2049 Notes") | 625.0 | | | (5.6) | | (5.6) | | | 12.6 | | 12.6 | | | 632.0 | | 632.0 | | | 5.103% | | 5.103% |
| 3.55% Senior Notes due 2052 (the "2052 Notes") | | 3.55% Senior Notes due 2052 (the "2052 Notes") | 350.0 | | | (3.7) | | | (0.4) | | | 345.9 | | | 3.558% |
| Other | Other | 1.4 | | | — | | | — | | | 1.4 | | | N/A | Other | 1.3 | | | — | | — | | | — | | — | | | 1.3 | | 1.3 | | | N/A | | N/A |
| $ | 2,321.7 | | | $ | (16.2) | | | $ | 9.0 | | | 2,314.5 | | |
| $ | |
| Less — Current portion | |
| Less — Current portion | |
| Less — Current portion | Less — Current portion | | | (14.2) | | |
| Long-term debt | Long-term debt | | $ | 2,300.3 | | |
| Long-term debt | |
| Long-term debt | |
| | December 31, | December 31, | 2019 | December 31, | 2022 |
| Debt Instrument | Debt Instrument | Long-Term Debt | | Unamortized Debt Issuance Costs | | Unamortized Original Issue Discount | | Long-Term
Debt, Net | | Weighted
Average
Interest
Rate | Debt Instrument | Long-Term Debt | | Unamortized Debt Issuance Costs | | Unamortized Original Issue Premium (Discount) | | Long-Term
Debt, Net | | Weighted
Average
Interest
Rate |
| Credit Agreement — Term Loan Facility | $ | 234.4 | | | $ | (1.0) | | | $ | 0 | | | $ | 233.4 | | | 2.880% |
| 5.25% Senior Notes due 2025 (the "2025 Notes") | 650.0 | | | (4.2) | | | 0 | | | 645.8 | | | 5.250% |
| 2027 Notes | 2027 Notes | 750.0 | | | (4.7) | | | (4.1) | | | 741.2 | | | 3.885% | 2027 Notes | $ | 550.0 | | | $ | | $ | (2.1) | | | $ | | $ | (1.8) | | | $ | | $ | 546.1 | | | 3.885% | | 3.885% |
| 2029 Notes | 2029 Notes | 375.0 | | | (2.9) | | | (1.1) | | | 371.0 | | | 4.288% | 2029 Notes | 375.0 | | | (2.0) | | (2.0) | | | (0.7) | | (0.7) | | | 372.3 | | 372.3 | | | 4.288% | | 4.288% |
| 2030 Notes | | 2030 Notes | 350.0 | | | (2.0) | | | (0.6) | | | 347.4 | | | 3.525% |
| 2032 Notes | | 2032 Notes | 350.0 | | | (2.8) | | | (0.7) | | | 346.5 | | | 2.624% |
| 2049 Notes | 2049 Notes | 325.0 | | | (3.3) | | | (5.3) | | | 316.4 | | | 5.363% | 2049 Notes | 625.0 | | | (6.0) | | (6.0) | | | 13.2 | | 13.2 | | | 632.2 | | 632.2 | | | 5.103% | | 5.103% |
| $ | 2,334.4 | | | $ | (16.1) | | | $ | (10.5) | | | 2,307.8 | | |
| 2052 Notes | | 2052 Notes | 350.0 | | | (3.8) | | | (0.5) | | | 345.7 | | | 3.558% |
| Other | | Other | 11.8 | | | — | | | — | | | 11.8 | | | N/A |
| $ | |
| Less — Current portion | |
| Less — Current portion | |
| Less — Current portion | Less — Current portion | | | (14.1) | | |
| Long-term debt | Long-term debt | | $ | 2,293.7 | | |
| Long-term debt | |
| Long-term debt | |
Senior Notes
The issuance, maturity and interest payment dates of the Company's senior unsecured 2027 Notes, 2029 Notes, 2030 Notes, 2032 Notes, 2049 Notes and 20492052 Notes (collectively, the "Notes") are as shown below:
| | | | | | | | | | | | | | | | | | | | |
| Note | | Issuance Date | | Maturity Date | | Interest Payment Dates |
| 2027 Notes | | August 2017 | | September 15, 2027 | | March 15 and September 15 |
| 2029 Notes | | May 2019 | | May 15, 2029 | | May 15 and November 15 |
| 2030 Notes | | February 2020 | | May 30, 2030 | | May 30 and November 30 |
| 2032 Notes | | November 2021 | | January 15, 2032 | | January 15 and July 15 |
| 2049 Notes | | May 2019 and February 2020 | | May 15, 2049 | | May 15 and November 15 |
| 2052 Notes | | November 2021 | | January 15, 2052 | | January 15 and July 15 |
Lear Corporation and Subsidiaries
Notes to Consolidated Financial Statements (continued)
2027 Notes Issued in 2017
In 2017, the Company issued $750.0$750 million in aggregate principal amount at maturity of 2027 Notes at a stated coupon rate of 3.8%. The 2027 Notes were issued at 99.294% of par, resulting in a yield to maturity of 3.885%.
The net proceeds from the offering of $744.7 million, after original issue discount, were used to redeem the outstanding $500.0$500 million in aggregate principal amount of the senior unsecured notes due 2023 at a redemption price equal to 100% of the principal amount thereof, plus a "make-whole" premium of $17.0 million, as well as to refinance a portion of the Company's $500.0$500 million prior term loan facility (see "— Credit Agreement" below).facility.
In November 2021, the Company paid $221.5 million for the purchase of $200 million in aggregate principal amount of the 2027 Notes, including an early tender premium of $21.0 million and related fees of $0.5 million. In connection with this transaction, the Company recognized a loss of $23.9 million on the extinguishment of debt.
Prior to June 15, 2027, the Company, at its option, may redeem some or all of the 2027 Notes, in whole or in part, at a redemption price equal to 100% of the principal amount thereof, plus a "make-whole" premium as of, and accrued and unpaid interest to, the redemption date. At any time onOn or after June 15, 2027, but prior to the maturity date of September 15, 2027, the Company, at its option, may redeem some or all of the 2027 Notes, in whole or in part, at a redemption price equal to 100% of the principal amount thereof, plus accrued and unpaid interest to the redemption date.
2029 and 2049 Notes Issued in 2019
In 2019, the Company issued $375.0$375 million in aggregate principal amount at maturity of 2029 Notes and $325.0$325 million in aggregate principal amount at maturity of 2049 Notes. The 2029 Notes have a stated coupon rate of 4.25% and were issued at 99.691% of par, resulting in a yield to maturity of 4.288%. The 2049 Notes have a stated coupon rate of 5.25% and were issued at 98.32% of par, resulting in a yield to maturity of 5.363%.
The net proceeds from the offering wereof $693.3 million, after original issue discount. The proceedsdiscount, were used to redeem the $325.0$325 million in aggregate principal amount of the5.375% senior notes due 2024 Notes(the "2024 Notes") at a redemption price equal to 102.688% of the principal amount of such 2024 Notes, plus accrued interest, as well as to finance the acquisition of Xevo (Note 4, "Acquisition") and for general corporate purposes.
In connection with these transactions,Prior to February 15, 2029, the Company, recognizedat its option, may redeem the 2029 Notes, in whole or in part, at a lossredemption price equal to 100% of $10.6 millionthe principal amount thereof, plus the applicable premium, if any, as of, and accrued and unpaid interest to, but not including, the redemption date. On or after February 15, 2029, the Company, at its option, may redeem the 2029 Notes, at any time, in whole or in part, on not less than 15 nor more than 60 days' prior notice, at a redemption price equal to 100% of the extinguishmentprincipal amount thereof, plus accrued and unpaid interest to, but not including, the redemption date.
Prior to November 15, 2048, the Company, at its option, may redeem the 2049 Notes, in whole or in part, at a redemption price equal to 100% of debtthe principal amount thereof, plus the applicable premium, if any, as of, and paid related issuance costsaccrued and unpaid interest to, but not including, the redemption date. On or after November 15, 2048, the Company, at its option, may redeem the 2049 Notes, at any time, in whole or in part, on not less than 15 nor more than 60 days' prior notice, at a redemption price equal to 100% of $6.5 million.the principal amount thereof, plus accrued and unpaid interest to, but not including, the redemption date.
2030 Notes and 2049 Notes Issued in 2020
In 2020, the Company issued $350.0$350 million in aggregate principal amount at maturity of 2030 Notes and $300.0$300 million in aggregate principal amount at maturity of 2049 Notes. The 2030 Notes have a stated coupon rate of 3.5% and were issued at 99.774% of par, resulting in a yield to maturity of 3.525%. The 2049 Notes have a stated coupon rate of 5.25% and were issued at 106.626% of par, resulting in a yield to maturity of 4.821%.
The net proceeds from the offering were $669.1 million after original issue discount. The proceeds were used to redeem the $650.0$650 million in aggregate principal amount of 5.25% senior notes due 2025 Notes(the "2025 Notes") at a redemption price equal to 102.625% of the principal amount of such 2025 Notes, plus accrued interest.
Prior to February 28, 2030, the Company, at its option, may redeem the 2030 Notes, in whole or in part, at a redemption price equal to 100% of the principal amount thereof, plus the applicable premium, if any, as of, and accrued and unpaid interest to, but not including, the redemption date. On or after February 28, 2030, the Company, at its option, may redeem the 2030 Notes, at any time, in whole or in part, on not less than 15 nor more than 60 days' prior notice, at a redemption price equal to 100% of the principal amount thereof, plus accrued and unpaid interest to, but not including, the redemption date.
Prior to November 15, 2048, the Company, at its option, may redeem the 2049 Notes, in whole or in part, at a redemption price equal to 100% of the principal amount thereof, plus the applicable premium, if any, as of, and accrued and unpaid interest to, but not including, the redemption date. On or after November 15, 2048, the Company, at its option, may redeem the 2049
Lear Corporation and Subsidiaries
Notes to Consolidated Financial Statements (continued)
Notes, at any time, in whole or in part, on not less than 15 nor more than 60 days' prior notice, at a redemption price equal to 100% of the principal amount thereof, plus accrued and unpaid interest to, but not including, the redemption date.
2032 Notes and 2052 Notes Issued in 2021
In 2021, the Company issued $350 million in aggregate principal amount at maturity of 2032 Notes and $350 million in aggregate principal amount at maturity of 2052 Notes. The 2032 Notes have a stated coupon rate of 2.6% and were issued at 99.782% of par, resulting in a yield to maturity of 2.624%. The 2052 Notes have a stated coupon rate of 3.55% and were issued at 99.845% of par, resulting in a yield to maturity of 3.558%.
The net proceeds from the offering of $698.7 million, after original issue discount, were used, in part, to fund the tender of $200 million in aggregate principal amount of 2027 Notes (see "— 2027 Notes" above) and the repayment in full of $206.3 million outstanding on the Company's $250 million term loan facility under its credit agreement (see "— Credit Agreement" below). The remaining net proceeds were used to finance the 2022 acquisition of Kongsberg ICS (Note 4, "Acquisitions") and for general corporate purposes.
Prior to October 15, 2031, the Company, at its option, may redeem the 2032 Notes, in whole or in part, at a redemption price equal to 100% of the principal amount thereof, plus the applicable premium, if any, as of, and accrued and unpaid interest to, but not including, the redemption date. On or after October 15, 2031, the Company, at its option, may redeem the 2032 Notes, at any time, in whole or in part, on not less than 15 nor more than 60 days' prior notice, at a redemption price equal to 100% of the principal amount thereof, plus accrued and unpaid interest to, but not including, the redemption date.
Prior to July 15, 2051, the Company, at its option, may redeem the 2052 Notes, in whole or in part, at a redemption price equal to 100% of the principal amount thereof, plus the applicable premium, if any, as of, and accrued and unpaid interest to, but not including, the redemption date. On or after July 15, 2051, the Company, at its option, may redeem the 2052 Notes, at any time, in whole or in part, on not less than 15 nor more than 60 days' prior notice, at a redemption price equal to 100% of the principal amount thereof, plus accrued and unpaid interest to, but not including, the redemption date.
In connection with these transactions, the Company recognized a loss of $21.1 million on the extinguishment of debt and paid related issuance costs of $6.0 million.$7.1 million in 2021.
Covenants
Subject to certain exceptions, the indentures governing the Notes contain restrictive covenants that, among other things, limit the ability of the Company to: (i) create or permit certain liens and (ii) consolidate, merge or sell all or substantially all of the Company’sCompany's assets. The indentures governing the Notes also provide for customary events of default. As of December 31, 2020,2023, the Company was in compliance with all covenants under the indentures governing the Notes.
Credit Agreement
In 2017, the Company entered into an unsecured credit agreement, (the "Credit Agreement") consistingwhich consisted of a $1.75 billion revolving credit facility (the "Revolving Credit Facility") and a $250.0$250 million term loan facility (the "Term Loan Facility"). In 2020,October 2021, the Company entered into an amended and restated credit agreement (the "Credit Agreement") that increased the Revolving Credit Facility to $2.0 billion and extended the maturity date to October 28, 2026. In November 2021, the Company repaid in full $206.3 million outstanding on the Term Loan Facility. Inclusive of this amount, the Company made principal payments on the Term Loan Facility of $220.3 million in 2021. In connection with these transactions, the Company recognized a loss of $0.7 million on the extinguishment of debt and paid related issuance costs of $2.8 million.
In June 2023, the Company amended the Credit Agreement to implement the transition from the London Interbank Offered Rate to the Secured Overnight Financing Rate ("SOFR") in accordance with the existing terms of the Credit Agreement, adopting SOFR as the reference rate for certain U.S. dollar-denominated borrowings.
In November 2023, the Company entered into an extension agreement (the "Extension Agreement") related to its Credit Agreement to extend the maturity date of the Revolving Credit Facility by one year to August 8, 2024,October 28, 2027, and replace the Canadian Dollar Offered Rate (CDOR) with term Canadian Overnight Repo Rate Average (CORRA) as the benchmark rate for term rate loans denominated in Canadian dollars. In connection with the Extension Agreement, the Company paid related issuance costs of $1.0$1.2 million.The maturity date of the Term Loan Facility is August 8, 2022.
In the first quarter of 2020, as a proactive measure in response to the COVID-19 pandemic, the Company borrowed $1.0 billion2023 and 2021, there were no borrowings or repayments under the Revolving Credit Facility, which was repaid in full in the third quarter of 2020.Facility. In 2019,2022, aggregate borrowings and repayments under the Revolving Credit Facility were $30.0$65.0 million. In 2018,As of December 31, 2023 and 2022, there were 0no borrowings or repaymentsoutstanding under the Revolving Credit Facility.
Lear Corporation and Subsidiaries
Notes to Consolidated Financial Statements (continued)
Revolving Credit Facility. As of December 31, 2020 and 2019, there were 0 borrowings outstanding under the Revolving Credit Facility.
In 2020, 2019 and 2018, the Company made required principal payments under the Term Loan Facility of $14.1 million, $7.8 million and $6.3 million, respectively.
Advances under the Revolving Credit Facility and the Term Loan FacilityAgreement generally bear interest based on (i) the EurocurrencyTerm Benchmark, Central Bank Rate (asand Risk Free Rate ("RFR") (in each case, as defined in the Credit Agreement) or (ii) theAlternate Base Rate (as("ABR") and Canadian Prime Rate (in each case, as defined in the Credit Agreement) plus a margin, determined in accordance with a pricing grid.. As of December 31, 2020,2023, the ranges and rates are as follows (in percentages):
| | | | | | | | | | | | | | | | | | | | | | | | | | | | | | | | | | | | | | |
| | Eurocurrency Rate | | Base Rate |
| | Minimum | | Maximum | | Rate as of
December 31, 2020 | | Minimum | | Maximum | | Rate as of
December 31,
2020 |
| Revolving Credit Facility | | 1.00 | % | | 1.60 | % | | 1.10 | % | | 0.00 | % | | 0.60 | % | | 0.10 | % |
| Term Loan Facility | | 1.125 | % | | 1.90 | % | | 1.25 | % | | 0.125 | % | | 0.90 | % | | 0.25 | % |
| | | | | | | | | | | | | | | | | | | | | | | | | | | | | | | | | | | | | | |
| | Term Benchmark, Central Bank Rate
and RFR Loans | | ABR and Canadian Prime Rate Loans |
| | Minimum | | Maximum | | Rate as of December 31, 2023 | | Minimum | | Maximum | | Rate as of December 31, 2023 |
| Credit Agreement | | 0.925 | % | | 1.450 | % | | 1.125 | % | | 0.000 | % | | 0.450 | % | | 0.125 | % |
| | | | | | | | | | | | |
AThe facility fee, which ranges from 0.125%0.075% to 0.30%0.20% of the total amount committed under the Revolving Credit Facility, is payable quarterly.
Covenants
The CreditCredit Agreement contains various customary representations, warranties and covenants by the Company, including, without limitation, (i) covenants regarding maximum leverage, (ii) limitations on fundamental changes involving the Company or its subsidiaries and (iii) limitations on indebtedness and liens. As of December 31, 2020,2023, the Company was in compliance with all covenants under the Credit Agreement.
Term Loan
In May 2023, the Company borrowed $150.0 million under its unsecured delayed-draw term loan facility (the "Term Loan") to finance, in part, the acquisition of IGB (Note 4, "Acquisitions"). The Term Loan matures on May 1, 2026, three years after the funding date. Advances under the Term Loan generally bear interest based on the Daily or Term SOFR (as defined in the Term Loan agreement) plus a margin determined in accordance with a pricing grid that ranges from 1.00% to 1.525%. As of December 31, 2023, the interest rate was 6.575%.
Covenants
The Term Loan contains the same covenants as the Credit Agreement. As of December 31, 2023, the Company was in compliance with all covenants under the Term Loan.
Other
As of December 31, 2020,2023, other long-term debt, including the current portion, consisted of amounts outstanding under finance leases.
Scheduled Maturities
lease agreements. As of December 31, 2020, scheduled maturities related to2022, other long-term debt, including the Credit Agreement — Term Loan Facility for the five succeeding years are shown below (in millions):
| | | | | |
| 2021 | $ | 14.1 | |
| 2022 | 206.2 | |
| 2023 | 0 | |
| 2024 | 0 | |
| 2025 | 0 | |
(8) Leases
Right-of-Use Assets and Lease Obligations
The Company has operating leases for production, office and warehouse facilities, manufacturing and office equipment and vehicles. Operating lease assets and obligations included in the accompanying consolidated balance sheet are shown below (in millions):
| | December 31, | December 31, | 2020 | | 2019 | December 31, | 2023 | | 2022 |
| Right-of-use assets under operating leases: | Right-of-use assets under operating leases: | |
| Other long-term assets | Other long-term assets | $ | 540.3 | | | $ | 527.0 | |
| Other long-term assets | |
| Other long-term assets | |
| Lease obligations under operating leases: | Lease obligations under operating leases: | |
| Accrued liabilities | Accrued liabilities | $ | 116.3 | | | $ | 113.9 | |
| Accrued liabilities | |
| Accrued liabilities | |
| Other long-term liabilities | Other long-term liabilities | 438.9 | | | 422.4 | |
| $ | 555.2 | | | $ | 536.3 | |
| $ | |
Lear Corporation and Subsidiaries
Notes to Consolidated Financial Statements (continued)
Maturities of lease obligations as of December 31, 2020,2023, are shown below (in millions):
| | 2021 | $ | 141.0 | |
| 2022 | 111.5 | |
| 2023 | 85.9 | |
| 2024 | 2024 | 71.5 | |
| 2025 | 2025 | 58.7 | |
| 2026 | |
| 2027 | |
| 2028 | |
| Thereafter | Thereafter | 169.7 | |
| Total undiscounted cash flows | Total undiscounted cash flows | 638.3 | |
| Less: Imputed interest | Less: Imputed interest | (83.1) | |
| Lease obligations under operating leases | Lease obligations under operating leases | $ | 555.2 | |
TheIn addition to the right-of-use assets obtained in exchange for operating lease obligations shown below, the Company entered into 2 lease contracts, oneacquired $14.3 million of which is expected to commence in the first quarter of 2021 with a lease term of five years, and the other of which is expected to commence in the third quarter 2021 with a lease term of ten years. The aggregate right-of-use assets and related lease obligations are expected to be approximately $52.0 million.in conjunction with its acquisition of IGB in 2023 and $34.1 million of right-of-use assets and related lease obligations in conjunction with its acquisition of Kongsberg ICS in 2022. See Note 4, "Acquisitions."
Cash flow information related to operating leases is shown below (in millions):
| | For the year ended December 31, | For the year ended December 31, | 2020 | | 2019 | For the year ended December 31, | 2023 | | 2022 | | 2021 |
| Non-cash activity: | Non-cash activity: | |
| Right-of-use assets obtained in exchange for operating lease obligations | Right-of-use assets obtained in exchange for operating lease obligations | $ | 135.1 | | | $ | 214.3 | |
| Right-of-use assets obtained in exchange for operating lease obligations | |
| Right-of-use assets obtained in exchange for operating lease obligations | |
| Operating cash flows: | Operating cash flows: | |
| Cash paid related to operating lease obligations | Cash paid related to operating lease obligations | $ | 143.8 | | | $ | 141.8 | |
| Cash paid related to operating lease obligations | |
| Cash paid related to operating lease obligations | |
Lease expense included in the accompanying consolidated statement of income is shown below (in millions):
| | For the year ended December 31, | For the year ended December 31, | 2020 | | 2019 | |
| For the year ended December 31, | |
| For the year ended December 31, | |
| Operating lease expense | |
| Operating lease expense | |
| Operating lease expense | Operating lease expense | $ | 148.6 | | | $ | 140.6 | | |
| Short-term lease expense | Short-term lease expense | 15.4 | | | 17.0 | | |
| Short-term lease expense | |
| Short-term lease expense | |
| Variable lease expense | |
| Variable lease expense | |
| Variable lease expense | Variable lease expense | 8.0 | | | 6.5 | | |
| Total lease expense | Total lease expense | $ | 172.0 | | | $ | 164.1 | | |
| Total lease expense | |
| Total lease expense | |
The Company's short-term lease expense excludes leases with a duration of one month or less, as permitted by the standard.less.
Variable lease expense includes payments based on performance or usage, as well as changes to index and rate-based lease payments. Additionally, the Company evaluated its supply contracts with its customers and concluded that variable lease (income) expense in these arrangements is not material.
For the year ended December 31, 2018, the Company recorded rent expense of $163.8 million.
For the years ended December 31, 20202023, 2022 and 2019,2021, the Company recognized impairment charges of $2.0$10.9 million, $6.5 million and $0.8$7.2 million, respectively, related to its right-of-use assets in conjunction with its restructuring actions (Note 5, "Restructuring"). For the year ended December 31, 2022, the Company recognized additional right-of-use asset impairment charges of $7.0 million related to its Russian operations. The impairment charges are included in cost of sales in the accompanying consolidated statements of income.
The weighted average lease term and discount rate for operating leases as of December 31, 2020,2023, are shown below:
| | | | | |
| Weighted average remaining lease term | Seven years |
| Weighted average discount rate | 3.44.0 | % |
For the year ended December 31, 2023, the Company recognized a gain of $11.3 million on the sale of a manufacturing facility that was subsequently leased back under a short-term lease. The Company has entered into certain finance lease agreements which are not material togain is included in other expense, net in the accompanying consolidated financial statements (Note 7, "Debt").
Lear Corporation and Subsidiaries
Notes to Consolidated Financial Statements (continued)
(9) Income Taxes
A summary of consolidated income before provision for income taxes and equity in net income of affiliates and the components of provision for income taxes is shown below (in millions):
| | | | | | | | | | | | | | | | | |
| For the year ended December 31, | 2020 | | 2019 | | 2018 |
| Consolidated income before provision for income taxes and equity in net income of affiliates: | | | | | |
| Domestic | $ | (145.0) | | | $ | 317.4 | | | $ | 726.2 | |
| Foreign | 444.3 | | | 636.2 | | | 812.2 | |
| $ | 299.3 | | | $ | 953.6 | | | $ | 1,538.4 | |
| Domestic (benefit) provision for income taxes: | | | | | |
| Current provision | $ | 29.0 | | | $ | 24.2 | | | $ | 35.0 | |
| Deferred (benefit) provision | (106.2) | | | (52.6) | | | 91.5 | |
| Total domestic (benefit) provision | $ | (77.2) | | | $ | (28.4) | | | $ | 126.5 | |
| Foreign provision for income taxes: | | | | | |
| Current provision | $ | 149.6 | | | $ | 160.1 | | | $ | 190.2 | |
| Deferred (benefit) provision | 21.5 | | | 14.4 | | | (4.8) | |
| Total foreign provision | $ | 171.1 | | | $ | 174.5 | | | $ | 185.4 | |
| Provision for income taxes | $ | 93.9 | | | $ | 146.1 | | | $ | 311.9 | |
The Act was enacted on December 22, 2017. The Act reduced the U.S. federal corporate income tax rate from 35% to 21% beginning in 2018, required companies to pay a one-time transition tax on all offshore earnings that were previously tax deferred and created new taxes on certain foreign sourced earnings. In March 2018, the FASB issued ASU 2018-05, "Income Taxes — Amendments to SEC Paragraphs Pursuant to SEC Staff Accounting Bulletin No. 118." The guidance provided for a provisional one-year measurement period for entities to finalize their accounting for certain tax effects related to the Act. Accordingly, for the year ended December 31, 2018, the Company recognized a favorable adjustment to the 2017 income tax expense of $5.3 million related to the remeasurement of the December 31, 2017 deferred tax balances, the one-time transition tax and numerous other items included in the Act. The Company also analyzed the impact of several new provisions of the Act that became effective as of January 1, 2018, such as the GILTI provision, foreign-derived intangible income ("FDII") deduction, a new minimum tax related to payments to foreign subsidiaries and affiliates known as base erosion anti-abuse tax, interest expense limitations under Internal Revenue Code ("IRC") section 163(j), executive compensation limitations under IRC section 162(m) and various other provisions. | | | | | | | | | | | | | | | | | |
| For the year ended December 31, | 2023 | | 2022 | | 2021 |
| Consolidated income before provision for income taxes and equity in net income of affiliates: | | | | | |
| Domestic | $ | 59.9 | | | $ | 87.6 | | | $ | (110.9) | |
| Foreign | 717.3 | | | 421.7 | | | 694.4 | |
| $ | 777.2 | | | $ | 509.3 | | | $ | 583.5 | |
| Domestic (benefit) provision for income taxes: | | | | | |
| Current provision | $ | 43.0 | | | $ | 35.3 | | | $ | 38.4 | |
| Deferred benefit | (29.4) | | | (41.4) | | | (76.6) | |
| Total domestic (benefit) provision | $ | 13.6 | | | $ | (6.1) | | | $ | (38.2) | |
| Foreign provision for income taxes: | | | | | |
| Current provision | $ | 196.6 | | | $ | 147.8 | | | $ | 154.8 | |
| Deferred (benefit) provision | (29.4) | | | (8.0) | | | 21.1 | |
| Total foreign provision | $ | 167.2 | | | $ | 139.8 | | | $ | 175.9 | |
| Provision for income taxes | $ | 180.8 | | | $ | 133.7 | | | $ | 137.7 | |
The domestic (benefit)current provision includes withholding taxes related to dividends and royalties paid by the Company’sCompany's foreign subsidiaries, as well as state and local taxes. In 2020, 20192023, 2022 and 2018,2021, the foreign deferred (benefit) provision for income taxes includes the benefit of prior unrecognized net operating loss carryforwards of $5.3$8.0 million, $1.8$0.8 million and $7.1$2.9 million, respectively.
Lear Corporation and Subsidiaries
Notes to Consolidated Financial Statements (continued)
A summary of the differences between the provision for income taxes calculated at the United States federal statutory income tax rate of 21% and the consolidated provision for income taxes is shown below (in millions):
| | For the year ended December 31, | For the year ended December 31, | 2020 | | 2019 | | 2018 | For the year ended December 31, | 2023 | | 2022 | | 2021 |
| Consolidated income before provision for income taxes and equity in net income of affiliates multiplied by the United States federal statutory income tax rate | Consolidated income before provision for income taxes and equity in net income of affiliates multiplied by the United States federal statutory income tax rate | $ | 62.9 | | | $ | 200.2 | | | $ | 323.1 | |
| Differences in income taxes on foreign earnings, losses and remittances | Differences in income taxes on foreign earnings, losses and remittances | 20.7 | | | 14.1 | | | 53.4 | |
| Valuation allowance adjustments | 47.7 | | | 1.2 | | | (38.8) | |
Valuation allowance adjustments (1) | |
| Research and development and other tax credits | Research and development and other tax credits | (11.8) | | | (40.8) | | | (9.9) | |
| FDII deduction | FDII deduction | (14.6) | | | (29.3) | | | (27.6) | |
U.S. tax impact of foreign earnings (1) | (21.1) | | | 9.7 | | | 7.2 | |
U.S. tax impact of foreign earnings (2) | |
| Tax audits and assessments | Tax audits and assessments | 8.9 | | | 0.4 | | | 6.9 | |
| Change in the tax status of certain affiliates | 0 | | | (18.1) | | | 0 | |
| Transition tax on accumulated foreign earnings | 0 | | | 0 | | | (15.1) | |
| U.S. tax rate change and other tax reform items | 0 | | | 0 | | | 9.8 | |
| | Other | Other | 1.2 | | | 8.7 | | | 2.9 | |
| Provision for income taxes | Provision for income taxes | $ | 93.9 | | | $ | 146.1 | | | $ | 311.9 | |
(1) Relates primarily to changes in valuation allowances on the deferred tax assets of foreign subsidiaries in 2022 and 2021.
(2) Reflects the impact on the domestic provision for income taxes related to foreign source income, including foreign branch earnings net of the applicable foreign tax credits in the general, foreign branch, GILTI and passive separate limitation categories. This amount includes the U.S. tax impact of apportioning U.S. expenses against the GILTI and foreign branch basketsbasket in calculating the foreign tax credit limitation resulting in no tax benefit for these expenses due to the Company’sCompany's excess foreign tax credit position in the GILTI basket for 2020, 20192023 and 2018 and foreign branch basket for 2018. In 2020, as a result of the change in the foreign branch basket limitation, the Company recognized tax benefits of $15.5 million related to the U.S. deferred tax effect of the foreign branches.
In 2019, the Company completed a U.S. research and development ("R&D") tax credit study for the years 2013 to 2018, the results of which were accepted by the Internal Revenue Service and pursuant to which the Company recognized a tax benefit of $28.6 million. The tax benefit is reflected in the table above in research and development and other tax credits.2021.
For the years ended December 31, 2020, 20192023, 2022 and 2018,2021, income in foreign jurisdictions with tax holidays was $29.4$48.4 million, $89.4$40.5 million and $107.1$55.6 million, respectively. Such tax holidays generally expire from 20202023 through 2035.2036.
Lear Corporation and Subsidiaries
Notes to Consolidated Financial Statements (continued)
Deferred income taxes represent temporary differences in the recognition of certain items for financial reporting and income tax purposes. A summary of the components of the net deferred income tax asset is shown below (in millions):
| | | | | | | | | | | |
| December 31, | 2020 | | 2019 |
| Deferred income tax assets (liabilities): | | | |
| Tax loss carryforwards | $ | 423.9 | | | $ | 419.7 | |
| Tax credit carryforwards | 280.6 | | | 294.0 | |
| Retirement benefit plans | 82.9 | | | 59.1 | |
| Accrued liabilities | 177.9 | | | 136.1 | |
| Self-insurance reserves | 7.1 | | | 5.8 | |
| Current asset basis differences | 43.3 | | | 43.7 | |
| Long-term asset basis differences | (36.5) | | | (65.4) | |
| Deferred compensation | 22.6 | | | 27.2 | |
| Recoverable customer engineering, development and tooling | 67.1 | | | (10.5) | |
| Undistributed earnings of foreign subsidiaries | (71.7) | | | (76.7) | |
| Derivative instruments and hedging activities | (5.2) | | | (5.2) | |
| Other | (8.9) | | | (5.8) | |
| Net deferred income tax asset before valuation allowance | 983.1 | | | 822.0 | |
| Valuation allowance | (397.7) | | | (344.8) | |
| Net deferred income tax asset | $ | 585.4 | | | $ | 477.2 | |
Lear Corporation and Subsidiaries
Notes to Consolidated Financial Statements (continued) | | | | | | | | | | | |
| December 31, | 2023 | | 2022 |
| Deferred income tax assets (liabilities): | | | |
| Tax loss carryforwards | $ | 394.3 | | | $ | 397.4 | |
| Tax credit carryforwards | 240.4 | | | 243.9 | |
| Retirement benefit plans | 24.6 | | | 22.6 | |
| Accrued liabilities | 269.8 | | | 208.7 | |
| Self-insurance reserves | 5.4 | | | 5.5 | |
| Current asset basis differences | 50.3 | | | 42.0 | |
Long-term asset basis differences (1) | 16.4 | | | 3.5 | |
| Deferred compensation | 35.4 | | | 25.8 | |
| Capitalized engineering, research and development | 201.0 | | | 169.6 | |
| Undistributed earnings of foreign subsidiaries | (83.9) | | | (71.7) | |
| Derivative instruments and hedging activities | (31.6) | | | (10.7) | |
| Other | 1.2 | | | 1.8 | |
| Net deferred income tax asset before valuation allowance | 1,123.3 | | | 1,038.4 | |
| Valuation allowance | (429.0) | | | (417.9) | |
| Net deferred income tax asset | $ | 694.3 | | | $ | 620.5 | |
Included in the long-term asset basis differences for the years ended December 31, 2023 and 2022, are deferred tax assets of $157.3 million and $145.5 million, respectively, related to lease obligations and deferred tax liabilities of $157.3 million and $145.5 million, respectively, related to right-of-use assets.As of December 31, 20202023 and 2019,2022, the valuation allowance with respect to the Company’sCompany's deferred tax assets was $397.7$429.0 million and $344.8$417.9 million, respectively, a net increase of $52.9$11.1 million.
Concluding that a valuation allowance is not required is difficult when there is significant negative evidence, such as cumulative losses in recent years, which is objective and verifiable. When measuring cumulative losses in recent years, the Company uses a rolling three-year period of pretax book income, adjusted for permanent differences between book and taxable income and certain other items. As of December 31, 2020,2023, the Company continues to maintain a U.S. valuation allowance of $18.8$30.6 million, with respectprimarily related to certain of its U.S. state and local deferred tax assets that, due to their nature, are not likely to be realized. In addition, the Company continues to maintain a valuation allowance of $378.9$398.4 million with respect to its deferred tax assets in several international jurisdictions.
The classification of the net deferred income tax asset is shown below (in millions):
| | December 31, | December 31, | 2020 | | 2019 | December 31, | 2023 | | 2022 |
| Long-term deferred income tax assets | Long-term deferred income tax assets | $ | 670.2 | | | $ | 563.8 | |
| Long-term deferred income tax liabilities | Long-term deferred income tax liabilities | (84.8) | | | (86.6) | |
| Net deferred income tax asset | Net deferred income tax asset | $ | 585.4 | | | $ | 477.2 | |
As of December 31, 2020,2023, deferred income taxes have not been provided on the undistributed earnings of the Company’sCompany's foreign subsidiaries since these earnings will not be taxable upon repatriation to the United States. These earnings will be primarily treated as previously taxed income from either the one-time transition tax or GILTI, or they will be offset with a 100% dividend received deduction. However, the Company continues to provide a deferred tax liability for foreign withholding tax that will be incurred with respect to the undistributed foreign earnings that are not permanently reinvested.
As of December 31, 2020,2023, the Company had tax loss carryforwards of $1.8$1.7 billion. Of the total tax loss carryforwards, $1.5$1.4 billion have no expiration date, and $247.9$252.8 million expire between 20212024 and 2037.2040. In addition, the Company had tax credit carryforwards of $280.6$240.4 million, comprised principally of U.S. foreign tax credits of $114.9$69.4 million that expire between 2027 and 2030,2031, U.S. research and development credits of $120.1$128.1 million that expire between 20242025 and 20402043 and other tax credits primarily in international jurisdictions of $45.6$42.9 million that generally expire between 20212024 and 2040.
On January 1, 2018, the Company adopted ASU 2016-16, "Income Taxes — Intra-Entity Transfers of Assets Other than Inventory." The new standard requires the recognition of the income tax effects of intercompany sales and transfers of assets other than inventory in the period in which the sale or transfer occurs. The standard also requires modified retrospective adoption. Accordingly, the Company recognized a deferred tax asset of $2.3 million and a corresponding credit to retained earnings in conjunction with the adoption. The effects of adopting the other provisions of ASU 2016-16 were not significant.2043.
As of December 31, 20202023, 2022 and 2019,2021, the Company’sCompany's gross unrecognized tax benefits were $36.4$33.1 million, $32.7 million and $31.6$34.9 million (excluding interest and penalties), respectively, which isare recorded in other long-term liabilities in the
Lear Corporation and Subsidiaries
Notes to Consolidated Financial Statements (continued)
accompanying consolidated balance sheets. If recognized, allAll of the Company’s gross unrecognized tax benefits, if recognized, would affect the Company’s effective tax rate.
A summary of the changes in gross unrecognized tax benefits is shown below (in millions):
| | For the year ended December 31, | For the year ended December 31, | 2020 | | 2019 | | 2018 | For the year ended December 31, | 2023 | | 2022 | | 2021 |
| Balance at beginning of period | Balance at beginning of period | $ | 31.6 | | | $ | 36.7 | | | $ | 33.2 | |
| Additions (reductions) based on tax positions related to current year | 4.9 | | | (0.3) | | | 7.9 | |
| Additions based on tax positions related to prior years | 3.6 | | | 2.0 | | | 0.1 | |
| Additions based on tax positions related to current year | |
| Reductions based on tax positions related to prior years | |
| Settlements | Settlements | (1.2) | | | (3.7) | | | 0 | |
| Statute expirations | Statute expirations | (4.7) | | | (2.8) | | | (2.7) | |
| Foreign currency translation | Foreign currency translation | 2.2 | | | (0.3) | | | (1.8) | |
| Balance at end of period | Balance at end of period | $ | 36.4 | | | $ | 31.6 | | | $ | 36.7 | |
The Company recognizes interest and penalties with respect to unrecognized tax benefits as income tax expense. As of December 31, 20202023, 2022 and 2019,2021, the Company had recorded gross reserves of $12.2$11.6 million, $12.3 million and $11.5$12.7 million, respectively, related to interest and penalties, all of which, if recognized, would affect the Company’sCompany's effective tax rate.
The Company operates in multiple jurisdictions throughout the world, and its tax returns are periodically audited or subject to review by both domestic and foreign tax authorities. During the next twelve months, it is reasonably possible that, as a result of audit settlements, the conclusion of current examinations and the expiration of the statute of limitations in multiple jurisdictions,
Lear Corporation and Subsidiaries
Notes to Consolidated Financial Statements (continued)
the Company may decrease the amount of its gross unrecognized tax benefits by $8.4$5.0 million, all of which, if recognized, would affect the Company’sCompany's effective tax rate. The gross unrecognized tax benefits subject to potential decrease involve issues related to transfer pricing and various other tax items in multiple jurisdictions. However, as a result of ongoing examinations, tax proceedings in certain countries, additions to the gross unrecognized tax benefits for positions taken and interest and penalties, if any, arising in 2021,2024, it is not possible to estimate the potential net increase or decrease to the Company’sCompany's gross unrecognized tax benefits during the next twelve months.
The Company considers its significant tax jurisdictions to include China, Germany, Italy, Mexico, Morocco, Spain, the United Kingdom and the United States. The Company or its subsidiaries generally remain subject to income tax examination in certain U.S. state and local jurisdictions for years after 2015.2018. Further, the Company or its subsidiaries remain subject to income tax examination in Spain for years after 2005,2007, in Mexico for years after 2013,2016, in Italy and Morocco for years after 2014,2017, in Germany Italyfor years after 2018, in China and the United Kingdom for years after 2015, in China for years after 20162019 and in the United States generally for years after 2019.2021.
On August 16, 2022, the Inflation Reduction Act of 2022 ("IRA") was signed into law. The IRA contains a number of revisions to the Internal Revenue Code, including a 15% corporate minimum tax and a 1% excise tax on share repurchases, which are effective for tax years beginning after December 31, 2022. The tax-related provisions of the IRA did not have a material impact on the Company's consolidated financial statements. For the year ended December 31, 2023, the Company incurred $2.9 million of excise taxes on its share repurchases, which is included in repurchases of shares of common stock in the accompanying consolidated statement of equity.
In 2021, the Brazilian Supreme Court ruled on certain matters, including the method of determining the amount of indirect tax credits that taxpayers are entitled to monetize in future periods. As a result of the ruling, other expense, net includes a gain of $45.0 million for the year ended December 31, 2021, for which $8.0 million of tax expense was recognized.
(10) Pension and Other Postretirement Benefit Plans
The Company has noncontributory defined benefit pension plans covering certain domestic employees and certain employees in foreign countries, principally Canada.
The Company’sCompany's domestic salaried pension plans provide benefits based on final average earnings formulas. The Company’sCompany's domestic hourly pension plans provide benefits under flat benefit and cash balance formulas. The Company also has contractual arrangements with certain employees which provide for supplemental retirement benefits. In general, the Company’sCompany's policy is to fund its pension benefit obligation based on legal requirements, tax and liquidity considerations and local practices.
The Company has postretirement benefit plans covering certain domestic and Canadian retirees. The Company’sCompany's postretirement benefit plans generally provide for the continuation of medical benefits for eligible retirees. The Company does not fund its postretirement benefit obligation. Rather, payments are made as costs are incurred by covered retirees.
Lear Corporation and Subsidiaries
Notes to Consolidated Financial Statements (continued)
Obligation
A reconciliation of the change in benefit obligation for the years ended December 31, 20202023 and 2019,2022, is shown below (in millions):
| | | | Pension | | | Other Postretirement | | Pension | | | Other Postretirement |
| | | December 31, 2020 | | December 31, 2019 | | | December 31, 2020 | | December 31, 2019 | | December 31, 2023 | | December 31, 2022 | | | December 31, 2023 | | December 31, 2022 |
| | | U.S. | | Foreign | | U.S. | | Foreign | | | U.S. | | Foreign | | U.S. | | Foreign | | U.S. | | Foreign | | U.S. | | Foreign | | | U.S. | | Foreign | | U.S. | | Foreign |
| Change in benefit obligation: | Change in benefit obligation: | | | |
| Benefit obligation at beginning of period | Benefit obligation at beginning of period | $ | 500.8 | | | $ | 504.3 | | | $ | 438.0 | | | $ | 437.1 | | | | $ | 55.4 | | | $ | 25.6 | | | $ | 52.4 | | | $ | 34.3 | |
| Benefit obligation at beginning of period | |
| Benefit obligation at beginning of period | |
| Service cost | Service cost | 0.1 | | | 5.0 | | | 0.1 | | | 6.3 | | | | 0 | | | 0 | | | 0 | | | 0.3 | |
| Interest cost | Interest cost | 16.4 | | | 12.2 | | | 18.6 | | | 14.7 | | | | 1.7 | | | 0.7 | | | 2.1 | | | 1.3 | |
| Amendment | 0 | | | 0 | | | 0 | | | 0 | | | | 0.4 | | | 0 | | | 0 | | | 0 | |
| Actuarial loss | 66.4 | | | 39.9 | | | 63.0 | | | 55.8 | | | | 6.9 | | | 2.1 | | | 4.5 | | | 0.4 | |
| | Actuarial (gains) losses | |
| Actuarial (gains) losses | |
| Actuarial (gains) losses | |
| Benefits paid | Benefits paid | (19.3) | | | (20.0) | | | (18.9) | | | (21.5) | | | | (3.2) | | | (1.5) | | | (3.6) | | | (1.3) | |
| Benefits paid — settlements | 0 | | | (29.2) | | | 0 | | | 0 | | | | 0 | | | 0 | | | 0 | | | 0 | |
| Curtailment | 0 | | | 0 | | | 0 | | | (2.4) | | | | 0 | | | 0 | | | 0 | | | (10.9) | |
| | Translation adjustment | |
| | Translation adjustment | |
| | Translation adjustment | Translation adjustment | 0 | | | 17.0 | | | 0 | | | 14.3 | | | | 0 | | | 0.5 | | | 0 | | | 1.5 | |
| Benefit obligation at end of period | Benefit obligation at end of period | $ | 564.4 | | | $ | 529.2 | | | $ | 500.8 | | | $ | 504.3 | | | | $ | 61.2 | | | $ | 27.4 | | | $ | 55.4 | | | $ | 25.6 | |
Actuarial lossesgains
As of December 31, 2020,2023, the increase in pension and U.S. other postretirement benefit obligations attributable to actuarial losses primarily relates to a decrease in the discount rate used to determine the benefit obligations (see assumptions below) and, to a lesser extent, changes in mortality assumptions for the Company's U.S. plans. With respect to the other postretirement benefit obligation, actuarial losses were offset by gains related to claims cost updates for the Company's foreign plans.obligations. As of December 31, 2019,2023, the increasedecrease in the foreign other postretirement obligation attributable to actuarial gains relates primarily to demographic and claims cost updates. As of December 31, 2022, the decrease in the pension and other postretirement benefit obligations attributable to actuarial lossesgains primarily relates to a decreasean increase in the discount rate used to determine the benefit obligations (see assumptions below).
Lear Corporation and Subsidiaries
Notes to Consolidated Financial Statements (continued)
Plan Assets and Funded Status
A reconciliation of the change in plan assets for the years ended December 31, 20202023 and 2019,2022, and the funded status as of December 31, 20202023 and 2019,2022, is shown below (in millions):
| | | | Pension | | | Other Postretirement | | Pension | | | Other Postretirement |
| | | December 31, 2020 | | December 31, 2019 | | | December 31, 2020 | | December 31, 2019 | | December 31, 2023 | | December 31, 2022 | | | December 31, 2023 | | December 31, 2022 |
| | | U.S. | | Foreign | | U.S. | | Foreign | | | U.S. | | Foreign | | U.S. | | Foreign | | U.S. | | Foreign | | U.S. | | Foreign | | | U.S. | | Foreign | | U.S. | | Foreign |
| Change in plan assets: | Change in plan assets: | | | |
Fair value of plan assets at
beginning of period | Fair value of plan assets at
beginning of period | $ | 376.6 | | | $ | 396.8 | | | $ | 330.6 | | | $ | 351.8 | | | | $ | 0 | | | $ | 0 | | | $ | 0 | | | $ | 0 | |
| Fair value of plan assets at beginning of period | |
| Fair value of plan assets at beginning of period | |
| Actual return on plan assets | Actual return on plan assets | 41.7 | | | 19.8 | | | 61.5 | | | 42.3 | | | | 0 | | | 0 | | | 0 | | | 0 | |
| Employer contributions | Employer contributions | 19.2 | | | 7.7 | | | 3.4 | | | 6.6 | | | | 3.2 | | | 1.5 | | | 3.6 | | | 1.3 | |
| Benefits paid | Benefits paid | (19.3) | | | (20.0) | | | (18.9) | | | (21.5) | | | | (3.2) | | | (1.5) | | | (3.6) | | | (1.3) | |
| Benefits paid — settlements | 0 | | | (29.2) | | | 0 | | | 0 | | | | 0 | | | 0 | | | 0 | | | 0 | |
| | Translation adjustment | |
| Translation adjustment | |
| Translation adjustment | Translation adjustment | 0 | | | 7.9 | | | 0 | | | 17.6 | | | | 0 | | | 0 | | | 0 | | | 0 | |
Fair value of plan assets at
end of period | Fair value of plan assets at
end of period | $ | 418.2 | | | $ | 383.0 | | | $ | 376.6 | | | $ | 396.8 | | | | $ | 0 | | | $ | 0 | | | $ | 0 | | | $ | 0 | |
| | Funded status | Funded status | $ | (146.2) | | | $ | (146.2) | | | $ | (124.2) | | | $ | (107.5) | | | | $ | (61.2) | | | $ | (27.4) | | | $ | (55.4) | | | $ | (25.6) | |
| Funded status | |
| Funded status | |
Lear Corporation and Subsidiaries
Notes to Consolidated Financial Statements (continued)
A summary of amounts recognized in the consolidated balance sheets as of December 31, 20202023 and 2019,2022, is shown below (in millions):
| | | | Pension | | | Other Postretirement | | Pension | | | Other Postretirement |
| | | December 31, 2020 | | December 31, 2019 | | | December 31, 2020 | | December 31, 2019 | | December 31, 2023 | | December 31, 2022 | | | December 31, 2023 | | December 31, 2022 |
| | | U.S. | | Foreign | | U.S. | | Foreign | | | U.S. | | Foreign | | U.S. | | Foreign | | U.S. | | Foreign | | U.S. | | Foreign | | | U.S. | | Foreign | | U.S. | | Foreign |
| Amounts recognized in the consolidated balance sheet: | Amounts recognized in the consolidated balance sheet: | | | |
| Other long-term assets | Other long-term assets | $ | 0 | | | $ | 9.1 | | | $ | 0.1 | | | $ | 23.8 | | | | $ | 0 | | | $ | 0 | | | $ | 0 | | | $ | 0 | |
| Other long-term assets | |
| Other long-term assets | |
| Accrued liabilities | Accrued liabilities | (2.5) | | | (3.2) | | | (2.6) | | | (3.3) | | | | (4.0) | | | (1.5) | | | (3.9) | | | (1.4) | |
| Other long-term liabilities | Other long-term liabilities | (143.7) | | | (152.1) | | | (121.7) | | | (128.0) | | | | (57.2) | | | (25.9) | | | (51.5) | | | (24.2) | |
| | Funded status | |
| Funded status | |
| Funded status | |
Accumulated Benefit Obligation
As of December 31, 20202023 and 2019,2022, the accumulated benefit obligation for all of the Company’sCompany's pension plans was $1,079.6$769.3 million and $990.3$720.5 million, respectively.
As of December 31, 20202023 and 2019,2022, the majority of the Company's pension plans had accumulated benefit obligations in excess of plan assets. Information related to pension plans with accumulated benefit obligations in excess of plan assets is shown below (in millions):
| | December 31, | December 31, | 2020 | | 2019 | December 31, | 2023 | | 2022 |
| Projected benefit obligation | Projected benefit obligation | $ | 813.7 | | | $ | 726.3 | |
| Accumulated benefit obligation | Accumulated benefit obligation | 799.6 | | | 711.5 | |
| Fair value of plan assets | Fair value of plan assets | 512.2 | | | 470.8 | |
Pretax amounts recognized in other comprehensive income (loss) ("OCIL") for the years ended December 31, 2023 and 2022, is shown below (in millions):
| | | | | | | | | | | | | | | | | | | | | | | | | | | | | | | | | | | | | | | | | | | | | | | | | | |
| | Pension | | | Other Postretirement |
| | December 31, 2023 | | December 31, 2022 | | | December 31, 2023 | | December 31, 2022 |
| | U.S. | | Foreign | | U.S. | | Foreign | | | U.S. | | Foreign | | U.S. | | Foreign |
| Unrecognized amounts in AOCL at beginning of period | $ | (58.9) | | | $ | (61.2) | | | $ | (102.6) | | | $ | (114.6) | | | | $ | 39.2 | | | $ | 4.2 | | | $ | 14.7 | | | $ | (0.5) | |
| Actuarial gains (losses) recognized: | | | | | | | | | | | | | | | | |
| Reclassification adjustments | 1.0 | | | 1.9 | | | 2.0 | | | 4.1 | | | | (3.3) | | | (0.2) | | | (1.2) | | | — | |
| Actuarial gains (losses) arising during the period | (0.3) | | | (11.0) | | | 41.3 | | | 42.2 | | | | (0.7) | | | 1.8 | | | 25.8 | | | 4.8 | |
| | | | | | | | | | | | | | | | |
| Effect of settlements | (0.1) | | | (0.4) | | | 0.4 | | | (0.2) | | | | — | | | — | | | — | | | — | |
| Prior service credit recognized: | | | | | | | | | | | | | | | | |
| Reclassification adjustments | — | | | — | | | — | | | — | | | | (0.1) | | | — | | | (0.1) | | | — | |
| | | | | | | | | | | | | | | | |
| Translation adjustment | — | | | (1.4) | | | — | | | 7.3 | | | | — | | | 0.1 | | | — | | | (0.1) | |
| Amounts recognized in OCIL during the period | 0.6 | | | (10.9) | | | 43.7 | | | 53.4 | | | | (4.1) | | | 1.7 | | | 24.5 | | | 4.7 | |
| Unrecognized amounts in AOCL at end of period | $ | (58.3) | | | $ | (72.1) | | | $ | (58.9) | | | $ | (61.2) | | | | $ | 35.1 | | | $ | 5.9 | | | $ | 39.2 | | | $ | 4.2 | |
Lear Corporation and Subsidiaries
Notes to Consolidated Financial Statements (continued)
Other Comprehensive Income (Loss) and Accumulated Other Comprehensive Loss
Pretax amounts recorded in accumulated other comprehensive loss not yet recognized in other comprehensive income (loss) for the years endednet periodic benefit cost (credit) as of December 31, 20202023 and 2019,2022, are shown below (in millions):
| | | | | | | | | | | | | | | | | | | | | | | | | | | | | | | | | | | | | | | | | | | | | | | | | | |
| | Pension | | | Other Postretirement |
| | December 31, 2020 | | December 31, 2019 | | | December 31, 2020 | | December 31, 2019 |
| | U.S. | | Foreign | | U.S. | | Foreign | | | U.S. | | Foreign | | U.S. | | Foreign |
| Actuarial gains (losses) recognized: | | | | | | | | | | | | | | | | |
| Reclassification adjustments | $ | 2.3 | | | $ | 5.2 | | | $ | 1.8 | | | $ | 7.8 | | | | $ | (1.6) | | | $ | 0 | | | $ | (2.3) | | | $ | 0 | |
| Actuarial loss arising during the period | (46.1) | | | (39.7) | | | (21.7) | | | (33.8) | | | | (6.9) | | | (2.1) | | | (4.5) | | | 0 | |
| Effect of curtailment | 0 | | | 0 | | | 0 | | | 0.1 | | | | 0 | | | 0 | | | 0 | | | 0 | |
| Effect of settlements | 0.3 | | | 13.0 | | | 0.1 | | | 0 | | | | 0 | | | 0 | | | 0 | | | 0 | |
| Prior service credit recognized: | | | | | | | | | | | | | | | | |
| Reclassification adjustments | 0 | | | 0 | | | 0 | | | 0 | | | | (0.2) | | | 0 | | | (0.2) | | | (0.2) | |
| Prior service cost arising during the period | 0 | | | 0 | | | 0 | | | 0 | | | | (0.4) | | | 0 | | | 0 | | | 0 | |
| Translation adjustment | 0 | | | (3.6) | | | 0 | | | (3.8) | | | | 0 | | | 0 | | | 0 | | | 0 | |
| $ | (43.5) | | | $ | (25.1) | | | $ | (19.8) | | | $ | (29.7) | | | | $ | (9.1) | | | $ | (2.1) | | | $ | (7.0) | | | $ | (0.2) | |
| | | | | | | | | | | | | | | | | | | | | | | | | | | | | | | | | | | | | | | | | | | | | | | | | | |
| | Pension | | | Other Postretirement |
| | December 31, 2023 | | December 31, 2022 | | | December 31, 2023 | | December 31, 2022 |
| | U.S. | | Foreign | | U.S. | | Foreign | | | U.S. | | Foreign | | U.S. | | Foreign |
| Net unrecognized actuarial gains (losses) | $ | (58.3) | | | $ | (71.6) | | | $ | (58.9) | | | $ | (60.7) | | | | $ | 34.2 | | | $ | 5.8 | | | $ | 38.2 | | | $ | 4.1 | |
| Prior service credit (cost) | — | | | (0.5) | | | — | | | (0.5) | | | | 0.9 | | | 0.1 | | | 1.0 | | | 0.1 | |
| Unrecognized amounts in AOCL at end of period | $ | (58.3) | | | $ | (72.1) | | | $ | (58.9) | | | $ | (61.2) | | | | $ | 35.1 | | | $ | 5.9 | | | $ | 39.2 | | | $ | 4.2 | |
In addition, the Company recognized tax benefit (expense) in other comprehensive income (loss) related to its defined benefit plans of $18.5$2.2 million, $13.7($24.9) million and ($3.0)22.7) million for the years ended December 31, 2020, 20192023, 2022 and 2018,2021, respectively.
Pretax amounts recorded in accumulated other comprehensive loss not yet recognized in net periodic benefit cost as of December 31, 2020 and 2019, are shown below (in millions):
| | | | | | | | | | | | | | | | | | | | | | | | | | | | | | | | | | | | | | | | | | | | | | | | | | |
| | Pension | | | Other Postretirement |
| | December 31, 2020 | | December 31, 2019 | | | December 31, 2020 | | December 31, 2019 |
| | U.S. | | Foreign | | U.S. | | Foreign | | | U.S. | | Foreign | | U.S. | | Foreign |
| Net unrecognized actuarial gain (loss) | $ | (149.4) | | | $ | (160.7) | | | $ | (105.9) | | | $ | (135.9) | | | | $ | 11.2 | | | $ | (3.0) | | | $ | 19.6 | | | $ | (0.9) | |
| Prior service (cost) credit | 0 | | | (1.5) | | | 0 | | | (1.2) | | | | 1.2 | | | 0.1 | | | 1.9 | | | 0.1 | |
| $ | (149.4) | | | $ | (162.2) | | | $ | (105.9) | | | $ | (137.1) | | | | $ | 12.4 | | | $ | (2.9) | | | $ | 21.5 | | | $ | (0.8) | |
The Company uses the corridor approach when amortizing actuarial gains and losses. Under the corridor approach, net unrecognized actuarial gains and losses in excess of 10% of the greater of i) the projected benefit obligation or ii) the fair value of plan assets are amortized over future periods. For plans with little to no active participants, the amortization period is the remaining average life expectancy of the participants. For plans with active participants, the amortization period is the remaining average service period of the active participants. The amortization periods range from 43 to 3431 years for the Company's defined benefit pension plans and from 16 to 1715 years for the Company's other postretirement benefit plans.
The components of the Company's net periodic pension benefit cost (credit) are shown below (in millions):
| | | | | | | | | | | | | | | | | | | | | | | | | | | | | | | | | | | |
| | Year Ended December 31, |
| 2023 | | 2022 | | 2021 |
| Pension | U.S. | | Foreign | | U.S. | | Foreign | | U.S. | | Foreign |
| Service cost | $ | — | | | $ | 3.4 | | | $ | — | | | $ | 4.2 | | | $ | — | | | $ | 5.3 | |
| Interest cost | 20.7 | | | 16.7 | | | 15.5 | | | 11.2 | | | 14.5 | | | 10.5 | |
| Expected return on plan assets | (20.3) | | | (16.2) | | | (23.9) | | | (17.2) | | | (23.5) | | | (19.6) | |
| Amortization of actuarial loss | 1.0 | | | 1.9 | | | 2.0 | | | 4.1 | | | 3.9 | | | 6.1 | |
| | | | | | | | | | | |
| | | | | | | | | | | |
| Settlement (gains) losses | (0.1) | | | (0.4) | | | 0.4 | | | (0.2) | | | 0.4 | | | — | |
| Net periodic benefit cost (credit) | $ | 1.3 | | | $ | 5.4 | | | $ | (6.0) | | | $ | 2.1 | | | $ | (4.7) | | | $ | 2.3 | |
The components of the Company's net periodic other postretirement benefit cost (credit) are shown below (in millions):
| | | | | | | | | | | | | | | | | | | | | | | | | | | | | | | | | | | |
| | Year Ended December 31, |
| 2023 | | 2022 | | 2021 |
| Other Postretirement | U.S. | | Foreign | | U.S. | | Foreign | | U.S. | | Foreign |
| | | | | | | | | | | |
| Interest cost | $ | 1.5 | | | $ | 0.9 | | | $ | 1.5 | | | $ | 0.7 | | | $ | 1.4 | | | $ | 0.7 | |
| Amortization of actuarial gains | (3.3) | | | (0.2) | | | (1.2) | | | — | | | (1.1) | | | — | |
| Amortization of prior service credit | (0.1) | | | — | | | (0.1) | | | — | | | (0.1) | | | — | |
| | | | | | | | | | | |
| | | | | | | | | | | |
| Net periodic benefit cost (credit) | $ | (1.9) | | | $ | 0.7 | | | $ | 0.2 | | | $ | 0.7 | | | $ | 0.2 | | | $ | 0.7 | |
Lear Corporation and Subsidiaries
Notes to Consolidated Financial Statements (continued)
Net Periodic Pension and Other Postretirement Benefit Cost (Credit)
The components of the Company’s net periodic pension benefit cost (credit) are shown below (in millions):
| | | | | | | | | | | | | | | | | | | | | | | | | | | | | | | | | | | |
| | Year Ended December 31, |
| 2020 | | 2019 | | 2018 |
| Pension | U.S. | | Foreign | | U.S. | | Foreign | | U.S. | | Foreign |
| Service cost | $ | 0.1 | | | $ | 5.0 | | | $ | 0.1 | | | $ | 6.3 | | | $ | 0.1 | | | $ | 6.9 | |
| Interest cost | 16.4 | | | 12.2 | | | 18.6 | | | 14.7 | | | 19.8 | | | 14.7 | |
| Expected return on plan assets | (21.4) | | | (19.6) | | | (20.2) | | | (20.9) | | | (27.3) | | | (23.0) | |
| Amortization of actuarial loss | 2.3 | | | 5.2 | | | 1.8 | | | 7.8 | | | 2.0 | | | 6.2 | |
| | | | | | | | | | | |
| Curtailment (gain) loss | 0 | | | 0 | | | 0 | | | (2.3) | | | 0 | | | 0.4 | |
| Settlement losses | 0.3 | | | 13.0 | | | 0.1 | | | 0 | | | 5.7 | | | 0 | |
| Net periodic benefit cost (credit) | $ | (2.3) | | | $ | 15.8 | | | $ | 0.4 | | | $ | 5.6 | | | $ | 0.3 | | | $ | 5.2 | |
The components of the Company’s net periodic other postretirement benefit cost (credit) are shown below (in millions):
| | | | | | | | | | | | | | | | | | | | | | | | | | | | | | | | | | | |
| | Year Ended December 31, |
| 2020 | | 2019 | | 2018 |
| Other Postretirement | U.S. | | Foreign | | U.S. | | Foreign | | U.S. | | Foreign |
| Service cost | $ | 0 | | | $ | 0 | | | $ | 0 | | | $ | 0.3 | | | $ | 0 | | | $ | 0.4 | |
| Interest cost | 1.7 | | | 0.7 | | | 2.1 | | | 1.3 | | | 1.9 | | | 1.4 | |
| Amortization of actuarial (gain) loss | (1.6) | | | 0 | | | (2.3) | | | 0 | | | (2.2) | | | 0.2 | |
| Amortization of prior service credit | (0.2) | | | 0 | | | (0.2) | | | (0.2) | | | (0.2) | | | (0.3) | |
| Curtailment gain | 0 | | | 0 | | | 0 | | | (10.6) | | | 0 | | | 0 | |
| | | | | | | | | | | |
| Net periodic benefit cost (credit) | $ | (0.1) | | | $ | 0.7 | | | $ | (0.4) | | | $ | (9.2) | | | $ | (0.5) | | | $ | 1.7 | |
For the year ended December 31, 2020, the Company recognized pension settlement losses of $12.9 million related to its restructuring actions (Note 5, "Restructuring").
For the year ended December 31, 2019, the Company recognized an other postretirement curtailment gain of $10.6 million related to its restructuring actions (Note 5, "Restructuring").
For the year ended December 31, 2018, the Company recognized pension settlement losses of $5.4 million related to its annuity purchase for certain terminated vested plan participants of its U.S. defined benefit pension plans.
Assumptions
The weighted average actuarial assumptions used in determining the benefit obligations are shown below:
| | | | | | | | | | | | | | | | | | | | | | | |
| | Pension | | Other Postretirement |
| December 31, | 2020 | | 2019 | | 2020 | | 2019 |
| Discount rate: | | | | | | | |
| Domestic plans | 2.6% | | 3.4% | | 2.4% | | 3.2% |
| Foreign plans | 2.0% | | 2.6% | | 2.5% | | 3.1% |
| Rate of compensation increase: | | | | | | | |
| Foreign plans | 3.3% | | 3.7% | | N/A | | N/A |
| | | | | | | | | | | | | | | | | | | | | | | |
| | Pension | | Other Postretirement |
| December 31, | 2023 | | 2022 | | 2023 | | 2022 |
| Discount rate: | | | | | | | |
| Domestic plans | 5.2% | | 5.5% | | 5.1% | | 5.5% |
| Foreign plans | 4.4% | | 5.0% | | 4.6% | | 5.3% |
| Rate of compensation increase: | | | | | | | |
| Foreign plans | 2.6% | | 2.5% | | N/A | | N/A |
Table of ContentsLear Corporation and Subsidiaries
Notes to Consolidated Financial Statements (continued)
The weighted average actuarial assumptions used in determining the net periodic benefit cost (credit) are shown below:
| | For the year ended December 31, | For the year ended December 31, | 2020 | | 2019 | | 2018 | For the year ended December 31, | 2023 | | 2022 | | 2021 |
| Pension | Pension | |
| Discount rate: | Discount rate: | |
| Discount rate: | |
| Discount rate: | |
| Domestic plans | |
| Domestic plans | |
| Domestic plans | Domestic plans | 3.4 | % | | 4.3 | % | | 3.6 | % | 5.5 | % | | 3.0 | % | | 2.6 | % |
| Foreign plans | Foreign plans | 2.6 | % | | 3.4 | % | | 3.1 | % | Foreign plans | 5.0 | % | | 2.5 | % | | 2.0 | % |
| Expected return on plan assets: | Expected return on plan assets: | |
| Domestic plans | Domestic plans | 5.8 | % | | 6.3 | % | | 6.5 | % |
| Domestic plans | |
| Domestic plans | | 6.0 | % | | 5.5 | % | | 5.8 | % |
| Foreign plans | Foreign plans | 5.4 | % | | 5.9 | % | | 5.9 | % | Foreign plans | 5.4 | % | | 4.6 | % | | 5.2 | % |
| Rate of compensation increase: | Rate of compensation increase: | |
| Foreign plans | Foreign plans | 3.7 | % | | 3.4 | % | | 3.3 | % |
| Foreign plans | |
| Foreign plans | | 2.5 | % | | 3.5 | % | | 3.3 | % |
| Other postretirement | Other postretirement | |
| Discount rate: | Discount rate: | |
| Discount rate: | |
| Discount rate: | |
| Domestic plans | |
| Domestic plans | |
| Domestic plans | Domestic plans | 3.2 | % | | 4.2 | % | | 3.5 | % | 5.5 | % | | 2.8 | % | | 2.4 | % |
| Foreign plans | Foreign plans | 3.1 | % | | 3.8 | % | | 3.5 | % | Foreign plans | 5.3 | % | | 3.1 | % | | 2.5 | % |
The expected return on plan assets is determined based on several factors, including adjusted historical returns, historical risk premiums for various asset classes and target asset allocations within the portfolio. Adjustments made to the historical returns are based on recent return experience in the equity and fixed income markets and the belief that deviations from historical returns are likely over the relevant investment horizon.
As of December 31, 20202023 and 2019,2022, the weighted-average interest crediting rate used by one of the Company's U.S. pension plans was a minimum of 4.0%4.7%.
Healthcare Trend Rate
The assumed healthcare cost trend rates used to measure the postretirement benefit obligation as of December 31, 2020,2023, are shown below:
| | | | | | | | | | | |
| U.S. Plans | | Foreign Plans |
| Initial healthcare cost trend rate | 6.5% | | 4.7% |
| Ultimate healthcare cost trend rate | 4.5% | | 4.0% |
| Year ultimate healthcare cost trend rate achieved | 2028 | | 2040 |
| | | | | | | | | | | |
| U.S. Plans | | Foreign Plans |
| Initial healthcare cost trend rate | 6.3% | | 4.9% |
| Ultimate healthcare cost trend rate | 4.5% | | 4.0% |
| Year ultimate healthcare cost trend rate achieved | 2030 | | 2040 |
Lear Corporation and Subsidiaries
Notes to Consolidated Financial Statements (continued)
Plan Assets
Fair value measurements and the related valuation techniques and fair value hierarchy level for the Company’sCompany's pension plan assets measured at fair value on a recurring basis as of December 31, 20202023 and 2019,2022, are shown below (in millions):
| | December 31, 2020 |
| Total | | Level 1 | | Level 2 | | Level 3 | | Valuation Technique |
| December 31, 2023 | | | December 31, 2023 |
| Total | | | Total | | Level 1 | | Level 2 | | Level 3 | | Valuation Technique |
| U.S. Plans: | U.S. Plans: | |
| Equity securities - | Equity securities - | |
| Equity securities - | |
| Equity securities - | |
| Equity funds | |
| Equity funds | |
| Equity funds | Equity funds | $ | 104.3 | | | $ | 85.9 | | | $ | 18.4 | | | $ | 0 | | | Market | $ | 58.7 | | | $ | | $ | 46.6 | | | $ | | $ | 12.1 | | | $ | | $ | — | | | Market | | Market |
| Common stock | Common stock | 85.2 | | | 53.9 | | | 31.3 | | | 0 | | | Market | Common stock | 50.3 | | | 44.9 | | 44.9 | | | 5.4 | | 5.4 | | | — | | — | | | Market | | Market |
| Fixed income - | Fixed income - | |
| Fixed income funds | Fixed income funds | 84.2 | | | 84.2 | | | 0 | | | 0 | | | Market |
| Fixed income funds | |
| Fixed income funds | | 74.7 | | | 74.7 | | | — | | | — | | | Market |
| Corporate bonds | Corporate bonds | 66.7 | | | 0 | | | 66.7 | | | 0 | | | Market | Corporate bonds | 95.4 | | | — | | — | | | 95.4 | | 95.4 | | | — | | — | | | Market | | Market |
| Government obligations | Government obligations | 6.2 | | | 0 | | | 6.2 | | | 0 | | | Market | Government obligations | 18.6 | | | — | | — | | | 18.6 | | 18.6 | | | — | | — | | | Market | | Market |
| Preferred stock | 1.4 | | | 0.9 | | | 0.5 | | | 0 | | | Market |
| Cash and short-term investments | Cash and short-term investments | 11.9 | | | 2.8 | | | 9.1 | | | 0 | | | Market | Cash and short-term investments | 8.3 | | | 6.8 | | 6.8 | | | 1.5 | | 1.5 | | | — | | — | | | Market | | Market |
| Assets at fair value | Assets at fair value | 359.9 | | | $ | 227.7 | | | $ | 132.2 | | | $ | 0 | | |
| Investments measured at net asset value - | Investments measured at net asset value - | | | |
| Investments measured at net asset value - | |
| Investments measured at net asset value - | |
| Alternative investments | |
| Alternative investments | |
| Alternative investments | Alternative investments | 58.3 | | |
| Assets at fair value | Assets at fair value | $ | 418.2 | | |
| Assets at fair value | |
| Assets at fair value | |
| Foreign Plans: | |
| Foreign Plans: | |
| Foreign Plans: | Foreign Plans: | |
| Equity securities - | Equity securities - | |
| Equity securities - | |
| Equity securities - | |
| Equity funds | |
| Equity funds | |
| Equity funds | Equity funds | $ | 138.0 | | | $ | 0 | | | $ | 138.0 | | | $ | 0 | | | Market | $ | 30.4 | | | $ | | $ | — | | | $ | | $ | 30.4 | | | $ | | $ | — | | | Market | | Market |
| Common stock | Common stock | 60.9 | | | 60.9 | | | 0 | | | 0 | | | Market | Common stock | 18.4 | | | 18.4 | | 18.4 | | | — | | — | | | — | | — | | | Market | | Market |
| Fixed income - | Fixed income - | |
| Fixed income funds | |
| Fixed income funds | |
| Fixed income funds | Fixed income funds | 58.4 | | | 0 | | | 58.4 | | | 0 | | | Market | 49.5 | | | — | | — | | | 49.5 | | 49.5 | | | — | | — | | | Market | | Market |
| Corporate bonds | Corporate bonds | 30.8 | | | 0 | | | 30.8 | | | 0 | | | Market | Corporate bonds | 23.9 | | | — | | — | | | 23.9 | | 23.9 | | | — | | — | | | Market | | Market |
| Government obligations | Government obligations | 49.5 | | | 0 | | | 49.5 | | | 0 | | | Market | Government obligations | 175.7 | | | — | | — | | | 175.7 | | 175.7 | | | — | | — | | | Market | | Market |
| | Cash and short-term investments | Cash and short-term investments | 15.1 | | | 7.0 | | | 8.1 | | | 0 | | | Market |
| Cash and short-term investments | |
| Cash and short-term investments | | 13.5 | | | 9.3 | | | 4.2 | | | — | | | Market |
| Assets at fair value | Assets at fair value | 352.7 | | | $ | 67.9 | | | $ | 284.8 | | | $ | 0 | | |
| Investments measured at net asset value - | Investments measured at net asset value - | | | |
| Investments measured at net asset value - | |
| Investments measured at net asset value - | |
| Alternative investments | Alternative investments | 30.3 | | |
| Alternative investments | |
| Alternative investments | |
| Assets at fair value | |
| Assets at fair value | |
| Assets at fair value | Assets at fair value | $ | 383.0 | | |
|
Lear Corporation and Subsidiaries
Notes to Consolidated Financial Statements (continued)
| | December 31, 2019 |
| Total | | Level 1 | | Level 2 | | Level 3 | | Valuation Technique |
| December 31, 2022 | | | December 31, 2022 |
| Total | | | Total | | Level 1 | | Level 2 | | Level 3 | | Valuation Technique |
| U.S. Plans: | U.S. Plans: | |
| Equity securities - | Equity securities - | |
| Equity securities - | |
| Equity securities - | |
| Equity funds | |
| Equity funds | |
| Equity funds | Equity funds | $ | 103.6 | | | $ | 81.5 | | | $ | 22.1 | | | $ | 0 | | | Market | $ | 65.2 | | | $ | | $ | 52.1 | | | $ | | $ | 13.1 | | | $ | | $ | — | | | Market | | Market |
| Common stock | Common stock | 77.4 | | | 45.5 | | | 31.9 | | | 0 | | | Market | Common stock | 54.9 | | | 39.8 | | 39.8 | | | 15.1 | | 15.1 | | | — | | — | | | Market | | Market |
| Fixed income - | Fixed income - | |
| Fixed income funds | |
| Fixed income funds | |
| Fixed income funds | Fixed income funds | 76.0 | | | 76.0 | | | 0 | | | 0 | | | Market | 79.1 | | | 79.1 | | 79.1 | | | — | | — | | | — | | — | | | Market | | Market |
| Corporate bonds | Corporate bonds | 53.9 | | | 0 | | | 53.9 | | | 0 | | | Market | Corporate bonds | 63.4 | | | — | | — | | | 63.4 | | 63.4 | | | — | | — | | | Market | | Market |
| Government obligations | Government obligations | 7.3 | | | 0 | | | 7.3 | | | 0 | | | Market | Government obligations | 9.7 | | | — | | — | | | 9.7 | | 9.7 | | | — | | — | | | Market | | Market |
| Preferred stock | Preferred stock | 1.2 | | | 0.6 | | | 0.6 | | | 0 | | | Market | Preferred stock | 0.2 | | | 0.2 | | 0.2 | | | — | | — | | | — | | — | | | Market | | Market |
| Cash and short-term investments | Cash and short-term investments | 14.0 | | | 8.4 | | | 5.6 | | | 0 | | | Market | Cash and short-term investments | 13.4 | | | 2.8 | | 2.8 | | | 10.6 | | 10.6 | | | — | | — | | | Market | | Market |
| Assets at fair value | Assets at fair value | 333.4 | | | $ | 212.0 | | | $ | 121.4 | | | $ | 0 | | |
| Investments measured at net asset value - | Investments measured at net asset value - | | | |
| Investments measured at net asset value - | |
| Investments measured at net asset value - | |
| Alternative investments | |
| Alternative investments | |
| Alternative investments | Alternative investments | 43.2 | | |
| Assets at fair value | Assets at fair value | $ | 376.6 | | |
| Assets at fair value | |
| Assets at fair value | |
| Foreign Plans: | |
| Foreign Plans: | |
| Foreign Plans: | Foreign Plans: | |
| Equity securities - | Equity securities - | |
| Equity securities - | |
| Equity securities - | |
| Equity funds | |
| Equity funds | |
| Equity funds | Equity funds | $ | 148.4 | | | $ | 0 | | | $ | 148.4 | | | $ | 0 | | | Market | $ | 55.2 | | | $ | | $ | — | | | $ | | $ | 55.2 | | | $ | | $ | — | | | Market | | Market |
| Common stock | Common stock | 66.7 | | | 66.7 | | | 0 | | | 0 | | | Market | Common stock | 32.9 | | | 32.9 | | 32.9 | | | — | | — | | | — | | — | | | Market | | Market |
| Fixed income - | Fixed income - | |
| Fixed income funds | |
| Fixed income funds | |
| Fixed income funds | Fixed income funds | 45.6 | | | 0 | | | 45.6 | | | 0 | | | Market | 43.4 | | | — | | — | | | 43.4 | | 43.4 | | | — | | — | | | Market | | Market |
| Corporate bonds | Corporate bonds | 31.5 | | | 0 | | | 31.5 | | | 0 | | | Market | Corporate bonds | 15.9 | | | — | | — | | | 15.9 | | 15.9 | | | — | | — | | | Market | | Market |
| Government obligations | Government obligations | 55.8 | | | 0 | | | 55.8 | | | 0 | | | Market | Government obligations | 113.2 | | | — | | — | | | 113.2 | | 113.2 | | | — | | — | | | Market | | Market |
| | Cash and short-term investments | Cash and short-term investments | 10.9 | | | 7.7 | | | 3.2 | | | 0 | | | Market |
| Cash and short-term investments | |
| Cash and short-term investments | | 13.3 | | | 3.2 | | | 10.1 | | | — | | | Market |
| Assets at fair value | Assets at fair value | 358.9 | | | $ | 74.4 | | | $ | 284.5 | | | $ | 0 | | |
| Investments measured at net asset value - | Investments measured at net asset value - | | | |
| Investments measured at net asset value - | |
| Investments measured at net asset value - | |
| Alternative investments | Alternative investments | 37.9 | | |
| Alternative investments | |
| Alternative investments | |
| Assets at fair value | |
| Assets at fair value | |
| Assets at fair value | Assets at fair value | $ | 396.8 | | |
|
For further information on the GAAP fair value hierarchy, see Note 16, "Financial Instruments." Pension plan assets for the foreign plans relate to the Company’sCompany's pension plans primarily in Canada and the United Kingdom.
The Company’sCompany's investment policies incorporate an asset allocation strategy that emphasizes the long-term growth of capital. The Company believes that this strategy is consistent with the long-term nature of plan liabilities and ultimate cash needs of the plans. For the domestic portfolio, the Company targets a return seeking asset (e.g., equity securities, equity mutual funds, and exchange traded funds ("ETFs") and alternative investments) allocation of 45%40% — 65%60% and a risk mitigating asset (e.g., fixed income securities, and fixed income mutual funds and ETFs) allocation of 35%40% — 55%60%. As the funding ratio for the defined benefit pension plans covering certain domestic employees changes, the proportion of return seeking assets will be adjusted accordingly. For the foreign portfolio, the Company targets an equity allocation of 45%0% — 65%35% of plan assets, a fixed income allocation of 25%65% — 45%100%, an alternative investment allocation of 0% — 25%10% and a cash allocation of 0% — 15%10%. Differences in the target allocations of the domestic and foreign portfolios are reflective of differences in the underlying plan liabilities. Diversification within the investment portfolios is pursued by asset class and investment management style. The investment portfolios are reviewed on a quarterly basis to maintain the desired asset allocations, given the market performance of the asset classes and investment management styles. Alternative investments are redeemable in the near term, generally with 90 daysdays' notice.
The Company utilizes investment management firms to manage these assets in accordance with the Company’sCompany's investment policies. Excluding alternative investments, mutual funds and ETFs, retained investment managers are provided investment guidelines, which restrict the use of certain assets, including commodities contracts, futures contracts, options, venture capital, real estate, interest-only or principal-only strips and investments in the Company’sCompany's own debt or equity. Derivative instruments
Lear Corporation and Subsidiaries
Notes to Consolidated Financial Statements (continued)
are also prohibited without the specific approval of the Company. Investment managers are limited in the maximum size of individual security holdings and the maximum exposure to any one industry relative to the total portfolio. Fixed income managers are provided further investment guidelines that indicate minimum credit ratings for debt securities and limitations on weighted average maturity and portfolio duration.
The Company evaluates investment manager performance against market indices which the Company believes are appropriate to the investment management style for which the investment manager has been retained. The Company’sCompany's investment policies incorporate an investment goal of aggregate portfolio returns which exceed the returns of the appropriate market indices by a reasonable spread over the relevant investment horizon.
Contributions
In 2021,2024, the Company's minimum required contributions to its domestic and foreign pension plans are expected to be approximately $5 millionto $10 million.$2 million. The Company may elect to make contributions in excess of minimum funding requirements in response to investment performance or changes in interest rates or when the Company believes that it is financially advantageous to do so and based on its other cash requirements. After 2021,2024, the Company’sCompany's minimum funding requirements will depend on several factors, including investment performance and interest rates. The Company’sCompany's minimum funding requirements may also be affected by changes in applicable legal requirements.
Benefit Payments
As of December 31, 2020,2023, the Company’sCompany's estimate of expected benefit payments in each of the five succeeding years and in the aggregate for the five years thereafter are shown below (in millions):
| | | | Pension | | | Other Postretirement | | Pension | | | Other Postretirement |
| Year | Year | U.S. | | Foreign | | | U.S. | | Foreign | Year | U.S. | | Foreign | | | U.S. | | Foreign |
| 2021 | $ | 20.9 | | | $ | 19.3 | | | | $ | 4.0 | | | $ | 1.4 | |
| 2022 | 22.8 | | | 20.5 | | | | 4.0 | | | 1.5 | |
| 2023 | 23.5 | | | 20.2 | | | | 4.0 | | | 1.5 | |
| 2024 | 2024 | 23.5 | | | 21.0 | | | | 4.0 | | | 1.5 | |
| 2025 | 2025 | 24.5 | | | 22.0 | | | | 3.9 | | | 1.4 | |
| 2026 | |
| 2027 | |
| 2028 | |
| Five years thereafter | Five years thereafter | 130.8 | | | 127.9 | | | | 17.7 | | | 6.8 | |
Multi-Employer Pension Plans
The Company currently participates in 2two multi-employer pension plans, the U.A.W. Labor-Management Group Pension Plan (EIN 51-6099782-001) and UNITE Here National Retirement Fund (EIN 13-6130178-001), for certain of its employees. Contributions to these plans are based on 4four collective bargaining agreements, which expire between January 31, 2021July 21, 2024 and April 25, 2025.June 30, 2027.
Detailed information related to these plans is shown below (amounts in millions):
| | | | Pension Protection Act
Zone Status | | | | | | Contributions to Multiemployer Pension Plans | | Pension Protection Act
Zone Status | | | | Contributions to Multiemployer Pension Plans |
| Employer Identification Number ("EIN") | Employer Identification Number ("EIN") | December 31,
2020
Certification | | December 31,
2019
Certification | | FIP/RP
Pending or
Implemented | | Surcharge | | Year Ended December 31, 2020 | | Year Ended December 31, 2019 | | Year Ended December 31, 2018 | Employer Identification Number ("EIN") | December 31, 2022 Certification | | December 31, 2021 Certification | | FIP/RP (1) Pending or Implemented | | Surcharge | | Year Ended December 31, 2023 | | Year Ended December 31, 2022 | | Year Ended December 31, 2021 |
| 51-6099782-001 | 51-6099782-001 | Green | | Green | | Yes | | No | | $ | 0.6 | | | $ | 0.5 | | | $ | 0.6 | |
| 13-6130178-001 | 13-6130178-001 | Red | | Red | | Yes | | No | | 0.5 | | | 0.4 | | | 0.4 | |
(1) Funding improvement plan or rehabilitation plan as defined by Employment Retirement Security Act of 1974.
For its plan years 20202023 and 2019,2022, the Company's contributions to the U.A.W. Labor-Management Group Pension Plan represented more than 5% of the plan's total contributions.
Defined Contribution Plan
The Company also sponsors defined contribution plans and participates in government-sponsored programs in certain foreign countries. Contributions are determined as a percentage of each covered employee’semployee's salary. For the years ended December 31, 2020, 20192023, 2022 and 2018,2021, the aggregate cost of the defined contribution plans was $17.1$19.7 million, $14.0$18.2 million and $13.7$16.4 million, respectively.
Lear Corporation and Subsidiaries
Notes to Consolidated Financial Statements (continued)
The Company also has a defined contribution retirement program for its salaried employees. Contributions to this program are determined as a percentage of each covered employee’semployee's eligible compensation. For the years ended December 31, 2020, 20192023, 2022 and 2018,2021, the Company recorded expense of $18.3$27.6 million, $17.6$23.5 million and $21.5$20.4 million, respectively, related to this program.
(11) Revenue Recognition
A summary of the Company’sCompany's revenue by reportable operating segment and geography is shown below (in millions):
| | For the year ended December 31, | For the year ended December 31, | 2020 | For the year ended December 31, | 2023 |
| Seating | | E-Systems | | Total |
| Seating | | | Seating | | E-Systems | | Total |
| North America | North America | $ | 5,545.7 | | | $ | 1,084.8 | | | $ | 6,630.5 | |
| Europe and Africa | Europe and Africa | 4,371.4 | | | 1,868.9 | | | 6,240.3 | |
| Asia | Asia | 2,418.7 | | | 1,236.6 | | | 3,655.3 | |
| South America | South America | 376.9 | | | 142.5 | | | 519.4 | |
| $ | 12,712.7 | | | $ | 4,332.8 | | | $ | 17,045.5 | |
| $ | |
| | For the year ended December 31, | For the year ended December 31, | 2019 | For the year ended December 31, | 2022 |
| Seating | | E-Systems | | Total |
| Seating | | | Seating | | E-Systems | | Total |
| North America | North America | $ | 6,265.2 | | | $ | 1,100.3 | | | $ | 7,365.5 | |
| Europe and Africa | Europe and Africa | 5,620.2 | | | 2,165.3 | | | 7,785.5 | |
| Asia | Asia | 2,710.7 | | | 1,257.6 | | | 3,968.3 | |
| South America | South America | 501.1 | | | 189.9 | | | 691.0 | |
| $ | 15,097.2 | | | $ | 4,713.1 | | | $ | 19,810.3 | |
| $ | |
| | For the year ended December 31, | For the year ended December 31, | 2018 | For the year ended December 31, | 2021 |
| Seating | | E-Systems | | Total |
| Seating | | | Seating | | E-Systems | | Total |
| North America | North America | $ | 6,549.7 | | | $ | 1,110.9 | | | $ | 7,660.6 | |
| Europe and Africa | Europe and Africa | 6,299.0 | | | 2,427.9 | | | 8,726.9 | |
| Asia | Asia | 2,624.6 | | | 1,415.4 | | | 4,040.0 | |
| South America | South America | 548.6 | | | 172.4 | | | 721.0 | |
| $ | 16,021.9 | | | $ | 5,126.6 | | | $ | 21,148.5 | |
| $ | |
(12) Capital Stock, Accumulated Other Comprehensive Loss and Equity
Common Stock
The Company is authorized to issue up to 300,000,000 shares of Common Stock. The Company’sCompany's Common Stock is listed on the New York Stock Exchange under the symbol "LEA" and has the following rights and privileges:
•Voting Rights – All shares of the Company’sCompany's common stock have identical rights and privileges. With limited exceptions, holders of common stock are entitled to 1one vote for each outstanding share of common stock held of record by each stockholder on all matters properly submitted for the vote of the Company’sCompany's stockholders.
•Dividend Rights – Subject to applicable law, any contractual restrictions and the rights of the holders of outstanding preferred stock, if any, holders of common stock are entitled to receive ratably such dividends and other distributions that the Company’sCompany's Board of Directors (the "Board"), in its discretion, declares from time to time.
•Liquidation Rights – Upon the dissolution, liquidation or winding up of the Company, subject to the rights of the holders of outstanding preferred stock, if any, holders of common stock are entitled to receive ratably the assets of the Company available for distribution to the Company’sCompany's stockholders in proportion to the number of shares of common stock held by each stockholder.
•Conversion, Redemption and Preemptive Rights – Holders of common stock have no conversion, redemption, sinking fund, preemptive, subscription or similar rights.
Lear Corporation and Subsidiaries
Notes to Consolidated Financial Statements (continued)
Common Stock Share Repurchase Program
Since the first quarter of 2011, the Company's Board of Directors has authorized $6.1 billion in share repurchases under its common stock share repurchase program. As of December 31, 2020, the Company has paid $4.7 billion in aggregate for repurchases of its common stock, at an average price of $90.07 per share, excluding commissions and related fees. In March 2020, as a proactive measure in response to the COVID-19 pandemic, the Company suspended share repurchases under its share repurchase program.
Share repurchases are shown below (in millions except for shares and per share amounts):
| | | | | | | | | | | | | | | | | | | | | | | |
| For the year ended December 31, | Aggregate Repurchases | | Cash paid for Repurchases | | Number of Shares | | Average Price per Share (2) |
2020 (1) | $ | 70.0 | | | $ | 70.0 | | | 641,149 | | $ | 109.22 | |
| 2019 | $ | 380.4 | | | $ | 384.7 | | | 2,819,081 | | $ | 134.95 | |
| 2018 | $ | 705.2 | | | $ | 704.9 | | | 4,308,418 | | $ | 163.69 | |
(1) Prior to suspension.
(2) Excludes commissions.
As of December 31, 2020, the Company has a remaining repurchase authorization of $1.4 billion under its current common stock share repurchase program, which will expire on December 31, 2022. The Company may implement these share repurchases through a variety of methods, including, but not limited to, open market purchases, accelerated stock repurchase programs and structured repurchase transactions. The extent to which the Company willmay repurchase its outstanding common stock and the timing of such repurchases will depend upon its financial condition, results of operations, capital requirements, prevailing market conditions, alternative uses of capital and other factors.
The Company has a common stock share repurchase program (the "Repurchase Program") which permits the discretionary repurchase of its common stock. Since its inception in the first quarter of 2011, the Board has authorized $6.1 billion in share repurchases under the Repurchase Program. As of December 31, 2023, the Company has repurchased, in aggregate, $5.2 billion of its outstanding common stock, at an average price of $93.43 per share, excluding commissions and related fees. As of December 31, 2023, the Company has a remaining repurchase authorization of $0.9 billion under its Repurchase Program, which expires on December 31, 2024.
Share repurchases are shown below (in millions, except for shares and per share amounts):
| | | | | | | | | | | | | | | | | | | | | | | |
| For the year ended December 31, | Aggregate Repurchases | | Cash paid for Repurchases | | Number of Shares | | Average Price per Share (1) |
| 2023 | $ | 313.1 | | | $ | 296.5 | | | 2,281,723 | | $ | 137.21 | |
| 2022 | $ | 100.3 | | | $ | 100.3 | | | 763,309 | | | $ | 131.37 | |
| 2021 | $ | 100.3 | | | $ | 100.3 | | | 589,717 | | | $ | 170.03 | |
(1) Excludes commissions.
In addition to shares repurchased under the Company’s common stock share repurchase programRepurchase Program described above, the Company classifiedclassifies shares withheld from the settlement of the Company’sCompany's restricted stock unit and performance share awards to cover tax withholding requirements as common stock held in treasury in the accompanying consolidated balance sheets as of December 31, 2020 and 2019.sheet.
In 2018, the Company’s Board of Directors approved the retirement of 8 million shares of common stock held in treasury. These retired shares are reflected as authorized, but not issued, in the accompanying consolidated balance sheets as of December 31, 2020 and 2019. The retirement of shares held in treasury resulted in a reduction in the par value of common stock, additional paid-in capital and retained earnings of $0.1 million, $155.9 million and $1,014.2 million, respectively. These reductions were offset by a corresponding reduction in shares held in treasury of $1,170.2 million. Accordingly, there was no effect on stockholders' equity as a result of this transaction.
Quarterly Dividend
In March 2020, as2023 and 2022, the Board declared a proactive measure in response to the COVID-19 pandemic, the Company suspended its quarterly cash dividend. Prior todividend of $0.77 per share of common stock in all quarters.
In 2021, the suspension,Board declared a quarterly cash dividend of $0.25 per share of common stock in the Company’s Boardfirst and second quarters, a quarterly cash dividend of Directors declared$0.50 per share of common stock in the third quarter and a quarterly cash dividend of $0.77 per share of common stock in the first quarter of 2020. The quarterly cash dividend was reinstated in the fourth quarter of 2020 at $0.25 per share of common stock. In 2019 and 2018, the Company’s Board of Directors declared quarterly cash dividends of $0.75 and $0.70, respectively, per share of common stock.quarter.
Dividends declared and paid are shown below (in millions):
| | For the year ended December 31, | For the year ended December 31, | 2020 | | 2019 | | 2018 | For the year ended December 31, | 2023 | | 2022 | | 2021 |
| Dividends declared | Dividends declared | $ | 62.1 | | | $ | 186.3 | | | $ | 185.8 | |
| Dividends paid | Dividends paid | $ | 67.3 | | | $ | 186.3 | | | $ | 186.3 | |
Dividends payable on common shares to be distributed under the Company’sCompany's stock-based compensation program will be paid when such common shares are distributed.
Accumulated Other Comprehensive LossIncome
Comprehensive income is defined as all changes in the Company’sCompany's net assets except changes resulting from transactions with stockholders. It differs from net income in that certain items recorded in equity are included in comprehensive income.
Lear Corporation and Subsidiaries
Notes to Consolidated Financial Statements (continued)
Accumulated Other Comprehensive Loss
A summary of changes in accumulated other comprehensive loss, net of tax, is shown below (in millions):
| | For the year ended December 31, | For the year ended December 31, | 2020 | | 2019 | | 2018 | For the year ended December 31, | 2023 | | 2022 | | 2021 |
| Defined benefit plans: | Defined benefit plans: | |
| Balance at beginning of year | Balance at beginning of year | $ | (217.6) | | | $ | (172.8) | | | $ | (184.0) | |
| Reclassification adjustments (net of tax expense of $4.7 million in 2020, $2.0 million in 2019 and $2.4 million in 2018) | 14.3 | | | 5.0 | | | 9.0 | |
| Other comprehensive income (loss) recognized during the period (net of tax benefit (expense) of $23.2 million in 2020, $15.7 million in 2019 and ($0.6) million in 2018) | (73.6) | | | (49.8) | | | 2.2 | |
| Balance at beginning of year | |
| Balance at beginning of year | |
| Reclassification adjustments (net of tax benefit (expense) of $0.2 million in 2023, ($1.0) million in 2022 and ($2.1) million in 2021) | |
| Other comprehensive income (loss) recognized during the period (net of tax benefit (expense) of $2.0 million in 2023, ($23.9) million in 2022 and ($20.6) million in 2021) | |
| Balance at end of year | Balance at end of year | $ | (276.9) | | | $ | (217.6) | | | $ | (172.8) | |
| Derivative instruments and hedge activities: | Derivative instruments and hedge activities: | |
| Balance at beginning of year | Balance at beginning of year | $ | 9.8 | | | $ | (9.7) | | | $ | (22.9) | |
| Reclassification adjustments (net of tax benefit (expense) of ($1.8) million in 2020, $10.2 million in 2019 and $4.1 million in 2018) | 7.5 | | | (38.0) | | | (15.2) | |
| Other comprehensive income (loss) recognized during the period (net of tax benefit (expense) of $1.0 million in 2020, ($15.7) million in 2019 and ($7.4) million in 2018) | (4.7) | | | 57.5 | | | 28.4 | |
| Balance at beginning of year | |
| Balance at beginning of year | |
| Reclassification adjustments (net of tax benefit of $35.1 million in 2023, $8.5 million in 2022 and $8.7 million in 2021) | |
| Other comprehensive income recognized during the period (net of tax expense of $51.0 million in 2023, $19.1 million in 2022 and $1.2 million in 2021) | |
| Balance at end of year | Balance at end of year | $ | 12.6 | | | $ | 9.8 | | | $ | (9.7) | |
| Currency translation adjustments: | Currency translation adjustments: | |
| Balance at beginning of year | Balance at beginning of year | $ | (564.9) | | | $ | (523.3) | | | $ | (306.5) | |
| Other comprehensive income (loss) recognized during the period (net of tax benefit of $3.8 million in 2020, $0.9 million in 2019 and $2.3 million in 2018) | 124.1 | | | (41.6) | | | (216.8) | |
| Balance at beginning of year | |
| Balance at beginning of year | |
| Other comprehensive income (loss) recognized during the period (net of tax benefit (expense) of $1.2 million in 2023, ($4.7) million in 2022 and ($4.1) million in 2021) | |
| Balance at end of year | Balance at end of year | $ | (440.8) | | | $ | (564.9) | | | $ | (523.3) | |
For the years ended December 31, 2020, 20192023, 2022 and 2018,2021, other comprehensive income (loss) related to currency translation adjustments includes pretax losses related to intercompany transactions for which settlement is not planned or anticipated in the foreseeable future of $0.6$0.1 million, $0.5$2.6 million and $1.2$0.4 million, respectively.
For the years ended December 31, 20202023, 2022 and 2019,2021, other comprehensive income (loss) related to currency translation adjustments also includes net investment hedge lossesgains (losses) of $18.3($5.9) million, $25.3 million and $4.4$17.9 million, respectively.
Redeemable Noncontrolling Interest
In accordance with GAAP, the Company records redeemable noncontrolling interests at the greater of (1) the initial carrying amount adjusted for the noncontrolling interest holder’s share of total comprehensive income or loss and dividends ("noncontrolling interest carrying value") or (2) the redemption value as of and based on conditions existing as of the reporting date. Required redeemable noncontrolling interest adjustments are recorded as an increase to redeemable noncontrolling interests, with an offsetting adjustment to retained earnings. The redeemable noncontrolling interest is classified in mezzanine equity in the accompanying consolidated balance sheet as of December 31, 2019.
In 2020, the noncontrolling interest holder in Shanghai Lear STEC Automotive Parts Co., Ltd. exercised its option requiring the Company to purchase its 45% redeemable noncontrolling interest. The transaction was completed in the fourth quarter of 2020 for $95.5 million plus undistributed retained earnings of $26.8 million. These amounts are reflected in cash flows from financing activities in the accompanying statement of cash flows for the year ended December, 31, 2020.
For further information related to the redeemable noncontrolling interest adjustment, see Note 3, "Summary of Significant Accounting Policies — Net Income Per Share Attributable to Lear."
Noncontrolling Interests
In 2019,2021, the Company deconsolidated GACCsold a 49% equity interest in its wholly owned consolidated subsidiary, Shenyang Lear Jinbei Automotive Systems Co., Ltd. ("Shenyang Lear"), for $36.2 million. The Company continues to control Shenyang Lear, and as it no longer controlsa result, the entity. In 2018,operating results and cash flows of Shenyang Lear continue to be included in the Company gained controlCompany's consolidated financial statements. Noncontrolling interest of Lear FAWSN. For further information related to these transactions, see Note 6, "Investments$7.6 million was recorded in Affiliatesconjunction with the transaction. The difference between the consideration paid and Other Related Party Transactions."the carrying value of the noncontrolling interest recorded is reflected in additional paid-in capital in the accompanying consolidated balance sheets. The proceeds from the sale are classified within cash flows used in financing activities in the accompanying consolidated statement of cash flows for the year ended December 31, 2021.
Lear Corporation and Subsidiaries
Notes to Consolidated Financial Statements (continued)
(13) Stock-Based Compensation
As of November 9, 2009, the Company adopted the Lear Corporation 2009 Long-Term Stock Incentive Plan (as amended, the "2009 LTSIP"). The 2009 LTSIP reserved 11,815,748 shares of common stock for issuance under stock option, restricted stock, restricted stock unit, restricted unit, performance share, performance unit and stock appreciation right awards. As of May 16, 2019, the Company adopted the Lear Corporation 2019 Long-Term Stock Incentive Plan (the "2019 LTSIP"LTSIP," and together with the 2009 LTSIP, the "Plans"), after which no awards will be issued under the 2009 LTSIP. The 2019 LTSIP reserves 2,526,8584,226,858 shares of common stock plus shares of common stock awarded under the 2009 LTSIP that are cancelled subsequent to May 16, 2019, for issuance under stock option, restricted stock, restricted stock unit, restricted unit, performance share, performance unit and stock appreciation right awards. In addition, the Company adopted the Lear Corporation 2019 Inducement Grant Plan ("Inducement Plan") as of April 17, 2019, in conjunction with the acquisition of Xevo. The Inducement Plan reserved 146,516 shares of common stock for issuance under restricted stock and restricted stock unit awards, of which 145,202 awards were granted on April 17, 2019. The remaining shares under the Inducement Plan will not be awarded.
Under the 2009 LTSIP, the 2019 LTSIP and the Inducement Plan,Plans, the Company has granted restricted stock units, performance shares and stock options to certain of its employees, all of which generally vest in one to three years following the grant date. For the years ended December 31, 2020, 20192023, 2022 and 2018,2021, the Company recognized compensation expense related to these awards of $39.0$65.8 million, $22.3$50.3 million and $40.1
Lear Corporation and Subsidiaries
Notes to Consolidated Financial Statements (continued)
$58.7 million, respectively. Unrecognized compensation expense related to these awards of $65.5$67.8 million will be recognized over the next 1.91.6 years on a weighted average basis. In accordance with the provisions of the awards, the Company withholds shares from the settlement of such awards to cover minimum statutory tax withholding requirements. The withheld shares are classified as common stock held in treasury in the accompanying consolidated balance sheets as of December 31, 20202023 and 2019.2022.
A summary of restricted stock units, performance shares and stock options for the year ended December 31, 2020,2023, is shown below:
| | Restricted
Stock Units | Weighted Average Grant Date
Fair Value | Performance
Shares | Weighted Average Grant Date
Fair Value | Stock Options | Weighted Average Grant Date
Fair Value |
| Outstanding as of December 31, 2019 | 705,136 | | $128.71 | 849,544 | | $140.83 | 0 | | |
| Restricted
Stock Units | | | Restricted
Stock Units | Weighted Average Grant Date
Fair Value | Performance
Shares | Weighted Average Grant Date
Fair Value | Stock Options | Weighted Average Grant Date
Fair Value |
| Outstanding as of December 31, 2022 | | Outstanding as of December 31, 2022 | 494,461 | | $145.64 | 726,485 | | $201.83 | 202,702 | | $32.65 |
| Granted | Granted | 168,811 | | $129.40 | 346,317 | | $147.53 | 108,446 | | $30.32 | Granted | 240,389 | | $130.38 | $130.38 | 430,899 | | $138.54 | $138.54 | — | | | |
| Distributed (vested) | Distributed (vested) | (220,122) | | | (129,920) | | | 0 | | |
| Cancelled | Cancelled | (37,241) | | | (256,470) | | | 0 | | |
Outstanding as of December 31, 2020 (1) | 616,584 | | $124.83 | 809,471 | | $143.48 | 108,446 | | $30.32 |
| Cancelled | |
| Cancelled | |
Outstanding as of December 31, 2023 (1) | |
Outstanding as of December 31, 2023 (1) | |
Outstanding as of December 31, 2023 (1) | | 569,324 | | $138.21 | 914,911 | | $161.36 | 202,702 | | $32.65 |
| | Vested or expected to vest as of December 31, 2020 | 616,584 | | | 299,390 | | | 108,446 | | |
| Vested or expected to vest as of December 31, 2023 | |
| Vested or expected to vest as of December 31, 2023 | |
| Vested or expected to vest as of December 31, 2023 | |
(1)Outstanding performance shares are reflected at the maximum possible payout that may be earned during the relevant performance periods.
The grant date fair value of restricted stock units is based on the share price on the grant date. The weighted average grant date fair value of restricted stock units granted in 20192022 and 20182021 was $134.65$164.57 and $168.86,$165.28, respectively. The grant date fair value of performance shares wasis based on a Monte Carlo simulation in 2020 and 2019 and on the share price on the grant date in 2018.or a Monte Carlo simulation, as applicable. The weighted average grant date fair value of performance shares granted in 20192022 and 20182021 was $124.48$196.83 and $179.40,$188.11, respectively. The grant date fair value of stock options is based on a Black-Scholes model. The grant date fair value of options granted in 2021 was $35.33. There were no stock options granted in 2022.
(14) CommitmentsLegal and Other Contingencies
Legal and Other Contingencies
As of December 31, 20202023 and 2019,2022, the Company had recorded reserves for pending legal disputes, including commercial disputes, product liability claims and other legal matters, of $17.2$13.5 million and $14.0$15.9 million, respectively. Such reserves reflect amounts recognized in accordance with GAAP and typically exclude the cost of legal representation. Product liabilityReserves for warranty and warranty reservesrecall matters are recorded separately from legal reserves, as described below.
Lear Corporation and Subsidiaries
Notes to Consolidated Financial Statements (continued)
Commercial Disputes
The Company is involved from time to time in legal proceedings and claims, including, without limitation, commercial or contractual disputes with its customers, suppliers and competitors. These disputes vary in nature and are usually resolved by negotiations between the parties.
Product Liability, Warranty and WarrantyRecall Matters
In the event that use of the Company’sCompany's products results in, or is alleged to result in, bodily injury and/or property damage or other losses, the Company may be subject to product liability lawsuits and other claims. Such lawsuits generally seek compensatory damages, punitive damages and attorneys’attorneys' fees and costs. In addition, if any of the Company’sCompany's products are, or are alleged to be, defective, the Company may be required or requested by its customers to support warranty costs or to participate in a recall or other corrective action involving such products. Certain of the Company’sCompany's customers have asserted claims against the Company for costs related to recalls or other corrective actions involving its products. The Company can provide no assurances that it will not experience material claims in the future or that it will not incur significant costs to defend such claims.
To a lesser extent, theThe Company is a party to agreements with certain of its customers, whereby these customers may pursue claims against the Company for contribution of all or a portion of the amounts sought in connection with product liabilitywarranty and warranty claims.recall matters.
Lear Corporation and Subsidiaries
Notes to Consolidated Financial Statements (continued)
In certain instances, allegedly defective products may be supplied by Tier 2the Company's suppliers. The Company may seek recovery from its suppliers of materials or services included within the Company’sCompany's products that are associated with product liability claims and/or warranty and warranty claims.recall matters. The Company carries insurance for certain legal matters, including product liability claims, but such coverage may be limited. The Company does not maintain insurance for product warranty orand recall matters.
The Company records productreserves for warranty reservesand recall matters when liability is probable and related amounts are reasonably estimable.
A summary of the changes in reserves for product liabilitywarranty and warranty claimsrecall matters for each of the periods in the two years ended December 31, 2020,2023, is shown below (in millions):
| | | | | |
Balance as of January 1, 2019December 31, 2021 | $ | 28.546.0 | |
Expense, net including(including changes in estimatesestimates) | 17.96.6 | |
| Settlements | (15.2)(19.6) | |
| Foreign currency translation and other | 0.8 (2.6) | |
Balance as of December 31, 20192022 | 32.030.4 | |
Expense, net including(including changes in estimatesestimates) | 26.19.5 | |
| Settlements | (10.3)(13.2) | |
| Foreign currency translation and other | 0.95.7 | |
Balance as of December 31, 20202023 | $ | 48.732.4 | |
Environmental Matters
The Company is subject to local, state, federal and foreign laws, regulations and ordinances which govern activities or operations that may have or have had adverse environmental effects and whicheffects. These regulations impose liability for clean-up costs resulting from past spills, disposals or other releases of hazardous wastes and environmental compliance. The Company’sCompany's policy is to comply with all applicable environmental laws and to maintain an environmental management program based on ISO 14001 to ensure compliance with this standard. However, the Company currently is, has been and in the future may become the subject of formal or informal enforcement actions or procedures.
As of December 31, 20202023 and 2019,2022, the Company had recorded environmental reserves of $8.9$4.9 million and $9.3$7.9 million, respectively. The Company does not believe that the environmental liabilities associated with its current and former properties will have a material adverse impact on its business, financial condition, results of operations or cash flows; however, no assurances can be given in this regard.
Other Matters
The Company is involved from time to time in various other legal proceedings and claims, including, without limitation, intellectual property matters, tax claims and employment matters. Although the outcome of any legal matter cannot be predicted with certainty, the Company does not believe that any of the other legal proceedings or claims in which the Company is
Lear Corporation and Subsidiaries
Notes to Consolidated Financial Statements (continued)
currently involved, either individually or in the aggregate, will have a material adverse impact on its business, financial condition, results of operations or cash flows. However, no assurances can be given in this regard.
Although the Company records reserves for legal disputes, product liabilitywarranty and warranty claimsrecall matters, and environmental and other matters in accordance with GAAP, the ultimate outcomes of these matters are inherently uncertain. Actual results may differ significantly from current estimates.
Insurance Recoveries
The Company incurred losses and incremental costs related to the destruction of assets caused by a typhoon in the Philippines in December 2021. In 2022 and 2023, the Company reached an installment settlement and a final settlement, respectively, for the recovery of such costs under applicable insurance policies. Anticipated proceeds from insurance recoveries related to losses and incremental costs that have been incurred ("loss recoveries") are recognized when receipt is probable. Anticipated proceeds from insurance recoveries in excess of the net book value of destroyed property, plant and equipment ("insurance gain contingencies") are recognized when all contingencies related to the claim have been resolved. Loss recoveries related to the destruction of inventory and incremental costs are included in costs of sales and loss recoveries and insurance gain contingencies related to the destruction of property, plant and equipment are included in other expense, net. Cash proceeds related to the destruction of inventory and incremental costs are included in cash flows from operating activities and cash proceeds related to the destruction of property, plant and equipment are included in cash flows from investing activities.
Lear Corporation and Subsidiaries
Notes to Consolidated Financial Statements (continued)
As of December 31, 2023, the Company had incurred cumulative losses and incremental costs related to the typhoon of $27.1 million, of which $0.6 million was incurred in 2023. As of December 31, 2023, the Company received cumulative cash proceeds of $22.6 million, of which $9.3 million was received in 2023.
The classification of insurance recoveries included in the accompanying consolidated financial statements is shown below (in millions):
| | | | | | | | | | | |
| For the year ended December 31, | 2023 | | 2022 |
| Consolidated statements of income | | | |
| Cost of sales | $ | 3.9 | | | $ | 13.3 | |
| Other expense, net | 4.0 | | | 1.4 | |
| | | |
| Consolidated statements of cash flows | | | |
| Cash flows from operating activities | 8.2 | | | 12.8 | |
| Cash flows from investing activities | 1.1 | | | 0.5 | |
| | | |
Employees
Approximately 47% of the Company’sCompany's employees are members of industrial trade unions and are employed under the terms of various labor agreements. Labor agreements covering approximately 85%86% of the Company’sCompany's global unionized workforce of approximately 82,50088,000 employees including(including labor agreements in the United States and Canada covering approximately 1%2% of the Company’sCompany's global unionized workforce,workforce) are scheduled to expire in 2021.2024. Management does not anticipate any significant difficulties with respect to the renewal of these agreements.
(15) Segment Reporting
A summary of revenues from external customers and other financial information by reportable operating segment is shown below (in millions):
| | | | Year Ended December 31, 2020 | | Year Ended December 31, 2023 |
| | | Seating | | E-Systems | | Other | | Consolidated | | Seating | | E-Systems | | Other | | Consolidated |
| Revenues from external customers | Revenues from external customers | $ | 12,712.7 | | | $ | 4,332.8 | | | $ | 0 | | | $ | 17,045.5 | |
Segment earnings (1) | Segment earnings (1) | 590.5 | | | 98.1 | | | (234.5) | | | 454.1 | |
| Depreciation and amortization | Depreciation and amortization | 348.1 | | | 176.6 | | | 15.2 | | | 539.9 | |
| Capital expenditures | Capital expenditures | 257.2 | | | 179.3 | | | 15.8 | | | 452.3 | |
| Total assets | Total assets | 7,596.1 | | | 3,403.3 | | | 2,199.2 | | | 13,198.6 | |
| | | | Year Ended December 31, 2019 | | Year Ended December 31, 2022 |
| | | Seating | | E-Systems | | Other | | Consolidated | | Seating | | E-Systems | | Other | | Consolidated |
| Revenues from external customers | Revenues from external customers | $ | 15,097.2 | | | $ | 4,713.1 | | | $ | 0 | | | $ | 19,810.3 | |
Segment earnings (1) | Segment earnings (1) | 961.2 | | | 366.3 | | | (257.3) | | | 1,070.2 | |
| Depreciation and amortization | Depreciation and amortization | 331.0 | | | 163.0 | | | 15.9 | | | 509.9 | |
| Capital expenditures | Capital expenditures | 370.4 | | | 213.9 | | | 19.6 | | | 603.9 | |
| Total assets | Total assets | 7,277.6 | | | 3,068.1 | | | 2,335.0 | | | 12,680.7 | |
| | | | Year Ended December 31, 2018 | | Year Ended December 31, 2021 |
| | | Seating | | E-Systems | | Other | | Consolidated | | Seating | | E-Systems | | Other | | Consolidated |
| Revenues from external customers | Revenues from external customers | $ | 16,021.9 | | | $ | 5,126.6 | | | $ | 0 | | | $ | 21,148.5 | |
Segment earnings (1) | Segment earnings (1) | 1,263.6 | | | 628.5 | | | (238.0) | | | 1,654.1 | |
| Depreciation and amortization | Depreciation and amortization | 323.5 | | | 146.2 | | | 14.7 | | | 484.4 | |
| Capital expenditures | Capital expenditures | 459.8 | | | 208.4 | | | 8.8 | | | 677.0 | |
|
(1)For a definition of segment earnings, see Note 3 , "Summary of Significant Accounting Policies — Segment Reporting."
For the year ended December 31, 2020, segment earnings include restructuring charges of $83.1 million, $54.5 million and $1.1 million in the Seating and E-Systems segments and in the other category, respectively. The Company expects to incur approximately $11 million and approximately $7 million of additional restructuring costs in the Seating and E-Systems segments, respectively, related to activities initiated as of December 31, 2020, and expects that the components of such costs will be consistent with its historical experience.
For the year ended December 31, 2019, segment earnings include restructuring charges of $150.1 million, $38.0 million and $2.1 million in the Seating and E-Systems segments and in the other category, respectively.
For the year ended December 31, 2018, segment earnings include restructuring charges of $62.3 million, $20.9 million and $4.8 million in the Seating and E-Systems segments and in the other category, respectively.
Lear Corporation and Subsidiaries
Notes to Consolidated Financial Statements (continued)
For further information, see Note 5, "Restructuring."
A reconciliation of segment earnings to consolidated income before provision for income taxes and equity in net income of affiliates is shown below (in millions):
| | For the year ended December 31, | For the year ended December 31, | 2020 | | 2019 | | 2018 | For the year ended December 31, | 2023 | | 2022 | | 2021 |
| Segment earnings | Segment earnings | $ | 688.6 | | | $ | 1,327.5 | | | $ | 1,892.1 | |
| Corporate and regional headquarters and elimination of intercompany activity ("Other") | Corporate and regional headquarters and elimination of intercompany activity ("Other") | (234.5) | | | (257.3) | | | (238.0) | |
| Consolidated income before interest, other expense, provision for income taxes and equity in net income of affiliates | Consolidated income before interest, other expense, provision for income taxes and equity in net income of affiliates | 454.1 | | | 1,070.2 | | | 1,654.1 | |
| Interest expense | 99.6 | | | 92.0 | | | 84.1 | |
| Interest expense, net | |
| Other expense, net | Other expense, net | 55.2 | | | 24.6 | | | 31.6 | |
| Consolidated income before provision for income taxes and equity in net income of affiliates | Consolidated income before provision for income taxes and equity in net income of affiliates | $ | 299.3 | | | $ | 953.6 | | | $ | 1,538.4 | |
Revenues from external customers and tangible long-lived assets for each of the geographic areas in which the Company operates is shown below (in millions):
| | For the year ended December 31, | For the year ended December 31, | 2020 | | 2019 | | 2018 | For the year ended December 31, | 2023 | | 2022 | | 2021 |
| Revenues from external customers | Revenues from external customers | |
| United States | |
| United States | |
| United States | United States | $ | 3,599.1 | | | $ | 3,658.5 | | | $ | 3,717.7 | |
| Mexico | Mexico | 2,528.4 | | | 3,058.6 | | | 3,236.9 | |
| China | China | 2,592.7 | | | 2,579.7 | | | 2,781.5 | |
| Germany | Germany | 1,288.3 | | | 1,698.7 | | | 2,187.2 | |
| Other countries | Other countries | 7,037.0 | | | 8,814.8 | | | 9,225.2 | |
| Total | Total | $ | 17,045.5 | | | $ | 19,810.3 | | | $ | 21,148.5 | |
| | December 31, | December 31, | 2020 | | 2019 | December 31, | 2023 | | 2022 |
Tangible long-lived assets (1) | Tangible long-lived assets (1) | |
| United States | |
| United States | |
| United States | United States | $ | 534.0 | | | $ | 549.8 | |
| Mexico | Mexico | 689.9 | | | 700.1 | |
| China | China | 458.2 | | | 450.2 | |
| Germany | Germany | 205.8 | | | 204.9 | |
| Other countries | Other countries | 1,388.6 | | | 1,326.2 | |
| Total | Total | $ | 3,276.5 | | | $ | 3,231.2 | |
(1)Tangible long-lived assets include property, plant and equipment and right-of-use assets.
The following is aA summary of the percentage of revenues from major customers:customers is shown below:
| | | | | | | | | | | | | | | | | |
| For the year ended December 31, | 2020 | | 2019 | | 2018 |
| General Motors | 18.7% | | 18.2% | | 18.1% |
| Ford | 13.5% | | 13.8% | | 15.6% |
| Daimler | 11.9% | | 11.1% | | 9.9% |
| Volkswagen | 11.7% | | 10.9% | | 9.6% |
| | | | | | | | | | | | | | | | | |
| For the year ended December 31, | 2023 | | 2022 | | 2021 |
| General Motors | 19.8% | | 20.2% | | 18.2% |
| Ford | 11.4% | | 13.5% | | 13.5% |
| Volkswagen | 11.0% | | 10.8% | | 11.8% |
| Mercedes-Benz | 10.4% | | 11.3% | | 11.2% |
| Stellantis | 10.2% | | 10.3% | | 10.9% |
Lear Corporation and Subsidiaries
Notes to Consolidated Financial Statements (continued)
(16) Financial Instruments
Debt Instruments
The carrying values of the Notes vary from their fair values. The fair values of the Notes were determined by reference to the quoted market prices of these securities (Level 2 input based on the GAAP fair value hierarchy). The carrying value of the Company’s Term Loan Facility approximates its fair value (Level 3 input based on the GAAP fair value hierarchy). The.The estimated fair value, as well as the carrying value, of the Company's debt instruments are shown below (in millions):
| | December 31, | December 31, | 2020 | | 2019 | December 31, | 2023 | | 2022 |
Estimated aggregate fair value (1) | Estimated aggregate fair value (1) | $ | 2,633.3 | | | $ | 2,384.6 | |
Aggregate carrying value (1) (2) | Aggregate carrying value (1) (2) | 2,320.3 | | | 2,334.4 | |
(1) Includes Term Loan Facility and Notes (excludes Excludes "other" debt).debt.
(2) Excludes the impact of unamortized debt issuance costs and unamortized original issue premium (discount).
Cash, Cash Equivalents and Restricted Cash
The Company has cash on deposit that is legally restricted as to use or withdrawal. A reconciliation of cash and cash equivalents reported on the accompanying consolidated balance sheets to cash, cash equivalents and restricted cash reported on the accompanying consolidated statements of cash flows is shown below (in millions):
| | | | | | | | | | | | | | | | | |
| December 31, | 2020 | | 2019 | | 2018 |
| Balance sheet — cash and cash equivalents | $ | 1,306.7 | | | $ | 1,487.7 | | | $ | 1,493.2 | |
| Restricted cash included in other current assets | 5.1 | | | 15.9 | | | 8.7 | |
| Restricted cash included in other long-term assets | 2.7 | | | 6.8 | | | 17.9 | |
| Statement of cash flows — cash, cash equivalents and restricted cash | $ | 1,314.5 | | | $ | 1,510.4 | | | $ | 1,519.8 | |
Accounts Receivable Factoring
During the second quarter of 2020, the Company entered into an uncommitted factoring arrangement which provides for aggregate purchases of specified customer accounts in North America. The factoring arrangement results in true sales of the factored receivables, which are excluded from amounts reported in the consolidated balance sheets when the receivables are factored in accordance with ASC 860, "Transfers and Servicing." There were no receivables factored during the year ended December 31, 2020. The Company cannot provide any assurances that the factoring arrangement will be available or utilized in the future. | | | | | | | | | | | | | | | | | |
| December 31, | 2023 | | 2022 | | 2021 |
| Balance sheet — cash and cash equivalents | $ | 1,196.3 | | | $ | 1,114.9 | | | $ | 1,318.3 | |
| Restricted cash included in other current assets | 0.6 | | | 0.3 | | | 1.4 | |
| Restricted cash included in other long-term assets | 1.6 | | | 2.2 | | | 1.6 | |
| Statement of cash flows — cash, cash equivalents and restricted cash | $ | 1,198.5 | | | $ | 1,117.4 | | | $ | 1,321.3 | |
Marketable Equity Securities
Marketable equity securities, which the Company accounts for under the fair value option, are included in the accompanying consolidated balance sheets as shown below (in millions):
| | December 31, | December 31, | 2020 | | 2019 | December 31, | 2023 | | 2022 |
| Other current assets | Other current assets | $ | 9.3 | | | $ | 17.1 | |
| Other long-term assets | Other long-term assets | 49.4 | | | 42.1 | |
| $ | 58.7 | | | $ | 59.2 | |
| $ | |
Unrealized gains and losses arising from changes in the fair value of the marketable equity securities are recognized in other expense, net in the accompanying consolidated statements of income. The fair value of the marketable equity securities is determined by reference to quoted market prices in active markets (Level 1 input based on the GAAP fair value hierarchy).
Equity Securities Without Readily Determinable Fair Values
As of December 31, 20202023 and 2019,2022, investments in equity securities without readily determinable fair values of $11.2 million and $15.2$18.2 million, respectively, are included in other long-term assets in the accompanying consolidated balance sheets. Such investments are valued at cost, less any impairment,cumulative impairments and adjusted for changes resulting from observable, orderly transactions for identical or similar securities. For the years ended December 31, 20202023 and 2019,2021, the Company recognized impairment charges
Lear Corporation and Subsidiaries
Notes to Consolidated Financial Statements (continued)
of $4.0$7.0 million and $5.0$1.0 million, respectively, related to investmentscertain investments. Investments in equity securities without readily determinable fair values.values have been reduced for cumulative impairments of $17.0 million and $10.0 million as of December 31, 2023 and 2022, respectively.
Derivative Instruments and Hedging Activities
Foreign Exchange
The Company uses forwards, swaps and other derivative contracts to reduce the effects of fluctuations in foreign exchange rates on known foreign currency exposures. Gains and losses on the derivative instruments are intended to offset gains and losses on
Lear Corporation and Subsidiaries
Notes to Consolidated Financial Statements (continued)
the hedged transaction in an effort to reduce exposure to fluctuations in foreign exchange rates. The principal currencies hedged by the Company include the Mexican peso, various European currencies, the Japanese yen,Chinese renminbi, the Philippine peso, the Chinese renminbi, the Thai bahtJapanese yen and the Brazilian real.Canadian dollar.
Foreign currency derivative contracts not designated as hedging instruments consist principally of hedges of cash transactions, intercompany loans and certain other balance sheet exposures.
Net Investment Hedges
The Company uses cross-currency interest rate swaps which are designated as net investment hedges of the foreign currency rate exposure of its investment in certain Euro-denominated subsidiaries. For the years ended December 31, 2020 and 2019, contraContra interest expense on net investment hedges ofwas $2.3 million, $4.6 million and $6.5 million for the years ended December 31, 2023, 2022 and $1.8 million,2021, respectively, and is included in interest expense, net in the accompanying consolidated statements of income.
Balance Sheet Classification
The notional amount, estimated aggregate fair value and related balance sheet classification of the Company's foreign currency and net investment hedge contracts are shown below (in millions, except for maturities):
| | | | | | | | | | | |
| December 31, | 2020 | | 2019 |
| Fair value of foreign currency contracts designated as cash flow hedges: | | | |
| Other current assets | $ | 49.7 | | | $ | 44.0 | |
| Other long-term assets | 13.0 | | | 7.3 | |
| Other current liabilities | (14.1) | | | (4.5) | |
| Other long-term liabilities | (0.8) | | | (0.2) | |
| 47.8 | | | 46.6 | |
| Notional amount | $ | 1,353.3 | | | $ | 1,465.8 | |
| Outstanding maturities in months, not to exceed | 24 | | 24 |
| Fair value of derivatives designated as net investment hedges: | | | |
| | | |
| Other long-term liabilities | $ | (22.6) | | | $ | (4.4) | |
| | | |
| Notional amount | $ | 300.0 | | | $ | 300.0 | |
| Outstanding maturities in months, not to exceed | 45 | | 57 |
| Fair value of foreign currency contracts not designated as hedge instruments: | | | |
| Other current assets | $ | 5.8 | | | $ | 6.9 | |
| Other current liabilities | (6.1) | | | (3.2) | |
| (0.3) | | | 3.7 | |
| Notional amount | $ | 1,140.8 | | | $ | 697.0 | |
| Outstanding maturities in months, not to exceed | 12 | | 12 |
| Total fair value | $ | 24.9 | | | $ | 45.9 | |
| Total notional amount | $ | 2,794.1 | | | $ | 2,462.8 | |
| | | | | | | | | | | |
| December 31, | 2023 | | 2022 |
| Fair value of foreign currency contracts designated as cash flow hedges: | | | |
| Other current assets | $ | 137.2 | | | $ | 63.4 | |
| Other long-term assets | 19.9 | | | 10.3 | |
| Other current liabilities | (1.8) | | | (6.7) | |
| Other long-term liabilities | (0.5) | | | (0.2) | |
| 154.8 | | | 66.8 | |
| Notional amount | $ | 2,352.3 | | | $ | 1,546.9 | |
| Outstanding maturities in months, not to exceed | 24 | | 24 |
| Fair value of derivatives designated as net investment hedges: | | | |
| Other long-term assets | $ | — | | | $ | 4.8 | |
| | | |
| Other long-term liabilities | (1.1) | | | — | |
| (1.1) | | | 4.8 | |
| Notional amount | $ | 150.0 | | | $ | 150.0 | |
| Outstanding maturities in months, not to exceed | 27 | | 39 |
| Fair value of foreign currency contracts not designated as hedge instruments: | | | |
| Other current assets | $ | 5.8 | | | $ | 9.5 | |
| Other current liabilities | (1.2) | | | (13.4) | |
| 4.6 | | | (3.9) | |
| Notional amount | $ | 569.9 | | | $ | 758.6 | |
| Outstanding maturities in months, not to exceed | 1 | | 7 |
| Total fair value | $ | 158.3 | | | $ | 67.7 | |
| Total notional amount | $ | 3,072.2 | | | $ | 2,455.5 | |
Lear Corporation and Subsidiaries
Notes to Consolidated Financial Statements (continued)
Accumulated Other Comprehensive Loss — Derivative Instruments and Hedge Activities
Pretax amounts related to foreign currency interest rate swapcontracts and net investment hedge contractshedges that were recognized in and reclassified from accumulated other comprehensive loss are shown below (in millions):
| | For the year ended December 31, | For the year ended December 31, | 2020 | | 2019 | | 2018 | For the year ended December 31, | 2023 | | 2022 | | 2021 |
| Gains (losses) recognized in accumulated other comprehensive loss: | Gains (losses) recognized in accumulated other comprehensive loss: | |
| Foreign currency contracts | Foreign currency contracts | $ | (5.7) | | | $ | 82.4 | | | $ | 50.5 | |
| Interest rate swap contracts | 0 | | | (9.2) | | | (14.7) | |
| Foreign currency contracts | |
| Foreign currency contracts | |
| | Net investment hedges | Net investment hedges | (18.3) | | | (4.4) | | | 0 | |
| (24.0) | | | 68.8 | | | 35.8 | |
| Net investment hedges | |
| Net investment hedges | |
| 260.9 | |
| (Gains) losses reclassified from accumulated other comprehensive loss to: | (Gains) losses reclassified from accumulated other comprehensive loss to: | |
| Net sales | Net sales | (0.6) | | | 3.8 | | | 2.3 | |
| Net sales | |
| Net sales | |
| Cost of sales | Cost of sales | 7.6 | | | (52.6) | | | (21.6) | |
| Interest expense | 2.4 | | | 1.1 | | | 0 | |
| Interest expense, net | |
| Other expense, net | Other expense, net | (0.1) | | | 0 | | | 0 | |
| 9.3 | | | (47.7) | | | (19.3) | |
| (176.4) | |
| Comprehensive income (loss) | Comprehensive income (loss) | $ | (14.7) | | | $ | 21.1 | | | $ | 16.5 | |
As of December 31, 20202023 and 2019,2022, pretax net gains $4.7of $156.3 million and $19.4$71.8 million, respectively, related to the Company’sCompany's derivative instruments and hedge activities were recorded in accumulated other comprehensive loss.
During the next twelve month period, net gains (losses) expected to be reclassified into earnings are shown below (in millions):
| | | | | |
| Foreign currency contracts | $ | 35.6135.3 | |
| Interest rate swap contracts | (2.4) | |
| |
| Total | $ | 33.2132.9 | |
Such gains and losses will be reclassified at the time that the underlying hedged transactions are realized.
For the years ended December 31, 2020, 20192023, 2022 and 2018,2021, the Company recognized tax expensebenefit (expense) of $0.8($15.9) million, $5.5($10.6) million and $3.3$7.5 million, respectively, in other comprehensive income (loss) related to its derivative instruments and hedge activities.
Fair Value Measurements
GAAP provides that fair value is an exit price, defined as a market-based measurement that represents the amount that would be received to sell an asset or paid to transfer a liability in an orderly transaction between market participants. Fair value measurements are based on one or more of the following three valuation techniques:
| | | | | | | | |
| Market: | | This approach uses prices and other relevant information generated by market transactions involving identical or comparable assets or liabilities. |
| |
| Income: | | This approach uses valuation techniques to convert future amounts to a single present value amount based on current market expectations. |
| |
| Cost: | | This approach is based on the amount that would be required to replace the service capacity of an asset (replacement cost). |
Further, GAAP prioritizes the inputs and assumptions used in the valuation techniques described above into a three-tier fair value hierarchy as follows:
| | | | | | | | |
| Level 1: | | Observable inputs, such as quoted market prices in active markets for identical assets or liabilities that are accessible at the measurement date. |
| |
| Level 2: | | Inputs, other than quoted market prices included in Level 1, that are observable either directly or indirectly for the asset or liability. |
| |
| Level 3: | | Unobservable inputs that reflect the entity’sentity's own assumptions about the exit price of the asset or liability. Unobservable inputs may be used if there is little or no market data for the asset or liability at the measurement date. |
Lear Corporation and Subsidiaries
Notes to Consolidated Financial Statements (continued)
The Company discloses fair value measurements and the related valuation techniques and fair value hierarchy level for its assets and liabilities that are measured or disclosed at fair value.
Items Measured at Fair Value on a Recurring Basis
Fair value measurements and the related valuation techniques and fair value hierarchy level for the Company’sCompany's assets and liabilities measured at fair value on a recurring basis as of December 31, 20202023 and 2019,2022, are shown below (in millions):
| | December 31, 2020 |
| Frequency | | Asset
(Liability) | | Valuation
Technique | | Level 1 | | Level 2 | | Level 3 |
| December 31, 2023 | | | December 31, 2023 |
| Frequency | | | Frequency | | Asset
(Liability) | | Valuation
Technique | | Level 1 | | Level 2 | | Level 3 |
| Foreign currency contracts, net | Foreign currency contracts, net | Recurring | | $ | 47.5 | | | Market / Income | | $ | 0 | | | $ | 47.5 | | | $ | 0 | |
| Net investment hedges | Net investment hedges | Recurring | | (22.6) | | | Market / Income | | 0 | | | (22.6) | | | 0 | |
| Marketable equity securities | Marketable equity securities | Recurring | | 58.7 | | | Market | | 58.7 | | | 0 | | | 0 | |
| | December 31, 2019 |
| Frequency | | Asset
(Liability) | | Valuation
Technique | | Level 1 | | Level 2 | | Level 3 |
| December 31, 2022 | | | December 31, 2022 |
| Frequency | | | Frequency | | Asset
(Liability) | | Valuation
Technique | | Level 1 | | Level 2 | | Level 3 |
| Foreign currency contracts, net | Foreign currency contracts, net | Recurring | | $ | 50.3 | | | Market / Income | | $ | 0 | | | $ | 50.3 | | | $ | 0 | |
| Net investment hedges | Net investment hedges | Recurring | | (4.4) | | | Market / Income | | 0 | | | (4.4) | | | 0 | |
| Marketable equity securities | Marketable equity securities | Recurring | | 59.2 | | | Market | | 59.2 | | | 0 | | | 0 | |
The Company determines the fair value of its derivative contracts using quoted market prices to calculate the forward values and then discounts such forward values to the present value. The discount rates used are based on quoted bank deposit or swap interest rates. If a derivative contract is in a net liability position, the Company adjusts these discount rates, if required, by an estimate of the credit spread that would be applied by market participants purchasing these contracts from the Company’sCompany's counterparties. If an estimate of the credit spread is required, the Company uses significant assumptions and factors other than quoted market rates, which would result in the classification of its derivative liabilities within Level 3 of the fair value hierarchy. As of December 31, 20202023 and 2019,2022, there were 0no derivative contracts that were classified within Level 3 of the fair value hierarchy. In addition, there were 0no transfers in or out of Level 3 of the fair value hierarchy during 20202023 and 2019.2022.
For further information on fair value measurements and the Company’sCompany's defined benefit pension plan assets, see Note 10, "Pension and Other Postretirement Benefit Plans."
Items Measured at Fair Value on a Non-Recurring Basis
The Company measures certain assets and liabilities at fair value on a non-recurring basis, which are not included in the table above. As these non-recurring fair value measurements are generally determined using unobservable inputs, these fair value measurements are classified within Level 3 of the fair value hierarchy.
In 2020 and 2019, the Company completed quantitative goodwill impairment analyses for selected reporting units (Note 3, "Summary of Significant Accounting Policies — Impairment of Goodwill"). The Level 3 fair value estimate of the reporting units was based on a third-party valuation and/or management's estimates, using a combination of the discounted cash flow method and guideline public company method.Acquisitions
In 2019,2023, as a result of the acquisition of XevoIGB (Note 4, "Acquisition"), Level 3 fair value estimates of $90.1 million related to intangible assets are recorded in the accompanying consolidated balance sheets as of December 31, 2020 and 2019. The estimated fair values of these assets were based on third-party valuations and management's estimates, generally utilizing the income and cost approaches.
In 2019, as a result of the deconsolidation of GACC (Note 6, "Investments in Affiliates and Other Related Party Transactions"), the Company is accounting for its investment in GACC under the equity method. The Level 3 fair value estimate related to the Company's equity interest was based on the present value of future cash flows and reflects a discount for the lack of control and the lack of marketability associated with equity interests.
In 2018, as a result of the Lear FAWSN transaction (Note 6, "Investments in Affiliates and Other Related Party Transactions""Acquisitions"), Level 3 fair value estimates related to property, plant and equipment of $11.0$47.5 million, developed technology and customer-based intangible assets of $7.5$15.4 million and noncontrolling interestsright-of-use assets of $14.0$14.3 million are recorded in the accompanying consolidated balance sheet as of December 31, 2023.
In 2022, as a result of the acquisition of Kongsberg ICS (Note 4, "Acquisitions"), Level 3 fair value estimates related to property, plant and equipment of $124.1 million, right-of-use assets of $34.1 million and developed technology intangible assets of $11.1 million are recorded in the accompanying consolidated balance sheets as of December 31, 20202023 and 2019. In addition, the Lear FAWSN transaction required a Level 3 fair value estimate related to the Company's
Lear Corporation and Subsidiaries
Notes to Consolidated Financial Statements (continued)
previously held equity interest of $23.0 million. These Level 3 fair value estimates were determined as of the effective date of the transaction.2022.
Fair value estimates of property, plant and equipment were based on independent appraisals, giving consideration to the highest and best use of the assets. Key assumptions used in the appraisals were based on a combination of market and cost approaches, as appropriate. Fair value estimates of developed technology intangible assets were based on a relief from royalty approach. Fair value estimates of customer-based intangible assets were based on the present value of futuremulti-period excess earnings attributable to the asset group after recognition of required returns to other contributory assets.method. Fair value estimates of noncontrolling and equity interestsright-of-use assets were based on the present value of future cash flows and a value to earnings multiple approach and reflect discounts for the lack of control and the lack of marketability associated with noncontrolling and equity interests.
As of December 31, 2020 and 2019, there were no additional significant assets or liabilities measured at fair value on a non-recurring basis.
(17) Quarterly Financial Data (unaudited)
(In millions, except per share data)
| | | | | | | | | | | | | | | | | | | | | | | |
| | Thirteen Weeks Ended |
| | April 4,
2020 | | July 4,
2020 | | October 3,
2020 | | December 31,
2020 |
| Net sales | $ | 4,457.7 | | | $ | 2,444.5 | | | $ | 4,900.1 | | | $ | 5,243.2 | |
| Gross profit | 334.2 | | | (127.4) | | | 442.8 | | | 459.3 | |
| Consolidated net income (loss) | 83.6 | | | (269.5) | | | 197.1 | | | 222.7 | |
| Net income (loss) attributable to Lear | 76.4 | | | (293.9) | | | 174.4 | | | 201.6 | |
| Basic net income (loss) per share attributable to Lear | 1.26 | | | (4.89) | | | 2.90 | | | 3.35 | |
| Diluted net income (loss) per share attributable to Lear | 1.26 | | | (4.89) | | | 2.89 | | | 3.33 | |
In the first quarter of 2020, the Company recognized tax benefits of $10.6 million related to a loss on the extinguishment of debt, restructuring charges and various other items. The Company also recognized a loss of $21.1 million related to the extinguishment of debt.
In the second quarter of 2020, the Company recognized tax expense of $22.8 million related to the establishment of a valuation allowance on deferred tax assets of a foreign subsidiary and net tax benefits of $21.1 million related to restructuring charges and various other items.
In the third quarter of 2020, the Company recognized tax benefits of $9.8 million related to the release of a valuation allowance on deferred tax assets and $5.0 million related to an increase in our research and development tax credits resulting from the completion of a research and development tax credit study and net tax expense of $10.2 million related to restructuring charges and various other items. The Company also recognized a pension benefit plan settlement loss of $10.2 million related to its restructuring actions.
In the fourth quarter of 2020, the Company recognized tax benefits of $8.1 million related to restructuring charges and various other items and $15.5 million related to the U.S. deferred tax effect of our foreign branches and tax expense of $16.7 million related to a net increase in valuation allowances on deferred tax assets. The Company also recognized pension benefit plan settlement losses of $2.7 million related to its restructuring actions and an impairment charge of $4.0 million related to an investment.
For further information, see Note 6, "Investments in Affiliates and Other Related Party Transactions," Note 7, "Debt," Note 9, "Income Taxes," and Note 10, "Pension and Other Postretirement Benefit Plans."market approach.
Lear Corporation and Subsidiaries
Notes to Consolidated Financial Statements (continued)
| | | | | | | | | | | | | | | | | | | | | | | |
| | Thirteen Weeks Ended |
| | March 30,
2019 | | June 29,
2019 | | September 28,
2019 | | December 31,
2019 |
| Net sales | $ | 5,160.1 | | | $ | 5,007.6 | | | $ | 4,825.0 | | | $ | 4,817.6 | |
| Gross profit | 473.2 | | | 478.2 | | | 459.3 | | | 326.8 | |
| Consolidated net income | 246.1 | | | 202.0 | | | 238.6 | | | 144.0 | |
| Net income attributable to Lear | 228.9 | | | 182.8 | | | 215.9 | | | 126.0 | |
| Basic net income per share attributable to Lear | 3.75 | | | 2.92 | | | 3.59 | | | 2.51 | |
| Diluted net income per share attributable to Lear | 3.73 | | | 2.92 | | | 3.58 | | | 2.50 | |
In the first quarter of 2019,2023, 2022 and 2021, the Company recognized tax benefitscompleted impairment assessments related to certain of $18.4its intangible assets resulting from changes in the intended uses of such assets and recorded impairment charges of $1.9 million, $8.9 million and $8.5 million, respectively. The fair value estimate of the related asset group was based on management's estimates, using a discounted cash flow method (Note 3, "Summary of Significant Accounting Policies — Impairment of Long-Lived Assets").
In 2023, 2022 and 2021, the Company completed impairment assessments related to certain right-of-use assets in conjunction with its restructuring actions (Note 4, "Restructuring") and recorded impairment charges of $10.9 million, $6.5 million and $7.2 million, respectively. The fair value estimates of the related assets were based on management's estimates, using a discounted cash flow method.
In 2022, the Company completed impairment assessments related to substantially all of its operating assets in Russia and recorded charges of $19.4 million related to changes inimpairments of inventory, property, plant and equipment and right-of-use assets. The fair value estimates of the tax status of certain affiliates, $3.2 million related to share-based compensation and $15.6 million related to restructuring charges and various other items.assets were based on management's estimates, using a discounted cash flow method.
In the second quarter of 2019,2022, the Company recognized tax benefitscompleted quantitative goodwill impairment analyses for selected reporting units (Note 3, "Summary of $11.0 million related to restructuring charges and various other items and tax expenseSignificant Accounting Policies — Impairment of $10.4 million related to the establishment of a valuation allowance on the deferred tax assets of a foreign subsidiary.Goodwill"). The Company also recognized a loss of $10.6 million related to the extinguishment of debt.
In the third quarter of 2019, the Company recognized tax benefits of $28.6 million related to research and development tax credits and $9.1 million related to restructuring charges and various other items. The Company also recognized a gain of $4.0 million related to the deconsolidation of an affiliate.
In the fourth quarter of 2019, the Company recognized tax benefits of $14.1 million related to the U.S. tax impactLevel 3 fair value estimates of the foreign tax credit regulationsreporting units were based on management's estimates, using the discounted cash flow method.
As of December 31, 2023 and $32.2 million related to restructuring charges and various other items. The Company also recognized curtailment gains of $12.9 million related to certain foreign pension and postretirement benefit plans and an impairment charge of $5.0 million related to an investment.
For further information see, Note 6, "Investments in Affiliates and Other Related Party Transactions," Note 7, "Debt," Note 9, "Income Taxes," and Note 10, "Pension and Other Postretirement Benefit Plans ."2022, there were no additional significant assets or liabilities measured at fair value on a non-recurring basis.
(18)17) Accounting Pronouncements
Accounting Standards Updates ("ASU") Issued But Not Yet Adopted:
ASU 2023-07 (issued November 2023), "Segment Reporting - Improving Reportable Segment Disclosures." The ASU requires disclosure of significant segment expenses impacting profit and loss that are regularly provided to the chief operating decision maker. It also requires public entities to provide in interim periods all disclosures about a reportable segment’s profit or loss and assets that are currently required annually. The update is required to be applied retrospectively to prior periods presented, based on the significant segment expense categories identified and disclosed in the period of adoption. The update is effective for fiscal years beginning after December 15, 2023, and interim periods within fiscal years beginning after December 15, 2024, with early adoption permitted. The Company is currently evaluating the impact of the standard on its financial disclosures.
ASU 2023-09 (issued December 2023), "Improvements to Income Tax Disclosures." The ASU requires disclosure of specific categories in the effective tax rate reconciliation, as well as additional information for reconciling items that meet a quantitative threshold. It also requires disclosure of income taxes paid, net of refunds, disaggregated by federal, state and foreign taxes, and further disaggregated by jurisdiction based on a quantitative threshold, for annual periods. The update is effective for fiscal years beginning after December 15, 2024, with early adoption permitted. The standard is to be adopted prospectively; however, retrospective application is permitted. The Company is currently evaluating the impact of the standard on its financial disclosures.
The Company considers the applicability and impact of all ASUs issued by the FASB.
The Company considered the ASUs summarized below, effective for 2020:
Measurement of Credit Losses on Financial Instruments
See Note 3, "Summary of Significant Accounting Policies — Accounts Receivable."
Simplifying the Test for Goodwill Impairment
Effective January 1, 2020, the standard simplifies theStandards Board. Other recently issued accounting for goodwill impairments and allows a goodwill impairment charge to be based on the amount of a reporting unit's carrying value in excess of its fair value. This eliminates the requirement to calculate the implied fair value of goodwill (i.e., "Step 2" under current guidance).
Reference Rate Reform
In March 2020, the FASB issued ASU 2020-04, "Reference Rate Reform (Topic 848): Facilitation of the Effects of Reference Rate Reform on Financial Reporting." The guidance provides temporary optional expedients and exceptions to the current guidance on contract modifications and hedge accounting to ease the financial reporting burdens related to the expected market transition from the London Interbank Offered Rate ("LIBOR") and other interbank offered rates to alternative reference rates. The guidance was effective upon issuance and generally can be applied to applicable contract modifications and hedge relationships prospectively through December 31, 2022. The adoption of this guidance ispronouncements are not expected to have a significantmaterial impact onor are not relevant to the Company's consolidated financial statements.
Lear Corporation and Subsidiaries
Notes to Consolidated Financial Statements (continued)
Disclosure Requirements for Defined Benefit Plans
In December 2020, the Company adopted ASU 2018-14, "Compensation — Retirement Benefits — Defined Benefit Plans — General (Subtopic 715-20): Disclosure Framework — Changes to the Disclosure Requirements for Defined Benefit Plans," which provides minor changes to the disclosure requirements for employers that sponsor defined benefit pension and/or other postretirement benefit plans. The adoption of this standard did not have a significant impact on the Company's financial statements.
The Company considered the ASUs summarized below, effective after 2020:
Simplifying the Accounting for Income Taxes
See Note 3 "Summary of Significant Accounting Policies — Income Taxes."
LEAR CORPORATION AND SUBSIDIARIES
SCHEDULE II – VALUATION AND QUALIFYING ACCOUNTS
(In millions) | | | | | | | | | | | | | | | | | | | | | | | | | | | | | |
| Balance
as of Beginning
of Period | | Additions | | Retirements | | Other
Changes | | Balance
as of End
of Period |
| For the year ended December 31, 2023 | | | | | | | | | |
| Valuation of accounts deducted from related assets: | | | | | | | | | |
| Allowance for doubtful accounts | $ | 35.3 | | | $ | 7.8 | | | $ | (10.0) | | | $ | 2.5 | | | $ | 35.6 | |
| Allowance for deferred tax assets | 417.9 | | | 17.5 | | | (20.8) | | | 14.4 | | | 429.0 | |
| Total | $ | 453.2 | | | $ | 25.3 | | | $ | (30.8) | | | $ | 16.9 | | | $ | 464.6 | |
| | Balance
as of Beginning
of Period | | Additions | | Retirements | | Other
Changes | | Balance
as of End
of Period |
| For the year ended December 31, 2020 | |
| Balance
as of Beginning
of Period | | | Balance
as of Beginning
of Period | | Additions | | Retirements | | Other
Changes | | Balance
as of End
of Period |
| For the year ended December 31, 2022 | |
| Valuation of accounts deducted from related assets: | Valuation of accounts deducted from related assets: | |
| Valuation of accounts deducted from related assets: | |
| Valuation of accounts deducted from related assets: | |
| Allowance for doubtful accounts | |
| Allowance for doubtful accounts | |
| Allowance for doubtful accounts | Allowance for doubtful accounts | $ | 36.0 | | | $ | 7.0 | | | $ | (9.8) | | | $ | 2.1 | | | $ | 35.3 | |
| Allowance for deferred tax assets | Allowance for deferred tax assets | 344.8 | | | 81.4 | | | (43.5) | | | 15.0 | | | 397.7 | |
| Total | Total | $ | 380.8 | | | $ | 88.4 | | | $ | (53.3) | | | $ | 17.1 | | | $ | 433.0 | |
| | | | | | | | | | | | | | | | | | | | | | | | | | | | | |
| Balance
as of Beginning
of Period | | Additions | | Retirements | | Other
Changes | | Balance
as of End
of Period |
| For the year ended December 31, 2019 | | | | | | | | | |
| Valuation of accounts deducted from related assets: | | | | | | | | | |
| Allowance for doubtful accounts | $ | 33.2 | | | $ | 14.3 | | | $ | (10.9) | | | $ | (0.6) | | | $ | 36.0 | |
| Allowance for deferred tax assets | 350.4 | | | 31.3 | | | (30.7) | | | (6.2) | | | 344.8 | |
| Total | $ | 383.6 | | | $ | 45.6 | | | $ | (41.6) | | | $ | (6.8) | | | $ | 380.8 | |
| | Balance
as of Beginning
of Period | | Additions | | Retirements | | Other
Changes | | Balance
as of End
of Period |
| For the year ended December 31, 2018 | |
| Balance
as of Beginning
of Period | | | Balance
as of Beginning
of Period | | Additions | | Retirements | | Other
Changes | | Balance
as of End
of Period |
| For the year ended December 31, 2021 | |
| Valuation of accounts deducted from related assets: | Valuation of accounts deducted from related assets: | |
| Valuation of accounts deducted from related assets: | |
| Valuation of accounts deducted from related assets: | |
| Allowance for doubtful accounts | |
| Allowance for doubtful accounts | |
| Allowance for doubtful accounts | Allowance for doubtful accounts | $ | 41.8 | | | $ | 11.4 | | | $ | (17.5) | | | $ | (2.5) | | | $ | 33.2 | |
| Allowance for deferred tax assets | Allowance for deferred tax assets | 402.2 | | | 24.5 | | | (56.7) | | | (19.6) | | | 350.4 | |
| Total | Total | $ | 444.0 | | | $ | 35.9 | | | $ | (74.2) | | | $ | (22.1) | | | $ | 383.6 | |
ITEM 9 – CHANGES IN AND DISAGREEMENTS WITH ACCOUNTANTS ON
ACCOUNTING AND FINANCIAL DISCLOSURE
None.
ITEM 9A – CONTROLS AND PROCEDURES
(a)Disclosure Controls and Procedures
The Company has evaluated, under the supervision and with the participation of the Company’sCompany's management, including the Company’sCompany's President and Chief Executive Officer along with the Company’sCompany's Senior Vice President and Chief Financial Officer, the effectiveness of the Company’sCompany's disclosure controls and procedures (as defined in Rules 13a-15(e) and 15d-15(e) under the Securities Exchange Act of 1934, as amended (the "Exchange Act")) as of the end of the period covered by this Report. The Company’sCompany's disclosure controls and procedures are designed to provide reasonable assurance of achieving their objectives. Because of the inherent limitations in all control systems, no evaluation of controls can provide absolute assurance that all control issues and instances of fraud, if any, within the Company have been detected. Based on the evaluation described above, the Company’sCompany's President and Chief Executive Officer along with the Company’sCompany's Senior Vice President and Chief Financial Officer have concluded that the Company’sCompany's disclosure controls and procedures were effective to provide reasonable assurance that the desired control objectives were achieved as of the end of the period covered by this Report.
(b)Management’sManagement's Annual Report on Internal Control over Financial Reporting
The Company’sCompany's management is responsible for establishing and maintaining adequate internal control over financial reporting, as such term is defined in Exchange Act Rule 13a-15(f). Under the supervision and with the participation of the Company’sCompany's management, including the Company’sCompany's President and Chief Executive Officer along with the Company’sCompany's Senior Vice President and Chief Financial Officer, the Company conducted an evaluation of the effectiveness of internal control over financial reporting based on the Internal Control-Integrated Framework issued by the Committee of Sponsoring Organizations of the Treadway Commission (2013 framework). In April 2023, the Company completed the acquisition of I.G. Bauerhin ("IGB") and is currently integrating IGB into its operations, compliance programs and internal control processes. IGB constituted less than 2% of the Company's total assets as of December 31, 2023, including goodwill and intangible assets recorded as part of the purchase price allocations, and less than 1% of the Company's net sales for the year ended December 31, 2023. Securities and Exchange Commission rules and regulations allow companies to exclude acquisitions from their assessment of internal control over financial reporting during the first year following an acquisition while integrating the acquired company. The Company has excluded the acquired operations of IGB from its assessment of the Company's internal control over financial reporting as of December 31, 2023. Based on this evaluation, management concluded that the Company’sCompany's internal control over financial reporting was effective as of December 31, 2020.2023.
(c)Attestation Report of the Registered Public Accounting Firm
The attestation report of the Company’sCompany's independent registered public accounting firm regarding internal control over financial reporting is set forth in Item 8, "Consolidated Financial Statements and Supplementary Data," under the caption "Report of Independent Registered Public Accounting Firm on Internal Control over Financial Reporting" and incorporated herein by reference.
(d)Changes in Internal Control over Financial Reporting
There was no change in the Company’sCompany's internal control over financial reporting that occurred during the fiscal quarter ended December 31, 2020,2023, that has materially affected, or is reasonably likely to materially affect, the Company’sCompany's internal control over financial reporting.
ITEM 9B – OTHER INFORMATION
None.
ITEM 9B – OTHER INFORMATION
Rule 10b5-1 Trading Plan
During the three months ended December 31, 2023, no director or officer of the Company adopted or terminated a "Rule 10b5-1 trading arrangement" or "non-Rule 10b5-1 trading arrangement," as each term is defined in item 408(a) of Regulation S-K.
ITEM 9C – DISCLOSURE REGARDING FOREIGN JURISDICTIONS THAT PREVENT INSPECTIONS
Not applicable.
PART III
ITEM 10 – DIRECTORS, EXECUTIVE OFFICERS AND CORPORATE GOVERNANCE
The information required by Item 10 regarding our directors and corporate governance matters is incorporated by reference herein to the Proxy Statement sections entitled "Election of Directors" and "Directors and Corporate Governance." The information required by Item 10 regarding our executive officers appears as a supplementary item following Item 4 under Part I of this Report. The information required by Item 10 regarding compliance with sectionSection 16(a) of the Securities Exchange Act of 1934, as amended, is incorporated by reference herein to the Proxy Statement section entitled "Directors and Corporate Governance — Section 16(a) Beneficial Ownership Reporting Compliance."
Code of Ethics
We have adopted a codeCode of ethicsBusiness Conduct and Ethics that applies to our executive officers, including our Principal Executive Officer, our Principal Financial Officer and our Principal Accounting Officer. This code of ethics is entitled "Specific Provisions for Executive Officers" within our Code of Business Conduct and Ethics,Officer, which can be found on our website at http://www.lear.com. We will post any amendment to or waiver from the provisions of the Code of Business Conduct and Ethics that applies to the executive officers above on the same website and will provide it to stockholders free of charge upon written request by contacting Lear Corporation at 21557 Telegraph Road, Southfield, Michigan 48033, Attention: Investor Relations.
ITEM 11 – EXECUTIVE COMPENSATION
The information required by Item 11 is incorporated by reference herein to the Proxy Statement sections entitled "Directors and Corporate Governance — Director Compensation," "Compensation Discussion and Analysis," "Executive Compensation," "Compensation Committee Interlocks and Insider Participation" and "Compensation Committee Report." Notwithstanding anything indicating the contrary set forth in this Report, the "Compensation Committee Report" section of the Proxy Statement shall be deemed to be "furnished" not "filed" for purposes of the Securities Exchange Act of 1934, as amended.
ITEM 12 – SECURITY OWNERSHIP OF CERTAIN BENEFICIAL OWNERS AND MANAGEMENT AND
RELATED STOCKHOLDER MATTERS
Except as set forth herein, the information required by Item 12 is incorporated by reference herein to the Proxy Statement section entitled "Directors and Corporate Governance — Security Ownership of Certain Beneficial Owners, Directors and Management."
Equity Compensation Plan Information
| | As of December 31, 2020 | Number of securities to be
issued upon exercise of
outstanding options,
warrants and rights
(a) | | Weighted average
exercise price of
outstanding options,
warrants and rights
(b) | | Number of securities
available for future
issuance under equity
compensation plans
(excluding securities
reflected in column (a))
(c) |
| As of December 31, 2023 | | As of December 31, 2023 | Number of securities to be
issued upon exercise of
outstanding options,
warrants and rights
(a) | | Weighted average
exercise price of
outstanding options,
warrants and rights
(b) | | Number of securities
available for future
issuance under equity
compensation plans
(excluding securities
reflected in column (a))
(c) |
| Equity compensation plans approved by security holders | Equity compensation plans approved by security holders | 1,534,501 | | (1) | $ | 9.90 | | (2) | 1,624,471 | |
| Equity compensation plans not approved by security holders | Equity compensation plans not approved by security holders | — | | | — | | | — | |
| Total | Total | 1,534,501 | | | $ | 9.90 | | | 1,624,471 | |
(1)Includes 616,584569,324 of outstanding restricted stock units, 809,471914,911 of outstanding performance shares and 108,446202,702 of outstanding stock options. Outstanding performance shares are reflected at the maximum possible payout that may be earned during the relevant performance periods.
(2)Reflects outstanding restricted stock units and performance shares at a weighted average price of zero. Reflects outstanding stock options at a weighted average exercise price of $140.09.$148.16.
ITEM 13 – CERTAIN RELATIONSHIPS AND RELATED TRANSACTIONS, AND DIRECTOR INDEPENDENCE
The information required by Item 13 is incorporated by reference herein to the Proxy Statement sections entitled "Certain Relationships and Related Party Transactions" and "Directors and Corporate Governance — Independence of Directors."
ITEM 14 – PRINCIPAL ACCOUNTING FEES AND SERVICES
The information required by Item 14 is incorporated by reference herein to the Proxy Statement section entitled "Fees of Independent Accountants."
PART IV
ITEM 15 – EXHIBITS AND FINANCIAL STATEMENT SCHEDULE
The following documents are filed as part of this Form 10-K.
(a) 1. Consolidated Financial Statements:
Reports of Ernst & Young LLP, Independent Registered Public Accounting Firm (PCAOB ID: 42)
Consolidated Balance Sheets as of December 31, 20202023 and 20192022
Consolidated Statements of Income for the years ended December 31, 2020, 20192023, 2022 and 20182021
Consolidated Statements of Comprehensive Income for the years ended December 31, 2020, 20192023, 2022 and 20182021
Consolidated Statements of Equity for the years ended December 31, 2020, 20192023, 2022 and 20182021
Consolidated Statements of Cash Flows for the years ended December 31, 2020, 20192023, 2022 and 20182021
Notes to Consolidated Financial Statements
2. Financial Statement Schedule:
Schedule II — Valuation and Qualifying Accounts
All other financial statement schedules are omitted because such schedules are not required or the information required has been presented in the aforementioned financial statements.
3. The exhibits listed on the "Index to Exhibits" are filed with this Form 10-K or incorporated by reference as set forth below.
(b)The exhibits listed on the "Index to Exhibits" are filed with this Form 10-K or incorporated by reference as set forth below.
(c)Additional Financial Statement Schedules
None.
ITEM 16 – FORM 10-K Summary
None.
| | | | | | | | | | | | | | |
Index to Exhibits | | | | | | | | | | | | | | | | Exhibit
Number | | | Exhibit Name | | 3.1 | | | | | ** | 3.2 | | | | | 4.1 | | | | | 4.2 | | | | | 4.3 | | | | | 4.4 | | | | | 4.5 | | | | | 4.6 | | | | | 4.7 | | | | | 4.8 | | | | | 4.9 | | | | | 10.1 | * | | | | 10.2 | * | | | | 10.3 | * | | | | 10.4 | * | | | | 10.5 | * | | | | 10.6 | * | | | | 10.7 | * | | | | 10.810.7 | * | | | | 10.9 | * | | | | 10.10 | * | | | | 10.11 | * | | |
| | | | | | | | | | | | | | | | Index to Exhibits | | Exhibit
Number | | | 10.15Exhibit Name | | 10.9 | * | | | | 10.16 | * | | | | 10.1710.10 | * | | | | 10.1810.11 | * | | | | 10.1910.12 | * | | | | 10.2010.13 | * | | | | **10.2110.14 | * | | | | 10.22 | * | | | | 10.2310.15 | * | | | | 10.2410.16 | * | | | | 10.2510.17 | * | | | | 10.2610.18 | * | | | | 10.27 | * | | | | 10.28 | * | | | | 10.2910.19 | * | | | | 10.3010.20 | * | | | | 10.3110.21 | * | | |
| | | | | | | | | | | | | | | | 10.3210.22 | * | | | | 10.3310.23 | * | | | | 10.3410.24 | * | | | | 10.25 | | 10.35 | | Amended and Restated Credit Agreement, dated as of August 8, 2017,October 28, 2021, among the Company, the foreign subsidiary borrowers from time to time party thereto, the lenders from time to time party thereto, HSBC Securities (USA) Inc., as syndication agent, Barclays Bank PLC, Bank of America, N.A., Citibank N.A. and Merrill Lynch, Pierce, Fenner & Smith Incorporated,HSBC Bank USA, National Association, as co-documentationsyndication agents, and JPMorgan Chase Bank, N.A., as administrative agent (incorporated by reference to Exhibit 10.1 to the Company’s Current Report on Form 8-K filed on August 8, 2017)October 28, 2021). | | 10.36 | | | Extension Agreement, dated March 27, 2019, related to the Credit Agreement, dated as of August 8, 2017, among the Company, the foreign subsidiary borrowers from time to time party thereto, the lenders from time to time party thereto, HSBC Securities (USA) Inc., as syndication agent, Barclays Bank PLC, Citibank N.A. and Merrill Lynch, Pierce, Fenner & Smith Incorporated, as co-documentation agents, and JPMorgan Chase Bank, N.A., as administrative agent (incorporated by reference to Exhibit 10.1 to the Company’s Current Report on Form 8-K filed on March 27, 2019). |
| | | | | | | | | | | | | | | | Index to Exhibits | | 10.37Exhibit
Number | | | Extension Agreement and Amendment No. 2,dated February 20, 2020, related to the Credit Agreement, dated as of August 8, 2017 (as amended by that certain Extension Agreement dated as of March 27, 2019), among Lear Corporation, the foreign subsidiary borrowers from time to time party thereto, the lenders from time to time party thereto, HSBC Securities (USA) Inc., as syndication agent, Barclays Bank PLC, Citibank N.A. and Merrill Lynch, Pierce, Fenner & Smith Incorporated, as co-documentation agents, and JPMorgan Chase Bank, N.A., as administrative agent (incorporated by reference to Exhibit 10.1 to the Company’s Current Report on Form 8-K filed on February 24, 2020).Name | | 10.3810.26 | * | | | | 10.3910.27 | * | | | | 10.4010.28 | * | | | | 10.4110.29 | * | | | | 10.42 | * | | | | 10.4310.30 | * | | | | 10.4410.31 | * | | | | ** | 10.32 | * | | | | ** | 10.33 | * | | | | ** | 10.34 | * | | | | ** | 10.35 | * | | | | 10.36 | * | | | | 10.37 | | | Extension Agreement and Amendment No. 2 dated November 21, 2023, related to the Amended and Restated Credit Agreement, dated October 28, 2021 (as amended by that certain Amendment No. 1, dated June 14, 2023) among Lear Corporation, the foreign subsidiary borrowers from time to time thereto, the lenders from time to time party thereto, Barclays Bank PLC, Bank of America, N.A., Citibank, N.A. and HSBC Bank USA, National Association, as syndication agents, and JPMorgan Chase Bank, N.A., as administrative agent (incorporated by reference to Exhibit 10.1 to the Company’s Current Report on Form 8-K filed on April 17, 2019)November 21, 2023. | | ** | 10.38 | * | | | | ** | 21.1 | | | | | ** | 23.1 | | | | | ** | 31.1 | | | | | ** | 31.2 | | | | | ** | 32.1 | | | | | ** | 32.2 | | | |
Table of Contents | 97.1 | | |
| | | | | | | | | | | | | | | | 99.1 | | | | | *** | 101.INS | | | XBRL Instance Document. | | **** | 101.SCH | | | XBRL Taxonomy Extension Schema Document. | | **** | 101.CAL | | | XBRL Taxonomy Extension Calculation Linkbase Document. | | **** | 101.LAB | | | XBRL Taxonomy Extension Label Linkbase Document. | | **** | 101.PRE | | | XBRL Taxonomy Extension Presentation Linkbase Document. |
| | | | | | | | | | | | | | | | Index to Exhibits | | Exhibit
Number | | | Exhibit Name | | **** | 101.DEF | | | XBRL Taxonomy Extension Definition Linkbase Document. | | *** | 104 | | | Cover Page Interactive Data File |
______________________ * Compensatory plan or arrangement. ** Filed herewith. *** The XBRL Instance Document and Cover Page Interactive Data File do not appear in the Interactive Data File because their XBRL tags are embedded within the Inline XBRL document. **** Submitted electronically with the Report.
Signatures Pursuant to the requirements of Section 13 or 15(d) of the Securities Exchange Act of 1934, as amended, the registrant has duly caused this Report to be signed on its behalf by the undersigned, thereunto duly authorized on February 10, 2021.8, 2024. | | | | | | | | | | Lear Corporation | | | | By: | | /s/ Raymond E. Scott | | | Raymond E. Scott | | | President and Chief Executive Officer and a Director (Principal Executive Officer) |
Pursuant to the requirements of the Securities Exchange Act of 1934, as amended, this Report has been signed below by the following persons on behalf of Lear Corporation and in the capacities indicated on February 10, 2021.8, 2024. | | | | | | | | | | /s/ Raymond E. Scott | | /s/ Bradley M. HalversonMary Lou Jepsen | | Raymond E. Scott | | Bradley M. HalversonMary Lou Jepsen | | President and Chief Executive Officer and a Director | | a Director | | (Principal Executive Officer) | | | | | | /s/ Mary Lou Jepsen | /s/ Jason M. Cardew | | Mary Lou Jepsen/s/ Roger A. Krone | | Jason M. Cardew | | a DirectorRoger A. Krone | | Senior Vice President and Chief Financial Officer | | a Director | | (Principal Financial Officer) | | | /s/ Roger A. Krone | | | Roger A. Krone | /s/ Amy A. Doyle | | a Director/s/ Patricia L. Lewis | | Amy A. Doyle | | Patricia L. Lewis | | Vice President and Chief Accounting Officer | | /s/ Patricia L. Lewisa Director | | (Principal Accounting Officer) | | | Patricia L. Lewis | | | a Director /s/ Thomas P. Capo | | | Thomas P. CapoMei-Wei Cheng | | /s/ Kathleen A. Ligocki | a DirectorMei-Wei Cheng | | Kathleen A. Ligocki | | a Director | | a Director | | | | /s/ Mei-Wei Cheng | | | Mei-Wei ChengJonathan F. Foster | | /s/ Conrad L. Mallett, Jr. | a DirectorJonathan F. Foster | | Conrad L. Mallett, Jr. | | a Director | | a Director | | | | /s/ Jonathan F. Foster | | | Jonathan F. FosterBradley M. Halverson | | /s/ Gregory C. Smith | a DirectorBradley M. Halverson | | Gregory C. Smith | | a Director | | Non-Executive Chairman of the Board of Directors and | | | a Director | | | | | | | | | |
| |
