
UNITED STATES
SECURITIES AND EXCHANGE COMMISSION
Washington, D.C. 20549
_________________
FORM 10-K
_________________
| (Mark One) |
| [X] | ANNUAL REPORT PURSUANT TO SECTION 13 OR 15(d) OF THE SECURITIES EXCHANGE ACT OF 1934 For the fiscal year ended December 31, |
or
| [_] | TRANSITION REPORT PURSUANT TO SECTION 13 OR 15(d) OF THE SECURITIES EXCHANGE ACT OF 1934 |
Commission File Number: 001-36769
_____________________
FRP HOLDINGS, INC.
(Exact name of registrant as specified in its charter)
_____________________
| florida | 47-2449198 | |
(State or other jurisdiction of incorporation or organization) | (I.R.S. Employer Identification No.) | |
| 200 W. Forsyth St., 7th Floor, | 32202 | |
| (Address of principal executive offices) | (Zip Code) |
(904) 396-5733
Securities registered pursuant to Section 12(b) of the Act:
| Title of each class | Symbol | Name of each exchange on which registered | |||
| Common Stock, $.10 par value | FRPH | NASDAQ | |||
Securities registered pursuant to Section 12(g) of the Act: None
_________________
Indicate by check mark if the registrant is a well-known seasoned issuer, as defined in Rule 405 of the Securities Act. Yes [_] No [X]
Indicate by check mark if the registrant is not required to file reports pursuant to Section 13 or Section 15(d) of the Act. Yes [_] No [X]
Indicate by check mark whether the registrant (1) has filed all reports required to be filed by Section 13 or 15(d) of the Securities Exchange Act of 1934 during the preceding 12 months (or for such shorter period that the registrant was required to file such reports), and (2) has been subject to such filing requirements for the past 90 days. Yes [X] No [_]
Indicate by check mark whether the registrant has submitted electronically every Interactive Data File required to be submitted pursuant to Rule 405 of Regulation S-T (§232.405 of this chapter) during the preceding 12 months (or for such shorter period that the registrant was required to submit such files). Yes [X] No [_]
| 1 |
Indicate by check mark whether the registrant is a large accelerated filer, an accelerated filer, a non-accelerated filer, a smaller reporting company, or an emerging growth company. See the definitions of “large accelerated filer,” “accelerated filer,” “smaller reporting company,” and “emerging growth company” in Rule 12b-2 of the Exchange Act.
| Large accelerated filer [_] | Accelerated filer [_] | |
| Non-accelerated filer [X] | Smaller reporting company [X] | |
| Emerging growth company [_] | ||
If an emerging growth company, indicate by check mark if the registrant has elected not to use the extended transition period for complying with any new or revised financial accounting standards provided pursuant to Section 13(a) of the Exchange Act. [_]
Indicate by check mark whether the registrant has filed a report on and attestation to its management’s assessment of the effectiveness of its internal control over financial reporting under Section 404(b) of the Sarbanes-Oxley Act (15 U.S.C. 7262(b)) by the registered public accounting firm that prepared or issued its audit report. [_][_]
If securities are registered pursuant to Section 12(b) of the Act, indicate by check mark whether the financial statements of the registrant included in the filing reflect the correction of an error to previously issued financial statements. [_]
Indicate by check mark whether any of those error corrections are restatements that required a recovery analysis of incentive-based compensation received by any of the registrant’s executive officers during the relevant recovery period pursuant to §240.10D-1(b). [_]
Indicate by check mark whether the registrant is a shell company (as defined in Rule 12b-2 of the Act). Yes [_] No [X]
The number of shares of the registrant’s common stock outstanding as of March 28, 202217, 2024 was . The aggregate market value of the shares of Common Stock held by non-affiliates of the registrant as of June 30, 2021,2023, the last day of business of our most recently completed second fiscal quarter, was $413,410,236426,117,700. Solely for purposes of this calculation, the registrant has assumed that all directors, officers and ten percent (10%) shareholders of the Company are affiliates of the registrant.
DOCUMENTS INCORPORATED BY REFERENCE
Portions of the FRP Holdings, Inc. 20212023 Annual Report to Shareholders are incorporated by reference in Parts I and II.
Portions of the FRP Holdings, Inc. Proxy Statement which will be filed with the Securities and Exchange Commission not later than March 31, 20222024 are incorporated by reference in Part III.
| 2 |
FRP HOLDINGS, INC.
FORM 10-K
FOR THE FISCAL YEAR ENDED DECEMBER 31, 20212023
TABLE OF CONTENTS
| 3 |
Preliminary Note Regarding Forward-Looking Statements.
Certain matters discussed in the report contain “forward-looking statements” within the meaning of the Private Securities Litigation Reform Act of 1995, Section 27A of the Securities Act of 1933, as amended, and Section 21E of the Securities Exchange Act of 1934, as amended (the “Exchange Act”). The words or phrases “anticipate,” “estimate,” “believe,” “budget,” “continue,” “could,” “intend,” “may,” “plan,” “potential,” “predict,” “seek,” “should,” “will,” “would,” “expect,” “objective,” “projection,” “forecast,” “goal,” “guidance,” “outlook,” “effort,” “target” and similar expressions identify forward-looking statements. Such statements reflect management’s current views with respect to financial results related to future events and are based on assumptions and expectations that may not be realized and are inherently subject to risks and uncertainties, many of which cannot be predicted with accuracy and some of which might not even be anticipated. Future events and actual results, financial or otherwise, may differ, perhaps materially, from the results discussed in the forward-looking statements. Risk factors discussed in Item 1A of this Form 10-K and other factors that might cause differences, some of which could be material, include, but are not limited to: the impact of the Covid-19 Pandemic on our operations and financial results; the possibility that we may be unable to find appropriate investment opportunities; levels of construction activity in the markets served by our mining properties; demand for flexible warehouse/officeindustrial and commercial facilities in the Baltimore-Washington-Northern Virginia area; demand for apartments in Washington D.C., Richmond, VirginiaD.C and Greenville, South Carolina;SC; our ability to obtain zoning and entitlements necessary for property development; the impact of lending and capital market conditions on our liquidity, our ability to finance projects or repay our debt; general real estate investment and development risks; vacancies in our properties; risks associated with developing and managing properties in partnership with others; competition; our ability to renew leases or re-lease spaces as leases expire; illiquidity of real estate investments; bankruptcy or defaults of tenants; the impact of restrictions imposed by our credit facility; the level and volatility of interest rates; environmental liabilities; inflation risks; cyber security risks; as well as other risks listed from time to time in our SEC filings, including but not limited to, our annual and quarterly reports. We have no obligation to revise or update any forward-looking statements, other than as imposed by law, as a result of future events or new information. Readers are cautioned not to place undue reliance on such forward-looking statements.
These forward-looking statements are made as of the date hereof based on management’s current expectations, and the Company does not undertake an obligation to update such statements, whether as a result of new information, future events or otherwise. Additional information regarding these and other risk factors may be found in the Company’s other filings made from time to time with the Securities and Exchange Commission.
| 4 |
PART I
Item 1. BUSINESS.
FRP Holdings, Inc., a Florida corporation (the “Company”) was incorporated on April 22, 2014 in connection with a corporate reorganization that preceded the Spin-off of Patriot Transportation Holding, Inc. The Company’s predecessor issuer was formed on July 20, 1998. The business of the Company is conducted through our wholly-owned subsidiaries FRP Development Corp., a Maryland corporation, and Florida Rock Properties, Inc., a Florida corporation, and the various subsidiaries and joint ventures of each.
Our Business. The Company is a holding company engaged in various real estate businesses. Our business segments are: (i) leasing and management of industrial and commercial properties owned by the Company (the “Industrial and Commercial Segment” previously named “Asset Management Segment”), (ii) leasing and management of mining royalty land owned by the Company (the “Mining Royalty Lands Segment”), (iii) real property acquisition, entitlement, development and construction primarily for apartment, retail, warehouse,multifamily, industrial and office buildingscommercial, or residential either alone or through joint ventures (the “Development Segment”), (iv) ownership, leasing and management of apartment buildings through joint ventures (the “Multifamily Segment” previously named “Stabilized Joint Venture Segment”).
The Asset ManagementIndustrial and Commercial Segment owns, leases and manages commercial properties. The Company completed the disposition of 40 industrial warehouse properties and three additional land parcels to an affiliate of Blackstone Real Estate Partners VIII, L.P. for $347.2 million on May 21, 2018 and sold an additional industrial warehouse property to the same buyer on June 28, 2019 for $11.7 million, leaving only twoin-service commercial properties wholly owned by the Company or through joint ventures. Currently this includes eight warehouses in two business parks, an office building partially occupied by the Company, and one industrial acquisition (Cranberry Run Business Park, which we purchased in 2019) in the Asset Management Segment. In July 2020 we sold our property located at 1801 62nd Street which was placed in service on April 1, 2019. During the fourth quarter of 2021 we completed construction on two buildings in our Hollander Business Park. These assets are now a part of the Asset Management Segment. Our overall business strategy includes the re-deployment of the warehouse portfolio sales proceeds into asset classes across various business segments that will allow management to exploit its knowledge and expertise, including mixed-use properties, raw land, existing buildings, and strategic partnerships located in core markets with growth potential.ground leases.
Our Mining Royalty Lands Segment owns several properties comprisingtotaling approximately 15,00016,650 acres currently under lease for mining rents or royalties and an additional 4,280 acres through our Brooksville joint venture with Vulcan Materials. Other than one location in Virginia, all of our mining properties are located in Florida and Georgia.
Our Development Segment owns and continuously monitors the “highesthighest and best use”use of parcels of land that are in various stages of development. The overall strategy for this segment is to convert all of our non-income producing property into income-producing property through (i) an orderly process of constructing new apartment, retail, warehouse, and office buildings to be operated by the Company or (ii) a sale to, or joint venture with, third parties. Additionally, our Development Segment will form joint ventures on new developments of land not previously owned by the Company. Since 1990, one of our primary strategies in this segment has been to acquire, entitle and ultimately develop commercial and industrial business parks providing 5–15 building pads which we typically convert into warehouse or office buildings. To date, our management team has converted 32 of these pads into developed buildings. Our typical practice has been to transfer these assets to the Asset Management Segment on the earlier to occur of (i) commencement of rental revenue or (ii) issuance of the certificate of occupancy. We have also occasionally sold several of these pad sites over time to third parties.
The Stabilized Joint VentureMultifamily Segment includes joint ventures which own, lease and manage buildings that have met our initial lease uplease-up criteria. We intend to transfer additional joint ventures from our Development Segment into this segment as they reach stabilization. Stabilization occurs when oura minimum percentage leased goal is achieved.occupancy threshold has been achieved for a certain period of time.
Competition. As a developer, we compete with numerous developers, owners and operators of real estate,
many of whom own properties similar to ours in the same submarkets in which our properties are located. Price, location, rental space availability, flexibility of design and property management services are the major factors that affect competition.
Customers. In the Mining Royalty Lands Segment, we have a total of five tenants currently leasing our mining locations, and Vulcan Materials Company (“Vulcan” or “Vulcan Materials”) accounted for 23.0%24% of the Company’s consolidated revenues in 2021.2023. An event affecting Vulcan’s ability to perform under its lease agreements could materially impact the Company’s results.
Sales and Marketing. We use national brokerage firms to assist us in marketing our vacant properties. Our hands onhands-on in-house management team focuses on tenant satisfaction during the life of the lease which we have found to be very beneficial with respect to our tenant renewal success rate over the years.
| 5 |
Financial Information. Financial information is discussed by industry segment in Note 10 to the consolidated financial statements included in the accompanying 20212023 Annual Report to Shareholders, which is incorporated herein by reference.
Impact of the COVID-19 Pandemic. We have continued operations throughout the pandemic and have made every effort to act in accordance with national, state, and local regulations and guidelines. During 2020, Dock 79 and The Maren most directly suffered the impacts to our business from the pandemic due to our retail tenants being unable to operate at capacity, the lack of attendance at the Washington Nationals baseball park and the rent freeze imposed by the District. In 2021, the Delta and Omicron variants of the virus impacted our businesses, but because of the vaccine and efforts to reopen the economy, while still affected, they were not impacted to the extent that they were in 2020. It is possible that this version of the virus and its succeeding variants may impact our ability to lease retail spaces in Washington, D.C. and Greenville. We expect our business to be affected by the pandemic for as long as government intervention and regulation is required to combat the threat.
Environmental Matters. The Company incurs costs from time to time to investigate and remediate environmental contamination on its real estate, in particular, in connection with our Development Segment. The Company's mining leases contain provisions under which the lessee is responsible for environmental liabilities and reclamation of mining sites at least to the extent required by law.
Human Capital. The Company employed 1415 people and was provided services by three executive officers under a related party agreement at December 31, 2021.2023. Our small but dedicated workforce has extraordinarily low turnover, and the average tenure of our employee is 11.7412.3 years. We are committed to an inclusive and diverse culture and do not tolerate any sort of discrimination. We maintain a whistleblower hotline allowing employees to report complaints on an anonymous basis.
Company Website. The Company’s website may be accessed at www.frpdev.com. All of our filings with the Securities and Exchange Commission are accessible through our website promptly after filing. This includes annual reports on Form 10-K, proxy statements, quarterly reports on Form 10-Q, current reports filed or furnished on Form 8-K and all related amendments.
Item 1A. RISK FACTORS.
Our future results may be affected by a number of factors over which we have little or no control. The following issues, uncertainties, and risks, among others, should be considered in evaluating our business and outlook. Also, note that additional risks not currently identified or known to us could also negatively impact our business or financial results.
Risks Relating to the COVID-19 Pandemic
The current pandemic of the novel coronavirus COVID-19 could materially and adversely impact or
disrupt our financial condition, results of operations, cash flows and performance.
The financial performance of our stabilized mixed-use properties in Washington, D.C. has been adversely affected by the COVID-19 pandemic due to restrictions on the operation of local businesses, the rent freeze on lease renewals imposed in Washington, D.C. (through December 31, 2021), and the lack of fan attendance at the Washington Nationals baseball park in 2020. At this time, the Company is not certain the degree to which these factors will continue to impact Dock 79, The Maren. and Bryant Street, which could adversely affect our financial condition, results of operations and cash flows.
Additionally, the COVID-19 pandemic could materially and adversely affect our ability to complete pending and planned construction projects in a timely manner due to restrictions imposed on construction activities, delays in the permitting process or delays in the supply of materials or labor necessary for construction due to ongoing supply chain disruptions.
Risks Relating to our Business
A decline in the economic conditions in Baltimore and Washington, D.C. markets could adversely affect our business.
Nearly all of our commercialresidential/mixed-use and residential/mixed usecommercial properties are located in the Baltimore area and Washington, D.C. We are, therefore, subject to increased exposure to (positive or negative) to economic factors and other competitive factors specific to markets in confined geographic areas. Our operations may also be affected if too many competing properties are built in these markets. An economic downturn in these markets resulting from factors outside of our control could adversely affect our operation. Such a downturn could be triggered by such factors as the downsizing or relocation of government jobs, increased work from home opportunities, crime or acts of terrorism. We cannot be sure that these markets will continue to grow or demand the type of assets in our portfolio.
We conduct a significant portion of our operations through joint ventures, which may lead to disagreements with our joint venture partners and adversely affect our interests in the joint ventures.
We currently are a party to several joint ventures and we may enter into additional joint ventures in the future. In each of our existing joint ventures, the consent of our joint venture partner is required to take certain actions, and in some cases will share equal voting control. Our joint venture partners, as well as future partners, may have interests that are different from ours which may result in conflicting views as to the conduct of the joint ventures. In the event that we have a disagreement with a joint venture partner as to the resolution of a particular issue to come before the joint venture, or as to the conduct or management of the joint venture generally, we may not be able to resolve such disagreement in our favor and such a disagreement could have a material adverse effect on our interest in the joint venture or on the business of the joint venture generally.
Our business may be adversely affected by seasonal factors and harsh weather conditions.
| 6 |
The Mining Royalty Lands Segment and the Development Segment could be adversely affected by reduced construction and mining activity during periods of inclement weather. These factors could cause our operating results to fluctuate from quarter to quarter. An occurrence of unusually harsh or long-lasting inclement weather such as hurricanes, tornadoes and heavy snowfalls could have an adverse effect on our operations and profitability.
Our business could be negatively impacted by cyberattacks targeting our computer and telecommunications systems and infrastructure, or targeting those of our third-party service providers.
Our business, like other companies in our industry, has become increasingly dependent on digital technologies, including technologies that are managed by third-party service providers on whom we rely to help us collect, host or process information. Such technologies are integrated into our business operations. Use of the internet and other public networks for communications, services, and storage, including "cloud"
computing, exposes all users (including our business) to cybersecurity risks.
While we and our third-party service providers commit resources to the design, implementation, and monitoring of our information systems, there is no guarantee that our security measures will provide absolute security. Despite these security measures, we may not be able to anticipate, detect, or prevent cyberattacks, particularly because the methodologies used by attackers change frequently or may not be recognized until launched, and because attackers are increasingly using techniques designed to circumvent controls and avoid detection. We and our third-party service providers may therefore be vulnerable to security events that are beyond our control, and we may be the target of cyber-attacks, as well as physical attacks, which could result in information security breaches and significant disruption to our business.
Our revenues depend in part on construction sector activity, which tends to be cyclical.
Our Mining Royalty Lands Segment revenues are derived from royalties on construction aggregates mined on our properties. Thus, our results depend in part on residential, commercial and infrastructure construction activity and spending levels. The construction industry in our markets tends to be cyclical. Construction activity and spending levels vary across our markets and are influenced by interest rates, inflation, consumer spending habits, demographic shifts, environmental laws and regulations, employment levels and the availability of funds for public infrastructure projects. Economic downturns may lead to recessions in the construction industry, either in individual markets or nationally.
Our operations are subject to various environmental laws and regulations, the violation of which could result in substantial fines or penalties.
Liability for environmental contamination on real property owned by the Company may include the following costs, without limitation: investigation and feasibility study costs, remediation costs, litigation costs, oversight costs, monitoring costs, institutional control costs, penalties from state and federal agencies and third-party claims. These costs could be substantial and in extreme cases could exceed the value of the contaminated property. Moreover, on-site operations may be suspended until certain environmental contamination is remediated and/or permits are received, and governmental agencies can impose permanent restrictions on the manner in which a property may be used depending on the extent and nature of the contamination. This may result in a breach of the terms of the lease entered into with our tenants. Governmental agencies also may create liens on contaminated sites for damages it incurred to address such contamination. In addition, the presence of hazardous substances at, on, under or from a property may adversely affect our ability to sell the property or borrow funds using the property as collateral, thus harming our financial condition.
The presence of contaminated material at our Riverfront on the Anacostia development site will subject us to substantial environmental liability and costs as construction proceeds.
With respect to Phases III and IV of the Riverfront on the Anacostia site in Washington, D.C., preliminary environmental testing has indicated the presence of contaminated material that will have to be specially handled in excavation in conjunction with construction. While we have recovered and will continue to seek partial reimbursement for these costs from neighboring property owners, we still expect to incur significant environmental costs in
| 7 |
connection with construction.
The Company has no obligation to remediate this contamination on Phases III and IV of the development until such time as it makes a commitment to commence construction on each phase. The Company's actual expense to address this issue may be materially higher or lower than the expense previously recorded depending upon the actual costs incurred.
Our operations could be adversely affected by climate changeThe geographic concentration of our properties makes our business more vulnerable to severe weather conditions, natural disasters and climate change regulations.change.
Climate change presents an array of risks to real estate companies due to sea level rise, flooding, extreme weather, stronger storms and human migration. [WeA significant number of our properties are located in areas that are susceptible to hurricanes, tropical storms, flooding, sea level rise and other natural disasters. We have accounted for the risk of flooding and sea level rise in the design of our Riverfront on the Anacostia development.] Future developments, including potential “second life” uses of our mining properties, could be impacted by these factors and the impacts that they have
on human behavior. Weather conditions could disrupt the business of our tenants, which may affect the ability of some tenants to pay rent and/or their willingness to remain in or move to affected areas. [Additionally, the cost of insurance associated with our properties has increased, and future weather conditions may cause premiums to increase in the future.]
Uninsured losses could significantly reduce our earnings.
We self-insure for a portion of our claims exposure resulting from workers’ compensation, auto liability, general liability and employees’ health insurance. We also are responsible for our legal expenses relating to such claims. We maintain insurance above the amounts for which we self-insure with licensed insurance carriers. Although we believe the aggregate insurance limits should be sufficient to cover reasonably expected claims, it is possible that one or more claims could exceed our aggregate coverage limits. Additionally, there are certain losses, such as losses from hurricanes, terrorism, wars or earthquakes, where insurance is limited or not economically justifiable. If the Company experiences an uninsured loss of real property, we could lose both the invested capital and anticipated revenues associated with such property. We accrue currently for estimated incurred losses and expenses and periodically evaluate and adjust our claimsclaims’ accrued liability to reflect our experience. However, ultimate results may differ from our estimates, which could result in losses greater than accrued amounts.
We may be unable to renew leases or re-lease properties as leases expire.
When a lease expires, a tenant may elect not to renew it. If that occurs, we may not be able to lease the property on similar terms. The terms of renewal or re-lease (including the cost of required renovations and concessions to tenants) may be less favorable than the prior lease. If we are unable to lease all or substantially all of our properties, or if the rental rates upon such re-leasing are significantly lower than expected rates, our cash generated before debt repayments and capital expenditures may be adversely affected.
We may be unable to lease currently vacant properties.
If we are unable to obtain leases sufficient to cover carrying costs, then our cash flows may be adversely affected.
The bankruptcy or insolvency of significant tenants with long-term leases may adversely affect income produced by our properties.
Should tenants default on their obligations, our cash flow would be adversely affected, and we may not be able to find another tenant to occupy the space under similar terms or may have to make expenditures to retrofit or divide the space. Additionally, we may have to incur a non-cash expense for a significant amount of deferred rent revenue generated from the accounting requirement to straight-line rental revenues. The bankruptcy or insolvency of a major tenant may also adversely affect the income produced by a property. If any of our tenants become a debtor in a case under the U.S. Bankruptcy Code, we cannot evict that tenant
| 8 |
solely because of its bankruptcy. The bankruptcy court may authorize the tenant to reject and terminate its lease with the Company. Our claim against such a tenant for unpaid future rent would be subject to a statutory limitation that may be substantially less than the remaining rent actually owed to us under the tenant’s lease. Any shortfall in rent payments could adversely affect our cash flow.
Our inability to obtain necessary approvals for property development could adversely affect our profitability.
We may be unable to obtain, or incur delays in obtaining, necessary zoning, land-use, building, occupancy and other required governmental permits and authorizations, which could result in increased costs or abandonment of certain projects. Before we can develop a property, we must obtain a variety of approvals from local and state governments with respect to such matters as zoning, density, parking, subdivision, site planning and environmental issues. Legislation could impose moratoriums on new real estate development or land-use conversions from mining to development. These factors may reduce our profit or growth and may limit the value of these properties.
Real estate investments are not as liquid as other types of assets.
The illiquid nature of real estate investments may limit our ability to react promptly to changes in economic or other conditions. In addition, significant expenditures associated with real estate investments, such as mortgage payments, real estate taxes and maintenance costs, are generally not reduced when circumstances cause a reduction in income from the investments. Thus, the illiquid nature of our real estate investments could adversely affect our profitability under certain economic conditions.
Our debt service obligations may have adverse consequences on our business operations.
We use debt to finance our operations, including acquisitions of properties. As of December 31, 2021,2023, we had outstanding non-recourse mortgage indebtedness of $180,070,000, secured by developed real estate properties having a carrying value of $263,214,000.$246,804,000. Our use of debt may have adverse consequences, including the following:
| · | Our cash flows from operations may not be sufficient to meet required payments of principal and interest. |
| · | We may be forced to dispose of one or more of our properties, possibly on disadvantageous terms, to make payments on our debt. |
| · | We may default on our debt obligations, and the lenders may foreclose on our properties that collateralize those loans. |
| · | A foreclosure on one of our properties could create taxable income without any accompanying cash proceeds to pay the tax. |
| · | We may not be able to refinance or extend our existing debt. |
| · | The terms of any refinancing or extension may not be as favorable as the terms of our existing debt. |
| · | We may not be able to issue debt on unencumbered properties under reasonable terms to finance growth of our portfolio of properties. |
| · | We may be subject to a significant increase in the variable interest rates on our unsecured and secured lines of credit, which could adversely impact our operations. |
| · | Our debt agreements have yield maintenance requirements that result in a penalty if we prepay loans. |
Our uncollateralized revolving credit agreement restricts our ability to engage in some business activities.
Our uncollateralized revolving credit agreement contains customary negative covenants and other financial and operating covenants that, among other things:
| 9 |
| · | restricts our ability to incur certain additional indebtedness; |
| · | restricts our ability to make certain investments; |
| · | restricts our ability to merge with another company; |
| · | restricts our ability to pay dividends; |
| · | requires us to maintain financial coverage ratios; and |
| · | requires us to not encumber certain assets except as approved by the lenders. |
These restrictions could cause us to default on our unsecured line of credit or negatively affect our operations.
The replacement of LIBOR with an alternative reference rate may adversely affect interest expense related to outstanding debt and our financial results.
The United Kingdom’s Financial Conduct Authority (FCA) has announced that it would phase out LIBOR as a benchmark by the June 30, 2023. We will need to agree upon a replacement index with our lenders, which would require an amendment to our borrowing arrangements that use LIBOR as a factor in determining the interest rate (including our credit agreement with Wells Fargo), and the interest rate thereunder will likely change.
The U.S. Federal Reserve, in conjunction with the Alternative Reference Rates Committee, a steering committee comprised of large U.S. financial institutions, is considering replacing U.S. dollar LIBOR with a new index, the Secured Overnight Financing Rate (SOFR), calculated using short-term repurchase agreements backed by Treasury securities. Whether or not SOFR, or another alternative reference rate, attains market traction as a LIBOR replacement tool remains in question.
The transition to an alternative rate will require careful and deliberate consideration and implementation so as to not disrupt the stability of financial markets. There is no guarantee that a transition from LIBOR to an alternative will not result in financial market disruptions, significant increases in benchmark rates, or borrowing costs to borrowers, any of which could have an adverse effect on our business, results of operations and financial condition. Furthermore, any changes announced by the FCA, U.S. Federal Reserve, or other regulators in the method pursuant to which the reference rates are determined may result in a sudden or prolonged increase or decrease in the reported reference rates, which could have an adverse effect on our interest payments and our results of operations and financial condition.
Fluctuations in value of our investments U.S. Treasury debt.debt investments.
As of December 31, 2021,2023, the Company had total investments of $24,926,000$128,795,000 in U.SU.S. Treasury Notes which mature in late 2023.through mid-2024. The Company measures the fair value of these investments on a quarterly basis and recognizes the unrealized gain or loss in its comprehensive income. As a result, the Company’s comprehensive income will be impacted by factors outside our control such as fluctuations in interest rates that impact the value of our investment portfolio. The Company could incur losses should it sell the Notes prior to maturity.
Our Asset Management and Development SegmentsWe face competition from numerous sources.
As a developer of apartments, retail, flexible warehouse and office space, we compete with numerous developers, owners and operators of real estate, many of whom own properties similar to ours in the same submarkets in which our properties are located. If our competitors offer space at rental rates below current market rates, or below the rental rates we currently charge our tenants, we may lose potential tenants and we may be pressured to reduce our rental rates to an amount lower than we currently charge in order to retain tenants when our tenants’ leases expire. As a result, our financial condition, results of operations, cash flow and ability to satisfy our debt service obligations could be materially adversely affected.
Construction costs may be higher than anticipated.
Our long-term business plan includes a number of construction projects. The construction costs of these projects may exceed original estimates and possibly make the completion of a property uneconomical. Building material commodity shortages, supply chain disruptions, construction delays or stoppages or rapidly escalating construction costs may out-pace market rents, which would adversely affect our profits. The market environment and existing lease commitments may not allow us to raise rents to cover these higher costs.
Risks Relating to our Common Stock
Certain shareholders have effective control of a significant percentage of FRP's common stock and would have significant influence on the outcome of any shareholder vote.
As of December 31, 2021,2023, our Chief Executive Officer, John D. Baker, II beneficially owned approximately 14.9%15.8% of the outstanding shares of our common stock (79.4% of which are held in trusts under which voting power is shared with other family members) and members of his family who are (i) officers or directors of the company, (ii) required to report their beneficial ownership on Schedule 13D or Schedule 13G, or (iii) are members of his immediate family beneficially own, collectively, an additional 20.9%21.2% of the outstanding shares of our common stock. As a result, these individuals effectively may have the ability to direct the election of all members of our board of directors and to exercise a controlling influence over its business and affairs, including any determinations with respect to mergers or other business combinations involving the
Company, its acquisition or disposition of assets, its borrowing of monies, its issuance of any additional securities, its repurchase of common stock and its payment of dividends.
Provisions in our articles of incorporation and bylaws and certain provisions of Florida law could delay or prevent a change in control of FRP.
The existence of some provisions of our articles of incorporation and bylaws and Florida law could
| 10 |
discourage, delay or prevent a change in control of FRP that a shareholder may consider favorable. These include provisions:
These provisions apply even if a takeover offer may be considered beneficial by some shareholders and could delay or prevent an acquisition that our board of directors determines is not in the Company’s or the shareholders’ best interests.
FRP may issue preferred stock with terms that could dilute the voting power or reduce the value of our common stock.
Our articles of incorporation authorize us to issue, without the approval of our shareholders, one or more classes or series of preferred stock having such designations, powers, preferences and relative, participating, optional and other rights, and such qualifications, limitations or restrictions as our board of directors generally may determine. The terms of one or more classes or series of preferred stock could dilute the voting power or reduce the value of FRP's common stock. For example, FRP could grant holders of preferred stock the right to elect some number of its directors in all events or on the happening of specified events or the right to veto specified transactions. Similarly, the repurchase or redemption rights or dividend, distribution or liquidation preferences FRP could assign to holders of preferred stock could affect the residual value of the common stock.
Institutional investor focus on environmental, social and governance issues may impact our stock price.
Many large institutional investors focus on sustainability in managing investment risks, portfolio design and dealing with companies in which thethey invest. This focus extends to climate change and the plan for transitioning to a net-zero economy, diversity and inclusion and other human resource matters, and social and governance issues and corporate social responsibility. While we are proud of the returns to shareholders and our sustainable practices in construction and environmental management, we recognize our responsibility to focus on these key issues that impact our long-term sustainability. Our failure to demonstrate this commitment could dissuade institutional investors from holding our stock, which would result in downward pressure on our stock price.
Item 1B. UNRESOLVED STAFF COMMENTS.
None.
Item 1C. CYBERSECURITY.
We have processes in place for assessing, identifying, and managing material risks from cybersecurity threats which could result in information security breaches and significant disruption to our business. We have a multi-layer security approach including specialized hardware/software, access protocols, third-party
assessments, and regular training. Our servers are hosted by a third-party that provides Service Organization Control (SOC) Type 1 and 2 reports annually with monthly bridge letters and hosts a separate disaster recovery site. Our Firewall, Virtual Private Network, Multifactor Authentication, Email Gateway, Antivirus software, file storage protection software, and other software applications help mitigate cybersecurity risks. Our IT Steering committee reviews our access protocols and systems biannually. Our third-party internal auditing firm provided an assessment of our system design and performed testing. Our IT consultant participates in our weekly operations meetings, requires cybersecurity training, and monitors the results of test phishing and credential harvesting emails.
Our board of directors has oversight of our strategic and business risk management and has delegated cybersecurity risk management oversight to the Audit Committee of our board of directors. Our Audit Committee is responsible for ensuring that management has processes in place designed to identify and evaluate cybersecurity risks to which the company is exposed and to implement processes and programs to manage cybersecurity risks and mitigate cybersecurity incidents.
Management is responsible for identifying, assessing, and managing material cybersecurity risks on an ongoing basis, establishing processes to ensure that such potential cybersecurity risk exposures are monitored, putting in place appropriate mitigation measures, maintaining our business continuity plans, IT security policies and procedures, and providing regular reports to our board of directors, including through the Audit Committee. Our IT consultant monitors the prevention, detection, mitigation, and remediation of cybersecurity incidents through a variety of software tools, and regularly reports to management.
In 2023, we did not identify any cybersecurity events that have materially affected or are reasonably likely to materially affect our business, results of operations, or financial condition. However, despite our efforts, we cannot eliminate all risks from cybersecurity threats, or provide assurances that we have not experienced undetected cybersecurity incidents. For additional information about these risks, see Part I, Item 1A, "Risk Factors" in this Annual Report on Form 10-K.
Item 2. PROPERTIES.
The Company owns (predominately in fee simple but also through ownership of interests in joint ventures) approximately 20,00021,000 acres of land in Florida, Georgia, Maryland, Virginia, South Carolina, and the District of Columbia. This land is generally held by the Company in four distinct segments: (i) Asset ManagementIndustrial and Commercial Segment (land owned and operated as income producing rental properties in the form of commercial properties), (ii) Mining Royalty Lands Segment (land owned and leased to mining companies for royalties or rents), (iii) Development Segment (land owned and held for investment to be further developed for future income production or sales to third parties), and (iv) Stabilized Joint VentureMultifamily Segment (ownership, leasing and management of buildings through joint ventures).
Asset ManagementIndustrial and Commercial Segment. As of December 31, 2021,2023, the Asset ManagementIndustrial and Commercial Segment ownedincludes nine buildings at four commercial properties owned by the Company in fee simple as follows:
1) 34 Loveton Circle in suburban Baltimore County, MarylandMD consists of one office building totaling 33,708 square feet which is 95.1%90.8% occupied (16% of the space is occupied by the Company for use as our Baltimore headquarters). The property is subject to commercial leases with various tenants.
2) 155 E. 21st Street in Duval County, FloridaFL was an office building property that remains under lease through March 2026. We permitted the tenant to demolish all structures on the property during 2018.
3) Cranberry Run Business Park in HartfordHarford County, MarylandMD consists of five officeindustrial buildings totaling 267,737 square feet which are 81.0% occupied92.1% leased and 100.0% leased.occupied. The property is subject to commercial leases with various tenants.
4) Hollander 95 Business Park in Baltimore City, MarylandMD consists of twothree industrial buildings totaling 145,590247,340 square feet that were completed in the fourth quarter of 2021are 100.0% leased and are 29.1% leased.100.0% occupied
On May 21, 2018, the Company completed the disposition of 40 industrial warehouse properties and three additional land parcels to an affiliate of Blackstone Real Estate Partners VIII, L.P. for $347.2 million. The Company sold an additional warehouse property, which was excluded from the initial sale due to the tenant exercising its right of first refusal to purchase the property, to the same buyer for $11.7 million on June 28, 2019. The warehouse portfolio sale resulted in the disposition of all of the Company’s industrial flex/office warehouse properties prior to the sale date and constituted a major strategic shift and, as a result, these properties have been reclassified as discontinued operations for all periods presented in the financial statements filed herewith.
| 12 |
Mining Royalty Lands Segment.
Introduction.
Pursuant to amendments to Regulation S-K of the Securities Act of 1933 (“Regulation S-K”) adopted by the Securities and Exchange Commission in 2018, effective for fiscal years beginning on or after January 1, 2021, registrants with material mining operations must disclose certain information in their Securities and Exchange Act filings concerning mineral resources and mineral reserves, in accordance with to Subpart 1300 of Regulation S-K. This section of Item 2 provides summary information about our overall portfolio of mining royalty properties.
Our mining leases do not require tenants to furnish technical report summaries that meet the requirements of Rule 1302, and the Company does not otherwise have access to the technical data required to determine precise amounts of each class of mineral resource or probable or proven resources. In accordance with Rule 1303(a)(3), the Company is providing all required information in its possession or which it can obtain without incurring an unreasonable burden or expense.
The Company periodically engages consultants to examine reserveremaining sand and stone deposit estimates and geological studies conducted by tenants and their industry professionals.
Locations. The following map presents the locations of the Company’s mining properties, which are discussed by segment (as reported in the Company’s financial statements) below:
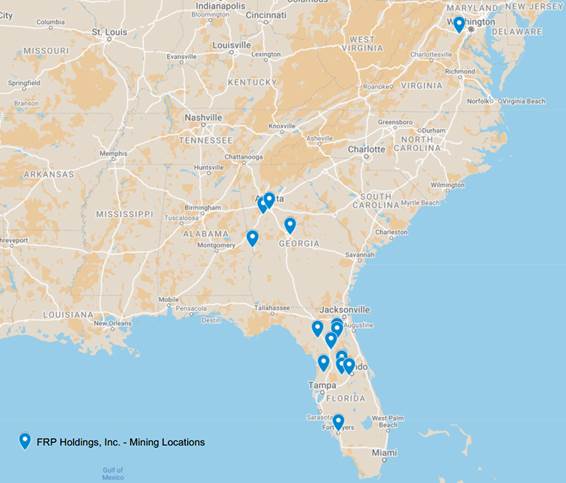
| 13 |
Mining Properties. TheThe Company owns a fee simple interest in 1314 open pit aggregates quarries located in Florida, Georgia and Virginia, which comprise approximately 15,00016,650 total acres. The Company’s quarries are subject to mining leases with various tenants, including Vulcan Materials, Martin Marietta, Cemex, Argos, and The Concrete Company. Aggregates consist of crushed stone, sand, gravel, fill dirt, limestone and calcium and are used primarily in construction applications.
Nine of the Company’s quarries (located in Grandin, FL, Fort Myers, FL, Keuka, FL, Newberry, FL, Astatula, FL, Columbus, GA, Macon, GA, Tyrone, GA, and Manassas, VA; comprising 12,649 acres in the aggregate)totaling 13,876 acres) are currently being mined, and fourfive of the Company’s quarries (located in Marion County, FL, Lake Louisa, FL, Astatula, FL and Lake Sand, FL and Forest Park, GA; comprising 2,452 acres in the aggregate)totaling 2,778 acres) are leased but are not currently being mined. Our typical mining lease requires the tenant to pay the Company a royalty based on the number of tons of mined materials sold from our mining property during a given fiscal year multiplied by a percentage of the average annual sales price per ton sold. In certain locations, typically where the reservessand and stone deposits on the property have been depleted but the tenant still has a need for the leased land, we collect a minimum annual rental amount. In the fiscal years ended December 31, 2021, 20202023, 2022 and 2019,2021, aggregate tons sold with respect to the Company’s mining properties were approximately 7,575,000, 8,206,0009,569,000, 9,525,000 and 7,815,000,7,575,000, respectively.
In May 2014, the Company entered into an amendment to our lease with Vulcan for our Fort Myers location requiring that the mining be accelerated and that the mining plan be conformed to accommodate the future construction of up to 105 residential dwelling units around the mined lakes. In return, the Company granted
Lee County an option to purchase a right of way for a connector road that would benefit the residential area on our property and to place a conservation easement on part of the property, which the County exercised in 2020. Mining activity commenced in 2017 following Lee County’s issuance of a mine operating permit allowing Vulcan to begin production.
In November 2017, Lake County commissioners voted to approve a permit to Cemex to mine the Company’s land in Lake Louisa, Florida. The county issued the permit in July 2019. AfterCemex expects to begin mining in late 2024 after completing the work necessary to prepare this site to become an active sand mine, Cemex expects to begin mining by March 2023.mine.
Brooksville Joint Venture. Additionally, through a joint venture with Vulcan Materials, the Company owns a 50% interest in 4,280 acres of mixed-use property in Brooksville, Florida, a portion of which comprises an aggregates quarrya ground calcium mine that is mined by Vulcan Materials. The Company entered into the joint venture in 2006 for the purpose of jointly owning and developing the land as a mixed-use community. In April 2011, the Florida Department of Community Affairs issued its final order approving the development of the project consisting of 5,800 residential dwelling units and over 600,000 square feet of commercial and 850,000 of light industrial uses. Zoning for the project was approved by the County in August 2012. Vulcan Materials still mines on the property and the Company receives 100% of the royalty on all tons sold at the Brooksville property. During 2017, the Company extended the mining lease on this property for an additional ten years (through 2032) in exchange for an increase in production of 100,000 tons by December 31, 2023. In the fiscal years ended December 31, 2021, 2020,2023, 2022, and 2019,2021, aggregate tons sold were approximately 280,000, 285,000259,000, 244,000 and 295,000,280,000, respectively.
Other Properties. The Company also owns an additional 10736 acres of investment property in Brooksville, Florida.
Development Segment – Warehouse/OfficeIndustrial and Commercial Land.
At December 31, 2021,2023, this segment owned the following future development parcels:
| 1) |
| 17 acres of land in Harford County, |
| 3) | 170 acres of land in Cecil County, MD that |
Development Segment – Land Held for InvestmentDevelopment or Sale.
| 14 |
At December 31, 2021,2023, this segment ownedwas invested in the following development parcels:
| 1) | Riverfront on the Anacostia: The Riverfront on the Anacostia property is a 5.8-acre parcel of real estate in Washington, D.C. that fronts the Anacostia River and is adjacent to the Washington Nationals Baseball Park. A revised Planned Unit Development (PUD) plan was approved in 2012 and permits the Company to develop, in four phases, a four-building, mixed-use project, containing approximately 1,161,050 square feet. The approved development includes numerous publicly accessible open spaces and a waterfront esplanade along the Anacostia River. The first phase (now known as Dock 79), which was completed through a joint venture with MRP Realty, and which consisted of a single building with residential and retail uses, became our fourth business segment in July 2017, now known as the |
| 2) | Hampstead Trade Center: The Hampstead Trade Center property in |
| 3) | Bryant Street: On December 24, 2018 the Company and MRP Realty formed four partnerships to purchase and develop approximately five acres of land at 500 Rhode Island Ave NE, Washington, D.C. This property is the first phase of the Bryant Street Master Plan. The property is located in an Opportunity Zone, which provides tax benefits in the new communities development program as established by Congress in the Tax Cuts and Jobs Act of 2017. This first phase is a mixed-use development which supports 487 residential units and |
| 4) |
| 5) | Square 664E: The Company’s Square 664E property is approximately two acres situated on the Anacostia River at the base of South Capitol Street less than half a mile down river from our Riverfront on the Anacostia property. This property is currently under lease to Vulcan Materials for use as a concrete batch plant through 2026. In March 2017, reconstruction of the bulkhead was completed at a cost of $4.2 million in anticipation of future high-rise development. |
| 6) | .408 Jackson: In December 2019, the Company entered into a joint venture with |
| 15 |
| 7) |
| Windlass Run: In March 2016, the Company entered into an agreement with St. Johns Properties Inc., a Baltimore development company, to jointly develop the remaining lands of our Windlass Run Business Park, located in Middle River, |
| 8) | Estero: In August 2022, the Company invested $3.6 million for a minority interest in a joint venture with Woodfield Development to purchase and develop 46 acres in Estero, FL into a mixed-use project with 554 multifamily units, 72,000 square feet of commercial space, 41,000 square feet of office space and a boutique 170-key hotel. While the joint venture attempts to rezone the property, the Company will receive a preferred return of 8% with an option to roll its investment into equity in the vertical development or exit at that point. |
| 9) | Buzzard Point: In November 2022, the Company entered into a contribution agreement with MRP and Steuart Investment Company (SIC) regarding potential development of an estimated 1,200 multifamily units in four phases on land owned by SIC. The Company entered into a separate agreement with MRP to perform pre-development obligations for the contribution agreement. The company owns 50% of the partnership with MRP. |
| 10) | Woven: In August 2023, the Company entered into an agreement with Woodfield Development for the acquisition and development of a mixed-use project known as “Woven” in Greenville, SC, to consist of an estimated 214 multifamily units and 10,000 square feet of retail space. The joint venture is in the pre-development and pre-closing phase in pursuit of vertical construction closing conditions. The Company owns 50% at this time with final ownership to be determined based upon contributions by the partners, land contributors, and other investors. |
Stabilized Joint VentureMultifamily Segment.
At December 31, 2021,2023, this segment ownedwas invested in the following stabilized multifamily joint ventures:
| 1) | Dock 79: Dock 79 (Phase I of the Riverfront on the Anacostia development) is a 305-unit residential apartment building with approximately 14,430 square feet of first floor retail space. The property is situated on approximately 2.1 acres of land located on Potomac Avenue in Washington, DC, across the street from the Nationals Park. |
| 2) | The Maren: The Maren (Phase II of the Riverfront on the Anacostia development) is a 264-unit residential apartment building with |
| 3) |
Item 3. LEGAL PROCEEDINGS.
None.
Item 4. MINE SAFETY DISCLOSURES.
None.
PART II
Item 5. MARKET FOR REGISTRANT'S COMMON EQUITY, RELATED STOCKHOLDER MATTERS AND ISSUER PURCHASES OF EQUITY SECURITIES.
There were approximately 333315 holders of record of FRP Holdings, Inc. common stock, $.10 par value, as of December 31, 2021.2023. The Company's common stock is traded on the Nasdaq Stock Market (Symbol FRPH).
Price Range of Common Stock. Information concerning stock prices is included under the caption "Quarterly Results" on page 9 of the Company's 20212023 Annual Report to Shareholders, and such information is incorporated herein by reference.
Dividends. The Company has not paid a cash dividend in the past and it is the present policy of the Board of Directors not to pay cash dividends. Information concerning restrictions on the payment of cash dividends is included in Note 4 to the consolidated financial statements included in the accompanying 20212023 Annual Report to Shareholders, and such information is incorporated herein by reference.
Securities Authorized for Issuance Under Equity Compensation Plans. Information regarding securities authorized for issuance under equity compensation plans is included in Item 12 of Part III of this Annual Report on Form 10-K, and such information is incorporated herein by reference.
Purchases of Equity Securities by the Issuer and Affiliated Purchasers
| Total | ||||||||||||||||||
| Number of | ||||||||||||||||||
| Shares | ||||||||||||||||||
| Purchased | Approximate | |||||||||||||||||
| As Part of | Dollar Value of | |||||||||||||||||
| Total | Publicly | Shares that May | ||||||||||||||||
| Number of | Average | Announced | Yet Be Purchased | |||||||||||||||
| Shares | Price Paid | Plans or | Under the Plans | |||||||||||||||
| Period | Purchased | per Share | Programs | or Programs (1) | ||||||||||||||
| October 1 through October 31 | — | $ | — | — | $ | 9,363,000 | ||||||||||||
| November 1 through November 30 | — | $ | — | — | $ | 9,363,000 | ||||||||||||
| December 1 through December 31 | — | $ | — | — | $ | 9,363,000 | ||||||||||||
| Total | — | $ | — | — | ||||||||||||||
| Total | ||||||||||||||||||
| Number of | ||||||||||||||||||
| Shares | ||||||||||||||||||
| Purchased | Approximate | |||||||||||||||||
| As Part of | Dollar Value of | |||||||||||||||||
| Total | Publicly | Shares that May | ||||||||||||||||
| Number of | Average | Announced | Yet Be Purchased | |||||||||||||||
| Shares | Price Paid | Plans or | Under the Plans | |||||||||||||||
| Period | Purchased | per Share | Programs | or Programs (1) | ||||||||||||||
| October 1 through October 31 | — | $ | — | — | $ | 7,363,000 | ||||||||||||
| November 1 through November 30 | — | $ | — | — | $ | 7,363,000 | ||||||||||||
| December 1 through December 31 | — | $ | — | — | $ | 7,363,000 | ||||||||||||
| Total | — | $ | — | — | ||||||||||||||
(1) On February 4, 2015, the Board of Directors authorized management to expend up to $5,000,000 to repurchase shares of the Company’s common stock from time to time as opportunities arise. On December 5, 2018, the Board of Directors approved a $10,000,000 increase in the Company’s stock repurchase authorization. On August 5, 2019, the Board of Directors approved a $10,000,000 increase in the Company’s stock repurchase authorization. On May 6, 2020, the Board of Directors approved a $10,000,000 increase in the Company’s stock repurchase authorization. On August 26, 2020, the Board of Directors approved a $10,000,000 increase in the Company’s stock repurchase authorization.
Item 6. [RESERVED]
Item 7. MANAGEMENT'S DISCUSSION AND ANALYSIS OF FINANCIAL CONDITION AND RESULTS OF OPERATION.
Information required in response to Item 7 is included under the caption "Management’s Discussion and Analysis of Financial Condition and Results of Operation" on pages 10 through 21 of the Company’s 20212023 Annual Report to Shareholders, and such information is incorporated herein by reference.
| 17 |
Item 7.A QUANTITATIVE AND QUALITATIVE DISCLOSURES ABOUT MARKET RISK.
Interest Rate Risk - We are exposed to the impact of interest rate changes through our variable-rate borrowings under our Credit Agreement with Wells Fargo.
Under the Wells Fargo Credit Agreement, the applicable margin for borrowings at December 31, 20212023 was Daily 1-Month LIBORSimple SOFR plus 1.0%2.25%. The applicable margin for such borrowings will be increased in the event that our debt to capitalization ratio as calculated under the Wells Fargo Credit Agreement Facility exceeds a target level.
The Company did not have any variable rate debt outstanding at December 31, 2021,2023, so a sensitivity analysis was not performed to determine the impact of hypothetical changes in interest rates on the Company’s results of operations and cash flows.
For our debt instruments with variable interest rates, changes in interest rates affect the amount of interest expense incurred. The following table presents the principal cash flow payments associated with our outstanding debt by year, weighted average interest rates on debt outstanding each year-end, and fair value of total debt as of December 31, 20212023 (dollars in thousands):
| 2022 | 2023 | 2024 | 2025 | 2026 | Thereafter | Total | Fair Value | 2024 | 2025 | 2026 | 2027 | 2028 | Thereafter | Total | Fair Value | |||||||||||||||||||||||||||||||||||||||||||||||
| Fixed rate debt | $ | — | $ | — | $ | — | $ | — | $ | — | $ | 180,070 | $ | 180,070 | $ | 174,111 | $ | — | $ | — | $ | — | $ | — | $ | — | $ | 180,070 | $ | 180,070 | $ | 145,678 | ||||||||||||||||||||||||||||||
| Average interest for fixed rate debt | 3.03 | % | 3.03 | % | 3.03 | % | 3.03 | % | 3.03 | % | 3.03 | % | 3.03 | % | 3.03 | % | 3.03 | % | 3.03 | % | 3.03 | % | 3.03 | % | 3.03 | % | 3.03 | % | ||||||||||||||||||||||||||||||||||
Item 8. FINANCIAL STATEMENTS AND SUPPLEMENTARY DATA.
Information required in response to this Item 8 is included under the caption "Quarterly Results" on page 9 and on pages 22 through 41 of the Company's 20212023 Annual Report to Shareholders. Such information is incorporated herein by reference.
Item 9. CHANGES IN AND DISAGREEMENTS WITH ACCOUNTANTS ON ACCOUNTING AND FINANCIAL DISCLOSURE.
None.
Item 9A. CONTROLS AND PROCEDURES.
CONCLUSION REGARDING THE EFFECTIVENESS OF DISCLOSURE CONTROLS AND PROCEDURES
Under the supervision and with the participation of our management, including our principal executive officer, principal financial officer and chief accounting officer, we conducted an evaluation of our disclosure controls and procedures, as such terms are defined under Rule 13a-15(e) promulgated under the Exchange Act. Based on this evaluation, our principal executive officer, our principal financial officer and our chiefprincipal accounting officer concluded that our disclosure controls and procedures were effective as of the end of the period covered by this Annual Report.
MANAGEMENT’S REPORT ON INTERNAL CONTROL OVER FINANCIAL REPORTING
Our management is responsible for establishing and maintaining adequate internal control over financial reporting, as such term is defined in Exchange Act Rule 13a-15(f). Under the supervision and with the participation of our management, including our principal executive officer, principal financial officer and principal accounting officer, we conducted an evaluation of the effectiveness of our internal control over
financial reporting based on the framework in the Internal Control-Integrated Framework (2013) issued by the Committee of Sponsoring Organizations of the Treadway Commission (COSO). Based on our evaluation
| 18 |
under the framework in the Internal Control-Integrated Framework (2013), our management concluded that our internal control over financial reporting was effective as of December 31, 2021.2023.
This Annual Report does not include an attestation report of our Independent Registered Public Accounting Firm, Hancock Askew & Co., LLP, regarding internal control over financial reporting. Management’s report was not subject to attestation by our Independent Registered Public Accounting Firm pursuant to rules of the Securities and Exchange Commission that permit the Company to provide only management’s report in this Annual Report.
CHANGE IN INTERNAL CONTROL OVER FINANCIAL REPORTING
During the fourth quarter of 2021,2023, there were no changes in our internal control over financial reporting that have materially affected, or are reasonably likely to materially affect, our internal control over financial reporting.
INHERENT LIMITATIONS OVER INTERNAL CONTROLS
Our internal control over financial reporting is designed to provide reasonable assurance regarding the reliability of financial reporting and the preparation of consolidated financial statements for external purposes in accordance with generally accepted accounting principles. Our internal control over financial reporting includes those policies and procedures that:
| i. | pertain to the maintenance of records that, in reasonable detail, accurately and fairly reflect the transactions and dispositions of our assets; |
| ii. | provide reasonable assurance that transactions are recorded as necessary to permit preparation of consolidated financial statements in accordance with generally accepted accounting principles, and that our receipts and expenditures are being made only in accordance with authorizations of our management and directors; and |
| iii. | provide reasonable assurance regarding prevention or timely detection of unauthorized acquisition, use or disposition of our assets that could have a material effect on the consolidated financial statements. |
Internal control over financial reporting cannot provide absolute assurance of achieving financial reporting objectives because of its inherent limitations, including the possibility of human error and circumvention by collusion or overriding of controls. Accordingly, even an effective internal control system may not prevent or detect material misstatements on a timely basis. Also, projections of any evaluation of effectiveness to future periods are subject to the risk that controls may become inadequate because of changes in conditions or that the degree of compliance with the policies or procedures may deteriorate.
ITEM 9B. OTHER INFORMATION.
None.
ITEM 9C. DISCLOSURE REGARDING FOREIGN JURISDICTIONS THAT PREVENT INSPECTIONS.
Not applicable.
| 19 |
PART III
Item 10. DIRECTORS, EXECUTIVE OFFICERS AND CORPORATE GOVERNANCE.
The Company has adopted a Financial Code of Ethical Conduct applicable to its principal executive officers, principal financial officers and principal accounting officers. A copy of this Financial Code of Ethical Conduct is filed as Exhibit 14 to this Form 10-K. The Financial Code of Ethical Conduct is also available on our web site at www.frpdev.com/investor-relations/corporate-governance/.
The rest of the information required in response to this Item 10 is included under the captions “Board“Our Board of Directors & Corporate Governance”Directors”, “Corporate Governance, ESG and Our Approach to Risk Management”, “Our Executive Officers”, “Securities Ownership” in the Company's Proxy Statement, and such information is incorporated herein by reference. The Proxy Statement will be filed with the Securities and Exchange Commission not later than March 31, 2022.2024.
Item 11. EXECUTIVE COMPENSATION.
Information required in response to this Item 11 is included under the caption “Executive Compensation” in the Company's Proxy Statement, and such information is incorporated herein by reference. The Proxy Statement will be filed with the Securities and Exchange Commission not later than March 31, 2022.2024.
Item 12. SECURITY OWNERSHIP OF CERTAIN BENEFICIAL OWNERS AND MANAGEMENT AND RELATED STOCKHOLDER MATTERS.
Equity Compensation Plan Information
| Number of Securities | Number of Securities | |||||||||||||||
| remaining available | remaining available | |||||||||||||||
| Number of Securities | for future issuance | Number of Securities | for future issuance | |||||||||||||
| to be issued upon | Weighted average | under equity | to be issued upon | Weighted average | under equity | |||||||||||
| exercise of | exercise price of | compensation plans | exercise of | exercise price of | compensation plans | |||||||||||
| outstanding options, | outstanding options, | (excluding securities | outstanding options, | outstanding options, | (excluding securities | |||||||||||
| warrants and rights | warrants and rights | reflected in column (a)) | warrants and rights | warrants and rights | reflected in column (a)) | |||||||||||
| Plan Category | (a) | (b) | (c) | (a) | (b) | (c) | ||||||||||
| Equity compensation plans | ||||||||||||||||
| approved by security holders | 154,532 | (1) | $ | 37.93 | (2) | 403,499 | (1) | 124,866 | (1) | $ | 39.99 | (2) | 344,077 | (1) | ||
| Equity compensation plans | ||||||||||||||||
| not approved by security holders | 0 | 0 | 0 | 0 | 0 | 0 | ||||||||||
| Total | 154,532 | $ | 37.93 | 403,499 | 124,866 | $ | 39.99 | 344,077 | ||||||||
| 1. | Column (a) includes |
payout of the performance share awards has been assumed, and the number of performance share awards has been calculated using our closing stock price on March 2, 20226, 2024 ($58.06)60.51). The performance share awards are subject to partial or complete forfeiture if the vesting criteria are not met. Because some or all of the performance share awards may not vest, and because the number of shares of restricted stock to be issued thereunder is dependent on future stock prices, columns (a) and (c) may overstate or understate expected dilution.
| 2. | Because there is no exercise price associated with the performance share awards, the weighted-average exercise price does not take the performance share awards into account. |
The remainder of the information required in response to this Item 12 is included under the captionscaption “Securities Ownership” in the Company's Proxy Statement, and such information is incorporated herein by reference. The Proxy Statement will be filed with the Securities and Exchange Commission not later than March 31, 2022.2024.
Item 13. CERTAIN RELATIONSHIPS AND RELATED TRANSACTIONS, AND DIRECTOR INDEPENDENCE.
Information required in response to this Item 13 is included under the captions “Related Party Transactions”“Corporate Governance, ESG and “BoardOur Approach to Risk Management” and “Our Board of Directors & Corporate Governance”Directors” in the Company's Proxy Statement, and such information is incorporated herein by reference. The Proxy Statement will be filed with the Securities and Exchange Commission not later than March 31, 2022.2024.
Item 14. PRINCIPAL ACCOUNTING FEES AND SERVICES.
Our independent registered accounting firm is Hancock Askew & Co., LLP, Jacksonville, Florida, Firm 794. Information required in response to this Item 14 is included under the captionscaption “Proposal 2: The Auditor Proposal” in the Company’s Proxy Statement, and such information is incorporated herein by reference. The Proxy Statement will be filed with the Securities and Exchange Commission not later than March 31, 2022.2024.
PART IV
Item 15. EXHIBITS, FINANCIAL STATEMENT SCHEDULE.
(a) (1) Financial Statements.
The response to this item is submitted as a separate section. See Index to Financial Statements on page 2726 of this Form 10-K.
(3) Exhibits.
The response to this item is submitted as a separate section. See Exhibit Index on pages 2524 through 2625 of this Form 10-K.
Item 16. FORM 10-K SUMMARY.
None.
None.
SIGNATURES
Pursuant to the requirements of Section 13 or 15(d) of the Securities Exchange Act of 1934, the registrant has duly caused this report to be signed on its behalf by the undersigned, thereunto duly authorized.
| FRP Holdings, Inc. | ||||
Date: March | By | JOHN D. BAKER II | ||
| John D. Baker II | ||||
| Chief Executive Officer | ||||
| (Principal Executive Officer) | ||||
| By | JOHN D. BAKER, III | |||
| John D. Baker, III | ||||
| Treasurer and Chief Financial Officer | ||||
| (Principal Financial Officer) | ||||
| By | JOHN D. KLOPFENSTEIN | |||
| John D. Klopfenstein | ||||
| Controller and Chief Accounting | ||||
| Officer (Principal Accounting Officer) | ||||
| 22 |
Pursuant to the requirements of the Securities Exchange Act of 1934, this report has been signed below by the following persons on behalf of the registrant and in the capacities indicated on March 30, 2022.26, 2024.
/s/ John D. Baker II John D. Baker II Executive Chairman and Chief Executive Officer | /s/
President and Vice-Chair Director | |
| (Principal Executive Officer) | ||
/s/ Matthew S. McAfee Matthew S. McAfee Director | ||
/s/ John D. Baker, III John D. Baker, III Treasurer and Chief Financial Officer (Principal Financial Officer) |
Director | |
/s/ John D. Klopfenstein John D. Klopfenstein Controller and Chief Accounting Officer (Principal Accounting Officer) | /s/
Director | |
/s/ Nicole B. Thomas Nicole B. Thomas Director | ||
/s/ William H. Walton William H. Walton Director | /s/Margaret Wetherbee Margaret Wetherbee Director |
| 23 |
FRP HOLDINGS, INC.
FORM 10-K FOR THE FISCAL YEAR ENDED DECEMBER 31, 20212023
EXHIBIT INDEX
| Item | 15(a)(3) |
| 24 |
| 101.INS | XBRL Instance Document Taxonomy Extension Schema |
| 101.SCH | XBRL Taxonomy Extension Schema Document |
| 101.CAL | XBRL Taxonomy Extension Calculation Linkbase |
| 101.DEF | XBRL Taxonomy Extension Definition Linkbase |
| 101.LAB | XBRL Taxonomy Extension Label Linkbase |
| 101.PRE | XBRL Taxonomy Extension Presentation Linkbase |
| 104 | Cover Page Interactive Data File (embedded within the Inline XBRL document and contained in Exhibit 101). |
FRP HOLDINGS, INC.
INDEX TO FINANCIAL STATEMENTS
(Item 15(a) (1) and 2))
| Page | ||||
| Consolidated Financial Statements: | ||||
| Consolidated balance sheets at December 31, | 54 | |||
| For the years ended December 31, | ||||
| Consolidated statements of income | 52 | |||
| Consolidated statements of comprehensive income | 53 | |||
| Consolidated statements of cash flows | 55 | |||
| Consolidated statements of shareholders' equity | 56 | |||
| Notes to consolidated financial statements | ||||
| Report of Independent Registered Public Accounting Firm | ||||
| Selected quarterly financial data (unaudited) | ||||
| Consent of Independent Registered Public Accounting Firm | ||||
All schedules have been omitted, as they are not required under the related instructions, are inapplicable, or because the information required is included in the consolidated financial statements.
Exhibit 23
CONSENT OF INDEPENDENT REGISTERED PUBLIC ACCOUNTING FIRM
FRP Holdings, Inc.
Jacksonville, Florida
We hereby consent to the incorporation by reference in the Registration Statements on Form S-8 (No. 333- 125099, 333-131475 and 333-216025) of FRP Holdings, Inc. of our report dated March 30, 2022,26, 2024, relating to the consolidated financial statements which appear in the Annual Report to Shareholders incorporated by reference herein.
Respectfully submitted,
Hancock Askew & Co., LLP
Jacksonville, Florida
March 30, 202226, 2024
Annual Report 20212023
CONSOLIDATED FINANCIAL HIGHLIGHTS
Years ended December 31
(Amounts in thousands except per share amounts)
| % | % | |||||||||||||||||||||||
| 2021 | 2020 | Change | 2023 | 2022 | Change | |||||||||||||||||||
| Revenues | $ | 31,220 | 23,583 | 32.4 | $ | 41,506 | 37,481 | 10.7 | ||||||||||||||||
| Operating profit | $ | 2,274 | 5,134 | (55.7 | ) | $ | 11,700 | 7,996 | 46.3 | |||||||||||||||
| Net investment income | $ | 4,215 | 7,415 | (43.2 | ) | $ | 10,897 | 5,473 | 99.1 | |||||||||||||||
| Interest Expense | $ | (2,304 | ) | (1,100 | ) | 109.5 | $ | (4,315 | ) | (3,045 | ) | 41.7 | ||||||||||||
| Equity in loss of joint ventures | $ | (5,754 | ) | (5,690 | ) | 1.1 | $ | (11,937 | ) | (5,721 | ) | 108.7 | ||||||||||||
| Gain on remeasurement of investment in real estate partnership | $ | 51,139 | — | — | ||||||||||||||||||||
| Gain on sale of real estate | $ | 805 | 9,170 | (91.2 | ) | |||||||||||||||||||
| Gain (loss) attributable to noncontrolling interest | $ | 11,879 | (993 | ) | 1296.3 | |||||||||||||||||||
| Gain on sale of real estate and other income | $ | 53 | 874 | (93.9 | ) | |||||||||||||||||||
| Loss attributable to noncontrolling interest | $ | (420 | ) | (518 | ) | (18.9 | ) | |||||||||||||||||
| Net income attributable to the Company | $ | 28,215 | 12,715 | 121.9 | $ | 5,302 | 4,565 | 16.1 | ||||||||||||||||
| Per common share: | ||||||||||||||||||||||||
| Net income attributable to the Company: | ||||||||||||||||||||||||
| Basic | $ | 3.02 | 1.33 | 127.1 | $ | 0.56 | 0.49 | 14.3 | ||||||||||||||||
| Diluted | $ | 3.00 | 1.32 | 127.3 | $ | 0.56 | 0.48 | 16.7 | ||||||||||||||||
| Total Assets | $ | 678,190 | 536,360 | 26.4 | $ | 709,166 | 701,084 | 1.2 | ||||||||||||||||
| Total Debt | $ | 178,409 | 89,964 | 98.3 | $ | 178,705 | 178,557 | — | ||||||||||||||||
| Shareholders' Equity | $ | 396,423 | 367,654 | 7.8 | $ | 414,520 | 407,145 | 1.8 | ||||||||||||||||
| Common Shares Outstanding | 9,411 | 9,364 | .5 | 9,484 | 9,460 | .3 | ||||||||||||||||||
| Book Value Per Common Share | $ | 42.12 | 39.26 | 7.3 | $ | 43.71 | 43.04 | 1.6 | ||||||||||||||||
BUSINESS. FRP Holdings, Inc. is a holding company engaged in the real estate business, namely (i) leasing and management of commercial properties owned by the Company, (ii) leasing and management of mining royalty land owned by the Company, (iii) real property acquisition, entitlement, development and construction primarily for apartment, retail, warehouse, and office buildings either alone or through joint ventures, (iv) ownership, leasing and management of buildings through joint ventures. The Company’s operating subsidiaries are FRP Development Corp. and Florida Rock Properties, Inc.
STRATEGY. Our strategy consists of athe re-deployment of proceedscash from the May 2018 warehouse saleasset sales, real estate operations, and mining royalties, into asset classesnew assets that allow management to exploit its knowledge and expertise. The asset classes of choice are mixed-use, industrial, raw land, existing buildings, and repeatable strategic partnerships located in core markets with growth potential. Emphasis will be placed on generating returns through opportunistic disposition, versusas well as cash-flow and long-term appreciation.
OBJECTIVE. We strive to improve shareholder value through (1) active engagement with properties and partners to grow asset value, (2) contributing our operating expertise and connections to maximize value and NOI growth, and (3) manage our capital structure in an efficient and responsible manner, with a watchful eye on projected future market conditions and trends to facilitate timely disposition of selected assets, (4) balancing growthdiligent, sustainable growth.
| 28 |
To Our Shareholders,
It is a truth universally acknowledged, at least in the investment world, that diversification on the company level is unnecessary if not out-and-out a bad thing. The heyday of the conglomerates like Gulf & Western or GE at its Jack Welch peak, with their hands in multiple assets and industries and global markets, is over. Investor bias towards asset concentration makes sense on a number of levels: it prevents empire building; it is hard enough to “get smart” on one industry, let alone a multitude of unrelated industries; investors don’t need companies to diversify for them when they can do it themselves as they see fit. The biggest argument against diversification on the company level is that it complicates things. Valuing one type of asset is easier than valuing multiple asset types.
This Company is not simple. Though far from a conglomerate, we have several business segments in different and unrelated facets of the real estate industry. We have our in-house projects and a multitude of joint ventures. The investor who knows the apartment business might not want to take the time to get to know the industrial space and almost certainly has limited exposure to the aggregates business. That surface level complexity and lack of concentration in one particular asset type is probably off-putting to some investors, especially for a company our size. We are arguably the corporate version of what Scott Fitzgerald referred to as “that most limited of all specialists—the well-rounded man.”
Our complexity is also part of the heritage of this Company, and we believe we have made it into an asset. Our mining royalties are the sole reason for this Company’s existence and have been an instrumental component of the cashflow engine that has fueled our debt-free industrial development. We could have sold our land on the Anacostia River in DC, and deemed multifamily development outside of our focus, and we would have closed the door on owning some of the best assets in one of the greatest cities in the world. When we sold our industrial portfolio in 2018, we could have solely concentrated on multi-family projects, and in doing so, we would have written off decades of industrial real estate experience, not to mention the recent boom in industrial real estate values.
We are a full-service real estate developer with expertise and experience in several asset classes at every stage of the development and ownership level. The ability to shift our capital, focus, and level of exposure between different asset classes is a good thing, and we believe it has served and will continue to serve this Company and its investors well. To that end, as we announced at our Investor Day in October, we are shifting our development focus away from multifamily towards industrial. The combination of both the shrinking of margins in the multifamily space because of the cost of debt and materials, as well as the softening of the DC market pressure.as a glut of post-covid projects came on line in the last two years, has led us to believe we are better off delaying any multifamily projects in that market. We have long-term faith in the DC market, and our partnership with MRP and the Steuart Investment Company to develop the Steaurt Family parcels is an amazing opportunity, but right now the timing is wrong. At the same time, despite the cost of materials, the industrial market is still excellent, and we can finance most of the development in our industrial pipeline on an all-equity basis. This is a perfect example of the benefit of having multiple asset types in our development strategy.
Having a multifaceted development strategy has served the Company well, but, as mentioned previously, it has also tended to muddy the waters for our investors. We are a small company, but in less than a decade we have shifted from an industrial asset manager with some development, to a developer with some asset management. Furthermore, we are a JV partner in a multitude of projects, a capital partner, a lender… it’s a lot, and it has tended to make our quarterly filings a trip to proverbial firehose for a drink of water. While we have tried to play to our strengths and put our cash to work, we have done a poor job of making our Company easier to understand. In our effort to grow shareholder value, we have made it harder for investors to wrap their arms around everything we do. This complexity in a company our size is one reason why we believe our stock price has never reflected our true net asset value. In theory, we could just keep our heads down and do our jobs and wait for an efficient market to recognize the fruits of our labor. In reality, we have to be more proactive about explaining what we do, how we do it, and where we are headed. It is our belief that our development strategy is a strength, maybe our biggest strength. But it also makes us complex, and unless we want to turn our back on that very strategy, then we have to make it easier for the investing public to understand us. Our Investor Day in October was a good start. Publishing a quarterly analysis of the estimated value of our assets is another step in the right direction. We are far from done.
| 29 |
To Our Shareholders,INDUSTRIAL AND COMMERCIAL
ThereIn an attempt to further clarify what we do, we have renamed our “Asset Management” and “Stabilized Joint Venture” segments. Going forward, these will be our “Industrial and Commercial” and “Multifamily” segments. This change is a concept in the studypurely cosmetic and does not shift assets between segments and requires no restatement of cognitive behavior known as “recency bias.” It is a phenomenon you are no doubt familiar with even if you have never heard the term. It is a memory bias that favors recent events over historical ones, granting what is fresh in our memory a potency lacking in the more distant past. This bias leadsfinancial results. However, going forward, it does allow us to immediately declarepursue industrial joint ventures while still keeping like with like.
The Industrial and Commercial segment performed well this year, growing revenues by 45.4% and NOI by 46.2% compared to 2022. These increases are partly the Chiefs-Bills playoff gameresult of rent growth at our Cranberry Run Business Park, but mostly due to a full year of 100% occupancy of two of our buildings at Hollander Business Park as well as the greatestaddition to this segment in March 2023 of all time (though that might actually be true). A C-SPAN clip causes us to claim (incorrectly) that America has never been more politically divided, allowing the partisan name-callinga fully occupied 101,750 square-foot, build-to-suit warehouse at Hollander. The strong performance of today to seem more bitter than the Civil War. So,this segment as we look forward into 2022 with 2021 fresh in our minds, some might feel a sense of frustration. With the seemingly never-ending conveyor belt of new Covid variants, the looming specter of inflation, the moving targets of herd immunity and normalcy—there is a temptation, and even a compulsion, to get caught up in the moment and think that after another year of uncertainty, we are right back where we started, cautiously optimistic perhaps, but more cautious than optimistic. No progress has been made, second verse samewell as the first. And yet, that description could not be less accurate.
2020 was a truly awful year—in another example of recency bias, some were (mistakenly) inclinedhigh demand for industrial product and its resilience to call it the worst year in American history. It was chaotic, uncertain, and downright scary—a period of time when keeping one’s head above water felt like real progress. Thatinflation is not an accurate description of most of 2021, particularly for this Company. In 2020, we were happy to see our assets behave normally in abnormal times. This year, we wanted to move beyond normal, and begin enacting the first stage of a meaningful period of growth for this Company. By and large,why we have deliveredshifted our development focus towards industrial for the time being. Industrial is our “bread and butter” and expanding our footprint will be the main focus of our development strategy for some time.
MULTIFAMILY
Our Multifamily business segment had a mixed year. Dock 79 and the Maren experienced nominal revenue growth of 1.8% with average annual occupancy (94.36%, 95.60%), renewal rates (68.29%, 53.23%), and increases on that.
Thisrenewals (2.80%, 4.21%) in line with historic expectations. There was an expected drop in pro rata NOI compared to last year, sawdue to the stabilizationsale of The Maren;our 20% TIC interest in both buildings to SIC, but total NOI for the permanent financingbuildings is down compared to last year. Rent growth did not keep pace with rising expenses and as mentioned previously, the DC market is soft right now due to a significant number of buildings coming online after a Covid bottleneck, as evidenced by trade-outs at the Maren and Dock 79 of 1.90% and -4.00% respectively. These are still excellent assets in a beautiful area as anyone who came to the refinancingInvestor Day we held at Dock 79 can attest to. They are financed interest-only through March 2033 at a rate (3.03%) that now feels like a historical anomaly. But the market, like the Nationals, isn’t where it was before Covid, which is the reason why we’re hitting pause on multifamily development in DC for the time being. And like the market (but maybe not the Nationals), we believe strongly in the long-term future of Dock 79 at extremely favorable terms;and the completion of constructionMaren, but we just need to wait out this ebb in the market and focus on expenses.
Conversely, we remain excited about Riverside, our first multifamily joint ventureJV with Woodfield Development in Greenville, South Carolina;SC. Riverside was added to this segment in the third quarter of last year after an exceptionally brief lease-up and had an average annual occupancy of 94.51% with 55.41% of expiring leases renewing with an average increase of 8.46%. Most importantly, Riverside added $800,000 of pro-rata NOI to this segment in its first full calendar year. We remain bullish about the completionGreenville market and look forward to adding .408 Jackson to this segment when it stabilizes in early 2024.
MINING ROYALTY LANDS
Mining royalties had a very strong 2023. Once again, we had our highest revenue year ever in this segment, growing revenues to $12,527,000, a 17.3% improvement over what had previously been our best revenue year ever in 2022. Part of the reason for this increase was the additional royalties from the acquisition in Astatula, FL that we completed in the second quarter of 2022, but the bulk of the increase came from increases in revenue at nearly every active location. We are very fortunate to have the best operators in the aggregates industry for our tenants. Vulcan Materials, our primary tenant, has been aggressive with their pricing, growing their average sales price at all locations by 15% over 2022, as reported in their third quarter investor presentation. Martin Marrietta saw a 20% increase in average sales price according to their third quarter call. State and federal infrastructure spending are expected to continue their upward trend with a 14% increase in total state highway and bridge capital spending anticipated in 2024 (on top of a 13% increase in 2023). Combined with increases in non-residential construction, at Bryant Street, where our anchor retail tenant isdemand in and operating and residential occupancy is over 50%. In 2021, we finished construction on two new warehouses at our Hollander Business Park and began construction on a third, effectively exhausting all available developable inventorythis sector should continue to be strong in our land bank, and we sought to remedy exhausting our land bank by purchasing 17 acres of future industrial space. Finally, after years of speculating on when, and2024, even if it might happen, Congress passed an infrastructure bill which shouldinterest rates dampen the pace of single-family home construction.
DEVELOPMENT
We have a meaningful impact on future mining royalty revenues. We ended 2020 with 569 multifamily units, 267,737 square feetthree-part development strategy which we use to grow our business: 1) In-House Development and Acquisition; 2) Joint Venture Development and Acquisition; and 3) Principal Capital Source Lending. Since the sale of our legacy industrial and $17,051,000 in NOI. At the end of 2021, we had 1,256 multifamily units, 413,327 square feet of industrial, and $20,815,000 in NOI.
Despite selling our warehouse portfolioassets in 2018, we remain committed to industrial real estate as an asset class through value-add purchases like Cranberry Run as well as developing our remaining pad sites at Hollander Business Park. 2021 represented a big step forward in that commitment. As mentioned previously, this year we completed construction on two new warehouses at Hollander totaling 145,590 square feet, we began construction on a 101,750 square-foot, build-to-suit, and we purchased 17 acres in Harford County, Maryland where we plan to develop a 250,000 square foot, Class A warehouse which will comprise the entirety of the developable space on the site. Thatthree-pronged strategy is 497,000 square feet of industrial development. When added to the 625,000 square feet of industrial developmenthow we have planned forgone about putting our Crause Property adjacentcash to Cranberry Run which we purchased last year, then wework. Our In-House strategy includes our industrial, commercial, and land development platform. These properties are talking about over a million square feet of industrial that did not exist prior to Covid.
The 2021 highlights of the Stabilized Joint Venture segment have been mentioned previously but bear repeating. In March, the Maren achieved stabilization, meaning 90% of its units were leased and occupied, triggering a change in control with the end result being that the asset is now consolidated on to our books in exactly the same way Dock 79 is. Its balance sheet is now part of our balance sheet and its income statement flows through the Company’s income statement. In addition to the one-time gain on remeasurement of $51.1 million, this consolidation has impacted and will continue to impact our depreciation and amortization, greatly increasing both. As a result, the impact on net income may in fact be negative for some time, but the positive impact on our NOI and cash flow will be significant. Around the same time that the Maren reached stabilization, the Company simultaneously negotiated both the permanent financing of the Maren and a refinancing of Dock 79. This $180 million loan ($92 million for Dock 79, $88 million for The Maren) lowered the interest rate at Dock 79 from 4.125% to 3.03%, deferred any principal payments for 12 years for both properties, and repaid our $13.75 million in preferred equity along with $2.3 million in accrued interest.
Covid measures continue to hamstring our retail tenants, but a full baseball season with fans, particularly in the warm weather months when outdoor seating is not a problem, was especially meaningful for our retail tenants in light of theacquired,
| 30 |
difficulties they faced in 2020. Build out of The Maren’s second retail space wasdeveloped, and managed 100% by FRP and transferred from Development to the Industrial and Commercial segment when construction is completed at the beginning of 2022 and the retail tenant is open for business. Occupancy was strong throughout the year for both assets. Dock 79 was more than 94% occupied at the endbuilding has its certificate of each quarter in 2021 which is the first such year for this asset. Average annual occupancy was 95.47% for Dock 79, which is in line with the highest average annual occupancy we’ve ever had there and an improvement over 2020’s rate of 93.13%. Average occupancy at the Maren since stabilization was 94.84%. Renewal rates on expiring leases were strong for both buildings. 62.20% of Dock 79’s expiring leases renewed vs 57.14% in 2020, and as the first generation of leases at the Maren expired, 67.40% renewed. These are positive developments, to be sure, but the ability to grow NOI was mitigated severely by the fact that the District kept emergency protocols in place, preventing us from evicting non-paying tenants and raising rent on renewals. Though evictions remain a long and complicated process, the prohibition on raising rents was allowed to lapse at the end of 2021. Since we start renewal discussions several weeks in advance of expiration, the prospect of rent increases will not kick in until February, and it remains to be seen if the renewal rates we saw during the rent freeze persist when rents start moving more in line with where the market rather than the District dictates.
Construction continues on The Verge, our joint venture with MRP in Buzzard Point,occupancy. As stated previously, industrial development through in-house projects as well as .408 Jackson,JV’s is the current focus of our joint venture with Woodfield Development.development strategy. We have three in-house projects in our industrial pipeline in various stages of development which will eventually join and drive NOI growth in the Industrial and Commercial segment. During the second quarter of 2023, we broke ground on a 259,000 square-foot building on our 17-acre parcel in Harford County, MD. We expect both projects to be complete and leasing to beginshell completion on this building in the third quarter of 2022. More pressing,2024. In North East, MD, along the I-95 corridor, we are in the middle of pre-development activities on 170 acres of industrial land that will ultimately support a 900,000 square-foot distribution center. We would be reluctant to build something this size as alludeda spec building, but we will be in a position to earlier,break ground as early as the fourth quarter of 2024 and would move forward on the project with an institutional capital partner or take it on ourselves as a build-to-suit. Finally, we are studying multiple conceptual designs for our 55-acre tract in Harford County, MD adjacent to the Cranberry Run Business Park. Our various configurations should yield from 600,000 to 700,000 square feet dependent on final design parameters and market demands.
Completion of these three industrial development projects will add over 1.8 million square feet of additional warehouse product to our Industrial and Commercial business segment as well as meaningfully increase this segment’s NOI once these assets are all fully stabilized.
Our Joint Venture development and acquisition strategy focuses on projects developed in conjunction with outside partners, where FRP is typically the majority owner through an equity contribution in the form of land we already own, capital, or a combination of the two. We seek out developers with expertise in a particular market or asset class, who will handle day-to-day operations, but will also share in acquisition, development, and asset management costs. The lion’s share of assets within our development segment are part of our joint-venture strategy. These include our opportunity zone investments in The Verge and Bryant Street in Washington, DC and .408 Jackson in Greenville, SC. All three of these assets are close to stabilization (90% occupancy for 90 days) and will join the Multifamily segment in 2024, adding 1,058 units to this segment. The Company is also in the process of pursuing its first industrial joint ventures. We believe this is the factbest way to start expanding beyond our traditional footprint into industrial markets that meet all our development criteria (high barriers to entry, employment/population growth, transportation infrastructure, etc.) that we wouldn’t have finished construction on both Bryant Street and Riverside. Bryant Streetthe bandwidth to develop ourselves.
The third prong of our development strategy is Principal Capital Lending. The chief component of this strategy has been what you’ve heard us refer to as “Lending Ventures.” It is a jointprogram where we lend the capital to a developer to use toward the entitlement and horizontal development of residential land. This land is pre-sold prior to commencement of any infrastructure improvements, and ultimately transferred to national homebuilders. On top of the interest accumulated, we then share in the profits from the lot sales. We have two current lending venture with MRP for theprojects in various stages of development. The first phase ofis a multi-family mixed useproject called Amber Ridge in Prince George’s County, MD. All 187 units have been sold and we received $20.2 in preferred interest and principal on $18 million in principal draws. The second is called Aberdeen Overlook, a 344 lot 110-acre residential development project in northeast Washington, DC.Aberdeen, MD. We have invested $32committed $31.1 million in common equityfunding under similar terms as Amber Ridge (10% interest rate, 20% preferred return, split of proceeds beyond 20%). A national homebuilder is under contract to purchase all of the finished building lots which will include 222 townhomes and another $23 million in preferred equity in this four building, 487-unit development. From both a capital and size perspective, Bryant Street is a big bet on the DC multi-family market. Construction is now complete on all four buildings, leasing is underway, and our retail anchor, Alamo Drafthouse Cinema, is open for business. At year end, Bryant Street’s residential units are 56.1% leased and 50.9% occupied, and its commercial space is 82.5% leased and 61.7% occupied. Bryant Street’s primary amenities are the Alamo Drafthouse and its proximity to the DC Metro. Public transportation and indoor entertainment are not yet the draws they used to be, but this project is an opportunity zone investment, and it is our intent to retain the property for the ten-year hold period required to realize the full tax benefits associated with this program. We have a lengthy investment time horizon on this project and we still believe the long term fundamentals are in place to make it successful. As mentioned previously, this year we also completed122 single family dwellings. Horizontal construction on Riverside, our first multifamily joint venture in Greenville, South Carolina. Leasing began in the third quarter on this 200-unit project, and at year end, it is 60% leased and 49% occupied.
The aggregates business is cyclical. Its three main drivers are home construction, commercial construction, and infrastructure,has begun, and the first two correlate very strongly with the economy and business cycle. A decade of more-or-less uninterrupted growth combined with the pricing power of aggregates producers11 lots were purchased prior to year end. This development strategy has been very kindincredibly useful as a way to put money to work at attractive rates of return during a time when we had more cash than projects in which to put the cash to use.
Since the asset sale in 2018, we have used our mining tenantsdevelopment strategy to put over $300 million of equity capital to work in a multitude of projects and this Companyasset classes (plus another $30 million of share repurchases). In so doing, we have grown our pro-rata NOI from $13.6 million at the end of 2018 to $30.2 million in turn. Since 2011, our royalty income has achieved2023 for a compound annual growth rate of 9%, which while impressive, is perhaps unsustainable. Trees, as17.3%. That kind of growth was only possible because we were a small, nimble company with an entrepreneurial attitude towards putting capital to work. As mentioned before, that kind of growth also made us incredibly complex to shareholders in a way I’m not sure management fully appreciated. We don’t want to let the saying goes, do not growtail wag the dog and stifle growth opportunities for fear that they may further complicate us, but this Company must and will make it a priority to bring our investor relations to the sky. If growth is the story of this Company over the past year, mining royalties is seemingly the only segment that does not fit that narrative. Royalty revenue was slightly down this year, and while steady, revenue has been more or less flat for the last three years (2019: $9.44 million; 2020: 9.48 million; 2021: $9.47 million). A cursory glance at the numbers might lead a reasonable person to conclude that the segment has peaked or at the very least plateaued. Anyone paying attention to this sector knows this is not the case. In 2019, the Company achieved $9 million in mining royalty revenue for the very first time. In 2020, we were able to improve on the previous year’s mark despite the loss of double minimums at our Lake Louisa location which left a $350,000 hole in revenue. In 2021, Vulcan temporarily shifted its mining activity off our portionlevel of the Manassas quarry leadingkind of Company we want to a $600,000 decrease in royalties atbe.
In the location compared to 2020,twelve months since this letter last reached you, unemployment remains low and yet total royalty revenue remained largely unaffected. That royalties were more or less flat two years inwe have started to see inflation cool, the economy continues to grow at a row, despite major shortfalls in revenue at specific locations, demonstrates the resilience of this segmenthealthy clip, interest rates appear stable, and the quality of our tenants and locations. We have market exposure in three of the country’s best aggregate producing states both in terms of production and pricing. Florida and Georgia, where the bulk of our assets are located, have benefited in particular from accelerated migration to the Sun Belt where job growth and housing starts continue to outpace the national average. These are markets where aggregates demand is already high, so the Infrastructure Investment and Jobs Act will meaningfully impact our mining tenants. In whatever form this Act’s $110 billion investment in hard infrastructure makes its way down to the markets our mining assets serve, the result will be an increase in demand when demand is already incredibly high and supply is stretched. This should lead to meaningful price increases. We have always had the utmost confidence in our assets, but we are particularly excited to see how they will perform in the next few years.
Every pandemic is different, but the one thing they have in common is that they have all ended. The same will be true for
elusive soft landing
| 31 |
Covid. Unfortunately, 2021 was not the year it happened. The nation and probably the world are suffering from Covid fatigue, and each variant that extends the abnormality that isnow seems like a real possibility. We will always maintain a healthy capital cushion, but we feel very comfortable putting a meaningful amount of our new, or at leastcash to work in our current normal, aggravates us. That aggravated recency bias can cause us to lose sight of how far we havedevelopment strategy. This Company—your Company—has come a very long way in the last two years. That is true for this nationfive years, and it is true for this Company. As you have read in this letter, 2021as exciting as that was, a period of very meaningful growth where we increased NOI by 22.11%, expanded our number of available multi-family units by 120.74%, and grew our industrial square footage by 54.38%. We are by no means at the finish line. This is merely the first step in a process to put our excess capital to work. Whilesincerely believe we are pleased with the initial results, we will continue to work to ensure that, recency bias or not, this Company—your Company—is one you are proud to own.
just getting started.
Respectfully yours,
John D. Baker II
C.E.O. and Executive Chairman
| 32 |
FORWARD LOOKING STATEMENTS
Certain matters discussed in this report contain forward-looking statements, including without limitation relating to the Company's plans, strategies, objectives, expectations, intentions, capital expenditures, future liquidity, and plans and timetables for completion of pending development projects. The words or phrases “anticipate,” “estimate,” ”believe,” “budget,” “continue,” “could,” “intend,” “may,” “plan,” “potential,” “predict,” “seek,” “should,” “will,” “would,” “expect,” “objective,” “projection,” “forecast,” “goal,” “guidance,” “outlook,” “effort,” “target” and similar expressions identify forward-looking statements. The following factors and others discussed in the Company’s periodic reports and filings with the Securities and Exchange Commission are among the principal factors that could cause actual results to differ materially from the forward-looking statements: levels of construction activity in the markets served by our mining properties; risk insurance markets; availability and terms of financing; competition; interest rates, inflation and general economic conditions; demand for warehouse/officeindustrial and commercial facilities in the Baltimore-Washington-Northern Virginia area; demand for apartments in Washington D.C., Richmond, Virginia and Greenville, South Carolina;SC; and ability to obtain zoning and entitlements necessary for property development. However, this list is not a complete statement of all potential risks or uncertainties.
These forward-looking statements are made as of the date hereof based on management’s current expectations, and the Company does not undertake an obligation to update such statements, whether as a result of new information, future events or otherwise. Additional information regarding these and other risk factors may be found in the Company’s other filings made from time to time with the Securities and Exchange Commission.
OPERATING PROPERTIES
The Company owns (predominately in fee simple but also through ownership of interests in joint ventures) approximately 20,00021,000 acres of land in Florida, Georgia, Maryland, Virginia, South Carolina, and the District of Columbia. This land is generally held by the Company in four distinct segments: (i) Asset ManagementIndustrial and Commercial Segment (land owned and operated as income producing rental properties in the form of commercial properties), (ii) Mining Royalty Lands Segment (land owned and leased to mining companies for royalties or rents), (iii) Development Segment (land owned andor joint ventures held for investment to be further developed for future income production or sales to third parties), and (iv) Stabilized Joint VentureMultifamily Segment (ownership, leasing and management of buildings through joint ventures).
Asset ManagementIndustrial and Commercial Segment. As of December 31, 2021,2023, the Asset ManagementIndustrial and Commercial Segment ownedincludes nine buildings at four commercial properties owned by the Company in fee simple as follows:
1) 34 Loveton Circle in suburban Baltimore County, MarylandMD consists of one office building totaling 33,708 square feet which is 95.1%90.8% occupied (16% of the space is occupied by the Company for use as our Baltimore headquarters). The property is subject to commercial leases with various tenants.
2) 155 E. 21st Street in Duval County, FloridaFL was an office building property that remains under lease through March 2026. We permitted the tenant to demolish all structures on the property during 2018.
3) Cranberry Run Business Park in HartfordHarford County, MarylandMD consists of five officeindustrial buildings totaling 267,737 square feet which are 81%92.1% occupied and 100%92.1% leased. The property is subject to commercial leases with various tenants.
4) Hollander 95 Business Park in Baltimore City, MarylandMD consists of two buildingsthree industrial totaling 145,590247,340 square feet that were completed in the fourth quarter of 2021are 100.0% leased and are 29.1% leased.100.0% occupied.
On May 21, 2018, the Company completed the disposition of 40 industrial warehouse properties and three additional land parcels to an affiliate of Blackstone Real Estate Partners VIII, L.P. for $347.2 million. The Company sold an additional warehouse property, which was excluded from the initial sale due to the tenant exercising its right of first refusal to purchase the property, to the same buyer for $11.7 million on June 28, 2019. The warehouse portfolio sale resulted in the disposition of all of the Company’s industrial flex/office warehouse properties prior to the sale date and constituted a major strategic shift and, as a result, these properties have been reclassified as discontinued operations for all periods presented in the financial statements filed herewith.
Mining Royalty Lands Segment – Mining Properties. The Company owns a fee simple interest in 1314 open pit aggregates quarries located in Florida, Georgia and Virginia, which comprise approximately 15,00016,650 total acres. The Company’s quarries are subject to mining leases with various tenants, including Vulcan Materials, Martin Marietta, Cemex, Argos, and The Concrete Company. Aggregates consist of crushed stone, sand, gravel, fill dirt, limestone and calcium and are used primarily in construction applications.
Nine of the Company’s quarries (located in Grandin, FL, Fort Myers, FL, Keuka, FL, Newberry, FL, Astatula, FL, Columbus, GA, Macon, GA, Tyrone, GA, and Manassas, VA; comprising 12,649 acres in the aggregate)totaling 13,876 acres) are currently being mined, and fourfive of the Company’s quarries (located in Marion County, FL, Lake Louisa, FL, andAstatula, FL, Lake Sand, FL and Forest
| 33 |
Park, GA; comprising 2,452 acres in the aggregate)totaling 2,778 acres) are leased but are not currently being mined. Our typical mining lease requires the tenant to pay the Company a royalty based on the number of tons of mined materials sold from our mining property during a given fiscal year multiplied by a percentage of the average annual sales price per ton sold. In certain locations, typically where the reservessand and stone deposits on the property have been depleted but the tenant still has a need for the leased land, we collect a minimum annual rental amount. In the fiscal years ended December 31, 2021, 20202023, 2022 and 2019,2021, aggregate tons sold with respect to the Company’s mining properties were approximately 9,569,000, 9,525,000 and 7,575,000, 8,206,000 and 7,815,000, respectively.
In May 2014, the Company entered into an amendment to our lease with Vulcan for our Fort Myers location requiring that the mining be accelerated and that the mining plan be conformed to accommodate the future construction of up to 105 residential dwelling units around the mined lakes. In return, the Company granted Lee County an option to purchase a right of way for a connector road that would benefit the residential area on our property and to place a conservation easement on part of the property, which the County exercised in 2020. Mining activity commenced in 2017 following Lee County’s issuance of a mine operating permit allowing Vulcan to begin production.
In November 2017, Lake County commissioners voted to approve a permit to Cemex to mine the Company’s land in Lake Louisa, Florida. The county issued the permit in July 2019. AfterCemex expects to begin mining after completing the work necessary to prepare this site to become an active sand mine, Cemex expects to begin mining by March 2023.mine.
Mining Royalty Lands Segment - Brooksville Joint Venture. In 2006, a subsidiary of the Company entered into a joint venture agreement with Vulcan Materials Company to jointly own and develop approximately 4,280 acres of land near Brooksville, Florida as a mixed-use community. In April 2011, the Florida Department of Community Affairs issued its final order approving the development of the project consisting of 5,800 residential dwelling units and over 600,000 square feet of commercial and 850,000 of light industrial uses. Zoning for the project was approved by the County in August 2012. Vulcan Materials still mines on the property and the Company receives 100% of the royalty on all tons sold at the Brooksville property. In 2021, 280,0002023, 259,000 tons were sold. During 2017, the Company extended the mining lease on this property for an additional ten years (through 2032) in exchange for an increase in production of 100,000 tons by December 31, 2023.
Mining Royalty Lands Segment - Other Properties. The segment also owns an additional 10736 acres of investment property in Brooksville, Florida.
Development Segment – Warehouse/OfficeIndustrial and Commercial Land.
At December 31, 2021,2023, this segment owned the following future development parcels:
| 1) |
| 17 acres of land in Harford County, |
| 3) | 170 acres of land Cecil County, MD that |
Development Segment – Land Held for InvestmentDevelopment or Sale.
At December 31, 2021,2023, this segment ownedwas invested in the following development parcels:
| 1) | Riverfront on the Anacostia: The Riverfront on the Anacostia property is a 5.8-acre parcel of real estate in Washington, D.C. that fronts the Anacostia River and is adjacent to the Washington Nationals Baseball Park. A revised Planned Unit Development (PUD) plan was approved in 2012 and permits the Company to develop, in four phases, a four-building, mixed-use project, containing approximately 1,161,050 square feet. The approved development includes numerous publicly accessible open spaces and a waterfront esplanade along the Anacostia River. The first phase (now known as Dock 79), which was completed through a joint venture with MRP Realty, and which consisted of a single building with residential and retail uses, became our fourth business segment in July 2017, now known as the |
| 34 |
| 2) | Hampstead Trade Center: The Hampstead Trade Center property in |
| 3) | Bryant Street: On December 24, 2018 the Company and MRP Realty formed four partnerships to purchase and develop approximately five acres of land at 500 Rhode Island Ave NE, Washington, D.C. This property is the first phase of the Bryant Street Master Plan. The property is located in an Opportunity Zone, which provides tax benefits in the new communities development program as established by Congress in the Tax Cuts and Jobs Act of 2017. This first phase is a mixed-use development which supports 487 residential units and |
| 4) |
| 5) | Square 664E: The Company’s Square 664E property is approximately two acres situated on the Anacostia River at the base of South Capitol Street less than half a mile down river from our Riverfront on the Anacostia property. This property is currently under lease to Vulcan Materials for use as a concrete batch plant through 2026. In March 2017, reconstruction of the bulkhead was completed at a cost of $4.2 million in anticipation of future high-rise development. |
| 6) | .408 Jackson: In December 2019, the Company entered into a joint venture with a new partner, Woodfield Development, for the acquisition and development of a mixed-use project known as “.408 Jackson” in Greenville, |
| 7) |
| Windlass Run: In March 2016, the Company entered into an agreement with St. Johns Properties Inc., a Baltimore development company, to jointly develop the remaining lands of our Windlass Run Business Park, located in Middle River, MD, into a multi-building business park consisting of approximately 329,000 square feet of single-story office space. The project will take place in several phases. Construction of the first phase, which includes two office buildings and two retail buildings totaling 100,030-square-feet, commenced in the fourth quarter of 2017 and was completed in January 2019. At December 31, 2023 Phase I was 73.4% leased and 62.8% occupied, the subsequent phases will follow as each phase is stabilized. |
| 8) | Estero: In August 2022, the Company invested $3.6 million for a 16% interest in a joint venture with Woodfield Development to purchase and develop 46 acres in Estero, FL into a mixed-use project with 554 multifamily units, 72,000 square feet of commercial space, 41,000 square feet of office space and a boutique 170-key hotel. While the joint venture attempts to rezone the property, the Company will receive a preferred return of 8% with an option to roll its investment into equity in the vertical development or exit at that point. |
| 9) | Buzzard Point: In November 2022, the Company entered into a contribution agreement with MRP and Steuart Investment Company (SIC) regarding potential development of an estimated 1,200 multifamily units in four |
| 35 |
located in Middle River, Maryland,phases on land owned by SIC. The Company entered into a multi-building business park consisting of approximately 329,000 square feet of single-story office space.separate agreement with MRP to perform pre-development obligations for the contribution agreement. The project will take place in several phases, with constructioncompany owns 50% of the first phase, which includes two office buildings and two retail buildings totaling 100,030-square-feet (inclusive of 27,950 retail), commenced in the fourth quarter of 2017 and was completed in January 2019. At December 31, 2021 Phase I was 48.0% leased and 46.7% occupied, the subsequent phases will follow as each phase is stabilized.partnership with MRP.
| 10) | Woven: In August 2023, the Company entered into an agreement with Woodfield Development for the acquisition and development of a mixed-use project known as “Woven” in Greenville, SC, to consist of an estimated 214 multifamily units and 10,000 square feet of retail space. The joint venture is in the pre-development and pre-closing phase in pursuit of vertical construction closing conditions. The Company owns 50% at this time with final ownership to be determined based upon contributions by the partners, land contributors, and other investors. |
Stabilized Joint Venture
Multifamily Segment.
At December 31, 2021,2023, this segment ownedwas invested in the following stabilized multifamily joint ventures:
| 1) | Dock 79: In 2014, approximately 2.1 acres (Phase I) of the total 5.8-acres was contributed to a joint venture owned by the Company (77%) and our partner, MRP Realty (23%), and construction commenced in October 2014 on a 305-unit residential apartment building with approximately 14,430 square feet of first floor retail space. |
| 2) | The Maren: On May 4, 2018, the Company and MRP Realty formed a Joint Venture to develop the second phase only of the four-phase master development known as Riverfront on the Anacostia in Washington, D.C. The purpose of the Joint Venture is to develop and own a 250,000-square-foot mixed-use development which supports 264 residential units and 6,758 square feet of retail. |
| 3) |
| 36 |
Five Year Summary
(Amounts in thousands except per share amounts)
| Years Ended December 31, | Years Ended December 31, | |||||||||||||||||||||||||||||||||||||||
| 2021 | 2020 | 2019 | 2018 | 2017 | 2023 | 2022 | 2021 | 2020 | 2019 | |||||||||||||||||||||||||||||||
| Summary of Operations: | ||||||||||||||||||||||||||||||||||||||||
| Revenues | $ | 31,220 | 23,583 | 23,756 | 22,022 | 15,602 | $ | 41,506 | 37,481 | 31,220 | 23,583 | 23,756 | ||||||||||||||||||||||||||||
| Operating profit | $ | 2,274 | 5,134 | 5,756 | 1,962 | 1,041 | $ | 11,700 | 7,996 | 2,274 | 5,134 | 5,756 | ||||||||||||||||||||||||||||
| Interest expense | $ | 2,304 | 1,100 | 1,054 | 3,103 | 2,741 | $ | 4,315 | 3,045 | 2,304 | 1,100 | 1,054 | ||||||||||||||||||||||||||||
| Income from continuing operations | $ | 40,094 | 11,722 | 8,822 | 959 | 49,548 | $ | 4,882 | 4,047 | 40,094 | 11,722 | 8,822 | ||||||||||||||||||||||||||||
| Per Common Share: | ||||||||||||||||||||||||||||||||||||||||
| Basic | $ | 4.29 | 1.22 | 0.89 | 0.10 | 4.97 | $ | 0.52 | 0.44 | 4.29 | 1.22 | 0.89 | ||||||||||||||||||||||||||||
| Diluted | $ | 4.27 | 1.22 | 0.89 | 0.09 | 4.94 | $ | 0.52 | 0.43 | 4.27 | 1.22 | 0.89 | ||||||||||||||||||||||||||||
| Income from discontinued operations, net | $ | — | — | 6,856 | 122,129 | 11,003 | $ | — | — | — | — | 6,856 | ||||||||||||||||||||||||||||
| Income (loss) attributable to noncontrolling interest | $ | 11,879 | (993 | ) | (499 | ) | (1,384 | ) | 18,801 | $ | (420 | ) | (518 | ) | 11,879 | (993 | ) | (499 | ) | |||||||||||||||||||||
| Net income attributable to the Company | $ | 28,215 | 12,715 | 16,177 | 124,472 | 41,750 | $ | 5,302 | 4,565 | 28,215 | 12,715 | 16,177 | ||||||||||||||||||||||||||||
| Per Common Share: | ||||||||||||||||||||||||||||||||||||||||
| Basic | $ | 3.02 | 1.33 | 1.64 | 12.40 | 4.19 | $ | 0.56 | 0.49 | 3.02 | 1.33 | 1.64 | ||||||||||||||||||||||||||||
| Diluted | $ | 3.00 | 1.32 | 1.63 | 12.32 | 4.16 | $ | 0.56 | 0.48 | 3.00 | 1.32 | 1.63 | ||||||||||||||||||||||||||||
| Financial Summary: | ||||||||||||||||||||||||||||||||||||||||
| Property and equipment, net | $ | 350,665 | 203,140 | 202,187 | 206,553 | 209,914 | $ | 367,320 | 367,158 | 350,665 | 203,140 | 202,187 | ||||||||||||||||||||||||||||
| Total assets | $ | 678,190 | 536,360 | 538,148 | 505,488 | 418,734 | $ | 709,166 | 701,084 | 678,190 | 536,360 | 538,148 | ||||||||||||||||||||||||||||
| Long-term debt | $ | 178,409 | 89,964 | 88,925 | 88,789 | 118,317 | $ | 178,705 | 178,557 | 178,409 | 89,964 | 88,925 | ||||||||||||||||||||||||||||
| Shareholders' equity | $ | 396,423 | 367,654 | 374,888 | 364,607 | 243,530 | $ | 414,520 | 407,145 | 396,423 | 367,654 | 374,888 | ||||||||||||||||||||||||||||
| Net Book Value per common share | $ | 42.12 | 39.26 | 38.19 | 36.57 | 24.32 | $ | 43.71 | 43.04 | 42.12 | 39.26 | 38.19 | ||||||||||||||||||||||||||||
| Other Data: | ||||||||||||||||||||||||||||||||||||||||
| Weighted average common shares - basic | 9,355 | 9,580 | 9,883 | 10,040 | 9,975 | 9,420 | 9,386 | 9,355 | 9,580 | 9,883 | ||||||||||||||||||||||||||||||
| Weighted average common shares - diluted | 9,397 | 9,609 | 9,926 | 10,105 | 10,040 | 9,461 | 9,435 | 9,397 | 9,609 | 9,926 | ||||||||||||||||||||||||||||||
| Number of employees | 14 | 13 | 12 | 10 | 19 | 15 | 13 | 14 | 13 | 12 | ||||||||||||||||||||||||||||||
| Shareholders of record | 333 | 339 | 342 | 355 | 382 | 315 | 327 | 333 | 339 | 342 | ||||||||||||||||||||||||||||||
Quarterly Results (unaudited)
(Dollars in thousands except per share amounts)
| For the Quarter Ended | For the Quarter Ended | |||||||||||||||||||||||||||||||||||||
| March 31, | June 30, | September 30, | December 31, | March 31, | June 30, | September 30, | December 31, | |||||||||||||||||||||||||||||||
| 2021 | 2021 | 2021 | 2021 | Total Fiscal Year 2021 | 2023 | 2023 | 2023 | 2023 | Total Fiscal Year 2023 | |||||||||||||||||||||||||||||
| Revenues | $ | 5,853 | 8,495 | 8,473 | 8,399 | 31,220 | $ | 10,114 | 10,696 | 10,591 | 10,105 | 41,506 | ||||||||||||||||||||||||||
| Operating profit (loss) | $ | 1,442 | (159 | ) | 732 | 259 | 2,274 | |||||||||||||||||||||||||||||||
| Income (loss) from continuing operations | $ | 40,875 | 281 | (113 | ) | (949 | ) | 40,094 | ||||||||||||||||||||||||||||||
| Net income (loss) attributable to the Company | $ | 28,373 | 82 | 352 | (592 | ) | 28,215 | |||||||||||||||||||||||||||||||
| Operating profit | $ | 2,854 | 2,767 | 2,896 | 3,183 | 11,700 | ||||||||||||||||||||||||||||||||
| Income from continuing operations | $ | 406 | 492 | 1,099 | 2,885 | 4,882 | ||||||||||||||||||||||||||||||||
| Net income attributable to the Company | $ | 565 | 598 | 1,259 | 2,880 | 5,302 | ||||||||||||||||||||||||||||||||
| Earnings per common share (a): | ||||||||||||||||||||||||||||||||||||||
| Net income attributable to the Company- | ||||||||||||||||||||||||||||||||||||||
| Basic | $ | 3.04 | 0.01 | 0.04 | (0.06 | ) | 3.02 | $ | 0.06 | 0.06 | 0.13 | 0.31 | 0.56 | |||||||||||||||||||||||||
| Diluted | $ | 3.03 | 0.01 | 0.04 | (0.06 | ) | 3.00 | $ | 0.06 | 0.06 | 0.13 | 0.30 | 0.56 | |||||||||||||||||||||||||
| Market price per common share (b): | ||||||||||||||||||||||||||||||||||||||
| High | $ | 51.95 | 62.45 | 60.21 | 65.00 | 65.00 | $ | 58.99 | 61.03 | 58.68 | 64.68 | 64.68 | ||||||||||||||||||||||||||
| Low | $ | 43.19 | 47.97 | 54.47 | 54.82 | 43.19 | $ | 53.77 | 52.81 | 53.97 | 53.19 | 52.81 | ||||||||||||||||||||||||||
| For the Quarter Ended | |||||||||||||||||||
| March 31, | June 30, | September 30, | December 31, | ||||||||||||||||
| 2022 | 2022 | 2022 | 2022 | Total Fiscal Year 2022 | |||||||||||||||
| Revenues | $ | 8,707 | 9,628 | 9,294 | 9,852 | 37,481 | |||||||||||||
| Operating profit | $ | 1,364 | 2,066 | 1,849 | 2,717 | 7,996 | |||||||||||||
| Income from continuing operations | $ | 404 | 582 | 384 | 2,677 | 4,047 | |||||||||||||
| Net income attributable to the Company | $ | 672 | 657 | 480 | 2,756 | 4,565 | |||||||||||||
| Earnings per common share (a): | |||||||||||||||||||
| Net income attributable to the Company- | |||||||||||||||||||
| Basic | $ | 0.07 | 0.07 | 0.05 | 0.29 | 0.49 | |||||||||||||
| Diluted | $ | 0.07 | 0.07 | 0.05 | 0.29 | 0.48 | |||||||||||||
| Market price per common share (b): | |||||||||||||||||||
| High | $ | 59.52 | 61.30 | 62.57 | 61.81 | 62.57 | |||||||||||||
| Low | $ | 54.55 | 54.92 | 53.24 | 53.50 | 53.24 | |||||||||||||
| For the Quarter Ended | |||||||||||||||||||
| March 31, | June 30, | September 30, | December 31, | ||||||||||||||||
| 2020 | 2020 | 2020 | 2020 | Total Fiscal Year 2020 | |||||||||||||||
| Revenues | $ | 5,783 | 5,849 | 6,098 | 5,853 | 23,583 | |||||||||||||
| Operating profit | $ | 794 | 1,204 | 1,581 | 1,555 | 5,134 | |||||||||||||
| Income from continuing operations | $ | 1,499 | 3,977 | 5,271 | 975 | 11,722 | |||||||||||||
| Net income attributable to the Company | $ | 1,618 | 4,149 | 5,455 | 1,493 | 12,715 | |||||||||||||
| Earnings per common share (a): | |||||||||||||||||||
| Net income attributable to the Company- | |||||||||||||||||||
| Basic | $ | 0.17 | 0.43 | 0.57 | 0.16 | 1.33 | |||||||||||||
| Diluted | $ | 0.16 | 0.43 | 0.57 | 0.16 | 1.32 | |||||||||||||
| Market price per common share (b): | |||||||||||||||||||
| High | $ | 52.03 | 46.35 | 43.80 | 46.75 | 52.03 | |||||||||||||
| Low | $ | 31.00 | 38.33 | 39.12 | 40.00 | 31.00 | |||||||||||||
| 37 |
(a) Earnings per share of common stock is computed independently for each quarter presented. The sum of the quarterly net earnings per share of common stock for a year may not equal the total for the year due to rounding differences.
(b) All prices represent high and low daily closing prices as reported by The Nasdaq Stock Market.
MANAGEMENT’S DISCUSSION AND ANALYSIS OF FINANCIAL CONDITION AND RESULTS OF OPERATIONS.
The following discussion includes a non-GAAP financial measure within the meaning of Regulation G promulgated by the Securities and Exchange Commission to supplement the financial results as reported in accordance with GAAP. The non-GAAP financial measure discussed is pro-rata net operating income (NOI). The Company uses this metric to analyze its continuing operations and to monitor, assess, and identify meaningful trends in its operating and financial performance. This measure is not, and should not be viewed as, a substitute for GAAP financial measures. Refer to “Non-GAAP Financial Measure” below in this annual report for a more detailed discussion, including reconciliations of this non-GAAP financial measure to its most directly comparable GAAP financial measure.
Executive Overview
FRP Holdings, Inc. (“FRP” or the “Company”) is a real estate development, asset management and operating company businesses. Our properties are located in the Mid-Atlantic and southeastern United States and consist of:
Lands leased to mining companies,Mining royalty lands, some of which will have second lives as development properties;
Residential apartments in Washington, D.C.; and Greenville, SC;
Warehouse or office properties in the Mid-Atlantic statesMaryland either existing or under development;
Mixed useMixed-use properties under development in Washington, D.C. or Greenville, South Carolina;SC; and
Properties held for sale.
We believe our present capital structure, liquidity and land provide us with years of opportunities to increase recurring revenue and long-term value for our shareholders. We intend to focus on our core business activity of real estate development, asset management and operations. We are developing a broad range of asset types that we believe will provide acceptable rates of return, grow recurring revenues and support future business. Capital commitments will be funded with cash proceeds from completed projects, existing cash, owned-land, partner capital and financing arrangements. We do not anticipate immediate benefits from investments. Timing of projects may be subject to delays caused by factors beyond our control.
Reportable Segments
We conduct primarily all of our business in the following four reportable segments: (1) asset managementindustrial and commercial (2) mining royalty lands (3) development and (4) stabilized joint ventures.multifamily. For more information regarding our reportable segments, see Note 10. Business Segments of our consolidated financial statements included in this annual report.
Highlights of 20212023.
| · |
| · | Mining Royalties revenues increased 17.3%; 17% increase in royalties per ton |
| · | 45.4% increase in Industrial and |
Asset ManagementIndustrial and Commercial Segment.
The Asset ManagementIndustrial and Commercial segment owns, leases and manages commercial properties. These assets create revenue and cash flows through tenant rental payments, lease management fees and reimbursements for building operating costs. The Company’s industrial warehouses typically lease for terms ranging from 3 – 10 years often with 1one or 2two renewal
| 38 |
options. All base rent revenue is recognized on a straight-lined basis. All of the commercial warehouse leases are triple net and common area maintenance costs (CAM Revenue) are billed monthly, and insurance and real estate taxes are billed annually. 34 Loveton is the only office product wherein all leases are full service therefore there is no CAM revenue. Office leases are also recognized on a straight-lined basis. The major cash outlays incurred in this segment are for operating expenses, real estate taxes, building repairs, lease commissions and other lease closing costs, construction of tenant improvements, capital to acquire existing operating buildings and closing costs related thereto and personnel costs of our property management team.
As of December 31, 2021,2023, the Asset ManagementIndustrial and Commercial Segment ownedincludes nine buildings at four commercial properties owned by the Company in fee simple as follows:
1) 34 Loveton Circle in suburban Baltimore County, MarylandMD consists of one office building totaling 33,708 square feet which is 95.1%90.8% occupied (16% of the space is occupied by the Company for use as our Baltimore headquarters). The property is subject to commercial leases with various tenants.
2) 155 E. 21st Street in Duval County, FloridaFL was an office building property that remains under lease through March 2026. We permitted the tenant to demolish all structures on the property during 2018.
3) Cranberry Run Business Park in HartfordHarford County, MarylandMD consists of five officeindustrial buildings totaling 267,737 square feet which are 81%92.1% occupied and 100%92.1% leased. The property is subject to commercial leases with various tenants.
4) Hollander 95 Business Park in Baltimore City, MarylandMD consists of twothree industrial buildings totaling 145,590247,340 square feet that were completed in the fourth quarter of 2021and are 29.1% leased.100.0% leased and 100.0% occupied.
Management focuses on several factors to measure our success on a comparative basis in this segment. The major factors we focus on are (1) net operating income growth, (2) growth in occupancy, (3) average annual occupancy rate (defined as the occupied square feet at the end of each month during a fiscal year divided by the number of months to date in that fiscal year as a percentage of the average number of square feet in the portfolio over that same time period), (4) tenant retention success rate (as a percentage of total square feet to be renewed), (5) building and refurbishing assets to meet Class A and Class B institutional grade classifications, and (6) reducing complexities and deferred capital expenditures to maximize sale price.
Mining Royalty Lands Segment.
Our Mining Royalty Lands segment owns several properties comprising approximately 15,00016,650 acres currently under lease for mining rents or royalties (excluding the 4,280 acres owned by our Brooksville joint venture with Vulcan Materials). Other than one location in Virginia, all of these properties are located in Florida and Georgia. The Company leases land under long-term leases that grant the lessee the right to mine and sell reservessand and stone deposits from our property in exchange for royalty payments. A typical lease has an option to extend the lease for additional terms. The typical lease in this segment requires the tenant to pay us a royalty based on the number of tons of mined materials sold from our property during a given fiscal year multiplied by a percentage of the average annual sales price per ton sold. As a result of this royalty payment structure, we do not bear the cost risks associated with the mining operations, however, we are subject to the cyclical nature of the construction markets in these states as both volumes and prices tend to fluctuate through those cycles. In certain locations, typically where the reservessand and stone deposits on our property have been depleted but the tenant still has a need for the leased land, we collect a minimum annual rental amount. We believe strongly in the potential for future growth in construction in Florida, Georgia, and Virginia which would positively benefit our profitability in this segment. In the
fiscal year ended December 31, 2021,2023, a total of 89.6 million tons were mined.
The major expenses in this segment are comprised of collection and accounting for royalties, management’s oversight of the mining leases, land entitlement for post-mining uses and property taxes at our non-leased locations and at our Grandin location which, unlike our other leased mining locations, are not entirely paid by the tenant. As such, our costs in this business are very low as a percentage of revenue, are relatively stable and are not affected by increases in production at our locations. Our current mining tenants includeare Vulcan Materials, Martin Marietta, Cemex, Argos and The Concrete Company.
| 39 |
Additionally, these locations provide us with opportunities for valuable “second lives” for these assets through proper land planning and entitlement.
Significant “2nd life” Mining Lands:
| Location | Acreage | Status |
| Brooksville, FL | 4,280 +/- | Development of Regional of Impact and County Land Use and Master Zoning in place for 5,800 residential unit, mixed-use development |
| Ft. Myers, FL | 1,907 +/- | Approval in place for 105, |
| Total | 6,187 +/- |
Development Segment.
Through our Development segment, we own and are continuously monitoring for their “highest and best use” several parcels of land that are in various stages of development. Our overall strategy in this segment is to convert all our non-income producing lands into income production through (i) an orderly process of constructing new commercial and residential buildings for us to own and operate or (ii) a sale to, or joint venture with, third parties. Additionally, our Development segment will purchase or form joint ventures on new developments of land not previously owned by the Company.
Revenues in this segment are generated predominately from land sales and interim property rents. The significant cash outlays incurred in this segment are for land acquisition costs, entitlement costs, property taxes, design and permitting, the personnel costs of our in-house management team and horizontal and vertical construction costs.
Development Segment – Warehouse/OfficeIndustrial and Commercial Land.
At December 31, 2021,2023, this segment owned the following future development parcels:
| 1) |
| 17 acres of land in Harford County, |
| 3) | 170 acres of land in Cecil County, MD that can accommodate 900,000 square feet of industrial development. |
We also have three properties that were either spun-off to us from Florida Rock Industries in 1986 or acquired by us from unrelated third parties. These properties, as a result of our “highest and best use” studies, are being prepared for income generation through sale or joint venture with third parties, and in certain cases we are leasing these properties on an interim basis for an income stream while we wait for the development market to mature.
Development Segment - Significant Investment Lands Inventory:
| Location | Approx. Acreage | Status |
NBV |
| Riverfront on the Anacostia Phases III-IV | 2.5 | Conceptual design program ongoing | $6,135,000 |
| Hampstead Trade Center, MD | 118 | Zoning applied for in preparation for sale | $9,708,000 |
| Square 664E, on the Anacostia River in DC | 2 | Under lease to Vulcan Materials as a concrete batch plant through 2026 | $7,677,000 |
| Total | 122.5 | $23,520,000 |
| Location | Approx. Acreage | Status |
NBV |
| Riverfront on the Anacostia Phases III-IV | 2.5 | Conceptual design program ongoing | $6,792,000 |
| Hampstead Trade Center, MD | 118 | Zoning applied for in preparation for sale | $10,671,000 |
| Square 664E, on the Anacostia River in DC | 2 | Under lease to Vulcan Materials as a concrete batch plant through 2026 | $7,355,000 |
| Total | 122.5 | $24,818,000 |
| 40 |
Development Segment - Investments in Joint Ventures
The third leg of our Development Segment consists of investments in joint venture for properties in development. The Company has investments in joint ventures, primarily with other real estate developers which are summarized below:
| Property | JV Partner | Status |
% Ownership |
| Brooksville Quarry, LLC near Brooksville, | Vulcan Materials Company | Future planned residential development of 3,500 acres which are currently subject to mining lease | 50% |
| BC FRP Realty, LLC for 35 acres in Maryland | St John Properties | Development of 329,000 square feet multi-building business park in progress | 50% |
| Bryant Street Partnerships for | MRP Realty | Mixed-use development with 487 residential units and | 61.36% |
| Aberdeen | $31.1 million in exchange for an interest rate of 10% and a 20% preferred return after which the Company is also entitled to a portion of proceeds from sale | Financing | |
| Amber Ridge residential development in Prince George’s County, | $18.5 million in exchange for an interest rate of 10% and a 20% preferred return after which the Company is also entitled to a portion of proceeds from sale | Financing | |
| The Verge at 1800 Half Street property in Buzzard Point area of Washington, D.C. | MRP Realty | 61.37% | |
| .408 Jackson property in Greenville, SC | Woodfield Development | 40% | |
| Woodfield Development | Pre-development activities for a mixed-use project with 554 multifamily units, 72,000 square feet of commercial space, 41,000 square feet of office space and a boutique 170-key hotel | 16% | |
| FRP/MRP Buzzard Point Sponsor, LLC | MRP Realty | Pre-development activities for phase one of property | 50% |
| Woven property in Greensville, SC | Woodfield Development |
Joint ventures where FRP is not the primary beneficiary (including those in the Multifamily Segment) are reflected in the line “Investment in joint ventures” on the balance sheet and “Equity in loss of joint ventures” on the income statement. The following table summarizes the Company’s investments in unconsolidated joint ventures (in thousands):
The major classes of assets, liabilities and equity of the Company’s Investments in Joint Ventures as of December 31,
COMPARATIVE RESULTS OF OPERATIONS Consolidated Results
Net income
Total revenues in this segment were year.
Mining Royalty Lands Segment Results
Total revenues in this segment were
second quarter 2022, as well as increases in revenue at nearly every active location. Net Operating Income in this segment was $11,720,000, up $1,568,000 or 15.4% compared to the same period last year.
Development Segment Results
The Development segment is responsible for (i) seeking out and identifying opportunistic purchases of income producing
With respect to ongoing projects:
In the fourth quarter
Total revenues in this segment were
Dock 79’s average residential occupancy for During the third quarter of 2022, we achieved stabilization at our Riverside Joint Venture in Greenville, SC. At the end of December, the building was 95.50% leased with 94.50% occupancy. Average occupancy for calendar year 2023 was 94.51% with 55.41% of expiring leases renewing with an average rental increase of 8.46%. Riverside is a joint venture with Woodfield Development and the Company owns 40% of the venture. Summary and Outlook Royalty revenue was up 17.3% over 2022 in what had previously been the highest revenue year for this segment. This kind of revenue growth is all the more remarkable when tons sold decreased by .76%. We are fortunate in both the locations of our mining assets, but also in the ability of our operators to push price aggressively. State and national infrastructure spending is expected to increase in 2024 creating further demand for aggregates products. In our Multifamily Segment, we are starting to feel the effects of a softening DC market. Revenues are more or less flat between Dock 79 and the Maren and did not keep pace with expenses. Pro-rata NOI is down which is to be expected after selling 20% of our share of Dock 79 and The Maren to SIC. But NOI for the two projects as a whole decreased 1.3% ($13,358,000 vs $13,529,000) compared to 2022. We should expect the market to remain slack until all the new supply has been absorbed. 2023 was the first full calendar year of operation for our Riverside multifamily joint venture in
In
LIQUIDITY AND CAPITAL RESOURCES
The growth of the Company’s businesses requires significant cash needs to acquire and develop land or operating buildings and to construct new buildings and tenant improvements. As of December 31,
Cash Flows - The following table summarizes our cash flows from operating, investing and financing activities for each of the periods presented (in thousands of dollars):
Operating Activities - Net cash provided by operating activities in At December 31, 2023, the Company was invested in U.S. Treasury notes valued at $128,795,000 maturing through mid-2024. The unrealized gain on these investments of $1,000 was recorded as part of comprehensive income and was based on the estimated market value by Wells Fargo Bank, N.A. (Level 1).
Net cash provided by operating activities in 2022 was $22,338,000 versus $22,242,000 in 2021. The Gain on remeasurement of investment in real estate partnership and related deferred income taxes were both non-cash adjustments to net income to arrive at net cash provided by operating
Investing Activities – Net cash used in investing activities in 2023 was $48,747,000 versus $23,196,000 in 2022. Investments in properties was $11.2 million for the twelve months ended December 31, 2023 and included the start of construction on a new speculative warehouse project in Aberdeen, MD on Chelsea Road. Investments in properties during the twelve months ended December 31, 2022 was $27.6 million which included the $11.6 million purchase of Astatula mining land, $6.7 million for 170 acres in Cecil County Maryland to accommodate 900,000 square feet of industrial development, and the completion of the build-to-suite at 1941 62nd Street. Investments in joint ventures was $46.7 million for the twelve months ended December 31, 2023 and included $12 million for FRP’s share of a $20 million paydown of the loan at Bryant Street, $19.6 million for our Aberdeen Overlook lending venture, $3.7 million for the impact of higher interest rates at Verge, and $2.5 million for predevelopment activities for our next potential apartment projects in Washington, D.C. and in Greenville. Investments in joint ventures was $21.6 million for the twelve months ended December 31, 2022 and included $13.8 million for the lending ventures including the Windlass loan and $3.6 million for our Estero joint venture. Net cash used in investing activities in 2022 was $23,196,000 versus cash provided by investing activities of $66,601,000 in
Financing Activities – Net cash Net cash provided by financing activities was $16,834,000 in 2022 versus cash used in financing activities of $1,231,000 in 2021 primarily due to the $27.9 million contribution for 20% ownership of Dock & Maren by our new limited partner (less $9.3 million distributed to MRP) and prior year refinancing of Dock 79 for $1.4 million more net of debt issuance costs than the amount
Credit Facilities - On
On March 19, 2021, the Company refinanced Dock 79 and The Maren projects pursuant to separate Loan Agreements and Deed of Trust Notes entered into with Teachers Insurance and Annuity Association of America, LLC. Dock 79 and The Maren borrowed principal sums of $92,070,000 and $88,000,000 respectively, in connection with the refinancing. The loans are separately secured by the Dock 79 and The Maren real property and improvements, bear a fixed interest rate of 3.03% per annum, and require monthly payments of interest only with the principal in full due April 1, 2033. Either loan may be prepaid subsequent to April 1, 2024, subject to yield maintenance premiums. Either loan may be
transferred to a qualified buyer as part of a one-time sale subject to a 60% loan to value, minimum of 7.5% debt yield and a 0.75% transfer fee. Effective March 31, 2021, the Company consolidated the assets (at current fair value), liabilities and operating results of our Riverfront Investment Partners II, LLC partnership (The Maren) which was previously accounted for under the equity method. As such the full amount of our mortgage loan was recorded in the consolidated financial statements.
Cash Requirements – The Company expended capital of
Non-GAAP Financial Measures.
To supplement the financial results presented in accordance with GAAP, FRP presents
The following tables represent the Joint Venture and Development pro-rata NOI by project:
OFF-BALANCE SHEET ARRANGEMENTS
The Company has outstanding letters of credit described above under “Liquidity and Capital Resources.” The Company has guaranteed debt as described above under Note 12 Contingent Liabilities. The Company unconsolidated Joint Ventures have debt as scheduled under “Investments in Joint Ventures”. The Company does not have any other off-balance sheet arrangements that either have, or are reasonably likely to have, a current or future material effect on its financial condition.
CRITICAL ACCOUNTING POLICIES
Management of the Company considers the following accounting policies critical to the reported operations of the Company:
Accounts Receivable and Unrealized Rents Valuation. The Company is subject to customer credit risk that could affect the collection of outstanding accounts receivable and unrealized rents, that is rents recorded on a straight-lined basis. To mitigate these risks, the Company performs credit reviews on all new customers and periodic credit reviews on existing customers. A detailed analysis of late and slow pay customers is prepared monthly and reviewed by senior management. The overall
Net Real Estate Investments and Impairment of Assets. Net real estate investments are recorded at cost less accumulated depreciation and depletion. Provision for depreciation of Net real estate investments is computed using the straight-line method based on the following estimated useful lives:
Depletion expense of
The Company periodically reviews net real estate investments for potential impairment whenever events or circumstances indicate the carrying amount of a long-lived asset may not be recoverable. This review consists of comparing cap rates on recent cash flows and market value estimates to the carrying values of each asset group. If this review indicates the carrying value might exceed fair value then an estimate of future cash flows for the remaining useful life of each property is prepared considering anticipated vacancy, lease rates, and any future capital expenditures. Changes in estimates or assumptions could have an impact on the Company’s financials.
All direct and indirect costs, including interest and real estate taxes, associated with the development, construction, leasing or expansion of real estate investments are capitalized as a development cost of the property. Included in indirect costs is an estimate of internal costs associated with development and rental of real estate investments. Changes in estimates or assumptions could have an impact on the Company’s financials.
Accounting for Real Estate Investments. The Company accounts for its real estate investments which are not wholly owned using either the cost method, the equity method or by consolidation with related non-controlling interest. Consolidation is required if the Company controls an investment and is the primary beneficiary. Equity method is required when the Company has significant influence over the operating and financial policies of the investment but is not in control or not the primary beneficiary. Cost method applies when the Company does not have significant influence of the operating and financial policies. Significant judgment is required and regular review as the facts change.
Income Taxes. The Company accounts for income taxes under the asset-and-liability method. Deferred tax assets and liabilities represent items that will result in taxable income or a tax deduction in future years for which the related tax expense or benefit has already been recorded in our statement of earnings. Deferred tax accounts arise as a result of timing differences between when items are recognized in the Consolidated Financial Statements compared with when they are recognized in the tax returns. The Company assesses the likelihood that deferred tax assets will be recovered from future taxable income. To the extent recovery is not probable, a valuation allowance is established and included as an expense as part of our income tax provision. No valuation allowance was recorded at December 31, actual results could vary materially from these estimates. Further, a number of years may elapse before a particular matter, for which an established accrual was made, is audited and resolved.
INFLATION
Most of the Company’s operating expenses are inflation-sensitive, with inflation generally producing increased costs of operations. Substantially all of the Company’s royalty agreements are based on a percentage of the sales price of the related mined items.
CONSOLIDATED STATEMENTS OF INCOME – Years ended December 31 (in thousands, except per share amounts)
See accompanying notes.
CONSOLIDATED STATEMENTS OF COMPREHENSIVE INCOME – Years ended December 31 (In thousands)
See accompanying notes.
CONSOLIDATED BALANCE SHEETS – As of December 31 (In thousands, except share data)
See accompanying notes.
CONSOLIDATED STATEMENTS OF CASH FLOWS– Years ended December 31 (In thousands)
See accompanying notes.
CONSOLIDATED STATEMENTS OF SHAREHOLDERS’ EQUITY (In thousands, except share amounts)
NOTES TO CONSOLIDATED FINANCIAL STATEMENTS
ORGANIZATION - FRP Holdings, Inc. (the “Company”) is a holding company engaged in
FRP Holdings, Inc. was incorporated on April 22, 2014 in connection with a corporate reorganization that preceded the Spin-off of Patriot Transportation Holding, Inc. The Company’s predecessor issuer was formed on July 20, 1998. The business of the Company is conducted through our wholly-owned subsidiaries FRP Development Corp., a Maryland corporation (“Development”) and Florida Rock Properties, Inc., a Florida corporation (“Properties”), and the various subsidiaries and joint ventures of each.
CONSOLIDATION - The consolidated financial statements include the accounts of the Company inclusive of our operating real estate subsidiaries, Development and Properties, and all wholly-owned or controlled entities. Our investments in real estate partnerships which are conducted through limited liability corporations (“LLC”) are also referred to as joint ventures. Investments in real estate joint ventures not controlled by the Company are accounted for under the equity or cost method of accounting as appropriate (See Note 2). All significant intercompany balances and transactions are eliminated in the consolidated financial statements.
Effective July 1, 2017 the Company consolidated the assets (at fair value), liabilities and operating results of our Riverfront Investment Partners I, LLC joint venture (“Dock 79”) which was previously accounted for under the equity method. Subsequent to the July 1, 2017 consolidation, the ownership of Dock 79 attributable to our partner MRP Realty is reflected on our consolidated balance sheet as a noncontrolling interest. In March 2021, Riverfront Investment Partners II, LLC reached stabilization which resulted in a change of control for accounting purposes as the veto rights of the minority shareholder lapsed and the Company became the primary beneficiary. As such, effective March 31, 2021 the Company consolidated the assets (at fair value), liabilities and operating results of our Riverfront Investment Partners II, LLC joint venture (“The Maren”) which was previously accounted for under the equity method. Subsequent to the March 31, 2021 consolidation, the ownership of The Maren attributable to our partner MRP Realty is reflected on our consolidated balance sheet as a noncontrolling interest. Such noncontrolling interests are reported on the Consolidated Balance Sheets within equity but separately from shareholders' equity. On the Consolidated Statements of Income, all of the revenues and expenses from Dock 79 are reported in net income, including both the amounts attributable to the Company and the noncontrolling interest. The Maren is reflected in Equity in loss of joint ventures on the Consolidated Statements of Income for the periods up to March 31, 2021 but is reflected like Dock 79 for periods commencing April 1, 2021. The amounts of consolidated net income attributable to the noncontrolling interest is clearly identified on the accompanying Consolidated Statements of Income. In 2022 we sold a 20% ownership interest in a tenancy-in-common (TIC) of Dock 79 and The Maren to a new partner Steuart Investment Company (SIC). The Company continues to consolidate both properties because of continued control over major decisions for both properties.
CASH AND CASH EQUIVALENTS - The Company considers all Treasury bills available for sale regardless of maturity and other highly liquid debt instruments with maturities of three months or less at time of purchase to be cash equivalents. Bank overdrafts consist of outstanding checks not yet presented to a bank for settlement, net of cash held in accounts with right of offset.
INVESTMENTS AVAILABLE FOR SALE - The Company determines the appropriate classification of its investments in debt securities at the time of purchase and reevaluates such determinations at each balance sheet date. Debt securities are classified as held to maturity when the Company has the positive intent and ability to hold the securities to maturity. Marketable securities that are bought and held principally for the purpose of selling them in the near term are classified as trading securities and are reported at fair value, with unrealized gains and losses recognized in earnings. Debt securities not classified as held to maturity or as trading, are classified as available-for-sale, and are carried at fair value, with the unrealized gains and losses, net of tax, included in the determination of comprehensive income and reported in the Consolidated Statements of Comprehensive Income. The fair value of securities is determined using quoted market prices. At December 31,
REVENUE AND EXPENSE RECOGNITION - Mining royalty revenues are recognized when the performance obligation is satisfied which is when the sand or stone mined and processed by the lessee is sold and removed from the property. Our typical mining lease requires the tenant to pay the Company a monthly royalty in arrears based on the number of tons of mined materials sold from our mining property multiplied by a percentage of the average annual sales price per ton sold from the prior fiscal year. In certain locations, typically where the sand and stone deposits on the property have been depleted but the tenant still has a need for the leased land, we collect a minimum annual rental amount but this is not the predominant component of mining royalties revenues. As such both mining royalty revenues and minimum annual rents are recognized as revenues from contracts with customers. Mining royalty revenues accounts receivable were $465,000, $618,000 and $388,000 at December 31, 2023, 2022 and 2021 respectively and there were no receivables from minimum rents. Mining royalties deferred revenue liabilities were $325,000, $47,000 and $249,000 at December 31, 2023, 2022 and 2021 respectively.
Sales of real estate are recognized when the collection of the sales price is reasonably assured and when the Company has fulfilled substantially all of its obligations, which are typically as of the closing date.
Accounts receivable are recorded net of discounts and provisions for estimated allowances. We estimate allowances on an ongoing basis by considering historical and current trends. We record estimated bad debts expense as a reduction of lease revenue. We estimate the net collectibility of our accounts receivable and establish an allowance for doubtful accounts based upon this assessment. Specifically, we analyze the aging of accounts receivable balances, historical bad debts, customer concentrations, customer credit-worthiness, current economic trends and changes in customer payment terms.
PROPERTY AND EQUIPMENT - Property and equipment is recorded at cost less accumulated depreciation and depletion. Provision for depreciation of property, plant and equipment is computed using the straight-line method based on the following estimated useful lives:
Depletion
The Company recorded depreciation and depletion expenses for fiscal year
All direct and indirect costs, including interest and real estate taxes, associated with the development, construction, leasing or expansion of real estate investments are capitalized as a cost of the property. Included in indirect costs is an allocation of internal costs associated with development of real estate investments. The cost of routine repairs and maintenance to property and equipment is expensed as incurred.
IMPAIRMENT OF LONG-LIVED ASSETS – The Company reviews its long-lived assets, which include property and equipment and purchased intangible assets subject to amortization for potential impairment annually or whenever events or circumstances indicate the carrying amount of a long-lived asset may not be recoverable. This review consists of comparing cap rates on recent cash flows and market value estimates to the carrying values of each asset group. If this review indicates the carrying value might exceed fair value then an estimate of future cash flows for the remaining useful life of each property is prepared considering anticipated vacancy, lease rates, and any future capital expenditures.
DEVELOPED PROPERTY RENTALS PURCHASE ACCOUNTING – Acquisitions of rental property, including any associated intangible assets, are measured at fair value at the date of acquisition. Any liabilities assumed or incurred are recorded at their fair value at the time of acquisition. The fair value of the acquired property is allocated between land and building (on an as-if vacant basis) based on management’s estimate of the fair value of those components for each type of property and to tenant improvements based on the depreciated replacement cost of the tenant improvements, which approximates their fair value. The fair value of the in-place leases is recorded as follows:
The Company’s determination of these fair values requires it to estimate market rents for each of the leases and make certain other assumptions. These estimates and assumptions affect the rental revenue, and depreciation and amortization expense recognized for these leases and associated intangible assets and liabilities.
INVESTMENTS IN JOINT VENTURES - The Company uses the equity method to account for its investments in Brooksville, BC FRP Realty, Estero, FRP/MRP Buzzard Point Sponsor, and Greenville/Woodfield, in which it has a voting interest of
INCOME TAXES - Deferred tax assets and liabilities are recognized based on differences between financial statement and tax bases of assets and liabilities using presently enacted tax rates. Deferred income taxes result from temporary
differences between pre-tax income reported in the financial statements and taxable income. The Company recognizes liabilities for uncertain tax positions based on a two-step process. The first step is to evaluate the tax position for recognition by determining if the weight of available evidence indicates that it is more likely than not that the position will be sustained on audit. The second step is to estimate and measure the tax benefit as the largest amount that is more than 50% likely to be realized upon ultimate settlement. It is inherently difficult and subjective to estimate such amounts, as the amounts rely upon the determination of the probability of various possible outcomes. The Company reevaluates these uncertain tax positions on a quarterly basis. This evaluation is based on factors including, but not limited to, changes in facts or circumstances, changes in tax law and expiration of statutes of limitations, effectively settled issues under audit, and audit activity. Such a change in recognition or measurement would result in the recognition of a tax benefit or an additional charge to the tax provision. It is the Company's policy to recognize as additional income tax expense the items of interest paid and penalties directly related to income taxes.
DEFERRED COMPENSATION PLAN - The Company has a deferred compensation plan, the Management Security Plan (MSP) for our President. The accruals for future benefits are based upon actuarial assumptions.
USE OF ESTIMATES - The preparation of financial statements in conformity with accounting principles generally accepted in the United State requires management to make estimates and assumptions that affect the reported amounts of assets and liabilities and disclosure of contingent assets and liabilities at the date of the financial statements and the reported amounts of revenues and expenses during the reporting period. Actual results could differ from those estimates.
Certain accounting policies and estimates are of more significance in the financial statement preparation process than others. The most critical accounting policies and estimates include the economic useful lives of our
ENVIRONMENTAL - Environmental expenditures that benefit future periods are capitalized. Expenditures that relate to an existing condition caused by past operations, and which do not contribute to current or future revenue generation, are expensed. Liabilities are recorded for the estimated amount of expected environmental assessments and/or remedial efforts. Estimation of such liabilities includes an assessment of engineering estimates, continually evolving governmental laws and standards, and potential involvement of other potentially responsible parties.
COMPREHENSIVE INCOME – Comprehensive income consists of net income and other comprehensive income (loss). Other comprehensive income (loss) refers to expenses, gains, and losses that are not included in net income, but rather are recorded directly in shareholders’ equity.
RECENTLY ISSUED ACCOUNTING STANDARDS – In
The Company has investments in joint ventures, primarily with other real estate developers. Joint ventures where FRP is not the primary beneficiary are reflected in the line “Investment in joint ventures” on the balance sheet and “Equity in loss of joint ventures” on the income statement. The assets of these joint ventures are restricted to use by the joint ventures and their obligations can only be settled by their assets or additional contributions by the partners.
The following table summarizes the Company’s
The Company is currently negotiating with MRP concerning an ownership adjustment related to the Bryant Street stabilization and conversion of FRP preferred equity to common equity which will be effective in 2024.
The major classes of assets, liabilities and equity of the Company’s Investments in Joint Ventures as of December 31, Investments in
Investments in Joint Ventures as of December 31,
The Company’s capital recorded by the unconsolidated Joint Ventures is $
The major classes of assets, liabilities and equity of the Company’s Investments in Joint Ventures as of December 31, Investments in
Investments in Joint Ventures as of December 31,
The amount of consolidated retained earnings (accumulated deficit) for these joint ventures was $
The income statements of the Bryant Street Partnerships are as follows (in thousands):
The income statements of the Greenville Partnerships are as follow (in thousands):
The income statements of the Verge Partnership are as follows (in thousands):
The Company is a party to an Administrative Services Agreement which resulted from our January 30, 2015 spin-off of Patriot Transportation Holding, Inc. (Patriot). The Administrative Services Agreement sets forth the terms on which Patriot will provide to FRP certain services that were shared prior to the Spin-off, including the services of certain employees and executive officers. The boards of the respective companies amended and extended this agreement for one year effective April 1,
The consolidated statements of income reflect charges and/or allocation from Patriot for these services of $
To determine these allocations between FRP and Patriot as set forth in the Administrative Services Agreement, we employ an allocation method to allocate said expenses and thus we believe that the allocations to FRP are a reasonable approximation of the costs related to FRP’s operations, but any such related-party transactions cannot be presumed to be carried out on an arm’s-length basis.
Debt is summarized as follows (in thousands):
The aggregate amount of principal payments, excluding the revolving credit, due subsequent to December 31,
On Agreement”) with Wells Fargo Bank, N.A. (“Wells Fargo”), effective
On November 17, 2017, Dock 79 borrowed a principal sum of $90,000,000 pursuant to a Loan Agreement and Deed of Trust Note entered into with EagleBank. The loan was secured by the Dock 79 real property and improvements, bore a fixed interest rate of 4.125% per annum and had a term of 120 months. The loan was paid in full on March 19, 2021. A prepayment penalty of $900,000 was recorded into interest expense in the quarter ending March 31, 2021.
Effective March 31, 2021, the Company consolidated the assets (at current fair value), liabilities and operating results of our Riverfront Investment Partners II, LLC partnership (“The Maren”) which was previously accounted for under the equity method. As such the full amount of our mortgage loan was recorded in the consolidated financial statements.
On March 19, 2021, the Company refinanced Dock 79 and The Maren projects pursuant to separate Loan Agreements and Deed of Trust Notes entered into with Teachers Insurance and Annuity Association of America, LLC. Dock 79 and The Maren borrowed principal sums of $92,070,000 and $88,000,000 respectively, in connection with the refinancing. The loans are separately secured by the Dock 79 and The Maren real property and improvements, bear a fixed interest rate of 3.03% per annum, and require monthly payments of interest only with the principal in full due April 1, 2033. Either loan may be prepaid subsequent to April 1, 2024, subject to yield maintenance premiums. Either loan may be transferred to a qualified buyer as part of a one-time sale subject to a 60% loan to value, minimum of 7.5% debt yield and a 0.75% transfer fee.
Debt cost amortization of $
The Company was in compliance with all debt covenants as of December 31, 2023.
The Company is a lessor of residential apartment homes, retail portions of mixed-use communities, commercial properties, and open pit aggregates quarries.
Residential The Company’s residential spaces generally lease for 12 – 15-month lease terms and 90 days prior to the expiration, as long as there is no balance due, the tenant is offered a renewal. If no notice to move out or renew is made, then the leases go to month to month until notification of termination or renewal is received. Renewal terms are typically 9 – 12 months. In 2021, due to the DC legislation in place freezing rent increases as a part of a covid relief plan, FRP was unable
to increase rental rates for renewals. This legislation was lifted in February 2022.
Retail The Company also leases retail spaces at apartment/mixed-use properties. The retail leases are typically 10 -15-year leases with options to renew for another
Commercial & Office The Company’s industrial warehouses typically lease for terms ranging from 3 – 10 years often with
Mining The Company leases land under long-term leases that grant the lessee the right to mine and sell
At December 31,
The minimum future straight-lined rentals due the Company on noncancelable leases as of December 31,
For
During 2023 the Company repurchased shares at an average cost of $. During 2021 the Company repurchased shares at an average cost of $.
The Company has
The Company utilizes the Black-Scholes valuation model for estimating fair value of stock compensation for options awarded to officers and employees. Each grant is evaluated based upon assumptions at the time of grant. The assumptions were dividend yield, expected volatility between % and %, risk-free interest rate of % to % and expected life of to years.
The dividend yield of is based on the fact that the Company does not pay cash dividends and has no present intention to pay cash dividends. Expected volatility is estimated based on the Company’s historical experience over a period equivalent to the expected life in years. The risk-free interest rate is based on the U.S. Treasury constant maturity interest rate at the date of grant with a term consistent with the expected life of the options granted. The expected life calculation is based on the observed and expected time to exercise options by the employees.
In January 2023, shares of restricted stock were granted to employees that will vest over the next years. In January 2023, shares of restricted stock were granted to employees as part of a long-term incentive plan that will vest over the next years. In March 2023, shares of restricted stock were granted to employees under the terms of the 2021 long-term incentive plan. In January 2022, shares of restricted stock were granted to employees that will vest over the next years. In January 2022, shares of restricted stock were granted to employees as part of a long-term incentive plan that will vest over the next years. In January 2021, shares of restricted stock were granted to employees that will vest over the next years. In January 2021, shares of restricted stock were granted to employees as part of a long-term incentive plan that will vest over the next
The aggregate intrinsic value of exercisable in-the-money options was $ and the aggregate intrinsic value of outstanding in-the-money options was $ based on the market closing price of $ on December
Gains of $ were realized by option holders during the year ended December 31,
Total unrecognized compensation cost of restricted stock granted but not yet vested as of December 31,
The Provision for income tax expense included in the financial statements (in thousands):
The Provision for income taxes (income tax benefit) consists of the following (in thousands):
The deferred taxes
As of December 31,
A
In this reconciliation, the category “Other, net” consists of permanent tax differences related to non-deductible expenses, special tax rates and tax credits, interest paid and penalties, and adjustments to prior year estimates. The effective state income tax rate in 2022 and 2023 was favorably impacted both by apportioned interest income in Florida and taxable losses in states with higher income tax rates.
The types of temporary differences and their related tax effects that give rise to
NOL Carryovers
The Company has no unrecognized tax benefits.
FRP tax returns in the U.S. and various states that include the Company are subject to audit by taxing authorities. As of December 31,
possibly materially, due to projected effective state tax rates.
The Company and certain subsidiaries have a savings/profit sharing plan for the benefit of qualified employees. The savings feature of the plan incorporates the provisions of Section 401(k) of the Internal Revenue Code under which an eligible employee may elect to save a portion (within limits) of their compensation on a tax deferred basis. The Company contributes to a participant’s account an amount equal to 50% (with certain limits) of the participant’s contribution. Additionally, the Company may make an annual discretionary contribution to the plan as determined by the Board of Directors, with certain limitations. The plan provides for deferred vesting with benefits payable upon retirement or earlier termination of employment. The Company’s cost was $
The Company has a deferred compensation plan, the Management Security Plan (MSP) for our President. The accruals for future benefits are based upon actuarial assumptions. Life insurance on his life has been purchased to partially fund this benefit and the Company is the owner and beneficiary of that policy. The expense for
The Company is reporting its financial performance based on
The ground leases.
Our Mining Royalty Lands
Through our Development
The
Operating results and certain other financial data for the Company’s business segments are as follows (in thousands):
Identifiable net assets:
Fair value is defined as the price that would be received to sell an asset or paid to transfer a liability in an orderly transaction between market participants at the measurement date. The fair value hierarchy prioritizes the inputs to valuation techniques used to measure fair value into three broad levels. Level 1 means the use of quoted prices in active markets for identical assets or liabilities. Level 2 means the use of values that are derived principally from or corroborated by observable market data. Level 3 means the use of inputs are those that are unobservable and significant to the overall fair value measurement.
At December 31,
At December 31, equivalents including U.S. Treasury notes was adjusted to fair value as described above.
The fair values of the Company’s other mortgage notes payable were estimated based on current rates available to the Company for debt of the same remaining maturities. At December 31,
The Company may be involved in litigation on a number of matters and is subject to certain claims which arise in the normal course of business. The Company has retained certain self-insurance risks with respect to losses for third party liability and property damage. In the opinion of management, none of these matters are expected to have a material adverse effect on the Company’s consolidated financial condition, results of operations or cash flows.
The Company is subject to numerous environmental laws and regulations. The Company believes that the ultimate disposition of currently known environmental matters will not have a material effect on its financial position, liquidity, or operations. The Company can give no assurance that previous environmental studies with respect to its properties have revealed all potential environmental contaminants; that any previous owner, occupant or tenant did not create any material environmental condition not known to the Company; that the current environmental condition of the properties will not be affected by tenants and occupants, by the condition of nearby properties, or by unrelated third parties; and that changes in applicable environmental laws and regulations or their interpretation will not result in additional environmental liability to the Company.
As of December 31,
The Company and MRP previously guaranteed $26 million of the construction loan on the Bryant Street Partnerships in exchange for a 1% lower interest rate. The value of the guarantee was calculated at $1.9 million based on the present value of the 1% interest savings over the anticipated 48-month term. This amount is included as part of the Company’s investment basis and was amortized to expense over the 48 months. In December 2023 this loan was paid in full with proceeds from another lender and contributions by the Company and MRP. The Company recorded a gain of $1.9 million in December 2023 as the guarantee liability was relieved. The Company and MidAtlantic Realty Partners (MRP) provided a guaranty for the interest carry cost of $110 million loan on the Bryant Street Partnerships issued in December 2023. The Company and MRP have a side agreement limiting the Company’s guarantee to its proportionate ownership. The value of the guarantee was calculated at $
the present value of the our assumption of
The Company, at December 31, As of December 31, 2023, we had additional financing commitments to our residential development lending ventures totaling $11.7 million of which $6.5 million is budgeted for in 2024.
The mining royalty lands segment has a total of
On March 31, 2021, the Company consolidated the assets (at fair value), liabilities and operating results of The Maren real estate partnership. The consolidation resulted in a gain on remeasurement of investment in real estate partnership of $51,139,000 of which $13,965,000 was attributed to noncontrolling interest.
The Company has allocated the purchase price of property acquisitions based upon the fair value of the assets acquired, consisting of land, buildings and intangible assets, including in-place leases and below market leases. These deferred leasing intangible assets are recorded within Deferred Costs and Deferred lease intangible, net in the consolidated balance sheets. The value of the in-place lease intangibles will be amortized
The Company reviews intangible assets for impairment, whenever events or changes in circumstances indicate that the carrying amount of such assets may not be recoverable. Recoverability of long-lived assets is measured by a comparison of the carrying amount of the asset group to the future undiscounted net cash flows expected to be generated by those assets. If such assets are considered to be impaired, the impairment charge recognized is the amount by which the carrying amounts of the assets exceeds the fair value of the assets.
The Company had the following Acquired
Amortization expense for in-place leases was $
The Estimated
On
Subsequent to the The following table shows the Historical earnings per share and the pro forma earnings per share assuming the stock split was effective:
Report of Management
Management's Responsibility for the Financial Statements
Management of the Company is responsible for the preparation and integrity of the consolidated financial statements appearing in our Annual Report on Form 10-K. The financial statements were prepared in conformity with accounting principles generally accepted in the United States appropriate in the circumstances and, accordingly, include certain amounts based on our best judgments and estimates. Financial information in this Annual Report on Form 10-K is consistent with that in the financial statements.
Management of the Company is responsible for establishing and maintaining a system of internal controls and procedures to provide reasonable assurance regarding the reliability of financial reporting and the preparation of the consolidated financial statements. Our internal control system is supported by a program of internal audits and appropriate reviews by management, written policies and guidelines, careful selection and training of qualified personnel, and a written Code of Business Conduct adopted by our Company's Board of Directors, applicable to all officers and employees of our Company and subsidiaries.
Because of its inherent limitations, internal control over financial reporting may not prevent or detect misstatements and, even when determined to be effective, can only provide reasonable assurance with respect to financial statement preparation and presentation. Also, projections of any evaluation of effectiveness to future periods are subject to the risk that controls may become inadequate because of changes in conditions, or that the degree of compliance with the policies or procedures may deteriorate.
Management's Report on Internal Control Over Financial Reporting
Management of the Company is responsible for establishing and maintaining adequate internal control over financial reporting as such term is defined in Rule 13a-15(f) under the Securities Exchange Act of 1934 ("Exchange Act"). Management assessed the effectiveness of the Company's internal control over financial reporting as of December 31,
The Company's independent auditors, Hancock Askew& Co., LLP, a registered public accounting firm, are appointed by the Audit Committee of the Company's Board of Directors, subject to ratification by our Company's shareholders. Hancock Askew & Co., LLP has audited and reported on the consolidated financial statements of FRP Holdings, Inc. The report of the independent auditors is contained in this annual report.
Audit Committee's Responsibility
The Audit Committee of our Company's Board of Directors, composed solely of Directors who are independent in accordance with the requirements of the Nasdaq Stock Market listing standards, the Exchange Act, and the Company's Corporate Governance Guidelines, meets with the independent auditors, management and internal auditors periodically to discuss internal controls and auditing and financial reporting matters. The Audit Committee reviews with the independent auditors the scope and results of the audit effort. The Audit Committee also meets periodically with the independent auditors and the chief internal auditor without management present to ensure that the independent auditors and the chief internal auditor have free access to the Audit Committee. Our Audit Committee's Report can be found in the Company's Report of Independent Registered Public Accounting Firm The Shareholders and Board of Directors FRP Holdings, Inc.
Opinion on the Financial Statements
We have audited the accompanying consolidated balance sheets of FRP Holdings, Inc. (the “Company”) as of December 31,
Basis for Opinion
These consolidated financial statements are the responsibility of the Company’s management. Our responsibility is to express an opinion on the Company’s consolidated financial statements based on our audits. We are a public accounting firm registered with the Public Company Accounting Oversight Board (United States) (“PCAOB”) and are required to be independent with respect to the Company in accordance with the U.S. federal securities laws and the applicable rules and regulations of the Securities and Exchange Commission and the PCAOB.
We conducted our audits in accordance with the standards of the PCAOB. Those standards require that we plan and perform the audit to obtain reasonable assurance about whether the consolidated financial statements are free of material misstatement, whether due to error or fraud. The Company is not required to have, nor were we engaged to perform, an audit of its internal control over financial reporting. As part of our audits, we are required to obtain an understanding of internal control over financial reporting, but not for the purpose of expressing an opinion on the effectiveness of the Company’s internal control over financial reporting. Accordingly, we express no such opinion.
Our audits included performing procedures to assess the risks of material misstatement of the consolidated financial statements, whether due to error or fraud, and performing procedures that respond to those risks. Such procedures included examining, on a test basis, evidence regarding the amounts and disclosures in the consolidated financial statements. Our audits also included evaluating the accounting principles used and significant estimates made by management, as well as evaluating the overall presentation of the consolidated financial statements. We believe that our audits provide a reasonable basis for our opinion.
Critical Audit Matter
The critical audit matter communicated below is a matter arising from the current period audit of the consolidated financial statements that was communicated or required to be communicated to the audit committee and that: (1) relates to accounts or disclosures that are material to the financial statements and (2) involve especially challenging, subjective, or complex judgments. The communication of a critical audit matter does not alter in any way our opinion on the financial statements, taken as a whole, and we are not, by communicating the critical audit matter below, providing a separate opinion on the critical audit matter or on the accounts or disclosures to which it relates.
Real Estate Investment Accounting Assessment
Description of Matter
At December 31, determine whether to use the cost or equity method to account for an investment or whether to consolidate such investment. Note 2 to the consolidated financial statements provides a detail of unconsolidated real estate investments.
Application and auditing of the accounting treatment of the Company’s real estate investments, including the process of evaluating the use of the cost or equity method of accounting or the evaluation of criteria for consolidation based on the variable interest entity (VIE) model or a voting interest entity (VOE) model, is complex and requires significant judgment. This evaluation and analysis include the determination of which party, if any, has power to direct the activities most significant to the economic performance of each real estate venture and whether the venture has sufficient equity to finance its activities without additional subordinated support. Factors considered by management in determining whether the Company has the power to direct the activities include voting rights, involvement in day-to-day capital allocation and operating decisions and the extent of the Company’s involvement in the entity.
How We Addressed the Matter in Our Audit
We obtained an understanding, evaluated the design and tested the operating effectiveness of relevant controls over the Company’s qualitative analysis that determines whether the Company has control over the venture, through influence, voting interest or through the presence of a variable interest in a real estate venture that would require consolidation.
For all investments in real estate ventures, our procedures include reading the operating agreements and other relevant documents and evaluating the structure and terms of the agreements and reviewing management’s evaluation of control over the entity and the applicability of the variable interest model as compared to the voting interest model. We evaluate management’s determination of whether the investee has sufficient equity to finance its activities without additional subordinated financial support and whether the equity holders lack the characteristics of a controlling financial interest. We consider management’s determination on whether the Company is the primary beneficiary or has a controlling financial interest that should be considered. We take into consideration evidence obtained in other areas of the audit, such as review of board minutes and status of the projects development to determine if any reconsideration of the findings is necessary.
Hancock Askew & Co., LLP
We have served as the Company’s auditor since 2006.
Jacksonville, Florida March
DIRECTORS AND OFFICERS
Directors John D. Baker II (1) Chief Executive Officer of the Company
John S. Surface (2)(3)(4) Chief Executive Officer of Covis Services
Martin E. Stein, Jr. (3)(4) Executive Chairman of Regency Centers Corporation Nicole B. Thomas (2)(3)(4) President of Baptist Medical Center Jacksonville
William H. Walton (2)(3)(4) Co-Founder and Managing Member of Rockpoint Group, LLC
Margaret Wetherbee Attorney
_______________ (1) Member of the Executive Committee (2) Member of the Audit Committee (3) Member of the Compensation Committee (4) Member of the Nominating Committee
Officers John D. Baker II Chief Executive Officer
David H. deVilliers, Jr. President & Chief Operating Officer
David H. deVilliers III Executive Vice President
John D. Baker III Chief Financial Officer & Treasurer
John D. Milton, Jr. Executive Vice President, Secretary & General Counsel
John D. Klopfenstein Controller and Chief Accounting Officer FRP Holdings, Inc. 200 West Forsyth Street, 7th Floor Jacksonville, Florida, 32202 Telephone: (904) 396-5733
Annual Meeting Shareholders are cordially invited to attend the
Transfer Agent
59 Maiden Lane Plaza Level New York, NY 10038 Telephone: 1-800-937-5449
General Counsel Nelson Mullins Riley & Scarborough LLP Jacksonville, Florida
Independent Registered Public Accounting Firm
Hancock Askew & Co., LLP Jacksonville, Florida
Common Stock Listed
The Nasdaq Stock Market (Symbol: FRPH)
Form 10-K
Shareholders may receive, without charge, a copy of FRP Holdings, Inc.’s annual report on Form 10-K for the year ended December 31,
Company Website
The Company’s website may be accessed at www.frpdev.com. All of our filings with the Securities and Exchange Commission can be accessed through our website promptly after filing. This includes annual reports on Form 10-K, proxy statements, quarterly reports on Form 10-Q, current reports filed or furnished on Form 8-K and all related amendments.
| |||||||||||||||||||||||||||||||||||||||||||||||||||||||||||||||||||||||||||||||||||||||||||||||||||||||||||||||||||||||||||||||||||||||||||||||||||||||||||||||||||||||||||||||||||||||||||||||||||||||||||||||||||||||||||||||||||||||||||||||||||||||||||||||||||||||||||||||||||||||||||||||||||||||||||||||||||||||||||||||||||||||||||||||||||||||||||||||||||||||||||||||||||||||||||||||||||||||||||||||||||||||||||||||||||||||||||||||||||||||||||||||||||||||||||||||||||||||||||||||||||||||||||||||||||||||||||||||||||||||||||||||||||||||||||||||||||||||||||||||||||||||||||||||||||||||||||||||||||||||||||||||||||||||||||||||||||||||||||||||||||||||||||||||||||||||||||||||||||||||||||||||||||||||||||||||||||||||||||||||||||||||||||||||||||||||||||||||||||||||||||||||||||||||||||||||||||||||||||||||||||||||||||||||||||||||||||||||||||||||||||||||||||||||||||||||||||||||||||||||||||||||||||||||||||||||||||||||||||||||||||||||||||||||||||||||||||||||||||||||||||||||||||||||||||||||||||||||||||||||