TABLE OF CONTENTS
| Page | ||
| Item 1. | ||
| Item 1A. | ||
| Item 1B. | ||
| Item 2. | ||
| Item 3. | ||
| Item 4. | ||
| Item 5. | ||
| Item 6. | ||
| Item 7. | ||
| Item 7A. | ||
| Item 8. | ||
| Item 9. | ||
| Item 9A. | ||
| Item 9B. | ||
| Item 10. | ||
| Item 11. | ||
| Item 12. | ||
| Item 13. | ||
| Item 14. | ||
| Item 15. | ||
TABLE OF DEFINED TERMS
| Term | Definition | |
| AIG | Ammonia Injection Grid | |
| ASCR™ | A trademark used to describe our Advanced Selective Catalytic Reduction process | |
| CAIR | Clean Air Interstate Rule | |
| CAVR | Clean Air Visibility Rule | |
| CSAPR | Cross-State Air Pollution Rule | |
| CFD | Computational Fluid Dynamics | |
| EPA | The U.S. Environmental Protection Agency | |
| ESP | Electrostatic Precipitator | |
| FGC | Flue Gas Conditioning | |
FUEL CHEM® | A trademark used to describe our fuel and flue gas treatment processes, including its TIFI® Targeted In-Furnace Injection™ technology to control slagging, fouling, corrosion and a variety of sulfur trioxide-related issues | |
| GSG™ | Graduated Straightening Grid | |
| HERT™ High Energy Reagent Technology™ | A trademark used to describe one of our SNCR processes for the reduction of NOx | |
NOx | Oxides of nitrogen | |
NOxOUT® | A trademark used to describe one of our SNCR processes for the reduction of NOx | |
NOxOUT-SCR® | A trademark used to describe our direct injection of urea as a catalyst reagent | |
NOxOUT CASCADE® | A trademark used to describe our process for the combination of SNCR and SCR technologies | |
| SCR | Selective Catalytic Reduction | |
| SNCR | Selective Non-Catalytic Reduction | |
TIFI® Targeted In-Furnace Injection™ | A trademark used to describe our proprietary technology that enables the precise injection of a chemical reagent into a boiler or furnace as part of a FUEL CHEM program | |
| ULTRA™ | A trademark used to describe our process for generating ammonia for use as a Selective Catalytic Reduction reagent | |
PART I
Forward-Looking Statements
This Annual Report on Form 10-K contains “forward-looking statements,” as defined in Section 21E of the Securities Exchange Act of 1934, as amended, that are made pursuant to the safe harbor provisions of the Private Securities Litigation Reform Act of 1995 and reflect our current expectations regarding our future growth, results of operations, cash flows, performance and business prospects, and opportunities, as well as assumptions made by, and information currently available to, our management. We have tried to identify forward-looking statements by using words such as “anticipate,” “believe,” “plan,” “expect,” “intend,” “will,” and similar expressions, but these words are not the exclusive means of identifying forward-looking statements. These statements are based on information currently available to us and are subject to various risks, uncertainties, and other factors, including, but not limited to, those discussed herein under the caption “Risk Factors” that could cause our actual growth, results of operations, financial condition, cash flows, performance and business prospects and opportunities to differ materially from those expressed in, or implied by, these statements. Except as expressly required by the federal securities laws, we undertake no obligation to update such factors or to publicly announce the results of any of the forward-looking statements contained herein to reflect future events, developments, or changed circumstances or for any other reason. Investors are cautioned that all forward-looking statements involve risks and uncertainties, including those detailed in our filings with the Securities and Exchange Commission. See “Risk Factors” in Item 1A.
ITEM 1 - BUSINESS
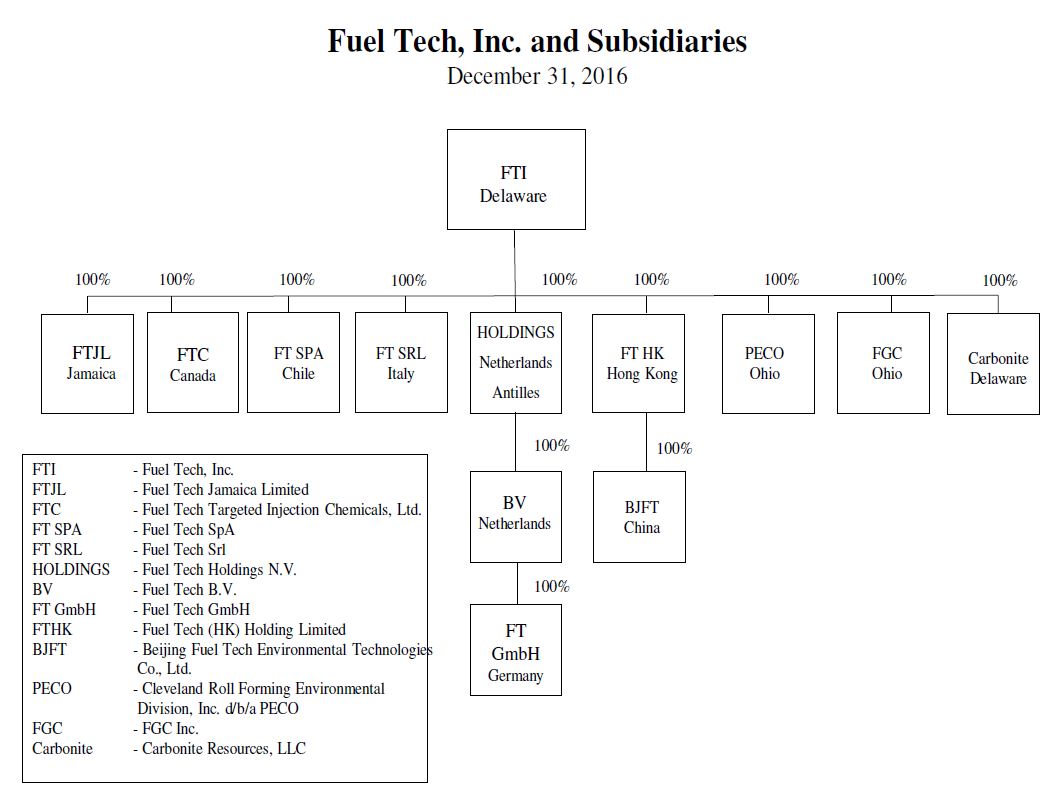
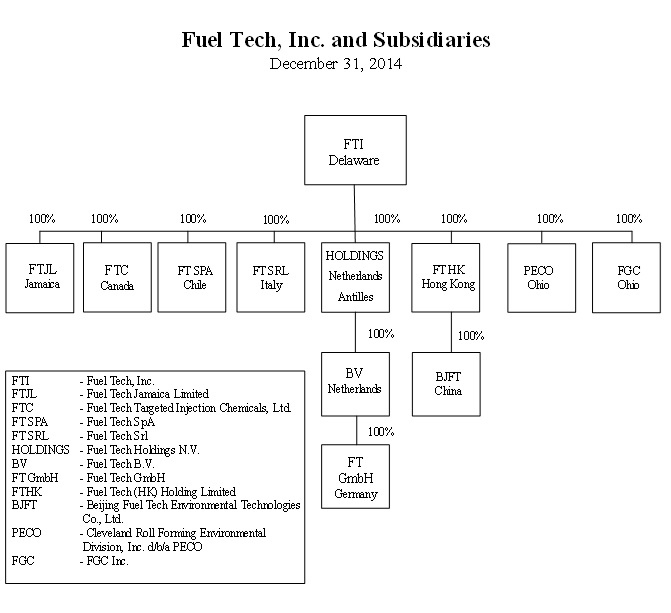
As used in this Annual Report on Form 10-K, the terms “we,” “us,” or “our,” refer to Fuel Tech, Inc. and our wholly-owned subsidiaries.
GENERAL
We are a leading technology company engaged in the worldwide development, commercialization and application of state-of-the-art proprietary technologies for air pollution control, process optimization, combustion efficiency and advanced engineering services. These technologies enable our customers to operate efficiently in a cost-effective and environmentally sustainable manner. We operate as a fully integrated company withto apply our extensive knowledge of carbonaceous fuel and combustion engineering to serve a capital projects business to leverage ourvariety of end markets. Our Air Pollution Control (APC) technologies and a specialty chemicals business which builds upon our proprietary FUEL CHEM® processes. Both segmentsbusiness processes rely heavily on our unique ability to inject chemical slurries into combustion units, in precise concentrations and locations, to achieve a desired outcome. Our Fuel Conversion business is a development stage opportunity focused on creating and manufacturing value-added engineered carbon feedstock products for carbon feedstock customer markets.
| • | Our APC technologies include advanced combustion modification techniques including low NOx burners and over fire air systems, along with post-combustion nitrogen oxide (NOx) control approaches, including NOxOUT® and HERT™ Selective Non-Catalytic Reduction (SNCR) |
| • | Our FUEL CHEM technologies revolve around the unique application of chemical injection programs which improve the efficiency, reliability, fuel flexibility and environmental status of combustion units by controlling slagging, fouling, corrosion, opacity and acid plume, as well as the formation of sulfur trioxide, |
| • | The Fuel Conversion business represents the continuing evolution of a new research and business development initiative we first commenced in 2014 following our acquisition of intellectual property rights and know-how related to the CARBONITE® fuel conversion process and technology. The goal of our Fuel Conversion technology is to convert coals of various grades into value-added engineered carbon feedstock products that are designed to be high in energy content and manufactured to contain other customizable carbon feedstock characteristics desirable in a variety of carbon feedstock use applications. Our Fuel Conversion technology has a number of potential applications including certain coal replacement, electric arc furnace reductant, ferro-alloy feedstock, and mercury reduced carbon feedstock. Since 2014, we have been testing and developing certain engineered carbon feedstock products for specific market applications. We are in the process of evaluating the commercialization of these product offerings with prospective customers. |
Many of our products and services rely heavily on our computational fluid dynamics and chemical kinetics modeling capabilities, which are enhanced by internally developed, high-end visualization software. These capabilities, coupled with our innovative technologies and multi-disciplined team approach, enable us to provide practical solutions to some of our customers' most challenging issues.
Regulations and Markets: Domestic
The continued growth of our APC technology segment is dependent upon the adoption and enforcement of increasingly stringent environmental regulations in the U.S. and globally. In the U.S., federal and state laws regulating the emission of NOx are the primary driver in our APC technology segment. The principal regulatory drivers currently in effect are as follows:
Clean Air Act: The Clean Air Act (CAA) requires the U.S. Environmental Protection Agency (EPA) to establish national ambient air quality standards (NAAQS) at levels that are protective of public health with an adequate margin of safety. The six pollutants specified include: Ozone (O3), Particulate Matter (PM), Nitrogen Dioxide (NO2), Sulfur Dioxide (SO2), Lead, and Carbon Monoxide (CO). The NAAQS provisions require that states comply with ozone and particulate emissions standards. NOx emissions are a precursor to ozone formation and also contribute to fine particulate emissions (PM2.5), which has been the recent regulatory driver through the Cross-State Air Pollution Rule (CSAPR). NOx emissions were targeted as contributors to fine particulate emissions and ozone emissions. Since 1990, programs have been established by the EPA at the regional and federal level to help states in their mission to define and meet their State Implementation Plans (SIPs) for attainment. NAAQS PM standards were issued in 1997, with more stringent standards issued in 2006 and 2012. The NAAQS ozone standards issued in 1997 were made more stringent in 2008. TheOn October 1, 2015, the EPA has stated it plansstrengthened the NAAQS for ground-level ozone by reducing the minimum acceptable level from 75 to revise the 2008 ozone NAAQS during 2015.70 parts per billion (ppb).
Cross-State Air Pollution Rule:Rule (CSAPR): On July 7, 2011, the Environmental Protection Agency passed the Cross-State Air Pollution Rule (CSAPR) under the “good neighbor” provision of the Clean Air Act to reduce emissions of SO2 and NOx from power plants in the eastern half of the United States. This rule replaces the Clean Air InterstateTransport Rule (CAIR)(CATR) and focuses on reducing air emissions contributing to fine particle (PM2.5) and ozone nonattainment that often travel across state lines; including SO2 and NOx which contribute to PM2.5 transport. CSAPR affected 27 states, with compliance for the first phase in 2012, with additional reductions required in the second phase by 2014. Under CSAPR, state emission caps were designated to mitigate the emission impact on downwind states by controlling emissions from upwind states. If sources within a state caused the state to exceed its assurance limit, severe penalties including a two-for-one reduction based on each source’s contribution percentage of the state overage would be applied. The DCtiming of CSAPR's implementation has been affected by a number of court actions. In December 2011, CSAPR was stayed prior to implementation due to lawsuits filed by various states and combustion sources, and in August 2012 the U.S. Circuit Court of Appeals, D.C. Circuit, vacated CSAPR on August 21, 2012, with a 2-1 vote.and remanded it to the EPA. The U.S. Supreme Court overturnedreversed that decision in April, 2014. Following the DCremand of the case to the D.C. Circuit, Court decision on April 29, 2014, which reinstated CSAPR on a 6-2 vote. Subsequently, the EPA revisedrequested that the court lift the CSAPR stay and toll the CSAPR compliance deadlines by three years. In October, 2014, the D.C. Circuit granted the EPA's request and, accordingly, CSAPR Phase 1 implementation dates from the original 2011 CSAPR plan,commenced in 2015, with Phase 12 beginning in 2017.
Most recently, in October 2016, the EPA finalized an update to CSAPR for the 2008 ozone NAAQS. The rule requires a number of CSAPRsources to reduce NOx during the ozone season, which is from May through the end of September, starting on January 1, 2015,in 2017. There are NOx credits available from prior years that may allow sources to trade banked allowances and Phase 2 to commence on January 1, 2017.delay emission reductions from current levels until the 2018 ozone season.
Industrial Boiler MACT: In December 2011, the EPA re-proposed its new emissions rule for industrial, commercial and institutional boilers and process heaters, known as the Industrial Boiler Maximum Achievable Control Technology (MACT) standard. The EPA proposedimplemented the final rule on January 31, 2013, with compliance scheduledstarting in January 2016 for January 2016.most units. Emissions regulated include acid gas emissions including hydrochloric acid (HCl), carbon monoxide (CO), mercury, PM, and dioxins. Due to on-going litigation, final deadlines still have not been determined for all the boiler types and categories, although many sources have installed controls to meet the requirements.
Clean Air Visibility Rule: ARule (CAVR: lsoThe Clean Air Visibility Rule (CAVR), also known as the Regional Haze rule, the Clean Air Visibility Rule (CAVR) is part of the Clean Air Act and was finalized in 2005. Under CAVR, certain States are required to submit implementation plans to the EPA to comply with the Regional Haze requirements, and updates are required every five years. A new CAVR was issued in January 2017 which requires states to implement new air pollution controls by 2021. The overall obligation of CAVR is to return the U.S.US scenic areas to “active” visibility by 2064.
Consent Decrees: Consent decree activity through the U.S.US Department of Justice or EPA may require emission sources to meet individual requirements. Sources may also agree to specific air pollution requirements with states or environmental groups.
Regulations and Markets: International
We also sell NOx control systems outside the United States, specifically in Europe, Latin America, South America,India (under a license agreement) and in the Pacific Rim, including the People’s Republic of China (China). Under European Union Directives, and new regulations in Chile, certainexisting coal fired power plants mustwill need to meet tighter emission regulations, and come into compliance by 2019 or 2020 (country specific). The Latin American countries will also present some opportunities for SNCR systems with specified NOx reduction targets by 2016.plants that have inter-company directives for curbing emissions, in the absence of national regulations. However, these opportunities will not be time sensitive, and will greatly depend on allocation of capital budgets from the parent companies.
China continues to represent an attractive opportunity for us as the government setsets pollution control, and energy conservation and efficiency improvements as top priorities, as part of tightened standards that were issuedaddressed by the super clean emission regulation officially released in 2012.December, 2015. We have viable technologies to help achieve these objectives. China’s dominant reliance on coal as an energy resource is not expected to change in the foreseeable future. China alone is forecasted to account for 76% of the projected increase in world coal use through 2035. Clean air will continue to be a pressing issue and has become a political issue, especially given China’s robust economic growth, expected growth in thermal power production,growing awareness of air pollution and an increasingly expanded role in international events and organizations.
China’s Ministry of Environmental Protection issued super clean emission regulations to be fully implemented as part of the Twelfth Five-Year Plan, running from 2011 to 2015,by 2020, in support of reducing harmful pollutants and further defining the technologies recommended to achieve the reductions. Super clean emission requires NOx emission under 50 mg/Nm3, SO2 emission under 35 mg/Nm3 and particulate emission under 10 mg/Nm3. The regulations for NOx apply to all thermalpublic utility units of 300MW or larger and private power generation units that have a steaming rate of 65 tons per hour (155 megawatts (MW)100MW or larger.larger, and will be progressively implemented in the eastern region by 2017, the central region by 2018, and the western region by 2020. These limits are also expected to be enforced on industrial emitters once the utility boilers are in compliance. Newly constructed units and existing units that were approved subsequent to December 31, 2013, must meet the same stringent emission standard, while certainstandard. The existing units approved prior to December 31, 2013 must meet a standard that is less stringent.which cannot be retrofitted will be closed, particularly for units under 300MW as part of Thirteenth Five Year Plan-improving overall energy efficiency and clean emission from 2015-2020. In addition, all units that are in Key Regions must achieve the same standard as the newly constructed units. Key Regions are defined as those areas that are highly developed or highly populated and are sensitive to environmental overloading.
The European Industrial Emissions Directive (IED) sets the target for NOx emissions to achieve required emissions levels.be at or below 200 mg/Nm3 from 1st January 2016. 15 member states have applied for temporary derogation primarily due to aging coal-fired fleets and compliance time frames vary between 2016 and 2020. The combination of SNCRimplementation is country specific and SCR technologies in tandemeach member country sets its own limits based on this guideline. Turkey, while not a member state, is also consideredlooking to meet this guideline as a viable technology choice.
The Latin American governments in general have not enacted NOx specific emission regulations (with the exception of Chile). However, certain companies have set internal targets for pollution control processand these will present a few opportunities for Fuel Tech in high population density areas, we believe that technologiesthe next 2 - 3 years. Current Chilean NOx emission limits for existing units are being met with retrofitting of Low NOx burners and OFA systems, while the new units are being fitted with SCRs. Further tightening of NOx limits may require the addition of SCRs to convert ureaexisting plants for compliance.
In India, stricter emission targets were announced by the government in December 2015 and phased implementation is expected. The government has prioritized PM, SOx, and NOx abatement in order of precedence for retrofit of existing power plants but emission control equipment is being designed in on new power plant projects. The power producers are looking to ammoniathe government to set up policies to help pay for the cost of plant retrofits. This will be deployed in Key Regions in supportimpact the pace of safety objectives, and this practice has already been implemented in major cities such as Beijing, Guangzhou and Shanghai.upgrade projects.
Products
Our NOx reduction and particulate control technologies are installed worldwide on over 1000 combustion units, including utility, industrial and municipal solid waste applications. Our products include customized NOx control systems and our patented ULTRA™ technology, which converts urea-to-ammonia on site and provides safe reagent for use in Selective Catalytic Reduction (SCR) systems.
| • | SNCR Systems: Our NOxOUT® and HERT™ SNCR processes use non-hazardous urea as the reagent rather than ammonia. Both the NOxOUT® and HERT™ processes on their own are capable of reducing NOx by up to 25% - 50% for utilities and by potentially significantly greater amounts for industrial units in many types of plants with capital costs ranging from $5 - $20/kW for utility boilers and with total annualized operating costs ranging from $1,000 - $2,000/ton of NOx removed. |
| • | Combined Systems: Our Advanced Selective Catalytic Reduction (ASCR™) systems include LNB, OFA, and SNCR components, along with a downsized SCR catalyst, Ammonia Injection Grid (AIG), and Graduated Straightening Grid (GSG™) system. Together, these systems provide up to 90% |
| • | ULTRA Technology: Our ULTRA™ process is designed to convert urea to ammonia safely and economically for use as a reagent in the SCR process for NOx reduction. Recent local objections in the ammonia permitting process have raised concerns regarding the safety of ammonia shipment and storage in quantities sufficient to supply SCR. In addition, the Department of Homeland Security has characterized anhydrous ammonia as a Toxic Inhalation Hazard commodity. |
SCR Processes and Services: Our SCR group provides SCR systems for industrial applications, managing all aspects of the process from application analysis through implementation in order to maximize SCR performance and minimize its impact on plant operations. Our SCR group also provides process design optimization, performance testing and improvement, and catalyst selection services for SCR systems on coal-fired boilers. In addition, other related services, including start-ups, maintenance support and general consulting services for SCR systems, Ammonia Injection Grid design and tuning to help optimize catalyst performance, and catalyst management services to help optimize catalyst life, are now offered to customers around the world. We also specialize in both physical experimental models, which involve construction of scale models through which flowsfluids are tested, and computational fluid dynamics models, which simulate fluid flow by generating a virtual replication of real-world geometry and operating inputs. We design flow corrective devices, such as turning vanes, ash screens, static mixers and our patent pending Graduated Straightening Grid (GSG™). Our models help clients optimize performance in flow critical equipment, such as selective catalytic reactors in SCR systems, where the effectiveness and longevity of catalysts are of utmost concern. OurThe Company’s modeling capabilities are also applied to other power plant systems where proper flow distribution and mixing are important for performance, such as flue gas desulphurization scrubbers, electrostatic precipitators, air heaters, exhaust stacks and carbon injection systems for mercury removal.
| • | ESP Processes and Services: ESP technologies for particulate control include Electrostatic Precipitator (ESP) products and services including ESP Inspection Services, Performance Modeling, and Performance and Efficiency Upgrades, along with complete turnkey capability for ESP retrofits. Flue gas conditioning (FGC) systems include treatment using sulfur trioxide (SO3) and ammonia (NH3) based conditioning to improve the performance of ESPs by modifying the properties of the fly ash particle. Our ULTRA technology can provide the ammonia system feed requirements for FGC applications as a safe alternative to ammonia reagent based systems. FGC systems offer a lower capital cost approach to improving ash particulate capture versus the alternative of installing larger ESPs or utilizing fabric filter technology to meet targeted emissions and opacity limits. Fuel Tech’s particulate control technologies have been installed on more than 125 units worldwide. |
| • | Burner Systems: Low NOx Burners and Ultra Low NOx Burners (LNB and ULNB) are available for coal-, oil-, and gas-fired industrial and utility units. Each system application is specifically designed to maximize NOx reduction. Computational fluid dynamics combustion modeling is used to validate the design prior to fabrication of equipment. NOx reductions can range from 40%-60% depending on the fuel type. Over-Fire Air (OFA) systems stage combustion for enhanced NOx reduction. Additional NOx reductions, beyond Low NOx Burners, of 35% - 50% are possible on different boiler configurations on a range of fuel types. Combined overall reductions range from 50% - 70%, with overall capital costs ranging from $10 - $20/kW and total costs ranging from $300 - $1,500/ton of NOx removed, depending on the scope. |
The key market dynamic for the APC product line is the continued use of coal as the principal fuel source for global electricity production. Coal currently accounts for approximately 37%33% of all U.S. electricity generation and roughly 80%74% of Chinese electricity generation. Major coal consumers include China, the United States and India.
Sales of APC products were $42.0$34.1 million, $72.6$43.5 million, and $62.4$42.0 million for the years ended December 31, 2016, 2015 and 2014, 2013 and 2012, respectively.
NOx Reduction Competition
Competition with our NOx reduction suite of products may be expected from companies supplying urea SNCR systems, combustion modification products, SCR systems and ammonia SNCR systems. In addition, we experience competition in the urea-to-ammonia conversion market.
Combustion modifications, including Low NOx Burners and Over-Fire Air systems, can be fitted to most types of boilers with cost and effectiveness varying with specific boilers. Combustion modifications may yield up to 20% - 60% NOx reduction economically with capital costs ranging from $10 - $20/kW and total costs ranging from $300 - $1,500/ton of NOx removed. The modifications are designed to reduce the formation of NOx and are typically the first NOx reduction efforts employed. Companies such as Alstom, Babcock Power, Inc., The Babcock & Wilcox Burner Business, Peerless Manufacturing Company,Combustion Components Associates, Inc., Foster Wheeler Corporation, and Siemens are active competitors in the Low NOx Burner business. Once NOx is formed, then the SCR process is an effective and proven method of control for removal of NOx up to 90%. SCR systems have a high capital cost of $300+/kW on retrofit coal applications. Such companies as Alstom, Babcock Power, The Babcock & Wilcox Company, AMEC through their acquisition of Foster Wheeler Corporation, Peerless Manufacturing Company, Mitsubishiand Hitachi, Power Systems, Cormetech and Johnson Matthey, are active SCR system providers, or providers of the catalyst itself.
The use of ammonia as the reagent for the SNCR process can reduce NOx by 30% - 70% on incinerators, but has limited applicability in the utility industry. Ammonia system capital costs range from $5 - $20/kW, with annualized operating costs ranging from $1,000 - $3,000/ton of NOx removed. These systems require the use of either anhydrous or aqueous ammonia, both of which are hazardous substances.
In addition to or in lieu of using the foregoing processes, certain customers may elect to close or de-rate plants, purchase electricity from third-party sources, switch from higher to lower NOx-emitting fuels or purchase NOx emission allowances.
Lastly, with respect to urea-to-ammonia conversion technologies, a competitive approach to our controlled urea decomposition system competes with Wahlco, Inc., which manufactures a system that hydrolyzes urea under high temperature and pressure.
APC BACKLOGBacklog
Consolidated APC segment backlog at December 31, 20142016 was $18.0$8.0 million versus backlog at December 31, 20132015 of $22.4$22.2 million. A substantial portion of the backlog as of December 31, 20142016 should be recognized as revenue in fiscal 2015,2017, although the timing of such revenue recognition in 20152017 is subject to the timing of the expenses incurred on existing projects.
FUEL CHEM
Product and Markets
The FUEL CHEM® technology segment revolves around the unique application of specialty chemicals to improve the efficiency, reliability and environmental status of plants operating in the electric utility, industrial, pulp and paper, waste-to-energy, and university and district heating markets. FUEL CHEM programs are currently in place on combustion units in North America, Mexico and Europe, treating a wide variety of solid and liquid fuels, including coal, heavy oil, black liquor, biomass and municipal waste.
Central to the FUEL CHEM approach is the introduction of chemical reagents, such as magnesium hydroxide, to combustion units via in-body fuel application (pre-combustion) or via direct injection (post-combustion) utilizing our proprietary TIFI® technology. By attacking performance-hindering problems, such as slagging, fouling and corrosion, as well as the formation of sulfur trioxide (SO3), and ammonium bisulfate (ABS), particulate matter (PM2.5), carbon dioxide (CO2), and unburned carbon in fly ash, our programs offer numerous operational, financial and environmental benefits to owners of boilers, furnaces and other combustion units.
The key market dynamic for this product line is the continued use of coal as the principal fuel source for global electricity production. Coal currently accounts for approximately 37%33% of all U.S. electricity generation and roughly 80%74% of Chinese electricity generation. Major coal consumers include the United States, China and India. Additional market dynamics include a growing, worldwide utilization of biomass for both steam and electrical production, as well as the strengthening of the pulp and paper industry worldwide, resulting in black liquor recovery boilers needing to maximize throughput.
The principal markets for this product line are electric power plants burning coals with slag-forming constituents such as sodium, iron and high levels of sulfur. Sodium is typically found in the Powder River Basin coals of Wyoming and Montana. Iron is typically found in coals produced in the Illinois Basin region. High sulfur content is typical of Illinois Basin coals and certain Appalachian coals. High sulfur content can give rise to unacceptable levels of SO3 formation especially in plants with SCR systems and flue gas desulphurization units (scrubbers).
The combination of slagging coals and SO3-related issues, such as “blue plume” formation, air pre-heater fouling and corrosion, SCR fouling and the proclivity to suppress certain mercury removal processes, represents an attractive market potential for Fuel Tech.
Sales of the FUEL CHEM products were $37.0$21.1 million, $36.8$30.2 million, and $35.2$37.0 million for the years ended December 31, 2014, 20132016, 2015 and 2012,2014, respectively.
Competition
Competition for our FUEL CHEM product line includes chemicals sold by specialty chemical and combustion engineering companies, such as Nalco (Ecolab)Ashland Inc., Environmental Energy Services, Inc., and GE Infrastructure. No technologically comparable substantive competition currently exists for our TIFI technology, which is designed primarily for slag control and SO3 abatement, but there can be no assurance that such lack of substantive competition will continue.
FUEL CONVERSION
INTELLECTUAL PROPERTY
The majority of our products are protected by U.S. and non-U.S. patents. We own 93128 granted patents worldwide and nine13 allowed utility model patents in China. We have 11984 patent applications pending; including 1312 in the United States and 10672 in non-U.S. jurisdictions, as well as 6 pending utility models in China.Jurisdictions. These patents and applications cover some 31 inventions, 16 associated with our NOx reduction business, 1213 associated with the FUEL CHEM business, and threetwo associated with non-commercialized technologies.the Fuel Conversion business. Our granted patents have expiration dates ranging from August 14, 2015October of 2018 to April 1, 2033. We have one patent due to expire in 2015 which is for a non-commercialized technology in Taiwan.June of 2035.
Management believes that the protection provided by the numerous claims in the above referenced patents or patent applications is substantial, and afford us a significant competitive advantage in our business. Accordingly, any significant reduction in the protection afforded by these patents or any significant development in competing technologies could have a material adverse effect on our business.
EMPLOYEES
At December 31, 2014,2016, we had 198146 employees, 148103 in North America, 3834 in China, sixseven in Europe and sixtwo in Chile. We enjoy good relations with our employees and are not a party to any labor management agreement.
RELATED PARTIES
Douglas G. Bailey, a member of our executive team, is a stockholder of American Bailey Corporation (ABC), which is a related party. Please refer to Note 11 to the consolidated financial statements in this documentForm 10-K for information about our transactions with ABC. Additionally, see the more detailed information relating to this subject under the caption “Certain Relationships and Related Transactions” in our definitive Proxy Statement to be distributed in connection with our 20152017 Annual Meeting of Stockholders, which information is incorporated by reference.
AVAILABLE INFORMATION
We are a fully integrated company using a suite of advanced technologies to provide boiler optimization, efficiency improvement and air pollution reduction and control solutions to utility and industrial customers worldwide. Originally incorporated in 1987 under the laws of the Netherlands Antilles as Fuel-Tech N.V., we were domesticated in the United States on September 30, 2006, and continue as a Delaware corporation with our corporate headquarters at 27601 Bella Vista Parkway, Warrenville, Illinois, 60555-1617. Fuel Tech maintains an Internet website at www.ftek.com. Our Annual Report on Form 10-K, quarterly reports on Form 10-Q, current reports on Form 8-K and any amendments to those reports filed or furnished pursuant to Section 13(a) of the Exchange Act are made available through our website as soon as reasonably practical after we electronically file or furnish the reports to the Securities and Exchange Commission. Our website also contains our Corporate Governance Guidelines and Code of Ethics and Business Conduct, as well as the charters of the Audit, Compensation, and Nominating and Corporate Governance committees of the Board of Directors. All of these documents are available in print without charge to stockholders who request them. Information on our website is not incorporated into this report.
ITEM 1A - RISK FACTORS
Investors in our Common Shares should be mindful of the following risk factors relative to our business.
Our Product Portfolio Lacks Diversification
We have two broad technology segments that provide advanced engineering solutions to meet the pollution control, efficiency improvement, and operational optimization needs of coal-fired energy-related facilities worldwide. They are as follows:
| • | The Air Pollution Control technology segment includes technologies to reduce NOx emissions in flue gas from boilers, incinerators, furnaces and other stationary combustion sources. These include Low and Ultra Low NOx Burners (LNB and ULNB), Over-Fire Air (OFA) systems, NOxOUT® and HERT™ Selective Non-Catalytic Reduction (SNCR) systems, and Advanced Selective Catalytic Reduction (ASCR™) systems. The ASCR system includes ULNB, OFA, and SNCR components, along with a downsized SCR catalyst, Ammonia Injection Grid (AIG), and Graduated Straightening Grid (GSG™) systems to provide high NOx reductions at significantly lower capital and operating costs than conventional SCR systems. The NOxOUT CASCADE® and NOxOUT-SCR® processes are basic types of ASCR systems, using just SNCR and SCR catalyst components. ULTRA™ technology creates ammonia at a plant site using safe urea for use with any SCR application. ESP technologies make use of electrostatic precipitator products and services to reduce particulate matter. Flue Gas Conditioning systems are chemical injection systems offered in markets outside the U.S. and Canada to enhance electrostatic precipitator and fabric filter performance in controlling particulate emissions. |
| • | The FUEL CHEM® technology segment which uses chemical processes in combination with advanced Computational Fluid Dynamics (CFD) and Chemical Kinetics Modeling (CKM) boiler modeling for the control of slagging, fouling, corrosion, opacity and other sulfur trioxide-related issues in furnaces and boilers through the addition of chemicals into the furnace using TIFI® Targeted In-Furnace Injection™ technology. |
An adverse development in our advanced engineering solution business as a result of competition, technological change, government regulation, customers converting to use natural gas or other fuels, or any other factor could have a significantly greater impact than if we maintained more diverse operations.
We Face Substantial Competition
Competition in the Air Pollution Control market comes from competitors utilizing their own NOx reduction processes, including SNCR systems, Low NOx Burners, Over-Fire Air systems, flue gas recirculation, ammonia SNCR and SCR, which do not infringe our patented technologies. Indirect competition will also arise from business practices such as the purchase rather than the generation of electricity, fuel switching, closure or de-rating of units, and sale or trade of pollution credits and emission allowances. Utilization by customers of such processes or business practices or combinations thereof may adversely affect our pricing and participation in the NOx control market if customers elect to comply with regulations by methods other than the purchase of our Air Pollution Control products. See Item 1 “Products” and “NOx Reduction Competition” in the Air Pollution Control segment overview.
Competition in the FUEL CHEM markets includes chemicals sold by specialty chemical and combustion engineering companies, such as NALCO (Ecolab), GE Infrastructure, and Environmental Energy Services, Inc.
Demand for Our APC and FUEL CHEM Products is Affected by External Market Factors
Reduced coal-fired electricity demand across the United States has led to coal-fired electricity production declines. Contributing to this decline in coal-fired generations were 1) lower natural gas prices which allowed utility operators to increase the amount of power generated from natural gas plants, 2) increased cost of environmental compliance with current environmental regulations, 3) constrained funding for capital projects, and 4) the uncertainty of regulation resulted in electricity generating unit operators delaying investment in NOx emission remediation plans until such time as the United States Environmental Protection Agency further clarifies the regulations.
Our Business Is Dependent on Continuing Air Pollution Control Regulations and Enforcement
Our business is significantly impacted by and dependent upon the regulatory environment surrounding the electricity generation market. Our business will be adversely impacted to the extent that regulations are repealed or amended to significantly reduce the level of required NOx reduction, or to the extent that regulatory authorities delay or otherwise minimize enforcement of existing laws. Additionally, long-term changes in environmental regulation that threaten or preclude the use of coal or other fossil fuels as a primary fuel source for electricity production which result in the reduction or closure of a significant number of fossil fuel-fired power plants may adversely affect our business, financial condition and results of operations. See Item 1 above under the caption “Regulations and Markets” in the Air Pollution Control segment overview.
We May Not Be Able to Successfully Protect our Patents and Proprietary Rights
We hold licenses to or own a number of patents for our products and processes. In addition, we also have numerous patent applications pending both in the U.S. and abroad. There can be no assurance that any of our pending patent applications will be granted or that our outstanding patents will not be challenged, overturned or otherwise circumvented by competitors. In foreign markets, the absence of harmonized patent laws makes it more difficult to ensure consistent respect for our patent rights in emergi
Our Results May Be Affected By Foreign Operations
In 2007, we expanded our operations in China by establishing a wholly-owned subsidiary in Beijing. Our management believes that the Asia-Pacific region, particularly China, offers significant market opportunities as nations in this region look to establish and implement regulatory policies for improving their environment and utilizing fossil fuels, especially coal, efficiently and effectively. In 2012, we expanded our operations in Latin and South America by establishing a wholly-owned subsidiary in Chile. The future business opportunities in these markets are dependent on the continued implementation and enforcement of regulatory policies that will benefit our technologies, the acceptance of our engineering solutions in such markets, the ability of potential customers to utilize our technologies on a competitive, cost-effective basis, and our ability to protect and enforce our intellectual property rights.
Our Operating Results May Be Adversely Affected by Product Pricing
The onset of significant competition for either of the technology segments might require us to lower our product prices in order to remain competitive and have a corresponding adverse impact on our realized gross margins and operating profitability. See the risk factor entitled “We Face Substantial Competition” above.
We May Not Be Able to Purchase Raw Materials on Commercially Advantageous Terms
Our FUEL CHEM technology segment is dependent, in part, upon a supply of magnesium hydroxide. Any adverse changes in the availability of this chemical will likely have an adverse impact on ongoing operation of our FUEL CHEM programs. On March 4, 2009, we entered into a Restated Product Supply Agreement (“PSA”) with Martin Marietta Magnesia Specialties, LLC (MMMS) in order to assure the continuance of a stable supply from MMMS of magnesium hydroxide products for our requirements in the United States and Canada. On October 31, 2013, we agreed to extend theThe term of the PSA toexpires on December 31, 2016.2017. Pursuant to the PSA, MMMS supplies us with magnesium hydroxide products manufactured pursuant to our specifications and we have agreed to purchase from MMMS, and MMMS has agreed to supply, 100% of our requirements for such magnesium hydroxide products for our customers who purchase such products for delivery in the United States and Canada. There can be no assurance that we will be able to obtain a stable source of magnesium hydroxide in markets outside the United States.
Our Customer Base Is Highly Concentrated
A small number of customers have historically accounted for a significant portion of our revenues. There can be no assurance that our current customers will continue to place orders, that orders by existing customers will continue at the levels of previous periods, or that we will be able to obtain orders from new customers. The loss of one or more of our customers could have a material adverse effect on our sales and operating results.
We May Not Be Able to Borrow Funds Pursuant to our Credit Facilities
We are party to a $15$5.0 million domestic revolving credit agreement with JPMorgan Chase Bank, N.A. As of December 31, 2014,2016, there were no outstanding borrowings on this facility, and Fuel Tech waswe had advanced $3.3 million of Letters of Credit. The Facility is secured by cash held by the Company in compliance with all financial covenants containeda separate restricted use designated JPM Chase deposit account, which is not readily available for our operating needs. The balance in the agreement.this restricted cash account is $6,020 as of December 31, 2016. In addition, our Chinese subsidiary, Beijing Fuel Tech Environmental Technologies Company, Ltd., has a RMB 356.5 million (approximately $5.688 million)$936) revolving credit facility with JPMorgan Chase Bank (China) Company Limited. As of December 31, 2014, the2016, there were no outstanding borrowings under this facility, were approximately $1,625.and we had outstanding bank guarantees of less than $0.1 million. In the event of any default on our part under either of these agreements, the lender is entitled to accelerate payment of any amounts outstanding and may, under certain circumstances, cancel the facilities. If we were unable to obtain a waiver for a breach of covenant and the lender accelerated the payment of any outstanding amounts, such acceleration may cause our cash position to significantly deteriorate or, if cash on hand were insufficient to satisfy the payment due, may require us to obtain alternate financing.
Our Fuel Conversion Business is in its Early Stages of Development
Our Fuel Conversion business is in the research and development stage and has not commenced commercial operations as of December 31, 2016. Traditionally, we have financed our research and product development activities from cash generated from operations. We spent $2.8 million in research and development and other related costs for both the years ended December 31, 2016 and 2015. We have been testing and developing engineered carbon feedstock products for specific markets which are not yet commercially viable. While we remain optimistic of our ability to develop and commercialize these products in the future, there can be no assurance that we will be able to further develop these products to the extent required for use within the markets and customer bases we have identified.
Further, we will be required to find outside financial resources to support the full development of our Fuel Conversion business for the longer term. The ability of the Company to fund its potential future Fuel Conversion operations, including constructing new manufacturing facilities and/or acquiring and re-purposing existing manufacturing facilities to meet our specifications for our Fuel Conversion business, is dependent upon our ability to obtain additional financing when and as needed. Due to the current state of the coal-fired electricity generating market, we believe we do not currently have the ability to access commercial debt markets for that financing. In addition, the volatility in the energy industry combined with recent bankruptcies and additional perceived credit risk of companies with coal exposure has resulted in traditional bank lenders seeking to reduce or eliminate their lending exposure to these companies. Accordingly, we may be required to seek financing from other sources at unfavorable pricing or with unfavorable terms to continue to run our traditional APC and Chemical Technologies contemporaneously with the development of the Fuel Conversion business segment. If such funding is not attainable, the development of the Fuel Conversion business may be significantly delayed or stopped altogether.
We may be unable to obtain, maintain or renew permits or leases necessary for future operations of our Fuel Conversion business, which could hinder our ability to commence future operations
Future operations for our Fuel Conversion business will require us to obtain a number of permits that impose strict regulations on various environmental and operational matters. These, as well as our anticipated Fuel Conversion facilities and operations, would include permits issued by various federal, state and local agencies and regulatory bodies. The permitting rules, and the interpretations of these rules, are complex, change frequently and are often subject to discretionary interpretations by applicable regulators, all of which might make compliance more difficult or impractical, and might possibly preclude the continuance of commencing future operations in the Fuel Conversion business. Non-governmental organizations, environmental groups and individuals have certain statutory rights to engage in the permitting process and might comment upon, or object to, our anticipated requested permits. Such persons also have the right to bring citizen's lawsuits to challenge the issuance of permits, or the validity of environmental impact statements related thereto. If any permits or leases would not be issued or renewed in a timely fashion or at all, or if permits issued or renewed would be conditioned in a manner that restricts our ability to efficiently and economically conduct our future Fuel Conversion operations, our cash flows or profitability could be materially or adversely affected.
ITEM 1B - UNRESOLVED STAFF COMMENTS
None
ITEM 2 - PROPERTIES
We own an office building in Warrenville, Illinois, which has served as our corporate headquarters since June 23, 2008. This facility, with approximately 40,000 square feet of office space, willis sufficient to meet our growth requirements for the foreseeable future.
We also operate from leased office facilities in Stamford, Connecticut; Durham, North Carolina; Gallarate, Italy and Beijing, China. Wewe do not segregate any of ourthese leased facilities by operating business segment. The terms of our four materialthe Company's eight primary lease arrangements are as follows:
The Stamford, Connecticut building lease, for approximately 6,440 square feet, runs from February 1, 2010 to December 31, 2019. The facility houses certain administrative functions such as Investor Relations and certain APC sales functions.
The Beijing, China building lease, for approximately 8,000 square feet, runs from September 1, 2014 to August 31, 2017. This facility serves as the operating headquarters for our Beijing Fuel Tech operation.
The Durham, North Carolina building lease, for approximately 16,0002,590 square feet, runs from MayJuly 1, 20142016 to April 30, 2017.July 31, 2019. This facility houses engineering operations.
The Gallarate, Italy building lease, for approximately 1,300 square feet, runs from May 1, 2013 to April 30, 2019. This facility serves as the operating headquarters for our European operations.
The Westlake, Ohio building lease, for approximately 5,000 square feet, runs from May 1, 2014 to April 30, 2017. This facility houses engineering operations. Upon expiration of the existing lease on April 30, 2017, the Company will move to a smaller location with 3,000 square feet of space, and with the lease term commencing on May 1, 2017 and ending on April 30, 2020.
The Aurora, IL warehouse lease, for approximately 11,000 square feet, runs from September 1, 2013 to December 31, 2020. This facility serves as an outside warehouse facility.
The Overland Park, KS lease, for approximately 600 square feet, runs from October 16, 2015 to October 15, 2018. This facility serves primarily as a sales office.
The Aberdeen Corners, GA lease, for an office suite, runs from June 1, 2015 to May 31, 2017. This facility primarily serves as a sales office.
ITEM 3 - LEGAL PROCEEDINGS
We are from time to time involved in litigation incidental to our business. We are not currently involved in any litigation in which we believe an adverse outcome would have a material effect on our business, financial condition, results of operations, or prospects.
ITEM 4 – MINE SAFETY DISCLOSURES
Not Applicable
PART II
ITEM 5 - MARKET FOR REGISTRANT’S COMMON EQUITY, RELATED STOCKHOLDER MATTERS AND ISSUER PURCHASE OF EQUITY SECURITIES
Market
Our Common Shares have been traded since September 1993 on The NASDAQ Stock Market, Inc. The tradingInc, where it trades under the symbol is FTEK.
Prices
The table below sets forth the high and low sales prices during each calendar quarter since January 2013.2015.
| 2016 | High | Low | ||||||
| Fourth Quarter | $ | 1.51 | $ | 1.13 | ||||
| Third Quarter | 1.80 | 1.31 | ||||||
| Second Quarter | 1.86 | 1.41 | ||||||
| First Quarter | 2.05 | 1.50 | ||||||
| 2014 | High | Low | ||||||||||||||
| 2015 | High | Low | ||||||||||||||
| Fourth Quarter | $ | 4.45 | $ | 3.61 | $ | 2.54 | $ | 1.77 | ||||||||
| Third Quarter | 5.68 | 4.10 | 2.42 | 1.76 | ||||||||||||
| Second Quarter | 6.77 | 4.96 | 3.16 | 2.18 | ||||||||||||
| First Quarter | 8.50 | 4.90 | 3.86 | 3.00 | ||||||||||||
| 2013 | High | Low | ||||||
| Fourth Quarter | $ | 9.63 | $ | 4.19 | ||||
| Third Quarter | 4.78 | 3.63 | ||||||
| Second Quarter | 4.42 | 3.55 | ||||||
| First Quarter | 5.20 | 4.00 | ||||||
Dividends
We have never paid cash dividends on the Common Shares and have no current plan to do so in the foreseeable future. The declaration and payment of dividends on the Common Shares are subject to the discretion of our Board of Directors. The decision of the Board of Directors to pay future dividends will depend on general business conditions, the effect of a dividend payment on our financial condition, and other factors the Board of Directors may consider relevant. The current policy of the Board of Directors is to reinvest earnings in operations to promote future growth.
| Period | Total Number of Shares Purchased | Average Price Paid Per Share | Total Cost | Maximum Dollar Value of Shares That May Yet Be Purchased Under the Program | |||||||||||
| Phase One Program | |||||||||||||||
| August 25, 2011 through September 30, 2011 | 571,554 | $ | 5.89 | $ | 3,367 | $ | 2,633 | ||||||||
| October 1, 2011 through December 31, 2011 | 130,160 | 5.71 | 744 | 1,889 | |||||||||||
| January 1, 2012 through March 31, 2012 | 334,636 | 5.64 | 1,889 | — | |||||||||||
| Phase Two Program | |||||||||||||||
| April 1, 2012 through June 30, 2012 | 1,124,797 | 4.70 | 5,290 | 710 | |||||||||||
| July 1, 2012 through September 30, 2012 | 145,443 | 4.88 | 710 | — | |||||||||||
| Total | 2,306,590 | $ | 5.20 | $ | 12,000 | $ | — | ||||||||
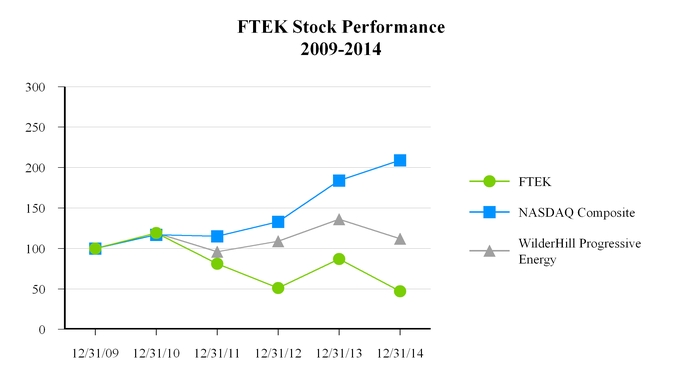
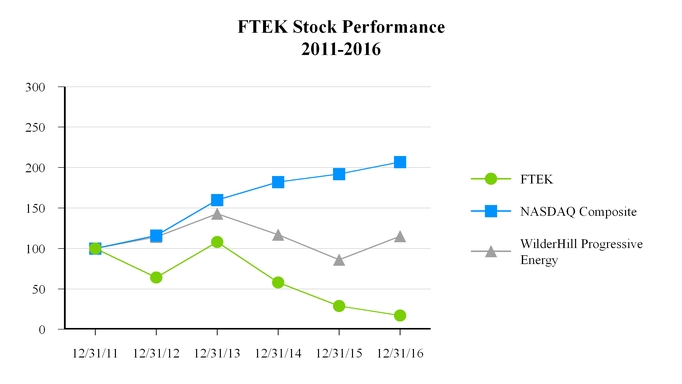
Performance Graph
The following line graph compares our total return to stockholders per common share for the five years ended December 31, 20142016 to that of the NASDAQ Composite Index and the WilderHill Progressive Energy Index for the period December 31, 20092011 through December 31, 2014.2016.
ITEM 6 - SELECTED FINANCIAL DATA
Selected financial data are presented below as of the end of and for each of the fiscal years in the five-year period ended December 31, 2014.2016. The selected financial data should be read in conjunction with the audited consolidated financial statements as of and for the year ended December 31, 2014,2016, and “Management’s Discussion and Analysis of Financial Condition and Results of Operations” included elsewhere in this report and the schedules thereto.
| For the years ended December 31 | For the years ended December 31 | |||||||||||||||||||||||||||||||||||||||
| CONSOLIDATED STATEMENT of OPERATIONS DATA | 2014 | 2013 | 2012 | 2011 | 2010 | |||||||||||||||||||||||||||||||||||
| CONSOLIDATED STATEMENT OF OPERATIONS DATA | 2016 | 2015 | 2014 | 2013 | 2012 | |||||||||||||||||||||||||||||||||||
| (in thousands of dollars, except for share and per-share data) | ||||||||||||||||||||||||||||||||||||||||
| Revenues | $ | 79,017 | $ | 109,338 | $ | 97,644 | $ | 93,668 | $ | 81,795 | $ | 55,161 | $ | 73,664 | $ | 79,017 | $ | 109,338 | $ | 97,644 | ||||||||||||||||||||
| Cost of sales | 43,889 | 62,521 | 56,899 | 49,857 | 46,821 | 36,367 | 45,107 | 43,889 | 62,521 | 56,899 | ||||||||||||||||||||||||||||||
| Selling, general and administrative and other costs and expenses | 36,891 | 36,375 | 35,545 | 34,162 | 31,037 | |||||||||||||||||||||||||||||||||||
| Goodwill impairment | 23,400 | — | — | — | — | |||||||||||||||||||||||||||||||||||
| Selling, general and administrative | 25,564 | 30,897 | 35,432 | 36,375 | 32,682 | |||||||||||||||||||||||||||||||||||
| Restructuring charge | 1,428 | 219 | — | — | — | |||||||||||||||||||||||||||||||||||
| Research and development | 4,552 | 4,273 | 1,459 | 2,442 | 2,863 | |||||||||||||||||||||||||||||||||||
| Goodwill and intangible assets impairment | 2,074 | 1,425 | 23,400 | — | — | |||||||||||||||||||||||||||||||||||
| Operating (loss) income | (25,163 | ) | 8,000 | 5,200 | 9,649 | 3,937 | (14,824 | ) | (8,257 | ) | (25,163 | ) | 8,000 | 5,200 | ||||||||||||||||||||||||||
| Net (loss) income | (17,725 | ) | 5,101 | 2,776 | 6,148 | 1,753 | (17,388 | ) | (12,380 | ) | (17,725 | ) | 5,101 | 2,776 | ||||||||||||||||||||||||||
| Basic (loss) income per common share | $ | (0.78 | ) | $ | 0.23 | $ | 0.12 | $ | 0.26 | $ | 0.07 | $ | (0.74 | ) | $ | (0.54 | ) | $ | (0.78 | ) | $ | 0.23 | $ | 0.12 | ||||||||||||||||
| Diluted (loss) income per common share | $ | (0.78 | ) | $ | 0.23 | $ | 0.12 | $ | 0.25 | $ | 0.07 | $ | (0.74 | ) | $ | (0.54 | ) | $ | (0.78 | ) | $ | 0.23 | $ | 0.12 | ||||||||||||||||
| Weighted-average basic shares outstanding | 22,782,000 | 22,286,000 | 22,709,000 | 24,095,000 | 24,213,000 | 23,365,000 | 23,101,000 | 22,782,000 | 22,286,000 | 22,709,000 | ||||||||||||||||||||||||||||||
| Weighted-average diluted shares outstanding | 22,782,000 | 22,579,000 | 23,535,000 | 24,633,000 | 24,405,000 | 23,365,000 | 23,101,000 | 22,782,000 | 22,579,000 | 23,535,000 | ||||||||||||||||||||||||||||||
| December 31 | December 31 | |||||||||||||||||||||||||||||||||||||||
| CONSOLIDATED BALANCE SHEET DATA | 2014 | 2013 | 2012 | 2011 | 2010 | 2016 | 2015 | 2014 | 2013 | 2012 | ||||||||||||||||||||||||||||||
| (in thousands of dollars) | ||||||||||||||||||||||||||||||||||||||||
| Working capital | $ | 39,688 | $ | 48,619 | $ | 38,918 | $ | 43,626 | $ | 36,645 | $ | 26,585 | $ | 35,865 | $ | 39,688 | $ | 48,619 | $ | 38,918 | ||||||||||||||||||||
| Total assets | 91,471 | 110,058 | 105,897 | 112,990 | 103,203 | 57,788 | 76,011 | 91,471 | 110,058 | 105,897 | ||||||||||||||||||||||||||||||
| Long-term obligations | 520 | 789 | 715 | 1,347 | 1,482 | 346 | 501 | 520 | 789 | 715 | ||||||||||||||||||||||||||||||
| Total liabilities | 19,170 | 21,435 | 21,661 | 23,977 | 19,293 | 14,396 | 17,037 | 19,170 | 21,435 | 21,661 | ||||||||||||||||||||||||||||||
| Stockholders’ equity (1) | 72,301 | 88,623 | 84,236 | 89,013 | 83,910 | 43,392 | 58,974 | 72,301 | 88,623 | 84,236 | ||||||||||||||||||||||||||||||
Notes:
| (1) | Stockholders’ equity includes the principal amount of nil coupon non-redeemable perpetual loan notes. See Note 7 to the consolidated financial statements. |
ITEM 7 - MANAGEMENT’S DISCUSSION AND ANALYSIS OF FINANCIAL CONDITION AND RESULTS OF OPERATIONS (amounts in thousands of dollars)
Background
We have twothree broad technology segments that provide advanced engineered solutions to meet the pollution control, efficiency improvement and operational optimization needs of energy-related facilities worldwide. They are as follows:
Air Pollution Control Technologies
The Air Pollution Control technology segment includes technologies to reduce NOx emissions in flue gas from boilers, incinerators, furnaces and other stationary combustion sources. These include Low and Ultra Low NOx Burners (LNB and ULNB), OFA systems, NOxOUT and HERT SNCR systems, and ASCR systems. The ASCR system includes ULNB, OFA, and SNCR components, along with a downsized SCR catalyst, AIG, and GSG systems to provide high NOx reductions at significantly lower capital and operating costs than conventional SCR systems. The NOxOUT CASCADE and NOxOUT-SCR processes are basic types of ASCR systems, using just SNCR and SCR catalyst components. ULTRA technology creates ammonia at a plant site using safe urea for use with any SCR application. Our ESP products and services include complete turnkey ESP retrofits and related services. Flue Gas Conditioning systems are chemical injection systems offered in markets outside the U.S. and Canada to enhance electrostatic precipitator and fabric filter performance in controlling particulate emissions. We distribute our products through our direct sales force and third-party sales agents.
FUEL CHEM Technologies
The FUEL CHEM technology segment, which uses chemical processes in combination with advanced CFD and CKM boiler modeling, for the control of slagging, fouling, corrosion, opacity and other sulfur trioxide-related issues in furnaces and boilers through the addition of chemicals into the furnace using TIFI Targeted In-Furnace Injection technology. Fuel Tech sells its FUEL CHEM program through its direct sales force and agents to industrial and utility power-generation facilities. FUEL CHEM programs have been installed on combustion units in North America, Europe, China, and India, treating a wide variety of solid and liquid fuels, including coal, heavy oil, biomass and municipal waste. The FUEL CHEM program improves the efficiency, reliability and environmental status of plants operating in the electric utility, industrial, pulp and paper, waste-to-energy, university and district heating markets and offers numerous operational, financial and environmental benefits to owners of boilers, furnaces and other combustion units.
The key market dynamic for both technology segments is the continued use of fossil fuels, especially coal, as the principal fuel source for global electricity production. Coal currently accounts for approximately 37%33% of all U.S. electricity generation and roughly 80%74% of Chinese electricity generation. Major coal consumers include China, the United States and India.
Fuel Conversion
The Fuel Conversion business represents a new business initiative we commenced in 2014. As described in Note 1 to the consolidated financial statements included in this Form 10-K, we acquired intellectual property rights and know-how related to the CARBONITE® fuel conversion process and technology. This process can convert coals of various grades into value-added products that are high in energy content, carbon-rich and contain less pollutants. Our Fuel Conversion technology has a number of potential applications including certain coal replacement, electric arc furnace reductant, ferro-alloy feedstock, and mercury reduced carbon feedstock. During 2015 and 2016, we have been testing and developing the engineered carbon products for specific markets. We are in the process of evaluating the commercialization of these product offerings with prospective customers and considering alternatives. Refer to Item 1A. RISK FACTORS for further detail regarding the risk factors associated with this segment. We have not yet earned revenue from prospective customers.
Critical Accounting Policies and Estimates
The consolidated financial statements are prepared in accordance with accounting principles generally accepted in the United States of America, which require us to make estimates and assumptions. We believe that of our accounting policies (see Note 1 to the consolidated financial statements), the following involve a higher degree of judgment and complexity and are deemed critical. We routinely discuss our critical accounting policies with the Audit Committee of the Board of Directors.
Revenue Recognition
Revenues from the sales of chemical products are recorded when title transfers, either at the point of shipment or at the point of destination, depending on the contract with the customer.
We use the percentage of completion method of accounting for equipment construction, equipment supply and license contracts that are sold within the Air Pollution Control technology segment. Under the percentage of completion method, revenues are recognized as work is performed based on the relationship between actual construction costs incurred and total estimated costs at completion. Construction costs include all direct costs such as materials, labor, and subcontracting costs, and indirect costs allocable to the particular contract such as indirect labor, tools and equipment, and supplies. Revisions in completion estimates and contract values are made in the period in which the facts giving rise to the revisions become known and can influence the timing of when revenues are recognized under the percentage of completion method of accounting. Such revisions have historically not had a material effect on the amount of revenue recognized. Provisions are made for estimated losses on uncompleted contracts in the period in which such losses are determined. As of December 31, 2014,2016, we had one construction contract in progress that was identified as loss contracts and a provision for losses in the amount of $4 was recorded in other accrued liabilities on the consolidated balance sheets. As of December 31, 2013, we had threetwo construction contracts in progress that were identified as loss contracts and a provision for losses in the amount of $68$41 was recorded in other accrued liabilities on the consolidated balance sheets.
Typically, our APC contracts are eight to sixteen months in length. A typical contract will have three or four critical operational measurements that, when achieved, serve as the basis for us to invoice the customer via progress billings. At a minimum, these measurements will include the generation of engineering drawings, the shipment of equipment and the completion of a system performance test.
As part of most of our contractual APC project agreements, we contractually commit to customer-specific acceptance criteria that relate to the operational performance of the system that is being sold. These criteria are determined based on mathematical modeling that is performed by our personnel, which is in turn based on operational inputs that are provided by the customer. Our customer is solely responsible for the accuracy of the operating condition information; all performance guarantees and equipment warranties granted by us are void if the operating condition information is inaccurate or is not met.
Accounts receivable includes unbilled receivables, representing revenues recognized in excess of billings on uncompleted contracts under the percentage of completion method of accounting. At December 31, 20142016 and December 31, 2013,2015, unbilled receivables were approximately $9,904$6,755 and $12,599,$7,312, respectively, and are included in accounts receivable on the consolidated balance sheet. Billings in excess of costs and estimated earnings on uncompleted contracts were $2,994$1,730 and $1,206$1,858 at December 31, 20142016 and December 31, 2013,2015, respectively, and are included in other accrued liabilities on the consolidated balance sheet.
We have installed over 10001,000 units with APC technology and normally provide performance guarantees to our customers based on the operating conditions for the project. As part of the project implementation process, we perform system start-up and optimization services that effectively serve as a test of actual project performance. We believe that this test, combined with the accuracy of the modeling that is performed, enables revenue to be recognized prior to the receipt of formal customer acceptance.
Allowance for Doubtful Accounts
The allowance for doubtful accounts is management’s best estimate of the amount of credit losses in accounts receivable. In order to control and monitor the credit risk associated with our customer base, we review the credit worthiness of customers on a recurring basis. Factors influencing the level of scrutiny include the level of business the customer has with us, the customer’s payment history and the customer’s financial stability. Receivables are considered past due if payment is not received by the date agreed upon with the customer, which is normally 30 days. Representatives of our management team review all past due accounts on a weekly basis to assess collectability. At the end of each reporting period, the allowance for doubtful accounts balance is reviewed relative to management’s collectability assessment and is adjusted if deemed necessary through a corresponding charge or credit to bad debts expense, which is included in selling, general, and administrative expenses in the consolidated statements of operations. Bad debt write-offs are made when management believes it is probable a receivable will not be recovered.
Inventories
Inventories consist primarily of spare parts and are stated at the lower of cost or market using the first-in, first-out method. Usage is recorded in cost of sales in the period that parts were issued to a project or used to service equipment. Inventories are periodically evaluated to identify obsolete or otherwise impaired parts and are written off when management determines usage is not probable. On December 31, 2016, the Company established an excess and obsolete inventory reserve of $825 of which $175 is included in inventories and $650 is included in other assetson the consolidated balance sheet. The Company estimates the balance of excess and obsolete inventory by analyzing inventory by age using last used and original purchase date and existing sales pipeline for which the inventory could be used.
Assessment of Potential Impairments of Goodwill and Intangible Assets
Goodwill and indefinite-lived intangible assets areis not amortized, but rather areis reviewed annually (in the fourth quarter) or more frequently if indicators arise, for impairment. We do not have any indefinite-lived intangible assets other than goodwill. Such indicators include a decline in expected cash flows, a significant adverse change in legal factors or in the business climate, unanticipated competition, a decrease in our market capitalization to an amount less than the carrying value of our assets, or slower growth rates, among others.
Goodwill is allocated among and evaluated for impairment at the reporting unit level, which is defined as an operating segment or one level below an operating segment. We have twothree reporting units: the FUEL CHEM segment, and the APC technology segment and the Fuel Conversion segment.
Our evaluation of goodwill impairment involves first assessing qualitative factors to determine whether it is more likely than not that the fair value of a reporting unit is less than its carrying amount. We may bypass this qualitative assessment, or determine that based on our qualitative assessment considering the totality of events and circumstances including macroeconomic factors, industry and market considerations, current and projected financial performance, a sustained decrease in our share price, or other factors, that additional impairment analysis is necessary. This additional analysis involves comparing the current fair value of a reporting unit to its carrying value. Fuel Tech uses a discounted cash flow (DCF) model to determine the current fair value of its two reporting units as this methodology was deemed to best quantify the present values of our expected future cash flows and yield a fair value that should be in line with the aggregate market value placed on the outstanding number of Common Shares as reflected by the current stock price multiplied by the outstanding common shares. A number of significant assumptions and estimates are involved in the application of the DCF model to forecast operating cash flows, including markets and market share, sales volumes and prices, costs to produce and working capital changes. Events outside our control, specifically market conditions that impact revenue growth assumptions, could significantly impact the fair value calculated. Management considers historical experience and all available information at the time the fair values of its reporting units are estimated. However, actual fair values that could be realized in an actual transaction may differ from those used to evaluate the impairment of goodwill.
The application of our DCF model in estimating the fair value of each reporting segment is based on the ‘income’ approach to business valuation. In using this approach for each reportable segment, we forecast segment revenues and expenses out to perpetuity and then discount the resulting cash flows to their present value using an appropriate discount rate. The forecast considers, among other items, the current and expected business environment, expected changes in the fixed and variable cost structure as the business grows, and a revenue growth rate that we feel is both achievable and sustainable. The discount rate used is composed of a number of identifiable risk factors, including equity risk, company size, and certain company specific risk factors such as our debt-to-equity ratio, among other factors, that when added together, results in a total return that a prudent investor would demand for an investment in our company.
In the event the estimated fair value of a reporting unit per the DCF model is less than the carrying value, additional analysis would be required. The additional analysis would compare the carrying amount of the reporting unit’s goodwill with the implied fair value of that goodwill. The implied fair value of goodwill is the excess of the fair value of the reporting unit over the fair values assigned to all of the assets and liabilities of that unit as if the reporting unit was acquired in a business combination and the fair value of the reporting unit represented the purchase price. If the carrying value of goodwill exceeds its implied fair value, an impairment loss equal to such excess would be recognized.
Fuel Tech performed its annual goodwill impairment analysis for each of its reporting units as of October 1, 20142016 and determined that no impairment of goodwill existed within the FUEL CHEM technology segment. It determined that itsGoodwill related to APC technology reporting unit was fully impaired in the fourth quarter of 2014. APC technology segment failed the first step test because the estimated fair value of the reporting unit was less than its carrying value, a result significantly affected by Fuel Tech's market capitalization, and thus requiring additional analysis of the segment. Based on this additional analysis, Fuel Tech determined that the current fair value of the APC technology reporting unit was less than the fair value of the assets and liabilities of the unit, resulting in an implied fair value of goodwill of zero, and accordingly recorded a non-cash goodwill impairment charge of $23.4 million related to this segment.
The APC segment encompasses the integrated operations of the Company's acquisitions of Advanced Combustion Technology, Inc. (ACT) in 2009 and PECO in 2014. While goodwill impairment is tested for the segment as a whole, the changes in estimates that led to the goodwill impairment charge were most significantly related to the ACT acquisition. The impairment primarily resulted from the lower estimates of revenues and margins in the segment in the assessment forecast period. These lower estimates derive from (1) lower natural gas prices that allow utility operators to switch to natural gas from coal and increase the amount of power generated from natural gas plants, (2) slower sales and smaller margins in the China market and (3) continued delays in investment in environmental remediation, particularly with respect to NOx technologies due to the regulatory environment.
Impairment of Long-Lived Assets and Amortizable Intangible Assets
Long-lived assets, including property, plant and equipment (PP&E) and intangible assets, are reviewed for impairment when events and circumstances indicate that the carrying amount of the assets (or asset group) may not be recoverable. If impairment indicators exist, we perform a more detailed analysis and an impairment loss is recognized when estimated future undiscounted cash flows expected to result from the use of the asset (or asset group) and its eventual disposition are less than the carrying amount. This process of analyzing impairment involves examining the operating condition of individual assets (or asset group) and estimating a fair value based upon current condition, relevant market factors and remaining estimated operational life compared to the asset’s remaining depreciable life. Quoted market prices and other valuation techniques are used to determine expected cash flows. Due to the existence of impairment indicators as more fully described in Note 1 to our consolidated financial statements, we performed a more detailed analysis of potential long-lived and intangible asset impairment in the APC technology asset group during the fourth quarter of 20142016 using the aforementioned undiscounted cash flows analysisanalysis.
In the fourth quarter of 2016, the Company performed an impairment test of the carrying value of our intangible assets to determine whether any impairment existed. The Company determined that the sum of the expected undiscounted cash flows attributable to certain intangible assets was less than its carrying value and concluded that noan impairment write-down was required. The impairment loss primarily related to the developed technology, customer relationships and trademarks acquired in the 2014 acquisition of thesePECO and FGC. The Company calculated the estimated fair value of the intangible asset by summing the present value of the expected cash flows over its life. The impairment was calculated by deducting the present value of the expected cash flows from the carrying value. This assessment resulted in an impairment charge of $2,074, which was included in “Goodwill and intangible assets exists. impairment” line in the accompanying Consolidated Statements of Operations for the year ended December 31, 2016.
In the fourth quarter of 2015, the Company performed an impairment test of the carrying value of our intangible assets to determine whether any impairment existed. The Company determined that the sum of the expected undiscounted cash flows attributable to certain intangible assets was less than its carrying value and that an impairment write-down was required. The impairment loss primarily related to the customer lists acquired in the 2009 acquisition of Advanced Combustion Technology and the 2014 acquisition of PECO. The Company calculated the estimated fair value of the intangible asset by summing the present value of the expected cash flows over its life. The impairment was calculated by deducting the present value of the expected cash flows from the carrying value. This assessment resulted in an impairment write-down of $1,425, which was included in “Goodwill and intangible assets impairment” line in the accompanying Consolidated Statements of Operations for the year ended December 31, 2015.
A significant portion of our property and equipment is comprised of assets deployed at customer locations relating to our FUEL CHEM technology asset group, and due to the shorter-term duration over which this equipment is depreciated, the likelihood of impairment is mitigated. The discontinuation of a FUEL CHEM program at a customer site would most likely result in the re-deployment of all or most of the affected assets to another customer location rather than an impairment.
Valuation Allowance for Deferred Income Taxes
Deferred tax assets represent deductible temporary differences and net operating loss and tax credit carryforwards. A valuation allowance is recognized if it is more likely than not that some portion of the deferred tax asset will not be realized. At the end of each reporting period, management reviews the realizability of the deferred tax assets. As part of this review, we consider if there are taxable temporary differences that could generate taxable income in the future, if there is the ability to carry back the net operating losses or credits, if there is a projection of future taxable income, and if there are any tax planning strategies that can be readily implemented.
Stock-Based Compensation
We recognize compensation expense for employee equity awards ratably over the requisite service period of the award, adjusted for estimated forfeitures.
We utilize the Black-Scholes option-pricing model to estimate the fair value of stock option awards. Determining the fair value of stock options using the Black-Scholes model requires judgment, including estimates for (1) risk-free interest rate - an estimate based on the yield of zero-coupon treasury securities with a maturity equal to the expected life of the option; (2) expected volatility - an estimate based on the historical volatility of our Common Shares for a period equal to the expected life of the option; and (3) expected life of the option - an estimate based on historical experience including the effect of employee terminations.
In addition, we utilize a Monte Carlo valuation pricing model to determine the fair value of certain restricted stock units (RSUs) that contain market conditions. Determining the fair value of these RSUs requires judgment and involves simulating potential future stock prices based on estimates for the risk-free interest rate, stock volatility, and correlations between our stock price and the stock prices of a peer group of companies.
If any of these assumptions differ significantly from actual results, stock-based compensation expense could be impacted.
Recently Adopted Accounting Standards
Recently Issued Accounting StandardsPronouncements
In May 2014, the FASBFinancial Accounting Standards Board (FASB) issued changesASU 2014-09 "Revenue from Contracts with Customers" (Topic 606). This new accounting guidance on revenue recognition provides for a single five-step model to the recognition ofbe applied to all revenue from contracts with customers. These changes createdThe new standard also requires additional financial statement disclosures that will enable users to understand the nature, amount, timing and uncertainty of revenue and cash flows relating to customer contracts. In August 2015, the FASB approved a comprehensive framework for all entities in all industriesone-year deferral to applyJanuary 1, 2018. Early adoption is permitted as of the original effective date. The standard may be applied retrospectively to each prior period presented or retrospectively with the cumulative effect recognized as of the date of adoption. The Company is in the determinationinitial stages of when to recognize revenue, and, therefore, supersede virtually all existing revenue recognition requirements and guidance. This framework is expected to result in less complex guidance in application while providing a consistent and comparable methodology for revenue recognition. The core principleevaluating the impact of the new standard on the accounting policies, processes, and system requirements. While the Company continues to assess the potential impacts of the new standard and anticipate this standard could have a material impact on the consolidated financial statements, the Company does not know or cannot reasonably estimate quantitative information related to the impact of the new standard on the financial statements at this time.
In July 2015, the FASB issued ASU 2015-11, Inventory (Topic 330): Simplifying the Measurement of Inventory. This new accounting guidance is thatmore clearly articulates the requirements for the measurement and disclosure of inventory. Topic 330, Inventory, currently requires an entity should recognize revenue to depictmeasure inventory at the transferlower of promised goodscost or services to customers inmarket. Market could be replacement cost, net realizable value, or net realizable value less an amount that reflectsapproximately normal profit margin. This new accounting guidance requires the consideration to which the entity expects tomeasurement of inventory at lower of cost and net realizable value. ASU 2015-11 will be entitled in exchange for those goods or services. To achieve this principle, an entity should apply the following steps: (i) identify the contract(s) with a customer, (ii) identify the performance obligations in the contract(s), (iii) determine the transaction price, (iv) allocate the transaction price to the performance obligations in the contract(s), and (v) recognize revenue when, or as, the entity satisfies a performance obligation. These changes become effective for Fuel Techthe Company beginning on January 1, 2017. Management is currently evaluating the potentialThe adoption of this guidance in not expected to have a material impact of these changes on the Consolidated Financial Statements.Company’s consolidated financial statements.
In August 2014,February 2016, the FASB issued changesASU 2016-02, Leases (Topic 842). The amendments in this Update increase transparency and comparability among organizations by recognizing lease assets and lease liabilities on the balance sheet and disclosing key information about leasing arrangements. ASU 2016-02 will be effective for the Company beginning on January 1, 2019. The Company is in the initial stages of evaluating the impact of the new standard on the accounting policies, processes, and system requirements. While the Company continues to assess the potential impacts of the new standard and anticipate this standard could have a material impact on the consolidated financial statements, the Company does not know or cannot reasonably estimate quantitative information related to the disclosureimpact of uncertainties aboutthe new standard on the financial statements at this time.
In March 2016, the FASB issued ASU 2016-09, Compensation - Stock Compensation (Topic 718): Improvements to Employee Share-Based Payment Accounting. The amendments in this Update simplify the income tax effects, minimum statutory tax withholding requirements and impact of forfeitures related to how share-based payments are accounted for and presented in the financial statements. ASU 2016-09 will be effective for the Company beginning on January 1, 2017. The Company is in the initial stages of evaluating the impact of the new standard on the accounting policies, processes, and system requirements. While the Company continues to assess the potential impacts of the new standard and anticipate this standard could have a material impact on the consolidated financial statements, the Company does not know or cannot reasonably estimate quantitative information related to the impact of the new standard on the financial statements at this time.
In November 2016, the FASB issued ASU 2016-18, Statement of Cash Flows (Topic 230): Restricted Cash (a consensus of the FASB Emerging Issues Task Force). The amendments in this Update require that a statement of cash flows explain the change during the period in the total of cash, cash equivalents, and amounts generally described as restricted cash or restricted cash equivalents. ASU 2016-18 will be effective for the Company beginning on January 1, 2018. The Company is in the initial stages of evaluating the impact of the new standard on the accounting policies, processes, and system requirements. While the Company continues to assess the potential impacts of the new standard and anticipate this standard could have a material impact on the consolidated financial statements, the Company does not know or cannot reasonably estimate quantitative information related to the impact of the new standard on the financial statements at this time.
In January 2017, the FASB issued ASU 2017-04, Intangibles-Goodwill and Other (Topic 350): Simplifying the Test for Goodwill Impairment. The amendments in this Update simplify how an entity’s abilityentity is required to continue astest goodwill for impairment by eliminating Step 2 from the goodwill impairment test. Step 2 measures a going concern. Under GAAP, continuationgoodwill impairment loss by comparing the implied fair value of a reporting entity as a going concernunit’s goodwill with the carrying amount of that goodwill. ASU 2017-04 will be effective for the Company beginning on January 1, 2020. The Company is presumed as the basis for preparing financial statements unless and until the entity’s liquidation becomes imminent. Even if an entity’s liquidation is not imminent, there may be conditions or events that raise substantial doubt about the entity’s ability to continue as a going concern. Because there is no guidance in GAAP about management’s responsibility to evaluate whether there is substantial doubt about an entity’s ability to continue as a going concern or to provide related note disclosures, there is diversity in practice whether, when, and how an entity discloses the relevant conditions and events in its financial statements. As a result, these changes require an entity’s management to evaluate whether there are conditions or events, considered in the aggregate, that raise substantial doubt aboutinitial stages of evaluating the entity’s ability to continue as a going concern within one year after the date that financial statements are issued. Substantial doubt is defined as an indication that it is probable that an entity will be unable to meet its obligations as they become due within one year after the date that financial statements are issued. If management has concluded that substantial doubt exists, then the following disclosures should be made in the financial statements: (i) principal conditions or events that raised the substantial doubt, (ii) management’s evaluationimpact of the significancenew standard on the accounting policies, processes, and system requirements. While the Company continues to assess the potential impacts of those conditions or events in relation to the entity’s ability to meet its obligations, (iii) management’s plans that alleviated the initial substantial doubt or, if substantial doubt was not alleviated, management’s plans that are intended to at least mitigate the conditions or events that raise substantial doubt,new standard and (iv) if the latter in (iii) is disclosed, an explicit statement that there is substantial doubt about the entity’s ability to continue asanticipate this standard could have a going concern. These changes become effective for Fuel Tech for the 2016 annual period. Management has determined that the adoption of these changes will not have anmaterial impact on the Consolidated Financial Statements. Subsequentconsolidated financial statements, the Company does not know or cannot reasonably estimate quantitative information related to adoption, this guidance will need to be applied by management at the endimpact of each annual period and interim period therein to determine what, if any, impact there will bethe new standard on the Consolidated Financial Statements in a given reporting period.financial statements at this time.
Revenues for the years ended December 31, 20142016 and 20132015 were $79,017$55,161 and $109,338,$73,664, respectively. The year-over-year decrease of $30,321,$18,503, or 28%25%, was principally driven by decreased revenue in ourboth APC and FUEL CHEM technology segmentsegments in both our United States (U.S.) and foreign operations, while our FUEL CHEM technology segment revenue remained unchanged.operations. Our U.S. revenues declined $12,374decreased by $8,940 or 20%17% from $63,275$51,485 to $50,901, while$42,545, and our Internationalinternational revenues declined $17,947by $9,563 or 39%43% from $46,063$22,179 to $28,116.$12,616.
Revenues for the APC technology segment were $42,031$34,052 for the year ended December 31, 2014,2016, a decrease of $30,521,$9,433, or 42%22%, versus fiscal 2013.2015. Revenues in our APC technology segment, which had been growing into 2013 largely through international sales, were adversely affected by a number of factors in 2014.2016. First, the U.S. regulatory environment, while remaining favorable for our prospects, has not spurred capital investment in our products by electric power producers. Second, while general economic conditions in the U.S. have improved, energy demand for coal fired power plants has declined as utilities have switched to lower cost natural gas sources. At the same time, these sources have generally allowed utilities to meet their regulatory objectives with existing emissions investments. Sales in foreign locations have not been robust enough to offset reduced demand in the U.S., as foreign sales have also declined due largely to the completion of a large contract in Chile which yielded a year-over-year decline of $10 million in revenue. During 2014 we completed two U.S. based acquisitions of new technology for particulate control which contributed $4.2 million of revenue and offset declines in our legacy technology offerings. While we do expect to see improved order flow in our U.S. APC segment in 2015,2017, any future orders will be dependent on our customer’scustomers' capital investment decisions to install emissions control technologies in order to meet state or federal regulations. We continue to actively bid projects in our foreign markets during 20152017 and will continue to look for growth opportunities within our chosen markets. Backlog for the years ended December 31, 20142016 and 20132015 was $18.0$8.0 million and $22.4$22.2 million, respectively.
Revenues for the FUEL CHEM technology segment for the year ended December 31, 20142016 were $36,986, an increase$21,109, a decrease of $200,$9,070, or 1%30% versus fiscal 2013. Our2015. This decrease is principally associated with reduced product demand from some of our largest Fuel Chem customers. These customers' decision to reduce spending was based on a number of factors including cost of coal fire powered generation, energy demand and overall economic conditions affecting the plant. We remain focused on attracting new customers in our FUEL CHEM technologybusiness, for both coal and non-coal applications, but our ability to attract new coal customers continues to be affected by the soft electric demand market and fuel switching as a result of low natural gas prices, which have led to unscheduled outages and coal consumption units operating at less than full capacity.prices.
Consolidated cost of sales for the years ended December 31, 20142016 and 20132015 were $43,889$36,367 and $62,521,$45,107, respectively. Consolidated gross margin percentage for the years ended December 31, 20142016 and 20132015 were 44%34% and 43%39%, respectively. The gross margins for the APC technology segment decreased slightly to 37%25% in 20142016 from 38%30% in 2013.2015. Gross margin for the APC technology segment included charges totaling $0.8 million consisting of a subcontractor dispute of $0.6 million and a non-cash excess and obsolete inventory reserve of $0.2 million; exclusive of these charges, gross margin would have been $9.5 million, or 28%. Gross margin percentage for the FUEL CHEM technology segment remained flat at 53%decreased slightly in 20142016 to 48% from 52% in 2015. Gross margin for the FUEL CHEM technology segment included the impact of the above-referenced non-cash excess and 2013.obsolete inventory reserve of $0.6 million; excluding this impact, gross margin would have been $10.7 million or 51%.
Selling, general and administrative (SG&A) expenses for the years ended December 31, 20142016 and 20132015 were $35,432$25,564 and $36,375,$31,116, respectively. The decrease of $943$5,333 or 3%17%, is primarily attributed to the following:
An increase in stock compensation expense of $524$208
A decrease in other administrative costs of $784
Restructuring costs were $1,428 and $219 in connection with the workforce reduction for the years ended December 31, 2016 and 2015. See Note 15, Restructuring Activities, for further discussion.
Research and development (“R&D”) expenses were $1,459$4,552 and $2,442$4,273 for the years ended December 31, 20142016 and 2013,2015, respectively. Included in our 2016 and 2015 R&D expense was $2,800 and $2,826 expense pertaining to the development of our Fuel Conversion business, while the remaining expenditures were focused on new product development for our APC and Fuel Chem businesses. We plan to continue focusing on increased R&D efforts in the pursuit of commercial applications for our technologies outside of our traditional markets, and in the development and analysis of new technologies that could represent incremental market opportunities.
Interest income for the year ended December 31, 2014 decreased2016 increased by $29$4 to $29$25 versus $58$21 in 2013.2015. Interest expense of $125$0 was recorded in 2014,2016, compared to $56$27 in the prior year. Finally, the increase in net other expenses to $544$925 from $137$360 in the prior year is due primarily to the impact of foreign exchange rates as it relates to settlement of balances denominated in foreign currencies, particularly in Chile.and certain other bank fees related to Letter of Credits.
For the year ended December 31, 2014,2016, we recorded an income tax benefitexpense of $8,078$1,664 on pre-tax loss of $25,803.$15,724. Our effective tax rates were 10.6% and 43.6% for the years ended December 31, 2016 and 2015, respectively. The effective tax rate of 31% was lower thanfor the year-ended December 31, 2016 differed from the federal statutory rate of 34% as a result of establishing a decrease related tofull valuation allowance on our China deferred tax assets and net operating losses generated in the non-deductible goodwill impairment chargeUnited States, which were offset by increasesestablishment of full valuation allowance. For the year ended December 31, 2015, we recorded an income tax expense of $3,757 on pre-tax loss of $8,623. Our income tax expense of $3,757 in 2015 resulted from state taxesthe establishment of a full valuation allowance for the United States deferred tax assets and lossesincome from our Italian subsidiary for which we were not able to recordreversed a portion of our deferred income tax benefitvaluation allowances as a result of the valuation allowance placed on that entity’s previously recorded net operating losses. For the year ended December 31, 2013, we recorded an income tax expense of $2,764 on pre-tax income of $7,865.
Revenues for the years ended December 31, 20132015 and 20122014 were $109,338$73,664 and $97,644,$79,017, respectively. The year-over-year increasedecrease of $11,694,$5,353, or 12%7%, was principally driven primarily by increaseddecreased revenue in our FUEL CHEM technology segment in both our United States (U.S.) and foreign operations, while our APC technology segment. Internationalsegment revenues for the years ended December 31, 2013 and 2012 were $46,063 and $27,219, respectively,increased marginally. Our U.S. revenues increased by $584 or 42% and 28% of consolidated revenues. The increase in1% from $50,901 to $51,485, while our foreigninternational revenues of $18,844,declined by $5,937 or 69%, is primarily attributable21% from $28,116 to continued growth in our China operations as well work progress on our large project in Chile.$22,179.
Revenues for the APC technology segment were $72,552$43,485 for the year ended December 31, 2013,2015, an increase of $10,111,$1,454, or 16%3%, versus fiscal 2012. This increase is predominantly attributed2014. Revenues in our APC technology segment, which had been growing into 2013 largely through international sales, were adversely affected by a number of factors in 2015. First, the U.S. regulatory environment, while remaining favorable for our prospects, has not spurred capital investment in our products by electric power producers. Second, while general economic conditions in the U.S. have improved, energy demand for coal fired power plants has declined as utilities have switched to increased orders for APC products primarilylower cost natural gas sources. At the same time, these sources have generally allowed utilities to meet their regulatory objectives with existing emissions investments. Sales in foreign markets andlocations have not been robust enough to offset reduced demand in the timing and recognitionU.S. Foreign sales declined year-over-year by approximately $6.0 million. This is due largely to the completion of workseveral large contracts in progress on those APC orders. We expect demand for our APC products to remain
Revenues for the FUEL CHEM technology segment for the year ended December 31, 20132015 were $36,786, an increase$30,179, a decrease of $1,583,$6,807, or 4% 18%versus fiscal 2012. The increase2014. This decrease is dueprincipally associated with reduced product demand from our largest Fuel Chem customer. This customer's decision to reduce spending was based on a higher levelnumber of shipping activity atfactors including cost of coal fire powered generation, energy demand and overall economic conditions affecting the plant. During 2015, our total revenue for this customer decreased from approximately $15 million in 2014 to $9 million in 2015 and we expect to see a few key existing customer accounts. However, the overallfurther decline in 2016. We remain focused on attracting new customers in our FUEL CHEM technology is stillbusiness, for both coal and non-coal applications, but our ability to attract new coal customers continues to be affected by the soft electric demand market and fuel switching as a result of low natural gas prices, which have led to unscheduled outages and coal consumption units operating at less than full capacity.prices.
During 2015 we recognized an impairment charge of $1.4 million for finite-lived APC segment intangible assets, and during 2014 we recognized an impairment charge of $23.4 million for our APC segment goodwill asset. A significant portion, $15.8 million, of our APC segment goodwill impairment recognized in 2014 and $1.1million of our APC segment intangible asset impairment recognized in 2015 related to the acquisition of Advanced Combustion Technology, Inc. (“ACT”) which was completed on January 1, 2009.
Selling, general and administrative expenses for the years ended December 31, 20132015 and 20122014 were $36,375$31,116 and $32,682,$35,432, respectively. The increasedecrease of $3,693$4,316 or 11%12%, is primarily attributed to the following:
An increasedecrease in employee costs, primarily commissions and bonuses, totaling $1,029
An decrease in non-employee commissions of costs associated with our international operations$215
An decrease in stock compensation expense of $1,345 due mainly to business expansion including increased personnel at our China and Chile subsidiaries$539
An increase in domestic salaries, wages, benefits, commissionsdepreciation and bonuses totaling $1,316 as a resultamortization of increased headcount as well as improved revenue and profits$140
An increasedecrease in professional fees and consulting services of $455
An decrease related to cleanup fees for a legacy facility of $325
An decrease in bad debt expense of $407$127
An increase in stock compensation expense of $492
Research and development (“R&D”) expenses were $2,442$4,273 and $2,863$1,459 for the years ended December 31, 20132015 and 2012,2014, respectively. Included in our 2015 and 2014 R&D expense was $2,826 and $277 expense pertaining to the development of our Fuel Conversion business, while the remaining expenditures were focused on new product development for our APC and Fuel Chem businesses. We plan to continue focusing on increased R&D efforts in the pursuit of commercial applications for our technologies outside of our traditional markets, and in the development and analysis of new technologies that could represent incremental market opportunities.
Interest income for the year ended December 31, 20132015 decreased by $20$8 to $58 versus $78$21versus $29 in 2012.2014. Interest expense of $56$27 was recorded in 2013,2015, compared to $93$125 in the prior year. Finally, the increasedecrease in net other expenses to $360 from $544 in the prior year is due primarily to the impact of foreign exchange rates as it relates to settlement of balances denominated in foreign currencies.currencies, particularly in Chile.
For the year ended December 31, 2013,2015, we recorded an income tax expense of $2,764$3,757 on pre-tax incomeloss of $7,865.$8,623. Our effective tax rates were 43.6% and (31.3%) for the years ended December 31, 2015 and 2014, respectively. The effective tax rate of 35% exceededfor the year-ended December 31, 2015 differed from the the federal statutory rate of 34% as a result of increases from state taxesestablishing a full valuation allowance on our United States deferred tax assets and lossesincome from our Italian subsidiary for which we were not able to recordreversed a portion of our deferred income tax benefitvaluation allowances as a result of the valuation allowance placed on that entity’s previously recorded net operating losses. These increases were offset by research credits for 2012 and 2013 that were both recorded for financial reporting purposes during 2013 and the effect of income tax rate differences between the U.S and our foreign subsidiaries. For the year endended December 31, 2012,2014, we recorded an income tax expensebenefit of $2,302$8,078 on pre-tax incomeloss of $5,078.$25,803.
Liquidity and Sources of Capital
At December 31, 2014,2016, we had cash and cash equivalents of $18,637$11,826 (excluding restricted cash of $6,020) and working capital of $39,688$26,585 versus cash and cash equivalents of $27,738$21,684 and working capital of $48,619$35,865 at December 31, 2013.2015.
Operating activities provided $5,435used $2,738 of cash for the year ended December 31, 2014,2016, primarily due to the add back of non-cash items from our net loss of $17,725$17,388 including a goodwill impairment charge of $23,400, stock compensation expense of $2,322,$1,991, depreciation and amortization of $4,306,$3,500, a decrease in deferred income taxes of $1,196, intangibles assets impairment charge of $2,074, excess and obsolete inventory reserve of $825, a reduction in bad debt expense of $762,$111, and a loss on sale of equipment of $60, as well as a decrease in our accounts receivable balance of $6,117$3,522, a decrease in inventory of $446, and a decrease in prepaid expenses and other current and non-current assets of $2,893, and an increase in our accrued liabilities and other non-current liabilities of $906.$699. Partially offsetting these items was subtraction of a non-cash item from our net loss related to a decrease in our accounts payable balance of $2,445.
Operating activities provided $6,928 of cash for the year ended December 31, 2015, primarily due to the add back of non-cash items from our net loss of $12,380 including stock compensation expense of $1,809, depreciation and amortization of $4,205, and a decrease in deferred income taxes of $4,916, as well as a decrease in our accounts receivable balance of $7,880 and an increase in our accounts payable balance of $1,817. Partially offsetting these items were subtractions of non-cash items from our net loss including deferred income taxes in the amountgain on sale of $9,524,equipment of $26, as well an decrease in our accounts payable balance of $3,600, an increase in inventory of $616, and$560, an increase in prepaid expenses and other current and non-current assets of $913.
Investing activities used cash of $13,897$938 and $1,754$776 for the years ended December 31, 20142016 and 2013,2015, respectively. Investment activities for the year ended December 31, 2016 consisted of purchases of equipment, patents, and other intangibles of $5,818$940 and $1,754 in each respectiveproceeds from sale of equipment of $2. Investment activities for the year to supportended December 31, 2015 consisted of purchases of equipment, patents, and grow our operations, including our $3,010 acquisitionother intangibles of intellectual property rights related to a fuel conversion business development initiative, as well as an investment to acquire two businesses located in Ohio in the amount$802 and proceeds from sale of $8,079, netequipment of cash acquired, during the current year.$26.
Financing activities provided $0used $6,192 of cash for the year ended December 31, 20142016 as a result of $6,020 increase in restricted cash, and $172 in cash used for the acquisition of common shares held in treasury that were withheld for taxes due by employees upon lapsing of restricted stock units. Financing activities used $1,875 of cash for the year ended December 31, 2015 which included proceeds and excess tax benefits from stock option exercisesa payment of our short-term debt in the amount of $304, offset by$1,623 and payments to repurchase our common stock in the amount of $304 for shares withheld to pay employee payroll taxes upon vesting of equity awards. Financing activities provided $2,045 of cash for the year ended December 31, 2013 as a result of cash received from China debt facility in the amount of $1,614 and proceeds and excess tax benefits from stock option exercises in the amount of $878, offset by payments to repurchase our common stock in the amount of $447$252 for shares withheld to pay employee payroll taxes upon vesting of equity awards.
On June 30, 2013, we2015, Fuel Tech amended ourits existing revolving credit facility (the Facility) with JPMorgan Chase Bank, N.AN.A. (JPM Chase) to extend the maturity date through June 30, 2015.2017. The total borrowing base ofavailability under the facility iswas $15,000 and containscontained a provision to increase the facility up to a total principal amount of $25,000 upon approval from JPM Chase. The Facility iswas unsecured, bears interest at a rate of LIBOR plus a spread range of 250300 basis points, to 375 basis points, as determined by a formula related to our leverage ratio, and is guaranteed by ourhas the Company’s Italian subsidiary, Fuel Tech Srl. We are allowed toS.r.l., as a guarantor. Fuel Tech can use this Facility for cash advances and standby letters of credit. As of December 31, 20142016 and 2013,December 31, 2015, there were no outstanding borrowings on the amended credit facilities.facility.
The Facility containscontained several debt covenants with which wethe Company must comply on a quarterly or annual basis, includingbasis. The Facility required a maximum Funded Debt tominimum trailing-twelve month EBITDA Ratio (or “Leverage Ratio”, as defined inof $500 for the Facility)quarters ending March 31, 2016 and June 30, 2016; Beginning with the fiscal quarter ended September 30, 2016, the Facility required a minimum EBITDA for the trailing twelve-month period then ended of 2.0:1.0 based on the four trailing quarterly periods. Maximum funded debt is defined as all borrowed funds, outstanding standby letters of credit and bank guarantees.not less than $1,000. EBITDA includes after tax earnings with add backs for interest expense, income taxes, depreciation and amortization, and stock-based compensation expenses.expense, and other non-cash items. This covenant was waived by our bank through the maturity date of the credit facility.period ending December 31, 2015. In addition, the Facility covenants includerequired a minimum working capital requirement of $35,000, starting as of December 31, 2015. Finally, the Facility had an annual capital expenditure limit of $10,000 and a minimum tangible net worth of $50,000, adjusted upward for 50% of net income generated and 100% of all capital issuances. At December 31, 2014 we were in compliance$5,000.
On May 9, 2016, the Company amended its existing U.S. Domestic credit facility with all activeJPM Chase such that the financial covenants specifiedas set forth in the credit agreement would not be measured for the period ending as of March 31, 2016, and were removed in their entirety from the Facility. The credit availability under the Facility has been reduced from $15,000 to $7,000 with this amendment, and further, JPM Chase's then current Revolving Commitment under the Facility is now secured by cash held by the Company in a separate restricted use designated JPM Chase deposit account. The amount of credit available to the Company under the Facility was $7,000 from the date of the effective date of the amended facility through May 31, 2016, at which time the credit available to the Company under the Facility was reduced to $6,000 from June 1, 2016 through July 31, 2016, at which time the credit available to the Company under the Facility was reduced to $5,000 and will remain as such until the Maturity Date of the Facility on June 30, 2017. The Company intends to renew the U.S. Domestic credit facility at its maturity. During the entire period of the Facility the Company must maintain sufficient cash balances in a segregated deposit account equal to the amount of the Facility and will fully pledge such cash as collateral to the bank to support the credit available to the Company under the Facility.
At December 31, 20142016 and 2013,2015, we had outstanding standby letters of credit and bank guarantees totaling approximately $8,284$3,292 and $3,478,$7,803, respectively, on our domestic credit facility in connection with contracts in process. We are committed to reimbursing the issuing bank for any payments made by the bank under these instruments. At December 31, 20142016 and 2013,2015, there were no cash borrowings under the domestic revolving credit facility and approximately $6,716$1,708 and $11,522,$7,197, respectively, was available for future borrowings. We pay a commitment fee of 0.25% per year on the unused portion of the revolving credit facility.
On June 27, 2014, our wholly-owned subsidiary,24, 2016, Beijing Fuel Tech Environmental Technologies Company, Ltd. (Beijing Fuel Tech), a wholly-owned subsidiary of Fuel Tech, entered into a new revolving credit facility (the China Facility) agreement with JPM Chase for RMB 356.5 million (approximately $5,688)$936), which expires on June 26, 2015.23, 2017. The Company intends to renew the China Facility at its maturity. This new credit facility replaced the previous RMB 35 million facility that expired on June 27, 2014.24, 2016. The facility is unsecured, bears interest at a rate of 125% of the People’s Bank of China (PBOC) Base Rate, and we haveis guaranteed BJFT's obligations under this facility.by Fuel Tech. Beijing Fuel Tech can use this facility for cash advances and bank guarantees. As of December 31, 20142016 and 2013,December 31, 2015, Beijing Fuel Tech had no cash borrowings outstanding inunder the amount of $1,625 and $1,636, respectively. These borrowings were subject to interest rates of 7.0% at December 31, 2014 and 2013.China Facility.
At December 31, 20142016 and 2013,2015, we had outstanding standby letters of credit and bank guarantees totaling approximately $336$22 and $646,$57, respectively, on its Beijing Fuel Tech revolving credit facility in connection with contracts in process. At December 31, 20142016 and 2013,2015, approximately $3,727$914 and $3,443$5,335 was available for future borrowings.
In the event of default on either the domestic facility or the China facility, the cross default feature in each allows the lending bank to accelerate the payments of any amounts outstanding and may, under certain circumstances, allow the bank to cancel the facility. If we were unable to obtain a waiver for a breach of covenant and the bank accelerated the payment of any outstanding amounts, such acceleration may cause our cash position to deteriorate or, if cash on hand were insufficient to satisfy the payment due, may require us to obtain alternate financing to satisfy the accelerated payment.
We continue to monitor our liquidity needs and in response to our continued losses have taken measures to reduce expenses and restructure operations which we feel are necessary to ensure we maintain sufficient working capital and liquidity to operate the amount of $125business and $56 were made duringinvest in our future.
For the yearsyear ended December 31, 20142016, we have sustained losses totaling $17,388. Our cash used in operations for this same period totaled $2,738. We incur on an annualized basis approximately $5.5 million in non-cash expenses for depreciation, amortization and 2013, respectively.stock compensation. We have taken measures to reduce our expense infrastructure, and over the past two years have eliminated approximately $8 million in aggregate expense through headcount and other operating expense cutbacks.
Our cash balance as of December 31, 2016 totaled $17.8 million (inclusive of our restricted cash balance), and our working capital totaled $26.6 million. We do not have any outstanding debt obligations other than our letters of credit, and our current credit agreement does not have any financial covenants as we have moved to a cash collateralized line of credit with our lender.
We have evaluated our ongoing business needs, and considered the opinioncash requirements of our base business of Air Pollution Control and Fuel Chem, as well as our efforts to support our Fuel Conversion business. This evaluation included consideration of the following: a) customer and revenue trends in our APC and Fuel Chem business segments, b) current operating structure and expenditure levels, c) contingent payouts as described in the notes to our financial statements, and d) support for our Fuel Conversion business and other research and development initiatives.
We currently have a $5 million domestic U.S. credit facility which we use to issue letters of credit to our customers. During 2016 that credit facility was converted to a fully cash collateralized line of credit requiring us to deposit funds in a restricted cash account to support that credit line. We expect to continue operating under this arrangement for the foreseeable future. Our liquidity may be adversely affected to the extent we are required to collateralize further letters of credit by additional cash deposits.
Based on this analysis, management expected near-term revenue growthbelieves that currently we have sufficient cash and working capital to operate our base APC and Fuel Chem businesses. However, we do not have sufficient capital to support the full development of our Fuel Conversion business. We will need to identify outside funding sources to support this business effort. No assurances can be given as to whether such resources will be driven byavailable, or on what terms. If such funding is not attainable, the timing of penetrationdevelopment of the coal-fired utility marketplace via utilization of our TIFI technology, by utility and industrial entities’ adherence to the NOx reduction
Contractual Obligations and Commitments
In our normal course of business, we enter into agreements obligating us to make future payments. The contractual cash obligations noted below are primarily related to supporting the ongoing operations of the business.
Payments due by period in thousands of dollars
| Contractual Cash Obligations | Total | 2015 | 2016-2017 | 2018-2019 | Thereafter | Total | 2017 | 2018-2019 | 2020-2021 | Thereafter | ||||||||||||||||||||||||||||||
| Operating lease obligations | $ | 3,598 | $ | 1,023 | $ | 1,760 | $ | 741 | $ | 74 | $ | 1,781 | $ | 778 | $ | 915 | $ | 88 | $ | — | ||||||||||||||||||||
| Beijing Fuel Tech credit facility | $ | 1,625 | $ | 1,625 | $ | — | $ | — | $ | — | ||||||||||||||||||||||||||||||
| Total | $ | 5,223 | $ | 2,648 | $ | 1,760 | $ | 741 | $ | 74 | $ | 1,781 | $ | 778 | $ | 915 | $ | 88 | $ | — | ||||||||||||||||||||
Interest payments in the amount of $125, $56,$0, $27, and $93$125 were made during the years ended December 31, 2014, 20132016, 2015 and 2012,2014, respectively.
In the normal course of our business, we use bank performance guarantees and letters of credit in support of construction contracts with customers as follows:
in support of the warranty period defined in the contract; or
in support of the system performance criteria that are defined in the contract.
In addition, we use bank performance guarantees with standby letters of credit and performance surety bonds as security for contract performance and other obligations as needed in the normal course of business. As of December 31, 2014,2016, we had outstanding bank performance obligations that may or may not result in cash obligations as follows:
Commitment expiration by period in thousands of dollars
| Commercial Commitments | Total | 2015 | 2016 | 2017 | Thereafter | Total | 2017 | 2018 | 2019 | Thereafter | ||||||||||||||||||||||||||||||
| Standby letters of credit and bank guarantees | $ | 8,620 | $ | 5,022 | $ | 3,598 | $ | — | $ | — | $ | 3,314 | $ | 2,392 | $ | 890 | $ | 32 | $ | — | ||||||||||||||||||||
| Performance Surety Bonds | $ | 12,389 | $ | 7,791 | $ | 3,364 | $ | 1,234 | $ | — | $ | 4,598 | $ | 4,598 | $ | — | $ | — | $ | — | ||||||||||||||||||||
| Total | $ | 21,009 | $ | 12,813 | $ | 6,962 | $ | 1,234 | $ | — | $ | 7,912 | $ | 6,990 | $ | 890 | $ | 32 | $ | — | ||||||||||||||||||||
Off-Balance-Sheet Transactions
There were no other off-balance-sheet transactions other than the obligations and commitments listed above during the three-year period ended December 31, 2014.2016.
ITEM 7A - QUANTITATIVE AND QUALITATIVE DISCLOSURES ABOUT MARKET RISK
Our earnings and cash flow are subject to fluctuations due to changes in foreign currency exchange rates. We do not enter into foreign currency forward contracts or into foreign currency option contracts to manage this risk due to the nature of the transactions involved.
We are also exposed to changes in interest rates primarily due to our debt arrangement (refer to Note 10 to the consolidated financial statements). A hypothetical 100 basis point adverse move in interest rates along the entire interest rate yield curve would not have a materially adverse effect on interest expense during the upcoming year ended December 31, 2015.2017.
ITEM 8 - FINANCIAL STATEMENTS AND SUPPLEMENTARY DATA
Report of Independent Registered Public Accounting Firm
To the Board of Directors and Stockholders
Fuel Tech, Inc.
We have audited the accompanying consolidated balance sheets of Fuel Tech, Inc. (the Company) as of December 31, 20142016 and 2013,2015, and the related consolidated statements of operations, comprehensive (loss) income,loss, stockholders' equity and cash flows for each of the three years in the period ended December 31, 2014. We also have audited Fuel Tech, Inc.'s internal control over2016. These financial reporting as of December 31, 2014, based on criteria established in Internal Control - Integrated Framework issued bystatements are the Committee of Sponsoring Organizationsresponsibility of the Treadway Commission in 1992. Fuel Tech, Inc.'s management is responsible for these financial statements, for maintaining effective internal control over financial reporting, and for its assessment of the effectiveness of internal control over financial reporting included in the accompanying Management’s Report on Internal Control Over Financial Reporting appearing under Item 9A.Company's management. Our responsibility is to express an opinion on these financial statements and an opinion on the Company's internal control over financial reporting based on our audits.
We conducted our audits in accordance with the standards of the Public Company Accounting Oversight Board (United States). Those standards require that we plan and perform the auditsaudit to obtain reasonable assurance about whether the financial statements are free of material misstatement and whether effectivemisstatement. The Company is not required to have, nor were we engaged to perform, an audit of its internal control over financial reporting. Our audits included consideration of internal control over financial reporting was maintainedas a basis for designing audit procedures that are appropriate in all material respects. Our auditsthe circumstances, but not for the purpose of expressing an opinion on the effectiveness of the Company’s internal control over financial statements includedreporting. Accordingly, we express no such opinion. An audit also includes examining, on a test basis, evidence supporting the amounts and disclosures in the financial statements, assessing the accounting principles used and significant estimates made by management, andas well as evaluating the overall financial statement presentation. Our audit of internal control over financial reporting included obtaining an understanding of internal control over financial reporting, assessing the risk that a material weakness exists, and testing and evaluating the design and operating effectiveness of internal control based on the assessed risk. Our audits also included performing such other procedures as we considered necessary in the circumstances. We believe that our audits provide a reasonable basis for our opinions.opinion.
In our opinion, the consolidated financial statements referred to above present fairly, in all material respects, the financial position of Fuel Tech, Inc. as of December 31, 20142016 and 2013,2015, and the results of its operations and its cash flows for each of the three years in the three-year period ended December 31, 2014,2016, in conformity with accounting principlesU.S. generally accepted in the United States of America. Also in our opinion, Fuel Tech, Inc. maintained, in all material respects, effective internal control over financial reporting as of December 31, 2014, based on criteria established in Internal Control - Integrated Framework issued by the Committee of Sponsoring Organizations of the Treadway Commission in 1992.accounting principles.
| /s/ |
| March |
Fuel Tech, Inc.
Consolidated Balance Sheets
(in thousands of dollars, except share and per-share data)
| December 31, | December 31, | |||||||||||||||
| 2014 | 2013 | 2016 | 2015 | |||||||||||||
| ASSETS | ||||||||||||||||
| Current assets: | ||||||||||||||||
| Cash and cash equivalents | $ | 18,637 | $ | 27,738 | $ | 11,826 | $ | 21,684 | ||||||||
| Restricted cash | 6,020 | — | ||||||||||||||
| Marketable securities | 36 | 30 | 9 | 19 | ||||||||||||
| Accounts receivable, net | 31,910 | 36,974 | 18,790 | 23,060 | ||||||||||||
| Inventories | 1,111 | 443 | ||||||||||||||
| Inventories, net | 1,012 | 1,653 | ||||||||||||||
| Prepaid expenses and other current assets | 4,094 | 2,196 | 2,891 | 3,889 | ||||||||||||
| Income taxes receivable | 597 | 1,407 | 87 | 1,857 | ||||||||||||
| Deferred income taxes | 1,953 | 477 | — | 239 | ||||||||||||
| Total current assets | 58,338 | 69,265 | 40,635 | 52,401 | ||||||||||||
| Property and equipment, net | 13,527 | 13,027 | 10,920 | 12,001 | ||||||||||||
| Goodwill | 2,116 | 21,051 | 2,116 | 2,116 | ||||||||||||
| Other intangible assets, net | 10,464 | 4,305 | 3,451 | 7,144 | ||||||||||||
| Deferred income taxes | 5,649 | — | — | 992 | ||||||||||||
| Other assets | 1,377 | 2,410 | 666 | 1,357 | ||||||||||||
| Total assets | $ | 91,471 | $ | 110,058 | $ | 57,788 | $ | 76,011 | ||||||||
| LIABILITIES AND STOCKHOLDERS’ EQUITY | ||||||||||||||||
| Current liabilities: | ||||||||||||||||
| Short-term debt | $ | 1,625 | $ | 1,636 | ||||||||||||
| Accounts payable | 7,310 | 9,920 | 6,303 | 8,942 | ||||||||||||
| Accrued liabilities: | ||||||||||||||||
| Employee compensation | 2,007 | 4,460 | 1,390 | 1,645 | ||||||||||||
| Other accrued liabilities | 7,708 | 4,630 | 6,357 | 5,949 | ||||||||||||
| Total current liabilities | 18,650 | 20,646 | 14,050 | 16,536 | ||||||||||||
| Deferred income taxes | — | 59 | ||||||||||||||
| Other liabilities | 520 | 730 | 346 | 501 | ||||||||||||
| Total liabilities | 19,170 | 21,435 | 14,396 | 17,037 | ||||||||||||
| COMMITMENTS AND CONTINGENCIES (Note 9) | ||||||||||||||||
| Stockholders’ equity: | ||||||||||||||||
| Common stock, $.01 par value, 40,000,000 shares authorized, 23,027,704 and 22,701,613 shares issued, and 22,860,398 and 22,592,956 outstanding in 2014 and 2013, respectively | 230 | 227 | ||||||||||||||
| Common stock, $.01 par value, 40,000,000 shares authorized, 23,800,924 and 23,419,008 shares issued, and 23,446,035 and 23,167,216 outstanding in 2016 and 2015, respectively | 238 | 234 | ||||||||||||||
| Additional paid-in capital | 134,985 | 132,796 | 137,380 | 135,394 | ||||||||||||
| Accumulated deficit | (61,752 | ) | (44,027 | ) | (91,520 | ) | (74,132 | ) | ||||||||
| Accumulated other comprehensive (loss) income | (448 | ) | 37 | |||||||||||||
| Accumulated other comprehensive loss | (1,568 | ) | (1,556 | ) | ||||||||||||
| Nil coupon perpetual loan notes | 76 | 76 | 76 | 76 | ||||||||||||
| Treasury stock, 167,306 and 108,657 shares in 2014 and 2013, respectively, at cost | (790 | ) | (486 | ) | ||||||||||||
| Treasury stock, 354,889 and 251,792 shares in 2016 and 2015, respectively, at cost | (1,214 | ) | (1,042 | ) | ||||||||||||
| Total stockholders’ equity | 72,301 | 88,623 | 43,392 | 58,974 | ||||||||||||
| Total liabilities and stockholders’ equity | $ | 91,471 | $ | 110,058 | $ | 57,788 | $ | 76,011 | ||||||||
See notes to consolidated financial statements.
Fuel Tech, Inc.
Consolidated Statements of Operations
(in thousands of dollars, except share and per-share data)
| For the years ended December 31, | For the years ended December 31, | |||||||||||||||||||||||
| 2014 | 2013 | 2012 | 2016 | 2015 | 2014 | |||||||||||||||||||
| Revenues | $ | 79,017 | $ | 109,338 | $ | 97,644 | $ | 55,161 | $ | 73,664 | $ | 79,017 | ||||||||||||
| Costs and expenses: | ||||||||||||||||||||||||
| Cost of sales | 43,889 | 62,521 | 56,899 | 36,367 | 45,107 | 43,889 | ||||||||||||||||||
| Selling, general and administrative | 35,432 | 36,375 | 32,682 | 25,564 | 30,897 | 35,432 | ||||||||||||||||||
| Restructuring charge | 1,428 | 219 | — | |||||||||||||||||||||
| Research and development | 1,459 | 2,442 | 2,863 | 4,552 | 4,273 | 1,459 | ||||||||||||||||||
| Goodwill impairment | 23,400 | — | — | |||||||||||||||||||||
| 104,180 | 101,338 | 92,444 | ||||||||||||||||||||||
| Operating (loss) income | (25,163 | ) | 8,000 | 5,200 | ||||||||||||||||||||
| Goodwill and intangible assets impairment | 2,074 | 1,425 | 23,400 | |||||||||||||||||||||
| Total Costs and Expenses | 69,985 | 81,921 | 104,180 | |||||||||||||||||||||
| Operating (loss) | (14,824 | ) | (8,257 | ) | (25,163 | ) | ||||||||||||||||||
| Interest expense | (125 | ) | (56 | ) | (93 | ) | — | (27 | ) | (125 | ) | |||||||||||||
| Interest income | 29 | 58 | 78 | 25 | 21 | 29 | ||||||||||||||||||
| Other expense | (544 | ) | (137 | ) | (107 | ) | (925 | ) | (360 | ) | (544 | ) | ||||||||||||
| (Loss) Income before taxes | (25,803 | ) | 7,865 | 5,078 | ||||||||||||||||||||
| Income tax benefit (expense) | 8,078 | (2,764 | ) | (2,302 | ) | |||||||||||||||||||
| Net (loss) income | $ | (17,725 | ) | $ | 5,101 | $ | 2,776 | |||||||||||||||||
| Net (loss) income per common share: | ||||||||||||||||||||||||
| (Loss) before income taxes | (15,724 | ) | (8,623 | ) | (25,803 | ) | ||||||||||||||||||
| Income tax (expense) benefit | (1,664 | ) | (3,757 | ) | 8,078 | |||||||||||||||||||
| Net (loss) | $ | (17,388 | ) | $ | (12,380 | ) | $ | (17,725 | ) | |||||||||||||||
| Net (loss) per common share: | ||||||||||||||||||||||||
| Basic | $ | (0.78 | ) | $ | 0.23 | $ | 0.12 | $ | (0.74 | ) | $ | (0.54 | ) | $ | (0.78 | ) | ||||||||
| Diluted | $ | (0.78 | ) | $ | 0.23 | $ | 0.12 | $ | (0.74 | ) | $ | (0.54 | ) | $ | (0.78 | ) | ||||||||
| Weighted-average number of common shares outstanding: | ||||||||||||||||||||||||
| Basic | 22,782,000 | 22,286,000 | 22,709,000 | 23,365,000 | 23,101,000 | 22,782,000 | ||||||||||||||||||
| Diluted | 22,782,000 | 22,579,000 | 23,535,000 | 23,365,000 | 23,101,000 | 22,782,000 | ||||||||||||||||||
See notes to consolidated financial statements.
Fuel Tech, Inc.
Consolidated Statements of Comprehensive (Loss) Income
(in thousands of dollars)
| For the years ended December 31, | ||||||||||||
| 2014 | 2013 | 2012 | ||||||||||
| Net (loss) income | $ | (17,725 | ) | $ | 5,101 | $ | 2,776 | |||||
| Other comprehensive (loss) income: | ||||||||||||
| Foreign currency translation adjustments | (489 | ) | 438 | (765 | ) | |||||||
| Unrealized gains/(losses) from marketable securities, net of tax | 4 | (9 | ) | (8 | ) | |||||||
| Total other comprehensive (loss) income | (485 | ) | 429 | (773 | ) | |||||||
| Comprehensive (loss) income | $ | (18,210 | ) | $ | 5,530 | $ | 2,003 | |||||
| For the years ended December 31, | ||||||||||||
| 2016 | 2015 | 2014 | ||||||||||
| Net (loss) | $ | (17,388 | ) | $ | (12,380 | ) | $ | (17,725 | ) | |||
| Other comprehensive (loss): | ||||||||||||
| Foreign currency translation adjustments | (6 | ) | (1,097 | ) | (489 | ) | ||||||
| Unrealized (losses)/gains from marketable securities, net of tax | (6 | ) | (11 | ) | 4 | |||||||
| Total other comprehensive (loss) | (12 | ) | (1,108 | ) | (485 | ) | ||||||
| Comprehensive (loss) | $ | (17,400 | ) | $ | (13,488 | ) | $ | (18,210 | ) | |||
See notes to consolidated financial statements.
Fuel Tech, Inc.
Consolidated Statements of Stockholders’ Equity
(in thousands of dollars or shares, as appropriate)
| Common Stock | Additional Paid-in Capital | Accumulated Deficit | Accumulated Other Comprehensive Income (Loss) | Nil Coupon Perpetual Loan Notes | Treasury Stock | Total | Common Stock | Additional Paid-in Capital | Accumulated Deficit | Accumulated Other Comprehensive Income (Loss) | Nil Coupon Perpetual Loan Notes | Treasury Stock | Total | |||||||||||||||||||||||||||||||||||||||||||||||||
| Shares | Amount | Shares | Amount | |||||||||||||||||||||||||||||||||||||||||||||||||||||||||||
| Balance at December 31, 2011 | 23,644 | $ | 237 | $ | 132,350 | $ | (44,031 | ) | $ | 381 | $ | 76 | $ | — | $ | 89,013 | ||||||||||||||||||||||||||||||||||||||||||||||
| Net income | 2,776 | 2,776 | ||||||||||||||||||||||||||||||||||||||||||||||||||||||||||||
| Balance at December 31, 2013 | 22,593 | $ | 227 | $ | 132,796 | $ | (44,027 | ) | $ | 37 | $ | 76 | $ | (486 | ) | $ | 88,623 | |||||||||||||||||||||||||||||||||||||||||||||
| Net loss | (17,725 | ) | (17,725 | ) | ||||||||||||||||||||||||||||||||||||||||||||||||||||||||||
| Foreign currency translation adjustments | (765 | ) | (765 | ) | (489 | ) | (489 | ) | ||||||||||||||||||||||||||||||||||||||||||||||||||||||
| Unrealized loss on marketable securities, net of tax | (8 | ) | (8 | ) | ||||||||||||||||||||||||||||||||||||||||||||||||||||||||||
| Stock compensation expense | 1,248 | 1,248 | ||||||||||||||||||||||||||||||||||||||||||||||||||||||||||||
| Issuance of deferred shares of stock | 58 | 58 | ||||||||||||||||||||||||||||||||||||||||||||||||||||||||||||
| Tax effect of expired vested options | (57 | ) | (57 | ) | ||||||||||||||||||||||||||||||||||||||||||||||||||||||||||
| Repurchases and retirement of common shares | (1,605 | ) | (16 | ) | (7,873 | ) | (7,889 | ) | ||||||||||||||||||||||||||||||||||||||||||||||||||||||
| Common shares issued upon vesting of restricted stock units | 72 | (101 | ) | (101 | ) | |||||||||||||||||||||||||||||||||||||||||||||||||||||||||
| Treasury shares withheld | (9 | ) | $ | (39 | ) | (39 | ) | |||||||||||||||||||||||||||||||||||||||||||||||||||||||
| Balance at December 31, 2012 | 22,102 | $ | 221 | $ | 133,498 | $ | (49,128 | ) | $ | (392 | ) | $ | 76 | $ | (39 | ) | $ | 84,236 | ||||||||||||||||||||||||||||||||||||||||||||
| Net income | 5,101 | 5,101 | ||||||||||||||||||||||||||||||||||||||||||||||||||||||||||||
| Foreign currency translation adjustments | 438 | 438 | ||||||||||||||||||||||||||||||||||||||||||||||||||||||||||||
| Unrealized loss on marketable securities, net of tax | (9 | ) | (9 | ) | ||||||||||||||||||||||||||||||||||||||||||||||||||||||||||
| Unrealized gain on marketable securities, net of tax | 4 | 4 | ||||||||||||||||||||||||||||||||||||||||||||||||||||||||||||
| Exercise of stock options | 195 | 2 | 809 | 811 | 60 | 297 | 297 | |||||||||||||||||||||||||||||||||||||||||||||||||||||||
| Tax benefit from stock compensation expense | 67 | 67 | 7 | 7 | ||||||||||||||||||||||||||||||||||||||||||||||||||||||||||
| Stock compensation expense | 1,798 | 1,798 | 2,322 | 2,322 | ||||||||||||||||||||||||||||||||||||||||||||||||||||||||||
| Tax effect of expired vested options | (121 | ) | (121 | ) | (379 | ) | (379 | ) | ||||||||||||||||||||||||||||||||||||||||||||||||||||||
| Common shares issued upon vesting of restricted stock units | 395 | 4 | (3,255 | ) | (3,251 | ) | 266 | 3 | (58 | ) | (55 | ) | ||||||||||||||||||||||||||||||||||||||||||||||||||
| Treasury shares withheld | (99 | ) | (447 | ) | (447 | ) | (59 | ) | (304 | ) | (304 | ) | ||||||||||||||||||||||||||||||||||||||||||||||||||
| Balance at December 31, 2013 | 22,593 | $ | 227 | $ | 132,796 | $ | (44,027 | ) | $ | 37 | $ | 76 | $ | (486 | ) | $ | 88,623 | |||||||||||||||||||||||||||||||||||||||||||||
| Balance at December 31, 2014 | 22,860 | $ | 230 | $ | 134,985 | $ | (61,752 | ) | $ | (448 | ) | $ | 76 | $ | (790 | ) | $ | 72,301 | ||||||||||||||||||||||||||||||||||||||||||||
| Net loss | (17,725 | ) | (17,725 | ) | (12,380 | ) | (12,380 | ) | ||||||||||||||||||||||||||||||||||||||||||||||||||||||
| Foreign currency translation adjustments | (489 | ) | (489 | ) | (1,097 | ) | (1,097 | ) | ||||||||||||||||||||||||||||||||||||||||||||||||||||||
| Unrealized gain on marketable securities, net of tax | 4 | 4 | ||||||||||||||||||||||||||||||||||||||||||||||||||||||||||||
| Unrealized loss on marketable securities, net of tax | (11 | ) | (11 | ) | ||||||||||||||||||||||||||||||||||||||||||||||||||||||||||
| Stock compensation expense | 2,322 | 2,322 | 1,809 | 1,809 | ||||||||||||||||||||||||||||||||||||||||||||||||||||||||||
| Exercise of stock options | 60 | 297 | 297 | |||||||||||||||||||||||||||||||||||||||||||||||||||||||||||
| Tax benefit from stock compensation expense | 7 | 7 | ||||||||||||||||||||||||||||||||||||||||||||||||||||||||||||
| Issuance of Deferred Director's shares | 39 | 1 | (71 | ) | (70 | ) | ||||||||||||||||||||||||||||||||||||||||||||||||||||||||
| Tax effect of expired vested options | (379 | ) | ` | (379 | ) | (908 | ) | ` | (908 | ) | ||||||||||||||||||||||||||||||||||||||||||||||||||||
| Common shares issued upon vesting of restricted stock units | 266 | 3 | (58 | ) | (55 | ) | 352 | 3 | (421 | ) | (418 | ) | ||||||||||||||||||||||||||||||||||||||||||||||||||
| Treasury shares withheld | (59 | ) | (304 | ) | (304 | ) | (84 | ) | (252 | ) | (252 | ) | ||||||||||||||||||||||||||||||||||||||||||||||||||
| Balance at December 31, 2014 | 22,860 | $ | 230 | $ | 134,985 | $ | (61,752 | ) | $ | (448 | ) | $ | 76 | $ | (790 | ) | $ | 72,301 | ||||||||||||||||||||||||||||||||||||||||||||
| Balance at December 31, 2015 | 23,167 | $ | 234 | $ | 135,394 | $ | (74,132 | ) | $ | (1,556 | ) | $ | 76 | $ | (1,042 | ) | $ | 58,974 | ||||||||||||||||||||||||||||||||||||||||||||
| Net loss | (17,388 | ) | (17,388 | ) | ||||||||||||||||||||||||||||||||||||||||||||||||||||||||||
| Foreign currency translation adjustments | (6 | ) | (6 | ) | ||||||||||||||||||||||||||||||||||||||||||||||||||||||||||
| Unrealized loss on marketable securities, net of tax | (6 | ) | (6 | ) | ||||||||||||||||||||||||||||||||||||||||||||||||||||||||||
| Stock compensation expense | 1,991 | 1,991 | ||||||||||||||||||||||||||||||||||||||||||||||||||||||||||||
| Common shares issued upon vesting of restricted stock units | 382 | 4 | (5 | ) | (1 | ) | ||||||||||||||||||||||||||||||||||||||||||||||||||||||||
| Treasury shares withheld | (103 | ) | (172 | ) | (172 | ) | ||||||||||||||||||||||||||||||||||||||||||||||||||||||||
| Balance at December 31, 2016 | 23,446 | $ | 238 | $ | 137,380 | $ | (91,520 | ) | $ | (1,568 | ) | $ | 76 | $ | (1,214 | ) | $ | 43,392 | ||||||||||||||||||||||||||||||||||||||||||||
See notes to consolidated financial statements.
Fuel Tech, Inc.
Consolidated Statements of Cash Flows
(in thousands of dollars)
| For the years ended December 31, | For the years ended December 31, | |||||||||||||||||||||||
| 2014 | 2013 | 2012 | 2016 | 2015 | 2014 | |||||||||||||||||||
| OPERATING ACTIVITIES | ||||||||||||||||||||||||
| Net (loss) income | $ | (17,725 | ) | $ | 5,101 | $ | 2,776 | |||||||||||||||||
| Adjustments to reconcile net (loss) income to net cash provided by operating activities: | ||||||||||||||||||||||||
| Net (loss) | $ | (17,388 | ) | $ | (12,380 | ) | $ | (17,725 | ) | |||||||||||||||
| Adjustments to reconcile net (loss) income to net cash (used in) provided by operating activities: | ||||||||||||||||||||||||
| Depreciation | 1,922 | 2,175 | 2,191 | 1,780 | 2,067 | 1,922 | ||||||||||||||||||
| Amortization | 2,384 | 839 | 898 | 1,720 | 2,138 | 2,384 | ||||||||||||||||||
| Gain on equipment disposals/impaired assets | — | — | (72 | ) | ||||||||||||||||||||
| Unrealized holding loss on marketable securities | — | — | 13 | |||||||||||||||||||||
| Loss (gain) on disposal of equipment | 60 | (26 | ) | — | ||||||||||||||||||||
| Allowance for doubtful accounts | 762 | 707 | 26 | (111 | ) | — | 762 | |||||||||||||||||
| Deferred income taxes | (9,524 | ) | 1,252 | (458 | ) | 1,196 | 4,916 | (9,524 | ) | |||||||||||||||
| Stock compensation expense | 2,322 | 1,798 | 1,306 | 1,991 | 1,809 | 2,322 | ||||||||||||||||||
| Goodwill impairment | 23,400 | — | — | |||||||||||||||||||||
| Goodwill and intangible assets impairment | 2,074 | 1,425 | 23,400 | |||||||||||||||||||||
| Excess and obsolete inventory reserve | 825 | — | — | |||||||||||||||||||||
| Changes in operating assets and liabilities, net of acquisitions: | ||||||||||||||||||||||||
| Accounts receivable | 6,117 | (6,970 | ) | 4,249 | 3,522 | 7,880 | 6,117 | |||||||||||||||||
| Inventories | (616 | ) | 77 | (202 | ) | 446 | (560 | ) | (616 | ) | ||||||||||||||
| Prepaid expenses, other current assets and other noncurrent assets | (913 | ) | 2,118 | (1,808 | ) | 2,893 | (1,245 | ) | (913 | ) | ||||||||||||||
| Accounts payable | (3,600 | ) | (2,968 | ) | 2,327 | (2,445 | ) | 1,817 | (3,600 | ) | ||||||||||||||
| Accrued liabilities and other noncurrent liabilities | 906 | (1,287 | ) | (2,579 | ) | 699 | (913 | ) | 906 | |||||||||||||||
| Net cash provided by operating activities | 5,435 | 2,842 | 8,667 | |||||||||||||||||||||
| Net cash (used in) provided by operating activities | (2,738 | ) | 6,928 | 5,435 | ||||||||||||||||||||
| INVESTING ACTIVITIES | ||||||||||||||||||||||||
| Purchases of property, equipment and patents | (2,808 | ) | (1,754 | ) | (2,534 | ) | (940 | ) | (802 | ) | (2,808 | ) | ||||||||||||
| Proceeds from the sale of equipment | 2 | 26 | — | |||||||||||||||||||||
| Purchases of other intangible assets | (3,010 | ) | — | — | — | — | (3,010 | ) | ||||||||||||||||
| Payment for acquisitions, net of cash acquired | (8,079 | ) | — | — | — | — | (8,079 | ) | ||||||||||||||||
| Net cash used in investing activities | (13,897 | ) | (1,754 | ) | (2,534 | ) | (938 | ) | (776 | ) | (13,897 | ) | ||||||||||||
| FINANCING ACTIVITIES | ||||||||||||||||||||||||
| Net proceeds (payments) of short-term debt | — | 1,614 | (1,187 | ) | ||||||||||||||||||||
| Payments on short-term borrowings | — | (1,623 | ) | — | ||||||||||||||||||||
| Proceeds from exercises of stock options | 297 | 811 | — | — | — | 297 | ||||||||||||||||||
| Excess tax benefit from exercises of stock options | 7 | 67 | — | — | — | 7 | ||||||||||||||||||
| Repurchases of common stock | — | — | (7,889 | ) | ||||||||||||||||||||
| Change in restricted cash | (6,020 | ) | — | — | ||||||||||||||||||||
| Treasury shares withheld | (304 | ) | (447 | ) | (39 | ) | (172 | ) | (252 | ) | (304 | ) | ||||||||||||
| Net cash provided by (used in) financing activities | — | 2,045 | (9,115 | ) | ||||||||||||||||||||
| Net cash used in financing activities | (6,192 | ) | (1,875 | ) | — | |||||||||||||||||||
| Effect of exchange rate fluctuations on cash | (639 | ) | 152 | (794 | ) | 10 | (1,230 | ) | (639 | ) | ||||||||||||||
| Net (decrease) increase in cash and cash equivalents | (9,101 | ) | 3,285 | (3,776 | ) | (9,858 | ) | 3,047 | (9,101 | ) | ||||||||||||||
| Cash and cash equivalents at beginning of year | 27,738 | 24,453 | 28,229 | 21,684 | 18,637 | 27,738 | ||||||||||||||||||
| Cash and cash equivalents at end of year | $ | 18,637 | $ | 27,738 | $ | 24,453 | $ | 11,826 | $ | 21,684 | $ | 18,637 | ||||||||||||
| Supplemental Cash Flow Information: | ||||||||||||||||||||||||
| Cash paid for: | ||||||||||||||||||||||||
| Interest | $ | 125 | $ | 56 | $ | 93 | $ | — | $ | 27 | $ | 125 | ||||||||||||
| Income taxes paid | $ | — | $ | 2,901 | $ | 2,043 | $ | 368 | $ | — | $ | — | ||||||||||||
See notes to consolidated financial statements.
Notes to Consolidated Financial Statements
(in thousands of dollars, except share and per-share data)
1. ORGANIZATION AND SIGNIFICANT ACCOUNTING POLICIES
Organization
Our FUEL CHEM program is based on proprietary TIFI® Targeted In-Furnace™ Injection technology, in combination with advanced Computational Fluid Dynamics (CFD) and Chemical Kinetics Modeling (CKM) boiler modeling, in the unique application of specialty chemicals to improve the efficiency, reliability and environmental status of combustion units by controlling slagging, fouling, corrosion, opacity and other sulfur trioxide-related issues in the boiler.
Our business is materially dependent on the continued existence and enforcement of air quality regulations, particularly in the United States. We have expended significant resources in the research and development of new technologies in building our proprietary portfolio of air pollution control, fuel and boiler treatment chemicals, computer modeling and advanced visualization technologies.
International revenues were $28,116,$12,616, $46,06322,179, and $27,21928,116 for the years ended December 31, 2014, 20132016, 2015 and 2012,2014, respectively. These amounts represented 36%23%, 42%30%, and 28%36% of Fuel Tech’s total revenues for the respective periods of time. Foreign currency changes did not have a material impact on the calculation of these percentages. We have foreign offices in Beijing, China and Gallarate, Italy.
Basis of Presentation
The consolidated financial statements include the accounts of Fuel Tech and its wholly-owned subsidiaries. All intercompany transactions have been eliminated.
Reclassifications
Certain reclassifications to prior year amounts have been made in the consolidated financial statements to conform to the current period presentation. In the third quarter of 2016, the Company concluded that it was appropriate to separately present restructuring charges in the Consolidated Statements of Operations. Accordingly, the corresponding reclassifications have also been made to the Consolidated Statements of Operations for the years ended December 31, 2016, 2015 and 2014.
Use of Estimates
The preparation of the financial statements in conformity with generally accepted accounting principles requires management to make estimates and assumptions that affect the amounts reported in the financial statements and accompanying notes. The Company uses estimates in accounting for, among other items, revenue recognition, allowance for doubtful accounts, income tax provisions, excess and obsolete inventory reserve, impairment of long-lived assets, and warranty expenses. Actual results could differ from those estimates.
Fair Value of Financial Instruments
The carrying values of cash and cash equivalents, accounts receivable, and accounts payable are reasonable estimates of their fair value due to their short-term nature. The carrying amount of our short-term debt under our revolving line of credit facility approximates fair value due to its short-term nature and because the amount outstanding accrues interest at a variable market-based rate. Our marketable securities are carried at fair value based on quoted market prices in an active market.
Cash and Cash Equivalents
We include cash and investments having an original maturity of three months or less at the time of acquisition in cash and cash equivalents. We have never incurred realized or unrealized holdings gains or losses on securities classified as cash equivalents. Income resulting from short-term investments is recorded as interest income. At December 31, 2014,2016, we had cash on hand of approximately $1,6393,222 at our Beijing, China subsidiary that is subject to certain local regulations that may limit the immediate availability of these funds outside of China. Cash on hand at our Italy subsidiary totaled approximately $2,408 at December 31, 2016.
Restricted Cash
Restricted cash represents funds that are restricted to satisfy any amount borrowed against the Company's existing revolving credit facility (the Facility) with JPMorgan Chase Bank, N.A. The amount of restricted cash was reduced by $1,000 on July 31, 2016 and became unrestricted cash and cash equivalents. The remaining balance of restricted cash totaling $6,020 will remain through the Maturity Date of the Facility. Refer to Note 10 Debt Financing for further information on the Facility.
Foreign Currency Risk Management
Our earnings and cash flows are subject to fluctuations due to changes in foreign currency exchange rates. We do not enter into foreign currency forward contracts or into foreign currency option contracts to manage this risk due to the nature of the transactions involved.
Accounts Receivable
Accounts receivable consist of amounts due to us in the normal course of our business, are not collateralized, and normally do not bear interest. Accounts receivable includes unbilled receivables, representing costs and estimated earnings in excess of billings on uncompleted contracts under the percentage of completion method. At December 31, 20142016 and 2013,2015, unbilled receivables were approximately $9,904$6,755 and $12,599,$7,312, respectively.
Allowance for Doubtful Accounts
The allowance for doubtful accounts is our management's best estimate of the amount of credit losses in accounts receivable. In order to control and monitor the credit risk associated with our customer base, we review the credit worthiness of customers on a recurring basis. Factors influencing the level of scrutiny include the level of business the customer has with Fuel Tech, the customer’s payment history, and the customer’s financial stability. Receivables are considered past due if payment is not received by the date agreed upon with the customer, which is normally 30 days.days. Representatives of our management team review all past due accounts on a weekly basis to assess collectability. At the end of each reporting period, the allowance for doubtful accounts balance is reviewed relative to management’s collectability assessment and is adjusted if deemed necessary through a corresponding charge or credit to bad debts expense, which is included in selling, general, and administrative expenses in the consolidated statements of operations. Bad debt write-offs are made when management believes it is probable a receivable will not be recovered. The table below sets forth the components of the Allowance for Doubtful Accounts for the years ended December 31.
| Year | Balance at January 1 | Provision charged to expense | Write-offs / Recoveries | Balance at December 31 | Balance at January 1 | Provision charged to expense | Write-offs / Recoveries | Balance at December 31 | ||||||||||||||||||||||||
| 2012 | $ | 430 | $ | 246 | $ | (216 | ) | $ | 460 | |||||||||||||||||||||||
| 2013 | $ | 460 | $ | 1,175 | $ | (446 | ) | $ | 1,189 | |||||||||||||||||||||||
| 2014 | $ | 1,189 | $ | 1,099 | $ | (366 | ) | $ | 1,922 | $ | 1,189 | $ | 1,099 | $ | (366 | ) | $ | 1,922 | ||||||||||||||
| 2015 | $ | 1,922 | $ | — | $ | (150 | ) | $ | 1,772 | |||||||||||||||||||||||
| 2016 | $ | 1,772 | $ | 172 | $ | (375 | ) | $ | 1,569 | |||||||||||||||||||||||
Prepaid expenses and other current assets
Prepaid expenses and other current assets includes Chinese banker acceptances of $838 and $2,144 as of December 31, 2016 and 2015. These are short-term commitments of typically 30 to 60 days for future payments and can be redeemed at a discount or applied to future vendor payments.
Inventories
Inventories consist primarily of spare parts and are stated at the lower of cost or market using the first-in, first-out method. Usage is recorded in cost of sales in the period that parts were issued to a project or used to service equipment. Inventories are periodically evaluated to identify obsolete or otherwise impaired parts and are written off when management determines usage is not probable. On December 31, 2016, the Company established an excess and obsolete inventory reserve of $825 of which $175 is included in inventories and $650 is included in other assetson the consolidated balance sheet. The Company estimates the balance of excess and obsolete inventory by analyzing inventory by age using last used and original purchase date and existing sales pipeline for which the inventory could be used. The table below sets forth the components of the Excess and Obsolete Inventory Reserve for the years ended December 31.
| Year | Balance at January 1 | Provision charged to expense | Write-offs / Recoveries | Balance at December 31 | ||||||||||||
| 2016 | $ | — | $ | 825 | $ | — | $ | 825 | ||||||||
Foreign Currency Translation and Transactions
Assets and liabilities of consolidated foreign subsidiaries are translated into U.S. dollars at exchange rates in effect at year end. Revenues and expenses are translated at average exchange rates prevailing during the year. Gains or losses on foreign currency transactions and the related tax effects are reflected in net income. The resulting translation adjustments are included in stockholders’ equity as part of accumulated other comprehensive income.
Accumulated Other Comprehensive (Loss) Income
The changes in accumulated other comprehensive (loss) income by component were as follows:
| December 31, | December 31, | |||||||||||||||
| 2014 | 2013 | 2016 | 2015 | |||||||||||||
| Foreign currency translation | ||||||||||||||||
| Balance at beginning of period | $ | 18 | $ | (420 | ) | $ | (1,568 | ) | $ | (471 | ) | |||||
| Other comprehensive (loss) income: | ||||||||||||||||
| Other comprehensive (loss): | ||||||||||||||||
| Foreign currency translation adjustments (1) | (489 | ) | 438 | (6 | ) | (1,097 | ) | |||||||||
| Balance at end of period | $ | (471 | ) | $ | 18 | $ | (1,574 | ) | $ | (1,568 | ) | |||||
| Available-for-sale marketable securities | ||||||||||||||||
| Balance at beginning of period | $ | 19 | $ | 28 | $ | 12 | $ | 23 | ||||||||
| Other comprehensive income (loss): | ||||||||||||||||
| Net unrealized holding gain (loss) (2) | 4 | (14 | ) | |||||||||||||
| Deferred income taxes (2) | — | 5 | ||||||||||||||
| Total other comprehensive income (loss) | 4 | (9 | ) | |||||||||||||
| Other comprehensive (loss): | ||||||||||||||||
| Net unrealized holding (loss) (2) | (6 | ) | (11 | ) | ||||||||||||
| Balance at end of period | $ | 23 | $ | 19 | $ | 6 | $ | 12 | ||||||||
| Total accumulated other comprehensive (loss) income | $ | (448 | ) | $ | 37 | |||||||||||
| Total accumulated other comprehensive (loss) | $ | (1,568 | ) | $ | (1,556 | ) | ||||||||||
| (1) | In all periods presented, there were no tax impacts related to rate changes and no amounts were reclassified to earnings. |
| (2) | In all periods presented, there were no realized holding gains or losses and therefore no amounts were reclassified to earnings. |
Research and Development
Research and development costs are expensed as incurred. Research and development projects funded by customer contracts are reported as part of cost of goods sold. Internally funded research and development expenses are reported as operating expenses.
Product/System Warranty
We typically warrant our air pollution control products and systems against defects in design, materials and workmanship for one to two years. A provision for estimated future costs relating to warranty expense is recorded when the products/systems become commercially operational.
Goodwill
Goodwill and indefinite-lived intangible assets areis not amortized, but areis reviewed annually or more frequently if indicators arise, for impairment. Our evaluation of goodwill impairment involves first assessing qualitative factors to determine whether it is more likely than not that the fair value of a reporting unit is less than its carrying amount. We may bypass this qualitative assessment, or determine that based on our qualitative assessment considering the totality of events and circumstances including macroeconomic factors, industry and market considerations, current and projected financial performance, a sustained decrease in our share price, or other factors, that additional impairment analysis is necessary. This additional analysis involves comparing the current fair value of our reporting units to their carrying values. We use a discounted cash flow (DCF) model to determine the current fair value of our two reporting units. A number of significant assumptions and estimates are involved in the application of the DCF model to forecast operating cash flows, including markets and market share, sales volumes and prices, costs to produce and working capital changes. Management considers historical experience and all available information at the time the fair values of its reporting units are estimated. However, actual fair values that could be realized in an actual transaction may differ from those used to evaluate the impairment of goodwill.
Goodwill is allocated to each of our reporting units, which is defined as an operating segment or one level below an operating segment, upon acquisition after considering the nature of the net assets giving rise to the goodwill and how each reporting unit would enjoy the benefits and synergies of the net assets acquired. Goodwill is also evaluated for impairment at the reporting unit level. We have two reporting units:units for goodwill evaluation purposes: the FUEL CHEM technology segment and the APC technology segment. There is no goodwill associated with either our APC or Fuel Conversion business segment.
During the fourth quarter of 2014, we experienced a decrease in our stock price that caused our market capitalization to fall below the equity value on our consolidated balance sheet, which can be a potential indicator of goodwill impairment. This, along with an overall slowdown in APC technology segment orders and corresponding downward adjustments to our financial forecasts, was considered during a detailed evaluation of the fair value of our reporting units. Fuel Tech performed its annual goodwill impairment analysis for each of its reporting units as of October 1, 2014 and determined that no impairment of goodwill existed within the FUEL CHEM technology segment. At the same time, we determined that our APC technology reporting unit failed the first step test because the estimated fair value of the reporting unit was less than its carrying value, thus requiring additional analysis of the segment. Based on this additional analysis, Fuel Tech determined that the current fair value of the APC technology reporting unit as of the test date was less than the fair value of the assets and liabilities of the unit, resulting in an implied fair value of goodwill of zero, and accordingly we recorded a non-cash goodwill impairment charge in the fourth quarter of 2014 of $23,400 representing the full carrying value of goodwill related to this reporting unit.
The following table shows our goodwill activity by reporting unit during the periods ending December 31, 20142016 and 2013:2015:
| 2014 | 2016 | |||||||||||||||||||||||||||||||
| Reporting Unit | Beginning Carrying Amount | Acquired Goodwill | Impairment Charge | Ending Carrying Amount | Beginning Carrying Amount | Acquired Goodwill | Impairment Charge | Ending Carrying Amount | ||||||||||||||||||||||||
| FUEL CHEM Technology Segment | $ | 2,116 | $ | — | $ | — | $ | 2,116 | $ | 2,116 | $ | — | $ | — | $ | 2,116 | ||||||||||||||||
| APC Technology Segment | 18,935 | 4,465 | (23,400 | ) | — | — | — | — | — | |||||||||||||||||||||||
| $ | 21,051 | $ | 4,465 | $ | (23,400 | ) | $ | 2,116 | $ | 2,116 | $ | — | $ | — | $ | 2,116 | ||||||||||||||||
| 2013 | 2015 | |||||||||||||||||||||||||||||||
| Reporting Unit | Beginning Carrying Amount | Acquired Goodwill | Impairment Charge | Ending Carrying Amount | Beginning Carrying Amount | Acquired Goodwill | Impairment Charge | Ending Carrying Amount | ||||||||||||||||||||||||
| FUEL CHEM Technology Segment | $ | 2,116 | $ | — | $ | — | $ | 2,116 | $ | 2,116 | $ | — | $ | — | $ | 2,116 | ||||||||||||||||
| APC Technology Segment | 18,935 | — | — | 18,935 | — | — | — | — | ||||||||||||||||||||||||
| $ | 21,051 | $ | — | $ | — | $ | 21,051 | $ | 2,116 | $ | — | $ | — | $ | 2,116 | |||||||||||||||||
| 2014 | ||||||||||||||||||||||||||||||||
| Reporting Unit | Beginning Carrying Amount | Acquired Goodwill | Impairment Charge | Ending Carrying Amount | ||||||||||||||||||||||||||||
| FUEL CHEM Technology Segment | $ | 2,116 | $ | — | $ | — | $ | 2,116 | ||||||||||||||||||||||||
| APC Technology Segment | 18,935 | 4,465 | (23,400 | ) | — | |||||||||||||||||||||||||||
| $ | 21,051 | $ | 4,465 | $ | (23,400 | ) | $ | 2,116 | ||||||||||||||||||||||||
Other Intangible Assets
Management reviews other finite-lived intangible assets, which include customer lists and relationships, covenants not to compete, patent assets, trade names, and acquired technologies, for impairment when events or changes in circumstances indicate the carrying amount of an asset or asset group may not be recoverable. In the event that impairment indicators exist, a further analysis is performed and if the sum of the expected undiscounted future cash flows resulting from the use of the asset or asset group is less than the carrying amount of the asset or asset group, an impairment loss equal to the excess of the asset or asset group's carrying value over its fair value is recorded. Management considers historical experience and all available information at the time the estimates of future cash flows are made, however, the actual cash values that could be realized may differ from those that are estimated. After performing additional analysis based onIn the fourth quarter of 2016, the Company performed an impairment test of the carrying value of our intangible assets to determine whether any impairment existed given the decline in our stock price and sustained operating losses in our APC segment. The Company determined that the sum of the expected undiscounted future cash flows test relatingattributable to certain intangible assets was less than its carrying value and that an impairment charge was required. The impairment loss primarily related to the developed technology, customer relationships and trademarks acquired in the 2014 acquisition of PECO and FGC. The Company calculated the estimated fair value of the intangible asset by summing the present value of the expected cash flows over its life. The impairment was calculated by deducting the present value of the expected cash flows from the carrying value. This assessment resulted in an impairment charge of $2,074, which was included in “Goodwill and intangible assets attributable to our APC technology segment, it was determined that no impairment losses for any assets or asset group relating to this segment existed. In addition, there were no indicationsimpairment” in the accompanying Consolidated Statements of impairment for any assets or asset group associated with our FUEL CHEM technology segment. As a result, no impairment lossesOperations for the yearsyear ended December 31, 2016.
In the fourth quarter of 2015, the Company performed an impairment test of the carrying value of our intangible assets to determine whether any impairment existed. The Company determined that the sum of the expected undiscounted cash flows attributable to certain intangible assets was less than its carrying value and that an impairment write-down was required. The impairment loss primarily related to the customer lists acquired in the 2009 acquisition of Advanced Combustion Technology and the 2014 2013acquisition of PECO. The Company calculated the estimated fair value of the intangible asset by summing the present value of the expected cash flows over its life. The impairment was calculated by deducting the present value of the expected cash flows from the carrying value. This assessment resulted in an impairment write-down of $1,425, which was included in “Goodwill and 2012 were recorded.intangible assets impairment” in the accompanying Consolidated Statements of Operations for the year ended December 31, 2015.
Third-party costs related to the development of patents are included within other intangible assets on the consolidated balance sheets. As of December 31, 20142016 and 2013,2015, the net patent asset balance, excluding patents acquired in business acquisitions, was $1,583$1,656 and $1,273,$1,699, respectively. The third-party costs capitalized as patent costs during the years ended December 31, 20142016 and 20132015 were $376$166 and $305,$244, respectively. Third-party costs are comprised of legal fees that relate to the review and preparation of patent disclosures and filing fees incurred to present the patents to the required governing body.
Our intellectual property portfolio has been a significant building block for the Air Pollution Control and FUEL CHEM technology segments. The patents are essential to the generation of revenue for our businesses and are essential to protect us from competition in the markets in which we serve. These costs are being amortized on the straight-line method over the period beginning with the patent issuance date and ending on the patent expiration date. Patent maintenance fees are charged to operations as incurred.
In 2014 we acquired intangible assets as a result of the business acquisitions described in Note 2 in the amount of $5,158. In addition, we acquired intellectual property rights and know-how that was not part of a business acquisition in the amount of $3,010 related to the CARBONITE® fuel conversion process that has an estimated useful life of 5 years.
Amortization expense for intangible assets was $1,720, $2,384, $8392,138 and $8982,384 for the years ended December 31, 2014, 20132016, 2015 and 2012,2014, respectively. The table below shows the amortization period and other intangible asset cost by intangible asset as of December 31, 20142016 and 2013,2015, and the accumulated amortization and net intangible asset value in total for all other intangible assets.
| 2014 | 2013 | 2016 | 2015 | |||||||||||||||||||||||||||||||||||||||||||||||||
| Description of Other Intangible | Amortization Period | Gross Carrying Amount | Accumulated Amortization | Net Carrying Amount | Gross Carrying Amount | Accumulated Amortization | Net Carrying Amount | |||||||||||||||||||||||||||||||||||||||||||||
| Description of Other Intangibles | Amortization Period | Gross Carrying Amount | Accumulated Amortization | Net Carrying Amount | Gross Carrying Amount | Accumulated Amortization | Net Carrying Amount | |||||||||||||||||||||||||||||||||||||||||||||
| Customer relationships | 4-15 years | $ | 5,087 | $ | (2,690 | ) | $ | 2,397 | $ | 4,567 | $ | (2,541 | ) | $ | 2,026 | 11-15 years | $ | 3,119 | $ | (2,979 | ) | $ | 140 | $ | 3,633 | $ | (3,114 | ) | $ | 519 | ||||||||||||||||||||||
| Trademarks and trade names | 4-8 years | 441 | (293 | ) | 148 | 351 | (219 | ) | 132 | 8 years | 351 | (351 | ) | — | 441 | (382 | ) | 59 | ||||||||||||||||||||||||||||||||||
| Patent assets | 1-15 years | 2,764 | (987 | ) | 1,777 | 2,388 | (822 | ) | 1,566 | 1- 20 years | 3,100 | (1,444 | ) | 1,656 | 3,007 | (1,210 | ) | 1,797 | ||||||||||||||||||||||||||||||||||
| Acquired technologies | 5-8 years | 7,974 | (1,832 | ) | 6,142 | 1,731 | (1,150 | ) | 581 | 5-8 years | 4,138 | (2,483 | ) | 1,655 | 7,515 | (2,746 | ) | 4,769 | ||||||||||||||||||||||||||||||||||
| Total | $ | 16,266 | $ | (5,802 | ) | $ | 10,464 | $ | 9,037 | $ | (4,732 | ) | $ | 4,305 | $ | 10,708 | $ | (7,257 | ) | $ | 3,451 | $ | 14,596 | $ | (7,452 | ) | $ | 7,144 | ||||||||||||||||||||||||
The table below shows the estimated future amortization expense for intangible assets:
| Year | Estimated Amortization Expense | Estimated Amortization Expense | ||||
| 2015 | $ | 2,072 | ||||
| 2016 | 2,020 | |||||
| 2017 | 1,695 | $ | 805 | |||
| 2018 | 1,530 | 785 | ||||
| 2019 | 1,247 | 574 | ||||
| 2020 | 123 | |||||
| 2021 | 123 | |||||
| Thereafter | 1,900 | 1,041 | ||||
| Total | $ | 10,464 | $ | 3,451 | ||
Property and Equipment
Property and equipment is stated at historical cost. Provisions for depreciation are computed by the straight-line method, using estimated useful lives that range based on the nature of the asset. Leasehold improvements are depreciated over the shorter of the associated lease term or the estimated useful life of the asset. Depreciation expense was $1,780, $1,922, $2,1752,067, and $2,1911,922 for the years ended December 31, 2014, 20132016, 2015 and 2012,2014, respectively. The table below shows the depreciable life and cost by asset class as of December 31, 20142016 and 2013,2015, and the accumulated depreciation and net book value in total for all classes of assets.
| Description of Property and Equipment | Depreciable Life | 2014 | 2013 | Depreciable Life | 2016 | 2015 | ||||||||||||||
| Land | $ | 1,440 | $ | 1,440 | $ | 1,440 | $ | 1,440 | ||||||||||||
| Building | 39 years | 4,535 | 4,535 | 39 years | 4,535 | 4,535 | ||||||||||||||
| Building and leasehold improvements | 3-39 years | 5,115 | 4,898 | 3-39 years | 5,087 | 5,102 | ||||||||||||||
| Field equipment | 3-4 years | 19,796 | 18,006 | 3-4 years | 19,870 | 19,797 | ||||||||||||||
| Computer equipment and software | 2-3 years | 3,005 | 2,677 | 2-3 years | 2,973 | 2,978 | ||||||||||||||
| Furniture and fixtures | 3-10 years | 1,525 | 1,512 | 3-10 years | 1,521 | 1,527 | ||||||||||||||
| Vehicles | 5 years | 36 | 36 | 5 years | 36 | 36 | ||||||||||||||
| Total cost | 35,452 | 33,104 | 35,462 | 35,415 | ||||||||||||||||
| Less accumulated depreciation | (21,925 | ) | (20,077 | ) | (24,542 | ) | (23,414 | ) | ||||||||||||
| Total net book value | $ | 13,527 | $ | 13,027 | $ | 10,920 | $ | 12,001 | ||||||||||||