Indicate by check mark whether the registrant has submitted electronically and posted on its corporate Web site, if any, every Interactive Data File required to be submitted and posted pursuant to Rule 405 of Regulation S-T (§232.405 of this chapter) during the preceding 12 months (or for such shorter period that the registrant was required to submit and post such files). Yes
Indicate by check mark whether the registrant is a large accelerated filer, an accelerated filer, a non-accelerated filer, smaller reporting company, or an emerging growth company. See definitions of “large accelerated filer,” “accelerated filer,” “smaller reporting company,” and “emerging growth company” in Rule 12b-2 of the Exchange Act. (Check one):
Large Accelerated Filer | ☐ | Accelerated Filer | ☐ | ||
Non-accelerated Filer | ☒ | Smaller reporting company | ☒ | ||
Emerging growth company | ☐ | ||||
If an emerging growth company, indicate by check mark if the registrant has elected not to use the extended transition period for complying with any new or revised financial accounting standards provided pursuant to Section 13(a) of the Exchange Act. Yes
Indicate by check mark whether the registrant is a shell company (as defined in Rule 12b-2 of the Exchange Act). Yes
As of June 30, 2018,2020, the aggregate market value of the registrant's common stock held by non-affiliates of the registrant was approximately $23,336,583$21,339,489 based on the closing sale price as reported on the NASDAQ National Market System.
As of February 28, 2019,2021, there were 24,186,82430,228,951 shares of common stock outstanding.
Documents incorporated by reference:
Portions of the definitive Proxy Statement to be delivered to shareholders in connection with the Annual Meeting of Shareholders to be held on May 16, 201920, 2021 are incorporated by reference into Part III.
Page | ||
Item 1. | ||
Item 1A. | ||
Item 1B. | ||
Item 2. | ||
Item 3. | ||
Item 4. | ||
Item 5. | ||
Item 6. | ||
Item 7. | ||
Item 7A. | ||
Item 8. | ||
Item 9. | ||
Item 9A. | ||
Item 9B. | ||
Item 10. | ||
Item 11. | ||
Item 12. | ||
Item 13. | ||
Item 14. | ||
Item 15. | ||
| 61 | ||
TABLE OF DEFINED TERMS
Term | Definition | |
AIG | Ammonia Injection Grid | |
APC | Air Pollution Control Technology | |
ASCR™ | A trademark used to describe our Advanced Selective Catalytic Reduction process | |
CFD | Computational Fluid Dynamics | |
EPA | ||
The U.S. Environmental Protection Agency | ||
ESP | Electrostatic Precipitator | |
FGC | Flue Gas Conditioning | |
FUEL CHEM ® | A trademark used to describe our fuel and flue gas treatment processes, including its TIFI ® Targeted In-Furnace Injection™ technology to control slagging, fouling, corrosion and a variety of sulfur trioxide-related issues | |
GSG™ | Graduated Straightening Grid | |
HERT™ High Energy Reagent Technology™ | A trademark used to describe one of our SNCR processes for the reduction of NOx | |
I-NOx ® | Systems can include LNB, OFA, and SNCR components, along with SCR technology, Ammonia Injection Grid (AIG), and Graduated Straightening Grid (GSG™) system | |
NOx | Oxides of nitrogen | |
NOxOUT® | A trademark used to describe one of our SNCR processes for the reduction of NOx | |
SCR | Selective Catalytic Reduction | |
SNCR | Selective | |
TIFI® Targeted In-Furnace Injection™ | ||
A trademark used to describe our proprietary technology that enables the precise injection of a chemical reagent into a boiler or furnace as part of a FUEL CHEM program | ||
UDI™ | Urea Direct Injection as the process to provide urea reagent directly into a duct for SCR applications | |
| Ultra-Low NOx Burner | ||
ULTRA® | A trademark used to describe our process for generating ammonia for use as a Selective Catalytic Reduction reagent | |
BREF | Best Available Reference Technology. European emission requirements. | |
DGI™ | Dissolved Gas Infusion | |
BACT | ||
Best Available Control Technology |
Forward-Looking Statements
This Annual Report on Form 10-K contains “forward-looking statements,” as defined in Section 21E of the Securities Exchange Act of 1934, as amended, that are made pursuant to the safe harbor provisions of the Private Securities Litigation Reform Act of 1995 and reflect our current expectations regarding our future growth, results of operations, cash flows, performance and business prospects, and opportunities, as well as assumptions made by, and information currently available to, our management. We have tried to identify forward-looking statements by using words such as “anticipate,” “believe,” “plan,” “expect,” “intend,” “will,” and similar expressions, but these words are not the exclusive means of identifying forward-looking statements. These statements are based on information currently available to us and are subject to various risks, uncertainties, and other factors, including, but not limited to, those discussed herein under the caption “Risk Factors” that could cause our actual growth, results of operations, financial condition, cash flows, performance and business prospects and opportunities to differ materially from those expressed in, or implied by, these statements. Except as expressly required by the federal securities laws, we undertake no obligation to update such factors or to publicly announce the results of any of the forward-looking statements contained herein to reflect future events, developments, or changed circumstances or for any other reason. Investors are cautioned that all forward-looking statements involve risks and uncertainties, including those detailed in our filings with the Securities and Exchange Commission. See “Risk Factors” in Item 1A.
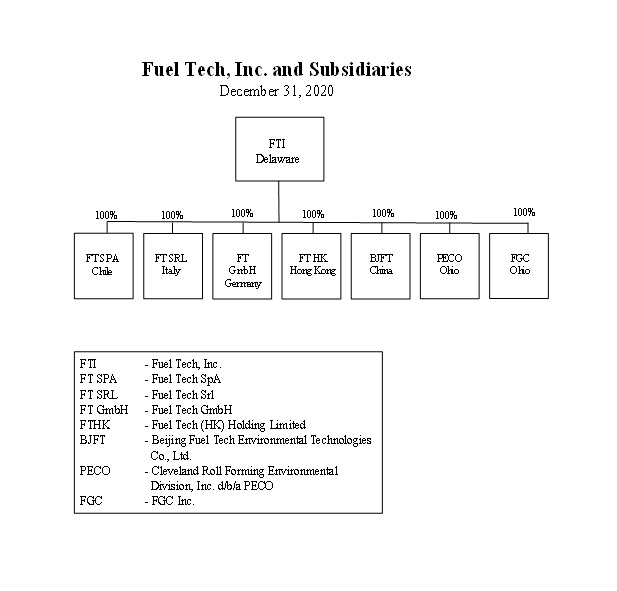
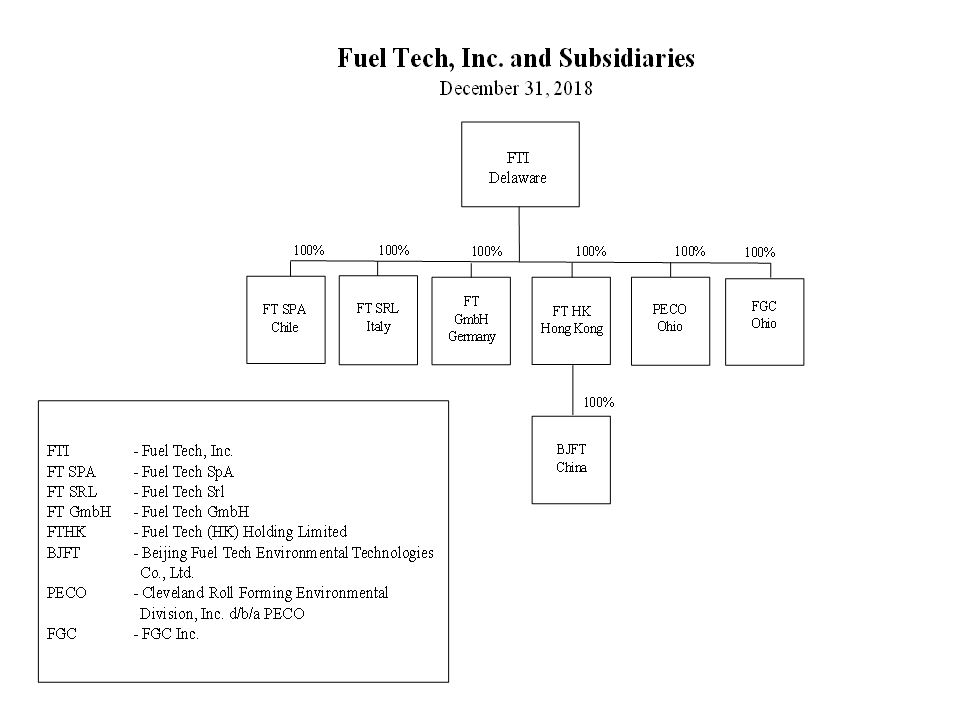
As used in this Annual Report on Form 10-K, the terms “we,” “us,” or “our,” refer to Fuel Tech, Inc. and our wholly-owned subsidiaries.
GENERAL
We are a leading technology company engaged in the worldwide development, commercialization and application of state-of-the-art proprietary technologies for air pollution control, process optimization, water treatment and advanced engineering services. These technologies enable our customers to operate efficiently in a cost-effective and environmentally sustainable manner.
● | The Company’s nitrogen oxide |
● | Fuel Tech’s APC technologies include particulate control with Electrostatic Precipitator (ESP) products and services including complete turnkey capability for ESP retrofits, with experience on units up to 700 MW. Flue gas conditioning (FGC) systems include treatment using sulfur trioxide |
● | Our FUEL CHEM technologies revolve around the unique application of chemical injection programs which improve the efficiency, reliability, fuel flexibility, boiler heat rate and environmental status of combustion units by controlling slagging, fouling, corrosion, opacity and acid plume, as well as the formation of sulfur trioxide, ammonium bisulfate, particulate matter |
● | Water treatment technologies include DGI™ Dissolved Gas Infusion Systems which utilize a patented nozzle and a patent-pending saturator to provide a competitive advantage over conventional utility and industrial aeration. An innovative alternative to current aeration technology among other applications, DGI systems can deliver supersaturated oxygen solutions and other gas-water combinations to target process applications or environmental issues. This infusion process has a variety of applications in the water and wastewater industries, including remediation, treatment, biological activity and wastewater odor management. DGI technology benefits include reduced energy consumption, installation costs, and operating costs, while improving treatment performance. The DGI technology is currently in the demonstration phase with limited revenues. |
Many of our products and services rely heavily on our computational fluid dynamics and chemical kinetics modeling capabilities, which are enhanced by internally developed, high-end visualization software. These capabilities, coupled with our innovative technologies and multi-disciplined team approach, enable us to provide practical solutions to some of our customers' most challenging issues.
Regulations and Markets: Domestic
The continuedfuture growth of our APC technology segment is dependent upon the adoption and enforcement of environmental regulations in the U.S. and globally. In the U.S., federal and state laws regulating the emission of NO
Clean Air Act:
The Clean Air Act (CAA) requires the U.S. Environmental Protection Agency (EPA) to establish national ambient air quality standards (NAAQS) at levels that are protective of public health with an adequate margin of safety. The six pollutants specified include: OzoneClean Air Visibility Rule (CAVR):
The Clean Air Visibility Rule (CAVR), also known as the Regional Haze rule, is part of the Clean Air Act and was finalized in 2005. Under CAVR, certain States are required to submit implementation plans to the EPA to comply with the Regional Haze requirements, and updates are required every five years. A new CAVR was issued in January 2017 which requires states to implement new air pollution controlsNew Unit Permits:
New gas fired units for both electricity generation and industrial use will require BACTConsent Decrees:
Consent decree activity through the US Department of Justice or EPA may require emission sources to meet individual requirements. Sources may also agree to specific air pollution requirements with states or environmental groups.Regulations and Markets: International
We also sell NO
The European Union published the BREF (Best Available Reference Technology) emission guidelines in mid 2017 that further lowered emission targets over a span of the next four years. The compliance timeline is expected to be extended due to slow initial adoption. These measures are expected to lower the environmentenvironmental impact of more than 3,000 large combustion plants throughout the European Union. Moreover, European countries that are not current EU members are expected to adopt these new standards as part of their approach to gain EU membership. Despite the significant expansion of renewable energy throughout Europe, the EU and neighboring states still rely heavily on coal generation to provide a stable base load to their power and heating demands. The BREF guidelines reduce NOx limit values by up to 25% which will require an upgrade of first generationthe first-generation NOx abatement systems, and that is expected to present new opportunities for Fuel Tech. However, the placepace of implementation will still be dependent on each country's internal processes.
The Indian government's initial compliance deadline of December 2017government has been delayed, but adoption of emission control technologies has started and it is expected to progress at a faster pace in 2019. After a wave of FGD implementation to address SOx, the focus is now shifting to NOx and PM control. This shift is expected to result inadopted a higher demandNOx emission standard for legacy power plants than what was initially agreed to in 2015 as part of the Paris Agreement. As a result, SNCR systems will be limited to WTE / industrial units for the foreseeable future. Particulate Matter (PM) emission reductions continue to be an area of focus in the country and that presents an opportunity for Fuel Tech's SNCRTech’s DFGC technology application which involves sulfur trioxide and flue gas conditioningammonia injection. These technologies which will be implemented through a collaboration with our local partner ISGEC.
Elsewhere in Southeast Asia, particulate emissions due to poor performing ESPs have been gaining attention byfrom local authorities. Power generators in several countries like Vietnam, Malaysia and the Philippines are actively looking for corrective options and this presents Fuel Tech with opportunities to bring our DFGC technology to these markets.
Products
Our NO
● | SCR Systems and Services: Our |
● | ULTRA Technology: OurULTRA® process is designed to convert urea to ammonia safely and economically for use as a reagent in the SCR process for NOx reduction. Recent local objections in the ammonia permitting process have raised concerns regarding the safety of ammonia shipment and storage in quantities sufficient to supply SCR. In addition, the Department of Homeland Security has characterized anhydrous ammonia as a Toxic Inhalation Hazard commodity. The safe conversion of urea to ammonia just prior to injection into the flue gas duct is particularly important near densely populated cities, major waterways, harbors or islands, or where the storage or transport of anhydrous or aqueous ammonia is a safety concern. UDI™ Urea Direct Injection systems utilize direct injection of urea reagent without the need for an ammonia injection grid. |
● | SNCR Systems: Our |
● | I-NOx® Systems: Our I-NOx® systems can include burner modifications, and SNCR components, along with SCR technology, Ammonia Injection Grid (AIG), and Graduated Straightening Grid (GSG™) system. Together, these systems provide up to 90% NOx reduction at significantly lower capital and operating costs than conventional SCR systems |
● | ESP Processes and Services: ESP technologies for particulate control include Electrostatic Precipitator (ESP) products and services including ESP Inspection Services, Performance Modeling, and Performance and Efficiency Upgrades, along with complete turnkey capability for ESP retrofits. Flue gas conditioning (FGC) systems include treatment using sulfur trioxide |
● | Burner Systems: Low |
A key market dynamicfactor for the APC product line is the continued use of coal and the growth of biomass for global electricity production. Coal currently accounts for approximately 30% of all U.S. electricity generation and roughly 69% of Chinese electricity generation. Major coal consumers include China, the United States and India. The growth of natural gas in the U.S. for industrial applications has increased the need for SCR technology since it often meets the definition of Best Available Control TechnologyBACT and is required on new industrial units.
Sales of APC products were $38.4 million, $27.8$8.6 million and $34.1$14.1 million for the years ended December 31, 2018, 20172020 and 2016,2019, respectively.
Competition with our NO
The SCR process is an effective and proven method of control for removal of NO
The use of both urea and ammonia as the reagent for the SNCR process can reduce NO
ESP retrofit competitors include B&W, Southern Environmental and Hamon. Flue Gas Conditioning competition includes Wahlco, Inc. and Chemithon, Inc.
Lastly, with respect to urea-to-ammonia conversion technologies, a competitive approach to our controlled urea decomposition system competes with Hamon and Wahlco, Inc., which manufacturesmanufacture a system that hydrolyzes urea under high temperature and pressure.
APC Backlog
Consolidated APC segment backlog at December 31, 20182020 was $12.4$5.3 million versus backlog at December 31, 20172019 of $22.1$9.7 million. A substantial portionThe Company expects to recognize revenue on approximately $3.0 million of the backlog as of December 31, 2018 should beover the next 12 months with the remaining recognized as revenue in fiscal 2019, although the timing of such revenue recognition in 2019 is subject to the timing of the expenses incurred on existing projects.
FUEL CHEM
Product and Markets
The FUEL CHEM
® technology segment revolves around the unique application of specialty chemicals to improve the efficiency, reliability and environmental status of plants operating in the electric utility, industrial, pulp and paper, waste-to-energy, and university and district heating markets. FUEL CHEM programs are currently in place on combustion units in North America, Mexico and Europe, treating a wide variety of solid and liquid fuels, including coal, heavy oil, black liquor, biomass and municipal waste.Central to the FUEL CHEM approach is the introduction of chemical reagents, such as magnesium hydroxide, to combustion units via in-body fuel application (pre-combustion) or via direct injection (post-combustion) utilizing our proprietary TIFI
® technology. By attacking performance-hindering problems, such as slagging, fouling and corrosion, as well as the formation of sulfur trioxideA key market dynamicfactor for this product line is the continued use of coal for global electricity production. Coal currently accounts for approximately 30%21% of all U.S. electricity generation and roughly 69%33% of Chineseglobal electricity generation. Major coal consumers include the United States, China and India. Additional market dynamics include a growing, worldwide utilization of biomass for both steam and electrical production, as well asand the strengthening of the pulp and paper industry worldwide, resulting in black liquor recovery boilers needing to maximize throughput. A new potential driver in the US is the Affordable Clean Energy (ACE) Rule issued by EPA in 2018 as a replacement for the Clean Power Plan which EPA has repealed. This Rule calls for thecontinued use of a wide range of available boiler heat rate improvement technologies to improve efficiency to reduce greenhouse gas emissions.
The combination of slagging coals and SO
Sales of the FUEL CHEM products were $18.1 million, $17.4$14.0 million and $21.1$16.4 million, for the years ended December 31, 2018, 20172020 and 2016,2019, respectively.
Competition
Competition for our FUEL CHEM product line includes chemicals sold by specialty chemical companies, such as Imerys, Environmental Energy Services, Inc., and SUEZ Water Technologies. No technologically comparable substantive competition currently exists for our TIFI technology, which is designed primarily for slag control and SO
INTELLECTUAL PROPERTY
The majority of our products are protected by U.S. and non-U.S. patents. We own 5347 granted patents worldwide and 153 allowed utility model patents in China. We have 1514 patent applications pending;pending: including 45 in the United States and 119 in non-U.S. Jurisdictions. These patents and applications cover some 2927 inventions, 1613 associated with our NO
Management believes that the protection provided by the numerous claims in the above referenced patents or patent applications is substantial and affordaffords us a significant competitive advantage in our business. Accordingly, any significant reduction in the protection afforded by these patents or any significant development in competing technologies could have a material adverse effect on our business.
EMPLOYEES
At December 31, 2018,2020, we had 11373 employees, 8266 in North America, 23two in China and eightfive in Europe. We enjoy good relations with our employees and are not a party to any labor management agreement.
HUMAN CAPITAL RESOURCES
We manage our Company according to a set of core principles. Included among these are respect for the individual, aspiring to excellence, safety and security, and appropriate reward for outstanding effort. We have put in place an employee compensation plan that recognizes hard work with above average salaries and equity incentive awards. We have returned to face-to-face work in our day-to-day activities, but we have implemented training and provided guidance for our teams to operate safely even in a face-to-face environment. As a technology company, we prize and reward educational achievement. Among our employees are found a large cohort of doctorates as well as other advanced degrees and professional certifications. We expect that these approaches to managing and empowering our human capital will continue to guide our progress in the future.
There are no material Related Party transactions to disclose. The Company's lease of our Board, is a stockholder ofcertain office space to American Bailey Corporation (ABC), which is a related party. Please refer to Note 11 to the consolidated financial statementsCorp. reported in thisour Form 10-K for information about our transactions with ABC. Additionally, see the more detailed information relating to this subject under the caption “Certain Relationships and Related Transactions” in our definitive Proxy Statement to be distributed in connection with ouryear ended December 31, 2019 Annual Meetingended as of Stockholders, which information is incorporated by reference.
AVAILABLE INFORMATION
We are a fully integrated company using a suite of advanced technologies to provide boiler optimization, efficiency improvement and air pollution reduction and control solutions to utility and industrial customers worldwide. Originally incorporated in 1987 under the laws of the Netherlands Antilles as Fuel-Tech N.V., we were domesticated in the United States on September 30, 2006, and continue as a Delaware corporation with our corporate headquarters at 27601 Bella Vista Parkway, Warrenville, Illinois, 60555-1617. Fuel Tech maintains an Internet website at
www.ftek.com. Our Annual Report on Form 10-K, quarterly reports on Form 10-Q, current reports on Form 8-K and any amendments to those reports filed or furnished pursuant to Section 13(a) of the Exchange Act are made available through our website as soon as reasonably practical after we electronically file or furnish the reports to the Securities and Exchange Commission. Our website also contains our Corporate Governance Guidelines and Code of Ethics and Business Conduct, as well as the charters of the Audit, Compensation, and Nominating and Corporate Governance committees of the Board of Directors. All of these documents are available in print without charge to stockholders who request them. Information on our website is not incorporated into this report.Investors in our Common Shares should be mindful of the following risk factors relative to our business.
Our Product Portfolio Lacks Diversification
We have two broad technology segments that provide advanced engineering solutions to meet the pollution control, efficiency improvement, and operational optimization needs of coal-fired energy-related facilities worldwide. They are as follows:
• | The Air Pollution Control technology segment includes technologies to reduce |
• | The FUEL CHEM ® technology segment which uses chemical processes in combination with advanced Computational Fluid Dynamics (CFD) and Chemical Kinetics Modeling (CKM) boiler modeling for the control of slagging, fouling, corrosion, opacity and other sulfur trioxide-related issues in furnaces and boilers through the addition of chemicals into the furnace using TIFI® Targeted In-Furnace Injection™ technology. |
An adverse development in our advanced engineering solutionsolutions business as a result of competition, technological change, government regulation, customers converting to use natural gas or other fuels, or any other factor could have a significantly greater impact than if we maintained more diverse operations.
We Face Substantial Competition
Competition in the Air Pollution Control market comes from competitors utilizing their own NO
Competition for our FUEL CHEM markets include chemicals sold by specialty chemical companies, such as Imerys, Environmental Energy Services, Inc., and SUEZ Water Technologies.
Demand for Our APC and FUEL CHEM Products is Affected by External Market Factors
Reduced coal-fired electricity demand across the United States has led to coal-fired electricity production declines. Contributing factors to this decline in coal-fired generations weregeneration were: 1) lower natural gas prices which allowed utility operators to increase the amount of power generated from natural gas plants, 2) increased cost of environmental compliance with current environmental regulations, 3) constrained funding for capital projects, and 4) the uncertainty of regulation resultedresulting in electricity generating unit operators delaying investment in NO
Our Business Is Dependent on Continuing Air Pollution Control Regulations and Enforcement
Our business is significantly impacted by and dependent upon the regulatory environment surrounding the electricity generation market. Our business will be adversely impacted to the extent that regulations are repealed or amended to significantly reduce the level of required NO
Our Dependence Upon Fixed-price Contracts Could Adversely Affect our Operating Results.
The majority of our air pollution control projects are currently performed on a fixed-price basis. Under a fixed-price contract, we agree on the price that we will receive for the entire project, based upon a defined scope, which includes specific assumptions and project criteria. If our estimates of the costs to complete the project are below the actual costs that we incur, our margins will decrease, or we may incur a loss. The revenue, cost and gross profit realized on a fixed-price contract will often vary from the estimated amounts because of unforeseen conditions or changes in job conditions and variations in labor and equipment productivity over the term of the contract. While our fixed-price contracts are typically not individually material to our operating results, if we are unsuccessful in mitigating these risks, we may realize gross profits that are different from those originally estimated and incur reduced profitability or losses on projects. Depending on the size of a project, these variations from estimated contract performance could have a significant effect on our operating results. In general, turnkey contracts to be performed on a fixed-price basis involve an increased risk of significant variations. Generally, our contracts and projects vary in length, depending on the size and complexity of the project, project owner demands and other factors. The foregoing risks are exacerbated for projects with longer-term durations and the inherent difficulties in estimating costs and of the interrelationship of the integrated services to be provided under these contracts whereby unanticipated costs or delays in performing part of the contract can have compounding effects by increasing costs of performing other parts of the contract.
Our Financial Performance May Vary Significantly From Period to Period.
Our annual revenues and earnings have varied in the past and are likely to vary in the future. Our contracts generally stipulate customer specific delivery terms and may have contract cycles of a year or more, which subjects these contracts to many factors beyond our control. In addition, contracts that are significantly larger in size than our typical contracts tend to intensify their impact on our annual operating results. Furthermore, as a significant portion of our operating costs are fixed, an unanticipated decrease in our revenues, a delay or cancellation of orders in backlog, or a decrease in the demand for our products, may have a significant impact on our annual operating results. Therefore, our annual operating results may be subject to significant variations and our operating performance in one period may not be indicative of our future performance.
Customers May Cancel or Delay Projects.
Customers may cancel or delay projects for reasons beyond our control. Our orders normally contain cancellation provisions that permit us to recover our costs, and, for most contracts, a portion of our anticipated profit in the event a customer cancels an order. If a customer elects to cancel an order, we may not realize the full amount of revenues included in our backlog. If projects are delayed, the timing of our revenues could be affected and projects may remain in our backlog for extended periods of time. Revenue recognition occurs over long periods of time and is subject to unanticipated delays. If we receive relatively large orders in any given quarter, fluctuations in the levels of our quarterly backlog can result because the backlog in that quarter may reach levels that may not be sustained in subsequent quarters.
Our Manufacturing Operations Are Dependent on Third-party Suppliers.
Although we are not dependent on any one supplier, we are dependent on the ability of our third-party suppliers to supply our raw materials, as well as certain specific component parts. The third-party suppliers upon which we depend may default on their obligations to us due to bankruptcy, insolvency, lack of liquidity, adverse economic conditions, operational failure, fraud, loss of key personnel, or other reasons. We cannot assure that our third-party suppliers will dedicate sufficient resources to meet our scheduled delivery requirements or that our suppliers will have sufficient resources to satisfy our requirements during any period of sustained demand. Failure of suppliers to supply, or delays in supplying, our raw materials or certain components, or allocations in the supply of certain high demand raw components, for any reason, including, without limitation, disruptions in our suppliers’ due to cybersecurity incidents, terrorist activity, public health crises (such as coronavirus), fires or other natural disasters could materially adversely affect our operations and ability to meet our own delivery schedules on a timely and competitive basis. Additionally, our third-party suppliers may provide us with raw materials or component parts that fail to meet our expectations or the expectations of our customers, which could subject us to product liability claims, other claims and litigation.
Our Use of Subcontractors Could Potentially Harm our Profitability and Business Reputation.
Occasionally we act as a prime contractor in some of the engineered projects we undertake. In our capacity as lead provider and when acting as a prime contractor, we perform a portion of the work on our projects with our own resources and typically subcontract activities such as manufacturing and installation work. In our industry, the lead contractor is normally responsible for the performance of the entire contract, including subcontract work. Thus, when acting as a prime contractor, we are subject to risk associated with the failure of one or more subcontractors to perform as anticipated.
We employ subcontractors at various locations around the world to meet our customers’ needs in a timely manner, meet local content requirements and reduce costs. Subcontractors perform all of our manufacturing for customers. The use of subcontractors decreases our control over the performance of these functions and could result in project delays, escalated costs and substandard quality. These risks could adversely affect our profitability and business reputation. In addition, many of our competitors, who have greater financial resources and greater bargaining power than we have, use the same subcontractors that we use and could potentially influence our ability to hire these subcontractors. If we were to lose relationships with key subcontractors, our business could be adversely impacted.
We Rely on Several Key Employees Whose Absence or Loss Could Disrupt our Operations or Be Adverse to our Business.
We are highly dependent on the experience of our management in the continuing development of our operations. The loss of the services of certain of these individuals would have a material adverse effect on our business. Although we have employment and non-competition agreements with certain of our key employees, as a practical matter, those agreements will not assure the retention of our employees, and we may not be able to enforce all of the provisions in any employment or non-competition agreement. Our future success will depend in part on our ability to attract and retain qualified personnel to manage our development and future growth. We cannot guarantee that we will be successful in attracting and retaining such personnel. Our failure to recruit additional key personnel could have a material adverse effect on our financial condition, results of operations and cash flows.
We May Not Be Able to Successfully Protect our Patents and Proprietary Rights
We hold licenses to or own a number of patents for our products and processes. In addition, we also have numerous patent applications pending both in the U.S. and abroad. There can be no assurance that any of our pending patent applications will be granted or that our outstanding patents will not be challenged, overturned or otherwise circumvented by competitors. In foreign markets, the absence of harmonized patent laws makes it more difficult to ensure consistent respect for our patent rights in emerging markets. In addition, certain critical technical information relating to our products which is not patented is held as trade secret, and protected by trade secret laws and restrictions on disclosure contained in our confidentiality and licensing agreements. There can be no assurance that such protections will prove adequate or that we will have adequate remedies against contractual counterparties for disclosure of our trade secrets or other violations of our intellectual property rights. See Item 1 above under the caption
“Intellectual Property.”Our Results May Be Affected By Foreign Operations
We currently have foreign operations predominantly in Europe with our operationsoffices located in China by establishing a wholly-owned subsidiary in Beijing. On January 17, 2019, we announced the suspension of further business development activity for its Air Pollution Control operation in Beijing. Our future financial results will be impacted by our ability to successfully complete the wind-down activities in Beijing during 2019.
On January 18, 2019, we announced the suspension of further business development activity for its Air Pollution Control operation in Beijing, China. Our future financial results will be impacted by our ability to successfully complete the remaining wind-down activities in Beijing during 2021.
In 2012, we expanded our operations in Latin and South America by establishing a wholly-owned subsidiary in Chile.We are in the process of successfully completing the closure of this subsidiary in Chile during 2021 given all of our existing Air Pollution Control operations are now complete.
Our Operating Results May Be Adversely Affected by Product Pricing
The onset of significant competition for either of the technology segments might require us to lower our product prices in order to remain competitive and have a corresponding adverse impact on our realized gross margins and operating profitability. See the risk factor entitled “We Face Substantial Competition” above.
We May Not Be Able to Purchase Raw Materials on Commercially Advantageous Terms
Our FUEL CHEM technology segment is dependent, in part, upon a supply of magnesium hydroxide. Any adverse changes in the availability of this chemical will likely have an adverse impact on ongoing operation of our FUEL CHEM programs. On March 4, 2009, we entered into a Restated Product Supply Agreement (“PSA”) with Martin Marietta Magnesia Specialties, LLC (MMMS) in order to assure the continuance of a stable supply from MMMS of magnesium hydroxide products for our requirements in the United States and Canada. The term of the PSA expires on December 31, 2019.2021. Pursuant to the PSA, MMMS supplies us with magnesium hydroxide products manufactured pursuant to our specifications and we have agreed to purchase from MMMS, and MMMS has agreed to supply, 100% of our requirements for such magnesium hydroxide products for our customers who purchase such products for delivery in the United States and Canada. There can be no assurance that we will be able to obtain a stable source of magnesium hydroxide in markets outside the United States.
Our Customer Base Is Highly Concentrated
A small number of customers have historically accounted for a significant portion of our revenues. There can be no assurance that our current customers will continue to place orders, that orders by existing customers will continue at the levels of previous periods, or that we will be able to obtain orders from new customers. The loss of one or more of our customers could have a material adverse effect on our sales and operating results.
There Is Still Significant Uncertainty Related to Borrow Funds Pursuantthe COVID-19 Pandemic; Future Pandemics Could Pose Similar Challenges
The emergence of the coronavirus (COVID-19) around the world presents significant risks to our Credit Facilities
Management cannot predict the full impact of the COVID-19 pandemic on the Company's sales and marketing channels and supply chain, and, as a result, the ultimate extent of the effects of the COVID-19 pandemic on the Company is highly uncertain and will be successful independ on future developments. Such effects could exist for an extended period of time even after the renewal of its credit agreement, or if obtained, thatpandemic ends and any future such financing will be in a similar amount or be on similar terms and conditions as the Company's current credit agreement.
ITEM 1B - UNRESOLVED STAFF COMMENTS
None
We own an office building in Warrenville, Illinois, which has served as our corporate headquarters since June 23, 2008. This facility, with approximately 40,000 square feet of office space, is sufficient to meet our requirements for the foreseeable future.
We also operate from leased office facilities and we do not segregate any of these leased facilities by operating business segment. The terms of the Company's eightthree primary lease arrangements as of December 31, 2020 are as follows:
The Gallarate, Italy building lease, for approximately 1,6361,335 square feet, runs from May 1, 20132019 to April 30, 2019.2025. This facility serves as the operating headquarters for our European operations.
The Aurora, IL warehouse lease, for approximately 11,000 square feet, runs from September 1, 2013 to December 31, 2020. This facility serves as an outside warehouse facility. On January 30, 2020, the Company extended the lease for three years to expire on December 31, 2023.
The Overland Park, KS lease, for approximately 600 square feet, runs from October 16, 2018 to October 15, 2021. This facility serves primarily as a sales office.
From time to time we are involved in litigation with respect to matters arising from the ordinary conduct of our business. In the opinion of management, based upon presently available information, either adequate provision for anticipated costs have been accrued or the ultimate anticipated costs will not materially affect our consolidated financial position, results of operations, or cash flows.
See Note 9 "Commitments and Contingencies" in the Notes to the Consolidated Financial Statements in this Annual Report on Form 10-K.
Not Applicable
ITEM 5 - MARKET FOR REGISTRANT’S COMMON EQUITY, RELATED STOCKHOLDER MATTERS AND ISSUER PURCHASE OF EQUITY SECURITIES
Market
Our Common Shares have been traded since September 1993 on The NASDAQ Stock Market, Inc, where it trades under the symbol FTEK.
Prices
The table below sets forth the high and low sales prices during each calendar quarter since January 2017.
| 2018 | High | Low | ||||||
| Fourth Quarter | $ | 1.49 | $ | 1.15 | ||||
| Third Quarter | 1.42 | 0.97 | ||||||
| Second Quarter | 1.42 | 1.00 | ||||||
| First Quarter | 1.57 | 1.00 | ||||||
| 2017 | High | Low | ||||||
| Fourth Quarter | $ | 1.17 | $ | 0.91 | ||||
| Third Quarter | 1.14 | 0.79 | ||||||
| Second Quarter | 0.99 | 0.76 | ||||||
| First Quarter | 1.28 | 1.02 | ||||||
2020 | High | Low | ||||||
Fourth Quarter | $ | 7.04 | $ | 0.69 | ||||
Third Quarter | 1.40 | 0.60 | ||||||
Second Quarter | 1.49 | 0.35 | ||||||
First Quarter | 1.00 | 0.30 | ||||||
2019 | High | Low | ||||||
Fourth Quarter | $ | 1.08 | $ | 0.84 | ||||
Third Quarter | 1.43 | 0.82 | ||||||
Second Quarter | 2.80 | 1.22 | ||||||
First Quarter | 1.85 | 1.17 | ||||||
Dividends
We have never paid cash dividends on the Common Shares and have no current plan to do so in the foreseeable future. The declaration and payment of dividends on the Common Shares are subject to the discretion of our Board of Directors. The decision of the Board of Directors to pay future dividends will depend on general business conditions, the effect of a dividend payment on our financial condition, and other factors the Board of Directors may consider relevant. The current policy of the Board of Directors is to reinvest earnings in operations to promote future growth.
Holders
As of February 28, 2019,March 3, 2021, there were 9896 holders of record of our common stock, which does not include the number of beneficial owners whose common stock was held in street name or through fiduciaries.
NASDAQ Delisting Notice
On January 7, 2020, Fuel Tech, Inc. (the “Company”) received a letter from the Listing Qualifications Department of The NASDAQ Stock Market (“NASDAQ”) notifying the Company that, based upon the closing bid price of the Company’s common stock that trades under the symbol “FTEK” (“Common Stock”), for the last 30 consecutive business days the Common Stock did not meet the minimum bid price of $1.00 per share required for continued listing on NASDAQ pursuant to NASDAQ Listing Rule 5450(a)(1) (the “Minimum Bid Rule”), initiating an automatic 180 calendar-day grace period for the Company to regain compliance.
In accordance with NASDAQ Listing Rule 5810(c)(3)(A), the Company had a period of 180 calendar days from the date of the notification, or until July 6, 2020 to achieve compliance with the Minimum Bid Rule. The Company received an extension to March 17, 2021 and regained compliance with the Minimum Bid Rule in December of 2020 when the Company’s Common Stock closed at or above $1.00 per share for a minimum of 10 consecutive business days.
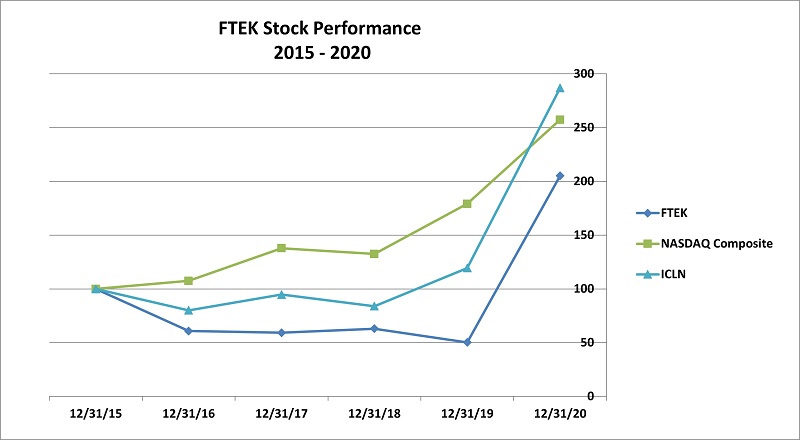
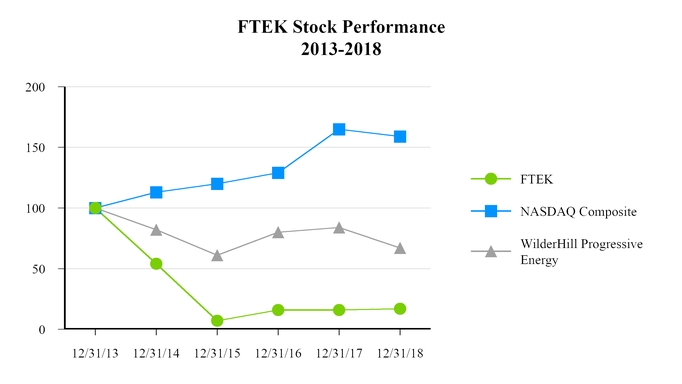
The following line graph compares our total return to stockholders per common share for the five years ended December 31, 20182020 to that of the NASDAQ Composite Index and the WilderHill ProgressiveS&P Global Clean Energy Index Fund for the period December 31, 20132014 through December 31, 2018.2020. The graph tracks the performance of a $100 investment in the Company's common stock and in each of the indexes (with the reinvestment of all dividends) on December 31, 2013.2015.
Selected financial data are presented below as of the end of and for each of the fiscal years in the five-year period ended December 31, 2018.2020. The selected financial data should be read in conjunction with the audited consolidated financial statements as of and for the year ended December 31, 2018,2020, and “Management’s Discussion and Analysis of Financial Condition and Results of Operations” included elsewhere in this report and the schedules thereto.
| For the years ended December 31 | ||||||||||||||||||||
| CONSOLIDATED STATEMENT OF OPERATIONS DATA | 2018 | 2017 | 2016 | 2015 | 2014 | |||||||||||||||
| (in thousands of dollars, except for share and per-share data) | ||||||||||||||||||||
| Revenues | $ | 56,535 | $ | 45,166 | $ | 55,161 | $ | 73,664 | $ | 79,017 | ||||||||||
| Cost of sales | 36,471 | 27,144 | 36,367 | 45,107 | 43,889 | |||||||||||||||
| Selling, general and administrative | 18,564 | 20,933 | 25,564 | 30,897 | 35,432 | |||||||||||||||
| Restructuring charge | — | 119 | 1,428 | 219 | — | |||||||||||||||
| Research and development | 1,073 | 1,070 | 1,752 | 1,447 | 1,459 | |||||||||||||||
| Impairment and abandonment charges | 317 | 2,965 | 2,074 | 1,425 | 23,400 | |||||||||||||||
| Operating (loss) income from continuing operations | 110 | (7,065 | ) | (12,024 | ) | (5,431 | ) | (25,163 | ) | |||||||||||
| Net loss from continuing operations | 85 | (6,535 | ) | (14,588 | ) | (9,554 | ) | (17,448 | ) | |||||||||||
| Loss from discontinued operations | (113 | ) | (3,914 | ) | (2,800 | ) | (2,826 | ) | (277 | ) | ||||||||||
| Net loss | $ | (28 | ) | $ | (10,449 | ) | $ | (17,388 | ) | $ | (12,380 | ) | $ | (17,725 | ) | |||||
| Net loss per common share: | ||||||||||||||||||||
| Basic | ||||||||||||||||||||
| Continuing operations | $ | — | $ | (0.28 | ) | $ | (0.62 | ) | $ | (0.41 | ) | $ | (0.77 | ) | ||||||
| Discontinued operations | — | (0.16 | ) | (0.12 | ) | (0.13 | ) | (0.01 | ) | |||||||||||
| Basic net loss per common share | $ | — | $ | (0.44 | ) | $ | (0.74 | ) | $ | (0.54 | ) | $ | (0.78 | ) | ||||||
| Diluted | ||||||||||||||||||||
| Continuing operations | $ | — | $ | (0.28 | ) | $ | (0.62 | ) | $ | (0.41 | ) | $ | (0.77 | ) | ||||||
| Discontinued operations | — | (0.16 | ) | (0.12 | ) | (0.13 | ) | (0.01 | ) | |||||||||||
| Diluted net loss per common share | $ | — | $ | (0.44 | ) | $ | (0.74 | ) | $ | (0.54 | ) | $ | (0.78 | ) | ||||||
| Weighted-average basic shares outstanding | 24,164,000 | 23,872,000 | 23,365,000 | 23,101,000 | 22,782,000 | |||||||||||||||
| Weighted-average diluted shares outstanding | 24,164,000 | 23,872,000 | 23,365,000 | 23,101,000 | 22,782,000 | |||||||||||||||
| December 31 | ||||||||||||||||||||
| CONSOLIDATED BALANCE SHEET DATA | 2018 | 2017 | 2016 | 2015 | 2014 | |||||||||||||||
| (in thousands of dollars) | ||||||||||||||||||||
| Working capital | $ | 23,556 | $ | 18,025 | $ | 26,585 | $ | 35,865 | $ | 39,688 | ||||||||||
| Total assets | 51,719 | 50,484 | 57,788 | 76,011 | 91,471 | |||||||||||||||
| Long-term obligations | 335 | 420 | 346 | 501 | 520 | |||||||||||||||
| Total liabilities | 17,667 | 16,312 | 15,099 | 17,740 | 19,170 | |||||||||||||||
| Stockholders’ equity (1) | 34,052 | 34,172 | 42,689 | 58,271 | 72,301 | |||||||||||||||
For the years ended December 31 | ||||||||||||||||||||
CONSOLIDATED STATEMENT OF OPERATIONS DATA | 2020 | 2019 | 2018 | 2017 | 2016 | |||||||||||||||
(in thousands of dollars, except for share and per-share data) | ||||||||||||||||||||
Revenues | $ | 22,550 | $ | 30,467 | $ | 56,535 | $ | 45,166 | $ | 55,161 | ||||||||||
Cost of sales | 11,912 | 19,637 | 36,471 | 27,144 | 36,367 | |||||||||||||||
Selling, general and administrative | 13,600 | 17,191 | 18,564 | 20,933 | 25,564 | |||||||||||||||
Restructuring charge | — | 625 | — | 119 | 1,428 | |||||||||||||||
Research and development | 1,177 | 1,127 | 1,073 | 1,070 | 1,752 | |||||||||||||||
Impairment and abandonment charges | 197 | 127 | 317 | 2,965 | 2,074 | |||||||||||||||
Operating (loss) income from continuing operations | (4,336 | ) | (8,240 | ) | 110 | (7,065 | ) | (12,024 | ) | |||||||||||
Net (loss) income from continuing operations | (4,278 | ) | (7,851 | ) | 85 | (6,535 | ) | (14,588 | ) | |||||||||||
Loss from discontinued operations | — | (1 | ) | (113 | ) | (3,914 | ) | (2,800 | ) | |||||||||||
Net loss | $ | (4,278 | ) | $ | (7,852 | ) | $ | (28 | ) | $ | (10,449 | ) | $ | (17,388 | ) | |||||
Net loss per common share: | ||||||||||||||||||||
Basic | ||||||||||||||||||||
Continuing operations | $ | (0.17 | ) | $ | (0.32 | ) | $ | — | $ | (0.28 | ) | $ | (0.62 | ) | ||||||
Discontinued operations | — | — | — | (0.16 | ) | (0.12 | ) | |||||||||||||
Basic net loss per common share | $ | (0.17 | ) | $ | (0.32 | ) | $ | — | $ | (0.44 | ) | $ | (0.74 | ) | ||||||
Diluted | ||||||||||||||||||||
Continuing operations | $ | (0.17 | ) | $ | (0.32 | ) | $ | — | $ | (0.28 | ) | $ | (0.62 | ) | ||||||
Discontinued operations | — | — | — | (0.16 | ) | (0.12 | ) | |||||||||||||
Diluted net loss per common share | $ | (0.17 | ) | $ | (0.32 | ) | $ | — | $ | (0.44 | ) | $ | (0.74 | ) | ||||||
Weighted-average basic shares outstanding | 24,691,000 | 24,202,000 | 24,164,000 | 23,872,000 | 23,365,000 | |||||||||||||||
Weighted-average diluted shares outstanding | 24,691,000 | 24,202,000 | 24,164,000 | 23,872,000 | 23,365,000 | |||||||||||||||
December 31, | ||||||||||||||||||||
CONSOLIDATED BALANCE SHEET DATA | 2020 | 2019 | 2018 | 2017 | 2016 | |||||||||||||||
(in thousands of dollars) | ||||||||||||||||||||
Working capital | $ | 15,542 | $ | 16,816 | $ | 23,556 | $ | 18,025 | $ | 26,585 | ||||||||||
Total assets | 30,088 | 31,606 | 51,719 | 50,484 | 57,788 | |||||||||||||||
Long-term obligations | 1,865 | 286 | 335 | 420 | 346 | |||||||||||||||
Total liabilities | 7,767 | 5,431 | 17,667 | 16,312 | 15,099 | |||||||||||||||
Stockholders’ equity (1) | 22,321 | 26,175 | 34,052 | 34,172 | 42,689 | |||||||||||||||
Notes:
(1) | Stockholders’ equity includes the principal amount of nil coupon non-redeemable perpetual loan notes. See Note 7 to the consolidated financial |
ITEM 7 - MANAGEMENT’S DISCUSSION AND ANALYSIS OF FINANCIAL CONDITION AND RESULTS OF OPERATIONS(amounts in thousands of dollars)
Executive Summary
In 2020, the Company continued to experience a challenging operational environment resulting from the ongoing substitution of gas-fired and renewable energy plant for coal-fired installations. Our cost control efforts reduced selling, general and administrative expenses from fiscal 2019 by 21% and the net loss by 46%. We continue to invest in new technologies to expand our product offerings into the water pollution control and treatment market. Our capital resources are sufficient for our immediate and longer-term needs and we continue to enjoy the services and support of a dedicated workforce. We expect that our cost control efforts will continue to yield reduced losses and the diminishing effects of the pandemic should lead to an improved market outlook.
Background
We have two broad technology segments that provide advanced engineered solutions to meet the pollution control, efficiency improvement and operational optimization needs of energy-related facilities worldwide. They are as follows:
Air Pollution Control Technologies
The Air Pollution Control technology segment includes technologies to reduce NO
FUEL CHEM Technologies
The FUEL CHEM technology segment, which uses chemical processes in combination with advanced CFD and CKM boiler modeling, for the control of slagging, fouling, corrosion, opacity and other sulfur trioxide-related issues in furnaces and boilers through the addition of chemicals into the furnace using TIFI
Targeted In-Furnace Injection technology. Fuel Tech sells its FUEL CHEM program through its direct sales force and agents to industrial and utility power-generation facilities. FUEL CHEM programs have been installed on combustion units in North America, Europe, China, and India, treating a wide variety of solid and liquid fuels, including coal, heavy oil, biomass and municipal waste. The FUEL CHEM program improves the efficiency, reliability and environmental status of plants operating in the electric utility, industrial, pulp and paper, waste-to-energy, university and district heating markets and offers numerous operational, financial and environmental benefits to owners of boilers, furnaces and other combustion units.The key market dynamic for both technology segments is the continued use of fossil fuels, especially coal, as the principal fuel source for global electricity production. Coal currently accounts for approximately 30%21% of all U.S. electricity generation and roughly 69%33% of Chineseglobal electricity generation. Major coal consumers include China, the United States and India.
Critical Accounting Policies and Estimates
The consolidated financial statements are prepared in accordance with accounting principles generally accepted in the United States of America, which require us to make estimates and assumptions. We believe that, of our accounting policies (see Note 1 to the consolidated financial statements), the following involve a higher degree of judgment and complexity and are deemed critical. We routinely discuss our critical accounting policies with the Audit Committee of the Board of Directors.
Revenue Recognition
The Company recognizes revenue when control of the promised goods or services is transferred to our customers, in an amount that reflects the consideration we expect to be entitled to in exchange for those goods or services. Fuel Tech’s sales of products to customers represent single performance obligations, which are not impacted upon the adoption of ASC 606. The majority of our contracts have a single performance obligation as the promise to transfer the individual goods or services is not separately identifiable from other promises in the contracts and, therefore, not distinct. Revenue is measured as the amount of consideration we expect to receive in exchange for transferring goods or providing services. Sales, value add, and other taxes we collect concurrent with revenue-producing activities are excluded from revenue.
FUEL CHEM
Revenues from the sale of chemical products are recognized when control transfers to customer upon shipment or delivery of the product based on the applicable shipping terms. We generally recognize revenue for these arrangements at a point in time based on our evaluation of when the customer obtains control of the promised goods or services.
On occasion, Fuel Tech will engineer and sell its chemical pumping equipment. These projects are similar in nature to the APC projects described above and for those projects where control transfers over time, revenue is recognized based on the extent of progress towards completion of the single performance obligation.
For projects containing multiple performance obligations, the Company allocates the transaction price based on the estimated standalone selling price. The Company must develop assumptions that require judgment to determine the stand-alone selling price for each performance obligation identified in the contract. The Company utilizes key assumptions to determine the stand-alone selling price, which may include other comparable transactions, pricing considered in negotiating the transaction and the estimated costs. Variable consideration is allocated specifically to one or more performance obligations in a contract when the terms of the variable consideration relate to the satisfaction of the performance obligation and the resulting amounts allocated are consistent with the amounts the Company would expect to receive for the satisfaction of each performance obligation.
The consideration allocated to each performance obligation is recognized as revenue when control is transferred for the related goods or services. For performance obligations which consist of licenses and other promises, the Company utilizes judgment to assess the nature of the combined performance obligation to determine whether the combined performance obligation is satisfied over time or at a point in time and, if over time, the appropriate method of measuring progress. The Company evaluates the measure of progress each reporting period and, if necessary, adjusts the measure of performance and related revenue recognition.
The Company receives payments from its customers based on billing schedules established in each contract. Up-front payments and fees are recorded as deferred revenue upon receipt or when due until the Company performs its obligations under these arrangements. Amounts are recorded as accounts receivable when the Company’s right to consideration is unconditional.
Air Pollution Control Technology
Fuel Tech’s APC contracts are typically six to eighteen months in length. A typical contract will have three or four critical operational measurements that, when achieved, serve as the basis for us to invoice the customer via progress billings. At a minimum, these measurements will include the generation of engineering drawings, the shipment of equipment and the completion of a system performance test.
As part of most of its contractual APC project agreements, Fuel Tech will agree to customer-specific acceptance criteria that relate to the operational performance of the system that is being sold. These criteria are determined based on modeling that is performed by Fuel Tech personnel, which is based on operational inputs that are provided by the customer. The customer will warrant that these operational inputs are accurate as they are specified in the binding contractual agreement. Further, the customer is solely responsible for the accuracy of the operating condition information; typically all performance guarantees and equipment warranties granted by us are voidable if the operating condition information is inaccurate or is not met.
Since control transfers over time, revenue is recognized based on the extent of progress towards completion of the single performance obligation. Fuel Tech uses the cost-to-cost input measure of progress for our contracts since it best depicts the transfer of assets to the customer which occurs as we incur costs on our contracts. Under the cost-to-cost input measure of progress, the extent of progress towards completion is measured based on the ratio of costs incurred to date to the total estimated costs at completion of the performance obligation. Revenues are recorded proportionally as costs are incurred. Costs to fulfill include all internal and external engineering costs, equipment charges, inbound and outbound freight expenses, internal and site transfer costs, installation charges, purchasing and receiving costs, inspection costs, warehousing costs, project personnel travel expenses and other direct and indirect expenses specifically identified as project- or product-line related, as appropriate (e.g. test equipment depreciation and certain insurance expenses).
Fuel Tech has installed over 1,0001,200 units with APC technology and normally provides performance guarantees to our customers based on the operating conditions for the project. As part of the project implementation process, we perform system start-up and optimization services that effectively serve as a test of actual project performance. We believe that this test, combined with the accuracy of the modeling that is performed, enables revenue to be recognized prior to the receipt of formal customer acceptance.
As of December 31, 2018,2020 we had five construction contracts in progress that were identified as loss contracts and a provision for losses in the amount of $123 was recorded in other accrued liabilities on the consolidated balance sheet. As of December 31, 2017, we had fourone construction contract in progress that were identified as a loss contract and a provision for losses in the amount of $117$176 was recorded in other accrued liabilities on the consolidated balance sheet. As of December 31, 2019, we had three construction contracts in progress that were identified as loss contracts and a provision for losses of $26 was recorded in other accrued liabilities on the consolidated balance sheet.
The timing of revenue recognition, billings and cash collections results in billed accounts receivable, unbilled receivables (contract assets), and customer advances and deposits (contract liabilities) on the consolidated balance sheets. In our Air Pollution Control Technology segment, amounts are billed as work progresses in accordance with agreed-upon contractual terms. Generally, billing occurs subsequent to revenue recognition, resulting in contract assets. These assets are reported on the
However, the Company will periodically bill in advance of costs incurred before revenue is recognized, resulting in contract liabilities. These liabilities are reported on the consolidated balance sheet on a contract-by-contract basis at the end of each reporting period. Contract liabilities were $1,234, $2,403$850 and $1,730$712 at December 31, 2018, 20172020 and 20162019, respectively, and are included in other accrued liabilities on the consolidated balance sheets.
Allowance for Doubtful Accounts
The allowance for doubtful accounts is management’s best estimate of the amount of credit losses in accounts receivable. In order to control and monitor the credit risk associated with our customer base, we review the credit worthiness of customers on a recurring basis. Factors influencing the level of scrutiny include the level of business the customer has with us, the customer’s payment history and the customer’s financial stability. Receivables are considered past due if payment is not received by the date agreed upon with the customer, which is normally 30 days. Representatives of our management team review all past due accounts on a weekly basis to assess collectability. At the end of each reporting period, the allowance for doubtful accounts balance is reviewed relative to management’s collectability assessment and is adjusted if deemed necessary through a corresponding charge or credit to bad debtsdebt expense, which is included in selling, general, and administrative expenses in the consolidated statements of operations. Bad debt write-offs are made when management believes it is probable a receivable will not be recovered
Inventories
Inventories consist primarily of spare parts and are stated at the lower of cost or net realizable value, using the weighted-average cost method. Usage is recorded in cost of sales in the period that parts were issued to a project or used to service equipment. Inventories are carried at weighted average cost and periodically evaluated to identify obsolete or otherwise impaired parts andthat are written off when management determines usage is not probable. The Company estimates the balance of excess and obsolete inventory by analyzing inventory by age using last used and original purchase date and existing sales pipeline for which the inventory could be used.
Assessment of Potential Impairments of Goodwill and Intangible Assets
Goodwill is not amortized, but rather is reviewed annually (in the fourth quarter) or more frequently if indicators arise, for impairment. We do not have any indefinite-lived intangible assets other than goodwill. Such indicators include a decline in expected cash flows, a significant adverse change in legal factors or in the business climate, unanticipated competition, a decrease in our market capitalization to an amount less than the carrying value of our assets, or slower growth rates, among others.
Goodwill is allocated among and evaluated for impairment at the reporting unit level, which is defined as an operating segment or one level below an operating segment. We have two reporting units: the FUEL CHEM segment and the APC technology segment.
Our evaluation of goodwill impairment involves first assessing qualitative factors to determine whether it is more likely than not that the fair value of a reporting unit is less than its carrying amount. We may bypass this qualitative assessment, or determine that based on our qualitative assessment considering the totality of events and circumstances including macroeconomic factors, industry and market considerations, current and projected financial performance, a sustained decrease in our share price, or other factors, that additional impairment analysis is necessary. This additional analysis involves comparing the current fair value of a reporting unit to its carrying value. Fuel Tech uses a discounted cash flow (DCF) model to determine the current fair value of its twoFUEL CHEM reporting unitsunit as this methodology was deemed to best quantify the present values of our expected future cash flows and yield a fair value that should be in line with the aggregate market value placed on the outstanding number of Common Shares as reflected by the current stock price multiplied by the outstanding common shares. A number of significant assumptions and estimates are involved in the application of the DCF model to forecast operating cash flows, including markets and market share, sales volumes and prices, costs to produce and working capital changes. Events outside our control, specifically market conditions that impact revenue growth assumptions, could significantly impact the fair value calculated. Management considers historical experience and all available information at the time the fair values of its reporting units are estimated. However, actual fair values that could be realized in an actual transaction may differ from those used to evaluate the impairment of goodwill.
The application of our DCF model in estimating the fair value of each reporting segment is based on the ‘net asset’ approach to business valuation. In using this approach for each reportable segment, we forecast segment revenues and expenses out to perpetuity and then discount the resulting cash flows to their present value using an appropriate discount rate. The forecast considers, among other items, the current and expected business environment, expected changes in the fixed and variable cost structure as the business
In the event the estimated fair value of a reporting unit per the DCF model is less than the carrying value, additional analysis would be required. The additional analysis would compare the carrying amount of the reporting unit’s goodwill with the implied fair value of that goodwill. The implied fair value of goodwill is the excess of the fair value of the reporting unit over the fair values assigned to all of the assets and liabilities of that unit as if the reporting unit was acquired in a business combination and the fair value of the reporting unit represented the purchase price.
The Company utilizes ASU 2017-04, Intangibles-Goodwill and Other (Topic 350): Simplifying the Test for Goodwill Impairment. This ASU is meant to simplify how an entity is required to test goodwill for impairment by eliminating Step 2 from the goodwill impairment test. Step 2 measures a goodwill impairment loss by comparing the implied fair value of a reporting unit’s goodwill with the carrying amount of that goodwill. The Company early adopted ASU 2017-04 on October 1, 2018Impairment for the annual goodwill impairment test completed during the fourth quarter which simplified the test by comparing the implied fair value of the reporting unit's goodwill with the carrying amount of goodwill and eliminating Step 2.
Fuel Tech performed its annual goodwill impairment analysis for each of its reporting units as of October 1, 20182020 and determined that no impairment of goodwill existed within the FUEL CHEM technology segment.
Impairment of Long-Lived Assets and Amortizable Intangible Assets
Long-lived assets, including property, plant and equipment (PP&E) and intangible assets, are reviewed for impairment when events and circumstances indicate that the carrying amount of the assets (or asset group) may not be recoverable. If impairment indicators exist, we perform a more detailed analysis and an impairment loss is recognized when estimated future undiscounted cash flows expected to result from the use of the asset (or asset group) and its eventual disposition are less than the carrying amount. This process of analyzing impairment involves examining the operating condition of individual assets (or asset group) and estimating a fair value based upon current condition, relevant market factors and remaining estimated operational life compared to the asset’s remaining depreciable life. Quoted market prices and other valuation techniques are used to determine expected cash flows. Due to the existence of impairment indicators as more fully described in Note 1 to our consolidated financial statements, we performed a more detailed analysis of potential long-lived and intangible asset impairment in the APC technology asset group during the fourth quarter of 2018 using2020 and determined no impairment exists.
During the aforementioned undiscounted cash flows analysis.
In the second and third quarters of 2019, the Company recorded an abandonment charge of $127 associated with certain international patent assets which the Company elected to not maintain and abandon in certain international locations due to limited business opportunities in those regions. The abandonment charge was calculated by determining the net book values of the abandoned patent assets by deducting the accumulated amortization from the acquisition cost. The abandonment charge of $317$127 is included in “Intangible assets abandonment and building impairment” line in the accompanying Consolidated Statements of Operations for the year ended December 31, 2018.
A significant portion of our property and equipment is comprised of assets deployed at customer locations relating to our FUEL CHEM technology asset group, and due to the shorter-term duration over which this equipment is depreciated, the likelihood of impairment is mitigated. The discontinuation of a FUEL CHEM program at a customer site would most likely result in the re-deployment of all or most of the affected assets to another customer location rather than an impairment.
Valuation Allowance for Deferred Income Taxes
Deferred tax assets represent deductible temporary differences and net operating loss and tax credit carryforwards. A valuation allowance is recognized if it is more likely than not that some portion of the deferred tax asset will not be realized. At the end of each reporting period, management reviews the realizability of the deferred tax assets. As part of this review, we consider if there are taxable temporary differences that could generate taxable income in the future, if there is the ability to carry back the net operating losses or credits, if there is a projection of future taxable income, and if there are any tax planning strategies that can be readily implemented. As required by ASC 740 "Income Taxes", a valuation allowance must be established when it is more likely than not that all or a portion of a deferred tax asset will not be realized. This assessment resulted in a valuation allowance on our deferred tax assets of $13,044, $12,234$15,971 and $13,179 for the years ended $15,394 at December 31, 2018, 20172020 and 20162019, respectively.
Stock-Based Compensation
We recognize compensation expense for employee equity awards ratably over the requisite service period of the award, adjusted for estimated forfeitures.
We utilize the Black-Scholes option-pricing model to estimate the fair value of stock option awards. Determining the fair value of stock options using the Black-Scholes model requires judgment, including estimates for (1) risk-free interest rate - an estimate based on the yield of zero-coupon treasury securities with a maturity equal to the expected life of the option; (2) expected volatility - an estimate based on the historical volatility of our Common Shares for a period equal to the expected life of the option; and (3) expected life of the option - an estimate based on historical experience including the effect of employee terminations.
Recently Adopted Accounting Standards
Leases
On January 1, 2018. The Company2019, we adopted the standard on January 1, 2018ASC 842 using the modified retrospective transition method. Seemethod outlined in ASU 2018-11, “Leases (Topic 842) Targeted Improvements.” Refer to Note 3, Revenue Recognition,10 for further discussion.
Operating lease ROU assets and disclosing key information about leasing arrangements. The liability recorded for aoperating lease is meant to recognize the lease payments and the asset as a right to use the underlying asset for the lease, including optional periods if it reasonably certain the option will be exercised. Recording of the liability should beliabilities are recognized based on the present value of the future minimum lease payments. If apayments over the lease term is less than twelve months, a company is allowed to elect not to record the asset and liability. Expense related to theseat commencement date. As most of our leases are to be amortized on a straightline basis over the expected term of the lease. Additionally, the provisions of Topic 842 provide additional guidance on separating lease terms from maintenance and other type of provisions that provide a good or service, accounting for sale-leaseback provisions, and leveraged leases. Reporting in the cash flow statement remains virtually unchanged. Additional qualitative and quantitative disclosures are required.
We have lease agreements with lease and this includes not recognizing right-of-use assets or lease liabilities for existing short-term leases of those assets in transitions. We also currently expect to electnon-lease components, and we elected the practical expedient to not separate lease and non-lease components for allthe majority of our leases.
Recently Issued Accounting Pronouncements
In July 2018,December 2019, the FASB issued ASU 2018-11 "Leases2019-12, “Income Taxes (Topic 842) Targeted Improvements." This amendment allows companies740): Simplifying the Accounting for Income Taxes.” The new rules reduce complexity by removing specific exceptions to electgeneral principles related to recordintra-period tax allocations, ownership changes in foreign investments, and interim period income tax accounting for year-to-date losses that exceed anticipated losses. The new rules also simplify accounting for franchise taxes that are partially based on income, transactions with a cumulative effectgovernment that result in a step up in the tax basis of goodwill, separate financial statements of legal entities that are not subject to tax, and enacted changes in tax laws in interim periods. The new rules will be effective for the Company in the first quarter of 2021, with early adoption permitted. The ASU permits either a retrospective basis or a modified retrospective transition approach. The Company is currently in the process of evaluating the impact of adoption of the new rules on the Company’s financial condition, results of operations, cash flows and disclosures.
In June 2016, the FASB issued ASU 2016-13, Financial Instruments - Credit Losses (Topic 326): Measurement of Credit Losses on Financial Instruments, which amends the current accounting guidance and requires the measurement of all expected losses based on historical experience, current conditions and reasonable and supportable forecasts. For trade receivables, loans, and other financial instruments, we will be required to use a forward-looking expected loss model rather than the incurred loss model for recognizing credit losses which reflects losses that are probable. The standard will become effective for interim and annual periods beginning after December 15, 2022, with early adoption permitted. Application of the amendments is through a cumulative-effect adjustment to beginning retained earnings on the date of adoption. We expect to elect the provisions of ASU 2018-11 as of the dateeffective date. The Company is currently in the process of evaluating the impact of adoption, but we do not believe the adoption of this standard will have a material impact on January 1, 2019.our financial statements.
2020 versus 2017
Highlights for the year ended December 31, 2020, compared to 2019:
For the years ended December 31, | ||||||||||||
2020 | 2019 | Change | ||||||||||
Revenues | $ | 22,550 | $ | 30,467 | $ | (7,917 | ) | |||||
Costs and expenses: | ||||||||||||
Cost of sales | 11,912 | 19,637 | (7,725 | ) | ||||||||
Selling, general and administrative | 13,600 | 17,191 | (3,591 | ) | ||||||||
Restructuring charge | — | 625 | (625 | ) | ||||||||
Research and development | 1,177 | 1,127 | 50 | |||||||||
Intangible assets abandonment | 197 | 127 | 70 | |||||||||
Total Costs and Expenses | 26,886 | 38,707 | (11,821 | ) | ||||||||
Operating loss from continuing operations | (4,336 | ) | (8,240 | ) | 3,904 | |||||||
Interest (expense) income | (4 | ) | 41 | (45 | ) | |||||||
Foreign exchange gain | — | 370 | (370 | ) | ||||||||
Other income (expense) | 119 | (8 | ) | 127 | ||||||||
Loss from continuing operations before income taxes | (4,221 | ) | (7,837 | ) | 3,616 | |||||||
Income tax expense | (57 | ) | (14 | ) | (43 | ) | ||||||
Net loss from continuing operations | (4,278 | ) | (7,851 | ) | 3,573 | |||||||
Loss from discontinued operations (net of income tax benefit of $0 in 2020 and 2019) | — | (1 | ) | 1 | ||||||||
Net loss | $ | (4,278 | ) | $ | (7,852 | ) | $ | 3,574 | ||||
Revenues
Revenues for the years ended December 31, 20182020 and 20172019 were $56,535$22,550 and $45,166,$30,467, respectively. The year-over-year increasedecrease of $11,369$7,917 or 25%26%, was driven by increaseddecreased revenue in both APC and FUEL CHEM technology segments in our United States (U.S.) operations. Our U.S. revenues increaseddecreased by $14,377$7,260 or 49%28% from $29,510$25,882 to $43,887,$18,622, and our international revenues decreased by $3,008$657 or 19%14% from $15,656$4,585 to $12,648.
Revenues for the APC technology segment were $38,417$8,557 for the year ended December 31, 2018, an increase2020, a decrease of $10,609,$5,525, or 38%39%, versus fiscal 2017.2019. The increasedecrease in APC revenue for the twelve month period ending December 31, 20182020 in comparison to prior year amount iswas principally related to the timing of project execution as a result of conversion of new orders announced during 2017 and 2018. Backlogthe decline in backlog which was $5.3 million and $9.7 million, for the years ended December 31, 20182020 and 2017 was $12.4 million and $22.1 million,2019, respectively.
Revenues for the FUEL CHEM technology segment for the year ended December 31, 20182020 were $18,118, an increase$13,993, a decrease of $760,$2,392, or 4%15% versus fiscal 2017.2019. We remain focused on attracting new customers in our FUEL CHEM business, for both coal and non-coal applications, but our ability to attract new coal customers continues to be affected by the soft electric demand market and fuel switching as a result of low natural gas prices.
Cost of sales and gross margin
Consolidated cost of sales for the years ended December 31, 20182020 and 20172019 were $36,471$11,912 and $27,144,$19,637, respectively. Consolidated gross margin percentages for the years ended December 31, 20182020 and 20172019 were 35%47% and 40%36%, respectively. The gross margins for the APC technology segment decreasedincreased to 29%46% in 20182020 from 34%20% in 2017.2019. The overall decreaseincrease in gross margin in the APC technology segment from 20172019 to 20182020 is primarily due to the timing of a large insurance settlement of $2,589 which was used to fund the recovery plan for the project affected and project mix, timing of project execution and margin erosion on lower-margin projects being executed in foreign geographies, which will not recur.net of $1,427 of remediation costs incurred during 2020 to address non-conformance issues under the terms of a contract with a U.S. customer. Gross margin percentage for the FUEL CHEM technology segment remained consistent at 50%decreased to 48% from 49% for the years ended December 31, 20182020 and 2017.2019.
Selling, general and administrative
Selling, general and administrative (SG&A) expenses for the years ended December 31, 20182020 and 20172019 were $18,564$13,600 and $20,933,$17,191, respectively. The decrease of $2,369$3,591 or 11%21%, is primarily attributed to the following:
A decrease in employee related costs of $1,004$190
A decrease in office and administrative costs relating to our foreign subsidiaries of $809
| • | A decrease in travel expense of $377 | |
| • | A decrease in professional service fees of $165 | |
| • | A decrease in bad debt of $997 | |
• | An decrease in other administrative costs of $613 |
Depreciation and Amortization
Depreciation and amortization are calculated using the straight line method and included in selling, general and administrative costs, includingexpense. For the years ended December 31, 2020 and 2019, the Company recorded depreciation of $663 and $810 and amortization of $118
Restructuring charge
Restructuring costs were $0 and $119 in connection with the workforce reduction$625 for the years ended December 31, 20182020 and 2017.2019. On January 18, 2019, the Company announced a planned suspension of the APC business operation in China. This action is part of Fuel Tech’s ongoing operational improvement initiatives designed to prioritize resource allocation, reduce costs, and drive profitability for the Company on a global basis. The transition associated with the suspension of the APC business includes staff rationalization, supplier and partner engagement, and the monetization of certain assets. See Note 15,16, Restructuring Activities, for further discussion.
Research and development (“R&D”) expenses were $1,073$1,177 and $1,070$1,127 for the years ended December 31, 20182020 and 2017,2019, respectively.
Intangible assets abandonment
In the fourth quarter of 2020, the Company recorded an abandonment charge of $197 due to the Company's decision to no longer maintain and defend certain patents and trademarks which are no longer contributing to operations. In the second quarter of 2018,2019, Fuel Tech recorded an abandonment charge of $317$127 associated with certain international patent assets which the Company elected to not maintain and abandon in certain international locations due to limited business opportunities in those regions. The abandonment charge wascharges were calculated by determining the net book values of the abandoned patent assets by deducting the accumulated amortization from the acquisition cost. The abandonment charge of $317 ischarges are included in “Intangible assets abandonment and building impairment”abandonment” line in the accompanying Consolidated Statements of Operations for the twelve months ended December 31, 2018.
Interest (income) / expense
Interest expense for the year ended December 31, 2018 and 20172020 was $4 versus income of $113 and $3,914, respectively. The loss from discontinued operations$41 in the Consolidated Statement of Operations2019.
Foreign exchange gain
Foreign exchange gain for the year ended December 31, 2018 includes an impairment charge2020 was $0 after a gain of $370 in 2019 related to the Carbonite patent assetsChile subsidiary.
Other income
Other income of $56 as a result of not being able to reach an agreement with a third-party to acquire or license the Carbonite technology in combination with the sale of certain equipment included in Assets held for sale. The Fuel Conversion business segment had no revenues associated with it. The overall decline in the discontinued operations$119 increased by $127 for the yearyears ended December 31, 20182020 compared to $(8) in comparison to the same periods in 2017 is2019 due to the overall wind-downinterest collected on resolution of operations for the Fuel Conversion discontinuedlegal judgment on a receivable payment from our China operations.
Income tax benefit (expense)
For the year ended December 31, 2018,2020, we recorded an income tax expense of $33$57 on pre-tax incomeloss of $118.$4,221. Our effective tax rates were 676.3%(1.4)% and 4.5%0.2% for the years ended December 31, 20182020 and 2017,2019, respectively. The effective tax rate for the year-ended December 31, 2018,2020, differed from the federal statutory rate of 21% as a result of establishing a deferred tax liability associated with a certain book-to-tax timing difference. For the year ended December 31, 2017,2019, we recorded an income tax benefitexpense of $580$14 on pre-tax loss of $7,115.$7,837. The effective tax rate for the year-ended December 31, 20172020 and 2019 differed from the federal statutory rate of 34% as a result of net operating losses generated in the United States, China, and Italy, which were offset by establishment of full valuation allowances.
Loss from discontinued operations
The activity of the Fuel Conversion discontinued operations consisted of other costs for the years ended December 31, 20172020 and 2016 were $45,1662019 of $0 and $55,161,$1, respectively. The year-over-year decreaseactivity of $9,995, or 18%, was driven by decreased revenue in both APC and FUEL CHEM technology segments in both our United States (U.S.) and foreign operations. Our U.S. revenues decreased by $13,035 or 31%from $42,545 to $29,510, and our international revenues increased by $3,040 or 24% from $12,616 to $15,656.
Liquidity and Sources of Capital
At December 31, 2018,2020, we had cash and cash equivalents of $12,039$10,640 (excluding restricted cash of $6,020)$1,966) and working capital of $23,556$15,542 versus cash and cash equivalents of $8,366$10,914 (excluding restricted cash of $6,020)$2,587) and working capital of $18,025$16,816 at December 31, 2017.
Operating activities provided $4,927used $2,707 of cash for the year ended December 31, 2018,2020, primarily due to the add back of non-cash items from our net loss from continuing operations of $266 including stock compensation expense of $290, depreciation and amortization of $848, intangible assets abandonment charge of $197, an increase in our accrued liabilities and other non-current liabilities of $2, and an increase in our accounts payable balance of $198 offset by a decrease in prepaid expenses and other current and non-current assets of $161, a decrease in our inventory balance of $171 and a decrease in our accounts receivable balance of $1,095.
Operating activities used $3,387 of cash for the year ended December 31, 2019, primarily due to the add back of non-cash items from our net income from continuing operations of $85$7,851 including stock compensation expense of $233,$574, depreciation and amortization of $847,$996, intangible assets abandonment charge of $317,$127, a reduction of the excess and obsolete inventory reserve of $78, a loss on sale of equipment of $142,$131, a decrease in our accounts receivable balance of $848, an increase$11,415, a decrease in our inventory balance of $108,$818, a decrease in prepaid expenses and other current and non-current assets of $251, an increase in our accrued liabilities and other non-current liabilities of $1,897, and an increase in our accounts payable balance of $521. Cash provided by operating activities also included cash used of $122 associated with the activity of the Fuel Conversion discontinued operations.
Investing activities used cash of $569$247 and $490$45 for the years ended December 31, 20182020 and 2017,2019, respectively. InvestmentInvesting activities for the year ended December 31, 20182020 consisted principally of purchases of equipment of $247. Investing activities for the year ended December 31, 2019 consisted of purchases of equipment, patents, and other intangibles of $570$550 and proceeds from sale of equipment of $1. Investment activities for the year ended December 31, 2017 consisted of purchases of equipment, patents, and other intangibles of $492 and proceeds from sale of equipment of $2.
Financing activities provided $1,282 and used $12 and $258$128 of cash for the years ended December 31, 20182020 and 2017 as2019. In 2020, the Company received a Paycheck Protection Plan loan of $1,556 but used a net $276 for stock compensation related transactions. The cash used in 2019 was a result of $12 and $258 in cash$128 used for the acquisition of common shares held in treasury that were withheld for taxes due by employees upon lapsing of restricted stock units.
On June 19, 2019, the Company is obligated underentered into a U.S. Domestic credit facilityCash Collateral Security agreement with (the Facility) with JPMorgan ChaseBMO Harris Bank, N.A. (JPM Chase) which provides(the BMO Harris agreement) to use for maximum revolving credit borrowingsthe sole purpose of $5,500 and matures on June 28, 2019. Fuel Tech can use this Facility for cash advances andissuing standby letters of credit. The Facility is secured by $5,500 inBMO Harris agreement requires us to pledge as cash held bycollateral 105% of the aggregate face amount of outstanding standby letters of credit. The Company in a separate restricted use designated JPM Chase deposit account and haspays 250 basis points on the Company’s Italian subsidiary, Fuel Tech S.r.l., as a guarantor. Outstanding borrowings under the Facility bear interest at a rateface values of LIBOR plus 300 basis points.outstanding letters of credit. There are no financial covenants set forth in this amendment to the Facility. The Facility was amended on three occasions during 2018, most recently October 19, 2018, in order to amend the maximum availability under the Facility. The Company is actively pursuing the renewal of its U.S. Domestic credit facility and intends to renew the U.S. Domestic credit facility at its maturity. As of BMO Harris agreement. At December 31, 2018 and 2017, there were no outstanding borrowings under2020, the Facility.
In connection with the transition to BMO Harris Bank N.A., the Company canceled its U.S. Domestic credit facility and approximately $443 and $1,996, was available for future borrowings under the Facility. We pay a commitment fee of 0.25% per year(the Facility) with JPMorgan Chase Bank, N.A. (JPM Chase) effective on the unused portion of the revolving credit facility.
Beijing Fuel Tech Environmental Technologies Company, Ltd. (Beijing Fuel Tech), iswas previously obligated under a revolving credit facility (the China Facility) agreement, as most recently amended on October 19, 2018, with JPM Chase which provides which providesprovided for maximum revolving credit borrowings of RMB 2.625 million (approximately $382) and maturesmatured on June 30, 2019. The Facility iswas secured by $520 in cash held by the Company in a separate restricted use designated JPM Chase deposit account. The China Facility bears interest at a rate of 140% of the People’s Bank of China (PBOC) Base Rate, and is guaranteed by the Company. Beijing Fuel Tech can use this facility for cash advances and bank guarantees. As of December 31, 2018 and 2017, Beijing Fuel Tech had no cash borrowings under the China Facility. At December 31, 2018 and 2017, we had outstanding standby letters of credit and bank guarantees totaling approximately $0 and $246, respectively, on its Beijing Fuel Tech revolving credit facility in connection with contracts in process. At December 31, 2018 and 2017, approximately $382 and $753 was available for future borrowings. As a result of the announcement of the suspension of the Air Pollution Control business in Beijing, the Company intends todid not renew the China Facility upon its expiration on June 30, 2019.
For the year ended December 31, 2018,2020 we have sustained incomea loss before discontinued operations totaling $85.$4,278. Our cash providedused by continuing operations for this same period totaled $5,049.$2,707. We have taken measures to reduce our expense infrastructure and over the past three years have eliminated approximately $7.0$17.5 million in aggregate selling, general and administrative expenses primarily through headcount and other operating expense cutbacks.
We have experienced continued declines in revenues and our working capital totaled $24.0 million. We do not have any outstanding debt obligations other than our letters of credit, and our current credit agreement does not have any financial covenants asrecurring losses. As a result, we have moved to a cash collateralized line of credit with our lender.
Our cash balance as of December 31, 2020 totaled $12,606 (including our restricted cash balance), and our working capital totaled $15,542. We do not have any outstanding debt obligations other than for our letters of credit and our PPP loan which was forgiven on January 8, 2021. We currently have a $5.5 million domestic U.S. credit facilitythe BMO Harris agreement which we use to issue letters of credit to our customers, which is a fully cash collateralized line of credit requiring us to deposit funds in a restricted cash account to support that credit line.account. We expect to continue operating under this arrangement for the foreseeable future. Our liquidity may be adversely affected
On February 17, 2021 we consummated the sale of 5,000,000 shares of Fuel Tech common stock sold to certain investors in a private placement transaction. The Company received gross proceeds of $25.8 million. The Company intends to use for the extent we are required to collateralize further letters of credit by additional cash deposits.
Commercial Commitments
| Contractual Cash Obligations | Total | 2019 | 2020 | 2021 | Thereafter | |||||||||||||||
| Operating lease obligations | $ | 726 | $ | 613 | $ | 102 | $ | 11 | $ | — | ||||||||||
| Total | $ | 726 | $ | 613 | $ | 102 | $ | 11 | $ | — | ||||||||||
Commitment expiration by period in thousands of dollars
| Commercial Commitments | Total | 2019 | 2020 | 2021 | Thereafter | |||||||||||||||
| Standby letters of credit and bank guarantees | $ | 5,028 | $ | 4,402 | $ | 277 | $ | 71 | $ | 278 | ||||||||||
| Total | $ | 5,028 | $ | 4,402 | $ | 277 | $ | 71 | $ | 278 | ||||||||||
Commercial Commitments | Total | 2021 | 2022 | 2023 | Thereafter | |||||||||||||||
Standby letters of credit and bank guarantees | $ | 1,873 | $ | 1,519 | $ | 96 | $ | 258 | $ | — | ||||||||||
Total | $ | 1,873 | $ | 1,519 | $ | 96 | $ | 258 | $ | — | ||||||||||
Off-Balance-Sheet Transactions
There were no other off-balance-sheet transactions other than the obligations and commitments listed above duringfor the three-year periodyear ended December 31, 2018.
Our earnings and cash flow are subject to fluctuations due to changes in foreign currency exchange rates. We do not enter into foreign currency forward contracts or into foreign currency option contracts to manage this risk due to the nature of the transactions involved.
We are also exposed to changes in interest rates primarily due to our debt arrangement (refer to Note 10 to the consolidated financial statements). A hypothetical 100 basis point adverse move in interest rates along the entire interest rate yield curve would not have a materially adverse effect on interest expense during the upcoming year ended December 31, 2018.2020.
Report of Independent Registered Public Accounting Firm
To the Stockholders and the Board of Directors and Stockholders of Fuel Tech, Inc.
Opinion on the Financial Statements
We have audited the accompanying consolidated balance sheets of Fuel Tech, Inc. (the Company) as of December 31, 20182020 and 2017,2019, the related consolidated statements of operations, comprehensive loss, stockholders’ equity and cash flows for each of the three years in the periodthen ended, December 31, 2018, and the related notes to the consolidated financial statements (collectively, the financial statements). In our opinion, the financial statements present fairly, in all material respects, the financial position of the Company as of December 31, 20182020 and 2017,2019, and the results of its operations and its cash flows for each of the three years in the periodthen ended, December 31, 2018, in conformity with accounting principles generally accepted in the United States of America.
Basis for Opinion
These financial statements are the responsibility of the Company’s management. Our responsibility is to express an opinion on the Company’s financial statements based on our audits. We are a public accounting firm registered with the Public Company Accounting Oversight Board (United States) (PCAOB) and are required to be independent with respect to the Company in accordance with U.S. federal securities laws and the applicable rules and regulations of the Securities and Exchange Commission and the PCAOB.
We conducted our audits in accordance with the standards of the PCAOB. Those standards require that we plan and perform the audit to obtain reasonable assurance about whether the financial statements are free of material misstatement, whether due to error or fraud. The Company is not required to have, nor were we engaged to perform, an audit of its internal control over financial reporting. As part of our audits we are required to obtain an understanding of internal control over financial reporting but not for the purpose of expressing an opinion on the effectiveness of the Company’s internal control over financial reporting. Accordingly, we express no such opinion.
Our audits included performing procedures to assess the risks of material misstatement of the financial statements, whether due to error or fraud, and performing procedures that respond to those risks. Such procedures included examining, on a test basis, evidence regarding the amounts and disclosures in the financial statements. Our audits also included evaluating the accounting principles used and significant estimates made by management, as well as evaluating the overall presentation of the financial statements. We believe that our audits provide a reasonable basis for our opinion.
Critical AuditMatters
The critical audit matters communicated below are matters arising from the current period audit of the financial statements that were communicated or required to be communicated to the audit committee and that: (1) relate to accounts or disclosures that are material to the financial statements and (2) involved our especially challenging, subjective, or complex judgments. The communication of critical audit matters does not alter in any way our opinion
Impairment of goodwill
As described in Note 1 of the financial statements, goodwill is tested for impairment at least annually as of the first day of the Company’s fourth quarter, or more frequently if events or changes in circumstances indicate that the carrying value may not be recoverable. The Company’s evaluation of goodwill impairment involves the comparison of the fair value of the Company’s reporting units to their carrying values. The Company uses a discounted cash flow analysis to determine the current fair value of the Company’s FUEL CHEM reporting unit. This requires management to make significant estimates and assumptions including estimates of future growth rates, operating margins and discount rates based on the estimated weighted average cost of capital for the business. Changes in these assumptions could have a significant impact on the fair value, which could have an impact on the conclusion of impairment, if any.
The Company performed its impairment analysis as of October 1, 2020. As part of the impairment assessment, the Company’s management determined that the fair value of the FUEL CHEM reporting unit exceeded its carrying value. As a result, no impairment charge was recorded in the consolidated statement of operations for the year ended December 31, 2020. Key financial assumptions used to determine the discounted cash flows of the reporting unit were developed my management.
We identified the evaluation of goodwill impairment as a critical audit matter because of the significant assumptions and judgments made by management within the discounted cash flow analysis used to determine the fair value of the Company’s FUEL CHEM reporting unit. Auditing the reasonableness of management’s key assumptions, including revenue growth rates, operating margins, and discount rates involved a high degree of auditor judgment and an increased effort, including the use of our valuation specialists.
Our audit procedures related to revenue growth rates, operating margins, and discount rates used to evaluate the Company’s FUEL CHEM reporting unit for impairment included the following, among others:
● | With the assistance of our fair value specialists, we evaluated the reasonableness of the discount rate and tested the relevance and reliability of source information underlying the determination of the rate, tested the mathematical accuracy of the calculation, and developed a range of independent estimates and compared those to the rate selected by management. |
● | We evaluated reasonableness of management’s forecasted revenue growth rates and operating margins by comparing to historical results and industry forecasts. |
● | We evaluated management’s ability to accurately forecast revenue and operating margins by comparing management’s prior forecasts to actual results. |
● | We evaluated the impact of changes to significant assumptions on the determination of whether impairment exists. |
Impairment of long-lived assets
As described in Note 1 of the financial statements, the Company’s management reviews long-lived assets for impairment when events or changes in circumstances indicate the carrying amount of an asset or asset group may not be recoverable. The Company’s evaluation of long-lived asset impairment includes determining the fair value of its asset groupings through a discounted cash flow model. In addition, the Company’s evaluation includes determining the fair value of its patents through a relief from royalty model. This requires management to make significant estimates and assumptions including estimates of future growth rates, discount rates, royalty rates and estimation period to perform the analysis. Changes in these assumptions could have a significant impact on the fair value, which could have an impact on the impairment charge, if any.
Both the Company’s Air Pollution Control (APC) and FUEL CHEM asset groupings experienced a decline in revenue, and the APC asset grouping experienced an operating loss during the year ended December 31, 2020. Company management determined that the carrying amount of the asset groupings may not be recoverable based on the operating performance. Accordingly, the Company performed an impairment assessment on its asset groups as of December 31, 2020. As part of its analysis, it determined that the fair value of the FUEL CHEM asset group exceeded its carrying value. In addition, the Company determined that the fair value of the APC patents exceeded their carrying value.
We identified the testing of long-lived assets for impairment as a critical audit matter because of the significant assumptions and judgments made by management within the discounted cash flow analysis and the relief from royalty valuation model. Auditing the reasonableness of management’s key assumptions, including revenue growth rates, discount rates, royalty rates and estimation period, involved a high degree of auditor judgment and an increased effort, including the use of our valuation specialists.
Our audit procedures related to revenue growth rates, discount rates, royalty rates and estimation period used to evaluate the FUEL CHEM asset group and the APC patents for impairment included the following, among others:
● | With the assistance of our fair value specialists, we evaluated the reasonableness of the discount and royalty rates and tested the relevance and reliability of source information underlying the determination of the rates, tested the mathematical accuracy of the calculation, and developed a range of independent estimates and compared those to the rates selected by management. |
● | We evaluated the reasonableness of management’s forecasted revenue growth rates by comparing the forecasts to historical results, industry forecasts and existing backlog. |
● | We evaluated the reasonableness of the estimation period by comparing to the weighted average remaining life of the related patents. |
● | We evaluated management’s ability to accurately forecast revenue by comparing management’s prior forecasts to actual results. |
● | We evaluated the impact of changes to significant assumptions on the recoverability of the asset group. |
Revenue recognition
As described in Note 1 of the financial statements, revenue for the Company’s Air Pollution Control technology contracts is recognized based on the extent of progress towards completion of the contract compared to the estimated effort to complete the contract. The Company uses a cost-to-cost input method of measuring progress on these contracts. Under the cost-to-cost input measure of progress, the extent of progress towards completion is measured based on the ratio of costs incurred to date to the estimated costs at completion of the performance obligation. Revenues are recorded proportionally as costs are incurred.
We identified revenue recognition over time for the Company’s Air Pollution Control technology contracts as a critical audit matter because of certain significant assumptions management makes when measuring progress, including assumptions related to expected total costs to complete the contract. Auditing these assumptions involved a high degree of auditor judgment and an increase in audit effort due to the impact these assumptions have on the amount of revenue recognized.
Our audit procedures related to the evaluation of management’s estimation of revenue recognized include the following, among others:
● | We evaluated management’s ability to accurately forecast project costs by comparing management’s prior forecasts of estimated costs to actual results. |
● | We selected a sample of customer contracts and evaluated management’s calculation of revenue recognized over time by performing the following procedures: |
o | Evaluating whether contract terms that may affect revenue recognition were identified and properly considered and performance obligations were appropriately identified |
o | Obtaining and reviewing contracts with customers, including change orders to evaluate whether the transaction price was appropriately identified. |
o | Testing management’s revenue recognition calculation model for mathematical accuracy. |
o | Assessing the validity of data used in the model for completeness and accuracy by agreeing, on a sample basis, key data inputs to source documents, including job costing reports and project budgets. |
/s/ RSM US LLP |
We have served as the Company's auditor since 2010. |
Chicago, Illinois |
March |
Fuel Tech, Inc.
Consolidated Balance Sheets
(
in thousands of dollars, except share and per-share data)December 31, | ||||||||
2020 | 2019 | |||||||
ASSETS | ||||||||
Current assets: | ||||||||
Cash and cash equivalents | $ | 10,640 | $ | 10,914 | ||||
Restricted cash | 1,595 | 2,080 | ||||||
Accounts receivable, net | 6,548 | 6,473 | ||||||
Inventories, net | 97 | 264 | ||||||
Prepaid expenses and other current assets | 2,193 | 1,879 | ||||||
Total current assets | 21,073 | 21,610 | ||||||
Property and equipment, net | 5,220 | 5,662 | ||||||
Goodwill | 2,116 | 2,116 | ||||||
Other intangible assets, net | 553 | 906 | ||||||
Restricted cash | 371 | 507 | ||||||
Right-of-use operating lease assets | 394 | 362 | ||||||
Other assets | 361 | 443 | ||||||
Total assets | $ | 30,088 | $ | 31,606 | ||||
LIABILITIES AND STOCKHOLDERS’ EQUITY | ||||||||
Current liabilities: | ||||||||
Accounts payable | $ | 2,353 | $ | 2,117 | ||||
Accrued liabilities: | ||||||||
Operating lease liabilities - current | 149 | 182 | ||||||
Employee compensation | 930 | 519 | ||||||
Other accrued liabilities | 2,099 | 1,976 | ||||||
Total current liabilities | 5,531 | 4,794 | ||||||
Operating lease liabilities - non-current | 237 | 180 | ||||||
| Long-term borrowings | 1,556 | — | ||||||
Deferred income taxes | 134 | 171 | ||||||
Other liabilities | 309 | 286 | ||||||
Total liabilities | 7,767 | 5,431 | ||||||
Stockholders’ equity: | ||||||||
Common stock, $.01 par value, 40,000,000 shares authorized, 25,639,702 and 25,053,480 shares issued, and 25,228,951 and 24,592,578 outstanding in 2020 and 2019, respectively | 262 | 254 | ||||||
Additional paid-in capital | 140,138 | 139,560 | ||||||
Accumulated deficit | (114,603 | ) | (110,325 | ) | ||||
Accumulated other comprehensive loss | (1,370 | ) | (1,778 | ) | ||||
Nil coupon perpetual loan notes | 76 | 76 | ||||||
Treasury stock, at cost (Note 6) | (2,182 | ) | (1,612 | ) | ||||
Total stockholders’ equity | 22,321 | 26,175 | ||||||
Total liabilities and stockholders’ equity | $ | 30,088 | $ | 31,606 | ||||
| December 31, | |||||||
| 2018 | 2017 | ||||||
| ASSETS | |||||||
| Current assets: | |||||||
| Cash and cash equivalents | $ | 12,039 | $ | 8,366 | |||
| Restricted cash | 6,020 | 1,020 | |||||
| Marketable securities | — | 6 | |||||
| Accounts receivable, net | 18,399 | 19,690 | |||||
| Inventories, net | 957 | 945 | |||||
| Prepaid expenses and other current assets | 3,184 | 3,592 | |||||
| Income taxes receivable | 118 | 129 | |||||
| Total current assets | 40,717 | 33,748 | |||||
| Property and equipment, net | 5,976 | 6,272 | |||||
| Goodwill | 2,116 | 2,116 | |||||
| Other intangible assets, net | 1,164 | 1,671 | |||||
| Restricted cash | — | 5,000 | |||||
| Assets held for sale | 485 | 485 | |||||
| Other assets | 1,261 | 1,192 | |||||
| Total assets | $ | 51,719 | $ | 50,484 | |||
| LIABILITIES AND STOCKHOLDERS’ EQUITY | |||||||
| Current liabilities: | |||||||
| Accounts payable | $ | 9,499 | $ | 9,065 | |||
| Accrued liabilities: | |||||||
| Employee compensation | 1,563 | 1,487 | |||||
| Income taxes payable | — | 73 | |||||
| Other accrued liabilities | 6,099 | 5,098 | |||||
| Total current liabilities | 17,161 | 15,723 | |||||
| Deferred income taxes | 171 | 169 | |||||
| Other liabilities | 335 | 420 | |||||
| Total liabilities | 17,667 | 16,312 | |||||
| COMMITMENTS AND CONTINGENCIES (Note 9) | |||||||
| Stockholders’ equity: | |||||||
| Common stock, $.01 par value, 40,000,000 shares authorized, 24,825,891 and 24,777,001 shares issued, and 24,170,585 and 24,132,910 outstanding in 2018 and 2017, respectively | 248 | 248 | |||||
| Additional paid-in capital | 138,992 | 138,760 | |||||
| Accumulated deficit | (102,495 | ) | (102,672 | ) | |||
| Accumulated other comprehensive loss | (1,285 | ) | (768 | ) | |||
| Nil coupon perpetual loan notes | 76 | 76 | |||||
| Treasury stock, 655,306 and 644,091 shares in 2018 and 2017, respectively, at cost | (1,484 | ) | (1,472 | ) | |||
| Total shareholders’ equity | 34,052 | 34,172 | |||||
| Total liabilities and shareholders’ equity | $ | 51,719 | $ | 50,484 | |||
Consolidated Statements of Operations
(
in thousands of dollars, except share and per-share data)For the years ended December 31, | ||||||||
2020 | 2019 | |||||||
Revenues | $ | 22,550 | $ | 30,467 | ||||
Costs and expenses: | ||||||||
Cost of sales | 11,912 | 19,637 | ||||||
Selling, general and administrative | 13,600 | 17,191 | ||||||
Restructuring charge | — | 625 | ||||||
Research and development | 1,177 | 1,127 | ||||||
Intangible assets abandonment and impairment | 197 | 127 | ||||||
Total Costs and Expenses | 26,886 | 38,707 | ||||||
Operating loss from continuing operations | (4,336 | ) | (8,240 | ) | ||||
Interest (expense) income | (4 | ) | 41 | |||||
Foreign exchange gain | — | 370 | ||||||
Other income (loss) | 119 | (8 | ) | |||||
Loss from continuing operations before income taxes | (4,221 | ) | (7,837 | ) | ||||
Income tax expense | (57 | ) | (14 | ) | ||||
Net loss from continuing operations | (4,278 | ) | (7,851 | ) | ||||
Loss from discontinued operations (net of income tax benefit of $0 in 2020 and 2019) | — | (1 | ) | |||||
Net loss | $ | (4,278 | ) | $ | (7,852 | ) | ||
Net loss per common share: | ||||||||
Basic | ||||||||
Continuing operations | $ | (0.17 | ) | $ | (0.32 | ) | ||
Discontinued operations | $ | — | $ | (0.00 | ) | |||
Basic net loss per common share | $ | (0.17 | ) | $ | (0.32 | ) | ||
Diluted | ||||||||
Continuing operations | $ | (0.17 | ) | $ | (0.32 | ) | ||
Discontinued operations | $ | — | $ | — | ||||
Diluted net loss per common share | $ | (0.17 | ) | $ | (0.32 | ) | ||
Weighted-average number of common shares outstanding: | ||||||||
Basic | 24,691,000 | 24,202,000 | ||||||
Diluted | 24,691,000 | 24,202,000 | ||||||
| For the years ended December 31, | ||||||||||||
| 2018 | 2017 | 2016 | ||||||||||
| Revenues | $ | 56,535 | $ | 45,166 | $ | 55,161 | ||||||
| Costs and expenses: | ||||||||||||
| Cost of sales | 36,471 | 27,144 | 36,367 | |||||||||
| Selling, general and administrative | 18,564 | 20,933 | 25,564 | |||||||||
| Restructuring charge | — | 119 | 1,428 | |||||||||
| Research and development | 1,073 | 1,070 | 1,752 | |||||||||
| Intangible assets abandonment and building impairment | 317 | 2,965 | 2,074 | |||||||||
| Total Costs and Expenses | 56,425 | 52,231 | 67,185 | |||||||||
| Operating income (loss) from continuing operations | 110 | (7,065 | ) | (12,024 | ) | |||||||
| Interest income | 6 | 10 | 25 | |||||||||
| Other expense | 2 | (60 | ) | (925 | ) | |||||||
| Income (loss) from continuing operations before income taxes | 118 | (7,115 | ) | (12,924 | ) | |||||||
| Income tax benefit (expense) | (33 | ) | 580 | (1,664 | ) | |||||||
| Net income (loss) from continuing operations | 85 | (6,535 | ) | (14,588 | ) | |||||||
| Loss from discontinued operations (net of income tax benefit of $0 in 2018, 2017 and 2016) | (113 | ) | (3,914 | ) | (2,800 | ) | ||||||
| Net loss | $ | (28 | ) | $ | (10,449 | ) | $ | (17,388 | ) | |||
| Net loss per common share: | ||||||||||||
| Basic | ||||||||||||
| Continuing operations | $ | — | $ | (0.28 | ) | $ | (0.62 | ) | ||||
Discontinued operations | $ | — | $ | (0.16 | ) | $ | (0.12 | ) | ||||
| Basic net loss per common share | $ | — | $ | (0.44 | ) | $ | (0.74 | ) | ||||
| Diluted | ||||||||||||
| Continuing operations | $ | — | $ | (0.28 | ) | $ | (0.62 | ) | ||||
| Discontinued operations | $ | — | $ | (0.16 | ) | $ | (0.12 | ) | ||||
| Diluted net loss per common share | $ | — | $ | (0.44 | ) | $ | (0.74 | ) | ||||
| Weighted-average number of common shares outstanding: | ||||||||||||
| Basic | 24,164,000 | 23,872,000 | 23,365,000 | |||||||||
| Diluted | 24,164,000 | 23,872,000 | 23,365,000 | |||||||||
Consolidated Statements of Comprehensive (Loss) Income
(
in thousands of dollars)For the years ended December 31, | ||||||||
2020 | 2019 | |||||||
Net loss | $ | (4,278 | ) | $ | (7,852 | ) | ||
Other comprehensive income (loss): | ||||||||
Foreign currency translation adjustments | 408 | (493 | ) | |||||
Total other comprehensive income (loss) | 408 | (493 | ) | |||||
Comprehensive loss | $ | (3,870 | ) | $ | (8,345 | ) | ||
| For the years ended December 31, | ||||||||||||
| 2018 | 2017 | 2016 | ||||||||||
| Net loss | $ | (28 | ) | $ | (10,449 | ) | $ | (17,388 | ) | |||
| Other comprehensive income (loss): | ||||||||||||
| Foreign currency translation adjustments | (513 | ) | 802 | (6 | ) | |||||||
| Unrealized losses from marketable securities, net of tax | (4 | ) | (2 | ) | (6 | ) | ||||||
| Total other comprehensive income (loss) | (517 | ) | 800 | (12 | ) | |||||||
| Comprehensive loss | $ | (545 | ) | $ | (9,649 | ) | $ | (17,400 | ) | |||
Consolidated Statements of Stockholders’ Equity
(
in thousands of dollars or shares, as appropriate)Common Stock | Additional Paid-in | Accumulated | Accumulated Other Comprehensive | Nil Coupon Perpetual Loan | Treasury | |||||||||||||||||||||||||||
Shares | Amount | Capital | Deficit | Loss | Notes | Stock | Total | |||||||||||||||||||||||||
Balance at December 31, 2018 | 24,170 | $ | 248 | $ | 138,992 | $ | (102,495 | ) | $ | (1,285 | ) | $ | 76 | $ | (1,484 | ) | $ | 34,052 | ||||||||||||||
Net loss | (7,852 | ) | (7,852 | ) | ||||||||||||||||||||||||||||
Foreign currency translation adjustments | (493 | ) | (493 | ) | ||||||||||||||||||||||||||||
| Stock compensation expense | 574 | 574 | ||||||||||||||||||||||||||||||
Common shares issued upon vesting of restricted stock units | 563 | 6 | (6 | ) | — | |||||||||||||||||||||||||||
Treasury shares withheld | (141 | ) | (128 | ) | (128 | ) | ||||||||||||||||||||||||||
Adoption of ASC 842 | 22 | 22 | ||||||||||||||||||||||||||||||
Balance at December 31, 2019 | 24,592 | $ | 254 | $ | 139,560 | $ | (110,325 | ) | $ | (1,778 | ) | $ | 76 | $ | (1,612 | ) | $ | 26,175 | ||||||||||||||
Net loss | (4,278 | ) | (4,278 | ) | ||||||||||||||||||||||||||||
Foreign currency translation adjustments | 408 | 408 | ||||||||||||||||||||||||||||||
Stock compensation expense | 290 | 290 | ||||||||||||||||||||||||||||||
| Exercise of stock Options | 183 | 2 | 294 | 296 | ||||||||||||||||||||||||||||
Common shares issued upon vesting of restricted stock units | 606 | 6 | (6 | ) | - | |||||||||||||||||||||||||||
Treasury shares withheld | (152 | ) | (570 | ) | (570 | ) | ||||||||||||||||||||||||||
Balance at December 31, 2020 | 25,229 | 262 | 140,138 | (114,603 | ) | (1,370 | ) | 76 | (2,182 | ) | $ | 22,321 | ||||||||||||||||||||
| Common Stock | Additional Paid-in Capital | Accumulated Deficit | Accumulated Other Comprehensive Income (Loss) | Nil Coupon Perpetual Loan Notes | Treasury Stock | Total | |||||||||||||||||||||||||
| Shares | Amount | ||||||||||||||||||||||||||||||
| Balance at December 31, 2015 | 23,167 | $ | 234 | $ | 135,394 | $ | (74,835 | ) | $ | (1,556 | ) | $ | 76 | $ | (1,042 | ) | $ | 58,271 | |||||||||||||
| Net loss | (17,388 | ) | (17,388 | ) | |||||||||||||||||||||||||||
| Foreign currency translation adjustments | (6 | ) | (6 | ) | |||||||||||||||||||||||||||
| Unrealized loss on marketable securities, net of tax | (6 | ) | (6 | ) | |||||||||||||||||||||||||||
| Stock compensation expense | 1,991 | 1,991 | |||||||||||||||||||||||||||||
| Common shares issued upon vesting of restricted stock units | 382 | 4 | (5 | ) | (1 | ) | |||||||||||||||||||||||||
| Treasury shares withheld | (103 | ) | (172 | ) | (172 | ) | |||||||||||||||||||||||||
| Balance at December 31, 2016 | 23,446 | $ | 238 | $ | 137,380 | $ | (92,223 | ) | $ | (1,568 | ) | $ | 76 | $ | (1,214 | ) | $ | 42,689 | |||||||||||||
| Net loss | (10,449 | ) | (10,449 | ) | |||||||||||||||||||||||||||
| Foreign currency translation adjustments | 802 | 802 | |||||||||||||||||||||||||||||
| Unrealized loss on marketable securities, net of tax | (2 | ) | (2 | ) | |||||||||||||||||||||||||||
| Stock compensation expense | 1,389 | 1,389 | |||||||||||||||||||||||||||||
| Common shares issued upon vesting of restricted stock units | 976 | 10 | (9 | ) | 1 | ||||||||||||||||||||||||||
| Treasury shares withheld | (289 | ) | (258 | ) | (258 | ) | |||||||||||||||||||||||||
| Balance at December 31, 2017 | 24,133 | $ | 248 | $ | 138,760 | $ | (102,672 | ) | $ | (768 | ) | $ | 76 | $ | (1,472 | ) | $ | 34,172 | |||||||||||||
| Net loss | (28 | ) | (28 | ) | |||||||||||||||||||||||||||
| Foreign currency translation adjustments | (513 | ) | (513 | ) | |||||||||||||||||||||||||||
| Unrealized loss on marketable securities, net of tax | (4 | ) | (4 | ) | |||||||||||||||||||||||||||
| Stock compensation expense | 233 | 233 | |||||||||||||||||||||||||||||
| Common shares issued upon vesting of restricted stock units | 49 | — | (1 | ) | (1 | ) | |||||||||||||||||||||||||
| Treasury shares withheld | (12 | ) | (12 | ) | (12 | ) | |||||||||||||||||||||||||
| Adoption of ASC 606 | 205 | 205 | |||||||||||||||||||||||||||||
| Balance at December 31, 2018 | 24,170 | $ | 248 | $ | 138,992 | $ | (102,495 | ) | $ | (1,285 | ) | $ | 76 | $ | (1,484 | ) | $ | 34,052 | |||||||||||||
Consolidated Statements of Cash Flows
(
in thousands of dollars)For the years ended December 31, | ||||||||
2020 | 2019 | |||||||
OPERATING ACTIVITIES | ||||||||
Net loss | $ | (4,278 | ) | $ | (7,852 | ) | ||
Loss from discontinued operations | — | 1 | ||||||
Net loss from continuing operations | (4,278 | ) | (7,851 | ) | ||||
Adjustments to reconcile net loss to net cash used in operating activities: | ||||||||
Depreciation | 663 | 810 | ||||||
Amortization | 185 | 186 | ||||||
Gain on disposal of equipment | (5 | ) | (3 | ) | ||||
Provision for doubtful accounts, net of recoveries | (1,026 | ) | 421 | |||||
Deferred income taxes | (38 | ) | — | |||||
Stock-based compensation, net of forfeitures | 290 | 574 | ||||||
Intangible assets abandonment | 197 | 127 | ||||||
Excess and obsolete inventory provision | — | (131 | ) | |||||
Foreign exchange gain | — | 370 | ||||||
Changes in operating assets and liabilities: | ||||||||
Accounts receivable | 1,095 | 11,415 | ||||||
Inventories | 171 | 818 | ||||||
Prepaid expenses, other current assets and other non-current assets | (161 | ) | 2,239 | |||||
Accounts payable | 198 | (7,331 | ) | |||||
Accrued liabilities and other non-current liabilities | 2 | (5,010 | ) | |||||
Net cash used in operating activities - continuing operations | (2,707 | ) | (3,366 | ) | ||||
Net cash used in operating activities - discontinued operations | — | (21 | ) | |||||
Net cash used in operating activities | (2,707 | ) | (3,387 | ) | ||||
INVESTING ACTIVITIES | ||||||||
Purchases of equipment and patents | (247 | ) | (550 | ) | ||||
Net cash used in investing activities - continued operations | (247 | ) | (550 | ) | ||||
Net cash provided by investing activities - discontinued operations | — | 505 | ||||||
Net cash used in investing activities | (247 | ) | (45 | ) | ||||
FINANCING ACTIVITIES | ||||||||
Proceeds from Borrowings | 1,556 | — | ||||||
Proceeds from Option Exercises | 296 | — | ||||||
Taxes paid on behalf of equity award participants | (570 | ) | (128 | ) | ||||
Net cash provided by (used in) financing activities | 1,282 | (128 | ) | |||||
Effect of exchange rate fluctuations on cash | 777 | (998 | ) | |||||
Net decrease in cash, cash equivalents and restricted cash | (895 | ) | (4,558 | ) | ||||
Cash, cash equivalents and restricted cash at beginning of period | 13,501 | 18,059 | ||||||
Cash, cash equivalents and restricted cash at end of period | $ | 12,606 | $ | 13,501 | ||||
Supplemental Cash Flow Information: | ||||||||
Cash paid for: | ||||||||
Income taxes | $ | 95 | $ | 18 | ||||
| For the years ended December 31, | ||||||||||||
| 2018 | 2017 | 2016 | ||||||||||
| OPERATING ACTIVITIES | ||||||||||||
| Net loss | $ | (28 | ) | $ | (10,449 | ) | $ | (17,388 | ) | |||
| Loss from discontinued operations | 113 | 3,914 | 2,800 | |||||||||
| Net income (loss) from continuing operations | 85 | (6,535 | ) | (14,588 | ) | |||||||
| Adjustments to reconcile net income (loss) to net cash used in operating activities: | ||||||||||||
| Depreciation | 654 | 1,312 | 1,780 | |||||||||
| Amortization | 193 | 215 | 1,118 | |||||||||
| Loss on disposal of equipment | 142 | 304 | 60 | |||||||||
| Provision for doubtful accounts, net of recoveries | (64 | ) | — | (111 | ) | |||||||
| Deferred income taxes | 2 | (534 | ) | 1,196 | ||||||||
| Stock-based compensation, net of forfeitures | 233 | 1,389 | 1,991 | |||||||||
| Intangible assets abandonment and building impairment | 317 | 2,965 | 2,074 | |||||||||
| Excess and obsolete inventory provision | 78 | 228 | 825 | |||||||||
| Changes in operating assets and liabilities: | ||||||||||||
| Accounts receivable | 848 | 113 | 3,522 | |||||||||
| Inventories | (108 | ) | (134 | ) | 446 | |||||||
| Prepaid expenses, other current assets and other non-current assets | 251 | (1,084 | ) | 2,893 | ||||||||
| Accounts payable | 521 | 2,500 | (2,445 | ) | ||||||||
| Accrued liabilities and other non-current liabilities | 1,897 | (2,439 | ) | 699 | ||||||||
| Net cash provided by (used in) operating activities - continuing operations | 5,049 | (1,700 | ) | (540 | ) | |||||||
| Net cash used in operating activities - discontinued operations | (122 | ) | (1,868 | ) | (2,198 | ) | ||||||
| Net cash provided by (used in) operating activities | 4,927 | (3,568 | ) | (2,738 | ) | |||||||
| INVESTING ACTIVITIES | ||||||||||||
| Purchases of equipment and patents | (570 | ) | (492 | ) | (940 | ) | ||||||
| Proceeds from the sale of equipment | 1 | 2 | 2 | |||||||||
| Net cash used in investing activities | (569 | ) | (490 | ) | (938 | ) | ||||||
| FINANCING ACTIVITIES | ||||||||||||
| Taxes paid on behalf of equity award participants | (12 | ) | (258 | ) | (172 | ) | ||||||
| Net cash used in financing activities | (12 | ) | (258 | ) | (172 | ) | ||||||
| Effect of exchange rate fluctuations on cash | (673 | ) | 856 | 10 | ||||||||
| Net increase (decrease) in cash, cash equivalents and restricted cash | 3,673 | (3,460 | ) | (3,838 | ) | |||||||
| Cash, cash equivalents and restricted cash at beginning of period | 14,386 | 17,846 | 21,684 | |||||||||
| Cash, cash equivalents and restricted cash at end of period | $ | 18,059 | $ | 14,386 | $ | 17,846 | ||||||
| Supplemental Cash Flow Information: | ||||||||||||
| Cash paid for: | ||||||||||||
| Interest | $ | — | $ | — | $ | — | ||||||
| Income taxes paid | $ | 27 | $ | 31 | $ | 368 | ||||||
See notes to consolidated financial statements.
(
in thousands of dollars, except share and per-share data)1.
ORGANIZATION AND SIGNIFICANT ACCOUNTING POLICIESOrganization
Fuel Tech, Inc. and subsidiaries ("Fuel Tech", the "Company", "we", "us" or "our") provides advanced engineered solutions for the optimization of combustion systems in utility and industrial applications. Our primary focus is on the worldwide marketing and sale of NO
Our FUEL CHEM program is based on proprietary TIFI
® Targeted In-Furnace™ Injection technology, in combination with advanced Computational Fluid Dynamics (CFD) and Chemical Kinetics Modeling (CKM) boiler modeling, in the unique application of specialty chemicals to improve the efficiency, reliability and environmental status of combustion units by controlling slagging, fouling, corrosion, opacity and other sulfur trioxide-related issues in the boiler.Our business is materially dependent on the continued existence and enforcement of air quality regulations, particularly in the United States. We have expended significant resources in the research and development of new technologies in building our proprietary portfolio of air pollution control, fuel and boiler treatment chemicals, computer modeling and advanced visualization technologies.
International revenues were $12,648, $15,656,$3,928 and $12,616$4,585 for the years ended December 31, 2018, 20172020 and 2016,2019, respectively. These amounts represented 22%, 35%,17% and 23%15% of Fuel Tech’s total revenues for the respective periods of time. Foreign currency changes did not have a material impact on the calculation of these percentages. We have foreign offices in Beijing, China and Gallarate, Italy.
Basis of Presentation
The consolidated financial statements include the accounts of Fuel Tech and its wholly-owned subsidiaries. All intercompany transactions have been eliminated.
The consolidated financial statements have been prepared in accordance with accounting principles generally accepted in the United States of America (GAAP). The books and records of subsidiaries located in foreign countries are maintained according to generally accepted accounting principles in those countries. Upon consolidation, the Company evaluates the differences in accounting principles and determines whether adjustments are necessary to convert the foreign financial statements to the accounting principles upon which the consolidated financial statements are based. As a result of this evaluation no material adjustments were identified. All intercompany transactions have been eliminated.
COVID-19 Pandemic
The emergence of the yearcoronavirus (COVID-19) around the world presents significant risks to the Company, not all of which the Company is able to fully evaluate or even foresee at the current time. The COVID-19 pandemic has affected the Company's operations during the twelve months ended December 31, 2018, we discovered an error in the previously issued financial statements as a result of the preparation of the current year income tax provision. The income tax error discovered did not correctly include a deferred tax liability associated with historical goodwill from our Fuel Chem business segment for the year ended December 31, 2015.
| Year Ended December 31, 2017 | As Previously Reported | Revision | As Revised | ||||||
| Income tax benefit | 46 | 534 | 580 | ||||||
| Net loss from continuing operations | (7,069 | ) | 534 | (6,535 | ) | ||||
| Net loss | (10,983 | ) | 534 | (10,449 | ) | ||||
| Comprehensive loss | (10,183 | ) | 534 | (9,649 | ) | ||||
| Basic | |||||||||
| Continuing operations | (0.30 | ) | 0.02 | (0.28 | ) | ||||
| Discontinued operations | (0.16 | ) | — | (0.16 | ) | ||||
| Basic loss per common share | (0.46 | ) | 0.02 | (0.44 | ) | ||||
| Diluted | |||||||||
| Continuing operations | (0.30 | ) | 0.02 | (0.28 | ) | ||||
| Discontinued operations | (0.16 | ) | — | (0.16 | ) | ||||
| Basic loss per common share | (0.46 | ) | 0.02 | (0.44 | ) | ||||
Management cannot predict the full impact of the COVID-19 pandemic on the December 31, 2017Company's sales and 2016 consolidated balance sheet:
| Year Ended December 31, 2017 | As Previously Reported | Revision | As Revised | ||||||
| Deferred income taxes (long-term) | — | (169 | ) | (169 | ) | ||||
| Accumulated deficit | (102,503 | ) | (169 | ) | (102,672 | ) | |||
| Total shareholders’ equity | 34,341 | (169 | ) | 34,172 | |||||
| Year Ended December 31, 2016 | As Previously Reported | Revision | As Revised | ||||||
| Deferred income taxes (long-term) | — | (703 | ) | (703 | ) | ||||
| Accumulated deficit | (91,520 | ) | (703 | ) | (92,223 | ) | |||
| Total shareholders’ equity | 43,392 | (703 | ) | 42,689 | |||||
Liquidity
We have experienced continued declines in revenues and recurring losses. As a result, we have evaluated our ongoing business needs, and considered the cash requirements of our Air Pollution Control (APC) and FUEL CHEM businesses. This evaluation included consideration of the following: a) customer and revenue trends in our APC and FUEL CHEM business segments, b) current operating structure and expenditure levels, c) current availability of working capital, and d) support for our research and development initiatives. We continue to monitor our liquidity needs and have taken measures to reduce expenses and restructure operations which we feel are necessary to ensure we maintain sufficient working capital and liquidity to operate the business and invest in our future.
On February 11, 2021, Fuel Tech entered into a securities purchase agreement (the “Purchase Agreement”) with certain institutional investors pursuant to which the Company agreed to issue and sell, in a private placement (the “Private Placement”), (i) 5,000,000 shares (the “Shares”) of Common Stock, (ii) and 2,500,000 warrants (the “Warrants”) exercisable for a total of 2,500,000 shares of Common Stock (the “Warrant Shares”) with an exercise price of $5.10 per Warrant Share, at a purchase price of $5.1625 per Share and associated warrant. The error originatedgross proceeds to the Company from the Private Placement were approximately $25.8 million, before deducting placement agent fees and offering expenses. The receipt of these funds strengthen our current cash position and in conjunction with our net cash flows expected to be generated from operations are adequate to fund planned operations of the Company for the year ended December 31, 2015 and the accumulated deficit was revised in the Statement of Stockholder's Equity to reflect the correction of the deferred tax liability:
| Year Ended December 31, 2015 | As Previously Reported | Revision | As Revised | ||||||
| Accumulated deficit | (74,132 | ) | (703 | ) | (74,835 | ) | |||
| Total shareholders’ equity | 58,974 | (703 | ) | 58,271 | |||||
Use of Estimates
The preparation of the financial statements in conformity with generally accepted accounting principles requires management to make estimates and assumptions that affect the amounts reported in the financial statements and accompanying notes. The Company uses estimates in accounting for, among other items, revenue recognition, allowance for doubtful accounts, income tax provisions, excess and obsolete inventory reserve, impairment of long-lived assets, and warranty expenses. Actual results could differ from those estimates.
Fair Value of Financial Instruments
The carrying values of cash and cash equivalents, accounts receivable, and accounts payable and long-term borrowings are reasonable estimates of their fair value due to their short-term nature. Our marketable securities are carried at fair value based on quoted market prices in an active market.
Cash, cash equivalents and restricted cash
We include cash and investments having an original maturity of three months or less at the time of acquisition in cash and cash equivalents. We have never incurred realized or unrealized holdings gains or losses on securities classified as cash equivalents. Income resulting from short-term investments is recorded as interest income. At December 31, 2018,2020, we had cash on hand of approximately $855$858 at our Beijing, China subsidiary that is subject to certain local regulations that may limit the immediate availability of these funds outside of China. Cash on hand at our Italy subsidiary totaled approximately 2,008$1,111 at December 31, 2018.
Restricted cash as of December 31, 2020 represents funds that are restricted to satisfy any amount borrowed against the Company's Cash Collateral Security agreement with BMO Harris Bank N.A. The balance of restricted cash totaling $1,966 is comprised of $1,595 in current assets relating to existing standby letters of credit with varying maturity dates and expire no later than December 31, 2020 and $371 in long-term assets will remain through the expiration dates of the underlying standby letters of credit (the latest maturity date is February 1, 2023) with BMO Harris Bank N.A. Refer to Note 11 Debt Financing for further information on the Facility.
Restricted cash as of December 31, 2019 represents funds that are restricted to satisfy any amount borrowed against the Company's then existing revolving credit facility (the Facility) with JPMorgan Chase Bank, N.A. The remaining balance of restricted cash totaling $6,020 will remain throughIn connection with the Maturity Date oftransition to BMO Harris Bank N.A., the Facility. Refer to Note 10 Debt Financing for further informationCompany canceled its U.S. Domestic credit facility with JPMorgan Chase Bank, N.A. effective on the Facility.
The following table provides a reconciliation of cash, cash equivalents, and restricted cash reported within the Consolidated Balance Sheet that sum to the total of the same such amounts shown in the Consolidated Statements of Cash Flows:
December 31, 2020 | December 31, 2019 | |||||||
Cash and cash equivalents | $ | 10,640 | $ | 10,914 | ||||
Restricted cash included in current assets | 1,595 | 2,080 | ||||||
Restricted cash included in long-term assets | 371 | 507 | ||||||
Total cash, cash equivalents, and restricted cash shown in the Consolidated Statements of Cash Flows | $ | 12,606 | $ | 13,501 | ||||
| December 31, 2018 | December 31, 2017 | |||||
| Cash and cash equivalents | $ | 12,039 | $ | 8,366 | ||
| Restricted cash included in current assets | 6,020 | 1,020 | ||||
| Restricted cash included in long-term assets | — | 5,000 | ||||
| Total cash, cash equivalents, and restricted cash shown in the Consolidated Statements of Cash Flows | $ | 18,059 | $ | 14,386 | ||
Foreign Currency Risk Management
Our earnings and cash flows are subject to fluctuations due to changes in foreign currency exchange rates. We do not enter into foreign currency forward contracts or into foreign currency option contracts to manage this risk due to the nature of the transactions involved.
Accounts Receivable
Accounts receivable consist of amounts due to us in the normal course of our business, are not collateralized, and normally do not bear interest. Accounts receivable includes contract assets, billings occurring subsequent to revenue recognition under ASC 606
Revenue from Contracts with Customers. At December 31,The allowance for doubtful accounts is our management's best estimate of the amount of credit losses in accounts receivable. In order to control and monitor the credit risk associated with our customer base, we review the credit worthiness of customers on a recurring basis. Factors influencing the level of scrutiny include the level of business the customer has with Fuel Tech, the customer’s payment history, and the customer’s financial stability. Receivables are considered past due if payment is not received by the date agreed upon with the customer, which is normally 30 days. Representatives of our management team review all past due accounts on a weekly basis to assess collectability. At the end of each reporting period, the allowance for doubtful accounts balance is reviewed relative to management’s collectability assessment and is adjusted if deemed necessary through a corresponding charge or credit to bad debts expense, which is included in selling, general, and administrative expenses in the consolidated statements of operations. Bad debt write-offs are made when management believes it is probable a receivable will not be recovered. The table below sets forth the components of the Allowance for Doubtful Accounts for the years ended December 31.
Year | Balance at January 1 | Provision charged to expense | Write-offs / Recoveries | Balance at December 31 | ||||||||||||
2019 | $ | 1,411 | $ | 573 | $ | (168 | ) | $ | 1,816 | |||||||
2020 | $ | 1,816 | $ | (498 | ) | $ | (483 | ) | $ | 835 | ||||||
| Year | Balance at January 1 | Provision charged to expense | Write-offs / Recoveries | Balance at December 31 | ||||||||||||
| 2016 | $ | 1,772 | $ | 172 | $ | (375 | ) | $ | 1,569 | |||||||
| 2017 | $ | 1,569 | $ | — | $ | (24 | ) | $ | 1,545 | |||||||
| 2018 | $ | 1,545 | $ | — | $ | (134 | ) | $ | 1,411 | |||||||
Prepaid expenses and other current assets
Prepaid expenses and other current assets includes Chinese banker acceptances of $997$549 and $613$43 as of December 31, 20182020 and 2017.2019. These are short-term commitments of typically 30three to 60 dayssix months for future payments and can be redeemed at a discount or applied to future vendor payments.
Inventories
Inventories consist primarily of spare parts and are stated at the lower of cost or net realizable value, using the weighted-average cost method. Usage is recorded in cost of sales in the period that parts were issued to a project or used to service equipment. Inventories are periodically evaluated to identify obsolete or otherwise impaired parts and are written off when management determines usage is not probable. The Company estimates the balance of excess and obsolete inventory by analyzing inventory by age using last used and original purchase date and existing sales pipeline for which the inventory could be used. The table below sets forth the components of the Excess and Obsolete Inventory Reserve for the years ended December 31.
Year | Balance at January 1 | Provision charged to expense | Write-offs / Recoveries | Balance at December 31 | ||||||||||||
2019 | 1,131 | — | (131 | ) | 1,000 | |||||||||||
2020 | 1,000 | — | (93 | ) | 907 | |||||||||||
| Year | Balance at January 1 | Provision charged to expense | Write-offs / Recoveries | Balance at December 31 | ||||||||||||
| 2016 | $ | — | $ | 825 | $ | — | $ | 825 | ||||||||
| 2017 | 825 | 228 | — | 1,053 | ||||||||||||
| 2018 | 1,053 | 78 | — | 1,131 | ||||||||||||
Foreign Currency Translation and Transactions
Assets and liabilities of consolidated foreign subsidiaries are translated into U.S. dollars at exchange rates in effect at year end. Revenues and expenses are translated at average exchange rates prevailing during the year. Gains or losses on foreign currency transactions and the related tax effects are reflected in net income. The resulting translation adjustments are included in stockholders’ equity as part of accumulated other comprehensive income.
During 2020, the Company recorded a foreign currency adjustment of $408 to accumulated other comprehensive loss.
Accumulated Other Comprehensive (Loss)Loss
December 31, | ||||||||
2020 | 2019 | |||||||
Foreign currency translation | ||||||||
Balance at beginning of period | $ | (1,778 | ) | $ | (1,285 | ) | ||
Other comprehensive loss: | ||||||||
Foreign currency translation adjustments (1) | 408 | (493 | ) | |||||
Balance at end of period | $ | (1,370 | ) | $ | (1,778 | ) | ||
Total accumulated other comprehensive loss | $ | (1,370 | ) | $ | (1,778 | ) | ||
| December 31, | ||||||||
| 2018 | 2017 | |||||||
| Foreign currency translation | ||||||||
| Balance at beginning of period | $ | (772 | ) | $ | (1,574 | ) | ||
| Other comprehensive (loss): | ||||||||
| Foreign currency translation adjustments (1) | (513 | ) | 802 | |||||
| Balance at end of period | $ | (1,285 | ) | $ | (772 | ) | ||
| Available-for-sale marketable securities | ||||||||
| Balance at beginning of period | $ | 4 | $ | 6 | ||||
| Other comprehensive (loss): | ||||||||
| Net unrealized holding (loss) (2) | (4 | ) | (2 | ) | ||||
| Balance at end of period | $ | — | $ | 4 | ||||
| Total accumulated other comprehensive (loss) | $ | (1,285 | ) | $ | (768 | ) | ||
(1) | |
In all periods presented, there were no tax impacts related to rate changes and |
Research and Development
Research and development costs are expensed as incurred. Research and development projects funded by customer contracts are reported as part of cost of goods sold. Internally funded research and development expenses are reported as operating expenses.
Product/System Warranty
We typically warrant our air pollution control products and systems against defects in design, materials and workmanship for one to two years. A provision for estimated future costs relating to warranty expense is recorded when the products/systems become commercially operational.
Goodwill
Goodwill is tested for impairment at least annually as of the first day of our fourth quarter, or more frequently if events or changes in circumstances indicate that the carrying value may not be recoverable. Our evaluation of goodwill impairment involves first assessing qualitative factors to determine whether it is more likely than not that the fair value of a reporting unit is less than its carrying amount. We may bypass this qualitative assessment, or determine that based on our qualitative assessment considering the totality of events and circumstances including macroeconomic factors, industry and market considerations, current and projected financial performance, a sustained decrease in our share price, or other factors, that additional impairment analysis is necessary. This additional analysis involves comparing the current fair value of our reporting units to their carrying values. We use a discounted cash flow (DCF) model to determine the current fair value of our two reporting units. A number of significant assumptions and estimates are involved in the application of the DCF model to forecast operating cash flows, including markets and market share, sales volumes and prices, costs to produce and working capital changes. Management considers historical experience and all available information at the time the fair values of its reporting units are estimated. However, actual fair values that could be realized in an actual transaction may differ from those used to evaluate the impairment of goodwill. For the APC business segment, the Company used working capital as a proxy of fair value for the business segment given the on-going losses in that segment. Fuel Tech performed its annual goodwill impairment analysis for each of its reporting units as of October 1, 20182020 and determined that no impairment of goodwill existed within the FUEL CHEM technology segment.
Goodwill is allocated to each of our reporting units, which is defined as an operating segment or one level below an operating segment, upon acquisition after considering the nature of the net assets giving rise to the goodwill and how each reporting unit would enjoy the benefits and synergies of the net assets acquired. Goodwill is also evaluated for impairment at the reporting unit level. We have two reporting units for goodwill evaluation purposes: the FUEL CHEM technology segment and the APC technology segment. There is no goodwill associated with our APC business technology segment.
The Company utilizes ASU 2017-04, Intangibles-Goodwill and Other (Topic 350): Simplifying the Test for Goodwill Impairment for the annual goodwill impairment test completed during the fourth quarter.
The entire goodwill balance of $2,116 was allocated to the FUEL CHEM technology segment as of December 31, 20182020 and 2017.2019. The Company did not recognize a charge for goodwill impairment for the periods ended December 31, 2018, 20172020 and 2016.
Other Intangible Assets
Management reviews other finite-lived intangible assets, which include customer lists and relationships, covenants not to compete, patent assets, trade names, and acquired technologies,lease assets for impairment when events or changes in circumstances indicate the carrying amount of an asset or asset group may not be recoverable. In the event that impairment indicators exist, a further analysis is performed and if the sum of the expected undiscounted future cash flows resulting from the use of the asset or asset group is less than the carrying amount of the asset or asset group, an impairment loss equal to the excess of the asset or asset group's carrying value over its fair value is recorded. Management considers historical experience and all available information at the time the estimates of future cash flows are made, however, the actual cash values that could be realized may differ from those that are estimated.
During the second quarteryear ended December 31, 2020, the Company recorded an abandonment charge of 2018,$197 due to the Company's decision to no longer maintain and defend certain patents and trademarks which are no longer contributing to operations. The abandonment charge was calculated by determining the net book values of the abandoned patent assets by deducting the accumulated amortization from the acquisition cost. The abandonment charge is included in “Intangible assets abandonment and impairment” line in the accompanying Consolidated Statements of Operations for the year then ended December 31, 2020.
During the year ended December 31, 2019, Fuel Tech recorded an abandonment charge of $317$127 associated with certain international patent assets which the Company elected to not maintain and abandon due to limited business opportunities in those regions. The abandonment charge was calculated by determining the net book values of the abandoned patent assets by deducting the accumulated amortization from the acquisition cost. The abandonment charge of $317 is included in “Intangible assets abandonment and building impairment” line in the accompanying Consolidated Statements of Operations for the year ended December 31, 2018.
Third-party costs related to the development of patents are included within other intangible assets on the consolidated balance sheets. As of December 31, 20182020 and 2017,2019, the net patent asset balance excluding patents acquired in business acquisitions, was $1,164$553 and $1,611,$906, respectively. The third-party costs capitalized as patent costs during the years ended December 31, 20182020 and 20172019 were $59$0 and $135,$56, respectively. Third-party costs are comprised of legal fees that relate to the review and preparation of patent disclosures and filing fees incurred to present the patents to the required governing body.
Our intellectual property portfolio has been a significant building block for the Air Pollution Control and FUEL CHEM technology segments. The patents are essential to the generation of revenue for our businesses and are essential to protect us from competition in the markets in which we serve. These costs are being amortized on the straight-line method over the period beginning with the patent issuance date and ending on the patent expiration date. Patent maintenance fees are charged to operations as incurred.
Amortization expense from continuing operations for intangible assets was $193, $215$185 and $1,118$186 for the years ended December 31, 2018, 20172020 and 2016,2019, respectively. The table below shows the amortization period and other intangible asset cost by intangible asset as of December 31, 20182020 and 2017,2019, and the accumulated amortization and net intangible asset value in total for all other intangible assets.
2020 | 2019 | |||||||||||||||||||||||||||
Description of Other Intangibles | Amortization Period (years) | Gross Carrying Amount | Accumulated Amortization | Net Carrying Amount | Gross Carrying Amount | Accumulated Amortization | Net Carrying Amount | |||||||||||||||||||||
Patent assets | 1 - 20 | 1,310 | (757 | ) | 553 | 1,897 | (991 | ) | 906 | |||||||||||||||||||
Total | $ | 1,310 | $ | (757 | ) | $ | 553 | $ | 1,897 | $ | (991 | ) | $ | 906 | ||||||||||||||
| 2018 | 2017 | |||||||||||||||||||||||||
| Description of Other Intangibles | Amortization Period | Gross Carrying Amount | Accumulated Amortization | Net Carrying Amount | Gross Carrying Amount | Accumulated Amortization | Net Carrying Amount | |||||||||||||||||||
| Customer relationships | 11-15 years | $ | 1,198 | $ | (1,198 | ) | $ | — | $ | 1,198 | $ | (1,138 | ) | $ | 60 | |||||||||||
| Patent assets | 1- 20 years | 2,092 | (928 | ) | 1,164 | 2,412 | (801 | ) | 1,611 | |||||||||||||||||
| Total | $ | 3,290 | $ | (2,126 | ) | $ | 1,164 | $ | 3,610 | $ | (1,939 | ) | $ | 1,671 | ||||||||||||
The table below shows the estimated future amortization expense for intangible assets:
Year | Estimated Amortization Expense | |||
2021 | $ | 145 | ||
2022 | 52 | |||
2023 | 51 | |||
2024 | 44 | |||
2025 | 43 | |||
Thereafter | 218 | |||
Total | $ | 553 | ||
| Year | Estimated Amortization Expense | ||
| 2019 | $ | 132 | |
| 2020 | 132 | ||
| 2021 | 132 | ||
| 2022 | 132 | ||
| 2023 | 132 | ||
| Thereafter | 504 | ||
| Total | $ | 1,164 | |
Property and Equipment
Property and equipment is stated at historical cost.cost and does not include capital in process expenditures yet to be capitalized. Provisions for depreciation are computed by the straight-line method, using estimated useful lives that range based on the nature of the asset. Leasehold improvements are depreciated over the shorter of the associated lease term or the estimated useful life of the asset. Depreciation expense from continuing operations was $654, $1,312,$663 and $1,780$810 for the years ended December 31, 2018, 20172020 and 2016,2019, respectively. The table below shows the depreciable life and cost by asset class as of December 31, 20182020 and 2017,2019, and the accumulated depreciation and net book value in total for all classes of assets.
Description of Property and Equipment | Depreciable Life (years) | 2020 | 2019 | |||||||||
Land | $ | 1,050 | $ | 1,050 | ||||||||
Building | 39 | 3,950 | 3,950 | |||||||||
Building and leasehold improvements | 3 - 39 | 2,886 | 2,886 | |||||||||
Field equipment | 3 - 4 | 19,748 | 19,507 | |||||||||
Computer equipment and software | 2 - 3 | 2,954 | 2,936 | |||||||||
Furniture and fixtures | 3 - 10 | 1,477 | 1,475 | |||||||||
Vehicles | 5 | 32 | 32 | |||||||||
| Construction in process | 12 | — | ||||||||||
Total cost | 32,109 | 31,836 | ||||||||||
Less accumulated depreciation | (26,889 | ) | (26,174 | ) | ||||||||
Total net book value | $ | 5,220 | $ | 5,662 | ||||||||
| Description of Property and Equipment | Depreciable Life | 2018 | 2017 | |||||||
| Land | $ | 1,050 | $ | 1,050 | ||||||
| Building | 39 years | 3,950 | 3,950 | |||||||
| Building and leasehold improvements | 3-39 years | 3,242 | 3,264 | |||||||
| Field equipment | 3-4 years | 19,541 | 19,251 | |||||||
| Computer equipment and software | 2-3 years | 3,154 | 3,124 | |||||||
| Furniture and fixtures | 3-10 years | 1,535 | 1,539 | |||||||
| Vehicles | 5 years | 32 | 32 | |||||||
| Total cost | 32,504 | 32,210 | ||||||||
| Less accumulated depreciation | (26,528 | ) | (25,938 | ) | ||||||
| Total net book value | $ | 5,976 | $ | 6,272 | ||||||
Property and equipment is reviewed for impairment when events and circumstances indicate that the carrying amount of the assets (or asset group) may not be recoverable. If impairment indicators exists, we perform a more detailed analysis and an impairment loss is recognized when estimated future undiscounted cash flows expected to result from the use of the asset (or asset group) and its eventual disposition are less than the carrying amount. This process of analyzing impairment involves examining the operating condition of individual assets (or asset group) and estimating a fair value based upon current condition, relevant market factors and remaining estimated operational life compared to the asset’s remaining depreciable life. Quoted market prices and other valuation techniques are used to determine expected cash flows. A significant portion of our property and equipment is comprised of assets deployed at customer locations relating to our FUEL CHEM technology asset group, and due to the shorter-term duration over which this equipment is depreciated, the likelihood of impairment is mitigated. The discontinuation of a FUEL CHEM program at a customer site would most likely result in the re-deployment of all or most of the affected assets to another customer location rather than an impairment.
Revenue Recognition
The Company recognizes revenue when control of the promised goods or services is transferred to our customers, in an amount that reflects the consideration we expect to be entitled to in exchange for those goods or services. Fuel Tech’s sales of products to customers represent single performance obligations, which are not impacted upon the adoption of ASC 606. The majority of our contracts have a single performance obligation as the promise to transfer the individual goods or services is not separately identifiable from other promises in the contracts and, therefore, not distinct. Revenue is measured as the amount of consideration we expect to receive in exchange for transferring goods or providing services. Sales, value add, and other taxes we collect concurrent with revenue-producing activities are excluded from revenue.
Air Pollution Control Technology
Fuel Tech’s APC contracts are typically six to eighteen months in length. A typical contract will have three or four critical operational measurements that, when achieved, serve as the basis for us to invoice the customer via progress billings. At a minimum, these measurements will include the generation of engineering drawings, the shipment of equipment and the completion of a system performance test.
As part of most of its contractual APC project agreements, Fuel Tech will agree to customer-specific acceptance criteria that relate to the operational performance of the system that is being sold. These criteria are determined based on modeling that is performed by Fuel Tech personnel, which is based on operational inputs that are provided by the customer. The customer will warrant that these operational inputs are accurate as they are specified in the binding contractual agreement. Further, the customer is solely responsible for the accuracy of the operating condition information; typically all performance guarantees and equipment warranties granted by us are voidable if the operating condition information is inaccurate or is not met.
Since control transfers over time, revenue is recognized based on the extent of progress towards completion of the single performance obligation. Fuel Tech uses the cost-to-cost input measure of progress for our contracts since it best depicts the transfer of assets to the customer which occurs as we incur costs on our contracts. Under the cost-to-cost input measure of progress, the extent of progress towards completion is measured based on the ratio of costs incurred to date to the total estimated costs at completion of the performance obligation. Revenues are recorded proportionally as costs are incurred. Costs to fulfill include all internal and external engineering costs, equipment charges, inbound and outbound freight expenses, internal and site transfer costs, installation charges, purchasing and receiving costs, inspection costs, warehousing costs, project personnel travel expenses and other direct and indirect expenses specifically identified as project- or product-line related, as appropriate (e.g. test equipment depreciation and certain insurance expenses).
Fuel Tech has installed over 1,0001,200 units with APC technology and normally provides performance guarantees to our customers based on the operating conditions for the project. As part of the project implementation process, we perform system start-up and optimization services that effectively serve as a test of actual project performance. We believe that this test, combined with the accuracy of the modeling that is performed, enables revenue to be recognized prior to the receipt of formal customer acceptance.
FUEL CHEM
Revenues from the sale of chemical products are recognized when control transfers to customer upon shipment or delivery of the product based on the applicable shipping terms. We generally recognize revenue for these arrangements at a point in time based on our evaluation of when the customer obtains control of the promised goods or services.
On occasion, Fuel Tech will engineer and sell its chemical pumping equipment. These projects are similar in nature to the APC projects described above and for those projects where control transfers over time, revenue is recognized based on the extent of progress towards completion of the single performance obligation.
For projects containing multiple performance obligations, the Company allocates the transaction price based on the estimated standalone selling price. The Company must develop assumptions that require judgment to determine the stand-alone selling price for each performance obligation identified in the contract. The Company utilizes key assumptions to determine the stand-alone selling price, which may include other comparable transactions, pricing considered in negotiating the transaction and the estimated costs. Variable consideration is allocated specifically to one or more performance obligations in a contract when the terms of the variable consideration relate to the satisfaction of the performance obligation and the resulting amounts allocated are consistent with the amounts the Company would expect to receive for the satisfaction of each performance obligation.
The consideration allocated to each performance obligation is recognized as revenue when control is transferred for the related goods or services. For performance obligations which consist of licenses and other promises, the Company utilizes judgment to assess the nature of the combined performance obligation to determine whether the combined performance obligation is satisfied over time or at a point in time and, if over time, the appropriate method of measuring progress. The Company evaluates the measure of progress each reporting period and, if necessary, adjusts the measure of performance and related revenue recognition.
The Company receives payments from its customers based on billing schedules established in each contract. Up-front payments and fees are recorded as deferred revenue upon receipt or when due until the Company performs its obligations under these arrangements. Amounts are recorded as accounts receivable when the Company’s right to consideration is unconditional.
Cost of sales includes all internal and external engineering costs, equipment and chemical charges, inbound and outbound freight expenses, internal and site transfer costs, installation charges, purchasing and receiving costs, inspection costs, warehousing costs, project personnel travel expenses and other direct and indirect expenses specifically identified as project- or product line-related, as appropriate (e.g., test equipment depreciation and certain insurance expenses). Certain depreciation and amortization expenses related to tangible and intangible assets, respectively, are allocated to cost of sales. We classify shipping and handling costs in cost of sales in the consolidated statements of operations.
Selling, General and Administrative Expenses
Selling, general and administrative expenses primarily include the following categories except where an allocation to the cost of sales line item is warranted due to the project- or product-line nature of a portion of the expense category: salaries and wages, employee benefits, non-project travel, insurance, legal, rent, accounting and auditing, recruiting, telephony, employee training, Board of Directors’ fees, auto rental, office supplies, dues and subscriptions, utilities, real estate taxes, commissions and bonuses, marketing materials, postage and business taxes. Departments comprising the selling, general and administrative line item primarily include the functions of executive management, finance and accounting, investor relations, regulatory affairs, marketing, business development, information technology, human resources, sales, legal and general administration.
Income Taxes
The provision for income taxes is determined using the asset and liability approach of accounting for income taxes. Under this approach, the provision for income taxes represents income taxes paid or payable (or received or receivable) for the current year plus the change in deferred taxes during the year. Deferred taxes represent the future tax consequences expected to occur when the reported amounts of assets and liabilities are recovered or paid, and result from differences between the financial and tax bases of our assets and liabilities and are adjusted for changes in tax rates and tax laws when enacted. Valuation allowances are recorded to reduce deferred tax assets when it is more likely than not that a tax benefit will not be realized. In evaluating the need for a valuation allowance, management considers all potential sources of taxable income, including income available in carryback periods, future reversals of taxable temporary differences, projections of taxable income, and income from tax planning strategies, as well as all available positive and negative evidence. Positive evidence includes factors such as a history of profitable operations, projections of future profitability within the carryforward period, including from tax planning strategies, and our experience with similar operations. Negative evidence includes items such as cumulative losses, projections of future losses, or carryforward periods that are not long enough to allow for the utilization of a deferred tax asset based on existing projections of income. Deferred tax assets for which no valuation allowance is recorded may not be realized upon changes in facts and circumstances.
Tax benefits related to uncertain tax positions taken or expected to be taken on a tax return are recorded when such benefits meet a more likely than not threshold. Otherwise, these tax benefits are recorded when a tax position has been effectively settled, which means that the statute of limitation has expired or the appropriate taxing authority has completed their examination even though the statute of limitations remains open. Interest and penalties related to uncertain tax positions are recognized as part of the provision for income taxes and are accrued beginning in the period that such interest and penalties would be applicable under relevant tax law until such time that the related tax benefits are recognized.
Leases
On January 1, 2019, we adopted ASC 842 "Leases" using the modified retrospective method outlined in ASU 2018-11, “Leases (Topic 842) Targeted Improvements.” Refer to Note 10 for further details regarding the effect of adoption. We determine if an arrangement is a lease at inception. Operating leases are included in right-of-use ("ROU") operating lease assets, operating lease liabilities - current, and operating lease liabilities - non-current on our Consolidated Balance Sheets.
Operating lease ROU assets and operating lease liabilities are recognized based on the present value of the future minimum lease payments over the lease term at commencement date. As most of our leases do not provide an implicit rate, we use our incremental borrowing rate based on the information available at commencement date in determining the present value of future payments. The operating lease ROU asset also includes any lease payments made and excludes lease incentives and initial direct costs incurred. Our lease terms may include options to extend or terminate the lease when it is reasonably certain that we will exercise that option. Lease expense for minimum lease payments is recognized on a straight-line basis over the lease term.
We have lease agreements with lease and non-lease components, and we elected the practical expedient to not separate lease and non-lease components for the majority of our leases. For certain equipment leases, such as vehicles, we account for the lease and non-lease components as a single lease component. We also elected the practical expedient to keep leases with an initial term of 12 months or less off of the consolidated balance sheet.
During the quarter ended September 30, 2020, an error was detected in the calculation of the adoption of ASC 842, "Leases" made on January 1, 2019. The calculation included an incorrect lease amount associated with one of our leases. This error did not correctly present the Right of Use asset and related Operating Lease Liability on the Company's balance sheet.
We evaluated the revision in accordance with Accounting Standards Codification (ASC) 250, Accounting Changes and Error Corrections and evaluated the materiality of the revision on prior periods' financial statements in accordance with the Securities and Exchange Commission Staff Accounting Bulletin No. 108, Quantifying Financial Statement Errors. We concluded that the revision was not material to any prior period and, therefore, amendments of previously filed reports are not required. Periods not presented herein will be revised, as applicable, in future filings. The revision did not have an impact on the net loss or earnings per share for the year ended December 31, 2019.
As Previously Reported Year Ended December 31, 2019 | Revision | As Revised Year Ended December 31, 2019 | ||||||||||
Right of Use Operating Lease Asset | 980 | (618 | ) | 362 | ||||||||
Operating Lease Liability - Current | 300 | (118 | ) | 182 | ||||||||
Operating Lease Liability - Non Current | 680 | (500 | ) | 180 | ||||||||
Stock-Based Compensation
Our stock-based employee compensation plan, referred to as the Fuel Tech, Inc. 2014 Long-Term Incentive Plan (Incentive Plan), was adopted in May 2014 and allows for awards to be granted to participants in the form of non-qualified stock options, incentive stock options, stock appreciation rights, restricted stock, restricted stock units, performance awards, and bonuses or other forms of share-based or non-share-based awards or combinations thereof. Participants in the Incentive Plan may be our directors, officers, employees, consultants or advisors (except consultants or advisors in capital-raising transactions) as the directors determine are key to the success of our business. There are a maximum of 5,600,676 shares that may be issued or reserved for awards to participants under the Incentive Plan as of December 31, 2018.2020. Based on the existing issued or reserved awards in Incentive Plan, there are 2,133,7332,533,639 shares available to be used for future awards to participants in the Incentive Plan as of December 31, 2018.
Basic and Diluted Earnings per Common Share
Basic earnings per share excludes the antidilutive effects of stock options, restricted stock units (RSUs) and the nil coupon non-redeemable convertible unsecured loan notes (see Note 7). Diluted earnings per share includes the dilutive effect of the nil coupon non-redeemable convertible unsecured loan notes, RSUs, and unexercised in-the-money stock options, except in periods of net loss where the effect of these instruments is antidilutive. Out-of-the-money stock options are excluded from diluted earnings per share because they are anti-dilutive.unlikely to be exercised and would be anti-dilutive if they were exercised. At December 31, 2018, 20172020 and 2016,2019, we had outstanding equity awards of 757,000, 2,210,000584,505 and 1,800,000,913,000, respectively, which were antidilutive for the purpose of inclusion incalculation of the diluted earnings per share calculation because the exercise prices of the options were greater than the average market price of our common stock.share. As of December 31, 2018, 20172020 and 20162019, respectively, we had an additional 620,000, 168,000547,000 and 184,000728,000 equity awards that were antidilutive because of the net loss in the year then ended. These equity awards could potentially dilute basic EPS in future years.
The table below sets forth the weighted-average shares used at December 31 in calculating earnings (loss) per share:
2020 | 2019 | |||||||
Basic weighted-average shares | 24,691,000 | 24,202,000 | ||||||
Conversion of unsecured loan notes | — | — | ||||||
Unexercised options and unvested restricted stock units | — | — | ||||||
Diluted weighted-average shares | 24,691,000 | 24,202,000 | ||||||
| 2018 | 2017 | 2016 | |||||||
| Basic weighted-average shares | 24,164,000 | 23,872,000 | 23,365,000 | ||||||
| Conversion of unsecured loan notes | — | — | — | ||||||
| Unexercised options and unvested restricted stock units | — | — | — | ||||||
| Diluted weighted-average shares | 24,164,000 | 23,872,000 | 23,365,000 | ||||||
Risk Concentrations
Financial instruments that potentially subject the Company to a significant concentration of credit risk consist primarily of cash and cash equivalents and accounts receivable. The Company maintains deposits in federally insured financial institutions in excess of federally insured limits. However, management believes the Company is not exposed to significant credit risk due to the financial position of its primary depository institution where a significant portion of its deposits are held.
For the year ended December 31, 2018,2020, we had two customers which individually represented greater than 10% of revenues. One customerBoth customers contributed revenues to both product segments but were primarily toconcentrated in our APC technology segment and represented 27% of consolidated revenues. The other customer contributed to our APC technology and FUEL CHEM technology segment and represented 13%28% of consolidated revenues. We had no customers that accounted for greater than 10% of our current assets as of December 31, 2018.
For the year ended December 31, 2017,2019, we had one customerthree customers which individually represented greater than 10% of revenues. ThisOne customer contributed primarily to our APC segment and represented 19% of consolidated revenues. The other two customers contributed to the FUEL CHEM technology segment and each customer represented 10%11% of consolidated revenues. We had no customers that accounted for greater than 10% of our current assets as of December 31, 2017.
We control credit risk through requiring milestone payments on long-term contracts, performing ongoing credit evaluations of its customers, and in some cases obtaining security for payment through bank guarantees and letters of credit.
We use the cost method to account for its common stock repurchases. During the years ended December 31, 20182020 and 2017,2019, we withheld 11,215152,257 and 289,202140,784 shares of our Common Shares, valued at approximately $12$570 and $258,$128, respectively, to settle personal tax withholding obligations that arose as a result of restricted stock units that vested. Refer to Note 6, “Treasury Stock,” for further discussion.
Recently AdoptedIssued Accounting Standards
In May 2014, the Financial Accounting Standards Board (FASB) issued ASU 2014-09 "Revenue from Contracts with Customers" (ASC 606). These changes created a comprehensive framework for all entities in all industries to apply in the determination of when to recognize revenue, and, therefore, supersede virtually all existing revenue recognition requirements and guidance. This framework is expected to result in less complex guidance in application while providing a consistent and comparable methodology for revenue recognition. The core principle of the guidance is that an entity should recognize revenue to depict the transfer of promised goods or services to customers in an amount that reflects the consideration to which the entity expects to be entitled in exchange for those goods or services. To achieve this principle, an entity should apply the following steps: (i) identify the contract(s) with a customer, (ii) identify the performance obligations in the contract(s), (iii) determine the transaction price, (iv) allocate the transaction price to the performance obligations in the contract(s), and (v) recognize revenue when, or as, the entity satisfies a performance obligation. The new standard also requires additional financial statement disclosures that will enable users to understand the nature, amount, timing and uncertainty of revenue and cash flows relating to customer contracts. In August 2015, the FASB approved a one-year deferral to January 1, 2018. The Company adopted the standard on January 1, 2018 using the modified retrospective transition method. See Note 3, Revenue Recognition, for further discussion.
In June 2016, the FASB issued ASU 2016-13, Financial Instruments - Credit Losses (Topic 326): Measurement of Credit Losses on Financial Instruments, which amends the current accounting guidance and requires the measurement of all expected losses based on historical experience, current conditions and reasonable and supportable forecasts. For trade receivables, loans, and other financial instruments, we will be required to use a forward-looking expected loss model rather than the incurred loss model for recognizing credit losses which reflects losses that are probable. The standard will become effective for interim and annual periods beginning on January 1, 2019. We expect thatafter December 15, 2022, with early adoption permitted. Application of the amendments is through a cumulative-effect adjustment to retained earnings as of the effective date. The Company is currently in the process of evaluating the impact of adoption, but we do not believe the adoption of this standard will have a material effectimpact on our financial statements. While we continue to assess all of the effects of adoption, we currently believe the most significant effects relate to the recognition of new right-of-use assets and lease liabilities on our balance sheet for our office and equipment operating leases and providing significant new disclosures about our leasing activities. We do not expect a significant change in our leasing activities between now and adoption. On adoption, we currently expect to recognize additional operating liabilities of approximately $756, with corresponding right-of-use assets of the same amount based on the present value of the remaining minimum rental payments under current leasing standards for existing operating leases. The new standard also provides
| 2018 | 2017 | 2016 | ||||||||||
| Total revenues | $ | 3,006 | $ | 8,034 | $ | 5,087 | ||||||
| Net loss | (1,868 | ) | (1,343 | ) | (2,300 | ) | ||||||
| 2018 | 2017 | 2016 | ||||||||||
| Total assets | $ | 8,546 | $ | 13,005 | $ | 13,474 | ||||||
| Total liabilities | 2,953 | 5,245 | 5,306 | |||||||||
| Total net assets | 5,593 | 7,760 | 8,168 | |||||||||
2. DISCONTINUED OPERATIONS
During 2017, the Company has suspended all operations associated with the Fuel Conversion business segment. The components ofCompany sold the net assets of theremaining Fuel Conversion discontinued operations inequipment within Assets held for sale onduring the Consolidated Balance Sheets totaling $485 which consisted of certain equipment as ofyear ended December 31, 2018 and 2017. The2019 for sales proceeds net of selling costs of $505, resulting amount in assets held fora gain on sale was determined using management's assumptions based on a plan of sale and we may not be able to realize as much value from$20 recorded in discontinued operations. Following the sale of the assets as we expect. In addition, accrued severance of $65 and $376 is included inremaining Fuel Conversion equipment during 2019, the other accrued liabilities line ofCompany completed the Consolidated Balance Sheets as of December 31, 2018 and 2017 respectively.wind-down activities associated with the Fuel Conversion business segment. The Fuel Conversion business segment had no other assets or liabilities associated with it.
The activity of the Fuel Conversion discontinued operations consisted of Research and Development, severance, an impairment charge and other costs for the years ended December 31, 2018, 2017,2020 and 20162019, of $113, $3,914$0 and $2,800,$1, respectively. The loss fromactivity of the Fuel Conversion discontinued operations inconsisted primarily of storage costs for holding the Consolidated Statement of Operationsequipment at a third-party location totaling $21 for the year ended December 31, 2018 includes an impairment charge related to2019 and the Carbonite patent assets of $56 during the second quarter of 2018 as a result of not being able to reach an agreement with a third-party to acquire or license the Carbonite technology in combination with thegain on sale of certain equipment included$20 recorded in Assets held for sale. The loss from discontinued operations in the Consolidated Statementoperations.
3. REVENUE RECOGNITION
| Balance at December 31, 2017 | Adjustments Upon Adoption of ASC 606 | Balance at January 1, 2018 | ||||||
| Liabilities | ||||||||
| Other accrued liabilities | $ | 5,098 | (205 | ) | $ | 4,893 | ||
| Equity | ||||||||
| Accumulated deficit | (102,672 | ) | 205 | (102,467 | ) | |||
Disaggregated Revenue by Product Technology
The following table presents our revenues disaggregated by product technology:
Twelve Months Ended December 31, | ||||||||
2020 | 2019 | |||||||
Air Pollution Control | ||||||||
Technology solutions | $ | 5,668 | $ | 10,640 | ||||
Spare parts | 906 | 1,031 | ||||||
Ancillary revenue | 1,983 | 2,411 | ||||||
Total Air Pollution Control Technology | 8,557 | 14,082 | ||||||
FUEL CHEM | ||||||||
FUEL CHEM technology solutions | 13,993 | 16,385 | ||||||
Total Revenues | $ | 22,550 | $ | 30,467 | ||||
| Twelve Months Ended December 31, | |||||||||
| 2018 | 2017 | 2016 | |||||||
| Air Pollution Control | |||||||||
| Technology solutions | $ | 35,176 | $ | 24,422 | $ | 30,082 | |||
| Spare parts | 1,083 | 1,022 | 1,328 | ||||||
| Ancillary revenue | 2,158 | 2,364 | 2,642 | ||||||
| Total Air Pollution Control Technology | 38,417 | 27,808 | 34,052 | ||||||
| FUEL CHEM | |||||||||
| FUEL CHEM technology solutions | 18,118 | 17,358 | 21,109 | ||||||
| Total Revenues | $ | 56,535 | $ | 45,166 | $ | 55,161 | |||
Disaggregated Revenue by Geography
The following table presents our revenues disaggregated by geography, based on the billing addresses of our customers:
Twelve Months Ended December 31, | ||||||||
2020 | 2019 | |||||||
United States | $ | 18,622 | $ | 25,882 | ||||
Foreign Revenues | ||||||||
Americas | 549 | 777 | ||||||
Europe | 1,656 | 2,322 | ||||||
Asia | 1,723 | 1,486 | ||||||
Total Foreign Revenues | 3,928 | 4,585 | ||||||
Total Revenues | $ | 22,550 | $ | 30,467 | ||||
| Twelve Months Ended December 31, | |||||||||
| 2018 | 2017 | 2016 | |||||||
| United States | $ | 43,887 | $ | 29,510 | $ | 42,545 | |||
| Foreign Revenues | |||||||||
| South America | 1,290 | 2,118 | 2,934 | ||||||
| Europe | 6,260 | 6,206 | 4,460 | ||||||
| Asia | 5,098 | 7,332 | 5,222 | ||||||
| Total Foreign Revenues | 12,648 | 15,656 | 12,616 | ||||||
| Total Revenues | $ | 56,535 | $ | 45,166 | $ | 55,161 | |||
Timing of Revenue Recognition
The following table presents the timing of our revenue recognition:
Twelve Months Ended December 31, | ||||||||
2020 | 2019 | |||||||
Products transferred at a point in time | $ | 15,787 | $ | 19,827 | ||||
Products and services transferred over time | 6,763 | 10,640 | ||||||
Total Revenues | $ | 22,550 | $ | 30,467 | ||||
| Twelve Months Ended December 31, | |||||||||
| 2018 | 2017 | 2016 | |||||||
| Products transferred at a point in time | $ | 21,359 | $ | 20,744 | $ | 25,079 | |||
| Products and services transferred over time | 35,176 | 24,422 | 30,082 | ||||||
| Total Revenues | $ | 56,535 | $ | 45,166 | $ | 55,161 | |||
Contract Balances
The timing of revenue recognition, billings and cash collections results in billed accounts receivable, unbilled receivables (contract assets), and customer advances and deposits (contract liabilities) on the consolidated balance sheets. In our Air Pollution Control Technology segment, amounts are billed as work progresses in accordance with agreed-upon contractual terms. Generally, billing occurs subsequent to revenue recognition, resulting in contract assets. These assets are reported on the consolidated balance sheet on a contract-by-contract basis at the end of each reporting period. At December 31, 2018, 20172020 and 2016,2019, contract assets were approximately $5,540, $7,894$2,348 and $6,755$1,857, respectively, and are included in accounts receivable on the consolidated balance sheets.
However, the Company will periodically bill in advance of costs incurred before revenue is recognized, resulting in contract liabilities. These liabilities are reported on the consolidated balance sheet on a contract-by-contract basis at the end of each reporting period. Contract liabilities were $1,234, $2,403$850 and $1,730$712 at December 31, 2018, 20172020 and 20162019, respectively, and are included in other accrued liabilities on the consolidated balance sheets.
As of December 31, 20182020 we had fiveone construction contract in progress that was identified as a loss contract and a provision for losses of $176 was recorded in other accrued liabilities on the consolidated balance sheet. As of December 31, 2019, we had three construction contracts in progress that were identified as loss contracts and a provision for losses of $123$26 was recorded in other accrued liabilities on the consolidated balance sheet. As of December 31, 2017, we had four construction contracts in progress that were identified as loss contracts and a provision for losses of $117 was recorded in other accrued liabilities on the consolidated balance sheet.
Remaining Performance Obligations
Remaining performance obligations, represents the transaction price of Air Pollution Control technology booked orders for which work has not been performed. As of December 31, 2018,2020, the aggregate amount of the transaction price allocated to remaining performance obligations was $12,384.$5,268. The Company expects to recognize revenue on approximately $10,622$2,981 of the remaining performance obligations over the next 12 months with the remaining recognized thereafter.
Practical Expedients and Exemptions
We generally expense sales commissions on a ratable basis when incurred because the amortization period would have been one year or less. These costs are recorded within selling, general and administrative expenses within the Consolidated Statements of Operations. A practical expedient was elected to not recognize shipping and handling costs as a separate performance obligation under ASC 606.
Accounts Receivable
The components of accounts receivable are as follows:
As of | ||||||||
December 31, 2020 | December 31, 2019 | |||||||
Trade receivables | $ | 5,015 | $ | 6,425 | ||||
Unbilled receivables | 2,348 | 1,857 | ||||||
Other short-term receivables | 20 | 7 | ||||||
Allowance for doubtful accounts | (835 | ) | (1,816 | ) | ||||
Total accounts receivable | $ | 6,548 | $ | 6,473 | ||||
4. INCOME TAXES
Within the calculation of the Company’s annual effective tax rate, the Company has used assumptions and estimates that may change as a result of future guidance, interpretation, and rule-making from the Internal Revenue Service, the SEC, and the FASB and/or various other taxing jurisdictions. For example, the Company anticipates that the state jurisdictions will continue to determine and announce their conformity to the U.S. Tax Act which could have an impact on the annual effective tax rate.
On March 27, 2020 the Coronavirus Aid, Relief, and Economic Security Act (CARES Act) was enacted which enacted the following relief among others;
● | Amended federal tax laws to permit 100% bonus depreciation for eligible qualified improvement property placed in service by the taxpayer after December 31, 2017 and before January 1, 2023. |
● | Eliminated the 80% of taxable income limitations by allowing corporate entities to fully utilize Net Operating Losses (NOL) carryforwards to offset taxable income in 2018, 2019 or 2020. The 80% limitation is reinstated for tax years after 2020. |
● | Increased the net interest expense deduction limit to 50% of adjusted taxable income from 30% for tax years beginning January 1, 2019 and 2020. |
● | Allowed taxpayers with alternative minimum tax credits to claim a refund in 2020 for the entire amount of the credit instead of recovering the credit through refunds over a period of years, as originally enacted by the Tax Cuts and Jobs Act in 2017. |
● | Allowed taxpayers the carryback of Net Operating Losses (NOL) as a result of tax years beginning after December 31, 2017, but before January 1, 2021 for the five prior years of the generated loss. |
The components of income (loss)loss before taxes for the years ended December 31 are as follows:
Origin of income before taxes | 2020 | 2019 | ||||||
United States | $ | (3,411 | ) | $ | (5,803 | ) | ||
Foreign | (810 | ) | (2,034 | ) | ||||
Loss before income taxes | $ | (4,221 | ) | $ | (7,837 | ) | ||
| Origin of income before taxes | 2018 | 2017 | 2016 | |||||||||
| United States | $ | 3,277 | $ | (9,821 | ) | $ | (13,016 | ) | ||||
| Foreign | (3,272 | ) | (1,208 | ) | (2,708 | ) | ||||||
| Income (Loss) before income taxes | $ | 5 | $ | (11,029 | ) | $ | (15,724 | ) | ||||
Significant components of income tax benefit (expense) for the years ended December 31 are as follows:
2020 | 2019 | |||||||
Current: | ||||||||
Federal | $ | — | $ | — | ||||
State | (7 | ) | (14 | ) | ||||
Foreign | (88 | ) | — | |||||
Total current | (95 | ) | (14 | ) | ||||
Deferred: | ||||||||
Federal | 22 | — | ||||||
State | 16 | — | ||||||
Total deferred | 38 | — | ||||||
Income tax expense | $ | (57 | ) | $ | (14 | ) | ||
| 2018 | 2017 | 2016 | ||||||||||
| Current: | ||||||||||||
| Federal | $ | (18 | ) | $ | 111 | $ | (357 | ) | ||||
| State | (13 | ) | — | — | ||||||||
| Foreign | — | (65 | ) | (105 | ) | |||||||
| Total current | (31 | ) | 46 | (462 | ) | |||||||
| Deferred: | ||||||||||||
| Federal | (2 | ) | 534 | — | ||||||||
| Foreign | — | — | (1,202 | ) | ||||||||
| Total deferred | (2 | ) | 534 | (1,202 | ) | |||||||
| Income tax benefit (expense) | $ | (33 | ) | $ | 580 | $ | (1,664 | ) | ||||
A reconciliation between the provision for income taxes calculated at the U.S. federal statutory income tax rate and the consolidated income tax expense in the consolidated statements of operations for the years ended December 31 is as follows:
2020 | 2019 | |||||||
Provision at the U.S. federal statutory rate | 21.0 | % | 21.0 | % | ||||
State taxes, net of federal benefit | 1.5 | % | 2.7 | % | ||||
Foreign tax rate differential | 0.5 | % | — | % | ||||
China Enterprise Tax | (2.1 | )% | — | % | ||||
Valuation allowance | (13.9 | )% | (29.2 | )% | ||||
Share based compensation shortfall | (2.0 | )% | — | % | ||||
Other true up | (2.7 | )% | 1.6 | % | ||||
Intangible assets impairment and other non-deductibles | 1.8 | % | 2.3 | % | ||||
State rate change | (6.5 | )% | — | % | ||||
Other | 1.0 | % | 1.8 | % | ||||
Income tax (expense) benefit effective rate | (1.4 | )% | 0.2 | % | ||||
| 2018 | 2017 | 2016 | |||||||
| Provision at the U.S. federal statutory rate | 21.0 | % | 34.0 | % | 34.0 | % | |||
| State taxes, net of federal benefit | (86.5 | )% | — | % | 2.4 | % | |||
| Foreign tax rate differential | (2,210.3 | )% | (0.9 | )% | — | % | |||
| Valuation allowance | (7,152.8 | )% | 15.0 | % | (42.7 | )% | |||
| Federal tax rate change | — | % | (43.9 | )% | — | % | |||
| Other true up | 8,904.9 | % | — | % | (0.6 | )% | |||
| Intangible assets impairment and other non-deductibles | 2,194.6 | % | (1.8 | )% | — | % | |||
| Other | (994.6 | )% | 2.1 | % | (4.1 | )% | |||
| Income tax benefit (expense) effective rate | 676.3 | % | 4.5 | % | (11.0 | )% | |||
The deferred tax assets and liabilities at December 31 are as follows:
2020 | 2019 | |||||||
Deferred tax assets: | ||||||||
Stock compensation expense | $ | 1,240 | $ | 1,882 | ||||
Goodwill | 986 | 1,490 | ||||||
Royalty accruals | 560 | 560 | ||||||
Bad debt allowance | 338 | 466 | ||||||
Net operating loss carryforwards | 10,959 | 9,146 | ||||||
Credit carry-forwards | 841 | 814 | ||||||
Inventory reserve | 206 | 243 | ||||||
Depreciation | 499 | 502 | ||||||
Other | 334 | 340 | ||||||
Total deferred tax assets | 15,963 | 15,443 | ||||||
Deferred tax liabilities: | ||||||||
Intangible assets | (126 | ) | (220 | ) | ||||
Total deferred tax liabilities | (126 | ) | (220 | ) | ||||
Net deferred tax asset before valuation allowance | 15,837 | 15,223 | ||||||
Valuation allowances for deferred tax assets | (15,971 | ) | (15,394 | ) | ||||
Net deferred tax liability | $ | (134 | ) | $ | (171 | ) | ||
| 2018 | 2017 | |||||||
| Deferred tax assets: | ||||||||
| Stock compensation expense | $ | 1,867 | $ | 1,814 | ||||
| Goodwill | 1,927 | 2,366 | ||||||
| Royalty accruals | 484 | 443 | ||||||
| Bad debt allowance | 345 | 360 | ||||||
| Inter-company interest expense accrual | — | 496 | ||||||
| Net operating loss carryforwards | 6,654 | 5,253 | ||||||
| Credit carry-forwards | 685 | 694 | ||||||
| Inventory reserve | 277 | 254 | ||||||
| Depreciation | 515 | 555 | ||||||
| Other | 539 | 362 | ||||||
| Total deferred tax assets | 13,293 | 12,597 | ||||||
| Deferred tax liabilities: | ||||||||
| Intangible assets | (283 | ) | (386 | ) | ||||
| Other | (137 | ) | (146 | ) | ||||
| Total deferred tax liabilities | (420 | ) | (532 | ) | ||||
| Net deferred tax asset before valuation allowance | 12,873 | 12,065 | ||||||
| Valuation allowances for deferred tax assets | (13,044 | ) | (12,234 | ) | ||||
| Net deferred tax liability | $ | (171 | ) | $ | (169 | ) | ||
The change in the valuation allowance for deferred tax assets for the years ended December 31 is as follows:
Year | Balance at January 1 | Charged to costs and expenses | (Deductions)/Other | Balance at December 31 | ||||||||||||
2019 | $ | 13,044 | 2,350 | — | $ | 15,394 | ||||||||||
2020 | $ | 15,394 | 577 | $ | 15,971 | |||||||||||
| Year | Balance at January 1 | Charged to costs and expenses | (Deductions)/Other | Balance at December 31 | ||||||||||
| 2016 | $ | 7,832 | 5,347 | — | $ | 13,179 | ||||||||
| 2017 | $ | 13,179 | (945 | ) | — | $ | 12,234 | |||||||
| 2018 | $ | 12,234 | 810 | — | $ | 13,044 | ||||||||
For the years ended December 31, 2018, 20172020 and 2016,2019, there were no exercises of stock options.
As required by ASC 740, we recognize the financial statement benefit of a tax position only after determining that the relevant tax authority would more likely than not sustain the position following an audit. For tax positions meeting the more-likely-than-not threshold, the amount recognized in the financial statements is the largest benefit that has a greater than
50% likelihood of being realized upon ultimate settlement with the relevant tax authority.We recognize interest and penalties related to unrecognized tax benefits in income tax expense for all periods presented. There were no interest and penalties recognized in income tax expense during the years ended December 31, 2018, 20172020 and 2016.2019. There were no unrecognized tax benefits as of December 31, 2018, 20172020 and 2016, including interest and penalties $0, $0 $140.
We are subject to taxation in the U.S., various states, and in non-U.S. jurisdictions. Our U.S. income tax returns are primarily subject to examination from 20152017 through 2017;2019; however, U.S. tax authorities also have the ability to review prior tax years to the extent loss carryforwards and tax credit carryforwards are utilized. The open years for the non-U.S. tax returns range from 20102012 through 20172019 based on local statutes.
On April 3, 2019, the Company received notice from the Internal Revenue Service that our U.S. income tax return for the year ended December 31, 2016 was under audit. In May of 2020, the audit was successfully completed with no change required.
Management periodically estimates our probable tax obligations using historical experience in tax jurisdictions and informed judgments. There are inherent uncertainties related to the interpretation of tax regulations in the jurisdictions in which we transact business. The judgments and estimates made at a point in time may change based on the outcome of tax audits, as well as changes to or further interpretations of regulations. If such changes take place, there is a risk that the tax rate may increase or decrease in any period. Tax accruals for tax liabilities related to potential changes in judgments and estimates for both federal and state tax issues are included in current liabilities on the consolidated balance sheet.
The investment in our foreign subsidiaries other than Fuel Tech S.p.A (Chile) and Beijing Fuel Tech is considered to be indefinite in duration and therefore we have not provided a provision for deferred U.S. income taxes on the unremitted earnings from those subsidiaries. A provision has not been established because it is not practicable to determine the amount of unrecognized deferred tax liability for such unremitted foreign earnings and because it is our present intention to reinvest the undistributed earnings indefinitely. As previously noted, the Tax Act made significant changes to the taxation of undistributed foreign earnings, requiring that all previously untaxed earnings and profits of our controlled foreign corporation be subjected to a one-time mandatory deemed repatriation tax. The transition tax substantially eliminated the basis differences that existed prior to the Tax Act. However, there are limited other taxes that could continue to apply such as foreign withholding and certain state taxes.
As required by ASC 740, a valuation allowance must be established when it is more likely than not that all or a portion of a deferred tax asset will not be realized. We have approximately $10,408$25,486 of US net operating loss carryforwards available to offset future US taxable income as of December 31, 2018.2020. The net operating loss carry-forwards related to tax losses generated in prior years ending December 31, 2017 and before in the US totaling $10,733 begin to expire in 2034. Further, we have tax loss carry-forwards of approximately $5,468$6,246 available to offset future foreign income in Italy as of December 31, 2018.2020. We have recorded a full valuation allowance against the resulting $1,312 deferred tax asset because we cannot anticipate when or if this entity will have taxable income sufficient to utilize the net operating losses in the future. There is no expiration of the net operating loss carry-forwards related to tax losses generated in prior years in Italy. Finally, we have tax loss carry-forwards of approximately $10,186$12,763 available to offset future foreign income in China as of December 31, 2018.2020. The net operating loss carry-forwards related to tax losses generated in prior years in China expire in 2022.
As of December 31, 2019, the investment in Fuel Tech S.p.A (Chile) was no longer considered to be indefinite and a provision for deferred U.S income taxes of $155 was recorded. As of December 31, 2020, Fuel Tech S.p.A (Chile) was still included in continuing operations, as a result an additional $15 was recorded, adjusting the total consideration to $170. The deferred income taxes associated with this investment are offset by a valuation allowance of ($170).
5. COMMON SHARES
At December 31, 20182020 and 2017,2019, respectively, we had 24,825,891and 24,777,00125,639,702 and 25,053,480 Common Shares issued and 24,170,58525,228,951 and 24,132,91024,592,578 outstanding, with an additional 6,715 shares reserved for issuance upon conversion of the nil coupon non-redeemable convertible unsecured loan notes (see Note 7). As of December 31, 2018,2020, we had 5,600,676 shares reserved for issuance upon the exercise or vesting of equity awards, of which 932,500484,500 are stock options that are currently exercisable (see Note 8).
6. TREASURY STOCK
Common shares held in treasury totaled 655,306948,347 and 644,091796,090 with a cost of $1,484$2,182 and $1,472$1,612 at December 31, 20182020 and 2017,2019, respectively. These shares were withheld from employees to settle personal tax withholding obligations that arose as a result of restricted stock units that vested during the current and prior years.
7.
NIL COUPON NON-REDEEMABLE CONVERTIBLE UNSECURED LOAN NOTESAt December 31, 20182020 and 2017,2019, respectively, we had a principal amount of
For the years ended December 31, 2020 and 2016,2019, there were no Loan Notes repurchased by the Company.
8. STOCK-BASED COMPENSATION
Under our stock-based employee compensation plan, referred to as the Fuel Tech, Inc. 2014 Long-Term Incentive Plan (Incentive Plan), awards may be granted to participants in the form of Non-Qualified Stock Options, Incentive Stock Options, Stock Appreciation Rights, Restricted Stock, Restricted Stock Units (“RSUs”), Performance Awards, Bonuses or other forms of share-based or non-share-based awards or combinations thereof. Participants in the Incentive Plan may be our directors, officers, employees, consultants or advisors (except consultants or advisors in capital-raising transactions) as the directors determine are key to the success of our business. There are a maximum of
5,600,676 shares that may be issued or reserved for awards to participants under the Incentive Plan which includes 1,200,000 additional shares as a result of an amendment to the Incentive Plan approved by our stockholders in May 2018. At December 31,Stock-based compensation is included in selling, general and administrative costs in our consolidated statements of operations.
The components of stock-based compensation from continuing operations for the years ended December 31, 2018, 20172020 and 20162019 were as follows:
For the Year Ended December 31, | ||||||||
2020 | 2019 | |||||||
Stock options | $ | — | $ | — | ||||
Restricted stock units | 290 | 574 | ||||||
Total stock-based compensation expense | 290 | 574 | ||||||
Tax benefit of stock-based compensation expense | — | — | ||||||
After-tax effect of stock based compensation | $ | 290 | $ | 574 | ||||
| For the Year Ended December 31, | ||||||||||||
| 2018 | 2017 | 2016 | ||||||||||
| Stock options | $ | — | $ | 120 | $ | 90 | ||||||
| Restricted stock units | 233 | 1,269 | 1,901 | |||||||||
| Total stock-based compensation expense | 233 | 1,389 | 1,991 | |||||||||
| Tax benefit of stock-based compensation expense | — | — | ||||||||||
| After-tax effect of stock based compensation | $ | 233 | $ | 1,389 | $ | 1,991 | ||||||
As of December 31, 2018,2020, there was $509$100 of total unrecognized compensation cost related to all non-vested share-based compensation arrangements granted under the Incentive Plan. That cost is expected to be recognized over the remaining requisite service period of
Stock Options
The stock options granted to employees under the Incentive Plan have a
Fuel Tech uses the Black-Scholes option pricing model to estimate the grant date fair value of employee stock options. The principal variable assumptions utilized in valuing options and the methodology for estimating such model inputs include: (1) risk-free interest rate – an estimate based on the yield of zero–coupon treasury securities with a maturity equal to the expected life of the option; (2) expected volatility – an estimate based on the historical volatility of Fuel Tech’s Common Stock for a period equal to the expected life of the option; and (3) expected life of the option – an estimate based on historical experience including the effect of employee terminations.
| 2017 | 2016 | |||||
| Expected dividend yield | — | % | — | % | ||
| Risk-free interest rate | 2.33 | % | 1.85 | % | ||
| Expected volatility | 61.2 | % | 62.3 | % | ||
| Expected life of option | 10 years | 8.8 years | ||||
There were no stock options granted during the yearyears ended December 31, 2018.
The following table presents a summary of our stock option activity and related information for the years ended December 31:
2020 | 2019 | |||||||||||||||
Number of Options | Weighted-Average Exercise Price | Number of Options | Weighted-Average Exercise Price | |||||||||||||
Outstanding at beginning of year | 747,500 | $ | 3.33 | 932,500 | $ | 4.68 | ||||||||||
Exercised | (183,000 | ) | 1.61 | — | — | |||||||||||
Expired or forfeited | (80,000 | ) | 5.79 | (185,000 | ) | 10.14 | ||||||||||
Outstanding at end of year | 484,500 | $ | 3.57 | 747,500 | $ | 3.33 | ||||||||||
Exercisable at end of year | 484,500 | $ | 3.57 | 747,500 | $ | 3.33 | ||||||||||
Weighted-average fair value of options granted during the year | $ | — | $ | — | ||||||||||||
Weighted-Average Remaining Contractual Life (years) | 3.70 | 4.73 | ||||||||||||||
Aggregate Intrinsic Value | $ | — | $ | — | ||||||||||||
| 2018 | 2017 | 2016 | |||||||||||||||||||
Number of Options | Weighted- Average Exercise Price | Number of Options | Weighted- Average Exercise Price | Number of Options | Weighted- Average Exercise Price | ||||||||||||||||
| Outstanding at beginning of year | 1,116,750 | $ | 6.34 | 1,039,750 | $ | 8.39 | 1,191,125 | $ | 10.48 | ||||||||||||
| Granted | — | — | 176,000 | 0.96 | 81,000 | 1.58 | |||||||||||||||
| Expired or forfeited | (184,250 | ) | 14.72 | (99,000 | ) | 18.32 | (232,375 | ) | 16.72 | ||||||||||||
| Outstanding at end of year | 932,500 | $ | 4.68 | 1,116,750 | $ | 6.34 | 1,039,750 | $ | 8.39 | ||||||||||||
| Exercisable at end of year | 932,500 | $ | 4.68 | 1,116,750 | $ | 6.34 | 1,039,750 | $ | 8.39 | ||||||||||||
| Weighted-average fair value of options granted during the year | $ | — | $ | 0.68 | $ | 1.11 | |||||||||||||||
Number of Options | Weighted- Average Exercise Price | Weighted- Average Remaining Contractual Life | Aggregate Intrinsic Value | ||||||||||
| Outstanding on January 1, 2018 | 1,116,750 | $ | 6.34 | ||||||||||
| Expired or forfeited | (184,250 | ) | 14.72 | ||||||||||
| Outstanding on December 31, 2018 | 932,500 | $ | 4.68 | 4.67 years | $ | 40 | |||||||
| Exercisable on December 31, 2018 | 932,500 | $ | 4.68 | 4.67 years | $ | 40 | |||||||
The aggregate intrinsic value in the preceding table represents the total pretax intrinsic value, based on our closing stock price of $1.19$3.88 as of December 31, 2018,2020, which would have been received by the option holders had those options holders exercised their stock options as of that date.
The following table summarizes information about stock options outstanding at December 31, 2018:2020:
Options Outstanding and Exercisable | ||||||||||||
| Range of Exercise Prices | Number of Options | Weighted-Average Remaining Contractual Life (years) | Weighted-Average Exercise Price | |||||||||
$0.96 - $1.27 | 88,000 | 6.9 | $ | 0.97 | ||||||||
$1.28 - $3.00 | 132,000 | 4.6 | 2.26 | |||||||||
$3.01 - $4.54 | 120,000 | 2.0 | 3.72 | |||||||||
$4.55 - $8.16 | 144,500 | 2.4 | 6.24 | |||||||||
| 484,500 | 3.7 | $ | 3.57 | |||||||||
| Options Outstanding | Options Exercisable | |||||||||||||||
Range of Exercise Prices | Number of Options | Weighted- Average Remaining Contractual Life | Weighted- Average Exercise Price | Number of Options | Weighted- Average Exercise Price | |||||||||||
| $0.96 - $1.27 | 176,000 | 8.9 years | $ | 0.97 | 176,000 | $ | 0.97 | |||||||||
| $1.28 - $3.00 | 207,000 | 6.8 years | 2.10 | 207,000 | 2.10 | |||||||||||
| $3.01 - $4.54 | 140,000 | 4.0 years | 3.72 | 140,000 | 3.72 | |||||||||||
| $4.55 - $9.06 | 224,500 | 3.4 years | 6.08 | 224,500 | 6.08 | |||||||||||
| $9.07 - $10.20 | 185,000 | 0.4 years | 10.14 | 185,000 | 10.14 | |||||||||||
| $0.96 - $10.20 | 932,500 | 4.7 years | $ | 4.68 | 932,500 | $ | 4.68 | |||||||||
As of and for the 12 months ended December 31, 2018,2020, there was no non-vested stock option activity and as of December 31, 2018, there was $0 of total unrecognized compensation cost related to non-vested stock options granted under the Incentive Plan. Fuel Tech received no proceeds of $296 from the exercise of stock options in the years ended December 31, 2018, 20172020, and 2016,$0 in 2019, respectively. It is our policy to issue new shares upon option exercises, loan conversions, and vesting of restricted stock units. We have not used cash and do not anticipate any future use of cash to settle equity instruments granted under share-based payment arrangements.
Restricted Stock Units
Restricted stock units (RSUs) granted to employees vest over time based on continued service (typically vesting over a period between two and four years). Such time-vested RSUs are valued at the date of grant using the intrinsic value method based on the closing price of the Common Shares on the grant date. Compensation cost, adjusted for estimated forfeitures, is amortized on a straight-line basis over the requisite service period.
During the years ended December 31, 20182020 and 2017,2019, there were 48,890605,630 and 981,633562,777 restricted stock units that vested with a grant date fair value of $77$658 and $2,794,$554, respectively.
A summary of restricted stock unit activity for the years ended December 31, 2018, 20172020 and 20162019 is as follows:
Shares | Weighted Average Grant Date Fair Value | |||||||
Unvested restricted stock units at December 31, 2018 | 1,110,277 | 1.21 | ||||||
Granted | 228,135 | 1.52 | ||||||
Vested | (562,777 | ) | 0.98 | |||||
Unvested restricted stock units at December 31, 2019 | 775,635 | 1.47 | ||||||
Forfeited | (70,000 | ) | 1.03 | |||||
Vested | (605,630 | ) | 1.09 | |||||
Unvested restricted stock units at December 31, 2020 | 100,005 | 4.08 | ||||||
| Shares | Weighted Average Grant Date Fair Value | |||||
| Unvested restricted units at January 1, 2016 | 1,204,883 | 4.21 | ||||
| Granted | 845,862 | 1.88 | ||||
| Forfeited | (205,033 | ) | 4.25 | |||
| Vested | (381,916 | ) | 4.36 | |||
| Unvested restricted stock units at December 31, 2016 | 1,463,796 | 2.82 | ||||
| Granted | 1,090,000 | 0.97 | ||||
| Forfeited | (213,001 | ) | 2.99 | |||
| Vested (1) | (981,633 | ) | 2.85 | |||
| Unvested restricted stock units at December 31, 2017 | 1,359,162 | 1.28 | ||||
| Forfeited | (199,995 | ) | 1.59 | |||
| Vested | (48,890 | ) | 1.59 | |||
| Unvested restricted stock units at December 31, 2018 | 1,110,277 | 1.21 | ||||
Deferred Directors Fees
In addition to the Incentive Plan, Fuel Tech has a Deferred Compensation Plan for Directors (Deferred Plan). Under the terms of the Deferred Plan, Directors can elect to defer Directors’ fees for shares of Fuel Tech Common Stock that are issuable at a future date as defined in the agreement. In accordance with ASC 718, Fuel Tech accounts for these awards as equity awards as opposed to liability awards. In 2018, 20172020 and 2016,2019, there was no stock-based compensation expense under the Deferred Plan.
9. COMMITMENTS AND CONTINGENCIES
Fuel Tech is subject to various claims and contingencies related to, among other things, workers compensation, general liability (including product liability), and lawsuits. The Company records liabilities where a contingent loss is probable and can be reasonably estimated. If the reasonable estimate of a probable loss is a range, the Company records the most probable estimate of the loss or the minimum amount when no amount within the range is a better estimate than any other amount. The Company discloses a contingent liability even if the liability is not probable or the amount is not estimable, or both, if there is a reasonable possibility that a material loss may have been incurred.
From time to time we are involved in litigation with respect to matters arising from the ordinary conduct of our business. In the opinion of management, based upon presently available information, either adequate provision for anticipated costs have been accrued or the ultimate anticipated costs will not materially affect our consolidated financial position, results of operations, or cash flows. We do not believe we have any pending loss contingencies that are probable or reasonably possible of having a material impact on our consolidated financial position, results of operations or cash flows.
During the third quarter of 2020, the Company was notified of an equipment component failure at a foreign customer location. The failure will be remedied under the warranty provision of the contracts that are in place with the customer and certain equipment under agreements expiring on various dates through 2021. Future minimum lease payments under non-cancellable operating leases that have initial or remaining lease terms in excess of one year assupplier. As of December 31, 2020 a charge of $176 was recorded in the accounts payable line of the Consolidated Balance Sheets. In 2018, are as follows:
| Year of Payment | Amount | ||
| 2019 | $ | 613 | |
| 2020 | 102 | ||
| 2021 | 10 | ||
| Total | $ | 725 | |
| Year of Payment | Amount | ||
| 2019 | $ | 164 | |
| 2020 | — | ||
| Total | $ | 164 | |
Performance Guarantees
The majority of Fuel Tech’s long-term equipment construction contracts contain language guaranteeing that the performance of the system that is being sold to the customer will meet specific criteria. On occasion, performance surety bonds and bank performance guarantees/letters of credit are issued to the customer in support of the construction contracts as follows:
in support of the warranty period defined in the contract; or
in support of the system performance criteria that are defined in the contract.
As of December 31, 2018,2020, we had outstanding bank performance guarantees and letters of credit in the amount of $5,028$1,873 in support of equipment construction contracts that have not completed their final acceptance test or that are still operating under a warranty period. The performance guarantees and letters of credit expire in dates ranging from April 2019December 2020 through JanuaryFebruary 2023. Due to the timing of expiration and the actual release of commitment from our bank, as of December 31, 2020, $1,134 of performance guarantees have expired and are currently reflected in outstanding balance. The expiration dates may be extended if the project completion dates are extended. Our management believes it is probable that these projects will be successfully completed and that there will not be a material adverse impact on our operations from these bank performance guarantees and letters of credit. As a result, no liability has been recorded for these performance guarantees.
Product Warranties
We issue a standard product warranty with the sale of our products to customers. Our recognition of warranty liability is based primarily on analyses of warranty claims experience in the preceding years as the nature of our historical product sales for which we offer a warranty are substantially unchanged. This approach provides an aggregate warranty accrual that is historically aligned with actual warranty claims experienced. ChangesThere were no changes in the warranty liability from continuing operations in 2018, 20172020 and 2016 are summarized below:2019. The warranty balance was $159 at December 31, 2020 and 2019.
10. LEASES
Adoption of ASC 842, "Leases"
On January 1, 2019, we adopted ASC 842 using the modified retrospective method outlined in ASU 2018-11 "Leases (Topic 842) Targeted Improvements." Results for reporting periods beginning after January 1, 2019 are presented under ASC 842, while prior period amounts are not adjusted and continue to be reported in accordance with our legacy accounting under Accounting Standards Codification Topic 840: Leases (ASC 840). The Company recorded the transition to ASC 842 by recognizing a cumulative-effect adjustment to the opening balance of retained earnings in the period of adoption rather than in the earliest period presented.
We have elected the package of practical expedients permitted under the transition guidance, which among other things, allow us to carry forward the historical accounting relating to lease identification and classification for existing leases upon adoption. We have also elected the practical expedient to not separate lease and non-lease components for the majority of our leases and the election to keep leases with an initial term of 12 months or less off of the consolidated balance sheet.
The cumulative effect of the changes made to our January 1, 2019 consolidated balance sheet for the adoption of ASC 842 were as follows:
| Balance at December 31, 2018 | Adjustments Upon Adoption of ASC 842 | Balance at January 1, 2019 | ||||||||||
Assets | ||||||||||||
Right-of-use operating lease assets | $ | — | $ | 832 | $ | 832 | ||||||
Liabilities | ||||||||||||
Other accrued liabilities | 6,099 | (22 | ) | 6,077 | ||||||||
Operating lease liabilities - current | — | 522 | 522 | |||||||||
Operating lease liabilities - non-current | — | 310 | 310 | |||||||||
Equity | ||||||||||||
Accumulated deficit | (102,495 | ) | 22 | (102,473 | ) | |||||||
The adjustment made to the January 1, 2019 consolidated balance sheet related to an accrued liability for lease escalation clauses in certain of our leases under ASC 840 which is a cumulative-effect adjustment to the opening balance of accumulated deficit upon the adoption of ASC 842.
| 2018 | 2017 | 2016 | ||||||||||
| Aggregate product warranty liability at beginning of year | $ | 159 | $ | 159 | $ | 268 | ||||||
| Net aggregate expense (income) related to product warranties | — | — | (109 | ) | ||||||||
| Aggregate reductions for payments | — | — | — | |||||||||
| Aggregate product warranty liability at end of year | $ | 159 | $ | 159 | $ | 159 | ||||||
Leases
The terms of the Company’s three primary office space lease arrangements are as follows:
The Gallarate, Italy building lease, for approximately 1,335 square feet, runs from May 1, 2019 to April 30, 2025. This facility serves as the operating headquarters for our European operations.
The Aurora, IL warehouse lease, for approximately 11,000 square feet, runs from September 1, 2013 to December 31, 2020. This facility serves as an outside warehouse facility. On January 30, 2020, the Company extended the lease for three years to expire on December 31, 2023.
The Overland Park, KS lease, for approximately 600 square feet, runs from October 16, 2018 to October 15, 2021. This facility serves primarily as a sales office.
The Company also has four additional operating leases related to certain office equipment and company leased vehicles. Our leases have remaining lease terms of 1 year to 4 years. Our leases do not contain any material residual value guarantees or material restricted covenants and we currently have no material sublease arrangements. We have no financing leases as defined under ASC 842.
Total operating lease expense for the years ended December 31, 2020 is as follows:
| 2020 | 2019 | |||||||
Operating lease cost | $ | 205 | $ | 555 | ||||
Short-term lease cost | 20 | 136 | ||||||
Total lease cost | $ | 225 | $ | 691 |
The weighted average remaining lease term was 3.04 years as of December 31, 2020. The weighted average discount rate was 4.68% as of December 31, 2020. An incremental borrowing rate of 5.25% was used for the properties in the United States and a rate of 2.67% for our lease in Italy.
Remaining maturities of our existing lease liabilities as of December 31, 2020 were as follows:
Year Ending December 31, | Operating Leases | |||
2021 | 177 | |||
2022 | 123 | |||
2023 | 116 | |||
2024 | 27 | |||
Thereafter | 10 | |||
Total lease payments | $ | 453 | ||
Less imputed interest | (67 | ) | ||
Total | $ | 386 | ||
The following is the balance sheet classification of our existing lease liabilities:
2020 | 2019 | |||||||
Operating lease liabilities - current | $ | 149 | $ | 182 | ||||
Operating lease liabilities - non-current | 237 | 180 | ||||||
Total operating lease liabilities | $ | 386 | $ | 362 | ||||
Supplemental cash flow information related to leases was as follows:
For the Twelve Months ended December 31, 2020 | For the twelve months ended December 31, 2019 | |||||||
Cash paid for amounts included in the measurement of lease liabilities | $ | 192 | $ | 541 | ||||
Leased assets obtained in exchange for operating lease liabilities | 179 | 520 | ||||||
11. DEBT FINANCING
On June 19, 2019, the Company entered into a Cash Collateral Security agreement with BMO Harris Bank, N.A. (the BMO Harris agreement) to use for the sole purpose of issuing standby letters of credit. The BMO Harris agreement requires us to pledge as cash collateral 105% of the aggregate face amount of outstanding standby letters of credit. The Company pays 250 basis points on the face values of outstanding letters of credit. There are no financial covenants set forth in the BMO Harris agreement. At December 31, 2020, the Company had outstanding standby letters of credit totaling approximately $1,873 under the BMO Harris agreement. As of December 31, 2020, the Company held $1,966 in a separate restricted use designated BMO Harris Bank N.A. deposit account. Fuel Tech is obligatedcommitted to reimbursing the issuing bank for any payments made by the bank under athese instruments.
In connection with the transition to BMO Harris Bank N.A., the Company canceled its U.S. Domestic credit facility with (the Facility) with JPMorgan Chase Bank, N.A. (JPM Chase) effective on September 25, 2019.
The Company was previously obligated under the Facility with JPM Chase which providesprovided for maximum revolving credit borrowings of $5,500 and matures on June 28, 2019.$5,500. Fuel Tech can useused this Facility primarily for cash advances and standby letters of credit. The Facility iswas secured by $5,500 in cash held by the Company in a separate restricted use designated JPM Chase deposit account and has the Company’s Italian subsidiary, Fuel Tech S.r.l., as a guarantor. Outstanding borrowings under the Facility bearbore interest at a rate of LIBOR plus 300 basis points. There arewere no financial covenants set forth in this amendment to the Facility. The Facility was amended on threeseveral occasions during 2019 and 2018, most recently OctoberJune 19, 2018,2019, in order to amend the maximum availability under the Facility. The Company is actively pursuing the renewal of its U.S. Domestic credit facility and intends to renew the U.S. Domestic credit facility at its maturity. As of December 31, 2018 and 2017, there were no outstanding borrowings under the Facility.
Beijing Fuel Tech Environmental Technologies Company, Ltd. (Beijing Fuel Tech), iswas previously obligated under a revolving credit facility (the China Facility) agreement, as most recently amended on October 19, 2018, with JPM Chase which provides which providesprovided for maximum revolving credit borrowings of RMB 2.625 million (approximately $382) and maturesmatured on June 30, 2019. The Facility iswas secured by $520 in cash held by the Company in a separate restricted use designated JPM Chase deposit account. The China Facility bears interest at a rate of 140% of the People’s Bank of China (PBOC) Base Rate, and is guaranteed by the Company. Beijing Fuel Tech can use this facility for cash advances and bank guarantees. As of December 31, 2018 and 2017, Beijing Fuel Tech had no cash borrowings under the China Facility. At December 31, 2018 and 2017, we had outstanding standby letters of credit and bank guarantees totaling approximately $0 and $246, respectively, on its Beijing Fuel Tech revolving credit facility in connection with contracts in process. At December 31, 2018 and 2017, approximately $382 and $753 was available for future
On April 17, 2020, the Company received loan proceeds in the amount of approximately $1,556 under the Paycheck Protection Program (“PPP”). The PPP, established as part of the Coronavirus Aid, Relief and Economic Security Act (“CARES Act”), provides for loans to qualifying businesses for amounts up to 2.5 times of the average monthly payroll expenses of the qualifying business. The loans and accrued interest are forgivable after eight weeks as long as the borrower uses the loan proceeds for eligible purposes, including payroll, benefits, rent and utilities, and maintains its payroll levels. The amount of loan forgiveness will be reduced if the borrower terminates employees or reduces salaries during the eight-week period. The unforgiven portion of the PPP loan is payable over two years at an interest rate of 1%, with a deferral of payments for the first six months. The Company used the proceeds for purposes consistent with the PPP. On January 8, 2021, the Small Business Administration informed the Company that its PPP loan had been forgiven in full. The balance of the loan is reflected in the Long-term borrowing line of the balance sheet as of December 31, 2020.
12. RELATED PARTY TRANSACTIONS
There are no material Related Party transactions to disclose. The transaction with American Bailey Corp. reported in the prior year Form 10-K for 2019 ended December 31, 2019.
As of December 31, 2019, persons now or formerly associated with American Bailey Corporation (ABC), currently own owned approximately 27% of our outstanding Common Shares. ABC iswas a sub-lessee under our February 1, 2010 lease of its offices in Stamford, Connecticut, which runsran through December 31, 2019. The Company did not renew the lease following its expiration on December 31, 2019. ABC reimbursesreimbursed us for its share of lease and lease-related expenses under the sublease agreement. The Stamford facility houseshoused certain administrative functions. The amounts earned from ABC related to the subleases for the yearsyear ended December 31, 2018, 2017 and 2016, were $164, $164 and $165, respectively.2019 was $165. The amount due from ABC related to the sublease agreement was $40, $13 and $13$27 at December 31, 2018, 2017 and 2016 respectively.2019.
13. DEFINED CONTRIBUTION PLAN
We have a retirement savings plan available for all our U.S. employees who have met minimum length-of-service requirements. Our contributions are determined based upon amounts contributed by the employees with additional contributions made at the discretion of the Board of Directors. Costs related to this plan were $231, $285$222 and $376$262 in 2018, 20172020 and 2016,2019, respectively.
14. BUSINESS SEGMENT, GEOGRAPHIC AND QUARTERLY FINANCIAL DATA
Business Segment Financial Data
We segregate our financial results into two reportable segments representing two broad technology segments as follows:
• | The Air Pollution Control technology segment includes technologies to reduce |
• | The FUEL CHEM ® technology segment, which uses chemical processes in combination with advanced CFD and CKM boiler modeling, for the control of slagging, fouling, corrosion, opacity and other sulfur trioxide-related issues in furnaces and boilers through the addition of chemicals into the furnace using TIFI® Targeted In-Furnace Injection™ technology. |
The “Other” classification includes those profit and loss items not allocated to either reportable segment. There are no inter-segment sales that require elimination.
We evaluate performance and allocate resources based on gross margin by reportable segment. The accounting policies of the reportable segments are the same as those described in the summary of significant accounting policies. We do not review assets by reportable segment, but rather, in aggregate for the Company as a whole.
Information about reporting segment net sales and gross margin from continuing operations are provided below:
For the year ended December 31, 2020 | Air Pollution Control Segment | FUEL CHEM Segment | Other | Total | ||||||||||||
Revenues from external customers | $ | 8,557 | $ | 13,993 | $ | — | $ | 22,550 | ||||||||
Cost of sales | (4,583 | ) | (7,329 | ) | — | (11,912 | ) | |||||||||
Gross margin | 3,974 | 6,664 | — | 10,638 | ||||||||||||
Selling, general and administrative | — | — | (13,600 | ) | (13,600 | ) | ||||||||||
Restructuring charge | — | — | — | — | ||||||||||||
Research and development | — | — | (1,177 | ) | (1,177 | ) | ||||||||||
Intangible assets abandonment | — | — | (197 | ) | (197 | ) | ||||||||||
Operating income (loss) from continuing operations | $ | 3,974 | $ | 6,664 | $ | (14,974 | ) | $ | (4,336 | ) | ||||||
| For the year ended December 31, 2018 | Air Pollution Control Segment | FUEL CHEM Segment | Other | Total | ||||||||||||
| Revenues from external customers | $ | 38,417 | $ | 18,118 | $ | — | $ | 56,535 | ||||||||
| Cost of sales | (27,382 | ) | (9,089 | ) | — | (36,471 | ) | |||||||||
| Gross margin | 11,035 | 9,029 | — | 20,064 | ||||||||||||
| Selling, general and administrative | — | — | (18,564 | ) | (18,564 | ) | ||||||||||
| Research and development | — | — | (1,073 | ) | (1,073 | ) | ||||||||||
| Intangible assets impairment | — | — | (317 | ) | (317 | ) | ||||||||||
| Operating income (loss) from continuing operations | $ | 11,035 | $ | 9,029 | $ | (19,954 | ) | $ | 110 | |||||||
| For the year ended December 31, 2017 | Air Pollution Control Segment | FUEL CHEM Segment | Other | Total | ||||||||||||
| Revenues from external customers | $ | 27,808 | $ | 17,358 | $ | — | $ | 45,166 | ||||||||
| Cost of sales | (18,478 | ) | (8,666 | ) | — | (27,144 | ) | |||||||||
| Gross margin | 9,330 | 8,692 | — | 18,022 | ||||||||||||
| Selling, general and administrative | — | — | (20,933 | ) | (20,933 | ) | ||||||||||
| Restructuring charge | (58 | ) | (61 | ) | — | (119 | ) | |||||||||
| Research and development | — | — | (1,070 | ) | (1,070 | ) | ||||||||||
| Building impairment | — | — | (2,965 | ) | (2,965 | ) | ||||||||||
| Operating income (loss) from continuing operations | $ | 9,272 | $ | 8,631 | $ | (24,968 | ) | $ | (7,065 | ) | ||||||
| For the year ended December 31, 2016 | Air Pollution Control Segment | FUEL CHEM Segment | Other | Total | ||||||||||||||||||||||||||||
For the year ended December 31, 2019 | Air Pollution Control Segment | FUEL CHEM Segment | Other | Total | ||||||||||||||||||||||||||||
| Revenues from external customers | $ | 34,052 | $ | 21,109 | $ | — | $ | 55,161 | $ | 14,082 | $ | 16,385 | $ | — | $ | 30,467 | ||||||||||||||||
| Cost of sales | (25,370 | ) | (10,997 | ) | — | (36,367 | ) | (11,256 | ) | (8,381 | ) | — | (19,637 | ) | ||||||||||||||||||
| Gross margin | 8,682 | 10,112 | — | 18,794 | 2,826 | 8,004 | — | 10,830 | ||||||||||||||||||||||||
| Selling, general and administrative | — | — | (25,564 | ) | (25,564 | ) | — | — | (17,191 | ) | (17,191 | ) | ||||||||||||||||||||
| Restructuring charge | (537 | ) | (891 | ) | — | (1,428 | ) | (625 | ) | — | — | (625 | ) | |||||||||||||||||||
| Research and development | — | — | (1,752 | ) | (1,752 | ) | — | — | (1,127 | ) | (1,127 | ) | ||||||||||||||||||||
| Intangible assets impairment | — | — | (2,074 | ) | (2,074 | ) | ||||||||||||||||||||||||||
Intangible assets abandonment | — | — | (127 | ) | (127 | ) | ||||||||||||||||||||||||||
| Operating income (loss) from continuing operations | $ | 8,145 | $ | 9,221 | $ | (29,390 | ) | $ | (12,024 | ) | $ | 2,201 | $ | 8,004 | $ | (18,445 | ) | $ | (8,240 | ) | ||||||||||||
Geographic Segment Financial Data
Information concerning our operations by geographic area is provided below. Revenues are attributed to countries based on the location of the customer. Assets are those directly associated with operations of the geographic area.
For the years ended December 31, | 2020 | 2019 | ||||||
Revenues: | ||||||||
United States | $ | 18,622 | $ | 25,882 | ||||
Foreign | 3,928 | 4,585 | ||||||
| $ | 22,550 | $ | 30,467 | |||||
As of December 31, | 2020 | 2019 | ||||||
Assets: | ||||||||
United States | $ | 24,524 | $ | 23,460 | ||||
Foreign | 5,564 | 8,764 | ||||||
| $ | 30,088 | $ | 32,224 | |||||
| For the years ended December 31, | 2018 | 2017 | 2016 | |||||||||
| Revenues: | ||||||||||||
| United States | $ | 43,887 | $ | 29,510 | $ | 42,545 | ||||||
| Foreign | 12,648 | 15,656 | 12,616 | |||||||||
| $ | 56,535 | $ | 45,166 | $ | 55,161 | |||||||
| As of December 31, | 2018 | 2017 | ||||||
| Assets: | ||||||||
| United States | $ | 36,784 | $ | 29,945 | ||||
| Foreign | 14,935 | 20,539 | ||||||
| $ | 51,719 | $ | 50,484 | |||||
15. FAIR VALUE MEASUREMENTS
We apply authoritative accounting guidance for fair value measurements of financial and nonfinancialnon-financial assets and liabilities. This guidance defines fair value, establishes a consistent framework for measuring fair value and expands disclosure for each major asset and liability category measured at fair value on either a recurring or nonrecurring basis and clarifies that fair value is an exit price, representing the amount that would be received to sell an asset or paid to transfer a liability in an orderly transaction between market participants. As such, fair value is a market-based measurement that should be determined based on assumptions that market participants would use in pricing an asset or liability. As a basis for considering such assumptions, the standard establishes a three-tier fair value hierarchy, which prioritizes the inputs used in measuring fair value as follows:
Level 1 – Observable inputs to the valuation methodology such as quoted prices in active markets for identical assets or liabilities
Level 2 – Inputs to the valuation methodology including quoted prices for similar assets or liabilities in active markets, quoted prices for identical assets or liabilities in inactive markets, inputs other than quoted prices that are observable for the asset or liability, and inputs that are derived principally from or corroborated by observable market data by correlation or other means
Level 3 – Significant unobservable inputs in which there is little or no market data, which require the reporting entity to develop its own estimates and assumptions or those expected to be used by market participants. Generally, these fair value measures are model-based valuation techniques such as discounted cash flows, option pricing models, and other commonly used valuation techniques
Transfers between levels of the fair value hierarchy are recognized based on the actual date of the event or change in circumstances that caused the transfer. We had no assets or liabilities that were valued using level 2 or level 3 inputs and therefore there were no transfers between levels of the fair value hierarchy during the periods ended December 31, 20182020 and 2017.2019.
16. RESTRUCTURING ACTIVITIES
On January 18, 2019, the Company announced a planned suspension of its Air Pollution Control (“APC”) business operation in China (“Beijing Fuel Tech”). This action is part of Fuel Tech’s ongoing operational improvement initiatives designed to prioritize resource allocation, reduce costs, and drive profitability for the Company on a global basis. The carrying amounttransition associated with the suspension of our short-term debtthe APC business includes staff rationalization, supplier and revolving linepartner engagement, and the monetization of credit approximates fair value duecertain assets. The remaining transition activities include the execution of the remaining activities to its short-term nature and becausesatisfy the amounts outstanding accrue interest at variable market-based rates.
The following table summarizespresents our revenues and net loss in China for the Company's assets measured at fair value on a non-recurring basis relating to the building impairment charge recognized during the second quarter of 2017, as more fully described in Note 1.years ended December 31, 2020 and 2019:
2020 | 2019 | |||||||
Total revenues | $ | 25 | $ | 329 | ||||
Net loss | (281 | ) | (1,767 | ) | ||||
| Level 1 | Level 2 | Level 3 | Impairment Losses | Fair Value at December 31, 2017 | |||||||||||
| Building | $ | — | $ | — | $ | 7,965 | $ | (2,965 | ) | $ | 5,000 | ||||
| $ | — | $ | — | $ | 7,965 | $ | (2,965 | ) | $ | 5,000 | |||||
The following table summarizespresents net assets in China for the Company'syears ended December 31, 2020 and 2019:
2020 | 2019 | |||||||
Total assets | $ | 2,463 | $ | 4,249 | ||||
Total liabilities | 396 | 399 | ||||||
Total net assets | 2,067 | 3,850 | ||||||
Total assets measured at fair value on a non-recurring basis relating to an intangibleprimarily consist of cash, accounts receivable, contract assets, impairmentprepaid expenses and other current assets. Total liabilities consist of accounts payable and certain accrued liabilities.
The Company recorded restructuring charges $625 for the twelve months ended December 31, 2019 associated with the suspension of its APC business operation in China. The charge recognized during 2016consisted primarily related toof one-time severance costs of $562 and the customer lists, developed technology and trademarks acquiredearly termination penalty for our lease in the 2014 acquisitionamount of PECO and FGC$63 associated with the suspension of our APC business in China. On January 23, 2019, the Company notified the landlord of our intention to early terminate the lease on July 22, 2019 resulting in the APC technology segment, as more fully described in Note 1.
| Level 1 | Level 2 | Level 3 | Impairment Losses | Fair Value at December 31, 2016 | |||||||||||
| Other intangible assets, net | $ | — | $ | — | $ | 5,525 | $ | (2,074 | ) | $ | 3,451 | ||||
| $ | — | $ | — | $ | 5,525 | $ | (2,074 | ) | $ | 3,451 | |||||
The Company recorded no restructuring charge for the twelve-months ending December 31, 2018. The Company recorded a charge of approximately $700 in 2017 in connection with the workforce reduction. This charge included $581 related to severance and benefit continuation costs due to the suspension of all operations associated with the Fuel Conversion business segment. The Company recorded a charge of $1,428 in 2016 in connection with the domestic workforce reduction. The charge consisted primarily of one-time severance payments and benefit continuation costs.2020. The following is a reconciliation of the accrual for the workforce reduction that is included within the "Accrued Liabilities" line of the consolidated balance sheets twelve-months ending December 31, 2018.sheets:
Twelve Months Ended | ||||||||
2020 | 2019 | |||||||
Restructuring liability at January 1, | $ | — | $ | 65 | ||||
Amounts expensed | — | 625 | ||||||
Amounts expensed - discontinued operations | — | — | ||||||
Amounts paid | — | (690 | ) | |||||
Restructuring liability at December 31, | $ | — | $ | — | ||||
| Twelve Months Ended | |||||||||
| 2018 | 2017 | 2016 | |||||||
| Restructuring liability at January 1, | $ | 391 | $ | 309 | $ | — | |||
| Amounts expensed | — | 119 | 1,428 | ||||||
| Amounts expensed - discontinued operations | — | 581 | — | ||||||
| Amounts paid | (326 | ) | (618 | ) | (1,119 | ) | |||
| Restructuring liability at December 31, | $ | 65 | $ | 391 | $ | 309 | |||
17. Unaudited Quarterly Financial Data
Set forth below are the unaudited quarterly financial data for the fiscal years ended December 31, 20182020 and 2017.2019.
For the quarters ended | March 31, | June 30, | September 30, | December 31, | ||||||||||||
2020 | ||||||||||||||||
Revenues | $ | 3,778 | $ | 4,401 | $ | 8,155 | $ | 6,216 | ||||||||
Cost of sales | 2,251 | 3,799 | 2,249 | 3,613 | ||||||||||||
Net (loss) income from continuing operations | (2,567 | ) | (2,544 | ) | 2,376 | (1,543 | ) | |||||||||
Income (loss) from discontinued operations | — | — | — | — | ||||||||||||
Net (loss) income | (2,567 | ) | (2,544 | ) | 2,376 | (1,543 | ) | |||||||||
Basic net (loss) income per common share: | ||||||||||||||||
Continuing operations | (0.10 | ) | (0.10 | ) | 0.10 | (0.07 | ) | |||||||||
Discontinued operations | — | — | — | — | ||||||||||||
Basic net (loss) income per common share: | $ | (0.10 | ) | $ | (0.10 | ) | $ | 0.10 | $ | (0.07 | ) | |||||
Diluted net (loss) income per common share: | ||||||||||||||||
Continuing operations | (0.10 | ) | (0.10 | ) | 0.09 | (0.07 | ) | |||||||||
Discontinued operations | — | — | — | — | ||||||||||||
Diluted net (loss) income per common share: | $ | (0.10 | ) | $ | (0.10 | ) | $ | 0.09 | $ | (0.07 | ) | |||||
2019 | ||||||||||||||||
Revenues | $ | 10,155 | $ | 8,948 | $ | 6,452 | $ | 4,912 | ||||||||
Cost of sales | 6,141 | 5,050 | 3,563 | 4,883 | ||||||||||||
Net loss from continuing operations | (1,279 | ) | (936 | ) | (1,296 | ) | (4,340 | ) | ||||||||
Loss from discontinued operations | (10 | ) | (9 | ) | 18 | — | ||||||||||
Net loss | (1,289 | ) | (945 | ) | (1,278 | ) | (4,340 | ) | ||||||||
| Basic net loss per common share: | ||||||||||||||||
Continuing operations | (0.05 | ) | (0.04 | ) | (0.05 | ) | (0.18 | ) | ||||||||
Discontinued operations | — | — | — | — | ||||||||||||
Basic net loss per common share: | $ | (0.05 | ) | $ | (0.04 | ) | $ | (0.05 | ) | $ | (0.18 | ) | ||||
| Diluted net loss per common share: | ||||||||||||||||
Continuing operations | (0.05 | ) | (0.04 | ) | (0.05 | ) | (0.18 | ) | ||||||||
Discontinued operations | — | — | — | — | ||||||||||||
Diluted net loss per common share: | $ | (0.05 | ) | $ | (0.04 | ) | $ | (0.05 | ) | $ | (0.18 | ) | ||||
| For the quarters ended | March 31 | June 30 | September 30 | December 31 | ||||||||||||
| 2018 | ||||||||||||||||
| Revenues | $ | 12,791 | $ | 11,847 | $ | 16,070 | $ | 15,827 | ||||||||
| Cost of sales | 7,766 | 8,125 | 10,654 | 9,926 | ||||||||||||
| Net income (loss) from continuing operations | (191 | ) | (1,679 | ) | 1,055 | 900 | ||||||||||
| Loss from discontinued operations | (25 | ) | (74 | ) | (10 | ) | (4 | ) | ||||||||
| Net income (loss) | (216 | ) | (1,753 | ) | 1,045 | 896 | ||||||||||
| Basic net income (loss) per common share: | — | — | ||||||||||||||
| Continuing operations | (0.01 | ) | (0.07 | ) | 0.04 | 0.04 | ||||||||||
| Discontinued operations | — | — | — | — | ||||||||||||
| Basic net income (loss) per common share: | $ | (0.01 | ) | $ | (0.07 | ) | $ | 0.04 | $ | 0.04 | ||||||
| Diluted net income (loss) per common share: | — | |||||||||||||||
| Continuing operations | (0.01 | ) | (0.07 | ) | 0.04 | 0.04 | ||||||||||
| Discontinued operations | — | — | — | — | ||||||||||||
| Diluted net income (loss) per common share: | $ | (0.01 | ) | $ | (0.07 | ) | $ | 0.04 | $ | 0.04 | ||||||
| 2017 | ||||||||||||||||
| Revenues | $ | 8,491 | $ | 9,741 | $ | 13,548 | $ | 13,386 | ||||||||
| Cost of sales | 4,769 | 6,116 | 8,498 | 7,761 | ||||||||||||
| Net income (loss) from continuing operations | (1,776 | ) | (5,585 | ) | (178 | ) | 1,004 | |||||||||
| Loss from discontinued operations | (730 | ) | (1,269 | ) | (239 | ) | (1,676 | ) | ||||||||
| Net loss | (2,506 | ) | (6,854 | ) | (417 | ) | (672 | ) | ||||||||
| Basic net income (loss) per common share: | ||||||||||||||||
| Continuing operations | (0.07 | ) | (0.24 | ) | (0.01 | ) | 0.04 | |||||||||
| Discontinued operations | (0.03 | ) | (0.05 | ) | (0.01 | ) | (0.07 | ) | ||||||||
| Basic net loss per common share: | $ | (0.10 | ) | $ | (0.29 | ) | $ | (0.02 | ) | $ | (0.03 | ) | ||||
| Diluted net income (loss) per common share: | ||||||||||||||||
| Continuing operations | (0.07 | ) | (0.24 | ) | (0.01 | ) | 0.04 | |||||||||
| Discontinued operations | (0.03 | ) | (0.05 | ) | (0.01 | ) | (0.07 | ) | ||||||||
| Diluted net loss per common share: | $ | (0.10 | ) | $ | (0.29 | ) | $ | (0.02 | ) | $ | (0.03 | ) | ||||
None
Disclosure Controls and Procedures
Under the supervision and with the participation of our Chief Executive Officer and Principal Financial Officer, our management evaluated the effectiveness of the design and operation of our disclosure controls and procedures (as defined in Rule 13a-15(e) under the Exchange Act), as of the end of the period covered by this Annual Report on Form 10-K (the “Evaluation Date”). Based upon that evaluation, our Chief Executive Officer and Principal Financial Officer concluded that, as of the Evaluation Date, our disclosure controls and procedures are effective to ensure that information required to be disclosed in the reports that we file or submit under the Exchange Act is (i) recorded, processed, summarized and reported, within the time periods specified in the Commission’s rules and forms and (ii) accumulated and communicated to our management, including our Chief Executive Officer and Principal Financial Officer, as appropriate to allow timely decisions regarding required disclosure.
Change in Internal Controls
There has been no change in the development of new policies related to the five-step model, training, ongoing contract review requirements, and gathering of information to comply with disclosure requirements.
Management’s Report on Internal Control Over Financial Reporting
Our management is responsible for establishing and maintaining adequate internal control over financial reporting, as such term is defined in Rule 13a-15(f) under the Exchange Act. As required by Rule 13a-15(c) under the Exchange Act, our management has carried out an evaluation, with the participation of the Chief Executive Officer and Principal Financial Officer, of the effectiveness of its internal control over financial reporting as of the end of the last fiscal year. The framework on which such evaluation was based is contained in the report entitled “Internal Control—Integrated Framework” issued by the Committee of Sponsoring Organizations of the Treadway Commission (the “COSO Report”) in 2013.
Our system of internal control over financial reporting is designed to provide reasonable assurance regarding the reliability of financial reporting and the preparation of financial statements for external purposes in accordance with generally accepted accounting principles. Because of its inherent limitations, internal control over financial reporting may not prevent or detect misstatements. Also, projections of any evaluation of effectiveness to future periods are subject to the risk that controls may become inadequate because of changes in conditions, or that the degree of compliance with the policies or procedures may deteriorate.
Based on its assessment, management has concluded that we maintained effective internal control over financial reporting as of December 31, 2018,2020, based on criteria in “Internal Control - Integrated Framework” issued by the COSO in 2013.
On January 8, 2021, the Company was informed by the Small Business Administration that its Payroll Protection Plan (PPP) loan had been forgiven in its entirety. The Company had borrowed $1,556,000 from our bank BMO Harris N.A. for use in support of the Company's staffing levels during the pandemic period of 2020, in accordance with the terms and conditions set down in the Coronavirus Aid, Relief and Economic Security (CARES) Act. This loan took the form of an unsecured promissory note with a term of two years and a stated interest rate of 1% per annum. Income from forgiveness of debt will be realized in the first quarter and disclosed in the first quarter's Form 10-Q.
In discussions with our bank, BMO Harris N.A., we have been informed that there is an administrative delay in the release of certain of our cash collateral that was securing standby letters of credit for projects that have been completed. We anticipated release of the collateral to be simultaneous with the expiration of the instrument, but receive an up to 30-day delay in the release of the collateral. As of now, instruments with an expiring date of December 31, 2020 in the amount of $1,190 have been released as of the date of this report, and the funds returned to our general operating account(s) as appropriate.
On February 11, 2021, Fuel Tech entered into a securities purchase agreement (the “Purchase Agreement”) with certain institutional investors pursuant to which the Company agreed to issue and sell, in a private placement (the “Private Placement”), (i) 5,000,000 shares (the “Shares”) of Common Stock, (ii) and 2,500,000 warrants (the “Warrants”) exercisable for a total of 2,500,000 shares of Common Stock (the “Warrant Shares”) with an exercise price of $5.10 per Warrant Share, at a purchase price of $5.1625 per Share and associated warrant. The gross proceeds to the Company from the Private Placement were approximately $25.8 million, before deducting placement agent fees and offering expenses. Subject to certain ownership limitations, the Warrants are immediately exercisable upon issuance and expire on the five and one-half year anniversary of the effective date of the registration statement registering the Warrant Shares for resale.
Pursuant to an engagement letter, dated as of February 11, 2021, between the Company and H.C. Wainwright & Co., LLC, or the placement agent, the Company agreed to pay the placement agent a cash fee of 6.5% of the aggregate gross proceeds of the Private Placement. The Company also agreed to pay the placement agent up to $50,000 in expenses. In addition, the Company issued to the placement agent (or its designees) warrants to purchase up to 350,000 shares of Common Stock (the “Placement Agent Warrants”), or 7.0% of the aggregate number of Shares sold in the Private Placement. The Placement Agent Warrants are exercisable commencing April 18, 2021 at an exercise price of $6.453125 per share of Common Stock and expire on the five and one-half year anniversary of the effective date of the registration statement registering the Shares and the Warrant Shares for resale.
The Private Placement closed on February 17, 2021. In connection with the Private Placement, the Company also entered into a Registration Rights Agreement (the “Registration Rights Agreement”) with the Selling Stockholders, pursuant to which the Company agreed to prepare and file a registration statement with respect to the resale of the Shares and the Warrant Shares.
The Shares, the Warrants, the Warrant Shares, the Placement Agent Warrants and the shares of Common Stock issuable thereunder were sold and issued without registration under the Securities Act of 1933, as amended (the “Securities Act”) in reliance on the exemptions provided by Section 4(a)(2) of the Securities Act as transactions not involving a public offering and Rule 506 promulgated under the Securities Act as sales to accredited investors.
Information required by this Item will be set forth under the captions “Election of Directors,” “Directors and Executive Officers of Fuel Tech,” “Compensation Committee,” “Audit Committee,” and “Financial Experts” in our definitive Proxy Statement related to the
We have adopted a Code of Ethics and Business Conduct (the “Code”) that applies to all employees, officers and directors, including the Chief Executive Officer and Principal Financial Officer. A copy of the Code is available free of charge to any person on written or telephone request to our Legal Department at the address or telephone number described in Item 1 under the heading "Available Information." The Code is also available on our website at
www.ftek.com.Other information concerning our directors and executive officers and relating to corporate governance will be set forth under the captions “Election of Directors,” “Audit Committee,” “Compensation and Nominating Committee,” “Financial Experts,” “Corporate Governance” and “General” in our Proxy Statement related to the
Information required by this Item will be set forth under the caption “Executive Compensation” in our definitive Proxy Statement and is incorporated by reference.
ITEM 12 - SECURITY OWNERSHIP OF CERTAIN BENEFICIAL OWNERS AND MANAGEMENT AND RELATED STOCKHOLDER MATTERS
The following table provides information for all equity compensation plans as of the fiscal year ended
December 31,| Plan Category | Number of Securities to be issued upon exercise of outstanding options and vesting of restricted stock units | Weighted-average exercise price of outstanding options | Number of securities remaining available for future issuance under equity compensation plan excluding securities listed in column (a) | |||||||
| (a) | (b) | (c) | ||||||||
| Equity compensation plans approved by security holders (1) | 2,042,777 | $ | 4.68 | 2,133,733 | ||||||
Plan Category | Number of Securities to be issued upon exercise of outstanding options and vesting of restricted stock units | Weighted-average exercise price of outstanding options | Number of securities remaining available for future issuance under equity compensation plan excluding securities listed in column (a) | |||||||||
(a) | (b) | (c) | ||||||||||
Equity compensation plans approved by security holders | 584,505 | $ | 3.57 | 2,533,629 | ||||||||
In addition to the plans listed above, we have a Deferred Compensation Plan for directors under which 100,000 Common Shares have been reserved for issuance as deferred compensation with respect to director's fees.
Further information required by this Item will be set forth under the caption “Principal Stockholders and Stock Ownership of Management” in the definitive Proxy Statement and is incorporated by reference.
Information required by this Item will be set forth under the captions “Compensation Committee Interlocks and Insider Participation” and “Certain Relationships and Related Transactions” in our definitive Proxy Statement and is incorporated by reference.
Information required by this Item will be set forth under the caption “Approval of Appointment of Auditors” in our definitive Proxy Statement and is incorporated by reference.
(a) | (1) Financial Statements |
The financial statements identified below and required by Part II, Item 8 of this Form 10-K are set forth above.
Management’s Report on Internal Control Over Financial Reporting
Report of Independent Registered Public Accounting Firm
Consolidated Balance Sheets as of December 31, 20182020 and 2017
Consolidated Statements of Operations for Years Ended December 31, 2018, 20172020 and 2016
Consolidated Statements of Comprehensive Loss for Years Ended December 31, 2018, 20172020 and 2016
Consolidated Statements of Stockholders’ Equity for the Years Ended December 31, 2018, 20172020 and 2016
Consolidated Statements of Cash Flows for the Years Ended December 31, 2018, 20172020 and 2016
Notes to Consolidated Financial Statements
(2) Financial Statement Schedules
All other schedules have been omitted because of the absence of the conditions under which they are required or because the required information, where material, is shown in the financial statements or the notes thereto.
(3) Exhibits
| Incorporated by Reference | ||||||||||||
| Exhibit | Description | Filed Herewith | Form | Period ending | Exhibit | Filing date | ||||||
| 3.1 | 8-K | 3.2 | 10/5/2006 | |||||||||
| 3.2 | 8-K | 3.1 | 10/5/2006 | |||||||||
| 3.3 | 8-K | 3.1 | 6/1/2015 | |||||||||
| 4.1 | 10-Q | 9/30/2009 | 4.1 | 11/4/2009 | ||||||||
| 4.2 | 10-Q | 9/30/2009 | 4.2 | 11/4/2009 | ||||||||
| 4.3 | 10-Q | 9/30/2009 | 4.3 | 11/4/2009 | ||||||||
| 4.4* | S-8 | 4.1 | 10/2/2006 | |||||||||
| 4.5* | S-8 | 4.1 | 3/31/2014 | |||||||||
| 4.6* | 10-K | 12/31/2006 | 4.6 | 3/6/2007 | ||||||||
| 4.7 | 10-Q | 6/30/2014 | 4.2 | 8/11/2014 | ||||||||
| 4.8* | 10-K | 12/31/2006 | 4.7 | 3/6/2007 | ||||||||
| 4.9* | 10-K | 12/31/2006 | 4.8 | 3/6/2007 | ||||||||
| 4.10* | 10-K | 12/31/2011 | 4.9 | 3/5/2012 | ||||||||
| 4.11* | 10-Q | 6/30/2014 | 4.1 | 8/11/2014 | ||||||||
| 4.12* | 10-Q | 3/31/2015 | 10.2 | 5/11/2015 | ||||||||
| 4.13* | 10-K | 12/31/2015 | 4.17 | 3/24/2016 | ||||||||
| 10.1 | 8-K | 99.1 | 2/7/2007 | |||||||||
| 10.2** | 10-K | 12/31/2008 | 10.7 | 3/5/2009 | ||||||||
| 10.3 | 10-Q | 9/30/2013 | 10.1 | 11/13/2013 | ||||||||
| 10.4 | 10-Q | 9/30/2009 | 10.5 | 11/4/2009 | ||||||||
| 10.5 | 10-Q | 9/30/2009 | 10.6 | 11/4/2009 | ||||||||
| 10.6 | 10-Q | 9/30/2009 | 10.7 | 11/4/2009 | ||||||||
| 10.7 | 10-Q | 6/30/2011 | 4.1 | 8/8/2011 | ||||||||
| 10.8 | 10-Q | 6/30/2013 | 4.1 | 8/7/2013 | ||||||||
| 10.9 | 10-K | 12/31/2015 | 10.12 | 3/24/2015 | ||||||||
| 10.10 | 10-Q | 6/30/2015 | 10.2 | 8/10/2015 | ||||||||
| 10.11 | 10-K | 12/31/2015 | 10.14 | 3/24/2015 | ||||||||
| 10.12 | 10-Q | 3/31/2016 | 10.1 | 5/10/2016 | ||||||||
| 10.13 | 10-Q | 6/30/2017 | 10.1 | 8/14/2017 | ||||||||
| 10.14 | 10-K | 12/31/2017 | 10.2 | 3/12/2018 | ||||||||
| 10.15 | 10-Q | 6/30/2018 | 10.2 | 8/13/2018 | ||||||||
| 10.16 | 10-Q | 9/30/2018 | 10.1 | 11/13/2018 | ||||||||
| 10.17 | 10-Q | 9/30/2018 | 10.2 | 11/13/2018 | ||||||||
| 10.18 | 10-Q | 6/30/2018 | 10.1 | 8/13/2018 | ||||||||
| 10.19 | 10-Q | 9/30/2018 | 10.3 | 11/13/2018 | ||||||||
| 10.20 | 10-Q | 6/30/2016 | 10.1 | 8/9/2016 | ||||||||
| 10.21 | 10-K | 12/31/2009 | 10.14 | 3/4/2010 | ||||||||
10.1 | Form of Indemnity Agreement between Fuel Tech, Inc. and its Directors and Officers. | 8-K | 99.1 | 2/7/2007 | ||||||||
10.2 | Credit Agreement, dated as of June 30, 2009, between JPMorgan Chase Bank, N.A. and Fuel Tech, Inc. | 10-Q | 9/30/2009 | 10.5 | 11/4/2009 | |||||||
10.3 | 10-Q | 9/30/2009 | 10.6 | 11/4/2009 | ||||||||
10.4 | 10-Q | 9/30/2009 | 10.7 | 11/4/2009 | ||||||||
10.5 | 10-Q | 6/30/2011 | 4.1 | 8/8/2011 | ||||||||
10.6 | 10-Q | 6/30/2013 | 4.1 | 8/7/2013 | ||||||||
10.7 | 10-K | 12/31/2015 | 10.12 | 3/24/2015 | ||||||||
10.8 | 10-Q | 6/30/2015 | 10.2 | 8/10/2015 | ||||||||
10.9 | 10-K | 12/31/2015 | 10.14 | 3/24/2015 | ||||||||
10.10 | 10-Q | 3/31/2016 | 10.1 | 5/10/2016 | ||||||||
10.11 | 10-Q | 6/30/2017 | 10.1 | 8/14/2017 | ||||||||
10.12 | 10-K | 12/31/2017 | 10.2 | 3/12/2018 | ||||||||
10.13 | 10-Q | 6/30/2018 | 10.2 | 8/13/2018 | ||||||||
10.14 | 10-Q | 9/30/2018 | 10.1 | 11/13/2018 | ||||||||
10.15 | 10-Q | 9/30/2018 | 10.2 | 11/13/2018 | ||||||||
10.16 | 10-Q | 6/30/2019 | 10.1 | 8/13/2019 | ||||||||
10.17 | 10-Q | 6/30/2018 | 10.1 | 8/13/2018 | ||||||||
10.18 | 10-Q | 9/30/2018 | 10.3 | 11/13/2018 | ||||||||
10.19 | 10-Q | 6/30/2016 | 10.1 | 8/9/2016 | ||||||||
10.20 | Sublease Agreement, dated December 9, 2009, between Fuel Tech, Inc. and American Bailey Corporation | 10-K | 12/31/2009 | 10.14 | 3/4/2010 | |||||||
10.21* | 10-K | 12/31/2018 | 10.24 | 3/14/2019 |
10.22* | ||||||||||||
8-K | 10.2 | 3/ | ||||||||||
10.23* | 8-K | |||||||||||
10.2 | 3/3/2021 | |||||||||||
10.24* |
| 8-K | 99.2 | 12/14/2018 | ||||||||
10.25* | 8-K | 99.2 | 12/ | |||||||||
| 8-K | 99.2 | 12/ | ||||||||||
10.27* | ||||||||||||
10-K | 12/31/2017 | 10.29 | 3/12/2018 | |||||||||
10.28* | 8-K | 99.1 | 12/14/2018 | |||||||||
| 10.29* | 2021 Fuel Tech, Inc. APC Officer and NSM Sales Commission Plan | 8-K | 99.1 | 12/ | ||||||||
10.30* | 8-K | 99.1 | 12/12/2019 | |||||||||
10.31* | Employment Agreement dated August 31, 2009, between William E. Cummings, Jr. and Fuel Tech, Inc. | 10-K | 12/31/2009 | 10.10 | 3/14/2010 | |||||||
10.32* | 10-K | 12/31/2011 | 10.21 | 3/5/2012 | ||||||||
| 10.33* | 8-K | 1.1 | 2/18/2021 | |||||||||
10.34* | Employment Agreement, dated March 9, 2018, between James M. Pach and Fuel Tech, Inc. | 10-K | 12/31/2017 | 10.35 | 3/12/2018 |
| 8-K | 10.1 | 2/18/2021 | ||||||||||
| 10.36* | 8-K | 10.2 | 2/18/2021 | |||||||||
23.1 | X | |||||||||||
31.1 | X | |||||||||||
31.2 | X | |||||||||||
32 | X | |||||||||||
101.1 INS | XBRL Instance Document. | |
101.2 SCH | XBRL Taxonomy Extension Schema Document. | |
101.3 CAL | XBRL Taxonomy Extension Calculation Linkbase Document. | |
101.4 DEF | XBRL Taxonomy Extension Definition Linkbase Document. | |
101.5 LAB | XBRL Taxonomy Extension Label Linkbase Document. | |
101.6 PRE | XBRL Taxonomy Extension Presentation Linkbase Document. | |
| * | Indicates a management contract or compensatory plan or arrangement.
Pursuant to the requirements of the Securities Exchange Act of 1934, the Registrant has duly caused this report to be signed on its behalf by the undersigned thereunto duly authorized.
61 Pursuant to the requirements of the Securities and Exchange Act of 1934, this report has been duly signed below by the following persons on behalf of Fuel Tech, Inc. and in the capacities and on the date indicated. Date: March 15, 2021
62 | ||||||||||||||||||||||||||||||||||||||||||||||||||||||||||||||||||||||||||||||||||||||||||||||||||||||||||||||||||||||||||||||||||||||||||||