cTable of Contents
UNITED STATES
SECURITIES AND EXCHANGE COMMISSION
Washington, D.C. 20549
FORM 10-K
| |
(Mark One) |
☒ | ANNUAL REPORT PURSUANT TO SECTION13 OR 15(d)OF THE SECURITIES EXCHANGE ACT OF 1934 |
|
For the fiscal year ended January 30, 2021February 3, 2024 |
|
OR |
|
☐ | TRANSITION REPORT PURSUANT TO SECTION13 OR 15(d)OF THE SECURITIES EXCHANGE ACT OF THE SECURITIES EXCHANGE ACT OF 1934 |
For the transition period from to |
|
Commission File No. 1-10299 |
|
|

(Exact name of registrant as specified in its charter) |
|
| |
New York | 13-3513936 |
(State or other jurisdiction of incorporation or organization) | (I.R.S. Employer Identification No.) |
incorporation or organization)
| |
330 West 34th Street, New York,, New York | 10001 |
(Address of principal executive offices) | (Address of principal executive offices)Zip Code) | (Zip Code)
|
Registrant’sRegistrant’s telephone number, including area code: (212) (212) 720-3700
Securities registered pursuant to Section12(b)of the Act:
|
| |
Title of each class | | Trading Symbol(s) | | Name of each exchange on which registered |
Common Stock, par value $0.01 | | FL | | New York Stock Exchange |
Preferred Stock Purchase Rights
|
| New York Stock Exchange
|
Securities registered pursuant to Section12(g)of the Act: None
Indicate by check mark if the registrant is a well-known seasoned issuer, as defined in Rule 405 of the Securities Act. Yes ⌧☒ No ◻☐
Indicate by check mark if the registrant is not required to file reports pursuant to Section 13 or Section 15(d) of the Act. Yes ◻☐ No ⌧☒
Indicate by check mark whether the registrant (1) has filed all reports required to be filed by Section 13 or 15(d) of the Securities Exchange Act of 1934 during the preceding 12 months (or for such shorter period that the Registrant was required to file such reports), and (2) has been subject to such filing requirements for the past 90 days. Yes ⌧☒ No ◻☐
Indicate by check mark whether the registrant has submitted electronically every Interactive Data File required to be submitted pursuant to Rule 405 of Regulation S-T (§ 232.405 of this chapter) during the preceding 12 months (or for such shorter period that the registrant was required to submit such files). Yes ⌧No ◻☐
Indicate by check mark whether the registrant is a large accelerated filer, an accelerated filer, a non-accelerated filer, smaller reporting company, or an emerging growth company. See the definitions of “large"large accelerated filer,” “accelerated" "accelerated filer,” “smaller" "smaller reporting company,”" and “emerging"emerging growth company”company" in Rule 12b-2 of the Exchange Act.
Large accelerated filer ☒ | Accelerated filer ◻☐ | Non-accelerated filer ◻☐ | Smaller reporting company ☐ |
Emerging growth company ☐ | | | |
If an emerging growth company, indicate by check mark if the registrant has elected not to use the extended transition period for complying with any new or revised financial accounting standards pursuant to Section 13(a) of the Exchange Act. ◻☐
Indicate by check mark whether the registrant has filed a report on and attestation to its management’s assessment of the effectiveness of its internal control over financial reporting under Section 404(b) of the Sarbanes-Oxley Act (15 U.S.C. 7262(b)) by the registered public accounting firm that prepared or issued its audit report. ☒
If securities are registered pursuant to Section 12(b) of the Act, indicate by check mark whether the financial statements of the registrant included in the filing reflect the correction of an error to previously issued financial statements. ☐
Indicate by check mark whether any of those error corrections are restatements that required a recovery analysis of incentive-based compensation received by any of the registrant’s executive officers during the relevant recovery period pursuant to §240.10D-1(b). ☐
Indicate by check mark whether the registrant is a shell company (as defined in Rule 12b-2 of the Act). Yes ☐ No☒
| |
The number of shares of the registrant’s Common Stock, par value $0.01 per share, outstanding as of March 22, 2021:21, 2024: | 103,278,20194,494,579
|
The aggregate market value of voting stock held by non-affiliates of the registrant computed by reference to the closing price as of the last business day of the Registrant’s most recently completed second fiscal quarter, July 31, 202029, 2023 was approximately: | $1,727,775,209*1,284,060,971* |
* For purposes of this calculation only only (a) all non-employee directors plus six executive officers and owners of five percent5% or more of the registrant are deemed to be affiliates of the registrant, and (b) shares deemed to be “held” by such persons include only outstanding shares of the registrant’s voting stock with respect to which such persons had, on such date, voting or investment power.
DOCUMENTS INCORPORATED BY REFERENCE
Portions of the registrant’s definitive Proxy Statement (the “Proxy Statement”) to be filed in connection with the Annual Meeting of Shareholders to be held on May 19, 2021:21, 2024: Parts III and IV.

TABLE OF CONTENTS
CAUTIONARY NOTE REGARDING FORWARD-LOOKING STATEMENTS
This Annual Report on Form 10-K (“Annual Report”) includes “forward-looking”"forward-looking" statements within the meaning of the Private Securities Litigation Reform Act of 1995. Forward-looking statements can be identified by the fact that they do not relate strictly to historical or current facts. They often include words such as “believes,” “expects,” “anticipates,” “estimates,” “intends,” “plans,” “seeks,” “continues,” “feels,” “forecasts,”"believes," "expects," "anticipates," "estimates," "intends," "plans," "seeks," "continues," "feels," "forecasts," or words of similar meaning, or future or conditional verbs, such as “will,” “should,” “could,” “may,” “aims,” “intends,”"will," "should," "could," "may," "aims," "intends," or “projects.” These"projects." Statements may be forward looking even in the absence of these particular words.
Examples of forward-looking statements include, statements relatingbut are not limited to, trends in or expectations relating to the expected effects of our initiatives, strategies and plans,
as well as trends in or expectationsstatements regarding our financial position, business strategy and other plans and objectives for our future operations, and generation of free cash flow. These forward-looking statements are based on our current expectations and beliefs concerning future developments and their potential effect on us. The forward-looking statements contained herein are largely based on our expectations for the future, which reflect certain estimates and assumptions made by our management. These estimates and assumptions reflect our best judgment based on currently known market conditions, operating trends, and other factors. Although we believe such estimates and assumptions to be reasonable, they are inherently uncertain and involve a number of risks and uncertainties that are beyond our control. As such, management’s assumptions about future events may prove to be inaccurate.
We do not intend to publicly update or revise any forward-looking statements as a result of new information, future events, changes in circumstances, or otherwise. These cautionary statements qualify all forward-looking statements attributable to us, or persons acting on our behalf. Management cautions you that the forward-looking statements contained herein are not guarantees of future performance, and we cannot assure you that such statements will be realized or that the events and circumstances they describe will occur. Factors that could cause actual results to differ materially from those anticipated or implied in the forward-looking statements herein include, but are not limited to, a change in the relationship with any of our key suppliers, including access to premium products, volume discounts, cooperative advertising, markdown allowances, or the ability to cancel orders or return merchandise; inventory management; our ability to fund our planned capital investments; execution of the Company's long-term strategic plan; a recession, volatility in the financial markets, and long-term growth modelother global economic factors, including inflation; capital and drivers, tax rates,resource allocation among our strategic opportunities; our ability to realize the expected benefits from acquisitions; business opportunities and expansion, strategic acquisitions or investments, expenses, dividends,expansion; investments; expenses; dividends; share repurchases, and our mitigation strategies, liquidity,repurchases; cash management; liquidity; cash flow from operations, use of cash and cash requirements, investments,operations; access to credit markets at competitive terms; borrowing capacity under our credit facility; cash repatriation; supply chain issues; labor shortages and usewage pressures; consumer spending levels; licensed store arrangements; the effect of proceeds, repatriationcertain governmental assistance programs; the success of cash toour marketing and sponsorship arrangements; expectations regarding increasing global taxes; the U.S.,effect of increased government regulation, compliance, and changes in law; the continuingeffect of the adverse outcome of any material litigation or government investigation that affects us or our industry generally; the effects of eachweather; ESG risks; increased competition; geopolitical events; the financial effects of accounting regulations and critical accounting policies; counterparty risks; and any other factors set forth in the coronavirus pandemic (COVID-19)section entitled “Risk Factors” of our most recent Annual Report on Form 10-K.
All written and social unrest on our financial results.oral forward-looking statements attributable to us are expressly qualified in their entirety by this cautionary statement. A forward-looking statement is neither a prediction nor a guarantee of future events or circumstances, and those future events or circumstances may not occur. You should not place undue reliance on forward-looking statements, which speak to our views only as of the date of this Annual Report. These forward-looking statements are all based on currently available operating, financial, and competitive information and are subject to various risks and uncertainties, many of which are unforeseeable and beyond our control, such as the developing situation, and uncertainty caused by and, related to the COVID-19 pandemic and social unrest.filing. Additional risks and uncertainties that we do not presently know about or that we currently consider to be insignificant may also affect our business operations and financial performance.
Our actual future results
Please refer to "Item 1A. Risk Factors" in this Annual Report on Form 10-K for a discussion of certain risks relating to our business and trends may differ materially depending on a variety of factors, including, but not limited to, the risks and uncertainties discussed under “Risk Factors” and “Management’s Discussion and Analysis of Financial Condition and Results of Operations.”any investment in our securities. Given these risks and uncertainties, you should not rely on forward-looking statements as a predictionpredictions of actual results. Any or all of the forward-looking statements contained in this Annual Reportreport, or any other public statement made by us, including by our management, may turn out to be incorrect. We are including this cautionary note to make applicable and take advantage of the safe harbor provisions of the Private Securities Litigation Reform Act of 1995 for forward-looking statements. We expressly disclaim any obligation to update or revise any forward-looking statements, whether as a result of new information, future events, or otherwise.
PARTPART I
Item1. Business
General
General
Foot Locker, Inc., incorporated under the laws of the State of New York in 1989,1989. Foot Locker, Inc. and its subsidiaries hereafter are referred to as the "Registrant," "Company," “we," "our," or "us." Foot Locker, Inc. has its corporate headquarters in New York.
Foot Locker, Inc. is a leading global retailer.footwear and apparel retailer that unlocks the "inner sneakerhead" in all of us. As of February 3, 2024, we operated 2,523 stores in 26 countries across North America, Europe, Australia, New Zealand, and Asia, and a licensed store presence in the Middle East and Asia. Foot Locker, Inc. leads the celebrationhas a strong history of sneaker authority that sparks discovery and youthignites the power of sneaker culture around the globe through aits portfolio of brands, including Foot Locker, Lady Foot Locker, Kids Foot Locker, Champs Sports, Eastbay, Footaction,WSS, and Sidestep. As of January 30, 2021, we operated 2,998 primarily mall-basedatmos.
Ensuring that our customers can engage with us in the most convenient manner for them whether in our stores, as well as stores in high-traffic urban retail areas andon our websites, or on our mobile applications, is a high streets, in 27 countries across the United States, Canada, Europe, Australia, New Zealand, and Asia. Our purpose is to inspire and empower youth culture around the world, by fueling a shared passionpriority for self-expression and creating unrivaled experiences at the heart of the global sneaker community.
Foot Locker, Inc. uses itsus. We use our omni-channel capabilities to bridge the digital world and physical stores, including order-in-store, buy online and pickup-in-store, and buy online and ship-from-store, as well as e-commerce. We operate websites and mobile apps aligned with the brand names of our store banners (including footlocker.com, ladyfootlocker.com, kidsfootlocker.com, champssports.com, footaction.com, footlocker.ca, footlocker.eu and related e-commerce sites in the various European countries that we operate, footlocker.com.au, footlocker.com.nz, sidestep-shoes.de, sidestep-shoes.nl, footlocker.hk, footlocker.sg, footlocker.mo, and footlocker.my).banners. These sites offer some of theour largest online product selections and provide a seamless link between our e-commerce experience and physical stores. We also operate the websites for eastbay.com, final-score.com, and eastbayteamsales.com.
Foot Locker, Inc. and its subsidiaries hereafter are referred to as the “Registrant,” “Company,” “we,” “our,” or “us.” Foot Locker, Inc. has its corporate headquarters in New York. The service marks, trade names,tradenames, and trademarks appearing in this report (except for Nike, Jordan, adidas, and Puma)New Balance) are owned by Foot Locker, Inc. or its subsidiaries.
Store and Operations Profile
| | | | | | | | | | | | | | |
| | | | | | | | | | | | Square Footage |
| | February 2, | | | | | | January 30, | | Relocations/ | | (in thousands) |
| | 2020 | | Opened | | Closed | | 2021 | | Remodels | | Selling | | Gross |
Foot Locker U.S. | | 867 | | 21 | | 40 | | 848 | | 20 | | 2,409 | | 4,203 |
Foot Locker Europe | | 636 | | 9 | | 21 | | 624 | | 17 | | 1,016 | | 2,176 |
Foot Locker Canada | | 105 | | — | | 4 | | 101 | | 2 | | 255 | | 422 |
Foot Locker Pacific | | 91 | | 2 | | — | | 93 | | 7 | | 166 | | 260 |
Foot Locker Asia | | 14 | | 6 | | — | | 20 | | — | | 79 | | 141 |
Kids Foot Locker | | 431 | | 4 | | 13 | | 422 | | 9 | | 736 | | 1,265 |
Lady Foot Locker | | 46 | | — | | 11 | | 35 | | — | | 51 | | 85 |
Champs Sports | | 536 | | 11 | | 8 | | 539 | | 4 | | 1,946 | | 3,033 |
Footaction | | 245 | | 4 | | 9 | | 240 | | 22 | | 758 | | 1,240 |
Runners Point | | 81 | | 1 | | 82 | | — | | — | | — | | — |
Sidestep | | 77 | | 11 | | 12 | | 76 | | 1 | | 88 | | 157 |
Total | | 3,129 | | 69 | | 200 | | 2,998 | | 82 | | 7,504 | | 12,982 |
| | | | | | | Square Footage |
| January 28, | | | | February 3, | Relocations/ | (in thousands) |
| 2023 | Opened | | Closed | 2024 | Remodels | Selling | Gross |
Foot Locker U.S. | | 747 | | 7 | | | 31 | | 723 | | 50 | | 2,401 | | 4,080 |
Foot Locker Canada | | 86 | | 1 | | | 2 | | 85 | | 6 | | 259 | | 426 |
Champs Sports | | 486 | | 1 | | | 83 | | 404 | | 14 | | 1,539 | | 2,421 |
Kids Foot Locker | | 394 | | 11 | | | 15 | | 390 | | 23 | | 780 | | 1,304 |
WSS | | 115 | | 28 | | | 2 | | 141 | | — | | 1,458 | | 1,757 |
Footaction | | 2 | | — | | | 1 | | 1 | | — | | 3 | | 6 |
North America | | 1,830 | | 48 | | | 134 | | 1,744 | | 93 | | 6,440 | | 9,994 |
Foot Locker Europe (1) | | 644 | | 25 | | | 32 | | 637 | | 30 | | 1,208 | | 2,470 |
Sidestep | | 78 | | — | | | 78 | | — | | — | | — | | — |
EMEA | | 722 | | 25 | | | 110 | | 637 | | 30 | | 1,208 | | 2,470 |
Foot Locker Pacific | | 94 | | 5 | | | 1 | | 98 | | 13 | | 243 | | 366 |
Foot Locker Asia | | 33 | | — | | | 20 | | 13 | | — | | 52 | | 98 |
atmos | | 35 | | 1 | | | 5 | | 31 | | — | | 28 | | 48 |
Asia Pacific | | 162 | | 6 | | | 26 | | 142 | | 13 | | 323 | | 512 |
Total owned stores | | 2,714 | | 79 | | | 270 | | 2,523 | | 136 | | 7,971 | | 12,976 |
| | | | | | | | |
Licensed stores | | 159 | | 56 | | | 13 | | 202 | | | |
Grand Total | | 2,873 | | 135 | | | 283 | | 2,725 | | | |
(1) | Includes 16 and 13 Kids Foot Locker Stores as of January 28, 2023 and February 3, 2024, respectively. |
As part of our Lace Up strategic plan, we aim to draw customers to our compelling new store concepts and build our off-mall portfolio to be the destination for all things sneakers. As of February 3, 2024, we operate 242 "Community," "House of Play," and "Power Stores" across our banners and geographies. Community stores are off-mall stores in the heart of the community that focus on creating authentic trust with local consumers and provide elevated shopping experiences with community spaces. Kids Foot Locker's House of Play concepts are rooted in play by offering a kids-first experience, including interactive playscapes, engaging activity areas, and the best styles for kids of all ages. Our Power Stores provide an elevated, seamless, and convenient shopping journey for the full family. Community, House of Play, and Power Stores provide pinnacle retail experiences that deliver connected customer interactions through service, experience, product, and a sense of community. As of February 3, 2024 and January 28, 2023, off-mall stores represented 39% and 34% of gross square footage in North America, respectively.
The following is a brief description of each of our banners:
Foot Locker — Foot Locker, celebrating its 50th year in 2024, is a leading global youth culture brand that connectsat the sneaker obsessed consumer with the most innovative and culturally relevant sneakers and apparel. Across all our consumer touchpoints, FootLocker enables consumers to fulfill their desire"heart of sneakers." Our iconic "striper" store associates invite everyone to be part of sneaker culture by curating new, exclusive and youth culture. We curate special product assortmentsfreshly picked sneakers and marketing content that supports our premium position,apparel from leading global brands such as Nike, Jordan, adidas, and Puma,New Balance, as well as new and emerging brands in the athletic and lifestyle space. We connect emotionally with our consumers through a combination of global brand events, and highly targeted and personalized experiences in local markets, includingand through our community-based Power Stores, which provide pinnacle retail experiences that deliver connected customer interactions through service, experience, product,social and a sensedigital channels. The new Home Court store concept serves as the ultimate expression of community. Foot Locker’s 1,686ambitions around basketball, with 29 stores primarily in North America. Foot Locker’s 1,543 stores are located in 2725 countries including 848723 in the United States, Puerto Rico, U.S. Virgin Islands, and Guam, 10185 in Canada, 624 in Europe, a combined 9398 in Australia and New Zealand, and 2013 in Asia. Our domestic stores have an average of 2,8003,300 selling square feet and our international stores have an average of 1,8002,100 selling square feet.
Kids Foot Locker — Kids Foot Locker offers the largesta large selection of premium brand-name athletic footwear, apparel, and accessories for children. Kids Foot Locker enables youth of all ages to participate in sneaker culture and helps their parents shop in a curated environment with only the best assortment in stores and online. We drive a sense of community in local markets through our “House of Play” community store concept, which connects with kids, parents, and caregivers through the power of play, offering experiences and products that celebrate the wonder and fun of childhood. Of our 422390 North America stores, 373375 are located in the United States, and Puerto Rico, 31and 15 in Europe, 16Canada. There are an additional 13 stores in Canada, 1 in Australia, and 1 in New Zealand.Europe. These stores have an average of 1,7002,000 selling square feet.
Lady Foot Locker — Lady Foot Locker is a U.S. retailer of athletic footwear, apparel, and accessories dedicated to sneaker-obsessed young women. Our stores provide premium sneakers and apparel, carefully selected to reflect the latest styles. Lady Foot Locker operates 35 stores that are located in the United States and Puerto Rico. These stores have an average of 1,500 selling square feet.
Champs Sports — Champs Sports is one of the largesta primarily mall-based specialty athletic footwear and apparel retailersretailer in North America. With a focusAmerica focused on serving the active athlete segment that is highly connected to sport and inspired by what is worn in the game and on the lifestyle expression of sport, Champs Sports’ product categories include athletic footwear and apparel, and sport-lifestyle inspired accessories. This assortment allowsfield. Champs Sports to offeris our lead banner for apparel, driving more head-to-toe offerings for the best head-to-toe fashion stories representing the most powerful athletic brands,consumer shopping for their performance and sports teams, and athletes in North America.style. Of our 539404 stores, 506375 are located in the United States, Puerto Rico, and the U.S. Virgin Islands and 3329 in Canada. The Champs Sports stores have an average of 3,6003,800 selling square feet.
FootactionWSS — Footaction Acquired in 2021, WSS is an athletic-inspired retailer focused on the large and rapidly growing Hispanic consumer demographic, operating a North American athletic footwearfleet of 141 off-mall stores in key markets across California, Texas, Arizona, Florida, and apparel retailer that offers the freshest, best edited selection of athletic lifestyle brands and looks. This banner is uniquely positioned at the intersection of sport and style,Nevada. WSS’s community-driven business benefits from deep relationships with a focus on authentic, premium product. Of our 240 stores, 235 are located in the United States and Puerto Rico and 5 are in Canada. The Footactioncustomers. WSS stores have an average of 3,20010,300 selling square feet.
Runners Pointatmos — We closed our Runners Point banner during 2020.
Sidestep — Sidestep Acquired in 2021, atmos is a predominantly athletic fashion footwear banner. Our 76digitally-led, culturally-connected global brand featuring premium sneakers and apparel, an exclusive in-house label, collaborative relationships with leading vendors in the sneaker ecosystem, experiential stores, are locatedand a robust omni-channel platform. atmos operates 31 stores in Germany, Netherlands, and Switzerland. Sidestep caters to a more discerning, fashion forward consumer. Sidestep stores haveJapan, with an average of 1,200900 selling square feet. The brand is also licensed to various entities in Asia.
Eastbay
Eastbay is a sporting goods direct marketer operating in the United States, providing high school and other athletes with a complete sports solution including athletic footwear, apparel, equipment, and team licensed merchandise for a broad range of sports. With over 100 sales professionals, Eastbay Team Sales connects directly with thousands of high school coaches and athletic directors in the United States in offering the best performance product and a premium service level.
Franchise OperationsCompetition
We have a total of 127 franchised Foot Locker stores located within the Middle East as of January 30, 2021, of which 58 are in Israel. These amounts are not included in the store counts in the table on the prior page.
Competition
The athletic footwear and apparel industry is highly competitive. We compete primarily with athletic footwear specialty stores, sporting goods stores, department stores, traditional shoe stores, mass merchandisers, and online retailers, some of which are our suppliers.
Merchandise Purchases
Financial information concerning merchandise purchases is contained under the “Liquidity”"Liquidity" section in “Item"Item 7. Management’s Discussion and Analysis of Financial Condition and Results of Operations”Operations" and under the “Business Risk”"Business Risk" section in the Financial Instruments and Risk Management note in “Item"Item 8. Consolidated Financial Statements and Supplementary Data.”"
Human Capital
We believe that our team members are one of our strongest competitive advantages and the high-quality service that they provide sets us apart from others in our industry. We had 14,335 full-time and 32,511 part-time employees as of February 3, 2024, and we consider employee relations to be satisfactory. Our purpose is to inspireBoard of Directors, through the Human Capital and empower youth culture around the world, by fueling a shared passion for self-expressionCompensation Committee, oversees human capital and creating unrivaled experiences at the heart of the global sneaker community. management resources matters.
We believe the strength of our workforce is a significant contributor to our success as a global brand that leads with purpose. WeOur people strategy includes actions surrounding "Uniting our Communities of Talent" around the world to achieve focus and drive results as a more agile and dynamic organization. For example, we seek to be a great place to work by cultivating and celebrating a culture that promotes diversity, inclusion, and belonging. Our “Live Well. Work Well.” framework enables us to provide support and resources for a variety of needs to helpbelonging (DIBs). By following our team members reach their fullest potential.
Our People Strategy includes actions around “Uniting our Communities of Talent” around the world to achieve focus and drive results as a more agile and dynamic organization.By creating a Diversity, Inclusion, and Belonging Strategy (DIBs)DIBs strategy as part of our people processes, we are able to attract, select, hire, grow, develop, promote, and retain valued team members with diverse backgrounds, perspectives, and experiences. We are relentless in creating a work environment that celebrates the differences that make us even stronger. In addition, our "Live Well. Work Well." framework enables us to provide support and resources for a variety of needs to help our team members reach their full potential. We provide career growth and professional development through formal learning and on-the-job experiences to advance our team members capability,members’ capabilities, confidence, and contribution.contributions.
We offer competitive compensation (including salary, incentive bonus, and equity) and benefits packages in each of our locations around the globe.
Our compensation program is designed to attract, retain, and reward talented individuals who possess the skills necessary to lead and support our business objectives, ensure the achievement ofachieve our strategic goals, and create long-term value for our shareholders. ToWe offer competitive compensation (including salary, incentive bonus, and equity) and benefits packages to eligible team members in each of our locations around the globe. Our compensation and benefits programs are designed to support the financial, mental, and physical well-being of our team members and their families. We believe in paying team members equitably, regardless of gender, race, or ethnicity, and we provide competitive compensation and benefits, including:
| ● | Health and wellness benefits (medical, dental, vision, and behavioral health coverage) |
| ● | Financial benefits (401(k) Plan with Company matching contribution, life and disability coverage, Employee Stock Purchase Plan at a 15 percent discount, and commuter benefits) |
| ● | Work-life balance and lifestyle benefits (such as paid time off for full-time team members and Employee Discount Program for all team members) |
| ● | Tuition reimbursement in the United States and EMEA only |
| ● | Outside the United States, we may offer supplemental Health and Wellness benefits, as well as Retirement benefits, based on local competitive practices. |
Through our listening session communication strategy,regularly review pay data to confirm we are committed to listening to and learning from our team members. For many years, we have tracked engagement and leadership effectiveness through our engagement surveys. We have improved our overall engagement, with 80 percent overall favorable rating and 85 percent response rate in 2020. We use insights from these surveys to assess our culture, evaluate our leaders, adjust our plans, and evolve our culture.doing so.
We had 15,791 full-time and 35,461 part-time employees as of January 30, 2021 and we consider employee relations to be satisfactory.
We are committed to engaging in corporate social responsibility and sustainability initiatives that support our communities and help us develop trusted relationships with our stakeholders. Our Corporate Social Responsibility disclosure is available to investors on the investor relations tab of our corporate website under the heading “Responsibility.”
Available Information
We maintain a corporate website at www.footlocker-inc.comwww.footlocker.com/corp. Our filings with the U.S. Securities and Exchange Commission (the “SEC”"SEC"), including our annual report on Form 10-K, quarterly reports on Form 10-Q, current reports on Form 8-K, and all amendments to those reports are available free of charge through this website as soon as reasonably practicable after they are filed with or furnished to the SEC. The Corporate Governance section of our corporate website contains our Corporate Governance Guidelines, Committee Charters, and the Code of Business Conduct for directors, officers, and employees, including the Chief Executive Officer, Chief Financial Officer, and Chief Accounting Officer. Copies of these documents may also be obtained free of charge upon written request to our Corporate Secretary at 330 West 34th34th Street, New York, N.Y.NY 10001.
Item1A. Risk Factors
Risks Related to Our Business and Industry
Our inability to implement our long-range strategic plan may adversely affect our future results.
Our ability to successfully implement and execute our long-range strategic plan is dependent on many factors. Our strategies may require significant capital investment and management attention. Additionally, any new initiative is subject to certain risks, including customer acceptance of our products and renovated store designs or locations, our loyalty program, our digital e-commerce, competition, product differentiation, the ability to attract and retain qualified personnel, and our ability to successfully integrate our acquisitions and implement technological initiatives. If we cannot successfully execute our strategic growth initiatives or if the long-range plan does not adequately address the challenges or opportunities we face, our financial condition and results of operations may be adversely affected. Additionally, failure to meet shareholder expectations, particularly with respect to sales, supplier diversification, cost-cutting programs, operating margins, and earnings per share, would likely result in volatility in the market value of our stock.
The retail athletic footwear and apparel business is highly competitive.
Our athletic footwear and apparel operations compete primarily with athletic footwear specialty stores, sporting goods stores, department stores, traditional shoe stores, mass merchandisers, and online retailers, many of which are units of national or regional chains that have significant financial and marketing resources. The principal competitive factors inas well as our markets are selection of merchandise customer experience, reputation, store location, advertising, and price. We cannot assure that we will continue to be able to compete successfully against existing or future competitors. Our expansion into markets served by our competitors, and entry of new competitors or expansion of existing competitors into our markets, could have a material adverse effect on our business, financial condition, and results of operations.
vendor suppliers direct-to-customers channels. Although we sell an increasing proportion of our merchandise online, a significantly faster shift in customer buying patterns to purchasing athletic footwear, athletic apparel, and sporting goods online could have a material adverse effect on our business results. In addition, all of our significant suppliers operate retail stores and distribute products directly through the internet and others may follow. Should this continue to occur or accelerate, and if our customers decide to purchase directly from our suppliers, it could have a material adverse effect on our business, financial condition, and results of operations.
The principal competitive factors in our markets are selection of merchandise, customer experience, reputation, store location, advertising, and price. We cannot assure that we will continue to be able to compete successfully against existing or future competitors. Our expansion into markets served by our competitors, and entry of new competitors or expansion of existing competitors into our markets, could have a material adverse effect on our business, financial condition, and results of operations.
A change in the relationship with any of our key suppliers or the unavailability of key products at competitive prices could affect our financial health.
Our business is dependent to a significant degree upon our ability to obtain premium productproducts and the ability to purchase brand-name merchandise at competitive prices, from a limited number of suppliers. In addition, we have negotiated volume discounts, cooperative advertising, and markdown allowances with our suppliers, as well as the ability to cancel orders and return excess or unneeded merchandise. We cannot be certain that such terms with our suppliers will continue in the future.
We purchased approximately 91 percent84% of our merchandise in 20202023 from our top five suppliers and we expect to continue to obtain a significant percentage of our athletic product from these suppliers in future periods. Approximately 75 percent65% of all merchandise purchased in 20202023 was purchased from one supplier — Nike, Inc. (“Nike”). Each of our operating divisionsbanners is highly dependent on Nike. Individually they purchased between 47 to 82 percent of their merchandise from Nike during the year. Merchandise that is high profile and in high demand is allocated by our suppliers based upon their internalown criteria. Although we have generally been able to purchase sufficient quantities of this merchandise in the past, weWe cannot be certain that our suppliers will continue to allocate sufficient amounts to us in the future or whether our suppliers will choose to further sell such merchandise inthrough their online business. own direct-to-customers channel.
Our inability to obtain merchandise in a timely manner from major suppliers as a result of business decisions by our suppliers, or any disruption in the supply chain, could have a material adverse effect on our business, financial condition, and results of operations. Because of the high proportion of purchases from Nike, any adverse development in Nike’s reputation, financial condition or results of operations, or the inability of Nike to develop and manufacture products that appeal to our target customers could also have an adverse effect on our business, financial condition, and results of operations. We cannot be certain that we will be able to acquire merchandise at competitive prices or on competitive terms in the future. These risks could have a material adverse effect on our business, financial condition, and results of operations.
The industry in which we operate is dependent upon fashion trends, customer preferences, product innovations, and other fashion-related factors.
The athletic footwear and apparel industry, especially at the premium end of the price spectrum, in which we operate, is subject to changing fashion trends and customer preferences. In addition, retailers in the athletic industry rely on their suppliers to maintain innovation in the products they develop. We cannot guarantee that our merchandise selection will accurately reflect customer preferences when it is offered for sale or that we will be able to identify and respond quickly to fashion changes, particularly given the long lead times for ordering much of our merchandise from suppliers. A substantial portion of our highest margin sales are to young males (ages 12–25), many of whom we believe purchase athletic footwear and athletic apparel as a fashion statement and are frequent purchasers. Our failure to anticipate, identify or react appropriately in a timely manner to changes in fashion trends that would make athletic footwear or athletic apparel less attractive to our customers could have a material adverse effect on our business, financial condition, and results of operations.
If we do not successfully manage our inventory levels, our operating results will be adversely affected.
We must maintain sufficient inventory levels to operate our business successfully. However, we also must guard against accumulating excess inventory. For example, we order most of our athletic footwear four to six months prior to delivery to us. If we fail to anticipate accurately either the market for the merchandise or our customers’ purchasing habits, we may be forced to rely on markdowns or promotional sales to dispose of excess or slow-moving inventory, which could negatively affect our gross margins and have a material adverse effect on our business, financial condition, and results of operations.
The COVID-19 pandemic has disrupted
We have key strategic initiatives designed to optimize our inventory levels and is expectedincrease the efficiency and responsiveness of our supply chain. We are also developing additional capabilities to continueanalyze customer behavior and demand, which we believe will allow us to disruptbetter localize assortment and improve store-level allocations to further tailor our business,assortments to customer needs and increase sell-through. Further, we are leveraging technology and data science to optimize our product-to-market processes and supply chain which could have a material adverse effectwe anticipate will enhance our in-season responsiveness. These initiatives and additional capabilities involve significant changes to our inventory management systems and processes. If we are unable to implement these initiatives, integrate these additional capabilities successfully, or properly utilize them, we may not realize the return on our investments that we anticipate, and our results of operations liquidity, and financial condition for an extended period of time.could be adversely affected.
In December 2019, a novel strain of coronavirus (COVID-19) was reported to have surfaced in Wuhan, China. In March 2020, the World Health Organization designated COVID-19 a pandemic. As a result of COVID-19, we temporarily closed all of our stores across all of our brands in North America, Europe Middle East and Africa (“EMEA”), and Asia Pacific for various periods throughout the year. We continue to monitor COVID-19, as well as new strains of the virus, and other closures, capacity limitations, social distancing requirements, and reduced operating hours may be required to help ensure the health and safety of our team members and our customers. We are also continuing to communicate with our suppliers regarding the flow of product. To the extent one or more of our suppliers is negatively affected by COVID-19, including due to the closure of their distribution centers or manufacturing facilities, we may be unable to maintain adequate inventory in our stores or distribution centers. COVID-19 has also caused disruption in transportation, such as shipping port congestion, which has adversely affected our ability to receive merchandise on a timely basis. Given the dynamic nature of these circumstances, the duration of business disruption, reduced customer traffic, and related financial affects cannot be reasonably estimated at this time but are expected to materially affect our business for 2021. The extent to which COVID-19 affects our results, or those of our suppliers, will depend on future developments, which are highly uncertain and cannot be predicted, including new information which may emerge concerning the severity of COVID-19 and the actions and related costs to contain or treat it, among others.
We are affected by mall traffic and our ability to secure suitable store locations.locations, both in malls and off-malls.
Many of our stores, especially in North America where 39% of our locations are off-mall, are located primarily in enclosed regional and neighborhood malls. Our sales are affected, in part, by the volume of mall traffic. Mall traffic may be adversely affected by, among other factors, economic downturns, the closing or continued decline of anchor department stores and/or specialty stores, and a decline in the popularity of mall shopping among our target customers. One of our strategic imperatives is to further increase the penetration of our North American fleet of off-mall locations to 50%.
Further, any terrorist act, natural disaster, public health issue, such as COVID-19, flu or otherincluding pandemics, or safety concern that decreases the level of mall traffic, or that affects our ability to open and operate stores in such locations, could have a material adverse effect on our business.
To take advantage of customer traffic and the shopping preferences of our customers, we need to maintain or acquire stores in desirable locations, such as in regional and neighborhood malls, as well as high-traffic urban retail areas and high streets. We cannot be certain that desirable locations will continue to be available at favorable rates. Some traditional enclosed malls are experiencing significantly lower levels of customer traffic, driven by economic conditions, public health issues, the closure of certain mall anchor tenants, and changes in customer shopping preferences, such as online shopping. Further, some malls have closed, and others may close in the future. While we seek to obtain suitable locations off-mall, there is no guarantee that we will be able to secure such locations.
Several large landlords dominate the ownership of prime malls and because of our dependence upon these landlords for a substantial number of our locations, any significant erosion of their financial condition or our relationships with them could negatively affect our ability to obtain and retain store locations. Additionally, further landlord consolidation may negatively affect our ability to negotiate favorable lease terms.
Our future growth may depend on our ability to expand operations in international markets.markets, including through licensed arrangements.
Our future growth will depend, in part, on our ability to expand our business in additional international markets. As we expand into new international markets, we may have only limited experience in operating our business in such markets. In other instances, we may have to rely on the efforts and abilities of foreign business partners in such markets.markets, such as through licensing agreements. In addition, business practices in these new international markets may be unlike those in the other markets we serve, and we may face increased exposure to certain risks. Our future growth may be materially adversely affected if we are unsuccessful in our international expansion efforts. Our inability to expand in international markets could have a material adverse effect on our business.
We may experience fluctuations in, and cyclicality of, our comparable-store sales results.
Our comparable-store sales have fluctuated significantly in the past, on both an annual and a quarterly basis, and we expect them to continue to fluctuate in the future. A variety of factors affect our comparable-store sales results, including, among others, fashion trends, product innovation, promotional events, the highly competitive retail sales environment, economic conditions, timing of income tax refunds, changes in our merchandise mix, calendar shifts of holiday periods, declines in foot traffic, supply chain disruptions, and weather conditions.
Many of our products represent discretionary purchases. Accordingly, customer demand for these products could decline in an economic downturn or if our customers develop other priorities for their discretionary spending. These risks could have a material adverse effect on our business, financial condition, and results of operations.
The effects of natural disasters, terrorism, acts of war, acts of violence, and public health issues may adversely affect our business.
Natural disasters, including earthquakes, hurricanes, floods, and tornadoes may affect store and distribution center operations. In addition, acts of terrorism, acts of war, and military action both in the United States and abroad can have a significant effect on economic conditions and may negatively affect our ability to purchase merchandise from suppliers for sale to our customers. Any act of violence, including active shooter situations and terrorist activities, that are targeted at or threatened against shopping malls, our stores, offices or distribution centers, could result in restricted access to our stores and/or store closures in the short-term and, in the long-term, may cause our customers and employees to avoid visiting our stores. The ongoing conflicts in Ukraine and the Middle East may lead to disruption in the global supply chain, rising fuel costs, or cybersecurity risks, and economic instability generally, any of which could materially and adversely affect our business and results of operations.
Public health issues, such as COVID-19, flu or otherincluding pandemics, whether occurring in the United States or abroad, could disrupt our operations and result in a significant part of our workforce being unable to operate or maintain our infrastructure or perform other tasks necessary to conduct our business. Additionally, public health issues may disrupt, or have an adverse effect on, our suppliers’ operations, our operations, our customers, or result in significantly lower traffic to or closure of our stores, or customer demand.
Our ability to mitigate the adverse effect of these events depends, in part, upon the effectiveness of our disaster preparedness and response planning as well as business continuity planning. However, we cannot be certain that our plans will be adequate or implemented properly in the event of an actual disaster.
Any significant declines in public safety or uncertainties regarding future economic prospects that affect customer spending habits could have a material adverse effect on customer purchases of our products. We may be required to suspend operations in some or all of our locations and incur significant costs to remediate concerns which could have a material adverse effect on our business, financial condition, and results of operations.
Riots,
Social unrest, including riots, vandalism, and other crimes and acts of violence, may affect the markets in which we operate, our customers, delivery of our products and customer service, and could have a material adverse effect on our business, results of operations, or financial condition.
Our business may be adversely affected by instability, disruption, or destruction, regardless of cause, including riots, civil insurrection or social unrest, and manmade disasters or crimes. Such events may result in property damage and loss and may also cause customers to suspend their decisions to shop in our stores, interrupt our supply chain, and cause restrictions, postponements, and cancellations of events that attract large crowds and public gatherings, such as store marketing events.
Additional risks and uncertainties not currently known to us or that we currently deem to be immaterial also may adversely affect our business, financial condition, or operating results.
Risk of loss or theft of assets, including inventory shrinkage, is inherent in the retail business. Loss may be caused by error or misconduct of employees, customers, vendors or other third parties including through organized retail crime and professional theft. While some level of inventory shrinkage is unavoidable, if we were to experience higher rates of inventory shrinkage, or if we were unable to effectively reduce losses or theft of assets, our results of operations could be affected adversely.
Our business could be materially harmed if we fail to adequately integrate the operations of the businesses we have acquired, or may acquire.
We have recently made, and may continue to make, acquisitions in the future based on available opportunities in the market. Acquisitions involve numerous inherent challenges, such as properly evaluating acquisition opportunities, properly evaluating risks and other diligence matters, ensuring adequate capital availability, and balancing other resource constraints. There are risks and uncertainties related to acquisitions, including difficulties integrating operations, personnel, and financial and other systems; unrealized sales expectations from the acquired business; unrealized synergies and cost savings; unknown or underestimated liabilities; diversion of management attention from running our existing businesses; and potential loss of key management or customers of the acquired business.
Risks Related to Technology, Data Security, and Privacy
We are subject to technology risks, including failures, security breaches, and cybersecurity risks that could harm our business, damage our reputation, and increase our costs in an effort to protect against these risks.
Information technology is a critical part of our business operations. We depend on information systems to process transactions, analyze customer behaviors through our loyalty program, make operational decisions, manage inventory, operate our websites, purchase, sell and ship goods on a timely basis, and maintain cost-efficient operations. There is a risk that we could experience a business interruption, theft of information, or reputational damage as a result of a cyber-attack, such as an infiltration of a data center or data leakage of confidential information, either internally or atthrough our third-party providers.
We may experience operational problems with our information systems as a result of system failures, system implementation issues, viruses, malicious hackers, sabotage, or other causes. We invest in security technology to protect the data stored by us, including our data and business processes, against the risk of data security breaches and cyber-attacks. Our data security management program includes enforcement of standard data protection policies such as Payment Card Industry compliance.compliance and other regulatory requirements. Additionally, we evaluate our major technology suppliers and any outsourced services through accepted security assessment measures. We maintain and routinely test backup systems and disaster recovery, along with external network security penetration testing by an independent third party as part of our business continuity preparedness.
While we believe that our security technology and processes follow appropriate practices in the prevention of security breaches and the mitigation of cybersecurity risks, given the ever-increasing abilities of those intent on breaching cybersecurity measures and given the necessity of our reliance on the security procedures of third-party vendors, the total security effort at any point in time may not be completely effective.
Any security breaches and cyber incidents could adversely affect our business.
Failure of our systems, either internally or at our third-party providers, including failures due to cyber-attacks that would prevent the ability of systems to function as intended, could cause transaction errors, loss of customers and sales, and negative consequences to us, our employees, and those with whom we do business. A cyberattack on a communications network or power grid could cause operational disruption resulting in loss of revenues. Any security breach involving the misappropriation, loss, or other unauthorized disclosure of confidential information by us could also severely damage our reputation, expose us to the risks of litigation and liability, increase operating costs associated with remediation, and harm our business. While we carry insurance that would mitigate the losses in connection with security breaches and cyber incidents, insurance may be insufficient to compensate us fully for potentially significant losses.
On July 26, 2023, the SEC adopted a final rule on cybersecurity risk management, strategy, governance, and incident disclosure (the "SEC Cyber Rule"). The SEC Cyber Rule requires public companies to make current disclosures about material cybersecurity incidents, as well as annual disclosures of material information about their cybersecurity risk management, strategy, and governance. The SEC Cyber Rule became effective on September 5, 2023. New data security laws add additional complexity, requirements, restrictions and potential legal risk, and compliance programs may require additional investment in resources, and could affect strategies and availability of previously useful data.
Risks associated with digital operations.
Our digital operations are subject to numerous risks, including risks related to the failure of the computer systems that operate our websites, mobile sites, and apps and their related support systems, computer viruses, cybersecurity risks, telecommunications or power failures, denial of service attacks, bot attacks, and similar disruptions. Also, to sustain, keep current, or grow our digital commerce business we will need to make additional investments. Risks related to digital commerce include those associated with credit card fraud, the need to keep pace with rapid technological change, governmental regulation, and legal uncertainties with respect to internet regulatory compliance. If any of these risks materialize, it could have a material adverse effect on our business.
Privacy
Our inability to successfully manage the implementation of a new Enterprise Resource Planning ("ERP") system may adversely affect our business and data security concernsresults of operations or the effectiveness of our internal controls over financial reporting.
We are currently in the preliminary states of implementing a new ERP system, as part of a plan to integrate and regulationupgrade our systems and processes. This initiative includes a fully-integrated global accounting, operations, and finance enterprise resource planning system. It will also include warehouse management, order management, as well as various interfaces between these systems, and supporting back-office systems. Additional implementation activities are expected to continue in phases over the next few years. ERP implementations are complex, labor intensive, and time-consuming projects, which also involve substantial expenditures on system software and implementation activities. The ERP system is critical to our ability to provide important information to our management, obtain, and deliver products, provide services and customer support, accurately maintain books and records, provide accurate, timely and reliable reports on our financial and operating results, and otherwise operate our business. ERP implementations also require transformation of business and financial processes in order to reap the benefits of the ERP system. Any such implementation involves risks inherent in the conversion to a new computer system, including loss of information and potential disruption to our normal operations. The implementation and maintenance of the new ERP system has required, and will continue to require, the investment of significant financial and human resources, the re-engineering of processes of our business, and the attention of many employees who would otherwise be focused on other aspects of our business. Our results of operations could be adversely affected if we experience time delays or cost overruns during the ERP implementation process, or if we are unable to reap the benefits we expect from the ERP system. Any material deficiencies in the design and implementation of the new ERP system could also result in additionalpotentially materially higher costs and liabilities.
The protectioncould adversely affect our ability to operate our business and otherwise negatively affect our financial reporting and the effectiveness of customer, employee, and Company data is critical. The regulatory environment surrounding information security and privacy is demanding, with the frequent impositionour internal control over financial reporting. Any of new and changing requirements. In addition, customers appear increasingly to have a high expectation that we will adequately protect their personal information. Any actual or perceived misappropriation or breach involving this data could attract negative media attention, cause harm to our reputation or result in liability (including but not limited to fines, penalties or lawsuits), any of whichthese consequences could have a material adverse effect on our business, operational results of operations and financial position, and cash flows.condition.
The European Union (“E.U.”) adopted a comprehensive General Data Privacy Regulation (the “GDPR”), which requires companies to satisfy new requirements regarding the handling of personal and sensitive data, including its use, protection, and the ability of persons whose data is stored to correct or delete data about themselves. Failure to comply with GDPR requirements could result in penalties of up to 4 percent of worldwide revenue. In addition, the State of California adopted the California Consumer Protection Act of 2018 ("CCPA"). The CCPA requires companies that process information on California residents to make new disclosures to consumers about their data collection, use and sharing practices, allows consumers to opt out of certain data sharing with third parties, and provides a new cause of action for data breaches. It remains unclear how the CCPA will be interpreted and the extent of its effect on our business. Some observers have noted that the CCPA could mark the beginning of a trend toward more stringent privacy legislation in the United States, which could increase our potential liability and adversely affect our business.
GDPR, CCPA and other similar laws and regulations, as well as any associated inquiries or investigations or any other government actions, may be costly to comply with, result in negative publicity, increase our operating costs, require significant management time and attention, and subject us to remedies that may harm our business, including fines or demands or orders that we modify or cease existing business practices. The laws and regulations relating to privacy and data security are evolving, can be subject to significant change and may result in ever-increasing regulatory and public scrutiny and escalating levels of enforcement and sanctions.
TheThe technology enablement of omni-channel initiatives in our business is complex.
We continue to invest in initiatives designed to deliver a high-quality, coordinated shopping experience online, in stores, and on mobile devices, which requires substantial investment in technology, information systems, and employee training, as well as significant management time and resources. Our omni-channel retailing efforts include the integration and implementation of new technology, including technology and software associated with our ERP implementation, and processes to be able to fulfill orders from any point within our system of stores and distribution centers, which is extremely complex and may not meet customer expectations for timely and accurate deliveries. These efforts involve substantial risk, including risk of implementation delays, cost overruns, technology interruptions, supply and distribution delays, and other issues that can affect the successful implementation and operation of our omni-channel initiatives. If our omni-channel initiatives are not successful we may not be able to provide a relevant shopping experience, or we domay not realize the return on our omni-channel investments that we anticipate, our financial performance and future growth could be materially adversely affected.
Privacy and data security concerns and regulation could result in additional costs and liabilities.
The protection of customer, employee, and Company data is critical. The regulatory environment surrounding privacy is demanding, with the frequent imposition of new and changing requirements. In addition, customers have a high expectation that we will adequately protect their personal information. Any actual or perceived misappropriation, breach or misuse involving this data could cause our customers to lose confidence in our ability to protect their data, which may cause them to potentially stop shopping with us or joining our loyalty program, attract negative media attention, cause harm to our reputation or result in liability (including but not limited to fines, penalties or lawsuits), any of which could have a material adverse effect on our business, operational results, financial position, and cash flows.
Regulatory scrutiny of privacy, user data protection, use of data and data collection is increasing on a global basis and regulations will likely continue to evolve over time. We are subject to numerous laws and regulations in the U.S. and internationally designed to protect the information of clients, customers, employees, and other third parties that we collect and maintain, including the European Union General Data Protection Regulation (the "EUGDPR") and the United Kingdom General Data Protection Regulation (the "UKGDPR"). Both the EUGDPR and UKGDPR, among other things, mandate requirements regarding the handling of personal data of employees and customers, including its use, protection, and the ability of persons whose data is stored to correct or delete such data about themselves. The state of California has a similar law called the California Consumer Privacy Act, recently amended and effective January 1, 2023, by the California Privacy Rights Act (as so amended, the "CCPA"). In addition to enforcement authority granted to the California Attorney General, the CCPA established the "California Privacy Protection Agency," a dedicated state agency charged with the authority to audit and enforce privacy rules, among other responsibilities, and the CCPA permits a private right of action for certain violations of law. Other U.S. states have also enacted comprehensive consumer privacy laws, and additional states may follow. We have from time to time received inquiries from governmental authorities regarding our practices. Additionally, the Federal Trade Commission and many state attorneys general are interpreting federal and state consumer protection laws to impose standards for the online collection, use, dissemination, and security of data.
These laws pose increasingly complex and rigorous compliance challenges, which may increase our compliance costs and related risk. If we fail to comply with these laws or other similar regulations applicable to our business, we could be subject to reputational harm and significant litigation, monetary damages, regulatory enforcement actions, or fines in one or more jurisdictions. The laws and regulations relating to privacy and data security are evolving, can be subject to significant change and may result in ever-increasing regulatory and public scrutiny and escalating levels of enforcement, sanctions, and private litigation.
Risks Related to our OperationsSupply Chain and Supply ChainOperations
Complications in our distribution centers and other factors affecting the distribution of merchandise may affect our business.
We operate multiple distribution centers worldwide, to support our businesses. In addition to the distribution centers that we operate, we haveas well as third-party arrangements, to support our operations in the United States, Canada, England, Australia, New Zealand, and New Zealand. Asia.
If complications arise with any facility or third-party arrangements, or if any facility is severely damaged or destroyed, our other distribution centers may be unable to support the resulting additional distribution demands. Our distribution center capabilities may also be affected by disruptions caused by upgrades or changes to our warehouse management systems. We also may be affected by disruptions in the global transportation network caused by events including delays caused by the COVID-19 pandemic,acts of war or hostility and related military actions, port disruption, port strikes, weather conditions, work stoppages, or other labor unrest. These factors may adversely affect our ability to deliver inventory on a timely basis. We depend upon third-party carriers for shipment of merchandise. Any interruption in service by these carriers for any reason could cause disruptions in our business, a loss of sales and profits, and other material adverse effects.
Manufacturer compliance with our social compliance program requirements.
We require our independent manufacturers to comply with our policies and procedures, which cover many areas including human rights policy, labor, health and safety, and environmental standards. We monitor compliance with our policies and procedures using internal resources, as well as third-party monitoring firms. Although we monitor their compliance with these policies and procedures, we do not control the manufacturers or their practices. Any failure of our independent manufacturers to comply with our policies and procedures or local laws in the country of manufacture could disrupt the shipment of merchandise to us, force us to locate alternate manufacturing sources, reduce demand for our merchandise, or damage our reputation.
Our reliance on key management.
Future performance will depend upon our ability to attract, retain, and motivate our executive and senior management teams. Our executive and senior management teams have substantial experience and expertise in our business and have made significant contributions to our success. Our future performance depends, to a significant extent, both upon the continued services of our current executive and senior management teams, as well as our ability to attract, hire, motivate, and retain additional qualified management in the future. While we believe that weWe have adequate succession planning and executive development programs, competition for key executivesplans in the retail industry is intense,place and our operationsBoard of Directors reviews these succession plans. If our succession plans do not adequately cover significant and unanticipated turnover, the loss of the services of any of these individuals, or any resulting negative perceptions or reactions, could be adversely affected if we cannot retaindamage our reputation and attractour business.
Additionally, our success depends on the talents and abilities of our workforce in all areas of our business, especially personnel that can adapt to complexities and grow their skillset across the changing environment. Our ability to successfully execute our strategy depends on attracting, developing, and retaining qualified executives.talent with diverse sets of skills, especially functional and technology specialists that directly support our strategies.
Risks associated with attracting and retaining store and field team members.
Our success depends, in part, upon our ability to attract, develop, and retain a sufficient number of qualified store and field team members. The turnover rate in the retail industry is generally high. If we are unable to attract and retain quality team members, our ability to meet our growth goals or to sustain expected levels of profitability may be compromised.
Our ability to meet our labor needs while controlling costs is subject to external factors such as unemployment levels, prevailing wage rates, minimum wage legislation, and overtime regulations.
Risks Related to our Investments
If our long-lived tangible assets and operating lease right-of-use assets, or goodwill become impaired, we may need to record significant non-cash impairment charges.
We review our long-lived tangible assets, and operating lease right-of-use assets, and goodwill when events indicate that the carrying value of such assets may be impaired. Goodwill is reviewed for impairment if impairment indicators arise and, at a minimum, annually.
Goodwill is not amortized but is subject to an impairment test, which consists of either a qualitative assessment on a reporting unit level, or a quantitative impairment test, if necessary. The determination of impairment charges is significantly affected by estimates of future operating cash flows and estimates of fair value. Our estimates of future operating cash flows are identified from our long-range strategic plans, which are based upon our experience, knowledge, and expectations; however, these estimates can be affected by factors such as our future operating results, future store profitability, and future economic conditions, all of which are difficult to predict accurately. Any significant deterioration in macroeconomic conditions could affect the fair value of our long-lived assets, including our operating lease right-of-use assets, and goodwill and could result in future impairment charges, which would adversely affect our results of operations.
We do not have the ability to exert control over our minority investments, and therefore, we are dependent on others in order to realize their potential benefits.
We currently
At February 3, 2024, we hold $337$152 million of non-controlling minority investments in various entities and we may make additional strategic minority investments in the future. Such minority investments inherently involve a lesser degree of control over business operations, thereby potentially increasing the financial, legal, operational, and compliance risks associated with the investments. Other investors in these entities may have business goals and interests that are not aligned with ours or may exercise their rights in a manner in which we do not approve. These circumstances could lead to delayed decisions or disputes and litigation with those other investors, all of which could have a material adverse impact on our reputation, business, financial condition, and results of operations.
If our investees seek additional financing to fund their growth strategies, these financing transactions may result in further dilution of our ownership stakes and these transactions may occur at lower valuations than the investment transactions through which we acquired such interests, which could significantly decrease the fair values of our investments in those entities. Additionally, if our investees are unable to obtain additional financing, those entities could need to significantly reduce their spending in order to fund their operations or result in their insolvency. These actions likely would result in reduced growth forecasts, which also could significantly decrease the fair values of our investments in those entities.
Risks Related to Shareholder Activism, Geopolitics, Regulations, Internal Controls, and Other External Risks
We may face risks associated with shareholder activism.
Publicly traded
Publicly-traded companies are subject to campaigns by shareholders advocating corporate actions related to matters, such as corporate governance, operational practices, and strategic direction. We may become subject in the future to such shareholder activity and demands. Such activities could interfere with our ability to execute our business plans, affect our allocation of capital, disrupt relationships with our vendor partners, be costly and time-consuming, disrupt our operations, and divert the attention of management, any of which could have an adverse effect on our business or stock price.
Our shareholder rights plan could impede or discourage a takeover or change of control.
In December 2020, our Board of Directors adopted a short-term rights plan. The rights plan is intended to protect the interests of all the Company’s shareholders by reducing the likelihood that any person would gain control of the Company through open market accumulation or other tactics without appropriately compensating the Company's shareholders for such control. The rights plan is not intended to prevent or deter any action or offer that the Board of Directors determines to be in the best interests of shareholders. However, the overall effect of the rights plan may render it more difficult or discourage a merger, tender offer or other business combination involving the Company that may be considered beneficial by some shareholders but is not supported by our Board of Directors.
Economic or political conditions in other countries, including fluctuations in foreign currency exchange rates and tax rates may adversely affect our operations.
A significant portion of our sales and operating income for 20202023 was attributable to our operations outside of the United States. As a result, our business is subject to the risks associated with doing business outside of the United States such as local customer product preferences, political unrest, disruptions or delays in shipments, changes in economic conditions in countries in which we operate, foreign currency fluctuations, real estate costs, and labor and employment practices in non-U.S. jurisdictions that may differ significantly from those that prevail in the United States.
In addition, because our suppliers manufacture a substantial amount of our products in foreign countries, our ability to obtain sufficient quantities of merchandise on favorable terms may be affected by governmental regulations, trade restrictions, labor, and other conditions in the countries from which our suppliers obtain their product.
Fluctuations in the value of the euro and the British Pound may affect the value of our European earnings when translated into U.S. dollars. Similarly, our earnings in other jurisdictions may be affected by the value of currencies when translated into U.S. dollars.
Except for our business in the United Kingdom (the “U.K.”), our Our international subsidiaries conduct most of their business in their local currency. Inventory purchases for our U.K. business are generally denominated in euros, which could result in foreign currency transaction gains or losses.
Our products are subject to import and excise duties and/or sales or value-added taxes in many jurisdictions. Fluctuations in tax rates and duties and changes in tax legislation or regulation could have a material adverse effect on our results of operations and financial condition.
Significant developments stemming from
Our stock price may be volatile, and the U.K.’s withdrawalvalue of our common stock has declined and may continue to decline.
The market price of our common stock may be highly volatile and may fluctuate or decline substantially as a result of a variety of factors, some of which are beyond our control, including without limitation:
| • | a change in the relationship with any of our key suppliers or the unavailability of key products at competitive prices; |
| • | actual or anticipated fluctuations in our financial condition or results of operations; |
| • | variance in our financial performance from expectations of securities analysts and securities analysts may issue unfavorable research about us; |
| • | changes in our projected operating and financial results; |
| • | announcements by us or our competitors of significant business developments, acquisitions, or new offerings; |
| • | significant data breaches; |
| • | future sales of our common stock by us or our shareholders, or the perception that such sales may occur; |
| • | changes in senior management or key personnel; |
| • | the trading volume of our common stock; |
| • | changes in the anticipated future size and growth rate of our market; and |
| • | general macroeconomic, geopolitical, and market conditions beyond our control. |
Broad market and industry fluctuations, as well as general economic, political, regulatory, and market conditions, such as recessions, interest rate changes, or international currency fluctuations, may also negatively affect the E.U.market price of our common stock. In the past, companies that have experienced volatility in the market price of their securities have been subject to securities class action litigation. We may be the target of this type of litigation in the future, which could result in substantial expenses and divert our management’s attention.
Increasing inflation could adversely affect our business, financial condition, results of operations, or cash flows.
Inflation, as well as some of the measures taken by or that may be taken by the governments in countries where we operate in an attempt to curb inflation, may have negative effects on the economies of those countries generally. If the United States or other countries where we operate experience substantial inflation in the future, our business may be adversely affected. Fewer customers may shop as these purchases may be seen as discretionary, and those who do shop may limit the amount of their purchases. Any reduced demand or changes in customer purchasing behavior may lead to lower sales, higher markdowns and an overly promotional environment or increased marketing and promotional spending. This could have a material adverse effect on our business, financial condition, results of operations, or cash flows.
Macroeconomic developments may adversely affect our business.
Our performance is subject to global economic conditions and the Company.
related effects on consumer spending levels. Continued uncertainty about global economic conditions poses a risk as consumers and businesses may postpone spending in response to tighter credit, unemployment, negative financial news, and/or declines in income or asset values, which could have a material negative effect on demand for our products. The ongoing conflicts in Ukraine and the Middle East may lead to disruption in the global supply chain, rising fuel costs, or cybersecurity risks, and economic instability generally, any of which could materially and adversely affect our business and results of operations. Additionally, with the U.K. formally exited’s exit from the European Union onin January 31, 2020, (commonly referred toknown as “Brexit”) and entered into a new trade agreement withBrexit, the European Union on December 24, 2020. Despiteongoing uncertainties of the U.K.’s December 2020 trade agreement, many potential future effects of Brexit remain unclear and could adversely affect certain areas of our business, including, but not limited to, an increase in duties and delays in the delivery of products, and adverse effects to our suppliers.
We have significant operations in bothtrading relationship between the U.K. and the E.U.,European Union have yet to be completely realized and we are highly dependent on the free flow of laborultimate outcome and goods in those regions. In responselong-term impacts for the U.K. and Europe remain uncertain. Ongoing changes and uncertainties related to Brexit, including trade frictions and Britain’s high inflation rate, continue to subject us to heightened trade risks in February 2020 we engagedthat region. In addition, disruptions to trade and free movement of goods, services, and people to and from the U.K., disruptions to the workforce of our business partners, increased foreign exchange volatility with a third-party logistics provider within Englandrespect to mitigate supply chain risks. Uncertainty surrounding Brexit could cause a slowdown inthe British pound, and additional legal, political, and economic activitychanges also subject us to further uncertainty in the U.K., Europe or globally,region.
As a retailer that is dependent upon consumer discretionary spending, our results of operations are sensitive to changes in macroeconomic conditions. Our customers may have less money for discretionary purchases as a result of job losses, foreclosures, bankruptcies, increased fuel and energy costs, higher interest rates, higher taxes, reduced access to credit, and lower home values. These and other economic factors could adversely affect demand for our products, which could adversely affect our financial condition and operating results and growth prospects. In addition, Brexit could lead to legal uncertainty and potentially divergent national laws and regulations as the U.K. determines which E.U. laws to replace or replicate, including data protection regulation. Compliance with any new laws and regulations may be cumbersome, difficult, or costly.results.
There remains substantial uncertainty surrounding the ultimate effect of Brexit and outcomes could disrupt the markets we serve and the tax jurisdictions in which we operate. This uncertainty creates challenges (particularly in the near term) with respect to trading relationships between our U.K. subsidiary and other E.U. nations. These possible effects of Brexit could adversely affect our business, results of operations, and financial condition.
Imposition of tariffs and export controls on the products we buy may have a material adverse effect on our business.
A significant portion of the products that we purchase, including the portion purchased from U.S.-based suppliers, as well as most of our private brand merchandise, is manufactured abroad. We may be affected by potential changes in international trade agreements or tariffs, such as new tariffs imposed on certain Chinese-made goods imported into the U.S. Furthermore, China or other countries may institute retaliatory trade measures in response to existing or future tariffs imposed by the U.S. that could have a negative effect on our business. If any of these events occur as described, we may be obligated to seek alternative suppliers for our private brand merchandise, raise prices, or make changes to our operations, any of which could have a material adverse effect on our sales and profitability, results of operations, and financial condition.
Macroeconomic developments may adversely affect our business.
Our performance is subject to global economic conditions and the related effects on consumer spending levels. Continued uncertainty about global economic conditions, including the COVID-19 pandemic, poses a risk as consumers and businesses may postpone spending in response to tighter credit, unemployment, negative financial news, and/or declines in income or asset values, which could have a material negative effect on demand for our products.
As a retailer that is dependent upon consumer discretionary spending, our results of operations are sensitive to changes in macroeconomic conditions. Our customers may have less money for discretionary purchases as a result of job losses, foreclosures, bankruptcies, increased fuel and energy costs, higher interest rates, higher taxes, reduced access to credit, and lower home values. These and other economic factors could adversely affect demand for our products, which could adversely affect our financial condition and operating results.
Instability in the financial markets may adversely affect our business.
During 2020, uncertainty surrounding
The global macroeconomic environment could be negatively affected by, among other things, instability in global economic markets, disruptions to the potential effectsbanking system and financial market volatility resulting from bank failures, increased U.S. trade tariffs and trade disputes with other countries, instability in the global credit markets, supply chain weaknesses, instability in the geopolitical environment as a result of Brexit, the Russian invasion of the COVID-19 pandemic helped create volatilityUkraine, the conflict in the Middle East, and other political tensions, and foreign governmental debt concerns. Such challenges have caused, and may continue to cause, uncertainty and instability in local economies and in global financial markets around the world. markets.
This volatility may affect our future access to the credit and debt security markets, leading to higher borrowing costs, or, in some cases, the inability to obtain additional financing.
On November 30, 2020, ICE Benchmark Administration (“IBA”), the administrator of LIBOR, with the support of the United States Federal Reserve and the United Kingdom’s Financial Conduct Authority, announced plans to consult on ceasing publication of USD LIBOR on December 31, 2021, for only the one week and two month USD LIBOR tenors, and on June 30, 2023, for all other USD Libor tenors. While this announcement extends the transition period to June 2023, the United States Federal Reserve concurrently issued a statement advising banks to stop new USD LIBOR issuances by the end of 2021. In light of these recent announcements, the future of LIBOR at this time is uncertain and any changes in the methods by which LIBOR is determined or regulatory activity related to LIBOR’s phaseout could cause LIBOR to perform differently than in the past or cease to exist. Our 2020 Credit Agreement provides for alternative methods of calculating the interest rate payable on indebtedness thereunder.
Instability in the global financial markets could reduce availability of credit to our business. Although we currently have a revolving credit agreement in place until July 14, 2025, tightening of credit markets could make it more difficult for us to access funds, refinance our existing indebtedness, enter into agreements for new indebtedness, or obtain funding through the issuance of the Company’s securities.
Material changes in the market value of the securities we hold may adversely affect our results of operations and financial condition.
At January 30, 2021February 3, 2024, our cash and cash equivalents totaled $1,680$297 million. The majority of our investments were short-term deposits in highly-rated banking institutions. We regularly monitor our counterparty credit risk and mitigate our exposure by making short-term investments only in highly-rated institutions and by limiting the amount we invest in any one institution. We continually monitor the creditworthiness of our counterparties. At January 30, 2021,February 3, 2024, all investments were in investment grade institutions. Despite an investment grade rating, it is possible that the value or liquidity of our investments may decline due to any number of factors, including general market conditions and bank-specific credit issues.
Our U.S. pension plan trust holds assets totaling $666$359 million at January 30, 2021.February 3, 2024. The fair values of these assets held in the trust are compared to the plan’s projected benefit obligation to determine the pension funding liability. We attempt to mitigate funding risk through asset diversification, and we regularly monitor investment risk of our portfolio through quarterly investment portfolio reviews and periodic asset and liability studies. Despite these measures, it is possible that the value of our portfolio may decline in the future due to any number of factors, including general market conditions and credit issues. Such declines could affect the funded status of our pension plan and future funding requirements.
Our financial results may be adversely affected by tax rates or exposure to additional tax liabilities.
We are a U.S. basedU.S.-based multinational company subject to tax in multiple U.S. and foreign tax jurisdictions. Our provision for income taxes is based on a jurisdictional mix of earnings, statutory rates, and enacted tax rules, including transfer pricing. Significant judgment is required in determining our provision for income taxes and in evaluating our tax positions on a worldwide basis. President Biden has proposed raising the highest U.S. federal income tax rate applicable to corporations.Our effective tax rate could be adversely affected by a number of factors, including shifts in the mix of pretax results by tax jurisdiction, changes in tax laws or related interpretations in the jurisdictions in which we operate, and tax assessments and related interest and penalties resulting from income tax audits.
2020 Form 10-K Page 11 Further, many countries continue to consider changes in their tax laws by implementing new taxes such as the digital service tax and initiatives such as the Organization for Economic Co-operation and Development’s Pillar II global minimum tax. Various countries are in the process of incorporating the Pillar II framework within their tax laws.
Changes in employment laws or regulation could harm our performance.
Various foreign and domestic labor laws govern our relationship with our employees and affect our operating costs. These laws include, but are not limited to, minimum wage requirements, overtime, sick, and sickpremium pay, paid time off, work scheduling, healthcare reform and the Patient Protection and Affordable Care Act, and the Protecting the Right to Organize Act, unemployment tax rates, workers’ compensation rates, European works council requirements, and union organization.
A number of factors could adversely affect our operating results, including additional government-imposed increases in minimum wages, overtime, sick, and sickpremium pay, paid leaves of absence, mandated health benefits, and changing regulations from the National Labor Relations Board or other agencies. Complying with any new legislation or interpretation of law, or reversing changes implemented under existing law could be time-intensive and expensive and may affect our business.
Legislative or regulatory initiatives related to climate change concerns may negatively affect our business.
Greenhouse gases may have an adverse effect on global temperatures, weather patterns, and the frequency and severity of extreme weather and natural disasters. Global climate change could result in certain types of natural disasters occurring more frequently or with more intense effects. Such events could make it difficult or impossible for us to deliver products to our customers, create delays, and inefficiencies in our supply chain. Following an interruption to our business, we could require substantial recovery time, experience significant expenditures to resume operations, and lose significant sales. Concern over climate change may result in new or additional legal, legislative, regulatory, and regulatorycompliance requirements to reduce or mitigate the effects of climate change on the environment, which could result in future tax, transportation, and utility increases, which could adversely affect our business.
There is also increased focus, including by investors, customers, and other stakeholders, on these and other sustainability matters, such as worker safety, the use of plastic, energy consumption, and waste.
Increasing
We face increased scrutiny and changingevolving expectations regarding environmental, social, and governance ("ESG") matters.
There is increasing scrutiny and evolving expectations from investors, customers, regulators, and our customersother stakeholders on ESG practices and disclosures, including those related to environmental stewardship, climate change, and diversity, inclusion, and belonging. Legislators and regulators have imposed, and likely will continue to impose, ESG-related legislation, rules, and guidance, which may conflict with respect to our Corporate Social Responsibility (“CSR”) mayone another and impose additional costs on us, impede our business opportunities, or expose us to new or additional risks.
Our reputation
For example, developing and acting on ESG-related initiatives, including sourcing and operational decisions, collecting, measuring, and reporting ESG-related information and metrics can be costly, difficult and time consuming and is subject to evolving reporting standards, including the SEC's recently approved climate-related reporting requirements and sustainability reporting requirements in the European Union.
In addition, state attorneys general and other state officials have spoken out against ESG-motivated investing by some investment managers and terminated contracts with managers based on their following certain ESG-motivated strategies. Moreover, proxy advisory firms that provide voting recommendations to investors have developed ratings for evaluating companies on their approach to different ESG matters, and unfavorable ratings of our company or our industry may lead to negative investor sentiment and the diversion of investment to other companies or industries. If we are unable to meet these standards or expectations, whether established by us or third parties, it could be damaged if we do not (or are perceived not to) act responsibly with respect to sustainability matters,result in adverse publicity, reputational harm, or loss of customer and/or investor confidence, which could adversely affect our business, results of operations, cash flows, and financial condition. Increasing attention to CSR matters may affect our business and some institutional investors may be discouraged from investing in us.
Companies across all industries are facing increasing scrutiny from stakeholders related to their CSR practices. Investor advocacy groups, certain institutional investors, investment funds, and other influential investors are also increasingly focused on CSR practices and in recent years have placed increasing importance on the implications and social cost of their investments. Regardless of the industry, investors’ increased focus and activism related to CSR and similar matters may hinder access to capital, as investors may decide to reallocate capital or to not commit capital as a result of their assessment of a company’s CSR practices. Companies which do not adapt to or comply with investor or stakeholder expectations and standards, which are evolving, or which are perceived to have not responded appropriately to the growing concern for CSR issues, regardless of whether there is a legal requirement to do so, may suffer from reputational damage and the business, financial condition, and/or stock price of such a company could be materially and adversely affected.liquidity.
In addition, the importance of CSR scoring evaluations is becoming more broadly accepted by shareholders. Certain organizations that provide corporate governance and other corporate risk information to shareholders have developed scores and ratings to evaluate companies based upon CSR metrics. Many shareholders focus on positive CSR business practices and scores when making investments and may consider a company’s score as a reputational or other factor in making an investment decision. In addition, investors, particularly institutional investors, use these scores to benchmark companies against their peers and if a company is perceived as lagging, these investors may engage with companies to require improved CSR disclosure or performance. We may face reputational damage in the event our CSR procedures or standards do not meet the standards set by various constituencies. A low score could result in a negative perception of us, or exclusion of our common stock from consideration by certain investors who may elect to invest with our competition instead. In addition, the cost of compliance to receive high CSR scores may be considerable.
We may be adversely affected by regulatory and litigation developments.
We are exposed to the risk that federal or state legislation may negatively affect our operations. Changes in federal or state wage requirements, employee rights, health care, social welfare, or entitlement programs, including health insurance, paid leave programs, or other changes in workplace regulation could increase our cost of doing business or otherwise adversely affect our operations. Additionally, we are regularly involved in litigation and demands, including commercial, tort, intellectual property, customer, employment, wage and hour, data privacy, anti-corruption, and other claims, including purported class action lawsuits. The cost of defending against these types of claims against us or the ultimate resolution of such claims, whether by settlement, mediation, arbitration, or adverse court or agency decision, may harm our business.
We operate in many different jurisdictions and we could be adversely affected by violations of the U.S. Foreign Corrupt Practices Act and similar worldwide anti-corruption laws.
The U.S. Foreign Corrupt Practices Act (“FCPA”("FCPA") and similar worldwide anti-corruption laws, including the U.K. Bribery Act of 2010, which is broader in scope than the FCPA, generally prohibit companies and their intermediaries from making improper payments to government officials for the purpose of obtaining or retaining business. Our internal policies mandate compliance with these anti-corruption laws. Despite our training and compliance programs, we cannot be assured that our internal control policies and procedures will always protect us from reckless or criminal acts committed by our employees or agents. Our continued expansion outside the United States, including in developing countries, could increase the risk of FCPA violations in the future. Violations of these laws, or allegations of such violations, could have a material adverse effect on our results of operations or financial condition.
Failure to fully comply with Section 404 of the Sarbanes-Oxley Act of 2002 could negatively affect our business, market confidence in our reported financial information, and the price of our common stock.
We continue to document, test, and monitor our internal control over financial reporting in order to satisfy the requirements of Section 404 of the Sarbanes-Oxley Act of 2002. However, we cannot be assured that our disclosure controls and procedures and our internal control over financial reporting will prove to be completely adequate in the future. Failure to fully comply with Section 404 of the Sarbanes-Oxley Act of 2002 could negatively affect our business, the price of our common stock and market confidence in our reported financial information, and the price of our common stock.information.
International intellectual property protection can be uncertain and costly.
Uncertainty in intellectual property protection can result from conducting business outside the United States, particularly in jurisdictions that do not have comparable levels of protection for our assets such as intellectual property, copyrights, and trademarks. Continuing to operate in such foreign jurisdictions where the ability to enforce intellectual property rights is limited increases our exposure to risk.
Risks Related to our Indebtedness and our Credit Facility
Our debt may cause an adverse effect on our business.
We have $400 million of 4% Senior Notes due 2029. Our inability to generate sufficient cash flow to satisfy our debt obligations or to refinance our debt obligations could adversely affect our business, financial condition, results of operations, and other corporate requirements. This could require us to direct a substantial portion of our future cash flow toward payments on our indebtedness, which would reduce the amount of cash flow available to fund working capital, capital expenditures, and other corporate requirements, thereby limiting our ability to respond to business opportunities.
We may be unable to draw on our credit facility in the future or we may be unable to secure a new credit facility with similar terms.
We have a $600 million asset-based revolving credit facility that is scheduled to expire in July 2025. Borrowings and letters of credit under our credit facility are not permitted to exceed a borrowing base, which is tied to our level of inventory. Therefore, reductions in the value of our inventory would result in a reduction in our borrowing base, which would reduce the amount of financial resources available to meet our operating requirements. Also, if we do not comply with our financial covenants and we do not obtain a waiver or amendment from our lenders, the lenders may elect to cause any amounts then owed to become immediately due and payable, not fund any new borrowing, or they may decline to renew our credit facility. In that event, we would seek to establish a replacement credit facility with one or more other lenders, including lenders with which we have an existing relationship, potentially on less desirable terms. There can be no guarantee that replacement financing would be available at commercially reasonable terms, if at all. Additionally, our rates on our revolving credit facility may be affected by our credit ratings which could result in higher interest expense in the future.
Item1B. Unresolved Staff Comments
None
Item 1C. Cybersecurity
Cybersecurity risk management and strategy
Information security is an important part of the Company’s culture and foundational to its management. This philosophy is emphasized throughout the organization by the Board of Directors, senior leadership, and team members to help promote a Company-wide culture of cybersecurity risk management.
We use information technology and third-party service providers to support our global business processes and activities, which exposes us to cybersecurity risks. We have from time-to-time experienced cybersecurity incidents. In the event of a cybersecurity incident, we respond in accordance with our policies, processes, applicable laws, and regulations. When necessary, we also engage third parties, such as cybersecurity advisors, to assist in investigating and remediating incidents. To date, the cybersecurity incidents have not had a material effect on our business strategy, results of operations, or financial condition.
Key Program Components
We take cybersecurity seriously, and our cybersecurity program is aligned to well-known and established cybersecurity frameworks. We use, and continue to improve, our cyber defense-in-depth strategy, which uses multiple layers of security for holistic protection.
Our cybersecurity governance program is strategically integrated into our enterprise risk management and is periodically presented to the audit committee, which is responsible for oversight of the enterprise risk management framework associated with technology, security, data, and privacy, and the Board of Directors. These procedures include regular risk monitoring by management to update current risks and identify potential new and emerging risks. The Technology Committee receives regular briefings from our Chief Operations Officer, Chief Technology Officer, Chief Information Security Officer, and outside experts on cybersecurity risks and cyber risk oversight. During these meetings, the Technology Committee and management discuss these risks, risk management activities and efforts, best practices, lessons learned from incidents at other companies, the effectiveness of our security measures, and other related matters. The Technology Committee Chair reports on the committee’s meetings, considerations, and actions to the Board at the next Board meeting following each Technology Committee meeting. The Audit Committee also discusses and receives updates on cybersecurity matters in connection with its oversight of enterprise risk management.
We also maintain a variety of incident response plans that are utilized when incidents are detected. We conduct periodic tabletop exercises, in which different internal and external stakeholders, including from time to time our CEO, Non-Executive Chair, or Board of Directors, participate in a simulated cyber scenario. The purpose of these exercises is to test our cyber incident response plan, identify weaknesses or gaps, and ensure that all participants are aware of, and familiar with, their roles and responsibilities.
We require employees with access to information systems to undertake data protection and cybersecurity training. In addition, certain individuals with privileged access, such as system administrators and developers, are subject to additional controls and monitoring activities. We also conduct periodic phishing campaigns to train users to better identify, report, and avoid malicious content.
We recognize that third-party service providers may introduce cybersecurity risks to our organization. In an effort to mitigate these risks, we have implemented a process before engaging with third-party service providers which are designed to assess their cybersecurity practices. Additionally, we endeavor to include cybersecurity requirements in our contracts with these providers, requiring them to adhere to certain cybersecurity standards and protocols.
Our Chief Information Security Officer, with oversight from the Chief Technology Officer and Chief Operations Officer, is primarily responsible for assessing and managing cybersecurity risks. Our Chief Information Security Officer has extensive cybersecurity knowledge and skills gained from over 25 years’ experience in the field. Our Chief Information Security Officer is continually informed about the latest developments in cybersecurity, including potential threats and innovative risk management techniques. This ongoing knowledge acquisition is crucial for the effective prevention, detection, mitigation, and remediation of cybersecurity incidents.
Several experienced information security professionals report to our Chief Information Security Officer and he is supported by a team of trained cybersecurity team members. In addition to our extensive in-house cybersecurity capabilities, at times we also engage assessors, consultants, auditors, or other third parties to assist with assessing, identifying, and managing cybersecurity risks.
Notwithstanding the breadth of the Company’s information security program, it may not be successful in preventing or mitigating a cybersecurity incident that could have a material adverse impact. For a discussion of whether and how any risks from cybersecurity threats have materially affected or are reasonably likely to materially affect the Company, including its business strategy, results of operations, or financial condition, see Item 1A. "Risk Factors," which is incorporated by reference into this Item 1C.
Item2. Properties
Our properties consist of land, leased stores, administrative facilities, and distribution centers. Gross square footage and total selling area for our store locations at the end of 20202023 were approximately 12.98 and 7.507.97 million square feet, respectively. These properties, which are primarily leased, are located in the United States and its territories, Canada, various European countries, Asia, Australia, and New Zealand.
We currently operate five
As of February 3, 2024, we operated eight distribution centers, of which two are owned and threesix are leased, occupying an aggregate of 3.03.42 million square feet. ThreeSix of these distribution centers are located in the United States, one in Canada, and one in the Netherlands. During 2023, we closed the distribution center that supported the Eastbay business and opened a new leased distribution center to support our Northeast operations. Additionally, we utilize the services of third-party providers for our operations in the U.K., Australia, New Zealand, South Korea, and Japan. We also own a cross-dock and manufacturing facility, and operate a leased warehouse in the United States, both of which supportsupports our Team Edition apparel business.
The Company plans to move two of its distribution centers to new leased locations to enhance capabilities and support planned growth for our WSS and European businesses. Our WSS distribution center is expected to open mid-year 2024, with our European distribution center expected to open in 2025. These new distribution centers will employ state-of-the-art technologies to deliver improved logistics capabilities and operational efficiencies.
We believe that all leases of properties that are material to our operations may be renewed, or that alternative properties are available, on terms similar to existing leases.
Item3. Legal Proceedings
Information regarding the Company’s legal proceedings is contained in the "Legal ProceedingsProceedings" note under “Item"Item 8. Consolidated Financial Statements and Supplementary Data.”"
Not applicable.
20202023 Form 10-K Page
13
16
Item 4. Mine Safety Disclosures
Not applicable.
Item4A. Information about our Executive Officers
The following table provides information with respect to all persons serving as executive officers as of March 25, 2021,28, 2024, including business experience for the last five years.
| | |
Chairman, President and Chief Executive Officer
|
| Richard A. Johnson
|
Executive Vice President and Chief Executive Officer — North America
|
| Frank Bracken
|
Executive Vice President and Chief Commercial Officer
|
| Andrew Gray
|
Executive Vice President and Chief Executive Officer — Asia Pacific and Chief Strategy Officer
|
| W. Scott Martin
|
Executive Vice President and Chief Financial Officer
|
| Lauren B. Peters
|
Executive Vice President and Chief Executive Officer — EMEA
|
| Vijay Talwar
|
Senior Vice President and Chief Accounting Officer
|
| Giovanna Cipriano
|
Senior Vice President, General Counsel and Secretary
|
| Sheilagh M. Clarke
|
Senior Vice President — Global Supply Chain
|
| Todd Greener
|
Senior Vice President and Chief Human Resources Officer
|
| Elizabeth S. Norberg
|
Senior Vice President and Chief Information Officer
|
| Himanshu Parikh
|
Vice President, Treasurer
|
| John A. Maurer
|
Name | Position | Age | Executive Officer Since |
| Mary N. Dillon | Chief Executive Officer since September 2022. Previously, Ms. Dillon served as Chief Executive Officer of Ulta Beauty, Inc. from July 2013 through June 2021. | 62 | 2022 |
| Michael Baughn | Executive Vice President and Chief Financial Officer since June 2023. Previously, Mr. Baughn served in various roles at Kohl’s Corporation, including Executive Vice President of Finance and Treasurer from July 2021 through May 2023 and Senior Vice President of Finance and Treasurer from April 2018 through July 2021. | 42 | 2023 |
| Franklin R. Bracken | Executive Vice President and Chief Commercial Officer since December 2022. Previously, he served as Executive Vice President and Chief Operating Officer from November 2021 through December 2022, Executive Vice President and Chief Executive Officer — North America from July 2020 through November 2021, and Senior Vice President and General Manager Foot Locker U.S., Lady Foot Locker, and Kids Foot Locker from October 2017 through July 2020. | 51 | 2021 |
| Cynthia Carlisle | Executive Vice President and Chief Human Resource Officer since March 2024. Previously, she served in various roles at Stryker Corporation, including Group Vice President, Human Resources from July 2020 through February 2024 and Vice President, Talent Management from November 2019 through July 2020. She served as Vice President, Human Resources for Roche Diagnostics from September 2016 through October 2019. | 49 | 2024 |
Jennifer L. Kraft | Executive Vice President and General Counsel since July 2023. Previously, she served as Senior Vice President, Deputy General Counsel and Corporate Secretary for Starbucks Corporation from September 2020 through June 2023. Prior to Starbucks, she served in roles of increasing responsibility at United Airlines Holdings, Inc. from July 2011 through September 2020, most recently as Deputy General Counsel, Vice President and Corporate Secretary. | 53 | 2023 |
Elliott D. Rodgers | Executive Vice President and Chief Operations Officer since December 2022. Previously, Mr. Rodgers served as Chief People Officer for Project 44 from October 2021 through November 2022. He served in various roles at Ulta Beauty, Inc., including Chief Information Officer from September 2020 through October 2021, Chief Supply Chain Officer from April 2019 to September 2020, and Senior Vice President, Supply Chain from March 2017 through March 2019. | 48 | 2022 |
| Giovanna Cipriano | Senior Vice President and Chief Accounting Officer since May 2009. | 54 | 2009 |
Richard A. Johnson, age 63, has served as Chairman of the Board since May 2016 and President and Chief Executive Officer since December 2014.
Frank Bracken, age 48, has served as Executive Vice President and Chief Executive Officer — North America since July 22, 2020. He previously served as Senior Vice President and General Manager Foot Locker, Lady Foot Locker, and Kids Foot Locker from October 2017 through July 2020. Mr. Bracken previously served as the General Manager of Foot Locker Canada from February 2016 through October 2017. From January 2014 through February 2016, Mr. Bracken served as Vice President, Divisional Merchandise Manager of Footwear for Champs Sports.
Andrew Gray, age 43,has served as Executive Vice President and Chief Commercial Officer since July 22, 2020. Mr. Gray previously served as Vice President and Chief Merchandising Officer — North America from October 2017 through July 2020 and Vice President and General Manager of U.S. Foot Locker and Lady Foot Locker from April 2016 to October 2017. Mr. Gray previously served as Vice President and General Merchandising Manager from July 2013 to April 2016.
W. Scott Martin, age 53, has served as Executive Vice President and Chief Executive Officer — Asia Pacific and Chief Strategy Officer since July 22, 2020. He previously served as Senior Vice President, Chief Strategy and Development Officer from March 2019 to July 2020. Previously he served as Senior Vice President — Strategy and Store Development from October 2017 to March 2019 and as Senior Vice President — Real Estate from June 2016 to September 2017. Mr. Martin previously served as Vice President, Store Development – Asia Pacific with Gap Inc. from June 2014 to June 2016.
Lauren B. Peters, age 59, has served as Executive Vice President and Chief Financial Officer since July 2011.
Vijay Talwar, age 49, has served as Executive Vice President and Chief Executive Officer — EMEA since February 2019. Mr. Talwar previously served as President — Digital from March 2018 to February 2019 and President — Digital/Footlocker.com/Eastbay from September 2016 to March 2018. Mr. Talwar served as President, Gifts and Special Occasions at Sears Holdings Corporation from 2014 to September 2016.
Giovanna Cipriano, age 51, has served as Senior Vice President and Chief Accounting Officer since May 2009.
Sheilagh M. Clarke, age 61, has served as Senior Vice President, General Counsel and Secretary since June 2014.
Todd Greener, age 50, has served as Senior Vice President — Global Supply Chain since October 2018. Mr. Greener previously served as Senior Vice President — Supply Chain at Advance Auto Parts from March 2015 to October 2018 and General Manager — Appliance Distribution Operations at General Electric Company from September 2012 to February 2015.
Elizabeth S. Norberg, age 54, has served as Senior Vice President and Chief Human Resources Officer since September 2018. Ms. Norberg previously served as Executive Vice President, Chief Human Resources Officer at Loews Hotels & Co. (a subsidiary of Loews Corporation) from August 2017 to September 2018, Executive Vice President, Chief Human Resources Officer at Red Lion Hotels Corporation from June 2016 to August 2017, and Vice President and Chief of Human Resources Operations, Health System at Northwell Health from January 2015 to June 2016.
Himanshu Parikh, age 48, has served as Senior Vice President, Chief Information Officer since December 18, 2020. From January 2015 to November 2020, Mr. Parikh served in various technology leadership roles at Michaels Corporation with his most recent role as Senior Vice President — Chief Technology Officer.
John A. Maurer, age 61, has served as Vice President, Treasurer since September 2006. In addition to this role, he also served as the Vice President of Investor Relations from February 2011 through March 2018.
There are no family relationships among the executive officers or directors of the Company.
PARTPART II
| Item5. Market for the Company’s Common Equity, Related Shareholder Matters, and Issuer Purchases of Equity Securities Item 5.
| Market for the Company’s Common Equity, Related Stockholder Matters and Issuer Purchases of Equity Securities
|
Foot Locker, Inc. common stock (ticker symbol “FL”"FL") is listed on the New York Stock Exchange as well as on the Börse Stuttgart stock exchange in Germany.
As of January 30, 2021,February 3, 2024, we had 11,9578,741 shareholders of record owning 103,619,12394,283,984 common shares.
We declared a dividenddividends of $0.40 per share in the first, quartersecond, and third quarters of 2020. During2023. The declaration of dividends and the first quarter, we suspended our second quarter dividend as a resultestablishment of the economic uncertainty as a resultper share amount, record dates and payment dates for any such future dividends are subject to the final determination of the COVID-19 pandemic. On August 20, 2020, our Board of Directors, approvedand are dependent upon multiple factors, including future earnings, cash flows, financial requirements, and other considerations. As previously announced, the reinstatementCompany has paused dividends to increase balance sheet flexibility in support of our quarterly dividend program at a ratelonger-term strategic initiatives.
On February 17, 2021, the Board of Directors declared a quarterly dividend of $0.20 per share to be paid on April 30, 2021. This dividend represents a 33 percent increase from the previous quarterly per share amount of $0.15 per share. The Board of Directors regularly reviews the dividend policy and rate, taking into consideration the overall financial and strategic outlook for our earnings, liquidity, and cash flow.
The following table is a summary of our fourth quarter share repurchases:
| | | | | | | | | | |
| | | | | | | Total Number of | | Dollar Value of |
| | Total | | Average | | Shares Purchased as | | Shares that may |
| | Number | | Price | | Part of Publicly | | yet be Purchased |
| | of Shares | | Paid Per | | Announced | | Under the |
Date Purchased | | Purchased (1) | | Share (1) | | Program (2) | | Program (2) |
November 1 to November 28, 2020 | | 257 | | $ | 36.88 | | — | | $ | 857,009,892 |
November 29 to January 2, 2020 | | 591,285 | | | 40.14 | | 591,285 | | | 833,277,966 |
January 3 to January 30, 2021 | | 69,062 | | | 39.54 | | 69,062 | | | 830,547,018 |
| | 660,604 | | $ | 40.07 | | 660,347 | | | |
Date Purchased | | Total Number of Shares Purchased (1) | | | Average Price Paid Per Share (1) | | | Total Number of Shares Purchased as Part of Publicly Announced Program (2) | | | Dollar Value of Shares that may yet be Purchased Under the Program (2) | |
October 29 to November 25, 2023 | | | — | | | $ | — | | | | — | | | $ | 1,103,814,042 | |
November 26 to December 30, 2023 | | | 1,606 | | | | 29.53 | | | | — | | | | 1,103,814,042 | |
December 31, 2023 to February 3, 2024 | | | 2,080 | | | | 28.97 | | | | — | | | | 1,103,814,042 | |
| | | 3,686 | | | $ | 29.21 | | | | — | | | | | |
(1) | These columns also reflect shares acquired in satisfaction of the tax withholding obligation of holders of restricted stock awards, which vested during the quarter, and shares repurchased pursuant to Rule 10b5-1 under the Securities Exchange Act of 1934. The calculation of the average price paid per share includes all fees, commissions, and other costs associated with the repurchase of such shares. quarter. |
(2) | On February 20, 2019,24, 2022, the Board of Directors approved a new 3-year, $1.2 billion share repurchase program extending through January 2022. Through January 30, 2021, 9 million sharesauthorizing the Company to repurchase up to $1.2 billion of its common stock, were purchased under this program fordoes not have an aggregate cost of $370 million. expiration date. |
Performance Graph
The graph below compares the cumulative five-year total return to shareholders (common stock price appreciation plus dividends, on a reinvested basis) of our common stock relative to the total returns of the S&P 600 Specialty Retailing Index and the Russell 3000 Index.
| | 2/2/2019 | | | 2/1/2020 | | | 1/30/2021 | | | 1/29/2022 | | | 1/28/2023 | | | 2/3/2024 | |
Foot Locker, Inc. | | $ | 100.00 | | | $ | 71.28 | | | $ | 84.38 | | | $ | 87.29 | | | $ | 91.03 | | | $ | 63.86 | |
S&P 600 Specialty Retailing Index | | $ | 100.00 | | | $ | 103.07 | | | $ | 251.03 | | | $ | 218.01 | | | $ | 213.28 | | | $ | 235.64 | |
Russell 3000 Index | | $ | 100.00 | | | $ | 120.31 | | | $ | 144.94 | | | $ | 168.53 | | | $ | 157.53 | | | $ | 192.27 | |
We previously used the S&P 400 Specialty Retailing Index and the Russell Midcap Index.Index, however, due to the reduction in size of our market capitalization it was determined that the S&P 600 Specialty Retailing Index and the Russell 3000 Index are more appropriate benchmarks as the median market capitalizations are the closest to the Company’s.
Indexed Share Price PerformanceThe following graph compares the cumulative five-year total return to shareholders on our common stock relative to the total returns of the S&P 400 Specialty Retailing Index and Russell Midcap Index, our prior benchmarks. It is our intention to use the Russell 3000 Index and the S&P 600 Specialty Retailing Index for future performance graphs.
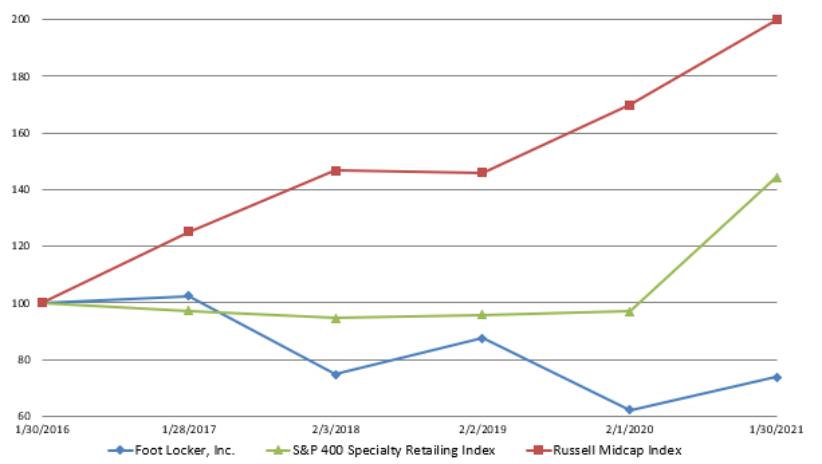
| | | | | | | | | | | | | | | | | | | |
| | 1/30/2016 | | 1/28/2017 | | 2/3/2018 | | 2/2/2019 | | 2/1/2020 | | 1/30/2021 | | 2/2/2019 | | 2/1/2020 | | 1/30/2021 | | 1/29/2022 | | 1/28/2023 | | 2/3/2024 | |
Foot Locker, Inc. | | $ | 100.00 | | $ | 102.39 | | $ | 74.82 | | $ | 87.55 | | $ | 62.41 | | $ | 73.87 | | $ | 100.00 | | | $ | 71.28 | | | $ | 84.38 | | | $ | 87.29 | | | $ | 91.03 | | | $ | 63.86 | |
S&P 400 Specialty Retailing Index | | $ | 100.00 | | $ | 97.25 | | $ | 94.78 | | $ | 95.79 | | $ | 97.09 | | $ | 144.24 | | $ | 100.00 | | | $ | 101.35 | | | $ | 150.57 | | | $ | 162.13 | | | $ | 155.60 | | | $ | 174.28 | |
Russell Midcap Index | | $ | 100.00 | | $ | 125.24 | | $ | 146.56 | | $ | 145.96 | | $ | 169.85 | | $ | 199.97 | | $ | 100.00 | | | $ | 116.37 | | | $ | 137.00 | | | $ | 152.05 | | | $ | 149.72 | | | $ | 163.09 | |
The above information should not be deemed “soliciting material”"soliciting material" or to be filed with the SEC, nor shall such information be incorporated by reference into any future filing under the Securities Act of 1933 or Securities Exchange Act of 1934, each as amended, except to the extent that we specifically incorporate it by reference into such filing.
20202023 Form 10-K Page
16
19
Item6. Selected Financial Data
FIVE-YEAR SUMMARY OF SELECTED FINANCIAL DATA
The selected financial data below should be read in conjunction with the Consolidated Financial Statements and the Notes thereto and other information contained elsewhere in this report.
| | | | | | | | | | | |
($ in millions, except per share amounts) | | 2020 | | 2019 | | 2018 | | 2017 (1) | | 2016 |
Summary of Operations | | | | | | | | | | | |
Sales | | $ | 7,548 | | 8,005 | | 7,939 | | 7,782 | | 7,766 |
Gross margin | | | 2,183 | | 2,543 | | 2,528 | | 2,456 | | 2,636 |
Selling, general and administrative expenses | | | 1,587 | | 1,650 | | 1,614 | | 1,501 | | 1,472 |
Depreciation and amortization | | | 176 | | 179 | | 178 | | 173 | | 158 |
Impairment and other charges | | | 117 | | 65 | | 37 | | 211 | | 6 |
Interest (expense) income, net | | | (7) | | 11 | | 9 | | 2 | | (2) |
Other income, net | | | 198 | | 12 | | 5 | | 5 | | 6 |
Net income | | | 323 | | 491 | | 541 | | 284 | | 664 |
Per Common Share Data | | | | | | | | | | | |
Basic earnings | | | 3.10 | | 4.52 | | 4.68 | | 2.23 | | 4.95 |
Diluted earnings | | | 3.08 | | 4.50 | | 4.66 | | 2.22 | | 4.91 |
Common stock dividends declared per share | | | 0.70 | | 1.52 | | 1.38 | | 1.24 | | 1.10 |
Weighted-average Common Shares Outstanding | | | | | | | | | | | |
Basic earnings | | | 104.3 | | 108.7 | | 115.6 | | 127.2 | | 134.0 |
Diluted earnings | | | 105.1 | | 109.1 | | 116.1 | | 127.9 | | 135.1 |
Financial Condition | | | | | | | | | | | |
Cash and cash equivalents | | $ | 1,680 | | 907 | | 891 | | 849 | | 1,046 |
Merchandise inventories | | | 923 | | 1,208 | | 1,269 | | 1,278 | | 1,307 |
Property and equipment, net | | | 788 | | 824 | | 836 | | 866 | | 765 |
Total assets | | | 7,043 | | 6,589 | | 3,820 | | 3,961 | | 3,840 |
Long-term debt and obligations under capital leases | | | 110 | | 122 | | 124 | | 125 | | 127 |
Total shareholders’ equity | | | 2,776 | | 2,473 | | 2,506 | | 2,519 | | 2,710 |
Financial Ratios | | | | | | | | | | | |
Sales per average gross square foot (2) | | $ | 417 | | 510 | | 504 | | 495 | | 515 |
SG&A as a percentage of sales | | | 21.0 | % | 20.6 | | 20.3 | | 19.3 | | 19.0 |
Net income margin | | | 4.3 | % | 6.1 | | 6.8 | | 3.6 | | 8.6 |
Adjusted net income margin (3) | | | 3.9 | % | 6.7 | | 6.9 | | 6.6 | | 8.4 |
Earnings before interest and taxes (EBIT) (3) | | $ | 501 | | 661 | | 704 | | 576 | | 1,006 |
EBIT margin (3) | | | 6.6 | % | 8.3 | | 8.9 | | 7.4 | | 13.0 |
Adjusted EBIT (3) | | $ | 428 | | 722 | | 741 | | 762 | | 1,012 |
Adjusted EBIT margin (3) | | | 5.7 | % | 9.0 | | 9.3 | | 9.9 | | 13.0 |
Return on assets (ROA) | | | 4.7 | % | 9.4 | | 13.9 | | 7.3 | | 17.4 |
Return on invested capital (ROIC) (3) | | | 8.6 | % | 12.5 | | 12.0 | | 11.0 | | 15.1 |
Net debt capitalization percent (3), (4) | | | 35.2 | % | 49.4 | | 51.7 | | 54.4 | | 48.5 |
Current ratio | | | 1.7 | | 2.0 | | 3.3 | | 4.1 | | 4.3 |
Other Data | | | | | | | | | | | |
Capital expenditures | | $ | 159 | | 187 | | 187 | | 274 | | 266 |
Number of stores at year end | | | 2,998 | | 3,129 | | 3,221 | | 3,310 | | 3,363 |
Total selling square footage at year end (in millions) | | | 7.50 | | 7.57 | | 7.63 | | 7.71 | | 7.63 |
Total gross square footage at year end (in millions) | | | 12.98 | | 13.15 | | 13.24 | | 13.30 | | 13.12 |
($ in millions, except per share amounts) | 2023 (1) | | 2022 | | 2021 | | 2020 | | 2019 |
Summary of Operations: | | | | | | | | | | | | | | |
Sales | $ | 8,154 | | | 8,747 | | | 8,958 | | | 7,548 | | | 8,005 |
Licensing revenue | | 14 | | | 12 | | | 10 | | | 6 | | | 8 |
Gross margin | | 2,259 | | | 2,792 | | | 3,080 | | | 2,183 | | | 2,543 |
Selling, general and administrative expenses | | 1,852 | | | 1,903 | | | 1,851 | | | 1,587 | | | 1,650 |
Depreciation and amortization | | 199 | | | 208 | | | 197 | | | 176 | | | 179 |
Impairment and other | | 80 | | | 112 | | | 172 | | | 117 | | | 65 |
Interest (expense) income, net | | (9 | ) | | (15 | ) | | (14 | ) | | (7 | ) | | 11 |
Other (expense) income, net | | (556 | ) | | (42 | ) | | 384 | | | 192 | | | 4 |
Net (loss) income attributable to Foot Locker, Inc. | | (330 | ) | | 342 | | | 893 | | | 323 | | | 491 |
Per Common Share Data: | | | | | | | | | |
Basic earnings | $ | (3.51 | ) | | 3.62 | | | 8.72 | | | 3.10 | | | 4.52 |
Diluted earnings | $ | (3.51 | ) | | 3.58 | | | 8.61 | | | 3.08 | | | 4.50 |
Common stock dividends declared per share | $ | 1.20 | | | 1.60 | | | 1.00 | | | 0.70 | | | 1.52 |
Weighted-average Common Shares Outstanding: | | | | | | | | | |
Basic earnings | | 94.2 | | | 94.3 | | | 102.5 | | | 104.3 | | | 108.7 |
Diluted earnings | | 94.2 | | | 95.5 | | | 103.8 | | | 105.1 | | | 109.1 |
Financial Condition: | | | | | | | | | | | | | | |
Cash and cash equivalents | $ | 297 | | | 536 | | | 804 | | | 1,680 | | | 907 |
Merchandise inventories | | 1,509 | | | 1,643 | | | 1,266 | | | 923 | | | 1,208 |
Property and equipment, net | | 930 | | | 920 | | | 917 | | | 788 | | | 824 |
Total assets | | 6,868 | | | 7,907 | | | 8,135 | | | 7,043 | | | 6,589 |
Long-term debt and obligations under capital leases | | 447 | | | 452 | | | 457 | | | 110 | | | 122 |
Total shareholders’ equity | | 2,890 | | | 3,293 | | | 3,243 | | | 2,776 | | | 2,473 |
Financial Ratios: | | | | | | | | | | | | | | |
Sales per average gross square foot (2) | $ | 510 | | | 548 | | | 540 | | | 417 | | | 510 |
SG&A as a percentage of sales | | 22.7 | % | | 21.8 | | | 20.7 | | | 21.0 | | | 20.6 |
Net (loss) income margin | | (4.0 | )% | | 3.9 | | | 10.0 | | | 4.3 | | | 6.1 |
Adjusted net income margin (3) | | 1.6 | % | | 5.4 | | | 8.4 | | | 3.9 | | | 6.7 |
Earnings (loss) before interest and taxes (EBIT) (3) | $ | (414 | ) | | 539 | | | 1,254 | | | 501 | | | 661 |
EBIT margin (3) | | (5.1 | )% | | 6.2 | | | 14.0 | | | 6.6 | | | 8.3 |
Adjusted EBIT (3) | $ | 214 | | | 692 | | | 1,049 | | | 428 | | | 722 |
Adjusted EBIT margin (3) | | 2.6 | % | | 7.9 | | | 11.7 | | | 5.7 | | | 9.0 |
Return on assets (ROA) | | (4.5 | )% | | 4.3 | | | 11.8 | | | 4.7 | | | 9.4 |
Return on invested capital (ROIC) (3) | | 3.8 | % | | 9.2 | | | 16.4 | | | 8.6 | | | 12.5 |
Current ratio | | 1.7 | | | 1.6 | | | 1.4 | | | 1.7 | | | 2.0 |
Other Data: | | | | | | | | | | | | | | |
Capital expenditures | $ | 242 | | | 285 | | | 209 | | | 159 | | | 187 |
Number of stores at year end | | 2,523 | | | 2,714 | | | 2,858 | | | 2,998 | | | 3,129 |
Total selling square footage at year end (in millions) | | 7.97 | | | 7.92 | | | 7.91 | | | 7.50 | | | 7.57 |
Total gross square footage at year end (in millions) | | 12.98 | | | 13.15 | | | 13.28 | | | 12.98 | | | 13.15 |
(1) | R2017 represented theesults for fiscal year 2023 reflect 53 weeks ended February 3, 2018.of operations as compared to 52 weeks for all other years presented. |
(2) | Calculated as store sales divided by the average monthly ending gross square footage of the last thirteen months. The computation for each of the years presented reflects the foreign exchange rate in effect for such year. The 2017 amount has been calculated excluding the sales of the 53rd week. |
| (3) | These represent non-GAAP measures, see Item 7, “Management’s"Management’s Discussion and Analysis of Financial Condition and Results of Operations”Operations" for additional information and calculation. |
(4) | Representstotal debt and obligations under leases, net of cash, and cash equivalents. For 2016 to 2018, this calculation includes the present value of operating leases prior to the adoption of the new lease accounting standard and therefore was considered a non-GAAP measure.calculation. |
20202023 Form 10-K Page
17
20
Item7. Management’sManagement’s Discussion and Analysis of Financial Condition and Results of Operations
This section of the Annual Report on Form 10-K generally discusses 20202023 and 20192022 detail and year-over-year comparisons between 2020 and 2019.these years. For a comparison of our results for 20192022 to our results of 20182021 and other financial information related to 2018,2021, refer to our Annual Report on Form 10-K for the year ended February 1, 2020January 28, 2023 filed with the SEC on March 27, 2020.2023.
Business Overview
Our Business
Foot Locker, Inc. leadsis a leading specialty retailer operating 2,523 stores in 26 countries across the celebrationNorth America, Europe, Australia, New Zealand, and Asia. We also have licensed store presence in the Middle East and Asia, with other geographies expected in 2024. Results for fiscal year 2023 reflect 53 weeks of operations as compared to 52 weeks for all other years presented.
Foot Locker, Inc. has a strong history of sneaker authority that sparks discovery and youthignites the power of sneaker culture around the globe through aits portfolio of brands, including Foot Locker, Lady Foot Locker, Kids Foot Locker, Champs Sports, Eastbay, Footaction,WSS, and Sidestep. Asatmos.
Overview of January 30, 2021, we operated 2,998 primarily mall-based stores, as well as stores in high-traffic urban retail areas and high streets, in 27 countries across the United States, Canada, Europe, Australia, New Zealand, and Asia. Our purpose is to inspire and empower youth culture around the world, by fueling a shared passion for self-expression and creating unrivaled experiences at the heart of the global sneaker community.Consolidated Results
Foot Locker, Inc. uses its omni-channel capabilities to bridge the digital world and physical stores, including order-in-store, buy online and pickup-in-store, and buy online and ship-from-store, as well as e-commerce. We operate websites and mobile apps aligned with the brand names
(in millions, except per share data) | 2023 | | 2022 | | 2021 | |
Sales | $ | 8,154 | | $ | 8,747 | | $ | 8,958 | |
Sales per average square foot | | 510 | | | 548 | | | 540 | |
Licensing revenue | | 14 | | | 12 | | | 10 | |
Gross margin | | 2,259 | | | 2,792 | | | 3,080 | |
Gross margin rate | | 27.7 | % | | 31.9 | % | | 34.4 | % |
Selling, general and administrative expenses ("SG&A") | | 1,852 | | | 1,903 | | | 1,851 | |
SG&A, as a percentage of sales | | 22.7 | % | | 21.8 | % | | 20.7 | % |
Income from operations | $ | 142 | | $ | 581 | | $ | 870 | |
(Loss) income from continuing operations before income taxes | $ | (423 | ) | $ | 524 | | $ | 1,240 | |
Net (loss) income attributable to Foot Locker, Inc. | $ | (330 | ) | $ | 342 | | $ | 893 | |
Diluted earnings per share | $ | (3.51 | ) | $ | 3.58 | | $ | 8.61 | |
| | | | | | |
Adjusted net income (non-GAAP) | $ | 134 | | $ | 473 | | $ | 755 | |
Adjusted diluted earnings per share (non-GAAP) | $ | 1.42 | | $ | 4.95 | | $ | 7.27 | |
Summary of our store banners (including footlocker.com, ladyfootlocker.com, kidsfootlocker.com, champssports.com, footaction.com, footlocker.ca, footlocker.eu (and related e-commerce sites in the various European countries that we operate) footlocker.com.au, footlocker.com.nz, sidestep-shoes.de, sidestep-shoes.nl, footlocker.mo, footlocker.hk, footlocker.sg, and footlocker.my). These sites offer some of the largest online product selections and provide a seamless link between e-commerce and physical stores. We also operate the websites for eastbay.com, final-score.com, and eastbayteamsales.com.2023 financial performance:
Segment Reporting
| | 2023 | | | 2022 | | | 2021 | |
Sales (decrease) increase | | | (6.8 | )% | | | (2.4 | )% | | | 18.7 | % |
Comparable-store sales (decrease) increase | | | (6.7 | )% | | | (1.9 | )% | | | 15.4 | % |
Our operating segments are identified according to how our business activities are managed and evaluated by our chief operating decision maker, our CEO. We have three operating segments, North America, Europe, Middle East, and Africa (“EMEA”), and Asia Pacific. Our North America operating segment includes the results of the following banners operating in the U.S. and Canada: Foot Locker, Kids Foot Locker, Lady Foot Locker, Champs Sports, and Footaction, including each of their related e-commerce businesses, as well as our Eastbay business that includes internet, catalog, and team sales. Our EMEA operating segment includes the results of the following banners operating in Europe: Foot Locker, Sidestep, and Kids Foot Locker, including each of their related e-commerce businesses. Our Asia Pacific operating segment includes the results of Foot Locker and Kids Foot Locker operating in Australia, New Zealand, and Asia as well as the related e-commerce businesses. We have further aggregated these operating segments into one reportable segment based upon their shared customer base and similar economic characteristics.
COVID-19
COVID-19 had a significant effect on overall economic conditions in the various geographic areas in which we have operations. Our top priority is to protect our team members and their families, our customers, and our operations. We have taken all precautionary measures as directed by health authorities and local, state, and national governments. In response to the COVID-19 pandemic, we temporarily closed our stores across all of our brands in North America, EMEA, and Asia Pacific throughout the year. The following represents a summary of the percentage of time that our stores were open, although there were significant regional variances by quarter and other restrictions that reduced operating hours as well:
| ● | Sales per square foot decreased to $510, from $548 per square foot in 2022, consistent with the overall sales decline of 6.8%. Excluding the effect of foreign currency fluctuations, sales decreased by 7.0% as compared to the prior-year period. |
| ● | Our footwear sales represented 81% of total sales, while apparel and accessory sales were 19%, reflecting a 1% increase in footwear sales compared to the prior year. |
| Period●
| Open daysOne of our strategic initiatives is improving our omni-channel capabilities. We are making ongoing investments in our omni-channel ecosystem, including our e-commerce experience and supply chain capabilities, in order to create seamless shopping experiences across all of our sales channels. During the year, we saw improvements in our e-commerce capabilities and the percentage of our direct-to-customers sales channel increased to 17.6% of total sales in 2023 as compared with 16.3% last year, excluding the sales from our Eastbay business that we closed in late 2022.
|
| First Quarter●
| 48 percentGross margin, as a percentage of sales, decreased to 27.7% as a result of increased promotions during 2023 and occupancy rate deleverage from the decline in sales. We prudently managed our markdowns to ensure that we ended the year with an improved inventory position.
|
| Second Quarter●
| 70 percentOur cost optimization program provided benefits, however it was not enough to offset the decline in sales and our strategic investments in technology and wages for our store team members. SG&A expenses were 22.7% of sales, an increase of 90 basis points as compared with the prior year.
|
Third Quarter
| 93 percent
|
Fourth Quarter
| 87 percent
|
Full Year
| 75 percent
|
We continue to monitor the outbreak of COVID-19 and other closures, or closures for a longer period of time, reduced operating hours, capacity limitations, and social distancing may be required to help ensure the health and safety of our team members and our customers. COVID-19 has and may continue to have an effect on ports and trade, as well as global travel.
20202023 Form 10-K Page
18
21
| ● | We continued to rationalize our portfolio of store brands and geographies to focus on our core banners. During 2023 we made significant progress, we completed the wind down of the Sidestep and atmos U.S. businesses, and we transitioned our businesses in Singapore and Malaysia to a license model. Additionally, we reduced our business in Asia by closing our operations in Hong Kong and Macau. |
| ● | During the year, we incurred costs to streamline our operations in Asia as well other non-cash charges related to our minority investments and our pension plan. See the "Other (Expense) Income," net section for further information. |
| ● | In 2023, we closed 270 stores, of which 83 related to our Champs Sports banner as we continued to shift this banner to focus serving the active athlete. Additional closures are anticipated in early 2024 to finalize the repositioning of this banner. Our closures were focused on stores that were underperforming and reflected the actions taken to rationalize our portfolio. |
| ● | Our focus for 2023 was an intentional investment and repositioning period and that is reflected in our results. Adjusted net income was $134 million, or $1.42 diluted earnings per share, as compared with adjusted net income of $473 million, or $4.95 diluted earnings per share, in the prior year. See the "Reconciliation of Non-GAAP Measures" section for detailed explanations of the various adjustments to our adjusted results. |
We have set up a special COVID-19 task force which is overseeing the necessary precautionary measures to protect the health and safety
Highlights of our team members as well as following the guidance provided by local health authorities.
Given the dynamic nature of these circumstances, the duration of business disruption, and reduced customer traffic, the related financial affect cannot be reasonably estimated at this time but may materially affect our businessposition for the full year of 2021.ended February 3, 2024 include:
| ● | We ended the year with cash and cash equivalents of $297 million at February 3, 2024. |
| ● | We reduced our merchandise inventories to $1.5 billion, or by 8.2%, as we focused on improving our inventory position. |
| ● | Net cash provided by operating activities was $91 million as compared with $173 million last year. This reflected lower net income, partially offset by a decrease in inventory. |
| ● | Cash capital expenditures during 2023 totaled $242 million and were primarily directed to the remodeling or relocation of 136 stores and the build-out of 79 new stores, as well as various technology and infrastructure projects. The new stores were focused on expanding our "Community," "House of Play," and "Power" stores, and we opened 69 stores bringing the total to 242 new concept stores operating as of the end of the fiscal year. Our capital plans for 2024 will continue to focus on the modernization of the store portfolio. |
| ● | During 2023, we returned $113 million of cash to our shareholders through dividends. As previously announced, the Company has paused dividends to increase balance sheet flexibility in support of longer-term strategic initiatives. We have embarked on a significant project to upgrade and update all of our enterprise planning systems, including e-commerce, supply chain, and financial systems. |
Reconciliation of Non-GAAP Measures
In addition to reporting our financial results in accordance with generally accepted accounting principles (“GAAP”("GAAP"), we report certain financial results that differ from what is reported under GAAP. In the following tables, we have presented certain financial measures and ratios identified as non-GAAP such as Earnings (Loss) Before Interest and Taxes (“EBIT”("EBIT"), adjusted EBIT, adjusted EBIT margin, adjusted income before income taxes, adjusted net income, adjusted net income margin, adjusted diluted earnings per share, Return on Invested Capital (“ROIC”("ROIC"), and free cash flow.
We present these non-GAAP measures because we believe they assist investors in comparing our performance across reporting periods on a consistent basis by excluding items that are not indicative of our core business or which affect comparability. These non-GAAP measures are also useful in assessing our progress in achieving our long-term financial objectives.
Additionally, we present certain amounts as excluding the effects of foreign currency fluctuations, which are also considered non-GAAP measures. Throughout the following discussions, where amounts are expressed as excluding the effects of foreign currency fluctuations, such changes are determined by translating all amounts in both years using the prior-year average foreign exchange rates. Presenting amounts on a constant currency basis is useful to investors because it enables them to better understand the changes in our businesses that are not related to currency movements.
We estimate the tax effect of the non-GAAP adjustments by applying a marginal rate to each of the respective items. The income tax items represent the discrete amount that affected the period.
The non-GAAP financial information is provided in addition to, and not as an alternative to, our reported results prepared in accordance with GAAP. Presented below is a reconciliation of GAAP and non-GAAP results discussed throughout this Annual Report on Form 10-K. All adjusted amounts exclude the loss from discontinued operations. Please see the non-GAAP reconciliations for free cash flow in the “"Liquidity and Capital Resources”" section.
Reconciliation:
| | | | | | | | | | |
($ in millions) | | 2020 | | 2019 | | 2018 | |
Pre-tax income: | | | | | | | | | | |
Income before income taxes | | $ | 494 | | $ | 672 | | $ | 713 | |
Pre-tax adjustments excluded from GAAP: | | | | | | | | | | |
Impairment and other charges (1) | | | 117 | | | 65 | | | 37 | |
Other income, net (2) | | | (190) | | | (4) | | | — | |
Adjusted income before income taxes (non-GAAP) | | $ | 421 | | $ | 733 | | $ | 750 | |
| | | | | | | | | | |
Calculation of Earnings Before Interest and Taxes (EBIT): | | | | | | | | | | |
Income before income taxes | | $ | 494 | | $ | 672 | | $ | 713 | |
Interest (expense)/income, net | | | (7) | | | 11 | | | 9 | |
EBIT | | $ | 501 | | $ | 661 | | $ | 704 | |
| | | | | | | | | | |
Adjusted income before income taxes | | $ | 421 | | $ | 733 | | $ | 750 | |
Interest (expense)/income, net | | | (7) | | | 11 | | | 9 | |
Adjusted EBIT (non-GAAP) | | $ | 428 | | $ | 722 | | $ | 741 | |
| | | | | | | | | | |
EBIT margin % | | | 6.6 | % | | 8.3 | % | | 8.9 | % |
Adjusted EBIT margin % | | | 5.7 | % | | 9.0 | % | | 9.3 | % |
Reconciliation of Non-GAAP Measures
($ in millions) | | 2023 | | | 2022 | | | 2021 | |
Pre-tax (loss) income: | | | | | | | | | | | | |
(Loss) income from continuing operations before income taxes | | $ | (423 | ) | | $ | 524 | | | $ | 1,240 | |
Pre-tax adjustments excluded from GAAP: | | | | | | | | | | | | |
Impairment and other (1) | | | 80 | | | | 112 | | | | 172 | |
Other expense / income, net (2) | | | 548 | | | | 41 | | | | (377 | ) |
Adjusted income before income taxes (non-GAAP) | | $ | 205 | | | $ | 677 | | | $ | 1,035 | |
| | | | | | | | | |
Calculation of Earnings (Loss) Before Interest and Taxes (EBIT): | | | | | | | | | | | | |
(Loss) income from continuing operations before income taxes | | $ | (423 | ) | | $ | 524 | | | $ | 1,240 | |
Interest expense, net | | | (9 | ) | | | (15 | ) | | | (14 | ) |
EBIT | | $ | (414 | ) | | $ | 539 | | | $ | 1,254 | |
| | | | | | | | | |
Adjusted income before income taxes | | $ | 205 | | | $ | 677 | | | $ | 1,035 | |
Interest expense, net | | | (9 | ) | | | (15 | ) | | | (14 | ) |
Adjusted EBIT (non-GAAP) | | $ | 214 | | | $ | 692 | | | $ | 1,049 | |
| | | | | | | | | |
EBIT margin % | | | (5.1 | )% | | | 6.2 | % | | | 14.0 | % |
Adjusted EBIT margin % | | | 2.6 | % | | | 7.9 | % | | | 11.7 | % |
| | | | | | | | | | | | | |
After-tax income: | | | | | | | | | | | | |
Net (loss) income attributable to Foot Locker, Inc. | | $ | (330 | ) | | $ | 342 | | | $ | 893 | |
After-tax adjustments excluded from GAAP: | | | | | | | | | | | | |
Impairment and other, net of income tax benefit of $18, $21, and $42, respectively (1) | | | 62 | | | | 91 | | | | 130 | |
Other expense / income, net of income tax (benefit) expense of ($142), ($9), and $99, respectively (2) | | | 406 | | | | 32 | | | | (278 | ) |
Net loss from discontinued operations, net of income tax benefit of $-, $1, and $-, respectively (3) | | | — | | | | 3 | | | | — | |
Tax reserves benefit / charge (4) | | | (4 | ) | | | 5 | | | | — | |
Tax benefits related to tax law rate changes (5) | | | — | | | | — | | | | (1 | ) |
Tax charge related to revaluation of certain intellectual property rights (6) | | | — | | | | — | | | | 11 | |
Adjusted net income (non-GAAP) | | $ | 134 | | | $ | 473 | | | $ | 755 | |
| | | | | | | | | |
Earnings per share: | | | | | | | | | | | | |
Diluted EPS | | $ | (3.51 | ) | | $ | 3.58 | | | $ | 8.61 | |
Diluted EPS amounts excluded from GAAP: | | | | | | | | | | | | |
Impairment and other (1) | | | 0.66 | | | | 0.95 | | | | 1.24 | |
Other expense / income, net (2) | | | 4.31 | | | | 0.33 | | | | (2.68 | ) |
Net loss from discontinued operations (3) | | | — | | | | 0.04 | | | | — | |
Tax reserves benefit / charge (4) | | | (0.04 | ) | | | 0.05 | | | | — | |
Tax benefits related to tax law rate changes (5) | | | — | | | | — | | | | (0.01 | ) |
Tax charge related to revaluation of certain intellectual property rights (6) | | | — | | | | — | | | | 0.11 | |
Adjusted diluted EPS (non-GAAP) | | $ | 1.42 | | | $ | 4.95 | | | $ | 7.27 | |
| | | | | | | | | |
Net (loss) income margin % | | | (4.0 | )% | | | 3.9 | % | | | 10.0 | % |
Adjusted net income margin % | | | 1.6 | % | | | 5.4 | % | | | 8.4 | % |
| | | | | | | | | | |
($ in millions) | | 2020 | | 2019 | | 2018 | |
After-tax income: | | | | | | | | | | |
Net income | | $ | 323 | | $ | 491 | | $ | 541 | |
After-tax adjustments excluded from GAAP: | | | | | | | | | | |
Impairment and other charges, net of income tax benefit of $24, $16, and $6, respectively (1) | | | 93 | | | 49 | | | 31 | |
Other income, net, net of income tax expense of $50, $-, and $- (2) | | | (140) | | | (4) | | | — | |
Tax charge related to revaluation of certain intellectual property
rights (3) | | | 25 | | | — | | | — | |
Tax expense/(benefit) related to tax law rate changes (4) | | | (5) | | | (2) | | | 4 | |
U.S. tax reform (5) | | | — | | | 2 | | | (28) | |
Income tax valuation allowances (6) | | | — | | | 2 | | | — | |
Tax benefit related to enacted change in foreign branch currency regulations (7) | | | — | | | — | | | (1) | |
Adjusted net income (non-GAAP) | | $ | 296 | | $ | 538 | | $ | 547 | |
| | | | | | | | | | |
Earnings per share: | | | | | | | | | | |
Diluted EPS | | $ | 3.08 | | $ | 4.50 | | $ | 4.66 | |
Diluted EPS amounts excluded from GAAP: | | | | | | | | | | |
Impairment and other charges (1) | | | 0.87 | | | 0.44 | | | 0.27 | |
Other income, net (2) | | | (1.33) | | | (0.04) | | | — | |
Tax charge related to revaluation of certain intellectual property
rights (3) | | | 0.24 | | | | | | | |
Tax expense/(benefit) related to tax law rate changes (4) | | | (0.05) | | | (0.02) | | | 0.04 | |
U.S. tax reform (5) | | | — | | | 0.02 | | | (0.25) | |
Income tax valuation allowances (6) | | | — | | | 0.03 | | | — | |
Tax benefit related to enacted change in foreign branch currency regulations (7) | | | — | | | — | | | (0.01) | |
Adjusted diluted EPS (non-GAAP) | | $ | 2.81 | | $ | 4.93 | | $ | 4.71 | |
| | | | | | | | | | |
Net income margin % | | | 4.3 | % | | 6.1 | % | | 6.8 | % |
Adjusted net income margin % | | | 3.9 | % | | 6.7 | % | | 6.9 | % |
Notes on Non-GAAP Adjustments:Adjustments
(1) | For 2020, 2019,2023, 2022, and 2018,2021, we recorded impairment and other charges of $117$80 million ($9362 million net ofafter tax), $65$112 million ($4991 million net ofafter tax), and $37$172 million ($31130 million net ofafter tax), respectively. See the "Impairment and Other ChargesOther" section for further information. |
(2) | During 2020, one2023, 2022, and 2021, we recorded other expense of our$548 million ($406 million after tax), and $41 million ($32 million after tax), and other income of $377 million ($278 million after-tax), respectively. These adjustments represent fair value and other changes in minority investments, which is measured usingpension settlement charges, and gains on sales of properties and businesses. See Note 5, "Other (Expense) Income, net" for further information. |
(3) | We recognized a charge to discontinued operations of $4 million ($3 million after tax) during the fair value measurement alternative, received additional funding in the thirdfourth quarter of 2020 at2022 related to the resolution of a higher valuation than our initial investment. Aslegal matter of a result,business we formerly operated. |
(4) | In the first quarter of 2023, we recorded a $190$4 million non-cash gain, or $140benefit related to income tax reserves due to a statute of limitations release. In the second quarter of 2022, we recorded a $5 million netcharge related to our income tax reserves due to the resolution of a foreign tax settlement. |
(5) | We recognized a tax charge of $1 million during the third quarterfourth quarters of 2020. In 2019, Other income, net represented a gain recorded2021 in connection with acquisition of a Canadian distribution center lease and related assets. The tax expense related to this transaction was largely offset bylaw changes in the release of a valuation allowance.Netherlands. |
(3)(6) | We recorded a $25 million tax charge related to the revaluation of certain intellectual property rights, pursuant to a non-U.S. advance pricing agreement. |
(4) | We recognized a tax benefitagreement of $5$11 million and $2 million during the fourth quarters of 2020 and 2019, respectively, and a tax expense of $4 million during the fourth quarter 2018 in connection with tax law changes in the Netherlands. |
(5) | On December 22, 2017, the United States enacted tax reform legislation that included a broad range of business tax provisions. In 2017, we recognized a $99 million provisional charge for the mandatory deemed repatriation of foreign sourced net earnings and a corresponding change in our permanent reinvestment assertion under ASC 740-30. During 2018, we reduced the provisional amounts by $28 million. This adjustment represented a $21 million reduction in the deemed repatriation tax and a $7 million benefit related to IRS accounting method changes and timing difference adjustments. In 2019, we recorded a charge for $2 million, which reflected an adjustment to U.S. tax on foreign income. We exclude the discrete U.S. tax reform effect from our Adjusted diluted EPS as it does not reflect our ongoing tax obligations under U.S. tax reform.2021. |
(6) | Valuation allowances were established against deferred tax assets associated with certain foreign tax losses. |
(7) | During 2018, the U.S. Treasury issued a notice that delayed the effective date of regulations under Internal Revenue Code Section 987.The effective date was further delayed by a notice issued in the fourth quarter of 2019 and third quarter of 2020. These regulations changed our method for determining the tax effects of foreign currency translation gains and losses for our foreign businesses that are operated as branches and are reported in a currency other than the currency of their parent. As a result of the delay in the effective date, we updated our calculations for the effect of these regulations, which resulted in an increase to deferred tax assets and a corresponding reduction in our income tax provision in the amount of $1 million in 2018. The adjustments recorded in 2020 and 2019 were not significant. |
Return on Invested Capital
ROIC is presented below and represents a non-GAAP measure. We believe ROIC is a meaningful measure because it quantifies how efficiently we generated operating income relative to the capital we have invested in the business. ROIC, subject to certain adjustments, is also used as a measure in executive long-term incentive compensation.
The closest U.S. GAAP measure to ROIC is Return on Assets (“ROA”) and is also presented below. ROA is calculated as net income attributable to Foot Locker, Inc. in the fiscal year divided by the two-year average of total assets. ROA decreased to 4.7 percent(4.5)% as compared with 9.4 percent4.3% in the prior year. This decrease reflected lowera net loss in 2023 as compared with net income and higher average total assets, primarily driven by an increase in cash and cash equivalents partially offset by lower merchandise inventories.
Prior to the adoption of the new lease standard in 2019, we adjusted our results to reflect our operating leases as if they qualified for finance lease treatment or as if the property were purchased. The presentation in 2018 did not reflect the requirements of the new lease standard. With the adoption of this standard, leases are now recorded on the Consolidated Balance Sheet, and therefore, certain adjustments are no longer required.2022. Our ROIC decreased to 8.6 percent3.8% in 2020,2023, as compared with 12.5 percent9.2% in the prior year. The overall decrease in ROIC reflected a decrease in adjusted return after taxes due to the lower profitability caused by the COVID-19 pandemic.in 2023.
| | | | | | | | | |
| | 2020 | | | 2019 | | | 2018 | |
ROA (1) | | 4.7 | % | | 9.4 | % | | 13.9 | % |
ROIC % | | 8.6 | % | | 12.5 | % | | 12.0 | % |
| | 2023 | | | 2022 | | | 2021 | |
ROA (1) | | | (4.5 | )% | | | 4.3 | % | | | 11.8 | % |
ROIC % | | | 3.8 | % | | | 9.2 | % | | | 16.4 | % |
(1) | Represents net (loss) income attributable to Foot Locker, Inc. of $323($330) million, $491$342 million, and $541$893 million divided by average total assets of $6,816$7,388 million, $5,205$8,021 million, and $3,891$7,589 million for 2020, 2019,2023, 2022, and 2018,2021, respectively. |
Calculation of ROIC:ROIC
| | | | | | | | | | |
($ in millions) | | 2020 | | 2019 | | 2018 | |
Adjusted EBIT | | $ | 428 | | $ | 722 | | $ | 741 | |
+ Rent expense (1) | | | — | | | — | | | 750 | |
- Estimated depreciation on capitalized operating leases (1) | | | — | | | — | | | (603) | |
+ Interest component of straight-line rent expense (2) | | | 158 | | | 173 | | | — | |
Adjusted net operating profit | | | 586 | | | 895 | | | 888 | |
- Adjusted income tax expense (3) | | | (167) | | | (236) | | | (241) | |
= Adjusted return after taxes | | $ | 419 | | $ | 659 | | $ | 647 | |
Average total assets (4) | | $ | 6,816 | | $ | 3,755 | | $ | 3,891 | |
- Average cash and cash equivalents | | | (1,294) | | | (899) | | | (870) | |
- Average non-interest bearing current liabilities | | | (819) | | | (720) | | | (690) | |
- Average merchandise inventories | | | (1,066) | | | (1,239) | | | (1,274) | |
+ Average estimated asset base of capitalized operating leases (1) | | | — | | | — | | | 2,989 | |
+ Average right-of-use assets (5) | | | — | | | 3,024 | | | — | |
+ 13‑month average merchandise inventories | | | 1,243 | | | 1,361 | | | 1,337 | |
= Average invested capital | | $ | 4,880 | | $ | 5,282 | | $ | 5,383 | |
ROIC % | | | 8.6 | % | | 12.5 | % | | 12.0 | % |
($ in millions) | 2023 | | 2022 | | 2021 | |
Adjusted EBIT | $ | 214 | | $ | 692 | | $ | 1,049 | |
+ Interest component of straight-line rent expense (1) | | 133 | | | 136 | | | 144 | |
Adjusted net operating profit | | 347 | | | 828 | | | 1,193 | |
- Adjusted income tax expense (2) | | (107 | ) | | (244 | ) | | (321 | ) |
+ Net loss attributable to noncontrolling interests | | — | | | 1 | | | 1 | |
= Adjusted return after taxes | $ | 240 | | $ | 585 | | $ | 873 | |
Average total assets | $ | 7,388 | | $ | 8,021 | | $ | 7,589 | |
- Average cash and cash equivalents | | (417 | ) | | (670 | ) | | (1,242 | ) |
- Average non-interest bearing current liabilities | | (927 | ) | | (1,109 | ) | | (1,060 | ) |
- Average merchandise inventories | | (1,576 | ) | | (1,455 | ) | | (1,095 | ) |
+ 13‑month average merchandise inventories | | 1,804 | | | 1,569 | | | 1,116 | |
= Average invested capital | $ | 6,272 | | $ | 6,356 | | $ | 5,308 | |
ROIC % | | 3.8 | % | | 9.2 | % | | 16.4 | % |
(1) | For 2018, the determination of the capitalized operating leases and the adjustments to income was calculated on a lease-by-lease basis and represented the best estimate of the asset base that would be recorded for operating leases as if they had been classified as finance leases or as if the property were purchased. No such adjustments are required for 2020 and 2019 since leases are accounted for on the Consolidated Balance Sheet after the adoption of the new leasing standard. |
(2) | Represents the add-back to operating income driven by the hypothetical interest expense we would incur if the property under our operating leases were owned or accounted for as finance leases. Calculated using the discount rate for each operating lease recorded as a component of rent expense. Operating lease interest is added back to adjusted net operating profit in the ROIC calculation to account for differences in capital structure between us and our competitors. |
(3)(2) | The adjusted income tax expense represents the marginal tax rate applied to adjusted net operating profit for each of the periods presented. |
(4) | For 2019, the amount represents the average total assets for 2019 and 2018, excluding the 2019 right-of-use assets of $2,899 million for comparability to prior periods. |
(5) | For 2019, the amount represents the average of the right-of-use assets as of February 1, 2020 and February 3, 2019 (the date of the adoption of the new lease standard) of $2,899 million and $3,148 million, respectively. |
Segment Reporting and Results of Operations
We have determined that we have three operating segments, North America, EMEA, and Asia Pacific. Our North America operating segment includes the results of the following banners operating in the U.S. and Canada: Foot Locker, Champs Sports, Kids Foot Locker, and WSS, including each of their related e-commerce businesses. Our EMEA operating segment includes the results of the Foot Locker and Kids Foot Locker banners operating in Europe, including each of their related e-commerce businesses. Our Asia Pacific operating segment includes the results of the Foot Locker banner and its related e-commerce business operating in Australia, New Zealand, and Asia, as well as atmos, which operates primarily in Asia. We have further aggregated these operating segments into one reportable segment based upon their shared customer base and similar economic characteristics.
As previously announced, during the second quarter of 2023, we ceased operating the Sidestep banner and closed the stores operating in Hong Kong and Macau. Additionally during the second quarter of 2023, we sold our Singapore and Malaysia businesses to our license partner. Our license partner now operates those stores under a licensing agreement. During the fourth quarter of 2023, we closed our atmos U.S. stores and e-commerce business.
Sales
Overview of Consolidated Results
| | | | | | | | | |
(in millions, except per share data) | | 2020 | | 2019 | | 2018 |
Sales | | $ | 7,548 | | $ | 8,005 | | $ | 7,939 |
Sales per average square foot | | | 417 | | | 510 | | | 504 |
Gross margin | | | 2,183 | | | 2,543 | | | 2,528 |
Selling, general and administrative expenses | | | 1,587 | | | 1,650 | | | 1,614 |
Depreciation and amortization | | | 176 | | | 179 | | | 178 |
| | | | | | | | | |
Operating Results | | | | | | | | | |
Division profit | | $ | 491 | | $ | 788 | | $ | 808 |
Less: Other charges | | | 117 | | | 65 | | | 37 |
Less: Corporate expense | | | 71 | | | 74 | | | 72 |
Income from operations | | | 303 | | | 649 | | | 699 |
Interest (expense) income, net | | | (7) | | | 11 | | | 9 |
Other income, net | | | 198 | | | 12 | | | 5 |
Income before income taxes | | $ | 494 | | $ | 672 | | $ | 713 |
| | | | | | | | | |
Net income | | $ | 323 | | $ | 491 | | $ | 541 |
Diluted earnings per share | | $ | 3.08 | | $ | 4.50 | | $ | 4.66 |
| | | | | | | | | |
Highlights of our 2020 financialComparable sales is a key performance include:
| ● | COVID-19 had a significant effect on overall economic conditions in the various geographic areas in which we have operations. In response to the COVID-19 pandemic,stores across all of our brands in North America, EMEA, and Asia Pacific were temporarily closed for various periods during the year. As a result of COVID-19, our stores were open for approximately 75 percent of operating days within 2020. While we attempted to mitigate the loss of sales by employing strategies such as buy on-line and pick-up in store or other curbside services, it was not enough to offset the decrease. Social unrest in the United States and Canada also affected our sales performance and affected our results due to the losses that were sustained. |
| ● | Footwear sales increased to 84 percent of total sales for 2020, as compared with 83 percent in the prior year. |
| ● | Our stores channel experienced decreases in sales due to the previously mentioned store closures and resulting reduced customer traffic to shopping centers and malls. |
| ● | Sales per square foot decreased to $417 reflecting store closures and related reduced customer traffic. |
| ● | Our direct-to-customers sales channel represented 27.8 percent of total sales in 2020, an increase from 16.1 percent in the prior year. Our ongoing investments in our omnichannel ecosystem, including supply chain capabilities, have been instrumental in delivering a seamless customer experience. |
| ● | As noted in the table below, sales and comparable sales both decreased due to closures of our stores throughout the year as a result of COVID-19. Our direct-to-customers channel generated significant increases which partially offset the sales declines in the stores channel. |
| | | | | | | |
| | 2020 | | 2019 | | 2018 | |
Sales (decrease)/increase | | (5.7) | % | 0.8 | % | 2.0 | % |
Comparable sales (decrease)/increase | | (5.9) | % | 2.2 | % | 2.7 | % |
| ● | Gross margin, as a percentage of sales, decreased to 28.9 percent as a result of increased promotions and the higher portion of direct-to-customer sales, which bear higher freight costs. |
| ● | SG&A expenses were 21.0 percent of sales, an increase of 40 basis points as compared with the prior year. The increase reflected lower sales and an increase in personal protective equipment costs, partially offset by governmental retention credits. |
| ● | Net income was $323 million, or $3.08 diluted earnings per share, which represented a decrease from the prior-year period. This decrease reflected lower sales and higher impairment charges, partially offset by an increase in other income. Adjusted net income was $296 million, or $2.81 diluted earnings per share, as compared with adjusted net income of $538 million, or $4.93 diluted earnings per share. |
Highlights of our financial positionindicator for the year ended January 30, 2021 include:
| ● | Due to the pandemic, we took various actions to enhance our liquidity, which included borrowing under our revolving credit facility and expense reductions across the organization, including lease concessions negotiated with landlords that reduced or deferred our lease-related payments, scaled-back merchandise inventory orders, extended payment terms with merchandise vendors, temporary workforce reductions, reduced capital spending, reduced salaries and deferred incentive compensation for the CEO and senior executives, and the suspension of our dividend payment in the second quarter, among other measures. |
| ● | We ended the year in a strong financial position. At year end, we had $1,580 million of cash and cash equivalents, net of debt. Cash and cash equivalents at January 30, 2021 were $1,680 million. Our ending cash balance was elevated, in part, due to the higher-than-normal accounts payable and accrued expenses due to timing of merchandise receipts. |
| ● | Net cash provided by operating activities was $1,062 million as compared with $696 million last year. |
| ● | During the year we amended our revolving credit facility, increasing it to a $600 million asset-based revolving credit facility maturing on July 14, 2025. No amounts were outstanding at January 30, 2021. |
| ● | Cash capital expenditures during 2020 totaled $159 million and were primarily directed to the remodeling or relocation of 80 stores, the build-out of 70 new stores, as well as other technology and infrastructure projects. |
| ● | During 2020, we returned $110 million of cash to our shareholders. Dividends totaling $73 million were declared and paid during 2020, and 968,547 shares were repurchased under our share repurchase program at a cost of $37 million. In February 2021, our Board of Directors approved a dividend of $0.20 per share payable on April 30, 2021. These initiatives demonstrate our commitment to delivering meaningful returns to our shareholders. |
Sales
us. All references to comparable-store sales for a given period relate to sales of stores that were open at the period-end and had been open for more than one year. The computation of consolidated comparable sales also includes direct-to-customers sales.sales as a result of our omnichannel strategy. We view our e-commerce business as an extension of our physical stores. Stores opened or closed during the period are not included in the comparable-store base; however, stores closed temporarily for relocation or remodeling are included. Stores that were temporarily closed due to the COVID-19 pandemic are also included in the computation of comparable-store sales. Computations exclude the effect of foreign currency fluctuations. Comparable-store sales for 2023 do not include sales from the 53rd week.
Sales from acquired businesses that include inventory are included in the computation of comparable-store sales after 15 months of operations. Accordingly, sales of WSS and atmos were included effective January 2023 and March 2023, respectively.
The information shown below represents certain sales metrics by sales channel:
| | | | | | | | | | |
($ in millions) | | 2020 | | 2019 | | 2018 | |
Stores | | | |
Sales | | $ | 5,447 | | $ | 6,720 | | $ | 6,714 | |
$ Change | | $ | (1,273) | | $ | 6 | | $ | 41 | |
% Change | | | (18.9) | % | | 0.1 | % | | 0.6 | % |
% of total sales | | | 72.2 | % | | 83.9 | % | | 84.6 | % |
Comparable sales (decrease)/increase | | | (19.3) | % | | 1.6 | % | | 1.1 | % |
| | | | | | | | | | |
Direct-to-customers | | | | | | | | | | |
Sales | | $ | 2,101 | | $ | 1,285 | | $ | 1,225 | |
$ Change | | $ | 816 | | $ | 60 | | $ | 116 | |
% Change | | | 63.5 | % | | 4.9 | % | | 10.5 | % |
% of total sales | | | 27.8 | % | | 16.1 | % | | 15.4 | % |
Comparable sales increase | | | 62.8 | % | | 5.6 | % | | 12.3 | % |
($ in millions) | | 2023 | | | 2022 | | | 2021 | |
Store sales | | $ | 6,751 | | | $ | 7,219 | | | $ | 7,029 | |
$ Change | | $ | (468 | ) | | $ | 190 | | | | |
% Change | | | (6.5 | )% | | | 2.7 | % | | | |
% of total sales | | | 82.8 | % | | | 82.5 | % | | | 78.5 | % |
Comparable sales (decrease) increase | | | (6.5 | )% | | | 3.7 | % | | | 25.8 | % |
| | | | | | | | | | | | | |
Direct-to-customer sales | | $ | 1,403 | | | $ | 1,528 | | | $ | 1,929 | |
$ Change | | $ | (125 | ) | | $ | (401 | ) | | | |
% Change | | | (8.2 | )% | | | (20.8 | )% | | | |
% of total sales | | | 17.2 | % | | | 17.5 | % | | | 21.5 | % |
Comparable sales decrease | | | (7.4 | )% | | | (21.2 | )% | | | (10.6 | )% |
| | | | | | | | | | | | | |
Total sales | | $ | 8,154 | | | $ | 8,747 | | | $ | 8,958 | |
$ Change | | $ | (593 | ) | | $ | (211 | ) | | | |
% Change | | | (6.8 | )% | | | (2.4 | )% | | | |
Comparable sales (decrease) increase | | | (6.7 | )% | | | (1.9 | )% | | | 62.8 | % |
In 2020,2023, sales decreased by 5.7 percent6.8% to $7,548$8,154 million from sales of $8,005$8,747 million in 2019.2022. Excluding the effect of foreign currency fluctuations, sales decreased by 6.3 percent7.0% as compared with 2019.2022. Results from 2023 include the effect of the 53rd week, which represented sales of $98 million.
| | Constant Currencies | | | Comparable Sales | |
Foot Locker | | | (2.7 | )% | | | (2.3 | ) |
Champs Sports | | | (22.2 | ) | | | (20.4 | ) |
Kids Foot Locker | | | 1.1 | | | | 0.2 | |
WSS | | | 6.0 | | | | (6.8 | ) |
Other | | | n.m. | | | | n.m. | |
North America | | | (8.5 | )% | | | (8.7 | ) |
Foot Locker | | | 1.0 | % | | | (0.8 | ) |
Sidestep | | | n.m. | | | | n.m. | |
EMEA | | | (3.1 | )% | | | (2.1 | ) |
Foot Locker | | | (3.1 | )% | | | 4.7 | |
atmos | | | 0.5 | | | | (2.1 | ) |
Asia Pacific | | | (2.0 | )% | | | 2.6 | |
Total Foot Locker, Inc. | | | (7.0 | )% | | | (6.7 | ) |
Comparable sales decreased by 5.9 percent6.7% as compared with the prior year. The overall comparableBy operating segment, North America and EMEA had decreases of 8.7% and 2.1%, respectively, while Asia Pacific generated an increase of 2.6%. Comparable sales decline was a result of store closures throughout the year necessitated by COVID-19, this was partially offset bydecreased in both our direct-to-customers channel,stores and direct-to-customer channels in 2023, due to ongoing macroeconomic headwinds as our customers become more discerning due to inflation and other cost pressures, which increased by 62.8 percentaffected customer traffic and conversion, as comparedwell as changing vendor mix coupled with the prior year. Our ongoing investments in our omnichannel ecosystem, including supply chain capabilities, have been instrumental in delivering a seamless customer experience resulting in our digital business representing 27.8 percentrepositioning of our sales for 2020. Our investments allowed us to leverage our direct-to customers business to continueChamps Sports banner. We are repositioning the Champs Sports banner to serve our customers achieving record daily volume levels.
Our EMEA and North America operating segments hadthe active athlete, which resulted in expected comparable sales declines whiledue to the transition.
For the combined channels, sales excluding foreign currency fluctuations, declined in all the regions we operate. North America sales were negatively affected by the closure of Eastbay business, which ceased operating in late 2022, as well as the repositioning of Champs Sports. Eastbay's sales primarily represent the other category, and excluding those sales the decline for North America would have been decline of 6.9%. Constant currency sales for EMEA decreased primarily from the closure of the Sidestep banner in the second quarter of 2023. Excluding the sales from the Sidestep banner, constant currency sales for our Asia PacificFoot Locker stores operating segment generated an increase. The decline in EMEA and North Americaincreased by 1.0%. Asia Pacific's sales decreased primarily came from the stores channel as a result of the temporary closures of our stores across all ofstrategic decisions to close our banners at various times during the year dueoperations in Hong Kong and Macau and to the pandemic.sell our Singapore and Malaysia operations to our licensing partner. Within North America, our Kids Foot Locker and Footaction business generated increases and our Champs Sports business was essentially flat with all other banners being negative. EMEA’s temporary store closures were for longer periods of time and therefore all banners operating in EMEA declined. Our Asia Pacific, operating segment increasescombined sales for our operations in Australia, New Zealand, and South Korea generated positive comparable sales. Our atmos operations were lednegatively affected by strong salesforeign currency fluctuations, however generated a positive increase excluding currency movements. On a comparable basis, atmos was negatively affected by declines in our Australia e-commerce business.availability of key styles and reduced tourism.
From a product perspective we experienced a declinefor the combined channels, the sales decrease in 2023 was across all product categories (footwear,footwear, apparel, and accessories) primarily due to closures necessitated by COVID-19. Sales of men’s basketball and women’s footwear were positive for the year. Additionally, our women’s apparel sales also generated an increase for the year.accessories.
Gross Margin
| | | | | | | |
| | 2020 | | 2019 | | 2018 | |
Gross margin rate | | 28.9 | % | 31.8 | % | 31.8 | % |
Basis point (decrease) increase in the gross margin rate | | (290) | | — | | 20 | |
Components of the change- | | | | | | | |
Merchandise margin rate (decline) / improvement | | (340) | | (30) | | 30 | |
Lower / (higher) occupancy and buyers’ compensation expense rate | | 50 | | 30 | | (10) | |
| | 2023 | | | 2022 | | | 2021 | |
Gross margin rate | | | 27.7 | % | | | 31.9 | % | | | 34.4 | % |
Basis point decrease in the gross margin rate | | | (420 | ) | | | (250 | ) | | | |
Components of the change: | | | | | | | | | |
Merchandise margin rate decline | | | (340 | ) | | | (240 | ) | | | |
Higher occupancy and buyers’ compensation expense rate | | | (80 | ) | | | (10 | ) | | | |
Gross margin is calculated as sales minus cost of sales. Cost of sales includes the cost of merchandise, freight, distribution costs including related depreciation expense, shipping and handling, occupancy and buyers’ compensation. Occupancy costs include rent (including fixed common area maintenance charges and other fixed non-lease components), real estate taxes, general maintenance, and utilities.
Overall, the
The gross margin rate decreased to 28.9 percent as compared with the prior year rate of 31.8 percent. The decline in the gross margin rate was due to increased promotions to remain competitive in the marketplace and to clear inventory, as well as the higher portion of direct-to-customer sales, which bear higher freight costs. The promotional stance was partially necessitated2023 by COVID-19 related store closures and our inability to return slow-moving inventory to our suppliers. Offsetting, in part, the higher promotional markdowns taken was increased supplier support, which positively affected the gross margin rate by 80420 basis points as compared withto the prior year.
year, reflecting higher promotional activity in the current marketplace and markdowns recorded to reduce overall inventory levels and improve aging. Other factors that negatively affected the rate were higher cost of merchandise and increased shrink. The occupancy rate was positively affected by COVID-19 related rent abatements. Duedeleverage reflected the fixed nature of these costs in relation to completed lease negotiations, we were able to record $67 millionthe decline in sales.
Selling, General and Administrative Expenses (SG&A)
| | | | | | | | | | |
($ in millions) | | 2020 | | 2019 | | 2018 | |
SG&A | | $ | 1,587 | | $ | 1,650 | | $ | 1,614 | |
$ Change | | $ | (63) | | $ | 36 | | $ | 113 | |
% Change | | | (3.8) | % | | 2.2 | % | | 7.5 | % |
SG&A as a percentage of sales | | | 21.0 | % | | 20.6 | % | | 20.3 | % |
($ in millions) | | 2023 | | | 2022 | | | 2021 | |
SG&A | | $ | 1,852 | | | $ | 1,903 | | | $ | 1,851 | |
$ Change | | $ | (51 | ) | | $ | 52 | | | | |
% Change | | | (2.7 | )% | | | 2.8 | % | | | |
SG&A as a percentage of sales | | | 22.7 | % | | | 21.8 | % | | | 20.7 | % |
SG&A decreased by $63$51 million, or 3.8 percent,2.7%, in 2020,2023, as compared with the prior year. As a percentage of sales, the SG&A rate increased by 4090 basis points as compared with 2019.2022. Excluding the effect of foreign currency fluctuations, SG&A decreased by $78$60 million, or 4.7 percent,3.2%, as compared with the prior year.
The increase in SG&A, as a percentage of sales, primarily reflected deleverage from the decline in sales, coupled with pressures from inflation and investments in front-line wages and technology aimed at improving the omnichannel experience and customer data analytics. Partially offsetting these increases were lower incentive compensation expense due to the Company's underperformance relative to targets and savings from our cost optimization program.
SG&A included CARES Act retention credits and similar governmental subsidies of $71 million, as we continued to pay our employees throughout most of the first quarter despite the temporary store closures. We also incurred incremental expenses of $14 million for personal protective equipment. We carefully managed expenses by reducing spending in all areas of the business, including marketing and travel, among other categories.
Depreciation and Amortization
| | | | | | | | | | |
($ in millions) | | 2020 | | 2019 | | 2018 | |
Depreciation and amortization | | $ | 176 | | $ | 179 | | $ | 178 | |
$ Change | | $ | (3) | | $ | 1 | | $ | 5 | |
% Change | | | (1.7) | % | | 0.6 | % | | 2.9 | % |
($ in millions) | | 2023 | | | 2022 | | | 2021 | |
Depreciation and amortization | | $ | 199 | | | $ | 208 | | | $ | 197 | |
$ Change | | $ | (9 | ) | | $ | 11 | | | | | |
% Change | | | (4.3 | )% | | | 5.6 | % | | | |
Capital expenditures were reduced at the onset of the COVID-19 pandemic and this contributed to the $3 million reduction in depreciationDepreciation and amortization in 2020decreased by $9 million as compared with 2019.the prior year. Excluding the effect of foreign currency fluctuations, depreciation and amortization decreased by $5$10 million as compared withprimarily due operating fewer stores and the effect from impairments recorded in the current and prior year.
Operating Results
Division profit was $491$264 million, or 6.5 percent3.2% of sales in 2020.2023. This compares with $788 million,$844 or 9.8 percent9.6% of sales, for the prior year. The decrease was driven by both sales channels experiencing declines in sales coupled with lower gross margins due to the promotional environment and deleveraging expenses, while cost-cutting program benefits were not enough to offset the decline wasin sales.
Impairment and Other
For 2023, impairment and other included impairment charges of $30 million from a review of underperforming stores and accelerated tenancy charges on right-of-use assets for closures of the Sidestep banner, certain Foot Locker Asia stores, and our U.S. atmos stores. Additionally, we incurred transformation consulting expense of $27 million and reorganization costs of $17 million primarily related to severance and the closures of the Sidestep banner, certain Foot Locker Asia stores, channel and wasa North American distribution center. The results for 2023 also included intangible asset impairment of $9 million on an atmos tradename, partially offset by an increasea $4 million reduction in our direct-to-customers channel. Our direct-to-customers channel improved its gross marginsthe fair value of the atmos contingent consideration.
For 2022, impairment and both channels significantly reduced operating costs as mitigation for the lossother charges included $58 million of sales caused by the COVID-19 pandemic.
Impairment and Other Charges
Due to COVID-19 and its effect on our actual and projected results, during the first quarterimpairment of 2020 we determined that a triggering event occurred for certain underperforming stores operating in Europe and, therefore, we conducted an impairment review. We evaluated the long-lived assets including theand right-of-use assets and recorded non-cashaccelerated tenancy charges, $42 million of $15transformation consulting, $22 million to write down store fixtures, leasehold improvements, and right-of-use assets of 70 stores. During the fourth quarter of 2020, we conducted an additional impairment review for approximately 90 underperforming stores. We evaluated the long-lived assets, including the right-of-use assets and recorded non-cash charges of $62 million to write down store fixtures, leasehold improvements, and right-of-use assets for approximately 60 of those stores.
Lossesprimarily severance costs related to social unrest represented inventory losses, damagesa reorganization, $9 million of litigation costs related to store property, repairs,an employment matter, $8 million of Sidestep tradename asset impairment, and other$4 million of acquisition integration costs, incurredpartially offset by a $31 million reduction in connection with the riots that affected certain partsfair value of the United States and Canada during 2020 and resulted in a loss of $18 million. Approximately 140 stores were damaged due to the unrest. The total charge included inventory losses of $15 million, damages to store property of $1 million, and repairs and other costs of $2 million. During the fourth quarter, we recorded a partial insurance recovery of $10 million. We are continuing to work with our insurers to determine the remaining amount of our covered losses under our property insurance policy. Additional insurance recoveries will be recorded in the period in which we conclude our settlement discussions with our insurance providers. atmos contingent consideration liability.
In May 2020, we made the strategic decision to shut down our Runners Point business and to consolidate our Sidestep support staff into our other operations in Europe. Also, as part of the next phase of the Champs Sports and Eastbay strategic initiative, we restructured positions and aligned several functions across the banners and consolidated certain Eastbay operations into Champs Sports. We recorded charges of $19 million related to the shutdown of the Runners Point business and $3 million related to the reorganization associated with Eastbay. We also recorded a charge of $4 million in connection with the reorganization of certain support functions and supply chain operations within our EMEA segment.
During 2020, we recorded charges totaling $4 million related to the write-down of one of our minority investments and we incurred $2 million related to the pension matter and related plan reformation.
See Note 3, 4, "Impairment and Other ChargesOther" for additional information.
Corporate Expense
| | | | | | | | | |
($ in millions) | | 2020 | | 2019 | | 2018 |
Corporate expense | | $ | 71 | | $ | 74 | | $ | 72 |
$ Change | | $ | (3) | | $ | 2 | | $ | 24 |
($ in millions) | | 2023 | | | 2022 | | | 2021 | |
Corporate expense | | $ | 42 | | | $ | 151 | | | $ | 129 | |
$ Change | | $ | (109 | ) | | $ | 22 | | | | |
Corporate expense consists of unallocated general and administrative expenses as well as depreciation and amortization related to our corporate headquarters, centrally managed departments, unallocated insurance and benefit programs, certain foreign exchange transaction gains and losses, and other items. Depreciation and amortization included in corporate expense was $24 million, $19 million, and $18 million in 2020, 2019, and 2018, respectively.
The allocation of corporate expense to the operating divisions is adjusted annually based upon an internal study; accordingly, the allocation increased by $28study.
Depreciation and amortization included in corporate expense was $36 million and $39 million in 2020, thus reducing corporate expense.2023 and 2022, respectively. Excluding the corporate allocation change,changes in depreciation and amortization, corporate expense increased by $25 million as compared with 2019. This increase wasdecreased primarily due to higheran increase in the allocation of corporate expense to the banners in 2023 and lower incentive compensation expense.expense, including share-based compensation expense that is tied to performance, partially offset by our ongoing investments in information technology.
2020 Form 10-K Page 25Interest Expense, net
($ in millions) | | 2023 | | | 2022 | | | 2021 | |
Interest expense | | $ | (24 | ) | | $ | (24 | ) | | $ | (17 | ) |
Interest income | | | 15 | | | | 9 | | | | 3 | |
Interest expense, net | | $ | (9 | ) | | $ | (15 | ) | | $ | (14 | ) |
Weighted-average interest rate (excluding fees) | | | 3.9 | % | | | 3.8 | % | | | 4.8 | % |
Interest (Expense) Income, net
| | | | | | | | | | |
($ in millions) | | 2020 | | 2019 | | 2018 | |
Interest expense | | $ | (13) | | $ | (10) | | $ | (11) | |
Interest income | | | 6 | | | 21 | | | 20 | |
Interest (expense) income, net | | $ | (7) | | $ | 11 | | $ | 9 | |
Weighted-average interest rate (excluding fees) | | | 6.6 | % | | 6.9 | % | | 7.0 | % |
We recorded net interest expense of $7$9 million in 2020 as2023, compared with net interest income of $11to $15 million in 2019.2022. Interest income decreased as a result of lower averageincreased primarily due to higher interest rates earned on our cash and cash equivalents. Additionally,equivalents coupled with higher interest expense increased due to the drawdown of the revolving credit facility in March 2020 and higher costs related to the new revolving credit facility. In the first quarter of 2020, we borrowed $330 million ofearned on our credit facility which was repaid in full during the second quarter of 2020.cross-currency swap.
Other (Expense) Income, net
| | | | | | | | | | |
($ in millions) | | 2020 | | 2019 | | 2018 | |
Other income, net | | $ | 198 | | $ | 12 | | $ | 5 | |
Other income, net
($ in millions) | | 2023 | | | 2022 | | | 2021 | |
Other (expense) income, net | | $ | (556 | ) | | $ | (42 | ) | | $ | 384 | |
This caption generally includes non-operating items, franchise royalty income, gains associated with disposal of property,including changes in fair value premiums paid, and realizedof minority investments measured at fair value or using the fair value measurement alternative, gains associated with foreign currency option contracts,on sales of businesses or assets, changes in the market value of our available-for-sale security, premiums paidour share of earnings or losses related to repurchaseour equity method investments, and retire bonds, changes in value fornet benefit (expense) related to our investmentspension and postretirement programs excluding the service cost component.
During 2023, we recorded an impairment of $478 million on a minority investment due to the decreased valuation resulting from the investee's underperformance and continued losses. The minority investment is accounted for using the fair value measurement alternative, which is at cost adjusted for changes in observable prices minus impairment our shareunder the practicability exception. We assess the carrying value of earningsthis investment for impairment whenever events or circumstances indicate that the carrying value may not be recoverable, and consider factors including, but not limited to, expected cash flows, underperformance relative to its plans and continued losses related to our equity method investments, and net benefit expense or income related to our pension and postretirement programs, excludingof the service cost component.
One of our minority investments, which is measured usinginvestee. We estimated the fair value measurement alternative, received additional funding atusing both a higher valuation thandiscounted cash flow approach and a market approach, which consider forecasted cash flows provided by the investee's management, as well as assumptions over discount rates, terminal values, and selected comparable companies.
During the fourth quarter of 2023, as part of efforts to reduce our initial investment. Aspension plan obligations, we transferred approximately $109 million of our U.S. Qualified pension plan registered assets and liabilities to an insurance company through the purchase of a result,group annuity contract, under which an insurance company is required to directly pay and administer pension payments to certain of our pension plan participants, or their designated beneficiaries. In connection with this transaction, we recorded a $190non-cash pretax settlement charge of $75 million. This settlement charge accelerated the recognition of previously unrecognized losses in "Accumulated Other Comprehensive Loss."
During 2022, we sold our investment in a publicly traded stock, Retailors, Ltd. for a loss of $62 million, non-cash gain during the third quarter of 2020. Other income, net also included $6offset by $1 million of royaltydividend income. Partially offsetting the loss was a $19 million gain on the divestiture of our Team Sales business.
See Note 5, "Other (Expense) Income, net" for additional information.
Income Taxes
($ in millions) | | 2023 | | | 2022 | | | 2021 | |
Income tax (benefit) expense | | $ | (93 | ) | | $ | 180 | | | $ | 348 | |
Effective tax rate | | | 22.0 | % | | | 34.3 | % | | | 28.1 | % |
We recorded an income $5 milliontax benefit of net benefit income relating to our pension and post retirement programs. This income was partially offset by $2$93 million in premiums paid2023, or an effective rate of 22.0%, as compared with income tax expense of $180 million or 34.3% in connection with2022. The change in the repurchase and retirement of bonds and a $1 million loss related to our equity method investments.
Income Taxes
Our effective tax rate for 2020 was 34.5 percent,reflected several factors, including the effects of non-deductible losses, as compared with 27.0 percentwell as the level and geographic mix of income. The effective tax rate in 2019. The increase was primarily due to valuation allowances for losses in certain foreign jurisdictions and2023 included a $25 million200-basis point deferred tax charge related toasset adjustment which negatively affected the revaluation of certain intellectual property rights pursuant to a non-U.S. advance pricing agreement. Additionally, during the fourth quarters of 2020 and 2019, we recorded tax benefits of $5 million and $2 million, respectively, in connection with tax law changes in the Netherlands.rate.
We regularly assess the adequacy of provisions for income tax contingencies in accordance with the applicable authoritative guidance on accounting for income taxes. As a result, reserves for unrecognized tax benefits may be adjusted due to new facts and developments, such as changes to interpretations of relevant tax law, assessments from taxing authorities, settlements with taxing authorities, and lapses of statutes of limitations. We recorded a $4 million reserve release in 2023 from a statute of limitations expiration on our foreign income taxes, as well as other various reserve releases totaling $4 million due to settlements of international tax examinations. During 2022, we recorded a $5 million charge related to our income tax reserves due to the resolution of a foreign tax settlement. Partially offsetting this charge in 2022 were tax benefits totaling $3 million from reserves releases due to various statute of limitation lapses. The changes in the tax reserves were not significant in 2020 and 2019.2021.
On March 27, 2020,August 16, 2022, President Biden signed the Coronavirus Aid, Relief, and Economic SecurityInflation Reduction Act (the “CARES Act”("IRA") was signedof 2022 into law in the U.S. to provide certain relief aslaw. The IRA contains a resultnumber of the COVID-19 pandemic. On December 27, the Consolidations Appropriations Act, 2021 (“CAA”) was signed into law to fund the federal government through the end of the fiscal year, provide further COVID-19 economic relief, and extend certain expiring tax provisions. In addition, governments around the world enacted or implemented various forms of tax relief measures in responserevisions to the economic conditionsInternal Revenue Code, including a 15% corporate minimum tax and a 1% excise tax on corporate stock repurchases in tax years beginning after December 31, 2022. We do not currently expect the wake of COVID-19. We are required to recognize the effects ofIRA tax law changes in the period of enactment. Weprovisions will have assessed the applicability of the CARES Act & CAA, (combined as “Acts”), and changes to income tax laws or regulations in other jurisdictions and determined there is noa significant effect on our overall effective tax rate. There were no share repurchases during 2023, thus no incremental excise tax paid.
The Organization for Economic Co-operation and Development Pillar Two guidelines published to date include transition and safe harbor rules around the implementation of the Pillar Two global minimum tax of 15%. Based on current enacted legislation effective in 2024 and our structure, we do not currently expect a significant effect on our overall effective tax rate for 2024. We are monitoring developments and evaluating the effects that these new rules will have on our future effective income tax provision for the year ended January 30, 2021. We continue to assess the effectrate, tax payments, financial condition, and results of the Acts and ongoing government guidance related to COVID-19 that may be issued.operations.
Liquidity and Capital Resources
Liquidity
Our primary source of liquidity has been cash flow from operations, while the principal uses of cash have been to fund inventorypay down liabilities and other working capital requirements; finance capital expenditures related to store openings, store remodelings, internet and mobile sites, information systems, and other support facilities; make retirement plan contributions, quarterly dividend payments,payments; and interest payments; and fund other cash requirements to support the development of our short-term and long-term operating strategies. We generally finance real estate with operating leases. We believe our cash, cash equivalents, future cash flow from operations, and amounts available under our credit agreement will be adequate to fund these requirements.
We may also repurchase our common stock through open market purchases, privately negotiated transactions, or otherwise.otherwise, including through Rule 10b5-1 trading plans. Such repurchases if any, will depend on prevailing market conditions, liquidity requirements, contractual restrictions, and other factors. The amounts involved may be material. As of January 30, 2021, approximately $830 million remained available under our current $1.2 billion share repurchase program.
InOn February 2021,24, 2022, the Board of Directors declaredapproved a quarterlyshare repurchase program authorizing the Company to repurchase up to $1.2 billion of its common stock. The new share repurchase program does not have an expiration date and as of February 3, 2024, approximately $1.1 billion remained available. Our board’s authorization of the share repurchase program does not obligate us to acquire any particular amount of common stock, and the repurchase program may be commenced, suspended, or discontinued at any time.
The Board of Directors regularly reviews the dividend of $0.20 per share to be paid on April 30, 2021, representing a 33 percent increase overpolicy and rate, taking into consideration the previous quarterly per share amount.
In January 2022, we will repay the $98 million principal outstandingoverall financial and strategic outlook of our 8.5 percent debentures.earnings, liquidity, and cash flow. We do not currently expect to pay dividends to allow us to invest in our strategic priorities, such as modernizing our technology infrastructure and stores.
Any material adverse change in customer demand, fashion trends, competitive market forces, or customer acceptance of our merchandise mix and retail locations, uncertainties related to the effect of competitive products and pricing, our reliance on a few key suppliers for a significant portion of our merchandise purchases and risks associated with global product sourcing, economic conditions worldwide, the effects of currency fluctuations, uncertainties caused by COVID-19, as well as other factors listed under the heading “Disclosure Regarding Forward-Looking Statements,” could affect our ability to continue to fund our liquidity needs from business operations.
Maintaining access to merchandise that we consider appropriate for our business may be subject to the policies and practices of our key suppliers. Therefore, we believe that it is critical to continue to maintain satisfactory relationships with these key suppliers. We purchased approximately 91 percent84% and 86% of our merchandise from our top five suppliers in both 20202023 and 2019 and expect to continue to obtain a significant percentage of our athletic product from these suppliers in future periods.2022, respectively. Approximately 75 percent and 71 percent65% was purchased from one supplier, Nike, Inc., in 2020both 2023 and 2019, respectively.2022.
Planned capital expenditures in 20212024 are $275 million. Included in the planned amount$285 million, of which $200 million is $160 million dedicated to real estate projects designed to elevate our customers’ in-store experience. The real estate totalThis includes the remodeling or expansionupdating of approximately 130400 existing stores as well asto our current design standards and will incorporate key elements of our current brand design specifications. Spending for 2024 also includes the planned opening of approximately 10020 new WSS stores includingand 15 new Foot Locker and Kids Foot Locker stores, representing the continued expansion of our off-mall community-based and “power” store formats, which provide pinnacle retail experiences that deliver connected customer interactions through service, experience, product, and a sense of community. The real estate total also includes continued expansion in Asia. Finally, the capital plan for 20212023 also includes $115$85 million primarily for digitalour technology and supply chain initiatives. As showninitiatives, including capital expenditures related to two new distribution centers. We also expect to spend an additional $60 million in 2020,software-as-a-service implementation costs related to our technology initiatives as we modernize our enterprise resource planning tools including e-commerce, supply chain, and finance. We have the ability to revise and reschedule muchsome of the anticipated capital expenditurespending program should our financial position require it.
Operating Activities
| | | | | | | | | |
($ in millions) | | 2020 | | 2019 | | 2018 |
Net cash provided by operating activities | | $ | 1,062 | | $ | 696 | | $ | 781 |
$ Change | | $ | 366 | | $ | (85) | | $ | (32) |
($ in millions) | | 2023 | | | 2022 | | | 2021 | |
Net cash provided by operating activities | | $ | 91 | | | $ | 173 | | | $ | 666 | |
$ Change | | $ | (82 | ) | | | | | | |
The amount provided by operating activities reflects net (loss) income adjusted for non-cash items and working capital changes. Adjustments to net income for non-cash items include non-cash gains, non-cash impairment and other, charges,pension settlement charge, fair value adjustments to our minority investments, depreciation and amortization, deferred income taxes, and share-based compensation expense. The decrease in cash from operating activities reflected lower net income, partially offset by timing of merchandise purchases and payments of accounts payable, as compared to the prior year.
Investing Activities
($ in millions) | | 2023 | | | 2022 | | | 2021 | |
Net cash used in investing activities | | $ | (222 | ) | | $ | (162 | ) | | $ | (1,376 | ) |
$ Change | | $ | (60 | ) | | | | | | |
The increase in cash provided by operatingused in investing activities primarily reflected lower capital expenditures coupled with the prior-year sale of one of our minority investments and a sale of a business.
Capital expenditures in 2020 compared with2023 decreased to $242 million from $285 million in the prior year, reflected higher inflows associated with working capital changes, partially offset by lower net income and a non-cash gain. In responsewhich was elevated as several large projects related to the COVID-19 pandemic we carefully managed our inventory levels. We2021 were also affected by lack of available inventory caused, in part, by slowdownspaid in the supply chain environment.first quarter of 2022. During 2020, we did not make any contributions to our U.S. qualified pension plan, as compared with $55 million made in 2019. No U.S. qualified pension plan contributions were required during 2020 due to the strong funded position of the plan. The amounts and timing of pension contributions are dependent on several factors, including asset performance.
As of January 30, 2021, we have withheld approximately $24 million of lease and lease-related payments as we continue to negotiate rent deferrals or abatements with our landlords for the period that our stores were closed due to the COVID-19 pandemic.
Cash paid for income taxes was $100 million, $201 million, and $184 million for 2020, 2019, and 2018, respectively.
Investing Activities
| | | | | | | | | |
($ in millions) | | 2020 | | 2019 | | 2018 |
Net cash used in investing activities | | $ | 168 | | $ | 235 | | $ | 274 |
$ Change | | $ | (67) | | $ | (39) | | $ | (15) |
Capital expenditures in 2020 decreased to $159 from $187 in the prior year. During 2020,2023, we completed the remodeling or relocation of 82136 existing stores, the build-out of 79 new stores, and openedmade progress on the development of information systems, websites, and infrastructure, including supply chain initiatives. During 2023 we made meaningful progress as we continue to implement our strategic initiative to power-up our portfolio of stores. Capital expenditures in 2023 included 69 new stores.stores in our "power" or "community" doors concept, bringing the total to 242 in operation as of February 3, 2024.
Investing activities
During 2023, we sold our businesses operating in Singapore and Malaysia for 2020 includedtotal cash outflowsconsideration of $9$24 million, related to variousor $16 million net of $8 million of cash in the business. We also sold a corporate office property in North America for proceeds of $6 million. Additionally, we invested $2 million and $5 million in 2023 and 2022, respectively, in minority investments with various limited partner venture capital funds managed by Black fund managers, who are committed to advancing diverse-led businesses as compared with $50part of our Leading in Education and Economic Development (LEED) initiative.
During 2022, we sold our investment in a public entity (Retailors, Ltd.) generating cash of $83 million in 2019.and dissolved a joint venture for proceeds of $12 million. Also included in 2019 is a $2 million inflow related to the saleduring 2022, we sold our Eastbay Team Sales business receiving proceeds of a building. $47 million.
Financing Activities
| | | | | | | | | |
($ in millions) | | 2020 | | 2019 | | 2018 |
Net cash used in financing activities | | $ | 126 | | $ | 493 | | $ | 527 |
$ Change | | $ | (367) | | $ | (34) | | $ | (89) |
($ in millions) | | 2023 | | | 2022 | | | 2021 | |
Net cash used in financing activities | | $ | (120 | ) | | $ | (279 | ) | | $ | (152 | ) |
$ Change | | $ | 159 | | | | | | | |
Cash used in financing activities consisted primarily of our return to shareholders initiatives, including ouras follows:
($ in millions) | | 2023 | | | 2022 | | | 2021 | |
Dividends paid on common stock | | $ | 113 | | | $ | 150 | | | $ | 101 | |
Share Repurchases | | | — | | | | 129 | | | | 348 | |
Total returned to shareholders | | $ | 113 | | | $ | 279 | | | $ | 449 | |
We declared and paid $113 million in dividends representing a quarterly rate of $0.40 per share repurchase programpaid out in the first, second and cash dividend payments,third quarters of 2023, as follows:
| | | | | | | | | |
($ in millions) | | 2020 | | 2019 | | 2018 |
Share repurchases | | $ | 37 | | $ | 335 | | $ | 375 |
Dividends paid on common stock | | | 73 | | | 164 | | | 158 |
Total returned to shareholders | | $ | 110 | | $ | 499 | | $ | 533 |
During 2020, we repurchased 968,547compared with $129 million in dividends in 2022, representing a quarterly rate of $0.40 per share paid out in each quarter in the prior year. No shares of our common stock underwere repurchased pursuant to our share repurchase programs for $37 million. Additionally, we declared andprogram during 2023, as compared with $129 million repurchased during 2022. We paid dividends of $73$10 million representing an annual rate of $0.70 per share in 2020.
In the first quarter of 2020, we borrowed $330 million of our then-existing revolving credit facility, which was repaid in full during the second quarter of 2020. In July 2020, we entered into a new $600 million revolving credit agreement and in connection with this transaction we paid fees of $4 million. During the year, we purchased and retired $20 million of our outstanding bonds for $22 million. Additionally, we paid $1 million in connection with our finance lease obligations.
During the year, we entered into an agreement with one of our franchisors to operate a limited number of Foot Locker stores in Europe. We have operational control of the new entity and have continued to consolidate the results of the joint venture. We received contributions of $6 million in connection with this agreement.
During 2020, we paid $1 million2023 to satisfy tax withholding obligations relatingrelated to the vesting of share-based equity awards. Offsetting
From November 3, 2023 through December 5, 2023, in order to fund working capital needs for the holiday selling season, we borrowed varying amounts above were proceeds received from the issuanceunder our credit facility, with $146 million of common stockaggregate borrowings and treasury stock in connection with the employee stock programsno more than $89 million outstanding during that time. No borrowings remained outstanding as of $6 million for 2020.February 3, 2024.
Free Cash Flow (non-GAAP measure)
In addition to net cash provided by operating activities, we use free cash flow as a useful measure of performance and as an indication of our financial strength and our ability to generate cash. We define free cash flow as net cash provided by operating activities less capital expenditures (which is classified as an investing activity). We believe the presentation of free cash flow is relevant and useful for investors because it allows investors to evaluate the cash generated from underlying operations in a manner similar to the method used by management. Free cash flow is not defined under U.S. GAAP. Therefore, it should not be considered a substitute for income or cash flow data prepared in accordance with U.S. GAAP and may not be comparable to similarly titled measures used by other companies. It should not be inferred that the entire free cash flow amount is available for discretionary expenditures.
The following table presents a reconciliation of net cash flow provided by operating activities, the most directly comparable U.S. GAAP financial measure, to free cash flow.
| | | | | | | | |
($ in millions) | | 2020 | | 2019 | | 2018 | | 2023 | | 2022 | | 2021 | |
Net cash provided by operating activities | | $ | 1,062 | | $ | 696 | | $ | 781 | | $ | 91 | | | $ | 173 | | | $ | 666 | |
Capital expenditures | | | (159) | | | (187) | | | (187) | |
Free cash flow | | $ | 903 | | $ | 509 | | $ | 594 | | $ | (151 | ) | | $ | (112 | ) | | $ | 457 | |
Capital Structure
On July 14, 2020, we amended our then-existing revolving
We maintain a credit agreement to providefacility for working capital and general corporate purposes. We currently have a $600 million asset-based revolving credit facility that is scheduled to matureexpire on July 14, 2025 (as amended, “2020 Credit Agreement”). Under the 2020 Credit Agreement interest is determined, at our option, by either (1) the eurodollar rate, which is determined by reference to LIBOR, plus a margin2025. No borrowings were outstanding as of 1.75 percent to 2.25 percent per annum, or (2) the base rate, which is determined by reference to the federal funds rate, plus a marginFebruary 3, 2024. The amount of 0.75 percent to 1.25 percent, in each case. In addition, we are paying a commitment fee of 0.50 percent per annum on the unused portion of the commitments under the 2020 Credit Agreement.
The 2020 Credit Agreement provides for a security interest in certain of our and the Guarantors’ (as defined in the 2020 Credit Agreement) domestic assets, including inventory, accounts receivable, cash deposits, and certain insurance proceeds. If certain specified events of default have occurred and are continuing, or ifborrowing availability under the 2020 Credit Agreementour credit facility is less than or equal toreduced by the greater of $60 million and 10 percent of the Loan Cap (as defined in the 2020 Credit Agreement), we are required to test compliance with a minimum consolidated fixed charge coverage ratio of 1.00 to 1.00 as of the end of each fiscal quarter. No events of default occurred during 2020.
As long as certain payment conditions are satisfied, including (a) the absence of any default or event of default has occurred availability under the 2020 Credit Agreement is not less than 15 percent of the lesser of the aggregate amount of the commitmentsstandby and (b) the Borrowing Base (as defined in the 2020 Credit Agreement), determined ascommercial letters of the preceding fiscal month and on a proforma basis for the following six fiscal months, we may make investments, pay dividends, and repurchase our shares without restriction.credit outstanding, which are not significant.
Credit Rating
As of March 25, 2021,28, 2024, our corporate credit ratings from Standard & Poor’s and Moody’s Investors Service are BB+BB and Ba1,Ba2, respectively. In addition, Moody’s Investors Service has rated our senior unsecured notes Ba2.Ba3.
Debt Capitalization and Equity
| | | | | | | |
($ in millions) | | 2020 | | 2019 | |
Long-term debt and obligations under finance leases | | $ | 110 | | $ | 122 | |
Operating lease liability | | | 3,079 | | | 3,196 | |
Total debt including finance and operating leases | | | 3,189 | | | 3,318 | |
Less: | | | | | | | |
Cash and cash equivalents | | | 1,680 | | | 907 | |
Total net debt including the present value of finance and operating leases | | | 1,509 | | | 2,411 | |
Shareholders’ equity | | | 2,776 | | | 2,473 | |
Total capitalization | | $ | 4,285 | | $ | 4,884 | |
| | | | | | | |
Total net debt capitalization percent including finance and operating leases | | | 35.2 | % | | 49.4 | % |
Net debt capitalization percent decreased to 35.2 percent as compared with 49.4 percent in the prior year, primarily reflecting higher cash and cash equivalents.
Off-Balance Sheet Arrangements
We have not entered into any transactions with unconsolidated entities that expose us to material continuing risks, contingent liabilities, or any other obligation under a variable interest in an unconsolidated entity. Also, our financial policies prohibit the use of derivatives for which there is no underlying exposure.
In connection with the sale of various businesses and assets, we may be obligated for certain lease commitments transferred to third parties and pursuant to certain normal representations, warranties, or indemnifications entered into with the purchasers of such businesses or assets. Although the maximum potential amounts for such obligations cannot be readily determined, we believe that the resolution of such contingencies will not significantly affect our consolidated financial position, liquidity, or results of operations.
We also operate certain stores for which lease agreements are in the process of being negotiated with landlords. Although there is no contractual commitment to make these payments, it is likely that leases will be executed.
Critical Accounting Policies
Our responsibility for integrity and objectivity in the preparation and presentation of the financial statements requires application of appropriate accounting policies. Generally, our accounting policies and methods are those specifically required by U.S. GAAP. Included in the Summary of Significant Accounting Policies note in “Item 8. Consolidated Financial Statements and Supplementary Data” is a summary of the most significant accounting policies. In some cases, we are required to calculate amounts based on estimates for matters that are inherently uncertain. We believe the following to be the most critical of those accounting policies that necessitate subjective judgments.
Merchandise Inventories and Cost of Sales
Merchandise inventories for our stores are valued at the lower of cost or market using the retail inventory method (“RIM”). The RIM is used by retail companies to value inventories at cost and calculate gross margins due to its practicality. Under the RIM, cost is determined by applying a cost-to-retail percentage across groupings of similar items, known as departments. The cost-to-retail percentage is applied to ending inventory at its current owned retail valuation to determine the cost of ending inventory on a department basis.
The RIM is a system of averages that requires estimates and assumptions regarding markups, markdowns and shrink, among others, and as such, could result in distortions of inventory amounts. Judgment is required for these estimates and assumptions, as well as to differentiate between promotional and other markdowns that may be required to correctly reflect merchandise inventories at the lower of cost or market. Reserves are established based on current selling prices when the inventory has not been marked down to market. The failure to take permanent markdowns on a timely basis may result in an overstatement of cost under the retail inventory method. The decision to take permanent markdowns includes many factors, including the current retail environment, inventory levels, and the age of the item. We believe this method and its related assumptions, which have been consistently applied, to be reasonable.
Leases
We determine if an arrangement is a lease at inception. Right-of-use assets and liabilities are recognized at the commencement date based on the present value of lease payments over the lease term for those arrangements where there is an identified asset and the contract conveys the right to control its use. Our lease term includes options to extend or terminate a lease only when it is reasonably certain that we will exercise that option.
As most of our leases do not provide an implicit interest rate, we use our incremental borrowing rates based on the remaining lease term to determine the present value of future lease payments. Our incremental borrowing rate for a lease is the rate of interest we would have to pay on a collateralized basis to borrow an amount equal to the lease payments under similar terms. Our incremental borrowing rate is calculated as the weighted average risk-free (sovereign) rate plus a spread to reflect our current unsecured credit rating plus the fees to borrow under our credit facility. The weighted average risk-free (sovereign) rates were based on the Treasury BVAL rates curve in Bloomberg. In the regions that we have stores, rates were developed for 3, 5, 7, 10, and 15 years. The weighting given to each region was determined by the number of stores in each region.
The spread to reflect our current credit rating represented the spread between U.S. Treasury rates and Bloomberg’s USD BVAL curve for non-financial companies with the Company’s credit rating. The fees to borrow represent the facility fees paid on the Company’s revolving credit facility.
Impairment of Long-Lived Tangible Assets and Right-of-Use Assets
We perform an impairment review when circumstances indicate that the carrying value of long-lived tangible assets and right-of-use assets may not be recoverable (“("a triggering event”event"). Our policy for determining whether a triggering event exists comprises the evaluation of measurable operating performance criteria and qualitative measures at the lowest level for which identifiable cash flows are largely independent of cash flows of other assets and liabilities, which is generally at the store level. We also evaluate for triggering events at the banner level. If an impairment review is necessitated by the identification of a triggering event, we determine the fair value of the asset using assumptions predominately identified from our historical performance and our long-range strategic plans.
To determine if an impairment exists, we compare the carrying amount of the asset with the estimated future undiscounted cash flows expected to result from the use of the asset group. If the carrying amount of the asset exceeds the estimated undiscounted future cash flows, we measure the amount of the impairment by comparing the carrying amount of the asset group with its estimated fair value.
The estimation of fair value is measured by discounting expected future cash flows using a risk adjusted discount rate and by using a market approach to determine current lease rates. Future expected cash flows are based upon estimates that, if not achieved, may result in significantly different results.
During 2020, due to the COVID-19 pandemic and its effect on our actual and projected results, during the first quarter of 2020, we determined that a triggering event occurred for certain underperforming stores operating in Europe and, therefore, we conducted an impairment review. We evaluated the long-lived assets, including the right-of-use assets, and recorded non-cash charges of $15 million to write down store fixtures, leasehold improvements, and right-of-use assets of 70 stores. Additionally, we performed an impairment review for certain underperforming stores during the fourth quarter and recorded non-cash impairment charges totaling $62 million for approximately 60 stores.
Recoverability of Goodwill and Indefinite-Lived Intangible Assets
|
We review goodwill for impairment annually during the first We review goodwill and indefinite-lived intangible assets for impairment annually during the fourth quarter of each fiscal year or more frequently if impairment indicators arise. The review of impairment consists of either using a qualitative approach to determine whether it is more likely than not that the fair value of the assets is less than their respective carrying values or a one-step qualitative impairment test.
|
|
In performing the qualitative assessment, we consider many factors in evaluating whether the carrying value of goodwill may not be recoverable, including declines in our stock price and market capitalization in relation to the book value of the Company and macroeconomic conditions affecting retail. If, based on the results of the qualitative assessment, it is concluded that it is not more likely than not that the fair value of a reporting unit exceeds its carrying value, additional quantitative impairment testing is performed. The quantitative test requires that the carrying value of each reporting unit be compared with its estimated fair value. If the carrying value of a reporting unit is greater than its fair value, a goodwill impairment charge will be recorded for the difference (up to the carrying value of goodwill).
We use a discounted cash flow approach to determine the fair value of a reporting unit. The determination of discounted cash flows of the reporting units and assets and liabilities within the reporting units requires significant estimates and assumptions. These estimates and assumptions primarily include, but are not limited to, the discount rate, terminal growth rates, earnings before depreciation and amortization, and capital expenditures forecasts. Due to the inherent uncertainty involved in making these estimates, actual results could differ from those estimates. We evaluate the merits of each significant assumption, both individually and in the aggregate, used to determine the fair value of the reporting units, as well as the fair values of the corresponding assets and liabilities within the reporting units.
In addition to performing our qualitative assessment as of the beginning of the year, we performed an additional quantitative assessment during the first quarter due to the COVID-19 pandemic and its effect on our results and stock price. Neither assessment resulted in the recognition of impairment.
|
|
Pension and Postretirement Liabilities
We review all assumptions used to determine our obligations for pension and postretirement liabilities annually with our independent actuaries, taking into consideration existing and future economic conditions and our intentions with regard to the plans. The assumptions used are:
Long-Term Rate of Return
|
| The expected rate of return on plan assets is the long-term rate of return expected to be earned on the plans’ assets and is recognized as a component of pension expense. The rate is based on the plans’ weighted-average target asset allocation, as well as historical and future expected performance of those assets. The target asset allocation is selected to obtain an investment return that is sufficient to cover the expected benefit payments and to reduce the variability of future contributions. The expected rate of return on plan assets is reviewed annually and revised, as necessary, to reflect changes in the financial markets and our investment strategy.
The weighted-average long-term rate of return used to determine 2020 pension expense was 5.5 percent.
|
|
|
|
|
| A decrease of 50 basis points in the weighted-average expected long-term rate of return would have increased 2020 pension expense by approximately $3 million. The actual return on plan assets in a given year typically differs from the expected long-term rate of return, and the resulting gain or loss is deferred and amortized into expense over the average life expectancy of the inactive participants.
|
|
|
|
Discount Rate
|
| An assumed discount rate is used to measure the present value of future cash flow obligations of the plans and the interest cost component of pension expense and postretirement income. The cash flows are then discounted to their present value and an overall discount rate is determined. The discount rate for our U.S. plans are determined by reference to the Bond:Link interest rate model based upon a portfolio of highly-rated U.S. corporate bonds with individual bonds that are theoretically purchased to settle the plan’s anticipated cash outflows. The discount rate selected to measure the present value of our Canadian benefit obligations is similar to the approach used for the U.S. plan and was determined by reference to the Canadian Rate:Link interest rate model.
The weighted-average discount rates used to determine the 2020 benefit obligations related to our pension and postretirement plans was 2.5 percent and 2.8 percent, respectively.
|
|
| Changing the weighted-average discount rate by 50 basis points would have changed the accumulated benefit obligation of the pension plans at January 30, 2021 by approximately $42 million and $35 million, depending on if the change was an increase or decrease, respectively. A decrease of 50 basis points in the weighted-average discount rate would have increased or decreased the accumulated benefit obligation on the postretirement plan by approximately $1 million depending on if the change was an increase or decrease, respectively.
|
|
|
|
Trend Rate
|
| We maintain two postretirement medical plans, one covering certain executive officers and key employees (“SERP Medical Plan”), and the other covering all other team members. With respect to the SERP Medical Plan, a 100-basis point change in the assumed health care cost trend rate would not significantly change this plan’s accumulated benefit obligation. With respect to the postretirement medical plan covering all other team members, there is limited risk to us for increases in health care costs since, beginning in 2001, new retirees have assumed the full expected costs and then-existing retirees have assumed all increases in such costs.
|
|
|
|
Mortality Assumptions
|
| The mortality assumption used to value our 2020 U.S. pension obligations was the Pri-2012 mortality table with generational projection using MP-2020 for both males and females, while in the prior year the obligation was valued using the Pri-2012 mortality table with generational projection using MP-2019. We used the 2014 CPM Private Sector mortality table projected generationally with Scale CPM-B for both males and females to value our Canadian pension obligations for 2020.
For the SERP Medical Plan, the mortality assumption used to value the 2019 obligation was updated to the PriH-2012 table with generational projection using MP-2020. Each year we update this assumption to the most recent study from the Society of Actuaries.
|
Income Taxes
Deferred tax assets are reduced by a valuation allowance, which is established when it is more likely than not that some portion or allthe fair value of the deferred tax assets willis less than their respective carrying values or a one-step qualitative impairment test.
In performing the qualitative assessment, we consider many factors in evaluating whether the carrying value of goodwill may not be realized. We are requiredrecoverable, including declines in our stock price and market capitalization in relation to estimate taxable income for future years by taxing jurisdictionthe book value of the Company and to use our judgment to determine whether to record a valuation allowance for part or allmacroeconomic conditions affecting retail. If, based on the results of the qualitative assessment, it is concluded that it is not more likely than not that the fair value of a deferred tax asset. Estimatesreporting unit exceeds its carrying value, additional quantitative impairment testing is performed. The quantitative test requires that the carrying value of taxable income are based upon our long-range strategic plans. A one percent change ineach reporting unit be compared with its estimated fair value. If the overall statutory tax ratecarrying value of a reporting unit is greater than its fair value, a goodwill impairment charge will be recorded for 2020 would have resulted in a change of $2 millionthe difference (up to the carrying value of goodwill).
We use a discounted cash flow approach to determine the net deferred tax assetfair value of a reporting unit. The determination of discounted cash flows of the reporting units and a corresponding charge or credit to income tax expense depending on whetherassets and liabilities within the tax rate change was a decrease or an increase.
We have operations in multiple taxing jurisdictions, and we are subject to audit in these jurisdictions. Tax audits by their nature are often complex and can require several years to resolve. Accruals of tax contingencies require us to makereporting units requires significant estimates and judgments with respectassumptions. These estimates and assumptions primarily include, but are not limited to, the ultimate outcome of tax audits. Actualdiscount rate, terminal growth rates, earnings before depreciation and amortization, and capital expenditures forecasts. Due to the inherent uncertainty involved in making these estimates, actual results could varydiffer from thesethose estimates.
Excluding We evaluate the effectmerits of any nonrecurring items that may occur, we expect the effective tax rate for 2021 to beeach significant assumption, both individually and in the rangeaggregate, used to determine the fair value of 29.6% to 30.6%. The actual tax rate will depend on the level and geographic mix of income and losses,reporting units, as well as the limitsfair values of the corresponding assets and liabilities within the reporting units.
Owned trademarks and trade names that have been determined to tax benefitshave indefinite lives are not subject to amortization but are reviewed at least annually for losses in certain foreign jurisdictions.potential impairment. Our actual tax rate will also dependimpairment evaluation for indefinite-lived intangible assets consists of either a qualitative or quantitative assessment, similar to the process for goodwill.
If the results of the qualitative assessment indicate that it is more likely than not that the fair value of the indefinite lived intangible is less than its carrying amount, or if we elect to proceed directly to a quantitative assessment, we calculate the fair value using a discounted cash flow method, based on the enactmentrelief-from-royalty concept, and compare the fair value to the carrying value to determine if the asset is impaired. This methodology assumes that, in lieu of ownership, a corporate tax rate increase, as proposedthird party would be willing to pay a royalty in order to exploit the related benefits of these types of assets. This approach is dependent on a number of factors, including estimates of future growth and trends, royalty rates in the category of intellectual property, discount rates, and other variables. We base our fair value estimates on assumptions we believe to be reasonable, but which are unpredictable and inherently uncertain. Actual future results may differ from those estimates. We recognize an impairment loss when the estimated fair value of the intangible asset is less than the carrying value.
Fair Value Measurements of Minority Investments
We account for certain minority investments using the fair value measurement alternative, which is at cost, adjusted for changes in observable prices minus impairment under the practicability exception. We evaluate our minority investments for impairment when events or circumstances indicate that the carrying value of the investment may not be recoverable and that impairment is other than temporary. If an indication of impairment occurs, we evaluate the recoverability of our carrying value based on the fair value of the investment. If an impairment is indicated, we adjust the carrying values of the investment downward, if necessary, to their estimated fair values.
We estimate the fair value of our minority investments using a discounted cash flow approach and/or a market approach, which consider forecasted cash flows provided by the Biden Administration.investee's management, as well as assumptions over discount rates, terminal values, and selected comparable companies. Therefore, the valuation results cannot be determined with precision and may not be realized in an actual sale the investment. Additionally, there are inherent uncertainties in any valuation technique, and changes in the underlying assumptions used, including discount rates and estimates of future cash flows, could significantly affect the results of current or future values.
Recent Accounting Pronouncements
Descriptions of the recently issued accounting principles and the accounting principles adopted by us during the year ended January 30, 2021 are included in the Summary of Significant Accounting Policies note in “Item 8. Consolidated Financial Statements and Supplementary Data.”
Recent SEC Ruling
In March 2024, the SEC adopted rules to enhance and standardize climate-related disclosures by public companies. The final rules will require us to provide information about the financial effects of climate-related risks on our operations and how we manage those risks. As a large accelerated filer, our compliance with the new climate disclosures will be phased in, beginning in the fiscal year 2025 Annual Report on Form 10-K.
Item7A. Quantitative and Qualitative Disclosures About Market Risk
Information regarding foreign exchange risk management is included in the Financial Instruments and Risk Management note under “Item 8. Consolidated FinancialFinancial Statements and Supplementary Data.”
Item8. Consolidated Financial Statements and Supplementary Data
The following Consolidated Financial Statements of the Company are included as part of this Report:
| ● | Consolidated Statements of Operations for the fiscal years ended: |
| | |
| ● | January 30, 2021, February 1, 2020, and February 2, 2019 |
| ● | Consolidated Statements of Comprehensive (Loss) Income for the fiscal years ended: |
| | |
| ● | January 30, 2021, February 1, 2020, and February 2, 2019 |
| ● | Consolidated Balance Sheets as of: |
| | |
| ● | January 30, 2021 and February 1, 2020 |
| ● | Consolidated Statements of Changes in Shareholders’ Equity for the fiscal years ended: |
| | |
| ● | January 30, 2021, February 1, 2020, and February 2, 2019 |
| ● | Consolidated Statements of Cash Flows for the fiscal years ended: |
| | |
| ● | January 30, 2021, February 1, 2020, and February 2, 2019 |
| ● | Notes to the Consolidated Financial Statements. Statements |
REPORT OF INDEPENDENT REGISTERED PUBLIC ACCOUNTING FIRM
To the Shareholders and Board of Directors
Foot Locker, Inc.:
Opinion on the ConsolidatedFinancial Statements
We have audited the accompanying consolidated balance sheets of Foot Locker, Inc. and subsidiaries (the Company) as of February 3, 2024 and January 30, 2021 and February 1, 2020,28, 2023, the related consolidated statements of operations, comprehensive (loss) income, changes in shareholders’ equity, and cash flows for each of the years in the three-year period ended January 30, 2021February 3, 2024, and the related notes (collectively, the consolidated financial statements). In our opinion, the consolidated financial statements present fairly, in all material respects, the financial position of the Company as of February 3, 2024 and January 30, 2021 and February 1, 2020,28, 2023, and the results of its operations and its cash flows for each of the years in the three-year period ended January 30, 2021,February 3, 2024, in conformity with U.S. generally accepted accounting principles.
We also have audited, in accordance with the standards of the Public Company Accounting Oversight Board (United States) (PCAOB), the Company’s internal control over financial reporting as of January 30, 2021,February 3, 2024, based on criteria established in Internal Control – Integrated Framework (2013) issued by the Committee of Sponsoring Organizations of the Treadway Commission, and our report dated March 25, 202128, 2024 expressed an unqualified opinion on the effectiveness of the Company’s internal control over financial reporting.
Change in Accounting Principle
As discussed in Note 1 to the consolidated financial statements, the Company changed its method of accounting for leases effective February 3, 2019 due to the adoption of Financial Accounting Standards Board Accounting Standards Codification (ASC) Topic 842, Leases.
Basis for Opinion
These consolidated financial statements are the responsibility of the Company’s management. Our responsibility is to express an opinion on these consolidated financial statements based on our audits. We are a public accounting firm registered with the PCAOB and are required to be independent with respect to the Company in accordance with the U.S. federal securities laws and the applicable rules and regulations of the Securities and Exchange Commission and the PCAOB.
We conducted our audits in accordance with the standards of the PCAOB. Those standards require that we plan and perform the audit to obtain reasonable assurance about whether the consolidated financial statements are free of material misstatement, whether due to error or fraud. Our audits included performing procedures to assess the risks of material misstatement of the consolidated financial statements, whether due to error or fraud, and performing procedures that respond to those risks. Such procedures included examining, on a test basis, evidence regarding the amounts and disclosures in the consolidated financial statements. Our audits also included evaluating the accounting principles used and significant estimates made by management, as well as evaluating the overall presentation of the consolidated financial statements. We believe that our audits provide a reasonable basis for our opinion.
Critical Audit MatterMatters
The critical audit mattermatters communicated below is a matterare matters arising from the current period audit of the consolidated financial statements that were communicated or required to be communicated to the audit committee and that: (1) relate to accounts or disclosures that are material to the consolidated financial statements and (2) involved our especially challenging, subjective, or complex judgments. The communication of the critical audit mattermatters does not alter in any way our opinion on the consolidated financial statements, taken as a whole, and we are not, by communicating the critical audit mattermatters below, providing separate opinions on the critical audit mattermatters or on the accounts or disclosures to which it relates.they relate.
Sufficiency of audit evidence over merchandise inventories
As discussed in Note 1 to the consolidated financial statements, merchandise inventories are valued at the lower of cost or market using the retail inventory method, except for WSS and atmos. Cost is determined on the last-in, first-out (LIFO) basis for domestic inventories and on the first-in, first-out (FIFO) basis for international inventories. Under the retail inventory method, cost is determined by applying a cost-to-retail percentage across groupings of similar items, known as departments. The cost-to-retail percentage is applied to ending inventory at its current owned retail valuation to determine the cost of ending inventory on a department basis. The recognition of inventory is reliant upon multiple information technology (IT) systems. The Company’s merchandise inventories were $1,509 million as of February 3, 2024.
We identified the sufficiency of audit evidence over merchandise inventories as a critical audit matter. Evaluating the sufficiency of audit evidence required subjective auditor judgment due to the highly automated nature of certain processes to record merchandise inventories that involves interfacing significant volumes of data across multiple IT systems. IT professionals with specialized skills and knowledge were required to assess the Company’s IT systems used in the merchandise inventories process.
The following are the primary procedures we performed to address this critical audit matter. We applied auditor judgment to determine the nature and extent of procedures to be performed over the recording of merchandise inventory, including the IT systems. We evaluated the design and tested the operating effectiveness of certain internal controls related to the recording of merchandise inventories. We tested IT dependent controls and involved IT professionals with specialized skills and knowledge who assisted in testing certain IT application and general IT controls used for calculating merchandise inventories. We selected a sample of transactions used in the calculation of merchandise inventories and compared inventory prices to vendor invoices and cash payments, and observed counts of inventories. For each sample, we also compared the inventory retail prices to inventory records. We assessed the sufficiency of audit evidence obtained over merchandise inventories by assessing the results of procedures performed, including the appropriateness of such evidence.
Fair value of asset group related to certain underperforming storesminority investment
As discussed in Notes 1, 5 and 319 to the consolidated financial statements, the Company performs anaccounts for a minority investment using the fair value measurement alternative, which is at cost, adjusted for changes in observable prices minus impairment review whenunder the practicability exception. The Company evaluates the minority investment for impairment whenever events or circumstances indicate that the carrying amountvalue of long-lived tangible assets and right-of-use assetsthe investment may not be recoverable. The long-lived tangible assetsrecoverable and that impairment is other than temporary. If an indication of impairment occurs, the right-of-use assetsCompany evaluates recoverability of the Company as of January 30, 2021 were $788 million and $2,716 million, respectively. If a triggering event is identified,carrying value based on the Company compares the carrying amount of the asset group with the estimated future cash flows expected to result from the use of the asset group. If the carrying amount of the asset group exceeds the estimated undiscounted future cash flows, the Company measures the amount of the impairment by comparing the carrying amount of the asset group with its estimated fair value. The estimation of fair value of the asset groupminority investment. If an impairment is measured by discounting expected future cash flowsindicated, the Company adjusts the carrying values of the investment downward, if necessary, to their estimated fair values. The carrying value of the Company’s minority investment as of February 3, 2024 was $134 million. During the fourth quarter of 2023, the fair value of a minority investment was determined using a risk adjusted discount ratediscounted cash flow approach and current market-based information for right-of-use assets. During the year ended January 30, 2021, the Company recordeda market approach and an impairment chargescharge of $77$478 million related to certain underperforming stores.was recorded.
We identified the evaluation of the fair value of the asset group related to certain underperforming storesa minority investment as a critical audit matter. The market-based assumptionsSubjective auditor judgment was required to evaluate the discount rate used within the discounted cash flow method to estimate the fair value of the asset group included market rent estimates for comparable stores that required a high degree of auditor judgment to evaluate and were challenging to test in the current economic environment, as the COVID-19 shutdowns impacted the retail real estate market significantly.investment. Changes in the selection of the market rent estimatesdiscount rate could have had a significant effectimpact on the determinationfair value. Additionally, the evaluation of the fair valuediscount rate required the involvement of the asset group, which impacted the measurementvaluation professionals with specialized skills and allocation of the impairment loss within the asset group.knowledge.
The following are the primary procedures we performed to address this critical audit matter. We evaluated the design and tested the operating effectiveness of certain internal controls over the Company’s long-lived tangible asset and right-of-use asset impairment assessment process, including controls related to the estimate of theCompany’s fair value ofmeasurement process. This included a control related to the asset group. Wediscount rate. In addition, we involved valuation professionals with specialized skills and knowledge, who assisted in:
| ● | evaluating the market rent estimates by assessing comparable retail leasing activity applicable to each location |
| ● | assessing historic leasing activity of the Company in relation to historical store sales performance |
in evaluating the Company’s discount rate by comparing it to a discount rate range that was independently developed using publicly available market data for comparable entities.
/s/ KPMG LLP
We have served as the Company’s auditor since 1995.
New York, New York
March 25, 202128, 2024
CONSOLIDATED STATEMENTS OF OPERATIONS
| | | | | | | | | |
($ in millions, except per share amounts) | | 2020 | | 2019 | | 2018 |
Sales | | $ | 7,548 | | $ | 8,005 | | $ | 7,939 |
| | | | | | | | | |
Cost of sales | | | 5,365 | | | 5,462 | | | 5,411 |
Selling, general and administrative expenses | | | 1,587 | | | 1,650 | | | 1,614 |
Depreciation and amortization | | | 176 | | | 179 | | | 178 |
Impairment and other charges | | | 117 | | | 65 | | | 37 |
Income from operations | | | 303 | | | 649 | | | 699 |
| | | | | | | | | |
Interest (expense) income, net | | | (7) | | | 11 | | | 9 |
Other income, net | | | 198 | | | 12 | | | 5 |
Income before income taxes | | | 494 | | | 672 | | | 713 |
Income tax expense | | | 171 | | | 181 | | | 172 |
Net income | | $ | 323 | | $ | 491 | | $ | 541 |
| | | | | | | | | |
Basic earnings per share | | $ | 3.10 | | $ | 4.52 | | $ | 4.68 |
Weighted-average shares outstanding | | | 104.3 | | | 108.7 | | | 115.6 |
| | | | | | | | | |
Diluted earnings per share | | $ | 3.08 | | $ | 4.50 | | $ | 4.66 |
Weighted-average shares outstanding, assuming dilution | | | 105.1 | | | 109.1 | | | 116.1 |
($ in millions, except per share amounts) | | 2023 | | | 2022 | | | 2021 | |
Sales | | $ | 8,154 | | | $ | 8,747 | | | $ | 8,958 | |
Licensing revenue | | | 14 | | | | 12 | | | | 10 | |
Total revenue | | | 8,168 | | | | 8,759 | | | | 8,968 | |
| | | | | | | | | |
Cost of sales | | | 5,895 | | | | 5,955 | | | | 5,878 | |
Selling, general and administrative expenses | | | 1,852 | | | | 1,903 | | | | 1,851 | |
Depreciation and amortization | | | 199 | | | | 208 | | | | 197 | |
Impairment and other | | | 80 | | | | 112 | | | | 172 | |
Income from operations | | | 142 | | | | 581 | | | | 870 | |
| | | | | | | | | |
Interest expense, net | | | (9 | ) | | | (15 | ) | | | (14 | ) |
Other (expense) income, net | | | (556 | ) | | | (42 | ) | | | 384 | |
(Loss) income from continuing operations before income taxes | | | (423 | ) | | | 524 | | | | 1,240 | |
Income tax (benefit) expense | | | (93 | ) | | | 180 | | | | 348 | |
Net (loss) income from continuing operations | | | (330 | ) | | | 344 | | | | 892 | |
Net loss from discontinued operations, net of tax | | | — | | | | (3 | ) | | | — | |
Net (loss) income | | | (330 | ) | | | 341 | | | | 892 | |
Net loss attributable to noncontrolling interests | | | — | | | | 1 | | | | 1 | |
Net (loss) income attributable to Foot Locker, Inc. | | $ | (330 | ) | | $ | 342 | | | $ | 893 | |
| | | | | | | | | |
Basic (loss) per share | | | | | | | | | |
(Loss) earnings per share from continuing operations attributable to Foot Locker, Inc. | | $ | (3.51 | ) | | $ | 3.66 | | | $ | 8.72 | |
Loss per share from discontinued operations, net of tax | | $ | — | | | $ | (0.04 | ) | | $ | — | |
Net (loss) earnings per share attributable to Foot Locker, Inc. | | $ | (3.51 | ) | | $ | 3.62 | | | $ | 8.72 | |
Weighted-average shares outstanding | | | 94.2 | | | | 94.3 | | | | 102.5 | |
| | | | | | | | | |
Diluted earnings (loss) per share | | | | | | | | | |
(Loss) earnings per share from continuing operations attributable to Foot Locker, Inc. | | $ | (3.51 | ) | | $ | 3.62 | | | $ | 8.61 | |
Net loss per share from discontinued operations, net of tax | | $ | — | | | $ | (0.04 | ) | | $ | — | |
Net (loss) earnings per share attributable to Foot Locker, Inc. | | $ | (3.51 | ) | | $ | 3.58 | | | $ | 8.61 | |
Weighted-average shares outstanding, assuming dilution | | | 94.2 | | | | 95.5 | | | | 103.8 | |
See Accompanying Notes to Consolidated Financial Statements.

CONSOLIDATED STATEMENTS OF COMPREHENSIVE INCOME
| | | | | | | | | |
($ in millions) | | 2020 | | 2019 | | 2018 |
Net income | | $ | 323 | | $ | 491 | | $ | 541 |
Other comprehensive income, net of income tax | | | | | | | | | |
| | | | | | | | | |
Foreign currency translation adjustment: | | | | | | | | | |
Translation adjustment arising during the period, net of income tax expense (benefit) of $3, $(1), and $(9), respectively | | | 40 | | | (20) | | | (75) |
| | | | | | | | | |
Cash flow hedges: | | | | | | | | | |
Change in fair value of derivatives, net of income tax benefit of $-, $1, and $-, respectively | | | 2 | | | (3) | | | — |
| | | | | | | | | |
Pension and postretirement adjustments: | | | | | | | | | |
Net actuarial gain (loss) and foreign currency fluctuations arising during the year, net of income tax expense (benefit) of $4, $(3), and $(8), respectively | | | 13 | | | (9) | | | (24) |
| | | | | | | | | |
Amortization of net actuarial gain/loss and prior service cost included in net periodic benefit costs, net of income tax expense of $3, $3, and $3, respectively | | | 8 | | | 8 | | | 8 |
Comprehensive income | | $ | 386 | | $ | 467 | | $ | 450 |
See Accompanying Notes to Consolidated Financial Statements.
CONSOLIDATED BALANCE SHEETS
| | | | | | |
| | | | | | |
($ in millions, except share amounts) | | January 30,
2021 | | February 1,
2020 |
ASSETS | | | | | | |
| | | | | | |
Current assets: | | | | | | |
Cash and cash equivalents | | $ | 1,680 | | $ | 907 |
Merchandise inventories | | | 923 | | | 1,208 |
Other current assets | | | 232 | | | 271 |
| | | 2,835 | | | 2,386 |
Property and equipment, net | | | 788 | | | 824 |
Operating lease right-of-use assets | | | 2,716 | | | 2,899 |
Deferred taxes | | | 101 | | | 81 |
Goodwill | | | 159 | | | 156 |
Other intangible assets, net | | | 17 | | | 20 |
Minority investments | | | 337 | | | 142 |
Other assets | | | 90 | | | 81 |
| | $ | 7,043 | | $ | 6,589 |
| | | | | | |
LIABILITIES AND SHAREHOLDERS’ EQUITY | | | | | | |
| | | | | | |
Current liabilities: | | | | | | |
Accounts payable | | $ | 402 | | $ | 333 |
Accrued and other liabilities | | | 560 | | | 343 |
Current portion of debt and obligations under finance leases | | | 102 | | | — |
Current portion of operating lease liabilities | | | 580 | | | 518 |
| | | 1,644 | | | 1,194 |
Long-term debt and obligations under finance leases | | | 8 | | | 122 |
Long-term operating lease liabilities | | | 2,499 | | | 2,678 |
Other liabilities | | | 116 | | | 122 |
Total liabilities | | | 4,267 | | | 4,116 |
Commitments and contingencies | | | | | | |
| | | | | | |
Shareholders’ equity: | | | | | | |
Common stock and paid-in capital: 103,693,359 | | | 779 | | | 764 |
and 104,187,310 shares outstanding, respectively | | | | | | |
Retained earnings | | | 2,326 | | | 2,103 |
Accumulated other comprehensive loss | | | (331) | | | (394) |
Treasury stock at cost: 74,236 and - shares, respectively | | | (3) | | | — |
Noncontrolling interest | | | 5 | | | — |
Total shareholder's equity | | | 2,776 | | | 2,473 |
| | $ | 7,043 | | $ | 6,589 |
See Accompanying Notes to Consolidated Financial Statements.
CONSOLIDATED STATEMENTS OF CHANGES IN SHAREHOLDERS’ EQUITY
| | | | | | | | | | | | | | | | | | | | | | |
| | Additional Paid-In | | | | | | | | | | Accumulated | | | | | | |
| | Capital & | | | | | | | | | | Other | | | | | Total |
| | Common Stock | | Treasury Stock | | Retained | | Comprehensive | | | Noncontrolling | | Shareholders' |
(shares in thousands, amounts in millions) | | Shares | | Amount | | Shares | | Amount | | Earnings | | Loss | | | interest | | Equity |
Balance at February 3, 2018 | | 121,262 | | $ | 842 | | (1,433) | | $ | (63) | | $ | 2,019 | | $ | (279) | | $ | — | | $ | 2,519 |
Restricted stock issued | | 93 | | | — | | — | | | — | | | — | | | — | | | — | | | — |
Issued under director and stock plans | | 175 | | | 6 | | — | | | — | | | — | | | — | | | — | | | 6 |
Share-based compensation expense | | — | | | 22 | | — | | | — | | | — | | | — | | | — | | | 22 |
Shares of common stock used to satisfy tax withholding obligations | | — | | | — | | (36) | | | (1) | | | — | | | — | | | — | | | (1) |
Share repurchases | | — | | | — | | (7,887) | | | (375) | | | — | | | — | | | — | | | (375) |
Reissued - Employee Stock Repurchase Plan ("ESPP") | | — | | | — | | 48 | | | 2 | | | — | | | — | | | — | | | 2 |
Retirement of treasury stock | | (8,597) | | | (61) | | 8,597 | | | 400 | | | (339) | | | — | | | — | | | — |
Net income | | — | | | — | | — | | | — | | | 541 | | | — | | | — | | | 541 |
Cash dividends declared on common stock ($1.38 per share) | | — | | | — | | — | | | — | | | (158) | | | — | | | — | | | (158) |
Translation adjustment, net of tax | | — | | | — | | — | | | — | | | — | | | (75) | | | — | | | (75) |
Pension and postretirement adjustments, net of tax | | — | | | — | | — | | | — | | | — | | | (16) | | | — | | | (16) |
Cumulative effect of the adoption of ASU 2014-09 | | — | | | — | | — | | | — | | | 4 | | | — | | | — | | | 4 |
Cumulative effect of the adoption of ASU 2016-16 | | — | | | — | | — | | | — | | | 37 | | | — | | | — | | | 37 |
Balance at February 2, 2019 | | 112,933 | | $ | 809 | | (711) | | $ | (37) | | $ | 2,104 | | $ | (370) | | $ | — | | $ | 2,506 |
Restricted stock issued | | 89 | | | — | | — | | �� | — | | | — | | | — | | | — | | | — |
Issued under director and stock plans | | 187 | | | 3 | | — | | | — | | | — | | | — | | | — | | | 3 |
Share-based compensation expense | | — | | | 18 | | — | | | — | | | — | | | — | | | — | | | 18 |
Shares of common stock used to satisfy tax withholding obligations | | — | | | — | | (32) | | | (2) | | | — | | | — | | | — | | | (2) |
Share repurchases | | — | | | — | | (8,375) | | | (335) | | | — | | | — | | | — | | | (335) |
Reissued - ESPP | | — | | | — | | 97 | | | 6 | | | — | | | — | | | — | | | 6 |
Retirement of treasury stock | | (9,021) | | | (66) | | 9,021 | | | 368 | | | (302) | | | — | | | — | | | — |
Net income | | — | | | — | | — | | | — | | | 491 | | | — | | | — | | | 491 |
Cash dividends declared on common stock ($1.52 per share) | | — | | | — | | — | | | — | | | (164) | | | — | | | — | | | (164) |
Translation adjustment, net of tax | | — | | | — | | — | | | — | | | — | | | (20) | | | — | | | (20) |
Change in cash flow hedges, net of tax | | — | | | — | | — | | | — | | | — | | | (3) | | | — | | | (3) |
Pension and postretirement adjustments, net of tax | | — | | | — | | — | | | — | | | — | | | (1) | | | — | | | (1) |
Cumulative effect of the adoption of Topic 842 | | — | | | — | | — | | | — | | | (26) | | | — | | | — | | | (26) |
Balance at February 1, 2020 | | 104,188 | | $ | 764 | | — | | $ | — | | $ | 2,103 | | $ | (394) | | $ | — | | $ | 2,473 |
Restricted stock issued | | 121 | | | — | | — | | | — | | | — | | | — | | | — | | | — |
Issued under director and stock plans | | 297 | | | 7 | | — | | | — | | | — | | | — | | | — | | | 7 |
Share-based compensation expense | | — | | | 15 | | — | | | — | | | — | | | — | | | — | | | 15 |
Shares of common stock used to satisfy tax withholding obligations | | — | | | — | | (41) | | | (1) | | | — | | | — | | | — | | | (1) |
Share repurchases | | — | | | — | | (969) | | | (37) | | | — | | | — | | | — | | | (37) |
Reissued - ESPP | | — | | | — | | 23 | | | 1 | | | — | | | — | | | — | | | 1 |
Retirement of treasury stock | | (913) | | | (7) | | 913 | | | 34 | | | (27) | | | — | | | — | | | — |
Noncontrolling interest acquired | | — | | | — | | — | | | — | | | — | | | — | | | 5 | | | 5 |
Net income | | — | | | — | | — | | | — | | | 323 | | | — | | | — | | | 323 |
Cash dividends declared on common stock ($0.70 per share) | | — | | | — | | — | | | — | | | (73) | | | — | | | — | | | (73) |
Translation adjustment, net of tax | | — | | | — | | — | | | — | | | — | | | 40 | | | — | | | 40 |
Change in cash flow hedges, net of tax | | — | | | — | | — | | | — | | | — | | | 2 | | | — | | | 2 |
Pension and postretirement adjustments, net of tax | | — | | | — | | — | | | — | | | — | | | 21 | | | — | | | 21 |
Balance at January 30, 2021 | | 103,693 | | $ | 779 | | (74) | | $ | (3) | | $ | 2,326 | | $ | (331) | | $ | 5 | | $ | 2,776 |
See Accompanying Notes to Consolidated Financial Statements.
CONSOLIDATED STATEMENTS OF CASH FLOWS
| | | | | | | | | |
| | | | | | | | | |
($ in millions) | 2020 | | 2019 | | 2018 |
From operating activities: | | | | | | | | | |
Net income | | $ | 323 | | $ | 491 | | $ | 541 |
Adjustments to reconcile net income to net cash provided by operating activities: | | | | | | | | | |
Non-cash gain | | | (190) | | | (4) | | | — |
Non-cash impairment and other charges | | | 97 | | | 48 | | | 19 |
Depreciation and amortization | | | 176 | | | 179 | | | 178 |
Deferred income taxes | | | (9) | | | 5 | | | 9 |
Share-based compensation expense | | | 15 | | | 18 | | | 22 |
U.S. qualified pension plan contributions | | | — | | | (55) | | | (128) |
Change in assets and liabilities: | | | | | | | | | |
Merchandise inventories | | | 294 | | | 51 | | | (16) |
Accounts payable | | | 58 | | | (51) | | | 135 |
Accrued and other liabilities | | | 139 | | | (40) | | | 39 |
Pension litigation accrual | | | — | | | — | | | 13 |
Class counsel fees paid in connection with pension litigation | | | — | | | — | | | (97) |
Other, net | | | 159 | | | 54 | | | 66 |
Net cash provided by operating activities | | | 1,062 | | | 696 | | | 781 |
| | | | | | | | | |
From investing activities: | | | | | | | | | |
Capital expenditures | | | (159) | | | (187) | | | (187) |
Minority investments | | | (9) | | | (50) | | | (89) |
Proceeds from sale of property | | | — | | | 2 | | | — |
Insurance proceeds related to loss on property and equipment | | | — | | | — | | | 2 |
Net cash used in investing activities | | | (168) | | | (235) | | | (274) |
| | | | | | | | | |
From financing activities: | | | | | | | | | |
Proceeds from the revolving credit facility | | | 330 | | | — | | | — |
Repayment of the revolving credit facility | | | (330) | | | — | | | — |
Payment of long-term debt and obligations under finance leases | | | (23) | | | — | | | — |
Payment of debt issuance costs | | | (4) | | | — | | | — |
Contribution from non-controlling interest | | | 6 | | | — | | | — |
Purchase of treasury shares | | | (37) | | | (335) | | | (375) |
Dividends paid on common stock | | | (73) | | | (164) | | | (158) |
Proceeds from exercise of stock options | | | 4 | | | 5 | | | 5 |
Proceeds from common stock issued under employee stock plans | | | 2 | | | — | | | — |
Treasury stock reissued under employee stock plan | | | — | | | 3 | | | 2 |
Shares of common stock repurchased to satisfy tax withholding obligations | | | (1) | | | (2) | | | (1) |
Net cash used in financing activities | | | (126) | | | (493) | | | (527) |
| | | | | | | | | |
Effect of exchange rate fluctuations on cash, cash equivalents, and restricted cash | | | 8 | | | (7) | | | (30) |
Net change in cash, cash equivalents, and restricted cash | | | 776 | | | (39) | | | (50) |
Cash, cash equivalents, and restricted cash at beginning of year | | | 942 | | | 981 | | | 1,031 |
Cash, cash equivalents, and restricted cash at end of period | | $ | 1,718 | | $ | 942 | | $ | 981 |
| | | | | | | | | |
Cash paid during the year: | | | | | | | | | |
Interest | | $ | 14 | | $ | 11 | | $ | 11 |
Income taxes | | $ | 100 | | $ | 201 | | $ | 184 |
See Accompanying Notes to Consolidated Financial Statements.
20202023 Form 10-K Page
40
36
CONSOLIDATED STATEMENTS OF COMPREHENSIVE (LOSS) INCOME
($ in millions) | | 2023 | | | 2022 | | | 2021 | |
Net (loss) income attributable to Foot Locker, Inc. | | $ | (330 | ) | | $ | 342 | | | $ | 893 | |
Other comprehensive income (loss), net of income tax | | | | | | | | | | | | |
| | | | | | | | | |
Foreign currency translation adjustment: | | | | | | | | | | | | |
Translation adjustment arising during the period, net of income tax benefit of $(1), $-, and $(1), respectively | | | (25 | ) | | | (41 | ) | | | (43 | ) |
| | | | | | | | | |
Hedges contracts: | | | | | | | | | | | | |
Change in fair value of derivatives, net of income tax benefit of $-, $-, and $-, respectively | | | 1 | | | | (3 | ) | | | 1 | |
| | | | | | | | | |
Pension and postretirement adjustments: | | | | | | | | | | | | |
Net actuarial (loss) gain and foreign currency fluctuations arising during the year, net of income tax (benefit) expense of $(5), $(4), and $8, respectively | | | (13 | ) | | | (12 | ) | | | 23 | |
Amortization of net actuarial loss included in net periodic benefit costs, net of income tax expense of $3, $3, and $3, respectively | | | 7 | | | | 7 | | | | 7 | |
Recognition of net actuarial loss on settlement included in net benefit costs, net of income tax expense of $19, $-, and $-, respectively | | | 56 | | | | — | | | | — | |
Comprehensive (loss) income | | $ | (304 | ) | | $ | 293 | | | $ | 881 | |
See Accompanying Notes to Consolidated Financial Statements.
CONSOLIDATED BALANCE SHEETS
| | February 3, | | | January 28, | |
($ in millions, except share amounts) | | 2024 | | | 2023 | |
ASSETS | | | | | | | | |
| | | | | | |
Current assets: | | | | | | | |
Cash and cash equivalents | | $ | 297 | | | $ | 536 | |
Merchandise inventories | | | 1,509 | | | | 1,643 | |
Other current assets | | | 419 | | | | 342 | |
| | | 2,225 | | | | 2,521 | |
Property and equipment, net | | | 930 | | | | 920 | |
Operating lease right-of-use assets | | | 2,188 | | | | 2,443 | |
Deferred taxes | | | 114 | | | | 90 | |
Goodwill | | | 768 | | | | 785 | |
Other intangible assets, net | | | 399 | | | | 426 | |
Minority investments | | | 152 | | | | 630 | |
Other assets | | | 92 | | | | 92 | |
| | $ | 6,868 | | | $ | 7,907 | |
| | | | | | |
LIABILITIES AND SHAREHOLDERS’ EQUITY | | | | | | | | |
| | | | | | |
Current liabilities: | | | | | | | | |
Accounts payable | | $ | 366 | | | $ | 492 | |
Accrued and other liabilities | | | 428 | | | | 568 | |
Current portion of debt and obligations under finance leases | | | 5 | | | | 6 | |
Current portion of lease obligations | | | 492 | | | | 544 | |
| | | 1,291 | | | | 1,610 | |
Long-term debt and obligations under finance leases | | | 442 | | | | 446 | |
Long-term lease obligations | | | 2,004 | | | | 2,230 | |
Other liabilities | | | 241 | | | | 328 | |
Total liabilities | | | 3,978 | | | | 4,614 | |
Shareholders’ equity: | | | | | | |
Common stock and paid-in capital: 94,283,984 and 93,396,901 shares issued, respectively | | | 776 | | | | 760 | |
Retained earnings | | | 2,482 | | | | 2,925 | |
Accumulated other comprehensive loss | | | (366 | ) | | | (392 | ) |
Less: Treasury stock at cost: 60,308 and 1,489 shares, respectively | | | (2 | ) | | | — | |
Total shareholders' equity | | | 2,890 | | | | 3,293 | |
| | $ | 6,868 | | | $ | 7,907 | |
See Accompanying Notes to Consolidated Financial Statements.
CONSOLIDATED STATEMENTS OF CHANGES IN SHAREHOLDERS’ EQUITY
(shares in thousands, | | Additional Paid-In Capital & Common Stock | | | Treasury Stock | | | Retained | | | Accumulated Other Comprehensive | | | Non-Controlling | | | Total Shareholders' | |
amounts in millions) | | Shares | | | Amount | | | Shares | | | Amount | | | Earnings | | | Loss | | | interest | | | Equity | |
Balance at January 30, 2021 | | | 103,693 | | | $ | 779 | | | | (74 | ) | | $ | (3 | ) | | $ | 2,326 | | | $ | (331 | ) | | $ | 5 | | | $ | 2,776 | |
Restricted stock issued | | | 499 | | | | — | | | | — | | | | — | | | | — | | | | — | | | | — | | | | — | |
Issued under director and stock plans | | | 353 | | | | 11 | | | | — | | | | — | | | | — | | | | — | | | | — | | | | 11 | |
Share-based compensation expense | | | — | | | | 29 | | | | — | | | | — | | | | — | | | | — | | | | — | | | | 29 | |
Shares of common stock used to satisfy tax withholding obligations | | | — | | | | — | | | | (205 | ) | | | (11 | ) | | | — | | | | — | | | | — | | | | (11 | ) |
Share repurchases | | | — | | | | — | | | | (7,546 | ) | | | (348 | ) | | | — | | | | — | | | | — | | | | (348 | ) |
Reissued ‐ Employee Stock Purchase Plan ("ESPP") | | | — | | | | (7 | ) | | | 301 | | | | 14 | | | | — | | | | — | | | | — | | | | 7 | |
Retirement of treasury stock | | | (5,474 | ) | | | (42 | ) | | | 5,474 | | | | 260 | | | | (218 | ) | | | — | | | | — | | | | — | |
Net income (loss) | | | — | | | | — | | | | — | | | | — | | | | 893 | | | | — | | | | (1 | ) | | | 892 | |
Cash dividends on common stock ($1.00 per share) | | | — | | | | — | | | | — | | | | — | | | | (101 | ) | | | — | | | | — | | | | (101 | ) |
Translation adjustment, net of tax | | | — | | | | — | | | | — | | | | — | | | | — | | | | (43 | ) | | | — | | | | (43 | ) |
Change in hedges, net of tax | | | — | | | | — | | | | — | | | | — | | | | — | | | | 1 | | | | — | | | | 1 | |
Pension and postretirement adjustments, net of tax | | | — | | | | — | | | | — | | | | — | | | | — | | | | 30 | | | | — | | | | 30 | |
Balance at January 29, 2022 | | | 99,071 | | | $ | 770 | | | | (2,050 | ) | | $ | (88 | ) | | $ | 2,900 | | | $ | (343 | ) | | $ | 4 | | | $ | 3,243 | |
Restricted stock issued | | | 117 | | | | — | | | | — | | | | — | | | | — | | | | — | | | | — | | | | — | |
Issued under director and stock plans | | | 228 | | | | 7 | | | | — | | | | — | | | | — | | | | — | | | | — | | | | 7 | |
Share-based compensation expense | | | — | | | | 31 | | | | — | | | | — | | | | — | | | | — | | | | — | | | | 31 | |
Shares of common stock used to satisfy tax withholding obligations | | | — | | | | — | | | | (40 | ) | | | (1 | ) | | | — | | | | — | | | | — | | | | (1 | ) |
Share repurchases | | | — | | | | — | | | | (4,050 | ) | | | (129 | ) | | | — | | | | — | | | | — | | | | (129 | ) |
Reissued ‐ ESPP | | | — | | | | (2 | ) | | | 120 | | | | 5 | | | | — | | | | — | | | | — | | | | 3 | |
Retirement of treasury stock | | | (6,019 | ) | | | (46 | ) | | | 6,019 | | | | 213 | | | | (167 | ) | | | — | | | | — | | | | — | |
Termination of joint venture | | | — | | | | — | | | | — | | | | — | | | | — | | | | — | | | | (3 | ) | | | (3 | ) |
Net income (loss) | | | — | | | | — | | | | — | | | | — | | | | 342 | | | | — | | | | (1 | ) | | | 341 | |
Cash dividends on common stock ($1.60 per share) | | | — | | | | — | | | | — | | | | — | | | | (150 | ) | | | — | | | | — | | | | (150 | ) |
Translation adjustment, net of tax | | | — | | | | — | | | | — | | | | — | | | | — | | | | (41 | ) | | | — | | | | (41 | ) |
Change in hedges, net of tax | | | — | | | | — | | | | — | | | | — | | | | — | | | | (3 | ) | | | — | | | | (3 | ) |
Pension and postretirement adjustments, net of tax | | | — | | | | — | | | | — | | | | — | | | | — | | | | (5 | ) | | | — | | | | (5 | ) |
Balance at January 28, 2023 | | | 93,397 | | | $ | 760 | | | | (1 | ) | | $ | — | | | $ | 2,925 | | | $ | (392 | ) | | $ | — | | | $ | 3,293 | |
Restricted stock issued | | | 678 | | | | — | | | | — | | | | — | | | | — | | | | — | | | | — | | | | — | |
Issued under director and stock plans | | | 209 | | | | 6 | | | | — | | | | — | | | | — | | | | — | | | | — | | | | 6 | |
Share-based compensation expense | | | — | | | | 13 | | | | — | | | | — | | | | — | | | | — | | | | — | | | | 13 | |
Shares of common stock used to satisfy tax withholding obligations | | | — | | | | — | | | | (274 | ) | | | (10 | ) | | | — | | | | — | | | | — | | | | (10 | ) |
Reissued ‐ ESPP | | | — | | | | (3 | ) | | | 215 | | | | 8 | | | | — | | | | — | | | | — | | | | 5 | |
Net loss | | | — | | | | — | | | | — | | | | — | | | | (330 | ) | | | — | | | | — | | | | (330 | ) |
Cash dividends on common stock ($1.20 per share) | | | — | | | | — | | | | — | | | | — | | | | (113 | ) | | | — | | | | — | | | | (113 | ) |
Translation adjustment, net of tax | | | — | | | | — | | | | — | | | | — | | | | — | | | | (25 | ) | | | — | | | | (25 | ) |
Change in hedges, net of tax | | | — | | | | — | | | | — | | | | — | | | | — | | | | 1 | | | | — | | | | 1 | |
Pension and postretirement adjustments, net of tax | | | — | | | | — | | | | — | | | | — | | | | — | | | | 50 | | | | — | | | | 50 | |
Balance at February 3, 2024 | | | 94,284 | | | $ | 776 | | | | (60 | ) | | $ | (2 | ) | | $ | 2,482 | | | $ | (366 | ) | | $ | — | | | $ | 2,890 | |
See Accompanying Notes to Consolidated Financial Statements.
CONSOLIDATED STATEMENTS OF CASH FLOWS
($ in millions) | | 2023 | | | 2022 | | | 2021 | |
From operating activities: | | | | | | | | | | | | |
Net (loss) income | | $ | (330 | ) | | $ | 341 | | | $ | 892 | |
Adjustments to reconcile net income to net cash from operating activities: | | | | | | | | | | | | |
Non-cash impairment and other | | | 40 | | | | 67 | | | | 148 | |
Pension settlement charge | | | 75 | | | | — | | | | — | |
Fair value adjustments to minority investments | | | 478 | | | | 61 | | | | (367 | ) |
Fair value change in contingent consideration | | | (4 | ) | | | (31 | ) | | | — | |
Depreciation and amortization | | | 199 | | | | 208 | | | | 197 | |
Deferred income taxes | | | (136 | ) | | | 21 | | | | 74 | |
Share-based compensation expense | | | 13 | | | | 31 | | | | 29 | |
Gain on sales of businesses | | | (3 | ) | | | (19 | ) | | | — | |
Gain on sale of property | | | (3 | ) | | | — | | | | — | |
Change in assets and liabilities: | | | | | | | | | |
Merchandise inventories | | | 120 | | | | (397 | ) | | | (259 | ) |
Accounts payable | | | (122 | ) | | | (101 | ) | | | 161 | |
Accrued and other liabilities | | | (109 | ) | | | (1 | ) | | | 1 | |
Insurance recovery received for inventory loss | | | — | | | | — | | | | 10 | |
Other, net | | | (127 | ) | | | (7 | ) | | | (220 | ) |
Net cash provided by operating activities | | | 91 | | | | 173 | | | | 666 | |
From investing activities: | | | | | | | | | | | | |
Capital expenditures | | | (242 | ) | | | (285 | ) | | | (209 | ) |
Purchase of business, net of cash acquired | | | — | | | | (14 | ) | | | (1,056 | ) |
Minority investments | | | (2 | ) | | | (5 | ) | | | (118 | ) |
Proceeds from sales of businesses | | | 16 | | | | 47 | | | | — | |
Proceeds from minority investments | | | — | | | | 95 | | | | — | |
Proceeds from sale of property | | | 6 | | | | — | | | | 3 | |
Insurance proceeds related to loss on property and equipment | | | — | | | | — | | | | 4 | |
Net cash used in investing activities | | | (222 | ) | | | (162 | ) | | | (1,376 | ) |
From financing activities: | | | | | | | | | | | | |
Repayment of the revolving credit facility | | | (146 | ) | | | — | | | | — | |
Dividends paid on common stock | | | (113 | ) | | | (150 | ) | | | (101 | ) |
Shares of common stock repurchased to satisfy tax withholding obligations | | | (10 | ) | | | (1 | ) | | | (11 | ) |
Payment of long-term debt and obligations under finance leases | | | (6 | ) | | | (6 | ) | | | (102 | ) |
Treasury stock reissued under employee stock plan | | | 4 | | | | 3 | | | | 7 | |
Proceeds from exercise of stock options | | | 5 | | | | 6 | | | | 10 | |
Proceeds from the revolving credit facility | | | 146 | | | | — | | | | — | |
Purchase of treasury shares | | | — | | | | (129 | ) | | | (348 | ) |
Purchase of non-controlling interest | | | — | | | | (2 | ) | | | — | |
Payment of debt issuance costs | | | — | | | | — | | | | (2 | ) |
Proceeds from debt issuance, net | | | — | | | | — | | | | 395 | |
Net cash used in financing activities | | | (120 | ) | | | (279 | ) | | | (152 | ) |
Effect of exchange rate fluctuations on cash, cash equivalents, and restricted cash | | | 3 | | | | — | | | | (6 | ) |
Net change in cash, cash equivalents, and restricted cash | | | (248 | ) | | | (268 | ) | | | (868 | ) |
Cash, cash equivalents, and restricted cash at beginning of year | | | 582 | | | | 850 | | | | 1,718 | |
Cash, cash equivalents, and restricted cash at end of period | | $ | 334 | | | $ | 582 | | | $ | 850 | |
| | | | | | | | | |
Supplemental information: | | | | | | | | | | | | |
Interest paid | | $ | 18 | | | $ | 17 | | | $ | 11 | |
Income taxes paid | | | 97 | | | | 153 | | | | 387 | |
Cash paid for amounts included in measurement of operating lease liabilities | | | 681 | | | | 704 | | | | 790 | |
Cash paid for amounts included in measurement of finance lease liabilities | | | 8 | | | | 9 | | | | 5 | |
Right-of-use assets obtained in exchange for operating lease obligations | | | 295 | | | | 458 | | | | 417 | |
Assets obtained in exchange for finance lease obligations | | | 1 | | | | — | | | | 4 | |
See Accompanying Notes to Consolidated Financial Statements.

NOTES TO CONSOLIDATED FINANCIAL STATEMENTS
1. Summary of Significant Accounting Policies
Basis of Presentation
The consolidated financial statements include the accounts of Foot Locker, Inc. and its domestic and international subsidiaries, as well as any entities in which we have a controlling voting interest that are required to be consolidated. All significant intercompany amounts have been eliminated. As used in these Notes to Consolidated Financial Statements the terms “Foot"Foot Locker,” “Company,” “we,” “our,”" "Company," "we," "our," and “us”"us" refer to Foot Locker, Inc. and its consolidated subsidiaries.
The preparation of financial statements in conformity with U.S. generally accepted accounting principles requires management to make estimates and assumptions relating to the reporting of assets and liabilities and the disclosure of contingent liabilities at the date of the financial statements, and the reported amounts of revenues and expenses during the reporting period. Actual results may differ from those estimates.
COVID-19 Pandemic
In March 2020, the World Health Organization designated COVID-19 a pandemic. COVID-19 had a significant effect on overall economic conditions in nearly all regions around the world and resulted in travel restrictions and business slowdowns or shutdowns. As a result of the COVID-19 pandemic, we temporarily closed our stores in North America, EMEA (Europe, Middle East, and Africa), and Asia Pacific throughout 2020 but primarily during the first and second quarters. We have been and will continue to operate in-store fulfillment activities to mitigate the effect of the temporary closures caused by COVID-19.
We considered the ongoing effects of the COVID-19 pandemic on our operations, as well as the assumptions and estimates used when preparing our financial statements, including inventory valuation, income taxes, and evaluating the impairment of long-lived tangible assets and right-of-use lease assets. These assumptions and estimates may change as the current situation evolves or new events occur and additional information is obtained. If the economic conditions caused by COVID-19 worsen beyond what is currently estimated by management, such future changes may have an adverse effect on our results of operations, financial position, and liquidity.
ReportingYear
Our fiscal year end is a 52-week52-week or 53-week53-week period ending the Saturday closest to the last day in January. Fiscal year 2020, 2019, and 20182023 represented the 5253 weeks ended February 3, 2024, while fiscal years 2022 and 2021 represented the 52 weeks ended January 30, 2021, February 1, 2020,28, 2023, and February 2, 2019,January 29, 2022, respectively. References to years in this annual report relate to fiscal years rather than calendar years.
Revenue Recognition
Store revenue is recognized at the point of sale and includes merchandise, net of returns, and excludes taxes. Revenue from layaway sales is recognized when the customer receives the product, rather than when the initial deposit is paid. We recognize revenue for merchandise that is shipped to our customers from our distribution centers and stores upon shipment as the customer has control of the product upon shipment. We account for shipping and handling as a fulfillment activity. We accrue the cost and recognize revenue for these activities upon shipment date, therefore total sales recognized includes shipping and handling fees. We have license agreements with unaffiliated third-party operators located in the Middle East and Asia. The agreements are largely structured with royalty income paid as a percentage of sales for the use of our trademarks, trade name and branding. We record licensing revenue based upon sales estimates for the current period from the third-party operators.
Gift Cards
We sell gift cards which do not have expiration dates. Revenue from gift card sales is recorded when the gift cards are redeemed by customers. Gift card breakage is recognized as revenue in proportion to the pattern of rights exercised by the customer, unless there is a legal obligation to remit the value of unredeemed gift cards to the relevant jurisdictions.
NOTES TO CONSOLIDATED FINANCIAL STATEMENTS
The table below presents the activity of our gift card liability balance:
| | | | | | |
| | | | |
($ in millions) | | 2020 | | 2019 |
Gift card liability at beginning of year | | $ | 35 | | $ | 35 |
Redemptions | | | (118) | | | (105) |
Breakage recognized in sales | | | (8) | | | (7) |
Activations | | | 131 | | | 112 |
Foreign currency fluctuations | | | 1 | | | — |
Gift card liability at end of year | | $ | 41 | | $ | 35 |
We elected not to disclose the information about remaining performance obligations since the amount of gift cards redeemed after 12 months is not significant for both 2020 and 2019.
Advertising Costs and Sales Promotion
Advertising and sales promotion costs are expensed at the time the advertising or promotion takes place, net of reimbursements for cooperative advertising. Cooperative advertising reimbursements earned for the launch and promotion of certain products agreed upon with vendors are recorded in the same period as the associated expenses are incurred.
Digital advertising costs are expensed as incurred, net of reimbursements for cooperative advertising. Digital advertising includes search engine marketing, such as display ads and keyword search terms, and other various forms of digital advertising. Reimbursements received in excess of expenses incurred related to specific, incremental, and identifiable advertising costs are accounted for as a reduction to the cost of merchandise and are reflected in cost of sales when the merchandise is sold.
Digital advertising costs are expensed as incurred, net of reimbursements for cooperative advertising. Digital advertising includes social media, search engine marketing, such as display ads and keyword search terms, and other various forms of digital advertising.
NOTES TO CONSOLIDATED FINANCIAL STATEMENTS
1. Summary of Significant Accounting Policies (continued)
Advertising costs, including digital advertising, which are included as a component of SG&A, were as follows:
| | | | | | | | | |
($ in millions) | | 2020 | | 2019 | | 2018 |
Advertising expenses (1) | | $ | 69 | | $ | 91 | | $ | 111 |
Digital advertising expenses | | | 89 | | | 95 | | | 96 |
Cooperative advertising reimbursements | | | (14) | | | (20) | | | (25) |
Net advertising expense | | $ | 144 | | $ | 166 | | $ | 182 |
(1) | Effective with the adoption of the new lease standard in 2019, advertising costs that are required by some of our mall-based leases are recorded as an element of rent expense. These costs were $14 million for 2018. |
Catalog Costs
($ in millions) | | 2023 | | | 2022 | | | 2021 | |
Advertising expenses | | $ | 216 | | | $ | 222 | | | $ | 223 | |
Cooperative advertising reimbursements | | | (35 | ) | | | (37 | ) | | | (29 | ) |
Net advertising expense | | $ | 181 | | | $ | 185 | | | $ | 194 | |
Catalog costs, which are primarily comprised of paper, printing, and postage, are expensed at the time the catalogs are distributed. Cooperative reimbursements earned for the promotion of certain products are agreed upon with vendors and are recorded in the same period as the associated catalog expenses are recorded.
Catalog costs, which are included as a component of SG&A, were as follows:
| | | | | | | | | |
($ in millions) | | 2020 | | 2019 | | 2018 |
Catalog costs | | $ | 7 | | $ | 15 | | $ | 18 |
NOTES TO CONSOLIDATED FINANCIAL STATEMENTS
Share-Based Compensation
We recognize compensation expense for share-based awards based on the grant date fair value of those awards. We use the Black-Scholes option-pricing model to determine the fair value of stock options, which requires the input of subjective assumptions regarding the expected term, expected volatility, and risk-free interest rate. See Note 20, 21,Share-Based Compensation, for information on the assumptions used to calculate the fair value of stock options. Share-based compensation expense is recognized on a straight-line basis over the requisite service period for each vesting tranche of the award. We recognize forfeitures as they occur. Upon exercise of stock options, issuance of restricted stock or units, or issuance of shares under the employee stock purchase plan, we will issue authorized but unissued common stock or use common stock held in treasury.
Awards of restricted stock units cliff vest after the passage of time, generally three years. Performance-based restrictedPerformance stock unit ("PSU") awards are earned on achievementonly after the attainment of pre-establishedperformance goals andin connection with regards to certain awards,the relevant performance period and vest after an additional one-yearone-year period.
PSU awards granted in 2023 and 2022 also include a performance objective based on our relative total shareholder return over the performance period to a pre-determined peer group, assuming the reinvestment of dividends. The fair value of these awards is determined using a Monte Carlo simulation as of the date of the grant.
Earnings Per Share
We account for earnings per share (“EPS”("EPS") using the treasury stock method. Basic EPS is computed by dividing net income for the period by the weighted-average number of common shares outstanding at the end of the period. Diluted EPS reflects the weighted-average number of common shares outstanding during the period used in the basic EPS computation plus dilutive common stock equivalents.
The computation of basic and diluted EPS is as follows:
| | | | | | | | | |
(in millions, except per share data) | | 2020 | | 2019 | | 2018 |
Net income | | $ | 323 | | $ | 491 | | $ | 541 |
| | | | | | | | | |
Weighted-average common shares outstanding | | | 104.3 | | | 108.7 | | | 115.6 |
Dilutive effect of potential common shares | | | 0.8 | | | 0.4 | | | 0.5 |
Weighted-average common shares outstanding assuming dilution | | | 105.1 | | | 109.1 | | | 116.1 |
| | | | | | | | | |
Earnings per share - basic | | $ | 3.10 | | $ | 4.52 | | $ | 4.68 |
Earnings per share - diluted | | $ | 3.08 | | $ | 4.50 | | $ | 4.66 |
| | | | | | | | | |
Anti-dilutive share-based awards excluded from diluted calculation | | | 2.5 | | | 2.2 | | | 1.9 |
Contingently issuable shares
(in millions, except per share data) | | 2023 | | | 2022 | | | 2021 | |
Net (loss) income from continuing operations | | $ | (330 | ) | | $ | 344 | | | $ | 892 | |
Net loss attributable to noncontrolling interests | | | — | | | | 1 | | | | 1 | |
(Loss) income from continuing operations attributable to Foot Locker, Inc. | | | (330 | ) | | | 345 | | | | 893 | |
Net loss from discontinued operations, net of tax | | | — | | | | (3 | ) | | | — | |
Net (loss) income attributable to Foot Locker, Inc. | | $ | (330 | ) | | $ | 342 | | | $ | 893 | |
| | | | | | | | | |
Weighted-average common shares outstanding | | | 94.2 | | | | 94.3 | | | | 102.5 | |
Dilutive effect of potential common shares | | | — | | | | 1.2 | | | | 1.3 | |
Weighted-average common shares outstanding assuming dilution | | | 94.2 | | | | 95.5 | | | | 103.8 | |
NOTES TO CONSOLIDATED FINANCIAL STATEMENTS
1. Summary of Significant Accounting Policies (continued)
(in millions, except per share data) | | 2023 | | | 2022 | | | 2021 | |
Basic earnings per share: | | | | | | | | | |
(Loss) earnings per share from continuing operations attributable to Foot Locker, Inc. | | $ | (3.51 | ) | | $ | 3.66 | | | $ | 8.72 | |
Loss per share from discontinued operations, net of tax | | | — | | | | (0.04 | ) | | | — | |
Net (loss) earnings per share attributable to Foot Locker, Inc. | | $ | (3.51 | ) | | $ | 3.62 | | | $ | 8.72 | |
| | | | | | | | | |
Diluted earnings per share: | | | | | | | | | |
(Loss) earnings per share from continuing operations attributable to Foot Locker, Inc. | | $ | (3.51 | ) | | $ | 3.62 | | | $ | 8.61 | |
Net loss per share from discontinued operations, net of tax | | | — | | | | (0.04 | ) | | | — | |
Net (loss) earnings per share attributable to Foot Locker, Inc. | | $ | (3.51 | ) | | $ | 3.58 | | | $ | 8.61 | |
| | | | | | | | | |
Anti-dilutive share-based awards excluded from diluted calculation | | | 4.5 | | | | 2.7 | | | | 1.8 | |
Performance stock units related to our long-term incentive programs of 0.8 million for 2023, 0.4 million for 2020, 0.52022, and 0.4 million for 2019, and 0.9 million for 2018,2021, have not been includedexcluded from diluted weighted-average shares. The issuance of these shares are contingent on our performance metrics as compared to the vesting conditionspre-established performance goals, which have not been satisfied. These shares relate to restricted stock unit awards issued in connection with our long-term incentive program.achieved.
Cash, Cash Equivalents, and Restricted Cash
Cash consists of funds held on hand and in bank accounts. Cash equivalents include amounts on demand with banks and all highly liquid investments with original maturities of three months or less, including money market funds. Additionally, amounts due from third-partythird-party credit card processors for the settlement of debit and credit card transactions are included as cash equivalents as they are generally collected within three business days. We present book overdrafts, representing checks issued but still outstanding in excess of bank balances, as part of accounts payable.
Restricted cash represents cash that is restricted as to withdrawal or use under the terms of various agreements. Restricted cash includes amounts held in escrow in connection with various leasing arrangements in Europe, and deposits held in insurance trusts to satisfy the requirement to collateralize part of the self-insured workers’ compensation and liability claims.
NOTES TO CONSOLIDATED FINANCIAL STATEMENTS
The following table provides the reconciliation of cash, cash equivalents, and restricted cash, as reported on our consolidated statements of cash flows:
| | | | | | | | |
| | January 30, | | February 1, | | February 2, | | February 3, | | January 28, | | January 29, | |
($ in millions) | | 2021 | | 2020 | | 2019 | | 2024 | | 2023 | | 2022 | |
Cash and cash equivalents (1) | | $ | 1,680 | | $ | 907 | | $ | 891 | | $ | 297 | | | $ | 536 | | | $ | 804 | |
Restricted cash included in other current assets (2) | | | 8 | | | 6 | | 59 | |
Restricted cash included in other current assets | | | 4 | | | 13 | | | 8 | |
Restricted cash included in other non-current assets | | | 30 | | 29 | | 31 | | 33 | | | 33 | | | 38 | |
Cash, cash equivalents, and restricted cash | | $ | 1,718 | | $ | 942 | | $ | 981 | | $ | 334 | | | $ | 582 | | | $ | 850 | |
(1)(1) | Includes cash equivalents of $503$40 million, $366$41 million, and $476$48 million for the years ended January 30, 2021, February 1, 2020, and February 2, 2019, respectively. |
(2) | The remaining balance of the qualified settlement fund related to the pension matter of $55 million was included in the current portion of restricted cash as of February 2, 20193, 2024, January 28, 2023, and was contributed to the pension plan in 2019.January 29, 2022, respectively. |
Merchandise Inventories and Cost of Sales
Merchandise inventories for our stores are valued at the lower of cost or market using the retail inventory method.method, except for WSS and atmos. Cost for retail stores is determined on the last-in, first-outfirst-out (“LIFO”) basis for domestic inventories and on the first-in, first-outfirst-in, first-out (“FIFO”) basis for international inventories. Merchandise inventories of the e-commerce businessfor our WSS and atmos businesses are valued at its net realizable value using weighted-average cost, which approximates FIFO.the weighted average method. Cost is determined on the FIFO basis.
NOTES TO CONSOLIDATED FINANCIAL STATEMENTS
1. Summary of Significant Accounting Policies (continued)
The retail inventory method is used by retail companies to value inventories at cost and calculate gross margins due to its practicality. Under the retail inventory method, cost is determined by applying a cost-to-retail percentage across groupings of similar items, known as departments. The cost-to-retail percentage is applied to ending inventory at its current owned retail valuation to determine the cost of ending inventory on a department basis. We provide reserves based on current selling prices when the inventory has not been marked down to market.
Transportation, distribution center, and sourcing costs are capitalized in merchandise inventories. We expense the freight associated with transfers between our store locations in the period incurred. We maintain an accrual for shrinkage based on historical rates.
Cost of sales is comprised of the cost of merchandise, as well as occupancy, buyers’ compensation, and shipping and handling costs. The cost of merchandise is recorded net of amounts received from suppliers for damaged product returns, markdown allowances, and volume rebates, as well as cooperative advertising reimbursements received in excess of specific, incremental advertising expenses.
Minority Investments
We use the equity method to account for investments in which we have the ability to exercise significant influence over the investee’s operating and financial policies, or in which we hold a partnership or limited liability company interest in an entity with specific ownership accounts, unless we have virtually no influence over the investee’s operating and financial policies. As of January 30, 2021, and February 1, 2020, we had $15 million and $8 million, respectively, of investments which are
We have a minority investment that is accounted for underusing the equity method.
Our investments that are not accounted for under the equity method are measuredfair value measurement alternative, which is at cost, adjusted for changes in observable prices minus impairment under the practicability exception. As
We evaluate our minority investments for impairment when events or circumstances indicate that the carrying value of January 30, 2021,the investment may not be recoverable and February 1,2020,an impairment is other than temporary. If an event occurs, we had $322 millionevaluate the recoverability of our carrying value based on the fair value of the investment. We estimate the fair value of our minority investments using both a discounted cash flow approach and $134 million, respectively,a market approach, which consider forecasted cash flows provided by the investee's management, as well as assumptions over discount rates, terminal values, and selected comparable companies. If an impairment is indicated, we adjust the carrying values of investments which are accounted for under this method.the investment downward, if necessary, to their estimated fair values.
Property and Equipment
Property and equipment are recorded at cost, less accumulated depreciation and amortization. Significant additions and improvements to property and equipment are capitalized. Major renewals or replacements that substantially extend the useful life of an asset are capitalized. Maintenance and repairs are expensed as incurred.
NOTES TO CONSOLIDATED FINANCIAL STATEMENTS
Depreciation and amortization are computed on a straight-line basis over the following estimated useful lives:
| | |
Buildings
|
|
|
Buildings
|
| Maximum of 50 years |
Store leasehold improvements | | Shorter of the asset useful life or expected term of the lease |
Furniture, fixtures, and equipment | | 3‑3‑10 years
|
Software | | 2‑2‑5 years
|
NOTES TO CONSOLIDATED FINANCIAL STATEMENTS
1. Summary of Significant Accounting Policies (continued)
Internal-Use Software Development Costs
We capitalize certain external and internal computer software and software development costs incurred during the application development stage. The application development stage generally includes software design and configuration, coding, testing, and installation activities. Capitalized costs include only external direct cost of materials and services consumed in developing or obtaining internal-use software, and payroll and payroll-related costs for employees who are directly associated with and devote time to the internal-use software project. Capitalization of such costs ceases no later than the point at which the project is substantially complete and ready for its intended use. We generally amortize these costs on a straight-line basis over a period not to exceed five years. Training and maintenance costs are expensed as incurred, while upgrades and enhancements are capitalized if it is probable that such expenditures will result in additional functionality. Capitalized software, net of accumulated amortization, is included as a component of Property and equipment, net and was $93$63 million and $80$87 million at February 3, 2024 and January 30, 202128, 2023, respectively.
Cloud computing arrangement (software-as-a-service contract) implementation costs that are capitalized are amortized on a straight-line basis over the contract term. These amounts are classified with prepaid expense and February 1, 2020, respectively.other long-term assets in the Consolidated Balance Sheets. Expense related to cloud computing arrangements are included in SG&A. The corresponding cash flows related to these arrangements are included in “Net cash provided by operating activities” in the Company’s Consolidated Statements of Cash Flows.
Impairment of Long-Lived Tangible Assets and Right-of-Use Assets
We perform an impairment review when circumstances indicate that the carrying value of long-lived tangible assets and right-of-use assets may not be recoverable (“a triggering event”). Our policy in determining whether a triggering event exists comprises the evaluation of measurable operating performance criteria and qualitative measures at the lowest level for which identifiable cash flows are largely independent of cash flows for other assets and liabilities, which is generally at the store level. We also evaluate triggering events at the banner level. In evaluating potential store level impairment, we compare future undiscounted cash flows expected to result from the use of the asset group to the carrying amount of the asset group. The future cash flows are estimated predominately based on our historical performance and long-range strategic plans. If the carrying amount of the asset group exceeds the estimated undiscounted future cash flows, we measure the amount of the impairment by comparing the carrying amount of the asset group with its estimated fair value. The estimation of fair value is measured by discounting expected future cash flows using a risk adjusted discount rate and using current market-based information for right-of-use assets. We estimate fair value based on the best information available using estimates, judgments, and projections as considered necessary.
Leases
On February 3, 2019, we adopted the new lease accounting standard. We applied the modified retrospective method of adoption and therefore, results for 2020 and 2019 are presented under the new guidance, while 2018 has not been adjusted.
Lease liabilities are recognized at the commencement date based on the present value of lease payments over the lease term for those arrangements where there is an identified asset and the contract conveys the right to control its use. The lease term includes options to extend or terminate a lease only when we are reasonably certain that we will exercise that option. The right-of-use asset is measured at the initial amount of the lease liability adjusted for lease payments made at or before the lease commencement date, initial direct costs, and any tenant improvement allowances received. For operating leases, right-of-use assets are reduced over the lease term by the straight-line lease expense recognized less the amount of accretion of the lease liability determined using the effective interest method.
We combine lease components and non-lease components. Given our policy election to combine lease and non-lease components, we also consider fixed common area maintenance (“CAM”) part of our fixed future lease payments; therefore, fixed CAM is also included in our lease liability. We recognize rent expense for operating leases as of the possession date for store leases or the commencement of the agreement for a non-store lease.leases. Rental expense, inclusive of rent holidays, concessions, and tenant allowances are recognized over the lease term on a straight-line basis. Contingent payments based upon sales and future increases determined by inflation related indices cannot be estimated at the inception of the lease and, accordingly, are charged to operations as incurred.
NOTES TO CONSOLIDATED FINANCIAL STATEMENTS
1. Summary of Significant Accounting Policies (continued)
As most of our leases do not provide an implicit interest rate, we use our incremental borrowing rates based on the remaining lease term to determine the present value of future lease payments. Our incremental borrowing rate for a lease is the rate of interest we would have to pay on a collateralized basis to borrow an amount equal to the lease payments under similar terms.
Leases with an initial term of 12 months or less are not recorded on the balance sheet. We recognize lease expense for short-term leases on a straight-line basis over the lease term.
Impairment of Goodwill and Other Intangible Assets
Goodwill and intangible assets with indefinite lives are reviewed for impairment annually during the firstfourth quarter of each fiscal year, or more frequently if impairment indicators arise. The review of goodwill impairment consists of either using a qualitative approach to determine whether it is more likely than not that the fair value of the assets is less than their respective carrying values or a one-stepone-step quantitative impairment test. In performing the qualitative assessment, we consider many factors in evaluating whether the carrying value of goodwill may not be recoverable, including declines in our stock price and market capitalization in relation to the book value of the Company and macroeconomic conditions affecting retail. If, based on the results of the qualitative assessment, it is concluded that it is not more likely than not that the fair value of a reporting unit exceeds its carrying value, additional quantitative impairment testing is performed. The quantitative test requires that the carrying value of each reporting unit be compared with its estimated fair value. If the carrying value of a reporting unit is greater than its fair value, a goodwill impairment charge will be recorded for the difference (up to the carrying value of goodwill).
We use a discounted cash flow approach to determine the fair value of a reporting unit. The determination of discounted cash flows of the reporting units and assets and liabilities within the reporting units requires significant estimates and assumptions. These estimates and assumptions primarily include, but are not limited to, the discount rate, terminal growth rates, earnings before depreciation and amortization, and capital expenditures forecasts. Due to the inherent uncertainty involved in making these estimates, actual results could differ from those estimates. We evaluate the merits of each significant assumption, both individually and in the aggregate, used to determine the fair value of the reporting units, as well as the fair values of the corresponding assets and liabilities within the reporting units.
For our 2020 annual impairment review conducted in the fourth quarter of 2023, we concluded the fair value of each reporting unit exceeded its carrying value. Goodwill is net of accumulated impairment charges of $167 million for all periods presented. The change in the goodwill amount represents foreign currency fluctuations.
Intangible assets with indefinite lives are tested for impairment if impairment indicators arise and, at a minimum, annually. The impairment review for intangible assets with indefinite lives consists of either performing a qualitative or a quantitative assessment. If the results of the qualitative assessment indicate that it is more likely than not that the fair value of the indefinite-lived intangible is less than its carrying amount, or if we elect to proceed directly to a quantitative assessment, we calculate the fair value using a discounted cash flow method, based on the relief from royalty method, and compare the fair value to the carrying value to determine if the asset is impaired. Intangible assets that are determined to have finite lives are amortized over their useful lives and are measured for impairment only when events or changes in circumstances indicate that the carrying value may be impaired.
Contingent Consideration
As a result of our purchase of atmos in 2021, we recognized contingent consideration, as a component of the purchase consideration is payable contingent on the achievement of certain sales and EBITDA performance. Contingent consideration is classified as a liability. The fair value of the contingent consideration liability is estimated using an option pricing model simulation that determines an average projected payment value across numerous iterations. This technique determines projected payments based on simulated sales and EBITDA derived from an internal forecast, adjusted for selected revenue and EBITDA volatilities and risk premiums based on market data for comparable guideline public companies. The projected payments are then discounted back to the valuation date at the Company’s cost of debt using a term commensurate with the contractual payment dates.
NOTES TO CONSOLIDATED FINANCIAL STATEMENTS
1. Summary of Significant Accounting Policies (continued)
The contingent consideration liability will be measured at fair value on a recurring basis until the contingency is resolved at the conclusion of 2025. Changes in the estimated fair value of the contingent consideration liability will be reflected in operating income or expense in the Consolidated Statements of Operations. The contingent consideration was initially valued at $35 million. During 2023 and 2022, the amount was reduced by $4 million and $31 million, respectively, through impairment and other in our Consolidated Statements of Operations.
Derivative Financial Instruments
All derivative financial instruments are recorded in our Consolidated Balance Sheets at their fair values. For derivatives designated as a hedge, and effective as part of a hedge transaction, the effective portion of the gain or loss on the hedging derivative instrument is reported as a component of other comprehensive income/loss or as a basis adjustment to the underlying hedged item and reclassified to earnings in the period in which the hedged item affects earnings. The effective portion of the gain or loss on hedges of foreign net investments is generally not reclassified to earnings unless the net investment is disposed of. To the extent derivatives do not qualify or are not designated as hedges, or are ineffective, their changes in fair value are recorded in earnings immediately, which may subject us to increased earnings volatility. We classify cash receipts and payments according to their nature in the statement of cash flows; however, cash flows from a derivative instrument that is accounted for as a fair value hedge or cash flow hedge are classified in the same category as the cash flows from the items being hedged.
NOTES TO CONSOLIDATED FINANCIAL STATEMENTS
Income Taxes
We account for our income taxes under the asset and liability method, which requires the recognition of deferred tax assets and liabilities for the expected future tax consequences of events that have been included in the financial statements. Under this method, deferred tax assets and liabilities are determined on the basis of the differences between the financial statements and the tax basis of assets and liabilities, using enacted tax rates in effect for the year in which the differences are expected to reverse. Deferred tax assets are recognized for tax credits and net operating loss carryforwards, reduced by a valuation allowance, which is established when it is more likely than not that some portion or all of the deferred tax assets will not be realized. The effect of a change in tax rates on deferred tax assets and liabilities is recognized in income in the period that includes the enactment date.
We recognize net deferred tax assets to the extent that we believe these assets are more likely than not to be realized. In making such a determination, we consider all available positive and negative evidence, including future reversals of existing taxable temporary differences, projected future taxable income, tax-planning strategies, and results of recent operations. If we determine that we would be able to realize our deferred tax assets in the future in excess of their net recorded amount, we would make an adjustment to the deferred tax asset valuation allowance, which would reduce the provision for income taxes.
A taxing authority may challenge positions that we adopted in our income tax filings. Accordingly, we may apply different tax treatments for transactions in filing our income tax returns than for income tax financial reporting. We regularly assess our tax positions for such transactions and record reserves for those differences when considered necessary. Tax positions are recognized only when it is more likely than not, based on technical merits, that the positions will be sustained upon examination. Tax positions that meet the more-likely-than-notmore-likely-than-not threshold are measured using a probability weighted approach as the largest amount of tax benefit that is greater than fifty percent likely of being realized upon settlement. Whether the more-likely-than-notmore-likely-than-not recognition threshold is met for a tax position is a matter of judgment based on the individual facts and circumstances of that position evaluated in light of all available evidence. We recognize interest and penalties related to unrecognized tax benefits within income tax expense in the accompanying Consolidated Statement of Operations. Accrued interest and penalties are included within the related tax liability line in the Consolidated Balance Sheet.
NOTES TO CONSOLIDATED FINANCIAL STATEMENTS
1. Summary of Significant Accounting Policies (continued)
Pension and Postretirement Obligations
Pension benefit obligations and net periodic pension costs are calculated using actuarial assumptions. Two key assumptions used in accounting for pension liabilities and expenses are the discount rate and expected rate of return on plan assets. The discount rate for the U.S. plans is determined by reference to the Bond:Link interest rate model based upon a portfolio of highly-rated U.S. corporate bonds with individual bonds that are theoretically purchased to settle the plan’s anticipated cash outflows. The cash flows are discounted to their present value and an overall discount rate is determined. The discount rate selected to measure the present value of the Canadian benefit obligations was developed by using that plan’s bond portfolio indices, which match the benefit obligations. We measure our plan assets and benefit obligations using the month-end date that is closest to our fiscal year end. The expected return on plan assets assumption is derived using the current and expected asset allocation of the pension plan assets and considering historical as well as expected performance of those assets.
Insurance Liabilities
We are primarily self-insured for health care, workers’ compensation, and general liability costs. Accordingly,Accordingly, provisions are made for actuarially determined estimates of discounted future claim costs for such risks, for the aggregate of claims reported, and claims incurred but not yet reported. Self-insured liabilities totaled $13 million and $12$14 million for February 3, 2024, $13 million for January 30, 202128, 2023 and February 1, 2020, respectively.$14 million for January 29, 2022. Workers’ compensation and general liability reserves are discounted using a risk-free interest rate. Imputed interest expense related to these liabilities was not significant for any of the periods presented.
NOTES TO CONSOLIDATED FINANCIAL STATEMENTS
Treasury Stock Retirement
We periodically retire treasury shares that we acquire through share repurchases and return those shares to the status of authorized but unissued. We account for treasury stock transactions under the cost method. For each reacquisition of common stock, the number of shares and the acquisition price for those shares is added to the existing treasury stock count and total value. When treasury shares are retired, our policy is to allocate the excess of the repurchase price over the par value of shares acquired to both retained earnings and additional paid-in capital. The portion allocated to additional paid-in capital is determined by applying a percentage, which is determined by dividing the number of shares to be retired by the number of shares issued, to the balance of additional paid-in capital as of the retirement date.
We did not retire shares in 2023. We retired 913,095 and 9,021,2446,019,212 shares of our common stock held in treasury during 20202022 and 2019, respectively. Thethe shares were returned to the status of authorized but unissued. As a result, treasury stock decreased by $34 million and $368 million as of January 30, 2021 and February 1, 2020, respectively.
Foreign Currency Translation
The functional currency of our international operations is the applicable local currency. The translation of the applicable foreign currency into U.S. dollars is performed for balance sheet accounts using current exchange rates in effect at the balance sheet date and for revenue and expense accounts using the weighted-average rates of exchange prevailing during the year. The unearned gains and losses resulting from such translation are included as a separate component of accumulated other comprehensive loss (“AOCL”) within shareholders’ equity.
Recently Adopted Accounting Pronouncements
On February 2, 2020, we adopted Financial Accounting Standards Board (“FASB”) guidance on the accounting for implementation costs of a cloud computing arrangement that is considered to be a service contract, that requires companies to follow the guidance for internal-use software to determine which costs to capitalize in a cloud computing arrangement that is a service contract. Under this guidance, such implementation costs will be capitalized in Other assets on the Consolidated Balance Sheet, with the related amortization presented in Selling, general and administrative expenses on the Consolidated Statement of Operations. This guidance was applied prospectively to implementation costs incurred after February 2, 2020. The adoption of this guidance did not have a significant effect on our consolidated financial statements.
On February 2, 2020, we adopted FASB’s updated guidance on the accounting for performing goodwill impairment tests. This update eliminates the requirement to perform a hypothetical purchase price allocation to measure goodwill impairment. In testing goodwill for impairment, an entity may elect to utilize a qualitative assessment to evaluate whether it is more likely than not that the fair value of a reporting unit is less than its carrying amount. If the qualitative assessment indicates that goodwill impairment is more likely than not, an entity should perform its goodwill impairment test by comparing the fair value of a reporting unit to its carrying amount and recognize an impairment charge for the amount by which the carrying amount exceeds the reporting unit's fair value, not to exceed the total amount of goodwill allocated to the reporting unit.
In January 2021, we adopted FASB’s amended guidance that eliminates, adds, and clarifies certain disclosure requirements for defined benefit pension or other postretirement plans. The eliminated disclosures include the amounts in accumulated other comprehensive income expected to be recognized in net periodic benefit costs over the next fiscal year and the effects of a one-percentage-point change in assumed health care cost trend rates on the aggregate of the service and interest cost components of net periodic benefit costs and the benefit obligation for postretirement health care benefits. The new disclosures require an explanation of significant gains and losses related to changes in benefit obligations. This standard is effective for fiscal years beginning after December 15, 2020 and allows for early adoption. The amendments are required to be applied retrospectively. The adoption of this guidance did not have a significant effect on our consolidated financial statements.
Other recentlyRecently issued accounting pronouncements did not, or are not believed by management to, have a material effect on our present or future consolidated financial statements.
NOTES TO CONSOLIDATED FINANCIAL STATEMENTS
1. Summary of Significant Accounting Policies (continued)
Recent Accounting Pronouncements Not Yet Adopted
All
In November 2023, the Financial Accounting Standards Board (“FASB”) issued Accounting Standards Update (“ASU”) 2023-07,Improvements to Reportable Segment Disclosures. ASU 2023-07 requires additional disclosures, including more detailed information about segment expenses about a public entity’s reportable segments on an annual and interim basis. The new segment disclosures are effective for fiscal years beginning after December 15, 2023, and interim periods within fiscal years beginning after December 15, 2024. Management will review the extent of new disclosures necessary in the coming quarters, prior to implementation in our 2024 Annual Report on Form 10-K. Other than additional disclosure, we do not expect a change to our consolidated statements of operations, financial position, or cash flows.
In December 2023, the FASB issued ASU 2023-09,Improvements to Income Tax Disclosures. ASU 2023-09 requires disaggregated information about a reporting entity’s effective tax rate reconciliation and income taxes paid. The new income tax disclosures are effective for fiscal years beginning after December 15, 2024. Management will review the extent of new disclosures necessary, prior to implementation in our 2025 Annual Report on Form 10-K. Other than additional disclosure, we do not expect a change to our consolidated statements of operations, financial position, or cash flows.
Other recently issued accounting pronouncements did not, or are not expected believed by management to, have a material effect on theour present or future consolidated financial statements.
2. Segment Information Revenue
The table below presents sales disaggregated by sales channel as well as licensing revenue earned from our various licensed arrangements. Sales are attributable to the channel in which the sales transaction is initiated.
($ in millions) | | 2023 | | | 2022 | | | 2021 | |
Sales by Channel: | | | | | | | | | |
Stores | | $ | 6,751 | | | $ | 7,219 | | | $ | 7,029 | |
Direct-to-customers | | | 1,403 | | | | 1,528 | | | | 1,929 | |
Total sales | | | 8,154 | | | | 8,747 | | | | 8,958 | |
Licensing revenue | | | 14 | | | | 12 | | | | 10 | |
Total revenue | | $ | 8,168 | | | $ | 8,759 | | | $ | 8,968 | |
Revenue by geographic area is presented in the following table. Revenue is attributed to the country in which the transaction is fulfilled.
($ in millions) | | 2023 | | | 2022 | | | 2021 | |
Revenue by Geography: | | | | | | | | | |
United States | | $ | 5,409 | | | $ | 5,981 | | | $ | 6,477 | |
International | | | 2,759 | | | | 2,778 | | | | 2,491 | |
Total revenue | | $ | 8,168 | | | $ | 8,759 | | | $ | 8,968 | |
For the year ended February 3, 2024, the countries that comprised the majority of the revenue for the international category were Canada, France, Italy, Australia, and Germany. No other individual country included in the international category was significant.
NOTES TO CONSOLIDATED FINANCIAL STATEMENTS
2. Revenue (continued)
Sales by banner and operating segments are presented in the following table.
($ in millions) | | 2023 | | | 2022 | | | 2021 | |
Foot Locker | | $ | 3,205 | | | $ | 3,304 | | | $ | 3,295 | |
Champs Sports | | | 1,304 | | | | 1,681 | | | | 1,939 | |
Kids Foot Locker | | | 716 | | | | 708 | | | | 724 | |
WSS | | | 640 | | | | 604 | | | | 195 | |
Other | | | 1 | | | | 126 | | | | 742 | |
North America | | | 5,866 | | | | 6,423 | | | | 6,895 | |
Foot Locker | | | 1,697 | | | | 1,628 | | | | 1,565 | |
Sidestep | | | 26 | | | | 94 | | | | 76 | |
EMEA | | | 1,723 | | | | 1,722 | | | | 1,641 | |
Foot Locker | | | 387 | | | | 414 | | | | 373 | |
atmos | | | 178 | | | | 188 | | | | 49 | |
Asia Pacific | | | 565 | | | | 602 | | | | 422 | |
Total sales | | $ | 8,154 | | | $ | 8,747 | | | $ | 8,958 | |
Contract Liabilities
The table below presents the activity of our gift card liability balance:
| | February 3, | | | January 28, | |
($ in millions) | | 2024 | | | 2023 | |
Gift card liability at beginning of year | | $ | 36 | | | $ | 46 | |
Redemptions | | | (278 | ) | | | (259 | ) |
Breakage recognized in sales | | | (6 | ) | | | (17 | ) |
Activations | | | 277 | | | | 266 | |
Gift card liability | | $ | 29 | | | $ | 36 | |
We elected not to disclose the information about remaining performance obligations since the amount of gift cards redeemed after 12 months is not significant for both 2023 and 2022.
We have integrated all available shopping channels including stores, websites, apps, and social channels, and catalogs.channels. Store sales are primarily fulfilled from the store’s inventory but may also be shipped from our distribution centers or from a different store location if an item is not available at the original store. Direct-to-customer orders are generally shipped to our customers through our distribution centers but may also be shipped from a store or a combination of our distribution centers and stores depending on the availability of particular items.
Our operating segments are identified according to how our business activities are managed and evaluated by our chief operating decision maker, our CEO. We have 3three operating segments, North America, EMEA (Europe, Middle East, and Africa), and Asia Pacific. Our North America operating segment includes the results of the following banners operating in the U.S. and Canada: Foot Locker, Kids Foot Locker, Lady Foot Locker, Champs Sports, and Footaction,WSS, including each of their related e-commerce businesses, as well as ourbanners we previously operated including Lady Foot Locker, Footaction, and the Eastbay business that includesincluded internet, catalog, and team sales. Our EMEA operating segment includes the results of the following banners operating in Europe: Foot Locker Sidestep, and Kids Foot Locker, including each of their related e-commerce businesses.businesses, as well as the Sidestep banner we previously operated. Our Asia Pacific operating segment includes the results of Foot Locker and Kids Foot Locker operating in Australia, New Zealand, and Asia and atmos operating primarily in Japan, as well as their related e-commerce businesses. Additionally, the EMEA and Asia Pacific operating segments include licensing revenue. We further aggregated these operating segments into 1one reportable segment based upon their shared customer base and similar economic characteristics.
NOTES TO CONSOLIDATED FINANCIAL STATEMENTS
3. Segment Information
We evaluate performance based on several factors, of which the primary financial measure is the banner’s financial results referred to as division profit. Division profit reflects income before income taxes, impairment and other, charges, corporate expense, non-operatinginterest expense, net and other (expense) income, and net interest income.net.
The following table summarizes our results:
| | | | | | | | | |
($ in millions) | 2020 | | 2019 | | 2018 |
Division profit | | $ | 491 | | $ | 788 | | $ | 808 |
Less: Impairment and other charges (1) | | | 117 | | | 65 | | | 37 |
Less: Corporate expense (2) | | | 71 | | | 74 | | | 72 |
Income from operations | | | 303 | | | 649 | | | 699 |
Interest (expense) income, net | | | (7) | | | 11 | | | 9 |
Other income, net | | | 198 | | | 12 | | | 5 |
Income before income taxes | | $ | 494 | | $ | 672 | | $ | 713 |
($ in millions) | | 2023 | | | 2022 | | | 2021 | |
Division profit | | $ | 264 | | | $ | 844 | | | $ | 1,171 | |
Less: Impairment and other (1) | | | 80 | | | | 112 | | | | 172 | |
Less: Corporate expense (2) | | | 42 | | | | 151 | | | | 129 | |
Income from operations | | | 142 | | | | 581 | | | | 870 | |
Interest expense, net | | | (9 | ) | | | (15 | ) | | | (14 | ) |
Other (expense) income, net (3) | | | (556 | ) | | | (42 | ) | | | 384 | |
(Loss) income from continuing operations before income taxes | | $ | (423 | ) | | $ | 524 | | | $ | 1,240 | |
(1)(1) | See Note 3, 4, Impairment and Other Chargesfor additional information on these amounts. |
(2)(2) | Corporate expense for all years presented reflects the reallocation of expense between corporate and the operating divisions. Based upon annual internal studies of corporate expense, the allocation of such expenses to the operating divisions was increased by $19 million for 2022 and $28 million for 2020, $32 million for 2019, and $40 million for 2018,2021, thereby reducing corporate expense. No change was made during 2023. |
(3) | See Note 5, Other (Expense) Income, net for additional information on these amounts. |
Sales disaggregated based upon channel for the fiscal years ended January 30, 2021, February 1, 2020, and February 2, 2019 are presented in the following table.
| | | | | | | | | |
($ in millions) | | 2020 | | 2019 | | 2018 |
Sales | | | | | | | | | |
Stores | | $ | 5,447 | | $ | 6,720 | | $ | 6,714 |
Direct-to-customers | | | 2,101 | | | 1,285 | | | 1,225 |
Total sales | | $ | 7,548 | | $ | 8,005 | | $ | 7,939 |
NOTES TO CONSOLIDATED FINANCIAL STATEMENTS
Sales and long-livedLong-lived asset information by geographic area as of and for the fiscal years ended February 3, 2024, January 30, 2021, February 1, 2020,28, 2023, and February 2, 2019 areJanuary 29, 2022 is presented in the following tables. Sales are attributed to the country in which the sales transaction is fulfilled.table. Long-lived assets reflect property and equipment and lease right-of-use assets.
($ in millions) | | 2023 | | | 2022 | | | 2021 | |
Long-Lived Assets: | | | | | | | | | |
United States | | $ | 2,025 | | | $ | 2,152 | | | $ | 2,285 | |
International | | | 1,093 | | | | 1,211 | | | | 1,248 | |
Total long-lived assets | | $ | 3,118 | | | $ | 3,363 | | | $ | 3,533 | |
| | | | | | | | | |
($ in millions) | | 2020 | | 2019 | | 2018 |
Sales by Geography | | | | | | | | | |
United States | | $ | 5,581 | | $ | 5,691 | | $ | 5,647 |
International | | | 1,967 | | | 2,314 | | | 2,292 |
Total sales | | $ | 7,548 | | $ | 8,005 | | $ | 7,939 |
| | | | | | | | | |
Long-Lived Assets | | | | | | | | | |
United States | | $ | 2,218 | | $ | 2,479 | | $ | 602 |
International | | | 1,286 | | | 1,244 | | | 234 |
Total long-lived assets | | $ | 3,504 | | $ | 3,723 | | $ | 836 |
For the year ended January 30, 2021,February 3, 2024, the countries that comprised the majority of the sales and long-lived assets for the international category were Canada, France, Italy, Australia, Germany, and England. No other individual country included in the international category was significant.
| | | | | | | | | | | | | | | | | | | | | | | | | | | |
| | Depreciation and | | | | | | | | | | | | | | | | | | |
| | Amortization | | Capital Expenditures (1) | | Total Assets |
($ in millions) | | 2020 | | 2019 | | 2018 | | 2020 | | 2019 | | 2018 | | 2020 | | 2019 | | 2018 |
Division | | $ | 152 | | $ | 160 | | $ | 160 | | $ | 88 | | $ | 105 | | $ | 112 | | $ | 5,159 | | $ | 5,523 | | $ | 2,900 |
Corporate | | | 24 | | | 19 | | | 18 | | | 71 | | | 82 | | | 75 | | | 1,884 | | | 1,066 | | | 920 |
Total | | $ | 176 | | $ | 179 | | $ | 178 | | $ | 159 | | $ | 187 | | $ | 187 | | $ | 7,043 | | $ | 6,589 | | $ | 3,820 |
significant as of February 3, 2024.
(1) Represents cash capital expenditures for all years presented.
| | Depreciation and Amortization | | | Capital Expenditures (1) | | | Total Assets | |
($ in millions) | | 2023 | | | 2022 | | | 2021 | | | 2023 | | | 2022 | | | 2021 | | | 2023 | | | 2022 | | | 2021 | |
Division | | $ | 163 | | | $ | 169 | | | $ | 163 | | | $ | 173 | | | $ | 200 | | | $ | 127 | | | $ | 6,256 | | | $ | 7,178 | | | $ | 7,184 | |
Corporate | | | 36 | | | | 39 | | | | 34 | | | | 69 | | | | 85 | | | | 82 | | | | 612 | | | | 729 | | | | 951 | |
Total | | $ | 199 | | | $ | 208 | | | $ | 197 | | | $ | 242 | | | $ | 285 | | | $ | 209 | | | $ | 6,868 | | | $ | 7,907 | | | $ | 8,135 | |
(1) | Represents cash capital expenditures for all years presented. |
3. Impairment and Other Charges
| | | | | | | | | |
($ in millions) | | 2020 | | 2019 | | 2018 |
Impairment of long-lived assets | | $ | 77 | | $ | 37 | | $ | 4 |
Runners Point shut down | | | 19 | | | — | | | — |
Losses related to social unrest | | | 8 | | | — | | | — |
Impairment of Investments | | | 4 | | | 11 | | | — |
EMEA reorganization | | | 4 | | | — | | | — |
Eastbay reorganization | | | 3 | | | — | | | — |
Pension litigation related charges | | | 2 | | | 4 | | | 18 |
Lease termination costs | | | — | | | 13 | | | — |
Other intangible asset impairments | | | — | | | — | | | 15 |
Total impairment and other charges | | $ | 117 | | $ | 65 | | $ | 37 |
Due to COVID-19 and its effect on our actual and projected results, during the first quarterTable of 2020, we determined that a triggering event occurred for certain underperforming stores operating in Europe and, therefore, we conducted an impairment review. We evaluated the long-lived assets, including the right-of-use assets, and recorded non-cash charges of $15 million to write down store fixtures, leasehold improvements, and right-of-use assets of 70 stores. During the fourth quarter of 2020, we conducted an impairment review for approximately 90 underperforming stores. We evaluated the long-lived assets, including the right-of-use assets and recorded non-cash charges of $62 million to write down store fixtures, leasehold improvements, and right-of-use assets for approximately 60 of these stores.
Losses related to social unrest represented inventory losses, damages to store property, repairs, and other costs incurred in connection with the riots that affected certain parts of the United States and Canada during the second quarter of 2020 and resulted in a loss of $18 million. Approximately 140 stores were damaged due to the unrest. The total charge included inventory losses of $15 million, damages to store property of $1 million, and repairs and other costs of $2 million.
Contents
NOTES TO CONSOLIDATED FINANCIAL STATEMENTS
4. Impairment and Other
($ in millions) | | 2023 | | | 2022 | | | 2021 | |
Impairment of long-lived assets and right-of-use assets | | $ | 30 | | | $ | 58 | | | $ | 92 | |
Transformation consulting | | | 27 | | | | 42 | | | | — | |
Reorganization costs | | | 17 | | | | 22 | | | | 4 | |
Other intangible asset impairments | | | 9 | | | | 8 | | | | 2 | |
Insurance recovery (losses) related to social unrest | | | 1 | | | | — | | | | (7 | ) |
Change in fair value of contingent consideration | | | (4 | ) | | | (31 | ) | | | — | |
Litigation costs | | | — | | | | 9 | | | | — | |
Acquisition and integration costs | | | — | | | | 4 | | | | 24 | |
Impairment of investments | | | — | | | | — | | | | 42 | |
Lease termination costs | | | — | | | | — | | | | 15 | |
Total impairment and other | | $ | 80 | | | $ | 112 | | | $ | 172 | |
Substantially allFor 2023, impairment and other included impairment charges of $30 million from a review of underperforming stores and accelerated tenancy charges on right-of-use assets for closures of the damagedSidestep banner, certain Foot Locker Asia stores, reopened duringand our U.S. atmos stores. Additionally, we incurred transformation consulting expense of $27 million and reorganization costs of $17 million primarily related to severance and the third quarter. Duringclosures of the fourth quarter, we recordedSidestep banner, certain Foot Locker Asia stores, and a partial insurance recoveryNorth American distribution center. This year also included intangible asset impairment of $10$9 million representingon an advance on our claim. We are continuing to work with our insurers to determine the remaining amount of our covered losses under our property insurance policy. Additional insurance recoveries will be recordedatmos tradename, partially offset by a $4 million reduction in the periodfair value of the atmos contingent consideration.
For 2022, impairment and other charges included $58 million of impairment of long-lived assets and right-of-use assets and accelerated tenancy charges, $42 million of transformation consulting, $22 million of primarily severance costs related to a reorganization, $9 million of litigation costs related to an employment matter, $8 million of Sidestep tradename asset impairment, and $4 million of acquisition integration costs related to the acquisitions of WSS and atmos, partially offset by a $31 million reduction in which we conclude our settlement discussions with our insurance providers.the fair value of the atmos contingent consideration liability.
In May 2020, we made
For 2021, impairment and other charges included $92 million of impairment of long-lived assets and right-of-use assets related primarily to the strategic decision to shut down our Runners Point businessthe Footaction banner, $24 million of acquisition and to consolidate our Sidestep support staff into our other operations in Europe. Also, as part of the next phase of the Champs Sportsintegration costs primarily represented investment banking and Eastbay strategic initiative, we restructured positions and aligned several functions across the banners and consolidated certain Eastbay operations into the Champs Sports headquarters. We recorded charges of $19 millionintegration consulting fees related to the shutdown of the Runners Point businessWSS and $3atmos acquisitions and $42 million related to the reorganization associated with Eastbay. As part of the decision to close the Runners Point banner, certain Runners Point stores have been converted into other banners and approximately 40 Runners Point and Sidestep stores closed prior to their natural lease expirations. In the fourth quarter of 2020, we recorded a charge of $4 million in connection with the reorganization of certain support functions and supply chain operations within our EMEA segment.
The table below presents a rollforward of our restructuring liability, which is recorded in Accrued and other liabilities on the Consolidated Balance Sheets. The remaining restructuring liability at January 30, 2021, which primarily relates to severance payments, is expected to be substantially paid within the next twelve months.
| | | | | | | | | | | | |
| | | | | | | | | | |
($ in millions) | | Runners Point | | Eastbay | | EMEA | | Total |
Balance as of February 1, 2020 | | $ | — | | $ | — | | $ | — | | $ | — |
Charges | | | 19 | | | 3 | | | 4 | | | 26 |
Payments | | | (13) | | | (3) | | | — | | | (16) |
Balance as of January 30, 2021 | | $ | 6 | | $ | — | | $ | 4 | | $ | 10 |
During 2020 and 2019, we recorded non-cash charges of $4 million and $11 million, respectively, related to the write-down of certain minority investments. One of our investments experienced a deterioration in their future outlook and due to the underperformancetheir underperformance.
5. Other (Expense) Income, net
($ in millions) | | 2023 | | | 2022 | | | 2021 | |
Fair value changes in minority investment | | $ | (478 | ) | | $ | — | | | $ | 290 | |
Pension settlement charge | | | (75 | ) | | | — | | | | — | |
Pension and postretirement net benefit (expense) income, excluding service cost | | | (8 | ) | | | — | | | | 7 | |
Share of (losses) earnings related to other minority investments | | | (1 | ) | | | 1 | | | | 3 | |
Minority investment in Retailors, Ltd. | | | — | | | | (61 | ) | | | 77 | |
Gain on sale of property | | | 3 | | | | — | | | | — | |
Foot Locker Singapore and Malaysia divestiture | | | 3 | | | | — | | | | — | |
Team Sales divestiture | | | — | | | | 19 | | | | — | |
Other | | | — | | | | (1 | ) | | | 7 | |
Total other (expense) income, net | | $ | (556 | ) | | $ | (42 | ) | | $ | 384 | |
Table of this investee, we have partially written down our investment in 2020 and 2019. In 2019, we recorded a full write down our investment in a children’s athletics startup which filed for bankruptcy.
The Company and the Company’s U.S. pension plan were involved in litigation related to the conversion of the plan to a cash balance plan. The court entered its final judgment in 2018, which required the plan be reformed as directed by the court order. We recorded charges in 2020, 2019, and 2018, related to the pension matter and related plan reformation totaling $2 million, $4 million, and $18 million, respectively. These charges recorded represented certain costs of the reformation and related administrative expenses.
During 2019, we performed an impairment review on our Footaction stores, certain other underperforming stores and a vacant store that had been previously subleased. We evaluated the long-lived assets, including the right-of-use assets, of these stores and recorded non-cash charges of $37 million to write down right-of-use assets, store fixtures and leasehold improvements. We also recorded $13 million of lease termination costs related to the closure of our SIX:02 locations during 2019.
During 2018, we recorded non-cash impairment charges of $4 million to write down store fixtures and leasehold improvements. We also performed an impairment review of other intangible assets and recorded a charge of $15 million to write down the value of the trademarks/trade names associated with Runners Point.
4. Other Income, net
Other income, net was $198 million, $12 million, and $5 million in 2020, 2019, and 2018, respectively.
Contents
NOTES TO CONSOLIDATED FINANCIAL STATEMENTS
5. Other (Expense) Income, net (continued)
Other (expense) income, net generally includes non-operating items, such as:
| - | franchise royalty income, |
| - | gains associated with disposal of property, |
| - | changes in fair value, premiums paid, and realized gains associated with foreign currency option contracts, |
| - | changes in the market value of our available-for-sale security, |
| - | premiums paid to repurchase and retire bonds, |
| - | changes in value for our investments accounted for using the fair value measurement alternative, which is at cost adjusted for changes in observable prices minus impairment, |
| - | our share of earnings or losses related to our equity method investments, and |
| - | net benefit expense or income related to our pension and postretirement programs, excluding the service cost component. component, |
| - | changes in fair value, premiums paid, and realized gains associated with foreign currency option contracts, |
| - | changes in the market value of our available-for-sale security, and premiums paid to repurchase and retire bonds. |
In 2020, oneDuring the fourth quarter of our2023, we recognized a $478 million non-cash impairment charge related to a minority investments, whichinvestment that is measuredaccounted for using the fair value measurement alternative, received additional fundingwhich is cost, adjusted for changes in Augustobservable prices minus impairment under the practicability exception. We estimated the fair value using both a discounted cash flow approach and a market approach. There was no impairment recognized in prior years based upon a qualitative assessment. The non-cash gain recorded in 2021 of $290 million was a result of application of the fair value measurement alternative, based on transactions at observable prices.
As part of our efforts to reduce pension plan obligations, during the fourth quarter of 2023 we transferred approximately $109 million of our U.S. Qualified pension plan registered assets and liabilities to an insurance company through the purchase of a higher valuation thangroup annuity contract, under which an insurance company is required to directly pay and administer pension payments to certain of our initial investment. As a result,pension plan participants, or their designated beneficiaries. In connection with this transaction, we recorded a $190non-cash pretax settlement charge of $75 million. This settlement charge accelerated the recognition of previously unrecognized losses in "Accumulated Other Comprehensive Loss."
Effective July 1, 2023, the Company sold its Foot Locker Singapore and Malaysia businesses, consisting primarily of inventory and fixed assets. We received proceeds of $16 million non-cash(net of cash of $8 million), resulting in a gain during the third quarter of 2020. Other income, net also included$3 million. In addition, we sold a corporate office property in North America for proceeds of $6 million, resulting in a gain of royalty income, $5$3 million.
During 2022, we sold our investment in a publicly traded stock, Retailors, Ltd. for a loss of $62 million, of net benefit income relating to our pension and post retirement programs. This income was partially offset by $2 million in premiums paid in connection with the repurchase and retirement of bonds and a $1 million loss related to our equity method investments.
During 2019, we recorded $8 million of royalty income, a $4 million gain associated with the acquisition of a Canadian distribution center lease and related assets from the partial exchange of a note that had previously been written down to zero, a $2 million gain related to the sale of a building, a $1 million gain on our available-for-sale security, partially offset by $2 million of net benefit expense relating to our pension and post retirement programs, and $1 million loss related to our equity method investments.
During 2018, we recorded $6 million of royalty income, $1 million of lease terminationdividend income. In the prior year, the changes in this investment generated non-cash gains of $68 million representing changes in fair value as well as a $1$9 million loss ondiscount to the initial public offering price. Also in 2022, we divested our available-for-sale security, and $1 millionTeam Sales business for a gain of net benefit expense relating to our pension and post retirement programs.$19 million.
5.6. Merchandise Inventories
| | | | | |
| | | | February 3, | | January 28, | |
($ in millions) | | January 30,
2021 | | February 1,
2020 | | 2024 | | 2023 | |
LIFO inventories | | $ | 544 | | $ | 810 | | $ | 956 | | | $ | 1,093 | |
FIFO inventories | | | 379 | | | 398 | | 553 | | | 550 | |
Total merchandise inventories | | $ | 923 | | $ | 1,208 | | $ | 1,509 | | | $ | 1,643 | |
The value of our LIFO inventories as calculated on a LIFO basis, approximates their value as calculated on a FIFO basis.
NOTES TO CONSOLIDATED FINANCIAL STATEMENTS
6. 7.Other Current Assets
| | | | | | |
($ in millions) | | January 30,
2021 | | February 1,
2020 |
Net receivables | | $ | 124 | | $ | 100 |
Other prepaid expenses | | | 56 | | | 46 |
Prepaid income taxes | | | 20 | | | 48 |
Prepaid rent | | | 14 | | | 55 |
Restricted cash | | | 8 | | | 6 |
Income taxes receivable | | | 1 | | | 1 |
Deferred tax costs | | | — | | | 9 |
Other | | | 9 | | | 6 |
| | $ | 232 | | $ | 271 |
| | | February 3, | | | January 28, | |
($ in millions) | | 2024 | | | 2023 | |
Net receivables | | $ | 160 | | | $ | 160 | |
Other prepaid expenses | | | 89 | | | | 71 | |
Prepaid income taxes | | | 82 | | | | 62 | |
Prepaid rent | | | 73 | | | | 19 | |
Restricted cash | | | 4 | | | | 13 | |
Other | | | 11 | | | | 17 | |
| | $ | 419 | | | $ | 342 | |
7.8. Property and Equipment, net
| | | February 3, | | | January 28, | |
($ in millions) | | 2024 | | | 2023 | |
Owned properties: | | | | | | |
Land | | $ | 3 | | | $ | 4 | |
Buildings | | | 51 | | | | 53 | |
Furniture, fixtures, equipment and software development costs | | | 1,403 | | | | 1,379 | |
| | | 1,457 | | | | 1,436 | |
Less: accumulated depreciation | | | (988 | ) | | | (948 | ) |
| | | 469 | | | | 488 | |
Finance leases: | | | | | | |
Assets under finance leases | | | 65 | | | | 65 | |
Less: accumulated amortization | | | (18 | ) | | | (12 | ) |
| | | 47 | | | | 53 | |
Alterations to leased and owned buildings: | | | | | | | | |
Cost | | | 996 | | | | 967 | |
Less: accumulated amortization | | | (582 | ) | | | (588 | ) |
| | | 414 | | | | 379 | |
| | $ | 930 | | | $ | 920 | |
NOTES TO CONSOLIDATED FINANCIAL STATEMENTS
| | | | | | |
($ in millions) | | January 30,
2021 | | February 1,
2020 |
Owned properties: | | | | | | |
Land | | $ | 4 | | $ | 4 |
Buildings | | | 52 | | | 54 |
Furniture, fixtures, equipment, and software development costs | | | 1,274 | | | 1,203 |
| | | 1,330 | | | 1,261 |
Less: accumulated depreciation | | | (907) | | | (818) |
| | $ | 423 | | $ | 443 |
Finance leases: | | | | | | |
Assets under finance leases | | $ | 11 | | $ | — |
Less: accumulated amortization | | | (1) | | | — |
| | $ | 10 | | $ | — |
| | | | | | |
Alterations to leased and owned buildings: | | | | | | |
Cost | | $ | 974 | | $ | 937 |
Less: accumulated amortization | | | (619) | | | (556) |
| | $ | 355 | | $ | 381 |
| | $ | 788 | | $ | 824 |
8.9. Other Intangible Assets, net
| | | | | | | | | | | | | | | | |
| | January 30, 2021 | | | | | February 1, 2020 | | February 3, 2024 | | | | January 28, 2023 | |
| | Gross | | Accum. | | Net | | Life in | | Gross | | Accum. | | Net | | Gross | | Accum. | | Net | | Life in | | Gross | | Accum. | | Net | |
($ in millions) | | value | | amort. | | value | | Years (2) | | value | | amort. | | value | | value | | amort. | | value | | Years (3) | | value | | amort. | | value | |
Amortized intangible assets: (1) | | | | | | | | | | | | | | | | | | | | | | | | | | | | | | | |
Lease acquisition costs | | $ | 121 | | $ | (116) | | $ | 5 | | 9.9 | | $ | 115 | | $ | (108) | | $ | 7 | | $ | 91 | | | $ | (90 | ) | | $ | 1 | | | 9.8 | | | $ | 102 | | | $ | (100 | ) | | $ | 2 | |
Trademarks / trade names | | 20 | | | (17) | | 3 | | 20.0 | | | 20 | | (16) | | 4 | |
Trademarks/tradenames | | | 18 | | | (18 | ) | | — | | | — | | | 18 | | | (18 | ) | | — | |
Customer lists | | | 20 | | | (15 | ) | | 5 | | | 3.0 | | | 20 | | | (9 | ) | | 11 | |
| | $ | 141 | | $ | (133) | | $ | 8 | | 14.8 | | $ | 135 | | $ | (124) | | $ | 11 | | $ | 129 | | | $ | (123 | ) | | $ | 6 | | | 4.8 | | | $ | 140 | | | $ | (127 | ) | | $ | 13 | |
| | | | | | | | | | | | | | | | | | | | | | | | | | | | | | |
Indefinite life intangible assets: (1) | | | | | | | | | | | | | | | | | | | | | | | | | | | | | | |
Trademarks / trade names | | | | | | | $ | 9 | | | | | | | | | $ | 9 | |
Other intangible assets, net | | | | | | | $ | 17 | | | | | | | | | $ | 20 | |
Trademarks/tradenames (2) | | | | | | | | $ | 393 | | | | | | | | | | $ | 413 | |
| | | | | | | | $ | 399 | | | | | | | | | | $ | 426 | |
(1)(1) | The change in the ending balances also reflect the derecognition of fully amortized leases during 2023 and the effect of foreign currency fluctuations due primarily to the movements of the euroYen in relation to the U.S. dollar. |
(2)(2) | Includes a non-cash impairment charge of $9 million and $8 million recorded in 2023 and 2022, respectively, see Note 4,Impairment and Other. |
(3) | Represents the weighted-average useful life as of January 30, 2021February 3, 2024 and excludes those assets that are fully amortized. |
NOTES TO CONSOLIDATED FINANCIAL STATEMENTS
9. Other Intangible Assets, net (continued)
Amortizing intangible assets primarily represent the WSS and atmos customer lists and lease acquisition costs, which are amounts that are required to secure prime lease locations, and other lease rights, primarily in Europe. Amortization expense recorded is as follows:
| | | | | | | |
| | | | | | |
($ in millions) | 2020 | | 2019 | | 2018 | | 2023 | | 2022 | | 2021 | |
Amortization expense | $ | 3 | | $ | 3 | | $ | 4 | | $ | 7 | | | $ | 8 | | | $ | 5 | |
Estimated future amortization expense for finite lived intangibles for the next five years is as follows:
| | | |
($ in millions) | | | |
2021 | | $ | 2 |
2022 | | | 2 |
2023 | | | 2 |
2024 | | | 1 |
2025 | | | 1 |
($ in millions) | |
2024 | $ | 5 |
2025 | | 1 |
NOTES TO CONSOLIDATED FINANCIAL STATEMENTS
9. 10.Other Assets
| | | | | | |
($ in millions) | | January 30,
2021 | | February 1,
2020 |
Restricted cash | | $ | 30 | | $ | 29 |
Pension asset | | | 3 | | | 3 |
Auction rate security | | | 7 | | | 7 |
Other | | | 50 | | | 42 |
| | $ | 90 | | $ | 81 |
| | | February 3, | | | January 28, | |
($ in millions) | | 2024 | | | 2023 | |
Restricted cash | | $ | 33 | | | $ | 33 | |
Security deposits | | | 25 | | | | 29 | |
Cross-currency swap contract | | | 7 | | | | — | |
Auction rate security | | | 6 | | | | 6 | |
Pension asset | | | 4 | | | | 4 | |
Other | | | 17 | | | | 20 | |
| | $ | 92 | | | $ | 92 | |
10.11. Accrued and Other Liabilities
| | | | | |
| | | | February 3, | | January 28, | |
($ in millions) | | January 30,
2021 | | February 1,
2020 | | 2024 | | 2023 | |
Taxes other than income taxes | | $ | 96 | | $ | 57 | |
Income taxes payable | | | 81 | | | 4 | |
Other payroll and payroll related costs, excluding taxes | | 73 | | 64 | | $ | 72 | | | $ | 99 | |
Incentive bonuses | | | 72 | | | 28 | | 11 | | | 72 | |
Taxes other than income taxes | | | 60 | | | 69 | |
Property and equipment (1) | | | 48 | | | 39 | |
Rent related costs | | | 33 | | | 35 | |
Customer deposits | | | 49 | | | 45 | | 31 | | | 39 | |
Rent related costs | | 40 | | 20 | |
Property and equipment (1) | | | 33 | | | 40 | |
Advertising | | | 25 | | | 21 | | 31 | | | 30 | |
Loyalty program | | | 31 | | | 29 | |
Income taxes payable | | | 6 | | | 39 | |
Other | | | 91 | | | 64 | | 105 | | | 117 | |
| | $ | 560 | | $ | 343 | | $ | 428 | | | $ | 568 | |
(1)(1) | Accruals for property and equipment are excluded from the Statements of Cash Flows for all years presented. |
11.12. Revolving Credit Facility
In the first quarter of 2020, we borrowed $330 million under our then-existing revolving credit facility. On July 14, 2020, we amended our then-existing revolving credit agreement to provide for
We have a $600 million asset-based revolving credit facility that is scheduled to matureexpire on July 14,2025 (as amended, “2020"2020 Credit Agreement”Agreement").
NOTES TO CONSOLIDATED FINANCIAL STATEMENTS
12. Revolving Credit Facility (continued)
In 2023 and 2021, we entered into amendments to the 2020 Credit Agreement ("Amended Credit Agreement"). On July 15, 2020,The amendments provide for, among other things, (i) reducing the Company repaid all revolvinginterest rates and commitment fees applicable to the loans outstandingand commitments, respectively, as described below, and (ii) reducing the "floor" applicable. The amendments provide that the interest rate applicable to loans drawn under the Amended Credit Agreement.
Under the 2020 Credit Agreement interest is determined,credit facility will be equal to, at our option, by either (1) the eurodollar rate, which is determined by reference to LIBOR, plus a margin of 1.75 percent to 2.25 percent per annum, or (2) the base rate, determined by reference to the federal funds rate, plus a margin of 0.75 percent0.25% to 1.25 percent,0.75% per annum, or a Eurodollar rate, determined by reference to Secured Overnight Financing Rate ("SOFR") plus 1%, plus a margin of 1.25% to 1.75% per annum, in each case.case, depending on availability under the Amended Credit Agreement. In addition, we are payingwill pay a commitment fee of 0.50 percent0.25% per annum on the unused portion of the commitments under the 2020Amended Credit Agreement.
If certain specified events of default have occurred and are continuing, or if availability under the 2020 Credit Agreement is less than or equal to the greater of $60 million and 10 percent of the Loan Cap (as defined in the 2020 Credit Agreement), we are required to test compliance with a minimum consolidated fixed charge coverage ratio of 1.00 to 1.00 as of the end of each fiscal quarter in order to make investments, pay dividends, and repurchase our shares. No events of default occurred during 2020.2023.
Our obligations under the Amended Credit Agreement are secured by a first priority lien on certain assets, including inventory and accounts receivable, cash deposits, and certain insurance proceeds. We may use letters of credit issued pursuant to the 2020Amended Credit Agreement to, among other things, support standby letters of credit in connection with insurance programs. The letters of credit outstanding as of January 30, 2021February 3, 2024 were not significant.
We
During the fourth quarter of 2023, we borrowed varying amounts under our credit facility, with $146 million of aggregate borrowings and no more than $89 million outstanding at any given time. As of February 3, 2024, we had no outstanding borrowings under the credit facility.
The unamortized balance of fees paid fees of $4 million in connection with the amendment of our credit facility and such costs are amortized over the life of the facility. The unamortized balance at January 30, 2021February 3, 2024 was $4$2 million. Interest expense, including facility fees, related to the revolving credit facility was $5 million, $1 million, and $1$3 million for 2020, 2019,each of 2023, 2022, and 2018, respectively.2021.
NOTES TO CONSOLIDATED FINANCIAL STATEMENTS
12.13. Long-Term Debt and Obligations Under Finance Leases
The components of long-term debt and obligations under finance leases are as follows:
| | | | | | |
($ in millions) | | January 30,
2021 | | February 1,
2020 |
8.5% debentures payable January 2022 | | $ | 98 | | $ | 118 |
Unamortized gain related to interest rate swaps (1) | | | 2 | | | 4 |
Obligations under finance leases | | | 10 | | | — |
| | $ | 110 | | $ | 122 |
Current portion of debt and obligations under finance leases | | | 102 | | | — |
| | $ | 8 | | $ | 122 |
| | February 3, | | | January 28, | |
($ in millions) | | 2024 | | | 2023 | |
4% Senior Notes due 2029 | | $ | 395 | | | $ | 395 | |
Obligations under finance leases | | | 52 | | | | 57 | |
| | $ | 447 | | | $ | 452 | |
Current portion of debt and obligations under finance leases | | | 5 | | | | 6 | |
| | $ | 442 | | | $ | 446 | |
(1) | In 2009, we terminated an interest rate swap at a gain. This gain is being amortized as part of interest expense over the remaining term of the debt using the effective-yield method. |
During 2020, we purchased and retired $20 million of our 8.5 percent debentures for $22 million. The remaining principal balance of $98 million is classified as a current liability as of January 30, 2021. Interest expense related to long-term debt and the amortization of the associated debt issuance costs was $8$17 million, $17 million, and $12 million for 2020, 2019,2023, 2022, and 2018.2021, respectively.
13.14. Other Liabilities
| | | | | | | |
| | | | February 3, | | January 28, | |
($ in millions) | | January 30,
2021 | | February 1,
2020 | | 2024 | | 2023 | |
Deferred taxes | | | $ | 140 | | | $ | 237 | |
Pension benefits | | $ | 38 | | $ | 61 | | 38 | | | 21 | |
Income taxes | | | 31 | | | 32 | | 31 | | | 31 | |
Postretirement benefits | | | 12 | | | 10 | |
Workers’ compensation and general liability reserves | | | 8 | | | 8 | |
Deferred taxes | | | 18 | | | 2 | |
Contingent consideration | | | — | | | 4 | |
Other | | | 9 | | | 9 | | 32 | | | 35 | |
| | $ | 116 | | $ | 122 | | $ | 241 | | | $ | 328 | |
\
NOTES TO CONSOLIDATED FINANCIAL STATEMENTS
14.15. Leases
The majority of our leases are operating leases for our company-operated retail store locations. We also lease, among other things, distribution and warehouse facilities, and office space for corporate administrative purposes. Operating lease periods generally range from 5 to 10 years and generally contain rent escalation provisions. Some of the store leases contain renewal options with varying terms and conditions.
Amounts recognized in the Consolidated Balance Sheet were as follows:
| | | | | | | February 3, | | January 28, | |
($ in millions) | ($ in millions) | January 30,
2021 | | February 1,
2020 | | 2024 | | 2023 | |
Operating leases: | | | | | | | | | | | |
Operating lease right-of-use assets | | $ | 2,716 | | $ | 2,899 | | $ | 2,188 | | | $ | 2,443 | |
| | | | | | | | | | |
Operating lease liabilities classified as current | | $ | 580 | | $ | 518 | | $ | 492 | | | $ | 544 | |
Operating lease liabilities classified as long-term | | | 2,499 | | 2,678 | | 2,004 | | | 2,230 | |
Total operating lease liabilities | | $ | 3,079 | | $ | 3,196 | | $ | 2,496 | | | $ | 2,774 | |
| | | | | | |
Finance leases: | | | | | | |
Property and equipment, net | | $ | 10 | | $ | — | |
| | | | | | |
Current portion of debt and obligations under finance leases | | $ | 2 | | $ | — | |
Long-term obligations under finance leases | | | 8 | | — | |
Total finance lease obligations | | $ | 10 | | $ | — | |
| | February 3, | | | January 28, | |
($ in millions) | | 2024 | | | 2023 | |
Finance leases: | | | | | | |
Property and equipment, net | | $ | 47 | | | $ | 53 | |
| | | | | | |
Finance lease obligations classified as current | | $ | 5 | | | $ | 6 | |
Finance lease obligations classified as long-term | | | 47 | | | | 51 | |
Total finance lease obligations | | $ | 52 | | | $ | 57 | |
Other information related to operatingour leases as of February 3, 2024 and January 30, 2021 and February 1, 202028, 2023 consisted of the following:
2020 Form 10-K Page 55
| | February 3, | | | January 28, | |
| | 2024 | | | 2023 | |
Weighted-average remaining lease term (years): | | | | | | |
Operating leases | | | 6.5 | | | | 6.5 | |
Finance leases | | | 14.5 | | | | 14.7 | |
Weighted-average discount rate: | | | | | | |
Operating leases | | | 5.5 | % | | | 5.0 | % |
Finance leases | | | 4.3 | % | | | 4.3 | % |
NOTES TO CONSOLIDATED FINANCIAL STATEMENTS
| | | | | | | |
| | January 30,
2021 | | February 1,
2020 | |
Weighted-average remaining lease term (years) | | | | | | | |
Operating leases | | | 6.7 | | | 7.3 | |
Finance leases | | | 4.4 | | | — | |
Weighted-average discount rate | | | | | | | |
Operating leases | | | 5.0 | % | | 5.4 | % |
Finance leases | | | 4.1 | % | | — | % |
Total lease costs include fixed operating lease costs, variable lease costs, and short-term lease costs. Most of our real estate leases require weus to pay certain expenses, such as CAM costs, real estate taxes, and other executory costs, of which the fixed portion is included in operating lease costs. Variable lease costs include non-lease components which are not fixed and are not included in determining the present value of our lease liability. Variable lease costs also include amounts based on a percentage of gross sales in excess of specified levels that are recognized when probable.
NOTES TO CONSOLIDATED FINANCIAL STATEMENTS
15. Leases (continued)
Lease costs which relate to retail stores and distribution centers are classified within cost of sales, while non-store lease costs are included in SG&A. Amortization of leased equipment assets is classified in depreciation and amortization. The components of lease cost for the years ended January 30, 20212023, 2022, and February 1, 20202021 were as follows:
($ in millions) | | 2023 | | | 2022 | | | 2021 | |
Operating lease costs | | $ | 613 | | | $ | 657 | | | $ | 653 | |
Variable lease costs | | | 304 | | | | 308 | | | | 331 | |
Short-term lease costs | | | 48 | | | | 19 | | | | 23 | |
Sublease income | | | (1 | ) | | | (1 | ) | | | (1 | ) |
Total operating lease costs | | | 964 | | | | 983 | | | | 1,006 | |
Finance lease costs: | | | | | | | | | |
Amortization of leased assets | | | 6 | | | | 6 | | | | 4 | |
Interest on lease liabilities | | | 2 | | | | 3 | | | | 1 | |
Total finance lease costs | | | 8 | | | | 9 | | | | 5 | |
Total lease cost | | $ | 972 | | | $ | 992 | | | $ | 1,011 | |
| | | | | | |
($ in millions) | 2020 | | 2019 |
Operating lease costs: | | $ | 620 | | $ | 668 |
Variable lease costs | | | 290 | | | 332 |
Short-term lease costs | | | 23 | | | 23 |
Sublease income | | | (1) | | | (1) |
Total operating lease costs | | $ | 932 | | $ | 1,022 |
Finance leases costs: | | | | | | |
Amortization of leased assets | | | 1 | | | — |
Total lease cost | | $ | 933 | | $ | 1,022 |
Rent expense for operating leases for 2018, under previous accounting guidance, amounted to $750 million and consisted of minimum and contingent rentals of $728 million and $27 million, respectively, less sublease income of $5 million. Other costs related to our leases, including the amortization of lease rights, totaled $147 million for the year ended February 2, 2019.
Maturities of lease liabilities as of January 30, 2021February 3, 2024 are as follows:
($ in millions) | | Operating leases | | | Finance leases | | | Total | |
2024 | | $ | 598 | | | $ | 8 | | | $ | 606 | |
2025 | | | 523 | | | | 6 | | | | 529 | |
2026 | | | 431 | | | | 4 | | | | 435 | |
2027 | | | 351 | | | | 4 | | | | 355 | |
2028 | | | 285 | | | | 4 | | | | 289 | |
Thereafter | | | 797 | | | | 45 | | | | 842 | |
Total lease payments | | | 2,985 | | | | 71 | | | | 3,056 | |
Less: Interest | | | 489 | | | | 19 | | | | 508 | |
Total lease liabilities | | $ | 2,496 | | | $ | 52 | | | $ | 2,548 | |
| | | | | | | | | |
($ in millions) | Operating leases | | Finance leases | | Total |
2021 | | $ | 718 | | $ | 3 | | $ | 721 |
2022 | | | 624 | | | 3 | | | 627 |
2023 | | | 542 | | | 2 | | | 544 |
2024 | | | 458 | | | 2 | | | 460 |
2025 | | | 366 | | | 1 | | | 367 |
Thereafter | | | 943 | | | — | | | 943 |
Total lease payments | | | 3,651 | | | 11 | | | 3,662 |
Less: Interest | | | 572 | | | 1 | | | 573 |
Total lease liabilities | | $ | 3,079 | | $ | 10 | | $ | 3,089 |
NOTES TO CONSOLIDATED FINANCIAL STATEMENTS
As of January 30, 2021,February 3, 2024, we signed operating leases primarily for retail stores that have not yet commenced and the total future undiscounted lease payments under these leases are $29$227 million.
Supplemental cash flow information related to This amount reflected leases for the year ended January 30, 2021retail stores and February 1, 2020 were as follows:two new distribution centers to support WSS and our European businesses.
| | | | | | |
($ in millions) | 2020 | | 2019 |
Cash paid for amounts included in measurement of operating lease liabilities | | $ | 626 | | $ | 679 |
Right-of-use assets obtained in exchange for lease obligations | | | 331 | | | 322 |
Cash paid for amounts included in measurement of finance lease liabilities | | | 1 | | | — |
Leases obtained in exchange for finance lease obligations | | | 11 | | | — |
15.16. Accumulated Other Comprehensive Loss
AOCL, net
($ in millions) | | 2023 | | | 2022 | | | 2021 | |
Foreign currency translation adjustments | | $ | (173 | ) | | $ | (148 | ) | | $ | (107 | ) |
Hedge contracts | | | (2 | ) | | | (3 | ) | | | — | |
Unrecognized pension cost and postretirement benefit | | | (191 | ) | | | (241 | ) | | | (236 | ) |
| | $ | (366 | ) | | $ | (392 | ) | | $ | (343 | ) |
NOTES TO CONSOLIDATED FINANCIAL STATEMENTS
16. Accumulated Other Comprehensive Loss (continued)
The changes in AOCL for the year ended January 30, 2021February 3, 2024 were as follows:
| | | | | | | | | | | | |
| | Foreign | | | | | Items Related | | | |
| | Currency | | | | | to Pension and | | | |
| | Translation | | Cash Flow | | Postretirement | | | |
($ in millions) | | Adjustments | | Hedges | | Benefits | | Total |
Balance as of February 1, 2020 | | $ | (104) | | $ | (3) | | $ | (287) | | $ | (394) |
| | | | | | | | | | | | |
OCI before reclassification | | | 40 | | | 2 | | | (1) | | | 41 |
Amortization of pension actuarial loss, net of tax | | | — | | | — | | | 8 | | | 8 |
Pension remeasurement, net of tax | | | — | | | — | | | 14 | | | 14 |
Other comprehensive income | | | 40 | | | 2 | | | 21 | | | 63 |
Balance as of January 30, 2021 | | $ | (64) | | $ | (1) | | $ | (266) | | $ | (331) |
($ in millions) | | Foreign Currency Translation Adjustments | | | Hedge Contracts | | | Items Related to Pension and Postretirement Benefits | | | Total | |
Balance as of January 28, 2023 | | $ | (148 | ) | | $ | (3 | ) | | $ | (241 | ) | | $ | (392 | ) |
| | | | | | | | | | | | | |
OCI before reclassification | | | (25 | ) | | | 10 | | | | — | | | | (15 | ) |
Reclassification of hedges, net of tax | | | — | | | | (9 | ) | | | — | | | | (9 | ) |
Amortization of pension actuarial loss, net of tax | | | — | | | | — | | | | 7 | | | | 7 | |
Pension and postretirement remeasurement, net of tax | | | — | | | | — | | | | (13 | ) | | | (13 | ) |
Pension settlement charge, net of tax | | | — | | | | — | | | | 56 | | | | 56 | |
Other comprehensive income | | | (25 | ) | | | 1 | | | | 50 | | | | 26 | |
Balance as of February 3, 2024 | | $ | (173 | ) | | $ | (2 | ) | | $ | (191 | ) | | $ | (366 | ) |
Reclassifications to income from AOCL for the year ended January 30, 2021February 3, 2024 were as follows:
| | | |
($ in millions) | | | |
Amortization of actuarial (gain) loss: | | | |
Pension benefits- amortization of actuarial loss | | $ | 12 |
Postretirement benefits- amortization of actuarial gain | | | (1) |
Net periodic benefit cost (see Note 19) | | | 11 |
Income tax | | | (3) |
Total, net of tax | | $ | 8 |
2020 Form 10-K Page 57
($ in millions) | | | |
Reclassification of hedges: | | | | |
Cross-currency swap | | $ | (9 | ) |
Income tax | | | — | |
Reclassification of hedges, net of tax | | $ | (9 | ) |
| | | | | |
Reclassification of actuarial loss: | | | |
Amortization of pension and postretirement benefits | | $ | 10 | |
Settlement charge | | | 75 | |
Total before tax | | | 85 | |
Income tax | | | (22 | ) |
Reclassification of actuarial loss, net of tax | | $ | 63 | |
Total, net of tax | | $ | 54 | |
NOTES TO CONSOLIDATED FINANCIAL STATEMENTS
16.17. Income Taxes
The domestic and international components of pre-tax (loss) income are as follows:
| | | | | | | | | |
($ in millions) | | 2020 | | 2019 | | 2018 |
Domestic | | $ | 647 | | $ | 591 | | $ | 629 |
International | | | (153) | | | 81 | | | 84 |
Total pre-tax income | | $ | 494 | | $ | 672 | | $ | 713 |
($ in millions) | | 2023 | | | 2022 | | | 2021 | |
Domestic | | $ | (381 | ) | | $ | 440 | | | $ | 1,244 | |
International | | | (42 | ) | | | 84 | | | | (4 | ) |
Total pre-tax (loss) income | | $ | (423 | ) | | $ | 524 | | | $ | 1,240 | |
Domestic pre-tax (loss) income includes the results of non-U.S. businesses that are operated in branches owned directly by the U.S. which, therefore, are subject to U.S. income tax.
NOTES TO CONSOLIDATED FINANCIAL STATEMENTS
17. Income Taxes (continued)
The income tax provision consists of the following:
| | | | | | | | | |
($ in millions) | | 2020 | | 2019 | | 2018 |
Current: | | |
Federal | | $ | 114 | | $ | 106 | | $ | 91 |
State and local | | | 43 | | | 39 | | | 42 |
International | | | 23 | | | 31 | | | 30 |
Total current tax provision | | | 180 | | | 176 | | | 163 |
Deferred: | | | | | | | | | |
Federal | | | 6 | | | (1) | | | (4) |
State and local | �� | | (2) | | | — | | | 1 |
International | | | (13) | | | 6 | | | 12 |
Total deferred tax (benefit) provision | | | (9) | | | 5 | | | 9 |
Total income tax provision | | $ | 171 | | $ | 181 | | $ | 172 |
($ in millions) | | 2023 | | | 2022 | | | 2021 | |
Current: | | | | | | | | | |
Federal | | $ | 8 | | | $ | 64 | | | $ | 192 | |
State and local | | | 2 | | | | 27 | | | | 66 | |
International | | | 33 | | | | 68 | | | | 16 | |
Total current tax provision | | | 43 | | | | 159 | | | | 274 | |
Deferred: | | | | | | | | | | | | |
Federal | | | (88 | ) | | | 23 | | | | 49 | |
State and local | | | (24 | ) | | | 4 | | | | 15 | |
International | | | (24 | ) | | | (6 | ) | | | 10 | |
Total deferred tax provision | | | (136 | ) | | | 21 | | | | 74 | |
Total income tax provision | | $ | (93 | ) | | $ | 180 | | | $ | 348 | |
Following the enactment of Public Law 115-97 (“115-97 ("Tax Act”Act") and the one-timeone-time transition tax, our historical foreign earnings are not subject to additional U.S. federal tax upon repatriation. Further, no additional U.S. federal tax will be due upon repatriation of current foreign earnings because they are either exempt or subject to U.S. tax as earned.
At January 30, 2021,February 3, 2024, we had accumulated undistributed foreign earnings of approximately $631$511 million. This amount consists of historical earnings that were previously taxed under the Tax Act and post-Tax Act earnings. Investments in our foreign subsidiaries, including working capital, will continue to be permanently reinvested. Cash balances in excess of working capital needs are considered to be available for repatriation to the United States and foreign withholding taxes will be accrued as necessary on these amounts.
We have not recorded a deferred tax liability for the difference between the financial statement carrying amount and the tax basis of our investments in foreign subsidiaries. The determination of any unrecorded deferred tax liability on this amount is not practicable due to the uncertainty of how these investments would be recovered.
A reconciliation of the significant differences between the federal statutory income tax rate and the effective income tax rate on pre-tax (loss) income is as follows:
| | | | | | | | |
| | 2020 | | 2019 | | 2018 | | | 2023 | | 2022 | | 2021 | |
Federal statutory income tax rate | | 21.0 | % | 21.0 | % | 21.0 | % | | 21.0 | % | | 21.0 | % | | 21.0 | % |
Deemed repatriation tax | | — | | — | | (2.7) | | |
Increase in valuation allowance | | 6.3 | | 1.0 | | 2.4 | | | (0.6 | ) | | 2.6 | | | 0.7 | |
State and local income taxes, net of federal tax benefit | | 6.6 | | 4.5 | | 4.7 | | | 5.4 | | | 5.0 | | | 5.4 | |
International income taxed at varying rates | | 4.3 | | 1.9 | | 1.6 | | | (4.4 | ) | | 8.4 | | | 2.4 | |
Foreign tax credits | | (2.4) | | (2.0) | | (2.1) | | | 1.4 | | | (3.6 | ) | | (1.4 | ) |
Domestic/foreign tax settlements | | (0.5) | | — | | (0.7) | | | 1.0 | | | (0.5 | ) | | (0.3 | ) |
Federal tax credits | | (0.4) | | (0.2) | | (0.2) | | | 0.5 | | | (0.4 | ) | | (0.1 | ) |
Foreign deferred adjustment | | | (2.0 | ) | | — | | — | |
Other, net | | (0.4) | | 0.8 | | 0.1 | | | (0.3 | ) | | 1.8 | | | 0.4 | |
Effective income tax rate | | 34.5 | % | 27.0 | % | 24.1 | % | | 22.0 | % | | 34.3 | % | | 28.1 | % |
NOTES TO CONSOLIDATED FINANCIAL STATEMENTS
17. Income Taxes (continued)
NOTES TO CONSOLIDATED FINANCIAL STATEMENTS
Deferred income taxes are provided for the effects of temporary differences between the amounts of assets and liabilities recognized for financial reporting purposes and the amounts recognized for income tax purposes. Items that give rise to significant portions of our deferred tax assets andare as follows:
| | February 3, | | | January 28, | |
($ in millions) | | 2024 | | | 2023 | |
Deferred tax assets: | | | | | | |
Tax loss/credit carryforwards and capital loss | | $ | 166 | | | $ | 123 | |
Employee benefits | | | 32 | | | | 42 | |
Operating leases - liabilities | | | 668 | | | | 725 | |
Other | | | 62 | | | | 61 | |
Total deferred tax assets | | $ | 928 | | | $ | 951 | |
Valuation allowance | | | (95 | ) | | | (93 | ) |
Total deferred tax assets, net | | $ | 833 | | | $ | 858 | |
Items that give rise to significant portions of our deferred tax liabilities are as follows:
| | | February 3, | | January 28, | |
($ in millions) | | 2020 | | 2019 | | 2024 | | 2023 | |
Deferred tax assets: | | | |
Tax loss/credit carryforwards and capital loss | | $ | 120 | | $ | 54 | |
Employee benefits | | | 52 | | | 40 | |
Property and equipment | | | 13 | | | 30 | |
Goodwill and other intangible assets | | | — | | | 14 | |
Operating leases - liabilities | | | 811 | | 844 | |
Other | | | 39 | | | 29 | |
Total deferred tax assets | | $ | 1,035 | | $ | 1,011 | |
Valuation allowance | | | (76) | | | (39) | |
Total deferred tax assets, net | | $ | 959 | | $ | 972 | |
Deferred tax liabilities: | | | | | | | | | | |
Merchandise inventories | | $ | 62 | | $ | 86 | | $ | 97 | | | $ | 87 | |
Operating leases - assets | | | 746 | | 794 | | 611 | | | 667 | |
Goodwill and other intangible assets | | | 13 | | — | | 118 | | | 123 | |
Net investment gains | | | 46 | | — | | — | | | 115 | |
Property and equipment | | | 24 | | | 6 | |
Other | | | 9 | | | 13 | | 9 | | | 7 | |
Total deferred tax liabilities | | $ | 876 | | $ | 893 | | $ | 859 | | | $ | 1,005 | |
Net deferred tax asset | | $ | 83 | | $ | 79 | |
Net deferred tax liability | | | $ | (26 | ) | | $ | (147 | ) |
Balance Sheet caption reported in: | | | | | | | | | | |
Deferred taxes | | $ | 101 | | $ | 81 | | $ | 114 | | | $ | 90 | |
Other liabilities | | | (18) | | | (2) | | (140 | ) | | (237 | ) |
| | $ | 83 | | $ | 79 | | $ | (26 | ) | | $ | (147 | ) |
Based upon the level of historical taxable income and projections for future taxable income, which are based upon our long-range strategic plans, management believes it is more likely than not that we will realize the benefits of deductible differences, net of the valuation allowances, at January 30, 2021, over the periods in which the temporary differences are anticipated to reverse. However, the amount of the deferred tax asset considered realizable could be adjusted in the future if estimates of taxable income are revised.
As of January 30, 2021,February 3, 2024, we have a valuation allowance of $76$95 million to reduce our deferred tax assets to an amount that is more likely than not to be realized. A valuation allowance of $67$73 million was recorded against tax loss carryforwards of certain foreign entities. Based on the history of losses and the absence of prudent and feasible business plans for generating future taxable income in these entities, we believe it is more likely than not that the benefit of these loss carryforwards will not be realized. As of January 30, 2021,February 3, 2024, a valuation allowance of $8$20 million was established for foreign taxes assessed at rates in excess of the U.S. federal tax rate for which no U.S. foreign tax credit is available. Additionally, since we do not have any reasonably foreseeable sources of Canadian capital gains in the U.S. or Canada, a valuation allowance of $1$2 million was established since 2019 for ato offset deferred tax asset arising from aassets on capital loss associated with an uncollectible Canadian note receivable.losses.
NOTES TO CONSOLIDATED FINANCIAL STATEMENTS
17. Income Taxes (continued)
At January 30, 2021,February 3, 2024, we have international minimum tax credit carryforwards with a potential tax benefit of $4$3 million and operating loss carryforwards with a potential tax benefit of $103$132 million, a portion of which will expire between 20212024 and 20272038 and a portion of which will never expire. We will have, when realized, a capital loss with a potential benefit of $1 million arising from a Canadian note receivable. The Canadian loss will carryforward indefinitely after realization. The international operating loss carryforwards do not include unrecognized tax benefits. The Canadian capital loss of $1 million will carry forward indefinitely and the U.S. capital losses of $10 million can be carried back 3 years and forward for 5 years after realization. We also have foreign tax credit carrybacks and carryforwards with a potential tax benefit of $12$20 million that will expire between 20212029 and 2030.2033.
NOTES TO CONSOLIDATED FINANCIAL STATEMENTS
We operate in multiple taxing jurisdictions and are subject to audit. Audits can involve complex issues that may require an extended period of time to resolve. A taxing authority may challenge positions that we have adopted in our income tax filings. Accordingly, we may apply different tax treatments for transactions in filing itsthe income tax returns than for income tax financial reporting. We regularly assess our tax positions for such transactions and record reserves for those differences.
Our 2019 We participate in the IRS's Compliance Assurance Process and the examination of our 2022 U.S. Federal income tax filing is under examination by the Internal Revenue Service. We expect to conclude the examinationwas concluded in the first quarter of 2021. We are participating in the IRS’s Compliance Assurance Process (“CAP”) for 2021 and 2020. The 2020 CAP is expected to conclude during 2021. We are subject to state and local tax examinations from 2017 to the present. February 2024. To date, no adjustments have been proposed in any audits that will have a material effect on our financial position or results of operations.
At January 30, 2021,February 3, 2024, we had $47$50 million of gross unrecognized tax benefits, of which $35$43 million would, if recognized, affect our annual effective tax rate. We classified certain income tax liabilities as current or noncurrent based on management’s estimate of when these liabilities will be settled. Interest expense and penalties related to unrecognized tax benefits are classified as income tax expense. We recognized $1interest income of $2 million ofin 2023 and interest expense in both 2020 and 2019. Interest was not significant for 2018. The total amount of accrued interest and penalties was $3 million, $2 million, and $1$6 million in 2020, 2019, and 2018, respectively.2022, the amount in 2021 was not significant.
The following table summarizes the activity related to unrecognized tax benefits:
($ in millions) | | 2023 | | | 2022 | | | 2021 | |
Unrecognized tax benefits at beginning of year | | $ | 52 | | | $ | 41 | | | $ | 47 | |
Foreign currency translation adjustments | | | — | | | | (1 | ) | | | (2 | ) |
Increases related to current year tax positions | | | 5 | | | | 9 | | | | 3 | |
Increases related to prior period tax positions | | | 2 | | | | 7 | | | | 2 | |
Decreases related to prior period tax positions | | | — | | | | — | | | | (3 | ) |
Settlements | | | (5 | ) | | | — | | | | (1 | ) |
Lapse of statute of limitations | | | (4 | ) | | | (4 | ) | | | (5 | ) |
Unrecognized tax benefits at end of year | | $ | 50 | | | $ | 52 | | | $ | 41 | |
| | | | | | | | | |
($ in millions) | | 2020 | | 2019 | | 2018 |
Unrecognized tax benefits at beginning of year | | $ | 45 | | $ | 34 | | $ | 44 |
Foreign currency translation adjustments | | | 3 | | | (1) | | | (3) |
Increases related to current year tax positions | | | 2 | | | 3 | | | 2 |
Increases related to prior period tax positions | | | 3 | | | 12 | | | 9 |
Decreases related to prior period tax positions | | | — | | | — | | | (13) |
Settlements | | | (1) | | | (2) | | | (3) |
Lapse of statute of limitations | | | (5) | | | (1) | | | (2) |
Unrecognized tax benefits at end of year | | $ | 47 | | $ | 45 | | $ | 34 |
It is reasonably possible that the liability associated with our unrecognized tax benefits will increase or decrease within the next twelve months. These changes may be the result of foreign currency fluctuations, ongoing audits, or the expiration of statutes of limitations. Settlements during 20212024 are not expected to be significant based on current estimates. Audit outcomes and the timing of audit settlements are subject to significant uncertainty. Although management believes that adequate provision has been made for such issues, the ultimate resolution could have an adverse effect on our earnings. Conversely, if these issues are resolved favorably in the future, the related provision would be reduced, generating a positive effect on earnings.
Due to the uncertainty of amounts and in accordance with our accounting policies, we have not recorded any potential consequences of these settlements. In addition, to the extent there are settlements in the future for certain foreign unrecognized tax benefits, the transition tax may also be revised accordingly.
17.18. Financial Instruments and Risk Management
We operate internationally and utilize certain derivative financial instruments to mitigate our foreign currency exposures, primarily related to third-partythird-party and intercompany forecasted transactions. As a result of the use of derivative instruments, we are exposed to the risk that counterparties will fail to meet their contractual obligations. To mitigate this counterparty credit risk, we have a practice of entering into contracts with major financial institutions selected based upon their credit ratings and other financial factors. We monitor the creditworthiness of counterparties throughout the duration of the derivative instrument.
NOTES TO CONSOLIDATED FINANCIAL STATEMENTS
18. Financial Instruments and Risk Management (continued)
Derivative Holdings Designated as Hedges
For a derivative to qualify as a hedge at inception and throughout the hedged period, we formally document the nature of the hedged items and the relationships between the hedging instruments and the hedged items, as well as our risk-management objectives, strategies for undertaking the various hedge transactions, and the methods of assessing hedge effectiveness and ineffectiveness. In addition, for hedges of forecasted transactions, the significant characteristics and expected terms of a forecasted transaction must be specifically identified, and it must be probable that each forecasted transaction would occur. If it were deemed probable that the forecasted transaction would not occur, the gain or loss on the derivative instrument would be recognized in earnings immediately. Gains or losses recognized in earnings for any of the periods presented were not significant. Derivative financial instruments qualifying for hedge accounting must maintain a specified level of effectiveness between the hedging instrument and the item being hedged, both at inception and throughout the hedged period, which we evaluate periodically.
The primary currencies to which we are exposed are the euro, British pound, Canadian dollar, Australian dollar, and Australian dollar.the Japanese Yen. Generally, merchandise inventories are purchased by each geographic area in their respective local currency with the exception of the United Kingdom, whose merchandise inventory purchases are primarily denominated in euros. In 2024, our business in the United Kingdom plans to begin purchasing merchandise inventory in its local currency.
For option and foreign exchange forward contracts designated as cash flow hedges of the purchase of inventory, the effective portion of gains and losses is deferred as a component of AOCL and is recognized as a component of cost of sales when the related inventory is sold. The amount reclassified to cost of sales related to such contracts was not significant for any of the periods presented. The effective portion of gains or losses associated with other forward contracts is deferred as a component of AOCL until the underlying transaction is reported in earnings. The ineffective portion of gains and losses related to cash flow hedges recorded to earnings was not significant for any of the periods presented. When using
On May 6, 2022, we entered into a forwardcross-currency swap contract asto reduce the effect of the fluctuating U.S. Dollar ("USD") to Japanese Yen ("JPY") foreign exchange rate on our foreign currency-denominated intercompany loan between our Japanese and U.S. subsidiary. We expect the gains and losses on this contract to offset losses and gains on the hedged transaction in an effort to reduce the earnings volatility resulting from the remeasurement of the principal and interest accrued on the loan. Though the intercompany loan eliminates in consolidation, the foreign currency remeasurement of the loan and interest by the U.S. subsidiary is reflected in the consolidated financial statements.
The cross-currency swap contract has a notional amount of JPY 11 billion and final receipt of $85 million. The cross-currency swap contract, which matures on November 2, 2031, swaps Yen-denominated interest payments for U.S. dollar-denominated interest payments, thereby economically converting the JPY 11 billion fixed-rate 3.51% intercompany loan to a fixed-rate 6.77% USD-denominated receivable for our U.S. subsidiary.
We designated the cross-currency swap contract to hedge the changes in value of the intercompany loan and its variability on earnings. We apply fair value hedge accounting, and we consider market factors other than the change in the spot exchange rate on the notional amount of the swap to be excluded components. The foreign currency spot rate fluctuations on the cross-currency swap notional amount and interest accruals are reported in earnings each period, while all other changes are reported in other comprehensive income. Because the terms of the hedged item and the hedging instrument we excludematch and the timelikelihood of swap counterparty default is not probable, the hedge is expected to exactly offset changes in the fair value of the foreign currency debt resulting from to foreign currency fluctuations over the term of the swap.
As of February 3, 2024 and January 28, 2023, the cross-currency swap had a fair value of $7 million included in other assets and $3 million liability included in other liabilities, respectively. We record the changes in the fair value of the contract fromto AOCL. Each period, we reclassify an amount out of AOCL equal to the assessment of effectiveness.
The notional value ofremeasurement gain or loss on the contracts outstanding at January 30, 2021hedged intercompany loan that is recorded in selling, general and February 1, 2020 was $69 million and $92 million, respectively.administrative expenses. As of February 3, 2024 and January 30, 2021, all of our hedged forecasted transactions extend less than twelve months into the future, and we expect all derivative-related amounts reported in AOCL to be reclassified to earnings within twelve months. The loss in AOCL as of January 30, 2021 and February 1, 202028, 2023, there was $1$2 million and $3 million in AOCL, net of tax, related to the cross-currency swap, respectively. In addition, we recognize swap interest income based on the differential in fixed interest rates per the contract. During 2023 and 2022, we recorded $3 million and $2 million of income in interest expense, net, respectively. Refer to Note 16 for further information regarding amounts recorded in AOCL.
Derivative Holdings Not Designated as Hedges
We enter into certain derivative contracts that are not designated as hedges, such as foreign exchange forward contracts and currency option contracts. These derivative contracts are used to manage certain costs of foreign currency-denominated merchandise purchases, intercompany transactions, and the effect of fluctuating foreign exchange rates on the reporting of foreign currency-denominated earnings. Changes in the fair value of derivative holdings not designated as hedges, as well as realized gains and premiums paid, are recorded in earnings immediately within SG&A or Other (expense) income, net, depending on the type of transaction. The aggregate amount recognized for these contracts was not significant for any of the periods presented.
The notional value
NOTES TO CONSOLIDATED FINANCIAL STATEMENTS
18. Financial Instruments and February 1, 2020 was $135 million and $1 million, respectively. The foreign exchange forward contracts outstanding at January 30, 2021 extend less than twelve months into the future.Risk Management (continued)
Fair Value of Derivative Contracts
The following represents the fair value of our derivative contracts.
| | | | | | | |
| | Balance Sheet | | January 30, | | February 1, | Balance Sheet | | February 3, | | January 28, | |
($ in millions) | | Caption | | 2021 | | 2020 | Caption | | 2024 | | 2023 | |
Hedging Instruments: | | | | | | | | | | | | |
Foreign exchange forward contracts | | Current assets | | $ | 1 | | $ | — | Current assets | | $ | 1 | | | $ | — | |
Foreign exchange forward contracts | | Current liabilities | | $ | 1 | | $ | 4 | |
Cross-currency swap contract | | Non-current assets | | $ | 7 | | | $ | — | |
Cross-currency swap contract | | Non-current liabilities | | $ | — | | $ | 3 | |
NOTES TO CONSOLIDATED FINANCIAL STATEMENTS
Notional Values and Foreign Currency Exchange Rates
The table below presents the notional amounts for all outstanding derivatives and the weighted-average exchange rates of foreign exchange forward contracts at January 30, 2021:
| | | | | |
| | | | | Weighted-Average |
($ in millions) | | | Contract Value | | Exchange Rate |
Inventory | | | | | |
Buy €/Sell British £ | | $ | 69 | | 0.9058 |
| | | | | |
Intercompany | | | | | |
Buy US $/Sell CAD $ | | $ | 1 | | 1.2761 |
Buy US $/Sell AUD $ | | $ | 1 | | 1.3154 |
Buy British £/ Sell € | | $ | 41 | | 1.1017 |
Buy US $/ Sell € | | $ | 91 | | 0.8211 |
Business Risk
The retail business is highly competitive. Price, quality, selection of merchandise, reputation, store location, advertising, and customer experience are important competitive factors in our business. We operate in 2726 countries and purchased approximately 91 percent84% and 86% of our merchandise in 2020 from our top 5 suppliers. suppliers in 2023 and 2022, respectively. In 2020,both 2023 and 2022, we purchased approximately 75 percent65% of our athletic merchandise from one major supplier, Nike, Inc. (“Nike”). Each of our operating divisions is highly dependent on Nike; they individually purchased 47 to 82 percent of their merchandise from Nike.
Included in our Consolidated Balance Sheet at January 30, 2021,February 3, 2024, are the net assets of our European operations, which total $283$537 million and are located in 1920 countries, 11 of which have adopted the euro as their functional currency.
18.19. Fair Value Measurements
We categorize our financial instruments into a three-levelthree-level fair value hierarchy that prioritizes the inputs to valuation techniques used to measure fair value into three broad levels. The fair value hierarchy gives the highest priority to quoted prices in active markets for identical assets or liabilities (Level 1)1) and the lowest priority to unobservable inputs (Level 3)3). If the inputs used to measure fair value fall within different levels of the hierarchy, the category level is based on the lowest priority level input that is significant to the fair value measurement of the instrument.
Fair value is determined based upon the exit price that would be received to sell an asset or paid to transfer a liability in an orderly transaction between market participants exclusive of any transaction costs. Our financial assets recorded at fair value are categorized as follows:
Level 1 - Quoted prices for identical instruments in active markets.
Level1- | Quoted prices for identical instruments in active markets. |
Level2 - | Observable inputs other than quoted prices included within Level 1, including quoted prices for similar instruments in active markets; quoted prices for identical or similar instruments in markets that are not active; and model-derived valuations in which all significant inputs or significant value-drivers are observable in active markets. |
Level3- | Model-derived valuations in which one or more significant inputs or significant value-drivers are unobservable. |
Level 2 - Observable inputs other than quoted prices included within Level 1, including quoted prices for similar instruments in active markets; quoted prices for identical or similar instruments in markets that are not active; and model-derived valuations in which all significant inputs or significant value-drivers are observable in active markets.
Level 3 - Model-derived valuations in which one or more significant inputs or significant value-drivers are unobservable.
Our auction rate security, classified as available-for-sale, is recorded within Other assets on the Consolidated Balance Sheet and is recorded at fair value with gains and losses reported in Other (expense) income, net in our Consolidated Statements of Operations. The fair value of the auction rate security is determined by using quoted prices for similar instruments in active markets and accordingly is classified as a Level 2 instrument.
2020 Form 10-K Page 63The fair value of the contingent consideration liability associated with the atmos acquisition is estimated using an option pricing model simulation that determines an average projected payment value across numerous iterations. See Note 1 for further details.
NOTES TO CONSOLIDATED FINANCIAL STATEMENTS
Our derivative financial instruments are valued using market-based inputs to valuation models. These valuation models require a variety of inputs, including contractual terms, market prices, yield curves, and measures of volatility and therefore are classified as Level 2 instruments.
NOTES TO CONSOLIDATED FINANCIAL STATEMENTS
19. Fair Value Measurements (continued)
Assets and Liabilities Measured at Fair Value on a Recurring Basis
| | | | | | | | | | | | | | | | | | |
($ in millions) | | As of January 30, 2021 | | As of February 1, 2020 |
| | Level 1 | | Level 2 | | Level 3 | | Level 1 | | Level 2 | | Level 3 |
Assets | | | | | | | | | | | | | | | | | | |
Available-for-sale security | | $ | — | | $ | 7 | | $ | — | | $ | — | | $ | 7 | | $ | — |
Foreign exchange forward contracts | | | — | | | 1 | | | — | | | — | | | — | | | — |
Total Assets | | $ | — | | $ | 8 | | $ | — | | $ | — | | $ | 7 | | $ | — |
| | | | | | | | | | | | | | | | | | |
Liabilities | | | | | | | | | | | | | | | | | | |
Foreign exchange forward contracts | | $ | — | | $ | 1 | | $ | — | | $ | — | | $ | 4 | | $ | — |
Total Liabilities | | $ | — | | $ | 1 | | $ | — | | $ | — | | $ | 4 | | $ | — |
($ in millions) | | February 3, 2024 | | | January 28, 2023 | |
| | Level 1 | | | Level 2 | | | Level 3 | | | Level 1 | | | Level 2 | | | Level 3 | |
Assets: | | | | | | | | | | | | | | | | | | | | | | | | |
Available-for-sale security | | $ | — | | | $ | 6 | | | $ | — | | | $ | — | | | $ | 6 | | | $ | — | |
Foreign exchange forward contracts | | | — | | | | 1 | | | | — | | | | — | | | | — | | | | — | |
Cross-currency swap contract | | | — | | | | 7 | | | | — | | | | — | | | | — | | | | — | |
Total assets | | $ | — | | | $ | 14 | | | $ | — | | | $ | — | | | $ | 6 | | | $ | — | |
Liabilities: | | | | | | | | | | | | | | | | | | | | | | | | |
Contingent consideration | | $ | — | | | $ | — | | | $ | — | | | $ | — | | | $ | — | | | $ | 4 | |
Cross-currency swap contract | | | — | | | | — | | | | — | | | | — | | | | 3 | | | | — | |
Total liabilities | | $ | — | | | $ | — | | | $ | — | | | $ | — | | | $ | 3 | | | $ | 4 | |
There were 0no transfers into or out of Level 1, Level 2, or Level 3 for any of the periods presented.
Assets and Liabilities Measured at Fair Value on a Nonrecurring Basis
Certain assets and liabilities are measured at fair value on a nonrecurring basis. Assets and liabilities recognized or disclosed at fair value on the consolidated financial statements on a nonrecurring basis include items such as property, plant and equipment, operating lease right-of-use assets, goodwill, other intangible assets, and minority investments that are not accounted for under the equity method of accounting. These assets are measured using Level 3 inputs, if determined to be impaired.
We have a minority investment that is accounted for using the fair value measurement alternative, which is at cost adjusted for changes in observable prices minus impairment under the practicability exception. During 2023, we recognized a $478 million non-cash impairment charge related to our investment, thereby reducing the carrying value to $134 million. We estimated the fair value using both a discounted cash flow approach and a market approach, which consider forecasted cash flows provided by the investee's management, as well as assumptions over discount rates, terminal values, and selected comparable companies.
As of February 3, 2024, cumulative impairments on our portfolio of minority investments, including the impairment of $478 million recorded during 2023, were $531 million.
Long-Term Debt
The fair value of long-term debt is determined by using model-derived valuations in which all significant inputs or significant value-drivers are observable in active markets and therefore are classified as Level 2.
| | | February 3, | | | January 28, | |
($ in millions) | | 2024 | | | 2023 | |
Carrying value (1) | | $ | 395 | | | $ | 395 | |
Fair value | | $ | 337 | | | $ | 338 | |
| | | | | | |
($ in millions) | | January 30,
2021 | | February 1,
2020 |
Carrying value | | $ | 100 | | $ | 122 |
Fair value | | $ | 106 | | $ | 135 |
(1) | The carrying value of debt for both periods reflected $5 million of issuer’s discount and costs related to 4% Notes due in 2029. |
The carrying values of cash and cash equivalents, restricted cash, and other current receivables and payables approximate their fair value.
NOTES TO CONSOLIDATED FINANCIAL STATEMENTS
19.20. Retirement Plans and Other Benefits
Pension and Other Postretirement Plans
We have defined benefit pension plans covering certain of our North American employees. In May 2019, the U.S. qualified pension plan was amended such that all employees who were not participants in the plan as of December 31,2019, will not become participants after such date. All benefit accruals were frozen as of December 31,2019 for all plan participants with less than eleven years of service as of December 31, 2019.that date. For participants with more than eleven years of service as of December 31,2019, benefit accruals will bewere frozen as of December 31,2022. Participants will continue to accrue interest at a fixed rate of 6 percent6% per year.
We also sponsor postretirement medical and life insurance plans, which are available to most of our retired U.S. employees. These plans are contributory and are not funded. The measurement date of the assets and liabilities is the month-end date that is closest to our fiscal year end.These plans are not significant.
The following tables set forth the plans’ changes in benefit obligations and plan assets, funded status, and amounts recognized in the Consolidated Balance Sheets:
2020 Form 10-K Page 64Sheets related to our pension plans:
($ in millions) | 2023 | | 2022 | |
Change in benefit obligation: | | | | | | |
Benefit obligation at beginning of year | $ | 566 | | $ | 674 | |
Service cost | | 6 | | | 14 | |
Interest cost | | 27 | | | 21 | |
Actuarial gains | | (6 | ) | | (93 | ) |
Foreign currency translation adjustments | | — | | | (2 | ) |
Benefits paid | | (35 | ) | | (48 | ) |
Settlement | | (127 | ) | | — | |
Benefit obligation at end of year | $ | 431 | | $ | 566 | |
| | | | |
Change in plan assets: | | | | |
Fair value of plan assets at beginning of year | $ | 546 | | $ | 676 | |
Actual return on plan assets | | 4 | | | (83 | ) |
Employer contributions | | 3 | | | 3 | |
Foreign currency translation adjustments | | — | | | (2 | ) |
Benefits paid | | (35 | ) | | (48 | ) |
Settlement | | (124 | ) | | — | |
Fair value of plan assets at end of year | $ | 394 | | $ | 546 | |
| | | | |
Funded status | $ | (37 | ) | $ | (20 | ) |
| | | | |
Amounts recognized on the balance sheet: | | | | |
Other assets | $ | 4 | | $ | 4 | |
Accrued and other liabilities | | (3 | ) | | (3 | ) |
Other liabilities | | (38 | ) | | (21 | ) |
| $ | (37 | ) | $ | (20 | ) |
NOTES TO CONSOLIDATED FINANCIAL STATEMENTS
| | | | | | | | | | | | |
| | Pension Benefits | Postretirement Benefits |
($ in millions) | | 2020 | | 2019 | | 2020 | | 2019 |
Change in benefit obligation | | | | | | | | | | | | |
Benefit obligation at beginning of year | | $ | 775 | | $ | 739 | | $ | 11 | | $ | 12 |
Service cost | | | 14 | | | 20 | | | — | | | — |
Interest cost | | | 21 | | | 27 | | | — | | | — |
Plan participants’ contributions | | | — | | | — | | | 1 | | | 1 |
Actuarial loss | | | 8 | | | 76 | | | 2 | | | — |
Foreign currency translation adjustments | | | 2 | | | (1) | | | — | | | — |
Benefits paid | | | (67) | | | (85) | | | (1) | | | (2) |
Settlement | | | — | | | (1) | | | — | | | — |
Benefit obligation at end of year | | $ | 753 | | $ | 775 | | $ | 13 | | $ | 11 |
| | | | | | | | | | | | |
Change in plan assets | | | | | | | | | | | | |
Fair value of plan assets at beginning of year | | $ | 715 | | $ | 644 | | | | | | |
Actual return on plan assets | | | 65 | | | 100 | | | | | | |
Employer contributions | | | 1 | | | 57 | | | | | | |
Foreign currency translation adjustments | | | 2 | | | (1) | | | | | | |
Benefits paid | | | (67) | | | (85) | | | | | | |
Fair value of plan assets at end of year | | $ | 716 | | $ | 715 | | | | | | |
| | | | | | | | | | | | |
Funded status | | $ | (37) | | | (60) | | $ | (13) | | $ | (11) |
| | | | | | | | | | | | |
Amounts recognized on the consolidated balance sheet: | | | | | | | | | | | | |
Other assets | | $ | 3 | | $ | 3 | | $ | — | | $ | — |
Accrued and other liabilities | | | (2) | | | (2) | | | (1) | | | (1) |
Other liabilities | | | (38) | | | (61) | | | (12) | | | (10) |
| | $ | (37) | | $ | (60) | | $ | (13) | | $ | (11) |
The Canadian qualified pension plan’s assets exceeded its accumulated benefit obligation for both 20202023 and 2019.2022. Our non-qualified pension plans have an accumulated benefit obligation in excess of plan assets, as these plans are unfunded. Accordingly, the table below reflects both the U.S. qualified plan and the non-qualified plans for both 2020plans.
($ in millions) | | 2023 | | | 2022 | |
Projected benefit obligation | | $ | 400 | | | $ | 533 | |
Accumulated benefit obligation | | | 400 | | | | 533 | |
Fair value of plan assets | | | 359 | | | | 509 | |
NOTES TO CONSOLIDATED FINANCIAL STATEMENTS
20. Retirement Plans and 2019.Other Benefits (continued)
| | | | | | |
($ in millions) | | 2020 | | 2019 |
Projected benefit obligation | | $ | 706 | | $ | 727 |
Accumulated benefit obligation | | | 706 | | | 727 |
Fair value of plan assets | | | 666 | | | 664 |
The following table provides the amounts recognized in AOCL on a pre-tax basis:
| | | | | | |
| | Pension | | Postretirement |
($ in millions) | | Benefits | | Benefits |
Net actuarial loss (gain) at beginning of year | | $ | 392 | | $ | (5) |
Amortization of net (loss) gain | | | (12) | | | 1 |
(Gain) loss arising during the year | | | (20) | | | 2 |
Foreign currency fluctuations | | | 1 | | | — |
Net actuarial loss (gain) at end of year | | $ | 361 | | $ | (2) |
2020 Form 10-K Page 65basis related to the pension plans:
($ in millions) | | | |
Net actuarial loss at beginning of year | | $ | 329 | |
Amortization of net loss | | | (11 | ) |
Loss arising during the year | | | 19 | |
Settlement charge | | | (75 | ) |
Net actuarial loss at end of year | | $ | 262 | |
NOTES TO CONSOLIDATED FINANCIAL STATEMENTS
The actuarial losses incurredrecognized during 20202023 were primarily driven from a decreaseby lower actual return as compared with the expected return on plan assets and updated assumptions based on recent experience, partially offset by an increase in discount rates applied against future expected benefit payments, andwhich resulted in an increasea decrease in the benefit obligation for the pension benefit plans. This was partially offset by higher actual return over expected return on
During the fourth quarter of 2023, as part of our efforts to reduce pension plan obligations, we transferred approximately $109 million of our U.S. Qualified pension plan registered assets and liability gains fromliabilities to an insurance company through the U.S. qualified plan.purchase of a group annuity contract, under which an insurance company is required to directly pay and administer pension payments to certain of our pension plan participants, or their designated beneficiaries. In connection with this transaction, we recorded a non-cash pretax settlement charge of $75 million. The settlement charge was calculated based on the total of the lump sum payments and the amount paid to the insurance company. This settlement charge accelerated the recognition of previously unrecognized losses in AOCL.
The following weighted-average assumptions were used to determine the benefit obligations under the plans:
| | | | | | | | | |
| | Pension Benefits | Postretirement Benefits | |
| | 2020 | | 2019 | | 2020 | | 2019 | |
Discount rate | | 2.5 | % | 2.9 | % | 2.8 | % | 3.0 | % |
Rate of compensation increase | | 3.6 | % | 3.6 | % | | | | |
| | 2023 | | | 2022 | |
Discount rate | | | 5.2 | % | | | 5.0 | % |
Rate of compensation increase (1) | | | 3.0 | % | | | 3.6 | % |
(1) | The rate of compensation increase for 2023 relates only to Canadian pension plan, as the other plans are frozen. |
Pension expense is actuarially calculated annually based on data available at the beginning of each year. The expected return on plan assets is determined by multiplying the expected long-term rate of return on assets by the market-related value of plan assets for the U.S. qualified pension plan and market value for the Canadian qualified pension plan. The market-related value of plan assets is a calculated value that recognizes investment gains and losses in fair value related to equities over three or five years, depending on which computation results in a market-related value closer to market value. Market-related value for the U.S. qualified plan was $661$513 million and $601$618 million for 20202023 and 2019,2022, respectively.
Assumptions used in the calculation of net benefit cost include the discount rate selected and disclosed at the end of the previous year, as well as other assumptions detailed in the table below:
| | | | | | | | | | | | | |
| | Pension Benefits | Postretirement Benefits | |
| | 2020 | | 2019 | | 2018 | | 2020 | | 2019 | | 2018 | |
Discount rate (1) | | 2.9 | % | 4.0 | % | 4.0 | % | 3.0 | % | 4.1 | % | 3.7 | % |
Rate of compensation increase | | 3.6 | % | 3.6 | % | 3.6 | % | | | | | | |
Expected long-term rate of return on assets | | 5.5 | % | 5.8 | % | 5.9 | % | | | | | | |
| | 2023 | | | 2022 | | | 2021 | |
Discount rate | | | 5.0 | % | | | 3.2 | % | | | 2.5 | % |
Rate of compensation increase (1) | | | 3.0 | % | | | 3.6 | % | | | 3.6 | % |
Expected long-term rate of return on assets | | | 5.6 | % | | | 4.8 | % | | | 5.3 | % |
(1)(1) | The U.S qualifiedrate of compensation increase for 2023 relates only to Canadian pension plan, was remeasured duringas the second quarter of 2018 in connection with the pension litigation. The discount rate used to determine the benefit obligation in 2018 before the remeasurement was 3.7%. other plans are frozen. |
The expected long-term rate of return on invested plan assets is based on the plans’ weighted-average target asset allocation, as well as historical and future expected performance of those assets. The target asset allocation is selected to obtain an investment return that is sufficient to cover the expected benefit payments and to reduce the variability of our future contributions.
NOTES TO CONSOLIDATED FINANCIAL STATEMENTS
20. Retirement Plans and Other Benefits (continued)
The following are the components of net periodic pension benefit cost and net periodic postretirement benefit income.
| | | | | | | | | | | | | | | | | | |
| | Pension Benefits | Postretirement Benefits |
($ in millions) | | 2020 | | 2019 | | 2018 | | 2020 | | 2019 | | 2018 |
Service cost | | $ | 14 | | $ | 20 | | $ | 18 | | $ | — | | $ | — | | $ | — |
Interest cost | | | 21 | | | 27 | | | 29 | | | — | | | — | | | — |
Expected return on plan assets | | | (37) | | | (37) | | | (38) | | | — | | | — | | | — |
Amortization of net loss (gain) | | | 12 | | | 12 | | | 12 | | | (1) | | | (1) | | | (1) |
Net benefit expense (income) | | $ | 10 | | $ | 22 | | $ | 21 | | $ | (1) | | $ | (1) | | $ | (1) |
cost. Service cost is recognized as a component of SG&A and the remaining pension and postretirement expense components are recognized as part of Other (expense) income, net.
Beginning in 2001, new retirees were charged the expected full cost of the medical plan, and then-existing retirees will incur 100 percent of the expected future increases in medical plan costs. Any changes in the health care cost trend rates assumed would not affect the accumulated benefit obligation or net benefit income, since retirees will incur 100 percent of such expected future increases.
($ in millions) | | 2023 | | | 2022 | | | 2021 | |
Service cost | | $ | 6 | | | $ | 14 | | | $ | 16 | |
Interest cost | | | 27 | | | | 21 | | | | 18 | |
Expected return on plan assets | | | (29 | ) | | | (31 | ) | | | (35 | ) |
Amortization of net loss | | | 11 | | | | 10 | | | | 10 | |
Settlement charge | | | 75 | | | | — | | | | — | |
Net benefit expense | | $ | 90 | | | $ | 14 | | | $ | 9 | |
2020 Form 10-K Page 66
NOTES TO CONSOLIDATED FINANCIAL STATEMENTS
We maintain a Supplemental Executive Retirement Plan (“SERP”), which is an unfunded plan that includes provisions for the continuation of medical and dental insurance benefits to certain executive officers and other key employees of the Company (“SERP Medical Plan”). The SERP Medical Plan’s accumulated projected benefit obligation at January 30, 2021 was $12 million. The following initial and ultimate cost trend rate assumptions were used to determine the benefit obligations under the SERP Medical Plan:
| | | | | | | | | | | | | |
| | Medical Trend Rate | Dental Trend Rate | |
| | 2020 | | 2019 | | 2018 | | 2020 | | 2019 | | 2018 | |
Initial cost trend rate | | 6.3 | % | 6.5 | % | 6.5 | % | 5.0 | % | 5.0 | % | 5.0 | % |
Ultimate cost trend rate | | 5.0 | % | 5.0 | % | 5.0 | % | 5.0 | % | 5.0 | % | 5.0 | % |
Year that the ultimate cost trend rate is reached | | 2025 | | 2025 | | 2025 | | 2020 | | 2020 | | 2019 | |
The following initial and ultimate cost trend rate assumptions were used to determine the net periodic cost under the SERP Medical Plan:
| | | | | | | | | | | | | |
| | Medical Trend Rate | Dental Trend Rate | |
| | 2020 | | 2019 | | 2018 | | 2020 | | 2019 | | 2018 | |
Initial cost trend rate | | 6.5 | % | 6.5 | % | 7.0 | % | 5.0 | % | 5.0 | % | 5.0 | % |
Ultimate cost trend rate | | 5.0 | % | 5.0 | % | 5.0 | % | 5.0 | % | 5.0 | % | 5.0 | % |
Year that the ultimate cost trend rate is reached | | 2025 | | 2025 | | 2025 | | 2020 | | 2019 | | 2018 | |
The mortality assumption used to value the 20202023 and 2022 U.S. pension obligations was the Pri-2012Pri-2012 mortality table with generational projection using MP-2020MP-2021 for both males and females, while in the prior year the obligation was valued using the Pri-2012 mortality table with generational projection using MP-2019.females. For years ended February 3, 2024 and January 30, 2021 and February 1, 2020,28, 2023, we used the 2014 CPM Private Sector mortality table projected generationally with Scale CPM-B for both males and females to value its Canadian pension obligations for 2020. For the SERP Medical Plan, the mortality assumption used to value the 2020 obligation was updated to the PriH-2012 table with generational projection using MP-2020, while in the prior year the obligation was valued using the PriH-2012 table with generational projection using MP-2019.
Plan Assets
The target composition of our U.S. qualified pension plan assets is 70% fixed-income securities, 28.5% equities, and 1.5% real estate. We may alter the asset allocation targets from time to time depending on market conditions and the funding requirements of the pension plan. This current asset allocation has and is expected to limit volatility with regard to the funded status of the plan, but may result in higher pension expense due to the lower long-term rate of return associated with fixed-income securities. Due to market conditions and other factors, actual asset allocations may vary from the target allocation outlined above. The target composition of our Canadian qualified pension plan assets is 95 percent95% fixed-income securities and 5 percent5% equities. We believe plan assets are invested in a conservative manner with the same overall objective and investment strategy as noted below for the U.S. pension plan. The bond portfolio is comprised of government and corporate bonds chosen to match the duration of the pension plan’s benefit payment obligations. This current asset allocation will limit future volatility with regard to the funded status of the plan.volatility.
The target composition of our U.S. qualified pension plan assets is 60 percent fixed-income securities, 36.5 percent equities, and 3.5 percent real estate. We may alter the asset allocation targets from time to time depending on market conditions and the funding requirements of the pension plan. This current asset allocation has and is expected to limit volatility with regard to the funded status of the plan, but may result in higher pension expense due to the lower long-term rate of return associated with fixed-income securities. Due to market conditions and other factors, actual asset allocations may vary from the target allocation outlined above.
We believe plan assets are invested in a conservative manner with an objective of providing a total return that, over the long term, provides sufficient assets to fund benefit obligations, taking into account our expected contributions and the level of funding risk deemed appropriate. Our investment strategy seeks to diversify assets among classes of investments with differing rates of return, volatility, and correlation in order to reduce funding risk. Diversification within asset classes is also utilized to ensure that there are no significant concentrations of risk in plan assets and to reduce the effect that the return on any single investment may have on the entire portfolio.
NOTES TO CONSOLIDATED FINANCIAL STATEMENTS
Valuation of Investments
Significant portions of plan assets are invested in commingled
Commingled trust funds. These funds are valued at the net asset value of units held by the plan at year end. Stocks and mutual funds traded on U.S. and Canadian security exchanges are valued at closing market prices on the measurement date. Each category of U.S. and Canadian plan assets is classified within the same level of the fair value hierarchy for 2023 and 2022.
NOTES TO CONSOLIDATED FINANCIAL STATEMENTS
20. Retirement Plans and Other Benefits (continued)
The fair values of the U.S. pension plan assets at February 3, 2024 and January 28, 2023 were as follows:
($ in millions) | | Level 1 | | | Level 2 | | | Level 3 | | | 2023 Total | | | 2022 Total | |
Cash | | $ | 1 | | | $ | — | | | $ | — | | | $ | 1 | | | $ | 2 | |
Cash equivalents | | | — | | | | 3 | | | | — | | | | 3 | | | | 1 | |
Commingled funds: | | | | | | | | | | | | | | | | | |
Equity securities | | | — | | | | 91 | | | | — | | | | 91 | | | | 130 | |
Fixed-income securities | | | — | | | | 241 | | | | — | | | | 241 | | | | 341 | |
Real estate securities | | | — | | | | 5 | | | | — | | | | 5 | | | | 8 | |
Corporate stock | | | 11 | | | | — | | | | — | | | | 11 | | | | 17 | |
Mutual fund | | | 7 | | | | — | | | | — | | | | 7 | | | | 10 | |
Total assets at fair value | | $ | 19 | | | $ | 340 | | | $ | — | | | $ | 359 | | | $ | 509 | |
The fair values of the Canadian pension plan assets at February 3, 2024 and January 30, 2021 and February 1, 202028, 2023 were as follows:
| | | | | | | | | | | | | | | |
($ in millions) | | Level 1 | | Level 2 | | Level 3 | | 2020 Total | | 2019 Total* |
Cash equivalents | | $ | — | | $ | — | | $ | — | | $ | — | | $ | 1 |
Equity securities: | | | | | | | | | | | | | | | |
Canadian and international (1) | | | 3 | | | — | | | — | | | 3 | | | 2 |
Fixed-income securities: | | | | | | | | | | | | | | | |
Cash matched bonds (2) | | | — | | | 47 | | | — | | | 47 | | | 48 |
Total assets at fair value | | $ | 3 | | $ | 47 | | $ | — | | $ | 50 | | $ | 51 |
*
| Each category of plan assets is classified within the same level of the fair value hierarchy for 2020 and 2019.
|
(1) | This category comprises one mutual fund that invests primarily in a diverse portfolio of Canadian securities. |
(2) | This category consists of fixed-income securities, including strips and coupons, issued or guaranteed by the Government of Canada, provinces or municipalities of Canada including their agencies and crown corporations, as well as other governmental bonds and corporate bonds. |
The fair values of the U.S. pension plan assets at January 30, 2021 and February 1, 2020 were as follows:
($ in millions) | | Level 1 | | | Level 2 | | | Level 3 | | | 2023 Total | | | 2022 Total | |
Cash equivalents | | $ | — | | | $ | 7 | | | $ | — | | | $ | 7 | | | $ | 6 | |
Equity securities: | | | | | | | | | | | | | | | | |
Canadian and international | | | 3 | | | | — | | | | — | | | | 3 | | | | 3 | |
Fixed-income securities: | | | | | | | | | | | | | | | |
Cash matched bonds | | | — | | | | 25 | | | | — | | | | 25 | | | | 28 | |
Total assets at fair value | | $ | 3 | | | $ | 32 | | | $ | — | | | $ | 35 | | | $ | 37 | |
| | | | | | | | | | | | | | | |
($ in millions) | | Level 1 | | Level 2 | | Level 3 | | 2020 Total | | 2019 Total* |
Cash equivalents | | $ | — | | $ | 4 | | $ | — | | $ | 4 | | $ | 3 |
Equity securities: | | | | | | | | | | | | | | | |
U.S. large-cap (1) | | | — | | | 117 | | | — | | | 117 | | | 116 |
U.S. mid-cap (1) | | | — | | | 34 | | | — | | | 34 | | | 34 |
International (2) | | | — | | | 84 | | | — | | | 84 | | | 78 |
Corporate stock (3) | | | 17 | | | — | | | — | | | 17 | | | 15 |
Fixed-income securities: | | | | | | | | | | | | | | | |
Long duration corporate and government bonds (4) | | | — | | | 269 | | | — | | | 269 | | | 273 |
Intermediate duration corporate and government bonds (5) | | | — | | | 119 | | | — | | | 119 | | | 121 |
Other types of investments: | | | | | | | | | | | | | | | |
Real estate securities (6) | | | — | | | 22 | | | — | | | 22 | | | 23 |
Insurance contracts | | | — | | | — | | | — | | | — | | | 1 |
Total assets at fair value | | $ | 17 | | $ | 649 | | $ | — | | $ | 666 | | $ | 664 |
*
| Each category of plan assets is classified within the same level of the fair value hierarchy for 2020 and 2019.
|
(1) | These categories consist of various managed funds that invest primarily in common stocks, as well as other equity securities and a combination of other funds. |
(2) | This category comprises three managed funds that invest primarily in international common stocks, as well as other equity securities and a combination of other funds. |
(3) | This category consists of the Company’s common stock. |
(4) | This category consists of various fixed-income funds that invest primarily in long-term bonds, as well as a combination of other funds, that together are designed to exceed the performance of related long-term market indices. |
(5) | This category consists of two fixed-income funds that invest primarily in intermediate duration bonds, as well as a combination of other funds, that together are designed to exceed the performance of related indices. |
(6) | This category consists of one fund that invests in global real estate securities. |
NOTES TO CONSOLIDATED FINANCIAL STATEMENTS
Contributions and Expected Payments
We were not required to make any contributions to the U.S. qualified pension plansplan in 2020. During 2019, we made a contribution of $55 million to this plan.2023 and 2022. We do not anticipate making any contributions to the U.S. qualified pension plan in 20212024 due to the strong funded status of the plan, however we continually evaluate the amount and timing of any potential contributions based on market conditions and other factors. We paid $1$3 million during 2023and $2 million in pension benefits2022 related to our unfunded non-qualified pension plans during 2020 and 2019, respectively.plans.
Estimated future benefit payments for each of the next five years and the five years thereafter are as follows:
| | | | | | |
| | Pension | | Postretirement |
($ in millions) | | Benefits | | Benefits |
2021 | | $ | 65 | | $ | 1 |
2022 | | | 53 | | | 1 |
2023 | | | 51 | | | 1 |
2024 | | | 49 | | | — |
2025 | | | 46 | | | — |
2026-2030 | | | 208 | | | 3 |
($ in millions) | | | |
2024 | | $ | 46 | |
2025 | | | 34 | |
2026 | | | 33 | |
2027 | | | 32 | |
2028 | | | 32 | |
2029 - 2033 | | | 145 | |
Savings Plans
We have two qualified savings plans, a 401(k)401(k) plan that is available to employees whose primary place of employment is the U.S., and another plan that is available to employees whose primary place of employment is in Puerto Rico. Eligible team members may contribute toWith the plans following 28 daysacquisition of employment and are eligibleWSS in 2021, we became the sponsor of the 401(k) plan for WSS employees. The charges for matching contributions upon completion of one year of service consisting of at least 1,000 hours. As of January 1, 2021, the savings plans allow eligible employees to contribute up to 40 percent of their compensation on a pre-tax basis, subject to a maximum of $19,500were not significant for the U.S. plan and $15,000 for the Puerto Rico plan. Prior to January 1, 2020, we matched 25 percent of employees’ pre-tax contributions on up to the first 4 percentany of the employees’ compensation (subject to certain limitations). Effective January 1, 2020, we match 100 percentperiods presented.
NOTES TO CONSOLIDATED FINANCIAL STATEMENTS
20.21. Share-Based Compensation
Stock Awards
Under our amended and restated 2007 Stock Incentive Plan (the “2007“2007 Stock Plan”), stock options, restricted stock, restricted stock units, stock appreciation rights, or other share-based awards may be granted to nonemployee directors, officers, and other employees, including our subsidiaries and operating divisions worldwide. Options for employees become exercisable in substantially equal annual installments over a three-yearthree-year period, beginning with the first anniversary of the date of grant of the option, unless a shorter or longer duration is established at the time of the option grant. The options terminate ten years from the date of grant. On Effective May 21, 2014, 17, 2023, the 2007 Stock Plan was amended and restated to increase the number of shares of common stock reserved for all awards to 14 million shares. As of January 30, 2021,February 3, 2024, there were 7,053,61312,598,147 shares available for issuance under this plan.
During 2022, the Company granted options and other awards to its President and Chief Executive Officer, Mary N. Dillon. These awards were granted outside of the 2007 Stock Incentive Plan as employment inducement awards and did not require shareholder approval under the rules of the New York Stock Exchange or otherwise. Shares available for future grant under this plan of 408,636 are reserved for the sole purpose to issue shares pursuant to her employment inducement awards.
Employees Stock Purchase Plan
Under our 2013
On May 17, 2023, the Company adopted the 2023 Foot Locker EmployeesEmployee Stock Purchase Plan (“ESPP”("2023 ESPP"), whose terms are substantially the same as the 2013 Foot Locker Employee Stock Purchase Plan ("2013 ESPP"). Under our 2023 ESPP, participating employees are able to contribute up to 10 percent10% of their annual compensation, not to exceed $25,000 in any plan year, through payroll deductions to acquire shares of our common stock at 85 percent85% of the lower market price on one of two specified dates in each plan year. Under the 2023 ESPP, participating employees are now permitted to purchase shares in June and December of each year. Of the 3,000,000 shares of common stock authorized under this plan,the 2023 ESPP, there were 2,275,1642,785,161 shares available for purchase as of January 30, 2021. During 2020 and 2019, participating employees purchased 104,054February 3, 2024. No further shares and 96,451 shares, respectively.may be issued under the 2013 ESPP.
NOTES TO CONSOLIDATED FINANCIAL STATEMENTS
Share-Based Compensation Expense
Total compensation expense included in SG&A
($ in millions) | | 2023 | | | 2022 | | | 2021 | |
Options and employee stock purchase plan | | $ | 4 | | | $ | 5 | | | $ | 6 | |
Restricted stock units and performance stock units | | | 9 | | | | 26 | | | | 23 | |
Total share-based compensation expense | | $ | 13 | | | $ | 31 | | | $ | 29 | |
| | | | | | | | | |
Tax benefit recognized | | $ | 2 | | | $ | 3 | | | $ | 3 | |
Option and the associated tax benefits recognized related to our share-based compensation plans, were as follows:
| | | | | | | | | |
($ in millions) | | 2020 | | 2019 | | 2018 |
Options and shares purchased under the ESPP | | $ | 6 | | $ | 6 | | $ | 7 |
Restricted stock and restricted stock units | | | 9 | | | 12 | | | 15 |
Total share-based compensation expense | | $ | 15 | | $ | 18 | | $ | 22 |
| | | | | | | | | |
Tax benefit recognized | | $ | 2 | | $ | 2 | | $ | 3 |
Employee Stock Purchase Plan Valuation Model and Assumptions
The Black-Scholes option-pricing model is used to estimate the fair value of share-based awards.options and the stock purchase plan. The Black-Scholes option-pricing model incorporates various and subjective assumptions, including expected term and expected volatility.
We estimate the expected term of share-based awardsoptions using our historical exercise and post-vesting employment termination patterns, which we believe are representative of future behavior. The expected term for the employee stock purchase plan valuation is based on the length of each purchase period as measured at the beginning of the offering period, which is one year.period. Effective with the adoption of the 2023 ESPP, we provide two offering periods.
We estimate the expected volatility of our common stock at the grant date using a weighted-average of our historical volatility and implied volatility from traded options on our common stock. We believe that this combination of historical volatility and implied volatility provides a better estimate of future stock price volatility.
NOTES TO CONSOLIDATED FINANCIAL STATEMENTS
21. Share-Based Compensation (continued)
The risk-free interest rate assumption is determined using the Federal Reserve nominal rates for U.S. Treasury zero-couponzero-coupon bonds with maturities similar to those of the expected term of the award being valued. The expected dividend yield is derived from our historical experience.
The following table shows the assumptions used to compute the share-based compensation expense:
| | | | | | | | | | | | | | | | | | | |
| | | | | | | | | | | | | | | | | | | |
| | Stock Option Plans | Stock Purchase Plan | |
| | 2020 | | 2019 | | 2018 | | 2020 | | 2019 | | 2018 | |
Weighted-average risk free rate of interest | | | 0.5 | % | | 2.2 | % | | 2.7 | % | | 1.8 | % | | 2.2 | % | | 2.0 | % |
Expected volatility | | | 37 | % | | 38 | % | | 37 | % | | 48 | % | | 54 | % | | 50 | % |
Weighted-average expected award life (in years) | | | 4.9 | | | 5.5 | | | 5.5 | | | 1.0 | | | 1.0 | | | 1.0 | |
Dividend yield | | | 4.3 | % | | 2.6 | % | | 3.1 | % | | 4.2 | % | | 3.1 | % | | 2.0 | % |
Weighted-average fair value | | $ | 5.03 | | $ | 17.07 | | $ | 12.42 | | $ | 13.97 | | $ | 16.68 | | $ | 15.29 | |
2020 Form 10-K Page 70expense for our options and stock purchase plan:
| | Stock Option Plans | | | Stock Purchase Plan | |
| | 2023 | | | 2022 | | | 2021 | | | 2023 | | | 2022 | | | 2021 | |
Weighted-average risk free rate of interest | | | 3.6 | % | | | 2.5 | % | | | 0.9 | % | | | 3.8 | % | | | 1.0 | % | | | 0.1 | % |
Expected volatility | | | 50 | % | | | 50 | % | | | 47 | % | | | 40 | % | | | 40 | % | | | 45 | % |
Weighted-average expected award life (in years) | | | 5.5 | | | | 5.5 | | | | 5.5 | | | | 0.5 | | | | 1.0 | | | | 1.0 | |
Dividend yield | | | 3.7 | % | | | 3.8 | % | | | 1.5 | % | | | 3.7 | % | | | 2.6 | % | | | 4.0 | % |
Weighted-average fair value | | $ | 13.53 | | | $ | 10.80 | | | $ | 20.22 | | | $ | 5.32 | | | $ | 18.46 | | | $ | 9.61 | |
NOTES TO CONSOLIDATED FINANCIAL STATEMENTS
The information set forth in the following table covers options granted under our stock option plans:
| | | | | | | | |
| | | | Weighted- | | Weighted- |
| | Number | | Average | | Average |
| | of | | Remaining | | Exercise |
| | Shares | | Contractual Life | | Price |
| | (in thousands) | (in years) | | (per share) |
Options outstanding at the beginning of the year | | 2,881 | | | | | $ | 54.21 |
Granted | | 1,069 | | | | | | 21.61 |
Exercised | | (165) | | | | | | 23.36 |
Expired or cancelled | | (245) | | | | | | 34.47 |
Options outstanding at January 30, 2021 | | 3,540 | | | 5.7 | | $ | 47.17 |
| | | | | | | | |
Options exercisable at January 30, 2021 | | 2,403 | | | 4.2 | | $ | 55.81 |
| | Number of Shares | | | Weighted- Average Remaining Contractual Life | | | Weighted- Average Exercise Price | |
| | (in thousands) | | | (in years) | | | (per share) | |
Options outstanding at the beginning of the year | | | 3,256 | | | | | | $ | 47.85 | |
Granted | | | 341 | | | | | | | 37.72 | |
Exercised | | | (194 | ) | | | | | | 23.93 | |
Expired or cancelled | | | (665 | ) | | | | | | 48.08 | |
Options outstanding at February 3, 2024 | | | 2,738 | | | | 3.3 | | | $ | 48.23 | |
Options exercisable at February 3, 2024 | | | 2,321 | | | | 2.3 | | | $ | 50.25 | |
The total fair value of options vested was $5 million, $4 million, and $4 million, during 2023, 2022, and 2021, respectively. During the years ended February 3, 2024, January 28, 2023, and January 29, 2022, we received $5 million, $6 million, during both 2020 and 2019. During the year ended January 30, 2021, we received $4$10 million, respectively, in cash from option exercises and recognized a related tax benefit of $1 million.an insignificant amount in 2023 and 2022, and $2 million in 2021.
The total intrinsic value of options exercised (the difference between the market price of the Company’s common stock on the exercise date and the price paid by the optionee to exercise the option) is presented below:
| | | | | | | | | |
($ in millions) | | 2020 | | 2019 | | 2018 |
Exercised | | $ | 3 | | $ | 5 | | $ | 4 |
($ in millions) | | 2023 | | | 2022 | | | 2021 | |
Exercised | | $ | 3 | | | $ | 1 | | | $ | 8 | |
The aggregate intrinsic value for stock options outstanding, and those outstanding and exercisable (the difference between the closing stock price on the last trading day of the period and the exercise price of the options, multiplied by the number of in-the-money stock options) is presented below:
| | | |
($ in millions) | | 2020 |
Outstanding | | $ | 24 |
Outstanding and exercisable | | $ | 5 |
($ in millions) | | 2023 | |
Outstanding | | $ | 4 | |
Outstanding and exercisable | | $ | 3 | |
NOTES TO CONSOLIDATED FINANCIAL STATEMENTS
21. Share-Based Compensation (continued)
As of January 30, 2021,February 3, 2024, there was $3$2 million of total unrecognized compensation cost related to nonvested stock options, which is expected to be recognized over a remaining weighted-average period of 1.41.5 years.
The following table summarizes information about stock options outstanding and exercisable at January 30, 2021:
| | | | | | | | | | | | |
| | Options Outstanding | Options Exercisable |
| | | | Weighted- | | | | | | | | |
| | | | Average | | Weighted- | | | | Weighted- |
| | | | Remaining | | Average | | | | Average |
Range of Exercise | | Number | | Contractual | | Exercise | | Number | | Exercise |
Prices | | Outstanding | | Life | | Price | | Exercisable | | Price |
| | (in thousands, except prices per share and contractual life) |
$18.84 to $23.09 | | 937 | | 8.7 | | $ | 21.55 | | 60 | | $ | 20.72 |
$24.75 to $36.51 | | 329 | | 2.3 | | | 33.01 | | 326 | | | 32.98 |
$44.78 to $45.75 | | 537 | | 4.9 | | | 44.91 | | 447 | | | 44.94 |
$46.64 to $62.11 | | 869 | | 5.0 | | | 60.12 | | 703 | | | 60.50 |
$63.33 to $73.21 | | 868 | | 4.8 | | | 68.60 | | 867 | | | 68.60 |
| | 3,540 | | 5.7 | | $ | 47.17 | | 2,403 | | $ | 55.81 |
February 3, 2024:
| | Options Outstanding | | | Options Exercisable | |
| | | | | Weighted- | | | | | | | | | | |
| | | | | Average | | | Weighted- | | | | | | Weighted- | |
| | | | | Remaining | | | Average | | | | | | Average | |
Range of Exercise | | Number | | | Contractual | | | Exercise | | | Number | | | Exercise | |
Prices | | Outstanding | | | Life | | | Price | | | Exercisable | | | Price | |
| | (in thousands, except prices per share and contractual life) | |
$21.60 - $30.98 | | | 688 | | | | 4.1 | | | $ | 24.77 | | | | 593 | | | $ | 24.07 | |
$36.49 - $46.64 | | | 682 | | | | 5.2 | | | | 41.71 | | | | 369 | | | | 44.19 | |
$53.61 - $58.94 | | | 400 | | | | 2.6 | | | | 56.58 | | | | 391 | | | | 56.65 | |
$62.02 - $72.83 | | | 968 | | | | 1.6 | | | | 66.02 | | | | 968 | | | | 66.02 | |
| | | 2,738 | | | | 3.3 | | | $ | 48.23 | | | | 2,321 | | | $ | 50.25 | |
2020 Form 10-K Page 71
NOTES TO CONSOLIDATED FINANCIAL STATEMENTS
Restricted Stock Units and Performance Stock Units
Restricted stock units (“RSU”) may be awarded to certain officers, key employees of the Company, and key employees.nonemployee directors. Additionally, RSU awardsperformance stock units (“PSU”) are madeawarded to officers and certain key employees in connection with our long-term incentive program, and to nonemployee directors.program. Each RSU awardand PSU represents the right to receive one share of our common stock provided that the applicable performance and vesting conditions are satisfied. PSU awards granted in 2023 and 2022 also include a performance objective based on our relative total shareholder return over the performance period to a pre-determined peer group, assuming the reinvestment of dividends. The fair value of these awards is determined using a Monte Carlo simulation as of the date of the grant.
Generally, RSU awards fully vest after the passage of time, typically three years. However, RSU years for employees and one year for nonemployee directors, provided there is continued service with the Company until the vesting date, subject to the terms of the award. PSU awards made in connection with our performance-based long-term incentive program are earned only after the attainment of certain performance metricsgoals during the relevant performance period and with regards to certain awards, vest after an additional one-yearone-year period. NaNNo dividends are paid or accumulated on any RSU or PSU awards.
Compensation expense is recognized using the market value at the date of grant and is amortized over the vesting period, provided the recipient continues to be employed. period.
RSU and PSU activity is summarized as follows:
| | | | | | | | | |
| | | | | Weighted-Average | | |
| | Number | Remaining | Weighted-Average |
| | of | Contractual | Grant Date |
| | Shares | Life | Fair Value |
| | | (in thousands) | | | (in years) | | | (per share) |
Nonvested at beginning of year | | | 936 | | | | | $ | 49.25 |
Granted (1) | | | 639 | | | | | | 28.69 |
Vested | | | (121) | | | | | | 53.27 |
Performance adjustment (2) | | | 51 | | | | | | |
Forfeited | | | (157) | | | | | | 38.41 |
Nonvested at January 30, 2021 | | | 1,348 | | | 1.3 | | $ | 38.48 |
| | | | | | | | | |
Aggregate value ($ in millions) | | $ | 52 | | | | | | |
| | Number of Shares | | | Weighted-Average Remaining Contractual Life | | | Weighted-Average Grant Date Fair Value | |
| | (in thousands) | | | (in years) | | | (per share) | |
Nonvested at beginning of year | | | 1,992 | | | | | | $ | 37.58 | |
Granted | | | 1,204 | | | | | | | 35.75 | |
Vested | | | (689 | ) | | | | | | 34.08 | |
Performance adjustment (1) | | | (866 | ) | | | | | | |
Forfeited | | | (263 | ) | | | | | | 39.02 | |
Nonvested at February 3, 2024 | | | 1,378 | | | | 1.2 | | | $ | 38.81 | |
| | | | | | | | | |
Aggregate value ($ in millions) | | $ | 53 | | | | | | | |
(1)(1) | Included in the units granted are approximately 0.2 million performance-based RSUs. The number of performance-based RSUs that are ultimately earned may vary from 0% to 200% of target depending on the achievement relative to predefined financial performance targets. |
(2) | This represents adjustments made to performance-based RSUPSU awards and reflectreflecting changes in estimates based upon our current performance against predefined financial targets. |
NOTES TO CONSOLIDATED FINANCIAL STATEMENTS
21. Share-Based Compensation (continued)
The total fair value of awards vested was $23 million, $6 million, $5 million, and $7$23 million, for 2020, 2019,2023, 2022, and 2018,2021, respectively. At January 30, 2021,February 3, 2024, there was $23$19 million of total unrecognized compensation cost related to nonvested RSU awards.
21. Shareholder Rights Plan
On December 7, 2020, our Board of Directors adopted a shareholder rights plan and declared a dividend distribution of one right (a "Right") for each outstanding share of common stock to shareholders of record at the close of business on December 18, 2020. Each Right entitles the registered holder to purchase from the Company, when exercisable, a unit consisting of one 1-thousandth (1/1,000) of a share of Series C Junior Participating Preferred Stock, par value $1.00 per share, of the Company, at a purchase price of $210.00 per unit, subject to adjustment. The description and complete terms of the Rights are set forth in a Rights Agreement (the "Rights Agreement"), dated as of December 7, 2020, between the Company and Computershare Trust Company, N.A., as rights agent.
Initially, the Rights will not be exercisable and will be attached to all outstanding shares of our common stock. In the event that a person, either individually or with or through certain affiliated or associated persons, acquires beneficial ownership of 20 percent or more of our then outstanding common stock, subject to certain exceptions, or following the commencement of a tender offer or exchange offer that would result in a person becoming an Acquiring Person (as defined in the Rights Agreement), the Rights will become exercisable. Once exercisable, each holder of a Right (other than the Acquiring Person, whose Rights will become null and void), will be entitled to purchase additional shares of our common stock at a 50 percent discount. The Board may redeem the Rights at a price of $0.001 per Right, subject to adjustment.
The Rights will expire on December 7, 2021, unless the Rights are earlier redeemed, exchanged or terminated.
NOTES TO CONSOLIDATED FINANCIAL STATEMENTS
22. Legal Proceedings
Legal proceedings pending against the Company or its consolidated subsidiaries consist of ordinary, routine litigation, or pre-litigation demands, including administrative proceedings, incidental to the business of the Company or businesses that have been sold or discontinued by the Company in past years. These legal proceedings include commercial, intellectual property, customer, environmental, and employment-related claims. Additionally, the Company is a defendant in a consolidated class action alleging wage/hour and wage statement violations in California.
We do not believe that the outcome of any such legal proceedings pending against the Company or its consolidated subsidiaries, as described above, would have a material adverse effect on our consolidated financial position, liquidity, or results of operations, taken as a whole, based upon current knowledge and taking into consideration current accruals. Litigation is inherently unpredictable. Judgments could be rendered or settlements made that could adversely affect the Company’s operating results or cash flows in a particular period.
23. Quarterly Results (Unaudited)
| | | | | | | | | | | |
($ in millions) | | 1st Quarter | | 2nd Quarter | | 3rd Quarter | | 4th Quarter | | Fiscal Year |
Sales | | | | | | | | | | | |
2020 | | 1,176 | | 2,077 | | 2,106 | | 2,189 | | $ | 7,548 |
2019 | | 2,078 | | 1,774 | | 1,932 | | 2,221 | | $ | 8,005 |
Gross margin (1) | | | | | | | | | | | |
2020 | | 271 | | 538 | | 650 | | 724 | | $ | 2,183 |
2019 | | 689 | | 534 | | 620 | | 700 | | $ | 2,543 |
Operating profit (2) | | | | | | | | | | | |
2020 | | (105) | | 69 | | 178 | | 161 | | $ | 303 |
2019 | | 228 | | 81 | | 164 | | 176 | | $ | 649 |
Net income (3), (4) | | | | | | | | | | | |
2020 | | (110) | | 45 | | 265 | | 123 | | $ | 323 |
2019 | | 172 | | 60 | | 125 | | 134 | | $ | 491 |
Basic earnings per share (5) | | | | | | | | | | | |
2020 | | (1.06) | | 0.43 | | 2.54 | | 1.18 | | $ | 3.10 |
2019 | | 1.53 | | 0.55 | | 1.16 | | 1.28 | | $ | 4.52 |
Diluted earnings per share (5) | | | | | | | | | | | |
2020 | | (1.06) | | 0.43 | | 2.52 | | 1.17 | | $ | 3.08 |
2019 | | 1.52 | | 0.55 | | 1.16 | | 1.27 | | $ | 4.50 |
(1) | Gross margin represents sales less cost of sales. Cost of sales includes: the cost of merchandise, freight, distribution costs including related depreciation expense, shipping and handling, occupancy and buyers’ compensation. Occupancy costs include rent (including fixed common area maintenance charges and other fixed non-lease components), real estate taxes, general maintenance, and utilities. |
(2) | Operating profit represents income before income taxes, net interest income and non-operating income. |
(3) | During the first and fourth quarters of 2020, we recorded impairment charges totaling $15 million and $66 million, respectively. During the fourth quarter of 2019, we recorded impairment charges of $48 million. See Note 3, Impairment and Other Charges for additional information. |
(4) | During the third quarter of 2020, we recorded a benefit of $190 million from one of our minority investments. See Note 4, Other Income for further information. |
(5) | Quarterly income per share amounts may not total to the annual amount due to changes in weighted-average shares outstanding during the year. |
20202023 Form
10-K10-K Page
73
ItemItem 9. Changes in and Disagreements with Accountants on Accounting and Financial Disclosure
There were no disagreements between the Company and its independent registered public accounting firm on matters of accounting principles or practices.
Item9A. Controls and Procedures
(a) | (a) | Evaluation of Disclosure Controls and Procedures. Procedures |
The Company’s management performed an evaluation, under the supervision and with the participation of the Company’s Chief Executive Officer (“CEO”) and Chief Financial Officer (“CFO”), of the effectiveness of the design and operation of the Company’s disclosure controls and procedures (as that term is defined in Rules 13a-15(e) and 15d-15(e) under the Securities Exchange Act of 1934, as amended (the “Exchange Act”)) as of January 30, 2021. Based on that evaluation, the Company’s CEO and CFO concluded that the Company’s disclosure controls and procedures were effective to ensure that information relating to the Company that is required to be disclosed in the reports that we file or submit under the Exchange Act is recorded, processed, summarized, and reported within the time periods specified in the SEC rules and forms, and is accumulated and communicated to management, including the CEO and CFO, as appropriate to allow timely decisions regarding required disclosure.
| The Company’s management performed an evaluation, under the supervision and with the participation of the Company’s Chief Executive Officer ("CEO") and Chief Financial Officer (“CFO”), of the effectiveness of the design and operation of the Company’s disclosure controls and procedures (as that term is defined in Rules 13a-15(e) and 15d-15(e) under the Securities Exchange Act of 1934, as amended (the “Exchange Act”)) as of February 3, 2024. Based on that evaluation, the Company’s CEO and CFO have concluded that the Company’s disclosure controls and procedures were effective as of February 3, 2024. Per Rules 13a-15(e) and 15d-15(e), the term disclosure controls and procedures means controls and other procedures of an issuer that are designed to ensure that information required to be disclosed by the issuer in the reports that it files or submits under the Exchange Act (15 U.S.C. 78a et seq.) is recorded, processed, summarized, and reported within the time periods specified in the SEC’s rules and forms. Disclosure controls and procedures include, without limitation, controls and procedures designed to ensure that information required to be disclosed by an issuer in the reports that it files or submits under the Exchange Act is accumulated and communicated to the issuer’s management, including its CEO and CFO, or persons performing similar functions, as appropriate to allow timely decisions regarding required disclosure. The Company’s management, including the CEO and CFO, does not expect that our disclosure controls and procedures or our internal control over financial reporting will prevent all errors and all fraud due to inherent limitations of internal controls. Because of such limitations, there is a risk that material misstatements will not be prevented or detected on a timely basis by internal control over financial reporting. However, these inherent limitations are known features of the financial reporting process. Therefore, it is possible to design into the process safeguards to reduce, though not eliminate, this risk. |
(b) | Remediation of Previously Disclosed Material Weakness in Internal Controls over Financial Reporting We previously identified and disclosed in our 2022 Annual Report on Form 10-K, a material weakness in our internal control over financial reporting related to certain ineffective general information technology controls over logical access and change management at our WSS business. As a result, process level automated controls and manual controls that were dependent on the completeness and accuracy of information derived from the affected information systems were also ineffective. In accordance with our internal control compliance program, a material weakness is not considered remediated until the remediation processes have been operational for a sufficient period of time and successfully tested. Throughout the year ended February 3, 2024, we undertook remediation measures. Our remediation efforts included (i) designing and implementing controls related to deprovisioning, privileged access, and user access reviews, (ii) developing an enhanced risk assessment process to evaluate logical access, and (iii) improving the existing training program associated with control design and implementation. In light of this material weakness, management performed additional procedures over our affected IT environment and personnel to determine if any unauthorized action had been taken and found no such instances. As of February 3, 2024, management completed the implementation of our remediation efforts of the material weakness. |
(c) | Management’s Annual Report on Internal Control over Financial Reporting.Reporting |
| The Company’s management is responsible for establishing and maintaining adequate internal control over financial reporting (as that term is defined in Exchange Act Rules 13a-15(f) and 15d-15(f)). To evaluate the effectiveness of the Company’s internal control over financial reporting, the Company uses the framework in Internal Control-Integrated Framework (2013) issued by the Committee of Sponsoring Organizations of the Treadway Commission (the “2013 COSO Framework”). Using the 2013 COSO Framework, the Company’s management, including the CEO and CFO, under the oversight of the Board of Directors, evaluated the Company’s internal control over financial reporting and concluded that the Company’s internal control over financial reporting was effective as of February 3, 2024. |
The Company’s management is responsible for establishing and maintaining adequate internal control over financial reporting (as that term is defined in Exchange Act Rules 13a-15(f) and 15d-15(f)). To evaluate the effectiveness of the Company’s internal control over financial reporting, the Company uses the framework in Internal Control-Integrated Framework (2013) issued by the Committee of Sponsoring Organizations of the Treadway Commission (the “2013 COSO Framework”). Using the 2013 COSO Framework, the Company’s management, including the CEO and CFO, evaluated the Company’s internal control over financial reporting and concluded that the Company’s internal control over financial reporting was effective as of January 30, 2021. KPMG LLP, the independent registered public accounting firm that audits the Company’s consolidated financial statements included in this annual report, has issued an attestation report on the Company’s effectiveness of internal control over financial reporting, which is included in Item 9A(d).
| (c)A company’s internal control over financial reporting includes those policies and procedures that: |
| (1) | pertain to the maintenance of records that, in reasonable detail, accurately and fairly reflect the transactions and dispositions of the assets of the Company; |
| (2) | provide reasonable assurance that transactions are recorded as necessary to permit preparation of financial statements in accordance with generally accepted accounting principles, and that receipts and expenditures of the company are being made only in accordance with authorizations of management and directors of the Company; and |
| (3) | provide reasonable assurance regarding prevention or timely detection of unauthorized acquisition, use, or disposition of the company’s assets that could have a material effect on the financial statements. |
| Because of its inherent limitations, internal control over financial reporting may not prevent or detect misstatements. Also, projections of any evaluation of effectiveness to future periods are subject to the risk that controls may become inadequate because of changes in conditions or that the degree of compliance with the policies or procedures may deteriorate. A material weakness is a deficiency, or a combination of deficiencies, in internal control over financial reporting, such that there is a reasonable possibility that a material misstatement of our annual or interim financial statements will not be prevented or detected on a timely basis. Our independent registered public accounting firm, KPMG LLP, who audited the Company’s consolidated financial statements included in this Annual Report on Form 10-K, has issued an attestation report on the Company’s effectiveness of internal control over financial reporting, which is included in Item 9A(d). |
(d) | Changes in Internal Control over Financial Reporting.Reporting |
We are currently migrating our e-commerce order management system. All North American e-commerce websites and apps were live on the new system as of January 30, 2021. In connection with this implementation and resulting business process changes, we may make changes to the design and operation of our internal control over financial reporting.
During the Company’s last fiscal quarter there were no changes in internal control over financial reporting, other than the implementation of our e-commerce order management system noted above, that materially affected, or are reasonably likely to materially affect, the Company’s internal control over financial reporting.
| (d)Other than execution of the material weakness remediation activities described above, there were no other changes in internal control over financial reporting (as defined by Rule 13a-15(f) and 15d-15(f) under the Exchange Act) during the quarter ended February 3, 2024, that have materially affected, or are reasonably likely to materially affect, our internal control over financial reporting. |
(e) | Report of Independent Registered Public Accounting Firm on Internal Control Over Financial Reporting- theReporting |
| The report appears on the following page. |
REPORT OF INDEPENDENT REGISTERED PUBLIC ACCOUNTING FIRM
To the Shareholders and Board of Directors
Foot Locker, Inc.:
Opinion on Internal Control Over Financial Reporting
We have audited Foot Locker, Inc.’s and subsidiariessubsidiaries' (the “Company”)Company) internal control over financial reporting as of January 30, 2021,February 3, 2024, based on criteria established in Internal Control – Integrated Framework (2013) issued by the Committee of Sponsoring Organizations of the Treadway Commission. In our opinion, the Company maintained, in all material respects, effective internal control over financial reporting as of January 30, 2021,February 3, 2024, based on criteria established in Internal Control – Integrated Framework (2013) issued by the Committee of Sponsoring Organizations of the Treadway Commission.
We also have audited, in accordance with the standards of the Public Company Accounting Oversight Board (United States) (PCAOB), the consolidated balance sheets of the Company as of February 3, 2024 and January 30, 2021 and February 1, 2020,28, 2023, the related consolidated statements of operations, comprehensive (loss) income, changes in shareholders’ equity, and cash flows for each of the years in the three-year period ended January 30, 2021,February 3, 2024, and the related notes (collectively, the “consolidatedconsolidated financial statements”)statements), and our report dated March 25, 202128, 2024 expressed an unqualified opinion on those consolidated financial statements.
Basis for Opinion
The Company’s management is responsible for maintaining effective internal control over financial reporting and for its assessment of the effectiveness of internal control over financial reporting, included in the accompanying Management’s Annual Report on Internal Control over Financial Reporting. Our responsibility is to express an opinion on the Company’s internal control over financial reporting based on our audit. We are a public accounting firm registered with the PCAOB and are required to be independent with respect to the Company in accordance with the U.S. federal securities laws and the applicable rules and regulations of the Securities and Exchange Commission and the PCAOB.
We conducted our audit in accordance with the standards of the PCAOB. Those standards require that we plan and perform the audit to obtain reasonable assurance about whether effective internal control over financial reporting was maintained in all material respects. Our audit of internal control over financial reporting included obtaining an understanding of internal control over financial reporting, assessing the risk that a material weakness exists, and testing and evaluating the design and operating effectiveness of internal control based on the assessed risk. Our audit also included performing such other procedures as we considered necessary in the circumstances. We believe that our audit provides a reasonable basis for our opinion.
Definition and Limitations of Internal Control Over Financial Reporting
A company’s internal control over financial reporting is a process designed to provide reasonable assurance regarding the reliability of financial reporting and the preparation of financial statements for external purposes in accordance with generally accepted accounting principles. A company’s internal control over financial reporting includes those policies and procedures that (1) pertain to the maintenance of records that, in reasonable detail, accurately and fairly reflect the transactions and dispositions of the assets of the company; (2) provide reasonable assurance that transactions are recorded as necessary to permit preparation of financial statements in accordance with generally accepted accounting principles, and that receipts and expenditures of the company are being made only in accordance with authorizations of management and directors of the company; and (3) provide reasonable assurance regarding prevention or timely detection of unauthorized acquisition, use, or disposition of the company’s assets that could have a material effect on the financial statements.
Because of its inherent limitations, internal control over financial reporting may not prevent or detect misstatements. Also, projections of any evaluation of effectiveness to future periods are subject to the risk that controls may become inadequate because of changes in conditions, or that the degree of compliance with the policies or procedures may deteriorate.
/s/ KPMG LLP
New York, New York
March 28, 2024
March 25, 2021
20202023 Form 10-K Page
75
76
Item9B. Other Information
During the quarter ended February 3, 2024, None.no director or officer (as defined in Rule 16a-1(f) promulgated under the Exchange Act) of the Company adopted or terminated a "Rule 10b5-1 trading arrangement" or a "non-Rule 10b5-1 trading arrangement" (as each term is defined in Item 408 of Regulation S-K).
Item9C. Disclosure Regarding Foreign Jurisdictions that Prevent Inspections
None.
PARTPART III
Item10. Directors, Executive Officers, and Corporate Governance
| (a) | Directors of the Company |
Information relative to directors of the Company will be set forth under the section captionedheading “Proposal 1-Election1: Election of Directors” in the Proxy Statement and is incorporated herein by reference.
| (b) | Executive Officers of the Company |
Information with respect to executive officers of the Company will beis set forth in Item 4A in Part I.
| (c) | Information with respect to compliance with Section 16(a) of the Securities Exchange Act of 1934 will be set forth under the section captioned “Section 16(a) Beneficial Ownership Reporting Compliance” in the Proxy Statement and is incorporated herein by reference. |
| (d) | Information on our audit committee and the audit committee financial expert will be contained inunder the heading “Committees” under the Governance section of the Proxy Statement under the section captioned “Committees of the Board” and is incorporated herein by reference. |
| | |
| (e)(d) | Information about the Code of Business Conduct governingapplicable to our employees, including our Chief Executive Officer, Chief Financial Officer, Chief Accounting Officer, and the Board of Directors, will be set forth under the heading “Code of Business Conduct” under the Corporate Governance section of the Proxy Statement and is incorporated herein by reference. |
Item11. Executive Compensation
Information set forth in the Proxy Statement beginning with the section captioned “Director Compensation” through and including the section captioned “Pension Benefits”“Excess Savings Plan” is incorporated herein by reference, and information set forth in the Proxy Statement under the heading “Compensation Committee Interlocks and Insider Participation” is incorporated herein by reference.
Item12. Security Ownership of Certain Beneficial Owners and Management and Related StockholderShareholder Matters
Information set forth in the Proxy Statement under the sections captioned “Equity Compensation Plan Information” and “Beneficial Ownership of the Company’s Stock” is incorporated herein by reference.
Item 13. Certain Relationships and Related Transactions, and Director Independence
Information set forth in the Proxy Statement under the section captioned “Directors’ Independence”“Shareholder Ownership” is incorporated herein by reference. Equity compensation plan information is contained under the “Stock Awards” and “Employees Stock Purchase Plan” sections of the Share-Based Compensation note in “Item 8. Consolidated Financial Statements and Supplementary Data.”
Item13. Certain Relationships and Related Transactions, and Director Independence
Information set forth under the heading “Directors’ Independence” under the Governance section of the Proxy Statement is incorporated herein by reference.
Item14. Principal Accounting Fees and Services
Our independent registered public accounting firm is KPMG LLP, New York, NY, Auditor Firm ID: 185. Information about the principal accounting fees and services is set forth under the section captioned “Proposal 3: Ratification of the Appointment of our Independent Registered Public Accounting Firm — Auditheading “Audit and Non-Audit Fees” inunder the “Proposal 3” section of the Proxy Statement and is incorporated herein by reference. Information about the Audit Committee’s preapproval policies and procedures is set forth in the section captioned “Proposal 3: Ratification of the Appointment of our Independent Registered Public Accounting Firm — Audit“Audit Committee Preapproval Policies and Procedures” inunder the “Proposal 3” section of the Proxy Statement and is incorporated herein by reference.
20202023 Form 10-K Page
76
77
PARTIV
Item15. Exhibits and Financial Statement Schedules
(a)(1) and (2) Financial Statements
The list of financial statements required by this item is set forth in Item 8. “Consolidated Financial Statements and Supplementary Data.” All other schedules specified under Regulation S-X have been omitted because they are not applicable, because they are not required, or because the information required is included in the financial statements or notes thereto.
(a)(3) and (c) Exhibits
An index of the exhibits which are required by this item and which are included or incorporated herein by reference in this report appears on pages 7779 through 80.82.
Item 16. Form 10-K Summary
None.
FOOT LOCKER,INC.
INDEX OF EXHIBITS
| ExhibitNo. | | | Description | Description
|
|---|
3.1 | | Certificate of Incorporation of the Registrant, as filed by the Department of State of the State of New York on April 7, 1989 (incorporated herein by reference to Exhibit 3(i)(a) to the Quarterly Report on Form 10-Q for the quarterly period ended July 26, 1997 filed on September 4, 1997 (the “July 26, 1997 Form 10-Q”)), as amended by Certificates of Amendment of the Certificate of Incorporation of the Registrant, as filed by the Department of State of the State of New York on (a) July 20, 1989, (b) July 24, 1990, (c) July 9, 1997 (incorporated herein by reference to Exhibit 3(i)(b) to the July 26, 1997 Form 10-Q), (d) June 11, 1998 (incorporated herein by reference to Exhibit 4.2(a) to the Registration Statement on Form S-8 (Registration No. 333-62425) (the “1998 Form S-8”)), (e) November 1, 2001 (incorporated(incorporated herein by reference to Exhibit 4.2 to the Registration Statement on Form S-8 (Registration No. 333-74688) (the “2001 Form S-8”)), (f) May 28, 2014 (incorporated herein by reference to Exhibit 3.1 to the Current Report on Form 8-K dated May 21, 2014 filed on May 28, 2014), and (g) December 8, 2020 (incorporated(incorporated herein by reference to Exhibit 3.1 to the Current Report on Form 8-K dated December 7, 2020 filed on December 8, 2020). |
| | |
3.2 | | By-LawsBylaws of the Registrant as amended (incorporated herein by reference to Exhibit 3.1 to the Current Report on Form 8-K dated February 20, 2018September 22, 2023 filed on FebruarySeptember 22, 2018)2023).
|
| | |
4.1* | | Description of Registrant’s Securities (incorporated by reference to Exhibit 4.1 to the Annual Report on Form 10-K for the fiscal year ended January 29, 2022 filed on March 22, 2022). |
| | |
3.34.2
| | Rights Agreement, dated as of December 7, 2020, between the Registrant and Computershare Trust Company, N.A., as Rights Agent (incorporated herein by reference to Exhibit 3.1 to the Current Report on Form 8-K dated December 7, 2020 filed on December 8, 2020).
|
|
|
|
4.1
|
| Indenture, dated as of October 10, 19915, 2021, by and among the Registrant, certain guarantors from time to time party thereto, and U.S. Bank National Association, as Trustee (incorporated herein by reference to Exhibit 4.1 to the Registration StatementCurrent Report on Form S-3 (Registration No. 33-43334)).8-K dated September 29, 2021 filed on October 5, 2021. |
|
|
|
4.24.3
| | Form of 8-1/2 % Debentures4% Senior Notes due 20222029 (incorporated herein by reference to Exhibit 44.2 to the Current Report on Form 8-K dated January 16, 1992)September 29, 2021 form 8-K). |
|
|
|
4.3*10.1
| | Description of Registrant’s Securities.
|
|
|
|
10.1
|
| Credit Agreement, dated as of May 19, 2016, among Foot Locker, Inc., a New York corporation,the Registrant, the guarantors party thereto, the lenders party thereto and Wells Fargo, National Association, as agent, letter of credit issuer and swing line lender (incorporated herein by reference to Exhibit 10.1 to the Current Report on Form 8-K dated May 19, 2016 filed on May 19, 2016). |
| | |
10.2 | | Amendment No. 1 to Credit Agreement, dated as of July 14, 2020, among Foot Locker, Inc., a New York corporation,the Registrant, the guarantors party thereto, the lenders party thereto, and Wells Fargo, National Association, as administrative agent, letter of credit issuer, and swing line lender (incorporated herein by reference to Exhibit 10.1 to the Current Report on Form 8-K dated July 14, 2020 filed on July 16, 2020). |
|
|
|
10.3†
|
| Foot Locker 2007 Stock Incentive Plan, amended and restated as of May 21, 2014 (incorporated herein by reference to Exhibit 10.3 to the Current Report on Form 8-K dated December 23, 2014 filed on December 31, 2014.
|
| | |
10.4†10.3
| | Amendment Number OneNo. 2 to the Foot Locker 2007 Stock Incentive Plan, amended and restatedCredit Agreement, dated as of May 21, 2014 (incorporated herein by reference to Exhibit 10.5 to19, 2021, among the Annual Report on Form 10-K forRegistrant, the fiscal year ended January 28, 2017 filed on March 23, 2017). |
|
|
|
10.5†
|
| Foot Locker Long-Term Incentive Compensation Plan,guarantors party thereto, the lenders party thereto, and Wells Fargo, National Association, as amendedadministrative agent, letter of credit issuer, and restated (incorporated herein by reference to Exhibit 10.3 to the Current Report on Form 8-K dated March 23, 2016 filed on March 29, 2016) (the “March 23, 2016 Form 8-K”).
|
|
|
|
Exhibit No.
|
| Description
|
|---|
10.6†
|
| Foot Locker Executive Incentive Cash Compensation Planswing line lender (incorporated by reference to Exhibit 10.1 to the Current Report on Form 8-K dated March 28, 2018 filed by Foot Locker, Inc. on April 3, 2018)May 20, 2021).
|
| | |
10.7†10.4
| | FormAmendment No. 3 to Credit Agreement, dated as of Nonstatutory Stock Option Award Agreement for Executive Officers (incorporated herein by reference to Exhibit 10.40 toApril 21, 2023, among the Annual Report on Form 10-K forRegistrant, the fiscal year ended January 28, 2006 filed on March 27, 2006).
|
|
|
|
10.8†
|
| Formguarantors party thereto, the lenders party thereto, and Wells Fargo, National Association, as administrative and collateral agent, letter of Nonstatutory Stock Option Award Agreement for Executive Officers (incorporated herein by reference to Exhibit 10.1 to the March 26, 2014 Form 8-K).
|
|
|
|
10.9†
|
| Form of Time-Based Restricted Stock Unit Award Agreement (incorporated herein by reference to Exhibit 10.3 to the March 28, 2013 Form 8-K).
|
|
|
|
10.10†
|
| Form of Time-Based Restricted Stock Unit Award Agreement (incorporated herein by reference to Exhibit 10.2 to March 23, 2016 Form 8-K).
|
|
|
|
10.11†
|
| Form of Time-Based Restricted Stock Unit Award Agreement for new hires (incorporated herein by reference to Exhibit 10.1 to the Quarterly Report on Form 10-Q for the quarterly period ended July 30, 2016 filed on September 7, 2016).
|
|
|
|
10.12†
|
| Form of Performance Restricted Stock Unit Award Agreement for Long-Term Incentive Compensation Plan (incorporated herein by reference to Exhibit 10.1 to the March 23, 2016 Form 8-K).
|
|
|
|
10.13†
|
| Form of Accelerate Future Growth Award Agreementcredit issuer, and swing line lender (incorporated herein by reference to Exhibit 10.1 to the Current Report on Form 8-K dated April 12, 201825, 2023 filed on April 18, 2018.)25, 2023).
|
| | |
10.14†10.5
| | Executive Supplemental Retirement Plan (incorporated herein by reference to Exhibit 10(d) to the Registration Statement on Form 8-B filed on August 7, 1989 (Registration No. 1-10299) (the “8-B Registration Statement”)).
|
|
|
|
10.15†
|
| Amendment to the Executive Supplemental Retirement Plan (incorporated herein by reference to Exhibit 10(c)(i) to the Annual Report on Form 10-K for the fiscal year ended January 28, 1995 filed on April 24, 1995).
|
|
|
|
10.16†
|
| Amendment to the Executive Supplemental Retirement Plan (incorporated herein by reference to Exhibit 10(d)(ii) to the Annual Report on Form 10-K for the fiscal year ended January 27, 1996 filed on April 26, 1996).
|
|
|
|
10.17†
|
| Supplemental Executive Retirement Plan, as amended and restated (incorporated herein by reference to Exhibit 10.1 to the Current Report on Form 8-K dated August 13, 2007 filed on August 17, 2007).
|
|
|
|
10.18†
|
| Amendment to the Foot Locker Supplemental Executive Retirement Plan (incorporated herein by reference to Exhibit 10.1 to the Current Report on Form 8-K dated May 25, 2011 filed on May 27, 2011).
|
|
|
|
10.19†
|
| Amendment Number Two to the Foot Locker Supplemental Executive Retirement Plan (incorporated herein by reference to Exhibit 10.3 to the Current Report on Form 8-K dated March 26, 2014 filed on April 1, 2014 (the “March 26, 2014 Form 8-K”)).
|
|
|
|
10.20†
|
| Amendment Number Three to the Foot Locker Supplemental Executive Retirement Plan (incorporated herein by reference to Exhibit 10.1 to the Current Report on Form 8-K dated May 22, 2019 filed on May 28, 2019 (the “May 22, 2019 Form 8-K”)).
|
|
|
|
Exhibit No.
|
| Description
|
|---|
10.21†
|
| Amendment Number Four to the Foot Locker Supplemental Executive Retirement Plan (incorporated herein by reference to Exhibit 10.1 to the Quarterly Report on Form 10-Q for the quarterly period ended August 3, 2019 filed on September 11, 2019).
|
|
|
|
10.22†
|
| Foot Locker Directors’ Retirement Plan, as amended (incorporated herein by reference to Exhibit 10(k) to the 8-B Registration Statement).
|
|
|
|
10.23†
|
| Amendments to the Foot Locker Directors’ Retirement Plan (incorporated herein by reference to Exhibit 10(c) to the Quarterly Report on Form 10-Q for the quarterly period ended October 28, 1995 filed on December 11, 1995).
|
|
|
|
10.24†
|
| Foot Locker, Inc. Excess Cash Balance Plan (incorporated herein by reference to Exhibit 10.22 to the Annual Report on Form 10-K for the fiscal year ended January 31, 2009 filed on March 30, 2009 (the “2008 Form 10-K”)).
|
|
|
|
10.25†*
|
| Foot Locker Excess Savings Plan.
|
|
|
|
10.26†
|
| Automobile Expense Reimbursement Program for Senior Executives (incorporated herein by reference to Exhibit 10.26 to the 2008 Form 10-K).
|
|
|
|
10.27†
|
| Executive Medical Expense Allowance Program for Senior Executives (incorporated herein by reference to Exhibit 10.27 to the 2008 Form 10-K).
|
|
|
|
10.28†
|
| Financial Planning Allowance Program for Senior Executives (incorporated herein by reference to Exhibit 10.28 to the 2008 Form 10-K).
|
|
|
|
10.29†
|
| Long-Term Disability Program for Senior Executives (incorporated herein by reference to Exhibit 10.32 to the 2008 Form 10-K).
|
|
|
|
10.30
|
| Form of indemnification agreement, as amended (incorporated herein by reference to Exhibit 10(g) to the 8-B Registration Statement).
|
|
|
|
10.31
|
| Amendment to form of indemnification agreement (incorporated herein by reference to Exhibit 10.5 to the Quarterly Report on Form 10-Q for the quarterly period ended May 5, 2001 filed on June 13, 2001 (the “May 5, 2001 Form 10-Q”)).
|
|
|
|
10.32
|
| Trust Agreement dated as of November 12, 1987 (“Trust Agreement”), between F.W. Woolworth Co. and The Bank of New York, as amended and assumed by the Registrant (incorporated herein by reference to Exhibit 10(j) to the 8-B Registration Statement). |
|
|
|
10.33
|
| , as amended by Amendment No. 1 to Trust Agreement made as of April 11, 2001 (incorporated(incorporated herein by reference to Exhibit 10.4 to the May 5, 2001 Form 10-Q)10-Q). |
| | |
ExhibitNo. | | Description |
| 10.6† | | Foot Locker 2007 Stock Incentive Plan, amended and restated as of March 22, 2023 (incorporated herein by reference to Exhibit 10.1 on Form S-8 (Registration No.333-272007), filed on May 17, 2023 (the “2023 Form S-8”)). |
| | |
| 10.7† | | Executive Incentive Cash Compensation Plan (incorporated by reference to Exhibit 10.1 to the Current Report on Form 8-K dated March 28, 2018 filed on April 3, 2018). |
| | |
10.8† | | Long-Term Incentive Compensation Plan, as amended and restated (incorporated herein by reference to Exhibit 10.3 to the Current Report on Form 8-K dated March 23, 2016 filed on March 29, 2016). |
10.34†
| | |
10.9† | | 2023 Foot Locker Employee Stock Purchase Plan (incorporated herein by reference to Exhibit 10.2 on the 2023 Form S-8). |
| | |
10.10† | | Excess Cash Balance Plan (incorporated herein by reference to Exhibit 10.22 to the Annual Report on Form 10-K for the fiscal year ended January 31, 2009 filed on March 30, 2009 (the “2008 Form 10-K”)). |
| | |
| 10.11† | | Excess Savings Plan (incorporated herein by reference to Exhibit 10.25 to the Annual Report on Form 10-K for the fiscal year ended January 30, 2021 filed on March 25, 2021). |
| | |
10.12† | | Form of Stock Option Award Agreement (incorporated by reference to Exhibit 10.8 to the Annual Report on Form 10-K for the fiscal year ended January 29, 2022 filed on March 22, 2022). |
| | |
10.13† | | Form of Restricted Stock Unit Award Agreement for Executives (incorporated by reference to Exhibit 10.9 to the Annual Report on Form 10-K for the fiscal year ended January 29, 2022 filed on March 22, 2022). |
| | |
10.14† | | Form of Restricted Stock Unit Award Agreement for Directors (incorporated by reference to Exhibit 10.10 to the Annual Report on Form 10-K for the fiscal year ended January 29, 2022 filed on March 22, 2022). |
| | |
10.15† | | Form of Performance Stock Unit Award Agreement (incorporated by reference to Exhibit 10.11 to the Annual Report on Form 10-K for the fiscal year ended January 29, 2022 filed on March 22, 2022). |
| | |
10.16† | | Form of Stock Option Inducement Award Agreement (Annual Award) for Mary N. Dillon (incorporated herein by reference to Exhibit 99.3 on Form S-8 (Registration No. 333-267044), filed on August 24, 2022 (the "2022 Form S-8")). |
| | |
10.17† | | Form of Restricted Stock Unit Inducement Award Agreement (Annual Award) for Mary N. Dillon (incorporated herein by reference to Exhibit 99.4 to the 2022 Form S-8). |
| | |
10.18† | | Form of Restricted Stock Unit Inducement Award Agreement for Mary N. Dillon (Sign-On Award) (incorporated herein by reference to Exhibit 99.1 to the 2022 Form S-8). |
| | |
10.19† | | Form of Performance Stock Unit Inducement Award Agreement (Annual Award) for Mary N. Dillon (incorporated herein by reference to Exhibit 99.5 to the 2022 Form S-8). |
| | |
10.20† | | Form of Performance Stock Unit Inducement Award Agreement (Transformation Award) for Mary N. Dillon (incorporated herein by reference to Exhibit 99.2 to the 2022 Form S-8). |
| | |
10.21† | | Executive Supplemental Retirement Plan (incorporated herein by reference to Exhibit 10(d) to the Registration Statement on Form 8-B filed on August 7, 1989 (Registration No. 1-10299) (the “8-B Registration Statement”)), as amended by Amendment No. 1 to Executive Supplemental Retirement Plan (incorporated herein by reference to Exhibit 10(c)(i) to the Annual Report on Form 10-K for the fiscal year ended January 28, 1995 filed on April 24, 1995), Amendment No. 2 to Executive Supplemental Retirement Plan (incorporated herein by reference to Exhibit 10(d)(ii) to the Annual Report on Form 10-K for the fiscal year ended January 27, 1996 filed on April 26, 1996). |
ExhibitNo. | | Description |
10.22† | | Supplemental Executive Retirement Plan (the “SERP”), as amended and restated (incorporated herein by reference to Exhibit 10.1 to the Current Report on Form 8-K dated August 13, 2007 filed on August 17, 2007), as amended by Amendment No. 1 to SERP (incorporated herein by reference to Exhibit 10.1 to the Current Report on Form 8-K dated May 25, 2011 filed on May 27, 2011), Amendment No. 2 to SERP (incorporated herein by reference to Exhibit 10.3 to the Current Report on Form 8-K dated March 26, 2014 filed on April 1, 2014), Amendment No. 3 to SERP (incorporated herein by reference to Exhibit 10.1 to the Current Report on Form 8-K dated May 22, 2019 filed on May 28, 2019), and Amendment No. 4 to SERP (incorporated herein by reference to Exhibit 10.1 to the Quarterly Report on Form 10-Q for the quarterly period ended August 3, 2019 filed on September 11, 2019). |
| | |
10.23† | | Directors’ Retirement Plan, as amended (incorporated herein by reference to Exhibit 10(k) to the 8-B Registration Statement), as amended by Amendment No. 1 to Directors’ Retirement Plan (incorporated herein by reference to Exhibit 10(c) to the Quarterly Report on Form 10-Q for the quarterly period ended October 28, 1995 filed on December 11, 1995). |
| | |
10.24† | | Automobile Expense Reimbursement Program for Senior Executives (incorporated herein by reference to Exhibit 10.26 to the 2008 Form 10-K). |
| | |
10.25† | | Executive Medical Expense Allowance Program for Senior Executives (incorporated herein by reference to Exhibit 10.27 to the 2008 Form 10-K). |
| | |
10.26† | | Financial Planning Allowance Program for Senior Executives (incorporated herein by reference to Exhibit 10.28 to the 2008 Form 10-K). |
| | |
10.27† | | Long-Term Disability Program for Senior Executives (incorporated herein by reference to Exhibit 10.32 to the 2008 Form 10-K). |
| | |
10.28† | | Employment Agreement, dated August 16, 2022, by and between Mary N. Dillon and the Company, (incorporated herein by reference to Exhibit 10.2 to the Current Report on Form 8-K dated August 16, 2022 filed on August 19, 2022). |
| | |
10.29† | | Employment Agreement, dated November 6, 2014, by and between Richard A. Johnson and the Company (incorporated herein by reference to Exhibit 10.2 to the Current Report on Form 8-K dated November 3, 2014 filed on November 7, 2014). |
| | |
10.35†10.30†
| | Amendment No. 1 to Employment Agreement, dated August 17, 2022, by and between Richard A. Johnson and the Company (incorporated herein by reference to Exhibit 10.1 to the Current Report on Form 8-K dated August 16, 2022 filed on August 19, 2022). |
| | |
| 10.31† | | Form of Senior Executive Employment Agreement (incorporated herein by reference to Exhibit 10.1 to the Current Report on Form 8-K dated April 20, 2015 filed on April 20, 2015). |
|
|
|
10.36†
10.32†* |
| Form of Senior Executive Employment Agreement (incorporated herein by reference to Exhibit 10.19 to the Annual Report on Form 10-K for the fiscal year ended January 30, 2016 filed on March 24, 2016)Offer Letter (including specific contractual obligations). |
|
|
|
10.37†
10.33†* |
| Form of Indemnification Agreement, dated July 28, 2020, between the Registrant and Stephen D. Jacobs (incorporated herein by reference to Exhibit 99.1 to the Current Report on Form 8-K dated September 1, 2020 filed September 4, 2020).as amended. |
|
|
|
† | Management contract or compensatory plan or arrangement.arrangement |
SIGNATURES
Pursuant to the requirements of Section 13 or 15(d) of the Securities Exchange Act of 1934, the Company has duly caused this report to be signed on its behalf by the undersigned, thereunto duly authorized.
| |
| FOOT LOCKER, INC.
|
| FOOT LOCKER, INC.
|
| By: /s/ RICHARD A. JOHNSON
|
| Richard A. JohnsonBy: /s/ MARY N. DILLON
|
| Mary N. Dillon
Chairman, President and Chief Executive Officer |
| |
| Date: March 25, 202128, 2024 |
Pursuant to the requirements of the Securities Exchange Act of 1934, this report has been signed below on March 25, 2021,28, 2024, by the following persons on behalf of the Company and in the capacities indicated.
| | |
/s/ RICHARD A. JOHNSON
| | /s/ LAUREN B. PETERS
|
Richard A. Johnson/s/ MARY N. DILLON
| | /s/ MICHAEL BAUGHN |
Mary N. Dillon | | Lauren B. PetersMichael Baughn
|
Chairman, President and
| | Executive Vice President and |
Chief Executive Officer | | Chief Financial Officer |
| | |
/s/ GIOVANNA CIPRIANO | | /s/ ULICE PAYNE, JR.STEVEN OAKLAND |
Giovanna Cipriano | | Ulice Payne, Jr.Steven Oakland
|
Senior Vice President and Chief Accounting Officer | | Director |
| | |
/s/ MAXINE CLARKVIRGINIA C. DROSOS | | /s/ DARLENE NICOSIAULICE PAYNE, JR. |
Maxine ClarkVirginia C. Drosos
| | Darlene NicosiaUlice Payne, Jr.
|
Director | | Director |
| | |
/s/ ALAN D. FELDMAN | | /s/KIMBERLY K. UNDERHILL |
Alan D. Feldman | | Kimberly K. Underhill |
Director | | Director |
| | |
/s/ ALAN D. FELDMANGUILLERMO G. MARMOL | | /s/ KIMBERLY K. UNDERHILLTRISTAN WALKER |
Alan D. FeldmanGuillermo G. Marmol
| | Kimberly K. UnderhillTristan Walker
|
Director | | Director |
| | |
/s/ GUILLERMO G. MARMOLDARLENE NICOSIA | | /s/ TRISTAN WALKERDONA D. YOUNG |
Guillermo G. MarmolDarlene Nicosia
| | Tristan WalkerDona D. Young
|
Director | | DirectorNon-Executive Chair
|
| | |
/s/ MATTHEW M. MCKENNA
|
| /s/ DONA D. YOUNG
|
Matthew M. McKenna
|
| Dona D. Young
|
Director
|
| Lead Director
|
|
|
|
/s/ STEVEN OAKLAND
|
|
|
Steven Oakland
|
|
|
Director
|
|
|
|
|
|
20202023 Form 10-K Page
82
83