UNITED STATES
SECURITIES AND EXCHANGE COMMISSION
WASHINGTON, D.C. 20549
FORM 10-K
|
| | | | |
| x | ANNUAL REPORT PURSUANT TO SECTION 13 OR 15(d) OF THE SECURITIES EXCHANGE ACT OF 1934 |
| For the fiscal year ended December 31, 20192022 |
OR
|
| | | | |
| ¨ | TRANSITION REPORT PURSUANT TO SECTION 13 OR 15(d) OF THE SECURITIES EXCHANGE ACT OF 1934 |
| For the transition period from to |
Commission File Number 1-10258
TREDEGAR CORPORATION
(Exact name of registrant as specified in its charter)
| | | | | | | | | | | |
| Virginia | | 54-1497771 |
(State or other jurisdiction
of incorporation or organization) | | (I.R.S. Employer
Identification No.) |
| | |
Virginia | | 54-1497771 |
(State or other jurisdiction
of incorporation or organization)
| | (I.R.S. Employer
Identification No.)
|
| | |
1100 Boulders Parkway, Richmond, Virginia
| | 23225 |
Richmond, | Virginia | | 23225 |
| (Address of principal executive offices) | | (Zip Code) |
Registrant’s telephone number, including area code: 804-330-1000
Securities registered pursuant to Section 12(b) of the Act:
|
| | | | | | | |
Title of Each Classeach class | Trading Symbol | Name of Each Exchangeeach exchange on Which Registeredwhich registered |
| Common Stock | TG | New York Stock Exchange |
Securities registered pursuant to Section 12(g) of the Act:
None
Indicate by check mark if the registrant is a well-known seasoned issuer, as defined in Rule 405 of the Securities Act. Yes ¨ No x
Indicate by check mark if the registrant is not required to file reports pursuant to Section 13 or Section 15(d) of the Act. Yes ¨ No x
Indicate by check mark whether the registrant (1) has filed all reports required to be filed by Section 13 or 15(d) of the Securities Exchange Act of 1934 during the preceding 12 months (or for such shorter period that the registrant was required to file such reports), and (2) has been subject to such filing requirements for at least the past 90 days. Yes x No ¨
Indicate by check mark whether the registrant has submitted electronically every Interactive Data File required to be submitted pursuant to Rule 405 of Regulation S-T (§ 232.405 of this chapter) during the preceding 12 months (or for such shorter period that the registrant was required to submit such files). Yes x No ¨
Indicate by check mark whether the registrant is a large accelerated filer, an accelerated filer, a non-accelerated filer, a smaller reporting company, or an emerging growth company. See the definitions of “large accelerated filer,” “accelerated filer,” “smaller reporting company” and “emerging growth company” in Rule 12b-2 of the Exchange Act.:
|
| | | | | | | | | | | | | | | | | | | | | | |
| Large accelerated filer | | o | Accelerated filer | x | Smaller reporting company | | o |
| | | | | |
| Non-accelerated filer | | o | | Emerging growth company | | o |
If an emerging growth company, indicate by check mark if the registrant has elected not to use the extended transition period for complying with any new or revised financial accounting standards provided pursuant to Section 13(a) of the Exchange Act. ¨
Indicate by check mark whether the registrant has filed a report on and attestation to its management’s assessment of the effectiveness of its internal control over financial reporting under Section 404(b) of the Sarbanes-Oxley Act (15 U.S.C. 7262(b)) by the registered public accounting firm that prepared or issued its audit report. x
If securities are registered pursuant to Section 12(b) of the Act, indicate by check mark whether the financial statements of the registrant included in the filing reflect the correction of an error to previously issued financial statements. ¨
Indicate by check mark whether any of those error corrections are restatements that required a recovery analysis of incentive-based compensation received by any of the registrant’s executive officers during the relevant recovery period pursuant to §240.10D-1(b). ¨
Indicate by check mark whether the registrant is a shell company (as defined in Rule 12b-2 of the Act). Yes ¨ No x
Aggregate market value of voting and non-voting common equity held by non-affiliates of the registrant as of June 30, 20192022 (the last business day of the registrant’s most recently completed second fiscal quarter): $437,372,894*$266,141,470*
Number of shares of Common Stock outstanding as of January 31, 2020: 33,365,039
March 10, 2023: 34,016,689 |
| | | | |
| * | In determining this figure, an aggregate of 7,037,0257,351,331 shares of Common Stock beneficially owned by Floyd D. Gottwald, Jr., John D. Gottwald, William M. Gottwald and the members of their immediate families has been excluded because the shares are deemed to be held by affiliates. The aggregate market value has been computed based on the closing price in the New York Stock Exchange on June 30, 2019.2022. |
Documents Incorporated By Reference
Portions of the Tredegar Corporation Proxy Statement for the 20202023 Annual Meeting of Shareholders (the “Proxy Statement”) are incorporated by reference into Part III of this Form 10-K.
Index to Annual Report on Form 10-K
Year Ended December 31, 20192022
| | | | | | | | | | | |
| | Page |
| | | |
| | Page | |
| | | |
Part I | | | |
| Business | | | | |
| | | |
| | | |
| Properties | | | | |
| | | |
| | | |
| | | |
| | | |
| | | |
| Selected Financial Data | | | | |
| | | |
| | | |
| | | |
| | | |
| | | |
| | | |
| | | |
Part III | | | |
| | | |
| | | |
| | | |
| | |
|
| | | |
| | | |
| | | |
| | | |
| | | |
| | | |
PART I
Item 1. BUSINESS
Description of Business
Tredegar Corporation (“Tredegar”), a Virginia corporation incorporated in 1988, is engaged, through its subsidiaries, in the manufacture of aluminum extrusions, polyethylene (“PE”) plastic films and polyester (“PET”) films. Unless the context requires otherwise, all references herein to “Tredegar,” “the Company,” “we,” “us” or “our” are to Tredegar Corporation and its consolidated subsidiaries.
The Company's reportable business segments are Aluminum Extrusions, PE Films and Flexible Packaging Films.
On October 30, 2020, the Company completed the sale of its personal care films business (“Personal Care Films”). The transaction excluded the packaging film lines and related operations located at the Pottsville, Pennsylvania manufacturing site (“Pottsville Packaging”), which are now being reported with the Surface Protection component of PE Films. Commencing in the third quarter of 2020, all historical results for Personal Care Films have been presented as discontinued operations.
For more information on this transaction, see Note 15 “Discontinued Operations” to the Consolidated Financial Statements included in Item 15. “Exhibits and Financial Statement Schedules” (“Item 15”) of this Annual Report on Form 10-K for the year ended December 31, 2022 (“Form 10-K”).
Aluminum Extrusions
Aluminum Extrusions, also referred to as Bonnell Aluminum, produces high-quality, soft-alloysoft and medium-strengthmedium strength alloyed aluminum extrusions, custom fabricated and finished, aluminum extrusions for the building and construction, automotive and transportation, consumer durables goods, machinery and equipment, electrical and renewable energy, and distribution markets. Bonnell Aluminum has manufacturing facilities located in: Newnan, Georgia; Carthage, Tennessee; Niles, Michigan; Elkhart, Indiana; and Clearfield, Utah.in the United States (“U.S.”).
Aluminum Extrusions manufactures mill (unfinished), machined, anodized and painted, (finished) and fabricatedthermally improved aluminum extrusions for sale directly to fabricators and distributors. It also manufactures and sells branded aluminum flooring trims under itsproduct lines: Futura TransitionsTM line by Bonnell Aluminum (flooring trims) and TSLOTSTM by Bonnell Aluminum (structural aluminum framing systems under its TSLOTSTM line.systems). Aluminum Extrusions competes primarily on the basis of product quality, service and price. Sales are made predominantly in the United States (“U.S.”). The end-use markets for Aluminum Extrusions are cyclical and seasonal in nature.
The end-uses in each of Aluminum Extrusions’ primary market segments include:
| | | | | | | | |
| Major Markets | | End-Uses |
| | |
Major Markets | | End-Uses |
| | |
| Building & construction - nonresidential | | Commercial windows and doors, curtain walls, storefronts and entrances, automatic entry doors, walkway covers, ducts, louvers and vents, office wall panels, partitions and interior enclosures, acoustical walls and ceilings, point of purchase displays, pre-engineered structures, and flooring trims (Futura TransitionsTM)by Bonnell Aluminum) |
| | |
| Building & construction - residential | | ShowerResidential windows and doors, shower and tub enclosures, railing and support systems, venetian blinds, and swimming pools and storm shutters |
| Automotive & transportation | | |
Automotive | | Automotive and light truck structural components, spare parts,battery enclosures for electric vehicles, after-market automotive accessories, grills for heavy trucks, travel trailers and recreation vehicles |
| | |
| Consumer durables | | Furniture,Office furniture, pleasure boats, refrigerators and freezers, appliances and sporting goods |
| | |
| Machinery & equipment | | Material handling equipment, conveyors and conveyingconveyor systems, medical equipment, industrial fans and aluminum framing systems (TSLOTSTM)by Bonnell Aluminum) |
| | |
| Distribution (metal service centers specializing in stock and release programs and custom fabrications to small manufacturers) | | Various custom profiles including storm shutters, pleasure boat accessories, theater set structures and various standard profiles (including rod, bar, tube and pipe) |
| Electrical & renewable energy | | |
Electrical | | Lighting fixtures, electronic apparatus, solar panel frames, electronic apparatusbrackets and rigid and flexible conduits |
Aluminum Extrusions’ net sales (sales less freight) by market segment for the three years ended December 31, 2022, 2021 and 2020 is shown below:
|
| | | | | | |
| % of Aluminum Extrusions Net Sales by Market Segment |
| | 2019 | | 2018 | | 2017 |
| Building and construction: | | | | | |
| Nonresidential | 51% | | 51% | | 51% |
| Residential | 8% | | 8% | | 9% |
| Automotive | 9% | | 8% | | 8% |
| Specialty: | | | | | |
| Consumer durables | 11% | | 12% | | 12% |
| Machinery & equipment | 7% | | 7% | | 7% |
| Electrical | 7% | | 7% | | 7% |
| Distribution | 7% | | 7% | | 6% |
| | | | | | |
| Total | 100% | | 100% | | 100% |
| | | | | | | | | | | | | | | | | | | | |
% of Aluminum Extrusions Net Sales1 by Market Segment |
| | 2022 | | 2021 | | 2020 |
| Building and construction: | | | | | |
| Nonresidential | 53% | | 50% | | 56% |
| Residential | 10% | | 10% | | 9% |
| Automotive | 8% | | 8% | | 8% |
| Specialty: | | | | | |
| Consumer durables | 10% | | 10% | | 10% |
| Machinery & equipment | 10% | | 8% | | 7% |
| Electrical | 4% | | 6% | | 4% |
| Distribution | 5% | | 8% | | 6% |
| Total | 100% | | 100% | | 100% |
| 1. The Company uses net sales from continuing operations as its measure of revenues from external customers at the segment level. For more business segment information, see Note 13 “Business Segments” to the Consolidated Financial Statements in Item 15. |
In 2019, 20182022, 2021 and 2017, nonresidential building and construction2020, Aluminum Extrusions net sales accounted for approximately 29%71%, 28%67% and 26%63% of Tredegar’s consolidated net sales, respectively.
Open Orders. Overall open orders in Aluminum Extrusions was approximately $136.0 million, or 41 million pounds, at December 31, 2022 compared to approximately $306.4 million, or 97 million pounds, at December 31, 2021, a decrease of $170.4 million, or approximately 56%. The reduction in open orders in 2022 compared to 2021 is primarily due to order cancellations as customers report high inventory levels. During the second half of 2022, the Company has observed order cancellations as customers report high inventory levels. Aluminum Extrusions expects the confluence of orders, cancellations and shipments to drive open orders to pre-COVID-19, normalized levels during the first half of 2023. The outlook for demand and shipments in 2023 remains uncertain given recessionary concerns. Sales volume for Aluminum Extrusions, which the Company believes is cyclical and seasonal in nature due to its end-use markets, was 174.7 million pounds in 2022, 183.4 million pounds in 2021 and 186.4 million pounds in 2020.
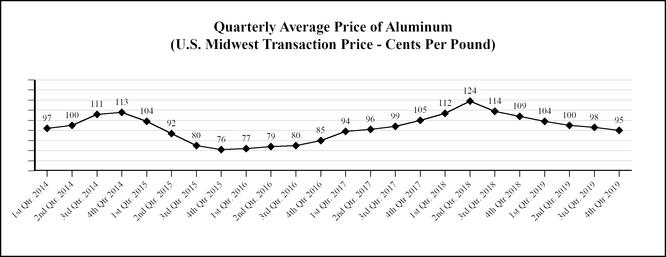
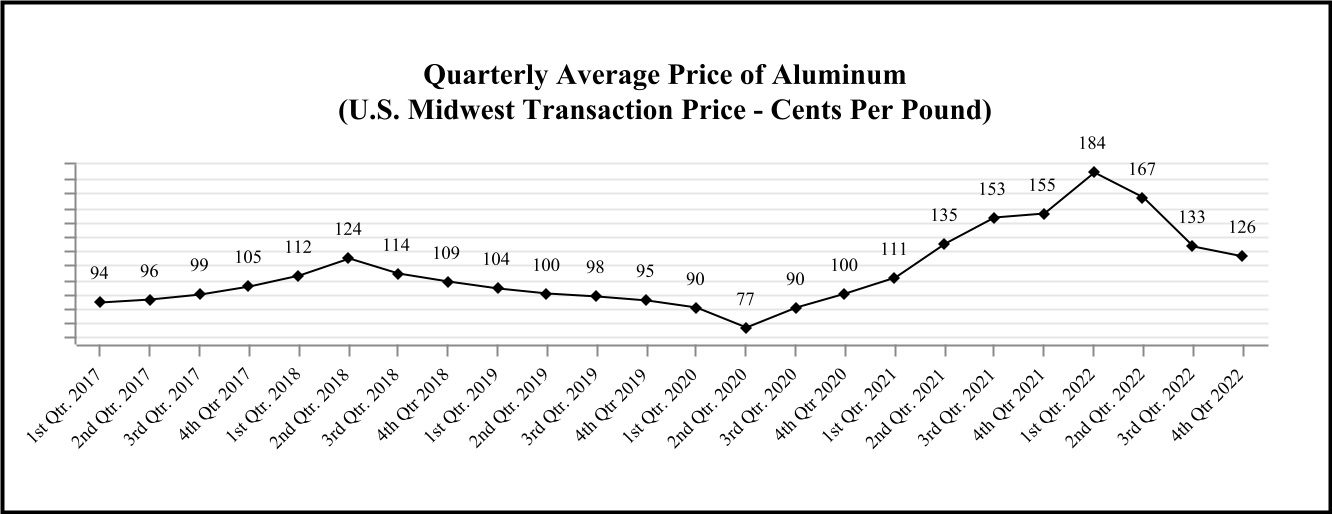
Raw Materials. The primary raw materials used by Aluminum Extrusions consist of aluminum ingot, aluminum scrap and various alloys, which are purchased from domestic and foreign producers in open-market purchases and under annual contracts. Refer to Item 7a. "Quantitative and Qualitative Disclosures About Market Risk” of this Form 10-K (“Item 7a”) for additional information on aluminum price trends. Aluminum Extrusions believes that it has adequate supply agreements for aluminum raw materials in 2023 despite continued supply chain cost increases related to paint, chemicals, packaging and other requirednon-aluminum raw materials and supplies in the foreseeable future.materials.
PE Films
PE Films manufactures plastic films, elastics and laminate materials primarily utilized inproduces surface protection films, personal care materials,polyethylene overwrap films and specialty and optical lighting applications. These products are manufactured at facilities in the U.S., The Netherlands, Hungary, China, Brazil and India. PE Films competes in all of its markets on the basis of product innovation, quality, service and price.
Surface Protection.films for other markets. Tredegar’s Surface Protection unit produces single- and multi-layer surface protection films sold under the UltraMask®UltraMask®, ForceField™ForceField™, ForceField PEARL®, Pearl A™, Lithyn™ and Pearl A™Obsidian™ brand names. These films, which are manufactured at facilities in the U.S. and China, support manufacturers of optical and other specialty substrates used in high-technology applications, most notably protecting high-value components of flat panel and flexible displays used in televisions, monitors, notebooks, smart phones,smartphones, tablets, e-readers, automobilesdigital signage, semiconductors and digital signage,automobiles during the manufacturing and transportation process. Tredegar’s Lithyn™ Series represents a new class of tapes for wafer thinning, singulation and transportation designed to enable customers’ to overcome processing challenges and reduce costs. The Obsidian™ series of products is designed for usage in automotive applications. In 2019, 20182022, 2021 and 2017, Surface Protection2020, PE Films accounted for approximately 11%, 10%15% and 11%, respectively,19% of Tredegar’s consolidated net sales.sales, respectively.
Personal Care. Tredegar’sIn October 2020, the Surface Protection unit assumed responsibility for Pottsville Packaging, which was previously reported within the Personal Care unit is a global suppliercomponent of apertured, elastic and embossedPE Films. Pottsville Packaging produces thin-gauge films laminate materials, and polyethylene and polypropylene overwrap films for personal care markets, including:
| |
• | Apertured film and laminate materials for use as topsheet in feminine hygiene products, baby diapers and adult incontinence products (including materials sold under the Sure&Soft™, Soft Quilt™, ComfortAire™, ComfortFeel™ and FreshFeel™ brand names);
|
| |
• | Elastic films and fabrics for use as components for baby diapers, adult incontinence products and feminine hygiene products (including components sold under the ExtraFlex™ and FlexAire™ brand names);
|
| |
• | Three-dimensional apertured film transfer layers for baby diapers and adult incontinence products sold under the AquiSoft™, AquiDry® and AquiDry Plus™ brand names;
|
Thin-gauge films that are readily printable and convertible on conventional processing equipment for overwrap for bathroom tissue and paper towels; and
Polypropylene films for various industrial applications, including tape and automotive protection.
In 2019, 2018 and 2017, Personal Care accounted for approximately 17%, 22% and 27% of Tredegar’s consolidated net sales, respectively.
Bright View Technologies. Tredegar’s Bright View Technologies, a late stage start-up company, designs and manufactures a range of advanced film-based components that provide specialized functionality for the global engineered optics market. By leveraging multiple platforms, including film capabilities and its patented microstructure technology, Bright View Technologies offers high performance solutions for a variety of LED-based applications such as lighting, consumer electronics, automotive, and other optical management markets.
PE Films’ net sales by market segment over the last three years are shown below:towels.
|
| | | | | |
| % of PE Films Net Sales by Market Segment * |
| | 2019 | | 2018 | | 2017 |
| Personal Care | 59% | | 68% | | 70% |
| Surface Protection | 38% | | 30% | | 28% |
| Bright View Technologies | 3% | | 2% | | 2% |
| Total | 100% | | 100% | | 100% |
| | | | | | |
| * See previous discussion by market segment for comparison of net sales to the Company’s consolidated net sales for each of the years presented. |
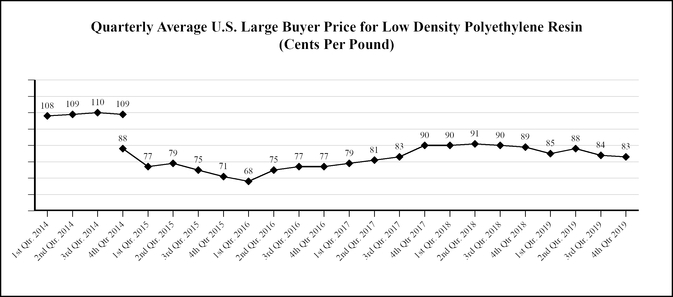
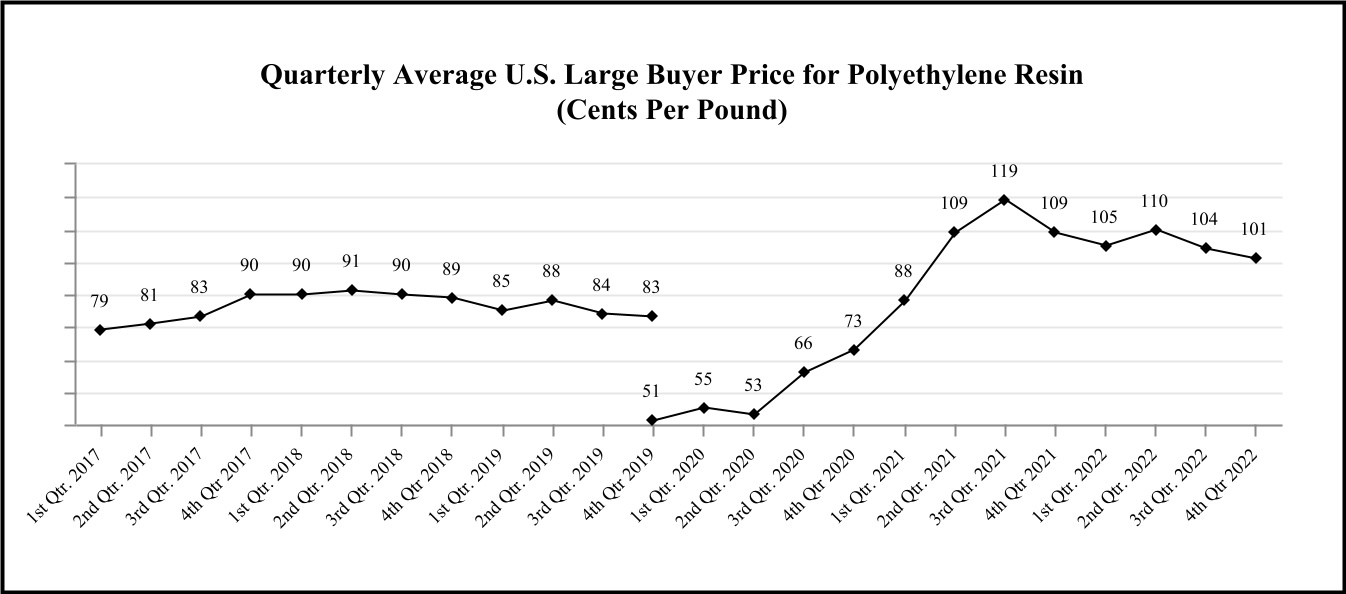
Raw Materials. The primary raw materials used by PE Films are low density, linear low density and high density polyethylene and polypropylene resins. These raw materials are obtained from domestic and foreign suppliers at competitive prices. Refer to Item 7a for additional information on resin price trends. PE Films believes that there will be an adequate supply of polyethylene and polypropylene resins in the foreseeable future.
Research and Development. Tredegar’s spending for research and development (“R&D”) activities in 2022, 2021 and 2020 was primarily related to PE Films. R&D spending by the PE Films also buys polypropylene-based nonwoven fabrics based on the resins previously notedwas approximately $5.3 million, $5.7 million and styrenic block copolymers,$7.7 million in 2022, 2021 and it believes there will be an adequate supply of these raw materials in the foreseeable future.2020, respectively.
Customers. PE Films’ products are sold globally,primarily in the U.S. and Asia, with the top fivefour customers, collectively, comprising 64%88%, 66%88% and 68%84% of its net sales in 2019, 20182022, 2021 and 2017,2020, respectively. Its largestNo single PE Films customer is The Procter & Gamble Company (“P&G”). Net sales to P&G totaled $59 million in 2019, $107 million in 2018 and $122 million in 2017 (these amounts include film sold to third parties that converted the film into materials used with products manufactured by P&G).exceeds 10% of Tredegar’s consolidated net sales. For additional information, see “ItemItem 1A. Risk“Risk Factors” of this Form 10-K (“Item 1A”).
Flexible Packaging Films
Flexible Packaging Films is comprised of Terphane Holdings LLC (“Terphane”). Flexible Packaging Films produces PET-based films for use in packaging applications that have specialized properties, such as heat resistance, strength, barrier protection and the ability to accept high-quality print graphics. These differentiated, high-value films are primarily manufactured in Brazil and sold in Latin America and the U.S. under the Terphane®, Sealphane® and SealphaneEcophane® brand names. Major end uses include food packaging and industrial applications. Flexible Packaging Films competes in all of its markets on the basis of product quality, service and price. In 2022, 2021 and 2020, Terphane accounted for approximately 19%, 18% and 18% of Tredegar’s consolidated net sales, respectively.
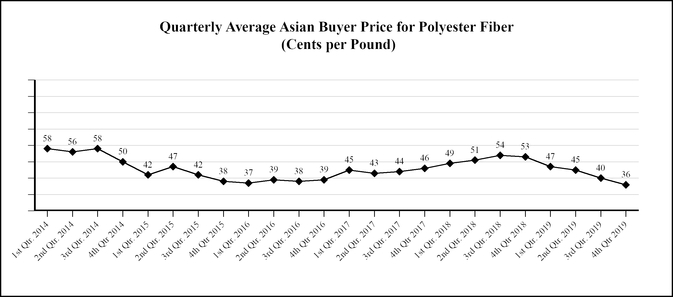
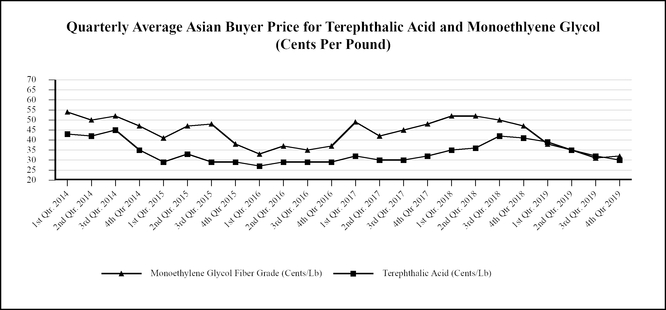
Raw Materials. The primary raw materials used by Flexible Packaging Films to produce polyester resins are purified terephthalic acid (“PTA”) and monoethylene glycol (“MEG”). Flexible Packaging Films also purchases additionalother polyester resins directly from suppliers. These raw materials are obtained from Brazilian and foreign suppliers at competitive prices. Flexible Packaging Films Terphane continues to monitor cost escalations to adjust selling prices as market dynamics permit and believes that there will be an adequate supply of polyester resins, PTA and MEG in the foreseeable future. Refer to Item 7a for additional information on resin price trends.
General
Intellectual Property. Tredegar considers patents, licenses and trademarks to be significantmaterial to PE Films. On December 31, 2019,2022, PE Films held 27443 patents (including 696 U.S. patents), licenses under patents owned by third parties, and 10576 registered trademarks (including 84 U.S. registered trademarks). Flexible Packaging Films held 1 U.S. patent and 1417 registered trademarks (including 24 U.S. registered trademarks). Aluminum Extrusions held no U.S. patents and 23 U.S. registered trademarks. OnAs of December 31, 2019,2022, these patents had remaining terms of less than one year1.5 to 1917 years.
ResearchGovernment Regulation. The Company’s operations are subject to various local, state, federal and Development. Tredegar’s spending for researchforeign government regulations, including environmental, privacy and development (“R&D”) activities in 2019, 2018anti-corruption and 2017 was primarily related to PE Films. PE Films has technical centers in: Durham, North Carolina; Richmond, Virginia;anti-bribery laws and Terre Haute, Indiana. Flexible Packaging Films has a technical center in Bloomfield, New York. R&D spending by the Company was approximately $19.6 million, $18.7 million and $18.3 million in 2019, 2018 and 2017, respectively.regulations.
Backlog. Overall backlog for continuing operations in Aluminum Extrusions was approximately $52.8 million at December 31, 2019 compared to approximately $67.6 million at December 31, 2018, a decrease of $14.8 million, or approximately 22%. Backlogs are not material to the operations in PE Films or Flexible Packaging Films. Net sales for Aluminum Extrusions, which the Company believes are cyclical in nature, were $529.6 million in 2019, $573.1 million in 2018 and $466.8 million in 2017.
Environmental Regulation.U.S. laws concerning the environment to which the Company’s domestic operations are or may be subject to include among others, the Clean Water Act, the Clean Air Act, the Resource Conservation and Recovery Act, the Occupational Safety and Health Act, the National Environmental Policy Act, the Toxic Substances Control Act, the Comprehensive Environmental Response, Compensation and Liability Act (“CERCLA”), regulations promulgated under these acts, and other federal, state or local laws or regulations governing environmental matters. Compliance with these laws is an important consideration because Tredegar uses hazardous materials in some of its operations, is a generator of hazardous waste, and wastewater from the Company’s operations is discharged to various types of wastewater management systems. Under CERCLA and other laws, Tredegar may be subject to financial exposure for costs associated with waste management and disposal, even if the Company fully complies with applicable environmental laws.
The U.S. Environmental Protection Agency has adopted regulations under the Clean Air Act relating to emissions of carbon dioxide and other greenhouse gases (“GHG”), including mandatory reporting and permitting requirements. Several of the Company’s manufacturing operations result in emissions of carbon dioxide or GHG and are subject to the current GHG regulations. The Company’s compliance with theseenvironmental regulations has yet to require significant expenditures. The cost of compliance with any future GHG legislation or regulations is not presently determinable, but Tredegar does not anticipate compliance to have a material adverse effect on its consolidated financial condition, results of operations and cash flows based on information currently available.
Tredegar is also subject to thecapital expenditures; however, environmental laws and regulations in the other countries where it conducts business.
At December 31, 2019, the Company believes that it was in material compliance with all applicable environmental laws, regulations and permits in the U.S. and other countries where it conducts business. Environmental standards tend to become more stringent over time. In addition, consumer preferences, ongoing health, safety and environmental initiatives on plastics and resins and other related legislative initiatives may adversely affect Tredegar’s business. InTherefore, in order to maintain substantial compliancecomply with such standards,current or future environmental legislation or regulations, the Company may be requiredsubject to incur additional capital expenditures, operating expenses or other compliance costs, the amounts and timing of which are not presently determinable but which could be significant, inincluding constructing new facilities or in modifying existing facilities. Furthermore,
Like environmental regulations, current or future privacy and anti-corruption and anti-bribery legislation or regulations may subject the Company to additional capital expenditures, operating expenses or other compliance costs, the amounts and timing of which are not presently determinable but could be significant. Any failure to comply with current or future laws and regulations, including environmental, privacy and anti-corruption and anti-bribery laws and regulations, could subject Tredegar
to substantial penalties, fines, costs and expenses. For further discussion regarding certain environmental, privacy and anti-corruption and anti-bribery laws and regulations to which the Company is subject, see Item 1A below.
Employees. Human Capital Management.
Overview
Tredegar employed approximately 3,0002,300 people at December 31, 2019.2022 located in the U.S., Brazil, and Asia, of which 80% are located in the U.S. Approximately 18% of the Company’s employees are represented by labor unions located in the U.S. under various collective bargaining agreements with varying durations and expiration dates, none of which expire before 2025. All of Tredegar’s Brazilian employees are represented by a national labor union. Generally, the total number of employees of Tredegar does not significantly fluctuate throughout the year. However, acquisition or divestiture activity, or changes in the level of business activity may impact employee levels.
Health and Safety
Tredegar has continuously exceeded the industry standards for safety. The Company uses various forms of employee safety metrics to assess the health and safety performance of its Aluminum Extrusions, PE Films and Flexible Packaging operations, including employee safety data which is available on the Company’s website at https://tredegar.com/about-tredegar/our-broader-commitments/committed-to-our-employees/.
Additionally, Aluminum Extrusions has on-site health clinics at its Carthage and Clearfield facilities. These clinics allow Aluminum Extrusions to invest in its people, provide more personal and more thorough healthcare to employees, and enhance the employer-employee relationship. The Carthage and Clearfield clinics serve over 500 and 300 employees, respectively.
Talent and Development
The Company believes its employees are its most valuable asset and are critical to the success of the Company. The Company seeks to retain employees by offering competitive wages, benefits and training opportunities. To assess and monitor employee retention and engagement, the Company surveys employees and takes actions to address areas of employee concern. The annual employee engagement survey results are presented to Tredegar’s Board of Directors (“Board”). Additionally, the objectives of our executive compensation programs are to attract, motivate and retain highly qualified executive officers. To accomplish these objectives, the Company relies on a pay strategy that emphasizes performance-based compensation through annual and long-term incentives. The Company believes that this pay strategy creates a strong link between pay and performance and aligns with our business strategy of generating strong operating results and shareholder value creation while controlling fixed costs.
The Company is committed to holistically supporting our employees both at work and in their communities by:
•Strictly following all applicable health, safety and non-discrimination laws in each country;
•Promoting the highest standards for employee health and safety through innovative programs; and
•Providing opportunities for community outreach and supporting programs that enhance the lives of children and families.
Inclusion and Diversity
Tredegar strictly complies with all applicable state, local and international laws governing nondiscrimination in employment in every location where Tredegar and its businesses have facilities to ensure healthy and positive working conditions. This applies to all terms and conditions of employment, including recruiting, hiring, job assignments, promotion, termination, layoff, recall, transfer, leaves of absence, compensation and training. All applicants and employees are treated with the same high level of respect regardless of their race, creed, color, religion, sex, sexual orientation, gender identity, age, pregnancy, national origin, ethnicity, political affiliation, union membership, marital status, citizenship status, veteran status, disability or other protected category. Employees who experience or witness discriminatory behavior are encouraged to report such behavior to their supervisor, Human Resources or Tredegar’s toll-free anonymous reporting hotline. Additionally, the Company spends significant resources in developing its employees. Among the five core principles of the “The Tredegar Way” that the Company uses to guide its organization, the “Leadership” principle is focused on building a team of motivated and engaged leaders at every level of the Company. Each business unit has identified specific action plans to promote the Leadership principle among its employees. Action plans include talent development, skills training, reinforcement of strong cultural values, and robust systems to ensure a safe working environment.
Information About Our Executive Officers. See Item 10. “Directors, Executive Officers and Corporate Governance” in Part III, Item 10 of this Form 10-K.
Available Information and Corporate Governance Documents. Tredegar’s Internetwebsite address is www.tredegar.com. The Company makes available, free of charge through its website, its annual report on Form 10-K, quarterly reports on Form 10-Q, current reports on Form 8-K and amendments to those reports filed or furnished pursuant to Section 13(a) or 15(d) of the Securities Exchange Act of 1934, as amended (the “Exchange Act”), as soon as reasonably practicable after such documents are electronically filed
with, or furnished to, the Securities and Exchange Commission (“SEC”). Information filed electronically with the SEC can be accessed on its website at www.sec.gov. In addition, the Company’s Corporate Governance Guidelines, Code of Conduct, the charters of the Audit, Executive Compensation, and Nominating and Governance Committees and Climate Change Risk Assessment and many other of our corporate policies are available on Tredegar’s website and are available in print without charge, to any shareholder upon request by contacting Tredegar’s Corporate Secretary at 1100 Boulders Parkway, Richmond, Virginia 23225. The information on or that can be accessed through the Company’s website is not, and shall not be deemed to be, a part of this Annual Report on Form 10-K for the year ended December 31, 2019 (“Form 10-K”) or incorporated into other filings it makes with the SEC.
Forward-looking and Cautionary Statements
Some of the information contained in this Form 10-K may constitute “forward-looking statements” within the meaning of the “safe harbor” provisions of the Private Securities Litigation Reform Act of 1995. When the Company uses the words “believe,” “estimate,” “anticipate,” “appear to,” “expect,” “project,” “plan,” “likely,” “may” and similar expressions, it does so to identify forward-looking statements. Such statements are based on the Company's then current expectations and are subject to a number of risks and uncertainties that could cause actual results to differ materially from those addressed in the forward-looking statements. It is possible that the Company's actual results and financial condition may differ, possibly materially, from the anticipated results and financial condition indicated in or implied by these forward-looking statements. Accordingly, you should not place undue reliance on these forward-looking statements. For risks and important factors that could cause actual results to differ from expectations, refer to the reports that Tredegar files with or furnishes the SEC from time-to-time, including the risks and important factors set forth in Item 1A. Readers are urged to review and consider carefully the disclosures Tredegar makes in the reports Tredegar files with or furnishes to the SEC. Tredegar does not undertake, and expressly disclaims any duty, to update any forward-looking statement to reflect any change in management’s expectations or any change in conditions, assumptions or circumstances on which such statements are based, except as required by applicable law.
Item 1A. RISK FACTORS
There are a number of risks and uncertainties that could have a material adverse effect on the Company’s consolidated financial condition, results of operations or cash flows. The following risk factors should be considered, in addition to the other information included in this Form 10-K, when evaluating Tredegar and its businesses.
Aluminum Extrusions
Sales volume and profitability of Aluminum Extrusions is cyclical and seasonal and highly dependent on economic conditions of end-use markets in the U.S., particularly in the construction sector. Aluminum Extrusions’ end-use markets can be cyclical and subject to seasonal swings in volume. Because of the capital intensive nature and level of fixed costs inherent in the aluminum extrusions business, the percentage drop in operating profits in a cyclical downturn will likely exceed the percentage drop in volume. In addition, during an economic slowdown, excess industry capacity often drives increased pricing pressure in many end-use markets as competitors protect their position with key customers. Any benefits associated with cost reductions and productivity improvements may not be sufficient to offset the adverse effects on profitability from pricing and margin pressure and higher bad debts (including a greater chance of loss associated with customers defaulting on fixed-price forward sales contracts) that usually accompany a downturn. In addition, higher energy costs can further reduce profits unless offset by price increases or cost reductions and productivity improvements.
Failure to prevent competitors from evading anti-dumping and countervailing duties, or a reduction in such duties, could adversely impact Aluminum Extrusions. Effective April 25, 2017, the anti-dumping duty and countervailing duty orders on aluminum extrusions were extended for a period of five years. The orders will be reviewed again beginning in March 2022. Chinese and other overseas manufacturers continue to try to evade the anti-dumping and countervailing orders to avoid duties. A failure by, or the inability of, U.S. trade officials to curtail the evasion of these duties, or the potential reduction of applicable duties pursuant to annual administrative reviews of the orders by the Department of Commerce, could have a material adverse effect on the financial condition, results of operations and cash flows of Aluminum Extrusions.
The duty-free importation of goods allowed under USMCA could result in lower demand for aluminum extrusions made in the U.S., which could materially and negatively affect Bonnell Aluminum’s business and results of operations. In March 2018, the U.S. imposed tariffs of 10% on aluminum ingot and semi-finished aluminum imported in the U.S. from certain countries, including countries from which Bonnell Aluminum has historically sourced aluminum products. In September 2019, the United States, Canada and Mexico entered into the United States-Mexico-Canada Agreement (“USMCA”). As a result of the 10% tariffs on aluminum ingot imported to the U.S. and the duty-free importation of goods allowed under USMCA, aluminum extrusions made in Canada and Mexico are free of the 10% tariff and can now be imported into and sold in the U.S. at very competitive prices. This could result in lower demand for aluminum extrusions made in the U.S., which could materially and negatively affect Bonnell Aluminum’s business and results of operations.
Competition from China could increase significantly if China is granted market economy status by the World Trade Organization. China launched a formal complaint at the World Trade Organization (“WTO”) challenging its non-market economy status, claiming that as of December 11, 2016, China’s transition period as a non-market economy under its Accession Protocol to the WTO ended. China believes with respectRisks Related to all Chinese-made products that it should receive market economy status and the rights attendant to that status under WTO rules. The U.S. and the European Union have each rejected that interpretation. If China is granted market economy status by the WTO, the extent to which the U.S. anti-dumping laws will be able to limit unfair trade practices from China will likely be limited because the U.S. government will be forced to utilize Chinese prices and costs that do not reflect market principles in anti-dumping duty investigations involving China, which could ultimately limit the level of anti-dumping duties applied to unfairly traded Chinese imports. The volume of unfairly traded imports of Chinese aluminum extrusions could increase as a result and this, in turn, would likely create substantial pricing pressure on Aluminum Extrusions’ products and could have a material adverse effect on the financial condition, results of operations and cash flows of Aluminum Extrusions. In June 2019, at China’s request, after certain preliminary rulings in the case went against the Chinese position, the WTO indefinitely suspended the proceedings on the Chinese WTO complaint.
Tredegar Businesses
The markets for Aluminum Extrusions’ products are highly competitive with product quality, service, delivery performance and price being the principal competitive factors. Aluminum Extrusions has approximately 1,500 customers that are in a variety of end-use markets within the broad categories of building and construction, distribution, automotive and other transportation, machinery and equipment, electrical and consumer durables. No single customer exceeds 4% of Aluminum Extrusions’ net sales. Future success and prospects depend on Aluminum Extrusions’ ability to provide superior service, high quality products, timely delivery and competitive pricing to retain existing customers and participate in overall industry cross-cycle growth. Failure in any of these areas could lead to a loss of customers, which could have an adverse material effect on the financial condition, results of operations and cash flows of Aluminum Extrusions.
PE Films
PE Films is highly dependent on sales associated with its top five customers, the largest of which is P&G. PE Films’ top five customers comprised approximately 19%, 21% and 26% of Tredegar’s consolidated net sales in 2019, 2018 and 2017, respectively, with net sales to P&G alone comprising approximately 6%, 10% and 13% in 2019, 2018 and 2017, respectively. The loss or significant reduction of sales associated with one or more of these customers without replacement by new business could have a material adverse effect on the Company. Other factors that could adversely affect the business include, by way of example, (i) failure by a key customer to achieve success or maintain share in markets in which they sell products containing PE Films’ materials, including as a result of customer preferences for products other than plastics, (ii) key customers using products developed by others that replace PE Films’ business with such customer, (iii) delays in a key customer rolling out products utilizing new technologies developed by PE Films, (iv) operational decisions by a key customer that result in component substitution, inventory reductions and similar changes, and (v) the cyclicality of the electronic display markets. While PE Films is undertaking efforts to expand its customer base, there can be no assurance that such efforts will be successful, or that they will offset any delay or loss of sales and profits associated with these large customers.
PE Films anticipates that a portion of its film products used in surface protection applications could be made obsolete by possible future customer product transitions to less costly alternative processes or materials. These transitions principally relate to one customer. The full transition continues to encounter delays. The Company estimates that during the next four quarters the adverse impact on operating profit from this customer shift versus the last four quarters ended December 31, 2019 could possibly be $14 million. To offset the potential adverse impact, the Company is aggressively pursuing and making progress generating sales from new surface protection products, applications and customers.
The Company previously disclosed a significant customer product transition for the Personal Care component of PE Films. Annual sales for this product declined from approximately $70 million in 2018 to $30 million in 2019. The Company recently extended an arrangement with this customer that is expected to generate sales of this product at approximately 2019 levels through at least 2022.
Personal Care had approximately break-even EBITDA (earnings before interest, taxes, depreciation and amortization) from ongoing operations in 2019 as competitive pressures resulted in missed sales and margin goals. Personal Care continues to focus on new business development and cost reduction initiatives in an effort to improve profitability. There can be no assurance that such efforts will be successful or that they will offset any loss of business due to product transitions and other lost sales.
PE Films and its customers operate in highly competitive markets. PE Films competes on product innovation, quality, price and service, and its businesses and their customers operate in highly competitive markets. Global market conditions continue to exacerbate the Company’s exposure to margin compression in its Personal Care business due to competitive forces, especially as certain personal care products move into the later stages of their product and intellectual protection life cycles. In addition, the changing dynamics of consumer products retailing, including the impact of on-line retailers such as Amazon, is creating price and margin pressure on the customers of PE Films’ Personal Care business. While PE Films continually works to identify new business opportunities with new and existing customers, primarily through the development of new products with improved performance and/or cost characteristics, there can be no assurance that such efforts will be successful or that they will offset business lost from competitive dynamics or customer product transitions.
Cost saving initiatives may not achieve the results anticipated. PE Films has undertaken and will continue to undertake cost reduction initiatives to consolidate certain production, improve operating efficiencies and generate cost savings. PE Films cannot be certain that it will be able to complete these initiatives as planned or that the estimated operating efficiencies or cost savings from such activities will be fully realized or maintained over time. In addition, PE Films may not be successful in moving production to other facilities or timely qualifying new production equipment. Failure to complete these initiatives could adversely affect PE Films’ financial condition, results of operations and cash flows.
Failure of PE Films’ customers, who are subject to cyclical downturns, to achieve success or maintain market share could adversely impact PE Films’ sales and operating margins. PE Films’ plastic films serve as components for, or are used in the production of, various consumer products sold worldwide. A customer’s ability to successfully develop, manufacture and market those products is integral to PE Films’ success. Also, consumers of premium products made with or using PE Films’ components may shift to less premium or less expensive products, reducing the demand for PE Films’ plastic films. Cyclical downturns and changing consumer preferences for plastic products generally may negatively affect businesses that use PE Films’ plastic film products, which could adversely affect sales and operating margins.
The Company’s inability to protect its intellectual property rights or its infringement of the intellectual property rights of others could have a material adverse impact on PE Films. PE Films operates in an industry where its significant customers and competitors have substantial intellectual property portfolios. The continued success of PE Films’ business depends on its ability not only to protect its own technologies and trade secrets, but also to develop and sell new products that do not infringe upon existing patents or threaten existing customer relationships. Intellectual property litigation is very costly and could result in substantial expense and diversions of Company resources, both of which could adversely affect its consolidated financial condition, results of operations and cash flows. In addition, there may be no effective legal recourse against infringement of the Company’s intellectual property by third parties, whether due to limitations on enforcement of rights in foreign jurisdictions or as a result of other factors.
An unstable economic environment could have a disruptive impact on PE Films’ supply chain. Certain raw materials used in manufacturing PE Films’ products are sourced from single suppliers, and PE Films may not be able to quickly or inexpensively re-source from other suppliers. The risk of damage or disruption to its supply chain may increase if and when different suppliers consolidate their product portfolios, experience financial distress or disruption of manufacturing operations (such as, for example, the impact of hurricanes on petrochemical production). Failure to take adequate steps to effectively manage such events, which are intensified when a product is procured from a single supplier or location, could adversely affect PE Films’ consolidated financial condition, results of operations and cash flows, as well as require additional resources to restore its supply chain.
Flexible Packaging Films
Overcapacity in Latin American polyester film production and a history of uncertain economic conditions in Brazil could adversely impact the financial condition, results of operations and cash flows of Flexible Packaging Films.
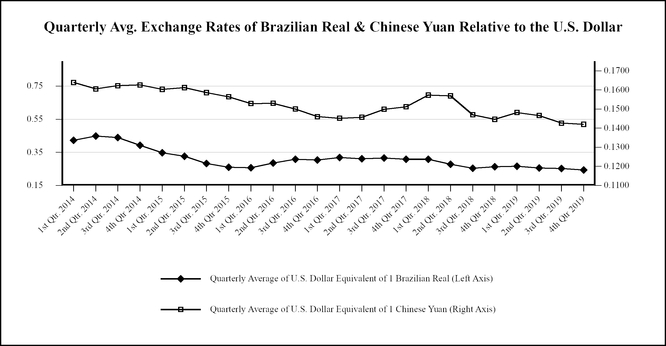
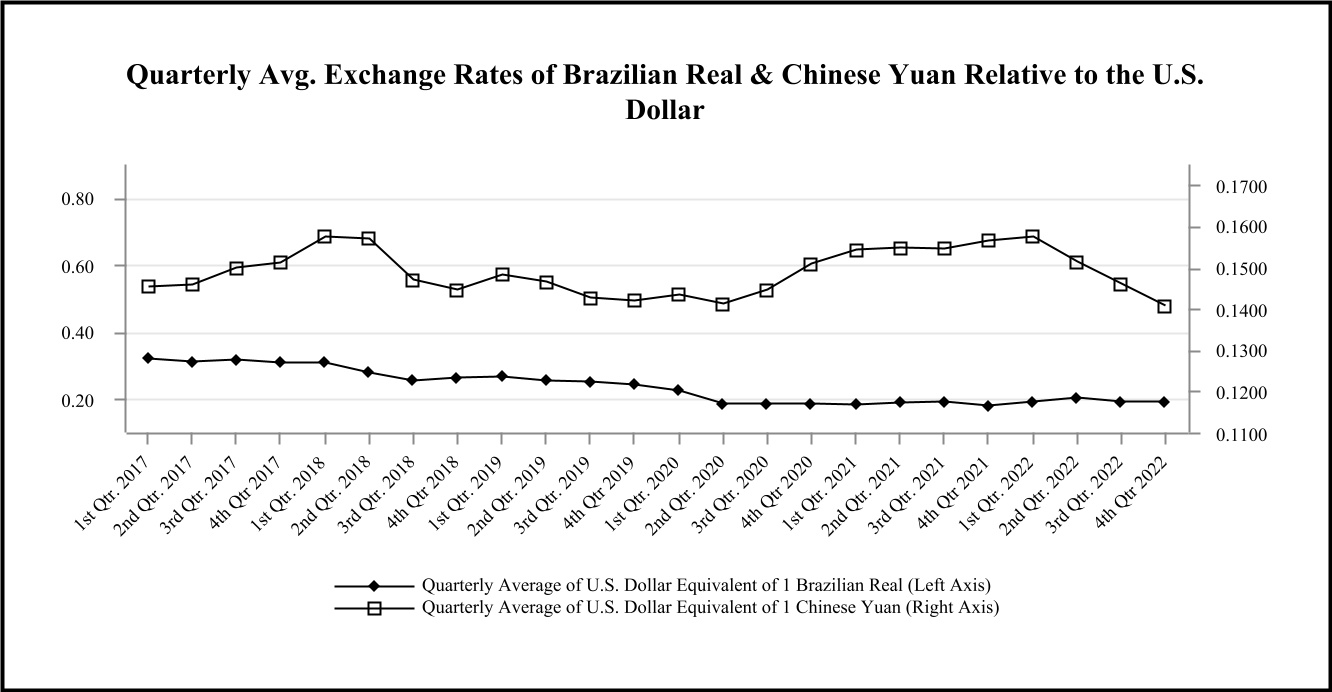
For flexible packaging films produced in Brazil, costs for operations in Brazil have been adversely impacted by inflation in Brazil that is higher than in the U.S. Flexible Packaging Films is exposed to additional foreign exchange translation risk because almost 90% of Flexible Packaging Films’ Brazilian sales are quoted or priced in U.S. Dollars while a large part of its Brazilian costs are quoted or priced in Brazilian Real. This mismatch, together with a variety of economic variables impacting currency exchange rates, causes volatility that could negatively or positively impact profitability for Flexible Packaging Films. While Flexible Packaging Films hedges this exposure on a short-term basis with foreign exchange forward rate contracts, the exposure continues to exist beyond the hedging periods.
Governmental failure to extend anti-dumping duties in Brazil on imported products or prevent competitors from circumventing such duties could adversely impact Flexible Packaging Films. In recent years, excess global capacity in the industry has led to increased competitive pressures from imports into Brazil. The Company believes that these conditions have shifted the competitive environment from a regional to a global landscape and have driven price convergence and lower product margins for Flexible Packaging Films. Favorable anti-dumping rulings or countervailing duties are in effect for products imported from China, Egypt, India, Mexico, United Arab Emirates, Turkey, Peru and Bahrain. Competitors not currently subject to anti-dumping duties may choose to utilize their excess capacity by selling product in Brazil, which may result in pricing pressures that Flexible Packaging Films may not be able to offset with cost savings measures and/or manufacturing efficiency initiatives. There can be no assurance that efforts to extend anti-dumping duties beyond 2020 on products imported from China, India, Egypt and other countries will be successful.
General
The Company has identified material weaknesses in its internal control over financial reporting at December 31, 2017, 2018 and 2019. The Company’s failure to establish and maintain effective internal control over financial reporting and to maintain effective disclosure controls and procedures increases the risk of a material misstatement in its consolidated financial statements, and its failure to meet its reporting and financial obligations, which in turn could have a negative impact on its financial condition.
Maintaining effective internal control over financial reporting is an integral part of producing reliable financial statements. As discussed in Item 9A. “Controls and Procedures,” the Company’s management concluded that the Company’s internal control over financial reporting was not effective for the periods referred to therein as a result of
certain deficiencies that were determined to constitute material weaknesses in the Company’s internal control over financial reporting.
Under standards established by the Public Company Accounting Oversight Board (“PCAOB”), a material weakness is defined as a deficiency, or a combination of deficiencies, in internal control over financial reporting such that there is a reasonable possibility that a material misstatement of the annual or interim financial statements will not be prevented or detected on a timely basis. Under the criteria set forth in Internal Control - Integrated Framework 2013 issued by the Committee of Sponsoring Organizations of the Treadway Commission, a material weakness in the design of monitoring controls indicates that the Company has not sufficiently developed and/or documented internal controls by which management can review and oversee the Company’s financial information to detect and correct material errors or that the personnel responsible for performing the review did not have the sufficient skill set or knowledge of the subject matter to perform a proper assessment.
As discussed in Item 9A. “Controls and Procedures,” to remediate the material weaknesses, the Company, with the assistance of its outside consultant, is in the process of implementing certain changes to its internal controls and reviewing the entire control environment to help ensure that there are no other material weaknesses. The Company believes that its remediation plan will be sufficient to remediate the identified material weaknesses and strengthen its internal control over financial reporting. However, remediation of the identified material weaknesses and strengthening the Company’s internal control environment will require a substantial effort throughout 2020 and, the Company anticipates, through the first quarter of 2021. As the Company continues to evaluate and work to improve its internal control over financial reporting and disclosure controls and procedures, management may determine to take additional measures to address control deficiencies or determine to modify the remediation plan. The Company cannot provide assurance, however, of when it will remediate all such weaknesses, nor can it be certain of whether additional actions will be required or the costs of any such actions. Moreover, the Company cannot provide assurance that additional material weaknesses will not arise in the future.
While the material weaknesses discussed in Item 9A. “Controls and Procedures” did not result in material misstatements of the Company’s financial statements as of and for the year ended December 31, 2017, 2018 or 2019, or any interim period during 2017, 2018 or 2019, any failure to remediate the material weaknesses, or the development of new material weaknesses in its internal control over financial reporting, could result in material misstatements in the Company’s consolidated financial statements and cause it to fail to meet its reporting and financial obligations, which in turn could have a negative impact on its financial condition.
Tredegar has an underfunded defined benefit (pension) plan. Tredegar sponsors a pension plan that covers certain hourly and salaried employees in the U.S. The plan was substantially frozen to new participants in 2007, and frozen to benefit accruals for active participants in 2014. As of December 31, 2019, the plan was underfunded under U.S. generally accepted accounting principles (“GAAP”) measures by $100.4 million. Tredegar expects that it will be required to make a cash contribution of approximately $12.3 million to its underfunded pension plan in 2020, and may be required to make higher cash contributions in future periods depending on the level of interest rates and investment returns on plan assets.
Noncompliance with any of the covenants in the Company’s $500 million revolving credit facility, which matures in June of 2024, could result in all debt under the agreement outstanding at such time becoming due and limiting its borrowing capacity, which could have a material adverse effect on consolidated financial condition and liquidity. The credit agreement governing Tredegar’s revolving credit facility contains restrictions and financial covenants that, if violated, could restrict the Company’s operational and financial flexibility. Failure to comply with these covenants could result in an event of default, which if not cured or waived, would result in all outstanding debt under the credit facility at such time becoming due, which could have a material adverse effect on the Company’s consolidated financial condition and liquidity.
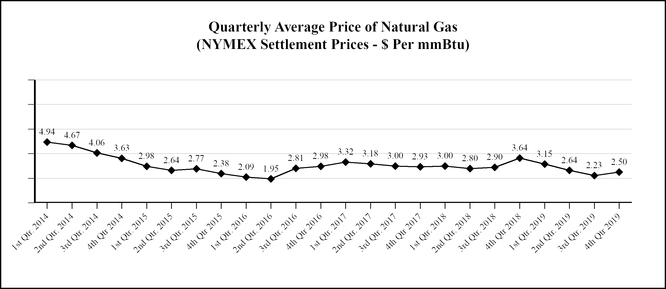
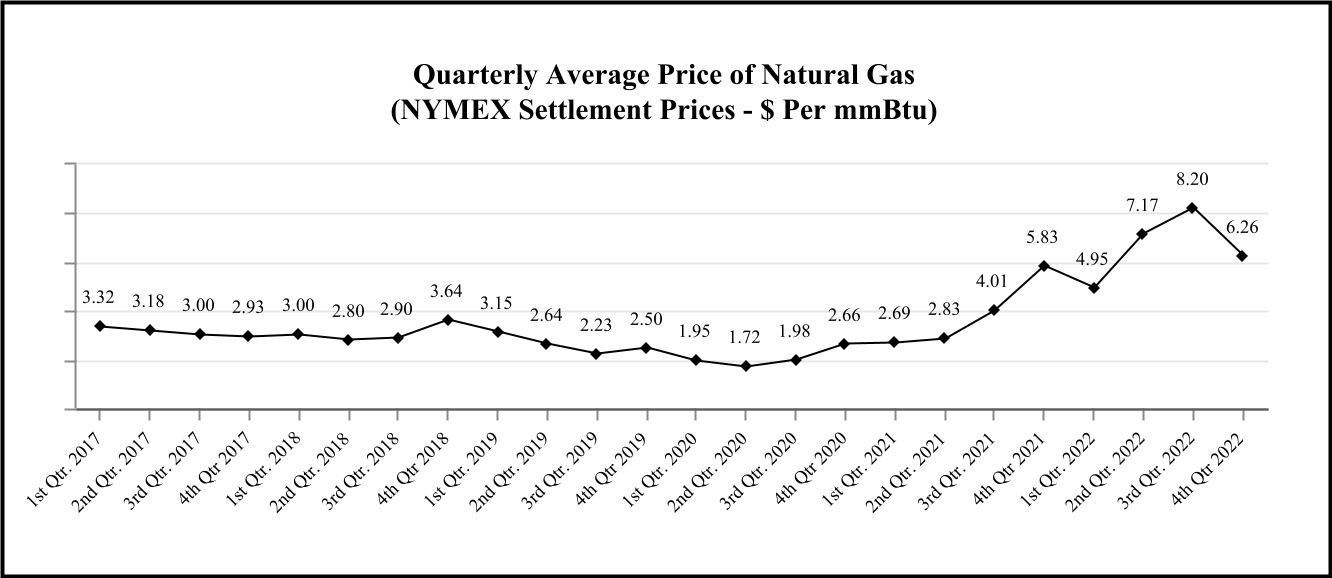
•Tredegar’s performance is influenced by costs incurred by its operating companies, including, for example, the cost of raw materials and energy. These costs include without limitation, the cost of aluminum (the raw material on which Aluminum Extrusions primarily depends), resin (the raw material on which PE Films primarily depends), PTA and MEG (the raw materials on which Flexible Packaging Films primarily depends), natural gas (the principal fuel necessary for Aluminum Extrusions’ plants to operate), electricity, diesel fuel and diesel fuel.paint. Aluminum, resin and natural gas prices are volatile as shown in the charts in Item 7a. The Company continues to face inflationary pressures, including notable increases in costs for raw materials, labor and freight. Additionally, geopolitical tensions, including deteriorating relations between the QuantitativeUnited States and Qualitative DisclosuresRussia resulting from the invasion of Russia into Ukraine, could result in Part II, Item 7. “Management’s Discussionthe implementation of additional economic sanctions, tariffs, import-export restrictions and Analysisretaliatory actions that all have the potential to adversely impact the cost of Financial Conditionraw materials and Results of Operations.”energy. The Company attempts to mitigate the effects of increased costs through price increases and contractual pass-through provisions, but there are no assuranceassurances that higher prices can effectively be passed through to customers or that Tredegar will be able to offset fully or on a timely basis the effects of higher raw material and energy costs through price increases or pass-through arrangements. Further, the Company’s cost control efforts may not be sufficient to offset any increases in raw material, energy or other costs.
•Material disruptions at one of the Company’s major manufacturing facilities could negatively impact financial results. Tredegar believes it has implemented measures to minimize the risks of disruption at its facilities. However, a disruption could occur as a result of any number of events: an equipment failure with repairs requiring long lead times, labor stoppages or shortages, cybersecurity attacks, utility disruptions, constraints on the supply or delivery of critical raw materials, and severe weather conditions, including potential flooding at the Aluminum Extrusions facility located in Carthage, TN, which is located in a 50-year flood plain. A material disruption in one of the Company’s operating locations could negatively impact production and the Company’s consolidated financial condition, results of operations and cash flows.
•A failure in the Company’s information technology systems as a result of cybersecurity attacks or other causes could negatively affect Tredegar’s business. The Company depends on information technology (“IT”) to record and process customer orders, manufacture and ship products in a timely manner, secure its production processes and know-how, maintain the financial accuracy of its business records and maintain personally identifiable information of its employees. An IT system failure due to computer viruses, internal or external security breaches, cybersecurity attacks or other malicious causes could disrupt our operations and prevent us from being able to process transactions with our customers,
operate our manufacturing facilities and properly report transactions in a timely manner. Increased global IT security threats and cyber-crime pose a potential risk to the security and availability of the Company’s IT systems, networks and services, including those that are managed, hosted, provided or used by third parties, as well as to the confidentiality, availability and integrity of the Company’s data. Additionally, increased cybersecurity risk arises due to certain employees working remotely. To date, interruptions of the Company’s IT systems have been infrequent and have not had a material impact on the Company’s operations. A significant prolonged failure of or security breach of the IT systems, networks or service providers the Company relies upon, or a loss or disclosure of business or other sensitive information, or personally identifiable information, as a result of a cybersecurity incident or other cause, could result in substantial costs to the Company, damage to the Company’s reputation, regulatory enforcement actions and lawsuits and could adversely affect the Company’s results of operations, financial condition or cash flows.
•Our failure to continue to attract, develop and retain certain key officers or employees could adversely affect our businesses. Our success depends upon the efforts and abilities of key personnel, many of whom are longstanding employees. The loss of any of these key personnel could deplete our institutional knowledge base and negatively affect our ability to efficiently operate our businesses. Certain roles have experienced high turnover in recent years, and we are experiencing an increasingly competitive labor market. Job market dynamics have been impacted by macroeconomic conditions, the effects of the COVID-19 pandemic and the “great resignation.” Increased employee turnover could hinder our ability to execute our business strategy and adversely affect our business, financial condition, results of operations and cash flows.
•The Company has identified material weaknesses in its internal control over financial reporting. The Company’s failure to establish and maintain effective internal control over financial reporting and to maintain effective disclosure controls and procedures increases the risk of a material misstatement in its consolidated financial statements, and its failure to meet its reporting and financial obligations, could, in turn, have a negative impact on its financial condition. Since 2019, a total of $7.6 million has been incrementally spent on remediation efforts for management’s outside consultant and design, hiring (including hiring replacements due to high turnover) and training activities.
Tredegar mayMaintaining effective internal control over financial reporting is an integral part of producing reliable financial statements. As discussed in Item 9A. “Controls and Procedures” of this Form 10-K (“Item 9A”), the Company’s management concluded that the Company’s internal control over financial reporting was not effective for the periods referred to therein as a result of certain deficiencies that were determined to constitute material weaknesses in the Company’s internal control over financial reporting. Specifically, the Company did not sufficiently attract, develop, and retain competent resources to fulfill internal control responsibilities and did not have an effective information and communication process that identified and assessed the source of and controls necessary to ensure the reliability of information used in financial reporting. As a consequence of these material weaknesses, the Company did not effectively design, implement and operate process-level controls across its financial reporting processes.
Under standards established by the Public Company Accounting Oversight Board, a material weakness is defined as a deficiency, or a combination of deficiencies, in internal control over financial reporting such that there is a reasonable possibility that a material misstatement of the annual or interim financial statements will not be ableprevented or detected on a timely basis.
As of December 31, 2022, the Company continues to successfully integrate strategic acquisitions. Acquisitions involve special risks,revise and execute management’s remediation plan, including the implementation of the new and revised internal controls over financial reporting. The results of management’s testing of the design, implementation and operating effectiveness of controls identified that the Company continued to have material weaknesses in its internal control over financial reporting as of December 31, 2022; however, the material weaknesses existing as of December 31, 2022 were limited to certain discrete items within the previously identified material weaknesses as described further in Item 9A.
While progress has been made since 2019, including the remediation of a significant number of process-level control deficiencies throughout our financial reporting processes, the Company experienced significant turnover in positions relevant to its internal control over financial reporting during 2021 and 2022 that impacted the effectiveness of prior training programs and management’s ability to implement control activities that operated for a sufficient period of time to allow management, through testing, to conclude that the control activities were operating effectively during 2022.
To remediate the material weaknesses described in Item 9A, the Company, with the oversight of the Audit Committee and the assistance of management’s outside consultant, has continued to revise its remediation strategy. The Company is in the process of implementing certain changes in its internal controls to remediate the material weaknesses described above. As the Company continues to evaluate and work to improve its internal control over financial reporting and disclosure controls and procedures, management may determine to take additional measures to address control deficiencies or modify the remediation plan. The Company cannot provide assurance, however, as to when it will remediate all such weaknesses, nor can it be certain of whether additional actions will be required or the costs of any such actions. Moreover, the Company cannot provide assurance that additional material weaknesses will not arise in the future. The material
weaknesses cannot be considered remediated until the applicable controls have operated for a sufficient period of time and management has concluded, through testing, that these controls are operating effectively.
The material weaknesses discussed in Item 9A did not result in material misstatements of the Company’s financial statements as of and for the years ended December 31, 2022, 2021 and 2020 or in the intervening interim periods during those respective years. Any failure to remediate the material weaknesses, or the development of new material weaknesses in its internal control over financial reporting, could result in material misstatements in the Company’s consolidated financial statements and cause it to fail to meet its reporting and financial obligations, which in turn could have a negative impact on its financial condition.
•Tredegar has an underfunded defined benefit (pension) plan. Tredegar sponsors a pension plan that covers certain hourly and salaried employees in the U.S. The plan was closed to new participants in 2007, and substantially frozen to benefit accruals for active participants in 2014. As of January 31, 2018, the plan no longer accrued benefits associated with crediting employees for service, thereby freezing all future benefits under the plan. On February 10, 2022, Tredegar announced the initiation of a process to terminate and settle its frozen defined benefit pension plan. In connection therewith, on February 9, 2022, the Company borrowed funds under its revolving credit agreement to contribute $50 million to the pension plan (the “Special Contribution”) to reduce its underfunding and as part of a program within the pension plan to hedge or fix the expected future contributions that will be needed by the Company through the settlement process. The settlement process has been delayed because of longer-than-expected review times with the Internal Revenue Service (“IRS”). The Company does not expect issues with receiving approval from the IRS and is hopeful that the entire process will be completed by the end of 2023. As of December 31, 2022, the plan was underfunded under U.S. generally accepted accounting principles (“GAAP”) measures by $28 million. The Company expects there will be no required minimum contributions to the pension plan until final settlement. The ultimate settlement benefit obligation may differ from the projected benefit obligation (“PBO”) of $246 million as of December 31, 2022, depending on market factors for buyers of pension obligations at the time of settlement. Additionally, factors that could cause actual future contributions by the Company to settle the pension plan to differ from expectations include, without limitation, meeting revenue, margin, working capitaldifferences between the ultimate settlement benefit obligation and capital expenditure expectations that substantially drive valuation, diversionthe PBO, census data, administrative costs, the effectiveness of management’s timehedging activities and attention from existing businesses,discounts required to liquidate non-public securities held by the potential assumption of unanticipated liabilities and contingencies and potential difficulties in integrating acquired businesses and achieving anticipated operational improvements. Acquired businesses may not achieve expected results.
plan.•Tredegar is subject to current and future governmental regulation, including environmental laws and regulations, and could become exposed to material liabilities and costs associated with such regulation. The Company is subject to regulation by local, state, federal and foreign governmental authorities. New laws and regulations, or changes to existing laws, including those relating to environmental matters (including global climate change and plastic products), and privacy matters, could subject Tredegar to significant additional capital expenditures, operating expenses or other compliance costs. Moreover, future developments in federal, state, local and international laws and regulations, including environmental laws, are difficult to predict. Environmental laws and privacy restrictions have become and are expected to continue to become increasingly strict. As a result, Tredegar expects to be subject to new environmental and privacy laws and regulations. However, any such changes are uncertain and, therefore, it is not possible for the Company to predict with certainty the amount of additional capital expenditures or operating expenses that could be necessary for compliance with respect to any such changes. See Environmental Regulation in Item 1. “Business” for a further discussion of this risk factor.
We areThe Company is subject to the U.S. Foreign Corrupt Practices Act, Brazilian anti-corruption laws and similar anti-bribery
laws in other jurisdictions, which generally prohibit companies and their intermediaries from making improper payments to foreign officials for the purpose of obtaining or retaining business. Although we have policies and procedures designed to facilitate compliance with these laws and regulations, our employees, contractors and agents may take actions in violation of our policies. Any such violation, even if prohibited by our policies, could adversely affect our business and/or our reputation. See Government Regulation in Item 1. “Business” of this Form 10-K for a further discussion of this risk factor.
Material disruptions at one•Noncompliance with any of the covenants in the Company’s major manufacturing facilities$375 million revolving credit facility, as amended and restated on June 29, 2022, which matures in June 2027, could negatively impactresult in all debt under the agreement outstanding at such time becoming due and limiting the Company’s borrowing capacity, which could have a material adverse effect on its consolidated financial results. Tredegar believes its facilities are operatedcondition and liquidity. The credit agreement governing Tredegar’s revolving credit facility contains restrictions and financial covenants that, if violated, could restrict the Company’s operational and financial flexibility. Failure to comply with these covenants could result in compliance with applicable local lawsan event of default, which if not cured or waived, would result in all outstanding debt under the revolving credit facility at such time becoming due, which could have a material adverse effect on the Company’s consolidated financial condition and regulationsliquidity.
•Our results of operations, financial condition and thatcash flows have been, and may continue to be, impacted by the CompanyCoronavirus (“COVID-19”). The COVID-19 pandemic has implemented measuresadversely affected the economy of the United States and other countries around the world, including affecting labor supply and causing supply chain disruptions. While some of the economic impacts resulting from COVID-19 have eased and many COVID-19 related restrictions have been lifted or relaxed due to minimizeadvancements in COVID-19 vaccination, testing, and treatment, a rise in infection rates, the risksemergence of disruption at its facilities. Suchnew COVID-19 variants, or any future pandemic could result in, among other things, a disruptionreduction in orders placed by our customers who could be closing or curtailing their own operations. We may also experience labor shortages and supply chain disruptions, including product and raw material shortages, delays, and price increases as a result of the COVID-19 pandemic or any number of events: an equipment failure with repairs requiring longfuture pandemic. Our suppliers, contractors, and third-party logistic providers may continue to experience disruptions and delays stemming from labor and supply challenges, and significant disruptions in transport and logistics services due to facility closures, labor constraints, and other challenges. These challenges may impact our ability to maintain sufficient inventory and to accurately predict demand or lead times, labor stoppageswhich may inhibit our ability to service customer demand. Additionally, addressing shortages from our current suppliers may require the Company to procure products from new suppliers or shortages, cybersecurity attacks, utility disruptions, constraintsthrough brokers with whom we have a limited or no prior relationship.
Providing an estimate for the ongoing impact of COVID-19 pandemic on the supplyCompany’s business is difficult given the evolving nature of COVID-19 and the likelihood that any impact would be affected by factors outside of our control. Such factors may include the severity, duration and spread of COVID-19 and emerging variants, the actions that have been or deliverymay be taken by the governments of critical raw materials,countries affected, and severe weather conditions. A material disruptionthe ability of our customers and consumers to remain in oneoperation and pay for the products purchased on a timely basis. Additionally, to the extent the COVID-19 pandemic or any future pandemic adversely affects our business, financial condition, or results of operations, it may heighten other risks described in this section.
Risks Related to Aluminum Extrusions
•Sales volume and profitability of Aluminum Extrusions is cyclical and seasonal and highly dependent on economic conditions of end-use markets in the U.S., particularly in the construction sector. Aluminum Extrusions’ end-use markets can be cyclical and subject to seasonal swings in volume. Because of the Company’s operatingcapital-intensive nature and level of fixed costs inherent in the aluminum extrusions business, the percentage drop in earnings before interest, taxes, depreciation and amortization (“EBITDA”) from ongoing operations in a cyclical downturn will likely exceed the percentage drop in volume. In addition, during an economic slowdown, excess industry capacity often drives increased pricing pressure in many end-use markets as competitors seek to protect their position with key customers. Any benefits associated with cost reductions and productivity improvements may not be sufficient to offset the adverse effects on profitability from pricing and margin pressure and higher bad debts (including a greater chance of loss associated with customers defaulting on fixed-price forward sales contracts) that usually accompany a downturn. In addition, higher energy costs can reduce profits unless offset by price increases or cost reductions and productivity improvements.
Starting in third quarter of 2022, the Company observed slowing order input and order cancellations as customers reported high inventory levels. There can be no assurance as to the extent and timing of the recovery of sales volumes and profits for Aluminum Extrusions, especially since there can be a lag in the recovery of its end-use markets in comparison to the overall economic recovery.
•The failure to successfully implement the new enterprise resource planning and manufacturing execution systems could adversely impact the Aluminum Extrusions business and results of operations. InJanuary 2022, Aluminum Extrusions obtained approval from the Board to engage in the implementation project of a new enterprise resource planning and manufacturing execution systems (“ERP/MES”) across all locations of the Aluminum Extrusions business. The ERP/MES project commenced in 2022 and is expected to cost a total of approximately $30 million over a two-year time span. The implementation of these systems is a major undertaking from a financial, management, and personnel perspective. The implementations may prove to be more difficult, costly, or time consuming than expected, and there can be no assurance that these systems will be beneficial to the extent anticipated. Any disruptions, delays or deficiencies in the design and implementation of the new systems could negativelyadversely affect our financial position, results of operations and cash flows; additionally, any disruptions, delays or deficiencies could adversely affect our remediation efforts with respect to the effectiveness of our internal controls over financial reporting.
•Failure to prevent foreign competitors from evading anti-dumping and countervailing duties, or failure to reinstate the Aluminum Tariff on aluminum extrusions, could adversely impact productionAluminum Extrusions. Chinese and other overseas manufacturers continue to try to evade the anti-dumping and countervailing orders to avoid duties. On October 3, 2022, the U.S. International Trade Commission (“ITC”) extended the anti-dumping (“AD”) and countervailing duty (“CVD”) orders against aluminum extrusions from China, for a period of five years. In 2018, the U.S. imposed tariffs of 10% on aluminum ingot and semi-finished aluminum imported into the U.S. from certain countries.However, in December 2020, the Department of Commerce (“DOC”) introduced a tariff exclusion process, granting applicants with tariff exclusions. A
failure by, or the inability of, U.S. trade officials to restore the import tariff in its consolidatedfull format, could have a material adverse effect on the financial condition, results of operations and cash flows.
flows of Aluminum Extrusions.An inability•The duty-free importation of goods allowed under the United States-Mexico-Canada Agreement (“USMCA”), or other free trade agreements or duty-preference regimes, could result in lower demand for aluminum extrusions made in the U.S., which could materially and negatively affect Aluminum Extrusions’ business and results of operations. As noted above, in March 2018, the U.S. imposed tariffs of 10% on aluminum ingot and semi-finished aluminum imported into the U.S. from certain countries, including countries from which Aluminum Extrusions has historically sourced aluminum products. In September 2019, the U.S., Canada and Mexico entered into the USMCA. As a result of the 10% tariffs on aluminum ingot imported to renegotiate the Company’s collective bargaining agreementsU.S. and the duty-free importation of goods allowed under USMCA or other trade agreement regimes or duty-preference programs, aluminum extrusions from outside the United States that are able to take advantage of duty-preference programs upon importation into the United States made in Canada and Mexico are free of the 10% tariff and can now be imported into and sold in the U.S. at very competitive prices. This could adversely impact itsresult in lower demand for aluminum extrusions made in the U.S., which could materially and negatively affect Aluminum Extrusions’ business and results of operations.
•The markets for Aluminum Extrusions’ products are highly competitive with product quality, service, delivery performance and price being the principal competitive factors. Aluminum Extrusions has approximately 1,200 customers that are in a variety of end-use markets within the broad categories of building and construction, distribution, automotive and other transportation, machinery and equipment, electrical and consumer durables. No single Aluminum Extrusions’ customer exceeds 4% of consolidated net sales. Future success and prospects depend on Aluminum Extrusions’ ability to provide superior service, high quality products, timely delivery and competitive pricing to retain existing customers and participate in overall industry cross-cycle growth. Failure in any of these areas could lead to a loss of customers, which could have an adverse material effect on the financial condition, results of operations and cash flows. Approximately 19% of Aluminum Extrusions.
Risks Related to PE Films
•PE Films is highly dependent on sales associated with relatively few large customers. PE Films’ top four customers comprised approximately 10%, 13% and 16% of Tredegar’s consolidated net sales in 2022, 2021 and 2020, respectively. The loss or significant reduction of sales associated with one or more of these customers without replacement by new business could have a material adverse effect on the Company. Surface Protection sales have been adversely impacted by weak market demand and competitive pricing. Customer demand for electronics has continued to deteriorate since the third quarter of 2022, causing manufacturers in the supply chain to experience reduced capacity utilization and inventory corrections. In addition, these depressed market conditions, which are expected to continue for most of the first half of 2023, are adversely impacting mix through reduced sales to our highest value-added customers and products.
The Company previously reported the risk that a portion of its film products used in surface protection applications would be made obsolete by customer product transitions, which principally relate to one customer, to less costly alternative processes or materials. The Company estimates that these transitions, which were complete as of the second quarter of 2022, resulted in a total decline of $7 million in pre-tax income from continuing operations as reported under GAAP and EBITDA from ongoing operations during 2022 versus 2021.
The Surface Protection business is continuing to experience competitive pricing pressures, unrelated to the customer product transitions, that adversely impacted pre-tax income from continuing operations as reported under GAAP and EBITDA from ongoing operations by approximately $5.5 million in 2022 versus 2021. To offset the adverse impact of the customer transitions and pricing pressures, the Company is aggressively pursuing sales of new surface protection products, applications and customers and driving production efficiencies and cost savings.
While PE Films is undertaking efforts to expand its customer base, there can be no assurance that such efforts will be successful, or that they will offset any loss of sales and profits associated with customer transitions and other large customer declines.
•Failure of PE Films’ customers, who are subject to cyclical downturns, to achieve success or maintain market share could adversely impact PE Films’ sales and operating margins. PE Films’ plastic films are used in the production of various consumer products sold worldwide. A customer’s ability to successfully develop, manufacture and market those products is integral to PE Films’ success. Cyclical downturns and changing consumer preferences may negatively affect businesses that use PE Films’ plastic film products, which could adversely affect sales and operating margins. Other factors that could adversely affect the business include (i) failure by a key customer to achieve success or maintain share in markets in which they sell products containing PE Films’ materials, including as a result of customer preferences for products other than plastics, (ii) key customers using products developed by others that replace PE Films’ business with such customers, (iii) delays in a key customer rolling out products utilizing new technologies developed by PE Films, and
(iv) operational decisions by a key customer that result in component substitution, inventory reductions and similar changes.
•The Company’s employees are represented by labor unions under various collective bargaining agreements with varying durationsinability to protect its intellectual property rights or its infringement of the intellectual property rights of others could have a material adverse impact on PE Films. The continued success of the PE Films’ business depends on its ability not only to protect its own technologies and expiration dates. Tredegar maytrade secrets, but also to develop and sell new products that do not be able to satisfactorily renegotiate collective bargaining agreements when they expire, whichinfringe upon existing patents. Intellectual property litigation is very costly and could result in strikes or work stoppages or higher labor costs. In addition, existing collective bargaining agreements may not prevent a strike or work stoppage at the Company’s facilities in the future. Any such work stoppages (or potential work stoppages)substantial expense and diversions of Company resources, both of which could negatively impact Tredegar’s ability to manufacture its products and adversely affect its consolidated financial condition, results of operations and cash flows. None of Tredegar’s collective bargaining agreements expire before the fourth quarter of 2021.
Our business and operations, and the operations of our suppliers,In addition, there may be adversely affected by epidemics such as the recent coronavirus (or COVID-19) outbreak. We may face risks related to health epidemics or outbreaks of communicable diseases. The outbreak of such a communicable disease could result in a widespread health crisis that could adversely affect general commercial activity and the economies and financial markets of many countries. For example, the recent outbreakno effective legal recourse against infringement of the Coronavirus Disease 2019 (COVID-19), which began in China, has been declaredCompany’s intellectual property by the World Health Organization to be a “pandemic,” has spread across the globe to many countries in which the Company does business and is impacting worldwide economic activity.
A public health epidemic, including COVID-19, poses the risk that we or our employees, contractors, suppliers, customers and other business partners may be prevented from conducting business activities for an indefinite period of time, includingthird parties, whether due to shutdowns that may be requestedlimitations on enforcement of rights in foreign jurisdictions or mandated by governmental authorities, or that such epidemic may otherwise interrupt or impair business activities. For example, a majority of protective films made by the PE Films’ Surface Protection unit are sold to customers who produce key components for flat panel displays. A significant proportion of that production and fabrication occurs in China. Although we have not had significant issues at our Surface Protection manufacturing plant in Guangzhou, China, there can be no assurance that COVID-19 will not impact our Surface Protection business as a result of the virus’ potentialother factors.
•Disruptions to PE Films’ supply chain could have a material adverse impact on delaysPE Films. Certain raw materials used in productionmanufacturing PE Films’ products are sourced from single suppliers, and transportation in, andPE Films may not be able to quickly or inexpensively re-source from other impacts on, the flat panel display industry andsuppliers. The risk of damage or disruption to its supply chain. While it is not possible at this time to estimate the impact that COVID-19 could have on our Surface Protection unitchain may increase if and the Company’s other business units, the continued
spreadwhen different suppliers consolidate their product portfolios, experience financial distress or disruption of COVID-19, the measures taken by the governments of countries affected, actions taken to protect employees, andmanufacturing operations (such as, for example, the impact of the pandemichurricanes on various business activities in affected countriespetrochemical production). Failure to take adequate steps to effectively manage such events, which are intensified when a product is procured from a single supplier or location, could adversely affect ourPE Films’ consolidated financial condition, results of operations and cash flows.
Tredegar’s valuation of its $7.5 million cost-basis investment in kaléo is volatileflows, and uncertain. Tredegar uses the fair value method to account for its fully-diluted ownership interest of approximately 18% in kaleo, Inc. (“kaléo”), a privately held specialty pharmaceutical company. There is no active secondary market for buying or selling stock in kaléo. The Company’s fair value estimates can fluctuate materially between reporting periods, primarily due to variances in kaléo’s performance versus expectations and changes in the valuation of guideline public companies as measured by their enterprise value-to-EBITDA multiples. Additionally, the estimated fair value of the Company’s investment in kaléo could decline. Public pressure to lower the price of pharmaceutical products and competitive pressures in the market could affect the price at which kaléo sells its products. The U.S. Department of Justice began an investigation of kaléo’s Evzio business in 2018, the impact of which on kaléo and on the value of the Company’s interest in kaléo cannot yet be estimated with any certainty. Kaléo initiated a plan in 2019 to reduce the cost structure of the Evzio product line and reallocatealso require additional resources to restore its allergy and pediatric product lines, principally Auvi-Q. As a result, kaléo substantially reduced commercial activities associated with Evzio in 2019. See Note 4 to the Notes to Financial Statements (“Note 4”) for more information.
supply chain.•Rising trade tensions could cause an increase in the cost of the Company’sPE Films’ products or otherwise negatively impact the Company. A significant portion of the Company’sPE Film’s business involves imports to and from the U.S. and other countries where the Company produces and sells its products. Trade tensions have been rising between the U.S. and other countries, particularly China. An increase in tariffs and other trade barriers between the U.S. and China, or between the U.S. and other countries, could cause an increase in the cost of the Company’sPE Films’ products or otherwise negatively impact the production and sale of the Company’s products in world markets.
A failure in•An impairment of the Company’s information technology systems asSurface Protection reporting unit’s goodwill could have a resultmaterial non-cash adverse impact on our results of cybersecurity attacks or other causes could negatively affect Tredegar’s business. operations.The Company assesses goodwill for impairment when events or circumstances indicate that the carrying value may not be recoverable, or, at a minimum, on an annual basis (December 1st of each year). The valuation of goodwill depends on information technology (“IT”) to recorda variety of factors, including macroeconomic conditions, industry and process customers’ orders, manufacturemarket considerations, cost factors and ship products in a timely manner, secure its production processes and know-how, maintain theoverall financial accuracy of its business records and maintain personally identified information of its employees. An IT system failure due to computer viruses, internal or external security breaches, cybersecurity attacks, or other malicious causes could disrupt our operations and prevent us from being able to process transactions with our customers, operate our manufacturing facilities and properly report transactions in a timely manner. Increased global IT security threats and cyber-crime pose a potential risk to the security and availability of the Company’s IT systems, networks, and services, including those that are managed, hosted, provided, or used by third parties,performance, as well as company and reporting unit factors, and goodwill impairment valuations can be sensitive to the confidentiality, availability, and integrity of the Company’s data. To date, interruptions of the Company’s IT systems have been infrequent and have not had a material impact on the Company’s operations. A significant protracted failure of or security breach of the IT systems, networks, or service providers the Company relies upon, or a loss or disclosure of business or other sensitive information, or personally identified information, as a result of a cybersecurity incident or other cause,assumptions associated with such factors. Failure to successfully achieve projections could result in substantial costsfuture impairments. Impairment to the Company, damage toSurface Protection reporting unit’s goodwill may also be caused by factors outside the Company’s reputation, regulatory enforcement actionscontrol, such as increasing competitive pricing pressures, weak consumer electronic market demand, lower than expected sales and lawsuits,profit growth rates, and various other factors. Significant and unanticipated changes could adverselyrequire a non-cash charge for impairment in a future period, which may significantly affect the Company’s results of operations in the period of such charge.
Risks Related to Flexible Packaging Films
•A history of uncertain economic conditions in Brazil could adversely impact the financial condition, results of operations and cash flows of Flexible Packaging Films. For flexible packaging films produced in Brazil, selling prices and key raw material costs are principally determined in U.S. Dollars and are impacted by local economic conditions and local and global competitive dynamics. Flexible Packaging Films is exposed to foreign exchange translation risk (its functional currency is the Brazilian Real) because almost 90% of the sales of Flexible Packaging Films business unit in Brazil (“Terphane Ltda.”) and substantially all of its related raw material costs are quoted or cash flows.priced in U.S. Dollars while its variable conversion, fixed conversion and sales, general and administrative costs before depreciation & amortization (collectively “Terphane Ltda. Operating Costs”) are quoted or priced in Brazilian Real. This mismatch, together with a variety of economic variables impacting currency exchange rates, causes volatility that could negatively or positively impact EBITDA from ongoing operations for Flexible Packaging Films. While Flexible Packaging Films hedges this exposure on a short-term basis with foreign exchange forward rate contracts, the exposure continues to exist beyond the hedging periods.
•Overcapacity in Latin American polyester film production and governmental failure to extend anti-dumping duties in Brazil on imported products or prevent competitors from circumventing such duties could adversely impact Flexible Packaging Films. In recent years, excess global capacity in the industry has led to increased competitive pressures from imports into Brazil. The Company believes that these conditions have shifted the competitive environment from a regional to a global landscape and have driven price convergence and lower product margins for Flexible Packaging Films. Favorable anti-dumping rulings or countervailing duties are in effect for products imported from China, Egypt, India, Mexico, United Arab Emirates, Turkey, Peru and Bahrain. Competitors not currently subject to anti-dumping duties may
choose to utilize their excess capacity by selling product in Brazil, which may result in pricing pressures that Flexible Packaging Films may not be able to offset with cost savings measures and/or manufacturing efficiency initiatives. In May 2021, the Brazilian authorities concluded the sunset review relating to the anti-dumping process for polyester film imported from China, India and Egypt, and decided to extend duties for another five years. However, due to its doubts that films would continue to be imported from China and Egypt, the government immediately suspended the implementation of the tariffs for those countries. If in the future there are volumes imported from China or Egypt which are harming the Brazilian market, authorities may promptly reinstate tariffs. For India, the Brazilian authorities also reviewed measures against countervailing duties and extended those for five years as well. Considering the expiration date for anti-dumping rulings against Mexico, United Arab Emirates and Turkey in first quarter 2023, Terphane timely petitioned for a sunset review in the fourth quarter of 2022, and the Brazilian authority is in the process of reviewing the petition and data provided in order to initiate the sunset review investigation, which was formalized in February 2023.
| |
Item 1B. | UNRESOLVED STAFF COMMENTS |
Item 1B. UNRESOLVED STAFF COMMENTS
None.
Item 2. PROPERTIES
General
Most of the improved real property and the other assets used in the Company’s operations are owned. Certain of the owned property is subject to an encumbrance under the Company’s revolving credit facilityagreement (see Note 117 “Debt and Credit Agreements” to the Consolidated Financial Statements in Item 15 for more information).
Tredegar considers the manufacturing facilities, warehouses and other properties and assets that it owns or leases to be in generally good condition. Capacity utilization at its various manufacturing facilities can vary with product mix and normal fluctuations in sales levels. The Company believes that its Bonnell Aluminum, PE Films and Flexible Packaging Films manufacturing facilities have sufficient capacity to meet current production requirements. Tredegar’s corporate headquarters, which is leased, is located at 1100 Boulders Parkway, Richmond, Virginia 23225.
The Company’s principal manufacturing plants and facilities as of December 31, 20192022 are listed below:
Aluminum Extrusions
|
| | | | | | | | | | | | | |
| Locations in the U.S. | | Locations Outside the U.S. | | Principal Operations |
Carthage, Tennessee Elkhart, Indiana
Newnan, Georgia
Niles, Michigan
Clearfield, Utah (leased)
Elkhart, Indiana
Newnan, Georgia
Niles, Michigan | | None | | Production of aluminum extrusions, fabrication and finishing |
PE Films
|
| | | | | | | | | | | | | |
| Locations in the U.S. | | Locations Outside the U.S. | | Principal Operations |
Durham, North Carolina (technical center and production facility) (leased)
Pottsville, Pennsylvania Richmond, Virginia (technical center) (leased) Terre Haute, Indiana (technical center and production facility)
| | Guangzhou, China Kerkrade, The Netherlands
Pune, India
Rétság, Hungary
São Paulo, Brazil
| | Production of plastic films elastics and laminate materials |
Flexible Packaging Films
|
| | | | | | | | | | | | | |
| Locations in the U.S. | | Locations Outside the U.S. | | Principal Operations |
Bloomfield, New York (technical center and production facility)
| | Cabo de Santo Agostinho, Brazil | | Production of PET-based films |
None.Item 3. LEGAL PROCEEDINGS
The information required by this Item 3 is set forth in Note 18 "Contingencies" to the Consolidated Financial Statements in Item 15 and is hereby incorporated herein by reference. | |
Item 4. | MINE SAFETY DISCLOSURES |
Item 4. MINE SAFETY DISCLOSURES
None.
PART II
| |
Item 5. | MARKET FOR TREDEGAR’S COMMON EQUITY, RELATED STOCKHOLDER MATTERS AND ISSUER PURCHASES OF EQUITY SECURITIES |
Market Prices of Common Stock and Shareholder DataItem 5. MARKET FOR REGISTRANT’S COMMON EQUITY, RELATED STOCKHOLDER MATTERS AND ISSUER PURCHASES OF EQUITY SECURITIES
Tredegar’s common stock is traded on the New York Stock Exchange (“NYSE”) under the ticker symbol “TG”. There were 33,365,03934,016,689 shares of common stock held by 1,8221,624 shareholders of record on December 31, 2019.
The following table shows the reported high and low closing prices of Tredegar’s common stock by quarter for the past two years.
|
| | | | | | | | | | | | | | | |
| | 2019 | | 2018 |
| | High | | Low | | High | | Low |
| First quarter | $ | 19.03 |
| | $ | 15.69 |
| | $ | 20.25 |
| | $ | 15.60 |
|
| Second quarter | 18.43 |
| | 15.59 |
| | 24.60 |
| | 16.99 |
|
| Third quarter | 19.78 |
| | 15.77 |
| | 26.25 |
| | 20.60 |
|
| Fourth quarter | 23.31 |
| | 18.74 |
| | 21.56 |
| | 15.00 |
|
Dividend Information
Tredegar has paid a regular cash dividend every quarter since becoming a public company in July 1989. During 2017, 2018 andIn addition, Tredegar has paid special cash dividends from time to time. On December 1, 2020, the first two quartersBoard declared a special dividend of 2019,$200 million, or $5.97 per share, on the CompanyCompany’s common stock (the “Special Dividend”). The Special Dividend was paid quarterly dividends of 11 cents per share; for the last two quarters of 2019, the Company paid quarterly dividends of 12 cents per share.in December 2020.
All decisions with respect to the declaration and payment of future dividends will be made by the Board of Directors (“Board”) in its sole discretion based upon earnings, financial condition, anticipated cash needs, restrictions in the Company’s revolving credit facility and other such considerations as the Board deems relevant. See Note 117 “Debt and Credit Agreements” to the Consolidated Financial Statements in Item 15 for the restrictions on the payment of dividends contained in the Company’s revolving credit agreement related to aggregate dividends permitted.agreement.
Issuer Purchases of Equity Securities
On January 7, 2008, Tredegar announced that itsthe Board approved a share repurchase program whereby management is authorized at its discretion to purchase, in the open market or in privately negotiated transactions, up to 5 million shares of the Company’s outstanding common stock. The authorization has no time limit. Tredegar did not repurchase any shares in the open market or otherwise in 2019, 20182022, 2021 or 20172020 under this standing authorization. The maximum number of shares remaining under this standing authorization was 1,732,003 at December 31, 2019.2022.
Comparative Tredegar Common Stock Performance Graph
The following graph compares cumulative total shareholder returns for Tredegar, the S&P SmallCap 600 Stock Index (an index comprised of companies with market capitalizations similar to Tredegar) and the Russell 2000 Index for the five years ended December 31, 2019.2022. Tredegar is part of both the S&P SmallCap 600 Index and Russell 2000 Index.
COMPARISON OF 5 YEAR CUMULATIVE TOTAL RETURN*
Among Tredegar Corporation, the S&P SmallCap 600 Index, and the Russell 2000 Index
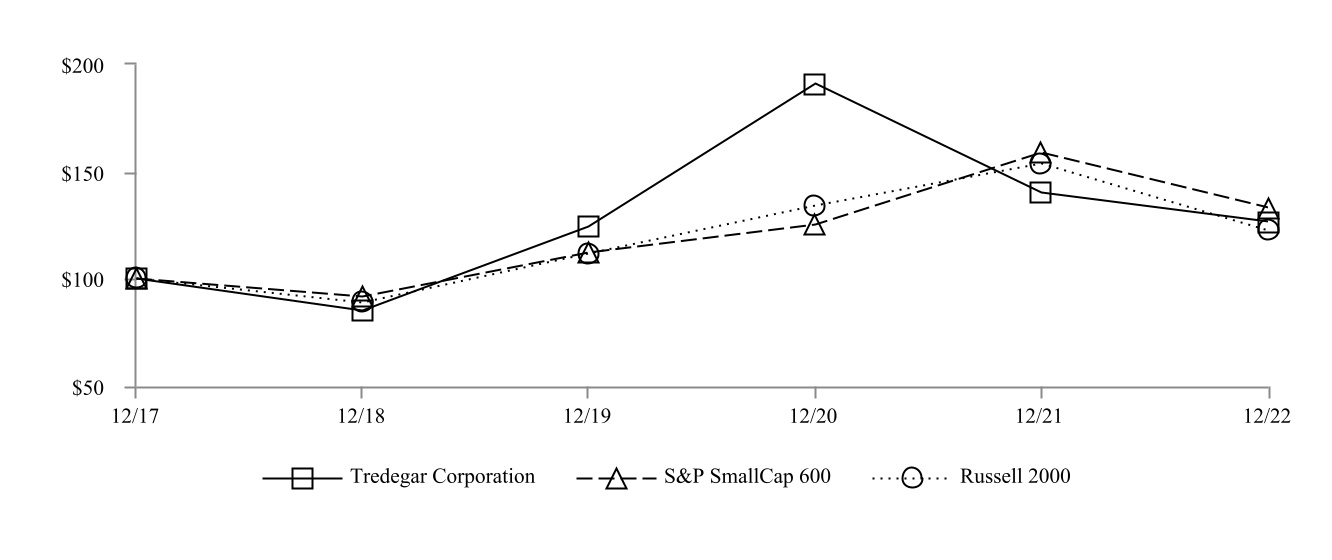
|
| |
*$100 invested on 12/31/1417 in stock or index, including reinvestment of dividends.
Fiscal year ending December 31.
Copyright© 2020
Copyright© 2022 Standard & Poor's, a division of S&P Global. All rights reserved.
Copyright© 2020 Copyright© 2022 Russell Investment Group. All rights reserved.
|
| |
Item 6. | SELECTED FINANCIAL DATA |
The tables that follow present certain selected financial and segment information for the five years ended December 31, 2019.
FIVE-YEAR SUMMARY
Tredegar Corporation and Subsidiaries
|
| | | | | | | | | | | | | | | | | | | | | | | | |
| Years Ended December 31 | 2019 | | | 2018 | | | 2017 | | | 2016 | | | 2015 | |
| (In thousands, except per-share data) | | | | | | | | | | | | | | |
| | | | | | | | | | | | | | | |
| Results of Operations: | | | | | | | | | | | | | | |
| Sales | $ | 972,358 |
| | | $ | 1,065,471 |
| | | $ | 961,330 |
| | | $ | 828,341 |
| | | $ | 896,177 |
| |
| Other income (expense), net (g) | 34,795 |
| (a) | | 30,459 |
| (a) | | 51,713 |
| (a) | | 2,381 |
| (b) | | (20,113 | ) | |
| | 1,007,153 |
| | | 1,095,930 |
| | | 1,013,043 |
| | | 830,722 |
| | | 876,064 |
| |
| Cost of goods sold (i) | 767,511 |
| (a) | | 849,756 |
| (a) | | 767,550 |
| (a) | | 659,867 |
| (b) | | 715,744 |
| (b) |
| Freight | 36,063 |
| | | 36,027 |
| | | 33,683 |
| | | 29,069 |
| | | 29,838 |
| |
| Selling, general & administrative expenses (i) | 94,352 |
| (a) | | 85,283 |
| (a) | | 83,386 |
| (a) | | 73,466 |
| (b) | | 69,384 |
| (b) |
| Research and development expenses | 19,636 |
| | | 18,707 |
| | | 18,287 |
| | | 19,122 |
| | | 16,173 |
| |
| Amortization of identifiable intangibles | 13,601 |
| | | 3,976 |
| | | 6,198 |
| | | 3,978 |
| | | 4,073 |
| |
| Pension and postretirement benefits (i) | 9,642 |
| | | 10,406 |
| | | 10,193 |
| | | 11,047 |
| | | 12,242 |
| |
| Interest expense | 4,051 |
| | | 5,702 |
| | | 6,170 |
| | | 3,806 |
| | | 3,502 |
| |
| Asset impairments and costs associated with exit and disposal activities | 4,125 |
| (a) | | 2,913 |
| (a) | | 102,488 |
| (a) | | 2,684 |
| (b) | | 3,850 |
| (b) |
| Goodwill impairment charge | — |
| | | 46,792 |
| (c) | | — |
| | | — |
| | | 44,465 |
| (c) |
| | 948,981 |
| | | 1,059,562 |
| | | 1,027,955 |
| | | 803,039 |
| | | 899,271 |
| |
| Income (loss) before income taxes | 58,172 |
| | | 36,368 |
| | | (14,912 | ) | | | 27,683 |
| | | (23,207 | ) | |
| Income tax expense (benefit) | 9,913 |
| | | 11,526 |
| | | (53,163 | ) | | | 3,217 |
| | | 8,928 |
| |
| Net income (loss) | $ | 48,259 |
| | | $ | 24,842 |
| | | $ | 38,251 |
| | | $ | 24,466 |
| | | $ | (32,135 | ) | |
| Diluted earnings (loss) per share | $ | 1.45 |
| | | $ | 0.75 |
| | | $ | 1.16 |
| | | $ | 0.75 |
| | | $ | (0.99 | ) | |
Refer to Notes to Financial Tables that follow these tables.
FIVE-YEAR SUMMARY
Tredegar Corporation and Subsidiaries
|
| | | | | | | | | | | | | | | | | | | | |
| Years Ended December 31 | 2019 | | 2018 | | 2017 | | 2016 | | 2015 | |
| (In thousands, except per-share data) | | | | | | | | | | |
| | | | | | | | | | | |
| Share Data: | | | | | | | | | | |
| Equity per share (h) | $ | 11.29 |
| | $ | 10.70 |
| | $ | 10.41 |
| | $ | 9.44 |
| | $ | 8.35 |
| |
| Cash dividends declared per share | $ | 0.46 |
| | $ | 0.44 |
| | $ | 0.44 |
| | $ | 0.44 |
| | $ | 0.42 |
| |
| Weighted average common shares outstanding during the period | 33,236 |
| | 33,068 |
| | 32,946 |
| | 32,762 |
| | 32,578 |
| |
| Shares used to compute diluted earnings (loss) per share during the period | 33,258 |
| | 33,092 |
| | 32,951 |
| | 32,775 |
| | 32,578 |
| |
| Shares outstanding at end of period | 33,365 |
| | 33,176 |
| | 33,017 |
| | 32,934 |
| | 32,682 |
| |
| Closing market price per share: | | | | | | | | | | |
| High | $ | 23.31 |
| | $ | 26.25 |
| | $ | 25.00 |
| | $ | 25.55 |
| | $ | 23.76 |
| |
| Low | $ | 15.59 |
| | $ | 15.00 |
| | $ | 14.85 |
| | $ | 11.68 |
| | $ | 12.63 |
| |
| End of year | $ | 22.35 |
| | $ | 15.86 |
| | $ | 19.20 |
| | $ | 24.00 |
| | $ | 13.62 |
| |
| Total return to shareholders (d) | 43.8 | % | | (15.1 | )% | | (18.2 | )% | | 79.4 | % | | (37.6 | )% | |
| Financial Position: | | | | | | | | | | |
| Total assets | $ | 712,668 |
| | $ | 707,373 |
| | $ | 755,743 |
| | $ | 651,162 |
| | $ | 623,260 |
| |
| Cash and cash equivalents | $ | 31,422 |
| | $ | 34,397 |
| | $ | 36,491 |
| | $ | 29,511 |
| | $ | 44,156 |
| |
| Debt | $ | 42,000 |
| | $ | 101,500 |
| | $ | 152,000 |
| | $ | 95,000 |
| | $ | 104,000 |
| |
| Shareholders’ equity (net book value) | $ | 376,749 |
| | $ | 354,857 |
| | $ | 343,780 |
| | $ | 310,783 |
| | $ | 272,748 |
| |
| Equity market capitalization (e) | $ | 745,709 |
| | $ | 526,172 |
| | $ | 633,935 |
| | $ | 790,411 |
| | $ | 445,131 |
| |
Refer to Notes to Financial Tables that follow these tables.
SEGMENT TABLES
Tredegar Corporation and Subsidiaries
|
| | | | | | | | | | | | | | | | | | | |
| Net Sales (f) | | | | | | | | | |
| Years Ended December 31 | 2019 | | 2018 | | 2017 | | 2016 | | 2015 |
| (In thousands) | | | | | | | | | |
| Aluminum Extrusions | $ | 529,602 |
| | $ | 573,126 |
| | $ | 466,833 |
| | $ | 360,098 |
| | $ | 375,457 |
|
| PE Films | 272,758 |
| | 332,488 |
| | 352,459 |
| | 331,146 |
| | 385,550 |
|
| Flexible Packaging Films | 133,935 |
| | 123,830 |
| | 108,355 |
| | 108,028 |
| | 105,332 |
|
| Total net sales | 936,295 |
| | 1,029,444 |
| | 927,647 |
| | 799,272 |
| | 866,339 |
|
| Add back freight | 36,063 |
| | 36,027 |
| | 33,683 |
| | 29,069 |
| | 29,838 |
|
| Sales as shown in Consolidated Statements of Income | $ | 972,358 |
| | $ | 1,065,471 |
| | $ | 961,330 |
| | $ | 828,341 |
| | $ | 896,177 |
|
| | | | | | | | | | |
| Identifiable Assets | | | | | | | | | |
| As of December 31 | 2019 | | 2018 | | 2017 | | 2016 | | 2015 |
| (In thousands) | | | | | | | | | |
| Aluminum Extrusions | $ | 265,027 |
| | $ | 281,372 |
| | $ | 268,127 |
| | $ | 147,639 |
| | $ | 136,935 |
|
| PE Films | 230,415 |
| | 231,720 |
| | 289,514 |
| | 278,558 |
| | 270,236 |
|
| Flexible Packaging Films | 74,016 |
| | 58,964 |
| | 49,915 |
| | 156,836 |
| | 146,253 |
|
| Subtotal | 569,458 |
| | 572,056 |
| | 607,556 |
| | 583,033 |
| | 553,424 |
|
| General corporate | 111,788 |
| | 100,920 |
| | 111,696 |
| | 38,618 |
| | 25,680 |
|
| Cash and cash equivalents | 31,422 |
| | 34,397 |
| | 36,491 |
| | 29,511 |
| | 44,156 |
|
| Total | $ | 712,668 |
| | $ | 707,373 |
| | $ | 755,743 |
| | $ | 651,162 |
| | $ | 623,260 |
|
Refer to Notes to Financial Tables that follow these tables.
SEGMENT TABLES
Tredegar Corporation and Subsidiaries
|
| | | | | | | | | | | | | | | | | | | | | | | | |
EBITDA from Ongoing Operations (l) | | | | | | | | | | | | | | |
| Years Ended December 31 | 2019 | | | 2018 | | | 2017 | | | 2016 | | | 2015 | |
| (In thousands) | | | | | | | | | | | | | | |
| Aluminum Extrusions: | | | | | | | | | | | | | | |
| Ongoing operations: | | | | | | | | | | | | | | |
| EBITDA | 65,683 |
| | | 65,479 |
| | | 58,524 |
| | | 46,967 |
| | | 40,131 |
| |
| Depreciation & amortization | (16,719 | ) | | | (16,866 | ) | | | (15,070 | ) | | | (9,173 | ) | | | (9,698 | ) | |
| EBIT (m) | 48,964 |
| | | 48,613 |
| | | 43,454 |
| | | 37,794 |
| | | 30,433 |
| |
| Plant shutdowns, asset impairments, restructurings and other | (561 | ) | (a) | | (505 | ) | (a) | | 321 |
| (a) | | (741 | ) | (b) | | (708 | ) | (b) |
| Trade name accelerated amortization | (10,040 | ) | (j) | | — |
| | | — |
| | | — |
| | | — |
| |
| PE Films: | | | | | | | | | | | | | | |
| Ongoing operations: | | | | | | | | | | | | | | |
| EBITDA | 37,803 |
| | | 51,058 |
| | | 55,889 |
| | | 39,350 |
| | | 63,398 |
| |
| Depreciation & amortization (j) | (14,627 | ) | | | (14,877 | ) | | | (14,343 | ) | | | (13,038 | ) | | | (15,123 | ) | |
| EBIT (m) | 23,176 |
| | | 36,181 |
| | | 41,546 |
| | | 26,312 |
| | | 48,275 |
| |
| Plant shutdowns, asset impairments, restructurings and other | (475 | ) | (a) | | (5,905 | ) | (a) | | (4,905 | ) | (a) | | (4,602 | ) | (b) | | (4,180 | ) | (b) |
| Goodwill impairment charge | — |
| | | (46,792 | ) | (c) | | — |
| | | — |
| | | — |
| |
| Flexible Packaging Films: | | | | | | | | | | | | | | |
| Ongoing operations: | | | | | | | | | | | | | | |
| EBITDA | 14,737 |
| | | 11,154 |
| | | 7,817 |
| | | 11,279 |
| | | 15,149 |
| |
| Depreciation & amortization | (1,517 | ) | | | (1,262 | ) | | | (10,443 | ) | | | (9,505 | ) | | | (9,697 | ) | |
| EBIT (m) | 13,220 |
| | | 9,892 |
| | | (2,626 | ) | | | 1,774 |
| | | 5,452 |
| |
| Plant shutdowns, asset impairments, restructurings and other | — |
| | | (45 | ) | (a) | | (89,398 | ) | (a) | | (214 | ) | (b) | | (185 | ) | (b) |
| Goodwill impairment charge | — |
| | | — |
| | | — |
| | | — |
| | | (44,465 | ) | (c) |
| Total | 74,284 |
| | | 41,439 |
| | | (11,608 | ) | | | 60,323 |
| | | 34,622 |
| |
| Interest income | 296 |
| | | 369 |
| | | 209 |
| | | 261 |
| | | 294 |
| |
| Interest expense | 4,051 |
| | | 5,702 |
| | | 6,170 |
| | | 3,806 |
| | | 3,502 |
| |
| Gain (loss) on investment in kaléo accounted for under the fair value method (g) | 28,482 |
| | | 30,600 |
| | | 33,800 |
| | | 1,600 |
| | | (20,500 | ) | |
| Loss on sale of investment property | — |
| | | (38 | ) | | | — |
| | | — |
| | | — |
| |
| Unrealized loss on investment property | — |
| | | (186 | ) | | | — |
| | | (1,032 | ) | | | — |
| |
| Stock option-based compensation expense | 4,209 |
| | | 1,221 |
| | | 264 |
| | | 56 |
| | | 483 |
| |
| Corporate expenses, net (k) | 36,630 |
| (a) | | 28,893 |
| (a) | | 30,879 |
| (a) | | 29,607 |
| (b) | | 33,638 |
| (b) |
| Income (loss) before income taxes | 58,172 |
| | | 36,368 |
| | | (14,912 | ) | | | 27,683 |
| | | (23,207 | ) | |
| Income tax expense (benefit) | 9,913 |
| | | 11,526 |
| | | (53,163 | ) | | | 3,217 |
| | | 8,928 |
| |
| Net income (loss) | $ | 48,259 |
| | | $ | 24,842 |
| | | $ | 38,251 |
| | | $ | 24,466 |
| | | $ | (32,135 | ) | |
Refer to Notes to Financial Tables that follow these tables.
SEGMENT TABLES
Tredegar Corporation and Subsidiaries
|
| | | | | | | | | | | | | | | | | | | |
| Depreciation and Amortization | | | | | | | | | |
| Years Ended December 31 | 2019 | | 2018 | | 2017 | | 2016 | | 2015 |
| (In thousands) | | | | | | | | | |
| Aluminum Extrusions | $ | 26,759 |
| | $ | 16,866 |
| | $ | 15,070 |
| | $ | 9,173 |
| | $ | 9,698 |
|
| PE Films | 15,822 |
| | 15,513 |
| | 14,609 |
| | 13,653 |
| | 15,480 |
|
| Flexible Packaging Films | 1,517 |
| | 1,262 |
| | 10,443 |
| | 9,505 |
| | 9,697 |
|
| Subtotal | 44,098 |
| | 33,641 |
| | 40,122 |
| | 32,331 |
| | 34,875 |
|
| General corporate (k) | 186 |
| | 163 |
| | 155 |
| | 141 |
| | 107 |
|
| Total depreciation and amortization expense | $ | 44,284 |
| | $ | 33,804 |
| | $ | 40,277 |
| | $ | 32,472 |
| | $ | 34,982 |
|
| | | | | | | | | | |
| Capital Expenditures | | | | | | | | | |
| Years Ended December 31 | 2019 | | 2018 | | 2017 | | 2016 | | 2015 |
| (In thousands) | | | | | | | | | |
| Aluminum Extrusions | $ | 17,855 |
| | $ | 12,966 |
| | $ | 25,653 |
| | $ | 15,918 |
| | $ | 8,124 |
|
| PE Films | 23,920 |
| | 21,998 |
| | 15,029 |
| | 25,759 |
| | 21,218 |
|
| Flexible Packaging Films | 8,866 |
| | 5,423 |
| | 3,619 |
| | 3,391 |
| | 3,489 |
|
| Subtotal | 50,641 |
| | 40,387 |
| | 44,301 |
| | 45,068 |
| | 32,831 |
|
| General corporate | 223 |
| | 427 |
| | 61 |
| | 389 |
| | — |
|
| Total capital expenditures | $ | 50,864 |
| | $ | 40,814 |
| | $ | 44,362 |
| | $ | 45,457 |
| | $ | 32,831 |
|
Refer to Notes to Financial Tables that follow these tables.
NOTES TO FINANCIAL TABLES
| |
(a) | For a description of plant shutdowns, asset impairments, restructurings and other charges for 2019, 2018, and 2017, see the plant shutdowns, asset impairments, restructurings and other tables for 2019, 2018 and 2017 in Results of Continuing Operations “Management’s Discussion and Analysis of Financial Condition and Results of Operations” in Part II, Item 7 of this Form 10-K. |
| |
(b) | For a description of plant shutdowns, asset impairments, restructurings and other charges for 2016 and 2015, see “Selected Financial Data” in Part II, Item 6 of the Company’s Annual Report on Form 10-K for the year ended December 31, 2018 (“2018 Form 10-K“), Part II, Item 6. |
| |
(c) | Results for 2018 included a goodwill impairment charge of $46.8 million ($38.2 million after taxes) recognized in PE Films in the third quarter of 2018 upon completion of an impairment analysis performed as of September 30, 2018. Results for 2015 included a goodwill impairment charge of $44.5 million ($44.5 million after taxes) recognized in Flexible Packaging Films in the third quarter of 2015 upon completion of an impairment analysis performed as of September 30, 2015. |
| |
(d) | Total return to shareholders is defined as the change in stock price during the year plus dividends per share, divided by the stock price at the beginning of the year. |
| |
(e) | Equity market capitalization is the closing market price per share for the period multiplied by the shares outstanding at the end of the period. |
| |
(f) | Net sales represents gross sales less freight. The Company uses net sales as its measure of revenues from external customers at the segment level. |
| |
(g) | The gains and losses on the Company’s investment in kaléo are included in “Other income (expense), net” in the consolidated statements of income. See Note 4 to the Notes to financial statements for more details for the years 2019, 2018 and 2017.
|
| |
(h) | Equity per share is computed by dividing shareholders’ equity at year end by the shares outstanding at year end. |
| |
(i) | For the years ended December 31, 2015 to 2017, the pension and postretirement benefit expenses recorded in Cost of goods sold and Selling, general and administrative expenses were reclassified to a new line item, Pension and postretirement benefits, on the consolidated statements of income, due to the retrospective adoption of Accounting Standards Update (“ASU”) 2017-07. |
| |
(j) | Depreciation and amortization (“D&A”) in 2019 for Aluminum Extrusions excludes $10.0 million for accelerated amortization of trade names as a result of a rebranding initiative. D&A in 2019, 2018, 2017, 2016 and 2015 for PE Films excludes $1.2 million, $0.6 million, $0.3 million, $0.6 million and $0.4 million, respectively, for accelerated depreciation associated with restructurings and plant closures. |
| |
(k) | Corporate depreciation and amortization is included in Corporate expenses, net, on the EBITDA from ongoing operations table above. |
| |
(l) | In the fourth quarter of 2019, the Company changed its segment measure of profit and loss from operating profit from ongoing operations to EBITDA (earnings before interest, taxes, depreciation and amortization) from ongoing operations. EBITDA from ongoing operations is the key profitability metric used by the Company’s chief operating decision maker to assess segment financial performance. See Note 5 to the Notes to Financial Statements in this 2019 Form 10-K for additional business segment information. |
| |
(m) | EBIT (earnings before interest and taxes) from ongoing operations is a non-GAAP financial measure included in the reconciliation of segment financial information to consolidated results for the Company. It is not intended to represent the stand-alone results for Tredegar’s ongoing operations under GAAP and should not be considered as an alternative to net income as defined by GAAP. EBIT is a widely understood and utilized metric that is meaningful to certain investors. We believe that including this financial metric in the reconciliation of management’s performance metric, EBITDA from ongoing operations, provides useful information to those investors that primarily utilize EBIT to analyze the Company’s core operations. |
| |
Item 7. | MANAGEMENT’S DISCUSSION AND ANALYSIS OF FINANCIAL CONDITION AND RESULTS OF OPERATIONS |
Item 7. MANAGEMENT’S DISCUSSION AND ANALYSIS OF FINANCIAL CONDITION AND RESULTS OF OPERATIONS Forward-lookingThe following discussion and Cautionary Statements
Someanalysis of our financial condition and results of operations focuses on and is intended to clarify the results of our operations, certain changes in our financial position, liquidity, capital structure and business developments for the periods covered by the consolidated financial statements included in this Form 10-K. This discussion should be read in conjunction with, and is qualified by reference to, the other related information containedincluding, but not limited to, the audited consolidated financial statements (including the notes thereto) and the description of our business, all as set forth in this Form 10-K, may constitute “forward-looking statements” withinas well as the meaning ofrisk factors discussed above in Item 1A.
This section provides discussion and a year-to-year comparison for the “safe harbor” provisions ofyears ended December 31, 2022, 2021 and 2020.
Business Overview
General
Tredegar Corporation is an industrial manufacturer with three primary businesses: custom aluminum extrusions for the Private Securities Litigation Reform Act of 1995. When using the words “believe,” “estimate,” “anticipate,” “expect,” “project,” “plan,” “likely,” “may”North American building and similar expressions, Tredegar does so to identify forward-looking statements. Such statements are based on then current expectationsconstruction ("B&C"), automotive and are subject to a number of risks and uncertainties that could cause actual results to differ materially from those addressedspecialty end-use markets through its Aluminum Extrusions segment; surface protection films for high-technology applications in the forward-looking statements. It is possible that actual resultsglobal electronics industry through its PE Films segment; and financial condition may differ, possibly materially, fromspecialized polyester films primarily for the anticipated resultsLatin American flexible packaging market through its Flexible Packaging Films segment. With approximately 2,300 employees, the Company operates manufacturing facilities in North America, South America, and financial condition indicated in or implied by these forward-looking statements. Accordingly, you should not place undue reliance on these forward-looking statements. For risksAsia.
Earnings before interest, taxes, depreciation and important factors that could cause actual results to differ from expectations, refer to the reports that Tredegar files with or furnishes the SEC from time-to-time, including the risks and important factors set forth in “Risk Factors” in Part I, Item 1A of this Form 10-K. Readers are urged to review and consider carefully the disclosures Tredegar makes in the reports Tredegar files with or furnishes to the SEC. Tredegar does not undertake, and expressly disclaims any duty, to update any forward-looking statement to reflect any change in management’s expectations or any change in conditions, assumptions or circumstances on which such statements are based, except as required by applicable law.
Executive Summary
General
Tredegar is a manufacturer of aluminum extrusions, polyethylene (“PE”amortization ("EBITDA") plastic films, and polyester films. Descriptions of all the Company’s businesses are provided in the Business section in Part I, Item 1 of this Form10-K.
Sales were $1.0 billion in 2019 compared to $1.1 billion in 2018. Net income was $48.3 million ($1.45 per diluted share) in 2019, compared with $24.8 million ($0.75 per diluted share) in 2018.
The 2019 results include:
An after-tax gain on the sale of the Company’s Shanghai manufacturing property of $5.9 million ($0.18 per share);
An after-tax dividend received from kaléo of $14.8 million ($0.45 per share); and
An unrealized after-tax gain on the Company’s investment in kaléo of $8.5 million ($0.26 per share), which is accounted for under the fair value method (see Note 4 for more details);
The 2018 results include:
An after-tax impairment of the total goodwill balance of PE Films’ Personal Care division of $38.2 million ($1.15 per share after-tax). See the Customer Product Transitions in Personal Care and Surface Protection section below and Note 8 to the Notes to Financial Statements for more details; and
An unrealized after-tax gain on the Company’s investment in kaléo of $23.9 million ($0.72 per share);
Other losses associated with plant shutdowns, asset impairments and restructurings are described in Note 17 to the Notes to Financial Statements. EBITDA from ongoing operations is the measure of segment profit and loss used by Tredegar’s chief operating decision maker ("CODM") for purposes of assessing financial performance. The Company uses sales less freight (“net sales”) from continuing operations as its measure of revenues from external customers at the segment level. This measure is separately included in the financial information regularly provided to the CODM.
Aluminum ExtrusionsEarnings before interest and taxes ("EBIT") from ongoing operations is a non-GAAP financial measure included in the reconciliation of segment financial information to consolidated results for the Company in Note 13 “Business Segments” to the Consolidated Financial Statements in Item 15. EBIT is not intended to represent the stand-alone results for Tredegar's ongoing operations under GAAP and should not be considered as an alternative to net income (loss) as defined by GAAP. We believe that EBIT is a widely understood and utilized metric that is meaningful to certain investors and that including this financial metric in the reconciliation of management’s performance metric, EBITDA from ongoing operations, provides useful information to those investors that primarily utilize EBIT to analyze the Company’s core operations.
A summarySales were $938.6 million in 2022 compared to $826.5 million in 2021. Net income from continuing operations was $28.4 million ($0.84 per diluted share) in 2022, compared with net income from continuing operations of operating results$57.9 million ($1.72 per diluted share) in 2021.
2022 Financial Results Highlights
•EBITDA from ongoing operations for Aluminum Extrusions is provided below:of $66.8 million was $10.9 million higher than the year of 2021
•EBITDA from ongoing operations for PE Films of $11.9 million was $15.7 million lower than the year of 2021
•EBITDA from ongoing operations for Flexible Packaging Films of $27.5 million was $4.2 million lower than the year of 2021
Other losses related to asset impairments and costs associated with exit and disposal activities for continuing operations were not material for the years ended December 31, 2022 and 2021, respectively. Gains and losses associated with plant shutdowns, asset impairments, restructurings and other items are described in Results of Operations below.
|
| | | | | | | | | | | | |
| | | | Year Ended | | Favorable/ |
| (In thousands, except percentages) | | | December 31, | | (Unfavorable) |
| | | 2019 | | 2018 | | % Change |
| Sales volume (lbs) | | | 208,249 |
| | 223,866 |
| | (7.0 | )% |
| Net sales | | | $ | 529,602 |
| | $ | 573,126 |
| | (7.6 | )% |
| Ongoing operations: | | | | | | | |
| EBITDA | | | $ | 65,683 |
| | $ | 65,479 |
| | 0.3 | % |
| Depreciation & amortization** | | | (16,719 | ) | | (16,866 | ) | | 0.9 | % |
| EBIT* | | | $ | 48,964 |
| | $ | 48,613 |
| | 0.7 | % |
| Capital expenditures | | | $ | 17,855 |
| | $ | 12,966 |
| | |
* See the table in Item 6 for a reconciliation of this non-GAAP measure to GAAP and additional information. **Excludes pre-tax accelerated amortization of trade names of $10.0 million in 2019. See Note 8 to the Notes to Financial Statements for more information. |
Results of Operations
2022 versus 2021
The following table presents a bridge of consolidated net income (loss) from continuing operations from the year of 2021 to the year of 2022 with related management’s discussion and analysis below the table.
| | | | | | | | |
| (In thousands) | | |
| Net income (loss) from continuing operations for the year ended December 31, 2021 | | $ | 57,937 | |
| Income tax expense (benefit) | | 9,284 | |
| Income (loss) from continuing operations before income taxes for the year ended December 31, 2021 | | 67,221 | |
| Increase (decrease) in income from increases (decreases) in the following items: | | |
| Sales | | 112,109 | |
| Other income (expense), net | | (19,441) | |
| Total | | 92,668 | |
| Increase (decrease) in income from (increases) decreases in the following items: | | |
| Cost of goods sold | | (114,352) | |
| Freight | | (6,750) | |
| Selling, general and administrative | | (3,826) | |
| Other | | (2,191) | |
| Total | | (127,119) | |
| Income (loss) from continuing operations before income taxes for the year ended December 31, 2022 | | 32,770 | |
| Income tax expense (benefit) | | 4,389 | |
| Net income (loss) from continuing operations for the year ended December 31, 2022 | | $ | 28,381 | |
Sales in 2022 increased by 13.6% compared with 2021. Net sales increased 18.3% in 2019 decreased versus 2018Aluminum Extrusions primarily due to lower sales volume and the passthrough of lower metal costs, partially offset by an increase in average selling prices to cover higher aluminum raw material costs and higher operating costs, partially offset by lower sales volume. Net sales decreased 18.0% in PE Films primarily due to lower volume, partially offset by higher pricing associated with the pass-through of increased resin costs. Net sales increased in Flexible Packaging Films by 20.1% primarily due to higher selling prices from the pass-through of higher resin costs, favorable product mix and higher sales volume. For more information on changes in net sales and volume, see the Segment Operations Review section below.
Other income (expense), net decreased $19.4 million compared to 2021, primarily due to 2021 gains of $12.8 million on the investment in kaléo and $8.5 million associated with a one-time tax credit in Brazil for unemployment/social security insurance non-income taxes resulting from a favorable decision by Brazil's Supreme Court regarding the calculation of such tax. See Note 9 “Other Income (Expense), net” to the Consolidated Financial Statements in Item 15 for additional information.
Consolidated gross profit (sales minus cost of goods sold and freight) as a percentage of sales (gross profit margin) was 14.9% in 2022 versus 18.0% in 2021. The gross profit margin in Aluminum Extrusions remained flat compared to 2021. The gross profit margin in PE Films decreased primarily due to Surface Protection lower sales for non-transitioning products associated with a market slowdown and customer inventory corrections and competitive pricing, and previously disclosed customer product transitions, partially offset by pass-through lag associated with resin pricing. The gross profit margin in Flexible Packaging Films decreased due to higher raw material costs and higher fixed costs, partially offset by favorable product mix, higher sales volume and higher selling prices from the pass-through of higher resin costs. For more information on changes in operating costs and expenses, see the Segment Operations Review section below.
As a percentage of sales, selling, general and administrative (“SG&A”) and R&D expenses were 9.1% in 2022 compared with 9.8% in 2021. SG&A expenses and sales increased year-over-year, while R&D expenses remained consistent with the prior year. Increased SG&A spending is primarily due to higher professional fees associated with the internal and external audits of the Company and higher employee-related compensation.
The effective tax rate used to compute income taxes for continuing operations for the year of 2022 was 13.4%, compared to 13.8% in 2021. The decrease in the effective tax rate for continuing operations is primarily due to a discrete tax benefit recorded in the first quarter of 2022 resulting from the implementation of new U.S. tax regulations associated with foreign tax credits published by the U.S. Treasury and Internal Revenue Service (“IRS”) on January 4, 2022. These regulations overhaul various components of the foreign tax credit regime including the determination of creditable foreign taxes and limit the amount of foreign taxes that are creditable against U.S. income taxes. This discrete benefit was partially offset by an increase to the effective tax rate as the result of the Brazilian income tax no longer being creditable in the U.S. for the foreseeable future. Lastly, the effective tax rate changed due to foreign rate differences pertaining to the Company’s foreign operations and the
benefit from tax incentives in Brazil. See Note 12 “Income Taxes” to the Consolidated Financial Statements in Item 15 for additional information.
Pre-tax gains and losses associated with plant shutdowns, asset impairments, restructurings and other items for continuing operations in 2022 detailed below are shown in the statements of net sales and EBITDA from ongoing operations by segment table in 2019Note 13 “Business Segments” to the Consolidated Financial Statements in Item 15 and are included in “Asset impairments and costs associated with exit and disposal activities, net of adjustments” in the consolidated statements of income, unless otherwise noted.
| | | | | | | | | | | | | | | | | |
| ($ in millions) | Q1 | Q2 | Q3 | Q4 | 2022 |
| Aluminum Extrusions: | | | | | |
| (Gains) losses from sale of assets, investment writedowns and other items: | | | | | |
COVID-19-related expenses, net of relief 2 | $ | 0.1 | | $ | — | | $ | — | | $ | — | | $ | 0.1 | |
Environmental charges at Newnan, Georgia plant3 | — | | — | | — | | 0.1 | | 0.1 | |
Storm damage to the Newnan, Georgia plant1 | — | | — | | — | | 0.1 | | 0.1 | |
| Total for Aluminum Extrusions | $ | 0.1 | | $ | — | | $ | — | | $ | 0.2 | | $ | 0.3 | |
| PE Films: | | | | | |
| (Gains) losses associated with plant shutdowns, asset impairments and restructurings: | | | | | |
| Other restructuring costs - severance | $ | — | | $ | — | | $ | 0.5 | | $ | — | | $ | 0.5 | |
| (Gains) losses from sale of assets, investment writedowns and other items: | | | | | |
COVID-19-related expenses2 | 0.1 | | 0.1 | | — | | — | | 0.2 | |
| Total for PE Films | $ | 0.1 | | $ | 0.1 | | $ | 0.5 | | $ | — | | $ | 0.7 | |
| Flexible Packaging Films: | | | | | |
| (Gains) losses from sale of assets, investment writedowns and other items: | | | | | |
COVID-19-related expenses2 | $ | — | | $ | — | | $ | — | | $ | 0.1 | | $ | 0.1 | |
| Total for Flexible Packaging Films | $ | — | | $ | — | | $ | — | | $ | 0.1 | | $ | 0.1 | |
| Corporate: | | | | | |
| (Gains) losses associated with plant shutdowns, asset impairments and restructurings: | | | | | |
| Other restructuring costs - severance | $ | — | | $ | 0.1 | | $ | — | | $ | — | | $ | 0.1 | |
| (Gains) losses from sale of assets, investment writedowns and other items: | | | | | |
Professional fees associated with business development activities1 | 1.5 | | 0.1 | | — | | 0.8 | | 2.4 | |
Professional fees associated with remediation activities related to internal control over financial reporting1 | 0.4 | 0.8 | 0.8 | 0.6 | 2.6 | |
Stock compensation expense associated with the fair value remeasurement of awards granted at the time of the 2020 Special Dividend1 | — | | (0.2) | | (0.1) | | — | | (0.3) | |
Net periodic benefit cost for the frozen defined benefit pension plan in process of termination4 | 3.4 | | 3.5 | | 3.5 | | 4.0 | | 14.4 | |
| Total for Corporate | $ | 5.3 | | $ | 4.3 | | $ | 4.2 | | $ | 5.4 | | $ | 19.2 | |
1.Included in “Selling, general and administrative expenses” in the consolidated statements of income. 2. Included in “Other income (expense), net” in the consolidated statements of income. 3. Included in "Costs of goods sold" in the consolidated statements of income. 4. For more information, see “Corporate Expenses, Interest and Other” below and Note 8 “Retirement Plans and Other Postretirement Benefits” to the Consolidated Financial Statements in Item 15. |
Average debt outstanding and interest rates were as follows:
| | | | | | | | | | | |
| (In millions, except percentages) | 2022 | | 2021 |
Floating-rate debt with interest charged on a rollover basis plus a credit spread1: | | | |
| Average outstanding debt balance | $ | 114.5 | | | $ | 128.8 | |
| Average interest rate | 3.5 | % | | 1.8 | % |
1.Following the entry into the Second Amended and Restated Credit Agreement on June 29, 2022, borrowings bear an interest rate equal to SOFR plus a credit spread adjustment of 10 basis points and an amount depending on the type of borrowing and commitment fees charged on the unused amount under the Second Amended and Restated Credit Agreement. Prior to entry into the Second Amended and Restated Credit Agreement, the interest rate was based on LIBOR plus an applicable credit spread. See "Liquidity and Capital Resources" below for additional information. |
2021 versus 2020
The following table presents a bridge of consolidated net income (loss) from continuing operations from the year of 2020 to the year of 2021 with related management’s discussion and analysis below the table.
| | | | | | | | |
| (In thousands) | | |
| Net income (loss) from continuing operations for the year ended December 31, 2020 | | $ | (16,833) | |
| Income tax expense (benefit) | | (8,213) | |
| Income (loss) from continuing operations before income taxes for the year ended December 31, 2020 | | (25,046) | |
| Increase (decrease) in income from increases (decreases) in the following items: | | |
| Sales | | 71,165 | |
| Other income (expense), net | | 87,670 | |
| Total | | 158,835 | |
| Increase (decrease) in income from (increases) decreases in the following items: | | |
| Cost of goods sold | | (90,723) | |
| Freight | | (2,546) | |
| Selling, general and administrative | | 9,282 | |
| Research and development | | 2,051 | |
| Amortization of intangibles | | 1,313 | |
| Goodwill impairment | | 13,696 | |
| Other | | 359 | |
| Total | | (66,568) | |
| Income (loss) from continuing operations before income taxes for the year ended December 31, 2021 | | 67,221 | |
| Income tax expense (benefit) | | 9,284 | |
| Net income (loss) from continuing operations for the year ended December 31, 2021 | | $ | 57,937 | |
Sales in 2021 increased slightlyby 9.4% compared with 2020. Net sales increased 18.3% in comparisonAluminum Extrusions primarily due to 2018. Excludingan increase in average selling prices to cover significantly higher aluminum raw material costs and higher operating costs, partially offset by lower sales volume. Net sales decreased 14.6% in PE Films primarily due to lower volume and unfavorable mix associated with the adversepreviously disclosed customer product transitions in Surface Protection, partially offset by higher pricing associated with the pass-through of increased resin costs. Net sales increased in Flexible Packaging Films by 4.0% primarily due to higher selling prices from the pass-through of higher resin costs and favorable product mix, partially offset by lower sales volume.
Other income (expense), net increased $87.7 million compared to 2020, primarily due to a 2021 gain of $8.5 million associated with a one-time tax credit in Brazil for unemployment/social security insurance non-income taxes resulting from a favorable decision by Brazil's Supreme Court regarding the calculation of such tax and a gain of $12.8 million on the Company’s investment in kaléo recognized in the full year ended December 31, 2021 compared to a loss of $60.9 million in the full year ended December 31, 2020.
Consolidated gross profit (sales minus cost of goods sold and freight) as a percentage of sales (gross profit margin) was 18.0% in 2021 versus 22.6% in 2020. The gross profit margin in Aluminum Extrusions decreased primarily due to higher labor and employee-related costs and other inflationary operating costs such as higher supply expenses, partially offset by higher pricing. The gross profit margin in PE Films decreased primarily due to Surface Protection lower sales and unfavorable mix associated with the customer product transitions, lower sales and unfavorable mix for products unrelated to customer product transitions, and margin erosion associated with higher resin costs that occurred before the resin index pricing plan was fully implemented. The gross profit margin in Flexible Packaging Films decreased due to lower sales volume and higher raw material costs, partially offset by favorable product mix and higher selling prices from the pass-through of higher resin costs.
As a percentage of sales, SG&A and R&D expenses were 9.8% in 2021 compared with 12.3% in 2020. SG&A and R&D expenses were down year-over-year, while net sales increased. Decreased spending is primarily due to non-recurring corporate costs associated with the divested Personal Care Films business, lower R&D spending in PE Films, lower stock-based compensation, and nonrecurring SG&A expenses related to the Bright View Technologies divestiture at the end of 2020.
Amortization of intangible assets decreased $1.3 million compared to 2020 primarily due to an out-of-period adjustment of $0.9 million in connection with the original valuation of intangible assets and goodwill related to the acquisition of Futura in February 2017.
During the first three months of 2020, the Company performed goodwill impairment tests and recognized a goodwill impairment charge of $13.7 million ($10.5 million after taxes), which represented the entire amount of goodwill associated with Aluminum Extrusions’ AACOA reporting unit. See Note 1 “Nature of Operations and Summary of Significant Accounting Policies” to the Consolidated Financial Statements in Item 15 for additional details.
The effective tax rate used to compute income taxes for continuing operations for the year of 2021 was 13.8%, compared to 32.8% in 2020. The decrease in the effective tax rate for continuing operations is primarily due to the strong earnings of Terphane Ltda, which are included in Tredegar’s U.S. consolidated tax return and, the tax impact of the accountinglocal statutory tax rates of Tredegar’s foreign subsidiaries being higher than the current U.S. tax rate of 21%, the benefit of tax incentives in Brazil and the release of the valuation allowance for inventoriescapital loss carryforwards.
Pre-tax gains and losses associated with plant shutdowns, asset impairments, restructurings and other items for continuing operations in 2021 detailed below are shown in the statements of net sales and EBITDA from ongoing operations by segment table in Note 13 “Business Segments” to the Consolidated Financial Statements in Item 15 and are included in “Asset impairments and costs associated with exit and disposal activities, net of adjustments” in the consolidated statements of income, unless otherwise noted.
| | | | | | | | | | | | | | | | | |
| ($ in millions) | Q1 | Q2 | Q3 | Q4 | 2021 |
| Aluminum Extrusions: | | | | | |
| (Gains) losses from sale of assets, investment writedowns and other items: | | | | | |
Consulting expenses for ERP feasibility study1 | $ | — | | $ | — | | $ | — | | $ | 0.3 | | $ | 0.3 | |
Futura intangible amortization out-of-period adjustment6 | — | | — | | — | | (0.9) | | (0.9) | |
Vacation accrual policy change5 | — | | — | | — | | (2.9) | | (2.9) | |
Environmental charges at Newnan, Georgia plant3 | — | | — | | 0.1 | | 0.1 | | 0.2 | |
COVID-19-related expenses, net of relief 2 | (0.2) | | 0.3 | | 0.1 | | (0.1) | | 0.1 | |
| Total for Aluminum Extrusions | $ | (0.2) | | $ | 0.3 | | $ | 0.2 | | $ | (3.5) | | $ | (3.2) | |
| PE Films: | | | | | |
| (Gains) losses associated with plant shutdowns, asset impairments and restructurings: | | | | | |
| Other restructuring costs - severance | $ | — | | $ | — | | $ | 0.1 | | $ | 0.3 | | $ | 0.4 | |
| (Gains) losses from sale of assets, investment writedowns and other items: | | | | | |
Vacation accrual policy change5 | — | | — | | — | | (0.5) | | (0.5) | |
COVID-19-related expenses2 | 0.2 | | 0.1 | | 0.1 | | 0.1 | | 0.5 | |
| Total for PE Films | $ | 0.2 | | $ | 0.1 | | $ | 0.2 | | $ | (0.1) | | $ | 0.4 | |
| Flexible Packaging Films: | | | | | |
| (Gains) losses from sale of assets, investment writedowns and other items: | | | | | |
One-time tax credit in Brazil for unemployment/social security insurance non-income taxes resulting from a favorable decision by Brazil’s Supreme Court regarding the calculation of such taxes 2,4 | $ | — | | $ | (8.5) | | $ | — | | $ | — | | $ | (8.5) | |
COVID-19-related expenses2 | — | | — | | — | | 0.1 | | 0.1 | |
| Total for Flexible Packaging Films | $ | — | | $ | (8.5) | | $ | — | | $ | 0.1 | | $ | (8.4) | |
| Corporate: | | | | | |
| (Gains) losses associated with plant shutdowns, asset impairments and restructurings: | | | | | |
| Costs, net of gain associated with the sale of the Lake Zurich manufacturing facility assets | $ | 0.2 | | $ | 0.2 | | $ | (0.2) | | $ | (0.1) | | $ | 0.1 | |
| Other restructuring costs - severance | — | | — | | — | | 0.2 | | 0.2 | |
| (Gains) losses from sale of assets, investment writedowns and other items: | | | | | |
Professional fees associated with business development activities1 | 0.8 | | 0.8 | | 0.7 | | 1.6 | | 3.9 | |
Professional fees associated with remediation activities related to internal control over financial reporting1 | 0.2 | 0.9 | 0.8 | 1.2 | 3.1 | |
Write-down of investment in Harbinger Capital Partners Special Situations Fund2 | 0.1 | | 0.4 | | — | | — | | 0.5 | |
Stock compensation expense associated with the fair value remeasurement of awards granted at the time of the 2020 Special Dividend1 | 0.4 | | 0.1 | | (0.1) | | — | | 0.4 | |
Transition service fees, net of corporate costs associated with the divested Personal Care Films business2 | (0.3) | | (0.3) | | 0.1 | | 0.2 | | (0.3) | |
Vacation accrual policy change5 | — | | — | | — | | (0.4) | | (0.4) | |
| Total for Corporate | $ | 1.4 | | $ | 2.1 | | $ | 1.3 | | $ | 2.7 | | $ | 7.5 | |
1.Included in “Selling, general and administrative expenses” in the consolidated statements of income. 2. Included in “Other income (expense), net” in the consolidated statements of income. 3. Included in "Costs of goods sold" in the consolidated statements of income. 4. For more information, see Note 9 “Other Income (Expense), net” to the consolidated financial statements in Item 15. 5. For more information, see Note 6 “Accrued Expenses” to the consolidated financial statements in Item 15. 6. Included in “Amortization of identifiable intangibles” in the consolidated statements of income. |
Average debt outstanding and interest rates were as follows:
| | | | | | | | | | | |
| (In millions, except percentages) | 2021 | | 2020 |
| Floating-rate debt with interest charged on a rollover basis at one-month LIBOR plus a credit spread: | | | |
| Average outstanding debt balance | $ | 128.8 | | | $ | 33.5 | |
| Average interest rate | 1.8 | % | | 2.3 | % |
Segment Operations Review
Aluminum Extrusions
A summary of results for Aluminum Extrusions is provided below:
| | | | | | | | | | | | | | | | | |
| Year Ended | | Favorable/ |
| (In thousands, except percentages) | December 31, | | (Unfavorable) |
| 2022 | | 2021 | | % Change |
| Sales volume (lbs) | 174,670 | | | 183,367 | | | (4.7) | % |
| Net sales | $ | 637,872 | | | $ | 539,325 | | | 18.3 | % |
| Ongoing operations: | | | | | |
| EBITDA | $ | 66,800 | | | $ | 55,948 | | | 19.4 | % |
| Depreciation & amortization | (17,414) | | | (16,272) | | | (7.0) | % |
| EBIT | $ | 49,386 | | | $ | 39,676 | | | 24.5 | % |
| Capital expenditures | $ | 23,664 | | | $ | 18,914 | | | |
Net sales in 2022 increased 18.3% versus 2021. The annual increase in net sales was primarily due to an increase in average selling prices to cover higher average aluminum raw material costs and higher operating costs, partially offset by lower sales volume. Sales volume in 2022 decreased 4.7% versus 2021, primarily due to lower shipments in the specialty and automotive segments which declined 14.3% and 4.2%, respectively. Shipments for non-residential B&C in 2022 increased by 1.6% versus 2021.
EBITDA from ongoing operations increased $10.9 million in 2022 versus 2021, primarily due to:
•Higher pricing ($69.6 million, net of the pass-through of aluminum raw materials costs), partially offset by: lower volume ($5.6 million); higher labor and employee-related costs ($7.2 million) and lower labor productivity ($5.6 million); higher supply expenses ($15.3 million), including significant price increases in paint, chemicals, packaging and other supplies; higher freight expenses ($6.3 million); higher utility rates ($3.1 million); higher maintenance expenses ($1.4 million); and higher SG&A ($3.0 million); and
•Inventories accounted for under the last in, first out (“LIFO”) method resulted in a charge of $2.9 million in 2022 versus a benefit of $0.6 million in 2021. In addition, inventories accounted for under the fourth quarterfirst in, first out (“FIFO”) method resulted in no charge or benefit in 2022 versus a benefit of 2019 versus 2018 ($1.5 million), EBITDA from ongoing operations increased $1.7$6.7 million despitein 2021, which related to the timing of the flow through of aluminum raw material costs passed through to customers previously acquired at higher prices in a 7% declinequickly changing commodity pricing environment. Also, the Company recorded unfavorable net out-of-period adjustments totaling $0.6 million for charges related to inventory, accrued labor costs and accounts payable in sales volume. The increase was primarily due2022.
Aluminum Extrusions has secured supply sources to higher pricing ($22.8 million)meet expected needs for aluminum raw materials in 2023. See discussion of quantitative and fabrication profits ($1.0 million), partially offset by lower sales volume ($8.7 million), increased labor and employee-related expenses ($7.4 million), higher supplies, maintenance, utilities and other operating costs ($2.0 million), increased freight costs ($2.0 million) and increased general and administrative expenses ($1.9 million).qualitative disclosures about market risk in Item 7a in this Form 10-K for additional information on aluminum price trends.
Projected Capital Expenditures and Depreciation & Amortization
Capital expenditures are projected to be $23$26 million in 2020, including the expected initial investment2023, include $11 million for a multi-year project to migrate to a new division-wide enterprise resource planning and manufacturing excellence system ($6 million),ERP/MES, $6 million for infrastructure upgrades at the facilities located in Niles, Michigan, Carthage, Tennessee and Newnan, Georgia, facilities ($4 million), and $2 million for other strategic projects. The ERP/MES project commenced in 2022 and is expected to cost a total of approximately $12$30 million over a two-year time span. In addition to strategic projects, approximately $7 million will be required to support continuity of current operations. Depreciation expense is projected to be $14$15 million in 2020.2023. Amortization expense is projected to be $3$2 million in 2020.2023.
PE Films
A summary of operating results for PE Films is provided below:
| | | | | Year Ended | | Favorable/ | | Year Ended | | Favorable/ |
| (In thousands, except percentages) | | December 31, | | (Unfavorable) | (In thousands, except percentages) | December 31, | | (Unfavorable) |
| | | 2019 | | 2018 | | % Change | 2022 | | 2021 | | % Change |
| Sales volume (lbs) | | 104,497 |
| | 123,583 |
| | (15.4 | )% | Sales volume (lbs) | 32,873 | | | 39,429 | | | (16.6) | % |
| Net sales | | $ | 272,758 |
| | $ | 332,488 |
| | (18.0 | )% | Net sales | $ | 97,571 | | | $ | 118,920 | | | (18.0) | % |
| Ongoing operations: | | | | | | | Ongoing operations: | |
| EBITDA | | $ | 37,803 |
| | $ | 51,058 |
| | (26.0 | )% | EBITDA | $ | 11,949 | | | $ | 27,694 | | | (56.9) | % |
| Depreciation & amortization | | (14,627 | ) | | (14,877 | ) | | 1.7 | % | Depreciation & amortization | (6,280) | | | (6,263) | | | (0.3) | % |
| EBIT* | | $ | 23,176 |
| | $ | 36,181 |
| | (35.9 | )% | |
| EBIT | | EBIT | $ | 5,669 | | | $ | 21,431 | | | (73.5) | % |
| Capital expenditures | | $ | 23,920 |
| | $ | 21,998 |
| | | Capital expenditures | $ | 3,289 | | | $ | 2,997 | | |
| * See the table in Item 6 for a reconciliation of this non-GAAP measure to GAAP and additional information. | |
Net sales in 20192022 decreased by $59.7 million18% versus 2018 due to lower sales in Personal Care of $65 million. The decline in net sales in Personal Care was2021, primarily due to lower volume in most product categories from competitive pressures ($48 million)Surface Protection and overwrap films. Sales volume and net sales declined 15% and 23%, including a large portionrespectively, in Surface Protection. Sales volume and net sales declined 19% and 4%, respectively, in overwrap films, with volume declines partially offset by the pricing impact associated with the customer product transition discussed below. In addition, net sales in Personal Care were adversely impacted by pricing, mix and the decline in the valuepass-through of currencies for operations outside of the U.S. relative to the U.S. Dollar.resin costs.
EBITDA from ongoing operations in 20192022 decreased by $13.3$15.7 million versus 20182021 primarily due to:
•A $6.8$14.6 million increasedecrease from Surface Protection primarily due to higher selling pricesas a result of:
◦Lower contribution for: non-transitioning products associated with a market slowdown and customer inventory corrections ($6.07.3 million), competitive pricing ($5.5 million), quality claims in 2018 that did not recur in 2019lower productivity ($1.20.6 million), production efficiencies and previously disclosed customer product transitions ($1.4 million), and favorable raw material costs ($1.96.6 million), partially offset by unfavorable mix (net impactlower SG&A and research and development expenses ($1.4 million);
◦The pass-through lag associated with resin costs (a benefit of $2.0 million)$0.5 million in 2022 versus a charge of $2.2 million in 2021);
◦A foreign currency transaction gain of $0.8 million in 2022 versus a loss of $0.2 million in 2021; and higher fixed manufacturing and general and administrative costs ($1.5 million); and
◦Inventories accounted for under the LIFO method resulted in a charge of $0.1 million in 2022 versus a charge of $0.6 million in 2021.
•A $19.6$1.1 million decrease from Personal Care,overwrap films primarily due to lower volume and unfavorable mix ($19.31.9 million), unfavorable pricing ($4.8 million), and production inefficiencies ($3.8 million), partially offset by. The pass-through lag associated with resin costs resulted in a benefit of $0.4 million in 2022 versus a charge of $1.3 million in 2021. In addition, inventories accounted for under the timingLIFO method resulted in the passthrougha charge of changes$0.4 million in resin prices ($2.1 million), lower fixed manufacturing ($4.4 million) and selling, general and administrative costs ($1.8 million).
2022 versus a benefit of $0.5 million in 2021.Customer Product Transitions and Other Factors in Personal Care and Surface Protection
The Company previously disclosed a significant customer product transition for the Personal Care component of PE Films. Annual sales for this product declined from approximately $70 million in 2018 to $30 million in 2019. The Company recently extended an arrangement with this customer that is expected to generate sales of this product at approximately 2019 levels through at least 2022.
Personal Care had approximately break-even EBITDA from ongoing operations in 2019 as competitive pressures resulted in missed sales and margin goals. Personal Care continues to focus on new business development and cost reduction initiatives in an effort to improve profitability.
The Surface Protection component of PE Films supports manufacturers of optical and other specialty substrates used in flat panel display products. These films are primarily used by customers to protect components of displays in the manufacturing and transportation processes and then discarded.
The Company previously reported the risk that a portion of its film products used in surface protection applications willwould be made obsolete by possible future customer product transitions, which principally relate to one customer, to less costly alternative processes or materials. These transitions principally relate to one customer. The full transition continues to encounter delays, resulting in higher than expected sales to this customer in 2019.materials. The Company estimates that during 2020these transitions, which were complete as of the adverse impact onsecond quarter of 2022, resulted in a total decline of $7 million in pre-tax income from continuing operations as reported under GAAP and EBITDA from ongoing operations during 2022 versus 2021.
The Surface Protection business is continuing to experience competitive pricing pressures, unrelated to the customer product transitions, that adversely impacted pre-tax income from this customer shiftcontinuing operations as reported under GAAP and EBITDA from ongoing operations by approximately $5.5 million in 2022 versus 2019 could possibly be $14 million.2021. To offset the potential adverse impact of the customer transitions and pricing pressures, the Company is aggressively pursuing and making progress generating sales fromof new surfacesurface protection products, applications and customers.customers and driving production efficiencies and cost savings.
Projected Capital Expenditures and Depreciation & Amortization
Capital expenditures are projected to be $16$4 million in 2020,2023, including: $1.5 million to complete a scale-up line in Surface Protection to improve development and speed to market for new products; $6$2 million for other development projects;productivity projects and $8$2 million for capital expenditures required to support continuity of current operations. Depreciation expense is projected to be $15$7 million in 2020.2023. There is no amortization expense for PE Films.
Flexible Packaging Films
A summary of operating results for Flexible Packaging Films is provided below:
| | | | | | | | | | | | | | | | | |
| Year Ended | | Favorable/
(Unfavorable)
% Change |
| (In thousands, except percentages) | December 31, | |
| 2022 | | 2021 | |
| Sales volume (lbs) | 106,685 | | | 104,569 | | | 2.0 | % |
| Net sales | $ | 168,139 | | | $ | 139,978 | | | 20.1 | % |
| Ongoing operations: | | | | | |
| EBITDA | $ | 27,452 | | | $ | 31,684 | | | (13.4) | % |
| Depreciation & amortization | (2,444) | | | (1,988) | | | (22.9) | % |
| EBIT | $ | 25,008 | | | $ | 29,696 | | | (15.8) | % |
| Capital expenditures | $ | 8,151 | | | $ | 5,603 | | | |
|
| | | | | | | | | | |
| | Year Ended | | Favorable/
(Unfavorable)
% Change |
| (In thousands, except percentages) | December 31, | |
| 2019 | | 2018 | |
| Sales volume (lbs) | 105,276 |
| | 98,994 |
| | 6.3 | % |
| Net sales | $ | 133,935 |
| | $ | 123,830 |
| | 8.2 | % |
| Ongoing operations: | | | | | |
| EBITDA | $ | 14,737 |
| | $ | 11,154 |
| | 32.1 | % |
| Depreciation & amortization | (1,517 | ) | | (1,262 | ) | | (20.2 | )% |
| EBIT* | $ | 13,220 |
| | $ | 9,892 |
| | 33.6 | % |
| Capital expenditures | $ | 8,866 |
| | $ | 5,423 |
| | |
| * See the table in Item 6 for a reconciliation of this non-GAAP measure to GAAP and additional information. |
Net sales in 20192022 increased versus 201820.1% compared to 2021, primarily due to higher selling prices from the pass-through of higher resin costs, favorable product mix and higher sales volume and increased selling prices. volume.
Terphane’s EBITDA from ongoing operations in 2019 increased2022 decreased by $3.6$4.2 million versus 20182021, primarily due to:
•Higher volumeraw material costs ($2.617.9 million), higher fixed costs ($1.5 million), and higher SG&A expenses ($1.4 million), offset by higher selling prices from the pass-through of higher resin costs ($18.3 million), higher sales volume ($1.1 million), favorable product mix ($1.6 million), partially offset by higher fixed and lower variable costs including costs related to a restarted line ($2.00.1 million);
•Net favorableunfavorable foreign currency translation of Real-denominated operating costs of $0.4 million;($3.7 million) in 2022 versus 2021; and
•Foreign currency transaction losses ($0.2 million) in 2022 compared to foreign currency transaction gains of $1.0 million($0.7 million) in 2019 versus losses of $0.8 million in 2018.
2021.Projected Capital Expenditures and Depreciation & Amortization
Capital expenditures are projected to be $8 million in 2020,2023, including $6$2 million for new capacity for value-added products and productivity projects and $1$6 million for capital expenditures required to support continuity of current operations. Depreciation expense is projected to be $2$3 million in 2020.2023. Amortization expense is projected to be $0.4$0.1 million in 2020.2023.
Corporate Expenses, Investments, Interest and Income TaxesOther
Corporate expenses, net in 2022 decreased by $0.6 million compared 2021, primarily due to lower professional fees associated with business development activities ($1.1 million), employee-related compensation ($0.9 million) and stock-based compensation ($0.6 million), partially offset by increased professional fees associated with the internal and external audits of the Company ($2.2 million).
Interest expense was $5.0 million in 2022 in comparison to $3.4 million in 2021, primarily due to higher interest rates.
Pension expense under GAAP was $9.6$14.4 million in 2019, a favorable2022, an unfavorable change of $0.8$0.5 million from 2018.2021. In February 2022, Tredegar announced the initiation of a process to terminate and settle its frozen defined benefit pension plan. In connection therewith, the Company borrowed funds under its revolving credit agreement and made the Special Contribution to reduce its underfunding and as part of a program within the pension plan to hedge or fix the expected future contributions that will be needed by the Company through the settlement process. The impactsettlement process has been delayed because of longer-than-expected review times with the IRS. The Company does not expect issues with receiving approval from the IRS and is hopeful that the entire process will be completed by the end of 2023. The Company realized income tax benefits on earningsthe Special Contribution of $11 million in 2022. Administrative costs for the pension plan through the settlement process are estimated at $4 to $5 million.
Tredegar’s frozen defined benefit pension plan was underfunded on a GAAP basis (also estimated settlement basis) by $28 million at December 31, 2022, comprised of investments at fair value of $218 million and a PBO of $246 million. The ultimate underfunded amount at settlement may differ from loweramounts existing at the end of 2022, depending on changes in market factors, including for buyers of pension obligations at the time of settlement.
Prior to the Special Contribution, GAAP pension expense is reflected in “Corporate expenses, net” inwas a reasonable proxy for the EBITDA from ongoing operations table in Note 5.Company’s required minimum cash contribution to the pension plan. The Company expects there will be no required minimum cash contributions until final settlement. Pension expense under GAAP is projected to be $14.2approximately $14 million in 2020. Corporate expenses,2023, which is mainly comprised of non-cash amortization of deferred net increased in 2019 versus 2018 primarily due to higher stock-based employee compensation ($1.7 million), and consulting fees ($4.1 million) related to the identification and remediation of previously disclosed material weaknessesactuarial losses reflected in the Company’s internal control over financial reporting, business development activities,shareholders’ equity as accumulated other comprehensive losses. Beginning in 2022, and implementation of new accounting guidance.
Interestconsistent with no expected required minimum cash contributions, no pension expense decreased to $4.1 millionis included in 2019 from $5.7 million in 2018, primarily due to lower average debt levels.
During 2019, the Company recognized consolidated income tax expense of $9.9 million based on pretax income of $58.2 million. During 2018, the Company recognized consolidated income tax expense of $11.5 million based on pretax income of $36.4 million. Information on the differences between the effective tax rate for incomecalculating earnings before interest, taxes, depreciation and the U.S. federal statutory rate for 2019 and 2018 are further detailedamortization as defined in the effective income tax rate reconciliation provided in Note 16.Company’s revolving credit agreement (“Credit EBITDA”).
Total debt was $42.0 million at December 31, 2019, compared to $101.5 million at December 31, 2018. Net debt (debt in excess of cash and cash equivalents) was $10.6 million at December 31, 2019, compared to $67.1 million at December 31, 2018. Net debt is calculated as follows:
|
| | | | | | | | |
| (In millions) | | December 31, 2019 | | December 31, 2018 |
| Debt | | $ | 42.0 |
| | $ | 101.5 |
|
| Less: Cash and cash equivalents | | 31.4 |
| | 34.4 |
|
| Net debt | | $ | 10.6 |
| | $ | 67.1 |
|
Net debt, a financial measure that is not calculated or presented in accordance with GAAP, is not intended to represent debt as defined by GAAP, but is utilized by management in evaluating financial leverage and equity valuation. The Company believes that investors also may find net debt helpful for the same purposes. Consolidated net capitalization and other credit measures are provided in the Financial Condition sectionLiquidity and Capital Resources, below.
Critical Accounting Policies
In the ordinary course of business, the Company makes a number of estimatesLiquidity and assumptions relating to the reporting of results of operations and financial position in the preparation of financial statements in conformity with GAAP. Actual results could differ significantly from those estimates under different assumptions and conditions. The Company believes the following discussion addresses its critical accounting policies. These policies require management to exercise judgments that are often difficult, subjective and complex due to the necessity of estimating the effect of matters that are inherently uncertain.
Impairment and Useful Lives of Long-lived Identifiable Assets and GoodwillCapital Resources
The Company assesses its long-lived identifiable assets for impairment when events or circumstances indicate that their carrying value may not be recoverable from future cash flows. Any necessary impairment chargescontinuously focuses on working capital management. Measures such as days sales outstanding (“DSO”), days inventory outstanding (“DIO”) and days payables outstanding (“DPO”) are recorded when the Company does not believe the carrying value of the long-lived asset(s) will be recoverable. Tredegar also reassesses the useful lives of its long-lived assets based onused to evaluate changes in the businessworking capital. Changes in operating assets and technologies.
The Company assesses goodwill for impairment when events or circumstances indicate that the carrying value may not be recoverable, or, at a minimum, on an annual basis (December 1st of each year). When assessing goodwill for impairment, accounting guidance allows the Company to first perform a qualitative assessment about the likelihood of the carrying value of a reporting unit exceeding its fair value, referred to as the Step 0 assessment. The Step 0 assessment requires the evaluation of certain qualitative factors, including macroeconomic conditions, industry and market considerations, cost factors and overall financial performance, as well as company and reporting unit factors. If the Company's Step 0 analysis indicates that it is more likely than not that the fair value of a reporting unit is less than the carrying amount, then the Company would perform a quantitative impairment test.
As ofliabilities from continuing operations from December 31, 2019,2021 to December 31, 2022 are summarized below. Cash flows for discontinued operations have not been separately disclosed in the Company appliedconsolidated statements of cash flows.
•Accounts and other receivables decreased $18.8 million or 18.2%.
◦Accounts and other receivables in Aluminum Extrusions decreased by $10.4 million primarily due to lower sales volume and the Step 0 assessmentpass-through of lower metal costs, partially offset by an increase in average selling prices to itscover higher operating costs in the fourth quarter of 2022 versus 2021. DSO (computed using trailing 12 months net sales and a rolling 12-month average of accounts and other receivables balances) was approximately 48.7 days in 2022 and 47.6 days in 2021.
◦Accounts and other receivables in PE Films’Films decreased by $6.5 million primarily due to lower sales volume in both Surface Protection reporting unit and Aluminum Extrusions’ reporting units createdoverwrap films, partially offset by increased overwrap films sales as a result of acquisitionsthe pricing impact associated with the pass-through of higher resin costs. DSO was approximately 30.3 days in 2012 (“AACOA”)2022 and 28.5 days in 2017 (“Futura”), each2021.
◦Accounts and other receivables in Flexible Packaging Films decreased by $1.7 million primarily due to lower sales volume in the fourth quarter of which had fair values significantly2022 versus 2021. DSO was approximately 41.1 days in excess2022 and 40.0 days in 2021.
•Inventories increased $39.2 million or 44.3%.
◦Inventories in Aluminum Extrusions increased by $16.8 million primarily due to increased raw material levels due to lower than anticipated customer orders, order cancellations as customers report high inventory levels, and increased aluminum supplier costs. DIO (computed using trailing 12 months costs of their carrying amounts when last tested usinggoods sold calculated on a FIFO basis and a rolling 12-month average of inventory balances calculated on the quantitative impairment test.FIFO basis) was approximately 53.6 days in 2022 and 41.4 days in 2021.
◦Inventories in PE Films has remained consistent with prior year. The Company's Step 0 analysisDIO of approximately 62.8 days in 2019 of2021 increased to 66.8 days in 2022 primarily due to the reporting units concluded that it is not more likely than not that the fair value of the reporting unit is less than its carrying amount. Therefore, the quantitative goodwill impairment test for these reporting units was not necessary in 2019.
Goodwillweak market demand for Surface Protection, AACOAProtection’s products.
◦Inventories in Flexible Packaging Films increased by $22.5 million primarily due to the impact of higher average resin prices on raw materials, higher planned finished good levels and Futura totaled $57.3 million, $13.7 million and $10.4 million, respectively, at December 31, 2019.
In assessing the recoverability of goodwill and long-lived identifiable assets,impact from the Company primarily estimates fair value using discounted cash flow analysis and comparative enterprise value-to-EBITDA multiples. These calculations require management to make assumptions regarding estimated future cash flows, discount rates and other factors to determine if an impairment exists. If these estimates or their related assumptions change in the future,U.S. dollar value of currencies related to operations outside of the Company may be requiredU.S. DIO was approximately 108.0 days in 2022 and 93.1 days in 2021.
•Net property, plant and equipment increased by $16.0 million or 9.4% primarily due to record additional impairment charges.capital expenditures of $40.1 million, partially offset by depreciation expense of $23.9 million.
All goodwill•Identifiable intangible assets, net decreased by $2.5 million or 17.7% primarily due to amortization expense.
•Deferred income tax assets decreased $1.8 million or 11.6% primarily due to changes in other comprehensive income and the projected utilization for foreign tax credits, partially offset by the change in deferred tax liability as a result of the implementation of new U.S. tax regulations associated with foreign tax credits published by the U.S. Treasury and IRS on January 4, 2022. See Note 12 “Income Taxes” to the Consolidated Financial Statements in Item 15 for additional information.
•Accounts payable decreased by $8.8 million or 7.1%.
◦Accounts payable in Aluminum Extrusions decreased by $11.3 million, primarily due to lower raw material purchases due to higher than anticipated on-hand inventory quantities, partially offset by favorable payment terms with certain vendors. DPO (computed using trailing 12 months costs of goods sold calculated on a FIFO basis and a rolling 12-month average of accounts payable balances) was approximately 64.2 days in 2022 and 60.1 days in 2021.
◦Accounts payable in PE Films’ Personal Care operating unit,Films decreased by $3.7 million primarily due to lower raw material purchases. DPO was approximately 51.0 days in the amount of $46.8 million ($38.2 million after deferred income tax benefits), was impaired2022 and 44.0 days in the third quarter of 2018. The goodwill impairment charge was recognized upon the completion of an asset recoverability test and impairment analysis performed as of September 30, 2018. This non-operating, non-cash charge, as computed under GAAP, resulted from the expectation of a significant customer transition. The2021.
Company performed an asset recoverability test and impairment analysis using projections under various business planning scenarios and concluded that the fair value of the Personal Care reporting unit was less than its carrying value.
In 2017,◦Accounts payable in Flexible Packaging Films recorded a charge for the impairment of assets in the amount of $101 million. As part of this write-down, trade names, customer relationships and proprietary technology were impairedincreased by $4.0$5.6 million, $9.4 million and $4.1 million, respectively; the remaining part of the write-down wasprimarily due to higher resin costs related to property, plantraw material purchases in 2022 and equipment.favorable payment terms with certain vendors. DPO was approximately 72.4 days in 2022 and 68.2 days in 2021.
Investment Accounted for Under the Fair Value Method
In August 2007 and December 2008, Tredegar made an aggregate investment of $7.5Net cash used in operating activities was $20.8 million in kaléo (formerly Intelliject, Inc.), a privately held specialty pharmaceutical company. This investment2022 compared to net cash provided by operating activities of $70.6 million in 2021. The change in operating activities is accounted for under the fair value method. At the time of the initial investment, the Company elected the fair value option of accounting since its investment objectives were similar to those of venture capitalists, which typically do not have controlling financial interests (venture capital funds generally use the fair value option to account for their investment portfolios). At December 31, 2019, Tredegar’s ownership interest was approximately 18% on a fully diluted basis.
The Company considers its investment in kaléo to be a Level 3 investment under the hierarchy described in GAAP. The Company discloses the level of its investments within the fair value hierarchy in which fair value measurements in their entirety fall, segregating fair value measurements using quoted prices in active markets for identical assets or liabilities (Level 1), significant other observable inputs (Level 2), and significant unobservable inputs (Level 3). The Company believes that its fair value estimates will continue to be based upon Level 3 inputs since there is no secondary market for Tredegar’s ownership. See Note 4 for more information on valuation methods used. Adjustmentsprimarily due to the estimated fair valueSpecial Contribution ($50 million), higher income taxes paid during 2022 and higher working capital due to factors discussed earlier in this section relating to accounts and other receivables, inventories and accounts payable.
Net cash used in investing activities was $35.5 million in 2022 compared to net cash provided by investing activities of this investment will be made$24.5 million in 2021. The change in investing activities is primarily due to higher capital expenditure spending ($9.5 million), cash proceeds received in 2021 in connection with the period in which such changes can be quantified.
At December 31, 2019 and 2018, the fair valuesale of the Company’s investment in kaléo (also($47.1 million) and the carrying value, whichsale of the Lake Zurich manufacturing facility assets in 2021 ($4.7 million).
Net cash provided by financing activities was $45.4 million in 2022 compared to net cash used in financing activities of $76.8 million in 2021. The change in financing activities is separately statedprimarily due to higher net borrowings ($125.0 million) under the Credit Agreement (as defined below) to fund the $50 million Special Contribution to the pension plan and working capital, higher deferred financing costs ($1.2 million) associated with the refinancing of the Credit Agreement in June 2022, repurchases of employee common stock for tax withholdings of $0.4 million in 2022, and $0.9 million of proceeds from the exercise of stock options in the consolidated balance sheets) was estimated at $95.5 millionfirst nine months of 2021.
The Company believes that existing borrowing availability, current cash balances and $84.6 million, respectively. The ultimate value of the Company’s ownership interest in kaléocash flow from operations will be determinedsufficient to satisfy short term material cash requirements related to working capital, capital expenditure, debt repayments and realized only ifdividend requirements for at least the next twelve months. In the longer term, liquidity will depend on many factors, including results of operations, the timing and when a liquidity event occurs, and the ultimate value could be materially different from the $95.5 million estimated fair value reflected in the Company’s financial statements at December 31, 2019.
Pension Benefits
Tredegar sponsors noncontributory defined benefit (pension) plans in its continuing operations that have resulted in varying amountsextent of net pension income or expense, as developed from actuarial valuations. Inherent in these valuations are key assumptions including discount rates, expected return on plan assets and rate of future compensation increases. The Company is required to consider current market conditions, includingcapital expenditures, changes in interest rates and plan asset investment returns, in determining these assumptions. Actuarial assumptions may differ materially from actual results dueoperating plans, or other events that would cause the Company to changing market and economic conditions, higher or lower withdrawal rates or longer or shorter life spans of participants. These differences may result in a significant impact to the amount of net pension income or expense recordedseek additional financing in future periods.
At December 31, 2022, Tredegar had cash and cash equivalents of $19.2 million, including funds held in locations outside the U.S. of $10.3 million.
On June 29, 2022, Tredegar entered into a Second Amended and Restated Credit Agreement (“Credit Agreement”) that replaced its existing $375 million five-year, secured revolving credit facility that was due to expire on June 28, 2024. The discountCredit Agreement is a five-year, revolving, secured credit facility that permits aggregate borrowings of $375 million and matures on June 29, 2027.
Net capitalization and indebtedness as defined under the Credit Agreement as of December 31, 2022 were as follows:
| | | | | |
| Net Capitalization and Indebtedness as of December 31, 2022 |
| (In thousands) |
| Net capitalization: | |
| Cash and cash equivalents | $ | 19,232 | |
| Debt: | |
| Credit Agreement | 137,000 | |
| Debt, net of cash and cash equivalents | 117,768 | |
| Shareholders’ equity | 201,762 | |
| Net capitalization | $ | 319,530 | |
| Indebtedness as defined in Credit Agreement: | |
| Total debt | $ | 137,000 | |
| Indebtedness | $ | 137,000 | |
Borrowings under the Credit Agreement bear an interest rate is usedequal to determineSecured Overnight Financing Rate ("SOFR") plus a credit spread adjustment of 10 basis points ("Adjusted Term SOFR Rate") and an amount depending on the present valuetype of future payments. The discountborrowing and commitment fees charged on the unused amount under the Credit Agreement at various Total Net Leverage Ratio levels as follows: | | | | | | | | |
| Pricing Under the Credit Agreement (Basis Points) |
| Total Net Leverage Ratio | Term Benchmark Spread | Commitment
Fee |
| <= 1.0x | 150.0 | | 20 | |
| >1.0x but <=2.0x | 162.5 | | 25 | |
| >2.0x but <=3.0x | 175.0 | | 30 | |
| >3.0x but <=3.5x | 187.5 | | 35 | |
| >3.5x | 200.0 | | 40 | |
At December 31, 2022, $137.0 million of the outstanding debt was principally priced at an interest rate is the single rate that, when applied to expected benefit payments, provides a present value equal to the present valueAdjusted Term SOFR Rate plus the applicable credit spread of expected benefit162.5 basis points. Prior to the Credit Agreement, the interest rate on borrowings was based on LIBOR plus an applicable credit spread.
The primary restrictive covenants in the Credit Agreement include:
•Total Net Leverage Ratio of 4.00x;
•Interest Coverage Ratio of 3.00x; and
•Unlimited payments determined by usingfor dividends and stock repurchases during the AA-rated bond yield curve. In general,term of the pension liability increasesCredit Agreement so long as the discount rate decreasesTotal Net Leverage Ratio is equal to or less than 2.00x, and vice versa. The weighted average discount rate utilized was 3.27%, 4.40%otherwise restrictions on payments for dividends and 3.72%stock repurchases for the term of the Credit Agreement at $75 million (provided that the $75 million basket will reset at the end of 2019, 2018each fiscal quarter when the Total Net Leverage ratio is less than or equal to 2.00x).
Under the Credit Agreement:
•Total Net Leverage Ratio is defined as the ratio of (a)(i) total indebtedness minus (ii) liquidity (the lesser of $50,000,000 and 2017, respectively, with changes between periods duethe aggregate amount of cash and cash equivalents) to changes in market(b) Credit EBITDA; and
•Interest Coverage Ratio is defined as the ratio of Credit EBITDA to interest rates. Pay for active participantsexpense.
The Credit Agreement is secured by substantially all assets of the planCompany and its domestic subsidiaries, including equity in certain material first-tier foreign subsidiaries. At December 31, 2022, based upon the most restrictive covenant within the Credit Agreement, available credit under the Credit Agreement was frozenapproximately $201 million. Total debt outstanding was $137.0 million and $73.0 million as of December 31, 2007. 2022 and 2021, respectively.
Credit EBITDA is not intended to represent net income (loss) or cash flow from operations as defined by GAAP and should not be considered as an alternative to either net income (loss) or to cash flow. The computations of Credit EBITDA, the Total Net Leverage Ratio and Interest Coverage Ratio as defined in the Credit Agreement are presented below.
| | | | | |
| Computations of Credit EBITDA, Total Net Leverage Ratio and Interest Coverage Ratio (in each case, as Defined in the Credit Agreement) Along with Related Primary Restrictive Covenants as of and for the Twelve Months Ended December 31, 2022 |
| Computations of Credit EBITDA for the twelve months ended December 31, 2022 (in thousands): |
| Net income (loss) | $ | 28,455 | |
| Plus: | |
| After-tax losses related to discontinued operations | — | |
| Total income tax expense for continuing operations | 4,389 | |
| Interest expense | 4,990 | |
| Depreciation and amortization expense for continuing operations | 26,403 | |
| All non-cash losses and expenses, plus cash losses and expenses not to exceed $10,000, for continuing operations that are classified as unusual, extraordinary or which are related to plant shutdowns, asset impairments and/or restructurings (cash-related of $5,898) | 5,924 | |
| Charges related to stock option grants and awards accounted for under the fair value-based method | 1,424 | |
| Losses related to the application of the equity method of accounting | — | |
| Losses related to adjustments in the estimated fair value of assets accounted for under the fair value method of accounting | — | |
| Minus: | |
| After-tax income related to discontinued operations | (74) | |
| Total income tax benefits for continuing operations | — | |
| Interest income | (57) | |
| All non-cash gains and income, plus cash gains and income in excess of $10,000, for continuing operations that are classified as unusual, extraordinary or which are related to plant shutdowns, asset impairments and/or restructurings | — | |
| Income related to changes in estimates for stock option grants and awards accounted for under the fair value-based method | — | |
| Income related to the application of the equity method of accounting | — | |
| Income related to adjustments in the estimated fair value of assets accounted for under the fair value method of accounting | (1,406) | |
| Plus cash dividends declared on investments in an amount not to exceed $10,000 for such period | — | |
| Plus or minus, as applicable, pro forma EBITDA adjustments associated with acquisitions and asset dispositions | — | |
| Plus or minus, as applicable, pro forma EBITDA adjustments to pension expense associated with the early payment of pension obligations | 14,400 | |
| Credit EBITDA | $ | 84,448 | |
| Computations of leverage and interest coverage ratios as defined in Credit Agreement at December 31, 2022: |
| Total Net Leverage Ratio | 1.39x |
| Interest Coverage Ratio | 16.92x |
| Most restrictive covenants as defined in Credit Agreement: | |
| Unlimited payments for dividends and stock repurchases during the term of the Credit Agreement so long as the Total Net Leverage Ratio is equal to or less than 2.00x, and otherwise restrictions on payments for dividends and stock repurchases for the term of the Credit Agreement at $75 million | $ | — | |
| Maximum Total Net Leverage Ratio permitted | 4.00x |
| Minimum Interest Coverage Ratio permitted | 3.00x |
Tredegar was in compliance with all of its debt covenants as of December 31, 2022. Noncompliance with any of the debt covenants may have a material adverse effect on its financial condition or liquidity, in the event such noncompliance cannot be cured or should the Company be unable to obtain a waiver from the lenders. Renegotiation of the covenant through an amendment to the Credit Agreement may effectively cure the noncompliance, but may have an effect on its financial condition or liquidity depending upon how the covenant is renegotiated.
Material Cash Requirements for Known Contractual and Other Obligations
The Company’s material cash requirements from known contractual and other obligations as of December 31, 2022 were as follows:
Long-term debt and interest payments
As of JanuaryDecember 31, 2018,2022, the plan no longer accrued benefitsCompany had outstanding debt of $137.0 million with contractual payments due in June 2027. Estimated future interest payments associated with crediting employeesoutstanding debt total $37.7 million, with $8.4 million payable within the next 12 months.
Pension and other postretirement obligations
In February 2022, Tredegar announced the initiation of a process to terminate and settle its frozen defined benefit pension plan, which could take up to 24 months to complete. In connection therewith, on February 9, 2022, the Company borrowed funds under its revolving credit agreement and contributed a $50 million Special Contribution to the pension plan to reduce its underfunding and as part of a program within the pension plan to hedge or fix the expected future contributions that will be needed by the Company through the settlement process. The Company estimates that, with the Special Contribution, there will be no required minimum contributions to the pension plan until final settlement. Tredegar expects that the final settlement funding will be approximately $28 million but may differ from this expectation based on changes in market factors, including from buyers of pension obligations at the time of settlement.
Tredegar also has a non-qualified supplemental pension plan covering certain employees. Effective December 31, 2005, further participation in this plan was terminated and benefit accruals for service, thereby freezingexisting participants were frozen. The plan was designed to restore all futureor a part of the pension benefits underthat would have been payable to designated participants from the plan.
A lower expected return onprincipal pension plans if it were not for limitations imposed by income tax regulations. The projected benefit obligation relating to this unfunded plan assets increaseswas $1.7 million, of which the amount of expense and vice versa. DecreasesCompany expects to pay $0.2 million in the levelnext 12 months.
In addition to providing pension benefits, the Company provides postretirement life insurance and health care benefits for certain groups of actual plan assets will also serveemployees. As of December 31, 2022, the aggregate benefit obligation for the Company’s other post retirement plans was $5.7 million, of which the Company expects to increasepay $0.5 million in the amount of pension expense. The total return on plan assets (net of feesnext 12 months.
Capital expenditure commitments
See “Projected Capital Expenditures and plan expenses), which is primarily affected by the changeDepreciation & Amortization” within “Segment Operations Overview” above in fair value of plan assets, current year contributions and current year payments to participants, was approximately 11.8% in 2019, negative 5.4% in 2018 and 10.0% in 2017. The expected long-term return on plan assets relating to continuing operations, which is estimated by asset class and generally based on inflation-adjusted historical returns, volatilities, risk premiums and managed asset premiums, was 6.00%, 6.50% and 6.50% in 2019, 2018 and 2017, respectively. The Company anticipates that its expected long-term return on plan assets will be 5.00%this Item 7 for 2020. See Note 13 for more information on expected long-term return on plan assets and asset mix.
See the Executive Summary section above for further discussion regarding the financial impact of the Company’s pension plans.planned investment in capital expenditures in 2023, of which $13.3 million contractual commitments that existed as of December 31, 2022.
Operating Leases
The Company enters into various operating leases primarily for real estate, office equipment and vehicles. See Note 4 “Leases” to the Consolidated Financial Statements in Item 15 for additional information.
Income TaxesUncertain Tax Positions
On a quarterly basis, Tredegar reviews its judgments regarding uncertain tax positions and the likelihood that the benefitsAs of a deferred income tax asset will be realized. As circumstances change, the Company reflects in earnings any adjustments to unrecognized benefits for uncertain tax positions and valuation allowances for deferred income tax assets.
For financial reporting purposes,December 31, 2022, unrecognized tax benefits on uncertain tax positions were $0.9 million, $3.4 million and $2.0 million as of December 31, 2019, 2018 and 2017, respectively.$0.6 million. Tax payments resulting from the successful challenge by the taxing authority on uncertain tax positions taken by Tredegar would possibly result in the payment of interest and penalties. Accordingly, the Company also accrues for possibleestimated interest and penalties of $0.1 million if tax payments were made as a result of a successful challenge by the taxing authority on uncertain tax positions. The balance of accrued interest and penalties on deductions taken relatingDue to uncertain tax positions was $0.1 million, $0.2 million and $0.1 million at December 31, 2019, 2018 and 2017, respectively ($0.1 million, $0.2 million and $0.1 million, respectively, net of corresponding U.S. federal and state income tax benefits). Accruals for possible interest and penalties on uncertain tax positions are reflecteduncertainties in income tax expense for financial reporting purposes.
Tredegar, or one of its subsidiaries, files income tax returns in the U.S. federal jurisdiction, various states and jurisdictions outside the U.S. With few exceptions, Tredegar is no longer subject to U.S. federal, state or non-U.S. income tax examinations by tax authorities for years before 2016.
As of December 31, 2019 and 2018, valuation allowances relating to deferred income tax assets were $5.1 million and $24.7 million, respectively. For more information on deferred income tax assets and liabilities, see Note 16.
Recently Issued Accounting Standards
Refer to the section Recently Issued Accounting Standards in Note 1 for information concerning the effect of recently issued accounting pronouncements.
Results of Operations
2019 versus 2018
Revenues. Sales in 2019 decreased by 8.7% compared with 2018 due to lower sales in both Aluminum Extrusions and PE Films. Net sales decreased 7.6% in Aluminum Extrusions primarily due to lower sales volume and the passthrough of lower metal costs, partially offset by an increase in average selling prices to cover higher operating costs. Net sales decreased 18.0% in PE Films primarily due to lower volume in most product categories in Personal Care from competitive pressures. Net sales increased in Flexible Packaging Films by 8.2% primarily due to higher sales volume and increased selling prices. For more information on changes in net sales and volume, see the Executive Summary section above.
Operating Costs and Expenses. Consolidated gross profit margin (sales minus cost of goods sold and freight as a percentage of sales) was 17.4% in 2019 versus 16.9% in 2018. The gross profit margin in Aluminum Extrusions increased primarily as a result of higher selling prices. The gross profit margins in PE Films and Flexible Packaging Films were essentially unchanged from 2018 to 2019.
For more information on changes in operating costs and expenses, see the Executive Summary section above.
Selling, General and Administrative. As a percentage of sales, selling, general and administrative and R&D expenses were 11.7% in 2019, which increased from 9.8% in 2018. The increase in selling, general and administrative and R&D expenses as a percentage of sales can be primarily attributed to lower sales for Aluminum Extrusions and PE Films. Increased spending was due to higher stock-based compensation and consulting fees due to remediation activities and other costs relating to the Company’s material weaknesses in internal control over financial reporting, business development activities, and implementation of new accounting guidance.
Plant shutdowns, asset impairments, restructurings and other. Pre-tax losses associated with plant shutdowns, asset impairments, restructurings and other items in 2019 as detailed below are shown in the EBITDA from ongoing operations table in Note 5 and are included in “Asset impairments and costs associated with exit and disposal activities, net of adjustments” in the consolidated statements of income, unless otherwise noted. A discussion of unrealized gains and losses on investments can also be found in Note 4 and additional information on restructuring costs can be found in Note 17.
|
| | | | | | | | | | | | | | | | | | |
| ($ in millions) | Q1 |
| Q2 |
| Q3 |
| Q4 |
| | 2019 |
| Aluminum Extrusions: | | | | | | |
| (Gains) losses from sale of assets, investment writedowns and other items: | | | | | | |
| | Wind damage to roof of Elkhart, Indiana plant2 | $ | — |
| $ | — |
| $ | 0.3 |
| $ | (0.4 | ) | | $ | (0.1 | ) |
| | Environmental charges at Carthage Tennessee plant1 | — |
| — |
| 0.3 |
| 0.2 |
| | 0.5 |
|
| | | Total for Aluminum Extrusions | $ | — |
| $ | — |
| $ | 0.6 |
| $ | (0.2 | ) | | $ | 0.4 |
|
| | | | | | | | | |
| PE Films: | | | | | | |
| (Gains) losses associated with plant shutdowns, asset impairments and restructurings: | | | | | | |
| | Shanghai plant shutdown: | | | | | | |
| | | Asset-related expenses | $ | 0.2 |
| $ | 0.2 |
| $ | 0.2 |
| $ | 0.1 |
| | $ | 0.7 |
|
| | | Gain from sale of plant3 | — |
| — |
| (6.3 | ) | — |
| | (6.3 | ) |
| | Consolidation of Personal Care manufacturing facilities - U.S. and Europe:4 | | | | | | |
| | | Severance | — |
| 0.1 |
| 0.5 |
| — |
| | 0.6 |
|
| | | Asset impairment | — |
| 0.1 |
| — |
| — |
| | 0.1 |
|
| | | Product qualifications1 | — |
| — |
| 0.1 |
| — |
| | 0.1 |
|
| | Lake Zurich, Illinois plant shutdown and transfer of production to new elastics lines in Terre Haute, Indiana:4 | | | | | | |
| | | Severance | — |
| 0.3 |
| 0.4 |
| 0.2 |
| | 0.9 |
|
| | | Asset impairment | — |
| 0.2 |
| — |
| — |
| | 0.2 |
|
| | | Safety/quality initiative1 | — |
| — |
| 0.1 |
| 0.1 |
| | 0.2 |
|
| | | Accelerated depreciation1 | — |
| 0.3 |
| 0.5 |
| 0.4 |
| | 1.2 |
|
| | | Product qualifications1 | — |
| — |
| 0.1 |
| 0.1 |
| | 0.2 |
|
| | Reserve for inventory impairment - Personal Care's Hungary facility | — |
| — |
| 0.2 |
| — |
| | 0.2 |
|
| | Other restructuring costs - severance | 0.4 |
| 0.1 |
| 0.1 |
| 0.2 |
| | 0.8 |
|
| | Write-off Personal Care production line - Guangzhou, China facility | 0.4 |
| — |
| — |
| — |
| | 0.4 |
|
| Subtotal for PE Films | 1.0 |
| 1.3 |
| (4.1 | ) | 1.1 |
| | (0.7 | ) |
| | | | | | | |
| Losses from sale of assets, investment writedowns and other items: | | | | | | |
| | Estimated excess costs associated with ramp-up of new product offerings and additional expenses related to strategic capacity expansion projects1 | 0.3 |
| 0.2 |
| 0.3 |
| 0.3 |
| | 1.1 |
|
| | | | | | | | | |
| | | Total for PE Films | $ | 1.3 |
| $ | 1.5 |
| $ | (3.8 | ) | $ | 1.4 |
| | $ | 0.4 |
|
| | | | | | | | | |
| Corporate: | | | | | | |
| | Professional fees associated with: internal control over financial reporting; business development activities; and implementation of new accounting guidance2 | $ | 0.9 |
| $ | 2.0 |
| $ | 1.6 |
| $ | 0.8 |
| | $ | 5.3 |
|
| | Accelerated recognition of stock option-based compensation5 | — |
| — |
| — |
| 1.3 |
| | 1.3 |
|
| | Environmental costs not associated with a business unit2 | — |
| — |
| — |
| 0.6 |
| | 0.6 |
|
| | | Total for Corporate | $ | 0.9 |
| $ | 2.0 |
| $ | 1.6 |
| $ | 2.7 |
| | $ | 7.2 |
|
1. Included in “Cost of goods sold” in the consolidated statements of income.
2. Included in “Selling, general and administrative” in the consolidated statements of income.
3. Included in “Other income (expense), net” in the consolidated statements of income.
4. Additional information on costs associated with exit and disposal activities and other details are available in Note 17.
5. Included in “Stock option-based compensation” in the EBITDA from ongoing operations table in Note 5. |
Interest Income and Expense. Interest income, which is included in “Other income (expense), net” in the consolidated statements of income, was $0.3 million in 2019 and $0.4 million in 2018.
Interest expense, which is net of amounts capitalized and included in property, plant and equipment ($0.9 million and $0.3 million capitalized in 2019 and 2018, respectively), was $4.1 million in 2019, compared to $5.7 million for 2018. Average debt outstanding and interest rates were as follows:
|
| | | | | | | |
| (In millions, except percentages) | 2019 | | 2018 |
| Floating-rate debt with interest charged on a rollover | | | |
| basis at one-month LIBOR plus a credit spread: | | | |
| Average outstanding debt balance | $ | 85.0 |
| | $ | 121.3 |
|
| Average interest rate | 4.0 | % | | 3.8 | % |
Identifiable Assets. A summary of identifiable assets for the year ended December 31, 2019 versus 2018 is provided below:
|
| | | | | | | | | | | |
| (In thousands) | Year Ended
December 31, | | |
| | 2019 | | 2018 | | Variance |
| Aluminum Extrusions | $ | 265,027 |
| | $ | 281,372 |
| | $ | (16,345 | ) |
| PE Films | 230,415 |
| | 231,720 |
| | (1,305 | ) |
| Flexible Packaging Films | 74,016 |
| | 58,964 |
| | 15,052 |
|
| Subtotal | 569,458 |
| | 572,056 |
| | (2,598 | ) |
| General corporate | 111,788 |
| | 100,920 |
| | 10,868 |
|
| Cash and cash equivalents | 31,422 |
| | 34,397 |
| | (2,975 | ) |
| Total | $ | 712,668 |
| | $ | 707,373 |
| | $ | 5,295 |
|
Identifiable assets in Aluminum Extrusions decreased at December 31, 2019 from December 31, 2018 primarily due to accelerated trade name amortization, lower accounts receivable balances due to lower sales and the timing of collections and lower inventory balances, partially offset bypotential tax audits, the additiontiming of the right-of-use assets resulting fromresolution of these positions is uncertain. Therefore, the implementationCompany is unable to make a reasonably reliable estimate of the new lease accounting guidance. Identifiable assets in PE Films decreased slightly at December 31, 2019 from December 31, 2018. Identifiable assets in Flexible Packaging Films increased at December 31, 2019 from December 31, 2018 primarily due to current year capital expenditures partially offset by lower inventory balances. Identifiable assets in General corporate increased at December 31, 2019 from December 31, 2018 primarily duetiming of payments beyond 12 months. See Note 12 “Income Taxes” to the increaseConsolidated Financial Statements in the fair value of the Company’s investment in kaléo.Item 15 for additional information.
2018 versus 2017
Revenues. Sales in 2018 increased by 10.8% compared with 2017 due to higher sales in all segments, except PE Films. Net sales increased 22.8% in Aluminum Extrusions primarily due to a full year of sales by Futura (acquired February 15, 2017), higher volume and an increase in average selling prices from the pass-through of higher market-driven raw material costs. Net sales decreased 5.7% in PE Films primarily due to topsheet business lost from competitive pressures in Europe and Asia, including at the Shanghai, China, facility that was recently shut down. Net sales increased in Flexible Packaging Films by 14.3% primarily due to higher sales volume, increased selling prices associated with the pass-through of higher resin costs and increased production capacity from an idle line that was restarted in June 2018. For more information on changes in net sales and volume, see the Segment Analysis below.
Operating Costs and Expenses. Consolidated gross profit margin (sales minus cost of goods sold and freight as a percentage of sales) was 16.9% in 2018 versus 16.7% in 2017. The gross profit margin in Aluminum Extrusions decreased primarily as a result of operating inefficiencies relating to the operation of its Niles, Michigan facility. The gross profit margin in PE Films decreased due to lower volume, as discussed above, unfavorable product mix and increased operating costs, partially offset by the realized cost savings of a restructuring completed in 2017. The gross profit margin in Flexible Packaging Films increased due to significantly lower depreciation and amortization costs in 2018 compared to 2017, resulting from the $101 million non-cash asset impairment charge recognized in the fourth quarter of 2017, higher production primarily from the restart of an idle line in June 2018, and higher overall demand.
For more information on changes in operating costs and expenses, see the Segment Analysis below.
Selling, General and Administrative. As a percentage of sales, selling, general and administrative and R&D expenses were 9.8% in 2018, which decreased from 10.6% in 2017. The decrease in selling, general and administrative and R&D expenses as a percentage of sales can be primarily attributed to higher sales as a result of the acquisition of Futura and the restart of a production line by Flexible Packaging Films, overall higher demand at Aluminum Extrusions and higher selling prices primarily due to the pass-through to customers of higher market-driven raw material costs.
During 2019, the Company changed the presentation of plant shutdowns, asset impairments, restructuring and other. The table below for 2018 has been provided to be consistent with the 2019 presentation.
Plant shutdowns, asset impairments, restructurings and other. Pre-tax losses associated with plant shutdowns, asset impairments, restructurings and other items in 2018 as detailed below are shown in the EBITDA from ongoing operations table in Note 5 and are included in “Asset impairments and costs associated with exit and disposal activities, net of adjustments” in the consolidated statements of income, unless otherwise noted. A discussion of unrealized gains and losses on investments can also be found in Note 4 and additional information on restructuring costs can be found in Note 17.
|
| | | | | | | | | | | | | | | | | | |
| ($ in millions) | Q1 | Q2 | Q3 | Q4 | | 2018 |
| Aluminum Extrusions: | | | | | | |
| Losses associated with plant shutdowns, asset impairments and restructurings: | | | | | | |
| | Other restructuring costs - severance | $ | 0.1 |
| $ | — |
| $ | — |
| $ | — |
| | $ | 0.1 |
|
| | | | | | | | | |
| Losses from sale of assets, investment writedowns and other items: | | | | | | |
| Aluminum Extrusions: | | | | | | |
| | Wind damage to roof of Elkhart, Indiana plant2 | — |
| — |
| 0.1 |
| — |
| | 0.1 |
|
| | Environmental charges at Carthage, Tennessee facility1 | — |
| — |
| 0.2 |
| 0.1 |
| | 0.3 |
|
| Subtotal for Aluminum Extrusions | — |
| — |
| 0.3 |
| 0.1 |
| | 0.4 |
|
| | | Total for Aluminum Extrusions | $ | 0.1 |
| $ | — |
| $ | 0.3 |
| $ | 0.1 |
| | $ | 0.5 |
|
| | | | | | | | | |
| PE Films: | | | | | | |
| (Gains) losses associated with plant shutdowns, asset impairments and restructurings: | | | | | | |
| | Shanghai plant shutdown: | | | | | | |
| | | Asset-related expenses | $ | — |
| $ | — |
| $ | 0.1 |
| $ | 0.3 |
| | $ | 0.4 |
|
| | | Severance & employee-related expenses | — |
| 0.3 |
| 1.1 |
| 0.4 |
| | 1.8 |
|
| | | Severance & employee-related expenses - administrative1 | — |
| 0.1 |
| 0.2 |
| 0.1 |
| | 0.4 |
|
| | | Legal | — |
| 0.1 |
| (0.1 | ) | — |
| | — |
|
| | | Accelerated depreciation1 | — |
| 0.1 |
| 0.4 |
| 0.1 |
| | 0.6 |
|
| | Other restructuring costs - severance | 0.1 |
| — |
| 0.2 |
| 0.3 |
| | 0.6 |
|
| Subtotal for PE Films | 0.1 |
| 0.6 |
| 1.9 |
| 1.2 |
| | 3.7 |
|
| | | | | | | |
| (Gains) losses from sale of assets, investment writedowns and other items: | | | | | | |
| | Estimated excess costs associated with ramp-up of new product offerings and additional expenses related to strategic capacity expansion projects1 | 1.0 |
| 0.6 |
| 0.2 |
| 0.3 |
| | 2.1 |
|
| | Costs related to a fire that occurred at a facility in Rétság, Hungary2 | — |
| — |
| — |
| 0.1 |
| | 0.1 |
|
| | Costs to prepare a market study2 | — |
| — |
| 0.2 |
| — |
| | 0.2 |
|
| | Gain on reversal of contingent liability3 | — |
| — |
| — |
| (0.3 | ) | | (0.3 | ) |
| Subtotal for PE Films | 1.0 |
| 0.6 |
| 0.4 |
| 0.1 |
| | 2.1 |
|
| | | | | | | | | |
| | | Total for PE Films | $ | 1.1 |
| $ | 1.2 |
| $ | 2.3 |
| $ | 1.3 |
| | $ | 5.8 |
|
| | | | | | | | | |
| Corporate: | | | | | | |
| | Professional fees associated with: internal control over financial reporting; and implementation of new accounting guidance2 | $ | 0.3 |
| $ | — |
| $ | 0.2 |
| $ | 0.6 |
| | $ | 1.1 |
|
| | Loss on investment in Harbinger Capital Partners Special Situations Fund, L.P.3 | — |
| 0.2 |
| 0.2 |
| 0.1 |
| | 0.5 |
|
| | Business development projects2 | — |
| — |
| — |
| 0.5 |
| | 0.5 |
|
| | | Total for Corporate | $ | 0.3 |
| $ | 0.2 |
| $ | 0.4 |
| $ | 1.2 |
| | $ | 2.1 |
|
1. Included in “Cost of goods sold” in the consolidated statements of income.
2. Included in “Selling, general and administrative” in the consolidated statements of income.
3. Included in “Other income (expense), net” in the consolidated statements of income. |
Segment Analysis. A summary of operating results for 2018 versus 2017 for each of the Company’s reporting segments is shown below.
Aluminum Extrusions
A summary of operating results for Aluminum Extrusions is provided below:
|
| | | | | | | | | | |
| | | Year Ended | | Favorable/ |
| (In thousands, except percentages) | | December 31, | | (Unfavorable) |
| | 2018 | | 2017 | | % Change |
| Sales volume (lbs)* | | 190,696 |
| | 176,269 |
| | 8.2% |
| Net sales | | $ | 573,126 |
| | $ | 466,833 |
| | 22.8% |
| Ongoing operations: | | | | | | |
| EBITDA | | $ | 65,479 |
| | $ | 58,524 |
| | 11.9% |
| Depreciation & amortization | | (16,866 | ) | | (15,070 | ) | | 11.9% |
| EBIT** | | $ | 48,613 |
| | $ | 43,454 |
| | 11.9% |
| Capital expenditures | | $ | 12,966 |
| | $ | 25,653 |
| | |
* Sales volume for the years ended December 31, 2018 and 2017 excludes sales volume of 33,170 lbs. and 23,166 lbs., respectively, associated with Futura, which was acquired on February 15, 2017. ** See the table in Item 6 for a reconciliation of this non-GAAP measure to GAAP and additional information. |
Net sales in 2018 increased versus 2017 primarily due to higher volume and an increase in average selling prices from the pass-through of higher market-driven raw material costs. Futura contributed $102.5 million of net sales in 2018 versus $71.0 million for the 10½ months owned during 2017. Excluding the impact of Futura, the increase in net sales was the result of higher sales volume ($32.4 million), an increase in average selling prices as noted above ($31.7 million) and improved mix ($10.8 million).
Volume on an organic basis, (which excludes the impact of the Futura acquisition) increased by 8.2% in 2018 versus 2017 due to higher volume in all of Aluminum Extrusion’s primary markets. Overall average capacity utilization during the fourth quarter of 2018 was in excess of 90%.
EBITDA from ongoing operations in 2018 increased by $7.0 million in comparison to 2017. Excluding the favorable impact of owning Futura for a full twelve-month period ($3.8 million) and the benefit for inventories accounted for under the LIFO method in the fourth quarter of 2018 ($2.3 million), EBITDA from ongoing operations increased $0.9 million, primarily due to:
Higher volume ($5.1 million) and favorable mix ($5.8 million), which were offset by higher employee-related costs ($5.2 million), higher supplies and maintenance ($2.3 million), higher freight ($1.7 million), and higher utilities, primarily in the first quarter of 2018 at the Newnan, Georgia facility ($0.9 million).Off-Balance Sheet Arrangements
The Company focused on fixing inefficiencies associated with the new extrusion line at its Niles, Michigan plant and estimatedhas no material off-balance sheet arrangements that EBITDA from ongoing operations in 2018 would have been higher by $3 million if not for these inefficiencies. These inefficiencieshad or are reflected in the higher costs noted above.
PE Films
A summary of operating results for PE Films is provided below:
|
| | | | | | | | | | |
| | | Year Ended | | Favorable/ |
| (In thousands, except percentages) | | December 31, | | (Unfavorable) |
| | 2018 | | 2017 | | % Change |
| Sales volume (lbs) | | 123,583 |
| | 138,999 |
| | (11.1)% |
| Net sales | | $ | 332,488 |
| | $ | 352,459 |
| | (5.7)% |
| Ongoing operations: | | | | | | |
| EBITDA | | $ | 51,058 |
| | $ | 55,889 |
| | (8.6)% |
| Depreciation & amortization | | (14,877 | ) | | (14,343 | ) | | 3.7% |
| EBIT* | | $ | 36,181 |
| | $ | 41,546 |
| | (12.9)% |
| Capital expenditures | | $ | 21,998 |
| | $ | 15,029 |
| | |
| * See the table in Item 6 for a reconciliation of this non-GAAP measure to GAAP and additional information. |
Net sales in 2018 decreased by $20.0 million versus 2017 primarily due to:
The volume decline in Personal Care was primarily relatedreasonably likely to topsheet business lost from competitive pressures in North America, Europe and Asia, including at the Shanghai, China, facility that was shut down in the fourth quarter of 2018. A small portion of the volume decline was associated with the start of a customer product transition. Volume for elastics products in Personal Care increased year-over-year; and
Slightly lower sales in Surface Protection caused by lower volume and the adverse impact of quality claims, partially offset by higher volume-based selling prices.
EBITDA from ongoing operations in 2018 decreased by $4.8 million versus 2017 primarily due to:
Lower contribution to profits from Personal Care, primarily due to lower volume and unfavorable product mix ($9.3 million), partially offset by volume-based higher selling pricing ($2.2 million), lower fixed and selling, general and administrative costs ($1.1 million), the timing of resin cost passthroughs ($0.7 million), productivity improvements ($0.3 million) and net favorable impact from the change in U.S. Dollar value of currencies for operations outside of the U.S. ($0.8 million);
Lower contribution to profits from Surface Protection, primarily due to lower volumes and unfavorable product mix ($4.1 million), the adverse impact of quality claims ($1.3 million), higher fixed and other manufacturing costs ($1.6 million), higher research and development spending and selling, general and administrative costs ($0.4 million) and higher freight costs ($0.5 million), partially offset by volume-based higher selling prices ($4.4 million); and
Realized cost savings associated with the North American consolidation of our PE Films manufacturing facilities completed in 2017 ($2.4 million).
Flexible Packaging Films
A summary of operating results for Flexible Packaging Films is provided below:
|
| | | | | | | | | | |
| | Year Ended | | Favorable/
(Unfavorable)
% Change |
| (In thousands, except percentages) | December 31, | |
| 2018 | | 2017 | |
| Sales volume (lbs) | 98,994 |
| | 89,325 |
| | 10.8 | % |
| Net sales | $ | 123,830 |
| | $ | 108,355 |
| | 14.3 | % |
| Ongoing operations: | | | | | |
| EBITDA | $ | 11,154 |
| | $ | 7,817 |
| | 42.7 | % |
| Depreciation & amortization | (1,262 | ) | | (10,443 | ) | | (87.9 | )% |
| EBIT* | $ | 9,892 |
| | $ | (2,626 | ) | | N/A |
|
| Capital expenditures | $ | 5,423 |
| | $ | 3,619 |
| | |
| * See the table in Item 6 for a reconciliation of this non-GAAP measure to GAAP and additional information. |
Net sales in 2018 increased versus 2017 primarily due to higher sales volume and increased selling prices associated with the pass-through of higher resin costs. The higher sales volume was supported by increased production capacity for Brazilian operations resulting from the re-start in June 2018 of a previously idled production line.
Terphane had EBITDA from ongoing operations in 2018 of $11.2 million versus $7.8 million in 2017. The resulting favorable change of $3.3 million for the period was primarily due to:
A benefit from higher volume ($5.5 million) and favorable tax incentives ($1.3 million), partially offset by the unfavorable impact of mix and higher resin costs, net of higher selling prices ($2.2 million);
Higher fixed and other manufacturing costs and selling, general and administrative costs, primarily related to higher volume ($2.0 million);
Favorable foreign currency translation of Real-denominated operating costs ($3.2 million), which was offset by a $1.7 million loss on foreign currency forward contracts that partially hedged Real-denominated operating costs; and
Unfavorable net foreign currency transaction impact ($0.6 million) resulting from foreign currency transaction losses of $0.8 million in 2018 and losses of $0.2 million in 2017.
Depreciation and amortization expense in 2018 was significantly lower than 2017 due to the non-cash write-down of Terphane’s long-lived assets during the fourth quarter of 2017.
***
During 2019, the Company changed the presentation of plant shutdowns, asset impairments, restructuring and other. The table below for 2017 has been provided to be consistent with the 2019 presentation.
Plant shutdowns, asset impairments, restructurings and other. Pre-tax losses associated with plant shutdowns, asset impairments, restructurings and other items 2017 as detailed below are shown in the EBITDA from ongoing operations table in Note 5 and are included in “Asset impairments and costs associated with exit and disposal activities, net of adjustments” in the consolidated statements of income, unless otherwise noted. A discussion of unrealized gains and losses on investments can also be found in Note 4 and additional information on restructuring costs can be found in Note 17.
|
| | | | | | | | | | | | | | | | | | | |
| ($ in millions) | Q1 | Q2 | Q3 | Q4 | | 2017 |
| Aluminum Extrusions: | | | | | | |
| Losses associated with plant shutdowns, asset impairments and restructurings: | | | | | | |
| | Other restructuring costs - severance | $ | — |
| $ | — |
| $ | — |
| $ | 0.1 |
| | $ | 0.1 |
|
| | Kentland shutdown - settlement of claims and other costs | — |
| — |
| 0.2 |
| — |
| | 0.2 |
|
| | | Total | — |
| — |
| 0.2 |
| 0.1 |
| | 0.3 |
|
| | | | | | | | | |
| (Gains) losses from sale of assets, investment writedowns and other items: | | | | | | |
| Aluminum Extrusions: | | | | | | |
| | Estimated excess costs associated with ramp-up of new product offerings and additional expenses related to strategic capacity expansion projects1 | 0.3 |
| 0.1 |
| 0.1 |
| — |
| | 0.5 |
|
| | (Gains) losses related to the explosion at the Newnan, Georgia facility in June 2016: | | | | | | |
| | | Gain on involuntary conversion of damaged plant3 | — |
| — |
| — |
| (5.3 | ) | | (5.3 | ) |
| | | Other excess production costs and adjustments1 | 0.3 |
| (0.9 | ) | — |
| 0.2 |
| | (0.4 | ) |
| | | Non-reimbursable legal and consulting fees2 | 0.1 |
| — |
| — |
| — |
| | 0.1 |
|
| | (Gains) losses related to the acquisition and integration of Futura: | | | | | | |
| | | Fair valuation of earnout provision3 | — |
| (0.7 | ) | — |
| — |
| | (0.7 | ) |
| | | Acquisition costs2 | 1.5 |
| — |
| — |
| — |
| | 1.5 |
|
| | | Integration costs2 | 0.1 |
| — |
| — |
| — |
| | 0.1 |
|
| | | Accounting adjustments upon inventory revaluation1 | 1.7 |
| — |
| — |
| — |
| | 1.7 |
|
| | Environmental charges Newnan, Georgia and Carthage, Tennessee plants1 | 0.4 |
| — |
| — |
| 1.5 |
| | 1.9 |
|
| Subtotal for Aluminum Extrusions | 4.4 |
| (1.5 | ) | 0.1 |
| (3.6 | ) | | (0.6 | ) |
| | | Total for Aluminum Extrusions | $ | 4.4 |
| $ | (1.5 | ) | $ | 0.3 |
| $ | (3.5 | ) | | $ | (0.3 | ) |
| | | | | | | | | |
| PE Films: | | | | | | |
| (Gains) losses associated with plant shutdowns, asset impairments and restructurings: | | | | | | |
| | Lake Zurich plant downsizing and restructuring: | | | | | | |
| | | Severance & employee-related expenses | $ | 0.2 |
| $ | (0.3 | ) | $ | — |
| $ | — |
| | $ | (0.1 | ) |
| | | Accelerated depreciation1 | 0.2 |
| 0.1 |
| — |
| — |
| | 0.3 |
|
| | | Other exit & disposal costs | 0.1 |
| — |
| — |
| — |
| | 0.1 |
|
| | | Other costs related to the downsizing1 | 0.2 |
| 0.2 |
| 0.1 |
| — |
| | 0.5 |
|
| | Other restructuring costs - severance | — |
| — |
| 0.1 |
| 0.1 |
| | 0.2 |
|
| | Asset impairments at the Hungary production facility | — |
| — |
| — |
| 0.3 |
| | 0.3 |
|
| Subtotal for PE Films | 0.7 |
| — |
| 0.2 |
| 0.4 |
| | 1.3 |
|
| | | | | | | |
| Losses from sale of assets, investment writedowns and other items: | | | | | | |
| | Estimated excess costs associated with ramp-up of new product offerings and additional expenses related to strategic capacity expansion projects1 | 1.5 |
| 0.9 |
| 0.6 |
| 0.6 |
| | 3.6 |
|
| | | | | | | | | |
| | | Total for PE Films | $ | 2.2 |
| $ | 0.9 |
| $ | 0.8 |
| $ | 1.0 |
| | $ | 4.9 |
|
| | | | | | | | | |
| Flexible Packaging: | | | | | | |
| (Gains) losses from sale of assets, investment writedowns and other items: | | | | | | |
| | Impairment of assets | $ | — |
| $ | — |
| $ | — |
| $ | 101.3 |
| | $ | 101.3 |
|
| | Terphane acquisition escrow payout gain3 | — |
| (11.9 | ) | — |
| — |
| | (11.9 | ) |
| Subtotal for Flexible Packaging | $ | — |
| $ | (11.9 | ) | $ | — |
| $ | 101.3 |
| | $ | 89.4 |
|
| | | | | | | | | |
|
| | | | | | | | | | | | | | | | | | | |
| Corporate: | | | | | | |
| | Severance | 0.3 |
| — |
| — |
| 0.1 |
| | $ | 0.4 |
|
| | Professional fees associated with: Terphane’s Limitada worthless stock deduction; and the impairment of assets of Flexible Packaging Films2 | — |
| — |
| — |
| 0.4 |
| 0.4 |
| $ | 0.4 |
|
| | Business development projects2 | 0.3 |
| 0.6 |
| 0.2 |
| 1.3 |
| 1.8 |
| $ | 2.4 |
|
| | Environmental costs not associated with a business unit2 | — |
| — |
| — |
| 0.8 |
| 0.8 |
| $ | 0.8 |
|
| | | Total for Corporate | $ | 0.6 |
| $ | 0.6 |
| $ | 0.2 |
| $ | 2.6 |
| | $ | 4.0 |
|
1. Included in “Cost of goods sold” in the consolidated statements of income.
2. Included in “Selling, general and administrative” in the consolidated statements of income.
3. Included in “Other income (expense), net” in the consolidated statements of income. |
Financial Condition
Assets and Liabilities
Tredegar’s management continues to focus on working capital management. Measures such as days sales outstanding (“DSO”), days inventory outstanding (“DIO”) and days payables outstanding (“DPO”) are used by the Company to evaluate changes in working capital. Significant changes in assets and liabilities from December 31, 2018 to December 31, 2019 are summarized below:
Accounts and other receivables decreased $17.2 million (13.8%).
Accounts and other receivables in Aluminum Extrusions decreased by $11.6 million primarily due to lower sales. DSO (computed using trailing 12 months net sales and a rolling 12-month average of accounts and other receivables balances) was approximately 48.5 days in 2019 and 44.6 days in 2018.
Accounts and other receivables in PE Films decreased by $7.0 million due mainly to lower net sales for Personal Care products. DSO was approximately 44.0 days in 2019 and 43.2 days in 2018.
Accounts and other receivables in Flexible Packaging Films increased by $1.5 million primarily due to higher sales. DSO was approximately 37.7 days in 2019 and 43.7 days in 2018.
Inventories decreased $12.4 million (13.3%).
Inventories in Aluminum Extrusions decreased by $5.4 million primarily due to a decrease in raw material prices and reduced purchases of inventory in light of lower sales. DIO (computed using trailing 12 months costs of goods sold calculated on a first in, first out basis and a rolling 12-month average of inventory balances calculated on the first-in, first-out basis) was approximately 38.6 days in 2019 and 33.5 days in 2018.
Inventories in PE Films decreased by $2.1 million primarily due to lower sales and the timing of raw material purchases. DIO was approximately 55.7 days in 2019 and 54.9 days in 2018.
Inventories in Flexible Packaging Films decreased by $5.0 million primarily due to a reduction of finished goods on hand and an overall reduction in raw material levels. DIO was approximately 94.3 days in 2019 and 77.9 days in 2018.
Net property, plant and equipment increased by $14.5 million (6.4%) primarily due to capital expenditures of $50.9 million, offset by depreciation of $30.7 million and the disposal of fixed assets ($2.1 million decrease).
Identifiable intangible assets decreased by $13.7 million (37.6%) primarily due to amortization expense of $13.6 million, including $10.0 million of accelerated amortization of trade names associated with the Bonnell Aluminum rebranding initiative. For information on the rebranding initiative, see Note 8.
Accounts payable decreased by $9.1 million (8.1%).
Accounts payable in Aluminum Extrusions decreased by $6.5 million, primarily due to lower volume, a decrease in metal prices and the normal volatility associated with the timing of payments. DPO (computed using trailing 12 months costs of goods sold calculated on a first in, first out basis and a rolling 12-month average of accounts payable balances) was approximately 49.9 days in 2019 and 49.7 days in 2018.
Accounts payable in PE Films decreased by $0.9 million primarily due to the normal volatility associated with the timing of payments. DPO was approximately 44.9 days in 2019 and 43.7 days in 2018.
Accounts payable in Flexible Packaging Films decreased by $1.3 million, primarily due to lower inventory levels and the normal volatility associated with the timing of payments. DPO was approximately 55.2 days in 2019 and 51.9 days in 2018.
Accrued expenses increased by $3.3 million (7.8%) from December 31, 2018 due to normal fluctuations in the accrual accounts.
Net noncurrent deferred income tax assets in excess of noncurrent deferred income tax liabilities decreased by $1.3 million primarily due to numerous changes between years in the balance of the components shown in the December 31, 2019 and 2018 schedule of deferred income tax assets and liabilities provided in Note 16. The Company had a current income tax receivable of $4.1 million at December 31, 2019 compared to a current income tax receivable of $6.8 million at December 31, 2018. The change is primarily due to timing of tax payments and refunds from net operating losses and tax credits carried back to prior years.
On June 28, 2019, Tredegar entered into a $500 million five-year, secured revolving credit agreement (“revolving credit agreement”), with an option to increase that amount by $100 million. The revolving credit agreement amends and restates the Company’s previous $400 million five-year agreement that was due to expire on March 1, 2021. Net capitalization and indebtedness as defined under the revolving credit agreement as of December 31, 2019 were as follows:
|
| | | |
| Net Capitalization and Indebtedness as of December 31, 2019 |
(In thousands) |
| Net capitalization: | |
| Cash and cash equivalents | $ | 31,422 |
|
| Debt: | |
| Revolving credit agreement | 42,000 |
|
| Other debt | — |
|
| Total debt | 42,000 |
|
| Debt net of cash and cash equivalents | 10,578 |
|
| Shareholders’ equity | 376,749 |
|
| Net capitalization | $ | 387,327 |
|
| Indebtedness as defined in revolving credit agreement: | |
| Total debt | $ | 42,000 |
|
| Other | — |
|
| Indebtedness | $ | 42,000 |
|
The credit spread and commitment fees charged on the unused amount under our revolving credit agreement at various indebtedness-to-adjusted EBITDA levels are as follows:
|
| | | | | |
| Pricing Under Revolving Credit Agreement (Basis Points) |
| Indebtedness-to-Adjusted EBITDA Ratio | Credit Spread Over LIBOR | | Commitment Fee |
| > 3.5x but <= 4.0x | 200.0 |
| | 40 |
|
| > 3.0x but <= 3.5x | 187.5 |
| | 35 |
|
| > 2.0x but <= 3.0x | 175.0 |
| | 30 |
|
| > 1.0x but <= 2.0x | 162.5 |
| | 25 |
|
| <= 1.0x | 150.0 |
| | 20 |
|
At December 31, 2019, the interest rate on debt under the revolving credit agreement existing at that date was priced at one-month LIBOR plus the applicable credit spread of 150 basis points. Under the revolving credit agreement, borrowings are permitted up to $500 million, and approximately $370 million was available to borrow at December 31, 2019, based upon the most restrictive covenant within the revolving credit agreement.
As of December 31, 2019, Tredegar was in compliance with all financial covenants outlined in its revolving credit agreement. Noncompliance with any of the debt covenants may have a material adversecurrent or future effect on its financial condition, or liquiditychanges in the event such noncompliance cannot be cured or should the Company be unable to obtain a waiver from the
lenders. Renegotiation of the covenant(s) through an amendment to the revolving credit agreement may effectively cure the noncompliance, but may have an effect on financial condition, revenues or expenses, results of operations, liquidity, depending upon how the amended covenant is renegotiated.
The computations of adjusted EBITDA, the leverage ratio and interest coverage ratio as defined in the revolving credit agreement are presented below along with the related most restrictive covenants. Adjusted EBITDA as defined in the revolving credit agreement is not intended to represent net incomecapital expenditures or cash flow from operations as defined by GAAP and should not be considered as either an alternative to net income or to cash flow.capital resources.
|
| | | |
Computations of Adjusted EBITDA, Leverage Ratio and Interest Coverage Ratio as Defined in the Revolving Credit Agreement Along with Related Most Restrictive Covenants
|
As of and for the Twelve Months Ended December 31, 2019 (In thousands)
|
| Computations of adjusted EBITDA as defined in revolving credit agreement for the twelve months ended December 31, 2019 |
| Net income | $ | 48,259 |
|
| Plus: | |
| After-tax losses related to discontinued operations | — |
|
| Total income tax expense for continuing operations | 9,913 |
|
| Interest expense | 4,051 |
|
| Depreciation and amortization expense for continuing operations | 44,284 |
|
| All non-cash losses and expenses, plus cash losses and expenses not to exceed $10,000, for continuing operations that are classified as unusual, extraordinary or which are related to plant shutdowns, asset impairments and/or restructurings (cash-related of $10,000) | 11,116 |
|
| Charges related to stock option grants and awards accounted for under the fair value-based method | 4,209 |
|
| Losses related to the application of the equity method of accounting | — |
|
| Losses related to adjustments in the estimated fair value of assets accounted for under the fair value method of accounting | — |
|
| Minus: | |
| After-tax income related to discontinued operations | — |
|
| Total income tax benefits for continuing operations | — |
|
| Interest income | (296 | ) |
| All non-cash gains and income, plus cash gains and income in excess of $10,000, for continuing operations that are classified as unusual, extraordinary or which are related to plant shutdowns, asset impairments and/or restructurings | — |
|
| Income related to changes in estimates for stock option grants and awards accounted for under the fair value-based method | — |
|
| Income related to the application of the equity method of accounting | — |
|
| Income related to adjustments in the estimated fair value of assets accounted for under the fair value method of accounting | (28,482 | ) |
| Plus cash dividends declared on investments in an amount not to exceed $10,000 for such period | 10,000 |
|
| Plus or minus, as applicable, pro forma EBITDA adjustments associated with acquisitions and asset dispositions | — |
|
| Adjusted EBITDA as defined in revolving credit agreement | $ | 103,054 |
|
| Computations of leverage and interest coverage ratios as defined in revolving credit agreement at December 31, 2019: |
| Leverage ratio (indebtedness-to-adjusted EBITDA) | .41x |
|
| Interest coverage ratio (adjusted EBITDA-to-interest expense) | 25.44x |
|
| Most restrictive covenants as defined in revolving credit agreement: | |
| Maximum permitted aggregate amount of dividends that can be paid by Tredegar during the term of the revolving credit agreement ($100,000 plus 50% of net income generated for each quarter beginning April 1, 2019) | $ | 145,805 |
|
| Maximum leverage ratio permitted | 4.00x |
|
| Minimum interest coverage ratio permitted | 3.00x |
|
Tredegar is obligated to make future payments under various contracts as set forth below:
|
| | | | | | | | | | | | | | | | | | | | | | | | | | | |
| | Payments Due by Period |
| (In millions) | 2020 | | 2021 | | 2022 | | 2023 | | 2024 | | Remainder | | Total |
| Debt: | | | | | | | | | | | | | |
| Principal payments | $ | — |
| | $ | — |
| | $ | — |
| | $ | — |
| | $ | 42.0 |
| | $ | — |
| | $ | 42.0 |
|
| Estimated interest expense | 1.4 |
| | 1.4 |
| | 1.4 |
| | 1.4 |
| | 0.7 |
| | — |
| | 6.3 |
|
Estimated contributions required: (1) | | | | | | | | | | | | | |
| Defined benefit plans | 12.3 |
| | 11.1 |
| | 14.3 |
| | 13.2 |
| | 13.9 |
| | 29.5 |
| | 94.3 |
|
| Other postretirement benefits | 0.5 |
| | 0.5 |
| | 0.5 |
| | 0.5 |
| | 0.5 |
| | 2.1 |
| | 4.6 |
|
| Capital expenditure commitments | 2.3 |
| | — |
| | — |
| | — |
| | — |
| | — |
| | 2.3 |
|
Leases(2) | 4.7 |
| | 3.6 |
| | 2.6 |
| | 2.4 |
| | 2.4 |
| | 9.8 |
| | 25.5 |
|
Estimated obligations relating to uncertain tax positions (3) | 0.1 |
| | — |
| | — |
| | — |
| | — |
| | 0.8 |
| | 0.9 |
|
Other (4) | 3.7 |
| | 2.3 |
| | 0.6 |
| | — |
| | — |
| | — |
| | 6.6 |
|
| Total | $ | 25.0 |
| | $ | 18.9 |
| | $ | 19.4 |
| | $ | 17.5 |
| | $ | 59.5 |
| | $ | 42.2 |
| | $ | 182.5 |
|
| |
(1) | Estimated minimum required contributions for defined benefit plans and benefit payments for other postretirement plans are based on actuarial estimates using current assumptions for discount rates, long-term rate of return on plan assets, rate of compensation increases and health care cost trends. The expected defined benefit plan contribution estimates for 2020 through 2029 were determined under provisions of the Pension Protection Act of 2006 using the preliminary assumptions chosen by Tredegar for the 2020 plan year. Tredegar has determined that it is not practicable to present defined benefit contributions and other postretirement benefit payments beyond 2029. |
| |
(2) | Contractual lease payments for 2020 include $0.4 million of short term lease payments and $0.5 million of variable lease costs. |
| |
(3) | Amounts for which reasonable estimates about the timing of payments cannot be made are included in the remainder column. |
| |
(4) | Includes contractual severance and other miscellaneous contractual arrangements. |
From time to time, the Company enters into transactions with third parties in connection with the sale of assets or businesses in which it agrees to indemnify the buyers or third parties involved in the transaction, or the sellers or third parties involved in the transaction agree to indemnify Tredegar, for certain liabilities or risks related to the assets or business. Also, in the ordinary course of business, the Company may enter into agreements with third parties for the sale of goods or services that may contain indemnification provisions. In the event that an indemnification claim is asserted, liability for indemnification would be subject to an assessment of the underlying facts and circumstances under the terms of the applicable agreement. Further, any indemnification payments may be limited or barred by a monetary cap, a time limitation, or a deductible or basket. For these reasons, the Company is unable to estimate the maximum potential amount of the potential future liability under the indemnity provisions of these agreements. Tredegar does, however, accrue for losses for any known contingent liability,
including those that may arise from indemnification provisions, when future payment is probable and the amount is reasonably estimable. The Company discloses contingent liabilities if the probability of loss is reasonably possible and material.
At December 31, 2019, Tredegar had
Critical Accounting Policies and Estimates
The preparation of financial statements in accordance with GAAP requires the Company to make estimates and assumptions that affect the reported amounts of assets, liabilities, revenues, expenses and related disclosures. Certain accounting policies, as described below, are considered "critical accounting policies" because they are particularly dependent on estimates made by management about matters that are inherently uncertain and could have a material impact on the Company’s consolidated financial statements. Estimates and judgments are based on historical experience, forecasted events and various other assumptions that management believes are reasonable under the circumstances. Actual results could differ significantly from those estimates under different assumptions and conditions. A summary of all of our significant accounting policies is included in Note 1 “Nature of Operations and Summary of Significant Accounting Policies” to the Consolidated Financial Statements in Item 15.
Impairment of Goodwill
The Company assesses goodwill for impairment when events or circumstances indicate that the carrying value may not be recoverable, or, at a minimum, on an annual basis (December 1st of each year). When assessing goodwill for impairment, accounting guidance allows the Company to first perform a qualitative assessment (“Step 0 analysis”), which evaluates certain qualitative factors, including macroeconomic conditions, industry and market considerations, cost factors and overall financial performance, as well as company and reporting unit factors. If the Company's Step 0 analysis indicates that it is more likely than not that the fair value of a reporting unit is less than its carrying amount, then the Company would perform a quantitative impairment test (“Step 1 analysis”).
During the three months ended September 30, 2022, events and circumstances indicated that the Surface Protection reporting unit (“Surface Protection”), which is also the asset group, might be impaired. The Company performed a Step 1 analysis and long-lived impairment analysis for Surface Protection and determined that the fair value of Surface Protection exceeded its carrying value by 18.6%.
The Company estimated the fair value of Surface Protection at September 30, 2022 by: (i) computing a weighted average estimated enterprise value (“EV”) utilizing both the discounted cash flow (the “DCF Method”) and market multiple (the “Market Multiple Method”) methods, (ii) applying adjustments for any surplus or deficient working capital, (iii) adding cash and cash equivalents, and (iv) subtracting interest-bearing debt. The Company’s estimate of $31.4Surface Protection’s EV as of September 30, 2022 was determined by weighting the Market Multiple Method by 20% and the DCF Method by 80%. A heavier weighting towards the DCF Method was used since Surface Protection’s projections better reflect recovery from the weak market demand, competitive pricing and cash flows associated with new surface protection products, applications, customers, production efficiencies, and cost savings. Key financial assumptions utilized to determine the fair value of the reporting unit includes revenue growth projections and a weighted average cost of capital assumption. At September 30, 2022, the effect of a ten percent decrease in the revenue growth projections and a one percent increase to the weighted average cost of capital assumption would further decrease the fair value of the reporting unit’s fair value by approximately $5 million and $6 million, respectively.
Customer demand for electronics has continued to deteriorate since the third quarter of 2022, causing manufacturers in the supply chain to experience reduced capacity utilization and inventory corrections. In addition, these depressed market conditions, which are expected to continue through the first half of 2023, are adversely impacting mix through reduced sales to our highest value-added customers and products. Given the uncertain demand for Surface Protections products, it is reasonably possible that the cash flow estimates used in deriving such fair value measurements may change in the future.
As of December 1, 2022, the Company’s reporting units with goodwill were Surface Protection in PE Films and Futura in Aluminum Extrusions. Both of these reporting units have separately identifiable operating net assets (operating assets including funds heldgoodwill and identifiable intangible assets net of operating liabilities). The Company's Step 0 analyses as of December 1, 2022 of these reporting units concluded that it is not more likely than not that the fair values of each reporting unit was less than its carrying amount. Therefore, the Step 1 quantitative goodwill impairment tests for these reporting units were not necessary as of December 1, 2022. The Surface Protection and Futura reporting units had goodwill in locations outside the amounts of $57.3 million and $13.3 million, respectively, at December 31, 2022. See Note 1 “Nature of Operations and Summary of Significant Accounting Policies” to the Consolidated Financial Statements in Item 15 for additional information on the analysis of goodwill impairment.
Pension Benefits
Tredegar sponsors a noncontributory defined benefit (pension) plan covering certain current and former U.S. employees. The plan is closed to new participants and pay for active plan participants for benefit calculations was frozen as of $23.0 million.December 31, 2007. As of January 31, 2018, the plan no longer accrued benefits associated with crediting employees for service, thereby freezing all future benefits under the plan. On February 10, 2022, Tredegar announced the initiation of a process to terminate and settle its frozen defined benefit pension plan, which is expected to be completed by the end of 2023.
The Company’s pension plan has resulted in varying amounts of net pension income or expense, as developed from actuarial valuations and the application of GAAP. Inherent in the valuation are key assumptions including discount rates and the expected return on plan assets. Inherent in the application of GAAP includes the amortization of deferred non-cash actuarial gains or losses. Net periodic pension benefit cost under GAAP during 2022, 2021 and 2020 was $14.4 million, $14.0 million and $14.6 million, respectively, including non-cash amortization of net actuarial losses of $13.7 million, $17.0 million and $15.5 million, respectively.
The Company believes that existing borrowing availability,is required to consider current cash balancesmarket conditions, including changes in interest rates and cash flowplan asset investment returns, in determining actuarial valuation assumptions. Assumptions may differ materially from operations will be sufficientactual results due to satisfy working capital, capital expenditurechanging market and dividend requirements for at least the next twelve months.
Shareholders’ Equity
Ateconomic conditions, higher or lower withdrawal rates or longer or shorter life spans of participants. These differences are deferred in accumulated other comprehensive income or loss directly in shareholders’ equity and subsequently amortized in net periodic pension benefit cost. Other comprehensive net actuarial losses reflected directly in shareholders’ equity was $103.6 million, $109.2 million and $149.5 million on a pre-tax basis as of December 31, 2022, 2021 and 2020, respectively, which have resulted in the significant non-cash amortization costs as noted above.
Following the announcement to terminate and settle the pension plan, the Company contributed $50 million to the pension plan and implemented (through consultation with its investment advisors) a liability-matching bond portfolio investment strategy (including a derivative overlay) that hedged the estimated settlement funding gap, which was approximately $24 million (before plan administration costs) at that time. The overall objective of this hedging program is to minimize the volatility of the estimated settlement funding gap such that, as applicable interest rates move up or down causing a decrease or increase in the estimated value of the settlement liability, the value of the matching bond portfolio and derivative overlay decreases or increases by a similar amount.
The discount rate is used to determine the present value of future payments (i.e., the estimated settlement liability). In general, the estimated settlement liability increases as the discount rate decreases and vice versa. The discount rate is the single rate that, when applied to expected benefit payments, provides a present value equal to the present value of expected benefit payments, which prior to the planned termination and settlement was determined by using the AA-rated bond yield curve. Given the anticipated termination and settlement of the pension plan, the Company determined an appropriate discount rate as of December 31, 2022, based on the weighted average of lump sum settlement interest rates and estimated annuity purchase settlement rates. The weighted average discount rate utilized was 5.07%, 2.90% and 2.57% at the end of 2022, 2021 and 2020, respectively, with changes between periods due to changes in market interest rates and in 2022 also the change to a settlement discount rate estimating methodology.
A 100 basis point increase in the discount rate assumption would have decreased the projected benefit obligation / estimated settlement liability and the net periodic pension cost for the pension plan by approximately $23 million and $2 million, respectively. A 100 basis point decrease in the discount rate assumption would have increased the projected benefit obligation / estimated settlement liability and the net periodic pension cost for the pension plan by approximately $24 million and $2 million, respectively. In both assumption situations, as a result of the hedging program, the Company would expect a similar overall change in the liability matching bond portfolio and derivative overlay.
A lower expected return on plan assets increases the amount of expense and vice versa. Decreases in the level of actual plan assets will also serve to increase the amount of pension expense. The total return on plan assets (net of fees and plan expenses), which is primarily affected by the change in fair value of plan assets, current year contributions and current year payments to participants, was approximately negative 15.1% in 2022, positive 10.4% in 2021 and positive 10.9% in 2020.
The expected long-term rate return of 5.00% used in both 2021 and 2020 were determined at the end of 2020 and 2019 Tredegar had 33,365,039 sharesand therefore did not contemplate the liability-driven investment strategy discussed above, however, the expected long-term rate return of common stock outstanding3.05% used in 2022 and a total market capitalization4.99% for 2023 does contemplate the liability-driven investment strategy discussed above. See Note 8 “Retirement Plans and Other Postretirement Benefits” to the Consolidated Financial Statements in Item 15 for more information on expected long-term return on plan assets and asset mix.
Net periodic benefit cost, which excludes the impact of $745.7the expected plan settlement, for 2023 under GAAP is expected to be approximately $14 million, compared with 33,176,024 sharesincluding non-cash amortization of common stock outstandingother comprehensive net actuarial losses of approximately $12 million.
The Company has been monitoring the estimated settlement funding gap and a total market capitalizationthe effectiveness of $526.2its liability-matching bond portfolio investment strategy through an online tool provided by its investment advisors, which increased to approximately $28 million at December 31, 2018.
Tredegar did not repurchase any shares on the open market in 2019, 2018 or 2017 under its approved share repurchase program.
Cash Flows
The discussion in this section supplements the information presented in the Consolidated statements of cash flows.
Cash provided by operating activities was $115.9 million in 2019 compared with $97.8 million in 2018. The increase is2022 primarily due to lower net working capital (accounts receivables, prepaids, accounts payable and accrued expenses) from changing business conditions ($43.4 million) and a dividend received from kaleo ($17.6 million), partially offset by income taxes paid in 2019 ($2.6 million) versus refunds received in 2018 ($24.0 million), lower EBITDA from ongoing operationsadministrative costs incurred by the operating segments ($9.5 million), and higher corporate costs and cash expenses for plant shutdowns and restructurings ($8.0 million).plan.
Cash used in investing activities was $39.9 million in 2019 compared with $34.1 million in 2018. Cash used in investing activities primarily represents capital expenditures, which were $50.9 million and $40.8 million in 2019 and 2018, respectively. Additionally, inAs the first quarter of 2018,settlement process occurs, the Company received $5 million from escrowed funds relatedexpects to an earnout from the acquisition of Futura, of which $4.3 million was classified in cash flows for investing activities, while in 2019, the Company received $10.9 million in proceeds from the salerecognize a non-cash reclassification adjustment to net income or loss of the Shanghai facility,entire remaining balance of other comprehensive net actuarial losses reflected directly in shareholders’ equity, which was shut down in 2018.approximately $104 million on a pre-tax basis at December 31, 2022.
Net cash flow used in financing activities was $77.3 million in 2019, primarily due to net repayments under the revolving credit agreement of $59.5 million and the payment of regular quarterly dividends aggregating for the year to $15.3 million ($0.46 per share annually). Cash used in financing activities was $64.1 million in 2018, including net repayments under the revolving credit agreement of $50.5 million and regular quarterly dividends aggregating for the year to $14.6 million ($0.44 per share annually).
Quantitative and Qualitative Disclosures about Market Risk
Tredegar has exposure to the volatility of interest rates, polyethylene, polypropylene and polyester resin prices, PTA and MEG prices, aluminum ingot and scrap prices, energy prices, foreign currencies and emerging markets. See the Assets and LiabilitiesSegment Operations Review section above for further discussion regarding interest rate exposures related to borrowings under the revolving credit agreement.
Changes in polyethylene resin prices, and the timing of those changes, could have a significantfinancial impact on profit margins in PE Films. Changes in polyester resin, PTA and MEG prices, and the timing of those changes, could have a significant impact on profit margins in Flexible Packaging Films. Profit margins in Aluminum Extrusions are sensitive to fluctuations in aluminum ingot and scrap prices as well as natural gas prices (natural gas is the principal energy source used to operate its casting furnaces). There is no assurance of the Company’s abilitypension plans.
Income Taxes
Current tax liabilities and assets are recognized for the estimated taxes payable or refundable, respectively, on the tax returns for the current year. Deferred tax assets and liabilities are determined based on differences between financial reporting and tax bases of assets and liabilities and are measured using the enacted tax rates and laws that will be in effect when the differences are expected to pass through higher raw materialreverse. Accordingly, accounting for income taxes represents the Company’s best estimate of various events and energy coststransactions. Tax laws are often complex and may be subject to its customers.
Seediffering interpretations by the Executive Summarytaxpayer and the Resultsrelevant governmental taxing authorities. In establishing a provision for income tax expense, Tredegar must make judgments and interpretations about the application of Continuing Operations sections above for discussiontax laws. The Company must also make estimates about when in the future certain items will affect taxable income in the various taxing jurisdictions.
A valuation allowance is recorded in the period when the Company determines that it is more likely than not that all or a portion of deferred income tax assets may not be realized. The establishment and removal of a valuation allowance requires the Company to consider all positive and negative evidence and make a judgmental decision regarding the amount of valuation allowance required as of a reporting date.
Tredegar may be required to change its provision for income taxes when estimates used in determining valuation allowances on deferred tax assets significantly change, or when new information indicates the need for adjustment in valuation allowances. Additionally, future events, such as changes in tax laws, tax regulations, or interpretations of such laws or regulations, could have an impact ofon the lagprovision for income tax and the effective tax rate. Any such changes could significantly affect the amounts reported in the pass-through of resin price changes.
The volatility of average quarterly prices of low density polyethylene resinfinancial statements in the U.S. (a primary raw material for PE Films products) is shown in the chart below:year these changes occur.
|
|
Source: Quarterly averages computed by Tredegar using monthly data provided by IHS, Inc. In January 2015, IHS reflected a 21 cents per pound non-market adjustment based on their estimate of the growth of discounts in prior periods. The 4th quarter 2014 average rate of $1.09 per pound is shown on a pro forma basis as if the non-market adjustment was made in the fourth quarter of 2014. |
Polyethylene resin prices in Europe, Asia and South America have exhibited similar long-term trends. The price of resin is driven by several factors, including supply and demand and the price of oil, ethylene and natural gas. To address fluctuating resin prices, PE Films has index-based pass-through raw material cost agreements for the majority of its business. However, under certain agreements, changes in resin prices are not passed through for an average period of 90 days (see the Executive Summary and the Results of Continuing Operations sections above for more information). Pricing on the remainder of the business is based upon raw material costs and supply/demand dynamics within the markets in which the Company operates.
Polyester resins, MEG and PTA used by Flexible Packaging Films in Brazil are primarily purchased domestically, with other sources available, mostly from Asia and the U.S. Given the nature of these products as commodities, pricing is derived from Asian pricing indexes. The volatility of the average quarterly prices for polyester fibers in Asia, which is representative of polyester resin (a primary raw material for polyester film products) prices, is shown in the chart below:
|
|
Source: Quarterly averages computed by Tredegar using monthly data from CMAI Global Index data.
|
The volatility of average quarterly prices of PTA and MEG in Asia (raw materials used in the production of polyester resins produced by Flexible Packaging Films) is shown in the chart below:
|
|
Source: Quarterly averages computed by Tredegar using monthly data from CMAI Global Index data. |
In the normal course of business, Aluminum Extrusions enters into fixed-price forward sales contracts with certain customers for the sale of fixed quantities of aluminum extrusions at scheduled intervals. In order to hedge its exposure to aluminum price volatility (see the chart below) under these fixed-price arrangements, which generally have a duration of not more than 12 months, the Company enters into a combination of forward purchase commitments and futures contracts to acquire or hedge aluminum, based on the scheduled deliveries. See Note 912 “Income Taxes” to the Consolidated Financial Statements in Item 15 for more information. The volatility of quarterly average aluminum prices is shown in the chart below:
|
|
Source: Quarterly averages computed by Tredegar using daily Midwest average prices provided by Platts. |
The volatility of quarterly average natural gas prices is shown in the chart below:
|
|
Source: Quarterly averages computed by Tredegar using monthly NYMEX settlement prices. |
Tredegar sells to customers in foreign markets through its foreign operations and through exports from U.S. plants. The percentage of sales and total assets for manufacturing operations related to foreign markets for 2019, 2018 and 2017 are as follows:
|
| | | | | | | | | | | | | | | | | | | | | | | | | | |
Tredegar Corporation - Continuing Operations Percentage of Net Sales and Total Assets Related to Foreign Markets |
| | 2019 | | 2018 | | 2017 |
| | % of Total | | % Total Assets - Foreign Oper- ations * | | % of Total | | % Total Assets - Foreign Oper- ations * | | % of Total | | % Total Assets - Foreign Oper- ations * |
| | Net Sales * | | | Net Sales * | | | Net Sales * | |
| | Exports From U.S. | | Foreign Oper- ations | | | Exports From U.S. | | Foreign Oper- ations | | | Exports From U.S. | | Foreign Oper- ations | |
| Canada | 2 |
| | — |
| | — |
| | 5 |
| | — |
| | — |
| | 5 |
| | — |
| | — |
|
| Europe | 1 |
| | 7 |
| | 5 |
| | 1 |
| | 8 |
| | 6 |
| | 1 |
| | 9 |
| | 6 |
|
| Latin America | 1 |
| | 12 |
| | 8 |
| | 1 |
| | 10 |
| | 8 |
| | 2 |
| | 9 |
| | 7 |
|
| Asia | 9 |
| | 1 |
| | 3 |
| | 7 |
| | 1 |
| | 4 |
| | 9 |
| | 2 |
| | 5 |
|
| Total % exposure to foreign markets | 13 |
| | 20 |
| | 16 |
| | 14 |
| | 19 |
| | 18 |
| | 17 |
| | 20 |
| | 18 |
|
|
| |
* | The percentages for foreign markets are relative to Tredegar’s consolidated net sales and total assets . |
Tredegar attempts to match the pricing and cost of its products in the same currency and generally views the volatility of foreign currencies and emerging markets, and the corresponding impact on earnings and cash flow, as part of the overall risk of operating in a global environment (for additional information see trends for the Euro, Brazilian Real and Chinese Yuan in the charts on the following page). Exports from the U.S. are generally denominated in U.S. Dollars. The Company’s foreign currency exposure on income from continuing foreign operations relates to the Euro, the Chinese Yuan, the Hungarian Forint, the Brazilian Real and the Indian Rupee.taxes.
PE Films is generally able to match the currency of its sales and costs for its product lines. For flexible packaging films Terphane produced in Brazil, selling prices and key raw material costs are principally determined in U.S. Dollars and are impacted by local economic conditions. Competition in Brazil, Terphane’s primary market, has been exacerbated by global overcapacity in the polyester industry generally, particularly in Latin America. These factors have resulted in significant competitive pricing pressures and U.S. Dollar equivalent margin compression. Moreover, variable conversion, fixed conversion and sales, general and administrative costs for operations in Brazil have been adversely impacted by inflation in Brazil that is higher than in the U.S. Terphane is exposed to additional foreign exchange translation risk (its functional currency is the Brazilian Real) because almost 90% of its sales in Latin America are quoted or priced in U.S. Dollars, while a
large majority of its Brazilian costs are quoted or priced in Brazilian Real. This mismatch, together with a variety of economic variables impacting currency exchange rates, causes volatility that could negatively or positively impact EBITDA from ongoing operations for Terphane.
The Company estimates that the net mismatch translation exposure between Terphane Ltda.’s U.S. Dollar quoted or priced sales and underlying Brazilian Real quoted or priced operating costs (excluding depreciation and amortization) is annual net costs of R$137 million. Terphane Ltda. has outstanding foreign exchange average forward rate contracts to purchase Brazilian Real and sell U.S. Dollars to hedge its exposure. See Note 9 for more information on outstanding hedging contracts and this hedging program.
Tredegar estimates that the change in the value of foreign currencies relative to the U.S. Dollar on PE Films had a favorable impact on EBITDA from ongoing operations in PE Films of $0.7 million in 2019 compared to 2018 and an unfavorable impact on EBITDA from ongoing operations of $0.8 million in 2018 compared with 2017.
Trends for the Euro are shown in the chart below:
|
|
Source: Quarterly averages computed by Tredegar using daily closing data provided by Bloomberg. |
Trends for the Brazilian Real and Chinese Yuan are shown in the chart below:
|
|
Source: Quarterly averages computed by Tredegar using daily closing data provided by Bloomberg. |
Item 7A. QUANTITATIVE AND QUALITATIVE DISCLOSURES ABOUT MARKET RISK
Tredegar has exposure to the volatility of interest rates, polyethylene and polypropylene resin prices, PTA and MEG prices, aluminum ingot and scrap prices, energy prices, foreign currencies and emerging markets. See Liquidity and Capital Resources regarding interest rate exposures related to borrowings under the Credit Agreement.
Profit margins in Aluminum Extrusions are sensitive to fluctuations in aluminum ingot and scrap prices as well as natural gas prices (natural gas is the principal energy source used to operate its casting furnaces). Changes in polyethylene resin prices and the timing of those changes could have a significant impact on profit margins in PE Films. Changes in polyester resin, PTA and MEG prices, and the timing of those changes, could have a significant impact on profit margins in Flexible Packaging Films. There is no assurance of the Company’s ability to pass through higher raw material and energy costs to its customers.
In the normal course of business, Aluminum Extrusions enters into fixed-price forward sales contracts with certain customers for the sale of fixed quantities of aluminum extrusions at scheduled intervals. In order to hedge its exposure to aluminum price volatility (see the chart below) under these fixed-price arrangements, which generally have a duration of not more than 12 months, the Company enters into a combination of forward purchase commitments and futures contracts to acquire or hedge aluminum, based on the scheduled deliveries. See Note 10 “Derivatives” to the Consolidated Financial Statements in Item 15 for additional information.
The volatility of quarterly average aluminum prices is shown in the chart below.
| | |
Item 7A. | QUANTITATIVE AND QUALITATIVE DISCLOSURES ABOUT MARKET RISKSource: Quarterly averages computed by the Company using daily Midwest average prices provided by Platts. |
The volatility of quarterly average natural gas prices is shown in the chart below.
| | |
| Source: Quarterly averages computed by Tredegar using monthly NYMEX settlement prices. |
The volatility of average quarterly prices of polyethylene resin in the U.S. (a primary raw material for PE Films products) is shown in the chart below:
| | |
| Source: Quarterly averages computed by Tredegar using monthly data provided by IHS, Inc. In February 2020, IHS reflected a 32 cents per pound non-market adjustment based on their estimate of the growth of discounts in prior periods. The 4th quarter 2019 average rate of $0.51 per pound is shown on a pro forma basis as if the non-market adjustment was made in the fourth quarter of 2019. |
The price of resin is driven by several factors, including supply and demand and the price of oil, ethylene and natural gas. Selling prices to customers are set considering numerous factors, including the expected volatility of resin prices. In certain situations, PE Films has index-based pass-through raw material cost arrangements with customers. However, under certain agreements, changes in resin prices are not passed through for a period of 90 days or more. In response to unprecedented cost increases and supply issues for polyethylene and polypropylene resin, Tredegar Surface Protection implemented a quarterly resin cost pass-through mechanism, effective July 1, 2021, for all products and customers not previously covered by such arrangements. Pricing on the remainder of the business is based upon raw material costs and supply/demand dynamics within the markets that the Company competes.
Polyester resins, MEG and PTA used in flexible packaging films produced in Brazil are primarily purchased domestically, with other sources available mostly from Asia and the U.S. Given the nature of these products as commodities, pricing is derived from Asian pricing indexes. The volatility of the average quarterly prices for polyester fibers in Asia, which is representative of polyester resin (a primary raw material for Flexible Packaging Films) pricing trends, is shown in the chart below:
| | |
| Source: Quarterly averages computed by Tredegar using monthly data from CMAI Global Index data. |
The volatility of average quarterly prices of PTA and MEG in Asia (raw materials used in the production of polyester resins produced by Flexible Packaging Films) is shown in the chart below:
| | |
| Source: Quarterly averages computed by Tredegar using monthly data from CMAI Global Index data. |
The Company sells to customers in foreign markets through its foreign operations and through exports from U.S. plants. The percentage of sales and total assets for manufacturing operations related to foreign markets for 2022, 2021 and 2020 are as follows:
| | | | | | | | | | | | | | | | | | | | | | | | | | | | | | | | | | | | | | | | | | | | | | | | | | | | | |
Tredegar Corporation
Percentage of Net Sales and Total Assets Related to Foreign Markets* |
| | 2022 | | 2021 | | 2020 |
| | % of Total | | % Total
Assets - Foreign Operations | | % of Total | | % Total
Assets - Foreign
Operations | | % of Total | | % Total
Assets -Foreign
Operations |
| | Net Sales | | | Net Sales | | | Net Sales | |
| | Exports
From
U.S. | | Foreign Operations | | | Exports
From
U.S. | | Foreign Operations | | | Exports
From
U.S. | | Foreign Operations | |
| Canada | 2 | | | — | | | — | | | 2 | | | — | | | — | | | 2 | | | — | | | — | |
| Europe | — | | | — | | | — | | | 1 | | | — | | | — | | | 1 | | | — | | | — | |
| Latin America | 1 | | | 13 | | | 13 | | | 1 | | | 12 | | | 10 | | | — | | | 13 | | | 10 | |
| Asia | 5 | | | — | | | 2 | | | 7 | | | — | | | 3 | | | 11 | | | — | | | 4 | |
| Total | 8 | | | 13 | | | 15 | | | 11 | | | 12 | | | 13 | | | 14 | | | 13 | | | 14 | |
| | | | | |
| * | The percentages for foreign markets are relative to Tredegar’s consolidated net sales and total assets . |
Tredegar attempts to match the pricing and cost of its products in the same currency and generally views the volatility of foreign currencies and the corresponding impact on earnings and cash flow as part of the overall risk of operating in a global environment (for additional information, see trends for the Brazilian Real and Chinese Yuan in the charts on the following page). Exports from the U.S. are generally denominated in U.S. Dollars. The Company’s foreign currency exposure on income from continuing foreign operations relates to the Chinese Yuan and the Brazilian Real.
PE Films is generally able to match the currency of its sales and costs for its product lines. For flexible packaging films produced in Brazil, selling prices and key raw material costs are principally determined in U.S. Dollars and are impacted by local economic conditions and local and global competitive dynamics. Flexible Packaging Films is exposed to foreign exchange translation risk (its functional currency is the Brazilian Real) because almost 90% of the sales of Flexible Packaging Films business unit in Brazil (“Terphane Ltda.”) and substantially all of its related raw material costs are quoted or priced in U.S. Dollars while its variable conversion, fixed conversion and sales, general and administrative costs before depreciation and
amortization (collectively “Terphane Ltda. Operating Costs”) are quoted or priced in Brazilian Real. This mismatch, together with a variety of economic variables impacting currency exchange rates, causes volatility that could negatively or positively impact EBITDA from ongoing operations for Flexible Packaging Films.
The Company estimates annual net costs of R$177 million for the net mismatch translation exposure between Terphane Ltda.’s U.S. Dollar quoted or priced sales and raw material costs and underlying Brazilian Real quoted or priced Terphane Ltda. Operating Costs. Terphane Ltda. has outstanding foreign exchange average forward rate contracts to purchase Brazilian Real and sell U.S. Dollars to hedge its exposure. See discussionNote 10 “Derivatives” to the Consolidated Financial Statements in Item 15 for more information on outstanding hedging contracts and this hedging program.
Tredegar estimates that the change in the value of Quantitativeforeign currencies relative to the U.S. Dollar on PE Films had a favorable impact on EBITDA from ongoing operations in PE Films of $1.1 million in 2022 compared to 2021.
Trends for the Brazilian Real and Qualitative Disclosures about Market RiskChinese Yuan are shown in Management’s Discussion and Analysis of Financial Condition and Results of Operations.the chart below:
| | |
| Source: Quarterly averages computed by Tredegar using daily closing data provided by Bloomberg. |
| |
Item 8. | FINANCIAL STATEMENTS AND SUPPLEMENTARY DATA |
See the Index to Financial StatementsItem 8. FINANCIAL STATEMENTS AND SUPPLEMENTARY DATA
The information required by this Item 8 is set forth in Item 15 and Supplementary Data for references to the report of the independent registered public accounting firm, the consolidated financial statements and selected quarterly financial data.is hereby incorporated herein by reference.
| |
Item 9. | CHANGES IN AND DISAGREEMENTS WITH ACCOUNTANTS ON ACCOUNTING AND FINANCIAL DISCLOSUREItem 9. CHANGES IN AND DISAGREEMENTS WITH ACCOUNTANTS ON ACCOUNTING AND FINANCIAL DISCLOSURE |
None.
| |
Item 9A. | CONTROLS AND PROCEDURES |
Item 9A.CONTROLS AND PROCEDURES
On November 1, 2018, the Company filed a Current Report on Form 8-K (the “November 2018 Form 8-K”) to disclose deficienciescertain material weaknesses in internal control over financial reporting. For further information, see the November 2018 Form 8-K and Item 4. “Controls and Procedures” of the Company’s Quarterly Report on Form 10-Q for the quarterly period ended September 30, 2018 (the “2018 Third Quarter 10-Q”).2018.
As of December 31, 2022, the Company continues to revise and execute management’s remediation plan, including the implementation of the new and revised internal controls over financial reporting. The results of management’s testing of the design, implementation and operating effectiveness of controls identified that the Company continued to have material weaknesses in its internal control over financial reporting as of December 31, 2022; however, the material weaknesses existing as of December 31, 2022 were limited to certain discrete items within the previously identified material weaknesses.
Evaluation of Disclosure Controls and Procedures as of December 31, 2019
In connection with the preparation of this Form 10-K, pursuant to Rule 13a-15(b) under the Securities Exchange Act of 1934, as amended (the “Exchange Act”), the Company carried out an evaluation with the participation of its management, including its Chief Executive Officer (principal executive officer) and Chief Financial Officer (principal financial officer), of the effectiveness of the design and operation of the Company’s disclosure controls and procedures (as defined under Rule 13a-15(e) orand 15d-15(e) under the Exchange Act) as of December 31, 2019.
2022.
Based on this evaluation, the Company’s Chief Executive Officer and Chief Financial Officer concluded that, because of the material weaknesses in internal control over financial reporting discussed below, the Company’s disclosure controls and procedures were not effective as of December 31, 2019,2022, to ensureensure: (i) that information required to be disclosed by the Company in the reports that it files or submits under the Exchange Act, is recorded, processed, summarized and reported, within the time periods specified in the SEC’s rules and forms, and (ii) that such information is accumulated and communicated to management, including the Chief Executive Officer and Chief Financial Officer, as appropriate, to allow timely decisions regarding required disclosure.
Management’s Report on Internal Control Over Financial Reporting as of December 31, 2019
The Company’s management is responsible for establishing and maintaining adequate internal control over financial reporting, as such term is defined in Rules 13a-15(f) and 15d-15(f) under the Exchange Act. The Company’s internal control over financial reporting is a process designed by or under the supervision of the Company’s Chief Executive Officer and Chief Financial Officer, and overseen by the Board of Directors, to provide reasonable assurance regarding the reliability of financial reporting and the preparation of published financial statements for external purposes in accordance with GAAP and includes policies and procedures that:
•Pertain to the maintenance of records that, in reasonable detail, accurately and fairly reflect the transactions and dispositions of the Company’s assets;
•Provide reasonable assurance that transactions are recorded as necessary to permit preparation of financial statements in accordance with GAAP, and that the Company’s receipts and expenditures are being made only in accordance with the authorization of its management and directors; and
•Provide reasonable assurance regarding prevention or timely detection of unauthorized acquisition, use or disposition of the Company’s assets that could have a material effect on the consolidated financial statements.
Because of its inherent limitations, internal control over financial reporting is not intended to provide absolute assurance that a misstatement of the Company’s consolidated financial statements would be prevented or detected. Also, projections of any evaluation of effectiveness to future periods are subject to the risk that controls may become inadequate because of changes in conditions, or that the degree of compliance with the policies or procedures may deteriorate.
A material weakness is a deficiency, or combination of deficiencies, in internal control over financial reporting, such that there is a reasonable possibility that a material misstatement of the annual or interim financial statements will not be prevented or detected on a timely basis.
Management conducted an evaluation of the effectiveness of the Company’s internal control over financial reporting using the criteria in Internal Control - Integrated Framework 2013 issued by the Committee of Sponsoring Organizations of the Treadway Commission (the “2013 COSO Framework”). As a result of this evaluation, managementBased on management’s assessment, the Company’s Chief Executive Officer and Chief Financial Officer concluded that the Company’sCompany did not maintain effective internal control over financial reporting was not effective as of December 31, 2019, because of the material weaknesses in internal control over financial reporting discussed below.
Control Environment: 2022.The Company did not have a sufficient number of trainedsufficiently attract, develop, and retain competent resources with assigned responsibility and accountability for the design, operation and documentation ofto fulfill internal control over financial reporting in accordance with the 2013 COSO Framework.
Risk Assessment: The Company did not have an effective risk assessment process that defined clear financial reporting objectivesresponsibilities and evaluated risks, including fraud risks, and risks resulting from changes in the external environment and business operations, at a sufficient level of detail to identify all relevant risks of material misstatement across the entity.
Information and Communication: The Company did not have an effective information and communication process that identified and assessed the source of and controls necessary to ensure the reliability of information used in financial reporting and that communicates relevant information about roles and responsibilities for internal control over financial reporting.
Monitoring Activities: The Company did not have effective monitoring activities to assess the operation of internal control over financial reporting, including the continued appropriateness of control design and level of documentation maintained to support control effectiveness.
Control Activities: As a consequence of thethese material weaknesses, described above, internal control deficiencies related to the Company did not effectively design, implement and operation ofoperate process-level controls and general information technology controls were determined to be pervasive throughout the Company’sacross its financial reporting processes.
While these material weaknesses did not result in material misstatements of the Company’s consolidated financial statements as of and for the year ended December 31, 2019,2022, these material weaknesses create a reasonable possibility that a material misstatement of account balances or disclosures in annual or interim consolidated financial statements may not be prevented or detected in a timely manner. Accordingly, the Company concluded that the deficiencies represent material weaknesses in its internal control over financial reporting and its internal control over financial reporting was not effective as of December 31, 2019.2022.
The Company’s independent registered public accounting firm, KPMG LLP, which audited the 20192022 consolidated financial statements included in this Form 10-K, has expressed an adverse opinion on the operating effectiveness of the Company's internal control over financial reporting. KPMG LLP'sLLP’s report appears on pages 50-51page 42 of this Form 10-K. Remediation Plan and Efforts to Address the Identified Material Weaknesses
The Company’sWith the oversight of the Audit Committee of the Board of Directors (the “Audit Committee”), the Company commenced remediation efforts are ongoing and it will continue its initiatives to implement and document policies and procedures, and strengthen the Company’s internal control environment. Remediation of the identified material weaknesses and strengthening the Company’s internal control environment will require a substantial effort throughout 2020 and, we anticipate,in the first quarter of 2021. 2019 pursuant to the original six step remediation plan that was designed with the assistance of management’s outside consultant, an internationally recognized accounting firm. As of December 31, 2022, the Company continues to revise and execute management’s remediation plan to implement new and revised internal controls over financial reporting. Since 2019, significant resources have been invested in the remediation efforts principally related to:
•the assistance from management’s outside consultant;
•the design of internal controls for various antiquated information technology systems that lead to highly manual processes supporting financial reporting objectives;
•the hiring of additional resources with technical internal control over financial reporting expertise; and
•the establishment and execution of training programs for management on relevant internal control over financial reporting matters.
In addition, the Aluminum Extrusions business commenced the implementation of a new Board-approved enterprise resource planning and manufacturing execution systems (“ERP/MES”) in the first quarter of 2022, which is expected to cost approximately $30 million over a two-year time span. The implementation will benefit the Aluminum Extrusion internal control environment by standardizing process-level controls and general information technology controls and significantly reduce the manual processes across the organization by replacing various antiquated information technology systems.
While progress has been made since 2019, including the remediation of a significant number of process-level control deficiencies throughout our financial reporting processes, the Company experienced significant turnover in positions relevant to its internal control over financial reporting during 2021 and 2022 that impacted the effectiveness of prior training programs and management’s ability to implement control activities that operated for a sufficient period of time to allow management, through testing, to conclude that the control activities were operating effectively during 2022. To remediate the material weaknesses described above, the Company, with the oversight of the Audit Committee and the assistance of management’s outside consultant, has continued to revise its remediation strategy with the following remediation steps:
•Continue to hire, train and retain individuals with appropriate skills and experience related to designing, operating and documenting internal control over financial reporting;
•Continue to enhance controls as needed as the Company remediates control deficiencies identified;
•Develop a targeted training program to educate control owners on the principles and requirements of internal control activities associated with the material weaknesses above including, but not limited to;
◦Addressing the reliability of the underlying information used in the performance of internal control activities;
◦Retaining adequate documentary evidence for internal control activities, including the retention of evidence to support the precision of review and evidence of review procedures performed to demonstrate effective design, implementation and operation of such controls; and
◦Ensuring timely and consistent performance of the controls as designed.
The material weaknesses cannot be considered completely remediated until the applicable controls have operated for a sufficient period of time and management has concluded, through testing, that these controls are operating effectively. In addition, we anticipate that certain controlsThe Company is committed to the Company plans to implement in 2020 will not have operated for a sufficient periodimprovement of time in 2020 to test their operating effectiveness as part of the Company’s evaluation ofits internal control over financial reporting as of December 31, 2020.
To remediate the material weaknesses described above, the Company is pursuing the six remediation steps identified in the 2018 Third Quarter 10-Q. To date, the Company has accomplished the following as part of those remediation steps:
| |
a. | Identified material processes and significant locations for the purpose of identifying risks of material misstatement to the Company’s financial statements, |
| |
b. | Conducted interviews with relevant parties to ensure our understanding of the activities involved in the recording of transactions within material processes, |
| |
c. | Substantially completed a comprehensive review and update, as necessary, of the documentation of relevant processes with respect to the Company’s internal control over financial reporting, and |
| |
d. | Documented significant elements of a comprehensive risk assessment and internal control gap analysis and commenced the validation thereof with key stakeholders. |
The Companyand management continues to work with its outside consultant an internationally recognized accounting firm, to assist in completing the remediation plan.those efforts, as necessary. The Company believes thatcontinues to monitor the impact of employee turnover and other external factors on its remediation plan will be sufficient to remediate the identified material weaknesses and strengthen its assessment of internal control over financial reporting. As the Company continues to evaluate, and works to improve, its internal control over financial reporting, management may determine that additional measures to address control deficiencies or modifications to the remediation plan are necessary. The Company cannot assure you however, when it will remediate suchthe identified material weaknesses, nor can it be certain whether additional actions will be required or the costs of any such actions.required. Moreover, the Company cannot assure you that additional material weaknesses will not arise in the future. See Item 1A. “Risk Factors” of this Form 10-K for risks and uncertainties associated with management’s report on internal control over financial reporting as of and for the year ended December 31, 2022.
Changes in Internal Control Over Financial Reporting
The Company is in the process of implementing certain changes in its internal controls to remediate the material weaknesses described above. The implementation of the plan began in the second quarter of 2019. Except as noted above with respect to the implementationcompletion of certain steps in the remediation plan, there has been no change in the Company’s internal control over financial reporting during the quarter ended December 31, 2019,2022, that has materially affected, or is reasonably likely to materially affect, its internal control over financial reporting.reporting (as defined in Rules 13a-15(f) and 15d-15(f) under the Exchange Act).
| |
Item 9B. | OTHER INFORMATION |
Item 9B. OTHER INFORMATION
None.
Item 9C. DISCLOSURE REGARDING FOREIGN JURISDICTIONS THAT PREVENT INSPECTIONS
None.
PART III
| |
Item 10. | DIRECTORS, EXECUTIVE OFFICERS AND CORPORATE GOVERNANCE |
Item 10. DIRECTORS, EXECUTIVE OFFICERS AND CORPORATE GOVERNANCE
The information concerning directors and persons nominated to become directors of Tredegar to be included in the Proxy Statement under the headings “Proposal 1: Election of Directors” and “Tredegar’s Board of Directors” is incorporated herein by reference.
The information concerning corporate governance to be included in the Proxy Statement under the headings “Board Meetings, Meetings of Non-ManagementIndependent Directors and the Board Committees” and “Corporate Governance” is incorporated herein by reference.
The information to be included in the Proxy Statement under the heading “Section 16(a) Beneficial Ownership Reporting Compliance”Governance and Risk Oversight” is incorporated herein by reference.
Set forth below are the names, ages and titles of the Company’s executive officers:
|
| | | | | | | | | | | | | |
| Name | | Age | | Title |
| John M. Steitz | | 6164 |
| | President and Chief Executive Officer |
| D. Andrew Edwards | | 6164 |
| | Executive Vice President and Chief Financial Officer |
Michael J. SchewelKevin C. Donnelly | | 6648 |
| | Vice President, General Counsel and Corporate Secretary |
John M. Steitz. Mr. Steitz was elected President and Chief Executive Officer effective March 19, 2019. He previously served as President and Chief Executive Officer of Addivant Corporation, a leading global supplier of antioxidants, intermediates, inhibitors, modifiers, UV stabilizers and other additives to the plastic and rubber industries, from March 2015 until January 2019, as President and Chief Operating Officer of PQ Corporation, a leading worldwide producer of specialty inorganic performance chemicals and catalysts, from October 2013 until March 2015, as President and Chief Executive Officer of Avantor Performance Materials, a global supplier of ultra-high-purity life sciences materials with strict regulatory and performance specifications, from September 2012 until September 2013, as President and Chief Operating Officer of Albemarle Corporation, a global specialty chemicals company, from March 2012 until August 2012, and as Chief Operating Officer and Executive Vice President of Albemarle from April 2007 until March 2012.
D. Andrew Edwards. Mr. Edwards was electednamed Executive Vice President and Chief Financial Officer effective August 6, 2020. Mr. Edwards served as Vice President and Chief Financial Officer from July 20, 2015.2015 until August 2020. He previously served as the Chief Financial Officer of United Sporting Companies, Inc., a wholesale distributor of outdoor sporting goods, from February 2013 until July 2015 and as Vice President, Controller and Chief Accounting Officer of Owens & Minor, Inc., a distributor of acute medical products, from April 2010 to February 2013 and as Acting Chief Financial Officer of Owens & Minor, Inc. from March 2012 to February 2013. Mr. Edwards also served as Vice President, Finance, of Owens & Minor, Inc. from December 2009 until April 2010. Mr. Edwards previously served as the Company’s Vice President, Chief Financial Officer and Treasurer from August 2003 to December 2009 and as the Company’s Vice President, Finance from November 1998 to August 2003. Mr. Edwards also served as the Company’s Treasurer from May 1997 to December 2009 and as the Company’s Controller from October 1992 until July 2000.
Michael J. SchewelKevin C. Donnelly. Mr. SchewelDonnelly was elected Vice President, General Counsel and Corporate Secretary effective May 9, 2016.January 1, 2021. He was previously a partner with the law firm of McGuire Woods, LLP from 1986 until May 2016, except for four years from 2002 until 2006 when hejoined Tredegar in 2010 and served as Secretaryits Associate General Counsel from 2013 to 2020. Prior to joining Tredegar, Mr. Donnelly was an associate at Hunton & Williams LLP (now Hunton Andrews Kurth LLP). He received a B.A. degree from the University of CommerceRichmond and Trade fora J.D. from the CommonwealthUniversity of Virginia.
Tredegar has adopted a Code of Conduct that applies to all of its directors, officers and employees (including its chief executive officer, chief financial officer and principal accounting officer) and has posted the Code of Conduct on its website. All amendments to or waivers from any provision of the Company’s Code of Conduct applicable to the chief executive officer, chief financial officer and principal accounting officer will be disclosed on the Company’s website. The Company’s internet address is www.tredegar.com.
| |
Item 11. | EXECUTIVE COMPENSATION |
Item 11. EXECUTIVE COMPENSATION
The information to be included in the Proxy Statement under the headings “Compensation of Directors,” “Board Meetings, Meetings of Non-Management Directors and Board Committees - Executive Compensation Committee Interlocks and Insider Participation,” “Compensation Discussion and Analysis,” “Executive Compensation Committee Report” and “Compensation of Executive Officers” is incorporated herein by reference.
| |
Item 12. | SECURITY OWNERSHIP OF CERTAIN BENEFICIAL OWNERS AND MANAGEMENT ANDRELATED STOCKHOLDER MATTERSItem 12. SECURITY OWNERSHIP OF CERTAIN BENEFICIAL OWNERS AND MANAGEMENT ANDRELATED STOCKHOLDER MATTERS |
The information to be included in the Proxy Statement under the heading “Stock Ownership”“Equity Compensation Plan Information” is incorporated herein by reference. The following table summarizes information with respect to equity compensation plans under which securities are authorized for issuance as of December 31, 2019.
|
| | | | | | | | | | |
| | | Column (a) | | Column (b) | | Column (c) |
| Plan Category | Number of Securities to be Issued Upon Exercise of Outstanding Options, Warrants and Rights* | | Weighted-Average Exercise Price of Outstanding Options, Warrants and Rights | | Number of Securities Remaining Available for Future Issuance Under Equity Compensation Plans, Excluding Securities Reflected in Column (a) |
| Equity compensation plans approved by security holders | 2,062,501 |
| | $ | 19.13 |
| | 954,454 |
|
| Equity compensation plans not approved by security holders | — |
| | — |
| | — |
|
| Total | 2,062,501 |
| | $ | 19.13 |
| | 954,454 |
|
| |
* | Includes performance stock units that give the holder the right to receive shares of Tredegar common stock upon the satisfaction of certain performance criteria. |
| |
Item 13. | CERTAIN RELATIONSHIPS AND RELATED TRANSACTIONS, AND DIRECTOR INDEPENDENCE |
Item 13. CERTAIN RELATIONSHIPS AND RELATED TRANSACTIONS, AND DIRECTOR INDEPENDENCE
The information to be included in the Proxy Statement under the headings “Certain Relationships and Related Transactions”,Transactions,” “Tredegar’s Board of Directors” and “Board Meetings, Meetings of Non-ManagementIndependent Directors and Board Committees” is incorporated herein by reference.
| |
Item 14. | PRINCIPAL ACCOUNTING FEES AND SERVICES |
Item 14. PRINCIPAL ACCOUNTING FEES AND SERVICES
Our independent registered public accounting firm is KPMG LLP, Richmond, Virginia, Audit Firm ID: 185.
The following is incorporated herein by reference:
•Information on accounting fees and services to be included in the Proxy Statement under the heading “Audit and Non-Audit Fees;” and
•Information on the Audit Committee’s procedures for pre-approving certain audit and non-audit services to be included in the Proxy Statement under the heading “Board Meetings, Meetings of Non-Management Directors and Board Committees—Audit Committee Matters.”
PART IV
| |
Item 15. | EXHIBITS AND FINANCIAL STATEMENT SCHEDULES |
| |
(a) | List of documents filed as a part of the report: |
Tredegar CorporationItem 15. EXHIBITS AND FINANCIAL STATEMENT SCHEDULES
Index to Financial Statements and Supplementary Data | | | | | | | | |
| (a) | List of documents filed as a part of the report: | |
| (1) | Financial statements: | |
| Tredegar Corporation |
| Index to Financial Statements and Supplementary Data |
| | Page |
| Auditors’ Opinions: | |
| | |
| | |
| Financial Statements: | |
| | |
| | |
| | |
| | |
| | |
| | |
| (2) | Financial statement schedules: | |
| None | |
| (3) | | |
| | |
|
| |
| Page |
Auditors’ Opinions: | |
Reports of Independent Registered Public Accounting Firm - KPMG LLP | |
Report of Independent Registered Public Accounting Firm - PricewaterhouseCoopers LLP | |
Financial Statements: | |
Consolidated Balance Sheets as of December 31, 2019 and 2018 | |
Consolidated Statements of Income for the Years Ended December 31, 2019, 2018 and 2017 | |
Consolidated Statements of Comprehensive Income (Loss) for the Years Ended December 31, 2019, 2018 and 2017 | |
Consolidated Statements of Cash Flows for the Years Ended December 31, 2019, 2018 and 2017 | |
Consolidated Statements of Shareholders' Equity for the Years Ended December 31, 2019, 2018 and 2017 | |
Notes to Financial Statements | |
| |
(2) | Financial statement schedules: |
None
|
| |
See Exhibit Index on pages: | |
Report of Independent Registered Public Accounting Firm
To the Shareholders and Board of Directors
Tredegar Corporation:
Opinion on the Consolidated Financial Statements
We have audited the accompanying consolidated balance sheets of Tredegar Corporation and subsidiaries (the Company) as of December 31, 20192022 and 2018,2021, the related consolidated statements of income (loss), comprehensive income (loss), cash flows, and shareholders’ equity for each of the years in the two-yearthree-year period ended December 31, 2019,2022, and the related notes (collectively, the consolidated financial statements). In our opinion, the consolidated financial statements present fairly, in all material respects, the financial position of the Company as of December 31, 20192022 and 2018,2021, and the results of its operations and its cash flows for each of the years in the two-yearthree-year period ended December 31, 2019,2022, in conformity with U.S. generally accepted accounting principles.
We also have audited, in accordance with the standards of the Public Company Accounting Oversight Board (United States) (PCAOB), the Company’s internal control over financial reporting as of December 31, 2019,2022, based on criteria established in Internal Control -– Integrated Framework (2013) issued by the Committee of Sponsoring Organizations of the Treadway Commission, and our report dated March 16, 20202023 expressed an adverse opinion on the effectiveness of the Company’s internal control over financial reporting.
Change in Accounting Principles
As discussed in Note 1 to the consolidated financial statements, the Company has changed its method of accounting for leases as of January 1, 2019 due to the adoption of Accounting Standards Codification (ASC) Topic 842, Leases and revenue as of January 1, 2018 due to the adoption of ASC Topic 606, Revenue from Contracts with Customers.
Basis for Opinion
These consolidated financial statements are the responsibility of the Company’s management. Our responsibility is to express
an opinion on these consolidated financial statements based on our audits. We are a public accounting firm registered with the PCAOB and are required to be independent with respect to the Company in accordance with the U.S. federal securities laws and the applicable rules and regulations of the Securities and Exchange Commission and the PCAOB.
We conducted our audits in accordance with the standards of the PCAOB. Those standards require that we plan and perform the audit to obtain reasonable assurance about whether the consolidated financial statements are free of material misstatement, whether due to error or fraud. Our audits included performing procedures to assess the risks of material misstatement of the consolidated financial statements, whether due to error or fraud, and performing procedures that respond to those risks. Such procedures included examining, on a test basis, evidence regarding the amounts and disclosures in the consolidated financial statements. Our audits also included evaluating the accounting principles used and significant estimates made by management, as well as evaluating the overall presentation of the consolidated financial statements. We believe that our audits provide a reasonable basis for our opinion.
Critical Audit Matter
The critical audit matter communicated below is a matter arising from the current period audit of the consolidated financial statements that was communicated or required to be communicated to the audit committee and that: (1) relates to accounts or disclosures that are material to the consolidated financial statements and (2) involved our especially challenging, subjective, or complex judgments. The communication of a critical audit matter does not alter in any way our opinion on the consolidated financial statements, taken as a whole, and we are not, by communicating the critical audit matter below, providing a separate opinion on the critical audit matter or on the accounts or disclosures to which it relates.
Goodwill impairment in the Surface Protection reporting unit
As discussed in Notes 1 and 5 to the consolidated financial statements, the Company’s goodwill balance as of December 31, 2022 was $70.6 million, including $57.3 million related to the Surface Protection reporting unit. The Company assesses goodwill for impairment when events or circumstances indicate that the carrying value may not be recoverable, or, at a minimum, on an annual basis (December 1st of each year). During the three months ended September 30, 2022, events and circumstances indicated that the Surface Protection reporting unit might be impaired. The Company performed a quantitative impairment test of the Surface Protection reporting unit as of September 30, 2022, and concluded that no impairment existed. Management estimated the fair value of the Surface Protection reporting unit based on a weighted average enterprise value utilizing the discounted cash flow and market multiple methods.
We identified the assessment of goodwill impairment in the Surface Protection reporting unit as a critical audit matter. The estimation of fair value of the reporting unit is complex and includes estimation uncertainties that required a higher level of subjective auditor judgment. Specifically, the discount rate and the revenue growth projections used in the discounted cash flow method required subjective and challenging auditor judgment as they represented subjective determinations of current and future market and economic conditions. Additionally, the audit effort associated with the discount rate and the revenue growth projections required specialized skills and knowledge. Changes to those assumptions could have had a significant effect on the Company’s estimate of the fair value of the reporting unit.
The following are the primary procedures we performed to address this critical audit matter. We performed sensitivity analyses over the Company’s discount rate and the revenue growth projections to assess their impact on the determination of the fair value of the Surface Protection reporting unit. We compared the revenue growth projections used in the discounted cash flow model to underlying business strategies and growth plans of the Company. In addition, we involved valuation professionals with specialized skills and knowledge, who assisted in:
● evaluating the Company’s discount rate, by comparing it to a discount rate that was independently developed using publicly available third-party market data for comparable entities
● evaluating the Company’s revenue growth projections by comparing them to projections that were independently developed using external market and industry data.
/s/ KPMG LLP
We have served as the Company’s auditor since 2018.
Richmond, Virginia
March 16, 2020
2023
Report of Independent Registered Public Accounting Firm
To the Shareholders and Board of Directors
Tredegar Corporation:
Opinion on Internal Control Over Financial Reporting
We have audited Tredegar Corporation and subsidiaries’subsidiaries' (the Company) internal control over financial reporting as of December 31, 2019,2022, based on criteria established in Internal Control -– Integrated Framework (2013) issued by the Committee of Sponsoring Organizations of the Treadway Commission. In our opinion, because of the effect of the material weaknesses, described below, on the achievement of the objectives of the control criteria, the Company has not maintained effective internal control over financial reporting as of December 31, 2019,2022, based on criteria established in Internal Control -– Integrated Framework (2013) issued by the Committee of Sponsoring Organizations of the Treadway Commission.
We also have audited, in accordance with the standards of the Public Company Accounting Oversight Board (United States) (PCAOB), the consolidated balance sheets of the Company as of December 31, 20192022 and 2018,2021, the related consolidated statements of income (loss), comprehensive income (loss), cash flows, and shareholders’ equity for each of the years in the two-yearthree-year period ended December 31, 2019,2022, and the related notes (collectively, the consolidated financial statements), and our report dated March 16, 20202023 expressed an unqualified opinion on those consolidated financial statements.
A material weakness is a deficiency, or a combination of deficiencies, in internal control over financial reporting, such that there is a reasonable possibility that a material misstatement of the company’s annual or interim financial statements will not be prevented or detected on a timely basis. MaterialThe material weaknesses related to the Company not sufficiently attracting, developing, and retaining competent resources to fulfill internal control responsibilities and not having an ineffective control environment resulting from an insufficient number of trained resources, ineffective risk assessment, ineffectiveeffective information and communication process that identified and ineffective monitoring activities resultingassessed the source of and controls necessary to ensure the reliability of information used in ineffective control activities related tofinancial reporting. As a consequence, the Company did not effectively design, implement and operation ofoperate process-level controls and general information technology controls across allits financial reporting processesprocesses. The material weaknesses have been identified and included in management’s assessment. The material weaknesses were considered in determining the nature, timing, and extent of audit tests applied in our audit of the 20192022 consolidated financial statements, and this report does not affect our report on those consolidated financial statements.
Basis for Opinion
The Company’s management is responsible for maintaining effective internal control over financial reporting and for its assessment of the effectiveness of internal control over financial reporting, included in the accompanying Management’s Report on Internal Control Over Financial Reporting as of December 31, 2019.Reporting. Our responsibility is to express an opinion on the Company’s internal control over financial reporting based on our audit. We are a public accounting firm registered with the PCAOB and are required to be independent with respect to the Company in accordance with the U.S. federal securities laws and the applicable rules and regulations of the Securities and Exchange Commission and the PCAOB.
We conducted our audit in accordance with the standards of the PCAOB. Those standards require that we plan and perform the audit to obtain reasonable assurance about whether effective internal control over financial reporting was maintained in all material respects. Our audit of internal control over financial reporting included obtaining an understanding of internal control over financial reporting, assessing the risk that a material weakness exists, and testing and evaluating the design and operating effectiveness of internal control based on the assessed risk. Our audit also included performing such other procedures as we considered necessary in the circumstances. We believe that our audit provides a reasonable basis for our opinion.
Definition and Limitations of Internal Control Over Financial Reporting
A company’s internal control over financial reporting is a process designed to provide reasonable assurance regarding the reliability of financial reporting and the preparation of financial statements for external purposes in accordance with generally accepted accounting principles. A company’s internal control over financial reporting includes those policies and procedures that (1) pertain to the maintenance of records that, in reasonable detail, accurately and fairly reflect the transactions and dispositions of the assets of the company; (2) provide reasonable assurance that transactions are recorded as necessary to permit preparation of financial statements in accordance with generally accepted accounting principles, and that receipts and expenditures of the company are being made only in accordance with authorizations of management and directors of the company; and (3) provide reasonable assurance regarding prevention or timely detection of unauthorized acquisition, use, or disposition of the company’s assets that could have a material effect on the financial statements.
Because of its inherent limitations, internal control over financial reporting may not prevent or detect misstatements. Also, projections of any evaluation of effectiveness to future periods are subject to the risk that controls may become inadequate because of changes in conditions, or that the degree of compliance with the policies or procedures may deteriorate.
/s/ KPMG LLP
Richmond, Virginia
March 16, 20202023
Report of Independent Registered Public Accounting Firm
To the Board of Directors and Shareholders of Tredegar Corporation
Opinion on the Financial Statements
We have audited the consolidated statements of income, of comprehensive income (loss), of shareholders’ equity, and of cash flows of Tredegar Corporation and its subsidiaries (the “Company”) for the year ended December 31, 2017, including the related notes (collectively referred to as the “consolidated financial statements”). In our opinion, the consolidated financial statements present fairly, in all material respects, the results of operations and cash flows of the Company for the year ended December 31, 2017 in conformity with accounting principles generally accepted in the United States of America.
Basis for Opinion
These consolidatedfinancial statements are the responsibility of the Company's management. Our responsibility is to express an opinion on the Company’s consolidatedfinancial statements based on our audit. We are a public accounting firm registered with the Public Company Accounting Oversight Board (United States) (PCAOB) and are required to be independent with respect to the Company in accordance with the U.S. federal securities laws and the applicable rules and regulations of the Securities and Exchange Commission and the PCAOB.
We conducted our audit of these consolidatedfinancial statements in accordance with the standards of the PCAOB. Those standards require that we plan and perform the audit to obtain reasonable assurance about whether the consolidatedfinancial statements are free of material misstatement, whether due to error or fraud.
Our audit included performing procedures to assess the risks of material misstatement of the consolidated financial statements, whether due to error or fraud, and performing procedures that respond to those risks. Such procedures included examining, on a test basis, evidence regarding the amounts and disclosures in the consolidatedfinancial statements. Our audit also included evaluating the accounting principles used and significant estimates made by management, as well as evaluating the overall presentation of the consolidatedfinancial statements. We believe that our audit provides a reasonable basis for our opinion.
/s/ PricewaterhouseCoopers LLP
Richmond, Virginia
February 21, 2018, except for the change in the manner in which the Company accounts for pension and postretirement benefits discussed in Note 1 (not presented herein) to the consolidated financial statements appearing under Item 15 of the Company’s 2018 annual report on Form 10-K, as to which the date is March 18, 2019, and except for the change in the manner in which the Company measures segment profit and loss discussed in Note 5 to the consolidated financial statements, as to which the date is March 16, 2020.
We served as the Company's auditor from 1989 to 2018.
CONSOLIDATED BALANCE SHEETS
Tredegar Corporation and Subsidiaries
| | | | | | | | | December 31 |
| December 31 | | 2019 | | 2018 | |
| | | 2022 | | 2021 |
| (In thousands, except share data) | (In thousands, except share data) | | | | (In thousands, except share data) | |
| Assets | Assets | | | | Assets | |
| Current assets: | Current assets: | | | | Current assets: | |
| Cash and cash equivalents | Cash and cash equivalents | $ | 31,422 |
| | $ | 34,397 |
| Cash and cash equivalents | $ | 19,232 | | | $ | 30,521 | |
| Accounts and other receivables, net of allowance for doubtful accounts and sales returns of $3,036 in 2019 and $2,937 in 2018 | 107,558 |
| | 124,727 |
| |
| Accounts and other receivables, net | | Accounts and other receivables, net | 84,544 | | | 103,312 | |
| Income taxes recoverable | Income taxes recoverable | 4,100 |
| | 6,783 |
| Income taxes recoverable | 733 | | | 2,558 | |
| Inventories | Inventories | 81,380 |
| | 93,810 |
| Inventories | 127,771 | | | 88,569 | |
| Prepaid expenses and other | Prepaid expenses and other | 8,696 |
| | 9,564 |
| Prepaid expenses and other | 10,304 | | | 11,275 | |
| Current assets of discontinued operations | | Current assets of discontinued operations | — | | | 178 | |
| Total current assets | Total current assets | 233,156 |
| | 269,281 |
| Total current assets | 242,584 | | | 236,413 | |
| Property, plant and equipment, at cost: | Property, plant and equipment, at cost: | | | | Property, plant and equipment, at cost: | |
| Land and land improvements | Land and land improvements | 9,744 |
| | 8,772 |
| Land and land improvements | 4,832 | | | 4,537 | |
| Buildings | Buildings | 106,551 |
| | 101,332 |
| Buildings | 71,129 | | | 69,406 | |
| Machinery and equipment | Machinery and equipment | 694,506 |
| | 682,968 |
| Machinery and equipment | 455,960 | | | 424,368 | |
| Total property, plant and equipment | Total property, plant and equipment | 810,801 |
| | 793,072 |
| Total property, plant and equipment | 531,921 | | | 498,311 | |
| Less accumulated depreciation | Less accumulated depreciation | (567,911 | ) | | (564,703 | ) | Less accumulated depreciation | (345,510) | | | (327,930) | |
| Net property, plant and equipment | Net property, plant and equipment | 242,890 |
| | 228,369 |
| Net property, plant and equipment | 186,411 | | | 170,381 | |
| Right-of-use leased assets | Right-of-use leased assets | 19,220 |
| | — |
| Right-of-use leased assets | 14,021 | | | 13,847 | |
| Investment in kaléo (cost basis of $7,500) | 95,500 |
| | 84,600 |
| |
| Identifiable intangible assets, net | Identifiable intangible assets, net | 22,636 |
| | 36,295 |
| Identifiable intangible assets, net | 11,690 | | | 14,152 | |
| Goodwill | Goodwill | 81,404 |
| | 81,404 |
| Goodwill | 70,608 | | | 70,608 | |
| Deferred income tax assets | Deferred income tax assets | 13,129 |
| | 3,412 |
| Deferred income tax assets | 13,900 | | | 15,723 | |
| Other assets | Other assets | 4,733 |
| | 4,012 |
| Other assets | 2,879 | | | 2,460 | |
| Total assets | Total assets | $ | 712,668 |
| | $ | 707,373 |
| Total assets | $ | 542,093 | | | $ | 523,584 | |
| Liabilities and Shareholders’ Equity | Liabilities and Shareholders’ Equity | | | | Liabilities and Shareholders’ Equity | |
| Current liabilities: | Current liabilities: | | | | Current liabilities: | |
| Accounts payable | Accounts payable | $ | 103,657 |
| | $ | 112,758 |
| Accounts payable | $ | 114,938 | | | $ | 123,760 | |
| Accrued expenses | Accrued expenses | 45,809 |
| | 42,495 |
| Accrued expenses | 31,603 | | | 33,104 | |
| Lease liability, short-term | Lease liability, short-term | 3,002 |
| | — |
| Lease liability, short-term | 2,035 | | | 2,158 | |
| Income taxes payable | | Income taxes payable | 1,137 | | | 9,333 | |
| Current liabilities of discontinued operations | | Current liabilities of discontinued operations | — | | | 193 | |
| Total current liabilities | Total current liabilities | 152,468 |
| | 155,253 |
| Total current liabilities | 149,713 | | | 168,548 | |
| Lease liability, long-term | Lease liability, long-term | 17,689 |
| | — |
| Lease liability, long-term | 12,738 | | | 12,831 | |
| Long-term debt | Long-term debt | 42,000 |
| | 101,500 |
| Long-term debt | 137,000 | | | 73,000 | |
| Pension and other postretirement benefit obligations, net | Pension and other postretirement benefit obligations, net | 107,446 |
| | 88,124 |
| Pension and other postretirement benefit obligations, net | 35,046 | | | 78,265 | |
| Deferred income tax liabilities | 11,019 |
| | — |
| |
| Other noncurrent liabilities | 5,297 |
| | 7,639 |
| |
| | Other non-current liabilities | | Other non-current liabilities | 5,834 | | | 6,218 | |
| Total liabilities | Total liabilities | 335,919 |
| | 352,516 |
| Total liabilities | 340,331 | | | 338,862 | |
| Contingencies (Note 18) | | Contingencies (Note 18) | |
| Shareholders’ equity: | Shareholders’ equity: | | | | Shareholders’ equity: | |
| Common stock (no par value): | Common stock (no par value): | | | | Common stock (no par value): | |
| Authorized 150,000,000 shares; | Authorized 150,000,000 shares; | | | | Authorized 150,000,000 shares; | |
| Issued and outstanding—33,365,039 shares in 2019 and 33,176,024 in 2018 (including restricted stock) | 45,514 |
| | 38,892 |
| |
| Common stock held in trust for savings restoration plan (74,798 shares in 2019 and 72,883 in 2018) | (1,592 | ) | | (1,559 | ) | |
| Issued and outstanding— 34,000,642 shares in 2022 and 33,736,629 in 2021 (including restricted stock) | | Issued and outstanding— 34,000,642 shares in 2022 and 33,736,629 in 2021 (including restricted stock) | 58,824 | | | 55,174 | |
| Common stock held in trust for savings restoration plan (113,316 shares in 2022 and 108,433 in 2021) | | Common stock held in trust for savings restoration plan (113,316 shares in 2022 and 108,433 in 2021) | (2,188) | | | (2,135) | |
| Accumulated other comprehensive income (loss): | Accumulated other comprehensive income (loss): | | | | Accumulated other comprehensive income (loss): | |
| Foreign currency translation adjustment | Foreign currency translation adjustment | (100,663 | ) | | (96,940 | ) | Foreign currency translation adjustment | (86,079) | | | (85,792) | |
| Gain (loss) on derivative financial instruments | Gain (loss) on derivative financial instruments | (1,307 | ) | | (1,601 | ) | Gain (loss) on derivative financial instruments | (2,480) | | | 901 | |
| Pension and other postretirement benefit adjustments | Pension and other postretirement benefit adjustments | (95,681 | ) | | (81,446 | ) | Pension and other postretirement benefit adjustments | (59,036) | | | (64,613) | |
| Retained earnings | Retained earnings | 530,478 |
| | 497,511 |
| Retained earnings | 292,721 | | | 281,187 | |
| Total shareholders’ equity | Total shareholders’ equity | 376,749 |
| | 354,857 |
| Total shareholders’ equity | 201,762 | | | 184,722 | |
| Total liabilities and shareholders’ equity | Total liabilities and shareholders’ equity | $ | 712,668 |
| | $ | 707,373 |
| Total liabilities and shareholders’ equity | $ | 542,093 | | | $ | 523,584 | |
| | | | | | |
See accompanying notes to financial statements.
CONSOLIDATED STATEMENTS OF INCOME (LOSS)
Tredegar Corporation and Subsidiaries
| | | | | | | | | | | Years Ended December 31 |
| Years Ended December 31 | | 2019 | | 2018 | | 2017 | |
| | | 2022 | | 2021 | | 2020 |
| (In thousands, except per-share data) | (In thousands, except per-share data) | | | | | | (In thousands, except per-share data) | |
| Revenues and other: | Revenues and other: | | | | | | Revenues and other: | |
| Sales | Sales | $ | 972,358 |
| | $ | 1,065,471 |
| | $ | 961,330 |
| Sales | $ | 938,564 | | | $ | 826,455 | | | $ | 755,290 | |
| Other income (expense), net | Other income (expense), net | 34,795 |
| | 30,459 |
| | 51,713 |
| Other income (expense), net | 935 | | | 20,376 | | | (67,294) | |
| | | 1,007,153 |
| | 1,095,930 |
| | 1,013,043 |
| | 939,499 | | | 846,831 | | | 687,996 | |
| Costs and expenses: | Costs and expenses: | | | | | | Costs and expenses: | |
| Cost of goods sold | Cost of goods sold | 767,511 |
| | 849,756 |
| | 767,550 |
| Cost of goods sold | 764,042 | | | 649,690 | | | 558,967 | |
| Freight | Freight | 36,063 |
| | 36,027 |
| | 33,683 |
| Freight | 34,982 | | | 28,232 | | | 25,686 | |
| Selling, general and administrative | Selling, general and administrative | 94,352 |
| | 85,283 |
| | 83,386 |
| Selling, general and administrative | 78,790 | | | 74,964 | | | 84,246 | |
| Research and development | Research and development | 19,636 |
| | 18,707 |
| | 18,287 |
| Research and development | 6,214 | | | 6,347 | | | 8,398 | |
| Amortization of identifiable intangibles | Amortization of identifiable intangibles | 13,601 |
| | 3,976 |
| | 6,198 |
| Amortization of identifiable intangibles | 2,520 | | | 1,704 | | | 3,017 | |
| Pension and postretirement benefits | Pension and postretirement benefits | 9,642 |
| | 10,406 |
| | 10,193 |
| Pension and postretirement benefits | 14,569 | | | 14,160 | | | 14,720 | |
| Interest expense | Interest expense | 4,051 |
| | 5,702 |
| | 6,170 |
| Interest expense | 4,990 | | | 3,386 | | | 2,587 | |
| Asset impairments and costs associated with exit and disposal activities | 4,125 |
| | 2,913 |
| | 102,488 |
| |
| Goodwill impairment charge | — |
| | 46,792 |
| | — |
| |
| Asset impairments and costs associated with exit and disposal activities, net of adjustments | | Asset impairments and costs associated with exit and disposal activities, net of adjustments | 622 | | | 1,127 | | | 1,725 | |
| Goodwill impairment | | Goodwill impairment | — | | | — | | | 13,696 | |
| Total | Total | 948,981 |
| | 1,059,562 |
| | 1,027,955 |
| Total | 906,729 | | | 779,610 | | | 713,042 | |
| Income (loss) before income taxes | 58,172 |
| | 36,368 |
| | (14,912 | ) | |
| Income (loss) from continuing operations before income taxes | | Income (loss) from continuing operations before income taxes | 32,770 | | | 67,221 | | | (25,046) | |
| Income tax expense (benefit) | Income tax expense (benefit) | 9,913 |
| | 11,526 |
| | (53,163 | ) | Income tax expense (benefit) | 4,389 | | | 9,284 | | | (8,213) | |
| Net income | $ | 48,259 |
| | $ | 24,842 |
| | $ | 38,251 |
| |
| Net income (loss) from continuing operations | | Net income (loss) from continuing operations | 28,381 | | | 57,937 | | | (16,833) | |
| Income (loss) from discontinued operations, net of tax | | Income (loss) from discontinued operations, net of tax | 74 | | | (111) | | | (58,611) | |
| Net income (loss) | | Net income (loss) | $ | 28,455 | | | $ | 57,826 | | | $ | (75,444) | |
| | | | | | | | |
| Earnings per share: | | | | | | |
| Earnings (loss) per share: | | Earnings (loss) per share: | |
| Basic: | | Basic: | |
| Continuing operations | | Continuing operations | $ | 0.84 | | | $ | 1.72 | | | $ | (0.51) | |
| Discontinued operations | | Discontinued operations | — | | | — | | | (1.75) | |
| Basic earnings (loss) per share | | Basic earnings (loss) per share | $ | 0.84 | | | $ | 1.72 | | | $ | (2.26) | |
| Diluted: | | Diluted: | |
| Continuing operations | | Continuing operations | $ | 0.84 | | | $ | 1.72 | | | $ | (0.51) | |
| Discontinued operations | | Discontinued operations | — | | | — | | | (1.75) | |
| Diluted earnings (loss) per share | | Diluted earnings (loss) per share | $ | 0.84 | | | $ | 1.72 | | | $ | (2.26) | |
| | Shares used to compute earnings (loss) per share: | | Shares used to compute earnings (loss) per share: | |
| Basic | Basic | $ | 1.45 |
| | $ | 0.75 |
| | $ | 1.16 |
| Basic | 33,806 | | 33,563 | | 33,402 |
| Diluted | Diluted | $ | 1.45 |
| | $ | 0.75 |
| | $ | 1.16 |
| Diluted | 33,826 | | 33,670 | | 33,402 |
See accompanying notes to financial statements.
CONSOLIDATED STATEMENTS OF COMPREHENSIVE INCOME (LOSS)
Tredegar Corporation and Subsidiaries
|
| | | | | | | | | | | | |
| Years Ended December 31 | | 2019 | | 2018 | | 2017 |
| (In thousands, except per-share data) | | | | | |
| Net income | $ | 48,259 |
| | $ | 24,842 |
| | $ | 38,251 |
|
| Other comprehensive income (loss): | | | | | |
| Unrealized foreign currency translation adjustment (net of tax benefit of $623 in 2019, tax of $281 in 2018 and tax benefit of $371 in 2017) | (3,723 | ) | | (10,762 | ) | | 7,792 |
|
| Derivative financial instruments adjustment (net of tax of $71 in 2019, tax benefit of $503 in 2018 and tax of $111 in 2017) | 294 |
| | (2,060 | ) | | (404 | ) |
| Pension & other postretirement benefit adjustments: | | | | | |
| Net gains (losses) and prior service costs (net of tax benefit of $6,417 in 2019, tax benefit of $319 in 2018 and tax benefit of $2,518 in 2017) | (22,508 | ) | | (1,118 | ) | | (8,634 | ) |
| Amortization of prior service costs and net gains or losses (net of tax of $2,359 in 2019, tax of $3,028 in 2018 and tax of $4,234 in 2017) | 8,273 |
| | 10,622 |
| | 7,811 |
|
| Other comprehensive income (loss) | (17,664 | ) | | (3,318 | ) | | 6,565 |
|
| Comprehensive income (loss) | $ | 30,595 |
| | $ | 21,524 |
| | $ | 44,816 |
|
| | | | | | | | | | | | | | | | | |
| Years Ended December 31 |
| 2022 | | 2021 | | 2020 |
| (In thousands) | |
| Net income (loss) | $ | 28,455 | | | $ | 57,826 | | | $ | (75,444) | |
| Other comprehensive income (loss): | | | | | |
| Unrealized foreign currency translation adjustment (net of tax expense of $290 in 2022, net of tax benefit of $365 in 2021 and net of tax benefit of $897 in 2020) | (287) | | | (1,643) | | | (8,781) | |
| Reclassification of foreign currency translation loss realized on the sale of Personal Care Films | — | | | — | | | 25,295 | |
| Derivative financial instruments adjustment (net of tax benefit of $336 in 2022, net of tax benefit of $351 in 2021 and net of tax expense of $790 in 2020) | (3,381) | | | (1,363) | | | 3,571 | |
| Pension & other postretirement benefit adjustments: | | | | | |
| Net gains (losses) and prior service costs (net of tax benefit of $1,400 in 2022, net of tax expense of $5,212 in 2021 and net of tax benefit of $4,228 in 2020) | (5,064) | | | 18,720 | | | (12,197) | |
| Amortization of prior service costs and net gains or losses (net of tax expense of $2,965 in 2022, net of tax expense of $3,676 in 2021 and net of tax expense of $3,937 in 2020) | 10,641 | | | 13,186 | | | 11,359 | |
| Other comprehensive income (loss) | 1,909 | | | 28,900 | | | 19,247 | |
| Comprehensive income (loss) | $ | 30,364 | | | $ | 86,726 | | | $ | (56,197) | |
See accompanying notes to financial statements.
CONSOLIDATED STATEMENTS OF CASH FLOWS
Tredegar Corporation and Subsidiaries
|
| | | | | | | | | | | | |
| Years Ended December 31 | | 2019 | | 2018 | | 2017 |
| (In thousands) | | | | | |
| Cash flows from operating activities: | | | | | |
| Net income | $ | 48,259 |
| | $ | 24,842 |
| | $ | 38,251 |
|
| Adjustments for noncash items: | | | | | |
| Depreciation | 30,683 |
| | 29,828 |
| | 34,079 |
|
| Amortization of identifiable intangibles | 13,601 |
| | 3,976 |
| | 6,198 |
|
| Goodwill impairment charge | — |
| | 46,792 |
| | — |
|
| Reduction of right-of-use lease asset | 2,588 |
| | — |
| | — |
|
| Deferred income taxes | 5,856 |
| | 8,626 |
| | (36,414 | ) |
| Accrued pension and postretirement benefits | 9,642 |
| | 10,406 |
| | 10,193 |
|
| (Gain) loss on investment in kaléo accounted for under the fair value method | (10,900 | ) | | (30,600 | ) | | (33,800 | ) |
| Loss on asset impairments | 519 |
| | 223 |
| | 101,282 |
|
| (Gain) loss on sale of assets | (6,334 | ) | | (46 | ) | | 553 |
|
| Gain from insurance recoveries | — |
| | — |
| | (5,261 | ) |
| Changes in assets and liabilities: | | | | | |
| Accounts and other receivables | 16,471 |
| | (11,883 | ) | | (10,566 | ) |
| Inventories | 11,315 |
| | (9,577 | ) | | (9,128 | ) |
| Income taxes recoverable/payable | 2,644 |
| | 25,018 |
| | (24,449 | ) |
| Prepaid expenses and other | 795 |
| | (1,924 | ) | | (784 | ) |
| Accounts payable and accrued expenses | (2,937 | ) | | 5,571 |
| | 21,123 |
|
| Lease liability | (2,723 | ) | | — |
| | — |
|
| Pension and postretirement benefit plan contributions | (8,614 | ) | | (8,907 | ) | | (5,829 | ) |
| Other, net | 4,998 |
| | 5,449 |
| | 2,767 |
|
| Net cash provided by operating activities | 115,863 |
| | 97,794 |
| | 88,215 |
|
| Cash flows from investing activities: | | | | | |
| Capital expenditures | (50,864 | ) | | (40,814 | ) | | (44,362 | ) |
| Acquisitions, net of cash acquired | — |
| | — |
| | (87,110 | ) |
| Return of escrowed funds relating to acquisition earn-out | — |
| | 4,250 |
| | — |
|
| Net proceeds from the sale of investment property | — |
| | 1,384 |
| | — |
|
| Insurance proceeds from cast house explosion | — |
| | — |
| | 5,739 |
|
| Proceeds from the sale of assets and other | 10,936 |
| | 1,098 |
| | 129 |
|
| Net cash used in investing activities | (39,928 | ) | | (34,082 | ) | | (125,604 | ) |
| Cash flows from financing activities: | | | | | |
| Borrowings | 65,500 |
| | 76,750 |
| | 190,750 |
|
| Debt principal payments | (125,000 | ) | | (127,250 | ) | | (133,750 | ) |
| Dividends paid | (15,325 | ) | | (14,592 | ) | | (14,532 | ) |
| Debt financing costs | (1,817 | ) | | — |
| | — |
|
| Repurchase of employee common stock for tax withholdings | (854 | ) | | (328 | ) | | (124 | ) |
| Proceeds from exercise of stock options and other | 184 |
| | 1,332 |
| | 819 |
|
| Net cash provided by (used in) financing activities: | (77,312 | ) | | (64,088 | ) | | 43,163 |
|
| Effect of exchange rate changes on cash | (1,598 | ) | | (1,718 | ) | | 1,206 |
|
| Increase (decrease) in cash and cash equivalents | (2,975 | ) | | (2,094 | ) | | 6,980 |
|
| Cash and cash equivalents at beginning of period | 34,397 |
| | 36,491 |
| | 29,511 |
|
| Cash and cash equivalents at end of period | $ | 31,422 |
| | $ | 34,397 |
| | $ | 36,491 |
|
| Supplemental cash flow information: | | | | | |
| Interest payments | $ | 4,358 |
| | $ | 5,421 |
| | $ | 5,808 |
|
| Income tax payments (refunds), net | $ | 2,595 |
| | $ | (24,020 | ) | | $ | 9,193 |
|
| | | | | | | | | | | | | | | | | |
| Years Ended December 31 |
| 2022 | | 2021 | | 2020 |
| (In thousands) |
| Cash flows from operating activities: | | | | | |
| Net income (loss) | $ | 28,455 | | | $ | 57,826 | | | $ | (75,444) | |
| Adjustments for noncash items: | | | | | |
| Depreciation | 23,882 | | | 22,080 | | | 28,940 | |
| Amortization of identifiable intangibles | 2,520 | | | 1,704 | | | 3,017 | |
| Goodwill impairment | — | | | — | | | 13,696 | |
| Reduction of right-of-use lease asset | 2,098 | | | 2,086 | | | 2,753 | |
| Deferred income taxes | 544 | | | (4,944) | | | (16,892) | |
| Accrued pension and postretirement benefits | 14,602 | | | 14,160 | | | 14,720 | |
| Stock-based compensation expense | 3,619 | | | 5,167 | | | 5,402 | |
| (Gain) loss on investment in kaléo | (1,406) | | | (12,462) | | | 60,900 | |
| Loss on sale of divested businesses | — | | | — | | | 52,326 | |
| Changes in assets and liabilities: | | | | | |
| Accounts and other receivables | 18,569 | | | (16,993) | | | (335) | |
| Inventories | (37,771) | | | (23,132) | | | (4,366) | |
| Income taxes recoverable/payable | (6,423) | | | 8,956 | | | 1,617 | |
| Prepaid expenses and other | (2,526) | | | 3,612 | | | (2,203) | |
| Accounts payable and accrued expenses | (14,916) | | | 19,835 | | | 4,045 | |
| Lease liability | (2,301) | | | (1,935) | | | (3,049) | |
| Pension and postretirement benefit plan contributions | (50,660) | | | (5,687) | | | (12,681) | |
| Other, net | 870 | | | 310 | | | 1,927 | |
| Net cash (used in) provided by operating activities | (20,844) | | | 70,583 | | | 74,373 | |
| Cash flows from investing activities: | | | | | |
| Capital expenditures | (36,875) | | | (27,361) | | | (23,355) | |
| Proceeds from the sale of kaléo | 1,406 | | | 47,062 | | | — | |
| Net proceeds on sale of divested businesses | — | | | — | | | 56,236 | |
| Proceeds from the sale of assets and other | 10 | | | 4,749 | | | — | |
| Net cash (used in) provided by investing activities | (35,459) | | | 24,450 | | | 32,881 | |
| Cash flows from financing activities: | | | | | |
| Borrowings | 313,500 | | | 75,500 | | | 162,250 | |
| Debt principal payments | (249,500) | | | (136,500) | | | (70,250) | |
| Dividends paid | (16,974) | | | (16,167) | | | (216,049) | |
| Debt financing costs | (1,245) | | | — | | | (693) | |
| Other | (396) | | | 325 | | | (850) | |
| Net cash provided by (used in) financing activities: | 45,385 | | | (76,842) | | | (125,592) | |
| Effect of exchange rate changes on cash | (371) | | | 484 | | | (1,238) | |
| (Decrease) increase in cash and cash equivalents | (11,289) | | | 18,675 | | | (19,576) | |
| Cash and cash equivalents at beginning of period | 30,521 | | | 11,846 | | | 31,422 | |
| Cash and cash equivalents at end of period | $ | 19,232 | | | $ | 30,521 | | | $ | 11,846 | |
| Supplemental cash flow information: | | | | | |
| Interest payments | $ | 4,423 | | | $ | 2,923 | | | $ | 1,679 | |
| Income tax payments, net | $ | 10,814 | | | $ | 4,706 | | | $ | 1,670 | |
See accompanying notes to financial statements.
CONSOLIDATED STATEMENTS OF SHAREHOLDERS’ EQUITY
Tredegar Corporation and Subsidiaries
|
| | | | | | | | | | | | | | | | | | | | | | | | | | | | | | |
| | | | | | | | | | Accumulated Other Comprehensive Income (Loss) | | |
| | Common Stock | | Retained Earnings | | Trust for Savings Restora-tion Plan | | Foreign Currency Trans-lation | | Gain (Loss) on Derivative Financial Instruments | | Pension & Other Post- retirement Benefit Adjust. | | Total Share- holders’ Equity |
| (In thousands, except share and per-share data) | Shares | | Amount | | | | | | |
| Balance at January 1, 2017 | 32,933,807 |
| | $ | 32,007 |
| | $ | 463,507 |
| | $ | (1,497 | ) | | $ | (93,970 | ) | | $ | 863 |
| | $ | (90,127 | ) | | $ | 310,783 |
|
| Net income | — |
| | — |
| | 38,251 |
| | — |
| | — |
| | — |
| | — |
| | 38,251 |
|
| Foreign currency translation adjustment (net of tax benefit of $371) | — |
| | — |
| | — |
| | — |
| | 7,792 |
| | — |
| | — |
| | 7,792 |
|
| Derivative financial instruments adjustment (net of tax of $111) | — |
| | — |
| | — |
| | — |
| | — |
| | (404 | ) | | — |
| | (404 | ) |
| Net gains or losses and prior service costs (net of tax benefit of $2,518) | — |
| | — |
| | — |
| | — |
| | — |
| | — |
| | (8,634 | ) | | (8,634 | ) |
| Amortization of prior service costs and net gains or losses (net of tax of $4,234) | — |
| | — |
| | — |
| | — |
| | — |
| | — |
| | 7,811 |
| | 7,811 |
|
| Cash dividends declared ($0.44 per share) | — |
| | — |
| | (14,532 | ) | | — |
| | — |
| | — |
| | — |
| | (14,532 | ) |
| Stock-based compensation expense | 49,475 |
| | 2,018 |
| | — |
| | — |
| | — |
| | — |
| | — |
| | 2,018 |
|
| Repurchase of employee common stock for tax withholdings | (7,125 | ) | | (124 | ) | | — |
| | — |
| | — |
| | — |
| | — |
| | (124 | ) |
| Issued upon exercise of stock options | 41,265 |
| | 819 |
| | — |
| | — |
| | — |
| | — |
| | — |
| | 819 |
|
| Cumulative effect adjustment for adoption of stock-based compensation accounting guidance | — |
| | 27 |
| | (27 | ) | | — |
| | — |
| | — |
| | — |
| | — |
|
| Tredegar common stock purchased by trust for savings restoration plan | — |
| | — |
| | 31 |
| | (31 | ) | | — |
| | — |
| | — |
| | — |
|
| Balance at December 31, 2017 | 33,017,422 |
| | 34,747 |
| | 487,230 |
| | (1,528 | ) | | (86,178 | ) | | 459 |
| | (90,950 | ) | | 343,780 |
|
| Net income | — |
| | — |
| | 24,842 |
| | — |
| | — |
| | — |
| | — |
| | 24,842 |
|
| Foreign currency translation adjustment (net of tax of $281) | — |
| | — |
| | — |
| | — |
| | (10,762 | ) | | — |
| | — |
| | (10,762 | ) |
| Derivative financial instruments adjustment (net of tax benefit of $503) | — |
| | — |
| | — |
| | — |
| | — |
| | (2,060 | ) | | — |
| | (2,060 | ) |
| Net gains or losses and prior service costs (net of tax benefit of $319) | — |
| | — |
| | — |
| | — |
| | — |
| | — |
| | (1,118 | ) | | (1,118 | ) |
| Amortization of prior service costs and net gains or losses (net of tax of $3,028) | — |
| | — |
| | — |
| | — |
| | — |
| | — |
| | 10,622 |
| | 10,622 |
|
| Cash dividends declared ($0.44 per share) | — |
| | — |
| | (14,592 | ) | | | | | | | | | | (14,592 | ) |
| Stock-based compensation expense | 102,762 |
| | 3,141 |
| | — |
| | — |
| | — |
| | — |
| | — |
| | 3,141 |
|
| Repurchase of employee common stock for tax withholdings | (17,558 | ) | | (328 | ) | | — |
| | — |
| | — |
| | — |
| | — |
| | (328 | ) |
| Issued upon exercise of stock options | 73,398 |
| | 1,332 |
| | — |
| | — |
| | — |
| | — |
| | — |
| | 1,332 |
|
| Tredegar common stock purchased by trust for savings restoration plan | — |
| | — |
| | 31 |
| | (31 | ) | | — |
| | — |
| | — |
| | — |
|
| Balance at December 31, 2018 | 33,176,024 |
| | 38,892 |
| | 497,511 |
| | (1,559 | ) | | (96,940 | ) | | (1,601 | ) | | (81,446 | ) | | 354,857 |
|
| Net income | — |
| | — |
| | 48,259 |
| | — |
| | — |
| | — |
| | — |
| | 48,259 |
|
| Foreign currency translation adjustment (net of tax benefit of $623) | — |
| | — |
| | — |
| | — |
| | (3,723 | ) | | — |
| | — |
| | (3,723 | ) |
| Derivative financial instruments adjustment (net of tax of $71) | — |
| | — |
| | — |
| | — |
| | — |
| | 294 |
| | — |
| | 294 |
|
| Net gains or losses (net of tax benefit of $6,417) | — |
| | — |
| | — |
| | — |
| | — |
| | — |
| | (22,508 | ) | | (22,508 | ) |
| Amortization of net gains or losses (net of tax of $2,359) | — |
| | — |
| | — |
| | — |
| | — |
| | — |
| | 8,273 |
| | 8,273 |
|
| Cash dividends declared ($0.46 per share) | — |
| | — |
| | (15,325 | ) | | — |
| | — |
| | — |
| | — |
| | (15,325 | ) |
| Stock-based compensation expense | 228,959 |
| | 7,292 |
| | — |
| | — |
| | — |
| | — |
| | — |
| | 7,292 |
|
| Repurchase of employee common stock for tax withholdings | (49,444 | ) | | (854 | ) | | — |
| | — |
| | — |
| | — |
| | — |
| | (854 | ) |
| Issued upon exercise of stock options | 9,500 |
| | 184 |
| | — |
| | — |
| | — |
| | — |
| | — |
| | 184 |
|
| Tredegar common stock purchased by trust for savings restoration plan | — |
| | — |
| | 33 |
| | (33 | ) | | — |
| | — |
| | — |
| | — |
|
| Balance at December 31, 2019 | 33,365,039 |
| | $ | 45,514 |
| | $ | 530,478 |
| | $ | (1,592 | ) | | $ | (100,663 | ) | | $ | (1,307 | ) | | $ | (95,681 | ) | | $ | 376,749 |
|
| | | | | | | | | | | | | | | | | | | | | | | | | | | | | | | | | | | |
| | Common Stock | | Retained
Earnings | | Trust for Savings Restoration Plan | | Accumulated Other Comprehensive Income (Loss) | | Total Shareholders’ Equity |
| (In thousands, except share and per-share data) | Shares | | Amount | | | | |
| Balance at January 1, 2020 | 33,365,039 | | | $ | 45,514 | | | $ | 530,478 | | | $ | (1,592) | | | $ | (197,651) | | | $ | 376,749 | |
| Net income (loss) | — | | | — | | | (75,444) | | | — | | | — | | | (75,444) | |
| Foreign currency translation adjustment | — | | | — | | | — | | | — | | | (8,781) | | | (8,781) | |
| Foreign currency translation loss realized on the sale of Personal Care Films | — | | | — | | | — | | | — | | | 25,295 | | | 25,295 | |
| Derivative financial instruments adjustment | — | | | — | | | — | | | — | | | 3,571 | | | 3,571 | |
| Net gains or (losses) and prior service costs | — | | | — | | | — | | | — | | | (12,197) | | | (12,197) | |
| Amortization of prior service costs and net gains or losses | — | | | — | | | — | | | — | | | 11,359 | | | 11,359 | |
| Cash dividends declared ($6.45 per share) | — | | | — | | | (216,049) | | | — | | | — | | | (216,049) | |
| Stock-based compensation expense | 131,354 | | | 5,402 | | | — | | | — | | | — | | | 5,402 | |
| Repurchase of employee common stock for tax withholdings | (39,217) | | | (850) | | | — | | | — | | | — | | | (850) | |
| | | | | | | | | | | |
| Tredegar common stock purchased by trust for savings restoration plan | — | | | — | | | 495 | | | (495) | | | — | | | — | |
| Balance at December 31, 2020 | 33,457,176 | | | 50,066 | | | 239,480 | | | (2,087) | | | (178,404) | | | 109,055 | |
| Net income (loss) | — | | | — | | | 57,826 | | | — | | | — | | | 57,826 | |
| Foreign currency translation adjustment | — | | | — | | | — | | | — | | | (1,643) | | | (1,643) | |
| Derivative financial instruments adjustment | — | | | — | | | — | | | — | | | (1,363) | | | (1,363) | |
| Net gains or (losses) and prior service costs | — | | | — | | | — | | | — | | | 18,720 | | | 18,720 | |
| Amortization of prior service costs and net gains or losses | — | | | — | | | — | | | — | | | 13,186 | | | 13,186 | |
| Cash dividends declared ($0.48 per share) | — | | | — | | | (16,167) | | | — | | | — | | | (16,167) | |
| Stock-based compensation expense | 229,014 | | | 4,783 | | | — | | | — | | | — | | | 4,783 | |
| Repurchase of employee common stock for tax withholdings | (17,266) | | | (590) | | | — | | | — | | | — | | | (590) | |
| Issued upon exercise of stock options | 67,705 | | | 915 | | | — | | | — | | | — | | | 915 | |
| Tredegar common stock purchased by trust for savings restoration plan | — | | | — | | | 48 | | | (48) | | | — | | | — | |
| Balance at December 31, 2021 | 33,736,629 | | | 55,174 | | | 281,187 | | | (2,135) | | | (149,504) | | | 184,722 | |
| Net income (loss) | — | | | — | | | 28,455 | | | — | | | — | | | 28,455 | |
| Foreign currency translation adjustment | — | | | — | | | — | | | — | | | (287) | | | (287) | |
| Derivative financial instruments adjustment | — | | | — | | | — | | | — | | | (3,381) | | | (3,381) | |
| Net gains or (losses) and prior service costs | — | | | — | | | — | | | — | | | (5,064) | | | (5,064) | |
| Amortization of prior service costs and net gains or losses | — | | | — | | | — | | | — | | | 10,641 | | | 10,641 | |
| Cash dividends declared ($0.50 per share) | — | | | — | | | (16,974) | | | — | | | — | | | (16,974) | |
| Stock-based compensation expense | 294,764 | | | 4,046 | | | — | | | — | | | — | | | 4,046 | |
| | | | | | | | | | | |
| Repurchase of employee common stock for tax withholdings | (30,751) | | | (396) | | | — | | | — | | | — | | | (396) | |
| Tredegar common stock purchased by trust for savings restoration plan | — | | | — | | | 53 | | | (53) | | | — | | | — | |
| Balance at December 31, 2022 | 34,000,642 | | | $ | 58,824 | | | $ | 292,721 | | | $ | (2,188) | | | $ | (147,595) | | | $ | 201,762 | |
See accompanying notes to financial statements.
NOTES TO FINANCIAL STATEMENTS
Tredegar Corporation and Subsidiaries
| |
1 | SUMMARY OF SIGNIFICANT ACCOUNTING POLICIES |
Organization and 1. NATURE OF OPERATIONS AND SUMMARY OF SIGNIFICANT ACCOUNTING POLICIES
Nature of Operations. Tredegar Corporation and subsidiaries (collectively “Tredegar,” “the Company,” “we,” “us” or “our”) are primarily engagedis an industrial manufacturer with three primary businesses: custom aluminum extrusions for the North American building & construction, automotive and specialty end-use markets; surface protection films for high-technology applications in the manufacture of aluminum extrusions,global electronics industry and polyethylene overwrap films used in bathroom tissue and polyesterpaper towels; and polyester-based films whichfor use in packaging applications that have specialized properties primarily for the Latin American and the United States (“U.S.”) flexible packaging markets. The Company’s business segments are reported for business segment purposes under Aluminum Extrusions (also referred to as Bonnell Aluminum), PE Films, and Flexible Packaging Films (also referred to as Terphane), respectively.. More information on the Company’s business segments is provided in Note 5. See13.
On October 30, 2020, the Company completed the sale of its personal care films business (“Personal Care Films”), which was part of its PE Films segment. The transaction excluded the packaging film lines and related operations located at the Pottsville, Pennsylvania manufacturing site (“Pottsville Packaging”), which are now being reported with the Surface Protection component of PE Films. Commencing in the third quarter of 2020, all historical results for Personal Care Films have been presented as discontinued operations.
For more information on this transaction, see Note 17 regarding restructurings.15.
Basis of Presentation.Presentation and Principles of Consolidation. The consolidated financial statements include the accounts and operations of Tredegarthe Company and all of its wholly-owned subsidiaries.have been prepared in accordance with U.S. generally accepted accounting principles (“GAAP”). Intercompany accountsbalances and transactions have been eliminated in consolidation.
The preparation of financial statements in conformity with United States (“U.S.”) generally accepted accounting principles (“GAAP”) requires Tredegar to make estimates and assumptions that affect the reported amounts of revenues, expenses, assets and liabilities and disclosure of contingent assets and liabilities at the date of the financial statements. Actual results could differ from those estimates.
Certain amounts for the prior years have been reclassified to conform to current year presentation.
Fiscal Year End. The Company operates on a calendar fiscal year except for the Aluminum Extrusions segment, which operates on a 52/53-week fiscal year basis. References to Aluminum Extrusions for 2019, 20182022, 2021 and 20172020 relate to the 52-week fiscal yearyears ended December 29, 2019, the 53-week fiscal year ended25, 2022, December 30, 201826, 2021 and the 52-week fiscal year ended December 24, 2017,27, 2020, respectively. The Company does not believe the impact of reporting the results of this segment as stated abovein this manner is material to the consolidated financial results. The Company may fund or receive cash from the Aluminum Extrusions segment based on Aluminum Extrusion’s cash flows from operations during the intervening period from Aluminum Extrusion’s fiscal year end to the Company’s calendar year end. There was no intercompany funding with Aluminum Extrusions between December 25, 2022 and December 31, 2022 nor between December 27, 2021 and December 31, 2021.
Use of Estimates. The preparation of financial statements in conformity with GAAP requires management to make estimates and assumptions that affect the reported amounts of assets, liabilities, revenue, expenses and disclosure of contingent assets and liabilities (if any). On an ongoing basis, the Company evaluates its estimates, including those related to provisions for transaction and credit losses, income taxes, pension, and the valuation of goodwill and intangible assets, among others. Tredegar bases its estimates on historical experience and various other assumptions which the Company believes to be reasonable under the circumstances. Actual results could differ from those estimates.
Foreign Currency Translation. The financial statements of subsidiaries located outside the U.S., where the local currency is the functional currency, are translated into U.S. Dollars using exchange rates in effect at the period end for assets and liabilities and average exchange rates during each reporting period for results of operations. Adjustments resulting from the translation of these financial statements are reflected as a separate component of shareholders’ equity. There are no operating subsidiaries located outside the U.S. where the U.S. Dollar is the functional currency.
Transaction and remeasurement gains or losses included in income were losses of $0.7$0.4 million, losses of $0.5 million and $0.8gains of $0.6 million in 2019, 20182022, 2021 and 2017,2020, respectively. These amounts do not include the effects between reporting periods that exchange rate changes have on income of the locations outside the U.S. that result from translation into U.S. Dollars.
Cash and Cash Equivalents. Cash and cash equivalents consist of cash on hand in excess of daily operating requirements and highly liquid investments with original maturities of three months or less. At December 31, 20192022 and 2018,2021, Tredegar had cash and cash equivalents of $31.4$19.2 million and $34.4$30.5 million, respectively, including funds held in locations outside the U.S. of $23.0$10.3 million and $31.1$16.4 million, respectively.
The Company’s policy permits investment of excess cash in marketable securities that have the highest credit ratings and maturities of less than one year. The primary objectives of the policy are safety of principal and liquidity.
Accounts and Other Receivables.Receivables, net. Accounts receivable are stated at the amount invoiced to customers less allowances for doubtful accounts and sales returns.accounts. Accounts receivable are non-interest bearing and arise from the sale of product to customers under typical industry trade terms. Notes receivable are not significant.immaterial. Past due amounts are determined based on established terms and charged-off when deemed uncollectible. The allowance for doubtful accounts is determined based on an assessment of probable losses taking into account past due amounts, customer credit profile, historical experience and current economic conditions. For
receivables that do not have a specific allowance, the loss rate is computed by segment to apply to the remaining receivables balance, using each segment’s historic loss rate. Other receivables include value-added taxes related to certain foreign subsidiaries and other miscellaneous receivables due within one year. For certain customers, the Company has arrangements in place with financial institutions whereby certain customer receivables are sold to the financial institution at a discount and without recourse. Upon sale, the associated receivable is derecognizedunrecognized and the discount is recognized. For more information on accounts receivable and other receivables, net, see Note 2.
Inventories. Inventories are stated at the lower of cost or market, with cost determined using the last in, first out (“LIFO”), method, the weighted average cost or the first in, first out (“FIFO”) method. Cost elements included in work-in-process and finished goods inventories are raw materials, direct labor and manufacturing overhead. Finished goods, work-in-process, raw materials and supplies, stores and other inventory are reviewed to determine if inventory quantities are in excess of forecasted usage or if they have become obsolete.
Property, Plant and Equipment. Accounts include costs of assets constructed or purchased, related delivery and installation costs and interest incurred on significant capital projects during their construction periods. Expenditures for renewals and betterments also are capitalized, but expenditures for repairs and maintenance are expensed as incurred. The cost and accumulated depreciation applicable to assets retired or sold are removed from the respective accounts, and gains or losses thereon are included in income.
Capital expenditures for property, plant and equipment include capitalized interest. Capitalized interest included in capital expenditures for property, plant and equipment was $0.9 million, $0.3 million and $0.4 million in 2019, 2018 and 2017, respectively.
immaterial. Depreciation is computed primarily by the straight-line method based on the estimated useful lives of the assets that except for isolated exceptions,generally range from 5 to 40 years for buildings and land improvements and 2 to 20 years for machinery and equipment.
Investments in Private Entities with Less Than or Equal to 50% Voting Ownership Interest. The Company accounts for its investments in private entities where its voting ownership is less than or equal to 50% based on the facts and circumstances surrounding the investment.
For those investments measured at fair value, GAAP requires disclosure of the level within the fair value hierarchy in which fair value measurements in their entirety fall, segregating fair value measurements using quoted prices in active markets for identical assets or liabilities (Level 1), significant other observable inputs (Level 2), and significant unobservable inputs (Level 3).
For more information on investments, see Note 4.
Goodwill and Identifiable Intangibles. The excess of the purchase price over the fair value of identifiable net assets of acquired companies is allocated to goodwill. The Company assesses goodwill for impairment when events or circumstances indicate that the carrying value may not be recoverable, or, at a minimum, on an annual basis (December 1st of each year). When assessing goodwill for impairment, accounting guidance allows the Company to first perform a qualitative assessment about the likelihood of the carrying value of a reporting unit exceeding its fair value, referred to as the "Step 0" assessment. The (“Step 0 assessment requires the evaluation ofanalysis”), which evaluates certain qualitative factors, including macroeconomic conditions, industry and market considerations, cost factors and overall financial performance, as well as company and reporting unit factors. If the Company's Step 0 analysis indicates that it is more likely than not that the fair value of a reporting unit is less than theits carrying amount, then the Company would perform a quantitative impairment test.test (“Step 1 analysis”).
ThereDuring the three months ended September 30, 2022, events and circumstances indicated that the Surface Protection reporting unit (“Surface Protection”), which is also the asset group, might be impaired. The Company performed a Step 1 analysis and long-lived impairment analysis for Surface Protection and determined that the fair value of Surface Protection exceeded its carrying value by 18.6%. Customer demand for electronics has continued to deteriorate since the third quarter of 2022, causing manufacturers in the supply chain to experience reduced capacity utilization and inventory corrections. In addition, these depressed market conditions, which are twoexpected to continue through the first half of 2023, are adversely impacting mix through reduced sales to our highest value-added customers and products. Given the uncertain demand for Surface Protections products, it is reasonably possible that the cash flow estimates used in deriving such fair value measurements may change in the future.
As of December 1, 2022, the Company’s reporting units in Aluminum Extrusions that havewith goodwill as a result of acquisitions in 2012 (“AACOA”) and in 2017 (“Futura”). The Company’s significant reporting unitwere Surface Protection in PE Films with goodwill is Surface Protection. Eachand Futura in Aluminum Extrusions. Both of these reporting units hashave separately identifiable operating net assets (operating assets including goodwill and identifiable intangible assets net of operating liabilities).
The Company estimates the fair value of its reporting units using discounted cash flow analysis and comparative enterprise value-to-EBITDA (earnings before interest, taxes, depreciation and amortization) multiples. The Surface Protection reporting unit of PE Films, AACOA and Futura had goodwill in the amounts of $57.3 million, $13.7 million and $10.4 million, respectively, at December 31, 2019.
As of December 1, 2019, the Company applied the Step 0 goodwill assessment to Surface Protection, AACOA and Futura, which all had fair values significantly in excess of their carrying amounts when last tested using the quantitative impairment test. The Company's Step 0 analysis in 2019analyses as of theDecember 1, 2022 of these reporting units concluded that it is not more likely than not that the fair values of theeach reporting units areunit was less than theirits carrying amounts.amount. Therefore, the Step 1 quantitative goodwill impairment testtests for these reporting units waswere not necessary in 2019.as of December 1, 2022.
Indefinite-livedAs of December 31, 2022, Surface Protection had goodwill of $57.3 million and long-lived identifiable intangible assets are assessed forof $29.3 million.
During the first three months of 2020, the Company performed goodwill impairment when events or circumstances indicatetests and recognized a goodwill impairment charge of $13.7 million ($10.5 million after taxes), which represented the entire amount of goodwill associated with Aluminum Extrusions’ AACOA reporting unit. The operations of the AACOA reporting unit, which includes the Niles, Michigan and Elkhart, Indiana facilities, were expected to be severely impacted by COVID-19, with over 80% of the aluminum extrusions manufactured at these facilities sold to customers that make consumer durable products, such as recreational boating and power sports vehicles, and to customers serving the carrying value may not be recoverable. The Company estimates the fair value of its trade names using a relief-from-royalty method that relies upon a corresponding discounted cash flow analysis.building and construction and automotive markets.
Additional disclosure of Tredegar’sFor more information on goodwill and identifiable intangible assets and the impairments recorded in 2018 and 2017 are included inintangibles, see Note 8.5.
Impairment of Long-Lived Assets. The Company reviews long-lived assets for possible impairment when events indicate that an impairment may exist. For assets that are held and used in operations, if events indicate that an asset may be impaired, the Company estimates the future unlevered pre-tax cash flows expected to result from the use of the asset and its eventual disposition. Assets are grouped for this purpose at the lowest level for which there are identifiable and independent cash flows.
If the sum of these undiscounted pre-tax cash flows is less than the carrying amount of the asset group, an impairment loss is calculated. Measurement of the impairment loss is the amount by which the carrying amount exceeds the estimated fair value of the asset group. As of December 31, 2022 and 2021, no events were identified that indicated long-lived assets may be impaired.
Assets that are held for sale are reported at the lower of their carrying amount or estimated fair value less cost to sell, with an impairment loss recognized for any write-down required.
Pension Costs and Postretirement Benefit Costs Other than Pensions. Pension costs and postretirement benefit costs other than pensions have been accrued over the period employees provided service to Tredegar. Liabilities and expenses for pension plans and other postretirement benefits are determined using actuarial methodologies and incorporate significant assumptions, including the rate used to discount the future estimated liability, the long-term rate of return on plan assets, and several assumptions relating to the employee workforce. The Company recognizes the funded status of its pension and other postretirement plans in the accompanying consolidated balance sheets. Tredegar’s policy is to fund its pension plans at amounts not less than the minimum requirements of the Employee Retirement Income Security Act (“ERISA”) of 1974 and to fund postretirement benefits other than pensions when claims are incurred.
On February 10, 2022, Tredegar announced the initiation of a process to terminate and settle its frozen defined benefit pension plan, which could take up to 24 months to complete. In connection therewith, on February 9, 2022, the Company contributed $50 million to the pension plan (the “Special Contribution”). As a result, the Company expects there will be no required minimum contributions to the pension plan until final settlement. As the settlement process occurs, the Company expects to recognize a non-cash reclassification adjustment to net income or loss of other comprehensive net actuarial losses associated with the pension plan currently reflected directly in shareholders’ equity. Other comprehensive net actuarial losses associated with the pension plan were approximately $104 million on a pre-tax basis as of December 31, 2022.
Additional disclosure regarding Tredegar’s pension costs and postretirement benefit costs other than pensions is included in Note 13.8.
Revenue Recognition. The Company’s revenue is primarily generated from the sale of finished products to customers. Those sales predominantly contain a single performance obligation and revenue is recognized at the point in time when control of the product is transferred to customers, along with the title, risk of loss and rewards of ownership. Depending on the arrangement with the customer, these criteria are met either at the time the product is shipped or when the product is made available or delivered at the destination specified in the agreement with the customer.
Sales revenue is recognized in an amount that reflects the consideration the Company expects to be entitled to in exchange for that finished product. The Company offers various discounts, rebates and allowances to customers, (collectively, “allowances”), all of which are considered when determining the transaction price. Certain allowances are fixed and determinable at the time of sale and are recorded at the time of sale as a reduction to revenues. Other allowances can vary depending on future outcomes such as sales returns and customer sales volume, and representthus represents variable consideration.
Amounts billed to customers related to freight are classified as sales revenue and the cost of freight is classified as a separate line in the accompanying consolidated statements of income. Taxes assessed by a governmental authority that are both imposed on and concurrent with a specific revenue-producing transaction between Tredegar and its customers (such as value-added taxes) are accounted for on a net basis and therefore excluded from revenues. See Note 513 for disaggregation of revenue by segment and type. See Note 62 for a table showing accounts and other receivables, net of allowance for bad debts and sales returns.debts.
Revenue expected to be recognized in any future period related to remaining performance obligations, excluding i) revenue pertaining to contracts that have an original expected duration of one year or less, ii) contracts where revenue is recognized as invoiced and iii) variable consideration related to unsatisfied performance obligations, is not expected to materially impact the Company’s financial results.
Research & Development (“R&D”) Costs. R&D costs are expensed as incurred and include primarily salaries, wages, employee benefits, equipment depreciation, facility costs and the cost of materials consumed relating to R&D efforts. R&D costs include a reasonable allocation of indirect costs.
Leases. At inception, the Company determines if an arrangement contains a lease and whether that lease meets the classification criteria of a finance or operating lease. The Company has elected to not record short-term leases with an original lease term of one year or less in the consolidated balance sheet. To the extent such leases contain renewal options that the Company intends to exercise, the related Right-of-Use (“ROU”) asset and lease liability are included in the consolidated balance sheet. Some of the Company’s lease arrangements contain lease components (e.g., minimum rent payments) and non-lease components (e.g., maintenance, labor charges, etc.). The Company generally accounts for the lease and non-lease components as a single lease component.
Certain of the Company’s lease agreements include rental payments that are adjusted periodically for an index or rate. The leases are initially measured using the projected payments adjusted for the index or rate in effect at the commencement date. The Company’s lease agreements do not contain any material residual value guarantees or material restrictive covenants.
Operating leases are included in “Right-of-use lease assets”, “Lease liabilities - short-term” and “Lease liabilities - long-term” on the consolidated balance sheets. These assets and liabilities are recognized at the commencement date based on the present value of remaining lease payments over the lease term using the Company’s secured incremental borrowing rates, adjusted for term and geographic location using country-based swap rates. As a result of the Company’s review of new and existing lease contracts, there were no instances where the Company could readily determine a rate implicit in the lease.
Lease expense for operating leases is recognized on a straight-line basis over the lease term. Variable lease expense is recognized in the period in which the obligation for those payments is incurred. Depending upon the specific use of the ROU asset, lease expense is included in the “Cost of goods sold”, “Freight”, “Selling, general and administrative”, and “Research and development” line items on the consolidated statements of income. Lease income is not material to the results of operations for the years ended December 31, 2022 and 2021, respectively. Additional disclosure regarding Tredegar’s leases is included in Note 4.
Income Taxes. Income taxes are recognized during the period in which transactions enter into the determination of income for financial reporting purposes, with deferred income taxes being provided at enacted statutory tax rates on the differences between the financial reporting and tax bases of assets and liabilities (see Note 16)12). Tredegar’s policy is to accrue U.S. federal income taxes to the extent required under GAAP on unremitted earnings of all foreign subsidiaries where required. However, due to changes in the taxation of dividends under the Tax Cuts and Jobs Act (the “TCJA”) enacted by the U.S. government in December 2017, Tredegar only records U.S. federal income taxes on unremitted earnings of its foreign subsidiaries where Tredegar cannot take steps to eliminate any potential tax on future distributions from its foreign subsidiaries. Because of the accumulation of significant losses related to foreign currency translations at Terphane Limitada, there were no unrecorded deferred income tax liabilities associated with U.S. federal income taxes and foreign withholding taxes on Terphane Limitada’s undistributed earnings as of December 31, 20192022 and December 31, 2018.2021.
A valuation allowance is recorded in the period when the Company determines that it is more likely than not that all or a portion of deferred income tax assets may not be realized. The establishment and removal of a valuation allowance requires the Company to consider all positive and negative evidence and make a judgmental decision regarding the amount of valuation
allowance required as of a reporting date. The benefit of an uncertain tax position is included in the accompanying financial statements when the Company determines that it is more likely than not that the position will be sustained, based on the technical merits of the position, if the taxing authority examines the position and the dispute is litigated. This determination is made on the basis of all the facts, circumstances and information available as of the reporting date.
Earnings Per Share. Basic earnings per share is computed using the weighted average number of shares of common stock outstanding. Diluted earnings per share is computed using the weighted average common and potentially dilutive common equivalent shares outstanding, determined as follows:
| | | | 2019 | | 2018 | | 2017 | | 2022 | | 2021 | | 2020 |
| Weighted average shares outstanding used to compute basic earnings per share | 33,236,115 |
| | 33,067,800 |
| | 32,945,961 |
| Weighted average shares outstanding used to compute basic earnings per share | 33,805,530 | | | 33,562,684 | | | 33,402,147 | |
| Incremental shares attributable to stock options and restricted stock | 22,022 |
| | 24,674 |
| | 5,327 |
| Incremental shares attributable to stock options and restricted stock | 20,900 | | | 107,566 | | | — | |
| Shares used to compute diluted earnings per share | 33,258,137 |
| | 33,092,474 |
| | 32,951,288 |
| Shares used to compute diluted earnings per share | 33,826,430 | | | 33,670,250 | | | 33,402,147 | |
Incremental shares attributable to stock options and restricted stock are computed using the average market price during the related period. The average out-of-the-money options to purchase shares that were excluded from the calculation of incremental shares attributable to stock options and restricted stock were 209,592, 726,475,2,760,983 and 397,669 as of1,582,222 for the year ended December 31, 2019, 20182022 and 2017,2021, respectively. The Company had a net loss from continuing operations for the year ended December 31, 2020, so there is no dilutive impact for such shares. If the Company had reported net income from continuing operations for the year ended December 31, 2020, average out-of-the-money options to purchase shares that were excluded from the calculation of incremental shares attributable to stock options and restricted stock were 1,212,375.
Stock-Based Employee Compensation Plans. Compensation expense is recorded onThe cost of all share-based awardspayments is recognized using itsthe calculated fair value at the grant date, or the date of any later modification, over the requisite service period under the graded-vesting method. The fair value of stock option awards was estimated as of the grant date using the Black-Scholes options-pricing model. The fair value of restricted stock awards was estimated as of the grant date using the closing stock price on that date.See Note 11 for additional information.
The assumptions used in this model for valuing Tredegar stock options granted in 2019, 2018 and 2017 were as follows:
|
| | | | | | | | | | | |
| | 2019 | | 2018 | | 2017 |
| Dividend yield | 2.4 | % | | 2.3 | % | | 1.9 | % |
| Weighted average volatility percentage | 38.3 | % | | 38.3 | % | | 38.3 | % |
| Weighted average risk-free interest rate | 2.4 | % | | 2.8 | % | | 1.8 | % |
| Holding period (years): | | | | | |
| Officers | 5 |
| | 5 |
| | 5 |
|
| Management | 5 |
| | 5 |
| | 5 |
|
| Weighted average exercise price at date of grant (also weighted average market price at date of grant): | | | | | |
| Officers | $ | 18.48 |
| | $ | 19.35 |
| | $ | 15.65 |
|
| Management | $ | 18.48 |
| | $ | 19.35 |
| | $ | 15.65 |
|
The dividend yield is the actual dividend yield on Tredegar’s common stock at the date of grant, which the Company believes is a reasonable estimate of the expected yield during the holding period. The expected volatility is based on the historical volatility of Tredegar’s common stock using a sequential period of historical data equal to the expected holding period of the option. The Company has no reason to believe that future volatility for this period is likely to differ from the past. The assumed risk-free interest rate is based on observed interest rates for U.S. Treasury debt securities appropriate for the expected holding period.
Tredegar stock options granted during 2019, 2018 and 2017, and related estimated fair value at the date of grant, are as follows:
|
| | | | | | | | | | | |
| | 2019 | | 2018 | | 2017 |
| Stock options granted (number of shares): | | | | | |
| Officers | 729,810 |
| | 425,228 |
| | 151,992 |
|
| Management | 28,477 |
| | 25,855 |
| | 57,559 |
|
| Total | 758,287 |
| | 451,083 |
| | 209,551 |
|
| Estimated weighted average fair value of options per share at date of grant: | | | | | |
| Officers | $ | 5.43 |
| | $ | 5.87 |
| | $ | 4.69 |
|
| Management | $ | 5.43 |
| | $ | 5.87 |
| | $ | 4.69 |
|
| Total estimated fair value of stock options granted (in thousands) | $ | 4,117 |
| | $ | 2,648 |
| | $ | 983 |
|
Additional disclosure of Tredegar stock options is included in Note 12.
Financial Instruments. Tredegar uses derivative financial instruments for the purpose of hedging aluminum price volatility and currency exchange rate exposures that exist as part of transactions associated with ongoing business operations. The Company’s derivative financial instruments are designated as and qualify as cash flow hedges and are recognized in the accompanying balance sheet at fair value. A change in the fair value of the derivative that is highly effective and that is designated and qualifies as a cash flow hedge is recorded in other comprehensive income. Gains and losses reported in other
comprehensive income (loss) are reclassified to earnings in the periods in which earnings are affected by the variability of cash flows of the hedged transaction. Such gains and losses are reported onin the same line as the underlying hedged item, and the cash flows related to financial instruments are classified in the consolidated statements of cash flows in a manner consistent with those of the transactions being hedged. Any hedge ineffectiveness (which represents the amount by which the changes in the fair value of the derivative exceed the variability in the cash flows of the forecasted transaction) is recorded in current period earnings. The amount of gains and losses recognized for hedge ineffectiveness were not material in 2019, 2018 and 2017.
The Company’s policy requires that it formally document all relationships between hedging instruments and hedged items, as well as its risk management objective and strategy for undertaking various hedge transactions. The Company also uses regression analysis, unless the hedge qualifies for other methods of assessing effectiveness, to formally assessesassess (both at the hedge’s inception and on an ongoing basis) whether the derivatives that are used in hedging transactions have been highly effective in offsetting changes in the fair value or cash flows of hedged items and whether those derivatives may be expected to remain highly effective in future periods. When it is determined that a derivative is not (or has ceased to be) highly effective as a hedge, the Company discontinues hedge accounting prospectively.
As a policy, Tredegar does not engage in speculative or leveraged transactions, nor does it hold or issue financial instruments for trading purposes. Additional disclosure of the utilization of derivative hedging instruments is included in Note 9.10.
Comprehensive Income (Loss). Comprehensive income (loss) is defined as net income or loss as adjusted by other comprehensive income or loss items. Other comprehensive income (loss) includes changes in foreign currency translation adjustments, unrealized gains and losses on derivative financial instruments, prior service costs and net gains or losses from pension and other postretirement benefit plans arising during the period and amortization of these prior service costs and net gain or loss adjustments, all recorded net of deferred income taxes.
The following table summarizes the after-tax changes in accumulated other comprehensive income (loss) for the year ended December 31, 2019:by component are summarized as follows:
|
| | | | | | | | | | | | | | | |
| (In thousands) | Foreign currency translation adjustment | | Gain (loss) on derivative financial instruments | | Pension and other post-retirement benefit adjustments | | Total |
| Beginning balance, January 1, 2019 | $ | (96,940 | ) | | $ | (1,601 | ) | | $ | (81,446 | ) | | $ | (179,987 | ) |
| Other comprehensive income (loss) before reclassifications | (3,723 | ) | | (2,686 | ) | | (22,508 | ) | | (28,917 | ) |
| Amounts reclassified from accumulated other comprehensive income (loss) | — |
| | 2,980 |
| | 8,273 |
| | 11,253 |
|
| Net other comprehensive income (loss) - current period | (3,723 | ) | | 294 |
| | (14,235 | ) | | (17,664 | ) |
| Ending balance, December 31, 2019 | $ | (100,663 | ) | | $ | (1,307 | ) | | $ | (95,681 | ) | | $ | (197,651 | ) |
| | | | | | | | | | | | | | | | | | | | | | | |
| Foreign Currency Translation | | Gain (Loss) on Derivative Financial Instruments | | Pension & Other Postretirement Benefit Adjust | | Total Accumulated Other Comprehensive Income (Loss) |
| Balance at January 1, 2020 | $ | (100,663) | | | $ | (1,307) | | | $ | (95,681) | | | $ | (197,651) | |
| Other comprehensive income (loss) | (9,678) | | | (4,362) | | | (16,425) | | | (30,465) | |
| Income tax (expense) benefit | 897 | | | 1,077 | | | 4,228 | | | 6,202 | |
| Other comprehensive income (loss), net of tax | (8,781) | | | (3,285) | | | (12,197) | | | (24,263) | |
| Reclassification adjustment to net income (loss) | 25,295 | | | 8,724 | | | 15,296 | | | 49,315 | |
| Income tax (expense) benefit | — | | | (1,868) | | | (3,937) | | | (5,805) | |
| Reclassification adjustment to net income (loss), net of tax | 25,295 | | | 6,856 | | | 11,359 | | | 43,510 | |
| Other comprehensive income (loss), net of tax | 16,514 | | | 3,571 | | | (838) | | | 19,247 | |
| Balance at December 31, 2020 | (84,149) | | | 2,264 | | | (96,519) | | | (178,404) | |
| Other comprehensive income (loss) | (2,008) | | | 3,800 | | | 23,932 | | | 25,724 | |
| Income tax (expense) benefit | 365 | | | (842) | | | (5,212) | | | (5,689) | |
| Other comprehensive income (loss), net of tax | (1,643) | | | 2,958 | | | 18,720 | | | 20,035 | |
| Reclassification adjustment to net income (loss) | — | | | (5,513) | | | 16,862 | | | 11,349 | |
| Income tax (expense) benefit | — | | | 1,192 | | | (3,676) | | | (2,484) | |
| Reclassification adjustment to net income (loss), net of tax | — | | | (4,321) | | | 13,186 | | | 8,865 | |
| Other comprehensive income (loss), net of tax | (1,643) | | | (1,363) | | | 31,906 | | | 28,900 | |
| Balance at December 31, 2021 | (85,792) | | | 901 | | | (64,613) | | | (149,504) | |
| Other comprehensive income (loss) | 3 | | | (1,256) | | | (6,464) | | | (7,717) | |
| Income tax (expense) benefit | (290) | | | (374) | | | 1,400 | | | 736 | |
| Other comprehensive income (loss), net of tax | (287) | | | (1,630) | | | (5,064) | | | (6,981) | |
| Reclassification adjustment to net income (loss) | — | | | (2,461) | | | 13,606 | | | 11,145 | |
| Income tax (expense) benefit | — | | | 710 | | | (2,965) | | | (2,255) | |
| Reclassification adjustment to net income (loss), net of tax | — | | | (1,751) | | | 10,641 | | | 8,890 | |
| Other comprehensive income (loss), net of tax | (287) | | | (3,381) | | | 5,577 | | | 1,909 | |
| Balance at December 31, 2022 | $ | (86,079) | | | $ | (2,480) | | | $ | (59,036) | | | $ | (147,595) | |
The following table summarizes the after-tax changes in accumulated other comprehensive income (loss) for the year ended December 31, 2018:
|
| | | | | | | | | | | | | | | |
| (In thousands) | Foreign currency translation adjustment | | Gain (loss) on derivative financial instruments | | Pension and other post-retirement benefit adjustments | | Total |
| Beginning balance, January 1, 2018 | $ | (86,178 | ) | | $ | 459 |
| | $ | (90,950 | ) | | $ | (176,669 | ) |
| Other comprehensive income (loss) before reclassifications | (10,762 | ) | | (2,978 | ) | | (1,118 | ) | | (14,858 | ) |
| Amounts reclassified from accumulated other comprehensive income (loss) | — |
| | 918 |
| | 10,622 |
| | 11,540 |
|
| Net other comprehensive income (loss) - current period | (10,762 | ) | | (2,060 | ) | | 9,504 |
| | (3,318 | ) |
| Ending balance, December 31, 2018 | $ | (96,940 | ) | | $ | (1,601 | ) | | $ | (81,446 | ) | | $ | (179,987 | ) |
Reclassifications of balancesamounts reclassified out of accumulated other comprehensive income (loss) intorelated to pension and other postretirement benefits is included in the computation of net income during 2019 are summarized as follows:periodic pension costs, see Note 8 for additional details.
|
| | | | | |
| (In thousands) | Amount reclassified from other comprehensive income (loss) | | Location of gain (loss) reclassified from accumulated other comprehensive income (loss) to net income (loss) |
| Gain (loss) on derivative financial instruments: | | | |
| Aluminum future contracts, before taxes | $ | (2,736 | ) | | Cost of goods sold |
| Foreign currency forward contracts, before taxes | (904 | ) | | Selling, general and administrative |
| Foreign currency forward contracts, before taxes | 62 |
| | Cost of goods sold |
| Total, before taxes | (3,578 | ) | | |
| Income tax expense (benefit) | (598 | ) | | Income taxes |
| Total, net of tax | $ | (2,980 | ) | | |
| Amortization of pension and other post-retirement benefits: | | | |
| Actuarial gain (loss) and prior service costs, before taxes | $ | (10,632 | ) | | (a) |
| Income tax expense (benefit) | (2,359 | ) | | Income taxes |
| Total, net of tax | $ | (8,273 | ) | | |
| | | | |
| (a) This component of accumulated other comprehensive income is included in the computation of net periodic pension cost (see Note 13 for additional detail). |
Reclassifications of balances out of accumulated other comprehensive income (loss) into net income during 2018 are summarized as follows:
|
| | | | | |
| (In thousands) | Amount reclassified from other comprehensive income (loss) | | Location of gain (loss) reclassified from accumulated other comprehensive income (loss) to net income |
| Gain (loss) on derivative financial instruments: | | | |
| Aluminum future contracts, before taxes | $ | 1,069 |
| | Cost of goods sold |
| Foreign currency forward contracts, before taxes | (1,796 | ) | | Selling, general and administrative |
| Foreign currency forward contracts, before taxes | 62 |
| | Cost of goods sold |
| Total, before taxes | (665 | ) | | |
| Income tax expense (benefit) | 253 |
| | Income taxes |
| Total, net of tax | $ | (918 | ) | | |
| Amortization of pension and other post-retirement benefits: | | | |
| Actuarial gain (loss) and prior service costs, before taxes | $ | (13,650 | ) | | (a) |
| Income tax expense (benefit) | (3,028 | ) | | Income taxes |
| Total, net of tax | $ | (10,622 | ) | | |
| | | | |
| (a) This component of accumulated other comprehensive income is included in the computation of net periodic pension cost (see Note 13 for additional detail). |
Reclassifications of balances out of accumulated other comprehensive income (loss) into net income during 2017 are summarized as follows:
|
| | | | | |
| (In thousands) | Amount reclassified from other comprehensive income (loss) | | Location of gain (loss) reclassified from accumulated other comprehensive income (loss) to net income |
| Gain (loss) on derivative financial instruments: | | | |
| Aluminum future contracts, before taxes | $ | 1,210 |
| | Cost of goods sold |
| Foreign currency forward contracts, before taxes | (43 | ) | | Selling, general and administrative |
| Foreign currency forward contracts, before taxes | 62 |
| | Cost of goods sold |
| Total, before taxes | 1,229 |
| | |
| Income tax expense (benefit) | 287 |
| | Income taxes |
| Total, net of tax | $ | 942 |
| | |
| Amortization of pension and other post-retirement benefits: | | | |
| Actuarial gain (loss) and prior service costs, before taxes | $ | (12,045 | ) | | (a) |
| Income tax expense (benefit) | (4,234 | ) | | Income taxes |
| Total, net of tax | $ | (7,811 | ) | | |
| | | | |
| (a) This component of accumulated other comprehensive income is included in the computation of net periodic pension cost (see Note 13 for additional detail). |
Recently Issued Accounting Standards Adopted.
Accounting pronouncements adopted prior to 2019:
ASU 2014-09, REVENUE FROM CONTRACTS WITH CUSTOMERS (TOPIC 606)
In May 2014,March 2020, the FASB and InternationalFinancial Accounting Standards Board ("FASB") issued their converged standard on revenue recognition. The revised revenue standard contains principles that an entity will applyAccounting Standards Update ("ASU") 2020-04 “Reference Rate Reform (Topic 848)”, which provides optional expedients and exceptions for applying GAAP to directcontracts, hedging relationships and other transactions affected by the measurement of revenue and timing of when it is recognized. The core principlediscontinuation of the guidance is that the recognition of revenue should depict the transfer of promised goodsLondon Interbank Offered Rate or services to customers in an amount that reflects the consideration to which an entity expectsby another reference rate expected to be entitled in exchange for those goods and services. To achieve that core principle, an entity will utilize a principle-based five-step approach model.discontinued because of reference rate reform. The converged standard also includes more robust disclosure requirements which requires entities to provide sufficient information to enable users of financial statements to understand the nature, amount, timing and uncertainty of revenue and cash flows arising from contracts with customers. In March 2016, amended guidance was effective beginning March 12, 2020 and can be applied prospectively through December 31, 2024. In January 2021, the FASB issued regarding clarifyingASU 2021-01, which clarified the implementation guidance on principal versus agent considerationsscope and in April 2016, clarifying guidance was issued relating to identifying performance obligations and licensing implementation. Theapplication of the original guidance. In the second quarter of 2022, the Company adopted the new standard effective January 1, 2018, using the modified retrospective approach applied to all contracts as of the date of adoption. Comparative periodsASU 2020-04, which did not have not been adjusted and continue to be reported under the accounting standards in effect for those periods. The adoption of ASU 2014-09, as amended, had noa material impact on the Company’s consolidated financial position, results of operations, equity or cash flows upon adoption. The Company has included the disclosures required by ASU 2014-09.
New accounting pronouncements adopted in 2019:
ASU 2016-02, LEASES (TOPIC 842)statements.
In February 2016, the Financial Accounting Standards Board (“FASB”) issued a revised standard on lease accounting. Lessees will need to recognize virtually all of their leases with a term longer than 12 months on the balance sheet, by recording a right-of-use (“ROU”) asset and lease liability. The revised standard requires additional analysis of the components of a transaction to determine if a right-of-use asset is embedded in the transaction that needs to be treated as a lease. Substantial additional disclosures are also required by the revised standard. The revised standard is effective for the Company for fiscal years beginning after December 31, 2018, including the interim periods within those fiscal years. A modified retrospective transition approach which requires a cumulative-effect adjustment to the opening balance of retained earnings on the effective date is required for leases existing at, or entered into after, the effective date, with certain practical expedients available. The Company elected to use certain transition practical expedients that allow it to elect to not reassess: i) whether expired or existing contracts contain leases under the new definition of a lease; ii) lease classification for expired or existing leases; and iii) whether previously capitalized initial direct costs would qualify for capitalization under Topic 842. The Company adopted the new guidance in the first quarter of 2019, electing the modified retrospective transition approach. The adoption did not have a material effect on the Company’s consolidated financial statements. The most significant impact of the new standard was the initial recognition of ROU assets of approximately $21 million and lease liabilities of approximately $22 million for real estate, office equipment and vehicle operating leases as of the date of adoption.
ASU 2017-12, DERIVATIVES AND HEDGING (TOPIC 815)
In August 2017, the FASB issued amended guidance on the accounting for hedging activities. The amended guidance makes more hedging strategies qualify for hedge accounting. After initial qualification, the amended guidance permits a qualitative effectiveness assessment for certain hedges instead of a quantitative test, if the company can reasonably support an expectation of effectiveness throughout the term of the hedge. The amended guidance is effective for annual and interim periods beginning after January 1, 2019, but may be adopted immediately. The Company adopted the amended guidance in the first quarter of 2019 and there was no impact from adoption on the Company’s consolidated financial statements.
ASU 2018-2, REPORTING COMPREHENSIVE INCOME (TOPIC 220)
In February 2018,September 2022, the FASB issued ASU 2018-22022-04 “Liabilities - Supplier Finance Programs (Subtopic 405-50)”, which requires that a buyer in a supplier finance program disclose sufficient information about the program to provide entities an optionallow users of the financial statements to reclassify certain “stranded tax effects” resultingunderstand the program’s nature, activity during the period, changes from the recent U.S. tax reform from accumulated other comprehensive income (AOCI)period to retained earnings. This new standard takes effect for all entities in fiscal years beginning after December 15, 2018,period and interim periods within those fiscal years.potential magnitude. The Company has elected to not reclassify the income tax effects resulting from tax reform from AOCI to retained earnings.
Accounting Standards Not Yet Implemented:
ASU 2016-13, FINANCIAL INSTRUMENTS - CREDIT LOSSES (TOPIC 326)
In June 2016, the FASB issued ASU 2016-13 related to the measurement of credit losses on financial instruments. The pronouncement replaces the incurred loss methodology to record credit losses with a methodology that reflects the expected credit losses for financial assets not accounted for at fair value with gains and losses recognized through net income. This standardguidance is effective for fiscal years beginning after December 15, 2019 and2022, including interim periods therein, with early adoption permittedwithin those fiscal years, except for the amendment on roll forward information, which is effective for fiscal years and interim periods therein, beginning after December 15, 2018. The Company is in2023. In the process of evaluating the guidance and expects to adopt ASU 2016-13 in the firstfourth quarter of 2020, with no2022, the Company adopted ASU 2022-04, which did not have a material impact on the Company’s consolidated financial statements.
ASU 2018-13, FAIR VALUE MEASUREMENT (TOPIC 820)
In August 2018, the FASB issued ASU 2018-13, which amended the fair value measurement guidance by removing and modifying certain disclosure requirements, while also adding new disclosure requirements. The amendments on changes in unrealized gains and losses, the range and weighted average of significant unobservable inputs used to develop Level 3 fair value measurements and the narrative description of measurement uncertainty should be applied prospectively for only the most recent interim or annual period presented in the initial fiscal year of adoption. All other amendments should be applied retrospectively to all periods presented upon their effective date. The amendments are effective for all companies for fiscal years, and interim periods within those years, beginning after December 15, 2019. Early adoption is permitted for all amendments. Further, a company may elect to early adopt the removal or modification of disclosures immediately and delay adoption of the new disclosure requirements until the effective date. The Company plans to adopt all disclosure requirements in the first quarter of 2020, with no material impact on the Company’s consolidated financial statements.
On February 15, 2017, Bonnell Aluminum acquired 100% of the stock of Futura Industries Corporation on a net debt-free basis for approximately $92 million (the “Initial Purchase Price”). The amount actually funded in cash at the transaction date was approximately $87.0 million (the “Initial Cash Funding”), which was the Initial Purchase Price net of preliminary closing adjustments for working capital and seller transaction-related obligations assumed and subsequently paid by Bonnell Aluminum. In addition, the Company was refunded $5 million in the first quarter of 2018 since Futura did not meet certain performance requirements for the 2017 fiscal year (“Earnout Provision”). The acquisition, which was funded using Tredegar’s revolving credit facility, was treated as an asset purchase for U.S. federal income tax purposes.
Under the terms of the transaction, $5 million of the Initial Cash Funding was placed in escrow (the “Earnout Escrow”) and was returned to Bonnell Aluminum because Futura did not achieve a targeted EBITDA level (as defined in the Stock Purchase Agreement) for the last eleven months of the fiscal year ended December 2017. At the acquisition date, the Company performed a probability weighted assessment in order to determine the fair value of this contingent asset. The assessment estimated a fair value of $4.3 million and a receivable (“Initial Earnout Receivable”) was recorded by Bonnell Aluminum. At December 31, 2017, the Company updated its valuation of this contingent asset, which resulted in a fair value of $5.0 million. The receivable was increased to $5.0 million, and an additional $0.7 million was recognized as income in 2017 in Other income (expense), net in the Consolidated Statements of Income.
The net purchase price for financial reporting purposes was set at approximately $82.9 million (the “Adjusted Net Purchase Price”), which was the Initial Cash Funding less the Initial Earnout Receivable and the net settlement of certain post-closing adjustments of $0.1 million paid to the seller in 2017. Adjustments to the purchase price were made retrospectively as if the accounting had been completed on the acquisition date. Based upon management’s valuation of the fair value of tangible and identifiable intangible assets acquired (net of cash acquired) and liabilities assumed, the allocation of the Adjusted Net Purchase Price is as follows:
|
| | | |
| (In thousands) | |
| Accounts receivable | $ | 6,680 |
|
| Inventories | 10,342 |
|
| Prepaid expenses and other current assets | 240 |
|
| Property, plant & equipment | 32,662 |
|
| Identifiable intangible assets: | |
| Customer relationships | 24,000 |
|
| Trade names | 6,700 |
|
| Trade payables & accrued expenses | (8,135 | ) |
| Total identifiable net assets | 72,489 |
|
| Adjusted Net Purchase Price | 82,860 |
|
| Goodwill | $ | 10,371 |
|
The goodwill and identifiable intangible asset balances associated with this acquisition are deductible for tax purposes on a straight-line basis over a period of approximately 15 years. For financial reporting purposes, customer relationships are being amortized over 12 years; trade names were being amortized over 13 years but were fully amortized in 2019 as a result of a rebranding initiative by Bonnell Aluminum (see Note 8 for more details on the rebranding initiative). Goodwill is not subject to amortization for financial reporting purposes.
For the year ended December 31, 2017, Tredegar’s consolidated results of operations and its Aluminum Extrusions business segment included the following Futura results for the 10.5 months owned: sales of $71.0 million, EBITDA from ongoing operations of $13.2 million, depreciation and amortization of $5.0 million, and capital expenditures of $2.5 million.
The following unaudited supplemental pro forma data presents Tredegar’s consolidated sales, net income and related earnings per share as if the acquisition of Futura had been consummated at the beginning of 2017, and is not necessarily indicative of the Company’s financial performance if the acquisition had actually been consummated as of that date, or of future performance. The supplemental unaudited pro forma measures for the year ended December 31, 2017 is presented below:
|
| | | |
| Tredegar Pro Forma Results with Futura Acquisition | |
| (In thousands, except per-share data) | 2017 |
| Sales | $ | 968,340 |
|
| Net income | $ | 37,974 |
|
| Earnings per share: | |
| Basic | $ | 1.15 |
|
| Diluted | $ | 1.15 |
|
Futura’s pre-acquisition results for the period from January 1 to February 14, 2017, and therefore the pro forma information for 2017 presented above, were adversely impacted by significant disruptions to manufacturing operations and sales caused by the renovation of its anodizing line. The actual accretion to Tredegar’s diluted earnings per share from Futura since the acquisition date was 12 cents per share for 2017.
The Company’s pro forma net income was computed for the periods shown as: (i) the Company’s reported net income, plus (ii) Futura’s historical pre-acquisition period earnings before interest, taxes, depreciation and amortization and excluding one-time purchase accounting and transaction-related expenses, minus (iii) the pro forma pre-acquisition period depreciation and amortization for Futura under purchase accounting for the Company, minus (iv) the pro forma pre-acquisition period interest expense for the Company applied at an annual rate of 3.0% to the $87.0 million Initial Cash Funding, minus (v) the pro forma pre-acquisition period income taxes applied at a rate of 39.1% to the pro forma pre-acquisition earnings before income taxes computed from items (ii) through (iv).
| |
3 | OTHER INCOME (EXPENSE), NET |
Other income (expense), net consists of the following:
|
| | | | | | | | | | | |
| (In thousands) | 2019 | | 2018 | | 2017 |
| Gain on investment in kaléo accounted for under fair value method | $ | 28,482 |
| | $ | 30,600 |
| | $ | 33,800 |
|
| Gain on sale of manufacturing plant in Shanghai, China | 6,316 |
| | — |
| | — |
|
| Gain associated with the settlement of an escrow agreement related to Terphane, acquired in October 2011 | — |
| | — |
| | 11,856 |
|
| Gain from insurance recoveries | — |
| | — |
| | 5,261 |
|
| Unrealized loss on investment property | — |
| | (186 | ) | | — |
|
| Other | (3 | ) | | 45 |
| | 796 |
|
| Total | $ | 34,795 |
| | $ | 30,459 |
| | $ | 51,713 |
|
The gain on investment in kaléo accounted for under the fair value method of $28.5 million includes a cash dividend of $17.6 million from kaléo. See Note 4 for more details on the investment in kaléo. See Note 17 for more details on the closing of the manufacturing plant in Shanghai, China.details.
The gain associated with the settlement of an escrow agreement related to the settlement of an escrow arrangement established upon the acquisition of Terphane Holdings, LLC in 2011. In settling the escrow arrangement, the Company assumed the risk of the claims (and associated legal fees) against which the escrow previously secured the Company. While the ultimate amount of such claims is unknown, the Company believes that it could be liable for some portion of these claims, and currently estimates the amount of such future claims at approximately $1.0 million.
The gain of $5.3 million from insurance recoveries related to the explosion that occurred in the second quarter of 2016 at the Aluminum Extrusions manufacturing facility in Newnan, Georgia, which includes the recognition of a gain on the involuntary conversion of an asset for insurance proceeds used for the replacement of capital equipment.2. ACCOUNTS AND OTHER RECEIVABLES
In August 2007 and December 2008, the Company made an aggregate investment of $7.5 million in kaleo, Inc. (“kaléo”), a privately held specialty pharmaceutical company dedicated to building innovative solutions for serious and life-threatening medical conditions. Tredegar owns Series A-3 Preferred Stock and Series B Preferred Stock in kaléo that, taken together, represents on a fully-diluted basis an approximate 18% interest in kaléo. Tredegar accounts for its investment in kaléo under the fair value option. At the time of the initial investment, the Company elected the fair value option of accounting since its investment objectives were similar to those of venture capitalists, which typically do not have controlling financial interests. Kaléo’s stock is not publicly traded.
The estimated fair value of the Company’s investment was $95.5 million as of December 31, 2019 and $84.6 million as of December 31, 2018. The Company recognized net appreciation on its investment in kaléo of $28.5 million ($23.4 million after taxes) and $30.6 million ($23.9 million after taxes) in 2019 and 2018, respectively, including a $17.6 million dividend paid on April 30, 2019. Future dividends are subject to the discretion of kaléo’s board of directors. Amounts recognized associated with the Company’s investment in kaléo are included in “Other income (expense), net” in the consolidated statements of income and separately stated in the EBITDA from ongoing operations table in Note 5.
The Company estimates the fair value of its investment in kaléo by: (i) computing the weighted average estimated enterprise value (“EV”) utilizing both the discounted cash flow method (the “DCF Method”) and the application of a market multiple to earnings before interest, taxes, depreciation and amortization (the “EBITDA Multiple Method”), (ii) applying adjustments for any surplus or deficient working capital and estimates of contingent liabilities, (iii) adding cash and cash equivalents, (iv) subtracting interest-bearing debt, (v) subtracting a private company liquidity discount estimated at 10% and 15% at December 31, 2019 and 2018, respectively, of the net result of (i) through (iv), and (vi) applying liquidation preferences and fully diluted ownership percentages to the estimated equity value computed in (i) through (v).
The Company’s estimate of kaléo’s EV as of December 31, 2019 was determined by weighting the EBITDA Multiple Method by 80% and the DCF Method by 20%, which was consistent with the weighting applied at December 31, 2018. The heavier weighting towards the EBITDA Multiple Method was due to its heuristic nature versus the hypothetical nature of the projections used in the DCF Method. The DCF Method projections rely on numerous assumptions and Level 3 inputs, including estimating market growth, market share, pricing, net margins (after allowances for temporary discounts, prompt pay
discounts, product returns, wholesaler fees, chargebacks, rebates and copays), selling expenses, R&D expenses, general and administrative expenses, income taxes on unlevered pretax income, working capital, capital expenditures and the risk-adjusted discount rate. In addition, there are various regulatory and legal enforcement efforts, including an ongoing Department of Justice investigation related to kaléo’s Evzio business, which could have a material adverse effect on kaléo’s business that require assessment in any valuation method applied.
The table below provides a sensitivity analysis of the estimated fair value at December 31, 2019, of the Company’s investment in kaléo for changes in the EBITDA multiple used in applying the EBITDA Multiple Method and the changes in the weighting of the DCF Method.
|
| | | | | | | | | | | | | | | | | |
| ($ Millions) | | EV-to-Adjusted EBITDA Multiple |
| | | 7.0 x | 8.0 x | 9.0 x | 10.0x | 11.0x |
| Weighting to DCF Method | 50 | % | $ | 89.8 |
| $ | 95.6 |
| $ | 101.4 |
| $ | 107.3 |
| $ | 113.1 |
|
| 40 | % | $ | 85.5 |
| $ | 92.5 |
| $ | 99.5 |
| $ | 106.5 |
| $ | 113.5 |
|
| 30 | % | $ | 81.1 |
| $ | 89.3 |
| $ | 97.5 |
| $ | 105.7 |
| $ | 113.8 |
|
| 20 | % | $ | 76.8 |
| $ | 86.2 |
| $ | 95.5 |
| $ | 104.9 |
| $ | 114.2 |
|
| 10 | % | $ | 72.5 |
| $ | 83.1 |
| $ | 93.6 |
| $ | 104.1 |
| $ | 114.6 |
|
| — | % | $ | 68.2 |
| $ | 79.9 |
| $ | 91.6 |
| $ | 103.3 |
| $ | 114.9 |
|
The ultimate value of the Company’s ownership interest in kaléo will be determined and realized only if and when a liquidity event occurs (including dividends), and the ultimate value could be materially different from the $95.5 million estimated fair value reflected in the Company’s financial statements at December 31, 2019.
The Company's business segments are Aluminum Extrusions, PE Films and Flexible Packaging Films. Aluminum Extrusions, also known as Bonnell Aluminum, produces high-quality, soft-alloy and medium-strength aluminum extrusions primarily for the following markets: building and construction, automotive, and specialty (which consists of consumer durables, machinery and equipment, electrical and distribution end-use products). PE Films is comprised of the following operating segments: surface protection films, personal care materials, and films for other markets. Flexible Packaging Films is comprised of the Company’s polyester films business, Terphane Holdings LLC (“Terphane”).
The Company’s reportable segments are based on its method of internal reporting, which is generally segregated by differences in products. Accounting standards for presentation of segments require an approach based on the way the Company organizes the segments for making operating decisions and how the chief operating decision maker (“CODM”) assesses performance.
Earnings before interest, taxes, depreciation and amortization from ongoing operations (“EBITDA from ongoing operations”) is the measure of profit and loss used by the CODM (Tredegar’s President and Chief Executive Officer) for purposes of assessing financial performance. In the fourth quarter of 2019, the Company concluded that “EBITDA from ongoing operations,” instead of “operating profit from ongoing operations,” is the most relevant metric for measuring segment financial performance. EBITDA from ongoing operations is the key profitability metric used by Tredegar’s President and Chief Executive Officer, who was elected by the Tredegar Board of Directors in March 2019. This change resulted in a revision of the Company’s segment disclosures for all periods to report EBITDA from ongoing operations as the measure of segment financial performance. The Company uses sales less freight (“net sales”) as its measure of revenues from external customers at the segment level. This measure is separately included in the financial information regularly provided to the CODM.
PE Films’ net sales to The Procter & Gamble Company (“P&G”) totaled $58.8 million in 2019, $106.5 million in 2018 and $122.4 million in 2017. These sales include plastic film sold to others that convert the film into materials used with products manufactured by P&G.
Information by business segment and geographic area for the last three years is provided in the segment tables below. There were no accounting transactions between segments and no allocations to segments.
|
| | | | | | | | | | | | |
| Net Sales |
| (In thousands) | | 2019 | | 2018 | | 2017 |
| Aluminum Extrusions | $ | 529,602 |
| | $ | 573,126 |
| | $ | 466,833 |
|
| PE Films | 272,758 |
| | 332,488 |
| | 352,459 |
|
| Flexible Packaging Films | 133,935 |
| | 123,830 |
| | 108,355 |
|
| Total net sales | 936,295 |
| | 1,029,444 |
| | 927,647 |
|
| Add back freight | 36,063 |
| | 36,027 |
| | 33,683 |
|
| Sales as shown in consolidated statements of income | $ | 972,358 |
| | $ | 1,065,471 |
| | $ | 961,330 |
|
|
| | | | | | | | | | | | |
| EBITDA from Ongoing Operations |
| (In thousands) | | 2019 | | 2018 | | 2017 |
| Aluminum Extrusions: | | | | | |
| Ongoing operations: | | | | | |
| EBITDA | $ | 65,683 |
| | $ | 65,479 |
| | $ | 58,524 |
|
| Depreciation & amortization (c) | (16,719 | ) | | (16,866 | ) | | (15,070 | ) |
| EBIT | 48,964 |
| | 48,613 |
| | 43,454 |
|
| Plant shutdowns, asset impairments, restructurings and other (a) | (561 | ) | | (505 | ) | | 321 |
|
| Trade name accelerated amortization | (10,040 | ) | | — |
| | — |
|
| PE Films: | | | | | |
| Ongoing operations: | | | | | |
| EBITDA | 37,803 |
| | 51,058 |
| | 55,889 |
|
| Depreciation & amortization (c) | (14,627 | ) | | (14,877 | ) | | (14,343 | ) |
| EBIT | 23,176 |
| | 36,181 |
| | 41,546 |
|
| Plant shutdowns, asset impairments, restructurings and other (a) | (475 | ) | | (5,905 | ) | | (4,905 | ) |
| Goodwill impairment charge | — |
| | (46,792 | ) | | — |
|
| Flexible Packaging Films: | | | | | |
| Ongoing operations: | | | | | |
| EBITDA | 14,737 |
| | 11,154 |
| | 7,817 |
|
| Depreciation & amortization | (1,517 | ) | | (1,262 | ) | | (10,443 | ) |
| EBIT | 13,220 |
| | 9,892 |
| | (2,626 | ) |
| Plant shutdowns, asset impairments, restructurings and other (a) | — |
| | (45 | ) | | (89,398 | ) |
| Total | 74,284 |
| | 41,439 |
| | (11,608 | ) |
| Interest income | 296 |
| | 369 |
| | 209 |
|
| Interest expense | 4,051 |
| | 5,702 |
| | 6,170 |
|
| Gain on investment in kaléo accounted for under the fair value method (a) | 28,482 |
| | 30,600 |
| | 33,800 |
|
| Loss on sale of investment property (a) | — |
| | (38 | ) | | — |
|
| Unrealized loss on investment property (a) | — |
| | (186 | ) | | — |
|
| Stock option-based compensation expense | 4,209 |
| | 1,221 |
| | 264 |
|
| Corporate expenses, net (a)(d) | 36,630 |
| | 28,893 |
| | 30,879 |
|
| Income (loss) before income taxes | 58,172 |
| | 36,368 |
| | (14,912 | ) |
| Income tax expense (benefit) (a) | 9,913 |
| | 11,526 |
| | (53,163 | ) |
| Net income (loss) | $ | 48,259 |
| | $ | 24,842 |
| | $ | 38,251 |
|
See footnotes following the tables.
|
| | | | | | | | |
| Identifiable Assets |
| (In thousands) | | 2019 | | 2018 |
| Aluminum Extrusions | $ | 265,027 |
| | $ | 281,372 |
|
| PE Films | 230,415 |
| | 231,720 |
|
| Flexible Packaging Films | 74,016 |
| | 58,964 |
|
| Subtotal | 569,458 |
| | 572,056 |
|
| General corporate | 111,788 |
| | 100,920 |
|
| Cash and cash equivalents (b) | 31,422 |
| | 34,397 |
|
| Total | $ | 712,668 |
| | $ | 707,373 |
|
|
| | | | | | | | | | | | | | | | | | | | | | | | |
| | | Depreciation and Amortization | | Capital Expenditures |
| (In thousands) | | 2019 | | 2018 | | 2017 | | 2019 | | 2018 | | 2017 |
| Aluminum Extrusions | $ | 26,759 |
| | $ | 16,866 |
| | $ | 15,070 |
| | $ | 17,855 |
| | $ | 12,966 |
| | $ | 25,653 |
|
| PE Films | 15,822 |
| | 15,513 |
| | 14,609 |
| | 23,920 |
| | 21,998 |
| | 15,029 |
|
| Flexible Packaging Films | 1,517 |
| | 1,262 |
| | 10,443 |
| | 8,866 |
| | 5,423 |
| | 3,619 |
|
| Subtotal | 44,098 |
| | 33,641 |
| | 40,122 |
| | 50,641 |
| | 40,387 |
| | 44,301 |
|
| General corporate (d) | 186 |
| | 163 |
| | 155 |
| | 223 |
| | 427 |
| | 61 |
|
| Total | $ | 44,284 |
| | $ | 33,804 |
| | $ | 40,277 |
| | $ | 50,864 |
| | $ | 40,814 |
| | $ | 44,362 |
|
|
| | | | | | | | | | | | |
| Net Sales by Geographic Area (b) |
| (In thousands) | | 2019 | | 2018 | | 2017 |
| United States | $ | 638,815 |
| | $ | 691,232 |
| | $ | 584,066 |
|
| Exports from the United States to: | | | | | |
| Asia | 82,829 |
| | 75,904 |
| | 84,846 |
|
| Canada | 16,846 |
| | 51,984 |
| | 46,505 |
|
| Europe | 6,091 |
| | 6,203 |
| | 8,505 |
|
| Latin America | 13,735 |
| | 12,106 |
| | 15,199 |
|
| Operations outside the United States: | | | | | |
| Brazil | 111,246 |
| | 101,217 |
| | 87,155 |
|
| The Netherlands | 35,871 |
| | 45,667 |
| | 54,380 |
|
| Hungary | 25,530 |
| | 33,512 |
| | 24,727 |
|
| China | 225 |
| | 7,814 |
| | 12,199 |
|
| India | 5,107 |
| | 3,805 |
| | 10,065 |
|
| Total | $ | 936,295 |
| | $ | 1,029,444 |
| | $ | 927,647 |
|
|
| | | | | | | | | | | | | | | | |
| | | Identifiable Assets by Geographic Area (b) | | Property, Plant & Equipment, Net by Geographic Area (b) |
| (In thousands) | | 2019 | | 2018 | | 2019 | | 2018 |
| United States | $ | 458,066 |
| | $ | 454,178 |
| | $ | 181,989 |
| | $ | 166,550 |
|
| Operations outside the United States: | | | | | | | |
| Brazil | 54,698 |
| | 52,796 |
| | 20,542 |
| | 16,072 |
|
| The Netherlands | 12,579 |
| | 15,020 |
| | 5,729 |
| | 6,005 |
|
| Hungary | 20,179 |
| | 23,615 |
| | 13,715 |
| | 15,436 |
|
| China | 18,056 |
| | 21,610 |
| | 16,210 |
| | 19,213 |
|
| India | 5,880 |
| | 4,837 |
| | 3,316 |
| | 3,692 |
|
| General corporate | 111,788 |
| | 100,920 |
| | 1,389 |
| | 1,401 |
|
| Cash and cash equivalents (b) | 31,422 |
| | 34,397 |
| | n/a |
| | n/a |
|
| Total | $ | 712,668 |
| | $ | 707,373 |
| | $ | 242,890 |
| | $ | 228,369 |
|
See footnotes following the tables and a reconciliation of net sales to sales as shown in the Consolidated Statements of Income in the first table of this Note 5.
|
| | | | | | | | | | | | |
| Net Sales by Product Group |
| (In thousands) | | 2019 | | 2018 | | 2017 |
| Aluminum Extrusions: | | | | | |
| Nonresidential building & construction | $ | 272,729 |
| | $ | 289,572 |
| | $ | 239,713 |
|
| Consumer durables | 57,607 |
| | 66,416 |
| | 54,126 |
|
| Automotive | 46,461 |
| | 48,037 |
| | 38,261 |
|
| Machinery & equipment | 38,657 |
| | 41,899 |
| | 33,450 |
|
| Distribution | 34,753 |
| | 40,924 |
| | 30,202 |
|
| Residential building & construction | 43,554 |
| | 43,943 |
| | 40,354 |
|
| Electrical | 35,841 |
| | 42,335 |
| | 30,727 |
|
| Subtotal | 529,602 |
| | 573,126 |
| | 466,833 |
|
| PE Films: | | | | | |
| Personal care materials | 161,493 |
| | 227,090 |
| | 246,416 |
|
| Surface protection films | 103,893 |
| | 98,126 |
| | 99,079 |
|
| LED-based products | 7,372 |
| | 7,272 |
| | 6,964 |
|
| Subtotal | 272,758 |
| | 332,488 |
| | 352,459 |
|
| Flexible Packaging Films | 133,935 |
| | 123,830 |
| | 108,355 |
|
| Total | $ | 936,295 |
| | $ | 1,029,444 |
| | $ | 927,647 |
|
| |
(a) | See Notes 1, 3, 4 and 17 for more information on losses associated with plant shutdowns, asset impairments and restructurings, unusual items, gains or losses from sale of assets, gains or losses on an investment accounted for under the fair value method and other items. |
| |
(b) | Information on exports and foreign operations are provided on the previous page. Cash and cash equivalents includes funds held in locations outside the U.S. of $23.0 million and $31.1 million at December 31, 2019 and 2018, respectively. Export sales relate almost entirely to PE Films. Operations outside the U.S. in The Netherlands, Hungary, China and India also relate to PE Films. Operations in Brazil are primarily related to Flexible Packaging Films, but also include PE Films operations. Sales from locations in The Netherlands and Hungary are primarily to customers located in Europe. Sales from locations in China (Guangzhou and Shanghai) are primarily to customers located in China, but also include other customers in Asia. The facility in Shanghai was shut down in the fourth quarter of 2018. |
| |
(c) | Depreciation and amortization for Aluminum Extrusions in 2019 excludes $10.0 million for accelerated amortization of trade names as a result of a rebranding initiative (see Note 8 for more information) and for PE Films in 2019, 2018 and 2017 excludes $1.2 million, $0.6 million and $0.3 million, respectively, for accelerated depreciation associated with restructurings and plant closures. |
| |
(d) | Corporate depreciation and amortization is included in Corporate expenses, net, on the EBITDA from ongoing operations table above. |
| |
6 | ACCOUNTS AND OTHER RECEIVABLES |
As of December 31, 20192022 and 2018,2021, accounts receivable and other receivables, net, were $107.6 million and $124.7 million, respectively, made up ofinclude the following:
| | | (In thousands) | | 2019 | | 2018 | (In thousands) | 2022 | | 2021 |
| Customer receivables | Customer receivables | $ | 106,153 |
| | $ | 122,182 |
| Customer receivables | $ | 83,667 | | | $ | 102,090 | |
| Other accounts and notes receivable | Other accounts and notes receivable | 4,441 |
| | 5,482 |
| Other accounts and notes receivable | 3,874 | | | 2,958 | |
| Total accounts and other receivables | Total accounts and other receivables | 110,594 |
| | 127,664 |
| Total accounts and other receivables | 87,541 | | | 105,048 | |
| Less: Allowance for bad debts and sales returns | (3,036 | ) | | (2,937 | ) | |
| Less: Allowance for bad debts | | Less: Allowance for bad debts | (2,997) | | | (1,736) | |
| Total accounts and other receivables, net | Total accounts and other receivables, net | $ | 107,558 |
| | $ | 124,727 |
| Total accounts and other receivables, net | $ | 84,544 | | | $ | 103,312 | |
A reconciliation of the beginning and ending balances of the allowance for doubtful accounts and sales returns for the three years ended December 31, 20192022 is as follows:
| | | | | | | | | | | | | | | | | |
| (In thousands) | 2022 | | 2021 | | 2020 |
| Balance, beginning of year | $ | 1,736 | | | $ | 2,797 | | | $ | 1,904 | |
| Charges to expense | 1,926 | | | 1,440 | | | 1,901 | |
| Recoveries | 2 | | | 35 | | | (90) | |
| Write-offs and settlements | (639) | | | (1,246) | | | (709) | |
| Foreign exchange and other | (28) | | | (1,290) | | | (209) | |
| Balance, end of year | $ | 2,997 | | | $ | 1,736 | | | $ | 2,797 | |
3. INVENTORIES
|
| | | | | | | | | | | | |
| (In thousands) | | 2019 | | 2018 | | 2017 |
| Balance, beginning of year | $ | 2,937 |
| | $ | 3,304 |
| | $ | 3,102 |
|
| Charges to expense | 1,188 |
| | 553 |
| | 2,369 |
|
| Recoveries | (38 | ) | | (56 | ) | | (857 | ) |
| Write-offs and settlements | (974 | ) | | (710 | ) | | (1,322 | ) |
| Foreign exchange and other | (77 | ) | | (154 | ) | | 12 |
|
| Balance, end of year | $ | 3,036 |
| | $ | 2,937 |
| | $ | 3,304 |
|
Inventories consist of the following:
| | | (In thousands) | | 2019 | | 2018 | (In thousands) | 2022 | | 2021 |
| Finished goods | Finished goods | $ | 24,504 |
| | $ | 24,938 |
| Finished goods | $ | 34,686 | | | $ | 25,199 | |
| Work-in-process | Work-in-process | 12,328 |
| | 15,648 |
| Work-in-process | 15,604 | | | 11,955 | |
| Raw materials | Raw materials | 24,735 |
| | 33,741 |
| Raw materials | 58,262 | | | 32,958 | |
| Stores, supplies and other | Stores, supplies and other | 19,813 |
| | 19,483 |
| Stores, supplies and other | 19,219 | | | 18,457 | |
| Total | Total | $ | 81,380 |
| | $ | 93,810 |
| Total | $ | 127,771 | | | $ | 88,569 | |
Inventories stated on the LIFO basis amounted to $17.6$25.3 million at December 31, 20192022 and $18.2$18.8 million at December 31, 2018,2021, which were below replacement costs by $11.1$15.6 million at December 31, 20192022 and $16.4$27.5 million at December 31, 2018. During 2018, certain PE Films inventories accounted for2021. Inventories stated on a LIFOthe weighted average cost basis declined, which resulted in cost of goods sold being stated at below current costs by $0.3 million.
| |
8 | GOODWILL AND IDENTIFIABLE INTANGIBLE ASSETS |
The components of goodwillwere $62.9 million and identifiable intangibles$30.9 million at December 31, 20192022 and 2018,2021, respectively, while inventories stated on the FIFO method amounted to $39.5 million and related amortization periods for continuing operations are as follows:$38.9 million at December 31, 2022 and 2021, respectively.
|
| | | | | | | | | | |
| (In thousands) | | 2019 | | 2018 | | Amortization Periods |
| Goodwill | $ | 81,404 |
| | $ | 81,404 |
| | Not amortized |
| Identifiable intangible assets: | | | | | |
| Customer relationships (cost basis of $29,550 in 2019 and $29,568 in 2018) | 20,198 |
| | 22,785 |
| | 10-12 years |
| Proprietary technology (cost basis of $6,181 in 2019 and $6,185 in 2018) | 895 |
| | 1,093 |
| | Not more than 15 years |
| Trade names (cost basis of $13,645 in 2019 and $13,690 in 2018) | 1,543 |
| | 12,417 |
| | 5 - 13 years |
| Total carrying value of identifiable intangibles | 22,636 |
| | 36,295 |
| | |
| Total carrying value of goodwill and identifiable intangible assets | $ | 104,040 |
| | $ | 117,699 |
| | |
4. LEASES
In the third quarterTredegar has various operating lease agreements with remaining terms up to 10 years, including leases of 2019,real estate, office equipment and vehicles. As of December 31, 2022 and 2021, the Company implemented a rebranding initiative at Bonnell Aluminum wherebyhad no finance lease agreements. Some leases include options to purchase the useleased asset, terminate the agreement or extend the term of the AACOA and Futura trade names was discontinuedagreement for one or more years. These options are included in the lease term when it is reasonably certain that the option will be exercised.
The following table presents a maturity analysis of the Company’s operating leases as of December 31, 2019. 2022:
| | | | | | | | | |
| (In thousands) | | | |
| Future Lease Payments | |
| 2023 | | $ | 2,616 | | |
| 2024 | | 2,423 | | |
| 2025 | | 2,383 | | |
| 2026 | | 2,047 | | |
| 2027 | | 1,726 | | |
| Thereafter | | 6,158 | | |
| Total undiscounted operating lease payments | | 17,353 | | |
| Less: Imputed interest | | 2,580 | | |
| Present value of operating lease liabilities | | $ | 14,773 | | |
The associated trade names assets, with a remaining net book value of $10.2 million, were amortized overfollowing table summarizes lease costs, related cash flow and other information for the last four months of 2019.years ended December 31, 2022 and 2021. These costs are primarily related to long-term operating leases, but also include amounts for variable leases and short-term leases.
| | | | | | | | | | | |
| (In thousands) | 2022 | | 2021 |
| Operating lease expense | $ | 2,718 | | | $ | 2,752 | |
| | | |
| | | |
| | | |
| | | |
| Other Information: | | | |
| Weighted-average remaining lease term for operating leases | 8 years | | 7 years |
| Weighted-average discount rate for operating leases | 4.27 | % | | 4.22 | % |
5. GOODWILL AND IDENTIFIABLE INTANGIBLE ASSETS
A reconciliation of the beginning and ending balance of goodwill for each of the two years in the period endedat December 31, 20192022 and 2021 is as follows:
|
| | | | | | | | | | | | | |
| (In thousands) | | | Aluminum Extrusions | | PE Films | | Total |
| Net carrying value of goodwill at January 1, 2018 | | $ | 24,066 |
| | $ | 104,142 |
| | $ | 128,208 |
|
| Goodwill impairment charge | | — |
| | (46,792 | ) | | (46,792 | ) |
| Increase (decrease) due to foreign currency translation | | — |
| | (12 | ) | | (12 | ) |
| Net carrying value of goodwill at December 31, 2018 | | 24,066 |
| | 57,338 |
| | 81,404 |
|
| Goodwill impairment charge | | — |
| | — |
| | — |
|
| Increase (decrease) due to foreign currency translation | | — |
| | — |
| | — |
|
| Net carrying value of goodwill at December 31, 2019 | | $ | 24,066 |
| | $ | 57,338 |
| | $ | 81,404 |
|
The goodwill of Aluminum Extrusions is carried by the reporting units AACOA and Futura, in the amounts of $13.7 million and $10.4 million, respectively, as of December 31, 2019. The goodwill of PE Films is carried by its Surface Protection component in the amount of $57.3 million as of December 31, 2019.
The Company recorded a goodwill impairment charge of $46.8 million ($38.2 million after taxes) for goodwill associated with the acquisition of certain components of PE Films. During the third quarter of 2018, the Company performed a goodwill impairment analysis related to the Personal Care reporting unit of PE Films. This review was undertaken as a result of the expected loss of business from a key customer and revised projections for PE Films. Based on an evaluation of projections under various business planning scenarios, the Company concluded that the fair value of the Personal Care reporting unit of PE Films was less than its carrying value.
A reconciliation of the beginning and ending balance of identifiable intangibles for each of the two years in the period ended December 31, 2019 is as follows:
|
| | | | | | | | | | | | | | | | | |
| (In thousands) | Customer Relationships | | Proprietary Technology | | Trade Names | | Total |
| Aluminum Extrusions: | | | | | | | |
| | Net carrying value at January 1, 2018 | $ | 24,613 |
| | $ | 495 |
| | $ | 11,071 |
| | $ | 36,179 |
|
| | | Amortization expense | (2,489 | ) | | (420 | ) | | (516 | ) | | (3,425 | ) |
| | Net carrying value at December 31, 2018 | 22,124 |
| | 75 |
| | 10,555 |
| | 32,754 |
|
| | | Amortization expense | (2,480 | ) | | (20 | ) | | (10,555 | ) | | (13,055 | ) |
| | Net carrying value at December 31, 2019 | $ | 19,644 |
| | $ | 55 |
| | $ | — |
| | $ | 19,699 |
|
| | | | | | | | | | |
| PE Films: | | | | | | | |
| | Net carrying value at January 1, 2018 | $ | — |
| | $ | 845 |
| | $ | — |
| | $ | 845 |
|
| | | Amortization expense | — |
| | (115 | ) | | — |
| | (115 | ) |
| | Net carrying value at December 31, 2018 | — |
| | 730 |
| | — |
| | 730 |
|
| | | Amortization expense | — |
| | (120 | ) | | — |
| | (120 | ) |
| | Net carrying value at December 31, 2019 | $ | — |
| | $ | 610 |
| | $ | — |
| | $ | 610 |
|
| | | | | | | | | | |
| Flexible Packaging Films: | | | | | | | |
| | Net carrying value at January 1, 2018 | $ | 831 |
| | $ | 360 |
| | $ | 2,337 |
| | $ | 3,528 |
|
| | | Amortization expense | (82 | ) | | (55 | ) | | (299 | ) | | (436 | ) |
| | | Increase (decrease) due to foreign currency translation | (88 | ) | | (17 | ) | | (176 | ) | | (281 | ) |
| | Net carrying value at December 31, 2018 | 661 |
| | 288 |
| | 1,862 |
| | 2,811 |
|
| | | Amortization expense | (91 | ) | | (55 | ) | | (280 | ) | | (426 | ) |
| | | Increase (decrease) due to foreign currency translation | (16 | ) | | (3 | ) | | (39 | ) | | (58 | ) |
| | Net carrying value at December 31, 2019 | $ | 554 |
| | $ | 230 |
| | $ | 1,543 |
| | $ | 2,327 |
|
| | | | | | | | | | |
| Total net carrying value of identifiable intangibles at December 31, 2019 | $ | 20,198 |
| | $ | 895 |
| | $ | 1,543 |
| | $ | 22,636 |
|
| | | | | | | | | | | | | | | | | | | | |
| (In thousands) | | Aluminum Extrusions(a) | | PE Films(a) | | Total |
| Net carrying value of goodwill at December 31, 2020 | | $ | 10,370 | | | $ | 57,338 | | | $ | 67,708 | |
| Out-of-period adjustment | | 2,900 | | | — | | | 2,900 | |
| Net carrying value of goodwill at December 31, 2021 | | 13,270 | | | 57,338 | | | 70,608 | |
| | | | | | |
| Net carrying value of goodwill at December 31, 2022 | | $ | 13,270 | | | $ | 57,338 | | | $ | 70,608 | |
| (a) The goodwill of Aluminum Extrusions and PE Films is carried by the Futura and Surface Protection reporting units, respectively. |
During the fourth quarter of 2017, in conjunction with annual business planning as well as valuation activities and other efforts,2021, the Company determined thatrecorded an out-of-period adjustment in connection with the carrying valueoriginal valuation of Terphane’s remaining long-livedintangible assets were impaired (Terphane’sand goodwill was written offrelated to the acquisition of Futura in 2015). Accordingly, the Company wrote down these assets based on an enterprise valuation for all of Terphane of approximately $30 million.February 2017. This write-downadjustment resulted in a non-cash asset impairment loss recognized duringreclassification of $2.9 million from acquired customer relationship intangible assets to goodwill and a $0.9 million decrease to accumulated amortization and amortization expense as of and for the fourth quarterperiod ended December 31, 2021.
A reconciliation of 2017 of $101 million ($87 million after non-cash tax benefits). As part of this write-down, customer relationships, proprietary technologyidentifiable intangibles at December 31, 2022 and trade names were impaired by $9.4 million, $4.1 million and $4.0 million, respectively, reducing their values to $0.8 million, $0.4 million and $2.4 million, respectively. The remaining part of this write-down was related to property, plant and equipment. Also, Terphane’s trade names were assigned estimated useful lives of 5 to 13 years, a change from the previous designation of an indefinite life.2021 is as follows:
| | | | | | | | | | | | | | | | | | | | | | | | |
| (In thousands) | Customer Relationships | | Proprietary Technology | | Trade Names | | Total | |
| Gross carrying value at December 31, 2022 | $ | 26,549 | | | $ | 3,726 | | | $ | 13,394 | | | $ | 43,669 | | |
| Accumulated amortization | (15,467) | | | (3,672) | | | (12,840) | | | (31,979) | | |
| Net carrying value at December 31, 2022 | $ | 11,082 | | | $ | 54 | | | $ | 554 | | | $ | 11,690 | | |
| | | | | | | | |
Gross carrying value at December 31, 2021(a) | $ | 26,526 | | | $ | 3,721 | | | $ | 13,338 | | | $ | 43,585 | | |
| Accumulated amortization | (13,267) | | | (3,603) | | | (12,563) | | | (29,433) | | |
| Net carrying value at December 31, 2021 | $ | 13,259 | | | $ | 118 | | | $ | 775 | | | $ | 14,152 | | |
| (a) Includes a $2.9 million gross reclassification from customer relationship intangible assets to goodwill offset by a $0.9 million decrease to accumulated amortization as a result of the out-of-period adjustment. | |
Amortization expense for continuing operations over the next five years is expected to be as follows:
| | | | | |
| Year | Amount
(In thousands) |
| 2023 | $ | 1,894 | |
| 2024 | 1,854 | |
| 2025 | 1,854 | |
| 2026 | 1,854 | |
| 2027 | 1,854 | |
6. ACCRUED EXPENSES
Accrued expenses consist of the following:
| | | | | | | | | | | |
| (In thousands) | 2022 | | 2021 |
| Incentive compensation | $ | 6,103 | | | $ | 7,016 | |
| Payrolls, related taxes and medical and other benefits | 5,916 | | | 7,558 | |
| Vacation | 3,502 | | | 3,452 | |
| Derivative contract liability | 3,260 | | | 1,254 | |
| Accrued freight | 2,298 | | | 2,337 | |
| Accrued utilities | 2,099 | | | 1,938 | |
| Workers’ compensation and disabilities | 2,051 | | | 2,422 | |
| Environmental liabilities | 1,627 | | | 1,634 | |
| Customer rebates | 1,154 | | | 1,857 | |
| Other | 3,593 | | | 3,636 | |
| Total | $ | 31,603 | | | $ | 33,104 | |
In the fourth quarter of 2021, the Company changed its vacation policy such that effective January 1, 2022 substantially all U.S. employees earn their vacation for the current year on a monthly basis throughout the year and forfeit any unused vacation at the end of the year, with the exception of a partial rollover allowance subject to a cap or where forfeiture is prohibited by applicable state or local law or a collective bargaining agreement. Under the previous policy, vacation was granted at the beginning of the year in advance of work being performed for the subsequent year. As a result of this policy change, the Company recorded in the fourth quarter of 2021 a reduction of $3.9 million to accrued expenses and a decrease to selling, general, and administrative expense ($1.3 million) and cost of goods sold ($2.6 million) within the consolidated statements of income.
|
| | | |
| Year | Amount (In thousands) |
| 2020 | $ | 3,070 |
|
| 2021 | 3,070 |
|
| 2022 | 2,935 |
|
| 2023 | 2,309 |
|
| 2024 | 2,269 |
|
7. DEBT AND CREDIT AGREEMENTS On June 29, 2022, Tredegar entered into a Second Amended and Restated Credit Agreement (the “Credit Agreement”) that replaced its existing $375 million five-year, secured revolving credit facility that was due to expire on June 28, 2024. The Credit Agreement is a five-year, revolving, secured credit facility that permits aggregate borrowings of $375 million and matures on June 29, 2027.
Borrowings under the Credit Agreement bear an interest rate equal to Secured Overnight Financing Rate ("SOFR") plus a credit spread adjustment of 10 basis points ("Adjusted Term SOFR Rate") and an amount depending on the type of borrowing and commitment fees charged on the unused amount under the Credit Agreement at various Total Net Leverage Ratio levels as follows: | | | | | | | | |
| Pricing Under the Credit Agreement (Basis Points) |
| Total Net Leverage Ratio | Term Benchmark Spread | Commitment
Fee |
| <= 1.0x | 150.0 | | 20 | |
| >1.0x but <=2.0x | 162.5 | | 25 | |
| >2.0x but <=3.0x | 175.0 | | 30 | |
| >3.0x but <=3.5x | 187.5 | | 35 | |
| >3.5x | 200.0 | | 40 | |
At December 31, 2022, $137.0 million of the outstanding debt was principally priced at an interest rate equal to the Adjusted Term SOFR Rate plus the applicable credit spread of 162.5 basis points. Prior to the Credit Agreement, the interest rate on borrowings was based on London Inter-Bank Offered Rate plus an applicable credit spread.
The primary restrictive covenants in the Credit Agreement include:
•Total Net Leverage Ratio of 4.00x;
•Interest Coverage Ratio of 3.00x; and
•Unlimited payments for dividends and stock repurchases during the term of the Credit Agreement so long as the Total Net Leverage Ratio is equal to or less than 2.00x, and otherwise restrictions on payments for dividends and stock repurchases for the term of the Credit Agreement at $75 million (provided that the $75 million basket will reset at the end of each fiscal quarter when the Total Net Leverage ratio is less than or equal to 2.00x).
Under the Credit Agreement:
•Total Net Leverage Ratio is defined as the ratio of (a)(i) total indebtedness minus (ii) liquidity (the lesser of $50,000,000 and the aggregate amount of cash and cash equivalents) to (b) EBITDA (as defined in Credit Agreement "Credit EBITDA"); and
•Interest Coverage Ratio is defined as the ratio of Credit EBITDA to interest expense.
The Credit Agreement is secured by substantially all assets of the Company and its domestic subsidiaries, including equity in certain material first-tier foreign subsidiaries. At December 31, 2022, based upon the most restrictive covenant within the Credit Agreement, available credit under the Credit Agreement was approximately $201 million. Tredegar was in compliance with all of its debt covenants as of December 31, 2022.
8. RETIREMENT PLANS AND OTHER POSTRETIREMENT BENEFITS
Tredegar sponsors a noncontributory defined benefit (pension) plan covering certain current and former U.S. employees. The plan for salaried and hourly employees currently in effect is based on a formula using the participant’s years of service and compensation or using the participant’s years of service and a dollar amount. The plan is closed to new participants and pay for active plan participants for benefit calculations was frozen as of December 31, 2007. As of January 31, 2018, the plan no longer accrued benefits associated with crediting employees for service, thereby freezing all future benefits under the plan.
Tredegar also has a non-qualified supplemental pension plan covering certain employees. Effective December 31, 2005, further participation in this plan was terminated and benefit accruals for existing participants were frozen. The plan was designed to restore all or a part of the pension benefits that would have been payable to designated participants from the principal pension plans if it were not for limitations imposed by income tax regulations. The projected benefit obligation relating to this unfunded plan was $1.7 million and $2.1 million at December 31, 2022 and December 31, 2021, respectively. Pension expense recognized for this plan was $0.1 million in 2022, 2021 and 2020. This information has been included in the pension benefit tables below.
In addition to providing pension benefits, the Company provides postretirement life insurance and health care benefits for certain groups of employees. Tredegar and retirees share in the cost of postretirement health care benefits, with employees hired on or before January 1, 1993, receiving a fixed subsidy to cover a portion of their health care premiums. The Company eliminated prescription drug coverage for Medicare-eligible retirees as of January 1, 2006. Consequently, Tredegar is not eligible for any federal subsidies.
Pension and other postretirement benefit liabilities related to Personal Care Films have been retained by the Company. Pension expense recognized for participation by these former employees in the Company’s plans is not material for the years ended December 31, 2022, 2021, and 2020.
The following tables reconcile the changes in benefit obligations and plan assets in 2022 and 2021, and reconcile the funded status to prepaid or accrued cost at December 31, 2022 and 2021:
| | | | | | | | | | | | | | | | | | | | | | | | | | |
| | Pension Benefits | | | Other Post-
Retirement Benefits |
| (In thousands) | 2022 | | 2021 | | | 2022 | | 2021 |
| Change in benefit obligation: | | | | | | | | |
| Benefit obligation, beginning of year | $ | 316,169 | | | $ | 336,159 | | | | $ | 7,370 | | | $ | 8,164 | |
| Service cost | — | | | — | | | | 18 | | | 21 | |
| Interest cost | 8,945 | | | 8,398 | | | | 207 | | | 195 | |
| Effect of actuarial (gains) losses related to the following: | | | | | | | | |
| Discount rate change | (61,519) | | | (12,512) | | | | (1,483) | | | (272) | |
| Retirement rate assumptions and mortality table adjustments | — | | | 1,028 | | | | — | | | (1) | |
| Other | 1,513 | | | (101) | | | | 90 | | | (274) | |
| Plan participant contributions | — | | | — | | | | 554 | | | 613 | |
| Benefits paid | (16,994) | | | (16,803) | | | | (1,030) | | | (1,076) | |
| Benefit obligation, end of year | $ | 248,114 | | | $ | 316,169 | | | | $ | 5,726 | | | $ | 7,370 | |
| Change in plan assets: | | | | | | | | |
| Plan assets at fair value, beginning of year | $ | 244,612 | | | $ | 233,075 | | | | $ | — | | | $ | — | |
| Actual return on plan assets | (59,683) | | | 23,131 | | | | — | | | — | |
| Employer contributions | 50,184 | | | 5,209 | | | | 476 | | | 463 | |
| Plan participant contributions | — | | | — | | | | 554 | | | 613 | |
| Benefits paid | (16,994) | | | (16,803) | | | | (1,030) | | | (1,076) | |
| Plan assets at fair value, end of year | $ | 218,119 | | | $ | 244,612 | | | | $ | — | | | $ | — | |
| Funded status of the plans | $ | (29,995) | | | $ | (71,557) | | | | $ | (5,726) | | | $ | (7,370) | |
| Amounts recognized in the consolidated balance sheets: | | | | | | | | |
| Accrued expenses (current) | $ | 180 | | | $ | 181 | | | | $ | 489 | | | $ | 478 | |
| Pension and other postretirement benefit obligations, net | 29,815 | | | 71,376 | | | | 5,237 | | | 6,892 | |
| Net amount recognized | $ | 29,995 | | | $ | 71,557 | | | | $ | 5,726 | | | $ | 7,370 | |
The following table sets forth the assumptions used in accounting for the pension and other post-retirement benefits, and the components of net periodic benefit cost:
| | | | | | | | | | | | | | | | | | | | | | | | | | | | | | | | | | | | | | |
| | Pension Benefits | | | Other Post-
Retirement Benefits |
| (In thousands, except percentages) | 2022 | | 2021 | | 2020 | | | 2022 | | 2021 | | 2020 |
| Weighted-average assumptions used to determine benefit obligations: | | | | | | | | | | | | |
| Discount rate | 5.07 | % | | 2.90 | % | | 2.57 | % | | | 5.17 | % | | 2.86 | % | | 2.54 | % |
| Expected long-term return on plan assets | 4.99 | % | | 3.05 | % | | 5.00 | % | | | n/a | | n/a | | n/a |
| Weighted-average assumptions used to determine net periodic benefit cost: | | | | | | | | | | | | |
| Discount rate | 2.90 | % | | 2.57 | % | | 3.27 | % | | | 2.86 | % | | 2.54 | % | | 3.25 | % |
| Expected long-term return on plan assets | 3.05 | % | | 5.00 | % | | 5.00 | % | | | n/a | | n/a | | n/a |
| Components of net periodic benefit cost: | | | | | | | | | | | | |
| Service cost | $ | — | | | $ | — | | | $ | — | | | | $ | 18 | | | $ | 21 | | | $ | 29 | |
| Interest cost | 8,945 | | | 8,398 | | | 10,156 | | | | 207 | | | 195 | | | 243 | |
| Expected return on plan assets | (8,174) | | | (11,316) | | | (11,004) | | | | — | | | — | | | — | |
| Amortization of prior service costs and gains or losses | 13,746 | | | 17,003 | | | 15,494 | | | | (140) | | | (141) | | | (198) | |
| Net periodic benefit cost | $ | 14,517 | | | $ | 14,085 | | | $ | 14,646 | | | | $ | 85 | | | $ | 75 | | | $ | 74 | |
Net periodic benefit cost is determined using assumptions at the beginning of each year. Funded status is determined using assumptions at the end of each year. The amount of the accumulated benefit obligation is the same as the projected benefit obligation. At December 31, 2022, the effect of a 1% change in the health care cost trend rate assumptions would not impact the post-retirement obligation.
Expected benefit payments over the next five years and in the aggregate for 2028—2032 are as follows:
| | | | | | | | | | | |
| (In thousands) | Pension
Benefits | | Other Post-
Retirement
Benefits |
| 2023 | $ | 18,701 | | | $ | 489 | |
| 2024 | 18,971 | | | 480 | |
| 2025 | 19,047 | | | 469 | |
| 2026 | 18,666 | | | 458 | |
| 2027 | 18,600 | | | 446 | |
| 2028—2032 | 88,847 | | | 2,051 | |
The average remaining duration of benefit payments for the pension plan is about 9.6 years.
The pre-tax amounts recorded in 2022, 2021 and 2020 in accumulated other comprehensive income consist of:
| | | | | | | | | | | | | | | | | | | | | | | | | | | | | | | | | | | |
| | Pension Benefits | | Other Post-Retirement Benefits |
| (In thousands) | 2022 | | 2021 | | 2020 | | 2022 | | 2021 | | 2020 |
| Net actuarial (gain) loss | $ | 103,998 | | | $ | 109,893 | | | $ | 150,267 | | | $ | (1,574) | | | $ | (320) | | | $ | 86 | |
Pension expense is expected to be approximately $14 million in 2023. The amounts in accumulated other comprehensive income, before related deferred income taxes, that are expected to be recognized as components of net periodic cost during 2023 are approximately $12 million of cost for the pension plan and approximately $0.2 million of benefit for other post-retirement plans.
The percentage composition of assets held by pension plans at December 31, 2022, 2021 and 2020 are as follows:
| | | | | | | | | | | | | | | | | |
| | % Composition of Plan Assets
at December 31, |
| | 2022 | | 2021 | | 2020 |
| Pension plans: | | | | | |
| Fixed income mutual fund | 13.9 | % | | — | | | — | |
| Fixed income securities | — | | | 25.3 | % | | 7.7 | % |
| Large/mid-capitalization equity securities | — | | | 28.1 | | | 27.1 | |
| Small-capitalization equity securities | — | | | 6.8 | | | 8.6 | |
| International and emerging market equity securities | — | | | 19.9 | | | 20.6 | |
| Total equity securities | — | | | 54.8 | | | 56.3 | |
| Private equity and hedge funds | 4.8 | | | 10.4 | | | 12.1 | |
| Collective investment trust | 69.9 | | | — | | | — | |
| Cash and cash equivalents | 11.4 | | | 2.8 | | | 17.5 | |
| Other assets | — | | | 6.7 | | | 6.4 | |
| Total | 100.0 | % | | 100.0 | % | | 100.0 | % |
Following the announcement to terminate and settle the pension plan, the Company contributed $50 million to the pension plan and implemented (through consultation with its investment advisors) a liability-matching bond portfolio investment strategy (including a derivative overlay) that hedged the estimated settlement funding gap, which was approximately $24 million (before plan administration costs) at that time. The overall objective of this hedging program is to minimize the volatility of the estimated settlement funding gap such that, as applicable interest rates move up or down causing a decrease or increase in the estimated value of the settlement liability, the value of the matching bond portfolio and derivative overlay decreases or increases by a similar amount.
A lower expected return on plan assets increases the amount of expense and vice versa. Decreases in the level of actual plan assets will also serve to increase the amount of pension expense. The total return on plan assets (net of fees and plan expenses), which is primarily affected by the change in fair value of plan assets, current year contributions and current year payments to participants, was approximately negative 15.1% in 2022, positive 10.4% in 2021 and positive 10.9% in 2020.
The expected long-term rate return of 5.00% used in both 2021 and 2020 were determined at the end of 2020 and 2019 and therefore did not contemplate the liability-driven investment strategy discussed above, however, the expected long-term rate return of 3.05% used in 2022 and 4.99% for 2023 does contemplate the liability-driven investment strategy discussed above.
Estimates of the fair value of assets held by the Company’s pension plan are provided by unaffiliated third parties. Investments in collective investment trusts, private equity, hedge funds and certain international equity securities are measured at net asset value, which is a practical expedient for measuring fair value. These assets are therefore excluded from the fair value hierarchy for each of the years presented. At December 31, 2022 and 2021, the pension plan assets are categorized by level within the fair value measurement hierarchy as follows:
| | | | | | | | | | | | | | | | | | | | | | | |
| (In thousands) | Total | | Quoted Prices
in Active
Markets for
Identical Assets
(Level 1) | | Significant
Other
Observable
Inputs
(Level 2) | | Significant
Unobservable
Inputs
(Level 3) |
| Balances at December 31, 2022 | | | | | | | |
Cash and cash equivalents(a) | $ | 24,796 | | | $ | 24,796 | | | $ | — | | | $ | �� | |
| Fixed income mutual fund | 30,284 | | | 30,284 | | | — | | | — | |
Private equity and hedge funds(b) | 10,250 | | | — | | | — | | | 10,250 | |
| Total plan assets at fair value | $ | 65,330 | | | $ | 55,080 | | | $ | — | | | $ | 10,250 | |
| Investments measured at net asset value: | | | | | | | |
Collective investment trust(c) | 152,389 | | | | | | | |
| Private equity and hedge funds | 141 | | | | | | | |
| Total investments measured at net asset value | $ | 152,530 | | | | | | | |
| Securities sold and interest receivable | 259 | | | | | | | |
| Total plan assets, December 31, 2022 | $ | 218,119 | | | | | | | |
| Balances at December 31, 2021 | | | | | | | |
| Cash and cash equivalents | $ | 6,943 | | | $ | 6,943 | | | $ | — | | | $ | — | |
| Large/mid-capitalization equity securities | 68,739 | | | 68,739 | | | — | | | — | |
| Small-capitalization equity securities | 16,588 | | | 16,588 | | | — | | | — | |
| International and emerging market equity securities | 25,174 | | | 25,174 | | | — | | | — | |
| Fixed income securities | 61,845 | | | 9,306 | | | 52,539 | | | — | |
| Contracts with insurance companies | 9,438 | | | — | | | — | | | 9,438 | |
Other assets(d) | 6,868 | | | 6,868 | | | — | | | — | |
| Total plan assets at fair value | $ | 195,595 | | | $ | 133,618 | | | $ | 52,539 | | | $ | 9,438 | |
| Investments measured at net asset value | 49,017 | | | | | | | |
| Total plan assets, December 31, 2021 | $ | 244,612 | | | | | | | |
(a) This category represents investments in cash and cash equivalents, which includes: 1.) cash held in the plan used for investments in U.S. Treasury futures which are entered into to minimize the volatility of the estimated settlement funding gap; and 2.) short term money market fund in which the amortized cost approximates fair value. These investments are highly liquid and therefore are classified as level 1 securities. (b) Represents the estimated fair market value of the Company’s ownership in private equity and hedge funds which are probable of being sold for an amount different from the net asset value per share in connection with the expected termination of the pension plan. (c) The collective investment trust contains liability hedging fixed income investments and are valued at the net asset value of the collective investment trust. The net asset value is used as a practical expedient to estimate fair value. The net asset value is based on the fair value of the underlying investments held by the fund less its liabilities. (d) Represents investments in certain commodity funds measured using quoted market prices. |
9. OTHER INCOME (EXPENSE), NET
Other income (expense), net consists of the following:
| | | | | | | | | | | | | | | | | |
| (In thousands) | 2022 | | 2021 | | 2020 |
Gain (loss) on investment in kaléo(a) | $ | 1,406 | | | $ | 12,780 | | | $ | (60,900) | |
| One-time tax credit in Brazil for unemployment/social security insurance non-income taxes resulting from a favorable decision by Brazil’s Supreme Court regarding the calculation of such tax | — | | | 8,486 | | | — | |
COVID-19-related expenses(b) | (350) | | | (624) | | | (2,231) | |
| Loss on sale of Bright View Technologies | — | | | — | | | (2,299) | |
| Other | (121) | | | (266) | | | (1,864) | |
| Total | $ | 935 | | | $ | 20,376 | | | $ | (67,294) | |
(a) In May 2022, additional cash consideration of $1.4 million was received related to customary post-closing adjustments. The gain in 2021 includes a $0.3 million dividend received from kaléo in the first quarter of 2021. See Note 16 for additional information. (b) Costs associated with operating under COVID-19 conditions include employee overtime expenses associated with absenteeism, personal protective equipment supplies and facility maintenance. |
In May 2021, the Brazil Supreme Court ruled in a leading case related to the amount of Brazilian value-added tax to exclude from the calculation of unemployment/social security insurance non-income taxes (“PIS/COFINS”). As a result, in the second quarter of 2021, the Company recorded a pre-tax gain of $8.5 million for certain excess PIS/COFINS paid from 2003 to 2021, that included applicable interest, which the Company applied to required Brazilian federal tax payments during 2021. The pre-tax gain was recorded in “Other income (expense), net” in the consolidated statements of income.
In December 2020, the Company entered into a definitive agreement and completed the sale of Bright View Technologies, which resulted in the recognition of a pre-tax loss of $2.3 million ($1.8 million after-tax).
10. DERIVATIVES
Tredegar uses derivative financial instruments for the purpose of hedging margin exposure from fixed-price forward sales contracts in Aluminum Extrusions and exposure from currency volatility that exist as part of ongoing business operations (primarily in Flexible Packaging Films). These derivative financial instruments are designated as and qualify as cash flow hedges and are recognized in the consolidated balance sheet at fair value. The fair value of derivative instruments recorded on the consolidated balance sheets are based upon Level 2 inputs. If individual derivative instruments with the same counterparty can be settled on a net basis, the Company records the corresponding derivative fair values as a net asset or net liability.
In the normal course of business, Aluminum Extrusions enters into fixed-price forward sales contracts with certain customers for the future sale of fixed quantities of aluminum extrusions at scheduled intervals. In order to hedge margin exposure created from the fixing of future sales prices relative to volatile raw material (aluminum) costs, Aluminum Extrusions enters into a combination of forward purchase commitments and futures contracts to acquire or hedge aluminum, based on the scheduled purchases for the firm sales commitments. The fixed-price firm sales commitments and related hedging instruments generally have durations of not more than 12 months, and the notional amount of aluminum futures contracts that hedged future purchases of aluminum to meet fixed-price forward sales contract obligations was $20.2$30.7 million (19.6(20.3 million pounds of aluminum) at December 31, 20192022 and $25.4$22.1 million (22.5(14.9 million pounds of aluminum) at December 31, 2018.2021.
The table below summarizes the location and gross amounts of aluminum derivative contract fair values (Level 2) in the consolidated balance sheets as of December 31, 20192022 and 2018:2021:
| | | | December 31, 2019 | | December 31, 2018 | | December 31, 2022 | | December 31, 2021 |
| (In thousands) | Balance Sheet Account | | Fair Value | | Balance Sheet Account | | Fair Value | (In thousands) | Balance Sheet
Account | | Fair
Value | | Balance Sheet
Account | | Fair
Value |
| Derivatives Designated as Hedging Instruments | | | | | Derivatives Designated as Hedging Instruments | |
Asset derivatives: Aluminum futures contracts | Accrued expenses | | $ | 6 |
| | Accrued expenses | | $ | 20 |
| Asset derivatives:
Aluminum futures contracts | Prepaid expenses & other | | $ | 48 | | | Prepaid expenses & other | | $ | 2,085 | |
Liability derivatives: Aluminum futures contracts | Accrued expenses | | (1,259 | ) | | Accrued expenses | | (1,650 | ) | Liability derivatives:
Aluminum futures contracts | Accrued expenses | | (3,260) | | | Accrued expenses | | (119) | |
| Aluminum futures contracts | | Aluminum futures contracts | Other non-current liabilities | | (369) | | | Other non-current liabilities | | — | |
| Net asset (liability) | | $ | (1,253 | ) | | $ | (1,630 | ) | Net asset (liability) | | $ | (3,581) | | | $ | 1,966 | |
In the event that a counterparty to an aluminum fixed-price forward sales contract chooses not to take delivery of its aluminum extrusions, the customer is contractually obligated to compensate Aluminum Extrusions for any losses on the related aluminum futures and/or forward contracts through the date of cancellation.
The table below summarizes the location and gross amounts of foreign currency forward contract fair values (Level 2) in the consolidated balance sheets as of December 31, 2019 and 2018:
|
| | | | | | | | | | | |
| | December 31, 2019 | | December 31, 2018 |
| (In thousands) | Balance Sheet Account | | Fair Value | | Balance Sheet Account | | Fair Value |
| Derivatives Designated as Hedging Instruments | | | | | | | |
Asset derivatives: Foreign currency forward contracts | Prepaid expenses and other | | $ | 83 |
| | Prepaid expenses and other | | $ | 37 |
|
Liability derivatives: Foreign currency forward contracts | Accrued expenses | | (935 | ) | | Accrued expenses | | (1,090 | ) |
| Net asset (liability) | | | $ | (852 | ) | | | | $ | (1,053 | ) |
The Company's earnings are exposed to foreign currency exchange risk primarily through the translation of the financial statements of subsidiaries that have a functional currency other than the U.S. Dollar. The Company’s largest exposure is for the Flexible Packaging Films business unit in Brazil, Terphane Limitada's (“Terphane Ltda.”). The Company estimates that the net mismatch translation exposure between for the Flexible Packaging Film's business unit in Brazil (“Terphane Ltda.’s U.S. Dollar”) of its sales and raw materials quoted or priced salesin U.S. Dollars and its underlying Brazilian Real (“R$”)variable conversion, fixed conversion and sales, general and administrative costs (before depreciation and amortization) quoted or priced operating costs (excluding depreciation and amortization)in Brazilian Real is annual net costs of R$137 million. As of December 31, 2019, 177 million Brazilian Real ("R$").
Terphane Ltda. hadhas the following outstanding foreign exchange average forward rate contracts to purchase Brazilian Real and sell U.S. Dollars:
|
| | | | |
| USD Notional Amount (000s) | Average Forward Rate Contracted on USD/BRL | R$ Equivalent Amount (000s) | Applicable Month | Estimated % of Terphane Ltda. R$ Operating Cost Exposure Hedged |
| $2,100 | 3.8900 | R$8,169 | Jan-20 | 72% |
| $2,200 | 3.9040 | R$8,589 | Feb-20 | 75% |
| $2,200 | 3.9076 | R$8,597 | Mar-20 | 75% |
| $2,200 | 3.9131 | R$8,609 | Apr-20 | 75% |
| $2,200 | 3.9188 | R$8,621 | May-20 | 76% |
| $2,200 | 3.9249 | R$8,635 | Jun-20 | 76% |
| $2,200 | 3.9326 | R$8,652 | Jul-20 | 76% |
| $2,200 | 3.9413 | R$8,671 | Aug-20 | 76% |
| $2,200 | 3.9495 | R$8,689 | Sep-20 | 76% |
| $2,200 | 3.9579 | R$8,707 | Oct-20 | 76% |
| $2,200 | 3.9660 | R$8,725 | Nov-20 | 76% |
| $2,050 | 3.9653 | R$8,129 | Dec-20 | 71% |
| $26,150 | 3.9309 | R$102,793 | | 75% |
| | | | | | | | | | | | | | |
| USD Notional Amount (000s) | Average Forward Rate Contracted on USD/BRL | R$ Equivalent Amount (000s) | Applicable Month | Estimated % of Terphane Ltda. R$ Operating Cost Exposure Hedged |
| $1,728 | 5.4310 | R$9,385 | Jan-23 | 64% |
| $1,822 | 5.4657 | R$9,959 | Feb-23 | 68% |
| $1,921 | 5.4995 | R$10,565 | Mar-23 | 72% |
| $1,903 | 5.5379 | R$10,539 | Apr-23 | 72% |
| $1,873 | 5.5753 | R$10,443 | May-23 | 71% |
| $1,928 | 5.6118 | R$10,820 | Jun-23 | 74% |
| $2,154 | 5.6378 | R$12,144 | Jul-23 | 83% |
| $2,020 | 5.6831 | R$11,480 | Aug-23 | 78% |
| $2,071 | 5.7174 | R$11,841 | Sep-23 | 80% |
| $2,013 | 5.7556 | R$11,586 | Oct-23 | 79% |
| $2,018 | 5.7836 | R$11,671 | Nov-23 | 79% |
| $1,786 | 5.8312 | R$10,414 | Dec-23 | 71% |
| $659 | 5.7360 | R$3,780 | Jan-24 | 23% |
| $659 | 5.7562 | R$3,793 | Feb-24 | 23% |
| $659 | 5.7774 | R$3,807 | Mar-24 | 23% |
| $659 | 5.8000 | R$3,822 | Apr-24 | 23% |
| $659 | 5.8207 | R$3,836 | May-24 | 24% |
| $659 | 5.8419 | R$3,850 | Jun-24 | 24% |
| $659 | 5.8636 | R$3,864 | Jul-24 | 24% |
| $659 | 5.8872 | R$3,880 | Aug-24 | 24% |
| $659 | 5.9118 | R$3,896 | Sep-24 | 24% |
| $659 | 5.9350 | R$3,911 | Oct-24 | 24% |
| $659 | 5.9581 | R$3,926 | Nov-24 | 24% |
| $659 | 5.9813 | R$3,942 | Dec-24 | 24% |
| $31,145 | 5.6880 | R$177,154 | | 48% |
These foreign currency exchange contracts have been designated as and qualify as cash flow hedges of Terphane Ltda.’s forecasted sales to customers quoted or priced in U.S. Dollars over that period. By changing the currency risk associated with these U.S. Dollar sales, the derivatives have the effect of offsetting operating costs quoted or priced in Brazilian Real and decreasing the net exposure to Brazilian Real in the consolidated statements of income.
The nettable below summarizes the location and gross amounts of foreign currency forward contract fair value ofvalues (Level 2) in the open forward contracts was a negative $0.8 millionconsolidated balance sheets as of December 31, 2019.2022 and 2021:
| | | | | | | | | | | | | | | | | | | | | | | |
| | December 31, 2022 | | December 31, 2021 |
| (In thousands) | Balance Sheet
Account | | Fair
Value | | Balance Sheet
Account | | Fair
Value |
| Derivatives Designated as Hedging Instruments | | | | | | | |
Asset derivatives:
Foreign currency forward contracts | Prepaid expenses and other | | $ | 781 | | | Prepaid expenses and other | | $ | — | |
| Foreign currency forward contracts | Other non-current assets | | 33 | | | Other non-current assets | | — | |
Liability derivatives:
Foreign currency forward contracts | Accrued expenses | | — | | | Accrued expenses | | (1,255) | |
| Foreign currency forward contracts | Other non-current liabilities | | (3) | | | Other non-current liabilities | | — | |
| Net asset (liability) | | | $ | 811 | | | | | $ | (1,255) | |
These derivative contracts involve elements of market risk that are not reflected on the consolidated balance sheet, including the risk of dealing with counterparties and their ability to meet the terms of the contracts. The counterparties to any forward purchase commitments are major aluminum brokers and suppliers, and the counterparties to any aluminum futures contracts are major financial institutions. Fixed-price forward sales contracts are only made available to the best and most credit-worthy customers. The counterparties to the Company’s foreign currency cash flow hedge contracts are major financial institutions.
The pretaxpre-tax effect on net income (loss) from continuing operations and other comprehensive income (loss) of derivative instruments classified as cash flow hedges and described in the previous paragraphs for years ended December 31, 2019, 2018,2022, 2021, and 20172020 is summarized in the tables below:
| | | | | | | | | | | | | | | | | |
| (In thousands) | Cash Flow Derivative Hedges |
| | Aluminum Futures Contracts |
| Years Ended December 31, | 2022 | | 2021 | | 2020 |
| Amount of pre-tax gain (loss) recognized in other comprehensive income | $ | (4,525) | | | $ | 6,215 | | | $ | 74 | |
| Location of gain (loss) reclassified from accumulated other comprehensive income into net income (effective portion) | Cost of
goods sold | | Cost of
goods sold | | Cost of
goods sold |
| Amount of pre-tax gain (loss) reclassified from accumulated other comprehensive income to net income (effective portion) | $ | 1,022 | | | $ | 5,787 | | | $ | (2,717) | |
| | | (In thousands) | Cash Flow Derivative Hedges | (In thousands) | Cash Flow Derivative Hedges |
| | Aluminum Futures Contracts | | Foreign Currency Forward Contracts |
| Years Ended December 31, | 2019 | | 2018 | | 2017 | Years Ended December 31, | 2022 | | 2021 | | 2020 |
| Amount of pre-tax gain (loss) recognized in other comprehensive income | $ | (2,359 | ) | | $ | (1,123 | ) | | $ | 1,501 |
| Amount of pre-tax gain (loss) recognized in other comprehensive income | $ | — | | $ | 3,269 | | | $ | — | | $ | (2,415) | | | $ | — | | $ | (4,437) | |
| Location of gain (loss) reclassified from accumulated other comprehensive income into net income (effective portion) | Cost of goods sold |
| | Cost of
goods sold |
| | Cost of
goods sold |
| Location of gain (loss) reclassified from accumulated other comprehensive income into net income (effective portion) | Cost of
goods sold | Selling, general & admin | | Cost of
goods sold | Selling, general & admin | | Cost of
goods sold | Selling, general & admin |
| Amount of pre-tax gain (loss) reclassified from accumulated other comprehensive income to net income (effective portion) | $ | (2,736 | ) | | $ | 1,069 |
| | $ | 1,210 |
| Amount of pre-tax gain (loss) reclassified from accumulated other comprehensive income to net income (effective portion) | $ | 61 | | $ | 1,378 | | | $ | 63 | | $ | (337) | | | $ | 62 | | $ | (6,069) | |
|
| | | | | | | | | | | | | | | | | | | | |
| (In thousands) | Cash Flow Derivative Hedges |
| | Foreign Currency Forward Contracts |
| Years Ended December 31, | 2019 | | 2018 | | 2017 |
| Amount of pre-tax gain (loss) recognized in other comprehensive income | $ | — |
| $ | (856 | ) | | $ | — |
| $ | (2,105 | ) | | $ | — |
| $ | (561 | ) |
| Location of gain (loss) reclassified from accumulated other comprehensive income into net income (effective portion) | Cost of
goods sold | Selling, general & admin | | Cost of
goods sold | Selling, general & admin | | Cost of
goods sold | Selling, general & admin |
| Amount of pre-tax gain (loss) reclassified from accumulated other comprehensive income to net income (effective portion) | $ | 62 |
| $ | (904 | ) | | $ | 62 |
| $ | (1,796 | ) | | $ | 62 |
| $ | (43 | ) |
Gains and losses on the ineffective portion of derivative instruments or derivative instruments that were not designated as hedging instruments were not material in 2019, 2018 and 2017. For the years ended December 31, 2019, 2018 and 2017, unrealized net losses from hedges that were discontinued were not material. As of December 31, 2019,2022, the Company expected $0.9expects $2.0 million of unrealized after-tax net losses on aluminum and foreign currency derivative instrumentscontracts reported in accumulated other comprehensive income (loss) to be reclassified to earnings within the next 12 months.
Accrued expenses consist of For the following:
|
| | | | | | | |
| (In thousands) | 2019 | | 2018 |
| Vacation | $ | 8,842 |
| | $ | 8,946 |
|
| Incentive compensation | 9,792 |
| | 6,979 |
|
| Payrolls, related taxes and medical and other benefits | 6,823 |
| | 6,600 |
|
| Workers’ compensation and disabilities | 3,557 |
| | 4,048 |
|
| Derivative contract liability | 2,188 |
| | 2,720 |
|
| Accrued utilities | 2,588 |
| | 2,420 |
|
| Accrued freight | 1,547 |
| | 2,091 |
|
| Environmental liabilities (current) | 2,122 |
| | 1,990 |
|
| Customer rebates | 2,442 |
| | 1,476 |
|
| Accrued severance | 1,389 |
| | 637 |
|
| Other | 4,519 |
| | 4,588 |
|
| Total | $ | 45,809 |
| | $ | 42,495 |
|
A reconciliation of the beginning and ending balances of accrued expenses associated with asset impairments and costs related to exit and disposal activities for each of the three years in the period ended December 31, 2019 can be found in Note 17.2022, 2021 and 2020, net gains or losses realized, from previously unrealized net gains or losses on hedges that had been discontinued, were not material.
| |
11 | DEBT AND CREDIT AGREEMENTS |
On June 28, 2019, Tredegar entered into a $500 million five-year, secured revolving credit agreement (“Credit Agreement”), with an option to increase that amount by $100 million. The Credit Agreement amends and restates the Company’s previous $400 million five-year, secured revolving credit facility that was due to expire on March 1, 2021.11. STOCK OPTION AND STOCK AWARD PLANS
Borrowings under the Credit Agreement bear an interest rateAs of LIBOR plus a credit spread and commitment fees charged on the unused amount under the Credit Agreement at various indebtedness-to-adjusted EBITDA levels as follows:
|
| | | | | | |
| Pricing Under Credit Agreement (Basis Points) |
| Indebtedness-to-Adjusted EBITDA Ratio | Credit Spread
Over LIBOR | | Commitment
Fee |
| > 3.5x but <= 4.0x | 200.0 |
| | 40 |
|
| > 3.0x but <= 3.5x | 187.5 |
| | 35 |
|
| > 2.0x but <= 3.0x | 175.0 |
| | 30 |
|
| > 1.0x but <= 2.0x | 162.5 |
| | 25 |
|
| <= 1.0x | 150.0 |
| | 20 |
|
At December 31, 2019,2022, the interest cost on debt borrowed underCompany had one stock-based compensation plan that permits the Credit Agreement was priced at one-month LIBOR plus the applicable credit spreadgrants of 150 basis points.
The most restrictive covenants in the Credit Agreement include:
Maximum indebtedness-to-adjusted EBITDAstock options, stock appreciation rights (“Leverage Ratio:SARs”) of 4.00x;
Minimum adjusted EBITDA-to-interest expense of 3.00x; and
Maximum aggregate distributions to shareholders over the term of the Credit Agreement of $130 million plus, beginning with the fiscal quarter ended June 30, 2019, 50% of net income, stock, restricted stock, and at a Leverage Ratio of equal to or greater than 3.00x, a limitation on such paymentsstock unit awards. Awards available for the succeeding quarter at the greater of (i) $4.75 million and (ii) 50% of consolidated net income for the most recent fiscal quarter.
The Credit Agreement is secured by substantially all of the Company’s and its domestic subsidiaries’ assets, including equity in certain material first-tier foreign subsidiaries.
At December 31, 2019, based upon the most restrictive covenant within the Credit Agreement, available credit under the Credit Agreement was approximately $370 million. Total debt due and outstandinggrant totaled 681,479 shares at December 31, 2019 is summarized below:
|
| | | | | | | | | | | |
Debt Due and Outstanding at December 31, 2019 (In thousands) |
| Year Due | Credit Agreement | | Other | | Total Debt Due |
| 2020 | $ | — |
| | $ | — |
| | $ | — |
|
| 2021 | — |
| | — |
| | — |
|
| 2022 | — |
| | — |
| | — |
|
| 2023 | — |
| | — |
| | — |
|
| 2024 | 42,000 |
| | — |
| | 42,000 |
|
| Total | $ | 42,000 |
| | $ | — |
| | $ | 42,000 |
|
Tredegar was in compliance with all of its debt covenants as of December 31, 2019. Noncompliance with any of the debt covenants may have a material adverse effect on financial condition or liquidity in the event such noncompliance cannot be cured or should the Company be unable to obtain a waiver from the lenders. Renegotiation of the covenant through an amendment to the Credit Agreement may effectively cure the noncompliance, but may have an effect on financial condition or liquidity depending upon how the covenant is renegotiated.
| |
12 | STOCK OPTION AND STOCK AWARD PLANS |
Tredegar has one equity incentive plan under which stock2022. Stock options may be granted to purchase a specified number of shares of common stock at a price no lower than the fair market value on the date of grant and for a term not to exceed 10 years. Stock options granted by
the Company during 2019, 2018in 2022, 2021 and 2017 either2020 vest after 2 years and have a 7-year life or vest after 3 years and have a 5-year life. Stock options exercisable totaled 2,719,919 and 1,762,190 shares at December 31, 2022 and 2021, respectively.
On December 1, 2020, Tredegar’s Board of Directors declared a special cash dividend of $200 million, or $5.97 per share, on the Company’s common stock (the “Special Dividend”). The Special Dividend was payable on December 18, 2020 and had an ex-dividend date of December 21, 2020. All stock option planawards that were outstanding at the time of the Special Dividend were modified pursuant to the nondiscretionary anti-dilution provisions in the related stock-based compensation plan. SARs that were outstanding at the time of the Special Dividend were also permitsmodified pursuant to the grantingnondiscretionary anti-dilution provisions in the related SARs grant agreements. The modifications included increasing the number of outstanding stock options and SARs as well as reducing the exercise prices of all outstanding stock options and SARS. The modification did not result in additional stock-based compensation expense. No other terms or conditions of outstanding awards were modified.
A summary of stock appreciation rights (“SARs”),options outstanding at December 31, 2022, 2021 and 2020, and changes during those years, is presented below:
| | | | | | | | | | | | | | | | | | | | | | | | | | | | | |
| | | | Option Exercise Price/Share |
| | Number of
Options | | Range | | Weighted
Average |
| Outstanding at January 1, 2020 | 1,628,903 | | | $ | 15.65 | | | to | | $ | 24.84 | | | $ | 19.13 | |
| Granted | 638,074 | | | 10.75 | | | to | | 14.62 | | | 11.90 | |
Modification for special cash dividend(a) | 701,535 | | | 10.75 | | | to | | 14.62 | | | 11.90 | |
Forfeited and expired(a) | (141,074) | | | 10.75 | | | to | | 24.84 | | | 11.87 | |
Outstanding at December 31, 2020(a) | 2,827,438 | | | 10.75 | | | to | | 22.49 | | | 13.55 | |
| Granted | 388,822 | | | 16.37 | | | to | | 16.37 | | | 16.37 | |
| Forfeited and expired | (22,611) | | | 14.47 | | | to | | 19.64 | | | 18.14 | |
| Exercised | (67,705) | | | 10.75 | | | to | | 17.29 | | | 13.51 | |
| Outstanding at December 31, 2021 | 3,125,944 | | | 10.75 | | | to | | 22.49 | | | 13.82 | |
| | | | | | | | | |
| Forfeited and expired | (17,203) | | | 14.47 | | | to | | 19.64 | | | 15.33 | |
| | | | | | | | | |
| Outstanding at December 31, 2022 | 3,108,741 | | | $ | 10.75 | | | to | | $ | 22.49 | | | $ | 13.81 | |
| (a) The option exercise price per share reflects the reduction to the exercise prices of outstanding stock options impacted by the modification due to the anti-dilution provisions in the stock-based compensation plan. |
The assumptions used in the Black-Scholes options-pricing model for valuing Tredegar stock restrictedoptions originally granted in 2021 and 2020, and the related estimated fair values at the date of grant, were as follows, no options were granted in 2022:
| | | | | | | | | | | |
| 2021 | | 2020 |
| Dividend yield | 2.6 | % | | 2.5 | % |
| Weighted average volatility percentage | 48.3 | % | | 43.8 | % |
| Weighted average risk-free interest rate | 0.9 | % | | 0.8 | % |
| Holding period (years) | 5 | | 5 |
Weighted average exercise price at date of grant (also weighted average market price at date of grant)(a) | $ | 16.37 | | | $ | 14.41 | |
| Estimated weighted average fair value of options per share at date of grant | $ | 5.57 | | | $ | 4.44 | |
| Total estimated fair value of stock options granted (in thousands) | $ | 2,165 | | | $ | 2,833 | |
| (a) In December 2020, the weighted average exercise price for outstanding stock option awards granted in 2020 were modified to $10.75. As the anti-dilution provisions in the stock-based compensation plan were structured to equitably adjust the award’s fair value before and after the modification, there is no resulting incremental fair value. |
The dividend yield is the actual dividend yield on Tredegar’s common stock at the date of grant, which the Company believes is a reasonable estimate of the expected yield during the holding period. The expected volatility is based on the historical volatility of Tredegar’s common stock unitusing a sequential period of historical data equal to the expected holding period of the option. The Company has no reason to believe that future volatility for this period is likely to differ from the past. The assumed risk-free interest rate is based on observed interest rates for U.S. Treasury debt securities appropriate for the expected holding period.
The following table summarizes additional information about stock options outstanding and exercisable at December 31, 2022:
| | | | | | | | | | | | | | | | | | | | | | | | | | | | | | | | | | | | | | | | | | | | | | | | | | | | | | | | |
| | | | | | | Options Outstanding at December 31, 2022 | | Options Exercisable at December 31, 2022 |
| | | | | | | | | Weighted Average | | Aggregate Intrinsic Value | | | | | | Aggregate Intrinsic Value |
Range of
Exercise Prices | | Shares | | Remaining Contractual Life | | Exercise
Price | | | Shares | | Weighted Average Exercise Price | |
| $ | 10.75 | | | to | | $ | 16.37 | | | 2,939,509 | | | 3.4 years | | $ | 13.47 | | | $ | — | | | 2,550,687 | | | $ | 13.03 | | | $ | — | |
| 17.29 | | | to | | 25.94 | | | 169,232 | | | 0.7 years | | 19.74 | | | — | | | 169,232 | | | 19.74 | | | — | |
| Total | | 3,108,741 | | | 3.3 years | | $ | 13.82 | | | $ | — | | | 2,719,919 | | | $ | 13.45 | | | $ | — | |
The total intrinsic value of stock options exercised was $0.2 million in 2021. There were no stock options exercised in 2022 and 2020. The grant-date fair value of stock option-based awards vested in 2022, 2021, and incentive awards. 2020 was $5.4 million, $3.5 million, and $3.0 million, respectively. As of December 31, 2022, the unrecognized compensation cost for continuing operations related to stock option-based awards was $0.2 million. This cost is expected to be recognized over the remaining weighted average period of 0.2 years.
Restricted stock grants ordinarily vest three years from the date of grant based upon continued employment. The fair value of restricted stock awards is estimated as of the grant date using the closing stock price on that date. Stock unit awards vest upon the achievement of certain performance targets. No SARs have been granted since 1992 and none are currently outstanding.
A summary of stock options outstanding at December 31, 2019, 2018 and 2017, and changes during those years, is presented below:
|
| | | | | | | | | | | | | | | | |
| | | | Option Exercise Price/Share |
| Number of Options | | Range | | Weighted Average |
| Outstanding at January 1, 2017 | 500,919 |
| | $ | 17.13 |
| | to | | $ | 30.01 |
| | $ | 21.67 |
|
| Granted | 209,551 |
| | 15.65 |
| | to | | 15.65 |
| | 15.65 |
|
| Forfeited and expired | (60,685 | ) | | 17.13 |
| | to | | 30.01 |
| | 21.42 |
|
| Exercised | (41,265 | ) | | 19.84 |
| | to | | 19.84 |
| | 19.84 |
|
| Outstanding at December 31, 2017 | 608,520 |
| | 15.65 |
| | to | | 24.84 |
| | 19.75 |
|
| Granted | 451,083 |
| | 19.35 |
| | to | | 19.35 |
| | 19.35 |
|
| Forfeited and expired | (96,089 | ) | | 15.65 |
| | to | | 24.84 |
| | 19.58 |
|
| Exercised | (73,398 | ) | | 15.65 |
| | to | | 22.49 |
| | 18.15 |
|
| Outstanding at December 31, 2018 | 890,116 |
| | 15.65 |
| | to | | 24.84 |
| | 19.69 |
|
| Granted | 758,287 |
| | 18.48 |
| | to | | 18.48 |
| | 18.48 |
|
| Forfeited and expired | (10,000 | ) | | 19.40 |
| | to | | 19.40 |
| | 19.40 |
|
| Exercised | (9,500 | ) | | 19.40 |
| | to | | 19.40 |
| | 19.40 |
|
| Outstanding at December 31, 2019 | 1,628,903 |
| | $ | 15.65 |
| | to | | $ | 24.84 |
| | $ | 19.13 |
|
The following table summarizes additional information about stock options outstanding and exercisable at December 31, 2019:
|
| | | | | | | | | | | | | | | | | | | | | | | | | | | | | | | | |
| | | | | | | Options Outstanding at December 31, 2019 | | Options Exercisable at December 31, 2019 |
| | | | | | | | | Weighted Average | | Aggregate Intrinsic Value | | | | | | Aggregate Intrinsic Value |
Range of Exercise Prices | | Shares | | Remaining Contractual Life (Years) | | Exercise Price | | | Shares | | Weighted Average Exercise Price | |
| $ | — |
| | to | | $ | 15.00 |
| | — |
| | 0.0 | | $ | — |
| | $ | — |
| | — |
| | $ | — |
| | $ | — |
|
| 15.01 |
| | to | | 17.50 |
| | 163,641 |
| | 4.4 | | 15.65 |
| | 1,096,395 |
| | 104,326 |
| | 15.65 |
| | 698,984 |
|
| 17.51 |
| | to | | 20.00 |
| | 1,255,670 |
| | 5.3 | | 18.83 |
| | 4,424,405 |
| | 46,300 |
| | 19.40 |
| | 136,585 |
|
| 20.01 |
| | to | | 25.00 |
| | 209,592 |
| | 3.5 | | 23.69 |
| | — |
| | 209,592 |
| | 23.69 |
| | — |
|
| Total | | 1,628,903 |
| | 5.0 | | $ | 19.13 |
| | $ | 5,520,800 |
| | 360,218 |
| | $ | 20.81 |
| | $ | 835,569 |
|
The following table summarizes additional information about unvested restricted stock outstanding at December 31, 2019, 20182022, 2021 and 2017:2020:
| | | | | | | | | | | | | | | | | | | | | | | | | | | | | | | | | | | |
| | Unvested Restricted Stock | | Maximum Unvested Restricted Stock Units Issuable Upon Satisfaction of Certain Performance Criteria |
| | Number
of Shares | | Weighted Avg. Grant Date Fair Value/Share | | Grant Date
Fair Value
(In thousands) | | Number
of Shares | | Weighted Avg. Grant Date Fair Value/Share | | Grant Date
Fair Value
(In thousands) |
| Outstanding at January 1, 2020 | 285,935 | | | $ | 18.27 | | | $ | 5,224 | | | 147,663 | | | $ | 21.25 | | | $ | 3,138 | |
| Granted | 155,138 | | | 14.55 | | | 2,257 | | | 34,275 | | | 15.25 | | | 523 | |
| Vested | (148,709) | | | 17.39 | | | (2,586) | | | (37,370) | | | 17.38 | | | (649) | |
| Forfeited | (57,385) | | | 17.00 | | | (976) | | | (32,066) | | | 17.36 | | | (557) | |
| Outstanding at December 31, 2020 | 234,979 | | | 16.68 | | | 3,919 | | | 112,502 | | | 21.82 | | | 2,455 | |
| Granted | 200,073 | | | 15.63 | | | 3,127 | | | 14,669 | | | 15.24 | | | 224 | |
| Vested | (87,636) | | | 15.78 | | | (1,383) | | | (73,930) | | | 17.17 | | | (1,269) | |
| Forfeited | (11,616) | | | 16.38 | | | (190) | | | (2,523) | | | 17.63 | | | (44) | |
| Outstanding at December 31, 2021 | 335,800 | | | 16.30 | | | 5,473 | | | 50,718 | | | 17.63 | | | 1,366 | |
| Granted | 301,969 | | | 11.88 | | | 3,587 | | | — | | | — | | | — | |
| Vested | (144,317) | | | 15.10 | | | (2,179) | | | — | | | — | | | — | |
| Forfeited | (18,474) | | | 14.94 | | | (276) | | | (50,718) | | | 17.63 | | | 1,366 | |
| Outstanding at December 31, 2022 | 474,978 | | | $ | 13.82 | | | $ | 6,564 | | | — | | | $ | — | | | $ | — | |
|
| | | | | | | | | | | | | | | | | | | | | |
| | Unvested Restricted Stock | | Maximum Unvested Restricted Stock Units Issuable Upon Satisfaction of Certain Performance Criteria |
| | Number of Shares | | Weighted Avg. Grant Date Fair Value/Share | | Grant Date Fair Value (In thousands) | | Number of Shares | | Weighted Avg. Grant Date Fair Value/Share | | Grant Date Fair Value (In thousands) |
| Outstanding at January 1, 2017 | 207,355 |
| | $ | 15.90 |
| | $ | 3,297 |
| | 238,429 |
| | $ | 16.39 |
| | $ | 3,908 |
|
| Granted | 107,362 |
| | 18.29 |
| | 1,964 |
| | 46,205 |
| | 17.38 |
| | 803 |
|
| Vested | (50,154 | ) | | 19.72 |
| | (989 | ) | | — |
| | — |
| | — |
|
| Forfeited | (57,887 | ) | | 16.16 |
| | (935 | ) | | (112,501 | ) | | 17.73 |
| | (1,995 | ) |
| Outstanding at December 31, 2017 | 206,676 |
| | 16.15 |
| | 3,337 |
| | 172,133 |
| | 15.78 |
| | 2,716 |
|
| Granted | 119,915 |
| | 17.39 |
| | 2,085 |
| | 61,227 |
| | 17.35 |
| | 1,062 |
|
| Vested | (64,702 | ) | | 18.31 |
| | (1,185 | ) | | — |
| | — |
| | — |
|
| Forfeited | (17,153 | ) | | 15.84 |
| | (272 | ) | | (48,651 | ) | | 13.23 |
| | (644 | ) |
| Outstanding at December 31, 2018 | 244,736 |
| | 16.20 |
| | 3,965 |
| | 184,709 |
| | 16.97 |
| | 3,134 |
|
| Granted | 185,422 |
| | 18.46 |
| | 3,423 |
| | 57,442 |
| | 18.34 |
| | 1,053 |
|
| Vested | (117,834 | ) | | 14.76 |
| | (1,739 | ) | | (69,926 | ) | | 10.96 |
| | (766 | ) |
| Forfeited | (26,389 | ) | | 16.11 |
| | (425 | ) | | (24,562 | ) | | 11.51 |
| | (283 | ) |
| Outstanding at December 31, 2019 | 285,935 |
| | $ | 18.27 |
| | $ | 5,224 |
| | 147,663 |
| | $ | 21.25 |
| | $ | 3,138 |
|
The total intrinsic value of stock options exercised was $0.1 million in 2019, $0.4 million in 2018 and $0.2 million in 2017. The grant-date fair value of stock option-based awards vested was $0.5 million in 2019, $0.1 million in 2018 and $0.4 million in 2017. As of December 31, 2019, there was2022, the unrecognized compensation cost of $1.9 million related to stock option-based awards and $2.5 millionfor continuing operations related to non-vested restricted stock and other stock-based awards.awards was $3.2 million. This cost is expected to be recognized over the remaining weighted average period of 1.091.6 years.
SARs granted by the Company in 2021 and 2020 vest after 2 years for stock option-based awards and 1.44 years for non-vested restricted stock and other stock-based awards. Stock option awardshave a 7-year life. There were no SARs granted in 2019 included a retirement provision that allowed for the immediate vesting of options held by a participant of the plan that ceased to provide service, including service as a member of the board of directors, with the Company subsequent to reaching the age of 65. As a result of this provision and2022. SARs may be settled in accordance with accounting for stock-based compensation, the Company accelerated the recognition of $1.3 million of expense into 2019. At December 31, 2019, the participant continues to provide ongoing service to the Company,cash upon exercise and therefore continues to vest in the stock options under the originally contemplated service period.
Stock options exercisable totaled 360,218 shares at December 31, 2019are classified as liabilities and 275,392 shares at December 31, 2018. Stock options available for grant totaled 954,454 shares at December 31, 2019.
| |
13 | RETIREMENT PLANS AND OTHER POSTRETIREMENT BENEFITS |
Tredegar sponsors a noncontributory defined benefit (pension) plan covering certain current and former U.S. employees. The plans for salaried and hourly employees currently in effect is based on a formula using the participant’s years of service and compensation or using the participant’s years of service and a dollar amount. The plan is closed to new participants and pay for active plan participants for benefit calculations was frozen as of December 31, 2007. As of January 31, 2018, the plan no longer accrued benefits associated with crediting employees for service, thereby freezing all future benefits under the plan.
In addition to providing pension benefits, the Company provides postretirement life insurance and health care benefits for certain groups of employees. Tredegar and retirees share in the cost of postretirement health care benefits, with employees hired on or before January 1, 1993, receiving a fixed subsidy to cover a portion of their health care premiums. The Company eliminated prescription drug coverage for Medicare-eligible retirees as of January 1, 2006. Consequently, Tredegar is not eligible for any federal subsidies.
The following tables reconcile the changes in benefit obligations and plan assets in 2019 and 2018, and reconcile the funded status to prepaid or accrued cost at December 31, 2019 and 2018:
|
| | | | | | | | | | | | | | | | | |
| | Pension Benefits | | | Other Post- Retirement Benefits |
| (In thousands) | 2019 | | 2018 | | | 2019 | | 2018 |
| Change in benefit obligation: | | | | | | | | |
| Benefit obligation, beginning of year | $ | 287,240 |
| | $ | 318,123 |
| | | $ | 6,889 |
| | $ | 7,704 |
|
| Service cost | — |
| | 17 |
| | | 26 |
| | 36 |
|
| Interest cost | 12,222 |
| | 11,442 |
| | | 290 |
| | 271 |
|
| Effect of actuarial (gains) losses related to the following: | | | | | | | | |
| Discount rate change | 38,919 |
| | (23,653 | ) | | | 894 |
| | (546 | ) |
| Retirement rate assumptions and mortality table adjustments | (2,589 | ) | | (914 | ) | | | 21 |
| | 6 |
|
| Other | (1,047 | ) | | (2,326 | ) | | | (176 | ) | | (285 | ) |
| Plan participant contributions | — |
| | — |
| | | 649 |
| | 656 |
|
| Benefits paid | (15,982 | ) | | (15,449 | ) | | | (943 | ) | | (953 | ) |
| Benefit obligation, end of year | $ | 318,763 |
| | $ | 287,240 |
| | | $ | 7,650 |
| | $ | 6,889 |
|
| Change in plan assets: | | | | | | | | |
| Plan assets at fair value, beginning of year | $ | 205,367 |
| | $ | 226,354 |
| | | $ | — |
| | $ | — |
|
| Actual return on plan assets | 20,624 |
| | (14,148 | ) | | | — |
| | — |
|
| Employer contributions | 8,320 |
| | 8,610 |
| | | 294 |
| | 297 |
|
| Plan participant contributions | — |
| | — |
| | | 649 |
| | 656 |
|
| Benefits paid | (15,982 | ) | | (15,449 | ) | | | (943 | ) | | (953 | ) |
| Plan assets at fair value, end of year | $ | 218,329 |
| | $ | 205,367 |
| | | $ | — |
| | $ | — |
|
| Funded status of the plans | $ | (100,434 | ) | | $ | (81,873 | ) | | | $ | (7,650 | ) | | $ | (6,889 | ) |
| Amounts recognized in the consolidated balance sheets: | | | | | | | | |
| Accrued expenses (current) | $ | 168 |
| | $ | 182 |
| | | $ | 470 |
| | $ | 456 |
|
| Pension and other postretirement benefit obligations, net | 100,266 |
| | 81,691 |
| | | 7,180 |
| | 6,433 |
|
| Net amount recognized | $ | 100,434 |
| | $ | 81,873 |
| | | $ | 7,650 |
| | $ | 6,889 |
|
Assumptions used for financial reporting purposes to compute net benefit income or cost and benefit obligations for continuing operations, and the components of net periodic benefit income or cost for continuing operations, are as follows:
|
| | | | | | | | | | | | | | | | | | | | | | | | | |
| | | Pension Benefits | | | Other Post- Retirement Benefits |
| (In thousands, except percentages) | 2019 | | 2018 | | 2017 | | | 2019 | | 2018 | | 2017 |
| Weighted-average assumptions used to determine benefit obligations: | | | | | | | | | | | | |
| Discount rate | 3.27 | % | | 4.40 | % | | 3.72 | % | | | 3.25 | % | | 4.37 | % | | 3.69 | % |
| Expected long-term return on plan assets | 5.00 | % | | 6.00 | % | | 6.50 | % | | | n/a |
| | n/a |
| | n/a |
|
| Weighted-average assumptions used to determine net periodic benefit cost: | | | | | | | | | | | | |
| Discount rate | 4.40 | % | | 3.72 | % | | 4.29 | % | | | 4.37 | % | | 3.69 | % | | 4.24 | % |
| Expected long-term return on plan assets | 6.00 | % | | 6.50 | % | | 6.50 | % | | | n/a |
| | n/a |
| | n/a |
|
| Components of net periodic benefit cost: | | | | | | | | | | | | |
| Service cost | $ | — |
| | $ | 17 |
| | $ | 194 |
| | | $ | 26 |
| | $ | 36 |
| | $ | 33 |
|
| Interest cost | 12,222 |
| | 11,442 |
| | 12,575 |
| | | 290 |
| | 271 |
| | 301 |
|
| Expected return on plan assets | (13,528 | ) | | (15,011 | ) | | (14,955 | ) | | | — |
| | — |
| | — |
|
| Amortization of prior service costs and gains or losses | 10,891 |
| | 13,894 |
| | 12,320 |
| | | (258 | ) | | (243 | ) | | (275 | ) |
| Net periodic benefit cost | $ | 9,585 |
| | $ | 10,342 |
| | $ | 10,134 |
| | | $ | 58 |
| | $ | 64 |
| | $ | 59 |
|
Net benefit income or cost is determined using assumptions at the beginning of each year. Funded status is determined using assumptions at the end of each year. The amount of the accumulated benefit obligation is the same as the projected benefit obligation. At December 31, 2019, the effect of a 1% change in the health care cost trend rate assumptions would not impact the post-retirement obligation.
Expected benefit payments for continuing operations over the next five years and in the aggregate for 2025-2029 are as follows:
|
| | | | | | | |
| (In thousands) | Pension Benefits | | Other Post- Retirement Benefits |
| 2020 | $ | 17,162 |
| | $ | 470 |
|
| 2021 | 17,524 |
| | 473 |
|
| 2022 | 17,895 |
| | 473 |
|
| 2023 | 18,088 |
| | 468 |
|
| 2024 | 18,325 |
| | 463 |
|
| 2025—2029 | 91,383 |
| | 2,202 |
|
Amounts recorded in 2019, 2018 and 2017 in accumulated other comprehensive income, before related deferred income taxes, consist of:
|
| | | | | | | | | | | | | | | | | | | | | | | |
| | Pension | | Other Post-Retirement |
| (In thousands) | 2019 | | 2018 | | 2017 | | 2019 | | 2018 | | 2017 |
| Prior service cost (benefit) | $ | — |
| | $ | — |
| | $ | 5 |
| | $ | — |
| | $ | — |
| | $ | — |
|
| Net actuarial (gain) loss | 150,047 |
| | 132,751 |
| | 144,377 |
| | (824 | ) | | (1,821 | ) | | (1,238 | ) |
Pension expense is expected to be $14.2 million in 2020. The amounts in accumulated other comprehensive income, before related deferred income taxes, that are expected to be recognized as components of net periodic benefit or cost during 2020 are as follows:
|
| | | | | | | |
| (In thousands) | Pension | | Other Post- Retirement |
| Prior service cost (benefit) | $ | — |
| | $ | — |
|
| Net actuarial (gain) loss | 15,254 |
| | (188 | ) |
The percentage composition of assets held by pension plans for continuing operations at December 31, 2019, 2018 and 2017 are as follows:
|
| | | | | | | | |
| | % Composition of Plan Assets at December 31, |
| | 2019 | | 2018 | | 2017 |
| Pension plans related to continuing operations: | | | | | |
| Fixed income securities | 8.7 | % | | 8.6 | % | | 7.7 | % |
| Large/mid-capitalization equity securities | 21.3 |
| | 18.2 |
| | 19.0 |
|
| Small-capitalization equity securities | 7.8 |
| | 6.8 |
| | 6.4 |
|
| International and emerging market equity securities | 19.7 |
| | 16.0 |
| | 15.1 |
|
| Total equity securities | 48.8 |
| | 41.0 |
| | 40.5 |
|
| Private equity and hedge funds | 35.0 |
| | 42.3 |
| | 44.6 |
|
| Other assets | 7.5 |
| | 8.1 |
| | 7.2 |
|
| Total for continuing operations | 100.0 | % | | 100.0 | % | | 100.0 | % |
Tredegar’s targeted allocation percentage for pension plan assets and the expected long-term rate of return on assets used to determine its benefit obligation at December 31, 2019, are as follows:
|
| | | | | |
| | Target % Composition of Plan Assets * | | Expected Long-term Return % |
| Pension plans related to continuing operations: | | | |
| Fixed income securities | 12.0 | % | | 2.0 | % |
| Large/mid-capitalization equity securities | 27.0 |
| | 5.8 |
|
| Small-capitalization equity securities | 8.0 |
| | 6.9 |
|
| International and emerging market equity securities | 20.0 |
| | 5.8 |
|
| Total equity securities | 55.0 |
| | 6.0 |
|
| Private equity and hedge funds | 33.0 |
| | 4.5 |
|
| Total for continuing operations | 100.0 | % | | 5.0 | % |
* Target percentages for the composition of plan assets represents a neutral position within the approved range of allocations for such assets.
|
Expected long-term returns are estimated by asset class and generally are based on inflation-adjusted historical returns, volatilities, risk premiums and managed asset premiums. The portfolio of fixed income securities is structured with maturities that generally match estimated benefit payments over the next 1-2 years. The other assets category is primarily comprised of cash and contracts with insurance companies. The Company’s primary investment objective is to maximize total return with a strong emphasis on the preservation of capital, and it believes that over the long-term a diversified portfolio of fixed income securities, equity securities, hedge funds and private equity funds has a better risk-return profile than fixed income securities alone. The average remaining duration of benefit payments for the pension plans is about 11.6 years. The Company expects its required contributions to be approximately $12.3 million in 2020.
Estimates of the fair value of assets held by the Company’s pension plan are provided by unaffiliated third parties. Investments in private equity and hedge funds and certain fixed income securities by the Company’s pension plan are measured at NAV, which is a practical expedient for measuring fair value. These assets are therefore excluded from the fair value hierarchy for each of the years presented. At December 31, 2019 and 2018, the pension plan assets are categorized by level within the fair value measurement hierarchy as follows:
|
| | | | | | | | | | | | | | | | |
| (In thousands) | Total | | Quoted Prices in Active Markets for Identical Assets (Level 1) | | Significant Other Observable Inputs (Level 2) | | Significant Unobservable Inputs (Level 3) |
| Balances at December 31, 2019 | | | | | | | |
| Large/mid-capitalization equity securities | $ | 46,440 |
| | $ | 46,440 |
| | $ | — |
| | $ | — |
|
| Small-capitalization equity securities | 17,135 |
| | 17,135 |
| | — |
| | — |
|
| International and emerging market equity securities | 43,079 |
| | 19,117 |
| | 23,962 |
| | — |
|
| Fixed income securities | 18,911 |
| | 6,209 |
| | 12,702 |
| | — |
|
| Contracts with insurance companies | 8,840 |
| | — |
| | — |
| | 8,840 |
|
| Other assets | 7,585 |
| | 7,585 |
| | — |
| | — |
|
| Total plan assets at fair value | $ | 141,990 |
| | $ | 96,486 |
| | $ | 36,664 |
| | $ | 8,840 |
|
| Private equity and hedge funds | 76,339 |
| | | | | | |
| Total plan assets, December 31, 2019 | $ | 218,329 |
| | | | | | |
| Balances at December 31, 2018 | | | | | | | |
| Large/mid-capitalization equity securities | $ | 37,323 |
| | $ | 37,323 |
| | $ | — |
| | $ | — |
|
| Small-capitalization equity securities | 13,880 |
| | 13,880 |
| | — |
| | — |
|
| International and emerging market equity securities | 32,931 |
| | 13,389 |
| | 19,542 |
| | — |
|
| Fixed income securities | 17,769 |
| | 5,886 |
| | 11,883 |
| | — |
|
| Contracts with insurance companies | 9,899 |
| | — |
| | — |
| | 9,899 |
|
| Other assets | 6,779 |
| | 6,779 |
| | — |
| | — |
|
| Total plan assets at fair value | $ | 118,581 |
| | $ | 77,257 |
| | $ | 31,425 |
| | $ | 9,899 |
|
| Private equity and hedge funds | 86,786 |
| | | | | | |
| Total plan assets, December 31, 2018 | $ | 205,367 |
| | | | | | |
Tredegar also has a non-qualified supplemental pension plan covering certain employees. Effective December 31, 2005, further participation in this plan was terminated and benefit accruals for existing participants were frozen. The plan was designed to restore all or a part of the pension benefits that would have been payable to designated participants from the principal pension plans if it were not for limitations imposed by income tax regulations. The projected benefit obligation relating to this unfunded plan was $2.2 million at December 31, 2019 and $2.0 million at December 31, 2018. Pension expense recognized for this plan was $0.1 million in 2019, $0.1 million in 2018 and $0.1 million in 2017. This information has been included in the preceding pension benefit tables.
Approximately 70 employees at PE Films’ manufacturing facility in Kerkrade, The Netherlands are covered by a collective bargaining agreement that includes participation in a multi-employer pension plan. Pension expense recognized for participation in this plan, which is equal to required contributions, was $0.3 million in 2019, $0.4 million in 2018 and $0.4 million in 2017. This information has been excluded from the preceding pension benefit tables.
Tredegar has a savings plan that allows eligible employees to voluntarily contribute a percentage of their compensation, up to Internal Revenue Service (“IRS”) limitations. The provisions of the savings plan provided the following benefits for salaried and certain hourly employees:
The Company makes matching contributions to the savings plan of $1 for every $1 an employee contributes per pay period up to a maximum of 5% of eligible compensation.
The savings plan includes immediate vesting of matching contributions and automatic enrollment at 3% of eligible compensation unless the employee opts out or elects a different percentage.
The Company also has a non-qualified plan that restores matching benefits for employees suspended from the savings plan due to certain limitations imposed by income tax regulations (“restoration plan”). Charges recognized for these plans were $3.9 million in 2019, $3.7 million in 2018 and $3.5 million in 2017. The Company’s liability under the restoration plan was $1.4 million at December 31, 2019 (consisting of 62,475 phantom shares of common stock) and $1.0 million at December 31, 2018 (consisting of 65,280 phantom shares of common stock) and valued at the closing market price on those dates.
The Tredegar Corporation Benefits Plan Trust (the “Trust”) purchased 7,200 shares of the Company’s common stock in 1998 for $0.2 million and 46,671 shares of its common stock in 1997 for $1.0 million, as a partial hedge against the phantom shares held in the restoration plan. There have been no shares purchased since 1998 except for re-invested dividends. The cost of the shares held by the Trust is shown as a reduction to shareholders’ equity in the consolidated balance sheets.
Tredegar has various lease agreements with terms up to 12 years, including leases of real estate, office equipment and vehicles. Some leases include options to purchase the leased asset, terminate the agreement or extend the term of the agreement for one or more years. These options are included in the lease term when it is reasonably certain that the option will be exercised.
At inception, the Company determines if an arrangement contains a lease and whether that lease meets the classification criteria of a finance or operating lease. The Company has elected to not record short-term leases with an original lease term of one year or lessaccrued expenses in the consolidated balance sheet. To the extent such leases contain renewal options that the Company intends to exercise, the related ROU asset and lease liability are included in the consolidated balance sheet. Some of the Company’s lease arrangements contain lease components (e.g. minimum rent payments) and non-lease components (e.g. maintenance, labor charges, etc.). The Company generally accounts for the lease and non-lease components as a single lease component.
Certain of the Company’s lease agreements include rental payments that are adjusted periodically for an index or rate. The leases are initially measured using the projected payments adjusted for the index or rate in effect at the commencement date. The Company’s lease agreements do not contain any material residual value guarantees or material restrictive covenants.
Operating Leases
Operating leases are included in “Right-of-use lease assets”, “Lease liabilities - short-term” and “Lease liabilities - long-term” on the consolidated balance sheets. These assets and liabilities are recognized at the commencement date based on the presentfair value of remaining lease payments overthese liability awards is remeasured at each reporting period until the lease term using the Company’s secured incremental borrowing rates, adjusted for termdate of settlement. Increases and geographic location using country-based swap rates. After reviewing new lease contractsdecreases in 2019 and the lease contracts in the implementation effort, the Company found no instance where it could readily determine the rate implicit in the lease.
Lease expense for operating leases is recognized on a straight-line basis over the lease term. Variable leasestock-based compensation expense is recognized inover the vesting period, in which the obligationor immediately, for those payments is incurred. Depending upon the specific usevested awards.
A summary of the ROU asset, lease expense is included in the “Cost of goods sold”, “Freight”, “Selling, general and administrative”, and “Research and development” line items on the consolidated statements of income. Lease income is not material to the results of operations for the year endedSARs outstanding at December 31, 2019.2022, 2021 and 2020, and changes during those years, is presented below:
| | | | | | | | | | | | | | | | | | | | | | | | | | | | | |
| | | | Exercise Price/Share |
| | Number of
SARs | | Range | | Weighted
Average |
| Outstanding at January 1, 2020 | — | | | $ | — | | | to | | $ | — | | | $ | — | |
Granted(a) | 387,252 | | | 10.75 | | | to | | 19.64 | | | 11.60 | |
| Modification for special cash dividend | 71,402 | | | 10.75 | | | to | | 19.64 | | | 11.60 | |
| Forfeited and expired | (82,214) | | | 10.75 | | | to | | 19.64 | | | 11.39 | |
| Outstanding at December 31, 2020 | 376,440 | | | 10.75 | | | to | | 19.64 | | | 11.64 | |
| Granted | 164,464 | | | 16.37 | | | to | | 16.37 | | | 16.37 | |
| Forfeited and expired | (10,043) | | | 10.75 | | | to | | 16.37 | | | 13.01 | |
| Exercised | (9,260) | | | 10.75 | | | to | | 15.25 | | | 13.87 | |
| Outstanding at December 31, 2021 | 521,601 | | | 10.75 | | | to | | 16.37 | | | 13.55 | |
| | | | | | | | | |
| Forfeited and expired | (22,914) | | | 10.75 | | | to | | 16.37 | | | 14.83 | |
| | | | | | | | | |
| Outstanding at December 31, 2022 | 498,687 | | | $ | 10.75 | | | to | | $ | 16.37 | | | $ | 13.49 | |
(a) The SARs exercise price per share reflects the reduction to the exercise prices of outstanding SARs as a results of the modification to the awards pursuant to the nondiscretionary anti-dilution provisions in the related SARs grant agreements. |
The following table presents information about the amount, timinggrant-date fair value of SARs awards vested in 2022, 2021 and uncertainty of cash flows arising from the Company’s operating leases as2020 was $0.5 million, $0.1 million and $0.6 million, respectively. As of December 31, 2019:2022, the unrecognized compensation cost for continuing operations was immaterial. This cost is expected to be recognized over the remaining weighted average period of 0.2 years.
|
| | | | |
| (In thousands) | | As of December 31, 2019 |
| Maturity of Lease Liabilities | Future Lease Payments |
| 2020 | | $ | 3,820 |
|
| 2021 | | 3,589 |
|
| 2022 | | 2,622 |
|
| 2023 | | 2,425 |
|
| 2024 | | 2,405 |
|
| Thereafter | | 9,786 |
|
| Total undiscounted operating lease payments | | 24,647 |
|
| Less: Imputed interest | | 3,956 |
|
| Present value of operating lease liabilities | | $ | 20,691 |
|
| | | |
| Balance Sheet Classification | | |
| Lease liabilities, short-term | | $ | 3,002 |
|
| Lease liabilities, long-term | | 17,689 |
|
| Total operating lease liabilities | | $ | 20,691 |
|
| | | |
| Other Information: | | |
| Weighted-average remaining lease term for operating leases | | 8 Years |
|
| Weighted-average discount rate for operating leases | | 4.32 | % |
Rental expense was $5.2 million in 2018 and $4.4 million in 2017. Rental commitments under all noncancellable leases as of December 31, 2018, were as follows:
|
| | | | |
| (In thousands) | |
| 2019 | $ | 4,445 |
|
| 2020 | 4,007 |
|
| 2021 | 3,591 |
|
| 2022 | 2,391 |
|
| 2023 | 1,245 |
|
| Remainder | 2,630 |
|
| Total minimum lease payments | $ | 18,309 |
|
Cash Flows
An initial right-of-use asset of $21 million was recognized as a non-cash asset addition and an initial lease liability of $22 million was recognized as a non-cash liability addition with the adoption of the new lease accounting standard.
Operating Lease Costs
Operating lease costs were $5.6 million in 2019. These costs are primarily related to long-term operating leases, but also include amounts for variable leases and short-term leases.
Income (loss) from continuing operations before income taxes and income tax expense (benefit) for continuing operations are as follows:
| | | | | | | | | | | | | | | | | |
| (In thousands) | 2022 | | 2021 | | 2020 |
| Income (loss) from continuing operations before income taxes: | | | | | |
| Domestic | $ | 3,185 | | | $ | 22,885 | | | $ | (58,033) | |
| Foreign | 29,585 | | | 44,336 | | | 32,987 | |
| Total | $ | 32,770 | | | $ | 67,221 | | | $ | (25,046) | |
| Current income tax expense (benefit): | | | | | |
| Federal | $ | 2 | | | $ | 1,232 | | | $ | 4,777 | |
| State | 772 | | | 764 | | | 136 | |
| Foreign | 3,071 | | | 13,521 | | | 2,374 | |
| Total | 3,845 | | | 15,517 | | | 7,287 | |
| Deferred income tax expense (benefit): | | | | | |
| Federal | 24 | | | (7,862) | | | (18,191) | |
| State | (537) | | | 125 | | | (640) | |
| Foreign | 1,057 | | | 1,504 | | | 3,331 | |
| Total | 544 | | | (6,233) | | | (15,500) | |
| Total income tax expense (benefit) | $ | 4,389 | | | $ | 9,284 | | | $ | (8,213) | |
|
| | | | | | | | | | | | |
| (In thousands) | | 2019 | | 2018 | | 2017 |
| Income (loss) before income taxes: | | | | | |
| Domestic | $ | 35,731 |
| | $ | 17,663 |
| | $ | 67,549 |
|
| Foreign | 22,441 |
| | 18,705 |
| | (82,461 | ) |
| Total | $ | 58,172 |
| | $ | 36,368 |
| | $ | (14,912 | ) |
| Current income tax expense (benefit): | | | | | |
| Federal | $ | 1,202 |
| | $ | (187 | ) | | $ | (20,560 | ) |
| State | 989 |
| | 815 |
| | 800 |
|
| Foreign | 1,801 |
| | 2,090 |
| | 3,247 |
|
| Total | 3,992 |
| | 2,718 |
| | (16,513 | ) |
| Deferred income tax expense (benefit): | | | | | |
| Federal | 17,357 |
| | 8,708 |
| | (23,302 | ) |
| State | 311 |
| | 364 |
| | (949 | ) |
| Foreign | (11,747 | ) | | (264 | ) | | (12,399 | ) |
| Total | 5,921 |
| | 8,808 |
| | (36,650 | ) |
| Total income tax expense (benefit) | $ | 9,913 |
| | $ | 11,526 |
| | $ | (53,163 | ) |
The significant differences between the U.S. federal statutory rate and the effective income tax rate forrelated to continuing operations are as follows:
| | | | | | | | | | | | | | | | | | | | | | | | | | |
| 2022 | | 2021 | | 2020 |
| (In thousands, except percentages) | Amount | % | | Amount | % | | Amount | % |
| Income tax expense (benefit) at federal statutory rate | $ | 6,882 | | 21.0 | | | $ | 14,116 | | 21.0 | | | $ | (5,260) | | 21.0 | |
| Foreign rate differences | 2,924 | | 8.9 | | | 8,269 | | 12.3 | | | 4,554 | | (18.2) | |
| U.S. tax on foreign branch income | 1,390 | | 4.1 | | | (5,667) | | (8.4) | | | 1,409 | | (5.6) | |
| Non-deductible other | 381 | | 1.2 | | | 1,053 | | 1.6 | | | 208 | | (0.8) | |
| Tax contingency accruals and tax settlements | 88 | | 0.3 | | | 202 | | 0.3 | | | (58) | | 0.2 | |
| State taxes, net of federal income tax benefit | 48 | | 0.1 | | | 933 | | 1.4 | | | (373) | | 1.5 | |
| Valuation allowance for capital loss carryforwards | — | | — | | | (5,415) | | (8.1) | | | 52 | | (0.2) | |
| Foreign currency translation variation on intercompany loans | — | | — | | | 1,374 | | 2.0 | | | — | | — | |
| Dividend received deduction net of foreign withholding tax | — | | — | | | (109) | | (0.2) | | | (52) | | 0.2 | |
| Changes in estimates related to prior year tax provision | (175) | | (0.5) | | | (383) | | (0.6) | | | (2,472) | | 9.9 | |
| Foreign derived intangible income deduction | (763) | | (2.3) | | | — | | — | | | — | | — | |
| Tax on Prodepe tax incentive | (1,024) | | (3.1) | | | 2,858 | | 4.3 | | | (801) | | 3.2 | |
| Research and development tax credit | (1,489) | | (4.5) | | | (928) | | (1.4) | | | (633) | | 2.5 | |
| Brazilian tax incentive | (3,873) | | (11.8) | | | (7,019) | | (10.4) | | | (4,787) | | 19.1 | |
| Income tax expense (benefit) at effective income tax rate | $ | 4,389 | | 13.4 | | | $ | 9,284 | | 13.8 | | | $ | (8,213) | | 32.8 | |
|
| | | | | | | | | | | | | | | | | |
| | 2019 | | 2018 | | 2017 |
| (In thousands, except percentages) | Amount |
| % |
| | Amount |
| % |
| | Amount |
| % |
|
| Income tax expense (benefit) at federal statutory rate | $ | 12,223 |
| 21.0 |
| | $ | 7,638 |
| 21.0 |
| | $ | (5,219 | ) | 35.0 |
|
| U.S. tax on foreign branch income | 15,865 |
| 27.2 |
| | 1,901 |
| 5.2 |
| | — |
| — |
|
| Foreign rate differences | 2,211 |
| 3.8 |
| | 1,805 |
| 5.0 |
| | 2,546 |
| (17.1 | ) |
| State taxes, net of federal income tax benefit | 987 |
| 1.7 |
| | 520 |
| 1.4 |
| | 656 |
| (4.4 | ) |
| Non-deductible expenses | 467 |
| 0.8 |
| | 322 |
| 0.9 |
| | 434 |
| (2.9 | ) |
| Stock-based compensation | 283 |
| 0.5 |
| | 175 |
| 0.5 |
| | 199 |
| (1.3 | ) |
| Global intangible low tax income | 68 |
| 0.1 |
| | — |
| — |
| | — |
| — |
|
| Valuation allowance for capital loss carryforwards | 60 |
| 0.1 |
| | 553 |
| 1.5 |
| | 83 |
| (0.6 | ) |
| Unremitted earnings from foreign operations | 60 |
| 0.1 |
| | 126 |
| 0.3 |
| | — |
| — |
|
| Non-deductible goodwill and asset impairment loss | — |
| — |
| | 1,801 |
| 5.1 |
| | 228 |
| (1.5 | ) |
| Increase in value of kaléo investment held abroad | — |
| — |
| | — |
| — |
| | (2,326 | ) | 15.6 |
|
| Settlement of Terphane acquisition escrow | — |
| — |
| | — |
| — |
| | (4,200 | ) | 28.2 |
|
| Impact of U.S. Tax Cuts and Jobs Act | — |
| — |
| | — |
| — |
| | (4,433 | ) | 29.7 |
|
| Worthless stock deductions | — |
| — |
| | — |
| — |
| | (61,413 | ) | 411.9 |
|
| Foreign derived intangible income deduction | (273 | ) | (0.5 | ) | | (1,050 | ) | (2.9 | ) | | — |
| — |
|
| Changes in estimates related to prior year tax provision | (721 | ) | (1.2 | ) | | (303 | ) | (0.8 | ) | | 320 |
| (2.1 | ) |
| Research and development tax credit | (830 | ) | (1.4 | ) | | (420 | ) | (1.2 | ) | | (375 | ) | 2.5 |
|
| Dividend received deduction net of foreign withholding tax | (1,016 | ) | (1.7 | ) | | — |
| — |
| | — |
| — |
|
| Brazilian tax incentive | (1,999 | ) | (3.4 | ) | | (1,340 | ) | (3.7 | ) | | — |
| — |
|
| Tax contingency accruals and tax settlements | (2,543 | ) | (4.4 | ) | | 773 |
| 2.1 |
| | (420 | ) | 2.8 |
|
| Valuation allowance due to foreign losses and impairments | (14,929 | ) | (25.6 | ) | | (975 | ) | (2.7 | ) | | 20,757 |
| (139.3 | ) |
| Income tax expense (benefit) at effective income tax rate | $ | 9,913 |
| 17.1 |
| | $ | 11,526 |
| 31.7 |
| | $ | (53,163 | ) | 356.5 |
|
During 2019,Income taxes in 2021 are primarily due to the Company recorded a deferredstrong earnings of Terphane Ltda, which are included in Tredegar’s U.S. consolidated tax expensereturn and, the tax impact of $1.0 million as athe local statutory tax rates of Tredegar’s foreign subsidiaries being higher than the current U.S. tax rate of 21%, the benefit of tax incentives in Brazil and the release of the valuation allowance to offset deferredfor capital loss carryforwards.
Income taxes in 2020 were primarily impacted by the tax assets for loss carryovers at our Hungarian subsidiary that the Company does not believe are more likely than not to be realized before the carryover periods expire. Due to recent favorable earnings trends, the Company reversed a $12.4 million valuation allowance on the net deferred tax assetsimpact of its Brazilian subsidiary Terphane Ltda. Because Terphane Ltda. is taxedbeing included in Tredegar’s U.S. consolidated tax return as a foreign branch, for US tax purposes, Tredegar also recorded a related deferred tax liability of $12.4 million for the reduction in foreign tax credits that would result from Terphane Ltda. realizing this net deferred tax asset.
Income taxes in 2018 were primarily impacted by not recording a tax benefit on a portion of the PE Films Personal Care goodwill impairment charge, the additional tax impact of Tredegar’s Brazilian subsidiaries being included in its US consolidated tax return as foreign branches as well as the tax impact of the local statutory tax rates of Tredegar’s foreign subsidiaries being higher than the current US tax rate of 21%. These increases to income tax expense were offset by recording a tax benefit on a portion of foreign losses and impairments, by the tax benefit of the foreign derived intangible income deduction under the TCJA, and by, the benefit of tax incentives in Brazil.
During 2017, the Company completed a plan to liquidateBrazil, and by claims for prior years’ U.S. research and development tax purposes one of its domestic subsidiaries, which allowed it to claim an income tax benefit on the write-off of the stock basis of Terphane, Inc. (Terphane’s U.S. affiliate) on its 2017 U.S. federal income tax return. The Company recorded an income tax benefit during the second quarter of 2017 of $8.1 million related to this worthless stock deduction, net of valuation allowances and accrual for uncertain tax positions. Also, during the fourth quarter of 2017, as a result of valuation activities and other efforts, the Company claimed an ordinary loss for U.S. federal and state income tax purposes of $153 million for the write-off of the stock basis of Terphane Limitada (Terphane’s Brazilian entity). The full tax benefit accrued for the Terphane Limitada worthless stock deduction at the 35% U.S. corporate income tax rate applicable for 2017 was approximately $54 million. This benefit was reduced by $4.8 million in conjunction with the TCJA for the portion of the deduction that is expected to be applied to income generated after 2017 where the new U.S. federal corporate income tax rate of 21% is applicable. The significant foreign rate difference for 2017 is primarily due to the difference between Hungary’s income tax rate of 9% and the U.S. federal corporate income tax rate of 35%.
credits.
Tredegar accrues U.S. federal income taxes on unremitted earnings of all foreign subsidiaries where required. However, due to changes in the taxation of dividends under TCJA, Tredegar will only record U.S. federal income taxes on unremitted earnings of its foreign subsidiaries where Tredegar cannot take steps to eliminate any potential tax on future distributions from its foreign subsidiaries. Prior to the second quarter of 2016, deferred U.S. federal income taxes had not been recorded for the undistributed earnings for Terphane Limitada because the Company had intended to permanently reinvest these earnings. Due to concerns about the political and economic conditions in Brazil, Terphane Limitada began making cash distributions to the Company in 2016. During the second quarter of 2016, Terphane Limitada paid a dividend of $10.7 million to the Company. During the second quarter of 2017, the Company recognized a net tax benefit of $0.4 million associated with additional U.S. tax related to this repatriation of cash from Brazil offset by the reversal of related tax contingencies. Because of the accumulation of significant losses related to foreign currency translations at Terphane Limitada,Ltda., there were no deferred income tax liabilities associated with the U.S. federal income taxes and foreign withholding taxes on Terphane Limitada’sLtda.’s undistributed earnings as of and December 31, 20192022 and 2018.2021. Beginning January 1, 2022, the TCJA eliminated the option to deduct research and development expenditures in the current year and requires taxpayers to capitalize such expenses as a result of amendments to Internal Revenue Code (“IRC”) Section 174. As a result of this provision of the TCJA, deferred tax assets related to capitalized research expenses pursuant to the amended IRC Section 174 increased by a net $4.8 million.
The Brazilian federal statutory income tax rate is a composite of 34.0% (25.0% of income tax and 9.0% of social contribution on income). Terphane’s manufacturing facility in Brazil is the beneficiary of certain income tax incentives that allow for a reduction in the statutory Brazilian federal income tax rate levied on the operating profit of its products. These incentives produce a current tax rate of 15.25% for Terphane (6.25% of income tax and 9.0% social contribution on income). The incentives were originally granted for a 10-year period commencing January 1, 2015 and expiring at the end of 2024.
Terphane Brazil has been granted an additional three years of tax incentives through the end of 2027. The benefit from the tax incentives was $2.0$3.9 million, $7.0 million and $1.3$4.8 million in 20192022, 2021 and 2018, respectively, and was immaterial for 2017.
2020, respectively.
Deferred income tax liabilities and deferred income tax assets at December 31, 20192022 and 2018,2021, are as follows:
| | | (In thousands) | 2019 | | 2018 | (In thousands) | 2022 | | 2021 |
| Deferred income tax liabilities: | | | | Deferred income tax liabilities: | |
| Amortization of goodwill and identifiable intangibles | $ | 12,023 |
| | $ | 13,416 |
| Amortization of goodwill and identifiable intangibles | $ | 10,533 | | | $ | 10,215 | |
| Depreciation | 7,065 |
| | — |
| Depreciation | 14,950 | | | 12,902 | |
| Foregone tax credits on foreign branch income | 12,361 |
| | — |
| Foregone tax credits on foreign branch income | 719 | | | 4,796 | |
| Foreign currency translation gain adjustment | — |
| | 300 |
| |
| Excess of carrying value over tax basis of investment in kaléo | 17,504 |
| | 15,131 |
| |
| | Right-of-use leased assets | 751 |
| | — |
| Right-of-use leased assets | 3,147 | | | 2,767 | |
| Other | 549 |
| | 184 |
| Other | 722 | | | 520 | |
| Total deferred income tax liabilities | 50,253 |
| | 29,031 |
| Total deferred income tax liabilities | 30,071 | | | 31,200 | |
| Deferred income tax assets: | | | | Deferred income tax assets: | |
| Depreciation | — |
| | 2,399 |
| |
| Pensions | 21,025 |
| | 17,153 |
| Pensions | 7,535 | | | 5,632 | |
| Employee benefits | 7,964 |
| | 6,676 |
| Employee benefits | 7,558 | | | 7,791 | |
| Excess capital losses | 1,551 |
| | 1,519 |
| Excess capital losses | 1,099 | | | 1,097 | |
| Inventory | 3,734 |
| | 3,644 |
| Inventory | 3,952 | | | 3,775 | |
| Asset write-offs, divestitures and environmental accruals | 1,355 |
| | 1,200 |
| Asset write-offs, divestitures and environmental accruals | 1,075 | | | 1,173 | |
| Tax benefit on U.S. federal, state and foreign NOL and credit carryforwards | 19,658 |
| | 23,507 |
| Tax benefit on U.S. federal, state and foreign NOL and credit carryforwards | 24,914 | | | 33,922 | |
| Timing adjustment for unrecognized tax benefits on uncertain tax positions, including portion relating to interest and penalties | 187 |
| | 267 |
| |
| Allowance for doubtful accounts | 383 |
| | 382 |
| |
| Section 174 Capitalized R&D expenditures | | Section 174 Capitalized R&D expenditures | 4,874 | | | — | |
| Other | | Other | 1,220 | | | 146 | |
| Lease liabilities | 967 |
| | — |
| Lease liabilities | 3,328 | | | 2,977 | |
| Derivative financial instruments | 345 |
| | 432 |
| |
| Tax basis remaining for installment sale - kaléo | | Tax basis remaining for installment sale - kaléo | 999 | | | 1,092 | |
| Foreign currency translation gain adjustment | 285 |
| | — |
| Foreign currency translation gain adjustment | 1,224 | | | 1,970 | |
| Deferred income tax assets before valuation allowance | 57,454 |
| | 57,179 |
| Deferred income tax assets before valuation allowance | 57,778 | | | 59,575 | |
| Less: Valuation allowance | 5,091 |
| | 24,736 |
| Less: Valuation allowance | 13,807 | | | 12,652 | |
| Total deferred income tax assets | 52,363 |
| | 32,443 |
| Total deferred income tax assets | 43,971 | | | 46,923 | |
| Net deferred income tax (assets) liabilities | $ | (2,110 | ) | | $ | (3,412 | ) | Net deferred income tax (assets) liabilities | $ | (13,900) | | | $ | (15,723) | |
| Amounts recognized in the consolidated balance sheets: | | | | Amounts recognized in the consolidated balance sheets: | |
| Deferred income tax assets (noncurrent) | $ | 13,129 |
| | $ | 3,412 |
| Deferred income tax assets (noncurrent) | $ | 13,900 | | | $ | 15,723 | |
| Deferred income tax liabilities (noncurrent) | 11,019 |
| | — |
| Deferred income tax liabilities (noncurrent) | — | | | — | |
| Net deferred income tax assets (liabilities) | $ | 2,110 |
| | $ | 3,412 |
| Net deferred income tax assets (liabilities) | $ | 13,900 | | | $ | 15,723 | |
Except as noted below, the Company believes that it is more likely than not that future taxable income will exceed future tax-deductible amounts thereby resulting in the realization of deferred income tax assets. The Company has estimated gross federal, state and foreign tax credits and net operating loss carryforwards of $19.7$24.9 million and $23.5$33.9 million at December 31, 20192022 and 2018,2021, respectively. The U.S. federal foreign tax credits will expire in 2026. Thebetween 2027-2031 and the U.S. federal net operating loss carryforwards were fully utilized in 2018. The majority of the foreign net operating loss carryforwards do not expire.research and development tax credits will expire by 2043. The U.S. state carryforwards expire at different points over the next 9 to 20 years.
Valuation allowances of $3.8$10.3 million, $7.7$9.4 million and $8.5$5.5 million at December 31, 2019, 20182022, 2021 and 2017,2020, respectively, are recorded against the tax benefit on U.S. federal, state and foreign tax credits and net operating loss carryforwards generated by certain foreign and domestic subsidiaries that may not be recoverable in the carryforward period. The valuation allowance for excess capital losses from investments and other related items was $1.3$0.7 million, $1.2$0.7 million and $4.4$7.1 million at December 31, 2019, 20182022, 2021 and 2017,2020, respectively. The 2018 balance decreased primarily due to the expiration of a portion of the capital loss carryforwards. The amount of the deferred income tax asset considered realizable, however, could be adjusted in the near term if estimates of the fair value of certain investments during the carryforward period change. Tredegar continues to evaluate opportunities to utilize capital loss carryforwards prior to their expiration at various dates in the future. As circumstances and events warrant, allowances will be reversed when it is more likely than not that future taxable income will
exceed deductible amounts, thereby resulting in the realization of deferred income tax assets. The valuation allowance for asset impairments in foreign jurisdictions where the Company believes it is more likely than not that the deferred income tax asset will not be realized was $0.0Valuation allowances of $2.8 million, $15.8$2.5 million and $15.6$4.9 million at December 31, 2019, 20182022, 2021 and 2017, respectively. Due to recent favorable earnings trends, the Company reversed a $12.4 million valuation allowance on the net2020, respectively, were recorded against certain deferred state tax assets of its Brazilian subsidiary Terphane Ltda. Because Terphane Ltda. is taxed as a foreign branch for US tax purposes, Tredegar also recorded a related deferred tax liability of $12.4 million for the reduction in foreign tax credits that would result from Terphane Ltda. realizing this net deferred tax asset.assets.
A reconciliation of the Company’s unrecognized uncertain tax positions since January 1, 2017,2020, is shown below: |
| | | | | | | | | | | | |
| | | Years Ended December 31, |
| (In thousands) | | 2019 | | 2018 | | 2017 |
| Balance at beginning of period | $ | 3,361 |
| | $ | 1,962 |
| | $ | 3,315 |
|
| Increase (decrease) due to tax positions taken in: | | | | | |
| Current period | 12 |
| | 13 |
| | 27 |
|
| Prior period | 49 |
| | 1,430 |
| | (532 | ) |
| Increase (decrease) due to settlements with taxing authorities | (151 | ) | | — |
| | (51 | ) |
| Reductions due to lapse of statute of limitations | (2,390 | ) | | (44 | ) | | (797 | ) |
| Balance at end of period | $ | 881 |
| | $ | 3,361 |
| | $ | 1,962 |
|
| | | | | | | | | | | | | | | | | |
| | Years Ended December 31, |
| (In thousands) | 2022 | | 2021 | | 2020 |
| Balance at beginning of period | $ | 648 | | | $ | 628 | | | $ | 881 | |
| Increase (decrease) due to tax positions taken in: | | | | | |
| Current period | 2 | | | — | | | 12 | |
| Prior period | 44 | | | 40 | | | — | |
| Reductions due to lapse of statute of limitations | (66) | | | (20) | | | (265) | |
| Balance at end of period | $ | 628 | | | $ | 648 | | | $ | 628 | |
Additional information related to unrecognized uncertain tax positions since January 1, 20172020 is summarized below:
| | | | | Years Ended December 31, | | Years Ended December 31, |
| (In thousands) | | 2019 | | 2018 | | 2017 | (In thousands) | 2022 | | 2021 | | 2020 |
Gross unrecognized tax benefits on uncertain tax positions (reflected in current income tax, other noncurrent liability accounts, or deferred tax assets in the balance sheet) | Gross unrecognized tax benefits on uncertain tax positions (reflected in current income tax, other noncurrent liability accounts, or deferred tax assets in the balance sheet) | $ | 881 |
| | $ | 3,361 |
| | $ | 1,962 |
| Gross unrecognized tax benefits on uncertain tax positions (reflected in current income tax, other noncurrent liability accounts, or deferred tax assets in the balance sheet) | $ | 628 | | | $ | 648 | | | $ | 628 | |
| Deferred income tax assets related to unrecognized tax benefits on uncertain tax positions (reflected in deferred income tax accounts in the balance sheet) | Deferred income tax assets related to unrecognized tax benefits on uncertain tax positions (reflected in deferred income tax accounts in the balance sheet) | (163 | ) | | (211 | ) | | (153 | ) | Deferred income tax assets related to unrecognized tax benefits on uncertain tax positions (reflected in deferred income tax accounts in the balance sheet) | 143 | | | 48 | | | (110) | |
| Net unrecognized tax benefits on uncertain tax positions, which would impact the effective tax rate if recognized | Net unrecognized tax benefits on uncertain tax positions, which would impact the effective tax rate if recognized | 718 |
| | 3,150 |
| | 1,809 |
| Net unrecognized tax benefits on uncertain tax positions, which would impact the effective tax rate if recognized | 771 | | | 696 | | | 518 | |
| Interest and penalties accrued on deductions taken relating to uncertain tax positions (approximately $(144), $107 and $(1) reflected in income tax expense in the income statement in 2019, 2018 and 2017, respectively, with the balance shown in current income tax and other noncurrent liability accounts in the balance sheet) | 100 |
| | 243 |
| | 136 |
| |
| Interest and penalties accrued on deductions taken relating to uncertain tax positions (approximately $16, $26 and $2 reflected in income tax expense in the income statement in 2022, 2021 and 2020, respectively, with the balance shown in current income tax and other noncurrent liability accounts in the balance sheet) | | Interest and penalties accrued on deductions taken relating to uncertain tax positions (approximately $16, $26 and $2 reflected in income tax expense in the income statement in 2022, 2021 and 2020, respectively, with the balance shown in current income tax and other noncurrent liability accounts in the balance sheet) | 149 | | | 133 | | | 102 | |
| Related deferred income tax assets recognized on interest and penalties | Related deferred income tax assets recognized on interest and penalties | (23 | ) | | (56 | ) | | (32 | ) | Related deferred income tax assets recognized on interest and penalties | (34) | | | (31) | | | (24) | |
| Interest and penalties accrued on uncertain tax positions net of related deferred income tax benefits, which would impact the effective tax rate if recognized | Interest and penalties accrued on uncertain tax positions net of related deferred income tax benefits, which would impact the effective tax rate if recognized | 77 |
| | 187 |
| | 104 |
| Interest and penalties accrued on uncertain tax positions net of related deferred income tax benefits, which would impact the effective tax rate if recognized | 115 | | | 102 | | | 78 | |
| Total net unrecognized tax benefits on uncertain tax positions reflected in the balance sheet, which would impact the effective tax rate if recognized | Total net unrecognized tax benefits on uncertain tax positions reflected in the balance sheet, which would impact the effective tax rate if recognized | $ | 795 |
| | $ | 3,337 |
| | $ | 1,913 |
| Total net unrecognized tax benefits on uncertain tax positions reflected in the balance sheet, which would impact the effective tax rate if recognized | $ | 886 | | | $ | 798 | | | $ | 596 | |
Tredegar, or one of its subsidiaries, files income tax returns in the U.S. federal jurisdiction, various states and jurisdictions outside the U.S. With few exceptions, Tredegar is no longer subject to U.S. federal, state or non-U.S. income tax examinations by tax authorities for years before 2016.2019. The Company anticipates that it is reasonably possible that Federal and state income tax audits or statutes may settle or close within the next 12 months which couldand are not expected to result in the recognition of up to approximately $0.7 million of the balance ofa material changes in unrecognized tax positions, including any payments that may be made.
13. BUSINESS SEGMENTS
The Company's business segments are Aluminum Extrusions, PE Films and Flexible Packaging Films. Aluminum Extrusions, also referred to as Bonnell Aluminum, produces high-quality, soft and medium strength alloyed aluminum extrusions, custom fabricated and finished, for the building and construction, automotive and transportation, consumer durables goods, machinery and equipment, electrical and renewable energy, and distribution markets. PE Films produces surface protection films, polyethylene overwrap films and films for other markets. Flexible Packaging Films produces polyester based films for use in packaging applications that have specialized properties, such as heat resistance, strength, barrier protection and the ability to accept high-quality print graphics.
The Company’s reportable segments are based on its method of internal reporting, which is generally segregated by differences in products. Accounting standards for presentation of segments require an approach based on the way the Company organizes the segments for making operating decisions and how the chief operating decision maker (“CODM”) assesses performance. EBITDA from ongoing operations is the key profitability measure used by the CODM (Tredegar’s President and Chief Executive Officer) for purposes of assessing financial performance. The Company uses sales less freight (“net sales”) from continuing operations as its measure of revenues from external customers at the segment level. This measure is separately included in the financial information regularly provided to the CODM. Earnings before interest and taxes ("EBIT") from ongoing operations is a non-GAAP financial measure included in the reconciliation of segment financial information to consolidated results for the Company below.
Information by business segment and geographic area for the last three years is provided in the segment tables below. There were no accounting transactions between segments and no allocations to segments.
| | | | | | | | | | | | | | | | | |
| Net Sales |
| (In thousands) | 2022 | | 2021 | | 2020 |
| Aluminum Extrusions | $ | 637,872 | | | $ | 539,325 | | | $ | 455,711 | |
| PE Films | 97,571 | | | 118,920 | | | 139,288 | |
| Flexible Packaging Films | 168,139 | | | 139,978 | | | 134,605 | |
| Total net sales | 903,582 | | | 798,223 | | | 729,604 | |
| Add back freight | 34,982 | | | 28,232 | | | 25,686 | |
| Sales as shown in consolidated statements of income | $ | 938,564 | | | $ | 826,455 | | | $ | 755,290 | |
Refer to Notes to Financial Tables that follow these tables.
| | | | | | | | | | | | | | | | | |
| EBITDA from Ongoing Operations |
| (In thousands) | 2022 | | 2021 | | 2020 |
| Aluminum Extrusions: | | | | | |
| Ongoing operations: | | | | | |
| EBITDA | $ | 66,800 | | | $ | 55,948 | | | $ | 55,137 | |
| Depreciation & amortization | (17,414) | | | (16,272) | | | (17,403) | |
| EBIT | 49,386 | | | 39,676 | | | 37,734 | |
| Plant shutdowns, asset impairments, restructurings and other (a) | (310) | | | 3,237 | | | (3,506) | |
| Goodwill impairment charge | — | | | — | | | (13,696) | |
| PE Films: | | | | | |
| Ongoing operations: | | | | | |
| EBITDA | 11,949 | | | 27,694 | | | 45,107 | |
| Depreciation & amortization | (6,280) | | | (6,263) | | | (6,762) | |
| EBIT | 5,669 | | | 21,431 | | | 38,345 | |
| Plant shutdowns, asset impairments, restructurings and other (a) | (646) | | | (371) | | | (1,974) | |
| Flexible Packaging Films: | | | | | |
| Ongoing operations: | | | | | |
| EBITDA | 27,452 | | | 31,684 | | | 30,645 | |
| Depreciation & amortization | (2,444) | | | (1,988) | | | (1,761) | |
| EBIT | 25,008 | | | 29,696 | | | 28,884 | |
| Plant shutdowns, asset impairments, restructurings and other (a) | (91) | | | 8,439 | | | (18) | |
| Total | 79,016 | | | 102,108 | | | 85,769 | |
| Interest income | 57 | | | 73 | | | 44 | |
| Interest expense | 4,990 | | | 3,386 | | | 2,587 | |
| Gain (loss) on investment in kaléo (a) | 1,406 | | | 12,780 | | | (60,900) | |
| Loss on sale of Bright View (a) | — | | | — | | | (2,299) | |
| Stock option-based compensation expense | 1,424 | | | 2,495 | | | 2,161 | |
| Corporate expenses, net (a) | 41,295 | | | 41,859 | | | 42,912 | |
| Income (loss) from continuing operations before income taxes | 32,770 | | | 67,221 | | | (25,046) | |
| Income tax expense (benefit) (a) | 4,389 | | | 9,284 | | | (8,213) | |
| Income (loss) from continuing operations | 28,381 | | | 57,937 | | | (16,833) | |
| Income (loss) from discontinued operations, net of tax (a) | 74 | | | (111) | | | (58,611) | |
| Net income (loss) | $ | 28,455 | | | $ | 57,826 | | | $ | (75,444) | |
Refer to Notes to Financial Tables that follow these tables.
| | | | | | | | | | | |
| Identifiable Assets |
| (In thousands) | 2022 | | 2021 |
| Aluminum Extrusions | $ | 293,308 | | | $ | 280,521 | |
| PE Films | 102,431 | | | 113,613 | |
| Flexible Packaging Films | 103,448 | | | 75,269 | |
| Subtotal | 499,187 | | | 469,403 | |
| General corporate | 23,674 | | | 23,482 | |
| Cash and cash equivalents (b) | 19,232 | | | 30,521 | |
| Discontinued operations | — | | | 178 | |
| Total | $ | 542,093 | | | $ | 523,584 | |
| | | | | | | | | | | | | | | | | | | | | | | | | | | | | | | | | | | |
| | Depreciation and Amortization | | Capital Expenditures |
| (In thousands) | 2022 | | 2021 | | 2020 | | 2022 | | 2021 | | 2020 |
| Aluminum Extrusions | $ | 17,414 | | | $ | 15,326 | | | $ | 17,403 | | | $ | 23,664 | | | $ | 18,914 | | | $ | 10,260 | |
| PE Films | 6,280 | | | 6,263 | | | 6,762 | | | 3,289 | | | 2,997 | | | 6,024 | |
| Flexible Packaging Films | 2,444 | | | 1,988 | | | 1,761 | | | 8,151 | | | 5,603 | | | 4,959 | |
| Subtotal | 26,138 | | | 23,577 | | | 25,926 | | | 35,104 | | | 27,514 | | | 21,243 | |
| General corporate (d) | 264 | | | 207 | | | 520 | | | 1,771 | | | (153) | | | 200 | |
| Discontinued operations | — | | | — | | | 5,511 | | | — | | | — | | | 1,912 | |
| Total | $ | 26,402 | | | $ | 23,784 | | | $ | 31,957 | | | $ | 36,875 | | | $ | 27,361 | | | $ | 23,355 | |
| | | | | | | | | | | | | | | | | |
| Net Sales by Geographic Area (c) |
| (In thousands) | 2022 | | 2021 | | 2020 |
| United States | $ | 717,049 | | | $ | 614,987 | | | $ | 530,243 | |
| Exports from the United States to: | | | | | |
| Asia | 41,995 | | | 59,242 | | | 80,217 | |
| Canada | 15,264 | | | 17,776 | | | 18,024 | |
| Europe | 3,885 | | | 4,489 | | | 5,440 | |
| Latin America | 6,867 | | | 4,937 | | | 2,169 | |
| Operations outside the United States: | | | | | |
| Brazil | 117,896 | | | 96,792 | | | 93,511 | |
| Asia | 626 | | | — | | | — | |
| Total | $ | 903,582 | | | $ | 798,223 | | | $ | 729,604 | |
| | | | | | | | | | | | | | | | | | | | | | | |
| | Identifiable Assets
by Geographic Area (c) | | Property, Plant & Equipment,
Net by Geographic Area (c) |
| (In thousands) | 2022 | | 2021 | | 2022 | | 2021 |
| United States | $ | 413,512 | | | $ | 398,749 | | | $ | 146,437 | | | $ | 135,310 | |
| Operations outside the United States: | | | | | | | |
| Brazil | 72,725 | | | 54,299 | | | 25,385 | | | 18,615 | |
| China | 12,950 | | | 16,355 | | | 11,903 | | | 14,889 | |
| General corporate | 23,674 | | | 23,482 | | | 2,686 | | | 1,567 | |
| Cash and cash equivalents (b) | 19,232 | | | 30,521 | | | n/a | | n/a |
| Discontinued operations | — | | | 178 | | | — | | | — | |
| Total | $ | 542,093 | | | $ | 523,584 | | | $ | 186,411 | | | $ | 170,381 | |
Refer to Notes to Financial Tables that follow these tables.
The Company’s facilities in Pottsville, PA (“PV”) and Guangzhou, China (“GZ”) have a tolling arrangement whereby certain surface protection films are manufactured in GZ for a fee with raw materials supplied from PV that are then shipped by GZ directly to customers principally in the Asian market but paid by customers directly to PV.Amounts associated with this intercompany tolling arrangement are reported in the table above as export sales from the U.S. to Asia, and include net sales of $20.1 million in 2022, $32.7 million in 2021 and $35.1 million in 2020.
| | | | | | | | | | | | | | | | | |
| Net Sales by Product Group |
| (In thousands) | 2022 | | 2021 | | 2020 |
| Aluminum Extrusions: | | | | | |
| Nonresidential building & construction | $ | 338,981 | | | $ | 269,252 | | | $ | 253,126 | |
| Consumer durables | 62,541 | | | 53,578 | | | 44,167 | |
| Automotive | 51,286 | | | 43,256 | | | 35,895 | |
| Machinery & equipment | 63,326 | | | 42,721 | | | 30,649 | |
| Distribution | 29,732 | | | 45,639 | | | 28,339 | |
| Residential building & construction | 64,268 | | | 52,236 | | | 40,049 | |
| Electrical | 27,738 | | | 32,643 | | | 23,486 | |
| Subtotal | 637,872 | | | 539,325 | | | 455,711 | |
| PE Films: | | | | | |
| Surface protection films | 68,140 | | | 88,436 | | | 109,097 | |
| Packaging | 29,431 | | | 30,484 | | | 22,700 | |
| LED-based products | — | | | — | | | 7,491 | |
| Subtotal | 97,571 | | | 118,920 | | | 139,288 | |
| Flexible Packaging Films | 168,139 | | | 139,978 | | | 134,605 | |
| Total | $ | 903,582 | | | $ | 798,223 | | | $ | 729,604 | |
(a)See Notes 5, 9, 12 and 15 for more information on losses associated with plant shutdowns, asset impairments and restructurings, unusual items, gains or losses from sale of assets, gains or losses on an investment accounted for under the fair value method and other items.
(b)Cash and cash equivalents includes funds held in locations outside the U.S. of $10.3 million and $16.4 million at December 31, 2022 and 2021, respectively.
(c)Export sales relate mostly to PE Films. Operations in Brazil relate to Flexible Packaging Films.
(d)Corporate depreciation and amortization are included in Corporate expenses, net, on the EBITDA from ongoing operations table above.
14. SAVINGS PLAN
Tredegar has a savings plan that allows eligible employees to voluntarily contribute a percentage of their compensation, up to IRS limitations. The provisions of the savings plan provided the following benefits for salaried and certain hourly employees:
•The Company makes matching contributions to the savings plan of $1 for every $1 an employee contributes per pay period up to a maximum of 5% of eligible compensation.
•The savings plan includes immediate vesting of matching contributions and automatic enrollment at 3% of eligible compensation unless the employee opts out or elects a different percentage.
The Company also has a non-qualified plan that restores matching benefits for employees suspended from the savings plan due to certain limitations imposed by income tax regulations (“restoration plan”). Charges recognized for these plans were $3.9 million in 2022, $3.3 million in 2021 and $4.0 million in 2020. The Company’s liability under the restoration plan was $0.7 million at December 31, 2022 (consisting of 70,266 phantom shares of common stock) and $0.7 million at December 31, 2021 (consisting of 56,570 phantom shares of common stock) and valued at the closing market price on those dates.
The Tredegar Corporation Benefits Plan Trust (the “Trust”) purchased 7,200 shares of the Company’s common stock in 1998 for $0.2 million and 46,671 shares of its common stock in 1997 for $1.0 million. There have been no shares purchased since 1998 except for re-invested dividends. The cost of the shares held by the Trust is shown as a reduction to shareholders’ equity in the consolidated balance sheets.
15. DIVESTITURES AND ASSETS HELD FOR SALE
Divestitures
Personal Care Films
In 2020, the Company completed the sale of Personal Care Films for an aggregate purchase price of $60.5 million, subject to customary adjustments. The Company agreed to provide certain transition services related to finance, human resources and information technology (“IT”) that ended during the second quarter of 2021, resulting in final cash proceeds of $64.1 million. Personal Care Films was previously reported in the PE Films segment.
The following table summarizes the financial results of discontinued operations reflected in the Consolidated Statements of Income for the year ended December 31 2020. Net income (loss) from discontinued operations for the years ended December 31, 2022 and 2021 were immaterial.
| | | | | |
17 | ASSET IMPAIRMENTS AND COSTS ASSOCIATED WITH EXIT AND DISPOSAL ACTIVITIESYear Ended December 31, |
| (In thousands) | 2020 |
| Revenues and other items: | |
| Sales | $ | 110,246 | |
| Other income (expense), net | (333) | |
| 109,913 | |
| Costs and expenses: | |
| Cost of goods sold | 92,079 | |
| Freight | 5,229 | |
| Selling, general and administrative | 16,824 | |
| Research and development | 8,863 | |
| Asset impairments and costs associated with exit and disposal activities, net of adjustments | 1,529 | |
| Loss on sale of business | 50,027 | |
| Total | 174,551 | |
| Income (loss) from discontinued operations before income taxes | (64,638) | |
| Income tax expense (benefit) | (6,027) | |
| Income (loss) from discontinued operations, net of tax | $ | (58,611) | |
The following table provides significant operating and investing cash flow information for discontinued operations for the year ended December 31, 2020. There was no significant operating and investing cash flow information for the years ended December 31, 2022 and 2021.
| | | | | |
| Year Ended December 31, |
| (In thousands) | 2020 |
| Operating activities: | |
| Depreciation and amortization | $ | 5,511 | |
| Loss on sale of Personal Care Films | 50,027 | |
| Total | 55,538 | |
| Investing activities: | |
| Net proceeds on sale of Personal Care Films | $ | 55,115 | |
| Capital expenditures | (1,912) | |
| Total | $ | 53,203 | |
Assets Held For Sale
In July 2019, the Company planscommitted to a plan to close its PE Films manufacturing facility in Lake Zurich, Illinois, which produces elastic materials. Production athistorically was reported within the Lake Zurich plant is expected to cease during the first halfpersonal care component of 2020 with product transfers to the new elastic production lines at Terre Haute, Indiana (“Lake Zurich plant shutdown”). As a result of the Lake Zurich plant shutdown, the Company expects to recognize pre-tax cash costs of $7.6 million comprised of (i) customer-related costs ($0.7 million), (ii) severance and other employee related costs ($1.8 million), and (iii) asset disposal and other cash costs ($5.1 million). In addition, the Company expects non-cash asset write-offs and accelerated depreciation of $1.6 million. Total expenses associated with the Lake Zurich plant shutdown are $2.7 million since project inception. Cash expenditures were $0.5 million in 2019. Proceeds from the expected sale of Lake Zurich’s real property are estimated at approximately $5 million. The Company anticipates that the Lake Zurich plant shutdown will be completed by the end of 2020.
The Company plans to consolidate the production of certainits PE Films personal care productssegment. As of December 31, 2020, the disposal group carrying value of $4.6 million was reported in Europe over"Prepaid expenses and other" in the next twelve months (“PC Europe consolidation”). As a result of this consolidation,consolidated balance sheet as the Company expects to recognize pre-tax cash costs of $1.7 million, primarilyheld for severance and customer-related costs. Total expenses associated with the PC Europe consolidation are $0.8 million since project inception. Cash expenditures were $0.5 million in 2019.
In June 2018, the Company announced plans to close its facility in Shanghai, China, which primarily produced plastic films used as components for personal care products (“Shanghai plant shutdown”). Production ceased at this plant during the fourth quarter of 2018. Total expenses associated with the Shanghai plant shutdown are $4.1 million since project inception. Cash expenditures were $0.8 million in 2019 and $3.3 million since project inception. The plant facilities were sold insale criteria was met. During the third quarter of 2019,2021, the Company completed the sale of the remaining assets in Lake Zurich, Illinois resulting in total cash proceeds of $4.7 million.
16. INVESTMENTS
In August 2007 and December 2008, the Company made an aggregate investment of $7.5 million in kaleo, Inc. (“kaléo”), a pre-tax gainprivately held specialty pharmaceutical company dedicated to building innovative solutions for serious and life-threatening medical conditions. Tredegar historically accounted for its investment in kaléo under the fair value option. At the time of $6.3the initial investment, the Company elected the fair value option of accounting since its investment objectives were similar to those of venture capitalists, which typically do not have controlling financial interests. kaléo’s stock is not publicly traded.
On December 27, 2021, the Company completed the sale of its investment interests in kaléo (Series A-3 Preferred Stock, Series B Preferred Stock and common stock) that, taken together, represented on a fully-diluted basis an approximate 18% interest in kaléo. Tredegar received closing cash proceeds of $47.1 million. Subsequently, in May 2022, additional cash consideration of $1.4 million was received related to customary post-closing adjustments, which is reported in “Other income (expense), net” in the consolidated statements of income.
17. SUPPLY CHAIN FINANCING
The Shanghai plant shutdown was completed inCompany has supply chain finance service agreements with third-party financial institutions to provide platforms that facilitate the fourth quarterability of 2019.
Other pre-tax charges in 2019 include restructuring costs in PE Films for severance inparticipating suppliers to finance payment obligations from the amountCompany with the third-party financial institution. The Company’s obligations to its suppliers, including amounts due and scheduled payment dates, are not affected by suppliers’ decisions to finance amounts under the supply chain finance agreements. As of $0.8 million, the write-off of inventory at PE Films’ Personal Care facility in Rétság, Hungary in the amount of $0.2December 31, 2022 and 2021, $25.9 million and the write-off of a Personal Care production line at the Guangzhou, China facility in the amount of $0.4 million.
A reconciliation$30.7 million, respectively, of the beginning and ending balances of accrued expenses associated with exit and disposal activities and charges associated with asset impairments and reported as “Asset impairments and costs associated with exit and disposal activities, net of adjustments” in the consolidated statements of income for the years ended December 31, 2019, 2018 and 2017 is as follows:Company’s accounts payable were financed by participating suppliers through third-party financial institutions.
|
| | | | | | | | | | | | | | | |
| (In Thousands) | Severance | | Asset
Impairments | | Other | | Total |
| Balance at January 1, 2017 | $ | 1,854 |
| | $ | — |
| | $ | 554 |
| | $ | 2,408 |
|
| For the year ended December 31, 2017: | | | | | | | |
| Charges: | | | | | | | |
| Flexible Packaging Films impairment | — |
| | 101,254 |
| | — |
| | 101,254 |
|
Other restructuring charges(a) | 589 |
| | 341 |
| | 304 |
| | 1,234 |
|
| | 589 |
| | 101,595 |
| | 304 |
| | 102,488 |
|
| Cash spend | (1,816 | ) | | — |
| | (382 | ) | | (2,198 | ) |
| Charges against assets | — |
| | (101,595 | ) | | — |
| | (101,595 | ) |
| Balance at January 1, 2018 | 627 |
| | — |
| | 476 |
| | 1,103 |
|
| For the year ended December 31, 2018: | | | | | | | |
| Charges: | | | | | | | |
| Shanghai plant shutdown | 1,832 |
| | 233 |
| | 98 |
| | 2,163 |
|
Other restructuring charges(b) | 822 |
| | — |
| | 20 |
| | 842 |
|
| | 2,654 |
| | 233 |
| | 118 |
| | 3,005 |
|
| Cash spend | (2,665 | ) | | — |
| | (434 | ) | | (3,099 | ) |
| Charges against assets | — |
| | (141 | ) | | — |
| | (141 | ) |
| Reversed to income | — |
| | (92 | ) | | — |
| | (92 | ) |
| Balance at January 1, 2019 | 616 |
| | — |
| | 160 |
| | 776 |
|
| For the year ended December 31, 2019: | | | | | | | |
| Charges: | | | | | | | |
| Shanghai plant shutdown | 113 |
| | — |
| | 716 |
| | 829 |
|
| Lake Zurich plant shutdown | 874 |
| | 191 |
| | 58 |
| | 1,123 |
|
| PC Europe consolidation | 588 |
| | 96 |
| | — |
| | 684 |
|
Other restructuring charges(c) | 842 |
| | 595 |
| | 52 |
| | 1,489 |
|
| | 2,417 |
| | 882 |
| | 826 |
| | 4,125 |
|
| Cash spend | (1,739 | ) | | — |
| | (900 | ) | | (2,639 | ) |
| Charges against assets | — |
| | (882 | ) | | — |
| | (882 | ) |
| Balance at December 31, 2019 | $ | 1,294 |
| | $ | — |
| | $ | 86 |
| | $ | 1,380 |
|
(a) Other restructuring charges in 2017 include PE Films severance ($0.2 million) and an impairment of a production line at its Rétság, Hungary facility ($0.2 million), Aluminum Extrusions severance ($0.1 million), Corporate severance ($0.3 million) and closure costs at the shutdown Kentland facility ($0.2 million). (b) Other restructuring charges in 2018 include severance of $0.7 million and $0.1 million at PE Films and Aluminum Extrusions, respectively. (c) Other restructuring charges in 2019 include PE Films severance ($0.8 million), write-off of inventory at its Personal Care facility in Rétság, Hungary ($0.2 million), and write-off of a Personal Care production line at the Guangzhou, China facility ($0.4 million). |
Tredegar is involved in various stages of investigation and remediation relating to environmental matters at certain current and former plant locations. Where the Company has determined the nature and scope of any required environmental remediation activity, estimates of cleanup costs have been obtained and accrued. As efforts continue to maintain compliance with applicable environmental laws and regulations, additional contingencies may be identified.identified continue. If additional contingencies are identified in the future, the Company’s practice is to determine at that time the nature and scope of those contingencies, obtain and accrue estimates of the cost of remediation, and perform remediation. While the Company believes it is currently adequately accrued for known environmental issues, it is possible that unexpected future costs for known or unknown
environmental issues could have a material adverse effect on its financial condition, results of operations and cash flows at that time.
The Company is involved in various other legal actions arising in the normal course of business. After taking into consideration the relevant information, the Company believes that it has sufficiently accrued for probable losses and that the actions will not have a material adverse effect on its financial position.
From time to time, the Company enters into transactions with third parties in connection with the sale of assets or businesses in which it agrees to indemnify the buyers or third parties involved in the transaction, or in which the sellers or third parties involved in the transaction agree to indemnify Tredegar, for certain liabilities or risks related to the assets or business. Also, in the ordinary course of its business, the Company may enter into agreements with third parties for the sale of goods or services that may contain indemnification provisions. In the event that an indemnification claim is asserted, liability for indemnification would be subject to an assessment of the underlying facts and circumstances under the terms of the applicable agreement. For these reasons, Tredegar is unable to estimate the maximum amount of the potential future liability under the indemnity provisions of these agreements. The Company does, however, accrue for losses for any known contingent liability, including those that may arise from indemnification provisions, when future payment is probable and the amount is reasonably estimable. The Company discloses contingent liabilities if the probability of loss is reasonably possible and considered to be material.
| |
19 | SELECTED QUARTERLY FINANCIAL DATA |
Tredegar Corporation and Subsidiaries
(In Thousands, Except Per-Share Amounts)
(Unaudited)
|
| | | | | | | | | | | | | | | |
| | First Quarter | | Second Quarter | | Third Quarter | | Fourth Quarter |
| For the year ended December 31, 2019 | | | | | | | |
| Sales | $ | 248,466 |
| | $ | 248,248 |
| | $ | 243,217 |
| | $ | 232,427 |
|
| Gross profit | 38,792 |
| | 46,780 |
| | 42,668 |
| | 40,546 |
|
| Net income (loss) | $ | 19,785 |
| | $ | 14,477 |
| | $ | 17,133 |
| | $ | (3,135 | ) |
| Earnings (loss) per share: | | | | | | | |
| Basic | $ | 0.60 |
| | $ | 0.44 |
| | $ | 0.51 |
| | $ | (0.09 | ) |
| Diluted | $ | 0.60 |
| | $ | 0.44 |
| | $ | 0.51 |
| | $ | (0.09 | ) |
| Shares used to compute earnings (loss) per share: | | | | | | | |
| Basic | 33,123 |
| | 33,270 |
| | 33,271 |
| | 33,278 |
|
| Diluted | 33,127 |
| | 33,278 |
| | 33,285 |
| | 33,278 |
|
| For the year ended December 31, 2018 | | | | | | | |
| Sales | $ | 258,711 |
| | $ | 263,759 |
| | $ | 267,294 |
| | $ | 275,707 |
|
| Gross profit | 46,732 |
| | 44,652 |
| | 40,478 |
| | 47,826 |
|
| Net income | $ | 18,165 |
| | $ | 14,722 |
| | $ | (34,201 | ) | | $ | 26,157 |
|
| Earnings per share: | | | | | | | |
| Basic | $ | 0.55 |
| | $ | 0.45 |
| | $ | (1.03 | ) | | $ | 0.79 |
|
| Diluted | $ | 0.55 |
| | $ | 0.44 |
| | $ | (1.03 | ) | | $ | 0.79 |
|
| Shares used to compute earnings per share: | | | | | | | |
| Basic | 32,982 |
| | 33,074 |
| | 33,110 |
| | 33,103 |
|
| Diluted | 32,988 |
| | 33,108 |
| | 33,110 |
| | 33,112 |
|
Due to rounding, the sum of quarterly amounts presented in the table above may not add up precisely to the corresponding full year amounts.
Item 16. FORM 10-K SUMMARY
Not Applicable.
EXHIBIT INDEX
|
| | | | |
2.13.1 | Stock Purchase Agreement, dated as of February 1, 2017, by and among Futura Industries Corporation, Futura Corporation, Susan D. Johnson, The Susan D. Johnson Trust, Ken Wells, The William L. Bonnell Company, Inc., and, in his capacity as Sellers’ Representative, Brent F. Lloyd (filed as Exhibit 2.1 of Tredegar’s Current Report on Form 8-K (File No. 1-10258), filed on February 2, 2017, and incorporated herein by reference) |
| |
3.1 | |
| |
| 3.1.1 | |
| |
| 3.1.2 | |
| |
| 3.1.3 | |
| |
| 3.2 | |
| |
+4.1 | |
| |
| 10.1 | Second Amended and Restated Credit Agreement, dated as of June 28, 2019,29, 2022, among Tredegar, as borrower, the lenders named therein, JPMorgan Chase Bank N.A., as administrative agent, SunTrust Bank, Citizens Bank N.A.N.A and PNC Bank, National Association, as co-syndication agents, and Bank of America, N.A., U.S. Bank National Association Bank of America, N.A. and Wells Fargo Bank, National Association, as co-documentation agents, and the other lenders party thereto (filed as Exhibit 4.1 to Tredegar’sTredegar's Current Report on Form 8-K (File No. 1-10258), filed on July 1, 2019,June 30, 2022, and incorporated herein by reference) |
| |
| 10.1.1 | Second Amended and Restated Guaranty, dated as of June 28, 2019,29, 2022, by and among the subsidiaries of Tredegar listed on the signature pages thereto in favor of JPMorgan ChaseChase Bank, N.A., as administrative agent, for the ratable benefit of the Holders of Guaranteed Obligations (as defined therein) filed(filed as Exhibit 4.2 to Tredegar’sTredegar's Current Report on Form 8-K (File No. 1-10258), filed on July 1, 2019,June 30, 2022, and incorporated herein by reference) |
| |
| 10.1.2 | Second Amended and Restated Pledge and Security Agreement, dated as of June 28, 2019,29, 2022, by and among Tredegar and the subsidiaries of Tredegar listed on the signature pages thereto and JPMorgan ChaseChase Bank, N.A., as administrative agent, for the ratable benefit of the Secured Parties (as defined therein) filed(filed as Exhibit 4.3 to Tredegar’sTredegar's Current Report on Form 8-K (File No. 1-10258), filed on July 1, 2019,June 30, 2022, and incorporated herein by reference) |
| |
| 10.2 | |
| |
| *10.3 | |
| |
| 10.4 | |
| |
| 10.5 | |
| |
| *10.6 | |
| |
| *10.6.1 | |
| |
| *10.7 | |
| |
| | | | | |
| |
| *10.10 | |
| |
| *10.11 | |
| |
| *10.12 | Agreement, dated asForm of February 19, 2014, byNotice of Stock Award and among Tredegar, John D. Gottwald, William M. GottwaldStock Award Terms and Floyd D. Gottwald, Jr.Conditions (filed as Exhibit 10.110.18 to Tredegar’s CurrentQuarterly Report on Form 8-K10-Q (File No. 1-10258), filed on February 20, 2014, for the quarterly period ended March 31, 2020, and incorporated herein by reference) |
| |
| *10.13 | |
| |
*10.13.110.14 | |
| |
*10.1410.15 | |
| |
*10.15 | |
| |
| *10.16 | |
| |
| *10.17 | |
| |
| +21 | |
| |
+23.123 | |
| |
+23.231.1 | |
| |
+31.1 | |
| |
| +31.2 | |
| |
| +32.1 | |
| |
| +32.2 | |
| +101 | |
+101 | XBRL Instance Document and Related Items |
| +104 | Cover Page Interactive Data File (formatted in iXBRL and contained in Exhibit 101) |
|
| | | | |
| * | Denotes compensatory plans or arrangements or management contracts. |
SIGNATURES
Pursuant to the requirements of Section 13 or 15(d) of the Securities Exchange Act of 1934, the registrant has duly caused this report to be signed on its behalf by the undersigned, thereunto duly authorized.
| | | | | | | | | | | | | | |
| | TREDEGAR CORPORATION
(Registrant) |
| | | | |
| Dated: | | TREDEGAR CORPORATION
(Registrant)
|
| | | | |
Dated: | March 16, 20202023 | By | | /s/ John M. Steitz |
| | | | John M. Steitz |
| | | | President and Chief Executive Officer |
Pursuant to the requirements of the Securities Exchange Act of 1934, this report has been signed below by the following persons on behalf of the registrant and in the capacities indicated on March 16, 2020.
| | | | | | | | | | | |
| Signature | | Title |
| | | |
| /s/ | John M. Steitz | | President, Chief Executive Officer and Director |
| (John M. Steitz) | | (Principal Executive Officer) |
| | | |
| /s/ | D. Andrew Edwards | | Executive Vice President and Chief Financial Officer |
| (D. Andrew Edwards) | | (Principal Financial Officer) |
| | | |
| /s/ | Frasier W. Brickhouse, II | | Corporate Treasurer and Controller |
| (Frasier W. Brickhouse, II) | | (Principal Accounting Officer) |
| | | |
| /s/ | Gregory A. Pratt | | Chairman of the Board of Directors |
| (Gregory A. Pratt) | | |
| | | |
| /s/ | | | |
Signature | | Title |
| | | |
/s/ | John M. Steitz | | President, Chief Executive Officer and Director |
| (John M. Steitz) | | (Principal Executive Officer) |
| | | |
/s/ | D. Andrew Edwards | | Vice President and Chief Financial Officer |
| (D. Andrew Edwards) | | (Principal Financial Officer) |
| | | |
/s/ | Frasier W. Brickhouse, II | | Corporate Treasurer and Controller |
| (Frasier W. Brickhouse, II) | | (Principal Accounting Officer) |
| | | |
/s/ | John D. Gottwald | | Chairman of the Board of Directors |
| (John D. Gottwald) | | |
| | | |
/s/ | George C. Freeman, III | | Director |
| (George C. Freeman, III) | | |
| | | |
| /s/ | William M. Gottwald | | Director |
| (William M. Gottwald) | | |
| | | |
/s/ | Kenneth R. Newsome | | Director |
| (Kenneth R. Newsome) | | |
| | | |
| /s/ | Gregory A. Pratt | | Director |
| (Gregory A. Pratt) | | |
| | | |
/s/ | Thomas G. Snead, Jr. | | Director |
| (Thomas G. Snead, Jr.) | | |
| | | |
| /s/ | Carl E. Tack, III | | Director |
| (Carl E. Tack, III) | | |
| | | |
| /s/ | Anne G. Waleski | | Director |
| (Anne G. Waleski) | | |