UNITED STATES
SECURITIES AND EXCHANGE COMMISSION
WASHINGTON, D.C. 20549
FORM 10-K
| | | | | |
| x | ANNUAL REPORT PURSUANT TO SECTION 13 OR 15(d) OF THE SECURITIES EXCHANGE ACT OF 1934 |
| For the fiscal year ended December 31, 20202023 |
OR
| | | | | |
| ¨ | TRANSITION REPORT PURSUANT TO SECTION 13 OR 15(d) OF THE SECURITIES EXCHANGE ACT OF 1934 |
| For the transition period from to |
Commission File Number 1-10258
TREDEGAR CORPORATION
(Exact name of registrant as specified in its charter)
| | | | | | | | | | | |
| Virginia | | 54-1497771 |
(State or other jurisdiction
of incorporation or organization) | | (I.R.S. Employer
Identification No.) |
| | | |
| 1100 Boulders Parkway, | | |
Richmond, | Virginia | | 23225 |
| (Address of principal executive offices) | | (Zip Code) |
Registrant’s telephone number, including area code: 804-330-1000
Securities registered pursuant to Section 12(b) of the Act:
| | | | | | | | |
| Title of each class | Trading Symbol | Name of each exchange on which registered |
| Common Stock | TG | New York Stock Exchange |
Securities registered pursuant to Section 12(g) of the Act:
None
Indicate by check mark if the registrant is a well-known seasoned issuer, as defined in Rule 405 of the Securities Act. Yes ¨ No x
Indicate by check mark if the registrant is not required to file reports pursuant to Section 13 or Section 15(d) of the Act. Yes ¨ No x
Indicate by check mark whether the registrant (1) has filed all reports required to be filed by Section 13 or 15(d) of the Securities Exchange Act of 1934 during the preceding 12 months (or for such shorter period that the registrant was required to file such reports), and (2) has been subject to such filing requirements for the past 90 days. Yes x No ¨
Indicate by check mark whether the registrant has submitted electronically every Interactive Data File required to be submitted pursuant to Rule 405 of Regulation S-T (§ 232.405 of this chapter) during the preceding 12 months (or for such shorter period that the registrant was required to submit such files). Yes x No ¨
Indicate by check mark whether the registrant is a large accelerated filer, an accelerated filer, a non-accelerated filer, a smaller reporting company, or an emerging growth company. See the definitions of “large accelerated filer,” “accelerated filer,” “smaller reporting company” and “emerging growth company” in Rule 12b-2 of the Exchange Act.
| | | | | | | | | | | | | | | | | | | | | | | |
| Large accelerated filer | | o | Accelerated filer | x | Smaller reporting company | | o |
| | | | | |
| Non-accelerated filer | | o | | Emerging growth company | | o |
If an emerging growth company, indicate by check mark if the registrant has elected not to use the extended transition period for complying with any new or revised financial accounting standards provided pursuant to Section 13(a) of the Exchange Act. ¨
Indicate by check mark whether the registrant has filed a report on and attestation to its management’s assessment of the effectiveness of its internal control over financial reporting under Section 404(b) of the Sarbanes-Oxley Act (15 U.S.C. 7262(b)) by the registered public accounting firm that prepared or issued its audit report. x
If securities are registered pursuant to Section 12(b) of the Act, indicate by check mark whether the financial statements of the registrant included in the filing reflect the correction of an error to previously issued financial statements. ¨
Indicate by check mark whether any of those error corrections are restatements that required a recovery analysis of incentive-based compensation received by any of the registrant’s executive officers during the relevant recovery period pursuant to §240.10D-1(b). ¨
Indicate by check mark whether the registrant is a shell company (as defined in Rule 12b-2 of the Act). Yes ¨ No x
Aggregate market value of voting and non-voting common equity held by non-affiliates of the registrant as of June 30, 20202023 (the last business day of the registrant’s most recently completed second fiscal quarter): $406,328,122*$278,307,771*
Number of shares of Common Stock outstanding as of March 12, 2021:8, 2024: 33,537,89234,430,769
| | | | | |
| * | In determining this figure, an aggregate of 7,133,6347,361,458 shares of Common Stock beneficially owned by Floyd D. Gottwald, Jr., John D. Gottwald, William M. Gottwald, and James T. Gottwald and the members of their immediate families has been excluded because the shares are deemed to be held by affiliates. The aggregate market value has been computed based on the closing price in the New York Stock Exchange on June 30, 2020.2023. |
Documents Incorporated By Reference
Portions of the Tredegar Corporation Proxy Statement for the 20212024 Annual Meeting of Shareholders (the “Proxy Statement”) are incorporated by reference into Part III of this Form 10-K.
Index to Annual Report on Form 10-K
Year Ended December 31, 20202023
PART I
Item 1. BUSINESS
Description of Business
Tredegar Corporation (“Tredegar”) is engaged, through its subsidiaries, in the manufacture of aluminum extrusions, polyethylene (“PE”) plastic films and polyester (“PET”) films. Unless the context requires otherwise, all references herein to “Tredegar,” “the Company,” “we,” “us” or “our” are to Tredegar Corporation and its consolidated subsidiaries.
The Company's reportable business segments are Aluminum Extrusions, PE Films and Flexible Packaging Films.Films (also referred to as “Terphane”).
On October 30, 2020,September 1, 2023, the Company completed the sale of its personal care films business (“Personal Care Films”). The transaction excluded the packaging film lines and related operations located at the Pottsville, Pennsylvania manufacturing site (“Pottsville Packaging”), which are now being reported within the Surface Protection component of PE Films. Commencing in the third quarter of 2020, all historical results for Personal Care Films have been presented as discontinued operations.
In December 2020, the Companyannounced that it had entered into a definitive agreement and completedto sell Terphane to Oben Group (the “Contingent Terphane Sale”). Completion of the sale is contingent upon the satisfaction of Bright View Technologies (“Bright View”). The sale does not represent a strategic shift nor does it have a major effect oncustomary closing conditions, including the Company’s historicalreceipt of certain competition filing approvals by authorities in Brazil and ongoing operations, thus all financial information for Bright View has been presented as continuing operations. Bright View historically has been reported in the PE Films segment.
Columbia. For more information on these transactions, see Note 2 “Discontinued Operations”“Status of Current Corporate Strategic Initiatives - Agreement to the Consolidated Financial Statements includedSell Terphane” in Item 15. “Exhibits7. “Management’s Discussion and Analysis of Financial Statement Schedules”Condition and Results of Operations” of this Annual Report on Form 10-K for the year ended December 31, 2023 (“Item 15”Form 10-K”).
Aluminum Extrusions
Aluminum Extrusions, also referred to as Bonnell Aluminum, produces high-quality, soft-alloysoft and medium-strengthmedium strength alloyed aluminum extrusions, custom fabricated and finished, aluminum extrusions for the building and construction, automotive and transportation, consumer durables goods, machinery and equipment, electrical and renewable energy, and distribution markets. Bonnell Aluminum has manufacturing facilities located in the United States (“U.S.”).
Aluminum Extrusions manufactures mill (unfinished), machined, anodized and painted, (finished) and fabricatedthermally improved aluminum extrusions for sale directly to fabricators and distributors. It also manufactures and sells branded aluminum flooring trims under itsproduct lines: Futura TransitionsTM lineby Bonnell Aluminum (flooring trims) and aluminum framing systems under its TSLOTSTM line.by Bonnell Aluminum (structural aluminum framing systems). Aluminum Extrusions competes primarily on the basis of product quality, service and price. Sales are made predominantly in the U.S. The end-use markets for Aluminum Extrusions are cyclical and seasonal in nature.
The end-uses in each of Aluminum Extrusions’ primary market segments include: | | | | | | | | |
| Major Markets | | End-Uses |
| | |
| Building & construction (“B&C”)- nonresidential | | Commercial windows and doors, curtain walls, storefronts and entrances, automatic entry doors, walkway covers, ducts, louvers and vents, office wall panels, partitions and interior enclosures, acoustical walls and ceilings, point of purchase displays, pre-engineered structures, and flooring trims (Futura TransitionsTM)by Bonnell Aluminum) |
Building & constructionB&C - residential | | Residential windows and doors, shower and tub enclosures, railing and support systems, venetian blinds, and swimming pools |
Automotive and& transportation | | Automotive and light truck structural components, spare parts,battery enclosures for electric vehicles, after-market automotive accessories, grills for heavy trucks, travel trailers and recreation vehicles |
| Consumer durables | | Furniture,Office furniture, pleasure boats, refrigerators and freezers, appliances and sporting goods |
| Machinery & equipment | | Material handling equipment, conveyors and conveyingconveyor systems, medical equipment, industrial fans and aluminum framing systems (TSLOTSTM)by Bonnell Aluminum) |
| Distribution (metal service centers specializing in stock and release programs and custom fabrications to small manufacturers) | | Various custom profiles including storm shutters, pleasure boat accessories, theater set structures and various standard profiles (including rod, bar, tube and pipe) |
Electrical and& renewable energy | | Lighting fixtures, electronic apparatus, solar panel brackets and rigid and flexible conduits |
Aluminum Extrusions’ net sales (sales less freight) by market segment for the three years ended December 31, 20202023, 2022 and 2021 is shown below: | % of Aluminum Extrusions Net Sales by Market Segment | % of Aluminum Extrusions Net Sales1 by Market Segment | | % of Aluminum Extrusions Net Sales1 by Market Segment |
| | | 2020 | | 2019 | | 2018 | | 2023 | | 2022 | | 2021 |
| Building and construction: | |
| B&C: | |
| Nonresidential | |
| Nonresidential | |
| Nonresidential | Nonresidential | 56% | | 51% | | 51% | 56% | | 53% | | 50% |
| Residential | Residential | 9% | | 8% | | 8% | Residential | 8% | | 10% |
| Automotive | Automotive | 8% | | 9% | | 8% | Automotive | 10% | | 8% |
| Specialty: | Specialty: | |
| Consumer durables | Consumer durables | 10% | | 11% | | 12% |
| Consumer durables | |
| Consumer durables | | 8% | | 10% |
| Machinery & equipment | Machinery & equipment | 7% | | 7% | | 7% | Machinery & equipment | 9% | | 10% | | 8% |
| Electrical | Electrical | 4% | | 7% | | 7% | Electrical | 6% | | 4% | | 6% |
| Distribution | Distribution | 6% | | 7% | | 7% | Distribution | 3% | | 5% | | 8% |
| Total | Total | 100% | | 100% | | 100% | Total | 100% | | 100% |
| | | 1. The Company uses net sales as its measure of revenues from external customers at the segment level. For more business segment information, see Note 13 “Business Segments” to the Consolidated Financial Statements included in Item 15. “Exhibits and Financial Statement Schedules” of this Form 10-K (“Item 15”). | | 1. The Company uses net sales as its measure of revenues from external customers at the segment level. For more business segment information, see Note 13 “Business Segments” to the Consolidated Financial Statements included in Item 15. “Exhibits and Financial Statement Schedules” of this Form 10-K (“Item 15”). |
In 2020, 20192023, 2022 and 2018, nonresidential building and construction2021, Aluminum Extrusions net sales accounted for approximately 35%70%, 34%71% and 35%67% of Tredegar’s consolidated net sales, respectively.
Open Orders. Overall open orders in Aluminum Extrusions were approximately $48.0 million, or 14 million pounds, at December 31, 2023 compared to approximately $136.0 million, or 41 million pounds, at December 31, 2022, a decrease of $88.0 million, or approximately 65%. This level is below the quarterly range of 21 to 27 million pounds in 2019 before pandemic-related disruptions that resulted in long lead times, driving a peak in open orders of approximately 100 million pounds during the first quarter of 2022. We believe that current open orders are below pre-pandemic levels due to higher interest rates, tighter lender requirements and the increase in remote working, which particularly impacts the non-residential B&C end-use market. In addition, data indicates that aluminum extrusion imports increased significantly in recent years, especially during the pandemic, and some of Aluminum Extrusions’ customers may have sourced, and continue to source, aluminum extrusions from producers outside the U.S. Sales volume for Aluminum Extrusions, which the Company believes is cyclical and seasonal in nature due to its end-use markets, was 138.5 million pounds in 2023, 174.7 million pounds in 2022 and 183.4 million pounds in 2021.
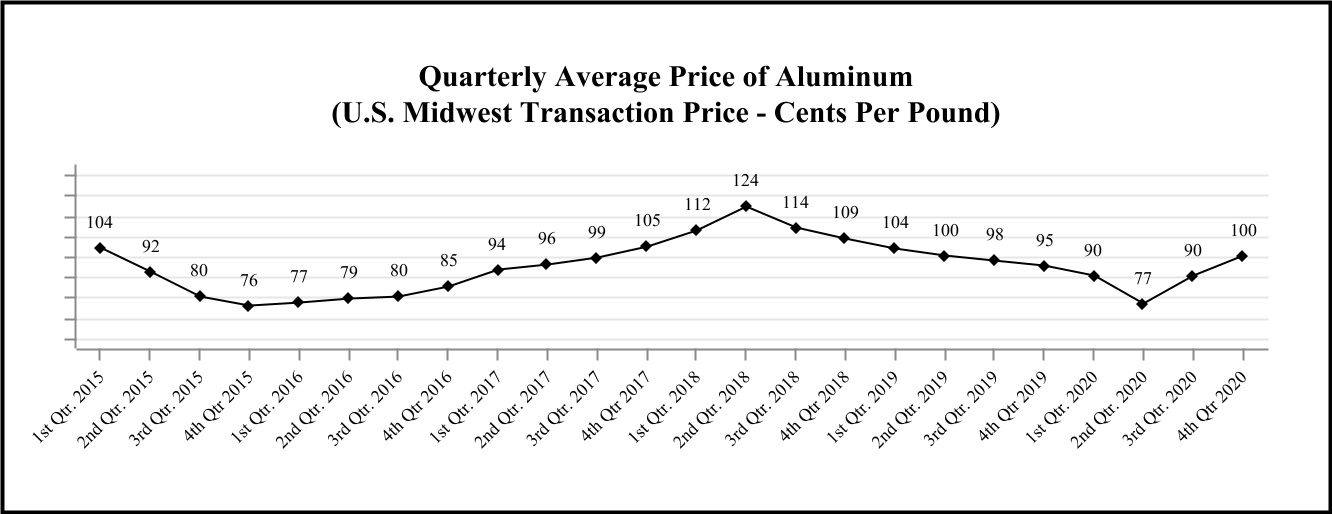
Raw Materials. The primary raw materials used by Aluminum Extrusions consist of aluminum ingot, aluminum scrap and various alloys, which are purchased from domestic and foreign producers in open-market purchases and under annual contracts. Refer to Item 7A. "Quantitative and Qualitative Disclosures About Market Risk” of this Form 10-K (“Item 7A”) for additional information on aluminum price trends. Aluminum Extrusions believes that it has adequate supply agreements for aluminum and other required raw materials and supplies in the foreseeable future.2024.
PE Films
PE Films is composed ofproduces surface protection films, polyethylene overwrap films and films for other markets. Tredegar’s Surface Protection unit produces single- and multi-layer surface protection films sold under the UltraMask®, ForceField™, ForceField PEARL®, Pearl A™ and Pearl A™Obsidian™ brand names. These films, which are manufactured at facilities in the U.S. and China, support manufacturers of optical and other specialty substrates used in high-technology applications, most notably protecting high-value components of flat panel and flexible displays used in televisions, monitors, notebooks, smartphones, tablets, e-readers, automobilesdigital signage, semiconductors and digital signage,automobiles during the manufacturing and transportation process. The Obsidian™ series of products is designed for usage in automotive applications. In 2020, 20192023, 2022 and 2018, surface protection films2021, PE Films accounted for approximately 15%11%, 13%11% and 12%15% of Tredegar’s consolidated net sales, respectively.
In October 2020, the Surface Protection unit assumed responsibility for Pottsville Packaging, which was previously reported within the Personal Care component of PE Films. Pottsville Packaging produces thin-gauge films as overwrap for bathroom tissue and paper towels.
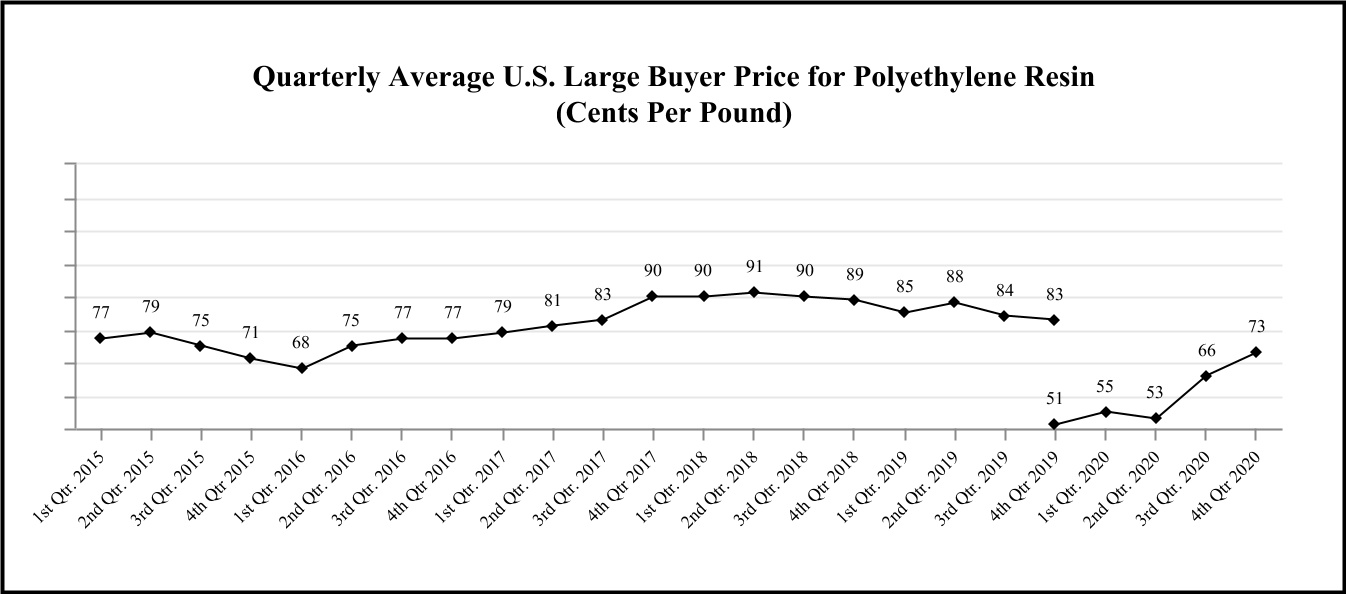
Raw Materials. The primary raw materials used by PE Films are polyethylene and polypropylene resins. These raw materials are obtained from domestic and foreign suppliers at competitive prices. Refer to Item 7A for additional information on resin price trends. PE Films believes that there will be an adequate supply of polyethylene and polypropylene resins in the foreseeable future.
Research and Development. Tredegar’s spending for research and development (“R&D”) activities in 2023, 2022 and 2021 was primarily related to PE Films. During the third quarter of 2023, the Company adopted a plan to close the PE Films technical center in Richmond, VA. Future R&D activities will be performed at the facility in Pottsville, PA. R&D spending by the PE Films was approximately $2.9 million, $5.3 million and $5.7 million in 2023, 2022 and 2021, respectively.
Customers. PE Films’ products are sold primarily in the U.S. and Asia, with the top four customers, collectively, comprising 84%, 86% and 86%87% of its net sales in 2020, 20192023 and 2018, respectively.88% in 2022 and 2021. No single PE Films customer exceeds 10% of Tredegar’s consolidated net sales. For additional information, see Item 1A. “Risk Factors” of this Form 10-K (“Item 1A”).
Flexible Packaging Films
Flexible Packaging Films is comprised of Terphane Holdings LLC (“Terphane”). Flexible Packaging Films produces PET-based films for use in packaging applications that have specialized properties, such as heat resistance, strength, barrier protection and the ability to accept high-quality print graphics. These differentiated, high-value films are primarily manufactured in Brazil and sold in Latin America and the U.S. under the Terphane®, Sealphane® and SealphaneEcophane® brand names. Major end uses include food packaging and industrial applications. Flexible Packaging Films competes in all of its markets on the basis of product quality, service and price. In 2023, 2022 and 2021, Terphane accounted for approximately 19%, 19% and 18% of Tredegar’s consolidated net sales, respectively.
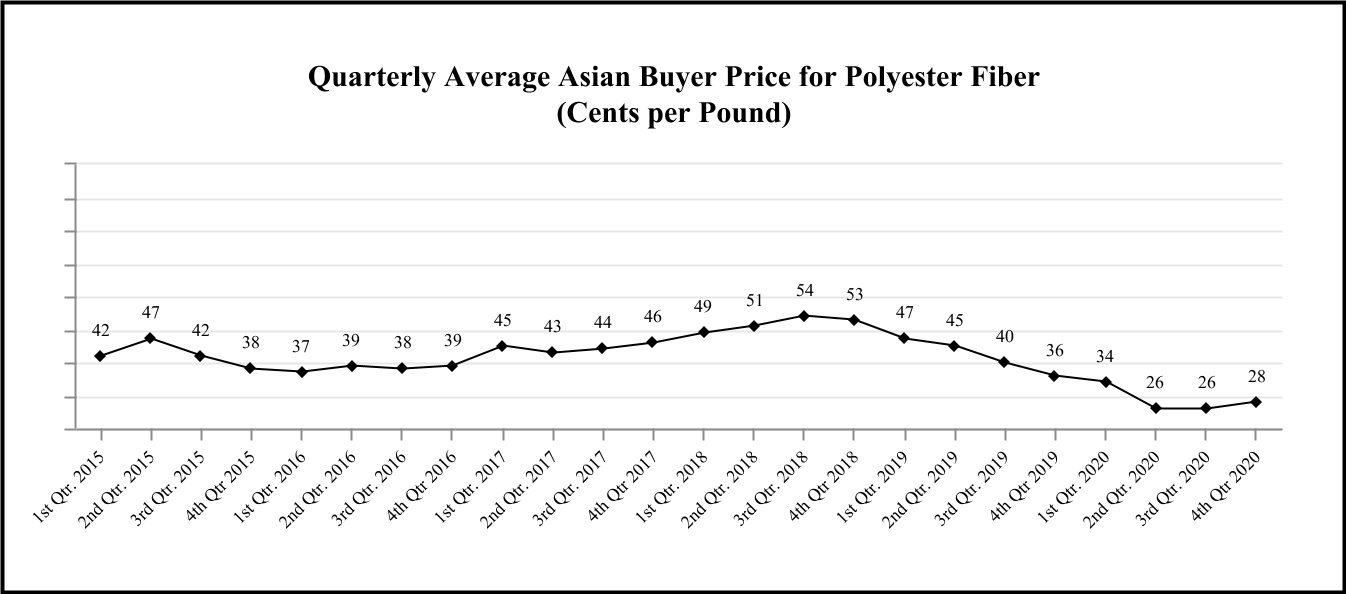
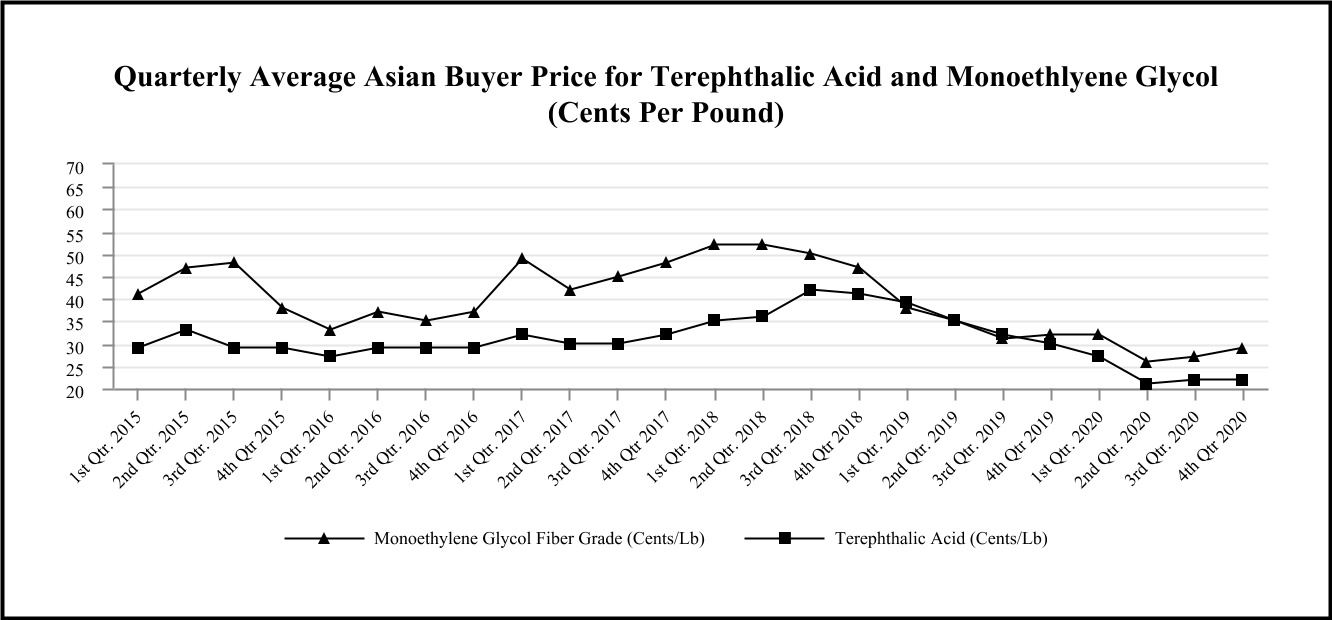
Raw Materials. The primary raw materials used by Flexible Packaging Films to produce polyester resins are purified terephthalic acid (“PTA”) and monoethylene glycol (“MEG”). Flexible Packaging Films also purchases additionalother polyester resins directly from suppliers. These raw materials are obtained from Brazilian and foreign suppliers at competitive prices. Flexible Packaging Films Terphane continues to monitor cost escalations to adjust selling prices as market dynamics permit and believes that there will be an adequate supply of polyester resins, PTA and MEG in the foreseeable future. Refer to Item 7A for additional information on resin price trends.
General
Intellectual Property. Tredegar considers patents, licenses and trademarks to be material to PE Films. On December 31, 2020,2023, PE Films held 5437 patents (including 46 U.S. patents), and 8266 registered trademarks (including 4 U.S. registered trademarks). Flexible Packaging Films held 1 U.S. patent and 1517 registered trademarks (including 24 U.S. registered trademarks). Aluminum Extrusions held no U.S. patents and 43 U.S. registered trademarks. As of December 31, 2020,2023, these patents had remaining terms of 3.50.5 to 15.517 years.
Research and Development. Tredegar’s spending for research and development (“R&D”) activities in 2020, 2019 and 2018 was primarily related to PE Films. R&D spending by the Company was approximately $8.4 million, $7.9 million and $6.7 million in 2020, 2019 and 2018, respectively.
Backlog. Overall backlog in Aluminum Extrusions was approximately $74.2 million at December 31, 2020 compared to approximately $52.8 million at December 31, 2019, an increase of $21.4 million, or approximately 41%. Backlogs are not material to the operations in PE Films or Flexible Packaging Films. Net sales for Aluminum Extrusions, which the Company believes are cyclical in nature, were $455.7 million in 2020, $529.6 million in 2019 and $573.1 million in 2018.
Government Regulation. The Company’s operations are subject to various local, state, federal and foreign government regulations, including environmental, privacy and anti-corruption and anti-bribery laws and regulations.
U.S. laws concerning the environment to which the Company’s domestic operations are or may be subject to include the Clean Water Act, the Clean Air Act, the Resource Conservation and Recovery Act, the Occupational Safety and Health Act, the National Environmental Policy Act, the Toxic Substances Control Act, the Comprehensive Environmental Response, Compensation and Liability Act (“CERCLA”), regulations promulgated under these acts, and other federal, state or local laws or regulations governing environmental matters. Compliance with these laws is an important consideration because Tredegar uses hazardous materials in some of its operations, is a generator of hazardous waste, and wastewater from the Company’s operations is discharged to various types of wastewater management systems. Under CERCLA and other laws, Tredegar may be subject to financial exposure for costs associated with waste management and disposal, even if the Company fully complies with applicable environmental laws.
The U.S. Environmental Protection Agency has adopted regulations under the Clean Air Act relating to emissions of carbon dioxide and other greenhouse gases (“GHG”), including mandatory reporting and permitting requirements. Several of the Company’s manufacturing operations result in emissions of carbon dioxide or GHG and are subject to the current GHG regulations. The Company’s compliance with theseenvironmental regulations has yet to require significant capital expenditures; however, environmental standards tend to become more stringent over time. Therefore, in order to comply with current or future environmental legislation or regulations, the Company may be subject to additional capital expenditures, operating expenses or other compliance costs, the amounts and timing of which are not presently determinable, but which could be significant, including constructing new facilities or modifying existing facilities.
For further discussion regarding certain privacy and anti-corruption and anti-bribery laws and regulations to which the Company is subject, see Item 1A. Risk Factors below. Like environmental regulations, current or future privacy and anti-corruption and anti-bribery legislation or regulations may subject the Company to additional capital expenditures, operating expenses or other compliance costs, the amounts and timing of which are not presently determinable but could be significant. Finally, anyAny failure to comply with current or future laws and regulations, including environmental, privacy and anti-corruption and anti-bribery laws and regulations, could subject Tredegar to substantial penalties, fines, costs and expenses. For further discussion regarding certain environmental, privacy and anti-corruption and anti-bribery laws and regulations to which the Company is subject, see Item 1A below.
Human Capital Management.
Overview
Tredegar employed approximately 2,4001,900 people at December 31, 20202023 located in the U.S., Brazil, and Asia.Asia, of which 75% are located in the U.S. Approximately 34%15% of the Company’s employees are represented by labor unions located in the U.S. and Brazil under various collective bargaining agreements with varying durations and expiration dates.dates, none of which expire before 2025. All of Tredegar’s Brazilian employees are represented by a national labor union. Generally, the total number of employees of Tredegar does not significantly fluctuate throughout the year. However, acquisition or divestiture activity, or changes in the level of business activity may impact employee levels.
Health and Safety
Tredegar has continuously exceeded the industry standards for safety in each of its respective manufacturing sectors. The Company uses various forms of employee safety metrics to assess the health and safety performance of its Aluminum Extrusions, PE Films and Flexible Packaging operations, including employee safety data which is available on the Company’s website at www.tredegar.com/about-tredegar/our-broader-commitments/committed-to-our-employees/.
Additionally, Aluminum Extrusions has on-site health clinics at its Carthage and Clearfield facilities. These clinics allow Aluminum Extrusions to invest in its people, provide more personal and more thorough healthcare to employees, and enhance the employer-employee relationship. Collectively, the Carthage and Clearfield clinics serve over 600 employees.
Talent and Development
The Company believes its employees are its most valuable asset and are critical to the success of the Company. The Company seeks to retain employees by offering competitive wages, benefits and training opportunities. To assess and monitor employee retention and engagement, the Company surveys employees and takes actions to address areas of employee concern. The annual employee engagement survey results are presented to Tredegar’s Board of Directors (“Board”). Additionally, the objectives of our executive compensation programs are to attract, motivate and retain highly qualified executive officers. To accomplish these objectives, the Company relies on a pay strategy that emphasizes performance-based compensation through annual and long-term incentives. The Company believes that this pay strategy creates a strong link between pay and performance and aligns with our business strategy of generating strong operating results and shareholder value creation while controlling fixed costs.
The Company is committed to holistically supporting our employees both at work and in their communities by:
•Strictly following all applicable health, safety and non-discrimination laws in each country;
•Promoting the highest standards for employee health and safety through innovative programs; and
•Providing opportunities for community outreach and supporting programs that enhance the lives of children and families.
Inclusion and Diversity
Tredegar strictly complies with all applicable state, local and international laws governing nondiscrimination in employment in every location where Tredegar and its businesses have facilities to ensure healthy and positive working conditions. This applies to all terms and conditions of employment, including recruiting, hiring, job assignments, promotion, termination, layoff, recall, transfer, leaves of absence, compensation and training. All applicants and employees are treated with the same high level of respect regardless of their race, creed, color, religion, sex, sexual orientation, gender identity, age, pregnancy, national origin, ethnicity, political affiliation, union membership, marital status, citizenship status, veteran status, disability or other protected category. Employees who experience or witness discriminatory behavior are encouraged to report such behavior to their supervisor, Human Resources or Tredegar’s toll-free anonymous reporting hotline. Additionally, the Company spends significant resources in developing its employees. Among the five core principles of the “The Tredegar Way” that the Company uses to guide its organization, the “Leadership” principle is focused on building a team of motivated and engaged leaders at every level of the Company. Each business unit has identified specific action plans to promote the Leadership
principle among its employees. Action plans include talent development, skills training, reinforcement of strong cultural values, and robust systems to ensure a safe working environment.
The Company seeks to retain employees by offering competitive wages, benefits and training opportunities. To assess and monitor employee retention and engagement, the Company surveys employees and takes actions to address areas of employee concern. The annual employee engagement survey results are presented to Tredegar’s Board of Directors (“Board”). Additionally, the objectives of our executive compensation programs are to attract, motivate and retain highly qualified executive officers. To accomplish these objectives, we rely on a pay strategy that emphasizes performance-based compensation through annual and long-term incentives. We believe that this pay strategy creates a strong link between pay and performance and aligns with our business strategy of generating strong operating results and shareholder value creation while controlling fixed costs.
We are committed to holistically supporting our employees both at work and in their communities by:
•Strictly following all applicable health, safety and non-discrimination laws in each country;
•Promoting the highest standards for employee health and safety through innovative programs; and
•Providing opportunities for community outreach and supporting programs that enhance the lives of children and families.
The Company uses various forms of employee safety metrics to assess the health and safety performance of its Aluminum Extrusions, PE Films and Flexible Packaging operations, including employee safety data which is available on its website at https://tredegar.com/about-tredegar/committed-to-our-employees. Tredegar has also instituted additional safety precautions during the ongoing COVID-19 pandemic as described in "The Impact of COVID-19" included in Item 7. "Management’s Discussion and Analysis of Financial Condition and Results of Operations" of this Form 10-K (“Item 7”).
Information About Our Executive Officers. See Item 10. “Directors, Executive Officers and Corporate Governance” of this Form 10-K.
Available Information and Corporate Governance Documents. Tredegar’s website address is www.tredegar.com. The Company makes available, through its website, its annual report on Form 10-K, quarterly reports on Form 10-Q, current reports on Form 8-K and amendments to those reports filed or furnished pursuant to Section 13(a) or 15(d) of the Securities Exchange Act of 1934, as amended (the “Exchange Act”), as soon as reasonably practicable after such documents are electronically filed with, or furnished to, the Securities and Exchange Commission (“SEC”). Information filed electronically with the SEC can be accessed on its website at www.sec.gov. In addition, the Company’s Corporate Governance Guidelines, Code of Conduct, the
charters of the Audit, Executive Compensation, and Nominating and Governance Committees and Climate Change Risk Assessment and many other corporate policies are available on Tredegar’s website and are available in print to any shareholder upon request by contacting Tredegar’s Corporate Secretary at 1100 Boulders Parkway, Richmond, Virginia 23225. The information on or that can be accessed through the Company’s website is not, and shall not be deemed to be, a part of this Annual Report on Form 10-K for the year ended December 31, 2020 (“Form 10-K”) or incorporated into other filings it makes with the SEC.
Forward-looking and Cautionary Statements
Some of the information contained in this Form 10-K may constitute “forward-looking statements” within the meaning of the “safe harbor” provisions of the Private Securities Litigation Reform Act of 1995. When the Company uses the words “believe,” “estimate,” “anticipate,” “appear to,” “expect,” “project,” “plan,” “likely,” “may” and similar expressions, it does so to identify forward-looking statements. Such statements are based on the Company's then current expectations and are subject to a number of risks and uncertainties that could cause actual results to differ materially from those addressed in the forward-looking statements. It is possible that the Company's actual results and financial condition may differ, possibly materially, from the anticipated results and financial condition indicated in or implied by these forward-looking statements. Accordingly, you should not place undue reliance on these forward-looking statements. For risks and important factors that could cause actual results to differ from expectations, refer to the reports that Tredegar files with or furnishes the SEC from time-to-time, including the risks and important factors set forth in Item 1A. Readers are urged to review and consider carefully the disclosures Tredegar makes in the reports Tredegar files with or furnishes to the SEC. Tredegar does not undertake, and expressly disclaims any duty, to update any forward-looking statement to reflect any change in management’s expectations or any change in conditions, assumptions or circumstances on which such statements are based, except as required by applicable law.
Item 1A. RISK FACTORS
There are a number of risks and uncertainties that could have a material adverse effect on the Company’s businesses and its consolidated financial condition, results of operations or cash flows. The following risk factors should be considered, in addition to the other information included in this Form 10-K, when evaluating Tredegar and its businesses.
Risks Related to Tredegar’s Corporate Strategic Initiatives and Indebtedness
•The planned divestiture of Terphane to Oben Group is subject to a number of conditions beyond our control. On September 1, 2023, the Company announced that it had entered into a definitive agreement to sell Terphane to Oben Group. Completion of the sale is contingent upon the satisfaction of customary closing conditions, including the receipt of certain competition filing approvals by authorities in Brazil and Colombia. On October 27, 2023, the Company filed the requisite competition forms with the Administrative Council for Economic Defense (“CADE”) in Brazil, which the Company views as the primary competition authority regarding this matter. This filing followed a pre-filing phase for CADE’s initial review. CADE’s maximum deadline for completing its review is no later than November 18, 2024. The merger review regarding the transaction was cleared by the Colombian authority in early February 2024.
As usual, it cannot be predicted with certainty whether all of the required closing conditions will be satisfied, waived or if other uncertainties may arise. While the regulatory review process is ongoing and in line with the Company’s expectations, regulators could impose additional requirements or obligations as conditions for their approval, which may be burdensome. If such closing conditions are not met or additional obligations are imposed, the proposed sale may not be consummated, encounter delays, or experience other issues that are not currently anticipated.
•The Company’s failure to successfully transition to the reporting requirements for its asset-based revolving credit facility (“ABL Facility”), which matures on June 30, 2026, or an unexpected downturn in the markets could adversely impact the Company’s financial position and results of operations. On December 27, 2023, the Company entered into the ABL Facility, which provides the Company with $180 million senior secured asset-based revolving credit facility that will expire on June 30, 2026. The ABL Facility amended the Company’s existing $200 million revolving, secured credit facility that was cash flow-based. Availability under the ABL Facility is governed by a borrowing base, determined by the application of specified advance rates against eligible assets, including a portion of trade accounts receivable, inventory, cash and cash equivalents, owned real properties, and owned machinery and equipment.
A number of factors could affect the Company’s ability to successfully complete its transition from its prior cash flow-based revolving credit facility to the current asset-based facility. These factors include:
•Failure to establish processes associated with the ABL Facility’s reporting requirements, which are currently on a monthly basis but could change to a weekly cadence if at any time the borrowing availability falls below 10% of the maximum aggregate principal amount. Failure to timely report could result in an Event of Default (as defined in the ABL Facility), which if not waived, would permit the lenders, at their option, to accelerate all outstanding debt under the ABL Facility. Should the lenders elect to accelerate the debt under the ABL Facility,
a cross-default would be triggered under the Terphane Brazil Loan (as defined below in Item 7. “Management’s Discussion and Analysis of Financial Condition and Results of Operations” of this Form 10-K (“Item 7”)).
•Because the Company is currently subject to a Cash Dominion Period (as defined in Item 7), it is required to borrow cash to fund working capital, capital expenditures, business development activity, and other general corporate purposes, which limits its financial flexibility;
•Advances on accounts receivable and inventory are subject to change based on periodic commercial finance examinations and appraisals, and the real property, machinery and equipment values included in the borrowing base are subject to change based on periodic appraisals, which could reduce borrowing availability under the ABL Facility; and
•If a Material Adverse Effect (as defined in the ABL Facility) has occurred, the Company will not be able to continue to borrow under the ABL Facility.
In addition, a significant deterioration in the Company’s accounts receivable or inventory levels due to depressed economic conditions, weak consumer spending, turmoil in the credit markets or other factors, could restrict its ability to service its indebtedness or borrow additional funds.
Upon the earlier of March 31, 2025 or the date the Company receives the proceeds from the Contingent Terphane Sale (the “ABL Adjustment Date”), borrowing availability under the ABL Facility will be reduced from $180 million to $125 million. If the Contingent Terphane Sale is not completed by the ABL Adjustment Date, the Company may have to undertake alternative financing plans, subject to the limitations imposed by the ABL Facility, including limitations on its ability to:
•refinance or restructure its indebtedness;
•sell assets; and
•raise additional capital.
The Company may be unable to implement alternative financing plans on commercially reasonable terms or at all, and any such alternative financing plans might be insufficient to allow it to make principal and interest payments on its indebtedness required as a result of the ABL Adjustment Date and the reduction of borrowing availability under the ABL Facility to $125 million. The Company’s ability to restructure or refinance its indebtedness will depend on, among other things, its existing financial condition, projections of business conditions, sales, Credit EBITDA, net cash flow, net leverage and the condition of the capital markets at such time. Any refinancing of the Company’s indebtedness could be at higher interest rates and could require it to comply with additional covenants, which could further restrict the Company’s business operations.
Noncompliance with any of the covenants of the ABL Facility could result int an Event of Default, which if not cured or waived, would permit the lenders, at their option, to accelerate all outstanding debt under the ABL Facility.
Risks Related to All Tredegar’s Businesses
•Recent macroeconomic factors, including inflation, high interest rates, recession risks and other lagging effects of the COVID-19 pandemic, have caused downturns in key markets and created other commercial disruptions, which have and could further adversely impact our businesses.Products sold to key end-use markets, including the B&C and consumer electronics markets, represent a significant portion of our revenue. Because these markets are tied closely to overall economic performance, macroeconomic factors have and could further cause changes to demand for our products. These factors include: (i) inflation; (ii) high interest rates; (iii) recession risks; (iv) disruptions to supply chains; (v) other interruptions of international and regional commerce; and (vi) other lagging effects of the COVID-19 pandemic. Price erosion may occur as competitors become more aggressive in pricing practices. To the extent that these factors reduce demand for our products, our business, financial position, results of operations and cash flows could be adversely impacted.
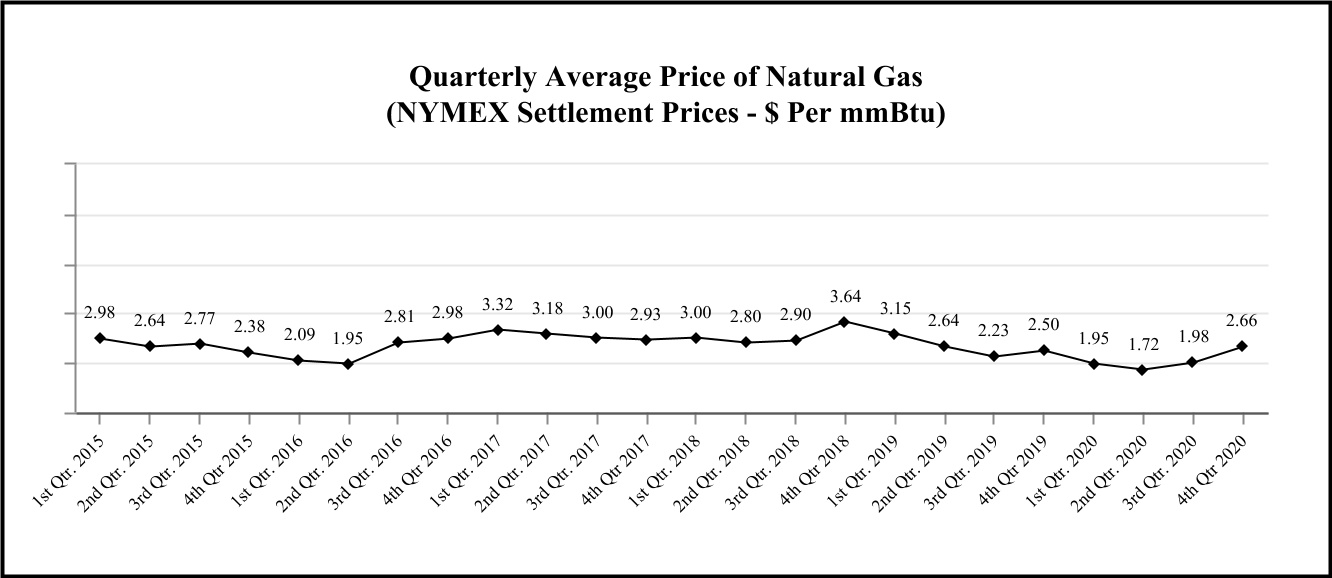
•Tredegar’s performance is influenced by costs incurred by its operating companies, including the cost of raw materials and energy. These costs include the cost of aluminum (the raw material on which Aluminum Extrusions primarily depends), resin (the raw material on which PE Films primarily depends), PTA and MEG (the raw materials on which Flexible Packaging Films primarily depends), natural gas (the principal fuel necessary for Aluminum Extrusions’ plants to operate), electricity, diesel fuel and paint. Aluminum, resin and natural gas prices are volatile as shown in the charts in Item 7A. The Company attempts to mitigate the effects of increased costs through price increases and contractual pass-through provisions, but there are no assurances that higher prices can effectively be passed through to customers or that Tredegar will be able to offset fully or on a timely basis the effects of higher costs. Further, the Company’s cost control efforts may not be sufficient to offset any increases in raw materials, energy or other costs.
•Our failure to continue to attract, develop and retain certain key officers or employees could adversely affect our businesses. Our success depends upon the efforts and abilities of key personnel, many of whom are longstanding employees. The loss of any of these key personnel could deplete our institutional knowledge base and negatively affect our ability to efficiently operate our businesses. Certain roles have experienced high turnover in recent years, and we are experiencing an increasingly competitive labor market. Increased employee turnover could hinder our ability to execute our business strategy and adversely affect our business, financial condition, results of operations and cash flows.
•Disruptions at one of the Company’s major manufacturing facilities could negatively impact financial results. Tredegar believes it has implemented measures to minimize the risks of disruption at its facilities. However, a disruption could occur as a result of any number of events: an equipment failure with repairs requiring long lead times, labor stoppages or shortages, cybersecurity attacks, utility disruptions, constraints on the supply or delivery of critical raw materials, and severe weather conditions, including potential flooding at the Aluminum Extrusions facility located in Carthage, TN, which is located in a 50-year flood plain. A material disruption in one of the Company’s operating locations could negatively impact production and the Company’s consolidated financial condition, results of operations and cash flows.
Risks Related to Aluminum Extrusions
•Sales volume and profitability of Aluminum Extrusions is cyclical and seasonal and highly dependent on economic conditions of end-use markets in the U.S., particularly in the construction sector. Aluminum Extrusions’ end-use markets can be cyclical and subject to seasonal swings in volume, and have been adversely impacted duringvolume. In addition, changes in architectural design, demographic, and/or remote work trends could negatively impact the coronavirus pandemic (“COVID-19”).overall commercial construction industry. Because of the capital intensivecapital-intensive nature and level of fixed costs inherent in the aluminum extrusions business, the percentage drop in earnings before interest, taxes, depreciation and amortization (“EBITDA”) from ongiongongoing operations in a cyclical downturn will likely exceed the percentage drop in volume. In addition, during an economic slowdown, excess industry capacity often drives increased pricing pressure in many end-use markets as competitors seek to protect their position with key customers. Any benefits associated with cost reductions and productivity improvements may not be sufficient to offset the adverse effects on profitability from pricing and margin pressure and higher bad debts (including a greater chance of loss associated with customers defaulting on fixed-price forward sales contracts) that usually accompany a downturn. In addition, higher energy costs can reduce profits unless offset by price increases or cost reductions and productivity improvements.
•Failure to prevent competitors from evading anti-dumping and countervailing duties, or a reduction in such duties, could adversely impact Aluminum Extrusions. Effective April 25, 2017, the anti-dumping duty and countervailing duty orders onUnfairly traded imports of aluminum extrusions were extended for a period of five years. The orders will be reviewed again beginning in
March 2022. Chinese and other overseas manufacturers continue to try to evade the anti-dumping and countervailing orders to avoid duties. A failure by,could injure or the inability of, U.S. trade officials to curtail the evasion of these duties, or the potential reduction of applicable duties pursuant to annual administrative reviews of the orders by the Department of Commerce,threaten with injury America’s domestic aluminum extrusions industry, which could have a materialan adverse effect on the financial condition, results of operations and cash flows of Aluminum Extrusions.
•1.Failure to prevent foreign competitors from evading anti-dumping and countervailing duties, or failure to reinstate the Aluminum Tariff on aluminum extrusions, could adversely impact Aluminum Extrusions. In 2018, the U.S. imposed tariffs of 10% on aluminum ingot and semi-finished aluminum imported into the U.S. from certain countries; however, in December 2020, the Department of Commerce (“DOC”) introduced a tariff exclusion process, granting applicants with tariff exclusions. In response to large and increasing volumes of unfairly traded imports of extrusions associated with these tariff exclusions, a coalition of U.S. domestic producers filed petitions with the DOC and U.S. International Trade Commission (“ITC”). In November 2023, the ITC found that there is a reasonable indication that the American aluminum extrusions industry is materially injured or threatened with injury due to imports from 14 countries, including China. The ITC’s preliminary determination found that subject import volumes were significant and increasing, and that with regard to pricing, subject imports predominantly undersold the domestic product by volume in each year of the period of investigation. On March 5, 2024, the DOC announced its preliminary finding that the governments of China, Indonesia, Mexico and Turkey unfairly subsidize their aluminum extrusion industries. The DOC calculated a range of affirmative preliminary countervailing duties from each country. A preliminary anti-dumping determination for these four countries and the 10 other countries included in the initial petition is expected in May 2024. The Company expects the final ITC vote to occur in late 2024. A failure by, or the inability of, U.S. trade officials to restore the import tariff in its full format could have an adverse effect on the businesses, financial condition, results of operations and cash flows of Aluminum Extrusions.
2.The duty-free importation of goods allowed under the United States-Mexico-Canada Agreement (“USMCA”), or other free trade agreements or duty-preference regimes, could result in lower demand for aluminum extrusions made in the U.S., which could materially and negatively affect Bonnell Aluminum’s business and results of operations. InAs noted above, in March 2018, the U.S. imposed tariffs of 10% on aluminum ingot and semi-finished aluminum imported ininto the U.S. from certain countries, including countries from which Bonnell Aluminum Extrusions has historically sourced aluminum products. In September 2019, the U.S., Canada and Mexico entered into the USMCA. As a result of the 10% tariffs on aluminum ingot imported to the U.S. and the duty-free importation of goods allowed under USMCA, aluminum extrusions made in Canada and Mexico that are able to take advantage of duty-preference programs upon importation into the United States are free of the
10% tariff and can now be imported into and sold in the U.S. at very competitive prices. This could result in lower demand for aluminum extrusions made in the U.S., which could materially and negatively affect Bonnell Aluminum’s business and results of operations.
•Competition from China could increase significantly if China is granted market economy status by the World Trade Organization. China launched a formal complaint to the World Trade Organization (“WTO”) challenging its non-market economy status, claiming that as of December 11, 2016, China’s transition period as a non-market economy under its Accession Protocol to the WTO ended. China believes with respect to all Chinese-made products that it should receive market economy status and the rights attendant to that status under WTO rules. The U.S. and the European Union have each rejected that interpretation. If China is granted market economy status by the WTO, the extent to which the U.S. anti-dumping laws will be able to limit unfair trade practices from China will likely be limited because the U.S. government will be forced to utilize Chinese prices and costs that do not reflect market principles in anti-dumping duty investigations involving China, which could ultimately limit the level of anti-dumping duties applied to unfairly traded Chinese imports. The volume of unfairly traded imports of Chinese aluminum extrusions could increase as a result and this, in turn, would likely create substantial pricing pressure on Aluminum Extrusions’ products and could have a material adverse effect on the financial condition,business, results of operations, financial condition and cash flows of Aluminum Extrusions. In June 2019, at China’s request, after certain preliminary rulings in the case went against the Chinese position, the WTO indefinitely suspended the proceedings on the Chinese WTO complaint.flows.
•The markets for Aluminum Extrusions’ products are highly competitive with product quality, service, delivery performance and price being the principal competitive factors. Aluminum Extrusions has approximately 1,4501,100 customers that are in a variety of end-use markets within the broad categories of building and construction, distribution, automotive and other transportation, machinery and equipment, electrical and consumer durables. No single Aluminum Extrusions’ customer exceeds 4% of consolidated net sales. Future success and prospects depend on Aluminum Extrusions’ ability to provide superior service, high quality products, timely delivery and competitive pricing to retain existing customers and participate in overall industry cross-cycle growth. Failure in any of these areas could lead to a loss of customers, which could have an adverse material effect on the business, financial condition, results of operations and cash flows of Aluminum Extrusions.
•The failure to successfully implement the new enterprise resource planning and manufacturing execution systems could adversely impact the Aluminum Extrusions business and results of operations. InJanuary 2022, Aluminum Extrusions commenced the implementation of new enterprise resource planning and manufacturing execution systems (“ERP/MES”) across all locations of the Aluminum Extrusions business. The implementation of these systems is a major undertaking from a financial, management, and personnel perspective. The implementations have been more difficult, time consuming and costly (approximately $21 million of spending to date) than expected. This project, which was expected to be completed in 2024, has been reorganized with an extended implementation period, due to the implementation of stringent spending measures to control financial leverage. As a result, the earliest “go-live” date for the new ERP/MES is 2025. There can be no assurance that these systems will be beneficial to the extent anticipated. Any additional disruptions, delays or deficiencies in the design and implementation of the new systems could adversely affect our financial position, results of operations and cash flows.
Risks Related to PE Films
•PE Films is highly dependent on sales associated with relatively few large customers. PE Films’ top four customers comprised approximately 16%10%, 14%10% and 13% of Tredegar’s consolidated net sales in 2020, 20192023, 2022 and 2018,2021, respectively. The loss or significant reduction of sales associated with one or more of these customers without replacement by new business could have a materialan adverse effect on the Company.
Additionally, PE Films anticipates that a portion Surface Protection sales have been adversely impacted by weak market demand and competitive pricing. Customer demand for electronics has continued to deteriorate since the third quarter of its film products used2022, causing manufacturers in surface protection applications could be made obsolete by possible future customer product transitionsthe supply chain to less costly alternative processes or materials. These transitions principally relate to one customer. The Company believes that previously reported delays in this customer's transitions were recently resolved by the customerexperience reduced capacity utilization and muchinventory corrections. Consequently, results of the remaining transitions could occur by the end of 2021. Under this scenario, the Company estimates that the contribution to EBITDA from ongoing operations for PE Films could decline due to the remaining customer product transitionshave been adversely impacted by $18 million in 2021 versus 2020 and $4 million in 2022 versus 2021. To offset the expected adverse impact, the Company is aggressively pursuing and making progress in generating contribution from sales from new surface protection products, applications and customers and implementing cost savings measures. Annual contribution to EBITDA from ongoing operationsweak demand for PE Films on surface protection products unrelated to the customer product transitions has increased since 2018 by approximately $12 million.Surface Protection products.
While PE Films is undertaking efforts to expand its customer base, there can be no assurance that such efforts will be successful, or that they will offset any loss of sales and profits associated with customer transitions and other large customer declines.
•FailureThe failure of PE Films’ customers who are subject to cyclical downturns, to achieve success or maintain market share could adversely impact PE Films’ sales and operating margins. PE Films’ plastic films are used in the production of various consumer products sold worldwide. A customer’sOur customers’ ability to successfully develop, manufacture and market those products is integral to PE Films’ success. Cyclical downturns and changing consumer preferences, particularly those driven by changes in technology, may negatively affect businesses that use PE Films’ plastic film products, which could adversely affect sales and operating margins. Other factors that could adversely affect the business include (i) failure by a key customer to achieve success or maintain share in markets in which they sell products containing PE Films’ materials, including as a result of customer preferences for products other than plastics, (ii) key customers using products developed by others that replace PE Films’ business with such customers, (iii) delays in a key customer rolling out products utilizing new technologies developed by PE Films, and (iv) operational decisions by a key customer that result in component substitution, inventory reductions and similar changes.
•The Company’s inability to protect its intellectual property rights or its infringement of the intellectual property rights of others could have a materialan adverse impact on PE Films. The continued success of the PE Films’ business depends on its ability not only to protect its own technologies and trade secrets, but also to develop and sell new products that do not infringe upon existing patents. Intellectual property litigation is very costly and could result in substantial expense and diversions of Company resources, both of which could adversely affect its consolidated financial condition, results of operations and cash flows. In addition, there may be no effective legal recourse against infringement of the Company’s intellectual property by third parties, whether due to limitations on enforcement of rights in foreign jurisdictions or as a result of other factors.
•Disruptions to PE Films’ supply chain could have a material adverse impact on PE Films. Certain raw materials used in manufacturing PE Films’ products are sourced from single suppliers, and PE Films may not be able to quickly or inexpensively re-source from other suppliers. The risk of damage or disruption to its supply chain may increase if and when different suppliers consolidate their product portfolios, experience financial distress or disruption of manufacturing operations (such as, for example, the impact of hurricanes on petrochemical production). Failure to take adequate steps to effectively manage such events, which are intensified when a product is procured from a single supplier or location, could adversely affect PE Films’ consolidated financial condition, results of operations and cash flows, and also require additional resources to restore its supply chain.
•Rising trade tensions could cause an increase in the cost of PE Films’ products or otherwise negatively impact the Company. A portion of PE Film’s business involves imports to and from the U.S. and other countries where the
Company produces and sells its products. Trade tensions have been rising between the U.S. and other countries, particularly China. An increase in tariffs and other trade barriers between the U.S. and China, or between the U.S. and other countries, could cause an increase in the cost of PE Films’ products or otherwise negatively impact the production and sale of the Company’s products in world markets.
•Further impairment of the Surface Protection reporting unit’s goodwill could have a non-cash adverse impact on our results of operations. The Company assesses goodwill for impairment when events or circumstances indicate that the carrying value may not be recoverable, or, at a minimum, on an annual basis (December 1st of each year). The valuation of goodwill depends on a variety of factors, including macroeconomic conditions, industry and market considerations, cost factors and overall financial performance, as well as Company and reporting unit factors, and goodwill impairment valuations can be sensitive to assumptions associated with such factors. Failure to successfully achieve projections could result in future impairments.
Risks Related to Flexible Packaging Films
•Overcapacity in Latin American polyester film production and governmental failure to extend anti-dumping duties in Brazil on imported products or prevent competitors from circumventing such duties could adversely impact Flexible Packaging Films. In recent years, excess global capacity in the industry has led to increased competitive pressures from imports into Brazil. The Company believes that these conditions have shifted the competitive environment from a regional to a global landscape and have driven price convergence and lower product margins for Flexible Packaging Films. Favorable anti-dumping rulings or countervailing duties are in effect for products imported from China, Egypt, India, Mexico, United Arab Emirates, Peru and Bahrain. Competitors not currently subject to anti-dumping duties may choose to utilize their excess capacity by selling product in Brazil, which may result in pricing pressures that Flexible Packaging Films may not be able to offset with cost savings measures and/or manufacturing efficiency initiatives.
In May 2021, the Brazilian authorities concluded the sunset review relating to the anti-dumping process for polyester film imported from China, India and Egypt, and decided to extend duties for another five years. However, due to its doubts that films would continue to be imported from China and Egypt, the government immediately suspended the implementation of the tariffs for those countries but agreed that if in the future there were volumes imported from China or Egypt which were harming the Brazilian market, authorities may promptly reinstate tariffs. Importing from Egypt increased in Brazil during 2023; therefore, Terphane requested the application of anti-dumping tariffs for Egypt, which was accepted by the Brazilian Government. These tariffs went into effect starting in November 2023. For films imported from India, the Brazilian authorities also reviewed measures against countervailing duties and extended those for five years as well.
In February 2024, the Brazilian Government determined that the anti-dumping measures against Mexico and United Arab Emirates should be extended for a five-year period and anti-dumping measures against Turkey should be removed.
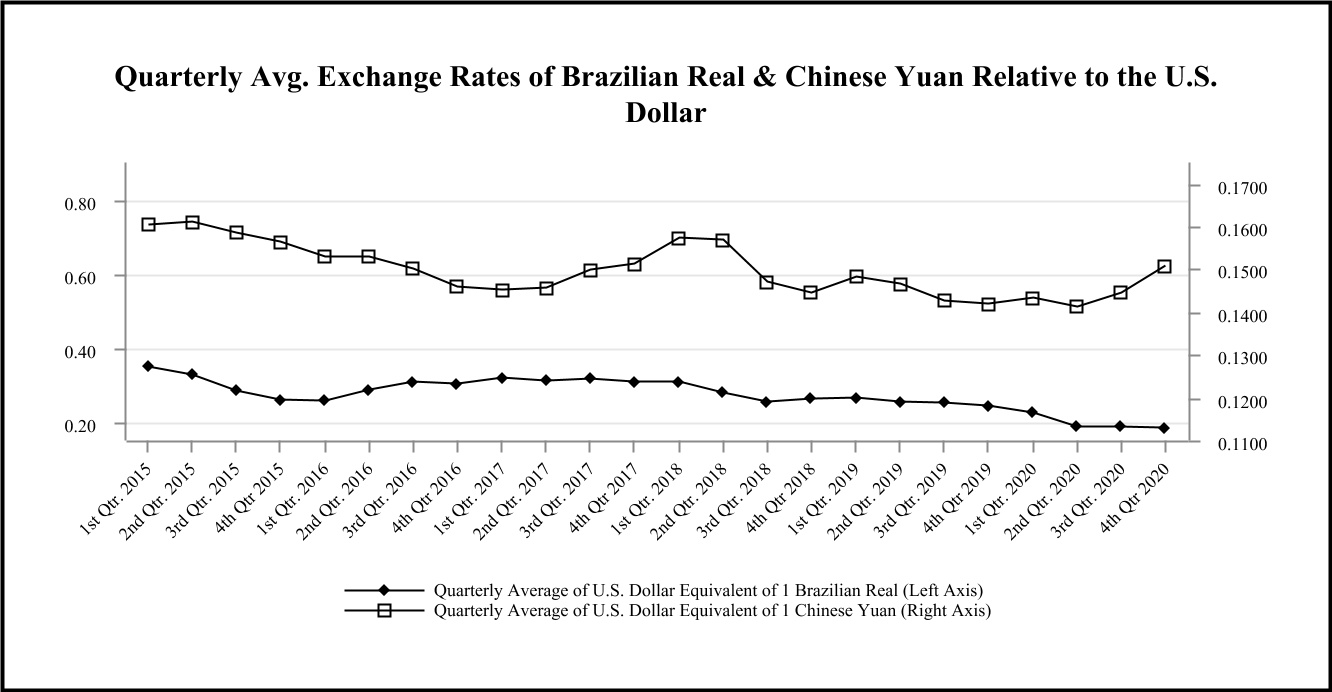
•A history of uncertain economic conditions in Brazil could adversely impact the financial condition, results of operations and cash flows of Flexible Packaging Films. For flexible packaging films produced in Brazil, selling prices and key raw material costs are principally determined in U.S. Dollars and are impacted by local economic conditions and local and global competitive dynamics. Flexible Packaging Films is exposed to foreign exchange translation risk (its functional currency is the Brazilian Real) because almost 90% of the sales of Flexible Packaging Films business unit in Brazil (“Terphane Ltda.”) and substantially all of its related raw material costs are quoted or priced in U.S. Dollars while its variable conversion, fixed conversion and sales, general and administrative costs before depreciation & amortization (collectively “Terphane Ltda. Operating Costs”) are quoted or priced in Brazilian Real. This mismatch, together with a variety of economic variables impacting currency exchange rates, causes volatility that could negatively or positively impact EBITDA from ongoing operations for Flexible Packaging Films. While Flexible Packaging Films hedges this exposure on a short-term basis with foreign exchange forward rate contracts, the exposure continues to exist beyond the hedging periods.
Other Business Risks
•GovernmentalA failure to extend anti-dumping duties in Brazil on imported products or prevent competitors from circumventing such duties could adversely impact Flexible Packaging Films. In recent years, excess global capacity in the industry has led to increased competitive pressures from imports into Brazil. Company’s information technology systems as a result of cybersecurity attacks or other causes could negatively affect Tredegar’s business. The Company believes that these conditions have shifteddepends on information technology (“IT”) to record and process customer orders, manufacture and ship products in a timely manner, secure its production processes and know-how, maintain the competitive environmentfinancial accuracy of its business records and maintain personally identifiable information of its employees. An IT system failure due to computer viruses, internal or external security breaches, cybersecurity attacks or other malicious causes could disrupt our operations and prevent us from a regional to a global landscape and have driven price convergence and lower product margins for Flexible Packaging Films. Favorable anti-dumping rulings or countervailing duties are in effect for products imported from China, Egypt, India, Mexico, United Arab Emirates, Turkey, Peru and Bahrain. Competitors not currently subject to anti-dumping duties may choose to utilize their excess capacity by selling product in Brazil, which may result in pricing pressures that Flexible Packaging Films may not bebeing able to offsetprocess transactions with cost savings measures and/our customers, operate our manufacturing facilities and properly report transactions in a timely manner. Increased global IT security threats and cyber-crime pose a potential risk to the security and availability of the Company’s IT systems, networks and services, including those that are managed, hosted, provided or manufacturing efficiency initiatives. Brazilian authorities initiated an investigation for sunset review on anti-dumping rulings against China, Indiaused by third parties, as well as to the confidentiality, availability and Egyptintegrity of the Company’s data. Additionally, increased cybersecurity risk arises due to certain employees working remotely. To date, interruptions of the Company’s IT systems have been infrequent, and extended duties that would have expired in 2020 forTredegar
one year. There can be no assurance that effortshas not experienced a material cybersecurity incident. A significant prolonged failure of or security breach of the IT systems, networks or service providers the Company relies upon, or a loss or disclosure of business or other sensitive information, or personally identifiable information, as a result of a cybersecurity incident or other cause, could result in substantial costs to extend anti-dumping duties beyond 2021 on products imported from China, India, Egyptthe Company, damage to the Company’s reputation, regulatory enforcement actions and other countries will be successful.
Risks Related to all Tredegar Businesseslawsuits and could adversely affect the Company’s business, results of operations, financial condition or cash flows.
•The Company has identified material weaknesses in its internal control overCompany’s results of operations, financial reporting. The Company’s failure to establishcondition and maintain effective internal control over financial reportingcash flows have been and to maintain effective disclosure controls and procedures increasescould be impacted by the riskmacroeconomic effects of a material misstatement in its consolidated financial statements,pandemic.The COVID-19 pandemic had multiple adverse effects on the global economy, including short-term impacts affecting labor supply and its failurecausing supply chain disruptions which led to meet its reporting and financial obligations, could, in turn, have a negative impact on its financial condition. Maintaining effective internal control over financial reporting is an integral part of producing reliable financial statements. As discussed in Item 9A. “Controls and Procedures” of this Form 10-K (“Item 9A”), the Company’s management concluded that the Company’s internal control over financial reporting was not effective for the periods referred to therein as a result of certain deficiencies that were determined to constitute material weaknesses in the Company’s internal control over financial reporting.
Under standards established by the Public Company Accounting Oversight Board, a material weakness is defined as a deficiency, or a combination of deficiencies, in internal control over financial reporting such that there is a reasonable possibility that a material misstatement of the annual or interim financial statements will not be prevented or detected on a timely basis. Under the criteria set forth in Internal Control - Integrated Framework 2013 issued by the Committee of Sponsoring Organizations of the Treadway Commission, a material weakness in the design of monitoring controls indicates that the Company has not sufficiently developed and/or documented internal controls by which management can review and oversee the Company’s financial information to detect and correct material errors or that the personnel responsible for performing the review did not have the sufficient skill set or knowledge of the subject matter to perform a proper assessment.
As discussed in Item 9A to remediate the material weaknesses, the Company, with the assistance of its outside consultant, is in the process of implementing certain changes to its internal controls and reviewing the entire control environment to help ensure that there are no other material weaknesses. The Company believes that its remediation plan will be sufficient to remediate the identified material weaknesses and strengthen its internal control over financial reporting. The Company’s remediation efforts are ongoing, and it will continue its initiatives to implement and document policies and procedures. Remediation of the identified material weaknesses and strengthening the Company’s internal control environment have extended into 2021.inflationary pressures. In addition, the Company is monitoringpandemic resulted in certain after-shocks and structural shifts, which have adversely impacted Tredegar’s markets.
In the impactevent of COVID-19 on its remediation plan. Depending on the severitya future pandemic, Tredegar’s businesses, our suppliers, contractors and length of the pandemic, the remediation timelinethird-party logistic providers could be negatively impacted because of inefficiencies caused by COVID-related limitations on travel, meetings, on-site work and close collaboration and the related increase in time necessaryexperience conditions similar to complete remediation projects.
As the Company continues to evaluate and work to improve its internal control over financial reporting and disclosure controls and procedures, management may determine to take additional measures to address control deficiencies or modify the remediation plan. The Company cannot provide assurance, however, as to when it will remediate all such weaknesses, nor can it be certain of whether additional actions will be required or the costs of any such actions. Moreover, the Company cannot provide assurance that additional material weaknesses will not arise in the future.
While the material weaknesses discussed in Item 9A did not result in material misstatements of the Company’s financial statements as of and for the years ended December 31, 2020, 2019, 2018 and 2017 or in the intervening interim periods during those respective years, any failure to remediate the material weaknesses, or the development of new material weaknesses in its internal control over financial reporting, could result in material misstatements in the Company’s consolidated financial statements and cause it to fail to meet its reporting and financial obligations, which in turn could have a negative impact on its financial condition.
•Tredegar has an underfunded defined benefit (pension) plan. Tredegar sponsors a pension plan that covers certain hourly and salaried employees in the U.S. The plan was closed to new participants in 2007, and substantially frozen to benefit accruals for active participants in 2014. As of January 31, 2018, the plan no longer accrued benefits associated with crediting employees for service, thereby freezing all future benefits under the plan. As of December 31, 2020, the plan was underfunded under U.S. generally accepted accounting principles (“GAAP”) measures by $103.1 million. Tredegar expects that it will be requiredCOVID-19 pandemic, including facility closures, labor constraints, supply chain disruptions and other challenges. These challenges could impact our ability to make a cash contribution of approximately $11.7 millionmaintain sufficient inventory and to its underfunded pension plan in 2021, and may be required to make higher cash contributions in future periods depending on the level of interest rates and investment returns on plan assets.
•Noncompliance with any of the covenants in the Company’s $375 million revolving credit facility, as amended on December 1, 2020, which matures in June 2024, could result in all debt under the agreement outstanding at such time becoming due and limiting the Company’s borrowing capacity,accurately predict demand or lead times, which could haveinhibit our ability to service customer demand. Additionally, a material adverse effect on its consolidated financial condition and liquidity. The credit agreement governing Tredegar’s revolving credit facility contains restrictions and financial covenants that, if violated,future pandemic could restrict the Company’s operational and financial
flexibility. Failure to comply with these covenants could result in an event of default, which if not cured or waived, would result in all outstanding debt under the credit facility at such time becoming due, which could have a material adverse effect on the Company’s consolidated financial condition and liquidity.
•Tredegar’s performance is influenced by costs incurred by its operating companies, including, for example, the cost of raw materials and energy. These costs include the cost of aluminum (the raw material on which Aluminum Extrusions primarily depends), resin (the raw material on which PE Films primarily depends), PTA and MEG (the raw materials on which Flexible Packaging Films primarily depends), natural gas (the principal fuel necessary for Aluminum Extrusions’ plants to operate), electricity and diesel fuel. Aluminum, resin and natural gas prices are volatile as shown in the charts in Quantitative and Qualitative Disclosures in Item 7. The Company attempts to mitigate the effects of increased costs through price increases and contractual pass-through provisions, but there are no assurances that higher prices can effectively be passed through to customers or that Tredegar will be able to offset fully or on a timely basis the effects of higher raw material and energy costs through price increases or pass-through arrangements. Further, the Company’s cost control efforts may not be sufficient to offset any increases in raw material, energy orheighten other costs.risks described above.
•Tredegar is subject to current and future governmental regulation,regulations, including environmental laws and regulations, and could become exposed to material liabilities and costs associated with such regulation. The Company is subject to regulation by local, state, federal and foreign governmental authorities. New laws and regulations, or changes to existing laws, including those relating to environmental matters (including global climate change and plastic products), and privacy matters, could subject Tredegar to significant additional capital expenditures, operating expenses or other compliance costs. Moreover, future developments in federal, state, local and international laws and regulations, including environmental laws, are difficult to predict. Environmental laws and privacy restrictions have become and are expected to continue to become increasingly strict. As a result, Tredegar expects to be subject to new environmental and privacy laws and regulations. However, any such changes are uncertain and, therefore, it is not possible for the Company to predict with certainty the amount of additional capital expenditures or operating expenses that could be necessary for compliance with respect to any such changes. See Government Regulation in Item 1. “Business” of this Form 10-K for a further discussion of this risk factor.
We areThe Company is subject to the U.S. Foreign Corrupt Practices Act, Brazilian anti-corruption laws and similar anti-bribery laws in other jurisdictions, which generally prohibit companies and their intermediaries from making improper payments to foreign officials for the purpose of obtaining or retaining business. Although we have policies and procedures designed to facilitate compliance with these laws and regulations, our employees, contractors and agents may take actions in violation of our policies. Any such violation, even if prohibited by our policies, could adversely affect our business and/or our reputation.
•Material disruptions at one of the Company’s major manufacturing facilities could negatively impact financial results. Tredegar believes it has implemented measures to minimize the risks of disruption at its facilities. However, a disruption could occur as a result of any number of events: an equipment failure with repairs requiring long lead times, labor stoppages or shortages, cybersecurity attacks, utility disruptions, constraints on the supply or delivery of critical raw materials, and severe weather conditions. A material disruption in one of the Company’s operating locations could negatively impact production and the Company’s consolidated financial condition, results of operations and cash flows.
•An inability to renegotiate the Company’s collective bargaining agreements could adversely impact its consolidated financial condition, results of operations and cash flows. Approximately 34% of the Company’s employees are represented by labor unions located in the U.S. and Brazil under various collective bargaining agreements with varying durations and expiration dates. Tredegar may not be able to satisfactorily renegotiate collective bargaining agreements when they expire, which could result in strikes or work stoppages or higher labor costs. In addition, existing collective bargaining agreements may not prevent a strike or work stoppage at the Company’s facilities in the future. Any such work stoppages (or potential work stoppages) could negatively impact Tredegar’s ability to manufacture its products and adversely affect its consolidated financial condition, results of operations and cash flows. None of Tredegar’s collective bargaining agreements expire before the fourth quarter of 2021.
•Our business and operations, and the operations of our customers, suppliers and others we do business with, may be adversely affected by epidemics such as the recent COVID-19 pandemic, which could adversely affect our financial condition, results of operations and cash flows. We may face risks related to health epidemics or outbreaks of communicable diseases. The outbreak of such a communicable disease could result in a widespread health crisis that could adversely affect general commercial activity and the economies and financial markets of many countries. For example, COVID-19 has spread across the globe to every country in which the Company does business and is impacting worldwide economic activity. A public health epidemic, including COVID-19, poses the risk that we or our contractors, suppliers, customers and other business partners may be prevented or otherwise adversely affected in the conduct of business activities for an indefinite period of time, including due to shutdowns that may be requested or mandated by governmental authorities and by other government mandates or policy changes. We may also face staffing issues if our employees
become ill from an epidemic, are subject to epidemic-related “stay-at-home” orders, or absenteeism increases because of fear of epidemic-related health risks. An epidemic may also cause a significant reduction in demand for one or more of our products as a result of a drop in product-specific demand, because of an epidemic’s impact on the world economy generally, or for other reasons. Bonnell Aluminum is experiencing higher than normal absenteeism and hiring difficulties due to COVID-19 factors. As a result, it is having difficulty maintaining sufficient labor to meet desired shipping levels. As a result of an epidemic, we may be unable to meet our supply commitments or otherwise fulfill our customers’ needs due to disruptions in our manufacturing and supply arrangements, including as a result of constrained workforce capacity, interruption of raw material supplies, transportation disruptions or a loss or disruption of other key elements of our manufacturing and distribution capability. An epidemic may cause the failure of, or default in performance by, third parties we rely on to supply our manufacturing operations, to process, transport or purchase our products, to finance our operations, and to otherwise provide products and services to the Company in support of our business and operations. While it is not possible at this time to estimate the impact that any particular epidemic, including COVID-19, could have on the Company’s business, the extent of that impact would likely be affected by factors outside of our control such as the severity, duration and spread of such an epidemic, the measures taken by the governments of countries affected and the ability of our customers and consumers to access government programs providing liquidity and support during the crisis. The impact of an epidemic on our employees, our customers, our supply chains, demand for our products, our ability to supply customers, our operating costs and our other business activities, could adversely affect our financial condition, results of operations and cash flows. For more information on the effect of COVID-19 on our business and financial condition, refer to “The Impact of COVID-19” in Item 7.
•Tredegar’s valuation of its $7.5 million cost-basis investment in kaléo is volatile and uncertain. Tredegar uses the fair value method to account for its fully-diluted ownership interest of approximately 20% in kaleo, Inc. (“kaléo”), a privately held specialty pharmaceutical company. There is no active secondary market for buying or selling stock in kaléo. The Company’s fair value estimates can fluctuate materially between reporting periods primarily due to changes in kaléo’s projections, which rely on numerous assumptions, and changes in the valuation of guideline public companies as measured by their enterprise value-to-EBITDA multiples. The estimated fair value of the Company’s investment in kaléo may significantly decline due to pricing pressures and expected changes in market access as well as continued lower market demand for epinephrine delivery devices resulting from COVID-19-driven delays in in-person back-to-school schedules and social distancing guidelines. Additionally, the U.S. Department of Justice began an investigation of kaléo’s Evzio business in 2018, the impact of which on kaléo and on the value of the Company’s interest in kaléo cannot be estimated with certainty. During 2020, kaléo discontinued the marketing of its Evzio product.
•A failure in the Company’s information technology systems as a result of cybersecurity attacks or other causes could negatively affect Tredegar’s business. The Company depends on information technology (“IT”) to record and process customers’ orders, manufacture and ship products in a timely manner, secure its production processes and know-how, maintain the financial accuracy of its business records and maintain personally identified information of its employees. An IT system failure due to computer viruses, internal or external security breaches, cybersecurity attacks or other malicious causes could disrupt our operations and prevent us from being able to process transactions with our customers, operate our manufacturing facilities and properly report transactions in a timely manner. Increased global IT security threats and cyber-crime pose a potential risk to the security and availability of the Company’s IT systems, networks and services, including those that are managed, hosted, provided or used by third parties, as well as to the confidentiality, availability and integrity of the Company’s data. To date, interruptions of the Company’s IT systems have been infrequent and have not had a material impact on the Company’s operations. A significant protracted failure of or security breach of the IT systems, networks or service providers the Company relies upon, or a loss or disclosure of business or other sensitive information, or personally identified information, as a result of a cybersecurity incident or other cause, could result in substantial costs to the Company, damage to the Company’s reputation, regulatory enforcement actions and lawsuits and could adversely affect the Company’s results of operations, financial condition or cash flows.
Item 1B. UNRESOLVED STAFF COMMENTS
None.
Item 1C. CYBERSECURITY
Tredegar’s business model depends on the efficiency and reliability of its information systems, networks, and essential assets, with a portion of these systems and networks being administered by third-party service providers. Tredegar’s Cybersecurity Program (the “Program”), which was designed utilizing a risk-based approach, was developed to not only prevent, identify, investigate, resolve, and mitigate potential cybersecurity vulnerabilities within Tredegar but also to enhance the information security posture of Tredegar’s operations involving third-party service providers.
Tredegar entrusts the third-party service providers with the responsibility to institute security measure protocols that are appropriately and proportionally tailored to the corresponding risks. Additionally, Tredegar also periodically conducts assessments of the third-party service providers’ security frameworks to verify the implementation of adequate security measures, to safeguard Tredegar against potential vulnerabilities.
The Program leverages a blend of automated systems, manual operations, and external evaluations to proactively identify and mitigate potential cybersecurity threats. Key components of the program include Tredegar’s Cybersecurity Incident Response Plan and Cyber Crisis Management Plan. These plans encompass a strategic approach that includes detection of threats, thorough analysis of cybersecurity incidents to determine whether timely notification to the Board of Directors is necessary, containment of incidents, eradication or mitigation of threats, recovery processes, and a comprehensive post-incident review.
To further strengthen its cybersecurity posture, Tredegar employs third-party consultants who work with the internal audit and information technology (“IT”) departments to assess Tredegar’s information security program and practices, including incident management, service continuity, and information security compliance programs, and identify areas for improvement.
The results of such an assessment are regularly presented to the Audit Committee. Notably, these assessments include periodic penetration tests, which allow Tredegar to identify vulnerabilities, refine procedures, and enhance its crisis management and recovery capabilities. The Program is also supported by an organizational structure, involving collaboration across various business sectors and an interdisciplinary Global Data Protection and Cybersecurity Oversight Team that meets regularly to identify information security risks and appropriate risk mitigation strategies. Additionally, because Tredegar recognizes the significant role that its employees play in information security, it provides annual formal information security training to all of its employees that covers critical topics such as phishing and email security best practices.
Tredegar’s IT Director has over 10 years of cybersecurity expertise, including a robust history of similar roles, cybersecurity certifications from EC-Council and ODU Global and holds a degree in Computer Science from Universidade Catolica de Pernambuco and an MBA in IT Management from Universidade Federal de Pernambuco. Our IT Director is responsible for overseeing the Program, including the prevention, mitigation, detection, and remediation of cybersecurity incidents. Tredegar’s IT Director also regularly collaborates closely with key management, including the Chief Financial Officer, General Counsel, Compliance Manager, and Human Resources Executive Director, to foster effective communication within Tredegar.
The Board is responsible for risk management, with specific oversight of cybersecurity risks being delegated to the Audit Committee. The Audit Committee receives updates from the IT Director at each of its quarterly meetings. These updates encompass an assessment of Tredegar’s cybersecurity risk profile, including the efficacy of Tredegar’s cybersecurity policies, procedures, strategies, and areas of emerging risk. Additionally, the Board receives annual, but often more frequent, updates on Tredegar’s cybersecurity systems.
Item 2. PROPERTIES
General
Most of the improved real property and the other assets used in the Company’s operations are owned. Certain of the owned property is subject to an encumbrance under the Company’s credit agreement (seeABL Facility. See Note 117 “Debt and Credit Agreements” to the Consolidated Financial Statements in Item 15 for more information).information.
Tredegar considers the manufacturing facilities, warehouses and other properties and assets that it owns or leases to be in generally good condition. Capacity utilization at its various manufacturing facilities can vary with product mix and normal
fluctuations in sales levels. The Company believes that its Bonnell Aluminum, PE Films and Flexible Packaging Films manufacturing facilities have sufficient capacity to meet current production requirements. Tredegar’s corporate headquarters, which is leased, is located at 1100 Boulders Parkway, Richmond, Virginia 23225.
The Company’s principal manufacturing plants and facilities as of December 31, 20202023 are listed below:
Aluminum Extrusions
| | | | | | | | | | | | | | |
| Locations in the U.S. | | Locations Outside the U.S. | | Principal Operations |
Carthage, Tennessee
Clearfield, Utah (leased)
Elkhart, Indiana
Newnan, Georgia
Niles, Michigan | | None | | Production of aluminum extrusions, fabrication and finishing |
PE Films
| | | | | | | | | | | | | | |
| Locations in the U.S. | | Locations Outside the U.S. | | Principal Operations |
Pottsville, Pennsylvania Richmond, Virginia (technical center) (leased)
| | Guangzhou, China | | Production of plastic films |
Flexible Packaging Films
| | | | | | | | | | | | | | |
| Locations in the U.S. | | Locations Outside the U.S. | | Principal Operations |
| Bloomfield, New York (technical center and production facility) | | Cabo de Santo Agostinho, Brazil | | Production of PET-based films |
Item 3. LEGAL PROCEEDINGS
The information required by this Item 3 is set forth in Note 1816 "Contingencies" to the Consolidated Financial Statements in Item 15 and is hereby incorporated herein by reference.
Item 4. MINE SAFETY DISCLOSURES
None.
PART IIForward-looking and Cautionary Statements
Some of the information contained in this Form 10-K may constitute “forward-looking statements” within the meaning of the “safe harbor” provisions of the Private Securities Litigation Reform Act of 1995. When the Company uses the words “believe,” “estimate,” “anticipate,” “appear to,” “expect,” “project,” “plan,” “likely,” “may” and similar expressions, it does so to identify forward-looking statements. Such statements are based on the Company's then current expectations and are subject to a number of risks and uncertainties that could cause actual results to differ materially from those addressed in the forward-looking statements. It is possible that the Company's actual results and financial condition may differ, possibly materially, from the anticipated results and financial condition indicated in or implied by these forward-looking statements. Accordingly, you should not place undue reliance on these forward-looking statements. For risks and important factors that could cause actual results to differ from expectations, refer to the reports that Tredegar files with or furnishes the SEC from time-to-time, including the risks and important factors set forth in Item 1A. Readers are urged to review and consider carefully the disclosures Tredegar makes in the reports Tredegar files with or furnishes to the SEC. Tredegar does not undertake, and expressly disclaims any duty, to update any forward-looking statement to reflect any change in management’s expectations or any change in conditions, assumptions or circumstances on which such statements are based, except as required by applicable law.
Item 5.1A. MARKET FOR REGISTRANT’S COMMON EQUITY, RELATED STOCKHOLDER MATTERS AND ISSUER PURCHASES OF EQUITY SECURITIESRISK FACTORS
Tredegar’s common stock is tradedThere are a number of risks and uncertainties that could have a material adverse effect on the New York Stock ExchangeCompany’s businesses and its consolidated financial condition, results of operations or cash flows. The following risk factors should be considered, in addition to the other information included in this Form 10-K, when evaluating Tredegar and its businesses.
Risks Related to Tredegar’s Corporate Strategic Initiatives and Indebtedness
•The planned divestiture of Terphane to Oben Group is subject to a number of conditions beyond our control. On September 1, 2023, the Company announced that it had entered into a definitive agreement to sell Terphane to Oben Group. Completion of the sale is contingent upon the satisfaction of customary closing conditions, including the receipt of certain competition filing approvals by authorities in Brazil and Colombia. On October 27, 2023, the Company filed the requisite competition forms with the Administrative Council for Economic Defense (“NYSE”CADE”) in Brazil, which the Company views as the primary competition authority regarding this matter. This filing followed a pre-filing phase for CADE’s initial review. CADE’s maximum deadline for completing its review is no later than November 18, 2024. The merger review regarding the transaction was cleared by the Colombian authority in early February 2024.
As usual, it cannot be predicted with certainty whether all of the required closing conditions will be satisfied, waived or if other uncertainties may arise. While the regulatory review process is ongoing and in line with the Company’s expectations, regulators could impose additional requirements or obligations as conditions for their approval, which may be burdensome. If such closing conditions are not met or additional obligations are imposed, the proposed sale may not be consummated, encounter delays, or experience other issues that are not currently anticipated.
•The Company’s failure to successfully transition to the reporting requirements for its asset-based revolving credit facility (“ABL Facility”), which matures on June 30, 2026, or an unexpected downturn in the markets could adversely impact the Company’s financial position and results of operations. On December 27, 2023, the Company entered into the ABL Facility, which provides the Company with $180 million senior secured asset-based revolving credit facility that will expire on June 30, 2026. The ABL Facility amended the Company’s existing $200 million revolving, secured credit facility that was cash flow-based. Availability under the ticker symbol “TG”ABL Facility is governed by a borrowing base, determined by the application of specified advance rates against eligible assets, including a portion of trade accounts receivable, inventory, cash and cash equivalents, owned real properties, and owned machinery and equipment.
A number of factors could affect the Company’s ability to successfully complete its transition from its prior cash flow-based revolving credit facility to the current asset-based facility. These factors include:
•Failure to establish processes associated with the ABL Facility’s reporting requirements, which are currently on a monthly basis but could change to a weekly cadence if at any time the borrowing availability falls below 10% of the maximum aggregate principal amount. Failure to timely report could result in an Event of Default (as defined in the ABL Facility), which if not waived, would permit the lenders, at their option, to accelerate all outstanding debt under the ABL Facility. Should the lenders elect to accelerate the debt under the ABL Facility,
a cross-default would be triggered under the Terphane Brazil Loan (as defined below in Item 7. “Management’s Discussion and Analysis of Financial Condition and Results of Operations” of this Form 10-K (“Item 7”)).
•Because the Company is currently subject to a Cash Dominion Period (as defined in Item 7), it is required to borrow cash to fund working capital, capital expenditures, business development activity, and other general corporate purposes, which limits its financial flexibility;
•Advances on accounts receivable and inventory are subject to change based on periodic commercial finance examinations and appraisals, and the real property, machinery and equipment values included in the borrowing base are subject to change based on periodic appraisals, which could reduce borrowing availability under the ABL Facility; and
•If a Material Adverse Effect (as defined in the ABL Facility) has occurred, the Company will not be able to continue to borrow under the ABL Facility.
In addition, a significant deterioration in the Company’s accounts receivable or inventory levels due to depressed economic conditions, weak consumer spending, turmoil in the credit markets or other factors, could restrict its ability to service its indebtedness or borrow additional funds.
Upon the earlier of March 31, 2025 or the date the Company receives the proceeds from the Contingent Terphane Sale (the “ABL Adjustment Date”), borrowing availability under the ABL Facility will be reduced from $180 million to $125 million. If the Contingent Terphane Sale is not completed by the ABL Adjustment Date, the Company may have to undertake alternative financing plans, subject to the limitations imposed by the ABL Facility, including limitations on its ability to:
•refinance or restructure its indebtedness;
•sell assets; and
•raise additional capital.
The Company may be unable to implement alternative financing plans on commercially reasonable terms or at all, and any such alternative financing plans might be insufficient to allow it to make principal and interest payments on its indebtedness required as a result of the ABL Adjustment Date and the reduction of borrowing availability under the ABL Facility to $125 million. The Company’s ability to restructure or refinance its indebtedness will depend on, among other things, its existing financial condition, projections of business conditions, sales, Credit EBITDA, net cash flow, net leverage and the condition of the capital markets at such time. Any refinancing of the Company’s indebtedness could be at higher interest rates and could require it to comply with additional covenants, which could further restrict the Company’s business operations.
Noncompliance with any of the covenants of the ABL Facility could result int an Event of Default, which if not cured or waived, would permit the lenders, at their option, to accelerate all outstanding debt under the ABL Facility.
Risks Related to All Tredegar’s Businesses
•Recent macroeconomic factors, including inflation, high interest rates, recession risks and other lagging effects of the COVID-19 pandemic, have caused downturns in key markets and created other commercial disruptions, which have and could further adversely impact our businesses.Products sold to key end-use markets, including the B&C and consumer electronics markets, represent a significant portion of our revenue. Because these markets are tied closely to overall economic performance, macroeconomic factors have and could further cause changes to demand for our products. These factors include: (i) inflation; (ii) high interest rates; (iii) recession risks; (iv) disruptions to supply chains; (v) other interruptions of international and regional commerce; and (vi) other lagging effects of the COVID-19 pandemic. Price erosion may occur as competitors become more aggressive in pricing practices. To the extent that these factors reduce demand for our products, our business, financial position, results of operations and cash flows could be adversely impacted.
•Tredegar’s performance is influenced by costs incurred by its operating companies, including the cost of raw materials and energy. These costs include the cost of aluminum (the raw material on which Aluminum Extrusions primarily depends), resin (the raw material on which PE Films primarily depends), PTA and MEG (the raw materials on which Flexible Packaging Films primarily depends), natural gas (the principal fuel necessary for Aluminum Extrusions’ plants to operate), electricity, diesel fuel and paint. Aluminum, resin and natural gas prices are volatile as shown in the charts in Item 7A. The Company attempts to mitigate the effects of increased costs through price increases and contractual pass-through provisions, but there are no assurances that higher prices can effectively be passed through to customers or that Tredegar will be able to offset fully or on a timely basis the effects of higher costs. Further, the Company’s cost control efforts may not be sufficient to offset any increases in raw materials, energy or other costs.
•Our failure to continue to attract, develop and retain certain key officers or employees could adversely affect our businesses. Our success depends upon the efforts and abilities of key personnel, many of whom are longstanding employees. The loss of any of these key personnel could deplete our institutional knowledge base and negatively affect our ability to efficiently operate our businesses. Certain roles have experienced high turnover in recent years, and we are experiencing an increasingly competitive labor market. Increased employee turnover could hinder our ability to execute our business strategy and adversely affect our business, financial condition, results of operations and cash flows.
•Disruptions at one of the Company’s major manufacturing facilities could negatively impact financial results. Tredegar believes it has implemented measures to minimize the risks of disruption at its facilities. However, a disruption could occur as a result of any number of events: an equipment failure with repairs requiring long lead times, labor stoppages or shortages, cybersecurity attacks, utility disruptions, constraints on the supply or delivery of critical raw materials, and severe weather conditions, including potential flooding at the Aluminum Extrusions facility located in Carthage, TN, which is located in a 50-year flood plain. A material disruption in one of the Company’s operating locations could negatively impact production and the Company’s consolidated financial condition, results of operations and cash flows.
Risks Related to Aluminum Extrusions
•Sales volume and profitability of Aluminum Extrusions is cyclical and seasonal and highly dependent on economic conditions of end-use markets in the U.S., particularly in the construction sector. Aluminum Extrusions’ end-use markets can be cyclical and subject to seasonal swings in volume. In addition, changes in architectural design, demographic, and/or remote work trends could negatively impact the overall commercial construction industry. Because of the capital-intensive nature and level of fixed costs inherent in the aluminum extrusions business, the percentage drop in earnings before interest, taxes, depreciation and amortization (“EBITDA”) from ongoing operations in a cyclical downturn will likely exceed the percentage drop in volume. In addition, during an economic slowdown, excess industry capacity often drives increased pricing pressure in many end-use markets as competitors seek to protect their position with key customers. Any benefits associated with cost reductions and productivity improvements may not be sufficient to offset the adverse effects on profitability from pricing and margin pressure and higher bad debts (including a greater chance of loss associated with customers defaulting on fixed-price forward sales contracts) that usually accompany a downturn.
•Unfairly traded imports of aluminum extrusions could injure or threaten with injury America’s domestic aluminum extrusions industry, which could have an adverse effect on the financial condition, results of operations and cash flows of Aluminum Extrusions.
1.Failure to prevent foreign competitors from evading anti-dumping and countervailing duties, or failure to reinstate the Aluminum Tariff on aluminum extrusions, could adversely impact Aluminum Extrusions. In 2018, the U.S. imposed tariffs of 10% on aluminum ingot and semi-finished aluminum imported into the U.S. from certain countries; however, in December 2020, the Department of Commerce (“DOC”) introduced a tariff exclusion process, granting applicants with tariff exclusions. In response to large and increasing volumes of unfairly traded imports of extrusions associated with these tariff exclusions, a coalition of U.S. domestic producers filed petitions with the DOC and U.S. International Trade Commission (“ITC”). In November 2023, the ITC found that there is a reasonable indication that the American aluminum extrusions industry is materially injured or threatened with injury due to imports from 14 countries, including China. The ITC’s preliminary determination found that subject import volumes were significant and increasing, and that with regard to pricing, subject imports predominantly undersold the domestic product by volume in each year of the period of investigation. On March 5, 2024, the DOC announced its preliminary finding that the governments of China, Indonesia, Mexico and Turkey unfairly subsidize their aluminum extrusion industries. The DOC calculated a range of affirmative preliminary countervailing duties from each country. A preliminary anti-dumping determination for these four countries and the 10 other countries included in the initial petition is expected in May 2024. The Company expects the final ITC vote to occur in late 2024. A failure by, or the inability of, U.S. trade officials to restore the import tariff in its full format could have an adverse effect on the businesses, financial condition, results of operations and cash flows of Aluminum Extrusions.
2.The duty-free importation of goods allowed under the United States-Mexico-Canada Agreement (“USMCA”), or other free trade agreements or duty-preference regimes, could result in lower demand for aluminum extrusions made in the U.S. As noted above, in March 2018, the U.S. imposed tariffs of 10% on aluminum ingot and semi-finished aluminum imported into the U.S. from certain countries, including countries from which Aluminum Extrusions has historically sourced aluminum products. In September 2019, the U.S., Canada and Mexico entered into the USMCA. As a result of the 10% tariffs on aluminum ingot imported to the U.S. and the duty-free importation of goods allowed under USMCA, aluminum extrusions made in Canada and Mexico that are able to take advantage of duty-preference programs upon importation into the United States are free of the
10% tariff and can now be imported into and sold in the U.S. at very competitive prices. This could result in lower demand for aluminum extrusions made in the U.S., which could negatively affect Aluminum Extrusions’ business, results of operations, financial condition and cash flows.
•The markets for Aluminum Extrusions’ products are highly competitive with product quality, service, delivery performance and price being the principal competitive factors. Aluminum Extrusions has approximately 1,100 customers that are in a variety of end-use markets within the broad categories of building and construction, distribution, automotive and other transportation, machinery and equipment, electrical and consumer durables. No single Aluminum Extrusions’ customer exceeds 4% of consolidated net sales. Future success and prospects depend on Aluminum Extrusions’ ability to provide superior service, high quality products, timely delivery and competitive pricing to retain existing customers and participate in overall industry cross-cycle growth. Failure in any of these areas could lead to a loss of customers, which could have an adverse effect on the business, financial condition, results of operations and cash flows of Aluminum Extrusions.
•The failure to successfully implement the new enterprise resource planning and manufacturing execution systems could adversely impact the Aluminum Extrusions business and results of operations. InJanuary 2022, Aluminum Extrusions commenced the implementation of new enterprise resource planning and manufacturing execution systems (“ERP/MES”) across all locations of the Aluminum Extrusions business. The implementation of these systems is a major undertaking from a financial, management, and personnel perspective. The implementations have been more difficult, time consuming and costly (approximately $21 million of spending to date) than expected. This project, which was expected to be completed in 2024, has been reorganized with an extended implementation period, due to the implementation of stringent spending measures to control financial leverage. As a result, the earliest “go-live” date for the new ERP/MES is 2025. There were 33,537,892 sharescan be no assurance that these systems will be beneficial to the extent anticipated. Any additional disruptions, delays or deficiencies in the design and implementation of common stock heldthe new systems could adversely affect our financial position, results of operations and cash flows.
Risks Related to PE Films
•PE Films is highly dependent on sales associated with relatively few large customers. PE Films’ top four customers comprised approximately 10%, 10% and 13% of Tredegar’s consolidated net sales in 2023, 2022 and 2021, respectively. The loss or significant reduction of sales associated with one or more of these customers without replacement by 1,747 shareholdersnew business could have an adverse effect on the Company. Surface Protection sales have been adversely impacted by weak market demand and competitive pricing. Customer demand for electronics has continued to deteriorate since the third quarter of record2022, causing manufacturers in the supply chain to experience reduced capacity utilization and inventory corrections. Consequently, results of operations for PE Films have been adversely impacted by weak demand for Surface Protection products.
While PE Films is undertaking efforts to expand its customer base, there can be no assurance that such efforts will be successful, or that they will offset any loss of sales and profits associated with large customer declines.
•The failure of PE Films’ customers to achieve success or maintain market share could adversely impact PE Films’ sales and operating margins. PE Films’ plastic films are used in the production of various consumer products sold worldwide. Our customers’ ability to successfully develop, manufacture and market those products is integral to PE Films’ success. Cyclical downturns and changing consumer preferences, particularly those driven by changes in technology, may negatively affect businesses that use PE Films’ plastic film products, which could adversely affect sales and operating margins. Other factors that could adversely affect the business include (i) failure by a key customer to achieve success or maintain share in markets in which they sell products containing PE Films’ materials, including as a result of customer preferences for products other than plastics, (ii) key customers using products developed by others that replace PE Films’ business with such customers, (iii) delays in a key customer rolling out products utilizing new technologies developed by PE Films, and (iv) operational decisions by a key customer that result in component substitution, inventory reductions and similar changes.
•The Company’s inability to protect its intellectual property rights or its infringement of the intellectual property rights of others could have an adverse impact on March 12, 2021.PE Films. The continued success of PE Films’ business depends on its ability not only to protect its own technologies and trade secrets, but also to develop and sell new products that do not infringe upon existing patents. Intellectual property litigation is very costly and could result in substantial expense and diversions of Company resources, both of which could adversely affect its consolidated financial condition, results of operations and cash flows. In addition, there may be no effective legal recourse against infringement of the Company’s intellectual property by third parties, whether due to limitations on enforcement of rights in foreign jurisdictions or as a result of other factors.
Dividend Information•Rising trade tensions could cause an increase in the cost of PE Films’ products or otherwise negatively impact the Company. A portion of PE Film’s business involves imports to and from the U.S. and other countries where the
Company produces and sells its products. Trade tensions have been rising between the U.S. and other countries, particularly China. An increase in tariffs and other trade barriers between the U.S. and China, or between the U.S. and other countries, could cause an increase in the cost of PE Films’ products or otherwise negatively impact the production and sale of the Company’s products in world markets.
•Further impairment of the Surface Protection reporting unit’s goodwill could have a non-cash adverse impact on our results of operations. The Company assesses goodwill for impairment when events or circumstances indicate that the carrying value may not be recoverable, or, at a minimum, on an annual basis (December 1st of each year). The valuation of goodwill depends on a variety of factors, including macroeconomic conditions, industry and market considerations, cost factors and overall financial performance, as well as Company and reporting unit factors, and goodwill impairment valuations can be sensitive to assumptions associated with such factors. Failure to successfully achieve projections could result in future impairments.
Risks Related to Flexible Packaging Films
•Overcapacity in Latin American polyester film production and governmental failure to extend anti-dumping duties in Brazil on imported products or prevent competitors from circumventing such duties could adversely impact Flexible Packaging Films. In recent years, excess global capacity in the industry has paidled to increased competitive pressures from imports into Brazil. The Company believes that these conditions have shifted the competitive environment from a regular cash dividend every quarter since becomingregional to a public companyglobal landscape and have driven price convergence and lower product margins for Flexible Packaging Films. Favorable anti-dumping rulings or countervailing duties are in July 1989effect for products imported from China, Egypt, India, Mexico, United Arab Emirates, Peru and expectsBahrain. Competitors not currently subject to anti-dumping duties may choose to utilize their excess capacity by selling product in Brazil, which may result in pricing pressures that comparable regular cash dividends willFlexible Packaging Films may not be able to offset with cost savings measures and/or manufacturing efficiency initiatives.
In May 2021, the Brazilian authorities concluded the sunset review relating to the anti-dumping process for polyester film imported from China, India and Egypt, and decided to extend duties for another five years. However, due to its doubts that films would continue to be paidimported from China and Egypt, the government immediately suspended the implementation of the tariffs for those countries but agreed that if in the future.future there were volumes imported from China or Egypt which were harming the Brazilian market, authorities may promptly reinstate tariffs. Importing from Egypt increased in Brazil during 2023; therefore, Terphane requested the application of anti-dumping tariffs for Egypt, which was accepted by the Brazilian Government. These tariffs went into effect starting in November 2023. For films imported from India, the Brazilian authorities also reviewed measures against countervailing duties and extended those for five years as well.
In February 2024, the Brazilian Government determined that the anti-dumping measures against Mexico and United Arab Emirates should be extended for a five-year period and anti-dumping measures against Turkey should be removed.
•A history of uncertain economic conditions in Brazil could adversely impact the financial condition, results of operations and cash flows of Flexible Packaging Films. For flexible packaging films produced in Brazil, selling prices and key raw material costs are principally determined in U.S. Dollars and are impacted by local economic conditions and local and global competitive dynamics. Flexible Packaging Films is exposed to foreign exchange translation risk (its functional currency is the Brazilian Real) because almost 90% of the sales of Flexible Packaging Films business unit in Brazil (“Terphane Ltda.”) and substantially all of its related raw material costs are quoted or priced in U.S. Dollars while its variable conversion, fixed conversion and sales, general and administrative costs before depreciation & amortization (collectively “Terphane Ltda. Operating Costs”) are quoted or priced in Brazilian Real. This mismatch, together with a variety of economic variables impacting currency exchange rates, causes volatility that could negatively or positively impact EBITDA from ongoing operations for Flexible Packaging Films. While Flexible Packaging Films hedges this exposure on a short-term basis with foreign exchange forward rate contracts, the exposure continues to exist beyond the hedging periods.
Other Business Risks
•A failure in the Company’s information technology systems as a result of cybersecurity attacks or other causes could negatively affect Tredegar’s business. The Company depends on information technology (“IT”) to record and process customer orders, manufacture and ship products in a timely manner, secure its production processes and know-how, maintain the financial accuracy of its business records and maintain personally identifiable information of its employees. An IT system failure due to computer viruses, internal or external security breaches, cybersecurity attacks or other malicious causes could disrupt our operations and prevent us from being able to process transactions with our customers, operate our manufacturing facilities and properly report transactions in a timely manner. Increased global IT security threats and cyber-crime pose a potential risk to the security and availability of the Company’s IT systems, networks and services, including those that are managed, hosted, provided or used by third parties, as well as to the confidentiality, availability and integrity of the Company’s data. Additionally, increased cybersecurity risk arises due to certain employees working remotely. To date, interruptions of the Company’s IT systems have been infrequent, and Tredegar
has not experienced a material cybersecurity incident. A significant prolonged failure of or security breach of the IT systems, networks or service providers the Company relies upon, or a loss or disclosure of business or other sensitive information, or personally identifiable information, as a result of a cybersecurity incident or other cause, could result in substantial costs to the Company, damage to the Company’s reputation, regulatory enforcement actions and lawsuits and could adversely affect the Company’s business, results of operations, financial condition or cash flows.
•The Company’s results of operations, financial condition and cash flows have been and could be impacted by the macroeconomic effects of a pandemic.The COVID-19 pandemic had multiple adverse effects on the global economy, including short-term impacts affecting labor supply and causing supply chain disruptions which led to inflationary pressures. In addition, the pandemic resulted in certain after-shocks and structural shifts, which have adversely impacted Tredegar’s markets.
In the event of a future pandemic, Tredegar’s businesses, our suppliers, contractors and third-party logistic providers could experience conditions similar to those associated with the COVID-19 pandemic, including facility closures, labor constraints, supply chain disruptions and other challenges. These challenges could impact our ability to maintain sufficient inventory and to accurately predict demand or lead times, which could inhibit our ability to service customer demand. Additionally, a future pandemic could heighten other risks described above.
•Tredegar has paid special cash dividends from timeis subject to time. On December 1, 2020,current and future governmental regulations, including environmental laws and regulations, and could become exposed to liabilities and costs associated with such regulation. The Company is subject to regulation by local, state, federal and foreign governmental authorities. New laws and regulations, or changes to existing laws, including those relating to environmental matters (including global climate change and plastic products), and privacy matters, could subject Tredegar to significant additional capital expenditures, operating expenses or other compliance costs. Moreover, future developments in federal, state, local and international laws and regulations, including environmental laws, are difficult to predict. Environmental laws and privacy restrictions have become and are expected to continue to become increasingly strict. As a result, Tredegar expects to be subject to new environmental and privacy laws and regulations. However, any such changes are uncertain and, therefore, it is not possible for the Board declared a special dividendCompany to predict with certainty the amount of $200 million,additional capital expenditures or $5.97 per share, on the Company’s common stock (the “Special Dividend”). The Special Dividend was paid in December 2020.
All decisionsoperating expenses that could be necessary for compliance with respect to any such changes.
The Company is subject to the declarationU.S. Foreign Corrupt Practices Act, Brazilian anti-corruption laws and paymentsimilar anti-bribery laws in other jurisdictions, which generally prohibit companies and their intermediaries from making improper payments to foreign officials for the purpose of future dividends will be madeobtaining or retaining business. Although we have policies and procedures designed to facilitate compliance with these laws and regulations, our employees, contractors and agents may take actions in violation of our policies. Any such violation, even if prohibited by our policies, could adversely affect our business and/or our reputation.
Item 1B. UNRESOLVED STAFF COMMENTS
None.
Item 1C. CYBERSECURITY
Tredegar’s business model depends on the efficiency and reliability of its information systems, networks, and essential assets, with a portion of these systems and networks being administered by third-party service providers. Tredegar’s Cybersecurity Program (the “Program”), which was designed utilizing a risk-based approach, was developed to not only prevent, identify, investigate, resolve, and mitigate potential cybersecurity vulnerabilities within Tredegar but also to enhance the information security posture of Tredegar’s operations involving third-party service providers.
Tredegar entrusts the third-party service providers with the responsibility to institute security measure protocols that are appropriately and proportionally tailored to the corresponding risks. Additionally, Tredegar also periodically conducts assessments of the third-party service providers’ security frameworks to verify the implementation of adequate security measures, to safeguard Tredegar against potential vulnerabilities.
The Program leverages a blend of automated systems, manual operations, and external evaluations to proactively identify and mitigate potential cybersecurity threats. Key components of the program include Tredegar’s Cybersecurity Incident Response Plan and Cyber Crisis Management Plan. These plans encompass a strategic approach that includes detection of threats, thorough analysis of cybersecurity incidents to determine whether timely notification to the Board of Directors is necessary, containment of incidents, eradication or mitigation of threats, recovery processes, and a comprehensive post-incident review.
To further strengthen its cybersecurity posture, Tredegar employs third-party consultants who work with the internal audit and information technology (“IT”) departments to assess Tredegar’s information security program and practices, including incident management, service continuity, and information security compliance programs, and identify areas for improvement.
The results of such an assessment are regularly presented to the Audit Committee. Notably, these assessments include periodic penetration tests, which allow Tredegar to identify vulnerabilities, refine procedures, and enhance its crisis management and recovery capabilities. The Program is also supported by an organizational structure, involving collaboration across various business sectors and an interdisciplinary Global Data Protection and Cybersecurity Oversight Team that meets regularly to identify information security risks and appropriate risk mitigation strategies. Additionally, because Tredegar recognizes the significant role that its employees play in information security, it provides annual formal information security training to all of its sole discretion based upon earnings, financial condition, anticipated cash needs, restrictionsemployees that covers critical topics such as phishing and email security best practices.
Tredegar’s IT Director has over 10 years of cybersecurity expertise, including a robust history of similar roles, cybersecurity certifications from EC-Council and ODU Global and holds a degree in Computer Science from Universidade Catolica de Pernambuco and an MBA in IT Management from Universidade Federal de Pernambuco. Our IT Director is responsible for overseeing the Program, including the prevention, mitigation, detection, and remediation of cybersecurity incidents. Tredegar’s IT Director also regularly collaborates closely with key management, including the Chief Financial Officer, General Counsel, Compliance Manager, and Human Resources Executive Director, to foster effective communication within Tredegar.
The Board is responsible for risk management, with specific oversight of cybersecurity risks being delegated to the Audit Committee. The Audit Committee receives updates from the IT Director at each of its quarterly meetings. These updates encompass an assessment of Tredegar’s cybersecurity risk profile, including the efficacy of Tredegar’s cybersecurity policies, procedures, strategies, and areas of emerging risk. Additionally, the Board receives annual, but often more frequent, updates on Tredegar’s cybersecurity systems.
Item 2. PROPERTIES
General
Most of the improved real property and the other assets used in the Company’s revolving credit facility and other such considerations asoperations are owned. Certain of the Board deems relevant.owned property is subject to an encumbrance under the ABL Facility. See Note 11 "Debt7 “Debt and Credit Agreements"Agreements” to the Consolidated Financial Statements in Item 15 for more information.
Tredegar considers the restrictions on the payment of dividends containedmanufacturing facilities, warehouses and other properties and assets that it owns or leases to be in the Company’s credit agreement related to aggregate dividends permitted.
Issuer Purchases of Equity Securities
On January 7, 2008, Tredegar announced that the Board approved a share repurchase program whereby management is authorizedgenerally good condition. Capacity utilization at its discretionvarious manufacturing facilities can vary with product mix and normal fluctuations in sales levels. The Company believes that its Bonnell Aluminum, PE Films and Flexible Packaging Films manufacturing facilities have sufficient capacity to purchase, in the open market or in privately negotiated transactions, up to 5 million sharesmeet current production requirements. Tredegar’s corporate headquarters, which is leased, is located at 1100 Boulders Parkway, Richmond, Virginia 23225.
The Company’s principal manufacturing plants and facilities as of the Company’s outstanding common stock. The authorization has no time limit. Tredegar did not repurchase any shares in the open market or otherwise in 2020, 2019 or 2018 under this standing authorization. The maximum number of shares remaining under this standing authorization was 1,732,003 at December 31, 2020.2023 are listed below:
Stock Performance GraphAluminum Extrusions
| | | | | | | | | | | | | | |
| Locations in the U.S. | | Locations Outside the U.S. | | Principal Operations |
Carthage, Tennessee
Clearfield, Utah (leased)
Elkhart, Indiana
Newnan, Georgia
Niles, Michigan | | None | | Production of aluminum extrusions, fabrication and finishing |
PE Films
| | | | | | | | | | | | | | |
| Locations in the U.S. | | Locations Outside the U.S. | | Principal Operations |
| Pottsville, Pennsylvania | | Guangzhou, China | | Production of plastic films |
Flexible Packaging Films
| | | | | | | | | | | | | | |
| Locations in the U.S. | | Locations Outside the U.S. | | Principal Operations |
| Bloomfield, New York (technical center and production facility) | | Cabo de Santo Agostinho, Brazil | | Production of PET-based films |
Item 3. LEGAL PROCEEDINGS
The following graph compares cumulative total shareholder returns for Tredegar,information required by this Item 3 is set forth in Note 16 "Contingencies" to the S&P SmallCap 600 Stock Index (an index comprised of companies with market capitalizations similar to Tredegar)Consolidated Financial Statements in Item 15 and the Russell 2000 Index for the five years ended December 31, 2020. Tredegar is part of both the S&P SmallCap 600 Index and Russell 2000 Index.
COMPARISON OF 5 YEAR CUMULATIVE TOTAL RETURN*
Among Tredegar Corporation, the S&P SmallCap 600 Index, and the Russell 2000 Index
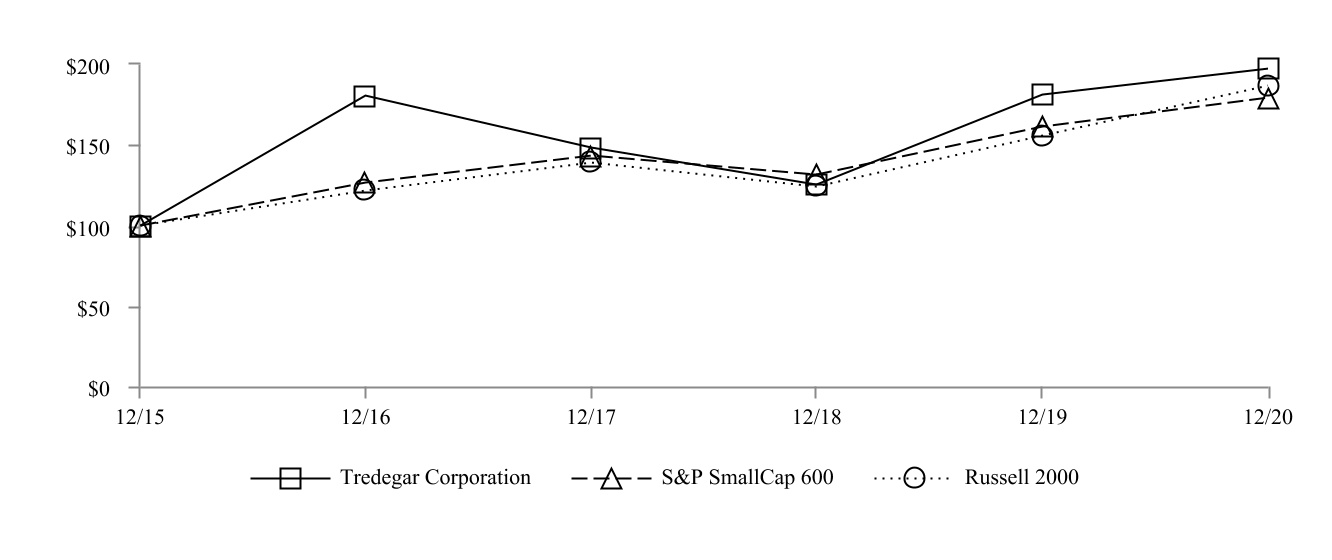
| | |
*$100 invested on 12/31/15 in stock or index, including reinvestment of dividends.
Fiscal year ending December 31.
Copyright© 2021 Standard & Poor's, a division of S&P Global. All rights reserved.
Copyright© 2021 Russell Investment Group. All rights reserved.
|
hereby incorporated herein by reference.
Item 6.4. SELECTED FINANCIAL DATAMINE SAFETY DISCLOSURES
The tables that follow present certain selected financial and segment information for the five years ended December 31, 2020. All historical results for Personal Care Films have been presented as discontinued operations. The surface protection component of the PE Films segment now includes Pottsville Packaging.None.
FIVE-YEAR SUMMARY
Tredegar Corporation and Subsidiaries
| | | | | | | | | | | | | | | | | | | | | | | | | | | | | | | | | | | | | | | | | | | | |
| Years Ended December 31 | 2020 | | | 2019 | | | 2018 | | | 2017 | | | 2016 | |
| (In thousands, except per-share data) | | | | | | | | | | | | | | |
| Results of Operations: | | | | | | | | | | | | | | |
| Sales | $ | 755,290 | | | | $ | 826,324 | | | | $ | 851,834 | | | | $ | 725,867 | | | | $ | 595,665 | | |
| Other income (expense), net (g) | (67,294) | | (a) | | 28,371 | | (a) | | 30,455 | | (a) | | 51,718 | | (b) | | 2,225 | | (b) |
| Total | 687,996 | | | | 854,695 | | | | 882,289 | | | | 777,585 | | | | 597,890 | | |
| Cost of goods sold (i) | 558,967 | | (a) | | 641,140 | | (a) | | 679,665 | | (a) | | 579,545 | | (b) | | 472,767 | | (b) |
| Freight | 25,686 | | | | 28,980 | | | | 27,170 | | | | 22,273 | | | | 17,864 | | |
| Selling, general & administrative (i) | 84,246 | | (a) | | 76,598 | | (a) | | 67,929 | | (a) | | 65,189 | | (b) | | 58,334 | | (b) |
| Research and development | 8,398 | | | | 7,893 | | | | 6,672 | | | | 6,189 | | | | 6,877 | | |
| Amortization of identifiable intangibles | 3,017 | | | | 13,601 | | | | 3,976 | | | | 6,198 | | | | 3,978 | | |
| Pension and postretirement benefits (i) | 14,720 | | | | 9,642 | | | | 10,406 | | | | 10,193 | | | | 11,047 | | |
| Interest expense | 2,587 | | | | 4,051 | | | | 5,702 | | | | 6,170 | | | | 3,806 | | |
| Asset impairments and costs associated with exit and disposal activities, net of adjustments | 1,725 | | (a) | | 784 | | (a) | | 398 | | (a) | | 102,114 | | (b) | | 302 | | (b) |
| Goodwill impairment | 13,696 | | (c) | | — | | | | — | | | | — | | | | — | | |
| Total | 713,042 | | | | 782,689 | | | | 801,918 | | | | 797,871 | | | | 574,975 | | |
| Income (loss) from continuing operations before income taxes | (25,046) | | | | 72,006 | | | | 80,371 | | | | (20,286) | | | | 22,915 | | |
| Income tax expense (benefit) | (8,213) | | | | 13,545 | | | | 18,807 | | | | (57,753) | | | | 4,786 | | |
| Income (loss) from continuing operations | (16,833) | | | | 58,461 | | | | 61,564 | | | | 37,467 | | | | 18,129 | | |
| Income (loss) from discontinued operations, net of tax | (58,611) | | | | (10,202) | | | | (36,722) | | | | 784 | | | | 6,337 | | |
| Net income (loss) | $ | (75,444) | | | | $ | 48,259 | | | | $ | 24,842 | | | | $ | 38,251 | | | | $ | 24,466 | | |
| Diluted earnings (loss) per share: | | | | | | | | | | | | | | |
| Continuing operations | $ | (0.51) | | | | $ | 1.76 | | | | $ | 1.86 | | | | $ | 1.14 | | | | $ | 0.55 | | |
| Discontinued operations | (1.75) | | | | (0.31) | | | | (1.11) | | | | 0.02 | | | | 0.20 | | |
| Diluted earnings (loss) per share | $ | (2.26) | | | | $ | 1.45 | | | | $ | 0.75 | | | | $ | 1.16 | | | | $ | 0.75 | | |
Refer to Notes to Financial Tables that follow these tables.
FIVE-YEAR SUMMARY
Tredegar Corporation and Subsidiaries
| | | | | | | | | | | | | | | | | | | | | | | | | | | | | |
| Years Ended December 31 | 2020 | | 2019 | | 2018 | | 2017 | | 2016 |
| (In thousands, except per-share data) | | | | | | | | | |
| Share Data: | | | | | | | | | |
| Equity per share (h) | $ | 3.26 | | | $ | 11.29 | | | $ | 10.70 | | | $ | 10.41 | | | $ | 9.44 | |
| Cash dividends declared per share (n) | $ | 6.45 | | | $ | 0.46 | | | $ | 0.44 | | | $ | 0.44 | | | $ | 0.44 | |
| Weighted average common shares outstanding during the period | 33,402 | | | 33,236 | | | 33,068 | | | 32,946 | | | 32,762 | |
| Shares used to compute diluted earnings (loss) per share during the period | 33,402 | | | 33,258 | | | 33,092 | | | 32,951 | | | 32,775 | |
| Shares outstanding at end of period | 33,457 | | | 33,365 | | | 33,176 | | | 33,017 | | | 32,934 | |
| Closing market price per share: | | | | | | | | | |
| High | $ | 22.32 | | | $ | 23.31 | | | $ | 26.25 | | | $ | 25.00 | | | $ | 25.55 | |
| Low | $ | 11.32 | | | $ | 15.59 | | | $ | 15.00 | | | $ | 14.85 | | | $ | 11.68 | |
| End of year | $ | 16.70 | | | $ | 22.35 | | | $ | 15.86 | | | $ | 19.20 | | | $ | 24.00 | |
| Total return to shareholders (d)(n) | 3.6 | % | | 43.8 | % | | (15.1) | % | | (18.2) | % | | 79.4 | % |
| Financial Position: | | | | | | | | | |
| Total assets | $ | 514,870 | | | $ | 712,668 | | | $ | 707,373 | | | $ | 755,743 | | | $ | 651,162 | |
| Cash and cash equivalents | $ | 11,846 | | | $ | 31,422 | | | $ | 34,397 | | | $ | 36,491 | | | $ | 29,511 | |
| Debt | $ | 134,000 | | | $ | 42,000 | | | $ | 101,500 | | | $ | 152,000 | | | $ | 95,000 | |
| Shareholders’ equity | $ | 109,055 | | | $ | 376,749 | | | $ | 354,857 | | | $ | 343,780 | | | $ | 310,783 | |
| Equity market capitalization (e) | $ | 558,735 | | | $ | 745,709 | | | $ | 526,172 | | | $ | 633,935 | | | $ | 790,411 | |
Refer to Notes to Financial Tables that follow these tables.
SEGMENT TABLES
Tredegar Corporation and Subsidiaries
| | | | | | | | | | | | | | | | | | | | | | | | | | | | | |
| Net Sales (f) | | | | | | | | | |
| Years Ended December 31 | 2020 | | 2019 | | 2018 | | 2017 | | 2016 |
| (In thousands) | | | | | | | | | |
| Aluminum Extrusions | $ | 455,711 | | | $ | 529,602 | | | $ | 573,126 | | | $ | 466,833 | | | $ | 360,098 | |
| PE Films | 139,288 | | | 133,807 | | | 127,708 | | | 128,406 | | | 109,674 | |
| Flexible Packaging Films | 134,605 | | | 133,935 | | | 123,830 | | | 108,355 | | | 108,028 | |
| Total net sales | 729,604 | | | 797,344 | | | 824,664 | | | 703,594 | | | 577,800 | |
| Add back freight | 25,686 | | | 28,980 | | | 27,170 | | | 22,273 | | | 17,864 | |
| Sales as shown in Consolidated Statements of Income | $ | 755,290 | | | $ | 826,324 | | | $ | 851,834 | | | $ | 725,867 | | | $ | 595,664 | |
| | | | | | | | | |
| Identifiable Assets | | | | | | | | | |
| As of December 31 | 2020 | | 2019 | | 2018 | | 2017 | | 2016 |
| (In thousands) | | | | | | | | | |
| Aluminum Extrusions | $ | 244,560 | | | $ | 265,027 | | | $ | 281,372 | | | $ | 268,127 | | | $ | 147,639 | |
| PE Films | 119,013 | | | 124,269 | | | 118,496 | | | 123,507 | | | 117,307 | |
| Flexible Packaging Films | 66,453 | | | 74,016 | | | 58,964 | | | 49,915 | | | 156,836 | |
| Subtotal | 430,026 | | | 463,312 | | | 458,832 | | | 441,549 | | | 421,782 | |
| General corporate | 71,508 | | | 109,655 | | | 99,570 | | | 109,882 | | | 37,345 | |
| Cash and cash equivalents | 11,846 | | | 31,422 | | | 34,397 | | | 36,491 | | | 29,511 | |
| Discontinued operations | 1,490 | | | 108,279 | | | 114,574 | | | 167,821 | | | 162,524 | |
| Total | $ | 514,870 | | | $ | 712,668 | | | $ | 707,373 | | | $ | 755,743 | | | $ | 651,162 | |
Refer to Notes to Financial Tables that follow these tables.
SEGMENT TABLES
Tredegar Corporation and Subsidiaries
| | | | | | | | | | | | | | | | | | | | | | | | | | | | | | | | | | | | | | | | | | | | |
EBITDA from Ongoing Operations (l) | | | | | | | | | | | | | | |
| Years Ended December 31 | 2020 | | | 2019 | | | 2018 | | | 2017 | | | 2016 | |
| (In thousands) | | | | | | | | | | | | | | |
| Aluminum Extrusions: | | | | | | | | | | | | | | |
| Ongoing operations: | | | | | | | | | | | | | | |
| EBITDA | $ | 55,137 | | | | $ | 65,683 | | | | $ | 65,479 | | | | $ | 58,524 | | | | $ | 46,967 | | |
| Depreciation & amortization (j) | (17,403) | | | | (16,719) | | | | (16,866) | | | | (15,070) | | | | (9,173) | | |
| EBIT (m) | 37,734 | | | | 48,964 | | | | 48,613 | | | | 43,454 | | | | 37,794 | | |
| Plant shutdowns, asset impairments, restructurings and other | (3,506) | | (a) | | (561) | | (a) | | (505) | | (a) | | 321 | | (b) | | (741) | | (b) |
| Goodwill impairment charge | (13,696) | | (c) | | — | | | | — | | | | — | | | | — | | |
| Trade name accelerated amortization | — | | | | (10,040) | | (j) | | — | | | | — | | | | — | | |
| PE Films: | | | | | | | | | | | | | | |
| Ongoing operations: | | | | | | | | | | | | | | |
| EBITDA | 45,107 | | | | 41,133 | | | | 32,404 | | | | 37,029 | | | | 21,535 | | |
| Depreciation & amortization | (6,762) | | | | (5,860) | | | | (6,201) | | | | (6,117) | | | | (5,718) | | |
| EBIT (m) | 38,345 | | | | 35,273 | | | | 26,203 | | | | 30,912 | | | | 15,817 | | |
| Plant shutdowns, asset impairments, restructurings and other | (1,974) | | (a) | | (733) | | (a) | | (186) | | (a) | | (157) | | (b) | | (1) | | (b) |
| Flexible Packaging Films: | | | | | | | | | | | | | | |
| Ongoing operations: | | | | | | | | | | | | | | |
| EBITDA | 30,645 | | | | 14,737 | | | | 11,154 | | | | 7,817 | | | | 11,279 | | |
| Depreciation & amortization | (1,761) | | | | (1,517) | | | | (1,262) | | | | (10,443) | | | | (9,505) | | |
| EBIT (m) | 28,884 | | | | 13,220 | | | | 9,892 | | | | (2,626) | | | | 1,774 | | |
| Plant shutdowns, asset impairments, restructurings and other | (18) | | | | — | | (a) | | (45) | | (a) | | (89,398) | | (b) | | (214) | | (b) |
| Total | 85,769 | | | | 86,123 | | | | 83,972 | | | | (17,494) | | | | 54,429 | | |
| Interest income | 44 | | | | 66 | | | | 146 | | | | 54 | | | | 106 | | |
| Interest expense | 2,587 | | | | 4,051 | | | | 5,702 | | | | 6,170 | | | | 3,806 | | |
| Gain (loss) on investment in kaléo accounted for under the fair value method (g) | (60,900) | | | | 28,482 | | | | 30,600 | | | | 33,800 | | | | 1,600 | | |
| Loss on sale of Bright View (o) | (2,299) | | | | — | | | | — | | | | — | | | | — | | |
| Loss on sale of investment property | — | | | | — | | | | (38) | | | | — | | | | — | | |
| Unrealized loss on investment property | — | | | | — | | | | (186) | | | | — | | | | (1,032) | | |
| Stock option-based compensation expense | 2,161 | | | | 4,132 | | | | 1,156 | | | | 245 | | | | 81 | | |
| Corporate expenses, net (k) | 42,912 | | (a) | | 34,482 | | (a) | | 27,265 | | (a) | | 30,231 | | (b) | | 28,301 | | (b) |
| Income (loss) from continuing operations before income taxes | (25,046) | | | | 72,006 | | | | 80,371 | | | | (20,286) | | | | 22,915 | | |
| Income tax expense (benefit) | (8,213) | | | | 13,545 | | | | 18,807 | | | | (57,753) | | | | 4,786 | | |
| Income (loss) from continuing operations | (16,833) | | | | 58,461 | | | | 61,564 | | | | 37,467 | | | | 18,129 | | |
| Income (loss) from discontinued operations, net of tax | (58,611) | | | | (10,202) | | | | (36,722) | | | | 784 | | | | 6,337 | | (g) |
| Net income (loss) | $ | (75,444) | | | | $ | 48,259 | | | | $ | 24,842 | | | | $ | 38,251 | | | | $ | 24,466 | | |
Refer to Notes to Financial Tables that follow these tables.
SEGMENT TABLES
Tredegar Corporation and Subsidiaries
| | | | | | | | | | | | | | | | | | | | | | | | | | | | | |
| Depreciation and Amortization | | | | | | | | | |
| Years Ended December 31 | 2020 | | 2019 | | 2018 | | 2017 | | 2016 |
| (In thousands) | | | | | | | | | |
| Aluminum Extrusions | $ | 17,403 | | | $ | 26,759 | | | $ | 16,866 | | | $ | 15,070 | | | $ | 9,173 | |
| PE Films | 6,762 | | | 5,860 | | | 6,201 | | | 6,117 | | | 5,716 | |
| Flexible Packaging Films | 1,761 | | | 1,517 | | | 1,262 | | | 10,443 | | | 9,505 | |
| Subtotal | 25,926 | | | 34,136 | | | 24,329 | | | 31,630 | | | 24,394 | |
| General corporate (k) | 520 | | | 186 | | | 163 | | | 155 | | | 141 | |
| Discontinued operations | 5,511 | | | 9,962 | | | 9,312 | | | 8,492 | | | 7,937 | |
| Total depreciation and amortization expense | $ | 31,957 | | | $ | 44,284 | | | $ | 33,804 | | | $ | 40,277 | | | $ | 32,472 | |
| | | | | | | | | |
| Capital Expenditures | | | | | | | | | |
| Years Ended December 31 | 2020 | | 2019 | | 2018 | | 2017 | | 2016 |
| (In thousands) | | | | | | | | | |
| Aluminum Extrusions | $ | 10,260 | | | $ | 17,855 | | | $ | 12,966 | | | $ | 25,653 | | | $ | 15,918 | |
| PE Films | 6,024 | | | 8,567 | | | 2,523 | | | 4,648 | | | 9,411 | |
| Flexible Packaging Films | 4,959 | | | 8,866 | | | 5,423 | | | 3,619 | | | 3,391 | |
| Subtotal | 21,243 | | | 35,288 | | | 20,912 | | | 33,920 | | | 28,720 | |
| General corporate | 200 | | | 223 | | | 427 | | | 61 | | | 389 | |
| Discontinued operations | 1,912 | | | 15,353 | | | 19,475 | | | 10,381 | | | 16,348 | |
| Total capital expenditures | $ | 23,355 | | | $ | 50,864 | | | $ | 40,814 | | | $ | 44,362 | | | $ | 45,457 | |
Refer to Notes to Financial Tables that follow these tables.
NOTES TO FINANCIAL TABLES
(a)For a description of plant shutdowns, asset impairments, restructurings and other charges for 2020, 2019, and 2018, see the plant shutdowns, asset impairments, restructurings and other tables for the respective periods in Results of Operations in Item 7.
(b)For a description of plant shutdowns, asset impairments, restructurings and other charges for 2017 and 2016, see Item 6. “Selected Financial Data” of the Company’s Annual Report on Form 10-K for the year ended December 31, 2018.
(c)Results for 2020 included a goodwill impairment charge of $13.7 million ($10.5 million after taxes) recognized in Bonnell Aluminum in the first quarter of 2020 upon completion of an impairment analysis performed as of March 31, 2020.
(d)Total return to shareholders is defined as the change in stock price during the year plus dividends per share, divided by the stock price at the beginning of the year.
(e)Equity market capitalization is the closing market price per share for the period multiplied by the shares outstanding at the end of the period.
(f)Net sales represents gross sales less freight. The Company uses net sales as its measure of revenues from external customers at the segment level.
(g)The gains and losses on the Company’s investment in kaléo are included in “Other income (expense), net” in the consolidated statements of income. See Note 4 to the Consolidated Financial Statements in Item 15 for more details for the years 2020, 2019 and 2018.
(h)Equity per share is computed by dividing shareholders’ equity at year end by the shares outstanding at year end.
(i)For the year ended December 31, 2017, the pension and postretirement benefit expenses recorded in Cost of goods sold and Selling, general and administrative expenses were reclassified to a new line item, Pension and postretirement benefits, on the consolidated statements of income, due to the retrospective adoption of Accounting Standards Update (“ASU”) 2017-07.
(j)Depreciation and amortization (“D&A”) in 2019 for Aluminum Extrusions excludes $10.0 million for accelerated amortization of trade names as a result of a rebranding initiative.
(k)Corporate depreciation and amortization is included in Corporate expenses, net, on the EBITDA from ongoing operations table above.
(l)In the fourth quarter of 2019, the Company changed its segment measure of profit and loss from operating profit from ongoing operations to EBITDA (earnings before interest, taxes, depreciation and amortization) from ongoing operations. EBITDA from ongoing operations is the key profitability metric used by the Company’s chief operating decision maker to assess segment financial performance. See Note 5 to the Consolidated Financial Statements in Item 15 for additional business segment information.
(m)EBIT (earnings before interest and taxes) from ongoing operations is a non-GAAP financial measure included in the reconciliation of segment financial information to consolidated results for the Company. It is not intended to represent the stand-alone results for Tredegar’s ongoing operations under GAAP and should not be considered as an alternative to net income as defined by GAAP. EBIT is a widely understood and utilized metric that is meaningful to certain investors. We believe that including this financial metric in the reconciliation of management’s performance metric, EBITDA from ongoing operations, provides useful information to those investors that primarily utilize EBIT to analyze the Company’s core operations.
(n)On December 1, 2020, the Board declared a special cash dividend of $200 million or $5.97 per share on the Company’s common stock. The special cash dividend was payable on December 18, 2020 to shareholders of record at the close of business on December 11, 2020.
(o)In December 2020, the Company entered into a definitive agreement and completed the sale of Bright View. See Note 2 to the Consolidated Financial Statements in Item 15 for more details.
Item 7. MANAGEMENT’S DISCUSSION AND ANALYSIS OF FINANCIAL CONDITION AND RESULTS OF OPERATIONS
Forward-looking and Cautionary Statements
Some of the information contained in this Form 10-K may constitute “forward-looking statements” within the meaning of the “safe harbor” provisions of the Private Securities Litigation Reform Act of 1995. When usingthe Company uses the words “believe,” “estimate,” “anticipate,” “appear to,” “expect,” “project,” “plan,” “likely,” “may” and similar expressions, Tredegarit does so to identify forward-looking statements. Such statements are based on Tredegar’sthe Company's then current expectations and are subject to a number of risks and uncertainties that could cause actual results to differ materially from those addressed in the forward-looking statements. It is possible that Tredegar’sthe Company's actual results and financial condition may differ, possibly materially, from the anticipated results and financial condition indicated in or implied by these forward-looking statements. In addition, the Company's current projections for its businesses could be materially affected by the highly uncertain impact of COVID-19. As a consequence, the Company's results could differ significantly from its projections, depending on, among other things, the duration of "shelter in place" orders and the ultimate impact of the pandemic on employees, supply chains, customers and the U.S. and world economies. Accordingly, you should not place undue reliance on these forward-looking statements. For risks and important factors that could cause actual results to differ from expectations, refer to the reports that Tredegar files with or furnishes the SEC from time-to-time, including the risks and important factors set forth in Item 1A. Readers are urged to review and consider carefully the disclosures Tredegar makes in the reports Tredegar files with or furnishes to the SEC. Tredegar does not undertake, and expressly disclaims any duty, to update any forward-looking statement to reflect any change in management’s expectations or any change in conditions, assumptions or circumstances on which such statements are based, except as required by applicable law.
Item 1A. RISK FACTORS
There are a number of risks and uncertainties that could have a material adverse effect on the Company’s businesses and its consolidated financial condition, results of operations or cash flows. The following risk factors should be considered, in addition to the other information included in this Form 10-K, when evaluating Tredegar and its businesses.
Risks Related to Tredegar’s Corporate Strategic Initiatives and Indebtedness
•The planned divestiture of Terphane to Oben Group is subject to a number of conditions beyond our control. On September 1, 2023, the Company announced that it had entered into a definitive agreement to sell Terphane to Oben Group. Completion of the sale is contingent upon the satisfaction of customary closing conditions, including the receipt of certain competition filing approvals by authorities in Brazil and Colombia. On October 27, 2023, the Company filed the requisite competition forms with the Administrative Council for Economic Defense (“CADE”) in Brazil, which the Company views as the primary competition authority regarding this matter. This filing followed a pre-filing phase for CADE’s initial review. CADE’s maximum deadline for completing its review is no later than November 18, 2024. The merger review regarding the transaction was cleared by the Colombian authority in early February 2024.
As usual, it cannot be predicted with certainty whether all of the required closing conditions will be satisfied, waived or if other uncertainties may arise. While the regulatory review process is ongoing and in line with the Company’s expectations, regulators could impose additional requirements or obligations as conditions for their approval, which may be burdensome. If such closing conditions are not met or additional obligations are imposed, the proposed sale may not be consummated, encounter delays, or experience other issues that are not currently anticipated.
•The Company’s failure to successfully transition to the reporting requirements for its asset-based revolving credit facility (“ABL Facility”), which matures on June 30, 2026, or an unexpected downturn in the markets could adversely impact the Company’s financial position and results of operations. On December 27, 2023, the Company entered into the ABL Facility, which provides the Company with $180 million senior secured asset-based revolving credit facility that will expire on June 30, 2026. The ABL Facility amended the Company’s existing $200 million revolving, secured credit facility that was cash flow-based. Availability under the ABL Facility is governed by a borrowing base, determined by the application of specified advance rates against eligible assets, including a portion of trade accounts receivable, inventory, cash and cash equivalents, owned real properties, and owned machinery and equipment.
A number of factors could affect the Company’s ability to successfully complete its transition from its prior cash flow-based revolving credit facility to the current asset-based facility. These factors include:
•Failure to establish processes associated with the ABL Facility’s reporting requirements, which are currently on a monthly basis but could change to a weekly cadence if at any time the borrowing availability falls below 10% of the maximum aggregate principal amount. Failure to timely report could result in an Event of Default (as defined in the ABL Facility), which if not waived, would permit the lenders, at their option, to accelerate all outstanding debt under the ABL Facility. Should the lenders elect to accelerate the debt under the ABL Facility,
a cross-default would be triggered under the Terphane Brazil Loan (as defined below in Item 7. “Management’s Discussion and Analysis of Financial Condition and Results of Operations” of this Form 10-K (“Item 7”)).
•Because the Company is currently subject to a Cash Dominion Period (as defined in Item 7), it is required to borrow cash to fund working capital, capital expenditures, business development activity, and other general corporate purposes, which limits its financial flexibility;
•Advances on accounts receivable and inventory are subject to change based on periodic commercial finance examinations and appraisals, and the real property, machinery and equipment values included in the borrowing base are subject to change based on periodic appraisals, which could reduce borrowing availability under the ABL Facility; and
•If a Material Adverse Effect (as defined in the ABL Facility) has occurred, the Company will not be able to continue to borrow under the ABL Facility.
In addition, a significant deterioration in the Company’s accounts receivable or inventory levels due to depressed economic conditions, weak consumer spending, turmoil in the credit markets or other factors, could restrict its ability to service its indebtedness or borrow additional funds.
Upon the earlier of March 31, 2025 or the date the Company receives the proceeds from the Contingent Terphane Sale (the “ABL Adjustment Date”), borrowing availability under the ABL Facility will be reduced from $180 million to $125 million. If the Contingent Terphane Sale is not completed by the ABL Adjustment Date, the Company may have to undertake alternative financing plans, subject to the limitations imposed by the ABL Facility, including limitations on its ability to:
•refinance or restructure its indebtedness;
•sell assets; and
•raise additional capital.
The Company may be unable to implement alternative financing plans on commercially reasonable terms or at all, and any such alternative financing plans might be insufficient to allow it to make principal and interest payments on its indebtedness required as a result of the ABL Adjustment Date and the reduction of borrowing availability under the ABL Facility to $125 million. The Company’s ability to restructure or refinance its indebtedness will depend on, among other things, its existing financial condition, projections of business conditions, sales, Credit EBITDA, net cash flow, net leverage and the condition of the capital markets at such time. Any refinancing of the Company’s indebtedness could be at higher interest rates and could require it to comply with additional covenants, which could further restrict the Company’s business operations.
Noncompliance with any of the covenants of the ABL Facility could result int an Event of Default, which if not cured or waived, would permit the lenders, at their option, to accelerate all outstanding debt under the ABL Facility.
Risks Related to All Tredegar’s Businesses
•Recent macroeconomic factors, including inflation, high interest rates, recession risks and other lagging effects of the COVID-19 pandemic, have caused downturns in key markets and created other commercial disruptions, which have and could further adversely impact our businesses.Products sold to key end-use markets, including the B&C and consumer electronics markets, represent a significant portion of our revenue. Because these markets are tied closely to overall economic performance, macroeconomic factors have and could further cause changes to demand for our products. These factors include: (i) inflation; (ii) high interest rates; (iii) recession risks; (iv) disruptions to supply chains; (v) other interruptions of international and regional commerce; and (vi) other lagging effects of the COVID-19 pandemic. Price erosion may occur as competitors become more aggressive in pricing practices. To the extent that these factors reduce demand for our products, our business, financial position, results of operations and cash flows could be adversely impacted.
•Tredegar’s performance is influenced by costs incurred by its operating companies, including the cost of raw materials and energy. These costs include the cost of aluminum (the raw material on which Aluminum Extrusions primarily depends), resin (the raw material on which PE Films primarily depends), PTA and MEG (the raw materials on which Flexible Packaging Films primarily depends), natural gas (the principal fuel necessary for Aluminum Extrusions’ plants to operate), electricity, diesel fuel and paint. Aluminum, resin and natural gas prices are volatile as shown in the charts in Item 7A. The Company attempts to mitigate the effects of increased costs through price increases and contractual pass-through provisions, but there are no assurances that higher prices can effectively be passed through to customers or that Tredegar will be able to offset fully or on a timely basis the effects of higher costs. Further, the Company’s cost control efforts may not be sufficient to offset any increases in raw materials, energy or other costs.
•Our failure to continue to attract, develop and retain certain key officers or employees could adversely affect our businesses. Our success depends upon the efforts and abilities of key personnel, many of whom are longstanding employees. The loss of any of these key personnel could deplete our institutional knowledge base and negatively affect our ability to efficiently operate our businesses. Certain roles have experienced high turnover in recent years, and we are experiencing an increasingly competitive labor market. Increased employee turnover could hinder our ability to execute our business strategy and adversely affect our business, financial condition, results of operations and cash flows.
•Disruptions at one of the Company’s major manufacturing facilities could negatively impact financial results. Tredegar believes it has implemented measures to minimize the risks of disruption at its facilities. However, a disruption could occur as a result of any number of events: an equipment failure with repairs requiring long lead times, labor stoppages or shortages, cybersecurity attacks, utility disruptions, constraints on the supply or delivery of critical raw materials, and severe weather conditions, including potential flooding at the Aluminum Extrusions facility located in Carthage, TN, which is located in a 50-year flood plain. A material disruption in one of the Company’s operating locations could negatively impact production and the Company’s consolidated financial condition, results of operations and cash flows.
Risks Related to Aluminum Extrusions
•Sales volume and profitability of Aluminum Extrusions is cyclical and seasonal and highly dependent on economic conditions of end-use markets in the U.S., particularly in the construction sector. Aluminum Extrusions’ end-use markets can be cyclical and subject to seasonal swings in volume. In addition, changes in architectural design, demographic, and/or remote work trends could negatively impact the overall commercial construction industry. Because of the capital-intensive nature and level of fixed costs inherent in the aluminum extrusions business, the percentage drop in earnings before interest, taxes, depreciation and amortization (“EBITDA”) from ongoing operations in a cyclical downturn will likely exceed the percentage drop in volume. In addition, during an economic slowdown, excess industry capacity often drives increased pricing pressure in many end-use markets as competitors seek to protect their position with key customers. Any benefits associated with cost reductions and productivity improvements may not be sufficient to offset the adverse effects on profitability from pricing and margin pressure and higher bad debts (including a greater chance of loss associated with customers defaulting on fixed-price forward sales contracts) that usually accompany a downturn.
•Unfairly traded imports of aluminum extrusions could injure or threaten with injury America’s domestic aluminum extrusions industry, which could have an adverse effect on the financial condition, results of operations and cash flows of Aluminum Extrusions.
1.Failure to prevent foreign competitors from evading anti-dumping and countervailing duties, or failure to reinstate the Aluminum Tariff on aluminum extrusions, could adversely impact Aluminum Extrusions. In 2018, the U.S. imposed tariffs of 10% on aluminum ingot and semi-finished aluminum imported into the U.S. from certain countries; however, in December 2020, the Department of Commerce (“DOC”) introduced a tariff exclusion process, granting applicants with tariff exclusions. In response to large and increasing volumes of unfairly traded imports of extrusions associated with these tariff exclusions, a coalition of U.S. domestic producers filed petitions with the DOC and U.S. International Trade Commission (“ITC”). In November 2023, the ITC found that there is a reasonable indication that the American aluminum extrusions industry is materially injured or threatened with injury due to imports from 14 countries, including China. The ITC’s preliminary determination found that subject import volumes were significant and increasing, and that with regard to pricing, subject imports predominantly undersold the domestic product by volume in each year of the period of investigation. On March 5, 2024, the DOC announced its preliminary finding that the governments of China, Indonesia, Mexico and Turkey unfairly subsidize their aluminum extrusion industries. The DOC calculated a range of affirmative preliminary countervailing duties from each country. A preliminary anti-dumping determination for these four countries and the 10 other countries included in the initial petition is expected in May 2024. The Company expects the final ITC vote to occur in late 2024. A failure by, or the inability of, U.S. trade officials to restore the import tariff in its full format could have an adverse effect on the businesses, financial condition, results of operations and cash flows of Aluminum Extrusions.
2.The duty-free importation of goods allowed under the United States-Mexico-Canada Agreement (“USMCA”), or other free trade agreements or duty-preference regimes, could result in lower demand for aluminum extrusions made in the U.S. As noted above, in March 2018, the U.S. imposed tariffs of 10% on aluminum ingot and semi-finished aluminum imported into the U.S. from certain countries, including countries from which Aluminum Extrusions has historically sourced aluminum products. In September 2019, the U.S., Canada and Mexico entered into the USMCA. As a result of the 10% tariffs on aluminum ingot imported to the U.S. and the duty-free importation of goods allowed under USMCA, aluminum extrusions made in Canada and Mexico that are able to take advantage of duty-preference programs upon importation into the United States are free of the
10% tariff and can now be imported into and sold in the U.S. at very competitive prices. This could result in lower demand for aluminum extrusions made in the U.S., which could negatively affect Aluminum Extrusions’ business, results of operations, financial condition and cash flows.
•The markets for Aluminum Extrusions’ products are highly competitive with product quality, service, delivery performance and price being the principal competitive factors. Aluminum Extrusions has approximately 1,100 customers that are in a variety of end-use markets within the broad categories of building and construction, distribution, automotive and other transportation, machinery and equipment, electrical and consumer durables. No single Aluminum Extrusions’ customer exceeds 4% of consolidated net sales. Future success and prospects depend on Aluminum Extrusions’ ability to provide superior service, high quality products, timely delivery and competitive pricing to retain existing customers and participate in overall industry cross-cycle growth. Failure in any of these areas could lead to a loss of customers, which could have an adverse effect on the business, financial condition, results of operations and cash flows of Aluminum Extrusions.
•The failure to successfully implement the new enterprise resource planning and manufacturing execution systems could adversely impact the Aluminum Extrusions business and results of operations. InJanuary 2022, Aluminum Extrusions commenced the implementation of new enterprise resource planning and manufacturing execution systems (“ERP/MES”) across all locations of the Aluminum Extrusions business. The implementation of these systems is a major undertaking from a financial, management, and personnel perspective. The implementations have been more difficult, time consuming and costly (approximately $21 million of spending to date) than expected. This project, which was expected to be completed in 2024, has been reorganized with an extended implementation period, due to the implementation of stringent spending measures to control financial leverage. As a result, the earliest “go-live” date for the new ERP/MES is 2025. There can be no assurance that these systems will be beneficial to the extent anticipated. Any additional disruptions, delays or deficiencies in the design and implementation of the new systems could adversely affect our financial position, results of operations and cash flows.
Risks Related to PE Films
•PE Films is highly dependent on sales associated with relatively few large customers. PE Films’ top four customers comprised approximately 10%, 10% and 13% of Tredegar’s consolidated net sales in 2023, 2022 and 2021, respectively. The loss or significant reduction of sales associated with one or more of these customers without replacement by new business could have an adverse effect on the Company. Surface Protection sales have been adversely impacted by weak market demand and competitive pricing. Customer demand for electronics has continued to deteriorate since the third quarter of 2022, causing manufacturers in the supply chain to experience reduced capacity utilization and inventory corrections. Consequently, results of operations for PE Films have been adversely impacted by weak demand for Surface Protection products.
While PE Films is undertaking efforts to expand its customer base, there can be no assurance that such efforts will be successful, or that they will offset any loss of sales and profits associated with large customer declines.
•The failure of PE Films’ customers to achieve success or maintain market share could adversely impact PE Films’ sales and operating margins. PE Films’ plastic films are used in the production of various consumer products sold worldwide. Our customers’ ability to successfully develop, manufacture and market those products is integral to PE Films’ success. Cyclical downturns and changing consumer preferences, particularly those driven by changes in technology, may negatively affect businesses that use PE Films’ plastic film products, which could adversely affect sales and operating margins. Other factors that could adversely affect the business include (i) failure by a key customer to achieve success or maintain share in markets in which they sell products containing PE Films’ materials, including as a result of customer preferences for products other than plastics, (ii) key customers using products developed by others that replace PE Films’ business with such customers, (iii) delays in a key customer rolling out products utilizing new technologies developed by PE Films, and (iv) operational decisions by a key customer that result in component substitution, inventory reductions and similar changes.
•The Company’s inability to protect its intellectual property rights or its infringement of the intellectual property rights of others could have an adverse impact on PE Films. The continued success of PE Films’ business depends on its ability not only to protect its own technologies and trade secrets, but also to develop and sell new products that do not infringe upon existing patents. Intellectual property litigation is very costly and could result in substantial expense and diversions of Company resources, both of which could adversely affect its consolidated financial condition, results of operations and cash flows. In addition, there may be no effective legal recourse against infringement of the Company’s intellectual property by third parties, whether due to limitations on enforcement of rights in foreign jurisdictions or as a result of other factors.
•Rising trade tensions could cause an increase in the cost of PE Films’ products or otherwise negatively impact the Company. A portion of PE Film’s business involves imports to and from the U.S. and other countries where the
Company produces and sells its products. Trade tensions have been rising between the U.S. and other countries, particularly China. An increase in tariffs and other trade barriers between the U.S. and China, or between the U.S. and other countries, could cause an increase in the cost of PE Films’ products or otherwise negatively impact the production and sale of the Company’s products in world markets.
•Further impairment of the Surface Protection reporting unit’s goodwill could have a non-cash adverse impact on our results of operations. The Company assesses goodwill for impairment when events or circumstances indicate that the carrying value may not be recoverable, or, at a minimum, on an annual basis (December 1st of each year). The valuation of goodwill depends on a variety of factors, including macroeconomic conditions, industry and market considerations, cost factors and overall financial performance, as well as Company and reporting unit factors, and goodwill impairment valuations can be sensitive to assumptions associated with such factors. Failure to successfully achieve projections could result in future impairments.
Risks Related to Flexible Packaging Films
•Overcapacity in Latin American polyester film production and governmental failure to extend anti-dumping duties in Brazil on imported products or prevent competitors from circumventing such duties could adversely impact Flexible Packaging Films. In recent years, excess global capacity in the industry has led to increased competitive pressures from imports into Brazil. The Company believes that these conditions have shifted the competitive environment from a regional to a global landscape and have driven price convergence and lower product margins for Flexible Packaging Films. Favorable anti-dumping rulings or countervailing duties are in effect for products imported from China, Egypt, India, Mexico, United Arab Emirates, Peru and Bahrain. Competitors not currently subject to anti-dumping duties may choose to utilize their excess capacity by selling product in Brazil, which may result in pricing pressures that Flexible Packaging Films may not be able to offset with cost savings measures and/or manufacturing efficiency initiatives.
In May 2021, the Brazilian authorities concluded the sunset review relating to the anti-dumping process for polyester film imported from China, India and Egypt, and decided to extend duties for another five years. However, due to its doubts that films would continue to be imported from China and Egypt, the government immediately suspended the implementation of the tariffs for those countries but agreed that if in the future there were volumes imported from China or Egypt which were harming the Brazilian market, authorities may promptly reinstate tariffs. Importing from Egypt increased in Brazil during 2023; therefore, Terphane requested the application of anti-dumping tariffs for Egypt, which was accepted by the Brazilian Government. These tariffs went into effect starting in November 2023. For films imported from India, the Brazilian authorities also reviewed measures against countervailing duties and extended those for five years as well.
In February 2024, the Brazilian Government determined that the anti-dumping measures against Mexico and United Arab Emirates should be extended for a five-year period and anti-dumping measures against Turkey should be removed.
•A history of uncertain economic conditions in Brazil could adversely impact the financial condition, results of operations and cash flows of Flexible Packaging Films. For flexible packaging films produced in Brazil, selling prices and key raw material costs are principally determined in U.S. Dollars and are impacted by local economic conditions and local and global competitive dynamics. Flexible Packaging Films is exposed to foreign exchange translation risk (its functional currency is the Brazilian Real) because almost 90% of the sales of Flexible Packaging Films business unit in Brazil (“Terphane Ltda.”) and substantially all of its related raw material costs are quoted or priced in U.S. Dollars while its variable conversion, fixed conversion and sales, general and administrative costs before depreciation & amortization (collectively “Terphane Ltda. Operating Costs”) are quoted or priced in Brazilian Real. This mismatch, together with a variety of economic variables impacting currency exchange rates, causes volatility that could negatively or positively impact EBITDA from ongoing operations for Flexible Packaging Films. While Flexible Packaging Films hedges this exposure on a short-term basis with foreign exchange forward rate contracts, the exposure continues to exist beyond the hedging periods.
Other Business Risks
•A failure in the Company’s information technology systems as a result of cybersecurity attacks or other causes could negatively affect Tredegar’s business. The Company depends on information technology (“IT”) to record and process customer orders, manufacture and ship products in a timely manner, secure its production processes and know-how, maintain the financial accuracy of its business records and maintain personally identifiable information of its employees. An IT system failure due to computer viruses, internal or external security breaches, cybersecurity attacks or other malicious causes could disrupt our operations and prevent us from being able to process transactions with our customers, operate our manufacturing facilities and properly report transactions in a timely manner. Increased global IT security threats and cyber-crime pose a potential risk to the security and availability of the Company’s IT systems, networks and services, including those that are managed, hosted, provided or used by third parties, as well as to the confidentiality, availability and integrity of the Company’s data. Additionally, increased cybersecurity risk arises due to certain employees working remotely. To date, interruptions of the Company’s IT systems have been infrequent, and Tredegar
has not experienced a material cybersecurity incident. A significant prolonged failure of or security breach of the IT systems, networks or service providers the Company relies upon, or a loss or disclosure of business or other sensitive information, or personally identifiable information, as a result of a cybersecurity incident or other cause, could result in substantial costs to the Company, damage to the Company’s reputation, regulatory enforcement actions and lawsuits and could adversely affect the Company’s business, results of operations, financial condition or cash flows.
•The Company’s results of operations, financial condition and cash flows have been and could be impacted by the macroeconomic effects of a pandemic.The COVID-19 pandemic had multiple adverse effects on the global economy, including short-term impacts affecting labor supply and causing supply chain disruptions which led to inflationary pressures. In addition, the pandemic resulted in certain after-shocks and structural shifts, which have adversely impacted Tredegar’s markets.
In the event of a future pandemic, Tredegar’s businesses, our suppliers, contractors and third-party logistic providers could experience conditions similar to those associated with the COVID-19 pandemic, including facility closures, labor constraints, supply chain disruptions and other challenges. These challenges could impact our ability to maintain sufficient inventory and to accurately predict demand or lead times, which could inhibit our ability to service customer demand. Additionally, a future pandemic could heighten other risks described above.
•Tredegar is subject to current and future governmental regulations, including environmental laws and regulations, and could become exposed to liabilities and costs associated with such regulation. The Company is subject to regulation by local, state, federal and foreign governmental authorities. New laws and regulations, or changes to existing laws, including those relating to environmental matters (including global climate change and plastic products), and privacy matters, could subject Tredegar to significant additional capital expenditures, operating expenses or other compliance costs. Moreover, future developments in federal, state, local and international laws and regulations, including environmental laws, are difficult to predict. Environmental laws and privacy restrictions have become and are expected to continue to become increasingly strict. As a result, Tredegar expects to be subject to new environmental and privacy laws and regulations. However, any such changes are uncertain and, therefore, it is not possible for the Company to predict with certainty the amount of additional capital expenditures or operating expenses that could be necessary for compliance with respect to any such changes.
The Company is subject to the U.S. Foreign Corrupt Practices Act, Brazilian anti-corruption laws and similar anti-bribery laws in other jurisdictions, which generally prohibit companies and their intermediaries from making improper payments to foreign officials for the purpose of obtaining or retaining business. Although we have policies and procedures designed to facilitate compliance with these laws and regulations, our employees, contractors and agents may take actions in violation of our policies. Any such violation, even if prohibited by our policies, could adversely affect our business and/or our reputation.
Item 1B. UNRESOLVED STAFF COMMENTS
None.
Item 1C. CYBERSECURITY
Tredegar’s business model depends on the efficiency and reliability of its information systems, networks, and essential assets, with a portion of these systems and networks being administered by third-party service providers. Tredegar’s Cybersecurity Program (the “Program”), which was designed utilizing a risk-based approach, was developed to not only prevent, identify, investigate, resolve, and mitigate potential cybersecurity vulnerabilities within Tredegar but also to enhance the information security posture of Tredegar’s operations involving third-party service providers.
Tredegar entrusts the third-party service providers with the responsibility to institute security measure protocols that are appropriately and proportionally tailored to the corresponding risks. Additionally, Tredegar also periodically conducts assessments of the third-party service providers’ security frameworks to verify the implementation of adequate security measures, to safeguard Tredegar against potential vulnerabilities.
The Program leverages a blend of automated systems, manual operations, and external evaluations to proactively identify and mitigate potential cybersecurity threats. Key components of the program include Tredegar’s Cybersecurity Incident Response Plan and Cyber Crisis Management Plan. These plans encompass a strategic approach that includes detection of threats, thorough analysis of cybersecurity incidents to determine whether timely notification to the Board of Directors is necessary, containment of incidents, eradication or mitigation of threats, recovery processes, and a comprehensive post-incident review.
To further strengthen its cybersecurity posture, Tredegar employs third-party consultants who work with the internal audit and information technology (“IT”) departments to assess Tredegar’s information security program and practices, including incident management, service continuity, and information security compliance programs, and identify areas for improvement.
The results of such an assessment are regularly presented to the Audit Committee. Notably, these assessments include periodic penetration tests, which allow Tredegar to identify vulnerabilities, refine procedures, and enhance its crisis management and recovery capabilities. The Program is also supported by an organizational structure, involving collaboration across various business sectors and an interdisciplinary Global Data Protection and Cybersecurity Oversight Team that meets regularly to identify information security risks and appropriate risk mitigation strategies. Additionally, because Tredegar recognizes the significant role that its employees play in information security, it provides annual formal information security training to all of its employees that covers critical topics such as phishing and email security best practices.
Tredegar’s IT Director has over 10 years of cybersecurity expertise, including a robust history of similar roles, cybersecurity certifications from EC-Council and ODU Global and holds a degree in Computer Science from Universidade Catolica de Pernambuco and an MBA in IT Management from Universidade Federal de Pernambuco. Our IT Director is responsible for overseeing the Program, including the prevention, mitigation, detection, and remediation of cybersecurity incidents. Tredegar’s IT Director also regularly collaborates closely with key management, including the Chief Financial Officer, General Counsel, Compliance Manager, and Human Resources Executive SummaryDirector, to foster effective communication within Tredegar.
The Board is responsible for risk management, with specific oversight of cybersecurity risks being delegated to the Audit Committee. The Audit Committee receives updates from the IT Director at each of its quarterly meetings. These updates encompass an assessment of Tredegar’s cybersecurity risk profile, including the efficacy of Tredegar’s cybersecurity policies, procedures, strategies, and areas of emerging risk. Additionally, the Board receives annual, but often more frequent, updates on Tredegar’s cybersecurity systems.
Item 2. PROPERTIES
General
Most of the improved real property and the other assets used in the Company’s operations are owned. Certain of the owned property is subject to an encumbrance under the ABL Facility. See Note 7 “Debt and Credit Agreements” to the Consolidated Financial Statements in Item 15 for more information.
Tredegar considers the manufacturing facilities, warehouses and other properties and assets that it owns or leases to be in generally good condition. Capacity utilization at its various manufacturing facilities can vary with product mix and normal fluctuations in sales levels. The Company believes that its Bonnell Aluminum, PE Films and Flexible Packaging Films manufacturing facilities have sufficient capacity to meet current production requirements. Tredegar’s corporate headquarters, which is leased, is located at 1100 Boulders Parkway, Richmond, Virginia 23225.
The Company’s principal manufacturing plants and facilities as of December 31, 2023 are listed below:
Aluminum Extrusions
| | | | | | | | | | | | | | |
| Locations in the U.S. | | Locations Outside the U.S. | | Principal Operations |
Carthage, Tennessee
Clearfield, Utah (leased)
Elkhart, Indiana
Newnan, Georgia
Niles, Michigan | | None | | Production of aluminum extrusions, fabrication and finishing |
PE Films
| | | | | | | | | | | | | | |
| Locations in the U.S. | | Locations Outside the U.S. | | Principal Operations |
| Pottsville, Pennsylvania | | Guangzhou, China | | Production of plastic films |
Flexible Packaging Films
| | | | | | | | | | | | | | |
| Locations in the U.S. | | Locations Outside the U.S. | | Principal Operations |
| Bloomfield, New York (technical center and production facility) | | Cabo de Santo Agostinho, Brazil | | Production of PET-based films |
Item 3. LEGAL PROCEEDINGS
The information required by this Item 3 is set forth in Note 16 "Contingencies" to the Consolidated Financial Statements in Item 15 and is hereby incorporated herein by reference.
Item 4. MINE SAFETY DISCLOSURES
None.
PART II
Item 5. MARKET FOR REGISTRANT’S COMMON EQUITY, RELATED STOCKHOLDER MATTERS AND ISSUER PURCHASES OF EQUITY SECURITIES
Tredegar’s common stock is traded on the New York Stock Exchange (“NYSE”) under the ticker symbol “TG”. There were 34,430,769 shares of common stock held by 1,559 shareholders of record on March 8, 2024.
Dividend Information
Prior to the third quarter of 2023, Tredegar paid a regular cash dividend every quarter since becoming a public company in July 1989. Under the ABL Facility, the Company is prohibited from making dividend payments during the fiscal quarters ending September 30, 2023 through December 31, 2024. See Note 7 “Debt and Credit Agreements” to the Consolidated Financial Statements in Item 15 for more information on the Company’s ABL Facility.
All decisions with respect to the declaration and payment of future dividends will be made by the Board in its sole discretion based upon earnings, financial condition, anticipated cash needs and other such considerations as the Board deems relevant.
Issuer Purchases of Equity Securities
On January 7, 2008, Tredegar announced that the Board approved a share repurchase program whereby management is authorized at its discretion to purchase, in the open market or in privately negotiated transactions, up to 5 million shares of the Company’s outstanding common stock. The authorization has no time limit. Tredegar did not repurchase any shares in the open market or otherwise in 2023, 2022 or 2021 under this standing authorization. The maximum number of shares remaining under this standing authorization was 1,732,003 at December 31, 2023. Under the ABL Facility, the Company is prohibited from making share repurchases during the fiscal quarters ending September 30, 2023 through December 31, 2024.
Stock Performance Graph
The following graph compares cumulative total shareholder returns for Tredegar, the S&P SmallCap 600 Stock Index (an index comprised of companies with market capitalizations similar to Tredegar) and the Russell 2000 Index for the five years ended December 31, 2023. Tredegar is part of both the S&P SmallCap 600 Index and Russell 2000 Index.
COMPARISON OF 5 YEAR CUMULATIVE TOTAL RETURN*
Among Tredegar Corporation, the S&P SmallCap 600 Index, and the Russell 2000 Index

| | |
*$100 invested on 12/31/18 in stock or index, including reinvestment of dividends. Fiscal year ending December 31.
Copyright© 2023 Standard & Poor's, a division of S&P Global. All rights reserved. Copyright© 2023 Russell Investment Group. All rights reserved. |
Item 6. [RESERVED]
Item 7. MANAGEMENT’S DISCUSSION AND ANALYSIS OF FINANCIAL CONDITION AND RESULTS OF OPERATIONS
The following discussion and analysis of our financial condition and results of operations focuses on and is intended to clarify the results of our operations, certain changes in our financial position, liquidity, capital structure and business developments for the periods covered by the consolidated financial statements included in this Form 10-K. This discussion should be read in conjunction with, and is qualified by reference to, the other related information including, but not limited to, the audited consolidated financial statements (including the notes thereto) and the description of our business, all as set forth in this Form 10-K, as well as the risk factors discussed above in Item 1A.
This section provides discussion and a year-to-year comparison for the years ended December 31, 2023 and 2022.
Business Overview
General
Tredegar Corporation is an industrial manufacturer with three primary businesses: custom aluminum extrusions for the North American building & construction,B&C, automotive and specialty end-use markets through its Aluminum Extrusions segment; surface protection films for high-technology applications in the global electronics industry through its PE Films segment; and specialized polyester films primarily for the Latin American flexible packaging market through its Flexible Packaging Films segment. With approximately 2,4001,900 employees, the Company operates manufacturing facilities in North America, South America, and Asia.
On October 30, 2020, the Company completed the sale of its personal care films business (“Personal Care Films”). The transaction excluded the packaging film lines and related operations located at the Pottsville, Pennsylvania manufacturing site (“Pottsville Packaging”), which are now being reported within the Surface Protection component of PE Films. Commencing in the third quarter of 2020, all historical results for Personal Care Films have been presented as discontinued operations. For more information on these transactions, see Note 2 to the Consolidated Financial Statements in Item 15.
Sales were $755.3 million in 2020 compared to $826.3 million in 2019. Net loss from continuing operations was $16.8 million ($0.51 per diluted share) in 2020, compared with net income from continuing operations of $58.5 million ($1.76 per diluted share) in 2019.
The 2020 results include:
•An after-tax loss on the Company’s investment in kaléo of $47.6 million ($1.42 per diluted share), which is accounted for under the fair value method (see Note 4 to the Consolidated Financial Statements in Item 15 for more details); and
•An impairment of the total goodwill balance of Aluminum Extrusions' reporting unit acquired in the AACOA acquisition in 2012 was recorded in the after-tax amount of $10.5 million ($0.32 per diluted share).
The 2019 results include:
•An after-tax dividend received from kaléo of $14.8 million ($0.45 per diluted share); and
•An unrealized after-tax gain on the Company’s investment in kaléo of $8.5 million ($0.26 per diluted share).
The 2018 results include:
•An unrealized after-tax gain on the Company’s investment in kaléo of $23.9 million ($0.72 per diluted share).
Other losses related to asset impairments and costs associated with exit and disposal activities for continuing operations were not material for the years ended December 31, 2020, 2019 and 2018, respectively. Losses associated with plant shutdowns, asset impairments, restructurings and other items are described in Results of Operations. Earnings before interest, taxes, depreciation and amortization (“EBITDA”)EBITDA from ongoing operations is the measure of segment profit and loss used by Tredegar’s chief operating decision maker (“CODM”) for purposes of assessing financial performance. The Company uses sales less
freight (“net sales”) from continuing operations as its measure of revenues from external customers at the segment level. This measure is separately included in the financial information regularly provided to the CODM.
EBIT (earningsEarnings before interest and taxes)taxes (“EBIT”) from ongoing operations is a non-GAAP financial measure included in the reconciliation of segment financial information to consolidated results for the Company. ItCompany in Note 13 “Business Segments” to the Consolidated Financial Statements in Item 15. EBIT is not intended to represent the stand-alone results for Tredegar’sTredegar's ongoing operations under GAAP and should not be considered as an alternative to net income (loss) as defined by GAAP. We believe that EBIT is a widely understood and utilized metric that is meaningful to certain investors. We believeinvestors and that including this financial metric in the reconciliation of management’s performance metric, EBITDA from ongoing operations, provides useful information to those investors that primarily utilize EBIT to analyze the Company’s core operations.
THE IMPACT OF COVID-19Sales were $704.8 million in 2023 compared to $938.6 million in 2022. Net income (loss) was $(105.9) million ($(3.10) per diluted share) in 2023, compared with net income (loss) of $28.5 million ($0.84 per diluted share) in 2022.
Essential Business and Employee Considerations2023 Financial Results Highlights
The Company’s priorities during the COVID-19 pandemic continue to be to protect the health and safety of employees while keeping its manufacturing sites open due to the essential nature of many of its products. Within the limitations imposed by the health and safety procedures described below, the Company has continued to manufacture the full range of products at its facilities.
The Company’s protocols to protect the health and well-being of its employees from COVID-19 continue to develop as COVID-19 informed work practices evolve and the Company responds to recommended and mandated actions of government and health authorities. In addition, to facilitate a return to fully functional operations, the Company has undertaken an education campaign to provide employees with the most accurate and up-to-date information available, particularly from the Centers for Disease Control (“CDC”), the Office of the Surgeon General and state and local health departments. The Company believes that these efforts will encourage employees to receive a vaccine when they are eligible.
The Company has educated employees about COVID-19, including how the virus is spread, COVID-19 symptoms and mitigation efforts to keep employees safe. Even in those facilities not bound by the Families First Coronavirus Response Act, the Company has adopted COVID-19 related pay and sick leave policies and remote work policies that require employees to stay home if they feel ill or have been exposed to others with the illness, until they are cleared to return to work by our Human Resources team, who applies CDC and other state health department guidance to each case. The Company’s policies include: mandating employees self-monitor for symptoms; taking an employee’s temperature before entering production facilities; answering self-screening questions related to potential exposure and COVID-19 symptoms; mandating frequent handwashing; requiring social distancing; requiring face coverings on production floors at all times and in common areas and office settings where social distancing is difficult; streamlining onsite personnel to only those required for production and distribution; strongly encouraging and, where mandated, requiring remote work for all those who can work from home; limiting travel to essential business purposes; and regularly cleaning and disinfecting facilities. In the U.S., the Company has educated employees on COVID-19-related government benefits and has provided such benefits even in those facilities where the government benefits are not mandated.
Bonnell Aluminum is experiencing higher than normal absenteeism and hiring difficulties, which it attributes to COVID-19-related factors. Bonnell Aluminum attempts to match its direct labor with demand and is facing difficulty maintaining sufficient labor to meet desired shipment levels.
Financial Considerations
The 2020 annual plan for Bonnell Aluminum (pre-COVID-19) included sales volume of 201 million pounds and •EBITDA from ongoing operations for Aluminum Extrusions of $65$38.0 million versus 2019 sales volumewas $28.8 million lower than the year of 208 million pounds and 2022.
•EBITDA from ongoing operations for PE Films of $65.7 million. Actual 2020 sales volume$11.2 million was 186$0.7 million pounds and lower than the year of 2022.
•EBITDA from ongoing operations for Flexible Packaging Films of $4.4 million was $55.1 million. Approximately 62%$23.1 million lower than the year of Bonnell Aluminum’s2022.
Gains and losses associated with exit and disposal activities, plant shutdowns, asset impairments, restructurings and other items are described in Results of Operations below.
Results of Operations
2023 versus 2022
The following table presents a bridge of consolidated net income (loss) from the year of 2022 to the year of 2023 with related management’s discussion and analysis below the table.
| | | | | | | | |
| (In thousands) | | |
| Net income (loss) for the year ended December 31, 2022 | | $ | 28,455 | |
| Income tax expense (benefit) | | 4,389 | |
| Income (loss) before income taxes for the year ended December 31, 2022 | | 32,844 | |
| Change in income (loss) from increases (decreases) in the following items: | | |
| Sales | | (233,739) | |
| Other income (expense), net | | (3,156) | |
| Total | | (236,895) | |
| Change in income (loss) from (increases) decreases in the following items: | | |
| Cost of goods sold | | 164,932 | |
| Freight | | 8,049 | |
| Selling, general and administrative | | 2,583 | |
| Research and development | | 2,453 | |
| Interest expense | | (6,617) | |
| Pension settlement loss | | (92,291) | |
| Goodwill impairment | | (34,891) | |
| Other | | (197) | |
| Total | | 44,021 | |
| Income (loss) before income taxes for the year ended December 31, 2023 | | (160,030) | |
| Income tax expense (benefit) | | (54,125) | |
| Net income (loss) for the year ended December 31, 2023 | | $ | (105,905) | |
Sales in 2023 decreased by 24.9% compared with 2022. Net sales decreased 25.6% in Aluminum Extrusions primarily due to lower sales volume and the pass-through of lower metal costs. Net sales decreased 21.3% in 2020 was relatedPE Films primarily due to buildinglower volume in Surface Protection, resulting from weak demand in the consumer electronics market and construction (“B&C”) markets (non-residential B&C of 55% and residential B&C of 7%). Much of the 2020customer inventory corrections during 2023. Net sales decreased in Flexible Packaging Films by 24.9% primarily due to lower sales volume associated with the B&C market was related to contractsand lower margin that existed at the start of the COVID-19 pandemic. With the completion of many of these contracts, Bonnell began experiencing weakness in the B&C market during the fourth quarter of 2020. Overall, the Company believes thatare driven by excess global capacity and competition in Brazil from imports, partially offset by favorable product mix. For more information on changes in net sales and volume, results for Bonnell Aluminumsee the Segment Operations Review section below.
Other income (expense), net was $(2.1) million in 2020 have outperformed2023 compared to $1.0 million in 2022. The change in other income (expense), net was primarily due a $2.0 million charge to adjust the industry, and performanceinitial purchase price of the nonparticipating single premium group annuity contract as a result of the routine administrative process to date duringtransition the COVID-19 environment has exceeded the Company's expectations, with current bookings and backlog at high levels. No significant issues have arisenpension plan. Also, there was cash consideration of $0.3 million received in January 2023 compared to date$1.4 million received in May 2022 related to customary post-closing adjustments on the collectionsale of accounts receivable at Bonnell Aluminum.the investment in kaleo, Inc., which was sold in December 2021. See Note 9 “Other Income (Expense), net” to the Consolidated Financial Statements in Item 15 for additional information.
Demand has remained strong under COVID-19 conditions for the Company’s flexible food packaging films produced by Terphane. Consolidated gross profit (sales minus cost of goods sold and freight) as a percentage of sales (gross profit margin) was 11.2% in 2023 versus 14.9% in 2022.
•The Surface Protection component of PE Films had record performance for EBITDA from ongoing operationsgross profit margin in Aluminum Extrusions decreased primarily due to: lower volume; higher labor and employee-related costs; lower labor productivity in the second quarter and first half of 2020, but it experienced a slowdown in the third quarter,2023; higher supply expense (including higher paint expense associated with a portion of the decline in volume relatedshift to a previously disclosed customermore painted product transitionthroughout 2023 and customer inventory corrections. The Company believes that while Surface Protection’s customer inventory corrections were largely resolved during the third quarter of 2020, it will experience a significant decline in volumeinflationary costs for other supplies); and profitabilityhigher freight rates; partially offset by higher pricing (primarily in the first quarter of 2021 as a result2023); lower utility costs; and favorable LIFO inventory adjustments in 2023 versus 2022. Additionally, the timing of the customer productflow through under the first-in first-out method of aluminum raw material costs passed through to customers, previously acquired at higher prices in a quickly changing commodity pricing environment, resulted in a charge of $1.1 million in 2023 versus a benefit of $0.1 million in 2022.
•The gross profit margin in PE Films increased primarily due to higher overwrap films contribution margin associated with higher volume and favorable mix, cost improvements and favorable LIFO inventory adjustments for both Surface
transition. SeeProtection and overwrap films in 2023 versus 2022, partially offset by lower contribution margin for Surface Protection associated with a market slowdown, customer inventory corrections for non-transitioning products and for previously disclosed customer product transitions.
•The gross profit margin in Flexible Packaging Films decreased primarily due to lower sales volume, lower selling prices from the PE Filmspass-through of lower resin costs and margin pressures and higher fixed and variable costs, partially offset by lower raw material costs.
For more information on changes in operating costs and expenses, see the Segment Operations Review section below for further discussion. No significant issues have arisen to date onbelow.
As a percentage of sales, selling, general and administrative (“SG&A”) and R&D expenses were 11.3% in 2023 compared with 9.1% in 2022. While SG&A and R&D expenses decreased 3.3% and 39.5% year-over-year, sales decreased $233.7 million or 24.9% compared with the collection of accounts receivable at Terphane or Surface Protection.
Tredegar owns approximately 20% of kaleo, Inc. (“kaléo”), which makes and sells an epinephrine delivery device under the name AUVI-Q®. The Company accounts for its investment in kaléo on a fair value basis. The Company’s estimate of the fair value of its interest in kaléo at December 31, 2020 was $34.6 million ($29.7 million after taxes), which represents an increase of $0.1 million ($0.1 million after taxes) and a decrease of $60.9 million ($47.6 million after taxes) since September 30, 2020 and December 31, 2019, respectively. The decline in estimated fair value in 2020prior year period. Lower SG&A spending was primarily due to: (i) current projections that assume ongoing pricing pressures, (ii) expectedto lower employee-related compensation and lower stock-based compensation, partially offset by higher professional fees associated with business development activities.
For more information on changes in market access as well as continued lower market demand for epinephrine delivery devices resulting from COVID-19-driven delaysinterest expense, see the “Corporate Expenses, Interest and Other” section of the Segment Operations Review section below.
During 2023, the Company settled the pension plan, which resulted in in-person back-to-school schedules and social distancing guidelines, and (iii) a higher private company liquidity discount.kaléo’s stock is not publicly traded. The ultimate value of Tredegar’s ownership interest in kaléo could be materially different from the $34.6 million estimated fair value reflectedpre-tax pension settlement loss in the consolidated results of operation of $92.3 million. On November 3, 2023, the pension plan termination and settlement process was completed, and the Company’s financial statements at December 31, 2020.relevant pension plan obligation was transferred to Massachusetts Mutual Life Insurance Company. See Note 8 “Retirement Plans and Other Postretirement Benefits” to the Consolidated Financial Statements in Item 15 for more information.
Total debtDuring 2023, a non-cash partial goodwill impairment of $34.9 million was $134 million at December 31, 2020,recognized, see Note 1 “Nature of Operations and Summary of Significant Accounting Policies” to the Consolidated Financial Statements in Item 15 for more information.
The effective tax rate used to compute income taxes for the year of 2023 was 33.8%, compared to $42 million at December 31, 2019. Net debt (debt13.4% in excess of cash and cash equivalents), a non-GAAP financial measure, was $122.2 million at December 31, 2020, compared2022. The increase in the effective tax rate is primarily due to $10.6 million at December 31, 2019. In December 2020, the Company paid a special dividend of $5.97 per share or $200 million,tax benefits previously recorded in other comprehensive income (loss) that were released as a result of strong cash generationthe pension plan termination, partially offset by a reduction in Brazilian tax incentives as a percentage of income. The stranded taxes released with the termination of the pension plan represent the effect of the change in federal and overall net cash proceeds of approximately $46 million relatingstate tax rates on pension-related deferred tax items initially recorded in other comprehensive income. The related stranded taxes were released in full in 2023. See Note 12 “Income Taxes” to the sale of Personal Care Films. The overall net cash proceeds resulted from net proceeds of $53 million receivedConsolidated Financial Statements in Item 15 for additional information.
Pre-tax gains and losses associated with plant shutdowns, asset impairments, restructurings and other items in 2023 detailed below are shown in the fourth quarterstatements of 2020 less $7 millionnet sales and EBITDA from ongoing operations by segment table in Note 13 “Business Segments” to the Consolidated Financial Statements in Item 15 and are included in “Asset impairments and costs associated with exit and disposal activities, net of expected expenditures during 2021, primarily related to information technology transition services and severance. The Company’s revolving credit agreement allows borrowings of up to $375 million and matures in June 2024. The Company believes that its most restrictive covenant (computed quarterly) is the leverage ratio, which permits maximum borrowings of up to 4x EBITDA, as defined under the revolving credit agreement for the trailing four quarters (“Credit EBITDA”). The Company had Credit EBITDA and a leverage ratio (calculatedadjustments” in the “consolidated statements of income, unless otherwise noted.
| | | | | | | | | | | | | | | | | |
| ($ in millions) | Q1 | Q2 | Q3 | Q4 | 2023 |
| Aluminum Extrusions: | | | | | |
| (Gains) losses associated with plant shutdowns, asset impairments and restructurings: | | | | | |
| Other restructuring costs - severance | $ | — | | $ | — | | $ | 0.1 | | $ | — | | $ | 0.1 | |
| (Gains) losses from sale of assets, investment writedowns and other items: | | | | | |
Consulting expenses for ERP/MES project1 | — | | — | | 1.2 | | 0.6 | | 1.8 | |
Storm damage to the Newnan, Georgia plant1 | 0.6 | | (0.2) | | 0.1 | | — | | 0.5 | |
Legal fees associated with the Aluminum Extruders Trade Case1 | — | | — | | — | | 0.5 | | 0.5 | |
| Total for Aluminum Extrusions | $ | 0.6 | | $ | (0.2) | | $ | 1.4 | | $ | 1.1 | | $ | 2.9 | |
| PE Films: | | | | | |
| (Gains) losses associated with plant shutdowns, asset impairments and restructurings: | | | | | |
Impairment of Richmond, Virginia Technical Center assets3 | $ | — | | $ | — | | $ | 3.4 | | $ | 0.1 | | $ | 3.5 | |
Richmond, Virginia Technical Center closure expenses, including severance3 | — | | — | | 1.2 | | 0.1 | | 1.3 | |
Richmond, Virginia Technical Center accelerated depreciation3 | — | | — | | — | | 0.3 | | 0.3 | |
Richmond, Virginia Technical Center lease modification3 | — | | — | | — | | (0.1) | | (0.1) | |
Goodwill impairment3 | — | | 15.4 | | 19.5 | | — | | 34.9 | |
| Total for PE Films | $ | — | | $ | 15.4 | | $ | 24.1 | | $ | 0.4 | | $ | 39.9 | |
| Flexible Packaging Films: | | | | | |
| (Gains) losses associated with plant shutdowns, asset impairments and restructurings: | | | | | |
| Other restructuring costs - severance | $ | 0.1 | | $ | — | | $ | — | | $ | — | | $ | 0.1 | |
| Total for Flexible Packaging Films | $ | 0.1 | | $ | — | | $ | — | | $ | — | | $ | 0.1 | |
| Corporate: | | | | | |
| (Gain) losses from sale of assets, investment writedowns and other items: | | | | | |
Professional fees associated with business development activities1 | $ | 0.2 | | $ | 1.5 | | $ | 2.9 | | $ | 0.7 | | $ | 5.3 | |
Professional fees associated with remediation activities related to internal control over financial reporting1 | 0.5 | | 0.5 | | 0.2 | | 0.8 | | 2.0 | |
Write-down of investment in Harbinger Capital Partners Special Situations Fund2 | — | | 0.2 | | — | | — | | 0.2 | |
Group annuity contract premium expense2 | — | | — | | — | | 2.0 | | 2.0 | |
Net periodic benefit cost for the frozen defined benefit pension plan in process of termination4 | 3.4 | | 3.4 | | 3.1 | | 0.9 | | 10.8 | |
Pension settlement loss4 | — | | — | | 25.6 | | 66.7 | | 92.3 | |
| Total for Corporate | $ | 4.1 | | $ | 5.6 | | $ | 31.8 | | $ | 71.1 | | $ | 112.6 | |
1.Included in “Selling, R&D and general expenses” in the consolidated statements of income. 2.Included in “Other income (expense), net” in the consolidated statements of income. 3.For more information, see the "PE Films" section below. 4. For more information, see the "Status of Current Corporate Strategic Initiatives" section below and Note 4 “Retirement Plans and Other Postretirement Benefits to the Consolidated Financial Statements in Item 15. |
Average total debt outstanding and Capital Resourcesinterest rates were as follows:
| | | | | | | | | | | |
| (In millions, except percentages) | 2023 | | 2022 |
| Floating-rate debt with interest charged on a rollover basis plus a credit spread: | | | |
| Average total outstanding debt balance | $ | 152.3 | | | $ | 114.5 | |
| Average interest rate | 7.2 | % | | 3.5 | % |
” below) of $93.4 million and 1.43x, respectively, at December 31, 2020. The Company’s current stress testing under a COVID-19-driven recession indicates a low probability that a future leverage ratio will exceed 4.0x. See the “Liquidity and Capital Resources” below for a reconciliation of net debt, a non-GAAP financial measure, to the most directly comparable GAAP financial measure.
OPERATIONS REVIEW
Segment Analysis. A summary of results for 2020 versus 2019 for each of the Company’s reporting segments is shown below.Operations Review
Aluminum Extrusions
A summary of results for Aluminum Extrusions is provided below:
| | Year Ended | | Favorable/ |
| Year Ended | | | Year Ended | | Favorable/ |
| (In thousands, except percentages) | (In thousands, except percentages) | December 31, | | (Unfavorable) | (In thousands, except percentages) | December 31, | | (Unfavorable) |
| 2020 | | 2019 | | % Change | 2023 | | 2022 | | % Change |
| Sales volume (lbs) | Sales volume (lbs) | 186,391 | | | 208,249 | | | (10.5) | % | Sales volume (lbs) | 138,451 | | | 174,670 | | 174,670 | | | (20.7) | | (20.7) | % |
| Net sales | Net sales | $ | 455,711 | | | $ | 529,602 | | | (14.0) | % | Net sales | $ | 474,803 | | | $ | | $ | 637,872 | | | (25.6) | | (25.6) | % |
| Ongoing operations: | Ongoing operations: | |
| EBITDA | EBITDA | $ | 55,137 | | | $ | 65,683 | | | (16.1) | % |
| Depreciation & amortization* | (17,403) | | | (16,719) | | | (4.1) | % |
| EBIT** | $ | 37,734 | | | $ | 48,964 | | | (22.9) | % |
| EBITDA | |
| EBITDA | | $ | 37,976 | | | $ | 66,800 | | | (43.1) | % |
| Depreciation & amortization | | Depreciation & amortization | (17,927) | | | (17,414) | | | (2.9) | % |
| EBIT | | EBIT | $ | 20,049 | | | $ | 49,386 | | | (59.4) | % |
| Capital expenditures | Capital expenditures | $ | 10,260 | | | $ | 17,855 | | |
* Excludes pre-tax accelerated amortization of trade names of $10.0 million in the year ended December 31, 2019. ** See the table in Item 6. “Selected Financial Data” of this Form 10-K (“Item 6”) for a reconciliation of this non-GAAP measure to GAAP. |
Net sales in 20202023 decreased by 14.0% versus 2019 25.6% versus 2022 primarily due to lower sales volume and the pass-through of lower metal costs, partially offset by an increase in average selling prices to cover higher operating costs. Sales volume in 2020 decreased by 10.5% versus 2019 with declines in all key markets, which the Company believes was mainly a result of COVID-19-related lower demand.
EBITDA from ongoing operations in 2020 decreased by $10.5$28.8 million in comparison to 20192023 versus 2022, primarily due to lowerto:
•Lower volume ($16.129.6 million) and, higher labor and employee-related costs ($4.3 ($4.5 million), lower labor productivity in the first half of 2023 ($0.9 million), higher supply expense, including higher paint expense associated with a shift to more painted product throughout 2023 and inflationary costs for other supplies ($1.2 million), higher freight rates ($0.8 million) and higher SG&A expenses ($1.5 million); partially offset by higher pricing, primarily in the first quarter of 2023 ($8.14.0 million), lower freight ($0.8 million) and lower travel and entertainment expenses as a result of COVID-19utility costs ($0.92.3 million).;
20•The timing of the flow-through under the FIFO method of aluminum raw material costs passed through to customers, previously acquired at higher prices in a quickly changing commodity pricing environment, resulted in a charge of $1.1 million in 2023 versus a benefit of $0.1 million in 2022; and
Aluminum Extrusions believes that it has adequate supply agreements for aluminum raw materials in 2024. See discussion of quantitative and qualitative disclosures about market risk in Item 7A in this Form 10-K for additional information on aluminum price trends.
Projected Capital Expenditures and Depreciation & Amortization
Capital expenditures for Bonnell Aluminum are projected to be $21$9 million in 2021,2024, including $3 million for infrastructure upgrades at the Carthage, Tennessee and Newnan, Georgia facilities, $3 million for a roof replacement at the Elkhart, Indiana site and $4 million for strategic projects. In addition, approximately $11productivity projects and $5 million will befor capital expenditures required to support continuity of current operations. The projected spending reflects stringent spending measures that the Company has implemented to control its financial leverage (see the Liquidity and Capital Resources section for more information). The multi-year implementation of the new ERP/MES has been reorganized with an extended implementation period. As a result, the earliest “go-live” date for the new ERP/MES is 2025. The ERP/MES project commenced in 2022, with spending to-date of approximately $21 million. Depreciation expense is projected to be $14$16 million in 2021.2024. Amortization expense is projected to be $3$2 million in 2021.2024.
PE Films
A summary of results for PE Films is provided below:
| | Year Ended | | Favorable/ |
| Year Ended | | | Year Ended | | Favorable/ |
| (In thousands, except percentages) | (In thousands, except percentages) | December 31, | | (Unfavorable) | (In thousands, except percentages) | December 31, | | (Unfavorable) |
| 2020 | | 2019 | | % Change | 2023 | | 2022 | | % Change |
| Sales volume (lbs) | Sales volume (lbs) | 45,175 | | | 43,983 | | | 2.7 | % | Sales volume (lbs) | 29,355 | | | 32,873 | | 32,873 | | | (10.7) | | (10.7) | % |
| Net sales | Net sales | $ | 139,288 | | | $ | 133,807 | | | 4.1 | % | Net sales | $ | 76,763 | | | $ | | $ | 97,571 | | | (21.3) | | (21.3) | % |
| Ongoing operations: | Ongoing operations: | |
| EBITDA | EBITDA | $ | 45,107 | | | $ | 41,133 | | | 9.7 | % |
| EBITDA | |
| EBITDA | | $ | 11,217 | | | $ | 11,949 | | | (6.1) | % |
| Depreciation & amortization | Depreciation & amortization | (6,762) | | | (5,860) | | | (15.4) | % | Depreciation & amortization | (6,522) | | | (6,280) | | (6,280) | | | (3.9) | | (3.9) | % |
| EBIT* | $ | 38,345 | | | $ | 35,273 | | | 8.7 | % |
| EBIT | | EBIT | $ | 4,695 | | | $ | 5,669 | | | (17.2) | % |
| Capital expenditures | Capital expenditures | $ | 6,024 | | | $ | 8,567 | | |
* See the table in Item 6 for a reconciliation of this non-GAAP measure to GAAP. |
Net sales increased by 4.1% in 20202023 decreased 21.3% versus 20192022, primarily due to higher sales of productslower volume in Surface Protection, unrelated toresulting from weak demand in the consumer electronics market and customer product transitions ($12.0 million), partially offset by lower sales associated with the customer product transitions this year ($6.8 million).inventory corrections during 2023. Sales volume in 2023 for surface protection films declined 22% and increased 2% for overwrap films versus 2022.
EBITDA from ongoing operations in 2020 increased by $4.02023 decreased $0.7 million versus 20192022 primarily due to:
•A $3.2$5.7 million increasedecrease from Surface Protection, primarily due to sales ofProtection:
◦Lower contribution margin for non-transitioning products unrelated to theassociated with a market slowdown and customer inventory corrections ($11.1 million) and for previously disclosed customer product transitions ($8.30.7 million), partially offset by lower salesfavorable pricing ($0.5 million), operating efficiencies ($2.6 million) and cost improvements ($3.2 million);
◦The pass-through lag associated with resin costs ($0.3 million charge in 2023 versus a benefit of $0.5 million in 2022);
◦A foreign currency transaction gain of $0.2 million in 2023 versus a gain of $0.8 million in 2022; and
◦Inventories accounted for under the customer product transitions ($4.5 million); andLIFO method resulted in a benefit of $1.0 million in 2023 versus a charge of $0.1 million in 2022.
•A $0.8$5.0 million increase from Pottsville Packagingoverwrap films primarily related todue:
◦Higher contribution margin associated with higher sales volume and favorable raw materials pricing.mix ($1.3 million), cost improvements ($3.1 million) and lower SG&A ($0.4 million);
Customer Product Transitions◦The pass-through lag associated with resin costs (a charge of $0.2 million in Surface Protection2023 versus a benefit of $0.4 million in 2022); and
The Surface Protection component◦Inventories accounted for under the LIFO method resulted in a benefit of $0.3 million in 2023 versus a charge of $0.4 million in 2022.
In August 2023, the Company adopted a plan to close the PE Films supports manufacturers of opticaltechnical center in Richmond, VA and other specialty substrates usedreduce its efforts to develop and sell films supporting the semiconductor market. Future research and development activities for PE Films will be performed at the facility in flat panel display products. ThesePottsville, PA. PE Films continues to have new business opportunities primarily relating to surface protection films are primarily used by customers tothat protect components of displays in the manufacturingflat panel and transportation processes and then discarded.
flexible displays. The Company previously reportedanticipates all activities to cease at the risk that a portion of its film products usedPE Films technical center in surface protection applications will be made obsolete by possible future customer product transitions to less costly alternative processes or materials. These transitions principally relate to one customer. The Company believes that previously reported delays in this customer's transitions were recently resolved by the customer and much of the remaining transitions could occurRichmond, VA, by the end of 2021. Under this scenario,the first quarter of 2024. The Company recognized total expense incurred through December 31, 2023 associated with exit activities of $1.3 million for: (i) severance and related costs ($0.9 million) and (ii) building closure costs ($0.4 million). In addition, the Company estimates thatrecognized a non-cash asset impairment ($3.5 million), accelerated depreciation ($0.3 million) and a gain on the contribution to EBITDA from ongoing operations for PE Films could decline due tolease modification ($0.1 million). Net annual cash savings of $3.4 million are anticipated, which began in the remaining customer product transitions by $18 million in 2021 versus 2020 and $4 million in 2022 versus 2021. To offset the expected adverse impact, the Company is aggressively pursuing and making progress in generating contribution from sales from new surface protection products, applications and customers and implementing cost savings measures. Annual contribution to EBITDA from ongoing operations for PE Films on surface protection products unrelated to the customer product transitions has increased since 2018 by approximately $12 million.fourth quarter of 2023.
Projected Capital Expenditures and Depreciation & Amortization
Capital expenditures for PE Films are projected to be $5$2 million in 2021, including: $22024, including $1 million for productivity projects and $3$1 million for capital expenditures required to support continuity of current operations. Depreciation expense is projected to be $6 million in 2021.2024. There is no amortization expense for PE Films.
Flexible Packaging Films
A summary of results for Flexible Packaging Films is provided below:
| | Year Ended | | Favorable/
(Unfavorable)
% Change |
| Year Ended | | | Year Ended | | Favorable/
(Unfavorable)
% Change |
| (In thousands, except percentages) | (In thousands, except percentages) | December 31, | |
| 2020 | | 2019 | | Favorable/
(Unfavorable)
% Change |
| 2023 | |
| 2023 | |
| Sales volume (lbs) | |
| Sales volume (lbs) | |
| Sales volume (lbs) | Sales volume (lbs) | 113,115 | | | 105,276 | | | 7.4 | % | 88,536 | | | 106,685 | | 106,685 | | | (17.0) | | (17.0) | % |
| Net sales | Net sales | $ | 134,605 | | | $ | 133,935 | | | 0.5 | % | Net sales | $ | 126,326 | | | $ | | $ | 168,139 | | | (24.9) | | (24.9) | % |
| Ongoing operations: | Ongoing operations: | |
| EBITDA | EBITDA | $ | 30,645 | | | $ | 14,737 | | | 107.9 | % |
| EBITDA | |
| EBITDA | | $ | 4,383 | | | $ | 27,452 | | | (84.0) | % |
| Depreciation & amortization | Depreciation & amortization | (1,761) | | | (1,517) | | | (16.1) | % | Depreciation & amortization | (2,865) | | | (2,444) | | (2,444) | | | (17.2) | | (17.2) | % |
| EBIT* | $ | 28,884 | | | $ | 13,220 | | | 118.5 | % |
| EBIT | | EBIT | $ | 1,518 | | | $ | 25,008 | | | (93.9) | % |
| Capital expenditures | Capital expenditures | $ | 4,959 | | | $ | 8,866 | | |
* See the table in Item 6 for a reconciliation of this non-GAAP measure to GAAP. |
Net sales in 2020 increased 0.5% versus 2019 while volume increased 7.4% versus 20192023 decreased 24.9% compared to 2022, primarily due to lower selling pricessales volume and lower margin that the Company believes were driven by excess global capacity and competition in Brazil from lower raw material costs and changes inimports, partially offset by favorable product mix.
Terphane’s EBITDA from ongoing operations in 2020 increased2023 decreased by $15.9$23.1 million versus 20192022, primarily due to:
•Lower raw material costs, netselling prices from the pass-through of lower selling pricesresin costs and margin pressures ($8.917.6 million), higherlower sales volume ($3.39.7 million), favorable product mix ($2.2 million) and lowerhigher fixed costs ($1.0 million)million, primarily due to under absorption from lower production volumes) and higher variable costs ($1.3 million, including higher costs resulting from quality issues), partially offset by higher variablelower raw material costs ($1.15.9 million) and higher selling and general administrationlower SG&A expenses ($0.4 million);
•Net favorable foreign currency translation of Real-denominated costs ($1.52.3 million);
•Foreign currency transaction losses of $0.5 million($0.3 million) in 2020 versus gains of $0.2 million2023 compared to foreign currency transaction losses ($0.2 million) in 2019;2022; and
•A benefitNet unfavorable foreign currency translation of $1.2 millionReal-denominated operating costs ($1.4 million) in 2020 resulting from the favorable settlement of a dispute related to value-added taxes.2023 versus 2022.
Projected Capital Expenditures and Depreciation & Amortization
Capital expenditures are projected to be $9$4 million in 2021, including $5 million for new capacity for value-added products and productivity projects and $4 million2024, for capital expenditures required to support continuity of current operations. Depreciation expense is projected to be $2$3 million in 2021.2024. Amortization expense is projected to be $0.4$0.1 million in 2021.2024.
Corporate Expenses, Interest and Income TaxesOther
Corporate expenses, net in 2023 decreased by $1.8 million compared to 2022, primarily due to lower pension expense as a result of the pension plan termination completed in 2023 ($3.7 million), lower accruals for employee-related compensation ($2.1 million) and lower stock-based compensation ($1.4 million), partially offset by higher professional fees associated with business development activities ($3.2 million) and a charge to adjust the initial purchase price of the nonparticipating single premium group annuity contract as a result of the routine administrative process to transition the pension plan ($2.0 million).
Interest expense was $11.6 million in 2023 in comparison to $5.0 million in 2022, primarily due to higher weighted average total debt outstanding, higher interest rates and the write-off of $1.1 million of deferred financing fees.
Status of Current Corporate Strategic Initiatives
The status of current corporate strategic initiatives is as follows:
Agreement to Sell Terphane
On September 1, 2023, the Company announced that it had entered into a definitive agreement to sell Terphane to Oben Group (the “Contingent Terphane Sale”). Completion of the sale is contingent upon the satisfaction of customary closing conditions, including the receipt of certain competition filing approvals by authorities in Brazil and Colombia. On October 27, 2023, the Company filed the requisite competition forms with the Administrative Council for Economic Defense (“CADE”) in Brazil. The regulatory review process is ongoing and in line with the Company’s expectations. CADE’s maximum deadline for completing its review is no later than November 18, 2024. The merger review regarding the transaction was cleared by the Colombian authority in early February 2024.
As of December 31, 2023, the Company has reported results for Terphane as a continuing operation, given the early stage of the approval process by authorities. If the Contingent Terphane Sale transaction is completed, the Company expects to realize after-tax cash proceeds of $85 million after deducting projected Brazil withholding taxes, escrow funds, U.S. capital
gains taxes and transaction costs. Actual after-tax net proceeds may differ from this estimate due to possible changes in deductions and the Company's tax situation during the potentially lengthy interim period to the closing date.
Pension expensePlan Termination
On September 27, 2023, the Company borrowed $30 million under the Prior Credit Agreement (as defined below) in anticipation of the final funding expected for terminating its defined benefit pension plan obligation. OnOctober 31, 2023, the Company used this cash to contribute $27.7 million to fully fund the pension plan with the amount necessary to purchase from Massachusetts Mutual Life Insurance Company a nonparticipating single premium group annuity contract for $157.5 million, subject to final premium adjustments. On November 3, 2023, the pension plan termination and settlement process was $14.6completed, and the Company’s relevant pension plan obligation was transferred to Massachusetts Mutual Life Insurance Company. This completed the pension plan termination process that began in February 2022. During 2023, the Company recognized a pre-tax pension settlement loss of $92.3 million.
Liquidity and Capital Resources
The Company continuously focuses on working capital management. Measures such as days sales outstanding (“DSO”), days inventory outstanding (“DIO”) and days payables outstanding (“DPO”) are used to evaluate changes in working capital. Changes in operating assets and liabilities from December 31, 2022 to December 31, 2023 are summarized below.
•Accounts and other receivables decreased $16.6 million or 19.6%.
◦Accounts and other receivables in 2020, an unfavorable changeAluminum Extrusions decreased $15.4 million primarily due to lower sales volume and the pass-through of $5.1 million from 2019. The impact on earnings from pension expense is reflected in “Corporate expenses, net” in thelower metal costs. DSO (computed using trailing 12 months net sales and a rolling 12-month average of accounts and other receivables balances) was approximately 45.1 days in 2023 and 48.7 days in 2022.
◦Accounts and other receivables in PE Films increased $0.6 million primarily due to higher sales volume in overwrap films, partially offset by lower sales volume in Surface Protection. DSO was approximately 26.3 days in 2023 and 30.3 days in 2022.
◦Accounts and other receivables in Flexible Packaging Films decreased $1.9 million primarily due to lower sales. DSO was approximately 38.1 days in 2023 and 41.1 days in 2022.
•Inventories decreased $45.7 million or 35.8%.
◦Inventories in Aluminum Extrusions decreased $24.1 million primarily due to decreased raw material levels which align to lower demand and strict working capital targets, partially offset by a LIFO inventory benefit of $1.2 million in 2023 versus a charge of $2.9 million in 2022. DIO (computed using trailing 12 months costs of goods sold calculated on a FIFO basis and a rolling 12-month average of inventory balances calculated on the FIFO basis) was approximately 51.6 days in 2023 and 53.6 days in 2022.
◦Inventories in PE Films decreased $1.9 million due to lower raw materials costs, partially offset by a LIFO inventory benefit of $1.3 million in 2023 versus a charge of $0.5 million in 2022. The DIO was approximately 57.2 days in 2023 and 66.8 days in 2022.
◦Inventories in Flexible Packaging Films decreased $19.7 million primarily due to lower raw material purchases, lower work-in-process and finished goods levels as a result of lower sales volume. DIO of approximately 117.7 days in 2023 was higher compared to 108.0 days for 2022 due to the lower 12-month average of costs of goods sold as a result of lower sales volume and lower margin that the Company believes are driven by excess global capacity and competition in Brazil from imports.
•Net property, plant and equipment decreased by $3.0 million or 1.6% primarily due to depreciation expense ($25.8 million) and the impairment of assets from the closure of the Richmond, VA technical center ($3.5 million), partially offset by capital expenditures ($25.6 million).
•Identifiable intangible assets, net decreased by $1.8 million or 15.7% primarily due to amortization expense.
•Deferred income tax assets increased $11.1 million or 80.1% primarily due to an increase in net operating profit by segment table inloss, tax credit and interest limitation carryforwards. Deferred tax liabilities related to intangible amortization and depreciation decreased $11.8 million while deferred taxes assets related to pension, employee benefits and inventory decreased $10.6 million. See Note 512 “Income Taxes” to the Consolidated Financial Statements in Item 15. Pension expense is projected to be $14.015 for additional information.
•Accounts payable decreased by $19.9 million or 17.3%.
◦Accounts payable in 2021, which is determined at the beginning of the year based on the funded status of the Company’s defined benefit pension plan and actuarial assumptions at that time. In addition to the higher pension expense in 2020 compared to 2019, corporate expenses, net, increasedAluminum Extrusions decreased $15.7 million, primarily due to lower raw material purchases to align with demand and strict working capital targets. DPO (computed using trailing 12 months costs of goods sold calculated on a FIFO basis and a rolling 12-month average of accounts payable balances) was approximately 49.8 days in 2023 and 64.2 days in 2022.
◦Accounts payable in PE Films remained relatively flat. DPO of approximately 43.4 days in 2023 was lower compared to 51.0 days for 2022 due to lower raw materials associated with overwrap films.
◦Accounts payable in Flexible Packaging Films decreased $3.9 million, primarily due to lower raw material purchases, lower work-in-process, and finished goods levels as a result of lower sales volume. DPO was approximately 61.7 days in 2023 and 72.4 days in 2022.
Net cash provided by operating activities was $24.0 million in 2023 compared to net cash used in operating activities of $20.8 million in 2022. The change in operating activities is primarily due to pension plan contributions of $27.7 million in 2023 compared to $50 million in 2022 and improved working capital due to factors discussed earlier in this section relating to accounts and other receivables, inventories and accounts payable.
Net cash used in investing activities was $26.2 million in 2023 compared to $35.5 million in 2022. The change in investing activities is primarily due to lower capital expenditure spending ($10.4 million).
Net cash used in financing activities was $4.5 million in 2023 compared to net cash provided by financing activities of $45.4 million in 2022. The change in financing activities is primarily due to lower net borrowings ($55.6 million) under the ABL Facility and the Prior Credit Agreement and Terphane Brazil Loan (defined below), higher professional feesdeferred financing costs ($3.4 million) related to business development activities and higher stock compensation expense ($1.02.8 million), partially offset by lower environmental expensesdividends paid in 2023 ($0.6 million) and lower other employee-related compensation ($1.38.1 million).
Interest expenseAt December 31, 2023, Tredegar had cash, cash equivalents and restricted cash of $13.5 million, including funds held in locations outside the U.S. of $9.8 million.
Debt and Credit Agreements
ABL Facility
On August 3, 2023, the Company entered into Amendment No. 2 to the Second Amended and Restated Credit Agreement (collectively the “Prior Credit Agreement”), which amended the financial covenants and decreased aggregate borrowings from $375 million to $2.6$200 million.
On December 27, 2023, the Company entered into Amendment No. 3 (the “ABL Facility”) to the Prior Credit Agreement, which provides the Company with $180 million senior secured asset-based revolving credit facility that will expire on June 30, 2026. The ABL Facility is secured by substantially all assets of the Company and its domestic subsidiaries, including equity in 2020certain material first-tier foreign subsidiaries. Availability for borrowings under the ABL Facility is governed by a borrowing base, determined by the application of specified advance rates against eligible assets, including a portion of trade accounts receivable, inventory, cash and cash equivalents, owned real properties, and owned machinery and equipment. Upon the earlier of March 31, 2025 or the date the Company receives the proceeds from $4.1the sale of Terphane (the “ABL Adjustment Date”), the $180 million ABL Facility will be reduced to $125 million. As of December 31, 2023, availability under the ABL Facility was $22.9 million, after reducing the availability by the aggregate outstanding borrowings of $126.3 million, standby letters of credit of $13.1 million and the Minimum Liquidity (as defined in 2019, primarily duethe ABL Facility) financial covenant.
Under the terms of the ABL Facility, certain domestic bank accounts are subject to lower average debt levels.blocked account agreements, each of which contains a springing feature whereby the lenders may exercise control over those accounts during a cash dominion period (any such period, a “Cash Dominion Period”). A Cash Dominion Period was implemented on the date of the closing of the ABL Facility and will remain in effect at all times prior to the ABL Adjustment Date. After the ABL Adjustment Date, a Cash Dominion Period goes into effect if availability under the ABL Facility falls below 12.5% or an Event of Default (as defined in the ABL Facility) occurs. The Company would then be subject to the Cash Dominion Period until the Event of Default is waived or ABL Facility availability is above 12.5% of the $125 million aggregate commitment for 30 consecutive days. Receipts that have not yet been applied to the ABL Facility are classified as restricted cash in the Company’s consolidated balance sheets.
The effectivefinancial covenants in the ABL Facility, which are reported to lenders on a monthly basis, include:
•Until the ABL Adjustment Date, the Company is required to maintain (i) minimum Credit EBITDA (as defined in the ABL Facility), as of the end of each fiscal month for the 12-month period then ended (presented below) and (ii) a Minimum Liquidity (as defined in the ABL Facility) of $10.0 million.
| | | | | |
| Minimum Credit EBITDA (In thousands) |
| December 2023 | $ | 21,070 | |
| January 2024 | 21,110 | |
| February 2024 | 18,750 | |
| March 2024 | 16,640 | |
| April 2024 | 19,780 | |
| May 2024 | 19,660 | |
| June 2024 | 19,450 | |
| July 2024 | 21,860 | |
| August 2024 | 22,830 | |
| September 2024 | 25,370 | |
| October 2024 | 26,070 | |
| November 2024 | 27,640 | |
| December 2024 | 29,640 | |
| January 2025 | 29,740 | |
| February 2025 | 29,850 | |
| March 2025 | $ | 29,980 | |
•Following the ABL Adjustment Date, the foregoing financial covenants will cease to exist and will be replaced with a minimum fixed charge coverage ratio of 1.00:1.00 that will be triggered in the event that availability is less than 10% of $125 million commitment amount and continuing thereafter until availability is greater than 10% of the $125 million commitment amount for 30 consecutive days.
The computation of Credit EBITDA, as defined in the ABL Facility, is presented below.
| | | | | |
Computations of Credit EBITDA (as defined in the ABL Facility) as of and for the Twelve Months Ended December 31, 2023 * |
| Computations of Credit EBITDA for the twelve months ended December 31, 2023 (in thousands): |
| Net income (loss) | $ | (105,905) | |
| Plus: | |
| After-tax losses related to discontinued operations | — | |
| Total income tax expense for continuing operations | — | |
| Interest expense | 11,607 | |
| Depreciation and amortization expense for continuing operations | 27,683 | |
| All non-cash losses and expenses, plus cash losses and expenses not to exceed $10,000, for continuing operations that are classified as unusual, extraordinary or which are related to plant shutdowns, asset impairments and/or restructurings (cash-related of $8,749) | 139,860 | |
| Charges related to stock option grants and awards accounted for under the fair value-based method | 231 | |
| Losses related to the application of the equity method of accounting | — | |
| Losses related to adjustments in the estimated fair value of assets accounted for under the fair value method of accounting | — | |
| Fees, costs and expenses incurred in connection with the amendment process | — | |
| Terphane sale transaction costs in an amount not to exceed $10,000 | 5,038 | |
| Minus: | |
| After-tax income related to discontinued operations | — | |
| Total income tax benefits for continuing operations | (54,125) | |
| Interest income | (522) | |
| All non-cash gains and income, plus cash gains and income in excess of $10,000, for continuing operations that are classified as unusual, extraordinary or which are related to plant shutdowns, asset impairments and/or restructurings | (100) | |
| Income related to changes in estimates for stock option grants and awards accounted for under the fair value-based method | — | |
| Income related to the application of the equity method of accounting | — | |
| Income related to adjustments in the estimated fair value of assets accounted for under the fair value method of accounting | (262) | |
| Plus cash dividends declared on investments in an amount not to exceed $10,000 for such period | — | |
| Plus or minus, as applicable, pro forma EBITDA adjustments associated with acquisitions and asset dispositions | — | |
| Plus or minus, as applicable, pro forma EBITDA adjustments to pension expense associated with the early payment of pension obligations | 10,664 | |
| Credit EBITDA | $ | 34,169 | |
*Credit EBITDA is not intended to represent net income (loss) or cash flow from operations as defined by GAAP and should not be considered as an alternative to either net income (loss) or to cash flow. |
The computation of the ABL Facility availability and Minimum Liquidity covenant, as defined in the ABL Facility, is presented below.
| | | | | |
| Year Ended |
| (In thousands, except percentages) | December 31, |
| 2023 |
| Maximum aggregate principal | $ | 180,000 | |
| |
| Maximum borrowing limit per the Borrowing base as defined in the ABL Facility (includes eligible domestic cash and cash equivalents of $3,846) | $ | 172,286 | |
| ABL Facility outstanding debt (matures on June 30, 2026) | 126,322 | |
| Outstanding standby letters of credit | 13,080 | |
| ABL Facility availability | $ | 32,884 | |
| Minimum Liquidity covenant | 10,000 | |
| ABL Facility availability in excess of Minimum Liquidity covenant | $ | 22,884 | |
In addition to the financial covenants, the ABL Facility contains restrictive covenants, including covenants that restrict the Company’s ability to pay dividends and repurchase shares of its common stock.
As of December 31, 2023, the Company was in compliance with all debt covenants.
Terphane Brazil Loan
On October 26, 2023, Terphane Ltda., the Company’s wholly owned subsidiary in Brazil, borrowed $20 million secured by certain of its assets (“Terphane Brazil Loan”). This U.S. Dollar borrowing matures on October 30, 2028. The Company expects that the Terphane Brazil Loan will be repaid (and collateral released) upon the closing of the Contingent Terphane Sale. On October 26, 2023, the Company borrowed $20 million from Terphane Brazil (the “Intercompany Loan”) at the same interest rate usedas the Terphane Brazil Loan, thereby transferring the funds to compute income taxes for continuing operations in 2020 was 32.8% compared to 18.8% in 2019. The differences between the U.S. federal statutory rateThe Company will repay the Intercompany Loan in conjunction with the closing of the Contingent Terphane Sale.
For more information on the ABL Facility and the effectiveTerphane Brazil Loan, see Note 7 “Debt and Credit Agreements” to the Consolidated Financial Statements in Item 15.
The Company believes that existing borrowing availability, current cash balances and cash flow from operations will be sufficient to satisfy short term material cash requirements related to working capital, capital expenditure, and debt repayments for at least the next 12 months. In the longer term, liquidity will depend on many factors, including the results of operations, the timing and extent of capital expenditures, changes in operating plans, or other events that would cause the Company to seek additional financing in future periods. In addition, the completion of the Contingent Terphane Sale would provide additional liquidity.
Material Cash Requirements for Known Contractual and Other Obligations
The Company’s material cash requirements from known contractual and other obligations as of December 31, 2023 were as follows:
Debt and interest payments
As of December 31, 2023, the Company had outstanding debt from the ABL Facility of $126.3 million with contractual payments due in June 2026. Estimated future interest payments associated with the ABL Facility total $28.6 million, with $11.5 million payable within the next 12 months.
As of December 31, 2023, Terphane Ltda., the Company’s wholly owned subsidiary in Brazil, had outstanding debt of $20.0 million under the Terphane Brazil Loan. Estimated future interest payments associated with the Terphane Brazil Loan total $7.9 million, with $2.3 million payable within the next 12 months.
Capital expenditure commitments
See “Projected Capital Expenditures and Depreciation & Amortization” within “Segment Operations Overview” above in this Item 7 for discussion of the Company’s planned investment in capital expenditures in 2024, of which $1.2 million are contractual commitments that existed as of December 31, 2023.
Operating Leases
The Company enters into various operating leases primarily for real estate, office equipment and vehicles. See Note 4 “Leases” to the Consolidated Financial Statements in Item 15 for additional information.
Uncertain Tax Positions
As of December 31, 2023, unrecognized tax rate for 2020 and 2019 are shown in Note 16benefits on uncertain tax positions were $0.7 million. Tax payments resulting from the successful challenge by the taxing authority on uncertain tax positions taken by Tredegar would possibly result in the Notespayment of estimated interest and penalties of $0.2 million if tax payments were made as a result of a successful challenge by the taxing authority on uncertain tax positions. Due to uncertainties in the timing of potential tax audits, the timing of the resolution of these positions is uncertain. Therefore, the Company is unable to make a reasonably reliable estimate of the timing of payments beyond 12 months. See Note 12 “Income Taxes” to the Consolidated Financial Statements.Statements in Item 15 for additional information.
Net capitalization and other credit measuresOff-Balance Sheet Arrangements
The Company has no material off-balance sheet arrangements that have had or are providedreasonably likely to have a material current or future effect on its financial condition, changes in Liquidity and Capital Resources, below.financial condition, revenues or expenses, results of operations, liquidity, capital expenditures or capital resources.
Critical Accounting Policies
InFrom time to time, the Company enters into transactions with third parties in connection with the sale of assets or businesses in which it agrees to indemnify the buyers or third parties involved in the transaction, or the sellers or third parties involved in the transaction agree to indemnify Tredegar, for certain liabilities or risks related to the assets or business. Also, in the ordinary course of business, the Company makesmay enter into agreements with third parties for the sale of goods or services that may contain indemnification provisions. In the event that an indemnification claim is asserted, liability for indemnification would be subject to an assessment of the underlying facts and circumstances under the terms of the applicable agreement. Further, any indemnification payments may be limited or barred by a numbermonetary cap, a time limitation, or a deductible or basket. For these reasons, the Company is unable to estimate the maximum potential amount of estimatesthe potential future liability under the indemnity provisions of these agreements. Tredegar does, however, accrue for losses for any known contingent liability, including those that may arise from indemnification provisions, when future payment is probable and assumptions relating to the reportingamount is reasonably estimable. The Company discloses contingent liabilities if the probability of results of operationsloss is reasonably possible and financial position in thematerial.
Critical Accounting Policies and Estimates
The preparation of financial statements in conformityaccordance with GAAP.GAAP requires the Company to make estimates and assumptions that affect the reported amounts of assets, liabilities, revenues, expenses and related disclosures. Certain accounting policies, as described below, are considered "critical accounting policies" because they are particularly dependent on estimates made by management about matters that are inherently uncertain and could have a material impact on the Company’s consolidated financial statements. Estimates and judgments are based on historical experience, forecasted events and various other assumptions that management believes are reasonable under the circumstances. Actual results could differ significantly from those estimates under different assumptions and conditions. The Company believes the following discussion addresses its criticalA summary of all of our significant accounting policies. These policies require management to exercise judgments that are often difficult, subjectiveis included in Note 1 “Nature of Operations and complex dueSummary of Significant Accounting Policies” to the necessity of estimating the effect of matters that are inherently uncertain.
Consolidated Financial Statements in Item 15.Impairment of Long-lived Identifiable Assets and Goodwill
The Company assesses its long-lived identifiable assets for impairment when events or circumstances indicate that their carrying value may not be recoverable from future cash flows. Any necessary impairment charges are recorded when the Company does not believe the carrying value of the long-lived asset(s) will be recoverable. Tredegar also reassesses the useful lives of its long-lived assets based on changes in the business and technologies.
The Company assesses goodwill for impairment when events or circumstances indicate that the carrying value may not be recoverable, or, at a minimum, on an annual basis (December 1st1st of each year). When assessing goodwill for impairment, accounting guidance allows the Company to first perform a qualitative assessment about the likelihood of the carrying value of a reporting unit exceeding its fair value, referred to as the (“Step 0 assessment. The Step 0 assessment requires the evaluation ofanalysis”), which evaluates certain qualitative factors, including macroeconomic conditions, industry and market considerations, cost factors and overall financial performance, as well as company and reporting unit factors. If the Company's Step 0 analysis indicates that it is more likely than not that the fair value of a reporting unit is less than theits carrying amount, then the Company would perform a quantitative impairment test.test (“Step 1 analysis”).
During 2023, uncertainty about the timing of a recovery in the consumer electronics market persisted, and manufacturers in the supply chain for consumer electronics continued to experience reduced capacity utilization and inventory corrections. In light of the limited visibility on the timing of a recovery and the expected adverse future impact to the Surface Protection business, coupled with a cautious outlook on new product development opportunities, the Company performed a Step 1 goodwill impairment analysis, as of June 30, 2023 and September 30, 2023, of the Surface Protection component of PE Films. The analyses concluded that the fair value of Surface Protection was less than its carrying value, thus a non-cash partial goodwill impairment of $34.9 million ($27.0 million after deferred income tax benefits) was recognized during 2023.
The Company estimated the fair value of Surface Protection by: (i) computing an estimated enterprise value (“EV”) utilizing the discounted cash flow method (the “DCF Method”), (ii) applying adjustments for any surplus or deficient working capital, (iii) adding cash and cash equivalents, and (iv) subtracting interest-bearing debt. The DCF Method was used, incorporating Surface Protection’s latest projections, which reflect updated expected market recovery levels, feasibility of launching new product applications, competitive pricing and cash flows associated with production efficiencies, as well as consideration of cost savings and inventory corrections.
Key financial assumptions utilized to determine the fair value of the reporting unit include revenue growth projections and a weighted average cost of capital assumption. At September 30, 2023, the effect of a ten percent decrease in the revenue growth projections and a one percent increase to the weighted average cost of capital assumption would further decrease the fair value of the reporting unit’s fair value by approximately $1 million. Further impairment to the Surface Protection reporting unit’s goodwill may be caused by factors outside the Company’s control, such as increasing competitive pricing pressures, weak consumer electronic market demand, lower than expected sales and profit growth rates, and various other factors. Given the uncertain demand for Surface Protections products, it is reasonably possible that the cash flow estimates used in deriving such fair value measurements may change in the future.
As of December 1, 2020,2023, the Company applied the Step 0 assessment to its PE Films’Company’s reporting units with goodwill were Surface Protection in PE Films and Futura in Aluminum Extrusions. Both of these reporting unitunits have separately identifiable operating net assets (operating assets including goodwill and its Aluminum Extrusions’ Futura reporting unit, which was created as a resultidentifiable intangible assets net of an acquisition in 2017. Each reporting unit had a fair value significantly in excess of its carrying amount when last tested using the quantitative impairment test.operating liabilities). The Company's Step 0 analysis in 2020 of these reporting units concluded that it is not more likely than not that the fair value of each reporting unit was lessgreater than its carrying amount.
Goodwillvalue. Therefore, the Step 1 quantitative goodwill impairment tests for these reporting units were not necessary. The Surface Protection and Futura totaled $57.3reporting units had goodwill in the amounts of $22.4 million and $10.4$13.3 million, respectively, at December 31, 2020.
In assessing the recoverability of goodwill and long-lived identifiable assets, the Company primarily estimates fair value using discounted cash flow analyses and comparative enterprise value-to-EBITDA multiples. These calculations require management to make assumptions regarding estimated future cash flows, discount rates and other factors to determine if an impairment exists. If these estimates or their related assumptions change in the future, the Company may be required to record additional impairment charges.
During the first three months of 2020, the Company performed goodwill impairment tests for the Aluminum Extrusions’ AACOA reporting unit, which was created as a result of an acquisition in 2011, and the Futura reporting unit using a combination of income and market approaches and determined that the fair value of the Futura reporting unit exceeded its carrying value. However, the fair value of the AAOCA reporting unit did not exceed its carrying value. As a result, the Company recognized a goodwill impairment charge of $13.7 million ($10.5 million after taxes), which represented the entire amount of goodwill associated with the AACOA reporting unit. The operations of the AACOA reporting unit, which includes the Niles, Michigan and Elkhart, Indiana facilities, was expected to be severely impacted by COVID-19 at that time, with over 80% of the aluminum extrusions manufactured at these facilities sold to customers that make consumer durable products, such as recreational boating and power sports vehicles, and to customers serving the building and construction and automotive markets.
Investment Accounted for Under the Fair Value Method
In August 2007 and December 2008, Tredegar made an aggregate investment of $7.5 million in kaléo (formerly Intelliject, Inc.), a privately held specialty pharmaceutical company. This investment is accounted for under the fair value method. At the time of the initial investment, the Company elected the fair value option of accounting since its investment objectives were similar to those of venture capitalists, which typically do not have controlling financial interests (venture capital funds generally use the fair value option to account for their investment portfolios). At December 31, 2020, Tredegar’s ownership interest was approximately 20% on a fully diluted basis.
The Company considers its investment in kaléo to be a Level 3 investment under the fair value hierarchy described in GAAP. The Company discloses the level of its investments within the fair value hierarchy in which fair value measurements in their entirety fall, segregating fair value measurements using quoted prices in active markets for identical assets or liabilities (Level 1), significant other observable inputs (Level 2), and significant unobservable inputs (Level 3). The Company believes that its fair value estimates will continue to be based upon Level 3 inputs since there is no secondary market for Tredegar’s ownership.2023. See Note 41 “Nature of Operations and Summary of Significant Accounting Policies” to the Consolidated Financial Statements in Item 15 for moreadditional information on valuation methods used. Adjustments to the estimated fair valueanalysis of this investment will be made in the period in which such changes can be quantified.goodwill impairment.
At December 31, 2020 and 2019, the fair value of the Company’s investment in kaléo (also the carrying value, which is separately stated in the consolidated balance sheets) was estimated at $34.6 million and $95.5 million, respectively. The weighted average cost of capital used in the fair market valuation of the Company’s interest in kaléo was 35% and 29% as of December 31, 2020 and 2019. The ultimate value of the Company’s ownership interest in kaléo will be determined and realized only if and when a liquidity event occurs, and the ultimate value could be materially different from the $34.6 million estimated fair value reflected in the Company’s financial statements at December 31, 2020. The fair market valuation of Tredegar’s interest in kaléo is sensitive to changes in the weighted average cost of capital used to discount cash flow projections for the high degree of risk and wide range of possible outcomes. At December 31, 2020, the effect of a 500 basis point decrease in the weighted average cost of capital assumption would have further increased the fair value of the Company’s interest in kaléo by approximately $5 million, and a 500 basis point increase in the weighted average cost of capital assumption would have decreased the fair value of the Company’s interest by approximately $6 million.
Pension Benefits
Tredegar sponsors noncontributory defined benefit (pension) plans that have resulted in varying amounts of net pension income or expense, as developed from actuarial valuations. Inherent in these valuations are key assumptions including discount rates, expected return on plan assets and rate of future compensation increases. The Company is required to consider current market conditions, including changes in interest rates and plan asset investment returns, in determining these assumptions. Actuarial assumptions may differ materially from actual results due to changing market and economic conditions, higher or lower withdrawal rates or longer or shorter life spans of participants. These differences may result in a significant impact to the amount of net pension income or expense recorded in future periods.
The discount rate is used to determine the present value of future payments. The discount rate is the single rate that, when applied to expected benefit payments, provides a present value equal to the present value of expected benefit payments determined by using the AA-rated bond yield curve. In general, the pension liability increases as the discount rate decreases and vice versa. The weighted average discount rate utilized was 2.57%, 3.27% and 4.40% at the end of 2020, 2019 and 2018, respectively, with changes between periods due to changes in market interest rates. Pay for active participants of the plan was frozen as of December 31, 2007. As of January 31, 2018, the plan no longer accrued benefits associated with crediting employees for service, thereby freezing all future benefits under the plan.
A lower expected return on plan assets increases the amount of expense and vice versa. Decreases in the level of actual plan assets will also serve to increase the amount of pension expense. The total return on plan assets (net of fees and plan expenses), which is primarily affected by the change in fair value of plan assets, current year contributions and current year payments to participants, was approximately 10.9% in 2020, 11.8% in 2019 and negative 5.4% in 2018. The expected long-term return on plan assets, which is estimated by asset class and generally based on inflation-adjusted historical returns, volatilities, risk premiums and managed asset premiums, was 5.00%, 6.00% and 6.50% in 2020, 2019 and 2018, respectively. The Company anticipates that its expected long-term return on plan assets will be 5.00% for 2021. See Note 13 to the Consolidated Financial Statements in Item 15 for more information on expected long-term return on plan assets and asset mix.
See the Executive Summary section above for further discussion regarding the financial impact of the Company’s pension plans.
Income TaxesLiquidity and Capital Resources
The Company continuously focuses on working capital management. Measures such as days sales outstanding (“DSO”), days inventory outstanding (“DIO”) and days payables outstanding (“DPO”) are used to evaluate changes in working capital. Changes in operating assets and liabilities from December 31, 2022 to December 31, 2023 are summarized below.
•Accounts and other receivables decreased $16.6 million or 19.6%.
◦Accounts and other receivables in Aluminum Extrusions decreased $15.4 million primarily due to lower sales volume and the pass-through of lower metal costs. DSO (computed using trailing 12 months net sales and a rolling 12-month average of accounts and other receivables balances) was approximately 45.1 days in 2023 and 48.7 days in 2022.
◦Accounts and other receivables in PE Films increased $0.6 million primarily due to higher sales volume in overwrap films, partially offset by lower sales volume in Surface Protection. DSO was approximately 26.3 days in 2023 and 30.3 days in 2022.
◦Accounts and other receivables in Flexible Packaging Films decreased $1.9 million primarily due to lower sales. DSO was approximately 38.1 days in 2023 and 41.1 days in 2022.
•Inventories decreased $45.7 million or 35.8%.
◦Inventories in Aluminum Extrusions decreased $24.1 million primarily due to decreased raw material levels which align to lower demand and strict working capital targets, partially offset by a LIFO inventory benefit of $1.2 million in 2023 versus a charge of $2.9 million in 2022. DIO (computed using trailing 12 months costs of goods sold calculated on a FIFO basis and a rolling 12-month average of inventory balances calculated on the FIFO basis) was approximately 51.6 days in 2023 and 53.6 days in 2022.
◦Inventories in PE Films decreased $1.9 million due to lower raw materials costs, partially offset by a LIFO inventory benefit of $1.3 million in 2023 versus a charge of $0.5 million in 2022. The DIO was approximately 57.2 days in 2023 and 66.8 days in 2022.
◦Inventories in Flexible Packaging Films decreased $19.7 million primarily due to lower raw material purchases, lower work-in-process and finished goods levels as a result of lower sales volume. DIO of approximately 117.7 days in 2023 was higher compared to 108.0 days for 2022 due to the lower 12-month average of costs of goods sold as a result of lower sales volume and lower margin that the Company believes are driven by excess global capacity and competition in Brazil from imports.
•Net property, plant and equipment decreased by $3.0 million or 1.6% primarily due to depreciation expense ($25.8 million) and the impairment of assets from the closure of the Richmond, VA technical center ($3.5 million), partially offset by capital expenditures ($25.6 million).
•Identifiable intangible assets, net decreased by $1.8 million or 15.7% primarily due to amortization expense.
•Deferred income tax assets increased $11.1 million or 80.1% primarily due to an increase in net operating loss, tax credit and interest limitation carryforwards. Deferred tax liabilities related to intangible amortization and depreciation decreased $11.8 million while deferred taxes assets related to pension, employee benefits and inventory decreased $10.6 million. See Note 12 “Income Taxes” to the Consolidated Financial Statements in Item 15 for additional information.
•Accounts payable decreased by $19.9 million or 17.3%.
◦Accounts payable in Aluminum Extrusions decreased $15.7 million, primarily due to lower raw material purchases to align with demand and strict working capital targets. DPO (computed using trailing 12 months costs of goods sold calculated on a FIFO basis and a rolling 12-month average of accounts payable balances) was approximately 49.8 days in 2023 and 64.2 days in 2022.
◦Accounts payable in PE Films remained relatively flat. DPO of approximately 43.4 days in 2023 was lower compared to 51.0 days for 2022 due to lower raw materials associated with overwrap films.
◦Accounts payable in Flexible Packaging Films decreased $3.9 million, primarily due to lower raw material purchases, lower work-in-process, and finished goods levels as a result of lower sales volume. DPO was approximately 61.7 days in 2023 and 72.4 days in 2022.
Net cash provided by operating activities was $24.0 million in 2023 compared to net cash used in operating activities of $20.8 million in 2022. The change in operating activities is primarily due to pension plan contributions of $27.7 million in 2023 compared to $50 million in 2022 and improved working capital due to factors discussed earlier in this section relating to accounts and other receivables, inventories and accounts payable.
Net cash used in investing activities was $26.2 million in 2023 compared to $35.5 million in 2022. The change in investing activities is primarily due to lower capital expenditure spending ($10.4 million).
Net cash used in financing activities was $4.5 million in 2023 compared to net cash provided by financing activities of $45.4 million in 2022. The change in financing activities is primarily due to lower net borrowings ($55.6 million) under the ABL Facility and the Prior Credit Agreement and Terphane Brazil Loan (defined below), higher deferred financing costs ($2.8 million), partially offset by lower dividends paid in 2023 ($8.1 million).
At December 31, 2023, Tredegar had cash, cash equivalents and restricted cash of $13.5 million, including funds held in locations outside the U.S. of $9.8 million.
Debt and Credit Agreements
ABL Facility
On August 3, 2023, the Company entered into Amendment No. 2 to the Second Amended and Restated Credit Agreement (collectively the “Prior Credit Agreement”), which amended the financial covenants and decreased aggregate borrowings from $375 million to $200 million.
On December 27, 2023, the Company entered into Amendment No. 3 (the “ABL Facility”) to the Prior Credit Agreement, which provides the Company with $180 million senior secured asset-based revolving credit facility that will expire on June 30, 2026. The ABL Facility is secured by substantially all assets of the Company and its domestic subsidiaries, including equity in certain material first-tier foreign subsidiaries. Availability for borrowings under the ABL Facility is governed by a quarterly basis, Tredegar reviews its judgments regarding uncertain tax positionsborrowing base, determined by the application of specified advance rates against eligible assets, including a portion of trade accounts receivable, inventory, cash and cash equivalents, owned real properties, and owned machinery and equipment. Upon the earlier of March 31, 2025 or the date the Company receives the proceeds from the sale of Terphane (the “ABL Adjustment Date”), the $180 million ABL Facility will be reduced to $125 million. As of December 31, 2023, availability under the ABL Facility was $22.9 million, after reducing the availability by the aggregate outstanding borrowings of $126.3 million, standby letters of credit of $13.1 million and the likelihoodMinimum Liquidity (as defined in the ABL Facility) financial covenant.
Under the terms of the ABL Facility, certain domestic bank accounts are subject to blocked account agreements, each of which contains a springing feature whereby the lenders may exercise control over those accounts during a cash dominion period (any such period, a “Cash Dominion Period”). A Cash Dominion Period was implemented on the date of the closing of the ABL Facility and will remain in effect at all times prior to the ABL Adjustment Date. After the ABL Adjustment Date, a Cash Dominion Period goes into effect if availability under the ABL Facility falls below 12.5% or an Event of Default (as defined in the ABL Facility) occurs. The Company would then be subject to the Cash Dominion Period until the Event of Default is waived or ABL Facility availability is above 12.5% of the $125 million aggregate commitment for 30 consecutive days. Receipts that have not yet been applied to the ABL Facility are classified as restricted cash in the Company’s consolidated balance sheets.
The financial covenants in the ABL Facility, which are reported to lenders on a monthly basis, include:
•Until the ABL Adjustment Date, the Company is required to maintain (i) minimum Credit EBITDA (as defined in the ABL Facility), as of the end of each fiscal month for the 12-month period then ended (presented below) and (ii) a Minimum Liquidity (as defined in the ABL Facility) of $10.0 million.
| | | | | |
| Minimum Credit EBITDA (In thousands) |
| December 2023 | $ | 21,070 | |
| January 2024 | 21,110 | |
| February 2024 | 18,750 | |
| March 2024 | 16,640 | |
| April 2024 | 19,780 | |
| May 2024 | 19,660 | |
| June 2024 | 19,450 | |
| July 2024 | 21,860 | |
| August 2024 | 22,830 | |
| September 2024 | 25,370 | |
| October 2024 | 26,070 | |
| November 2024 | 27,640 | |
| December 2024 | 29,640 | |
| January 2025 | 29,740 | |
| February 2025 | 29,850 | |
| March 2025 | $ | 29,980 | |
•Following the ABL Adjustment Date, the foregoing financial covenants will cease to exist and will be replaced with a minimum fixed charge coverage ratio of 1.00:1.00 that will be triggered in the event that availability is less than 10% of $125 million commitment amount and continuing thereafter until availability is greater than 10% of the $125 million commitment amount for 30 consecutive days.
The computation of Credit EBITDA, as defined in the ABL Facility, is presented below.
| | | | | |
Computations of Credit EBITDA (as defined in the ABL Facility) as of and for the Twelve Months Ended December 31, 2023 * |
| Computations of Credit EBITDA for the twelve months ended December 31, 2023 (in thousands): |
| Net income (loss) | $ | (105,905) | |
| Plus: | |
| After-tax losses related to discontinued operations | — | |
| Total income tax expense for continuing operations | — | |
| Interest expense | 11,607 | |
| Depreciation and amortization expense for continuing operations | 27,683 | |
| All non-cash losses and expenses, plus cash losses and expenses not to exceed $10,000, for continuing operations that are classified as unusual, extraordinary or which are related to plant shutdowns, asset impairments and/or restructurings (cash-related of $8,749) | 139,860 | |
| Charges related to stock option grants and awards accounted for under the fair value-based method | 231 | |
| Losses related to the application of the equity method of accounting | — | |
| Losses related to adjustments in the estimated fair value of assets accounted for under the fair value method of accounting | — | |
| Fees, costs and expenses incurred in connection with the amendment process | — | |
| Terphane sale transaction costs in an amount not to exceed $10,000 | 5,038 | |
| Minus: | |
| After-tax income related to discontinued operations | — | |
| Total income tax benefits for continuing operations | (54,125) | |
| Interest income | (522) | |
| All non-cash gains and income, plus cash gains and income in excess of $10,000, for continuing operations that are classified as unusual, extraordinary or which are related to plant shutdowns, asset impairments and/or restructurings | (100) | |
| Income related to changes in estimates for stock option grants and awards accounted for under the fair value-based method | — | |
| Income related to the application of the equity method of accounting | — | |
| Income related to adjustments in the estimated fair value of assets accounted for under the fair value method of accounting | (262) | |
| Plus cash dividends declared on investments in an amount not to exceed $10,000 for such period | — | |
| Plus or minus, as applicable, pro forma EBITDA adjustments associated with acquisitions and asset dispositions | — | |
| Plus or minus, as applicable, pro forma EBITDA adjustments to pension expense associated with the early payment of pension obligations | 10,664 | |
| Credit EBITDA | $ | 34,169 | |
*Credit EBITDA is not intended to represent net income (loss) or cash flow from operations as defined by GAAP and should not be considered as an alternative to either net income (loss) or to cash flow. |
The computation of the ABL Facility availability and Minimum Liquidity covenant, as defined in the ABL Facility, is presented below.
| | | | | |
| Year Ended |
| (In thousands, except percentages) | December 31, |
| 2023 |
| Maximum aggregate principal | $ | 180,000 | |
| |
| Maximum borrowing limit per the Borrowing base as defined in the ABL Facility (includes eligible domestic cash and cash equivalents of $3,846) | $ | 172,286 | |
| ABL Facility outstanding debt (matures on June 30, 2026) | 126,322 | |
| Outstanding standby letters of credit | 13,080 | |
| ABL Facility availability | $ | 32,884 | |
| Minimum Liquidity covenant | 10,000 | |
| ABL Facility availability in excess of Minimum Liquidity covenant | $ | 22,884 | |
In addition to the financial covenants, the ABL Facility contains restrictive covenants, including covenants that restrict the Company’s ability to pay dividends and repurchase shares of its common stock.
As of December 31, 2023, the Company was in compliance with all debt covenants.
Terphane Brazil Loan
On October 26, 2023, Terphane Ltda., the Company’s wholly owned subsidiary in Brazil, borrowed $20 million secured by certain of its assets (“Terphane Brazil Loan”). This U.S. Dollar borrowing matures on October 30, 2028. The Company expects that the benefits of a deferred income tax assetTerphane Brazil Loan will be realized. As circumstances change,repaid (and collateral released) upon the closing of the Contingent Terphane Sale. On October 26, 2023, the Company reflectsborrowed $20 million from Terphane Brazil (the “Intercompany Loan”) at the same interest rate as the Terphane Brazil Loan, thereby transferring the funds to the U.S. The Company will repay the Intercompany Loan in earnings any adjustments to unrecognized benefits for uncertain tax positions and valuation allowances for deferred income tax assets.conjunction with the closing of the Contingent Terphane Sale.
For financial reporting purposes,more information on the ABL Facility and the Terphane Brazil Loan, see Note 7 “Debt and Credit Agreements” to the Consolidated Financial Statements in Item 15.
The Company believes that existing borrowing availability, current cash balances and cash flow from operations will be sufficient to satisfy short term material cash requirements related to working capital, capital expenditure, and debt repayments for at least the next 12 months. In the longer term, liquidity will depend on many factors, including the results of operations, the timing and extent of capital expenditures, changes in operating plans, or other events that would cause the Company to seek additional financing in future periods. In addition, the completion of the Contingent Terphane Sale would provide additional liquidity.
Material Cash Requirements for Known Contractual and Other Obligations
The Company’s material cash requirements from known contractual and other obligations as of December 31, 2023 were as follows:
Debt and interest payments
As of December 31, 2023, the Company had outstanding debt from the ABL Facility of $126.3 million with contractual payments due in June 2026. Estimated future interest payments associated with the ABL Facility total $28.6 million, with $11.5 million payable within the next 12 months.
As of December 31, 2023, Terphane Ltda., the Company’s wholly owned subsidiary in Brazil, had outstanding debt of $20.0 million under the Terphane Brazil Loan. Estimated future interest payments associated with the Terphane Brazil Loan total $7.9 million, with $2.3 million payable within the next 12 months.
Capital expenditure commitments
See “Projected Capital Expenditures and Depreciation & Amortization” within “Segment Operations Overview” above in this Item 7 for discussion of the Company’s planned investment in capital expenditures in 2024, of which $1.2 million are contractual commitments that existed as of December 31, 2023.
Operating Leases
The Company enters into various operating leases primarily for real estate, office equipment and vehicles. See Note 4 “Leases” to the Consolidated Financial Statements in Item 15 for additional information.
Uncertain Tax Positions
As of December 31, 2023, unrecognized tax benefits on uncertain tax positions were $0.6 million and $0.9 million as of December 31, 2020 and 2019, respectively.$0.7 million. Tax payments resulting from the successful challenge by the taxing authority on uncertain tax positions taken by Tredegar would possibly result in the payment of interest and penalties. Accordingly, the Company also accrues for possibleestimated interest and penalties of $0.2 million if tax payments were made as a result of a successful challenge by the taxing authority on uncertain tax positions. The balance of accrued interest and penalties on deductions taken relatingDue to uncertain tax positions was $0.1 million, $0.1 million and $0.2 million at December 31, 2020, 2019 and 2018, respectively ($0.1 million, $0.1 million and $0.2 million, respectively, net of corresponding U.S. federal and state income tax benefits). Accruals for possible interest and penalties on uncertain tax positions are reflected in income tax expense for financial reporting purposes.
Tredegar, or one of its subsidiaries, files income tax returnsuncertainties in the U.S. federal jurisdiction, various states and jurisdictions outsidetiming of potential tax audits, the U.S. With few exceptions,timing of the resolution of these positions is uncertain. Therefore, the Company is unable to make a reasonably reliable estimate of the timing of payments beyond 12 months. See Note 12 “Income Taxes” to the Consolidated Financial Statements in Item 15 for additional information.
Off-Balance Sheet Arrangements
The Company has no material off-balance sheet arrangements that have had or are reasonably likely to have a material current or future effect on its financial condition, changes in financial condition, revenues or expenses, results of operations, liquidity, capital expenditures or capital resources.
From time to time, the Company enters into transactions with third parties in connection with the sale of assets or businesses in which it agrees to indemnify the buyers or third parties involved in the transaction, or the sellers or third parties involved in the transaction agree to indemnify Tredegar, for certain liabilities or risks related to the assets or business. Also, in the ordinary course of business, the Company may enter into agreements with third parties for the sale of goods or services that may contain indemnification provisions. In the event that an indemnification claim is no longerasserted, liability for indemnification would be subject to U.S. federal, statean assessment of the underlying facts and circumstances under the terms of the applicable agreement. Further, any indemnification payments may be limited or non-U.S. income tax examinationsbarred by tax authoritiesa monetary cap, a time limitation, or a deductible or basket. For these reasons, the Company is unable to estimate the maximum potential amount of the potential future liability under the indemnity provisions of these agreements. Tredegar does, however, accrue for years before 2017.losses for any known contingent liability, including those that may arise from indemnification provisions, when future payment is probable and the amount is reasonably estimable. The Company discloses contingent liabilities if the probability of loss is reasonably possible and material.
As
Critical Accounting Policies and Estimates
The preparation of December 31, 2020financial statements in accordance with GAAP requires the Company to make estimates and 2019, valuation allowances relating to deferred income taxassumptions that affect the reported amounts of assets, were $17.5 millionliabilities, revenues, expenses and $3.8 million, respectively. For more informationrelated disclosures. Certain accounting policies, as described below, are considered "critical accounting policies" because they are particularly dependent on deferred income tax assetsestimates made by management about matters that are inherently uncertain and liabilities, seecould have a material impact on the Company’s consolidated financial statements. Estimates and judgments are based on historical experience, forecasted events and various other assumptions that management believes are reasonable under the circumstances. Actual results could differ significantly from those estimates under different assumptions and conditions. A summary of all of our significant accounting policies is included in Note 161 “Nature of Operations and Summary of Significant Accounting Policies” to the Consolidated Financial Statements in Item 15.
Impairment of Goodwill
The Company assesses goodwill for impairment when events or circumstances indicate that the carrying value may not be recoverable, or, at a minimum, on an annual basis (December 1st of each year). When assessing goodwill for impairment, accounting guidance allows the Company to first perform a qualitative assessment (“Step 0 analysis”), which evaluates certain qualitative factors, including macroeconomic conditions, industry and market considerations, cost factors and overall financial performance, as well as company and reporting unit factors. If the Company's Step 0 analysis indicates that it is more likely than not that the fair value of a reporting unit is less than its carrying amount, then the Company would perform a quantitative impairment test (“Step 1 analysis”).
During 2023, uncertainty about the timing of a recovery in the consumer electronics market persisted, and manufacturers in the supply chain for consumer electronics continued to experience reduced capacity utilization and inventory corrections. In light of the limited visibility on the timing of a recovery and the expected adverse future impact to the Surface Protection business, coupled with a cautious outlook on new product development opportunities, the Company performed a Step 1 goodwill impairment analysis, as of June 30, 2023 and September 30, 2023, of the Surface Protection component of PE Films. The analyses concluded that the fair value of Surface Protection was less than its carrying value, thus a non-cash partial goodwill impairment of $34.9 million ($27.0 million after deferred income tax benefits) was recognized during 2023.
The Company estimated the fair value of Surface Protection by: (i) computing an estimated enterprise value (“EV”) utilizing the discounted cash flow method (the “DCF Method”), (ii) applying adjustments for any surplus or deficient working capital, (iii) adding cash and cash equivalents, and (iv) subtracting interest-bearing debt. The DCF Method was used, incorporating Surface Protection’s latest projections, which reflect updated expected market recovery levels, feasibility of launching new product applications, competitive pricing and cash flows associated with production efficiencies, as well as consideration of cost savings and inventory corrections.
ResultsKey financial assumptions utilized to determine the fair value of Operations
2020 versus 2019
Revenues. Salesthe reporting unit include revenue growth projections and a weighted average cost of capital assumption. At September 30, 2023, the effect of a ten percent decrease in 2020 decreasedthe revenue growth projections and a one percent increase to the weighted average cost of capital assumption would further decrease the fair value of the reporting unit’s fair value by 8.6% compared with 2019 primarily dueapproximately $1 million. Further impairment to lower sales in Aluminum Extrusions partially offset by higher sales in PE Films. Net sales decreased 14.0% in Aluminum Extrusions primarily due to lower sales volume and the pass-through of lower metal costs, partially offset by an increase in average selling prices to cover higher operating costs. Net sales increased 4.1% in PE Films primarily due to higher sales of products in Surface Protection unrelated to customer product transitions, partially offsetreporting unit’s goodwill may be caused by factors outside the Company’s control, such as increasing competitive pricing pressures, weak consumer electronic market demand, lower sales associated with the customer product transitions. Net sales increased in Flexible Packaging Films by 0.5% primarily due to increased volume and changes in product mix. For more information on changes in netthan expected sales and volume, seeprofit growth rates, and various other factors. Given the Executive Summary section above.uncertain demand for Surface Protections products, it is reasonably possible that the cash flow estimates used in deriving such fair value measurements may change in the future.
Operating Costs and Expenses. Consolidated gross profit margin (sales minus costAs of goods sold and freight as a percentage of sales) was 22.6% in 2020 versus 18.9% in 2019. The gross profit margin in Flexible Packaging Films increased due to higher sales volume, lower raw material costs and favorable product mix. The gross profit marginDecember 1, 2023, the Company’s reporting units with goodwill were Surface Protection in PE Films and Futura in Aluminum ExtrusionsExtrusions. Both of these reporting units have separately identifiable operating net assets (operating assets including goodwill and identifiable intangible assets net of operating liabilities). The Company's Step 0 analysis of these reporting units concluded that it is more likely than not that the fair value of each reporting unit was flat compared to 2019.
For more information on changes in operating costsgreater than its carrying value. Therefore, the Step 1 quantitative goodwill impairment tests for these reporting units were not necessary. The Surface Protection and expenses, see the Executive Summary section above.
Selling, General and Administrative. As a percentage of sales, selling, general and administrative (“SG&A”) and R&D expenses were 12.3% in 2020, which increased from 10.2% in 2019. SG&A and R&D expenses were up year-over-year, while net sales decreased. Increased SG&A expense was primarily due to higher professional fees related to business development activities, higher stock-based compensation expense, and corporate costs incurred during 2020 associated with the sale of Personal Care Films.
Plant shutdowns, asset impairments, restructurings and other. Pre-tax losses associated with plant shutdowns, asset impairments, restructurings and other items for continuing operations in 2020 detailed below are shownFutura reporting units had goodwill in the statementsamounts of net sales$22.4 million and EBITDA from ongoing operations by segment table in$13.3 million, respectively, at December 31, 2023. See Note 51 “Nature of Operations and Summary of Significant Accounting Policies” to the Consolidated Financial Statements in Item 15 and are included in “Asset impairments and costs associated with exit and disposal activities, net of adjustments” in the consolidated statements of income, unless otherwise noted. A discussion of unrealized gains and losses on investments can also be found in Note 4 to the Financial Statements in Item 15 andfor additional information on restructuring costs can be found in Note 17 to the Consolidated Financial Statements in Item 15.
| | | | | | | | | | | | | | | | | |
| ($ in millions) | Q1 | Q2 | Q3 | Q4 | 2020 |
| Aluminum Extrusions: | | | | | |
| Losses from sale of assets, investment writedowns and other items: | | | | | |
Consulting expenses for ERP feasibility study2 | $ | 0.7 | | $ | 0.2 | | $ | 0.3 | | $ | 0.1 | | $ | 1.3 | |
Environmental charges at Newnan, Georgia plant1 | — | | — | | — | | 0.3 | | 0.3 | |
COVID-19-related expenses2 | — | | 0.9 | | 0.5 | | 0.5 | | 1.9 | |
| Total for Aluminum Extrusions | $ | 0.7 | | $ | 1.1 | | $ | 0.8 | | $ | 0.9 | | $ | 3.5 | |
| | | | | |
| PE Films: | | | | | |
| Losses associated with plant shutdowns, asset impairments and restructurings: | | | | | |
| Surface Protection restructuring costs - severance | $ | — | | $ | — | | $ | — | | $ | 1.6 | | $ | 1.6 | |
| (Gains) losses from sale of assets, investment writedowns and other items: | | | | | |
COVID-19-related expenses3 | — | | 0.1 | | — | | 0.2 | | 0.3 | |
| Total for PE Films | $ | — | | $ | 0.1 | | $ | — | | $ | 1.8 | | $ | 1.9 | |
| | | | | |
| Corporate: | | | | | |
Professional fees associated with: internal control over financial reporting; business development activities; and implementation of new accounting guidance2 | $ | 1.8 | | $ | 1.8 | | $ | 0.6 | | $ | 1.3 | | $ | 5.5 | |
Accelerated recognition of stock option-based compensation2 | — | | 0.1 | | — | | — | | 0.1 | |
Corporate costs associated with the divestiture of Personal Care Films2 | — | | — | | 1.1 | | (0.3) | | 0.8 | |
Loss on sale of Bright View3 | — | | — | | — | | 2.3 | | 2.3 | |
Write-down of investment in Harbinger Capital Partners Special Situations Fund3 | 0.2 | | — | | 0.1 | | 0.1 | | 0.4 | |
Stock compensation expense associated with the fair value remeasurement of awards granted at the time of the Special Dividend2 | — | | — | | — | | 0.4 | | 0.4 | |
| Total for Corporate | $ | 2.0 | | $ | 1.9 | | $ | 1.8 | | $ | 3.8 | | $ | 9.5 | |
1. Included in “Cost of goods sold” in the consolidated statements of income.
2. Included in “Selling, general and administrative” in the consolidated statements of income.
3. Included in “Other income (expense), net” in the consolidated statements of income. |
Interest Expense. Interest expense, which is netanalysis of amounts capitalized and included in property, plant and equipment ($0.1 million and $0.3 million capitalized in 2020 and 2019, respectively), was $2.6 million in 2020, compared to $4.1 million for 2019. Average debt outstanding and interest rates were as follows:goodwill impairment.
| | | | | | | | | | | |
| (In millions, except percentages) | 2020 | | 2019 |
| Floating-rate debt with interest charged on a rollover basis at one-month LIBOR plus a credit spread: | | | |
| Average outstanding debt balance | $ | 33.5 | | | $ | 85.0 | |
| Average interest rate | 2.3 | % | | 4.0 | % |
2019 versus 2018
Revenues. Sales in 2019 decreased by 3.0% compared with 2018 due to lower sales in Aluminum Extrusions partially offset by higher sales in PE Films and Flexible Packaging Films. Net sales decreased 7.6% in Aluminum Extrusions primarily due to lower sales volume and the pass-through of lower metal costs, partially offset by an increase in average selling prices to cover higher operating costs. Net sales increased 4.8% in PE Films primarily due to higher sales volume and increased selling prices. Net sales increased in Flexible Packaging Films by 8.2% primarily due to higher sales volume and increased selling prices. For more information on changes in net sales and volume, see the Segment Analysis below.
Operating Costs and Expenses. Consolidated gross profit (sales minus cost of goods sold and freight) as a percentage of sales (gross profit margin) was 18.9% in 2019 versus 17.0% in 2018. The gross profit margin in Aluminum Extrusions increased primarily as a result of higher selling prices. The gross profit margin in PE Films increased primarily due to higher profits in Surface Protection as a result of higher sales volume and increased selling prices. The gross profit margin in Flexible Packaging Films was essentially unchanged from 2018 to 2019. For more information on changes in operating costs and expenses, see the Segment Analysis below.
Selling, General and Administrative. As a percentage of sales, SG&A and R&D expenses were 10.2% in 2019, which increased from 8.8% in 2018. The increase in SG&A and R&D expenses as a percentage of sales can be primarily attributed to lower sales for Aluminum Extrusions. Increased spending was due to higher stock-based compensation and consulting fees for remediation activities and other costs relating to the Company’s material weaknesses in internal control over financial reporting, business development activities and implementation of new accounting guidance.
Plant shutdowns, asset impairments, restructurings and other. Pre-tax losses associated with plant shutdowns, asset impairments, restructurings and other items for continuing operations in 2019 and 2018 detailed below are shown in the statements of net sales and EBITDA from ongoing operations by segment table in Note 5 to the Consolidated Financial Statements in Item 15 and are included in “Asset impairments and costs associated with exit and disposal activities, net of adjustments” in the consolidated statements of income, unless otherwise noted. A discussion of unrealized gains and losses on investments can also be found in Note 4 to the Consolidated Financial Statements in Item 15 and additional information on restructuring costs can be found in Note 17 to the Consolidated Financial Statements in Item 15. | | | | | | | | | | | | | | | | | |
| ($ in millions) | Q1 | Q2 | Q3 | Q4 | 2019 |
| Aluminum Extrusions: | | | | | |
| (Gains) losses from sale of assets, investment writedowns and other items: | | | | | |
Wind damage to roof of Elkhart, Indiana plant2 | $ | — | | $ | — | | $ | 0.3 | | $ | (0.4) | | $ | (0.1) | |
Environmental charges at Carthage Tennessee plant1 | — | | — | | 0.4 | | 0.2 | | 0.6 | |
| Total for Aluminum Extrusions | $ | — | | $ | — | | $ | 0.7 | | $ | (0.2) | | $ | 0.5 | |
| | | | | |
| PE Films: | | | | | |
| Losses associated with plant shutdowns, asset impairments and restructurings: | | | | | |
| Write-off of films production line - Guangzhou, China facility | $ | 0.4 | | $ | — | | $ | — | | $ | — | | $ | 0.4 | |
| Surface Protection restructuring costs - severance | — | | — | | 0.1 | | 0.2 | | 0.3 | |
| Total for PE Films | $ | 0.4 | | $ | — | | $ | 0.1 | | $ | 0.2 | | $ | 0.7 | |
| | | | | |
| Corporate: | | | | | |
Professional fees associated with: internal control over financial reporting; business development activities; and implementation of new accounting guidance2 | $ | 0.9 | | $ | 0.9 | | $ | 1.5 | | $ | 0.2 | | $ | 3.5 | |
Accelerated recognition of stock option-based compensation2 | — | | — | | — | | 1.3 | | 1.3 | |
Environmental costs not associated with a business unit2 | — | | — | | — | | 0.6 | | 0.6 |
| Total for Corporate | $ | 0.9 | | $ | 0.9 | | $ | 1.5 | | $ | 2.1 | | $ | 5.4 | |
1. Included in “Cost of goods sold” in the consolidated statements of income.
2. Included in “Selling, general and administrative” in the consolidated statements of income. |
| | | | | | | | | | | | | | | | | |
| ($ in millions) | Q1 | Q2 | Q3 | Q4 | 2018 |
| Aluminum Extrusions: | | | | | |
| Losses associated with plant shutdowns, asset impairments and restructurings: | | | | | |
| Other restructuring costs - severance | $ | 0.1 | | $ | — | | $ | — | | $ | — | | $ | 0.1 | |
| (Gains) losses from sale of assets, investment writedowns and other items: | | | | | |
Wind damage to roof of Elkhart, Indiana plant2 | — | | — | | 0.1 | | — | | 0.1 | |
Environmental charges at Carthage Tennessee plant1 | — | | — | | 0.2 | | 0.1 | | 0.3 | |
| Total for Aluminum Extrusions | $ | 0.1 | | $ | — | | $ | 0.3 | | $ | 0.1 | | $ | 0.5 | |
| | | | | |
| PE Films: | | | | | |
| Losses associated with plant shutdowns, asset impairments and restructurings: | | | | | |
| Surface Protection restructuring costs - severance | $ | — | | $ | — | | $ | — | | $ | 0.2 | | $ | 0.2 | |
| (Gains) losses from sale of assets, investment writedowns and other items: | | | | | |
Costs to prepare a market study2 | — | | — | | 0.2 | | — | | 0.2 | |
Gain on reversal of contingent liability3 | — | | — | | — | | (0.3) | | (0.3) | |
| Total for PE Films | $ | — | | $ | — | | $ | 0.2 | | $ | (0.1) | | $ | 0.1 | |
| | | | | |
| Corporate: | | | | | |
Professional fees associated with: internal control over financial reporting; and implementation of new accounting guidance2 | $ | 0.3 | | $ | — | | $ | 0.2 | | $ | 0.6 | | $ | 1.1 | |
Write-down of investment in Harbinger Capital Partners Special Situations Fund3 | — | | 0.2 | | 0.2 | | 0.1 | | 0.5 | |
Business development projects2 | — | | — | | — | | 0.5 | | 0.5 | |
| Total for Corporate | $ | 0.3 | | $ | 0.2 | | $ | 0.4 | | $ | 1.2 | | $ | 2.1 | |
1. Included in “Cost of goods sold” in the consolidated statements of income.
2. Included in “Selling, general and administrative” in the consolidated statements of income.
3. Included in “Other income (expense), net” in the consolidated statements of income. |
Interest Expense. Interest expense, which is net of amounts capitalized and included in property, plant and equipment ($0.3 million and $0.1 million capitalized in 2019 and 2018, respectively), was $4.1 million in 2019, compared to $5.7 million for 2018. Average debt outstanding and interest rates were as follows:
| | | | | | | | | | | |
| (In millions, except percentages) | 2019 | | 2018 |
| Floating-rate debt with interest charged on a rollover basis at one-month LIBOR plus a credit spread: | | | |
| Average outstanding debt balance | $ | 85.0 | | | $ | 121.3 | |
| Average interest rate | 4.0 | % | | 3.8 | % |
Segment Analysis. A summary of operating results for 2019 versus 2018 for each of the Company’s reporting segments is shown below.
Aluminum Extrusions
A summary of results for Aluminum Extrusions is provided below:
| | | | | | | | | | | | | | | | | |
| Year Ended | | Favorable/ |
| (In thousands, except percentages) | December 31, | | (Unfavorable) |
| 2019 | | 2018 | | % Change |
| Sales volume (lbs) | 208,249 | | | 223,866 | | | (7.0) | % |
| Net sales | $ | 529,602 | | | $ | 573,126 | | | (7.6) | % |
| Ongoing operations: | | | | | |
| EBITDA | $ | 65,683 | | | $ | 65,479 | | | 0.3 | % |
| Depreciation & amortization* | (16,719) | | | (16,866) | | | 0.9 | % |
| EBIT** | $ | 48,964 | | | $ | 48,613 | | | 0.7 | % |
| Capital expenditures | $ | 17,855 | | | $ | 12,966 | | | |
* Excludes pre-tax accelerated amortization of trade names of $10.0 million in the year ended December 31, 2019.
** See the table in Item 6 for a reconciliation of this non-GAAP measure to GAAP. |
Net sales in 2019 decreased versus 2018 primarily due to lower sales volume and the pass-through of lower metal costs, partially offset by an increase in average selling prices to cover higher operating costs.
EBITDA from ongoing operations in 2019 increased slightly in comparison to 2018. Excluding the adverse impact of the accounting for inventories under the last in, first out method in the fourth quarter of 2019 versus 2018 ($1.5 million), EBITDA from ongoing operations increased $1.7 million despite a 7% decline in sales volume. The increase was primarily due to higher pricing ($22.8 million) and fabrication profits ($1.0 million), partially offset by lower sales volume ($8.7 million), increased labor and employee-related expenses ($7.4 million), higher supplies, maintenance, utilities and other operating costs ($2.0 million), increased freight costs ($2.0 million) and increased general and administrative expenses ($1.9 million).
PE Films
A summary of results for PE Films is provided below:
| | | | | | | | | | | | | | | | | |
| Year Ended | | Favorable/ |
| (In thousands, except percentages) | December 31, | | (Unfavorable) |
| 2019 | | 2018 | | % Change |
| Sales volume (lbs) | 43,983 | | | 40,173 | | | 9.5 | % |
| Net sales | $ | 133,807 | | | $ | 127,708 | | | 4.8 | % |
| Ongoing operations: | | | | | |
| EBITDA | $ | 41,133 | | | $ | 32,404 | | | 26.9 | % |
| Depreciation & amortization | (5,860) | | | (6,201) | | | 5.5 | % |
| EBIT* | $ | 35,273 | | | $ | 26,203 | | | 34.6 | % |
| Capital expenditures | $ | 8,567 | | | $ | 2,523 | | | |
| * See the table in Item 6 for a reconciliation of this non-GAAP measure to GAAP. |
Net sales in 2019 increased by $6.1 million versus 2018 primarily due to higher sales in Surface Protection. Surface Protection’s sales increased $5.8 million due to higher sales volume and increased selling prices, partially offset by unfavorable product mix.
EBITDA from ongoing operations in 2019 increased by $8.7 million versus 2018 primarily due to:
•A $6.8 million increase from Surface Protection, primarily due to higher selling prices ($6.0 million), quality claims in 2018 that did not recur in 2019 ($1.2 million), production efficiencies ($1.4 million) and favorable raw material costs ($1.9 million), partially offset by unfavorable mix (net impact of $2.0 million) and higher fixed manufacturing and general and administrative costs ($1.5 million); and
•A $1.6 million increase from Pottsville Packaging primarily related to higher sales volume ($1.5 million), increased productivity ($0.5 million) and increased selling prices ($0.2 million), partially offset by unfavorable product mix ($1.0 million).
Flexible Packaging Films
A summary of results for Flexible Packaging Films is provided below:
| | | | | | | | | | | | | | | | | |
| Year Ended | | Favorable/
(Unfavorable)
% Change |
| (In thousands, except percentages) | December 31, | |
| 2019 | | 2018 | |
| Sales volume (lbs) | 105,276 | | | 98,994 | | | 6.3 | % |
| Net sales | $ | 133,935 | | | $ | 123,830 | | | 8.2 | % |
| Ongoing operations: | | | | | |
| EBITDA | $ | 14,737 | | | $ | 11,154 | | | 32.1 | % |
| Depreciation & amortization | (1,517) | | | (1,262) | | | (20.2) | % |
| EBIT* | $ | 13,220 | | | $ | 9,892 | | | 33.6 | % |
| Capital expenditures | $ | 8,866 | | | $ | 5,423 | | | |
| * See the table in Item 6 for a reconciliation of this non-GAAP measure to GAAP. |
Net sales in 2019 increased versus 2018 primarily due to higher sales volume and increased selling prices.
Terphane’s EBITDA from ongoing operations in 2019 increased by $3.6 million versus 2018 due to:
•Higher volume ($2.6 million) and higher selling prices ($1.6 million), partially offset by higher fixed and variable costs, including costs related to a restarted line ($2.0 million);
•Net favorable foreign currency translation of Real-denominated operating costs of $0.4 million; and
•Foreign currency transaction gains of $1.0 million in 2019 versus losses of $0.8 million in 2018.
Liquidity and Capital Resources
The Company continuously focuses on working capital management. Measures such as days sales outstanding (“DSO”), days inventory outstanding (“DIO”) and days payables outstanding (“DPO”) are used to evaluate changes in working capital. Changes in operating assets and liabilities from continuing operations from December 31, 20192022 to December 31, 20202023 are summarized below. Cash flows for discontinued operations have not been separately disclosed in the consolidated statements of cash flows.
•Accounts and other receivables decreased $2.8$16.6 million (3.1%)or 19.6%.
◦Accounts and other receivables in Aluminum Extrusions decreased by $3.3$15.4 million primarily due to lower sales volume and lower sales prices from the pass-through of lower metal costs, partially offset by an increase in average selling prices.costs. DSO (computed using trailing 12 months net sales and a rolling 12-month average of accounts and other receivables balances) was approximately 47.545.1 days in 20202023 and 48.548.7 days in 2019.2022.
◦Accounts and other receivables in PE Films decreased by $0.3increased $0.6 million as the removal of assets relatedprimarily due to Bright View washigher sales volume in overwrap films, partially offset by increased accounts receivableslower sales volume in Surface Protection due to higher sales.Protection. DSO was approximately 30.226.3 days in 20202023 and 34.730.3 days in 2019.2022.
◦Accounts and other receivables in Flexible Packaging Films remained consistent compareddecreased $1.9 million primarily due to the prior year.lower sales. DSO was approximately 41.038.1 days in 20202023 and 37.741.1 days in 2019.2022.
•Inventories increased $2.2decreased $45.7 million (3.5%)or 35.8%.
◦Inventories in Aluminum Extrusions increased by $3.2decreased $24.1 million primarily due to higher average aluminum pricesdecreased raw material levels which align to lower demand and COVID-19-related operational and production inefficiencies.strict working capital targets, partially offset by a LIFO inventory benefit of $1.2 million in 2023 versus a charge of $2.9 million in 2022. DIO (computed using trailing 12 months costs of goods sold calculated on a first in, first outFIFO basis and a rolling 12-month average of inventory balances calculated on the first-in, first-outFIFO basis) was approximately 39.351.6 days in 20202023 and 38.653.6 days in 2019.2022.
◦Inventories in PE Films increased by $0.7decreased $1.9 million primarily due to higherlower raw material levels in Surface Protectionmaterials costs, partially offset by the removala LIFO inventory benefit of assets related to Bright View.$1.3 million in 2023 versus a charge of $0.5 million in 2022. The DIO was approximately 59.257.2 days in 20202023 and 51.366.8 days in 2019.2022.
◦Inventories in Flexible Packaging Films decreased by $1.6$19.7 million primarily due to increasedlower raw material purchases, lower work-in-process and finished goods levels as a result of lower sales volume. DIO of approximately 117.7 days in 2023 was higher compared to 108.0 days for 2022 due to the lower 12-month average of costs of goods sold as a result of lower sales volume and lower resin costs partially offsetmargin that the Company believes are driven by higher raw material levels. DIO was approximately 89.4 daysexcess global capacity and competition in 2020 and 94.3 days in 2019.Brazil from imports.
•Net property, plant and equipment decreased by $7.0$3.0 million (4.0%)or 1.6% primarily due to depreciation expensesexpense ($25.8 million) and the impairment of $23.4 million, a reductionassets from the effectclosure of changes in foreign exchange rates of $3.3 million and the removal of assets related to Bright View of $2.3 million,Richmond, VA technical center ($3.5 million), partially offset by capital expenditures of $21.4 million.($25.6 million).
•Identifiable intangible assets, net decreased by $3.8$1.8 million (16.9%)or 15.7% primarily due to amortization expense of $3.0expense.
•Deferred income tax assets increased $11.1 million or 80.1% primarily due to an increase in net operating loss, tax credit and the removal ofinterest limitation carryforwards. Deferred tax liabilities related to intangible amortization and depreciation decreased $11.8 million while deferred taxes assets related to Bright View of $0.6pension, employee benefits and inventory decreased $10.6 million. See Note 12 “Income Taxes” to the Consolidated Financial Statements in Item 15 for additional information.
•Accounts payable increaseddecreased by $2.4$19.9 million (2.8%)or 17.3%.
◦Accounts payable in Aluminum Extrusions increased by $3.3decreased $15.7 million, primarily due to increased inventory levels as a result of COVID-19-related lower demand.raw material purchases to align with demand and strict working capital targets. DPO (computed using trailing 12 months costs of goods sold calculated on a first in, first outFIFO basis and a rolling 12-month average of accounts payable balances) was approximately 53.149.8 days in 20202023 and 49.964.2 days in 2019.2022.
◦Accounts payable in PE Films decreased by $3.2 million primarilyremained relatively flat. DPO of approximately 43.4 days in 2023 was lower compared to 51.0 days for 2022 due to effective working capital management and the normal volatilitylower raw materials associated with the timing of payments. DPO was approximately 36.8 days in 2020 and 37.1 days in 2019.overwrap films.
◦Accounts payable in Flexible Packaging Films increased by $0.5decreased $3.9 million, primarily due the negotiationto lower raw material purchases, lower work-in-process, and finished goods levels as a result of longer payment terms partially offset by reduced resin costs.lower sales volume. DPO was approximately 61.7 days in 20202023 and 55.272.4 days in 2019.2022.
Net cash provided by operating activities was $74.4$24.0 million in 20202023 compared to $115.9net cash used in operating activities of $20.8 million in 2019.2022. The decreasechange in operating activities is primarily due to significant netpension plan contributions of $27.7 million in 2023 compared to $50 million in 2022 and improved working capital efficienciesdue to factors discussed earlier in 2019 versus 2020 ($28.5 million), a dividend received from kaléo in 2019 ($17.6 million),this section relating to accounts and higher pensionother receivables, inventories and postretirement benefit plan contributions ($4.1 million), partially offset by higher EBITDA from ongoing operations for business segments of $9.3 million in 2020 versus the prior period.accounts payable.
Cash provided by investing activities was $32.9 million in 2020 compared toNet cash used in investing activities of $39.9was $26.2 million in 2019. Cash provided by investing activities2023 compared to $35.5 million in 2020 includes the net cash proceeds received for the sale of Personal Care Films ($55.1 million) and Bright View ($1.1 million), partially offset by capital expenditures of $23.4 million. Cash used2022. The change in investing activities in 2019 includesis primarily due to lower capital expenditures of $50.9 million, which was partially offset by $10.9 million of cash proceeds received for the sale of the PE Films’ Shanghai manufacturing facility.expenditure spending ($10.4 million).
Net cash used in financing activities of $125.6was $4.5 million in 20202023 compared to $77.3net cash provided by financing activities of $45.4 million in 2019.2022. The increasechange in financing activities is primarily due to higherlower net borrowings of $151.5 million($55.6 million) under the ABL Facility and the Prior Credit Agreement (as definedand Terphane Brazil Loan (defined below) and, higher dividend payments to shareholders of $200.7 million primarily due to the $200 million Special Dividend (partially funded from borrowings under the Credit Agreement, as defined below)deferred financing costs ($2.8 million), partially offset by lower debt financing costsdividends paid in 2023 ($8.1 million).
At December 31, 2023, Tredegar had cash, cash equivalents and restricted cash of $1.1$13.5 million, including funds held in locations outside the U.S. of $9.8 million.
Debt and Credit Agreements
ABL Facility
On August 3, 2023, the Company entered into Amendment No. 2 to the Second Amended and Restated Credit Agreement (collectively the “Prior Credit Agreement”), which amended the financial covenants and decreased aggregate borrowings from $375 million to $200 million.
On December 1, 2020, Tredegar27, 2023, the Company entered into an amendment (“Amendment No. 1”3 (the “ABL Facility”) to its five-yearthe Prior Credit Agreement, which provides the Company with $180 million senior secured asset-based revolving credit agreement (the “Credit Agreement”), which maturesfacility that will expire on June 30, 2026. The ABL Facility is secured by substantially all assets of the Company and its domestic subsidiaries, including equity in June 2024. Thecertain material changes from Amendment No. 1 are as follows:
•Aggregatefirst-tier foreign subsidiaries. Availability for borrowings available under the facility wereABL Facility is governed by a borrowing base, determined by the application of specified advance rates against eligible assets, including a portion of trade accounts receivable, inventory, cash and cash equivalents, owned real properties, and owned machinery and equipment. Upon the earlier of March 31, 2025 or the date the Company receives the proceeds from the sale of Terphane (the “ABL Adjustment Date”), the $180 million ABL Facility will be reduced from $500to $125 million. As of December 31, 2023, availability under the ABL Facility was $22.9 million, to $375 million.after reducing the availability by the aggregate outstanding borrowings of $126.3 million, standby letters of credit of $13.1 million and the Minimum Liquidity (as defined in the ABL Facility) financial covenant.
•The definition of Credit EBITDA was amended to permit certain adjustments for prepayment of pension obligations on a pro forma basis.
•Amendments were made to certainUnder the terms of the negative covenants, including, among other amendments,ABL Facility, certain domestic bank accounts are subject to blocked account agreements, each of which contains a springing feature whereby the following: (i)lenders may exercise control over those accounts during a cash dominion period (any such period, a “Cash Dominion Period”). A Cash Dominion Period was implemented on the restricted payments covenant was amended to permit a one-time special dividend payment of up to $200 million and allow for an aggregate amount of dividend payments up to $75 million subsequent to Amendment No. 1 through the maturity date of the Credit Agreement; (ii) the asset disposition covenant was amended to reduce the general basket to 20% of consolidated total assets over the lifeclosing of the facilityABL Facility and was resetwill remain in effect at all times prior to the ABL Adjustment Date. After the ABL Adjustment Date, a Cash Dominion Period goes into effect if availability under the ABL Facility falls below 12.5% or an Event of Default (as defined in the ABL Facility) occurs. The Company would then be subject to the Cash Dominion Period until the Event of Default is waived or ABL Facility availability is above 12.5% of the $125 million aggregate commitment for 30 consecutive days. Receipts that have not yet been applied to the ABL Facility are classified as of December 1, 2020; and (iii)restricted cash in the indebtedness covenant was amended to reduce several baskets to $25 million each.Company’s consolidated balance sheets.
Net capitalization and indebtedness asThe financial covenants in the ABL Facility, which are reported to lenders on a monthly basis, include:
•Until the ABL Adjustment Date, the Company is required to maintain (i) minimum Credit EBITDA (as defined underin the Credit AgreementABL Facility), as of December 31, 2020 were as follows:the end of each fiscal month for the 12-month period then ended (presented below) and (ii) a Minimum Liquidity (as defined in the ABL Facility) of $10.0 million.
| | | | | |
Net Capitalization and Indebtedness as of December 31, 2020 |
(InMinimum Credit EBITDA (In thousands) |
Net capitalization: | |
Cash and cash equivalentsDecember 2023 | $ | 11,84621,070 | |
Debt:January 2024 | 21,110 | |
Credit AgreementFebruary 2024 | 134,00018,750 | |
Debt, net of cash and cash equivalentsMarch 2024 | 122,15416,640 | |
Shareholders’ equityApril 2024 | 109,05519,780 | |
Net capitalizationMay 2024 | 19,660 | |
| June 2024 | 19,450 | |
| July 2024 | 21,860 | |
| August 2024 | 22,830 | |
| September 2024 | 25,370 | |
| October 2024 | 26,070 | |
| November 2024 | 27,640 | |
| December 2024 | 29,640 | |
| January 2025 | 29,740 | |
| February 2025 | 29,850 | |
| March 2025 | $ | 231,20929,980 | |
Indebtedness as defined in Credit Agreement: | |
Total debt | $ | 134,000 | |
Indebtedness | $ | 134,000 | |
The credit spread•Following the ABL Adjustment Date, the foregoing financial covenants will cease to exist and will be replaced with a minimum fixed charge coverage ratio of 1.00:1.00 that will be triggered in the event that availability is less than 10% of $125 million commitment fees charged onamount and continuing thereafter until availability is greater than 10% of the unused$125 million commitment amount under the Credit Agreement at various indebtedness-to-Credit EBITDA levels are as follows:for 30 consecutive days.
| | | | | | | | | | | |
| Pricing Under Credit Agreement (Basis Points) |
| Indebtedness-to-Credit EBITDA Ratio | Credit Spread
Over LIBOR | | Commitment
Fee |
| > 3.5x but <= 4.0x | 200.0 | | | 40 | |
| > 3.0x but <= 3.5x | 187.5 | | | 35 | |
| > 2.0x but <= 3.0x | 175.0 | | | 30 | |
| > 1.0x but <= 2.0x | 162.5 | | | 25 | |
| <= 1.0x | 150.0 | | | 20 | |
At December 31, 2020, the interest rate on debt under the Credit Agreement existing at that date was priced at one-month LIBOR plus the applicable credit spread of 162.5 basis points. Under the Credit Agreement, borrowings are permitted up to $375 million, and approximately $241 million was available to borrow at December 31, 2020, based upon the most restrictive covenant within the Credit Agreement.
The computationscomputation of Credit EBITDA, the leverage ratio and interest coverage ratio as defined in the Credit Agreement are presented below along with the related most restrictive covenants. Credit EBITDA, as defined in the Credit AgreementABL Facility, is not intended to represent net income or cash flow from operations as defined by GAAP and should not be considered as either an alternative to net income or to cash flow.
| | | | | |
Computations of Credit EBITDA (as defined in the ABL Facility) as of and for the Twelve Months Ended December 31, 2023 * |
Computations of Credit EBITDA Leverage Ratio and Interest Coverage Ratio as Defined in the Credit Agreement Along with Related Most Restrictive Covenants |
As of and for the Twelve Months Ended December 31, 2020 (In thousands) |
Computations of Credit EBITDA as defined in Credit Agreement for the twelve months ended December 31, 20202023 (in thousands): |
| Net income (loss) | $ | (75,444)(105,905) | |
| Plus: | |
| After-tax losses related to discontinued operations | 58,611— | |
| Total income tax expense for continuing operations | — | |
| Interest expense | 2,58711,607 | |
| Depreciation and amortization expense for continuing operations | 26,44627,683 | |
All non-cash losses and expenses, plus cash losses and expenses not to exceed $10,000, for continuing operations that are classified as unusual, extraordinary or which are related to plant shutdowns, asset impairments and/or restructurings (cash-related of $10,000)$8,749) | 26,384139,860 | |
| Charges related to stock option grants and awards accounted for under the fair value-based method | 2,161231 | |
| Losses related to the application of the equity method of accounting | — | |
| Losses related to adjustments in the estimated fair value of assets accounted for under the fair value method of accounting | 60,900— | |
| Fees, costs and expenses incurred in connection with the amendment process | — | |
| Terphane sale transaction costs in an amount not to exceed $10,000 | 5,038 | |
| Minus: | |
| After-tax income related to discontinued operations | — | |
| Total income tax benefits for continuing operations | (8,213)(54,125) | |
| Interest income | (44)(522) | |
| All non-cash gains and income, plus cash gains and income in excess of $10,000, for continuing operations that are classified as unusual, extraordinary or which are related to plant shutdowns, asset impairments and/or restructurings | — (100) | |
| Income related to changes in estimates for stock option grants and awards accounted for under the fair value-based method | — | |
| Income related to the application of the equity method of accounting | — | |
| Income related to adjustments in the estimated fair value of assets accounted for under the fair value method of accounting | — (262) | |
| Plus cash dividends declared on investments in an amount not to exceed $10,000 for such period | — | |
| Plus or minus, as applicable, pro forma EBITDA adjustments associated with acquisitions and asset dispositions | — | |
| Plus or minus, as applicable, pro forma EBITDA adjustments to pension expense associated with the early payment of pension obligations | —10,664 | |
Credit EBITDA as defined in Credit Agreement | $ | 93,38834,169 | |
*Credit EBITDA is not intended to represent net income (loss) or cash flow from operations as defined by GAAP and should not be considered as an alternative to either net income (loss) or to cash flow. |
The computation of the ABL Facility availability and Minimum Liquidity covenant, as defined in the ABL Facility, is presented below.
| | | | | |
| Year Ended |
Computations of leverage and interest coverage ratios(In thousands, except percentages) | December 31, |
| 2023 |
| Maximum aggregate principal | $ | 180,000 | |
| |
Maximum borrowing limit per the Borrowing base as defined in Credit Agreement at December 31, 2020:the ABL Facility (includes eligible domestic cash and cash equivalents of $3,846) | $ | 172,286 | |
Leverage ratio (indebtedness-to-Credit EBITDA)ABL Facility outstanding debt (matures on June 30, 2026) | 1.43x126,322 | |
Interest coverage ratio (Credit EBITDA-to-interest expense)Outstanding standby letters of credit | 36.1x13,080 | |
Most restrictive covenants as defined in Credit Agreement: | |
Maximum permitted aggregate amount of dividends that can be paid by Tredegar subsequent to Amendment No. 1 of the Credit Agreement ($75,000)ABL Facility availability | 75,000 | |
Maximum leverage ratio permitted$ | 4.00x32,884 | |
Minimum interest coverage ratio permittedLiquidity covenant | 3.00x10,000 | |
| ABL Facility availability in excess of Minimum Liquidity covenant | $ | 22,884 | |
TredegarIn addition to the financial covenants, the ABL Facility contains restrictive covenants, including covenants that restrict the Company’s ability to pay dividends and repurchase shares of its common stock.
As of December 31, 2023, the Company was in compliance with all debt covenants.
Terphane Brazil Loan
On October 26, 2023, Terphane Ltda., the Company’s wholly owned subsidiary in Brazil, borrowed $20 million secured by certain of its debt covenants as of December 31, 2020. Noncompliance with anyassets (“Terphane Brazil Loan”). This U.S. Dollar borrowing matures on October 30, 2028. The Company expects that the Terphane Brazil Loan will be repaid (and collateral released) upon the closing of the debt covenants may have a material adverse effect on its financial condition or liquidity, in the event such noncompliance cannot be cured or shouldContingent Terphane Sale. On October 26, 2023, the Company be unableborrowed $20 million from Terphane Brazil (the “Intercompany Loan”) at the same interest rate as the Terphane Brazil Loan, thereby transferring the funds to obtain a waiver from the lenders. RenegotiationU.S. The Company will repay the Intercompany Loan in conjunction with the closing of the covenant through an amendmentContingent Terphane Sale.
For more information on the ABL Facility and the Terphane Brazil Loan, see Note 7 “Debt and Credit Agreements” to the Credit Agreement may effectively cure the noncompliance, but may have an effect on its financial condition or liquidity depending upon how the covenant is renegotiated.Consolidated Financial Statements in Item 15.
The Company believes that existing borrowing availability, current cash balances and cash flow from operations will be sufficient to satisfy short term material cash requirements related to working capital, capital expenditure, and dividend requirementsdebt repayments for at least the next twelve12 months. In the longer term, liquidity will depend on many factors, including the results of operations, the timing and extent of capital expenditures, changes in operating plans, or other events that would cause the Company to seek additional financing in future periods. In addition, the completion of the Contingent Terphane Sale would provide additional liquidity.
Material Cash Requirements for Known Contractual and Other Obligations
The Company’s material cash requirements from known contractual and other obligations as of December 31, 2023 were as follows:
Debt and interest payments
As of December 31, 2023, the Company had outstanding debt from the ABL Facility of $126.3 million with contractual payments due in June 2026. Estimated future interest payments associated with the ABL Facility total $28.6 million, with $11.5 million payable within the next 12 months.
AtAs of December 31, 2020, Tredegar2023, Terphane Ltda., the Company’s wholly owned subsidiary in Brazil, had cashoutstanding debt of $20.0 million under the Terphane Brazil Loan. Estimated future interest payments associated with the Terphane Brazil Loan total $7.9 million, with $2.3 million payable within the next 12 months.
Capital expenditure commitments
See “Projected Capital Expenditures and cash equivalentsDepreciation & Amortization” within “Segment Operations Overview” above in this Item 7 for discussion of $11.8the Company’s planned investment in capital expenditures in 2024, of which $1.2 million including funds heldare contractual commitments that existed as of December 31, 2023.
Operating Leases
The Company enters into various operating leases primarily for real estate, office equipment and vehicles. See Note 4 “Leases” to the Consolidated Financial Statements in locations outside the U.S. of $9.4 million.Item 15 for additional information.
Contractual Obligations, Contingent Liabilities and CommitmentsUncertain Tax Positions
Following is a table which summarizes the continuing operations contractual obligations of Tredegar asAs of December 31, 2020:
| | | | | | | | | | | | | | | | | | | | | | | | | | | | | | | | | | | | | | | | | |
| | Payments Due by Period |
| (In millions) | 2021 | | 2022 | | 2023 | | 2024 | | 2025 | | Remainder | | Total |
| Debt: | | | | | | | | | | | | | |
| Principal payments | $ | — | | | $ | — | | | $ | — | | | $ | 134.0 | | | $ | — | | | $ | — | | | $ | 134.0 | |
| Estimated interest expense | 2.3 | | | 2.3 | | | 2.3 | | | 1.1 | | | — | | | — | | | 8.0 | |
Estimated contributions required: (1) | | | | | | | | | | | | | |
| Defined benefit plans | 11.7 | | | 12.0 | | | 11.9 | | | 11.3 | | | 9.7 | | | 9.5 | | | 66.1 | |
| Other postretirement benefits | 0.5 | | | 0.5 | | | 0.5 | | | 0.5 | | | 0.5 | | | 2.1 | | | 4.6 | |
| Capital expenditure commitments | 1.3 | | | 3.1 | | | — | | | — | | | — | | | — | | | 4.4 | |
Leases(2) | 3.2 | | | 2.9 | | | 2.6 | | | 2.5 | | | 2.4 | | | 7.4 | | | 21.0 | |
Estimated obligations relating to uncertain tax positions (3) | 0.1 | | | — | | | — | | | — | | | — | | | 0.6 | | | 0.7 | |
Other (4) | 4.2 | | | 0.6 | | | — | | | — | | | — | | | — | | | 4.8 | |
| Total | $ | 23.3 | | | $ | 21.4 | | | $ | 17.3 | | | $ | 149.4 | | | $ | 12.6 | | | $ | 19.6 | | | $ | 243.6 | |
(1) Estimated minimum required contributions for defined benefit plans2023, unrecognized tax benefits on uncertain tax positions were $0.7 million. Tax payments resulting from the successful challenge by the taxing authority on uncertain tax positions taken by Tredegar would possibly result in the payment of estimated interest and benefitpenalties of $0.2 million if tax payments for other postretirement plans are basedwere made as a result of a successful challenge by the taxing authority on actuarial estimates using current assumptions for discount rates, long-term rateuncertain tax positions. Due to uncertainties in the timing of return on plan assets, rate of compensation increases and health care cost trends. The expected defined benefit plan contribution estimates for 2021 through 2030 were determined under provisionspotential tax audits, the timing of the Pension Protection Actresolution of 2006 usingthese positions is uncertain. Therefore, the preliminary assumptions chosen by Tredegar for the 2021 plan year. Tredegar has determined that itCompany is not practicableunable to present defined benefit contributions and other postretirement benefit payments beyond 2030.
(2) Contractual lease payments for 2021 include $0.5 millionmake a reasonably reliable estimate of short term lease payments and $0.3 million of variable lease costs.
(3) Amounts for which reasonable estimates about the timing of payments cannot be madebeyond 12 months. See Note 12 “Income Taxes” to the Consolidated Financial Statements in Item 15 for additional information.
Off-Balance Sheet Arrangements
The Company has no material off-balance sheet arrangements that have had or are includedreasonably likely to have a material current or future effect on its financial condition, changes in the remainder column.
(4) Includes contractual severance and other miscellaneous contractual arrangements.financial condition, revenues or expenses, results of operations, liquidity, capital expenditures or capital resources.
From time to time, the Company enters into transactions with third parties in connection with the sale of assets or businesses in which it agrees to indemnify the buyers or third parties involved in the transaction, or the sellers or third parties involved in the transaction agree to indemnify Tredegar, for certain liabilities or risks related to the assets or business. Also, in the ordinary course of business, the Company may enter into agreements with third parties for the sale of goods or services that may contain indemnification provisions. In the event that an indemnification claim is asserted, liability for indemnification would be subject to an assessment of the underlying facts and circumstances under the terms of the applicable agreement. Further, any indemnification payments may be limited or barred by a monetary cap, a time limitation, or a deductible or basket. For these reasons, the Company is unable to estimate the maximum potential amount of the potential future liability under the indemnity provisions of these agreements. Tredegar does, however, accrue for losses for any known contingent liability, including those that may arise from indemnification provisions, when future payment is probable and the amount is reasonably estimable. The Company discloses contingent liabilities if the probability of loss is reasonably possible and material.
QuantitativeCritical Accounting Policies and Qualitative DisclosuresEstimates
The preparation of financial statements in accordance with GAAP requires the Company to make estimates and assumptions that affect the reported amounts of assets, liabilities, revenues, expenses and related disclosures. Certain accounting policies, as described below, are considered "critical accounting policies" because they are particularly dependent on estimates made by management about Market Riskmatters that are inherently uncertain and could have a material impact on the Company’s consolidated financial statements. Estimates and judgments are based on historical experience, forecasted events and various other assumptions that management believes are reasonable under the circumstances. Actual results could differ significantly from those estimates under different assumptions and conditions. A summary of all of our significant accounting policies is included in Note 1 “Nature of Operations and Summary of Significant Accounting Policies” to the Consolidated Financial Statements in Item 15.
Impairment of Goodwill
The Company assesses goodwill for impairment when events or circumstances indicate that the carrying value may not be recoverable, or, at a minimum, on an annual basis (December 1st of each year). When assessing goodwill for impairment, accounting guidance allows the Company to first perform a qualitative assessment (“Step 0 analysis”), which evaluates certain qualitative factors, including macroeconomic conditions, industry and market considerations, cost factors and overall financial performance, as well as company and reporting unit factors. If the Company's Step 0 analysis indicates that it is more likely than not that the fair value of a reporting unit is less than its carrying amount, then the Company would perform a quantitative impairment test (“Step 1 analysis”).
During 2023, uncertainty about the timing of a recovery in the consumer electronics market persisted, and manufacturers in the supply chain for consumer electronics continued to experience reduced capacity utilization and inventory corrections. In light of the limited visibility on the timing of a recovery and the expected adverse future impact to the Surface Protection business, coupled with a cautious outlook on new product development opportunities, the Company performed a Step 1 goodwill impairment analysis, as of June 30, 2023 and September 30, 2023, of the Surface Protection component of PE Films. The analyses concluded that the fair value of Surface Protection was less than its carrying value, thus a non-cash partial goodwill impairment of $34.9 million ($27.0 million after deferred income tax benefits) was recognized during 2023.
The Company estimated the fair value of Surface Protection by: (i) computing an estimated enterprise value (“EV”) utilizing the discounted cash flow method (the “DCF Method”), (ii) applying adjustments for any surplus or deficient working capital, (iii) adding cash and cash equivalents, and (iv) subtracting interest-bearing debt. The DCF Method was used, incorporating Surface Protection’s latest projections, which reflect updated expected market recovery levels, feasibility of launching new product applications, competitive pricing and cash flows associated with production efficiencies, as well as consideration of cost savings and inventory corrections.
Key financial assumptions utilized to determine the fair value of the reporting unit include revenue growth projections and a weighted average cost of capital assumption. At September 30, 2023, the effect of a ten percent decrease in the revenue growth projections and a one percent increase to the weighted average cost of capital assumption would further decrease the fair value of the reporting unit’s fair value by approximately $1 million. Further impairment to the Surface Protection reporting unit’s goodwill may be caused by factors outside the Company’s control, such as increasing competitive pricing pressures, weak consumer electronic market demand, lower than expected sales and profit growth rates, and various other factors. Given the uncertain demand for Surface Protections products, it is reasonably possible that the cash flow estimates used in deriving such fair value measurements may change in the future.
As of December 1, 2023, the Company’s reporting units with goodwill were Surface Protection in PE Films and Futura in Aluminum Extrusions. Both of these reporting units have separately identifiable operating net assets (operating assets including goodwill and identifiable intangible assets net of operating liabilities). The Company's Step 0 analysis of these reporting units concluded that it is more likely than not that the fair value of each reporting unit was greater than its carrying value. Therefore, the Step 1 quantitative goodwill impairment tests for these reporting units were not necessary. The Surface Protection and Futura reporting units had goodwill in the amounts of $22.4 million and $13.3 million, respectively, at December 31, 2023. See Note 1 “Nature of Operations and Summary of Significant Accounting Policies” to the Consolidated Financial Statements in Item 15 for additional information on the analysis of goodwill impairment.
Income Taxes
Current tax liabilities and assets are recognized for the estimated taxes payable or refundable, respectively, on the tax returns for the current year. Deferred tax assets and liabilities are determined based on differences between financial reporting and tax bases of assets and liabilities and are measured using the enacted tax rates and laws that will be in effect when the differences are expected to reverse. Accordingly, accounting for income taxes represents the Company’s best estimate of various events and transactions. Tax laws are often complex and may be subject to differing interpretations by the taxpayer and the relevant governmental taxing authorities. In establishing a provision for income tax expense, Tredegar must make judgments and interpretations about the application of tax laws. The Company must also make estimates about when in the future certain items will affect taxable income in the various taxing jurisdictions.
A valuation allowance is recorded in the period when the Company determines that it is more likely than not that all or a portion of deferred income tax assets may not be realized. The establishment and removal of a valuation allowance requires the Company to consider all positive and negative evidence and make a judgmental decision regarding the amount of valuation allowance required as of a reporting date.
Tredegar may be required to change its provision for income taxes when estimates used in determining valuation allowances on deferred tax assets significantly change, or when new information indicates the need for adjustment in valuation allowances. Additionally, future events, such as changes in tax laws, tax regulations, or interpretations of such laws or regulations, could have an impact on the provision for income tax and the effective tax rate. Any such changes could significantly affect the amounts reported in the financial statements in the year these changes occur.
See Note 12 “Income Taxes” to the Consolidated Financial Statements in Item 15 for additional information on income taxes.
Item 7A. QUANTITATIVE AND QUALITATIVE DISCLOSURES ABOUT MARKET RISK
Tredegar has exposure to the volatility of interest rates, polyethylene and polypropylene resin prices, Terephthalic Acid (“PTA”)PTA and Monoethylene Glycol (“MEG”)MEG prices, aluminum ingot and scrap prices, energy prices, foreign currencies and emerging markets. See Liquidity and Capital Resources regarding interest rate exposures related to borrowings under the Credit Agreement.ABL Facility.
Profit margins in Aluminum Extrusions are sensitive to fluctuations in aluminum ingot and scrap prices as well as natural gas prices (natural gas is the principal energy source used to operate its casting furnaces). Changes in polyethylene resin prices and the timing of those changes could have a significant impact on profit margins in PE Films. Changes in polyester resin, PTA and MEG prices, and the timing of those changes, could have a significant impact on profit margins in Flexible Packaging Films. There is no assurance of the Company’s ability to pass through higher raw material and energy costs to its customers.
The purchase price of raw materials fluctuates on a monthly basis; therefore, Aluminum Extrusions pricing policies generally allow the Company to pass the underlying index cost of aluminum and certain alloys through to the vast majority of our customers so that we remain substantially neutral to metal pricing. In the normal course of business, Aluminum Extrusions enters into fixed-price forward sales contracts with certain customers for the sale of fixed quantities of aluminum extrusions at scheduled intervals. In order to hedge its exposure to aluminum price volatility (see the chart below) under these fixed-price arrangements, which generally have a duration of not more than 12 months, the Company enters into a combination of forward purchase commitments and futures contracts to acquire or hedge aluminum, based on the scheduled deliveries. See Note 910 “Derivatives” to the Consolidated Financial Statements in Item 15 for additional information.
The volatility of quarterly average aluminum prices is shown in the chart below.
| | |
| Source: Quarterly averages computed by the Company using daily Midwest average prices provided by Platts. |
The volatility of quarterly average natural gas prices is shown in the chart below.
| | |
| Source: Quarterly averages computed by Tredegar using monthly NYMEX settlement prices. |
The volatility of average quarterly prices of polyethylene resin in the U.S. (a primary raw material for PE Films products) is shown in the chart below:
| | |
| Source: Quarterly averages computed by Tredegar using monthly data provided by IHS, Inc. In February 2020, IHS reflected a 32 cents per pound non-market adjustment based on their estimate of the growth of discounts in prior periods. The 4th quarter 2019 average rate of $0.51 per pound is shown on a pro forma basis as if the non-market adjustment was made in the fourth quarter of 2019. In January 2023, IHS reflected a 41 cents per pound non-market adjustment based on their estimate of the growth of discounts in the prior periods. The 4th quarter 2022 average rate of $0.60 per pound is shown on a pro forma basis as if the non-market adjustment was made in the fourth quarter of 2022. |
The price of resin is driven by several factors, including supply and demand and the price of oil, ethylene and natural gas. Selling prices to customers are set considering numerous factors, including the expected volatility of resin prices. In certain situations, PE Films has index-based pass-through raw material cost arrangements with customers. However, under certain agreements, changes in resin prices are not passed through for a period of 90 days or more. In response to unprecedented cost increases and supply issues for polyethylene and polypropylene resin, Tredegar Surface Protection implemented a quarterly resin cost pass-through mechanism, effective July 1, 2021, for all products and customers not previously covered by such arrangements. Pricing on the remainder of the business is based upon raw material costs and supply/demand dynamics within the markets thatin which the Company competes.
Polyester resins, MEG and PTA used in flexible packaging films produced in Brazil are primarily purchased domestically, with other sources available mostly from Asia and the U.S. Given the nature of these products as commodities, pricing is derived from Asian pricing indexes. The volatility of the average quarterly prices for polyester fibers in Asia, which is representative of polyester resin (a primary raw material for Flexible Packaging Films) pricing trends, is shown in the chart below:
| | |
| Source: Quarterly averages computed by Tredegar using monthly data from CMAI Global Index data. |
The volatility of average quarterly prices of PTA and MEG in Asia (raw materials used in the production of polyester resins produced by Flexible Packaging Films) is shown in the chart below:
| | |
| Source: Quarterly averages computed by Tredegar using monthly data from CMAI Global Index data. |
The Company sells to customers in foreign markets through its foreign operations and through exports from U.S. plants. The percentage of sales and total assets for manufacturing operations related to foreign markets for 2020, 20192023, 2022 and 20182021 are as follows:
| | | | | | | | | | | | | | | | | | | | | | | | | | | | | | | | | | | | | | | | | | | | | | | | | | | | | |
Tredegar Corporation
Percentage of Net Sales and Total Assets Related to Foreign Markets* |
| | 2020 | | 2019 | | 2018 |
| | % of Total | | % Total
Assets - Foreign Operations | | % of Total | | % Total
Assets - Foreign
Operations | | % of Total | | % Total
Assets -Foreign
Operations |
| | Net Sales | | | Net Sales | | | Net Sales | |
| | Exports
From
U.S. | | Foreign Operations | | | Exports
From
U.S. | | Foreign Operations | | | Exports
From
U.S. | | Foreign Operations | |
| Canada | 2 | | | — | | | — | | | 2 | | | — | | | — | | | 2 | | | — | | | — | |
| Europe | 1 | | | — | | | — | | | 1 | | | — | | | — | | | — | | | — | | | — | |
| Latin America | — | | | 13 | | | 10 | | | 1 | | | 12 | | | 7 | | | — | | | 10 | | | 7 | |
| Asia | 11 | | | — | | | 4 | | | 10 | | | — | | | 3 | | | 9 | | | 1 | | | 3 | |
| Total | 14 | | | 13 | | | 14 | | | 14 | | | 12 | | | 10 | | | 11 | | | 11 | | | 10 | |
| | | | | |
* | The percentages for foreign markets are relative to Tredegar’s consolidated net sales and total assets . |
| | | | | | | | | | | | | | | | | | | | | | | | | | | | | | | | | | | | | | | | | | | | | | | | | | | | | |
Tredegar Corporation
Percentage of Consolidated Net Sales and Total Assets Related to Foreign Markets |
| | 2023 | | 2022 | | 2021 |
| | % of Total | | % Total
Assets - Foreign Operations | | % of Total | | % Total
Assets - Foreign
Operations | | % of Total | | % Total
Assets -Foreign
Operations |
| | Net Sales | | | Net Sales | | | Net Sales | |
| | Exports
From
U.S. | | Foreign Operations | | | Exports
From
U.S. | | Foreign Operations | | | Exports
From
U.S. | | Foreign Operations | |
| Canada | 2 | | | — | | | — | | | 2 | | | — | | | — | | | 2 | | | — | | | — | |
| Europe | — | | | — | | | — | | | — | | | — | | | — | | | 1 | | | — | | | — | |
| Latin America | 1 | | | 13 | | | 15 | | | 1 | | | 13 | | | 13 | | | 1 | | | 12 | | | 10 | |
| Asia | 4 | | | — | | | 2 | | | 5 | | | — | | | 2 | | | 7 | | | — | | | 3 | |
| Total | 7 | | | 13 | | | 17 | | | 8 | | | 13 | | | 15 | | | 11 | | | 12 | | | 13 | |
Tredegar attempts to match the pricing and cost of its products in the same currency and generally views the volatility of foreign currencies and the corresponding impact on earnings and cash flow as part of the overall risk of operating in a global environment (for additional information, see trends for the Brazilian Real and Chinese Yuan in the charts on the following page). Exports from the U.S. are generally denominated in U.S. Dollars. The Company’s foreign currency exposure on income from continuing foreign operations relates to the Chinese Yuan and the Brazilian Real.
PE Films is generally able to match the currency of its sales and costs for its product lines. For flexible packaging films produced in Brazil, selling prices and key raw material costs are principally determined in U.S. Dollars and are impacted by local economic conditions and local and global competitive dynamics. Flexible Packaging Films is exposed to foreign exchange translation risk (its functional currency is the Brazilian Real) because almost 90% of the sales of Flexible Packaging Films business unit in Brazil (“Terphane Ltda.”) and substantially all of its related raw material costs are quoted or priced in U.S. Dollars while its variable conversion, fixed conversion and sales, general and administrative costs before depreciation &and amortization (collectively “Terphane Ltda. Operating Costs”) are quoted or priced in Brazilian Real. This mismatch, together
with a variety of economic variables impacting currency exchange rates, causes volatility that could negatively or positively impact EBITDA from ongoing operations for Flexible Packaging Films.
The Company estimates annual net costs of R$119139 million for the net mismatch translation exposure between Terphane Ltda.’s U.S. Dollar quoted or priced sales and raw material costs and underlying Brazilian Real quoted or priced Terphane Ltda. Operating Costs. Terphane Ltda. has outstanding foreign exchange average forward rate contracts to purchase Brazilian Real and sell U.S. Dollars to hedge its exposure. See Note 910 “Derivatives” to the Consolidated Financial Statements in Item 15 for more information on outstanding hedging contracts and this hedging program.
Tredegar estimates that the change in the value of foreign currencies relative to the U.S. Dollar on PE Films had an unfavorable impact on EBITDA from ongoing operations in PE Films of $0.7$0.6 million in 20202023 compared to 2019 and an unfavorable impact on EBITDA from ongoing operations of $0.5 million in 2019 compared with 2018.2022.
Trends for the Brazilian Real and Chinese Yuan are shown in the chart below:
| | |
| Source: Quarterly averages computed by Tredegar using daily closing data provided by Bloomberg. |
Item 7A. QUANTITATIVE AND QUALITATIVE DISCLOSURES ABOUT MARKET RISK
See discussion of Quantitative and Qualitative Disclosures about Market Risk in Item 7.
Item 8. FINANCIAL STATEMENTS AND SUPPLEMENTARY DATA
The information required by this Item 8 is set forth in Item 15 and is hereby incorporated herein by reference.
Item 9. CHANGES IN AND DISAGREEMENTS WITH ACCOUNTANTS ON ACCOUNTING AND FINANCIAL DISCLOSURE
None.
Item 9A. CONTROLS AND PROCEDURES
On November 1, 2018, the Company filed a Current Report on Form 8-K (the “November 2018 Form 8-K”) to disclose deficiencies in internal control over financial reporting. For further information, see the November 2018 Form 8-K and Item 4. “Controls and Procedures” of the Company’s Quarterly Report on Form 10-Q for the quarterly period ended September 30, 2018 (the “2018 Third Quarter 10-Q”).
Evaluation of Disclosure Controls and Procedures
In connection with the preparation of this Form 10-K, pursuant to Rule 13a-15(b) under the Securities Exchange Act of 1934, as amended (the “Exchange Act”), the Company carried out an evaluation with the participation of its management, including its Chief Executive Officer (principal executive officer) and Chief Financial Officer (principal financial officer), of the effectiveness of the design and operation of the Company’s disclosure controls and procedures (as defined under Rule 13a-15(e) and 15d-15(e) under the Exchange Act) as of December 31, 2020.2023.
Based on thisthe evaluation of our disclosure controls and procedures as of December 31, 2023, the Company’s Chief Executive Officer and Chief Financial Officer concluded that, becauseas of the material weaknesses in internal control over financial reporting discussed below, the Company’ssuch date, our disclosure controls and procedures were not effective as of December 31, 2020, to ensure: (i) that information required to be disclosed by the Company in the reports that it files or submits under the Exchange Act, is recorded, processed, summarized and reported, within the time periods specified in the SEC’s rules and forms, and (ii) that such information is accumulated and communicated to management, including the Chief Executive Officer and Chief Financial Officer, as appropriate, to allow timely decisions regarding required disclosure.effective.
Management’s Report on Internal Control Overover Financial Reporting
The Company’s management is responsible for establishing and maintaining adequate internal control over financial reporting, as such term is defined in Rules 13a-15(f) and 15d-15(f) under the Exchange Act. The Company’s internal control over financial reporting is a process designed by or under the supervision of the Company’s Chief Executive Officer and Chief Financial Officer, and overseen by the Board of Directors, to provide reasonable assurance regarding the reliability of financial reporting and the preparation of published financial statements for external purposes in accordance with GAAP and includes policies and procedures that:
•Pertain to the maintenance of records that, in reasonable detail, accurately and fairly reflect the transactions and dispositions of the Company’s assets;
•Provide reasonable assurance that transactions are recorded as necessary to permit preparation of financial statements in accordance with GAAP, and that the Company’s receipts and expenditures are being made only in accordance with the authorization of its management and directors; and
•Provide reasonable assurance regarding prevention or timely detection of unauthorized acquisition, use or disposition of the Company’s assets that could have a material effect on the consolidated financial statements.
Because of its inherent limitations, internal control over financial reporting is not intended to provide absolute assurance that a misstatement of the Company’s consolidated financial statements would be prevented or detected. Also, projections of any evaluation of effectiveness to future periods are subject to the risk that controls may become inadequate because of changes in conditions, or that the degree of compliance with the policies or procedures may deteriorate.
Management conducted an evaluation of the effectiveness of the Company’s internal control over financial reporting using the criteria in Internal Control - Integrated Framework 2013 issued by the Committee of Sponsoring Organizations of the Treadway Commission (the “2013 COSO Framework”).Based on management’s assessment, the Company’s Chief Executive Officer and Chief Financial Officer concluded that the Company’s internal control over financial reporting was effective as of December 31, 2023.
The effectiveness of the Company’s internal control over financial reporting as of December 31, 2023, has been audited by KPMG LLP, an independent registered public accounting firm, as stated in their report, which is included in Item 15 “Exhibits and Financial Statement Schedules”.
Remediation of Previously Disclosed Material Weaknesses
As previously disclosed under “Item 9a – Controls and Procedures” in our annual report on Form 10-K for the period ended December 31, 2022, the Company did not sufficiently attract, develop, and retain competent resources to fulfill internal control responsibilities and did not have an effective information and communication process that identified and assessed the source of and controls necessary to ensure the reliability of information used in financial reporting.As a consequence of these material weaknesses, the Company did not effectively design, implement and operate process-level controls across its financial reporting processes.A material weakness is a deficiency, or combination of deficiencies, in internal control over financial reporting, such that there is a reasonable possibility that a material misstatement of the annual or interim financial statements will not be prevented or detected on a timely basis.
Management conducted an evaluation of the effectiveness of the Company’s internal control over financial reporting using the criteria in Internal Control - Integrated Framework 2013 issued by the Committee of Sponsoring Organizations of the Treadway Commission (the “2013 COSO Framework”). As a result of this evaluation, management concluded that the
Company’s internal control over financial reporting was not effective as of December 31, 2020, because of the material weaknesses in internal control over financial reporting discussed below.
•Control Environment: The Company did not have a sufficient number of trained resources with assigned responsibility and accountability for the design, operation and documentation of internal control over financial reporting in accordance with the 2013 COSO Framework.
•Risk Assessment: The Company did not have an effective risk assessment process that defined clear financial reporting objectives and evaluated risks, including fraud risks, and risks resulting from changes in the external environment and business operations, at a sufficient level of detail to identify all relevant risks of material misstatement across the entity.
•Information and Communication: The Company did not have an effective information and communication process that identified and assessed the source of and controls necessary to ensure the reliability of information used in financial reporting and that communicates relevant information about roles and responsibilities for internal control over financial reporting.
•Monitoring Activities: The Company did not have effective monitoring activities to assess the operation of internal control over financial reporting, including the continued appropriateness of control design and level of documentation maintained to support control effectiveness.
•Control Activities: As a consequence of the material weaknesses described above, internal control deficiencies related to the design and operation of process-level controls and general information technology controls were determined to be pervasive throughout the Company’s financial reporting processes.
While these material weaknesses did not result in material misstatements of the Company’s financial statements as of and forDuring the year ended December 31, 2020, these material weaknesses create a reasonable possibility that a material misstatement of account balances or disclosures in annual or interim consolidated financial statements may not be prevented or detected in a timely manner. Accordingly,2023, the Company, concluded thatwith the deficiencies represent material weaknesses in itsoversight of the Audit Committee of our Board of Directors, continued to design and implement measures pursuant to management’s overall internal controlcontrols over financial reporting remediation plan and its internal control over financial reporting was not effective asalso completed testing of December 31, 2020.
The Company’s independent registered public accounting firm, KPMG LLP, which audited the 2020 consolidated financial statements included in this Form 10-K, has expressed an adverse opinion on thedesign and operating effectiveness of the Company's internal control over financial reporting. KPMG LLP's report appears on page 47 of this Form 10-K.
Remediation Plan
all remediated controls. The Company’s remediation efforts are ongoing, and it will continue its initiatives to implement and document policies and procedures, and strengthendate included the Company’s internal control environment. Remediation of the identified material weaknesses and strengthening the Company’s internal control environment has extended into 2021. In addition, the Company is monitoring the impact of COVID-19 on its remediation plan. Depending on the severity and length of the pandemic, the remediation timeline could be negatively impacted because of inefficiencies caused by COVID-related limitations on travel, meetings, on-site work and close collaboration and the related increase in time necessary to complete remediation projects.
The material weaknesses cannot be considered completely remediated until the applicable controls have operated for a sufficient period of time and management has concluded, through testing, that these controls are operating effectively.
To remediate the material weaknesses described above, the Company is pursuing the six remediation steps identified in the 2018 Third Quarter 10-Q. To date, the Company has accomplished the following as part of those remediation steps:following:
a.•Identified material processes and significant locations for the purposePerformed walkthroughs of identifying risks of material misstatement to the Company’s financial statements,reporting processes including identifying all information used within the Company’s control environment;
b.•Conducted interviews with relevant parties to ensure our understanding of the activities involved in the recording of transactions within material processes,
c.Substantially completedCompleted a comprehensive review of, and update as necessary, ofto, the documentation of relevant processes with respect to the Company’s internal control over financial reporting,reporting;
d.•Documented significant elements of a comprehensive risk assessment andDeveloped internal control gap analysisremediation plans to enhance controls for deficiencies associated with the material weaknesses above, including an assessment of personnel skills and commencedexperience related to the validation thereof with key stakeholders,design and operation of internal control activities;
e.•Commenced the design of certainImplemented all new or redesignedand revised internal controls to address the previously identified deficiencies associated with the material weaknesses above;
•Expanded the internal control compliance department with personnel who have appropriate internal control experience and identified resources for control owner positions that had previously experienced turnover; and
f.•CommencedExecuted a targeted training program to educate control owners on the design and implementationrequirements of internal controlscontrol activities, including maintaining adequate documentary evidence for certain processes within its Aluminum Extrusions business, PE Films business, its Flexible Packaging business, and its corporate functions.
The Company continues to work with its outside consultant, an internationally recognized accounting firm, to assist in completing the remediation plan. The Company believes that its remediation plan will be sufficient to remediate the identified
material weaknesses and strengthen its internal control over financial reporting. Asactivities.
Based on management’s evaluation of the Company continues to evaluate, and works to improve, itseffectiveness of the Company’s internal controls as of December 31, 2023, including newly remediated controls, management concluded that the Company’s internal control over financial reporting management may determineframework was effectively designed and operated effectively for a sufficient period of time to enable us to conclude that additional measures to address control deficiencies or modifications to the remediation plan are necessary. The Company cannot assure you, however, when it will remediate such weaknesses, nor can it be certain whether additional actions will be required or the costs of any such actions. Moreover, the Company cannot assure you that additionalall previously identified material weaknesses will not arise in the future.have been remediated as of December 31, 2023.
Changes in Internal Control Over Financial Reporting
The Company is in the process of implementing certain changes in its internal controls to remediate the material weaknesses described above. The implementation of the material aspects of this plan began in the second quarter of 2019. During the quarter ended December 31, 2020, the Company, with the assistance of its outside consultant, continued the design and implementation of internal controls for certain processes within its Aluminum business, PE Films business, Flexible Packaging business and its corporate function. Except as noted above with respect to the implementationcompletion of the steps in the remediation plan, there has been no change in the Company’s internal control over financial reporting during the quarteryear ended December 31, 2020,2023, that has materially affected, or is reasonably likely to materially affect, its internal control over financial reporting.reporting (as defined in Rules 13a-15(f) and 15d-15(f) under the Exchange Act).
Item 9B. OTHER INFORMATION
None.
Item 9C. DISCLOSURE REGARDING FOREIGN JURISDICTIONS THAT PREVENT INSPECTIONS
None.
PART III
Item 10. DIRECTORS, EXECUTIVE OFFICERS AND CORPORATE GOVERNANCE
The information concerning directors and persons nominated to become directors of Tredegar to be included in the Proxy Statement under the headings “Proposal 1: Election of Directors” and “Tredegar’s Board of Directors” is incorporated herein by reference.
The information concerning corporate governance to be included in the Proxy Statement under the headings “Board Meetings, Meetings of Non-ManagementIndependent Directors and the Board Committees” and “Corporate Governance”Governance and Risk Oversight” is incorporated herein by reference.
Set forth below are the names, ages and titles of the Company’s executive officers:
| | | | | | | | | | | | | | |
| Name | | Age | | Title |
| John M. Steitz | | 6265 | | | President and Chief Executive Officer |
| D. Andrew Edwards | | 6265 | | | Executive Vice President and Chief Financial Officer |
| Kevin C. Donnelly | | 4649 | | | Vice President, General Counsel and Corporate Secretary |
John M. Steitz. Mr. Steitz was elected President and Chief Executive Officer effective March 19, 2019. He previously served as President and Chief Executive Officer of Addivant Corporation, a leading global supplier of antioxidants, intermediates, inhibitors, modifiers, UV stabilizers and other additives to the plastic and rubber industries, from March 2015 until January 2019, as President and Chief Operating Officer of PQ Corporation, a leading worldwide producer of specialty inorganic performance chemicals and catalysts, from October 2013 until March 2015, as President and Chief Executive Officer of Avantor Performance Materials, a global supplier of ultra-high-purity life sciences materials with strict regulatory and performance specifications, from September 2012 untilthrough September 2013, as President and Chief Operating Officer of Albemarle Corporation, a global specialty chemicals company, from March 2012 untilthrough August 2012, and as Chief Operating Officer and Executive Vice President of Albemarle from April 2007 until March 2012.
D. Andrew Edwards. Mr. Edwards was named Executive Vice President and Chief Financial Officer effective August 6, 2020. Mr. Edwards had beenserved as Vice President and Chief Financial Officer sincefrom July 20, 2015.2015 until August 2020. He previously served as the Chief Financial Officer of United Sporting Companies, Inc., a wholesale distributor of outdoor sporting goods, from February 2013 until July 2015 and as Vice President, Controller and Chief Accounting Officer of Owens & Minor, Inc., a distributor of acute medical products, from April 2010 to February 2013 and as Acting Chief Financial Officer of Owens & Minor, Inc. from March 2012 to February 2013. Mr. Edwards also served as Vice President, Finance, of Owens & Minor, Inc. from December 2009 until April 2010. Mr. Edwards previously served as the Company’s Vice President, Chief Financial Officer and Treasurer from August 2003 to December 2009 and as the Company’s Vice President, Finance from November 1998 to August 2003. Mr. Edwards also served as the Company’s Treasurer from May 1997 to December 2009 and as the Company’s Controller from October 1992 until July 2000.
Kevin C. Donnelly. Mr. Donnelly was elected Vice President, General Counsel and Corporate Secretary effective January 1, 2021. He joined Tredegar in 2010 and served as its Associate General Counsel from 2013 to 2020. Prior to joining Tredegar, Mr. Donnelly was an associate at Hunton & Williams LLP (now Hunton Andrews Kurth LLP). He received a B.A. degree from the University of Richmond and a J.D. from the University of Virginia.
Tredegar has adopted a Code of Conduct that applies to all of its directors, officers and employees (including its chief executive officer, chief financial officer and principal accounting officer) and has posted the Code of Conduct on its website. All amendments to or waivers from any provision of the Company’s Code of Conduct applicable to the chief executive officer, chief financial officer and principal accounting officer will be disclosed on the Company’s website. The Company’s internet address is www.tredegar.com.
Item 11. EXECUTIVE COMPENSATION
The information to be included in the Proxy Statement under the headings “Compensation of Directors,” “Board Meetings, Meetings of Non-Management Directors and Board Committees - Executive Compensation Committee Interlocks and Insider Participation,” “Compensation Discussion and Analysis,” “Executive Compensation Committee Report” and “Compensation of Executive Officers” is incorporated herein by reference.
Item 12. SECURITY OWNERSHIP OF CERTAIN BENEFICIAL OWNERS AND MANAGEMENT AND RELATED STOCKHOLDER MATTERS
The information to be included in the Proxy Statement under the heading “Equity Compensation Plan Information” is incorporated herein by reference.
Item 13. CERTAIN RELATIONSHIPS AND RELATED TRANSACTIONS, AND DIRECTOR INDEPENDENCE
The information to be included in the Proxy Statement under the headings “Certain Relationships and Related Transactions,” “Tredegar’s Board of Directors” and “Board Meetings, Meetings of Non-ManagementIndependent Directors and Board Committees” is incorporated herein by reference.
Item 14. PRINCIPAL ACCOUNTING FEES AND SERVICES
Our independent registered public accounting firm is KPMG LLP, Richmond, Virginia, Audit Firm ID: 185.
The following is incorporated herein by reference:
•Information on accounting fees and services to be included in the Proxy Statement under the heading “Audit and Non-Audit Fees;” and
•Information on the Audit Committee’s procedures for pre-approving certain audit and non-audit services to be included in the Proxy Statement under the heading “Board Meetings, Meetings of Non-Management Directors and Board Committees—Audit Committee Matters.”
PART IV
Item 15. EXHIBITS AND FINANCIAL STATEMENT SCHEDULES
| | | | | | |
(a)(1) | (a)(1) | List of documents filed as a part of the report: | |
| (1) | Financial statements: | |
| Tredegar Corporation |
| Index to Financial Statements and Supplementary Data |
| Page |
| Auditors’ Opinions: | |
| | |
| | |
| Financial Statements: | |
| | |
| | |
| | |
| | |
| | |
| | |
(a)(1) | |
(a)(1) | |
| Tredegar Corporation | |
| Tredegar Corporation | |
| Tredegar Corporation | |
| Index to Financial Statements and Supplementary Data | | | Index to Financial Statements and Supplementary Data |
| | Page | | | | Page |
| Auditors’ Opinions: | |
| | |
| | |
| | | |
| | | | | |
| Financial Statements: | |
| | |
| | |
| | | |
| | | | | |
| | | | | |
| | | | | |
| | | | | |
| | | | | |
| (2) | (2) | Financial statement schedules: | |
| None | |
| None | |
| None | |
| None | |
| (3) | |
| (3) | |
| (3) | (3) | | | | |
|
Report of Independent Registered Public Accounting Firm
To the Shareholders and Board of Directors
Tredegar Corporation:
Opinion on the Consolidated Financial Statements
We have audited the accompanying consolidated balance sheets of Tredegar Corporation and subsidiaries (the Company) as of December 31, 20202023 and 2019,2022, the related consolidated statements of income (loss), comprehensive income (loss), cash flows, and shareholders’ equity for each of the years in the three-year period ended December 31, 2020,2023, and the related notes (collectively, the consolidated financial statements). In our opinion, the consolidated financial statements present fairly, in all material respects, the financial position of the Company as of December 31, 20202023 and 2019,2022, and the results of its operations and its cash flows for each of the years in the three-year period ended December 31, 2020,2023, in conformity with U.S. generally accepted accounting principles.
We also have audited, in accordance with the standards of the Public Company Accounting Oversight Board (United States) (PCAOB), the Company’s internal control over financial reporting as of December 31, 2020,2023, based on criteria established in Internal Control – Integrated Framework (2013) issued by the Committee of Sponsoring Organizations of the Treadway Commission, and our report dated March 16, 202115, 2024 expressed an adverseunqualified opinion on the effectiveness of the Company’s internal control over financial reporting.
Change in Accounting Principle
As discussed in Note 1 to the consolidated financial statements, the Company has changed its method of accounting for leases as of January 1, 2019 due to the adoption of Accounting Standards Codification Topic 842, Leases.
Basis for Opinion
These consolidated financial statements are the responsibility of the Company’s management. Our responsibility is to express an opinion on these consolidated financial statements based on our audits. We are a public accounting firm registered with the PCAOB and are required to be independent with respect to the Company in accordance with the U.S. federal securities laws and the applicable rules and regulations of the Securities and Exchange Commission and the PCAOB.
We conducted our audits in accordance with the standards of the PCAOB. Those standards require that we plan and perform the audit to obtain reasonable assurance about whether the consolidated financial statements are free of material misstatement, whether due to error or fraud. Our audits included performing procedures to assess the risks of material misstatement of the consolidated financial statements, whether due to error or fraud, and performing procedures that respond to those risks. Such procedures included examining, on a test basis, evidence regarding the amounts and disclosures in the consolidated financial statements. Our audits also included evaluating the accounting principles used and significant estimates made by management, as well as evaluating the overall presentation of the consolidated financial statements. We believe that our audits provide a reasonable basis for our opinion.
Critical Audit Matter
The critical audit matter communicated below is a matter arising from the current period audit of the consolidated financial statements that was communicated or required to be communicated to the audit committee and that: (1) relates to accounts or disclosures that are material to the consolidated financial statements and (2) involved our especially challenging, subjective, or complex judgments. The communication of a critical audit matter does not alter in any way our opinion on the consolidated financial statements, taken as a whole, and we are not, by communicating the critical audit matter below, providing a separate opinion on the critical audit matter or on the accounts or disclosures to which it relates.
Valuation of investmentGoodwill impairment in kaleo, Inc.the Surface Protection reporting unit
As discussed in Notes 1 and 45 to the consolidated financial statements, the Company accounts for its ownership interest in kaleo, Inc. (“kaléo”) underCompany’s goodwill balance as of December 31, 2023 was $35.7 million, including $22.4 million related to the fair value option of accounting.Surface Protection reporting unit, within the PE Films reportable segment. The Company estimatesassesses goodwill for impairment when events or circumstances indicate that the carrying value may not be recoverable, or, at a minimum, on an annual basis (December 1st of each year). During the three months ended June 30, 2023 and September 30, 2023, events and circumstances indicated that the Surface Protection reporting unit might be impaired. The Company performed quantitative impairment tests of the Surface Protection reporting unit as of June 30, 2023 and September 30, 2023, and concluded that an impairment existed as of June 30, 2023 and September 30, 2023. Management estimated the fair value of its investment in kaléo by computing the weighted average estimated enterprise valueSurface Protection reporting unit utilizing both the discounted cash flow method (the “DCF method”) and the application of a market multiple to earnings before interest, taxes, depreciation and amortization (the “EBITDA multiple method”), and applying certain other adjustments. The Company applied an 80% weighting to the DCF method and a 20% weighting to the EBITDA multiple method. As of December 31, 2020, the estimated fair value of the Company’s ownership interest in kaléo was $34.6M.
We identified the assessment of goodwill impairment of the Surface Protection reporting unit as a critical audit matter. The estimation of fair value of the reporting unit is complex and includes estimation uncertainties that required a higher level of subjective auditor judgment. Specifically, the revenue growth projections used in the discounted cash flow method required subjective and challenging auditor judgment as they represented subjective determinations of market and economic conditions. Additionally, the audit effort associated with the discount rate and the revenue growth projections required specialized skills
and knowledge. Changes to those assumptions could have had a significant effect on the Company’s estimate of the fair value of the Company’s ownership interest in kaléo as a critical audit matter. Subjective auditor judgment was required to evaluate certain assumptions used in the DCF method. Specifically, the weighted average cost of capital (“WACC”), which was used as the basis for the discount rate, is sensitive to variation such that minor changes to this assumption could have a significant impact on the estimated fair value of the Company’s ownership interest in kaléo.reporting unit.
The following are the primary procedures we performed to address thethis critical audit matter. We evaluated the design and tested the operating effectiveness of certain internal controls related to the Company’s goodwill impairment assessment process, including controls over the selection of the discount rate and development of the revenue growth projections. We assessed the revenue growth projections by considering correspondence with customers, as well as the underlying business strategies and growth plans of the Company. We also evaluated the revenue growth projections by comparing them to third-party market data and to historical actual results. In addition, we involved valuation professionals with specialized skills and knowledge, who assisted in:
— evaluating the Company’s discount rate by comparing it to a discount rate that was independently developed using publicly available third-party market data for comparable entities
— developing an estimate of fair value using kaléo’s forecasted cash flows and•evaluating the Company’s revenue growth projections by comparing them to projections that were independently developed discount rate,using external market and comparing the results of our estimate of fair value to the Company’s fair value estimate.industry data.
/s/ KPMG LLP
We have served as the Company’s auditor since 2018.
Richmond, Virginia
March 16, 202115, 2024
Report of Independent Registered Public Accounting Firm
To the Shareholders and Board of Directors
Tredegar Corporation:
Opinion on Internal Control Over Financial Reporting
We have audited Tredegar Corporation and subsidiaries’(thesubsidiaries' (the Company) internal control over financial reporting as of December 31, 2020,2023, based on criteria established in Internal Control – Integrated Framework (2013) issued by the Committee of Sponsoring Organizations of the Treadway Commission. In our opinion, because of the effect of the material weaknesses, described below, on the achievement of the objectives of the control criteria, the Company has not maintained, in all material respects, effective internal control over financial reporting as of December 31, 2020,2023, based on criteria established in Internal Control – Integrated Framework (2013) issued by the Committee of Sponsoring Organizations of the Treadway Commission.
We also have audited, in accordance with the standards of the Public Company Accounting Oversight Board (United States) (PCAOB), the consolidated balance sheets of the Company as of December 31, 20202023 and 2019,2022, the related consolidated statements of income (loss), comprehensive income (loss), cash flows, and shareholders’ equity for each of the years in the three-year period ended December 31, 2020,2023, and the related notes (collectively, the consolidated financial statements), and our report dated March 16, 202115, 2024 expressed an unqualified opinion on those consolidated financial statements.
A material weakness is a deficiency, or a combination of deficiencies, in internal control over financial reporting, such that there is a reasonable possibility that a material misstatement of the company’s annual or interim financial statements will not be prevented or detected on a timely basis. Material weaknesses related to an ineffective control environment resulting from an insufficient number of trained resources, ineffective risk assessment, ineffective information and communication, and ineffective monitoring activities resulting in ineffective control activities related to the design and operation of process-level controls and general information technology controls across all financial reporting processes have been identified and included in management’s assessment. The material weaknesses were considered in determining the nature, timing, and extent of audit tests applied in our audit of the 2020 consolidated financial statements, and this report does not affect our report on those consolidated financial statements.
Basis for Opinion
The Company’s management is responsible for maintaining effective internal control over financial reporting and for its assessment of the effectiveness of internal control over financial reporting, included in the accompanying Management’s Report on Internal Control Over Financial Reporting.Reporting. Our responsibility is to express an opinion on the Company’s internal control over financial reporting based on our audit. We are a public accounting firm registered with the PCAOB and are required to be independent with respect to the Company in accordance with the U.S. federal securities laws and the applicable rules and regulations of the Securities and Exchange Commission and the PCAOB.
We conducted our audit in accordance with the standards of the PCAOB. Those standards require that we plan and perform the audit to obtain reasonable assurance about whether effective internal control over financial reporting was maintained in all material respects. Our audit of internal control over financial reporting included obtaining an understanding of internal control over financial reporting, assessing the risk that a material weakness exists, and testing and evaluating the design and operating effectiveness of internal control based on the assessed risk. Our audit also included performing such other procedures as we considered necessary in the circumstances. We believe that our audit provides a reasonable basis for our opinion.
Definition and Limitations of Internal Control Over Financial Reporting
A company’s internal control over financial reporting is a process designed to provide reasonable assurance regarding the reliability of financial reporting and the preparation of financial statements for external purposes in accordance with generally accepted accounting principles. A company’s internal control over financial reporting includes those policies and procedures that (1) pertain to the maintenance of records that, in reasonable detail, accurately and fairly reflect the transactions and dispositions of the assets of the company; (2) provide reasonable assurance that transactions are recorded as necessary to permit preparation of financial statements in accordance with generally accepted accounting principles, and that receipts and expenditures of the company are being made only in accordance with authorizations of management and directors of the company; and (3) provide reasonable assurance regarding prevention or timely detection of unauthorized acquisition, use, or disposition of the company’s assets that could have a material effect on the financial statements.
Because of its inherent limitations, internal control over financial reporting may not prevent or detect misstatements. Also, projections of any evaluation of effectiveness to future periods are subject to the risk that controls may become inadequate because of changes in conditions, or that the degree of compliance with the policies or procedures may deteriorate.
/s/ KPMG LLP
Richmond, Virginia
March 16, 202115, 2024
CONSOLIDATED BALANCE SHEETS
Tredegar Corporation and Subsidiaries
| | December 31 |
| 2020 | | 2019 |
| December 31 | | | December 31 |
| 2023 | | | 2023 | | 2022 |
| (In thousands, except share data) | (In thousands, except share data) | |
| Assets | Assets | |
| Assets | |
| Assets | |
| Assets | |
| Assets | |
| Assets | |
| Assets | |
| Assets | |
| Assets | |
| Current assets: | |
| Current assets: | |
| Current assets: | Current assets: | |
| Cash and cash equivalents | Cash and cash equivalents | $ | 11,846 | | | $ | 31,422 | |
| Accounts and other receivables, net of allowance for doubtful accounts and sales returns of $2,797 in 2020 and $1,904 in 2019 | 86,327 | | | 89,117 | |
| Cash and cash equivalents | |
| Cash and cash equivalents | |
| Restricted cash | |
| Accounts and other receivables, net | |
| Income taxes recoverable | Income taxes recoverable | 2,807 | | | 2,661 | |
| Inventories | Inventories | 66,437 | | | 64,205 | |
| Prepaid expenses and other | Prepaid expenses and other | 19,679 | | | 8,333 | |
| Current assets of discontinued operations | 1,339 | | | 37,418 | |
| | Total current assets | |
| Total current assets | |
| Total current assets | Total current assets | 188,435 | | | 233,156 | |
| Property, plant and equipment, at cost: | Property, plant and equipment, at cost: | |
| Land and land improvements | |
| Land and land improvements | |
| Land and land improvements | Land and land improvements | 4,544 | | | 4,554 | |
| Buildings | Buildings | 66,406 | | | 64,311 | |
| Machinery and equipment | Machinery and equipment | 404,669 | | | 413,856 | |
| Total property, plant and equipment | Total property, plant and equipment | 475,619 | | | 482,721 | |
| Less accumulated depreciation | (309,074) | | | (309,165) | |
| Less: accumulated depreciation | |
| Net property, plant and equipment | Net property, plant and equipment | 166,545 | | | 173,556 | |
| Right-of-use leased assets | Right-of-use leased assets | 16,037 | | | 18,492 | |
| Investment in kaléo (cost basis of $7,500) | 34,600 | | | 95,500 | |
| Identifiable intangible assets, net | Identifiable intangible assets, net | 18,820 | | | 22,636 | |
| Goodwill | Goodwill | 67,708 | | | 81,404 | |
| Deferred income tax assets | Deferred income tax assets | 19,068 | | | 12,435 | |
| Other assets | Other assets | 3,506 | | | 4,628 | |
| Non-current assets of discontinued operations | 151 | | | 70,861 | |
| Total assets | Total assets | $ | 514,870 | | | $ | 712,668 | |
| Liabilities and Shareholders’ Equity | Liabilities and Shareholders’ Equity | |
| Current liabilities: | Current liabilities: | |
| Current liabilities: | |
| Current liabilities: | |
| Accounts payable | |
| Accounts payable | |
| Accounts payable | Accounts payable | $ | 89,702 | | | $ | 87,296 | |
| Accrued expenses | Accrued expenses | 40,741 | | | 39,465 | |
| Lease liability, short-term | Lease liability, short-term | 2,082 | | | 2,427 | |
| ABL revolving facility (matures on June 30, 2026) | |
| Income taxes payable | Income taxes payable | 706 | | | 0 | |
| Current liabilities of discontinued operations | 7,521 | | | 23,280 | |
| | Total current liabilities | |
| Total current liabilities | |
| Total current liabilities | Total current liabilities | 140,752 | | | 152,468 | |
| Lease liability, long-term | Lease liability, long-term | 14,949 | | | 17,338 | |
| Long-term debt | Long-term debt | 134,000 | | | 42,000 | |
| Pension and other postretirement benefit obligations, net | Pension and other postretirement benefit obligations, net | 110,585 | | | 107,446 | |
| Deferred income tax liabilities | 0 | | | 11,019 | |
| | Other non-current liabilities | Other non-current liabilities | 5,529 | | | 5,297 | |
| Non-current liabilities of discontinued operations | 0 | | | 351 | |
| Other non-current liabilities | |
| Other non-current liabilities | |
| Total liabilities | Total liabilities | 405,815 | | | 335,919 | |
| Contingencies (Note 16) | | Contingencies (Note 16) | | | |
| Shareholders’ equity: | Shareholders’ equity: | |
| Common stock (no par value): | |
| Authorized 150,000,000 shares; | |
| Issued and outstanding— 33,457,176 shares in 2020 and 33,365,039 in 2019 (including restricted stock) | 50,066 | | | 45,514 | |
| Common stock held in trust for savings restoration plan (105,067 shares in 2020 and 74,798 in 2019) | (2,087) | | | (1,592) | |
| Common stock, no par value (authorized 150,000,000 shares, issued and outstanding— 34,408,638 shares at December 31, 2023 and 34,000,642 at December 31, 2022) | |
| Common stock, no par value (authorized 150,000,000 shares, issued and outstanding— 34,408,638 shares at December 31, 2023 and 34,000,642 at December 31, 2022) | |
| Common stock, no par value (authorized 150,000,000 shares, issued and outstanding— 34,408,638 shares at December 31, 2023 and 34,000,642 at December 31, 2022) | |
| Common stock held in trust for savings restoration plan (118,543 shares at December 31, 2023 and 113,316 at December 31, 2022) | |
| Accumulated other comprehensive income (loss): | Accumulated other comprehensive income (loss): | |
| Foreign currency translation adjustment | |
| Foreign currency translation adjustment | |
| Foreign currency translation adjustment | Foreign currency translation adjustment | (84,149) | | | (100,663) | |
| Gain (loss) on derivative financial instruments | Gain (loss) on derivative financial instruments | 2,264 | | | (1,307) | |
| Pension and other postretirement benefit adjustments | Pension and other postretirement benefit adjustments | (96,519) | | | (95,681) | |
| Retained earnings | Retained earnings | 239,480 | | | 530,478 | |
| Total shareholders’ equity | Total shareholders’ equity | 109,055 | | | 376,749 | |
| Total liabilities and shareholders’ equity | Total liabilities and shareholders’ equity | $ | 514,870 | | | $ | 712,668 | |
See accompanying notes to financial statements.
CONSOLIDATED STATEMENTS OF INCOME (LOSS)
Tredegar Corporation and Subsidiaries
| | Years Ended December 31 |
| 2020 | | 2019 | | 2018 |
| (In thousands, except per-share data) | |
| Years Ended December 31 | | | Years Ended December 31 |
| 2023 | | | 2023 | | 2022 | | 2021 |
| (In thousands, except share data) | |
| Revenues and other: | |
| Revenues and other: | |
| Revenues and other: | |
| Revenues and other: | |
| Revenues and other: | |
| Revenues and other: | |
| Revenues and other: | |
| Revenues and other: | |
| Revenues and other: | |
| Revenues and other: | |
| Revenues and other: | |
| Revenues and other: | |
| Revenues and other: | |
| Revenues and other: | |
| Revenues and other: | Revenues and other: | |
| Sales | Sales | $ | 755,290 | | | $ | 826,324 | | | $ | 851,834 | |
| Sales | |
| Sales | |
| Other income (expense), net | Other income (expense), net | (67,294) | | | 28,371 | | | 30,455 | |
| 687,996 | | | 854,695 | | | 882,289 | |
| 702,678 | |
| Costs and expenses: | Costs and expenses: | |
| Cost of goods sold | |
| Cost of goods sold | |
| Cost of goods sold | Cost of goods sold | 558,967 | | | 641,140 | | | 679,665 | |
| Freight | Freight | 25,686 | | | 28,980 | | | 27,170 | |
| Selling, general and administrative | Selling, general and administrative | 84,246 | | | 76,598 | | | 67,929 | |
| Research and development | Research and development | 8,398 | | | 7,893 | | | 6,672 | |
| Amortization of identifiable intangibles | Amortization of identifiable intangibles | 3,017 | | | 13,601 | | | 3,976 | |
| Pension and postretirement benefits | Pension and postretirement benefits | 14,720 | | | 9,642 | | | 10,406 | |
| Interest expense | Interest expense | 2,587 | | | 4,051 | | | 5,702 | |
| Asset impairments and costs associated with exit and disposal activities, net of adjustments | Asset impairments and costs associated with exit and disposal activities, net of adjustments | 1,725 | | | 784 | | | 398 | |
| Pension settlement loss | |
| Goodwill impairment | Goodwill impairment | 13,696 | | | 0 | | | 0 | |
| Total | Total | 713,042 | | | 782,689 | | | 801,918 | |
| Income (loss) from continuing operations before income taxes | (25,046) | | | 72,006 | | | 80,371 | |
| Income (loss) before income taxes | |
| Income tax expense (benefit) | Income tax expense (benefit) | (8,213) | | | 13,545 | | | 18,807 | |
| Net income (loss) from continuing operations | (16,833) | | | 58,461 | | | 61,564 | |
| Income (loss) from discontinued operations, net of tax | (58,611) | | | (10,202) | | | (36,722) | |
| | Net income (loss) | |
| | Net income (loss) | |
| | Net income (loss) | Net income (loss) | $ | (75,444) | | | $ | 48,259 | | | $ | 24,842 | |
| | Earnings (loss) per share: | Earnings (loss) per share: | |
| Basic: | |
| Continuing operations | $ | (0.51) | | | $ | 1.76 | | | $ | 1.86 | |
| Discontinued operations | (1.75) | | | (0.31) | | | (1.11) | |
| Basic earnings (loss) per share | $ | (2.26) | | | $ | 1.45 | | | $ | 0.75 | |
| Diluted: | |
| Continuing operations | $ | (0.51) | | | $ | 1.76 | | | $ | 1.86 | |
| Discontinued operations | (1.75) | | | (0.31) | | | (1.11) | |
| Diluted earnings (loss) per share | $ | (2.26) | | | $ | 1.45 | | | $ | 0.75 | |
| Earnings (loss) per share: | |
| Earnings (loss) per share: | |
| Basic | |
| Basic | |
| Basic | |
| | Diluted | |
| | Diluted | |
| | Diluted | |
| | Shares used to compute earnings (loss) per share: | |
| | Shares used to compute earnings (loss) per share: | |
| | | Shares used to compute earnings (loss) per share: | Shares used to compute earnings (loss) per share: | |
| Basic | Basic | 33,402 | | 33,236 | | 33,068 |
| Basic | |
| Basic | | 34,133 | | 33,806 | | 33,563 |
| Diluted | Diluted | 33,402 | | 33,258 | | 33,092 | Diluted | 34,133 | | 33,826 | | 33,670 |
See accompanying notes to financial statements.
CONSOLIDATED STATEMENTS OF COMPREHENSIVE INCOME (LOSS)
Tredegar Corporation and Subsidiaries
| | Years Ended December 31 |
| 2020 | | 2019 | | 2018 |
| Years Ended December 31 | | | Years Ended December 31 |
| 2023 | | | 2023 | | 2022 | | 2021 |
| (In thousands) | (In thousands) | |
| Net income (loss) | Net income (loss) | $ | (75,444) | | | $ | 48,259 | | | $ | 24,842 | |
| Net income (loss) | |
| Net income (loss) | |
| Net income (loss) | |
| Net income (loss) | |
| Net income (loss) | |
| Net income (loss) | |
| Net income (loss) | |
| Net income (loss) | |
| Net income (loss) | |
| Net income (loss) | |
| Net income (loss) | |
| Net income (loss) | |
| Net income (loss) | |
| Net income (loss) | |
| Other comprehensive income (loss): | Other comprehensive income (loss): | |
| Unrealized foreign currency translation adjustment (net of tax benefit of $897 in 2020, net of tax benefit of $623 in 2019 and net of tax of $281 in 2018) | (8,781) | | | (3,723) | | | (10,762) | |
| Reclassification of foreign currency translation loss realized on the sale of Personal Care Films | 25,295 | | | 0 | | | 0 | |
| Derivative financial instruments adjustment (net of tax of $790 in 2020, net of tax of $71 in 2019 and net of tax benefit of $503 in 2018) | 3,571 | | | 294 | | | (2,060) | |
| Unrealized foreign currency translation adjustment (net of tax expense of $469 in 2023, net of tax expense of $290 in 2022 and net of tax benefit of $365 in 2021) | |
| Unrealized foreign currency translation adjustment (net of tax expense of $469 in 2023, net of tax expense of $290 in 2022 and net of tax benefit of $365 in 2021) | |
| Unrealized foreign currency translation adjustment (net of tax expense of $469 in 2023, net of tax expense of $290 in 2022 and net of tax benefit of $365 in 2021) | |
| Derivative financial instruments adjustment (net of tax expense of $933 in 2023, net of tax benefit of $336 in 2022 and net of tax benefit of $351 in 2021) | |
| Pension & other postretirement benefit adjustments: | Pension & other postretirement benefit adjustments: | |
| Net gains (losses) and prior service costs (net of tax benefit of $4,228 in 2020, net of tax benefit of $6,417 in 2019 and net of tax benefit of $319 in 2018) | (12,197) | | | (22,508) | | | (1,118) | |
| Amortization of prior service costs and net gains or losses (net of tax of $3,937 in 2020, net of tax of $2,359 in 2019 and net of tax of $3,028 in 2018) | 11,359 | | | 8,273 | | | 10,622 | |
| Recognition in earnings of actuarial loss for pension settlement (net of tax expense of $41,294) | |
| Recognition in earnings of actuarial loss for pension settlement (net of tax expense of $41,294) | |
| Recognition in earnings of actuarial loss for pension settlement (net of tax expense of $41,294) | |
| Net gains (losses) and prior service costs (net of tax expense of $422 in 2023, net of tax benefit of $1,400 in 2022 and net of tax expense of $5,212 in 2021) | |
| Amortization of prior service costs and net gains or losses (net of tax expense of $1,968 in 2023, net of tax expense of $2,965 in 2022 and net of tax expense of $3,676 in 2021) | |
| Other comprehensive income (loss) | Other comprehensive income (loss) | 19,247 | | | (17,664) | | | (3,318) | |
| Comprehensive income (loss) | Comprehensive income (loss) | $ | (56,197) | | | $ | 30,595 | | | $ | 21,524 | |
See accompanying notes to financial statements.
CONSOLIDATED STATEMENTS OF CASH FLOWS
Tredegar Corporation and Subsidiaries
| | Years Ended December 31 |
| 2020 | | 2019 | | 2018 |
| (In thousands) |
| Years Ended December 31 | | | Years Ended December 31 |
| 2023 | | | 2023 | | 2022 | | 2021 |
| (In thousands) | | (In thousands) | |
| Cash flows from operating activities: | Cash flows from operating activities: | |
| Net income (loss) | Net income (loss) | $ | (75,444) | | | $ | 48,259 | | | $ | 24,842 | |
| Net income (loss) | |
| Net income (loss) | |
| Adjustments for noncash items: | Adjustments for noncash items: | |
| Depreciation | |
| Depreciation | |
| Depreciation | Depreciation | 28,940 | | | 30,683 | | | 29,828 | |
| Amortization of identifiable intangibles | Amortization of identifiable intangibles | 3,017 | | | 13,601 | | | 3,976 | |
| Goodwill impairment | Goodwill impairment | 13,696 | | | 0 | | | 46,792 | |
| Reduction of right-of-use lease asset | Reduction of right-of-use lease asset | 2,753 | | | 2,588 | | | 0 | |
| Deferred income taxes | Deferred income taxes | (16,892) | | | 5,856 | | | 8,626 | |
| Accrued pension and postretirement benefits | Accrued pension and postretirement benefits | 14,720 | | | 9,642 | | | 10,406 | |
| (Gain) loss on investment in kaléo accounted for under the fair value method | 60,900 | | | (10,900) | | | (30,600) | |
| Loss on sale of divested businesses | 52,326 | | | 0 | | | 0 | |
| Net gain on disposal of assets | 0 | | | (6,334) | | | (46) | |
| Pension settlement loss | |
| Stock-based compensation expense | |
| Gain on investment in kaléo | |
| Impairment of Richmond, Virginia Technical Center assets | |
| Changes in assets and liabilities: | Changes in assets and liabilities: | |
| Accounts and other receivables | |
| Accounts and other receivables | |
| Accounts and other receivables | Accounts and other receivables | (335) | | | 16,471 | | | (11,883) | |
| Inventories | Inventories | (4,366) | | | 11,315 | | | (9,577) | |
| Income taxes recoverable/payable | Income taxes recoverable/payable | 1,617 | | | 2,644 | | | 25,018 | |
| Prepaid expenses and other | Prepaid expenses and other | (2,203) | | | 795 | | | (1,924) | |
| Accounts payable and accrued expenses | Accounts payable and accrued expenses | 4,045 | | | (2,937) | | | 5,571 | |
| Lease liability | Lease liability | (3,049) | | | (2,723) | | | 0 | |
| Pension and postretirement benefit plan contributions | Pension and postretirement benefit plan contributions | (12,681) | | | (8,614) | | | (8,907) | |
| Other, net | Other, net | 7,329 | | | 5,517 | | | 5,672 | |
| Net cash provided by operating activities | 74,373 | | | 115,863 | | | 97,794 | |
| Net cash provided by (used in) operating activities | |
| Cash flows from investing activities: | Cash flows from investing activities: | |
| Capital expenditures | Capital expenditures | (23,355) | | | (50,864) | | | (40,814) | |
| Return of escrowed funds relating to acquisition earn-out | 0 | | | 0 | | | 4,250 | |
| Net proceeds on sale of divested businesses | 56,236 | | | 0 | | | 0 | |
| Net proceeds from the sale of investment property | 0 | | | 0 | | | 1,384 | |
| Capital expenditures | |
| Capital expenditures | |
| Proceeds from the sale of kaléo | |
| | Proceeds from the sale of assets and other | |
| Proceeds from the sale of assets and other | |
| Proceeds from the sale of assets and other | Proceeds from the sale of assets and other | 0 | | | 10,936 | | | 1,098 | |
| Net cash provided by (used in) investing activities | Net cash provided by (used in) investing activities | 32,881 | | | (39,928) | | | (34,082) | |
| Cash flows from financing activities: | Cash flows from financing activities: | |
| Borrowings | Borrowings | 162,250 | | | 65,500 | | | 76,750 | |
| Borrowings | |
| Borrowings | |
| Debt principal payments | Debt principal payments | (70,250) | | | (125,000) | | | (127,250) | |
| Dividends paid | Dividends paid | (216,049) | | | (15,325) | | | (14,592) | |
| Debt financing costs | Debt financing costs | (693) | | | (1,817) | | | 0 | |
| Repurchase of employee common stock for tax withholdings | (850) | | | (854) | | | (328) | |
| Proceeds from exercise of stock options and other | 0 | | | 184 | | | 1,332 | |
| Other | |
| Net cash provided by (used in) financing activities: | Net cash provided by (used in) financing activities: | (125,592) | | | (77,312) | | | (64,088) | |
| Effect of exchange rate changes on cash | Effect of exchange rate changes on cash | (1,238) | | | (1,598) | | | (1,718) | |
| Increase (decrease) in cash and cash equivalents | (19,576) | | | (2,975) | | | (2,094) | |
| Cash and cash equivalents at beginning of period | 31,422 | | | 34,397 | | | 36,491 | |
| Cash and cash equivalents at end of period | $ | 11,846 | | | $ | 31,422 | | | $ | 34,397 | |
| Increase (decrease) in cash, cash equivalents and restricted cash | |
| Cash, cash equivalents and restricted cash at beginning of period | |
| Cash, cash equivalents and restricted cash at end of period | |
| Supplemental cash flow information: | Supplemental cash flow information: | |
| Interest payments | Interest payments | $ | 1,679 | | | $ | 4,358 | | | $ | 5,421 | |
| Income tax payments (refunds), net | $ | 1,670 | | | $ | 2,595 | | | $ | (24,020) | |
| Interest payments | |
| Interest payments | |
| Income tax payments, net | |
CONSOLIDATED STATEMENTS OF SHAREHOLDERS’ EQUITY
Tredegar Corporation and Subsidiaries
| | | | | | | | | | | Accumulated Other Comprehensive Income (Loss) | |
| | | Common Stock | | Retained
Earnings | | Trust for Savings Restoration Plan | | Foreign Currency Translation | | Gain (Loss) on Derivative Financial Instruments | | Pension & Other
Postretirement Benefit Adjust | | Total Shareholders’ Equity | | Common Stock | | Retained
Earnings | | Trust for Savings Restoration Plan | | Accumulated Other Comprehensive Income (Loss) | | Total Shareholders’ Equity |
| (In thousands, except share and per-share data) | (In thousands, except share and per-share data) | Shares | | Amount | |
| Balance at January 1, 2018 | 33,017,422 | | | $ | 34,747 | | | $ | 487,230 | | | $ | (1,528) | | | $ | (86,178) | | | $ | 459 | | | $ | (90,950) | | | $ | 343,780 | |
| Net income | — | | | — | | | 24,842 | | | — | | | — | | | — | | | — | | | 24,842 | |
| Balance at January 1, 2021 | |
| Balance at January 1, 2021 | |
| Balance at January 1, 2021 | |
| Net income (loss) | |
| Foreign currency translation adjustment | Foreign currency translation adjustment | — | | | — | | | — | | | — | | | (10,762) | | | — | | | — | | | (10,762) | |
| Derivative financial instruments adjustment | Derivative financial instruments adjustment | — | | | — | | | — | | | — | | | — | | | (2,060) | | | — | | | (2,060) | |
| Net gains or losses and prior service costs | — | | | — | | | — | | | — | | | — | | | — | | | (1,118) | | | (1,118) | |
| Net gains or (losses) and prior service costs | |
| Amortization of prior service costs and net gains or losses | Amortization of prior service costs and net gains or losses | — | | | — | | | — | | | — | | | — | | | — | | | 10,622 | | | 10,622 | |
| Cash dividends declared ($0.44 per share) | — | | | — | | | (14,592) | | | — | | | — | | | — | | | — | | | (14,592) | |
| Cash dividends declared ($0.48 per share) | |
| Stock-based compensation expense | Stock-based compensation expense | 102,762 | | | 3,141 | | | — | | | — | | | — | | | — | | | — | | | 3,141 | |
| Repurchase of employee common stock for tax withholdings | Repurchase of employee common stock for tax withholdings | (17,558) | | | (328) | | | — | | | — | | | — | | | — | | | — | | | (328) | |
| Issued upon exercise of stock options | Issued upon exercise of stock options | 73,398 | | | 1,332 | | | — | | | — | | | — | | | — | | | — | | | 1,332 | |
| Tredegar common stock purchased by trust for savings restoration plan | Tredegar common stock purchased by trust for savings restoration plan | — | | | — | | | 31 | | | (31) | | | — | | | — | | | — | | | 0 | |
| Balance at December 31, 2018 | 33,176,024 | | | 38,892 | | | 497,511 | | | (1,559) | | | (96,940) | | | (1,601) | | | (81,446) | | | 354,857 | |
| Net income | — | | | — | | | 48,259 | | | — | | | — | | | — | | | — | | | 48,259 | |
| Balance at December 31, 2021 | |
| Net income (loss) | |
| Foreign currency translation adjustment | Foreign currency translation adjustment | — | | | — | | | — | | | — | | | (3,723) | | | — | | | — | | | (3,723) | |
| Derivative financial instruments adjustment | Derivative financial instruments adjustment | — | | | — | | | — | | | — | | | — | | | 294 | | | — | | | 294 | |
| Net gains or losses and prior service costs | — | | | — | | | — | | | — | | | — | | | — | | | (22,508) | | | (22,508) | |
| Net gains or (losses) and prior service costs | |
| Amortization of prior service costs and net gains or losses | Amortization of prior service costs and net gains or losses | — | | | — | | | — | | | — | | | — | | | — | | | 8,273 | | | 8,273 | |
| Cash dividends declared ($0.46 per share) | — | | | — | | | (15,325) | | | — | | | — | | | — | | | — | | | (15,325) | |
| Cash dividends declared ($0.50 per share) | |
| Stock-based compensation expense | Stock-based compensation expense | 228,959 | | | 7,292 | | | — | | | — | | | — | | | — | | | — | | | 7,292 | |
| Repurchase of employee common stock for tax withholdings | Repurchase of employee common stock for tax withholdings | (49,444) | | | (854) | | | — | | | — | | | — | | | — | | | — | | | (854) | |
| Issued upon exercise of stock options | 9,500 | | | 184 | | | — | | | — | | | — | | | — | | | — | | | 184 | |
| | Tredegar common stock purchased by trust for savings restoration plan | Tredegar common stock purchased by trust for savings restoration plan | — | | | — | | | 33 | | | (33) | | | — | | | — | | | — | | | 0 | |
| Balance at December 31, 2019 | 33,365,039 | | | 45,514 | | | 530,478 | | | (1,592) | | | (100,663) | | | (1,307) | | | (95,681) | | | 376,749 | |
| Net loss | — | | | — | | | (75,444) | | | — | | | — | | | — | | | — | | | (75,444) | |
| Tredegar common stock purchased by trust for savings restoration plan | |
| Tredegar common stock purchased by trust for savings restoration plan | |
| Balance at December 31, 2022 | |
| Net income (loss) | |
| Foreign currency translation adjustment | Foreign currency translation adjustment | — | | | — | | | — | | | — | | | (8,781) | | | — | | | — | | | (8,781) | |
| Foreign currency translation loss realized on the sale of Personal Care Films | | 25,295 | | | 25,295 | |
| Derivative financial instruments adjustment | Derivative financial instruments adjustment | — | | | — | | | — | | | — | | | — | | | 3,571 | | | — | | | 3,571 | |
| Net gains or losses and prior service costs | — | | | — | | | — | | | — | | | — | | | — | | | (12,197) | | | (12,197) | |
| Net gains or (losses) and prior service costs | |
| Amortization of prior service costs and net gains or losses | Amortization of prior service costs and net gains or losses | — | | | — | | | — | | | — | | | — | | | — | | | 11,359 | | | 11,359 | |
| Cash dividends declared ($6.45 per share) | — | | | — | | | (216,049) | | | — | | | — | | | — | | | — | | | (216,049) | |
| Recognition in earnings of net actuarial loss for pension settlement | |
| Cash dividends declared ($0.26 per share) | |
| Stock-based compensation expense | Stock-based compensation expense | 131,354 | | | 5,402 | | | — | | | — | | | — | | | — | | | — | | | 5,402 | |
| | Repurchase of employee common stock for tax withholdings | |
| Repurchase of employee common stock for tax withholdings | |
| Repurchase of employee common stock for tax withholdings | Repurchase of employee common stock for tax withholdings | (39,217) | | | (850) | | | — | | | — | | | — | | | — | | | — | | | (850) | |
| Tredegar common stock purchased by trust for savings restoration plan | Tredegar common stock purchased by trust for savings restoration plan | — | | | — | | | 495 | | | (495) | | | — | | | — | | | — | | | 0 | |
| Balance at December 31, 2020 | 33,457,176 | | | $ | 50,066 | | | $ | 239,480 | | | $ | (2,087) | | | $ | (84,149) | | | $ | 2,264 | | | $ | (96,519) | | | $ | 109,055 | |
| Balance at December 31, 2023 | |
See accompanying notes to financial statements.
NOTES TO FINANCIAL STATEMENTS
Tredegar Corporation and Subsidiaries
11. NATURE OF OPERATIONS AND SUMMARY OF SIGNIFICANT ACCOUNTING POLICIES
Nature of Operations. Tredegar Corporation and subsidiaries (collectively “Tredegar,” “the Company,” “we,” “us” or “our”) is an industrial manufacturer with three primary businesses: custom aluminum extrusions for the North American building & construction, automotive and specialty end-use markets; surface protection films for high-technology applications in the global electronics industry;industry and polyethylene overwrap films used infor bathroom tissue and paper towels; and polyester-based films for use in packaging applications that have specialized properties primarily for the Latin American and the United States (“U.S.”) flexible packaging markets. The Company’s business segments are Aluminum Extrusions (also referred to as Bonnell Aluminum), PE Films, and Flexible Packaging Films (also referred to as Terphane). More information on the Company’s business segments is provided in Note 5.13.
On October 30, 2020,September 1, 2023, the Company completed the sale of its personal care films business (“Personal Care Films”), which was part of its PE Films segment. The transaction excluded the packaging film lines and related operations located at the Pottsville, Pennsylvania manufacturing site (“Pottsville Packaging”), which are now being reported within the Surface Protection component of PE Films. Commencing in the third quarter of 2020, all historical results for Personal Care Films have been presented as discontinued operations.
In December 2020, the Companyannounced that it had entered into a definitive agreement to sell Bright View Technologies (“Bright View”Terphane to Oben Group (the “Contingent Terphane Sale”),. Completion of the sale is contingent upon the satisfaction of customary closing conditions, including the receipt of certain competition filing approvals by authorities in Brazil and Colombia. On October 27, 2023, the Company filed the requisite competition forms with the transaction completed on December 31, 2020.Administrative Council for Economic Defense (“CADE”) in Brazil. The sale does not represent a strategic shift nor does it have a major effect onregulatory review process is ongoing and in line with the Company’s historical and ongoing operations, thus all financial informationexpectations. CADE’s maximum deadline for Bright View has been presented as continuing operations. Bright View historically has been reportedcompleting its review is no later than November 18, 2024. The merger review regarding the transaction was cleared by the Colombian authority in the PE Films segment.
For more information on these transactions, see Note 2 in the Notes to Financial Statementsearly February 2024.
Basis of Presentation and Principles of Consolidation. The consolidated financial statements include the accounts and operations of the Company and have been prepared in accordance with U.S. generally accepted accounting principles (“GAAP”). Intercompany balances and transactions have been eliminated in consolidation. Certain amounts for the prior years have been reclassified to conform to current year presentation.
Fiscal Year End. The Company operates on a calendar fiscal year except for the Aluminum Extrusions segment, which operates on a 52/53-week fiscal year basis. References to Aluminum Extrusions for 2020, 20192023, 2022 and 20182021 relate to the 53-week fiscal years ended December 31, 2023 and 52-week fiscal yearyears ended December 27, 2020, the 52-week fiscal year ended25, 2022 and December 29, 2019 and the 53-week fiscal year ended December 30, 2018,26, 2021, respectively. The Company does not believe the impact of reporting the results of this segment in this manner is material to the consolidated financial results. The Company may fund or receive cash from the Aluminum Extrusions segment based on Aluminum Extrusion’s cash flows from operations during the intervening period from Aluminum Extrusion’s fiscal year end to the Company’s calendar year end. As a result, the Company’s cashThere was no intercompany funding with Aluminum Extrusions between December 25, 2022 and cash equivalents declined by $3.8 million as of December 31, 2020 since the Company made payments to the Aluminum Extrusions segment to fund its working capital during the intervening period.2022.
Use of Estimates. The preparation of financial statements in conformity with GAAP requires management to make estimates and assumptions that affect the reported amounts of assets, liabilities, revenue, expenses and disclosure of contingent assets and liabilities (if any). On an ongoing basis, the Company evaluates its estimates, including those related to provisions for transaction and credit losses, income taxes, pension, and the valuation of goodwill and intangible assets, among others. Tredegar bases its estimates on historical experience and various other assumptions which the Company believes to be reasonable under the circumstances. Actual results could differ from those estimates.
Risk and Uncertainties. While it is not possible to estimate the impact that the coronavirus pandemic (“COVID-19”) may have on the Company’s business, estimates related to the accounting for impairment of long-lived assets and goodwill, an investment accounted for under the fair value method, pension benefits and income taxes could be materially adversely affected in future periods. Due to the uncertainty with respect to the magnitude of the impact and duration of COVID-19, future developments associated with COVID-19 may adversely affect the Company's financial condition, results of operations and cash flows. The Company continues to monitor the impact of COVID-19 on the business and its effect on the consolidated financial statements.
Foreign Currency Translation. The financial statements of subsidiaries located outside the U.S., where the local currency is the functional currency, are translated into U.S. Dollars using exchange rates in effect at the period end for assets and liabilities and average exchange rates during each reporting period for results of operations. Adjustments resulting from the translation of these financial statements are reflected as a separate component of shareholders’ equity. There are no operating subsidiaries located outside the U.S. where the U.S. Dollar is the functional currency. Transaction and remeasurement gains or losses included in income were gains of $0.6$0.2 million, losses of $0.6$0.4 million and gainslosses of $0.1$0.5 million in 2020, 20192023, 2022 and 2018,2021, respectively. These amounts do not include the effects between reporting periods that exchange rate changes have on income of the locations outside the U.S. that result from translation into U.S. Dollars.
Cash, Cash Equivalents and Cash Equivalents.Restricted cash. Cash, and cash equivalents and restricted cash consist of cash on hand in excess of daily operating requirements and highly liquid investments with original maturities of three months or less. At December 31, 20202023 and 2019,2022, Tredegar had cash,
and cash equivalents and restricted cash of $11.8$13.5 million and $31.4$19.2 million, respectively, including funds held in locations outside the U.S. of $9.4$9.8 million and $8.9$10.3 million, respectively.
The Company’s policy permits investment of excess cash in marketable securities that have the highest credit ratings and maturities of less than one year. The primary objectives of the policy are safety of principal and liquidity.
The following table provides a reconciliation of cash, cash equivalents and restricted cash to amounts shown in the consolidated statements of cash flows:
| | | | | | | | | | | |
| December 31, | | December 31, |
| (In thousands) | 2023 | | 2022 |
| Cash and cash equivalents | $ | 9,660 | | | $ | 19,232 | |
| Restricted cash | 3,795 | | | — | |
| Total cash, cash equivalents and restricted cash | $ | 13,455 | | | $ | 19,232 | |
Restricted cash as of December 31, 2023 consists of $3.4 million of receipts that have not yet been applied to the ABL Facility (defined below). See Note 7 for additional information.
Accounts and Other Receivables.Receivables, net. Accounts receivablereceivables are stated at the amount invoiced to customers less allowances for doubtful accounts and sales returns.accounts. Accounts receivablereceivables are non-interest bearing and arise from the sale of productproducts to customers under typical industry trade terms. Notes receivablereceivables are not significant.immaterial. Past due amounts are determined based on established terms and charged-off when deemed uncollectible. The allowance for doubtful accounts is determined based on an assessment of probable losses taking into account past due amounts, customer credit profile, historical experience and current economic conditions. For receivables that do not have a specific allowance, the loss rate is computed by segment to apply to the remaining receivables balance, using each segment’s historic loss rate. Other receivables include value-added taxes related to certain foreign subsidiaries and other miscellaneous receivables due within one year. For certain customers, the Company has arrangements in place with financial institutions whereby certain customer receivables are sold to the financial institution at a discount and without recourse. Upon sale, the associated receivable is unrecognized, and the discount is recognized as a reduction of sales.recognized. For more information on accounts receivable and other receivables, net, see Note 6.2.
Inventories. Inventories are stated at the lower of cost or market, with cost determined using the last in, first out (“LIFO”), method, the weighted average cost or the first in, first out (“FIFO”) method. Cost elements included in work-in-process and finished goods inventories are raw materials, direct labor and manufacturing overhead. Finished goods, work-in-process, raw materials and supplies, stores and other inventory are reviewed to determine if inventory quantities are in excess of forecasted usage or if they have become obsolete.
Property, Plant and Equipment. Accounts include costs of assets constructed or purchased, related delivery and installation costs and interest incurred on significant capital projects during their construction periods. Expenditures for renewals and betterments also are capitalized, but expenditures for repairs and maintenance are expensed as incurred. The cost and accumulated depreciation applicable to assets retired or sold are removed from the respective accounts, and gains or losses thereon are included in income. Capital expenditures for property, plant and equipment include capitalized interest. Capitalized interest included in capital expenditures for property, plant and equipment was $0.1 million, $0.3 million and $0.1 million in 2020, 2019 and 2018, respectively.immaterial. Depreciation is computed primarily by the straight-line method based on the estimated useful lives of the assets that generally range from 5 to 40 years for buildings and land improvements and 2 to 20 years for machinery and equipment.
Investments in Private Entities with Less Than or Equal to 50% Voting Ownership Interest. The Company accounts for its investments in private entities where its voting ownership is less than or equal to 50% based on the facts and circumstances surrounding the investment. For those investments measured at fair value, GAAP requires disclosure of the level within the fair value hierarchy in which fair value measurements in their entirety fall, segregating fair value measurements using quoted prices in active markets for identical assets or liabilities (Level 1), significant other observable inputs (Level 2), and significant unobservable inputs (Level 3). For more information on investments, see Note 4.
Goodwill and Identifiable Intangibles. The excess of the purchase price over the fair value of identifiable net assets of acquired companies is allocated to goodwill. The Company assesses goodwill for impairment when events or circumstances indicate that the carrying value may not be recoverable, or, at a minimum, on an annual basis (December 1st of each year). When assessing goodwill for impairment, accounting guidance allows the Company to first perform a qualitative assessment about the likelihood of the carrying value of a reporting unit exceeding its fair value, referred to as the "Step 0" assessment. The (“Step 0 assessment requires the evaluation ofanalysis”), which evaluates certain qualitative factors, including macroeconomic conditions, industry and market considerations, cost factors and overall financial performance, as well as company and reporting unit factors. If the Company's Step 0 analysis indicates that it is more likely than not that the fair value of a reporting unit is less than theits carrying amount, then the Company would perform a quantitative impairment test.test (“Step 1 analysis”).
During 2023, uncertainty about the first three monthstiming of 2020,a recovery in the consumer electronics market persisted, and manufacturers in the supply chain for consumer electronics continued to experience reduced capacity utilization and inventory corrections. In light of the limited visibility on the timing of a recovery and the expected adverse future impact to the Surface Protection business, coupled with a cautious outlook on new product development opportunities, the Company performed a Step 1 goodwill impairment testsanalysis, as of June 30, 2023 and recognizedSeptember 30, 2023, of the Surface Protection component of PE Films. The analyses concluded that the fair value of Surface Protection was less than its carrying value, thus a non-cash partial goodwill impairment charge of $13.7$34.9 million ($10.527.0 million after taxes)deferred income tax benefits) was recognized during 2023.
The Company estimated the fair value of Surface Protection by: (i) computing an estimated enterprise value (“EV”) utilizing the discounted cash flow method (the “DCF Method”), (ii) applying adjustments for any surplus or deficient working capital, (iii) adding cash and cash equivalents, and (iv) subtracting interest-bearing debt. The DCF Method was used, incorporating Surface Protection’s latest projections, which represented the entire amountreflect updated expected market recovery levels, feasibility of goodwill
launching new product applications, competitive pricing and cash flows associated with Aluminum Extrusions’ AACOA reporting unit. The operationsproduction efficiencies, as well as consideration of the AACOA reporting unit, which includes the Niles, Michigancost savings and Elkhart, Indiana facilities, were expected to be severely impacted by COVID-19, with over 80% of the aluminum extrusions manufactured at these facilities sold to customers that make consumer durable products, such as recreational boating and power sports vehicles, and to customers serving the building and construction and automotive markets.inventory corrections.
As of December 1, 2020,2023, the Company’s reporting units with goodwill were Surface Protection in PE Films and Futura in Aluminum Extrusions. Both of these reporting units have separately identifiable operating net assets (operating assets including goodwill and identifiable intangible assets net of operating liabilities). The Company estimates the fair value of its reporting units using discounted cash flow analyses and comparative enterprise value-to-EBITDA (earnings before interest, taxes, depreciation and amortization) multiples.
As of December 1, 2020, the Company applied the Step 0 goodwill assessment to Surface Protection and Futura, which both had fair values significantly in excess of their carrying amounts when last tested using the quantitative impairment test. The Company's Step 0 analyses in 2020analysis of these reporting units concluded that it is not more likely than not that the fair valuesvalue of each reporting unit was lessgreater than its carrying amount.value. Therefore, the Step 1 quantitative goodwill impairment tests for these reporting units were not necessary in 2020.necessary. The Surface Protection and Futura reporting units had goodwill in the amounts of $57.3$22.4 million and $10.4$13.3 million, respectively, at December 31, 2020.2023.
Indefinite-lived identifiable intangible assets are assessed for impairment when events or circumstances indicate that the carrying value may not be recoverable. The Company estimates the fair value of its trade names using a relief-from-royalty method that relies upon a corresponding discounted cash flow analysis.
Additional disclosure of Tredegar’sFor more information on goodwill and identifiable intangible assets and the impairments recorded in 2018 are included inintangibles, see Note 8.5.
Impairment of Long-Lived Assets. The Company reviews long-lived assets for possible impairment when events indicate that an impairment may exist. For assets that are held and used in operations, if events indicate that an asset may be impaired, the Company estimates the future unlevered pre-tax cash flows expected to result from the use of the asset and its eventual disposition. Assets are grouped for this purpose at the lowest level for which there are identifiable and independent cash flows. If the sum of these undiscounted pre-tax cash flows is less than the carrying amount of the asset group, an impairment loss is calculated. Measurement of the impairment loss is the amount by which the carrying amount exceeds the estimated fair value of the asset group.
Assets that are held for sale are reported at the lower of their carrying amount or estimated fair value less cost to sell, with an impairment loss recognized for any write-down required.
As of December 31, 2023 and 2022, no events, other than the Richmond Technical Center assets that went held for sale in the third quarter of 2023, were identified that indicated long-lived assets may be impaired.
Pension Costs and Postretirement Benefit Costs Other than Pensions. Pension costs and postretirement benefit costs other than pensions have been accrued over the period employees provided service to Tredegar. Liabilities and expenses for pension plans and other postretirement benefits are determined using actuarial methodologies and incorporate significant assumptions, including the rate used to discount the future estimated liability, the long-term rate of return on plan assets, and several assumptions relating to the employee workforce. The Company recognizes the funded status of its pension and other postretirement plans in the accompanying consolidated balance sheets. Tredegar’s policy ishas been to fund its pension plans at amounts not less than the minimum requirements of the Employee Retirement Income Security Act (“ERISA”) of 1974 and to fund postretirement benefits other than pensions when claims are incurred.
Additional disclosure regarding Tredegar’sIn February 2022, Tredegar announced the initiation of a process to terminate and settle its frozen defined benefit pension costsplan through lump sum distributions and postretirement benefit costs other than pensions is included inthe purchase of annuity contracts. On November 3, 2023, the pension plan termination and settlement process for the Company was completed. For more information, see Note 13.8.
Revenue Recognition. The Company’s revenue is primarily generated from the sale of finished products to customers. Those sales predominantly contain a single performance obligation and revenue is recognized at the point in time when control of the product is transferred to customers, along with the title, risk of loss and rewards of ownership. Depending on the arrangement with the customer, these criteria are met either at the time the product is shipped or when the product is made available or delivered atto the destination specified in the agreement with the customer.
Sales revenue is recognized in an amount that reflects the consideration the Company expects to be entitled to in exchange for that finished product. The Company offers various discounts, rebates and allowances to customers, (collectively, “allowances”), all of which are considered when determining the transaction price. Certain allowances are fixed and determinable at the time of sale and are recorded at the time of sale as a reduction to revenues. Other allowances can vary depending on future outcomes such as sales returns and customer sales volume, and representthus representing variable consideration.
Amounts billed to customers related to freight are classified as sales revenue and the cost of freight is classified as a separate line in the accompanying consolidated statements of income. Taxes assessed by a governmental authority that are both imposed on and concurrent with a specific revenue-producing transaction between Tredegar and its customers (such as value-added taxes) are accounted for on a net basis and therefore excluded from revenues. See Note 513 for disaggregation of revenue by segment and type. See Note 62 for a table showing accounts and other receivables, net of allowance for bad debts and sales returns.debts.
Revenue expected to be recognized in any future period related to remaining performance obligations, excluding i) revenue pertaining to contracts that have an original expected duration of one year or less, ii) contracts where revenue is recognized as invoiced and iii) variable consideration related to unsatisfied performance obligations, is not expected to materially impact the Company’s financial results.
Research &and Development (“R&D”) Costs. R&D costs are expensed as incurred and include primarily salaries, wages, employee benefits, equipment depreciation, facility costs and the cost of materials consumed relating to R&D efforts. R&D costs include a reasonable allocation of indirect costs.
In August 2023, the Company adopted a plan to close the PE Films technical center in Richmond, VA and reduce its efforts to develop and sell films supporting the semiconductor market. Future research and development activities for PE Films will be performed at the facility in Pottsville, PA. PE Films continues to have new business opportunities primarily relating to surface protection films that protect components of flat panel and flexible displays. The Company anticipates all activities to cease at the PE Films technical center in Richmond, VA, by the end of the first quarter of 2024. The Company recognized total expense incurred through December 31, 2023 associated with exit activities of $1.3 million for: (i) severance and related costs ($0.9 million) and (ii) building closure costs ($0.4 million). In addition, the Company recognized a non-cash asset impairment ($3.5 million), accelerated depreciation ($0.3 million) and a gain on the lease modification ($0.1 million).
A reconciliation of the beginning and ending balances of accrued expense associated with exit and disposal activities and charges associated with asset impairments reported as "Asset impairments and costs associated with exit and disposal activities, net of adjustments" in the consolidated statements of income for the year ended December 31, 2023 is shown below.
| | | | | | | | | | | | | | | | | | | | | | | |
| (In thousands) | Severance | | Asset impairment | | Other | | Total |
| Balance at January 1, 2023 | $ | — | | | $ | — | | | $ | — | | | $ | — | |
| Richmond Technical Center | 895 | | | 3,454 | | | 628 | | | 4,977 | |
| Charges | 895 | | | 3,454 | | | 628 | | | 4,977 | |
| Cash Spend | 510 | | | — | | | 312 | | | 822 | |
| Charges against assets | — | | | 3,454 | | | 188 | | | 3,642 | |
| Balance at December 31, 2023 | $ | 385 | | | $ | — | | | $ | 128 | | | $ | 513 | |
Leases. In February 2016, the Financial Accounting Standards Board (“FASB”) issued a revised standard on lease accounting, ASU 2016-2, Leases (Topic 842). The Company adopted the standard effective January 1, 2019. At inception, the Company determines if an arrangement contains a lease and whether that lease meets the classification criteria of a finance or operating lease. The Company has elected to not record short-term leases with an original lease term of one year or less in the consolidated balance sheet. To the extent such leases contain renewal options that the Company intends to exercise, the related Right-of-Use (“ROU”) asset and lease liability are included in the consolidated balance sheet. Some of the Company’s lease arrangements contain lease components (e.g., minimum rent payments) and non-lease components (e.g., maintenance, labor charges, etc.). The Company generally accounts for the lease and non-lease components as a single lease component.
Certain of the Company’s lease agreements include rental payments that are adjusted periodically for an index or rate. The leases are initially measured using the projected payments adjusted for the index or rate in effect at the commencement date. The Company’s lease agreements do not contain any material residual value guarantees or material restrictive covenants.
Operating leases are included in “Right-of-use lease assets”, “Lease liabilities - short-term” and “Lease liabilities - long-term” on the consolidated balance sheets. These assets and liabilities are recognized at the commencement date based on the present value of remaining lease payments over the lease term using the Company’s secured incremental borrowing rates, adjusted for term and geographic location using country-based swap rates. As a result of the Company’s review of new and existing lease contracts, there were no instances where the Company could readily determine a rate implicit in the lease.
Lease expense for operating leases is recognized on a straight-line basis over the lease term. Variable lease expense is recognized in the period in which the obligation for those payments is incurred. Depending upon the specific use of the ROU asset, lease expense is included in the “Cost of goods sold”, “Freight”, “Selling, general and administrative”, and “Research and development” line items on the consolidated statements of income. Lease income is not material to the results of operations for the years ended December 31, 20202023 and 2019,2022, respectively. Additional disclosure regarding Tredegar’s leases is included in Note 15.4.
Income Taxes. Income taxes are recognized during the period in which transactions enter into the determination of income for financial reporting purposes, with deferred income taxes being provided at enacted statutory tax rates on the differences between the financial reporting and tax bases of assets and liabilities (see Note 16)12). Tredegar’s policy is to accrue U.S. federal income taxes to the extent required under GAAP on unremitted earnings of all foreign subsidiaries where required. However, due to changes in the taxation of dividends under the Tax Cuts and Jobs Act (the “TCJA”) enacted by the U.S. government in December 2017, Tredegar only records U.S. federal income taxes on unremitted earnings of its foreign subsidiaries where Tredegar cannot take steps to eliminate any potential tax on future distributions from its foreign subsidiaries. Because of the accumulation of significant losses related to foreign currency translations at Terphane Limitada, there were no unrecorded deferred income tax liabilities associated with U.S. federal income taxes and foreign withholding taxes on Terphane Limitada’s undistributed earnings as of December 31, 20202023 and December 31, 2019.2022.
A valuation allowance is recorded in the period when the Company determines that it is more likely than not that all or a portion of deferred income tax assets may not be realized. The establishment and removal of a valuation allowance requires the Company to consider all positive and negative evidence and make a judgmental decision regarding the amount of valuation allowance required as of a reporting date. The benefit of an uncertain tax position is included in the accompanying financial statements when the Company determines that it is more likely than not that the position will be sustained, based on the
technical merits of the position, if the taxing authority examines the position and the dispute is litigated. This determination is made on the basis of all the facts, circumstances and information available as of the reporting date.
Earnings Per Share. Basic earnings per share is computed using the weighted average number of shares of common stock outstanding. Diluted earnings per share is computed using the weighted average common and potentially dilutive common equivalent shares outstanding, determined as follows:
| | 2020 | | 2019 | | 2018 |
| 2023 | | | 2023 | | 2022 | | 2021 |
| Weighted average shares outstanding used to compute basic earnings per share | Weighted average shares outstanding used to compute basic earnings per share | 33,402,147 | | | 33,236,115 | | | 33,067,800 | |
| Incremental shares attributable to stock options and restricted stock | Incremental shares attributable to stock options and restricted stock | 0 | | | 22,022 | | | 24,674 | |
| Shares used to compute diluted earnings per share | Shares used to compute diluted earnings per share | 33,402,147 | | | 33,258,137 | | | 33,092,474 | |
Incremental shares attributable to stock options and restricted stock are computed under the treasury stock method using the average market price during the related period. The Company had a net loss from continuing operations for the year ended December 31, 2020,2023, so there is no dilutive impact for such shares. If the Company had reported net income from continuing operations for the year ended December 31, 2020,2023, average out-of-the-money options to purchase shares that were excluded from the calculation of incremental shares attributable to stock options and restricted stock would have been 2,925,091. The average out-of-the-money options to purchase shares that were excluded from the calculation of incremental shares attributable to stock options and restricted stock were 1,212,375. For2,760,983 and 1,582,222 for the years ended December 31, 20192022 and 2018, average out-of-the-money options to purchase shares that were excluded from the calculation of incremental shares attributable to stock options and restricted stock were 209,592 and 726,475,2021, respectively.
Stock-Based Employee Compensation Plans. The cost of all share-based payments is recognized using the calculated fair value at the grant date, or the date of any later modification, over the requisite service period under the graded-vesting method. See Note 1211 for additional information.
Financial Instruments. Tredegar uses derivative financial instruments for the purpose of hedging aluminum price volatility and currency exchange rate exposures that exist as part of transactions associated with ongoing business operations. The Company’s derivative financial instruments are designated as and qualify as cash flow hedges and are recognized in the accompanying balance sheet at fair value. A change in the fair value of the derivative that is highly effective and that is designated and qualifies as a cash flow hedge is recorded in other comprehensive income. Gains and losses reported in other comprehensive income (loss) are reclassified to earnings in the periods in which earnings are affected by the variability of cash flows of the hedged transaction. Such gains and losses are reported onin the same line as the underlying hedged item, and the cash flows related to financial instruments are classified in the consolidated statements of cash flows in a manner consistent with those of the transactions being hedged. Any hedge ineffectiveness (which represents the amount by which the changes in the fair value of the derivative exceed the variability in the cash flows of the forecasted transaction) is recorded in current period earnings. The amount of gains and losses recognized for hedge ineffectiveness were not material in 2020, 2019 and 2018.
The Company’s policy requires that it formally document all relationships between hedging instruments and hedged items, as well as its risk management objective and strategy for undertaking various hedge transactions. The Company also uses regression analysis, unless the hedge qualifies for other methods of assessing effectiveness, to formally assessesassess (both at the hedge’s inception and on an ongoing basis) whether the derivatives that are used in hedging transactions have been highly effective in offsetting changes in the fair value or cash flows of hedged items and whether those derivatives may be expected to remain highly effective in future periods. When it is determined that a derivative is not (or has ceased to be) highly effective as a hedge, the Company discontinues hedge accounting prospectively.
As a policy, Tredegar does not engage in speculative or leveraged transactions, nor does it hold or issue financial instruments for trading purposes. Additional disclosure of the utilization of derivative hedging instruments is included in Note 9.10.
Comprehensive Income (Loss). Comprehensive income (loss) is defined as net income or loss as adjusted by other comprehensive income or loss items. Other comprehensive income (loss) includes changes in foreign currency translation adjustments,adjustments; unrealized gains and losses on derivative financial instruments,instruments; prior service costs and net gains or losses from pension and other postretirement benefit plans arising during the periodperiod; and amortization of these prior service costs and net gain or loss adjustments,adjustments; and during the period, realized net actuarial loss for pension settlement all recorded net of deferred income taxes.
The following table summarizes the after-tax changes in accumulated other comprehensive income (loss) for the year ended December 31, 2020:by component are summarized as follows:
| | | | | | | | | | | | | | | | | | | | | | | |
| (In thousands) | Foreign currency translation adjustment | | Gain (loss) on derivative financial instruments | | Pension and other post-retirement benefit adjustments | | Total |
| Beginning balance, January 1, 2020 | $ | (100,663) | | | $ | (1,307) | | | $ | (95,681) | | | $ | (197,651) | |
| Other comprehensive income (loss) before reclassifications | (8,781) | | | (3,285) | | | (12,197) | | | (24,263) | |
| Amounts reclassified from accumulated other comprehensive income (loss) | 25,295 | | | 6,856 | | | 11,359 | | | 43,510 | |
| Net other comprehensive income (loss) - current period | 16,514 | | | 3,571 | | | (838) | | | 19,247 | |
| Ending balance, December 31, 2020 | $ | (84,149) | | | $ | 2,264 | | | $ | (96,519) | | | $ | (178,404) | |
| | | | | | | | | | | | | | | | | | | | | | | |
| (In thousands) | Foreign Currency Translation | | Gain (Loss) on Derivative Financial Instruments | | Pension & Other Postretirement Benefit Adjust | | Total Accumulated Other Comprehensive Income (Loss) |
| Balance at January 1, 2021 | $ | (84,149) | | | $ | 2,264 | | | $ | (96,519) | | | $ | (178,404) | |
| Other comprehensive income (loss) | (2,008) | | | 3,800 | | | 23,932 | | | 25,724 | |
| Income tax (expense) benefit | 365 | | | (842) | | | (5,212) | | | (5,689) | |
| Other comprehensive income (loss), net of tax | (1,643) | | | 2,958 | | | 18,720 | | | 20,035 | |
| Reclassification adjustment to net income (loss) | — | | | (5,513) | | | 16,862 | | | 11,349 | |
| Income tax (expense) benefit | — | | | 1,192 | | | (3,676) | | | (2,484) | |
| Reclassification adjustment to net income (loss), net of tax | — | | | (4,321) | | | 13,186 | | | 8,865 | |
| Other comprehensive income (loss), net of tax | (1,643) | | | (1,363) | | | 31,906 | | | 28,900 | |
| Balance at December 31, 2021 | (85,792) | | | 901 | | | (64,613) | | | (149,504) | |
| Other comprehensive income (loss) | 3 | | | (1,256) | | | (6,464) | | | (7,717) | |
| Income tax (expense) benefit | (290) | | | (374) | | | 1,400 | | | 736 | |
| Other comprehensive income (loss), net of tax | (287) | | | (1,630) | | | (5,064) | | | (6,981) | |
| Reclassification adjustment to net income (loss) | — | | | (2,461) | | | 13,606 | | | 11,145 | |
| Income tax (expense) benefit | — | | | 710 | | | (2,965) | | | (2,255) | |
| Reclassification adjustment to net income (loss), net of tax | — | | | (1,751) | | | 10,641 | | | 8,890 | |
| Other comprehensive income (loss), net of tax | (287) | | | (3,381) | | | 5,577 | | | 1,909 | |
| Balance at December 31, 2022 | (86,079) | | | (2,480) | | | (59,036) | | | (147,595) | |
| Other comprehensive income (loss) | 3,511 | | | 11,794 | | | 1,935 | | | 17,240 | |
| Income tax (expense) benefit | (469) | | | (2,977) | | | (422) | | | (3,868) | |
| Other comprehensive income (loss), net of tax | 3,042 | | | 8,817 | | | 1,513 | | | 13,372 | |
| Reclassification adjustment to net income (loss) | — | | | (7,580) | | | 101,323 | | | 93,743 | |
| Income tax (expense) benefit | — | | | 2,044 | | | (43,261) | | | (41,217) | |
| Reclassification adjustment to net income (loss), net of tax | — | | | (5,536) | | | 58,062 | | | 52,526 | |
| Other comprehensive income (loss), net of tax | 3,042 | | | 3,281 | | | 59,575 | | | 65,898 | |
| Balance at December 31, 2023 | $ | (83,037) | | | $ | 801 | | | $ | 539 | | | $ | (81,697) | |
The following table summarizes the after-tax changes in accumulated other comprehensive income (loss) for the year ended December 31, 2019:
| | | | | | | | | | | | | | | | | | | | | | | |
| (In thousands) | Foreign currency translation adjustment | | Gain (loss) on derivative financial instruments | | Pension and other post-retirement benefit adjustments | | Total |
| Beginning balance, January 1, 2019 | $ | (96,940) | | | $ | (1,601) | | | $ | (81,446) | | | $ | (179,987) | |
| Other comprehensive income (loss) before reclassifications | (3,723) | | | (2,686) | | | (22,508) | | | (28,917) | |
| Amounts reclassified from accumulated other comprehensive income (loss) | 0 | | | 2,980 | | | 8,273 | | | 11,253 | |
| Net other comprehensive income (loss) - current period | (3,723) | | | 294 | | | (14,235) | | | (17,664) | |
| Ending balance, December 31, 2019 | $ | (100,663) | | | $ | (1,307) | | | $ | (95,681) | | | $ | (197,651) | |
Reclassifications of balancesamounts reclassified out of accumulated other comprehensive income (loss) intorelated to pension and other postretirement benefits are included in the computation of net income during 2020 are summarized as follows:
| | | | | | | | | | | |
(In thousands) | Amount reclassified from other comprehensive income (loss) | | Location of gain (loss) reclassified from accumulated other comprehensive income (loss) to net income (loss) |
Gain (loss) on derivative financial instruments: | | | |
Aluminum future contracts, before taxes | $ | (2,717) | | | Cost of goods sold |
Foreign currency forward contracts, before taxes | (6,069) | | | Selling, general and administrative |
Foreign currency forward contracts, before taxes | 62 | | | Cost of goods sold |
Total, before taxes | (8,724) | | | |
Income tax expense (benefit) | (1,868) | | | Income tax expense (benefit) |
Total, net of tax | $ | (6,856) | | | |
Amortization of pension and other post-retirement benefits: | | | |
Actuarial gain (loss) and prior service costs, before taxes | $ | (15,296) | | | (a) |
Income tax expense (benefit) | (3,937) | | | Income tax expense (benefit) |
Total, net of tax | $ | (11,359) | | | |
Reclassification adjustment of foreign currency translation loss included in income: | | | |
Realized loss on foreign currency translation adjustments related to the sale of Personal Care Films | $ | (25,295) | | | Income (loss) from discontinued operations, net of tax |
(a) This component of accumulated other comprehensive income is included in the computation of net periodic pension cost (see Note 13 for additional detail). |
Reclassifications of balances out of accumulated other comprehensive income (loss) into net income during 2019 are summarized as follows:Recently Issued Accounting Standards.
| | | | | | | | | | | |
(In thousands) | Amount reclassified from other comprehensive income (loss) | | Location of gain (loss) reclassified from accumulated other comprehensive income (loss) to net income |
Gain (loss) on derivative financial instruments: | | | |
Aluminum future contracts, before taxes | $ | (2,736) | | | Cost of goods sold |
Foreign currency forward contracts, before taxes | (904) | | | Selling, general and administrative |
Foreign currency forward contracts, before taxes | 62 | | | Cost of goods sold |
Total, before taxes | (3,578) | | | |
Income tax expense (benefit) | (598) | | | Income tax expense (benefit) |
Total, net of tax | $ | (2,980) | | | |
Amortization of pension and other post-retirement benefits: | | | |
Actuarial gain (loss) and prior service costs, before taxes | $ | (10,632) | | | (a) |
Income tax expense (benefit) | (2,359) | | | Income tax expense (benefit) |
Total, net of tax | $ | (8,273) | | | |
(a) This component of accumulated other comprehensive income is included in the computation of net periodic pension cost (see Note 13 for additional detail). |
New accounting pronouncements adopted in 2023:Reclassifications of balances out of accumulated other comprehensive income (loss) into net income during 2018 are summarized as follows: | | | | | | | | | | | |
(In thousands) | Amount reclassified from other comprehensive income (loss) | | Location of gain (loss) reclassified from accumulated other comprehensive income (loss) to net income |
Gain (loss) on derivative financial instruments: | | | |
Aluminum future contracts, before taxes | $ | 1,069 | | | Cost of goods sold |
Foreign currency forward contracts, before taxes | (1,796) | | | Selling, general and administrative |
Foreign currency forward contracts, before taxes | 62 | | | Cost of goods sold |
Total, before taxes | (665) | | | |
Income tax expense (benefit) | 253 | | | Income tax expense (benefit) |
Total, net of tax | $ | (918) | | | |
Amortization of pension and other post-retirement benefits: | | | |
Actuarial gain (loss) and prior service costs, before taxes | $ | (13,650) | | | (a) |
Income tax expense (benefit) | (3,028) | | | Income tax expense (benefit) |
Total, net of tax | $ | (10,622) | | | |
(a) This component of accumulated other comprehensive income is included in the computation of net periodic pension cost (see Note 13 for additional detail). |
In July 2023, the Financial Accounting Standard Board (“FASB”) issued Accounting Standards Adopted.
In June 2016,Updated ("ASU") 2023-03 to amend various Securities and Exchange Commission (“SEC”) paragraphs in the FASB issuedAccounting Standards Codification (“ASC”) to primarily reflect the issuance of SEC Staff Accounting Bulletin No. 120. ASU 2016-13, “Financial InstrumentsNo. 2023-03, “Presentation of Financial Statements (Topic 205), Income Statement—Reporting Comprehensive Income (Topic 220), Distinguishing Liabilities from Equity (Topic 480), Equity (Topic 505), and Compensation—Stock Compensation (Topic 718): Amendments to SEC Paragraphs Pursuant to SEC Staff Accounting Bulletin No. 120, SEC Staff Announcement at the March 24, 2022 Emerging Issues Task Force ("EITF") Meeting, and Staff Accounting Bulletin Topic 6.B, Accounting Series Release 280—General Revision of Regulation S-X: Income or Loss Applicable to Common Stock.” ASU 2023-03 amends the ASC for SEC updates pursuant to SEC Staff Accounting Bulletin No. 120; SEC Staff Announcement at the March 24, 2022 EITF Meeting; and Staff Accounting Bulletin Topic 6.B, Accounting Series Release 280 - Credit Losses (Topic 326).” The pronouncement replaces the incurred loss methodologyGeneral Revision of Regulation S-X: Income or Loss Applicable to record credit losses with a methodology that reflects the expected credit losses for financial assets not accounted for at fair value with gainsCommon Stock. These updates were immediately effective and losses recognized through net income. In the first quarter of 2020, the Company adopted ASU 2016-13 which resulted in an adjustment of less than $0.2 million and, therefore, did not have a material impact on the Company’sCompany's consolidated financial statements.
Accounting standards not yet adopted:
In August 2018,October 2023, the FASB issued ASU 2018-13, Fair Value Measurement: Changes2023-06 to amend various paragraphs in the ASC to primarily reflect the issuance of SEC Staff Bulletin No. 33-10532. ASU 2023-06 will impact various disclosure areas, including the statement of cash flows, accounting changes and error corrections, earnings per share, debt, equity, derivatives, and transfers of financial assets. The amendments in this ASU 2023-06 will be effective on the date the related disclosures are removed from Regulation S-X or Regulation S-K by the SEC and will no longer be effective if the SEC has not removed the applicable disclosure requirement by June 30, 2027. Early adoption is not permitted. The Company does not expect a material impact from the adoption of this standard on our consolidated financial statements and related disclosures.
In November 2023, the FASB issued ASU 2023-07 to improve reportable segment disclosure and requirements, primarily through the enhanced disclosures about significant segment expenses. ASU 2023-07 expands public entities’ segment disclosures by requiring disclosure of significant segment expenses that are regularly provided to the Disclosure Requirementschief operating decision maker and included within each reported measure of segment profit or loss, an amount and description of its composition for Fair Value Measurement (“ASU 2018-13”), which changes theother segment items, and interim disclosures of a reportable segment’s profit or loss and assets. All disclosure requirements of ASU 2023-07 are required for fair value measurementsentities with a single reportable segment. This ASU is effective for fiscal years beginning after December 15, 2023 and interim period beginning after December 15, 2024, with early adoption permitted. The amendments in this ASU are to be applied retrospectively to all prior periods presented in the financial statements. The Company is currently evaluating the impact of this standard on our consolidated financial statements and related disclosures.
In December 2023, the FASB issued ASU 2023-09 to improve the income tax disclosures related to the rate reconciliation and income taxes paid information and to improve the effectiveness of income tax disclosures. The amendments in this ASU will require the Company to disclose specified additional information in its income tax rate reconciliation and provide additional information for reconciling items that meet a quantitative threshold. ASU 2023-09 will also require the Company to disaggregate its income taxes paid disclosure by removing, addingfederal, state and modifying certain disclosures.foreign taxes, with further disaggregation required for significant individual jurisdictions. This ASU 2018-13 is effective for annual periods beginning after December 15, 2019, with2024, early adoption permitted. This ASU became effective on January 1, 2020 and the requirements of this ASU did not have a material impact on the Company's fair value disclosures.
Accounting Standards Not Yet Adopted.
In December 2019, the FASB issued ASU 2019-12, which simplifies the accounting for income taxes. The new guidance simplifies the accounting for income taxes by eliminating certain exceptions related to the approach for intraperiod tax allocation, the methodology for calculating income taxes in an interim period, hybrid taxes and the recognition of deferred tax liabilities for outside basis differences. It also clarifies and simplifies other aspects of the accounting for income taxes. The amendments are effective for fiscal years beginning after December 15, 2020 and interim periods therein, with early adoptionis permitted. The Company is currently evaluating the impact of this new guidance.standard on our consolidated financial statements and related disclosures.
2 DIVESTITURES AND ASSETS HELD FOR SALE
Divestitures
Personal Care Films
On August 24, 2020, the Company entered into a definitive agreement to sell Personal Care Films for an aggregate purchase price of approximately $60.5 million, subject to customary adjustments. Upon completion of the sale on October 30, 2020, the Company recognized a pre-tax loss of $50.0 million ($46.7 million after-tax) for the year ended December 31, 2020, which includes the realization of other comprehensive losses on foreign currency translation adjustments of $25.3 million previously reflected in shareholder’s equity. In addition, the Company agreed to provide certain transition services related to finance, human resources and information technology which are expected to end in the first half of 2021. Personal Care Films was previously reported in the PE Films segment.
The following table summarizes the financial results of discontinued operations reflected in the Consolidated Statements of Income for the year ended December 31, 2020, 2019 and 2018:
| | | | | | | | | | | | | | | | | |
| Years Ended December 31 |
| (In thousands) | 2020 | | 2019 | | 2018 |
| Revenues and other items: | | | | | |
| Sales | $ | 110,246 | | | $ | 146,034 | | | $ | 213,637 | |
| Other income (expense), net | (333) | | | 6,424 | | | 4 | |
| 109,913 | | | 152,458 | | | 213,641 | |
| Costs and expenses: | | | | | |
| Cost of goods sold | 92,079 | | | 126,371 | | | 170,091 | |
| Freight | 5,229 | | | 7,083 | | | 8,857 | |
| Selling, general and administrative | 16,824 | | | 17,754 | | | 17,354 | |
| Research and development | 8,863 | | | 11,743 | | | 12,035 | |
| Asset impairments and costs associated with exit and disposal activities, net of adjustments | 1,529 | | | 3,341 | | | 2,515 | |
| Goodwill impairment | 0 | | | 0 | | | 46,792 | |
| Loss on sale of business | 50,027 | | | 0 | | | 0 | |
| Total | 174,551 | | | 166,292 | | | 257,644 | |
| Income (loss) from discontinued operations before income taxes | (64,638) | | | (13,834) | | | (44,003) | |
| Income tax expense (benefit) | (6,027) | | | (3,632) | | | (7,281) | |
| Income (loss) from discontinued operations, net of tax | $ | (58,611) | | | $ | (10,202) | | | $ | (36,722) | |
The assets and liabilities of the discontinued operations reflected in the Consolidated Balance Sheets as of December 31, 2020 and 2019, respectively were as follows:
| | | | | | | | | | | |
| December 31 |
| (In thousands) | 2020 | | 2019 |
| Assets | | | |
| Accounts and other receivables, net | $ | 0 | | | $ | 18,441 | |
| Income tax recoverable | 0 | | | 1,439 | |
| Inventories | 0 | | | 17,175 | |
| Prepaid expenses and other (b) | 1,339 | | | 363 | |
| Total current assets | 1,339 | | | 37,418 | |
| Property, plant and equipment, net | 0 | | | 69,334 | |
| Right-of-use leased assets | 0 | | | 728 | |
| Deferred income taxes | 0 | | | 694 | |
| Other assets | 151 | | | 105 | |
| Total non-current assets | 151 | | | 70,861 | |
| Total assets of discontinued operations | $ | 1,490 | | | $ | 108,279 | |
| | | |
| Liabilities | | | |
| Accounts payable | $ | 0 | | | $ | 16,361 | |
| Accrued expenses (b) | 7,521 | | | 6,344 | |
| Lease liability, short-term | 0 | | | 575 | |
| Total current liabilities | 7,521 | | | 23,280 | |
| Lease liability, long-term | 0 | | | 351 | |
| Total non-current liabilities | 0 | | | 351 | |
| Total liabilities of discontinued operations (a) | $ | 7,521 | | | $ | 23,631 | |
| | | |
(a) Pension and other postretirement benefit liabilities related to Personal Care Films have been retained by the Company. (b) The consolidated balance sheet of discontinued operations as of December 31, 2020 includes $0.4 million of other receivables related to the settlement of customary post-closing adjustments, deferred assets of $0.9 million and deferred obligations of $5.3 million related to transition services, accrued severance of $2.1 million, and other miscellaneous accrued expenses of $0.2 million. |
The following table provides significant operating and investing cash flow information for discontinued operations:
| | | | | | | | | | | | | | | | | |
| Year Ended December 31, |
| (In thousands) | 2020 | | 2019 | | 2018 |
| Operating activities: | | | | | |
| Depreciation and amortization | $ | 5,511 | | | $ | 9,962 | | | $ | 9,312 | |
| Gain from the sale of the Shanghai manufacturing facility assets | 0 | | | (6,316) | | | 0 | |
| Loss on sale of Personal Care Films | 50,027 | | | 0 | | | 0 | |
| Total | 55,538 | | | 3,646 | | | 9,312 | |
| Investing activities: | | | | | |
| Net proceeds on sale of Personal Care Films | $ | 55,115 | | | $ | 0 | | | $ | 0 | |
| Proceeds from the sale of the Shanghai manufacturing facility assets | 0 | | | 10,936 | | | 0 | |
| Capital expenditures | (1,912) | | | (15,353) | | | (19,475) | |
| Total | $ | 53,203 | | | $ | (4,417) | | | $ | (19,475) | |
Bright View
In December 2020, the Company entered into a definitive agreement and completed the sale of Bright View for an aggregate purchase price of $1.5 million, subject to customary adjustments, which resulted in the recognition of a pre-tax loss of $2.3 million ($1.8 million after-tax) included in “Other income (expense), net” in the consolidated statements of income for the year ended December 31, 2020. In addition, the Company agreed to provide certain transition services related to information technology. The sale does not represent a strategic shift nor does it have a major effect on the Company’s
historical and ongoing operations, thus all financial information for Bright View has been presented as continuing operations. Bright View historically has been reported in the PE Films segment.
Assets Held For Sale
In July 2019, the Company committed to a plan to close its manufacturing facility in Lake Zurich, Illinois, which historically was reported by the Company within the personal care component of its PE Films segment. In March 2020, this facility was shut down and the production of elastic materials it previously produced was transferred to Terre Haute, Indiana.
In the third quarter of 2020, the held for sale criteria was met since the Company expected the sale of the facility to be completed within one year. As of December 31, 2020, the disposal group carrying value of $4.6 million consists of land, building, and building improvements and is reported in "Prepaid expenses and other" in the Consolidated Balance Sheet. These assets were not included as part of the sale of Personal Care Films.
3 OTHER INCOME (EXPENSE), NET
Other income (expense), net consists of the following:
| | | | | | | | | | | | | | | | | |
| (In thousands) | 2020 | | 2019 | | 2018 |
| (Loss) gain on investment in kaléo accounted for under fair value method | $ | (60,900) | | | $ | 28,482 | | | $ | 30,600 | |
| Loss on sale of Bright View Technologies | (2,299) | | | 0 | | | 0 | |
| Corporate costs associated with the divestiture of Personal Care Films | (851) | | | 0 | | | 0 | |
| COVID-19-related expenses (a) | (2,231) | | | 0 | | | 0 | |
| Other | (1,013) | | | (111) | | | (145) | |
| Total | $ | (67,294) | | | $ | 28,371 | | | $ | 30,455 | |
| (a) Costs associated with operating under COVID-19 conditions include employee overtime expenses associated with absenteeism, personal protective equipment supplies and facility maintenance. |
The gain on investment in kaléo accounted for under the fair value method of $28.5 million includes a cash dividend of $17.6 million received in 2019 from kaléo. See Note 4 for more details on the investment in kaléo.
4 INVESTMENTS
In August 2007 and December 2008, the Company made an aggregate investment of $7.5 million in kaleo, Inc. (“kaléo”), a privately held specialty pharmaceutical company dedicated to building innovative solutions for serious and life-threatening medical conditions. Tredegar owns Series A-3 Preferred Stock and Series B Preferred Stock in kaléo that, taken together, represents on a fully-diluted basis an approximate 20% interest in kaléo. Tredegar accounts for its investment in kaléo under the fair value option. At the time of the initial investment, the Company elected the fair value option of accounting since its investment objectives were similar to those of venture capitalists, which typically do not have controlling financial interests. kaléo’s stock is not publicly traded.
The estimated fair value of the Company’s investment was $34.6 million as of December 31, 2020 and $95.5 million as of December 31, 2019. The Company recognized a pre-tax loss on its investment in kaléo of $60.9 million ($47.6 million after taxes) in 2020, which was primarily due to: (i) current projections that assume ongoing pricing pressures, (ii) expected changes in market access as well as continued lower market demand for epinephrine delivery devices resulting from COVID-19-driven delays in in-person back-to-school schedules and social distancing guidelines, and (iii) a higher private company liquidity discount. The net appreciation on its investment of $28.5 million ($23.4 million after taxes) in 2019 included a pre-tax cash dividend of $17.6 million received on April 30, 2019. Future dividends are subject to the discretion of kaléo’s board of directors. Amounts recognized associated with the Company’s investment in kaléo are included in “Other income (expense), net” in the consolidated statements of income and separately stated in the EBITDA from ongoing operations table in Note 5.
The Company estimates the fair value of its investment in kaléo by: (i) computing the weighted average estimated enterprise value (“EV”) utilizing both the discounted cash flow method (the “DCF Method”) and the application of a market multiple to earnings before interest, taxes, depreciation and amortization (the “EBITDA Multiple Method”), (ii) applying adjustments for any surplus or deficient working capital and estimates of contingent liabilities, (iii) adding cash and cash equivalents, (iv) subtracting interest-bearing debt, (v) subtracting a private company liquidity discount estimated at 20% at December 31, 2020 (versus 10% at December 31, 2019) of the net result of (i) through (iv), and (vi) applying liquidation preferences and fully diluted ownership percentages to the estimated equity value computed in (i) through (v).
The Company’s estimate of kaléo’s EV as of December 31, 2020 was determined by weighting the EBITDA Multiple Method by 20% and the DCF Method by 80% compared to an 80% and 20% weighting of the EBITDA Multiple Method and DCF Method, respectively, used in the Company's estimate of kaléo’s EV as of December 31, 2019. A heavier weighting towards the DCF Method as of December 31, 2020 was used since kaléo’s projections better reflect ongoing pricing pressures and expected changes in market access. The DCF Method projections rely on numerous assumptions and Level 3 inputs. In
addition, there are various regulatory and legal enforcement efforts, including an ongoing Department of Justice investigation related to kaléo’s discontinued Evzio business, which could have a material adverse effect on kaléo’s business that require assessment in any valuation method applied.
The ultimate value of the Company’s ownership interest in kaléo will be determined and realized only if and when a liquidity event occurs, and the ultimate value could be materially different from the $34.6 million estimated fair value reflected in the Company’s financial statements at December 31, 2020.
5 BUSINESS SEGMENTS
The Company's business segments are Aluminum Extrusions, PE Films and Flexible Packaging Films. Aluminum Extrusions, also referred to as Bonnell Aluminum, produces high-quality, soft-alloy and medium-strength custom fabricated and finished aluminum extrusions for the building and construction, automotive and transportation, consumer durables, machinery and equipment, electrical and renewable energy, and distribution markets. PE Films is composed of surface protection films, polyethylene overwrap films and films for other markets. Flexible Packaging Films is comprised of the Company’s polyester films business, Terphane Holdings LLC (“Terphane”).
The Company’s reportable segments are based on its method of internal reporting, which is generally segregated by differences in products. Accounting standards for presentation of segments require an approach based on the way the Company organizes the segments for making operating decisions and how the chief operating decision maker (“CODM”) assesses performance.
Earnings before interest, taxes, depreciation and amortization from ongoing operations (“EBITDA from ongoing operations”) is the measure of profit and loss used by the CODM (Tredegar’s President and Chief Executive Officer) for purposes of assessing financial performance. In the fourth quarter of 2019, the Company concluded that “EBITDA from ongoing operations,” instead of “operating profit from ongoing operations,” is the most relevant metric for measuring segment financial performance. This change resulted in a revision of the Company’s segment disclosures for all periods to report EBITDA from ongoing operations as the measure of segment financial performance. The Company uses sales less freight (“net sales”) as its measure of revenues from external customers at the segment level. This measure is separately included in the financial information regularly provided to the CODM.
Information by business segment and geographic area for the last three years is provided in the segment tables below. There were no accounting transactions between segments and no allocations to segments.
| | | | | | | | | | | | | | | | | |
| Net Sales |
| (In thousands) | 2020 | | 2019 | | 2018 |
| Aluminum Extrusions | $ | 455,711 | | | $ | 529,602 | | | $ | 573,126 | |
| PE Films | 139,288 | | | 133,807 | | | 127,708 | |
| Flexible Packaging Films | 134,605 | | | 133,935 | | | 123,830 | |
| Total net sales | 729,604 | | | 797,344 | | | 824,664 | |
| Add back freight | 25,686 | | | 28,980 | | | 27,170 | |
| Sales as shown in consolidated statements of income | $ | 755,290 | | | $ | 826,324 | | | $ | 851,834 | |
Refer to Notes to Financial Tables that follow these tables.
| | | | | | | | | | | | | | | | | |
| EBITDA from Ongoing Operations |
| (In thousands) | 2020 | | 2019 | | 2018 |
| Aluminum Extrusions: | | | | | |
| Ongoing operations: | | | | | |
| EBITDA | $ | 55,137 | | | $ | 65,683 | | | $ | 65,479 | |
| Depreciation & amortization (d) | (17,403) | | | (16,719) | | | (16,866) | |
| EBIT | 37,734 | | | 48,964 | | | 48,613 | |
| Plant shutdowns, asset impairments, restructurings and other (a) | (3,506) | | | (561) | | | (505) | |
| Goodwill impairment charge | (13,696) | | | 0 | | | 0 | |
| Trade name accelerated amortization (d) | 0 | | | (10,040) | | | 0 | |
| PE Films: | | | | | |
| Ongoing operations: | | | | | |
| EBITDA | 45,107 | | | 41,133 | | | 32,404 | |
| Depreciation & amortization | (6,762) | | | (5,860) | | | (6,201) | |
| EBIT | 38,345 | | | 35,273 | | | 26,203 | |
| Plant shutdowns, asset impairments, restructurings and other (a) | (1,974) | | | (733) | | | (186) | |
| Flexible Packaging Films: | | | | | |
| Ongoing operations: | | | | | |
| EBITDA | 30,645 | | | 14,737 | | | 11,154 | |
| Depreciation & amortization | (1,761) | | | (1,517) | | | (1,262) | |
| EBIT | 28,884 | | | 13,220 | | | 9,892 | |
| Plant shutdowns, asset impairments, restructurings and other (a) | (18) | | | 0 | | | (45) | |
| Total | 85,769 | | | 86,123 | | | 83,972 | |
| Interest income | 44 | | | 66 | | | 146 | |
| Interest expense | 2,587 | | | 4,051 | | | 5,702 | |
| Gain (loss) on investment in kaléo accounted for under the fair value method (a) | (60,900) | | | 28,482 | | | 30,600 | |
| Loss on sale of Bright View (f) | (2,299) | | | 0 | | | 0 | |
| Loss on sale of investment property (a) | 0 | | | 0 | | | (38) | |
| Unrealized loss on investment property (a) | 0 | | | 0 | | | (186) | |
| Stock option-based compensation expense | 2,161 | | | 4,132 | | | 1,156 | |
| Corporate expenses, net (a) | 42,912 | | | 34,482 | | | 27,265 | |
| Income (loss) from continuing operations before income taxes | (25,046) | | | 72,006 | | | 80,371 | |
| Income tax expense (benefit) (a) | (8,213) | | | 13,545 | | | 18,807 | |
| Income (loss) from continuing operations | (16,833) | | | 58,461 | | | 61,564 | |
| Income (loss) from discontinued operations, net of tax (a) | (58,611) | | | (10,202) | | | (36,722) | |
| Net income (loss) | $ | (75,444) | | | $ | 48,259 | | | $ | 24,842 | |
Refer to Notes to Financial Tables that follow these tables.
| | | | | | | | | | | |
| Identifiable Assets |
| (In thousands) | 2020 | | 2019 |
| Aluminum Extrusions | $ | 244,560 | | | $ | 265,027 | |
| PE Films | 119,013 | | | 124,269 | |
| Flexible Packaging Films | 66,453 | | | 74,016 | |
| Subtotal | 430,026 | | | 463,312 | |
| General corporate | 71,508 | | | 109,655 | |
| Cash and cash equivalents (b) | 11,846 | | | 31,422 | |
| Discontinued operations | 1,490 | | | 108,279 | |
| Total | $ | 514,870 | | | $ | 712,668 | |
| | | | | | | | | | | | | | | | | | | | | | | | | | | | | | | | | | | |
| | Depreciation and Amortization | | Capital Expenditures |
| (In thousands) | 2020 | | 2019 | | 2018 | | 2020 | | 2019 | | 2018 |
| Aluminum Extrusions | $ | 17,403 | | | $ | 26,759 | | | $ | 16,866 | | | $ | 10,260 | | | $ | 17,855 | | | $ | 12,966 | |
| PE Films | 6,762 | | | 5,860 | | | 6,201 | | | 6,024 | | | 8,567 | | | 2,523 | |
| Flexible Packaging Films | 1,761 | | | 1,517 | | | 1,262 | | | 4,959 | | | 8,866 | | | 5,423 | |
| Subtotal | 25,926 | | | 34,136 | | | 24,329 | | | 21,243 | | | 35,288 | | | 20,912 | |
| General corporate (e) | 520 | | | 186 | | | 163 | | | 200 | | | 223 | | | 427 | |
| Discontinued operations | 5,511 | | | 9,962 | | | 9,312 | | | 1,912 | | | 15,353 | | | 19,475 | |
| Total | $ | 31,957 | | | $ | 44,284 | | | $ | 33,804 | | | $ | 23,355 | | | $ | 50,864 | | | $ | 40,814 | |
| | | | | | | | | | | | | | | | | |
| Net Sales by Geographic Area (c) |
| (In thousands) | 2020 | | 2019 | | 2018 |
| United States | $ | 530,243 | | | $ | 593,599 | | | $ | 636,968 | |
| Exports from the United States to: | | | | | |
| Asia | 80,217 | | | 82,342 | | | 74,499 | |
| Canada | 18,024 | | | 15,022 | | | 16,467 | |
| Europe | 5,440 | | | 5,752 | | | 3,909 | |
| Latin America | 2,169 | | | 4,135 | | | 991 | |
| Operations outside the United States: | | | | | |
| Brazil | 93,511 | | | 96,274 | | | 85,868 | |
| China | 0 | | | 220 | | | 5,962 | |
| Total | $ | 729,604 | | | $ | 797,344 | | | $ | 824,664 | |
| | | | | | | | | | | | | | | | | | | | | | | |
| | Identifiable Assets
by Geographic Area (c) | | Property, Plant & Equipment,
Net by Geographic Area (c) |
| (In thousands) | 2020 | | 2019 | | 2020 | | 2019 |
| United States | $ | 363,106 | | | $ | 403,366 | | | $ | 132,268 | | | $ | 140,609 | |
| Operations outside the United States: | | | | | | | |
| Brazil | 49,157 | | | 41,890 | | | 15,588 | | | 15,348 | |
| China | 17,763 | | | 18,056 | | | 16,245 | | | 16,210 | |
| General corporate | 71,508 | | | 109,655 | | | 2,444 | | | 1,389 | |
| Cash and cash equivalents (b) | 11,846 | | | 31,422 | | | n/a | | n/a |
| Discontinued operations | 1,490 | | | 108,279 | | | 0 | | | 69,334 | |
| Total | $ | 514,870 | | | $ | 712,668 | | | $ | 166,545 | | | $ | 242,890 | |
Refer to Notes to Financial Tables that follow these tables.
The Company’s facilities in Pottsville, PA (“PV”) and Guangzhou, China (“GZ”) have a tolling arrangement whereby certain surface protection films are manufactured in GZ for a fee with raw materials supplied from PV that are then shipped by GZ directly to customers principally in the Asian market but paid by customers directly to PV.Amounts associated with this
intercompany tolling arrangement are reported in the table above as export sales from the U.S. to Asia, and include net sales of $35.1 million in 2020, $32.1 million in 2019 and $28.9 million in 2018.
| | | | | | | | | | | | | | | | | |
| Net Sales by Product Group |
| (In thousands) | 2020 | | 2019 | | 2018 |
| Aluminum Extrusions: | | | | | |
| Nonresidential building & construction | $ | 253,126 | | | $ | 272,729 | | | $ | 289,572 | |
| Consumer durables | 44,167 | | | 57,607 | | | 66,416 | |
| Automotive | 35,895 | | | 46,461 | | | 48,037 | |
| Machinery & equipment | 30,649 | | | 38,657 | | | 41,899 | |
| Distribution | 28,339 | | | 34,753 | | | 40,924 | |
| Residential building & construction | 40,049 | | | 43,554 | | | 43,943 | |
| Electrical | 23,486 | | | 35,841 | | | 42,335 | |
| Subtotal | 455,711 | | | 529,602 | | | 573,126 | |
| PE Films: | | | | | |
| Surface protection films | 109,097 | | | 103,893 | | | 98,126 | |
| Packaging | 22,700 | | | 22,542 | | | 22,310 | |
| LED-based products | 7,491 | | | 7,372 | | | 7,272 | |
| Subtotal | 139,288 | | | 133,807 | | | 127,708 | |
| Flexible Packaging Films | 134,605 | | | 133,935 | | | 123,830 | |
| Total | $ | 729,604 | | | $ | 797,344 | | | $ | 824,664 | |
(a)See Notes 1, 2, 3, 4 and 17 for more information on losses associated with plant shutdowns, asset impairments and restructurings, unusual items, gains or losses from sale of assets, gains or losses on an investment accounted for under the fair value method and other items.
(b)Cash and cash equivalents includes funds held in locations outside the U.S. of $9.4 million and $8.9 million at December 31, 2020 and 2019, respectively.
(c)Information on exports and foreign operations are provided on the previous page. Export sales relate almost entirely to PE Films. Operations in China relate to PE Films. Operations in Brazil relate to Flexible Packaging Films.
(d)Depreciation and amortization for Aluminum Extrusions in 2019 excludes $10.0 million for accelerated amortization of trade names as a result of a rebranding initiative (see Note 8 for more information)
(e)Corporate depreciation and amortization are included in Corporate expenses, net, on the EBITDA from ongoing operations table above.
(f)In December 2020, the Company entered into a definitive agreement and completed the sale of Bright View. See Note 2 for more details.
62. ACCOUNTS AND OTHER RECEIVABLES
As of December 31, 20202023 and 2019,2022, accounts receivable and other receivables, net, were $86.3 million and $89.1 million, respectively, made up ofinclude the following:
| | (In thousands) | (In thousands) | 2020 | | 2019 | (In thousands) | 2023 | | 2022 |
| Customer receivables | Customer receivables | $ | 85,274 | | | $ | 88,822 | |
| Other accounts and notes receivable | 3,850 | | | 2,199 | |
| Other receivables | |
| Total accounts and other receivables | Total accounts and other receivables | 89,124 | | | 91,021 | |
| Less: Allowance for bad debts and sales returns | (2,797) | | | (1,904) | |
| Less: Allowance for bad debts | |
| Total accounts and other receivables, net | Total accounts and other receivables, net | $ | 86,327 | | | $ | 89,117 | |
A reconciliation of the beginning and ending balances of the allowance for doubtful accounts and sales returns for the three years ended December 31, 20202023 is as follows:
| | | | | | | | | | | | | | | | | |
| (In thousands) | 2020 | | 2019 | | 2018 |
| Balance, beginning of year | $ | 1,904 | | | $ | 2,054 | | | $ | 2,227 | |
| Charges to expense | 1,901 | | | 715 | | | 450 | |
| Recoveries | (90) | | | (38) | | | (85) | |
| Write-offs and settlements | (709) | | | (756) | | | (414) | |
| Foreign exchange and other | (209) | | | (71) | | | (124) | |
| Balance, end of year | $ | 2,797 | | | $ | 1,904 | | | $ | 2,054 | |
| | | | | | | | | | | | | | | | | |
| (In thousands) | 2023 | | 2022 | | 2021 |
| Balance, beginning of year | $ | 2,997 | | | $ | 1,736 | | | $ | 2,797 | |
| Charges to expense | 882 | | | 1,926 | | | 1,440 | |
| Recoveries | 102 | | | 2 | | | 35 | |
| Write-offs and settlements | (1,734) | | | (639) | | | (1,246) | |
| Foreign exchange and other | 54 | | | (28) | | | (1,290) | |
| Balance, end of year | $ | 2,301 | | | $ | 2,997 | | | $ | 1,736 | |
73. INVENTORIES
Inventories consist of the following:
| | (In thousands) | (In thousands) | 2020 | | 2019 | (In thousands) | 2023 | | 2022 |
| Finished goods | Finished goods | $ | 15,251 | | | $ | 18,217 | |
| Work-in-process | Work-in-process | 9,098 | | | 12,123 | |
| Raw materials | Raw materials | 25,913 | | | 20,121 | |
| Stores, supplies and other | Stores, supplies and other | 16,175 | | | 13,744 | |
| Total | Total | $ | 66,437 | | | $ | 64,205 | |
Inventories stated on the LIFO basis amounted to $14.4$7.2 million at December 31, 20202023 and $12.6$25.3 million at December 31, 2019,2022, which were below replacement costs by $12.1$13.2 million at December 31, 20202023 and $8.6$15.6 million at December 31, 2019.2022. Inventories stated on the weighted average cost basis was $33.6were $45.3 million and $32.9$62.9 million at December 31, 20202023 and 2019,2022, respectively, while inventories stated on the first in, first outFIFO method amounted to $18.4$29.6 million and $18.7$39.5 million at December 31, 20202023 and 2019,2022, respectively.
84. LEASES
Tredegar has various operating lease agreements with remaining terms up to 9 years, including leases of real estate, office equipment and vehicles. As of December 31, 2023 and 2022, the Company had no finance lease agreements. Some leases include options to purchase the leased asset, terminate the agreement or extend the term of the agreement for one or more years. These options are included in the lease term when it is reasonably certain that the option will be exercised.
The following table presents a maturity analysis of the Company’s operating leases as of December 31, 2023:
| | | | | | | | | |
| (In thousands) | | | |
| Future Lease Payments | |
| 2024 | | $ | 2,635 | | |
| 2025 | | 2,458 | | |
| 2026 | | 2,078 | | |
| 2027 | | 1,786 | | |
| 2028 | | 1,557 | | |
| Thereafter | | 4,600 | | |
| Total undiscounted operating lease payments | | 15,114 | | |
| Less: Imputed interest | | 2,065 | | |
| Present value of operating lease liabilities | | $ | 13,049 | | |
The following table summarizes lease costs, related cash flow and other information for the years ended December 31, 2023 and 2022. These costs are primarily related to long-term operating leases, but also include amounts for variable leases and short-term leases.
| | | | | | | | | | | |
| (In thousands) | 2023 | | 2022 |
| Operating lease expense | $ | 2,882 | | | $ | 2,718 | |
| | | |
| | | |
| | | |
| | | |
| Other Information: | | | |
| Weighted-average remaining lease term for operating leases | 7 years | | 8 years |
| Weighted-average discount rate for operating leases | 4.46 | % | | 4.27 | % |
5. GOODWILL AND IDENTIFIABLE INTANGIBLE ASSETS
The components of goodwill and identifiable intangibles at December 31, 2020 and 2019, and related amortization periods are as follows:
| | | | | | | | | | | | | | | | | |
| (In thousands) | 2020 | | 2019 | | Amortization Periods |
| Goodwill | $ | 67,708 | | | $ | 81,404 | | | Not amortized |
| Identifiable intangible assets, net: | | | | | |
| Customer relationships (cost basis of $29,450 in 2020 and $29,550 in 2019) | 17,551 | | | 20,198 | | | 10-12 years |
| Proprietary technology (cost basis of $3,726 in 2020 and $6,181 in 2019) | 194 | | | 895 | | | Not more than 15 years |
| Trade names (cost basis of $13,397 in 2020 and $13,645 in 2019) | 1,075 | | | 1,543 | | | 5 - 13 years |
| Total carrying value of identifiable intangibles | 18,820 | | | 22,636 | | | |
| Total carrying value of goodwill and identifiable intangible assets | $ | 86,528 | | | $ | 104,040 | | | |
In the third quarter of 2019, the Company implemented a rebranding initiative at Bonnell Aluminum whereby the use of the AACOA and Futura trade names was discontinued as of December 31, 2019. The associated trade names assets, with a remaining net book value of $10.2 million, were amortized over the last four months of 2019.
A reconciliation of goodwill at December 31, 20202023 and 20192022 is as follows:
| | | | | | | | | | | | | | | | | | | | |
| (In thousands) | | Aluminum Extrusions1 | | PE Films1 | | Total |
| Net carrying value of goodwill at December 31, 2018 | | $ | 24,066 | | | $ | 57,338 | | | $ | 81,404 | |
| Goodwill impairment charge | | 0 | | | 0 | | | 0 | |
| Net carrying value of goodwill at December 31, 2019 | | 24,066 | | | 57,338 | | | 81,404 | |
| Goodwill impairment charge | | (13,696) | | | 0 | | | (13,696) | |
| Net carrying value of goodwill at December 31, 2020 | | $ | 10,370 | | | $ | 57,338 | | | $ | 67,708 | |
1.The goodwill of Aluminum Extrusions and PE Films is carried by the Futura and Surface Protection reporting units, respectively. |
| | | | | | | | | | | | | | | | | | | | |
| (In thousands) | | Aluminum Extrusions(a) | | PE Films(a) | | Total |
| Net carrying value of goodwill at December 31, 2021 | | $ | 13,270 | | | $ | 57,338 | | | $ | 70,608 | |
| | | | | | |
| Net carrying value of goodwill at December 31, 2022 | | 13,270 | | | 57,338 | | | 70,608 | |
| Goodwill impairment | | — | | | (34,891) | | | (34,891) | |
| Net carrying value of goodwill at December 31, 2023 | | $ | 13,270 | | | $ | 22,447 | | | $ | 35,717 | |
| (a) The goodwill of Aluminum Extrusions and PE Films is carried by the Futura and Surface Protection reporting units, respectively. |
A reconciliation of identifiable intangibles at December 31, 20202023 and 20192022 is as follows:
| | | | | | | | | | | | | | | | | | | | | | | | | | | | | | |
| (In thousands) | Customer Relationships | | Proprietary Technology | | Trade Names | | Total | |
| Aluminum Extrusions: | | | | | | | | |
| Net carrying value at December 31, 2018 | $ | 22,124 | | | $ | 75 | | | $ | 10,555 | | | $ | 32,754 | | |
| | Amortization expense | (2,480) | | | (20) | | | (10,555) | | | (13,055) | | |
| Net carrying value at December 31, 2019 | 19,644 | | | 55 | | | 0 | | | 19,699 | | |
| | Amortization expense | (2,480) | | | (20) | | | 0 | | | (2,500) | | |
| Net carrying value at December 31, 2020 | $ | 17,164 | | | $ | 35 | | | $ | 0 | | | $ | 17,199 | | |
| | | | | | | | | | |
| PE Films: | | | | | | | | |
| Net carrying value at December 31, 2018 | $ | 0 | | | $ | 730 | | | $ | 0 | | | $ | 730 | | |
| | Amortization expense | 0 | | | (120) | | | 0 | | | (120) | | |
| Net carrying value at December 31, 2019 | 0 | | | 610 | | | 0 | | | 610 | | |
| | Amortization expense | 0 | | | (120) | | | 0 | | | (120) | | |
| | Bright View disposal | 0 | | | (490) | | | 0 | | | (490) | | |
| Net carrying value at December 31, 2020 | $ | 0 | | | $ | 0 | | | $ | 0 | | | $ | 0 | | |
| | | | | | | | | | |
| Flexible Packaging Films: | | | | | | | | |
| Net carrying value at December 31, 2018 | $ | 661 | | | $ | 288 | | | $ | 1,862 | | | $ | 2,811 | | |
| | Amortization expense | (91) | | | (55) | | | (280) | | | (426) | | |
| | Increase (decrease) due to foreign currency translation | (16) | | | (3) | | | (39) | | | (58) | | |
| | Impairment loss | 0 | | | 0 | | | 0 | | | 0 | | |
| Net carrying value at December 31, 2019 | 554 | | | 230 | | | 1,543 | | | 2,327 | | |
| | Amortization expense | (84) | | | (53) | | | (260) | | | (397) | | |
| | Increase (decrease) due to foreign currency translation | (83) | | | (18) | | | (208) | | | (309) | | |
| Net carrying value at December 31, 2020 | $ | 387 | | | $ | 159 | | | $ | 1,075 | | | $ | 1,621 | | |
| | | | | | | | | | |
| Total net carrying value of identifiable intangibles at December 31, 2020 | $ | 17,551 | | | $ | 194 | | | $ | 1,075 | | | $ | 18,820 | | |
| | | | | | | | | | | | | | | | | | | | | | | | |
| (In thousands) | Customer Relationships | | Proprietary Technology | | Trade Names | | Total | |
| Gross carrying value at December 31, 2022 | $ | 26,549 | | | $ | 3,726 | | | $ | 13,394 | | | $ | 43,669 | | |
| Accumulated amortization | (15,467) | | | (3,672) | | | (12,840) | | | (31,979) | | |
| Net carrying value at December 31, 2022 | $ | 11,082 | | | $ | 54 | | | $ | 554 | | | $ | 11,690 | | |
| | | | | | | | |
| Gross carrying value at December 31, 2023 | $ | 26,575 | | | $ | 3,732 | | | $ | 13,460 | | | $ | 43,767 | | |
| Accumulated amortization | (17,270) | | | (3,687) | | | (12,959) | | | (33,916) | | |
| Net carrying value at December 31, 2023 | $ | 9,305 | | | $ | 45 | | | $ | 501 | | | $ | 9,851 | | |
Amortization expense over the next five years is expected to be as follows:
| | | | | |
| Year | Amount
(In thousands) |
| 2021 | $ | 2,955 | |
| 2022 | 2,820 | |
| 2023 | 2,195 | |
| 2024 | 2,154 | |
| 2025 | 2,154 | |
6. ACCRUED EXPENSES
Accrued expenses consist of the following:
| | | | | | | | | | | |
| (In thousands) | 2023 | | 2022 |
| Payrolls, related taxes and medical and other benefits | 6,261 | | | 5,916 | |
| Vacation | 2,602 | | | 3,502 | |
| Workers’ compensation and disabilities | 2,178 | | | 2,051 | |
| Group annuity contract premium liability | 2,000 | | | — | |
| Customer rebates | 1,891 | | | 1,154 | |
| Environmental liabilities | 1,563 | | | 1,627 | |
| Accrued utilities | 1,321 | | | 2,099 | |
| Accrued interest | 1,236 | | | 407 | |
| Incentive compensation | 612 | | | 6,103 | |
| Derivative contract liability | 483 | | | 3,260 | |
| Accrued freight | 440 | | | 2,298 | |
| Other | 3,855 | | | 3,186 | |
| Total | $ | 24,442 | | | $ | 31,603 | |
7. DEBT AND CREDIT AGREEMENTS
ABL Facility
On August 3, 2023, the Company entered into Amendment No. 2 to the Second Amended and Restated Credit Agreement (collectively the “Prior Credit Agreement”), which amended the financial covenants and decreased aggregate borrowings from $375 million to $200 million.
On December 27, 2023, the Company entered into Amendment No. 3 (the “ABL Facility”) to the Prior Credit Agreement, which provides the Company with $180 million senior secured asset-based revolving credit facility that will expire on June 30, 2026. The ABL Facility is secured by substantially all assets of the Company and its domestic subsidiaries, including equity in certain material first-tier foreign subsidiaries. Availability for borrowings under the ABL Facility is governed by a borrowing base, determined by the application of specified advance rates against eligible assets, including a portion of trade accounts receivable, inventory, cash and cash equivalents, owned real properties, and owned machinery and equipment. Upon the earlier of March 31, 2025 or the date the Company receives the proceeds from the sale of Terphane (the “ABL Adjustment Date”), the $180 million ABL Facility will be reduced to $125 million. As of December 31, 2023, availability under the ABL Facility was $22.9 million, after reducing the availability by the aggregate outstanding borrowings of $126.3 million, standby letters of credit of $13.1 million, and the Minimum Liquidity (as defined in the ABL Facility) financial covenant. The Company incurred $2.6 million of debt issuance costs in conjunction with the ABL Facility, which are being amortized on a straight-line basis over the remaining term of the ABL Facility.
Outstanding borrowings accrue interest at the rates elected by the Company depending on the type of loan and denomination of such borrowing. With respect to revolving loans denominated in U.S. Dollars, the Company may elect interest rates at:
•Alternate Base Rate (“ABR”) plus 2.50% before the ABL Adjustment Date and the applicable ABR Spread (as defined in the ABL Facility) after the ABL Adjustment Date are determined in accordance with an excess availability-based pricing grid. ABR is defined, in part, as the greater of (a) the Prime Rate in effect on such day, (b) the Federal Reserve Bank of New York Rate in effect on such day plus ½ of 1% and (c) the Adjusted Term SOFR Rate (defined below) for a one-month period plus 1%; or
•The Adjusted Term SOFR Rate plus 3.50% before the ABL Adjustment Date and the applicable Term Benchmark Spread (as defined in the ABL Facility) are determined in accordance with an excess availability-based pricing grid after the ABL Adjustment Date. Adjusted Term SOFR Rate is defined as the Term SOFR Rate plus 0.10%, subject to an initial Floor (as defined in the ABL Facility) of 0%.
Interest rate indices for select non-U.S. dollar borrowings, including borrowings denominated in Euro, Pounds Sterling, Swiss Francs and Japanese Yen, remain consistent with the terms of the Prior Credit Agreement.
Based upon the quarterly average of daily availability under the ABL Facility, the interest rate pricing grid applicable after the ABL Adjustment Date will be as follows:
| | | | | | | | | | | |
| Pricing under the ABL Facility (Basis Points) |
| Quarter Average of Daily Availability | Term Benchmark
Spread | ABR
Spread | Commitment
Fee* |
| > 66% of $125 million aggregate commitment | 225.0 | | 125.0 | | 40.0 | |
| ≤ 66% but > 33% of $125 million aggregate commitment | 250.0 | | 150.0 | | 40.0 | |
| ≤ 33% of $125 million aggregate commitment | 275.0 | | 175.0 | | 40.0 | |
*The Commitment Fee before the ABL Adjustment Date and after the ABL Adjustment Date remain the same as reflected in this table. |
Under the terms of the ABL Facility, certain domestic bank accounts are subject to blocked account agreements, each of which contains a springing feature whereby the lenders may exercise control over those accounts during a cash dominion period (any such period, a “Cash Dominion Period”). A Cash Dominion Period was implemented on the date of the closing of the ABL Facility and will remain in effect at all times prior to the ABL Adjustment Date. After the ABL Adjustment Date, a Cash Dominion Period goes into effect if availability under the ABL Facility falls below 12.5% or an Event of Default (as defined in the ABL Facility) occurs. The Company would then be subject to the Cash Dominion Period until the Event of Default is waived or ABL Facility availability is above 12.5% of the $125 million aggregate commitment for 30 consecutive days. Receipts that have not yet been applied to the ABL Facility are classified as restricted cash in the Company’s consolidated balance sheets.
The financial covenants in the ABL Facility, which are reported to lenders on a monthly basis, include:
•Until the ABL Adjustment Date, the Company is required to maintain (i) minimum Credit EBITDA (as defined in the ABL Facility), as of the end of each fiscal month for the 12-month period then ended (presented below) and (ii) a Minimum Liquidity (as defined in the ABL Facility) of $10.0 million.
| | | | | |
| Minimum Credit EBITDA (In thousands) |
| December 2023 | $ | 21,070 | |
| January 2024 | 21,110 | |
| February 2024 | 18,750 | |
| March 2024 | 16,640 | |
| April 2024 | 19,780 | |
| May 2024 | 19,660 | |
| June 2024 | 19,450 | |
| July 2024 | 21,860 | |
| August 2024 | 22,830 | |
| September 2024 | 25,370 | |
| October 2024 | 26,070 | |
| November 2024 | 27,640 | |
| December 2024 | 29,640 | |
| January 2025 | 29,740 | |
| February 2025 | 29,850 | |
| March 2025 | $ | 29,980 | |
•Following the ABL Adjustment Date, the foregoing financial covenants will cease to exist and will be replaced with a minimum fixed charge coverage ratio of 1.00:1.00 that will be triggered in the event that availability is less than 10% of $125 million commitment amount and continuing thereafter until availability is greater than 10% of the $125 million commitment amount for 30 consecutive days.
In addition to the financial covenants, the ABL Facility contains restrictive covenants, including covenants that restrict the Company’s ability to pay dividends and repurchase shares of its common stock.
If at any time the availability under the ABL facility is less than 10% (but on and after the ABL Adjustment Date, 20%) of the maximum aggregate principal amount in effect at such time or an Event of Default occurs, the Company’s current monthly reporting requirements to lenders changes to a weekly cadence until the Event of Default is waived, cured or the availability under the ABL facility is above 10% (but on and after the ABL Adjustment Date, 20%) of the maximum aggregate principal amount for 30 consecutive days.
The ABL Facility has customary representations and warranties including, as a condition to each borrowing, that all such representations and warranties are true and correct in all material respects (including a representation that no Material
Adverse Effect (as defined in the ABL Facility) has occurred since December 31, 2022). In the event that the Company cannot certify that all conditions to the borrowing have been met, the lenders can restrict the Company’s future borrowings under the ABL Facility. Because a Cash Dominion Period is currently in effect and the Company is required to represent that no Material Adverse Effect has occurred as a condition to borrowing, the outstanding debt under the ABL Facility (all contractual payments due on June 30, 2026) is classified as a current liability in the consolidated balance sheets.
In accordance with the ABL Facility, the lenders have been provided with the Company’s financial statements, covenant compliance certificates and projections to facilitate their ongoing assessment of the Company. Accordingly, the Company believes the likelihood that lenders would exercise the subjective acceleration clause whereby prohibiting future borrowings is remote. As of December 31, 2023, the Company was in compliance with all debt covenants.
Terphane Brazil Loan
On October 26, 2023, Flexible Packaging Film's business unit in Brazil (“Terphane Ltda.”), the Company’s wholly owned subsidiary in Brazil, borrowed $20 million secured by certain of its assets (“Terphane Brazil Loan”). This U.S. Dollar borrowing matures on October 30, 2028, with interest payable quarterly at an annual floating interest rate of the Secured Overnight Financing Rate (“SOFR”) plus 5.99%. The SOFR rate was 5.36% as of December 31, 2023. Quarterly principal payments of $1.7 million begin starting in year 3 of the loan. There are no prepayment penalties. The Company expects that the Terphane Brazil Loan will be repaid (and collateral released) upon the closing of the Contingent Terphane Sale. On October 26, 2023, the Company borrowed $20 million from Terphane Brazil (the “Intercompany Loan”) at the same interest rate as the Terphane Brazil Loan, thereby transferring the funds to the U.S. The Company will repay the Intercompany Loan in conjunction with the closing of the Contingent Terphane Sale.
8. RETIREMENT PLANS AND OTHER POSTRETIREMENT BENEFITS
Tredegar sponsored a noncontributory defined benefit (pension) plan covering certain current and former U.S. employees. The plan for salaried and hourly employees was based on a formula using the participant’s years of service and compensation or using the participant’s years of service and a dollar amount. The plan is closed to new participants and pay for active plan participants for benefit calculations was frozen as of December 31, 2007. As of January 31, 2018, the plan no longer accrued benefits associated with crediting employees for service, thereby freezing all future benefits under the plan. On February 10, 2022, Tredegar announced the initiation of a process to terminate and settle its frozen defined benefit pension plan through lump sum distributions and the purchase of annuity contracts. In connection therewith, on February 9, FINANCIAL INSTRUMENTS2022, the Company contributed $50 million to the pension plan.
During the third quarter of 2023, the Company remeasured the pension plan, which resulted in a pre-tax pension settlement loss in the consolidated results of operation of $25.6 million. The remeasurement of the pension benefit obligation and plan assets was triggered by $64.5 million of lump sum distributions from the pension plan assets which exceeded the pension plan's service and interest cost.
On September 27, 2023, the Company borrowed $30 million under the Prior Credit Agreement in anticipation of the final funding expected for terminating its defined benefit pension plan obligation. OnOctober 31, 2023, the Company used this cash to contribute $27.7 million to fully fund the pension plan with the amount necessary to purchase from Massachusetts Mutual Life Insurance Company a nonparticipating single premium group annuity contract for $157.5 million. On November 3, 2023, the pension plan termination and settlement process was completed, and the Company’s relevant pension plan obligation was transferred to Massachusetts Mutual Life Insurance Company. This completed the pension plan termination process that began in February 2022. As a result of the routine administrative process to transition the pension plan, the Company recognized a $2.0 million charge to adjust the initial purchase price of the nonparticipating single premium group annuity contract. During the fourth quarter of 2023, the Company recognized a pre-tax pension settlement loss of $66.7 million.
Tredegar also has a non-qualified supplemental pension plan covering certain employees. Effective December 31, 2005, further participation in this plan was terminated and benefit accruals for existing participants were frozen. The plan was designed to restore all or a part of the pension benefits that would have been payable to designated participants from the principal pension plans if it were not for limitations imposed by income tax regulations. The projected benefit obligation relating to this unfunded plan was $1.6 million and $1.7 million at December 31, 2023 and December 31, 2022, respectively. Pension expense recognized for this plan was $0.1 million in 2023, 2022 and 2021. This information has been included in the pension benefit tables below.
In addition to providing pension benefits, the Company provides postretirement life insurance and health care benefits for certain groups of employees. Tredegar and retirees share in the cost of postretirement health care benefits, with employees hired on or before January 1, 1993, receiving a fixed subsidy to cover a portion of their health care premiums. The Company eliminated prescription drug coverage for Medicare-eligible retirees as of January 1, 2006. Consequently, Tredegar is not eligible for any federal subsidies.
The following tables reconcile the changes in benefit obligations and plan assets in 2023 and 2022, and reconcile the funded status to prepaid or accrued cost at December 31, 2023 and 2022:
| | | | | | | | | | | | | | | | | | | | | | | | | | |
| | Pension Benefits | | | Other Post-
Retirement Benefits |
| (In thousands) | 2023 | | 2022 | | | 2023 | | 2022 |
| Change in benefit obligation: | | | | | | | | |
| Benefit obligation, beginning of year | $ | 248,114 | | | $ | 316,169 | | | | $ | 5,726 | | | $ | 7,370 | |
| Service cost | — | | | — | | | | 10 | | | 18 | |
| Interest cost | 9,623 | | | 8,945 | | | | 288 | | | 207 | |
| Effect of actuarial (gains) losses related to the following: | | | | | | | | |
| Discount rate change | (10,751) | | | (61,519) | | | | 99 | | | (1,483) | |
| | | | | | | | |
| Other | (6,459) | | | 1,513 | | | | 12 | | | 90 | |
| Plan participant contributions | — | | | — | | | | 490 | | | 554 | |
| Benefits paid | (16,957) | | | (16,994) | | | | (913) | | | (1,030) | |
| Settlement payments and annuity purchase | (221,970) | | | — | | | | — | | | — | |
| Benefit obligation, end of year | $ | 1,600 | | | $ | 248,114 | | | | $ | 5,712 | | | $ | 5,726 | |
| Change in plan assets: | | | | | | | | |
| Plan assets at fair value, beginning of year | $ | 218,119 | | | $ | 244,612 | | | | $ | — | | | $ | — | |
| Actual return on plan assets | (7,053) | | | (59,683) | | | | — | | | — | |
| Employer contributions | 27,861 | | | 50,184 | | | | 423 | | | 476 | |
| Plan participant contributions | — | | | — | | | | 490 | | | 554 | |
| Benefits paid | (16,957) | | | (16,994) | | | | (913) | | | (1,030) | |
| Settlement payments and annuity purchase | (221,970) | | | — | | | | — | | | — | |
| Plan assets at fair value, end of year | $ | — | | | $ | 218,119 | | | | $ | — | | | $ | — | |
| Funded status of the plans | $ | (1,600) | | | $ | (29,995) | | | | $ | (5,712) | | | $ | (5,726) | |
| Amounts recognized in the consolidated balance sheets: | | | | | | | | |
| Accrued expenses (current) | $ | 180 | | | $ | 180 | | | | $ | 489 | | | $ | 489 | |
| Pension and other postretirement benefit obligations, net | 1,420 | | | 29,815 | | | | 5,223 | | | 5,237 | |
| Net amount recognized | $ | 1,600 | | | $ | 29,995 | | | | $ | 5,712 | | | $ | 5,726 | |
The following table sets forth the assumptions used in accounting for the pension and other post-retirement benefits, and the components of net periodic benefit cost:
| | | | | | | | | | | | | | | | | | | | | | | | | | | | | | | | | | | | | | |
| | Pension Benefits | | | Other Post-
Retirement Benefits |
| (In thousands, except percentages) | 2023 | | 2022 | | 2021 | | | 2023 | | 2022 | | 2021 |
| Weighted-average assumptions used to determine benefit obligations: | | | | | | | | | | | | |
| Discount rate | 4.89 | % | | 5.07 | % | | 2.90 | % | | | 4.98 | % | | 5.17 | % | | 2.86 | % |
| Expected long-term return on plan assets | n/a | | 4.99 | % | | 3.05 | % | | | n/a | | n/a | | n/a |
| Weighted-average assumptions used to determine net periodic benefit cost: | | | | | | | | | | | | |
Discount rate(a) | 5.07%/5.37% | | 2.90 | % | | 2.57 | % | | | 5.17 | % | | 2.86 | % | | 2.54 | % |
| Expected long-term return on plan assets | n/a | | 3.05 | % | | 5.00 | % | | | n/a | | n/a | | n/a |
| Components of net periodic benefit cost: | | | | | | | | | | | | |
| Service cost | $ | — | | | $ | — | | | $ | — | | | | $ | 10 | | | $ | 18 | | | $ | 21 | |
| Interest cost | 9,623 | | | 8,945 | | | 8,398 | | | | 288 | | | 207 | | | 195 | |
| Expected return on plan assets | (8,109) | | | (8,174) | | | (11,316) | | | | — | | | — | | | — | |
| Amortization of prior service costs and gains or losses | 9,245 | | | 13,746 | | | 17,003 | | | | (213) | | | (140) | | | (141) | |
| Net periodic benefit cost | $ | 10,759 | | | $ | 14,517 | | | $ | 14,085 | | | | $ | 85 | | | $ | 85 | | | $ | 75 | |
| Pension settlement loss | 92,291 | | | — | | | — | | | | — | | | — | | | — | |
| Total benefit cost | $ | 103,050 | | | $ | 14,517 | | | $ | 14,085 | | | | $ | 85 | | | $ | 85 | | | $ | 75 | |
| (a) Prior to the pension lump sum distributions in August 2023, a discount rate of 5.07% was used to determine the net periodic benefit cost. Subsequent to August 2023, a discount rate of 5.37% was used to determine the net periodic benefit cost until the Company purchased a nonparticipating single premium group annuity contract in October 2023. |
Net periodic benefit cost is determined using assumptions at the beginning of each year. Funded status is determined using assumptions at the end of each year. The amount of the accumulated benefit obligation is the same as the projected benefit obligation. At December 31, 2023, the effect of a 1% change in the health care cost trend rate assumptions would not impact the post-retirement obligation.
Expected benefit payments over the next five years and in the aggregate for 2028—2032 are as follows:
| | | | | | | | | | | |
| (In thousands) | Pension Benefits | | Other Post-
Retirement
Benefits |
| 2024 | $ | 180 | | | $ | 481 | |
| 2025 | 172 | | | 470 | |
| 2026 | 165 | | | 456 | |
| 2027 | 157 | | | 445 | |
| 2028 | 148 | | | 433 | |
| 2028—2032 | 620 | | | 1,998 | |
The pre-tax amounts recorded in 2023, 2022 and 2021 in accumulated other comprehensive income (loss) consist of:
| | | | | | | | | | | | | | | | | | | | | | | | | | | | | | | | | | | |
| | Pension Benefits | | Other Post-Retirement Benefits |
| (In thousands) | 2023 | | 2022 | | 2021 | | 2023 | | 2022 | | 2021 |
| Net actuarial (gain) loss | $ | 415 | | | $ | 103,998 | | | $ | 109,893 | | | $ | (1,250) | | | $ | (1,574) | | | $ | (320) | |
The amounts in accumulated other comprehensive income, before related deferred income taxes, which are expected to be recognized as components of net periodic cost during 2024 are approximately $0.1 million of benefit for other post-retirement plans.
There were no plan assets as of December 31, 2023. The percentage composition of assets held by the pension plan at December 31, 2022 was as follows:
| | | | | |
| % Composition of Plan Assets
at December 31, |
| 2022 |
| Pension plan: | |
| Fixed income mutual fund | 13.9 | % |
| Private equity and hedge funds | 4.8 | |
| Collective investment trust | 69.9 | |
| Cash and cash equivalents | 11.4 | |
| Total | 100.0 | % |
Following the announcement to terminate and settle the pension plan in 2022, the Company contributed $50 million to the pension plan and implemented (through consultation with its investment advisors) a liability-matching bond portfolio investment strategy (including a derivative overlay) that hedged the estimated settlement funding gap, which was approximately $24 million (before plan administration costs) at that time. The overall objective of this hedging program was to minimize the volatility of the estimated settlement funding gap such that, as applicable interest rates moved up or down causing a decrease or increase in the estimated value of the settlement liability, the value of the matching bond portfolio and derivative overlay decreased or increased by a similar amount. Accordingly, the expected long-term rate return of 3.05% used in 2022 and 4.99% used in 2023 contemplated the liability-driven investment strategy.
A lower expected return on plan assets increased the amount of expense and vice versa. Decreases in the level of actual plan assets would also serve to increase the amount of pension expense. The total return on plan assets (net of fees and plan expenses), which was primarily affected by the change in fair value of plan assets, current year contributions and current year payments to participants, was approximately negative 15.1% in 2022 and positive 10.4% in 2021.
Estimates of the fair value of assets held by the Company’s pension plan were provided by unaffiliated third parties. Investments in collective investment trusts, private equity, hedge funds and certain international equity securities were measured at net asset value, which was a practical expedient for measuring fair value. These assets were therefore excluded from the fair value hierarchy for each of the year presented. At December 31, 2022, the pension plan assets are categorized by level within the fair value measurement hierarchy as follows: | | | | | | | | | | | | | | | | | | | | | | | |
| (In thousands) | Total | | Quoted Prices
in Active
Markets for
Identical Assets
(Level 1) | | Significant
Other
Observable
Inputs
(Level 2) | | Significant
Unobservable
Inputs
(Level 3) |
| Balances at December 31, 2022 | | | | | | | |
Cash and cash equivalents(a) | $ | 24,796 | | | $ | 24,796 | | | $ | — | | | $ | — | |
| Fixed income mutual fund | 30,284 | | | 30,284 | | | — | | | — | |
Private equity and hedge funds(b) | 10,250 | | | — | | | — | | | 10,250 | |
| Total plan assets at fair value | $ | 65,330 | | | $ | 55,080 | | | $ | — | | | $ | 10,250 | |
| Investments measured at net asset value: | | | | | | | |
Collective investment trust(c) | 152,389 | | | | | | | |
| Private equity and hedge funds | 141 | | | | | | | |
| Total investments measured at net asset value | $ | 152,530 | | | | | | | |
| Securities sold and interest receivable | 259 | | | | | | | |
| Total plan assets, December 31, 2022 | $ | 218,119 | | | | | | | |
(a) This category represents investments in cash and cash equivalents, which includes: 1.) cash held in the plan used for investments in U.S. Treasury futures which were entered into to minimize the volatility of the estimated settlement funding gap; and 2.) short term money market fund in which the amortized cost approximates fair value. These investments were highly liquid and therefore were classified as Level 1 securities. (b) Represents the estimated fair market value of the Company’s ownership in private equity and hedge funds which were probable of being sold for an amount different from the net asset value per share in connection with the expected termination of the pension plan. (c) The collective investment trust contains liability hedging fixed income investments and were valued at the net asset value of the collective investment trust. The net asset value was used as a practical expedient to estimate fair value. The net asset value was based on the fair value of the underlying investments held by the fund less its liabilities. (d) Represents investments in certain commodity funds measured using quoted market prices. |
9. OTHER INCOME (EXPENSE), NET
Other income (expense), net consists of the following:
| | | | | | | | | | | | | | | | | |
| (In thousands) | 2023 | | 2022 | | 2021 |
Gain on investment in kaléo(a) | $ | 262 | | | $ | 1,406 | | | $ | 12,780 | |
| One-time tax credit in Brazil for unemployment/social security insurance non-income taxes resulting from a favorable decision by Brazil’s Supreme Court regarding the calculation of such tax | — | | | — | | | 8,486 | |
COVID-19-related expenses(b) | (9) | | | (350) | | | (624) | |
Group annuity contract premium expense(c) | (2,000) | | | — | | | — | |
| Other | (400) | | | (47) | | | (377) | |
| Total | $ | (2,147) | | | $ | 1,009 | | | $ | 20,265 | |
(a) In January 2023 and May 2022, additional cash consideration of $0.3 million and $1.4 million, respectively was received related to customary post-closing adjustments. The gain in 2021 includes a $0.3 million dividend received from kaléo in the first quarter of 2021. (b) Costs associated with operating under COVID-19 conditions include employee overtime expenses associated with absenteeism, personal protective equipment supplies and facility maintenance. (c) See Note 8 for more information. |
On December 27, 2021, the Company completed the sale of its investment interests in kaleo, Inc. (“kaléo”) (Series A-3 Preferred Stock, Series B Preferred Stock and common stock) that, taken together, represented on a fully diluted basis an approximate 18% interest in kaléo. Tredegar received closing cash proceeds of $47.1 million.
In May 2021, the Brazil Supreme Court ruled in a leading case related to the amount of Brazilian value-added tax to exclude from the calculation of unemployment/social security insurance non-income taxes (“PIS/COFINS”). As a result, in the second quarter of 2021, the Company recorded a pre-tax gain of $8.5 million for certain excess PIS/COFINS paid from 2003 to 2021, that included applicable interest, which the Company applied to required Brazilian federal tax payments during 2021. The pre-tax gain was recorded in “Other income (expense), net” in the consolidated statements of income.
10. DERIVATIVES
Tredegar uses derivative financial instruments for the purpose of hedging margin exposure from fixed-price forward sales contracts in Aluminum Extrusions and exposure from currency volatility that exist as part of ongoing business operations (primarily in Flexible Packaging Films). These derivative financial instruments are designated as and qualify as cash flow hedges and are recognized in the consolidated balance sheet at fair value. The fair value of derivative instruments recorded on the consolidated balance sheets areis based upon Level 2 inputs. If individual derivative instruments with the same counterparty can be settled on a net basis, the Company records the corresponding derivative fair values as a net asset or net liability.
In the normal course of business, Aluminum Extrusions enters into fixed-price forward sales contracts with certain customers for the future sale of fixed quantities of aluminum extrusions at scheduled intervals. In order to hedge margin exposure created from the fixing of future sales prices relative to volatile raw material (aluminum) costs, Aluminum Extrusions enters into a combination of forward purchase commitments and futures contracts to acquire or hedge aluminum, based on the scheduled purchases for the firm sales commitments. The fixed-price firm sales commitments and related hedging instruments generally have durations of not more than 12 months, and the notional amount of aluminum futures contracts that hedged future
purchases of aluminum to meet fixed-price forward sales contract obligations was $12.1$7.7 million (13.0(5.6 million pounds of aluminum) at December 31, 20202023 and $20.2$30.7 million (19.6(20.3 million pounds of aluminum) at December 31, 2019.2022.
The table below summarizes the location and gross amounts of aluminum derivative contract fair values (Level 2) in the consolidated balance sheets as of December 31, 20202023 and 2019:2022:
| | | | December 31, 2020 | | December 31, 2019 | | December 31, 2023 | | December 31, 2022 |
| (In thousands) | (In thousands) | Balance Sheet
Account | | Fair
Value | | Balance Sheet
Account | | Fair
Value | (In thousands) | Balance Sheet
Account | | Fair
Value | | Balance Sheet
Account | | Fair
Value |
| Derivatives Designated as Hedging Instruments | Derivatives Designated as Hedging Instruments | |
Asset derivatives:
Aluminum futures contracts | Asset derivatives:
Aluminum futures contracts | Prepaid expenses & other | | $ | 1,560 | | | Accrued expenses | | $ | 6 | |
| Liability derivatives: | |
Asset derivatives:
Aluminum futures contracts | |
Asset derivatives:
Aluminum futures contracts | |
Liability derivatives:
Aluminum futures contracts | Liability derivatives:
Aluminum futures contracts | Accrued expenses | | (22) | | | Accrued expenses | | (1,259) | |
| Aluminum futures contracts | |
| Net asset (liability) | Net asset (liability) | | $ | 1,538 | | | $ | (1,253) | |
In the event that a counterparty to an aluminum fixed-price forward sales contract chooses not to take delivery of its aluminum extrusions, the customer is contractually obligated to compensate Aluminum Extrusions for any losses on the related aluminum futures and/or forward contracts through the date of cancellation.
The table below summarizes the location and gross amounts of foreign currency forward contract fair values (Level 2) in the consolidated balance sheets as of December 31, 2020 and 2019:
| | | | | | | | | | | | | | | | | | | | | | | |
| | December 31, 2020 | | December 31, 2019 |
| (In thousands) | Balance Sheet
Account | | Fair
Value | | Balance Sheet
Account | | Fair
Value |
| Derivatives Designated as Hedging Instruments | | | | | | | |
Asset derivatives:
Foreign currency forward contracts | Prepaid expenses and other | | $ | 853 | | | Prepaid expenses and other | | $ | 83 | |
Liability derivatives:
Foreign currency forward contracts | Accrued expenses | | (466) | | | Accrued expenses | | (935) | |
| Net asset (liability) | | | $ | 387 | | | | | $ | (852) | |
The Company's earnings are exposed to foreign currency exchange risk primarily through the translation of the financial statements of subsidiaries that have a functional currency other than the U.S. Dollar. The Company estimates that the net mismatch translation exposure for the Flexible Packaging Film's business unit in Brazil (“Terphane Ltda.”) of its sales and raw materials quoted or priced in U.S. Dollars and its variable conversion, fixed conversion and sales, general and administrative costs (before depreciation and amortization) quoted or priced in Brazilian Real is annual net costs of R$119139 million Brazilian Real ("R$").
Terphane Ltda. has the following outstanding foreign exchange average forward rate contracts to purchase Brazilian Real and sell U.S. Dollars:
| | | | | | | | | | | | | | |
| USD Notional Amount (000s) | Average Forward Rate Contracted on USD/BRL | R$ Equivalent Amount (000s) | Applicable Month | Estimated % of Terphane Ltda. R$ Operating Cost Exposure Hedged |
| $1,270 | 5.4638 | R$6,939 | Jan-21 | 70% |
| $1,290 | 5.4674 | R$7,053 | Feb-21 | 71% |
| $1,270 | 5.4693 | R$6,946 | Mar-21 | 70% |
| $1,320 | 5.4765 | R$7,229 | Apr-21 | 73% |
| $1,285 | 5.4778 | R$7,039 | May-21 | 71% |
| $1,395 | 5.4882 | R$7,656 | Jun-21 | 77% |
| $1,450 | 5.4945 | R$7,967 | Jul-21 | 80% |
| $1,430 | 5.4993 | R$7,864 | Aug-21 | 79% |
| $1,520 | 5.5105 | R$8,376 | Sep-21 | 84% |
| $1,400 | 5.5100 | R$7,714 | Oct-21 | 78% |
| $1,495 | 5.5224 | R$8,256 | Nov-21 | 83% |
| $1,170 | 5.5060 | R$6,442 | Dec-21 | 65% |
| $16,295 | 5.4913 | R$89,481 | | 75% |
| | | | | | | | | | | | | | |
| USD Notional Amount (000s) | Average Forward Rate Contracted on USD/BRL | R$ Equivalent Amount (000s) | Applicable Month | Estimated % of Terphane Ltda. R$ Operating Cost Exposure Hedged |
| $1,784 | 5.2993 | R$9,454 | Jan-24 | 82% |
| $1,766 | 5.3188 | R$9,393 | Feb-24 | 81% |
| $1,781 | 5.3346 | R$9,501 | Mar-24 | 82% |
| $1,827 | 5.3373 | R$9,751 | Apr-24 | 84% |
| $1,798 | 5.3588 | R$9,635 | May-24 | 83% |
| $1,812 | 5.3708 | R$9,732 | Jun-24 | 84% |
| $1,804 | 5.3848 | R$9,714 | Jul-24 | 84% |
| $1,806 | 5.4014 | R$9,755 | Aug-24 | 84% |
| $1,857 | 5.4107 | R$10,048 | Sep-24 | 87% |
| $1,851 | 5.4225 | R$10,037 | Oct-24 | 87% |
| $1,837 | 5.4403 | R$9,994 | Nov-24 | 86% |
| $1,801 | 5.4580 | R$9,830 | Dec-24 | 85% |
| $21,724 | 5.3786 | R$116,844 | | 84% |
These foreign currency exchange contracts have been designated and qualify as cash flow hedges of Terphane Ltda.’s forecasted sales to customers quoted or priced in U.S. Dollars over that period. By changing the currency risk associated with these U.S. Dollar sales, the derivatives have the effect of offsetting operating costs quoted or priced in Brazilian Real and decreasing the net exposure to Brazilian Real in the consolidated statements of income.
The pre-tax nettable below summarizes the location and gross amounts of foreign currency forward contract fair value ofvalues (Level 2) in the open forward contracts was a negative $0.9 millionconsolidated balance sheets as of December 31, 2020.2023 and 2022:
| | | | | | | | | | | | | | | | | | | | | | | |
| | December 31, 2023 | | December 31, 2022 |
| (In thousands) | Balance Sheet
Account | | Fair
Value | | Balance Sheet
Account | | Fair
Value |
| Derivatives Designated as Hedging Instruments | | | | | | | |
Asset derivatives:
Foreign currency forward contracts | Prepaid expenses and other | | $ | 2,050 | | | Prepaid expenses and other | | $ | 781 | |
| Foreign currency forward contracts | Other non-current assets | | 146 | | | Other non-current assets | | 33 | |
| | | | | | | |
Liability derivatives:
Foreign currency forward contracts | Other non-current liabilities | | — | | | Other non-current liabilities | | (3) | |
| Net asset (liability) | | | $ | 2,196 | | | | | $ | 811 | |
These derivative contracts involve elements of market risk that are not reflected on the consolidated balance sheet, including the risk of dealing with counterparties and their ability to meet the terms of the contracts. The counterparties to any forward purchase commitments are major aluminum brokers and suppliers, and the counterparties to any aluminum futures contracts are major financial institutions. Fixed-price forward sales contracts are only made available to the best and most credit-worthycreditworthy customers. The counterparties to the Company’s foreign currency cash flow hedge contracts are major financial institutions.
The pretaxpre-tax effect on net income (loss) from continuing operations and other comprehensive income (loss) of derivative instruments classified as cash flow hedges and described in the previous paragraphs for years ended December 31, 2020, 2019,2023, 2022, and 20182021 is summarized in the tables below:
| | (In thousands) | (In thousands) | Cash Flow Derivative Hedges | (In thousands) | Cash Flow Derivative Hedges |
| | | Aluminum Futures Contracts | | Aluminum Futures Contracts |
| Years Ended December 31, | Years Ended December 31, | 2020 | | 2019 | | 2018 | Years Ended December 31, | 2023 | | 2022 | | 2021 |
| Amount of pre-tax gain (loss) recognized in other comprehensive income | Amount of pre-tax gain (loss) recognized in other comprehensive income | $ | 74 | | | $ | (2,359) | | | $ | (1,123) | |
| Location of gain (loss) reclassified from accumulated other comprehensive income into net income (effective portion) | Location of gain (loss) reclassified from accumulated other comprehensive income into net income (effective portion) | Cost of
goods sold | | Cost of
goods sold | | Cost of
goods sold | Location of gain (loss) reclassified from accumulated other comprehensive income into net income (effective portion) | Cost of
goods sold | | Cost of
goods sold |
| Amount of pre-tax gain (loss) reclassified from accumulated other comprehensive income to net income (effective portion) | Amount of pre-tax gain (loss) reclassified from accumulated other comprehensive income to net income (effective portion) | $ | (2,717) | | | $ | (2,736) | | | $ | 1,069 | |
| | | | | | | | | | | | | | | | | | | | | | | | | | |
| (In thousands) | Cash Flow Derivative Hedges |
| | Foreign Currency Forward Contracts |
| Years Ended December 31, | 2020 | | 2019 | | 2018 |
| Amount of pre-tax gain (loss) recognized in other comprehensive income | $ | 0 | | $ | (4,437) | | | $ | 0 | | $ | (856) | | | $ | 0 | | $ | (2,105) | |
| Location of gain (loss) reclassified from accumulated other comprehensive income into net income (effective portion) | Cost of
goods sold | Selling, general & admin | | Cost of
goods sold | Selling, general & admin | | Cost of
goods sold | Selling, general & admin |
| Amount of pre-tax gain (loss) reclassified from accumulated other comprehensive income to net income (effective portion) | $ | 62 | | $ | (6,069) | | | $ | 62 | | $ | (904) | | | $ | 62 | | $ | (1,796) | |
| | | | | | | | | | | | | | | | | | | | | | | | | | |
| (In thousands) | Cash Flow Derivative Hedges |
| | Foreign Currency Forward Contracts |
| Years Ended December 31, | 2023 | | 2022 | | 2021 |
| Amount of pre-tax gain (loss) recognized in other comprehensive income | $ | — | | $ | 4,196 | | | $ | — | | $ | 3,269 | | | $ | — | | $ | (2,415) | |
| Location of gain (loss) reclassified from accumulated other comprehensive income into net income (effective portion) | Cost of
goods sold | Selling, general & admin | | Cost of
goods sold | Selling, general & admin | | Cost of
goods sold | Selling, general & admin |
| Amount of pre-tax gain (loss) reclassified from accumulated other comprehensive income to net income (effective portion) | $ | 61 | | $ | 3,011 | | | $ | 61 | | $ | 1,378 | | | $ | 63 | | $ | (337) | |
As of December 31, 2020,2023, the Company expects $1.2$0.8 million of unrealized after-tax lossesnet gains on aluminum and foreign currency derivative instrumentscontracts reported in accumulated other comprehensive income (loss) to be reclassified to earnings within the next 12 months. For the years ended December 31, 2020, 20192023, 2022 and 2018,2021, net gains or losses realized, from previously unrealized net gains or losses on hedges that had been discontinued, were not material.
10 ACCRUED EXPENSES
Accrued expenses consist of the following:
| | | | | | | | | | | |
| (In thousands) | 2020 | | 2019 |
| Payrolls, related taxes and medical and other benefits | $ | 9,571 | | | $ | 6,227 | |
| Incentive compensation | 8,138 | | | 9,603 | |
| Vacation | 7,283 | | | 6,975 | |
| Workers’ compensation and disabilities | 2,986 | | | 3,546 | |
| Environmental liabilities (current) | 2,066 | | | 2,122 | |
| Accrued severance | 1,894 | | | 1,180 | |
| Accrued utilities | 1,460 | | | 1,711 | |
| Customer rebates | 1,398 | | | 1,504 | |
| Accrued freight | 1,397 | | | 1,389 | |
| Derivative contract liability | 487 | | | 2,188 | |
| Other | 4,061 | | | 3,020 | |
| Total | $ | 40,741 | | | $ | 39,465 | |
11 DEBT AND CREDIT AGREEMENTS
On December 1, 2020, Tredegar entered into an amendment (“Amendment No. 1”) to its five-year secured revolving credit agreement (the “Credit Agreement”), which matures in June 2024. The material changes from Amendment No. 1 are as follows:
•Aggregate borrowings available under the facility were reduced from $500 million to $375 million.
•The definition of Credit EBITDA was amended to permit certain adjustments for prepayment of pension obligations on a pro forma basis.
•Amendments were made to certain of the negative covenants, including, among other amendments, the following: (i) the restricted payments covenant was amended to permit a one-time special dividend payment of up to $200 million and allow for an aggregate amount of dividend payments up to $75 million subsequent to Amendment No. 1 through the maturity date of the Credit Agreement; (ii) the asset disposition covenant was amended to reduce the general basket to 20% of consolidated total assets over the life of the facility and was reset as of December 1, 2020; and (iii) the indebtedness covenant was amended to reduce several baskets to $25 million each.
Borrowings under the Credit Agreement bear an interest rate of LIBOR plus a credit spread and commitment fees charged on the unused amount under the Credit Agreement at various indebtedness-to-Credit EBITDA levels as follows:
| | | | | | | | | | | | |
| Pricing Under Credit Agreement (Basis Points) | |
| Indebtedness-to-Credit EBITDA Ratio | Credit Spread
Over LIBOR | | Commitment
Fee | |
| > 3.5x but <= 4.0x | 200.0 | | | 40 | | |
| > 3.0x but <= 3.5x | 187.5 | | | 35 | | |
| > 2.0x but <= 3.0x | 175.0 | | | 30 | | |
| > 1.0x but <= 2.0x | 162.5 | | | 25 | | |
| <= 1.0x | 150.0 | | | 20 | | |
At December 31, 2020, the interest cost on debt borrowed under the Credit Agreement was priced at one-month LIBOR plus the applicable credit spread of 162.5 basis points.
The most restrictive covenants in the Credit Agreement include:
•Maximum indebtedness-to-Credit EBITDA (“Leverage Ratio”) of 4.00x;
•Minimum Credit EBITDA-to-interest expense of 3.00x; and
•Maximum aggregate distributions to shareholders over the remaining term of the Credit Agreement of $75 million; provided, that if the Leverage Ratio of equal to or greater than 3.00x, a limitation on such payments for the succeeding quarter at the greater of (i) $4.75 million and (ii) 50% of consolidated net income for the most recent fiscal quarter.
The Credit Agreement is secured by substantially all of the Company’s and its domestic subsidiaries’ assets, including equity in certain material first-tier foreign subsidiaries. At December 31, 2020, based upon the most restrictive covenant within the Credit Agreement, available credit under the Credit Agreement was approximately $241 million. Total debt outstanding was $134 million and $42 million as of December 31, 2020 and 2019, respectively.
Tredegar was in compliance with all of its debt covenants as of December 31, 2020. Noncompliance with any of the debt covenants may have a material adverse effect on its financial condition or liquidity, in the event such noncompliance cannot be cured or should the Company be unable to obtain a waiver from the lenders. Renegotiation of the covenant through an amendment to the Credit Agreement may effectively cure the noncompliance, but may have an effect on its financial condition or liquidity depending upon how the covenant is renegotiated.
1211. STOCK OPTION AND STOCK AWARD PLANS
As of December 31, 2020,2023, the Company had one stock-based compensation plan that permits the grants of stock options, stock appreciation rights (“SARs”), stock, restricted stock, and stock unit awards. Awards available for grant totaled 342,709 shares at December 31, 2023. Stock options may be granted to purchase a specified number of shares of common stock at a price no lower than the fair market value on the date of grant and for a term not to exceed 10 years. Stock options granted by the Company in 2020, 2019, and 20182021 vest after 2 years and have a 7-year life or vest after 3 years and have a 5-year life. Stock options exercisable totaled 1,287,7923,019,333 and 360,2182,719,919 shares at December 31, 20202023 and 2019,2022, respectively. Stock options available for grant totaled 484,835 shares at December 31, 2020.
On December 1, 2020, Tredegar’s Board of Directors declared a special cash dividend of $200 million, or $5.97 per share, on the Company’s common stock (the “Special Dividend”). The Special Dividend was payable on December 18, 2020 and had an ex-dividend date of December 21, 2020. All stock option awards that were outstanding at the time of the Special Dividend were modified pursuant to the nondiscretionary anti-dilution provisions in the related stock-based compensation plan. SARs that were outstanding at the time of the Special Dividend were also modified pursuant to the nondiscretionary anti-dilution provisions in the related SARs grant agreements. The modifications included increasing the number of outstanding stock options and SARs as well as reducing the exercise prices of all outstanding stock options and SARS. The modification did not result in additional stock-based compensation expense. No other terms or conditions of outstanding awards were modified.
A summary of stock options outstanding at December 31, 2020, 20192023, 2022 and 2018,2021, and changes during those years, is presented below:
| | | | | | | | | | | | | | | | | | | | | | | | | | | | | |
| | | | Option Exercise Price/Share |
| | Number of
Options | | Range | | Weighted
Average |
| Outstanding at December 31, 2017 | 608,520 | | | $ | 15.65 | | | to | | $ | 24.84 | | | $ | 19.75 | |
| Granted | 451,083 | | | 19.35 | | | to | | 19.35 | | | 19.35 | |
| Forfeited and expired | (96,089) | | | 15.65 | | | to | | 24.84 | | | 19.58 | |
| Exercised | (73,398) | | | 15.65 | | | to | | 22.49 | | | 18.15 | |
| Outstanding at December 31, 2018 | 890,116 | | | 15.65 | | | to | | 24.84 | | | 19.69 | |
| Granted | 758,287 | | | 18.48 | | | to | | 18.48 | | | 18.48 | |
| Forfeited and expired | (10,000) | | | 19.40 | | | to | | 19.40 | | | 19.40 | |
| Exercised | (9,500) | | | 19.40 | | | to | | 19.40 | | | 19.40 | |
| Outstanding at December 31, 2019 | 1,628,903 | | | 15.65 | | | to | | 24.84 | | | 19.13 | |
Granted1 | 638,074 | | | 10.75 | | | to | | 14.62 | | | 11.90 | |
Modification for special cash dividend1 | 701,535 | | | 10.75 | | | to | | 14.62 | | | 11.90 | |
Forfeited and expired1 | (141,074) | | | 10.75 | | | to | | 24.84 | | | 11.87 | |
| Exercised | 0 | | | 0 | | | to | | 0 | | | 0 | |
Outstanding at December 31, 20201 | 2,827,438 | | | $ | 10.75 | | | to | | $ | 22.49 | | | $ | 13.55 | |
1.The option exercise price per share reflects the reduction to the exercise prices of outstanding stock options impacted by the modification due to the anti-dilution provisions in the stock-based compensation plan. |
| | | | | | | | | | | | | | | | | | | | | | | | | | | | | |
| | | | Option Exercise Price/Share |
| | Number of
Options | | Range | | Weighted
Average |
| Outstanding at January 1, 2021 | 2,827,438 | | | $ | 10.75 | | | to | | $ | 22.49 | | | $ | 13.55 | |
| Granted | 388,822 | | | 16.37 | | | to | | 16.37 | | | 16.37 | |
| Forfeited and expired | (22,611) | | | 14.47 | | | to | | 19.64 | | | 18.14 | |
| Exercised | (67,705) | | | 10.75 | | | to | | 17.29 | | | 13.51 | |
| Outstanding at December 31, 2021 | 3,125,944 | | | 10.75 | | | to | | 22.49 | | | 13.82 | |
| | | | | | | | | |
| Forfeited and expired | (17,203) | | | 14.47 | | | to | | 19.64 | | | 15.33 | |
| | | | | | | | | |
| Outstanding at December 31, 2022 | 3,108,741 | | | 10.75 | | | to | | 22.49 | | | 13.81 | |
| | | | | | | | | |
| Forfeited and expired | (89,408) | | | 13.78 | | | to | | 19.64 | | | 19.60 | |
| | | | | | | | | |
| Outstanding at December 31, 2023 | 3,019,333 | | | $ | 10.75 | | | to | | $ | 22.49 | | | $ | 13.64 | |
No options were granted in 2023 nor 2022. The assumptions used in the Black-Scholes options-pricing model for valuing Tredegar stock options originally granted in 2020, 2019 and 2018,2021, and the related estimated fair values at the date of grant, were as follows:
| | | | | | | | | | | | | | | | | |
| 2020 | | 2019 | | 2018 |
| Dividend yield | 2.5 | % | | 2.4 | % | | 2.3 | % |
| Weighted average volatility percentage | 43.8 | % | | 38.3 | % | | 38.3 | % |
| Weighted average risk-free interest rate | 0.8 | % | | 2.4 | % | | 2.8 | % |
| Holding period (years) | 5 | | 5 | | 5 |
Weighted average exercise price at date of grant (also weighted average market price at date of grant)1 | $ | 14.41 | | | $ | 18.48 | | | $ | 19.35 | |
| Estimated weighted average fair value of options per share at date of grant | $ | 4.44 | | | $ | 5.43 | | | $ | 5.87 | |
| Total estimated fair value of stock options granted (in thousands) | $ | 2,833 | | | $ | 4,117 | | | $ | 2,648 | |
1.In December 2020, the weighted average exercise price for outstanding stock option awards granted in 2020, 2019 and 2018 were modified to $10.75, $13.78 and $14.43, respectively. As the anti-dilution provisions in the stock-based compensation plan were structured to equitably adjust the award’s fair value before and after the modification, there is no resulting incremental fair value. |
| | | | | |
| 2021 |
| Dividend yield | 2.6 | % |
| Weighted average volatility percentage | 48.3 | % |
| Weighted average risk-free interest rate | 0.9 | % |
| Holding period (years) | 5 |
| Weighted average exercise price at date of grant (also weighted average market price at date of grant) | $ | 16.37 | |
| Estimated weighted average fair value of options per share at date of grant | $ | 5.57 | |
| Total estimated fair value of stock options granted (in thousands) | $ | 2,165 | |
The dividend yield is the actual dividend yield on Tredegar’s common stock at the date of grant, which the Company believes is a reasonable estimate of the expected yield during the holding period. The expected volatility is based on the historical volatility of Tredegar’s common stock using a sequential period of historical data equal to the expected holding period of the option. The Company has no reason to believe that future volatility for this period is likely to differ from the past. The assumed risk-free interest rate is based on observed interest rates for U.S. Treasury debt securities appropriate for the expected holding period.
The following table summarizes additional information about stock options outstanding and exercisable at December 31, 2020:2023:
| | | | | Options Outstanding at December 31, 2020 | | Options Exercisable at December 31, 2020 | | | | | | | Options Outstanding at December 31, 2023 | | Options Exercisable at December 31, 2023 |
| | | | | | Weighted Average | | Aggregate Intrinsic Value | | | | | | Aggregate Intrinsic Value | | | | | | | | | Weighted Average | | Aggregate Intrinsic Value | | | | | | Aggregate Intrinsic Value |
Range of
Exercise Prices | Range of
Exercise Prices | | Shares | | Remaining Contractual Life | | Exercise
Price | | | Shares | | Weighted Average Exercise Price | |
| $ | 0 | | | to | | $ | 13.99 | | | 1,598,700 | | | 5.4 years | | $ | 12.11 | | | $ | 7,338,799 | | | 425,219 | | | $ | 12.50 | | | $ | 1,785,553 | |
| 13.99 | | | to | | 18.65 | | | 1,059,138 | | | 4.4 years | | 14.64 | | | 2,209,408 | | | 692,973 | | | 14.66 | | | 1,447,785 | |
| 18.65 | | | to | | 23.32 | | | 169,600 | | | 2.1 years | | 20.27 | | | 0 | | | 169,600 | | | 20.27 | | | 0 | |
| $ | |
| $ | |
| 17.29 | |
| Total | Total | | 2,827,438 | | | 4.9 years | | $ | 13.55 | | | $ | 9,548,207 | | | 1,287,792 | | | $ | 14.68 | | | $ | 3,233,338 | |
The total intrinsic value of stock options exercised was $0.2 million in 2021. There were no stock options exercised in 2023 and 2022. The grant-date fair value of stock option-based awards vested in 2023, 2022 and 2021 was $2.2 million, $5.4 million, and $3.5 million, respectively. As of December 31, 2023, there was no unrecognized compensation cost related to stock option-based awards.
Restricted stock grants ordinarily vest three years from the date of grant based upon continued employment. The fair value of restricted stock awards is estimated as of the grant date using the closing stock price on that date. Stock unit awards vest upon the achievement of certain performance targets. The following table summarizes additional information about unvested restricted stock outstanding at December 31, 2020, 20192023, 2022 and 2018:2021:
| | | | Unvested Restricted Stock | | Maximum Unvested Restricted Stock Units Issuable Upon Satisfaction of Certain Performance Criteria | | Unvested Restricted Stock | | Maximum Unvested Restricted Stock Units Issuable Upon Satisfaction of Certain Performance Criteria |
| | | Number
of Shares | | Weighted Avg. Grant Date Fair Value/Share | | Grant Date
Fair Value
(In thousands) | | Number
of Shares | | Weighted Avg. Grant Date Fair Value/Share | | Grant Date
Fair Value
(In thousands) | | Number
of Shares | | Weighted Avg. Grant Date Fair Value/Share | | Grant Date
Fair Value
(In thousands) | | Number
of Shares | | Weighted Avg. Grant Date Fair Value/Share | | Grant Date
Fair Value
(In thousands) |
| Outstanding at January 1, 2018 | 206,676 | | | $ | 16.15 | | | $ | 3,337 | | | 172,133 | | | $ | 15.78 | | | $ | 2,716 | |
| Outstanding at January 1, 2021 | |
| Granted | Granted | 119,915 | | | 17.39 | | | 2,085 | | | 61,227 | | | 17.35 | | | 1,062 | |
| Vested | Vested | (64,702) | | | 18.31 | | | (1,185) | | | 0 | | | 0 | | | 0 | |
| Forfeited | Forfeited | (17,153) | | | 15.84 | | | (272) | | | (48,651) | | | 13.23 | | | (644) | |
| Outstanding at December 31, 2018 | 244,736 | | | 16.20 | | | 3,965 | | | 184,709 | | | 16.97 | | | 3,134 | |
| Outstanding at December 31, 2021 | |
| Granted | Granted | 185,422 | | | 18.46 | | | 3,423 | | | 57,442 | | | 18.34 | | | 1,053 | |
| Vested | Vested | (117,834) | | | 14.76 | | | (1,739) | | | (69,926) | | | 10.96 | | | (766) | |
| Forfeited | Forfeited | (26,389) | | | 16.11 | | | (425) | | | (24,562) | | | 11.51 | | | (283) | |
| Outstanding at December 31, 2019 | 285,935 | | | 18.27 | | | 5,224 | | | 147,663 | | | 21.25 | | | 3,138 | |
| Outstanding at December 31, 2022 | |
| Granted | Granted | 155,138 | | | 14.55 | | | 2,257 | | | 34,275 | | | 15.25 | | | 523 | |
| Vested | Vested | (148,709) | | | 17.39 | | | (2,586) | | | (37,370) | | | 17.38 | | | (649) | |
| Forfeited | Forfeited | (57,385) | | | 17.00 | | | (976) | | | (32,066) | | | 17.36 | | | (557) | |
| Outstanding at December 31, 2020 | 234,979 | | | $ | 16.68 | | | $ | 3,919 | | | 112,502 | | | $ | 21.82 | | | $ | 2,455 | |
| Outstanding at December 31, 2023 | |
The total intrinsic value of stock options exercised was $0.1 million and $0.4 million in 2019 and 2018, respectively. There were no stock options exercised in 2020. The grant-date fair value of stock option-based awards vested was $3.0 million, $0.5 million, and $0.1 million in 2020, 2019, and 2018, respectively. As of December 31, 2020, there was2023, the unrecognized compensation cost for continuing operations of $2.0 million related to stock option-based awards and $1.7 million related to non-vested restricted stock and other stock-based awards.awards was $3.6 million. This cost is expected to be recognized over the remaining weighted average period of 1.2 years for stock option-based awards and 1.4 years for non-vested restricted stock and other stock-based awards. Commencing in 2019, stock option award grants include a retirement provision that allow for the immediate vesting of options held by a participant that ceases to provide service, including service as a member of the board of directors, with the Company, subsequent to reaching the age of 65. As a result of this provision, the Company recognized accelerated stock compensation expense for continuing operations of $0.1 million and $1.3 million in 2020 and 2019, respectively. 1.9 years.
SARs granted by the Company in 20202021 vest after 2 years and have the same terms and vesting requirements as the 2020 stock option grants excepta 7-year life. There were no SARs granted in 2023 or 2022. SARs may be settled in cash upon exercise and therefore are classified as liabilities and included in accrued expenses in the consolidated balance sheet. The fair value of these liability awards is remeasured at each reporting period until the date of settlement. Increases and decreases in stock-based compensation expense isare recognized over the vesting period, or immediately, for vested awards.
A summary of SARs outstanding at December 31, 2023, 2022 and 2021, and changes during those years, is presented below:The following table summarizes SARs activity in 2020 as no SARs were granted prior to January 1, 2020 since 1992:
| | | | | | | | | | | | | | | | | | | | | | | | | | | | | |
| | | | Exercise Price/Share |
| | Number of
SARs | | Range | | Weighted
Average |
| Outstanding at January 1, 2020 | 0 | | | $ | 0 | | | to | | $ | 0 | | | $ | 0 | |
Granted1 | 387,252 | | | 10.75 | | | to | | 19.64 | | | 11.60 | |
| Modification for special cash dividend | 71,402 | | | 10.75 | | | to | | 19.64 | | | 11.60 | |
| Forfeited and expired | (82,214) | | | 10.75 | | | to | | 19.64 | | | 11.39 | |
| Exercised | 0 | | | 0 | | | to | | 0 | | | 0 | |
| Outstanding at December 31, 2020 | 376,440 | | | $ | 10.75 | | | to | | $ | 19.64 | | | $ | 11.64 | |
1.The SARs exercise price per share reflects the reduction to the exercise prices of outstanding SARs as a results of the modification to the awards pursuant to the nondiscretionary anti-dilution provisions in the related SARs grant agreements. |
| | | | | | | | | | | | | | | | | | | | | | | | | | | | | |
| | | | Exercise Price/Share |
| | Number of
SARs | | Range | | Weighted
Average |
| Outstanding at January 1, 2021 | 376,440 | | | $ | 10.75 | | | to | | $ | 19.64 | | | $ | 11.64 | |
| Granted | 164,464 | | | 16.37 | | | to | | 16.37 | | | 16.37 | |
| Forfeited and expired | (10,043) | | | 10.75 | | | to | | 16.37 | | | 13.01 | |
| Exercised | (9,260) | | | 10.75 | | | to | | 15.25 | | | 13.87 | |
| Outstanding at December 31, 2021 | 521,601 | | | 10.75 | | | to | | 16.37 | | | 13.55 | |
| | | | | | | | | |
| Forfeited and expired | (22,914) | | | 10.75 | | | to | | 16.37 | | | 14.83 | |
| | | | | | | | | |
| Outstanding at December 31, 2022 | 498,687 | | | 10.75 | | | to | | 16.37 | | | 13.49 | |
| | | | | | | | | |
| Forfeited and expired | (53,969) | | | 10.75 | | | to | | 16.37 | | | 12.78 | |
| | | | | | | | | |
| Outstanding at December 31, 2023 | 444,718 | | | $ | 10.75 | | | to | | $ | 16.37 | | | $ | 13.57 | |
The grant-date fair value of SARs awards vested in 20202022 and 2021 was $0.6 million.$0.5 million and $0.1 million, respectively. The grant-date fair value of SARs awards vested in 2023 was immaterial. As of December 31, 2020, the SARs2023, there was no unrecognized compensation cost for continuing operations was $1.5 million. This cost is expectedrelated to be recognized over the remaining weighted average vesting period of 1.1 years.
13 RETIREMENT PLANS AND OTHER POSTRETIREMENT BENEFITS
Tredegar sponsors a noncontributory defined benefit (pension) plan covering certain current and former U.S. employees. The plan for salaried and hourly employees currently in effect is based on a formula using the participant’s years of service and compensation or using the participant’s years of service and a dollar amount. The plan is closed to new participants and pay for active plan participants for benefit calculations was frozen as of December 31, 2007. As of January 31, 2018, the plan no longer accrued benefits associated with crediting employees for service, thereby freezing all future benefits under the plan.
In addition to providing pension benefits, the Company provides postretirement life insurance and health care benefits for certain groups of employees. Tredegar and retirees share in the cost of postretirement health care benefits, with employees hired on or before January 1, 1993, receiving a fixed subsidy to cover a portion of their health care premiums. The Company eliminated prescription drug coverage for Medicare-eligible retirees as of January 1, 2006. Consequently, Tredegar is not eligible for any federal subsidies.SARs.
The following tables reconcile the changes in benefit obligations and plan assets in 2020 and 2019, and reconcile the funded status to prepaid or accrued cost at December 31, 2020 and 2019:
| | | | | | | | | | | | | | | | | | | | | | | | | | |
| | Pension Benefits | | | Other Post-
Retirement Benefits |
| (In thousands) | 2020 | | 2019 | | | 2020 | | 2019 |
| Change in benefit obligation: | | | | | | | | |
| Benefit obligation, beginning of year | $ | 318,763 | | | $ | 287,240 | | | | $ | 7,650 | | | $ | 6,889 | |
| Service cost | 0 | | | 0 | | | | 29 | | | 26 | |
| Interest cost | 10,156 | | | 12,222 | | | | 243 | | | 290 | |
| Effect of actuarial (gains) losses related to the following: | | | | | | | | |
| Discount rate change | 26,887 | | | 38,919 | | | | 644 | | | 894 | |
| Retirement rate assumptions and mortality table adjustments | (3,446) | | | (2,589) | | | | 13 | | | 21 | |
| Other | 69 | | | (1,047) | | | | 55 | | | (176) | |
| Plan participant contributions | 0 | | | 0 | | | | 606 | | | 649 | |
| Benefits paid | (16,270) | | | (15,982) | | | | (1,076) | | | (943) | |
| Benefit obligation, end of year | $ | 336,159 | | | $ | 318,763 | | | | $ | 8,164 | | | $ | 7,650 | |
| Change in plan assets: | | | | | | | | |
| Plan assets at fair value, beginning of year | $ | 218,329 | | | $ | 205,367 | | | | $ | 0 | | | $ | 0 | |
| Actual return on plan assets | 18,800 | | | 20,624 | | | | 0 | | | 0 | |
| Employer contributions | 12,216 | | | 8,320 | | | | 470 | | | 294 | |
| Plan participant contributions | 0 | | | 0 | | | | 606 | | | 649 | |
| Benefits paid | (16,270) | | | (15,982) | | | | (1,076) | | | (943) | |
| Plan assets at fair value, end of year | $ | 233,075 | | | $ | 218,329 | | | | $ | 0 | | | $ | 0 | |
| Funded status of the plans | $ | (103,084) | | | $ | (100,434) | | | | $ | (8,164) | | | $ | (7,650) | |
| Amounts recognized in the consolidated balance sheets: | | | | | | | | |
| Accrued expenses (current) | $ | 181 | | | $ | 168 | | | | $ | 481 | | | $ | 470 | |
| Pension and other postretirement benefit obligations, net | 102,903 | | | 100,266 | | | | 7,683 | | | 7,180 | |
| Net amount recognized | $ | 103,084 | | | $ | 100,434 | | | | $ | 8,164 | | | $ | 7,650 | |
The following table sets forth the assumptions used in accounting for the pension and other post-retirement benefits, and the components of net periodic benefit cost:
| | | | | | | | | | | | | | | | | | | | | | | | | | | | | | | | | | | | | | |
| | Pension Benefits | | | Other Post-
Retirement Benefits |
| (In thousands, except percentages) | 2020 | | 2019 | | 2018 | | | 2020 | | 2019 | | 2018 |
| Weighted-average assumptions used to determine benefit obligations: | | | | | | | | | | | | |
| Discount rate | 2.57 | % | | 3.27 | % | | 4.40 | % | | | 2.54 | % | | 3.25 | % | | 4.37 | % |
| Expected long-term return on plan assets | 5.00 | % | | 5.00 | % | | 6.00 | % | | | n/a | | n/a | | n/a |
| Weighted-average assumptions used to determine net periodic benefit cost: | | | | | | | | | | | | |
| Discount rate | 3.27 | % | | 4.40 | % | | 3.72 | % | | | 3.25 | % | | 4.37 | % | | 3.69 | % |
| Expected long-term return on plan assets | 5.00 | % | | 6.00 | % | | 6.50 | % | | | n/a | | n/a | | n/a |
| Components of net periodic benefit cost: | | | | | | | | | | | | |
| Service cost | $ | 0 | | | $ | 0 | | | $ | 17 | | | | $ | 29 | | | $ | 26 | | | $ | 36 | |
| Interest cost | 10,156 | | | 12,222 | | | 11,442 | | | | 243 | | | 290 | | | 271 | |
| Expected return on plan assets | (11,004) | | | (13,528) | | | (15,011) | | | | 0 | | | 0 | | | 0 | |
| Amortization of prior service costs and gains or losses | 15,494 | | | 10,891 | | | 13,894 | | | | (198) | | | (258) | | | (243) | |
| Net periodic benefit cost | $ | 14,646 | | | $ | 9,585 | | | $ | 10,342 | | | | $ | 74 | | | $ | 58 | | | $ | 64 | |
Net periodic benefit cost is determined using assumptions at the beginning of each year. Funded status is determined using assumptions at the end of each year. The amount of the accumulated benefit obligation is the same as the projected benefit obligation. At December 31, 2020, the effect of a 1% change in the health care cost trend rate assumptions would not impact the post-retirement obligation.
Expected benefit payments over the next five years and in the aggregate for 2026-2030 are as follows:
| | | | | | | | | | | |
| (In thousands) | Pension
Benefits | | Other Post-
Retirement
Benefits |
| 2021 | $ | 17,593 | | | $ | 481 | |
| 2022 | 18,001 | | | 482 | |
| 2023 | 18,205 | | | 478 | |
| 2024 | 18,445 | | | 473 | |
| 2025 | 18,511 | | | 468 | |
| 2026—2030 | 90,778 | | | 2,196 | |
The pre-tax amounts recorded in 2020, 2019 and 2018 in accumulated other comprehensive income consist of:
| | | | | | | | | | | | | | | | | | | | | | | | | | | | | | | | | | | |
| | Pension | | Other Post-Retirement |
| (In thousands) | 2020 | | 2019 | | 2018 | | 2020 | | 2019 | | 2018 |
| Net actuarial (gain) loss | $ | 150,267 | | | $ | 150,047 | | | $ | 132,751 | | | $ | 86 | | | $ | (824) | | | $ | (1,821) | |
Pension expense is expected to be $14.0 million in 2021. The amounts in accumulated other comprehensive income, before related deferred income taxes, that are expected to be recognized as components of net periodic cost during 2021 are $17.1 million of cost for the pension plan and $0.1 million of benefit for other post-retirement plans.
The percentage composition of assets held by pension plans at December 31, 2020, 2019 and 2018 are as follows:
| | | | | | | | | | | | | | | | | |
| | % Composition of Plan Assets
at December 31, |
| | 2020 | | 2019 | | 2018 |
| Pension plans: | | | | | |
| Fixed income securities | 7.7 | % | | 8.7 | % | | 8.6 | % |
| Large/mid-capitalization equity securities | 27.1 | | | 21.3 | | | 18.2 | |
| Small-capitalization equity securities | 8.6 | | | 7.8 | | | 6.8 | |
| International and emerging market equity securities | 20.6 | | | 19.7 | | | 16.0 | |
| Total equity securities | 56.3 | | | 48.8 | | | 41.0 | |
| Private equity and hedge funds | 12.1 | | | 35.0 | | | 42.3 | |
| Cash and cash equivalents | 17.5 | | | 1.4 | | | 1.4 | |
| Other assets | 6.4 | | | 6.1 | | | 6.7 | |
| Total | 100.0 | % | | 100.0 | % | | 100.0 | % |
Tredegar’s targeted allocation percentage for pension plan assets and the expected long-term rate of return on assets used to determine its benefit obligation at December 31, 2020, are as follows:
| | | | | | | | | | | |
| Target % Composition of Plan Assets1 | | Expected Long-term Return % |
| Pension plans: | | | |
| Fixed income securities | 12.0 | % | | 1.3 | % |
| Large/mid-capitalization equity securities | 27.0 | | | 6.3 | |
| Small-capitalization equity securities | 8.0 | | | 6.8 | |
| International and emerging market equity securities | 20.0 | | | 5.6 | |
| Total equity securities | 55.0 | | | 6.1 | |
| Private equity and hedge funds | 33.0 | | | 4.4 | |
| Total | 100.0 | % | | 5.0 | % |
1.Target percentages for the composition of plan assets represents a neutral position within the approved range of allocations for such assets. |
Expected long-term returns are estimated by asset class and generally are based on inflation-adjusted historical returns, volatilities, risk premiums and managed asset premiums. The portfolio of fixed income securities is structured with maturities that generally match estimated benefit payments over the next 1-2 years. The other assets category is primarily comprised of cash and contracts with insurance companies. The Company’s primary investment objective is to maximize total return with a strong emphasis on the preservation of capital, and it believes that over the long-term a diversified portfolio of fixed income securities, equity securities, hedge funds and private equity funds has a better risk-return profile than fixed income securities alone. The average remaining duration of benefit payments for the pension plans is about 11.5 years. The Company expects its required contributions to be approximately $11.7 million in 2021.
Estimates of the fair value of assets held by the Company’s pension plan are provided by unaffiliated third parties. Investments in private equity and hedge funds and certain fixed income securities by the Company’s pension plan are measured at net asset value, which is a practical expedient for measuring fair value. These assets are therefore excluded from the fair value hierarchy for each of the years presented.
At December 31, 2020 and 2019, the pension plan assets are categorized by level within the fair value measurement hierarchy as follows:
| | | | | | | | | | | | | | | | | | | | | | | |
| (In thousands) | Total | | Quoted Prices
in Active
Markets for
Identical Assets
(Level 1) | | Significant
Other
Observable
Inputs
(Level 2) | | Significant
Unobservable
Inputs
(Level 3) |
| Balances at December 31, 2020 | | | | | | | |
| Cash and cash equivalents | $ | 40,890 | | | $ | 40,890 | | | $ | 0 | | | $ | 0 | |
| Large/mid-capitalization equity securities | 63,146 | | | 63,146 | | | 0 | | | 0 | |
| Small-capitalization equity securities | 19,932 | | | 19,932 | | | 0 | | | 0 | |
| International and emerging market equity securities | 24,325 | | | 24,325 | | | 0 | | | 0 | |
| Fixed income securities | 18,008 | | | 6,690 | | | 11,318 | | | 0 | |
| Contracts with insurance companies | 9,118 | | | 0 | | | 0 | | | 9,118 | |
| Other assets | 5,629 | | | 5,629 | | | 0 | | | 0 | |
| Total plan assets at fair value | $ | 181,048 | | | $ | 160,612 | | | $ | 11,318 | | | $ | 9,118 | |
Investments measured at net asset value1 | 52,027 | | | | | | | |
| Total plan assets, December 31, 2020 | $ | 233,075 | | | | | | | |
| Balances at December 31, 2019 | | | | | | | |
| Cash and cash equivalents | $ | 3,076 | | | $ | 3,076 | | | $ | 0 | | | $ | 0 | |
| Large/mid-capitalization equity securities | 46,440 | | | 46,440 | | | 0 | | | 0 | |
| Small-capitalization equity securities | 17,135 | | | 17,135 | | | 0 | | | 0 | |
| International and emerging market equity securities | 43,079 | | | 19,117 | | | 23,962 | | | 0 | |
| Fixed income securities | 18,911 | | | 6,209 | | | 12,702 | | | 0 | |
| Contracts with insurance companies | 8,840 | | | 0 | | | 0 | | | 8,840 | |
| Other assets | 4,509 | | | 4,509 | | | 0 | | | 0 | |
| Total plan assets at fair value | $ | 141,990 | | | $ | 96,486 | | | $ | 36,664 | | | $ | 8,840 | |
Investments measured at net asset value1 | 76,339 | | | | | | | |
| Total plan assets, December 31, 2019 | $ | 218,329 | | | | | | | |
1.Includes private equity, hedge funds and certain international equity securities measured at net asset value. |
Tredegar also has a non-qualified supplemental pension plan covering certain employees. Effective December 31, 2005, further participation in this plan was terminated and benefit accruals for existing participants were frozen. The plan was designed to restore all or a part of the pension benefits that would have been payable to designated participants from the principal pension plans if it were not for limitations imposed by income tax regulations. The projected benefit obligation relating to this unfunded plan was $2.2 million at December 31, 2020 and December 31, 2019. Pension expense recognized for this plan was $0.1 million in 2020, 2019, and 2018. This information has been included in the preceding pension benefit tables.
Pension and other postretirement benefit liabilities related to Personal Care Films have been retained by the Company. Pension expense recognized for participation by these former employees in the Company’s plans is not material for the years ended December 31, 2020, 2019, and 2018.
14 SAVINGS PLAN
Tredegar has a savings plan that allows eligible employees to voluntarily contribute a percentage of their compensation, up to Internal Revenue Service (“IRS”) limitations. The provisions of the savings plan provided the following benefits for salaried and certain hourly employees:
•The Company makes matching contributions to the savings plan of $1 for every $1 an employee contributes per pay period up to a maximum of 5% of eligible compensation.
•The savings plan includes immediate vesting of matching contributions and automatic enrollment at 3% of eligible compensation unless the employee opts out or elects a different percentage.
The Company also has a non-qualified plan that restores matching benefits for employees suspended from the savings plan due to certain limitations imposed by income tax regulations (“restoration plan”). Charges recognized for these plans were $4.0 million in 2020, $3.9 million in 2019 and $3.7 million in 2018. The Company’s liability under the restoration plan was
$1.0 million at December 31, 2020 (consisting of 61,394 phantom shares of common stock) and $1.4 million at December 31, 2019 (consisting of 62,475 phantom shares of common stock) and valued at the closing market price on those dates.
The Tredegar Corporation Benefits Plan Trust (the “Trust”) purchased 7,200 shares of the Company’s common stock in 1998 for $0.2 million and 46,671 shares of its common stock in 1997 for $1.0 million, as a partial hedge against the phantom shares held in the restoration plan. There have been no shares purchased since 1998 except for re-invested dividends. The cost of the shares held by the Trust is shown as a reduction to shareholders’ equity in the consolidated balance sheets.
15 LEASES
Tredegar has various lease agreements with terms up to 10 years, including leases of real estate, office equipment and vehicles. Some leases include options to purchase the leased asset, terminate the agreement or extend the term of the agreement for one or more years. These options are included in the lease term when it is reasonably certain that the option will be exercised.
The following table presents information about the amount, timing and uncertainty of cash flows arising from the Company’s operating leases as of December 31, 2020:
| | | | | | | | | |
| (In thousands) | | | |
| Future Lease Payments | |
| 2021 | | $ | 2,749 | | |
| 2022 | | 2,653 | | |
| 2023 | | 2,525 | | |
| 2024 | | 2,417 | | |
| 2025 | | 2,417 | | |
| Thereafter | | 7,404 | | |
| Total undiscounted operating lease payments | | 20,165 | | |
| Less: Imputed interest | | 3,134 | | |
| Present value of operating lease liabilities | | $ | 17,031 | | |
As of January 1, 2019, an initial right-of-use asset of $20 million was recognized as a non-cash asset addition and an initial lease liability of $22 million was recognized as a non-cash liability addition with the adoption of the new lease accounting standard.
The following table summarizes lease costs, related cash flow and other information for the years ended December 31, 2020 and 2019. These costs are primarily related to long-term operating leases, but also include amounts for variable leases and short-term leases.
| | | | | | | | | | | |
| (In thousands) | 2020 | | 2019 |
| Operating lease expense | $ | 3,260 | | | $ | 3,087 | |
| | | |
| | | |
| | | |
| Right-of-use assets recognized as non-cash additions from the execution of new operating leases | $ | 529 | | | $ | 20,709 | |
| Other Information: | | | |
| Weighted-average remaining lease term for operating leases | 8 years | | 9 years |
| Weighted-average discount rate for operating leases | 4.21 | % | | 4.24 | % |
1612. INCOME TAXES
Income (loss) from continuing operations before income taxes and income tax expense (benefit) for continuing operations are as follows:
| | (In thousands) | (In thousands) | 2020 | | 2019 | | 2018 | (In thousands) | 2023 | | 2022 | | 2021 |
| Income (loss) from continuing operations before income taxes: | |
| Income (loss) before income taxes: | |
| Domestic | |
| Domestic | |
| Domestic | Domestic | $ | (58,033) | | | $ | 52,536 | | | $ | 67,806 | |
| Foreign | Foreign | 32,987 | | | 19,470 | | | 12,565 | |
| Total | Total | $ | (25,046) | | | $ | 72,006 | | | $ | 80,371 | |
| Current income tax expense (benefit): | Current income tax expense (benefit): | |
| Federal | |
| Federal | |
| Federal | Federal | $ | 4,777 | | | $ | 7,551 | | | $ | 30 | |
| State | State | 136 | | | 1,558 | | | 766 | |
| Foreign | Foreign | 2,374 | | | 579 | | | 771 | |
| Total | Total | 7,287 | | | 9,688 | | | 1,567 | |
| Deferred income tax expense (benefit): | Deferred income tax expense (benefit): | |
| Federal | Federal | (18,191) | | | 15,298 | | | 16,264 | |
| Federal | |
| Federal | |
| State | State | (640) | | | 187 | | | 948 | |
| Foreign | Foreign | 3,331 | | | (11,628) | | | 28 | |
| Total | Total | (15,500) | | | 3,857 | | | 17,240 | |
| Total income tax expense (benefit) | Total income tax expense (benefit) | $ | (8,213) | | | $ | 13,545 | | | $ | 18,807 | |
The significant differences between the U.S. federal statutory rate and the effective income tax rate related to continuing operations are as follows:
| | 2020 | | 2019 | | 2018 |
| 2023 | | | 2023 | | 2022 | | 2021 |
| (In thousands, except percentages) | (In thousands, except percentages) | Amount | % | | Amount | % | | Amount | % | (In thousands, except percentages) | Amount | % | | Amount | % | | Amount | % |
| Income tax expense (benefit) at federal statutory rate | |
| Stranded taxes released with termination of pension | |
| Changes in estimates related to prior year tax provision | |
| Brazilian tax incentive | |
| Research and development tax credit | |
| Tax on Prodepe tax incentive | |
| State taxes, net of federal income tax benefit | |
| Foreign currency translation variation on intercompany loans | |
| Dividend received deduction net of foreign withholding tax | |
| Foreign derived intangible income deduction | |
| Tax contingency accruals and tax settlements | |
| Changes in federal valuation allowance | |
| Non-deductible other | |
| Foreign rate differences | Foreign rate differences | $ | 3,753 | | (14.9) | | | $ | 1,533 | | 1.9 | | | $ | 1,576 | | 2.1 | |
| U.S. tax on foreign branch income | U.S. tax on foreign branch income | 1,409 | | (5.6) | | | 16,029 | | 22.3 | | | 2,229 | | 2.8 | |
| Non-deductible expenses | 219 | | (0.9) | | | 285 | | 0.4 | | | 99 | | 0.1 | |
| Valuation allowance for capital loss carryforwards | 52 | | (0.2) | | | 60 | | 0.1 | | | 553 | | 0.7 | |
| Unremitted earnings from foreign operations | 13 | | (0.1) | | | 60 | | 0.1 | | | 126 | | 0.2 | |
| Foreign derived intangible income deduction | 0 | | 0 | | | (319) | | (0.4) | | | (695) | | (0.9) | |
| Valuation allowance due to foreign losses and impairments | 0 | | 0 | | | (14,350) | | (19.9) | | | (2,162) | | (2.7) | |
| Stock-based compensation | (24) | | 0.1 | | | 292 | | 0.4 | | | 177 | | 0.2 | |
| Dividend received deduction net of foreign withholding tax | (52) | | 0.2 | | | (1,016) | | (1.4) | | | 0 | | 0 | |
| Tax contingency accruals and tax settlements | (58) | | 0.2 | | | (2,543) | | (3.5) | | | 673 | | 0.8 | |
| State taxes, net of federal income tax benefit | (373) | | 1.5 | | | 1,050 | | 1.5 | | | 1,203 | | 1.5 | |
| Research and development tax credit | (633) | | 2.5 | | | (523) | | (0.7) | | | (130) | | (0.2) | |
| Changes in estimates related to prior year tax provision | (2,472) | | 9.9 | | | (135) | | (0.2) | | | (380) | | (0.5) | |
| Brazilian tax incentive | (4,787) | | 19.1 | | | (1,999) | | (2.8) | | | (1,340) | | (1.7) | |
| Income tax expense (benefit) at federal statutory rate | (5,260) | | 21.0 | | | 15,121 | | 21.0 | | | 16,878 | | 21.0 | |
| Income tax expense (benefit) at effective income tax rate | Income tax expense (benefit) at effective income tax rate | $ | (8,213) | | 32.8 | | | $ | 13,545 | | 18.8 | | | $ | 18,807 | | 23.4 | |
IncomeProvision (benefit) for income taxes for the year ended December 31, 2023 was $(54.1) million compared to $4.4 million for the year ended December 31, 2022. The effective tax rates for the years ended December 31, 2023 and 2022 were 33.8% and 13.4%, respectively. The change in 2020effective tax rate is primarily attributed to tax benefits previously recorded in other comprehensive income (loss) that were primarilyreleased as a result of the pension plan termination, partially offset by a reduction in Brazilian tax incentives as a percentage of income. The stranded taxes released with the termination of the pension plan represent the effect of the change in federal and state tax rates on pension-related deferred tax items initially recorded in other comprehensive income. The related stranded taxes were released in full in 2023.
The effective tax rate in 2022 was impacted by a large discrete benefit recorded in the first quarter of 2022, resulting from the implementation of new U.S. tax regulations associated with foreign tax credits published by the U.S. Treasury and Internal Revenue Service (“IRS”) on January 4, 2022. These regulations overhauled various components of the foreign tax credit regime including the determination of creditable foreign taxes and limit the amount of foreign taxes that are creditable against U.S. income taxes. As the result of these regulations, future Brazilian income tax under Brazil tax law in place at that time
would have been deductible, but not creditable, in the U.S. The accounting rules require a reduction of the U.S. deferred tax liability previously established related to anticipated future income from Brazil. The IRS released guidance in 2023 that provides temporary relief for tax years after 2021 from the regulations published by the U.S. Treasury and Internal Revenue Service on January 4, 2022. As a result of the IRS guidance released in 2023, the reduction in the first quarter of 2022 of the U.S. deferred tax liability previously established related to anticipated future income from Brazil was reversed in 2023.
The effective tax rate in 2021 was impacted by the tax impactstrong earnings of Terphane Ltda. beingLtda, which are included in Tredegar’s U.S. consolidated tax return as a foreign branch, the tax impact of the local statutory tax rates of Tredegar’s foreign subsidiaries being higher than the current US tax rate of 21%, the benefit of tax incentives in Brazil, and, by claims for prior years’ U.S. research and development tax credits.
During 2019, due to favorable earnings trends, the Company released a $12.4 million valuation allowance on the net deferred tax assets of its Brazilian subsidiary Terphane Ltda. Because Terphane Ltda. is taxed as a foreign branch for U.S. tax purposes, Tredegar also recorded a related deferred tax liability of $12.4 million for the reduction in foreign tax credits that would result from Terphane Ltda. realizing this net deferred tax asset.
Income taxes in 2018 were primarily impacted the additional tax impact of Terphane Ltda. being included in Tredegar’s U.S. consolidated tax return as a foreign branch as well as the tax impact of the local statutory tax rates of Tredegar’s foreign subsidiaries being higher than the current U.S. tax rate of 21%. These increases to income tax expense were offset by recording a tax benefit on a portion of foreign losses and impairments, by the tax benefit of the foreign derived intangible income deduction under the TCJA, and by, the benefit of tax incentives in Brazil.Brazil and the release of the valuation allowance for capital loss carryforwards.
Tredegar accrues U.S. federal income taxes on unremitted earnings of all foreign subsidiaries where required. However, due to changes in the taxation of dividends under TCJA,However; Tredegar will only record U.S. federal income taxes on unremitted earnings of its foreign subsidiaries where Tredegar cannot take steps to eliminate any potential tax on future distributions from its foreign subsidiaries. Because of the accumulation of significant losses related to foreign currency translations at Terphane Ltda., there were no deferred income tax liabilities associated with the U.S. federal income taxes and foreign withholding taxes on Terphane Ltda.’s undistributed earnings as of and December 31, 20202023 and 2019.2022.
The Brazilian federal statutory income tax rate is a composite of 34.0% (25.0% of income tax and 9.0% of social contribution on income). Terphane’s manufacturing facility in Brazil is the beneficiary of certain income tax incentives that allow for a reduction in the statutory Brazilian federal income tax rate levied on the operating profit of its products. These incentives produce a current tax rate of 15.25% for Terphane (6.25% of income tax and 9.0% social contribution on income). The incentives were originally granted for a 10-year period commencing January 1, 2015 and expiring at the end of 2024. Terphane Brazil has been granted an additional three years of tax incentives through the end of 2027. The benefit from the tax incentives was $4.8$0.9 million, $2.0$3.9 million and $1.3$7.0 million in 2020, 20192023, 2022 and 2018,2021, respectively.
Deferred income tax liabilitiesassets and deferred income tax assets for continuing operationsliabilities at December 31, 20202023 and 2019,2022, are as follows:
| | (In thousands) | (In thousands) | 2020 | | 2019 | (In thousands) | 2023 | | 2022 |
| Deferred income tax liabilities: | |
| Amortization of goodwill and identifiable intangibles | $ | 9,520 | | | $ | 12,080 | |
| Depreciation | 10,844 | | | 7,395 | |
| Foregone tax credits on foreign branch income | 5,714 | | | 12,361 | |
| Excess of carrying value over tax basis of investment in kaléo | 4,905 | | | 17,504 | |
| Derivative financial instruments | 659 | | | 0 | |
| Right-of-use leased assets | 2,979 | | | 751 | |
| Other | 285 | | | 488 | |
| Total deferred income tax liabilities | 34,906 | | | 50,579 | |
| Deferred income tax assets: | Deferred income tax assets: | |
| Pensions | 25,576 | | | 21,025 | |
| Pension and other postretirement obligations | |
| Pension and other postretirement obligations | |
| Pension and other postretirement obligations | |
| Employee benefits | Employee benefits | 9,757 | | | 7,963 | |
| Excess capital losses | 7,462 | | | 1,551 | |
| Basis difference in capital assets | |
| Inventory | Inventory | 2,613 | | | 3,759 | |
| Asset write-offs, divestitures and environmental accruals | Asset write-offs, divestitures and environmental accruals | 2,904 | | | 1,355 | |
| Tax benefit on U.S. federal, state and foreign NOL and credit carryforwards | 18,305 | | | 17,992 | |
| Timing adjustment for unrecognized tax benefits on uncertain tax positions, including portion relating to interest and penalties | 134 | | | 187 | |
| Allowance for doubtful accounts | 141 | | | 383 | |
| U.S. federal and state NOL and credit carryforwards | |
| Capitalized R&D expenditures | |
| Other | |
| Lease liabilities | Lease liabilities | 3,144 | | | 967 | |
| Derivative financial instruments | — | | | 345 | |
| Interest expense limitation | |
| Foreign currency translation gain adjustment | Foreign currency translation gain adjustment | 1,423 | | | 255 | |
| Deferred income tax assets before valuation allowance | Deferred income tax assets before valuation allowance | 71,459 | | | 55,782 | |
| Less: Valuation allowance | Less: Valuation allowance | 17,485 | | | 3,787 | |
| Total deferred income tax assets | Total deferred income tax assets | 53,974 | | | 51,995 | |
| Net deferred income tax (assets) liabilities | $ | (19,068) | | | $ | (1,416) | |
| Deferred income tax liabilities: | |
| Goodwill and identifiable intangibles | |
| Goodwill and identifiable intangibles | |
| Goodwill and identifiable intangibles | |
| Property, plant and equipment | |
| Foregone tax credits on foreign branch income | |
| | Right-of-use leased assets | |
| | Right-of-use leased assets | |
| | Right-of-use leased assets | |
| Other | |
| Total deferred income tax liabilities | |
| Net deferred income tax assets (liabilities) | |
| Amounts recognized in the consolidated balance sheets: | Amounts recognized in the consolidated balance sheets: | |
| Deferred income tax assets (noncurrent) | |
| Deferred income tax assets (noncurrent) | |
| Deferred income tax assets (noncurrent) | Deferred income tax assets (noncurrent) | $ | 19,068 | | | $ | 12,435 | |
| Deferred income tax liabilities (noncurrent) | Deferred income tax liabilities (noncurrent) | 0 | | | 11,019 | |
| Net deferred income tax assets (liabilities) | Net deferred income tax assets (liabilities) | $ | 19,068 | | | $ | 1,416 | |
Except as noted below, the Company believes that it is more likely than not that future taxable income will exceed future tax-deductible amounts thereby resulting in the realization of deferred income tax assets.assets the Company had U.S. federal and state tax credits of $16.7 million, net operating loss carryforwards of $16.5 million and a deferred interest limitation of $2.6 million at December 31, 2023. The Company has estimated grosshad U.S. federal state and foreignstate tax credits of $15.3 million and net operating loss carryforwards of $18.3 million and $18.0$9.6 million at December 31, 20202022. The U.S. federal net operating loss and 2019, respectively.deferred interest limitation can be carried forward indefinitely. The U.S. federal foreign tax credits will expire by 2027between 2027-2033 and the U.S. federal research and development tax credits will expire by 2040.2044. The U.S. state carryforwards expire at different points over the next 20 years.
Valuation allowances of $5.5$12.9 million, $2.5$10.3 million and $6.6$9.4 million at December 31, 2020, 20192023, 2022 and 2018,2021, respectively, are recorded against the tax benefit on U.S. federal state and foreignstate tax credits and net operating loss carryforwards generated by certain foreign and domestic subsidiaries that may not be recoverable in the carryforward period. The valuation allowance for excessunrealized capital losses from investments and other related items was $7.1 million, $1.3 million and $1.2$0.7 million at December 31, 2020, 20192022 and 2018, respectively. The 2020 balance increased primarily due to capital loss carryforwards created by the sale of Personal Care Films. The 2018 balance decreased primarily due to the expiration of a portion of prior year capital loss carryforwards.2021. The amount of the deferred income tax asset considered realizable, however, could be adjusted in the near term if estimates of the fair value of certain investments during the carryforwardcarry-forward period change. Tredegar continues to evaluate opportunities to utilize capital loss carryforwards prior to their expiration at various dates in the future. As circumstances and events warrant, allowances will be reversed when it is more likely than not that future taxable income will exceed deductible amounts, thereby resulting in the realization of deferred income tax assets. A valuation allowanceValuation allowances of $4.9$2.2 million, was$2.8 million and $2.5 million at December 31, 2023, 2022 and 2021, respectively, were recorded in 2020 related to variousagainst certain deferred state tax assets. The valuation allowance for asset impairments in foreign jurisdictions where the Company believes it is more likely than not that the deferred income tax asset will not be realized was zero at December 31, 2020 and 2019, and $15.8 million at December 31, 2018. In 2019, the Company reversed a $12.4 million valuation allowance on the net deferred tax assets of its Brazilian subsidiary Terphane Ltda due to favorable earnings trends. Since Terphane Ltda. is taxed as a foreign branch for US tax purposes, Tredegar also recorded a related deferred tax liability of $12.4 million for the reduction in foreign tax credits that would result from Terphane Ltda. realizing this net deferred tax asset.
A reconciliation of the Company’s unrecognized uncertain tax positions since January 1, 2018,2021, is shown below: | | | | Years Ended December 31, | | Years Ended December 31, |
| (In thousands) | (In thousands) | 2020 | | 2019 | | 2018 | (In thousands) | 2023 | | 2022 | | 2021 |
| Balance at beginning of period | Balance at beginning of period | $ | 881 | | | $ | 3,361 | | | $ | 1,962 | |
| Increase (decrease) due to tax positions taken in: | Increase (decrease) due to tax positions taken in: | |
| Current period | Current period | 12 | | | 12 | | | 13 | |
| Current period | |
| Current period | |
| Prior period | Prior period | 0 | | | 49 | | | 1,430 | |
| Increase (decrease) due to settlements with taxing authorities | (265) | | | (151) | | | 0 | |
| Reductions due to lapse of statute of limitations | Reductions due to lapse of statute of limitations | 0 | | | (2,390) | | | (44) | |
| Balance at end of period | Balance at end of period | $ | 628 | | | $ | 881 | | | $ | 3,361 | |
Additional information related to unrecognized uncertain tax positions since January 1, 20182021 is summarized below:
| | | | | | | | | | | | | | | | | |
| | Years Ended December 31, |
| (In thousands) | 2020 | | 2019 | | 2018 |
Gross unrecognized tax benefits on uncertain tax positions (reflected in current income tax, other noncurrent liability accounts, or deferred tax assets in the balance sheet) | $ | 628 | | | $ | 881 | | | $ | 3,361 | |
| Deferred income tax assets related to unrecognized tax benefits on uncertain tax positions (reflected in deferred income tax accounts in the balance sheet) | (110) | | | (163) | | | (211) | |
| Net unrecognized tax benefits on uncertain tax positions, which would impact the effective tax rate if recognized | 518 | | | 718 | | | 3,150 | |
| Interest and penalties accrued on deductions taken relating to uncertain tax positions (approximately $2, $(144) and $107 reflected in income tax expense in the income statement in 2020, 2019 and 2018, respectively, with the balance shown in current income tax and other noncurrent liability accounts in the balance sheet) | 102 | | | 100 | | | 243 | |
| Related deferred income tax assets recognized on interest and penalties | (24) | | | (23) | | | (56) | |
| Interest and penalties accrued on uncertain tax positions net of related deferred income tax benefits, which would impact the effective tax rate if recognized | 78 | | | 77 | | | 187 | |
| Total net unrecognized tax benefits on uncertain tax positions reflected in the balance sheet, which would impact the effective tax rate if recognized | $ | 596 | | | $ | 795 | | | $ | 3,337 | |
| | | | | | | | | | | | | | | | | |
| | Years Ended December 31, |
| (In thousands) | 2023 | | 2022 | | 2021 |
Gross unrecognized tax benefits on uncertain tax positions (reflected in current income tax, other noncurrent liability accounts, or deferred tax assets in the balance sheet) | $ | 659 | | | $ | 628 | | | $ | 648 | |
| Deferred income tax assets related to unrecognized tax benefits on uncertain tax positions (reflected in deferred income tax accounts in the balance sheet) | 98 | | | 143 | | | 48 | |
| Net unrecognized tax benefits on uncertain tax positions, which would impact the effective tax rate if recognized | 757 | | | 771 | | | 696 | |
| Interest and penalties accrued on deductions taken relating to uncertain tax positions (approximately $20, $16 and $26 reflected in income tax expense in the income statement in 2023, 2022 and 2021, respectively, with the balance shown in current income tax and other noncurrent liability accounts in the balance sheet) | 169 | | | 149 | | | 133 | |
| Related deferred income tax assets recognized on interest and penalties | (39) | | | (34) | | | (31) | |
| Interest and penalties accrued on uncertain tax positions net of related deferred income tax benefits, which would impact the effective tax rate if recognized | 130 | | | 115 | | | 102 | |
| Total net unrecognized tax benefits on uncertain tax positions reflected in the balance sheet, which would impact the effective tax rate if recognized | $ | 887 | | | $ | 886 | | | $ | 798 | |
Tredegar, or one of its subsidiaries, files income tax returns in the U.S. federal jurisdiction, various states and jurisdictions outside the U.S. With few exceptions, Tredegar is no longer subject to U.S. federal, state or non-U.S. income tax examinations by tax authorities for years before 2017.2020. The Company anticipates that it is reasonably possible that Federal and state income tax audits or statutes may settle or close within the next 12 months which couldand are not expected to result in the recognition of up to approximately $0.5 million of the balance ofa material change in unrecognized tax positions, including any payments that may be made.
17 ASSET IMPAIRMENTS AND COSTS ASSOCIATED WITH EXIT AND DISPOSAL ACTIVITIES
In connection with13. BUSINESS SEGMENTS
The Company's business segments are Aluminum Extrusions, PE Films and Flexible Packaging Films. Aluminum Extrusions, also referred to as Bonnell Aluminum, produces high-quality, soft and medium strength alloyed aluminum extrusions, custom fabricated and finished, for the anticipated customer product transitionsbuilding and construction, automotive and transportation, consumer durables goods, machinery and equipment, electrical and renewable energy, and distribution markets. PE Films produces surface protection films, polyethylene overwrap films and films for other markets. Flexible Packaging Films produces polyester based films for use in Surface Protection,packaging applications that have specialized properties, such as heat resistance, strength, barrier protection and the ability to accept high-quality print graphics.
The Company’s reportable segments are based on its method of internal reporting, which is generally segregated by differences in products. Accounting standards for presentation of segments require an approach based on the way the Company recognized severanceorganizes the segments for making operating decisions and other employee-related expenseshow the chief operating decision maker (“CODM”) assesses performance. EBITDA from ongoing operations is the key profitability measure used by the CODM (Tredegar’s President and Chief Executive Officer) for purposes of $1.6assessing financial performance. The Company uses sales less freight (“net sales”) as its measure of revenues from external customers at the segment level. This measure is separately included in the financial information regularly provided to the CODM. Earnings before interest and taxes ("EBIT") from ongoing operations is a non-GAAP financial measure included in the reconciliation of segment financial information to consolidated results for the Company below.
Information by business segment and geographic area for the last three years is provided in the segment tables below. There were no accounting transactions between segments and no allocations to segments.
| | | | | | | | | | | | | | | | | |
| Net Sales |
| (In thousands) | 2023 | | 2022 | | 2021 |
| Aluminum Extrusions | $ | 474,803 | | | $ | 637,872 | | | $ | 539,325 | |
| PE Films | 76,763 | | | 97,571 | | | 118,920 | |
| Flexible Packaging Films | 126,326 | | | 168,139 | | | 139,978 | |
| Total net sales | 677,892 | | | 903,582 | | | 798,223 | |
| Add back freight | 26,933 | | | 34,982 | | | 28,232 | |
| Sales as shown in consolidated statements of income (loss) | $ | 704,825 | | | $ | 938,564 | | | $ | 826,455 | |
Refer to Notes to Financial Tables that follow these tables.
| | | | | | | | | | | | | | | | | |
| EBITDA from Ongoing Operations |
| (In thousands) | 2023 | | 2022 | | 2021 |
| Aluminum Extrusions: | | | | | |
| Ongoing operations: | | | | | |
| EBITDA | $ | 37,976 | | | $ | 66,800 | | | $ | 55,948 | |
| Depreciation & amortization | (17,927) | | | (17,414) | | | (16,272) | |
| EBIT | 20,049 | | | 49,386 | | | 39,676 | |
| Plant shutdowns, asset impairments, restructurings and other (a) | (3,557) | | | (310) | | | 3,237 | |
| | | | | |
| PE Films: | | | | | |
| Ongoing operations: | | | | | |
| EBITDA | 11,217 | | | 11,949 | | | 27,694 | |
| Depreciation & amortization | (6,522) | | | (6,280) | | | (6,263) | |
| EBIT | 4,695 | | | 5,669 | | | 21,431 | |
| Plant shutdowns, asset impairments, restructurings and other (a) | (4,972) | | | (646) | | | (371) | |
| Goodwill impairment | (34,891) | | | — | | | — | |
| Flexible Packaging Films: | | | | | |
| Ongoing operations: | | | | | |
| EBITDA | 4,383 | | | 27,452 | | | 31,684 | |
| Depreciation & amortization | (2,865) | | | (2,444) | | | (1,988) | |
| EBIT | 1,518 | | | 25,008 | | | 29,696 | |
| Plant shutdowns, asset impairments, restructurings and other (a) | (113) | | | (91) | | | 8,439 | |
| Total | (17,271) | | | 79,016 | | | 102,108 | |
| Interest income | 522 | | | 57 | | | 73 | |
| Interest expense | 11,607 | | | 4,990 | | | 3,386 | |
| Gain on investment in kaléo (a) | 262 | | | 1,406 | | | 12,780 | |
| Stock option-based compensation expense | 231 | | | 1,424 | | | 2,495 | |
| Pension settlement loss | 92,291 | | | — | | | — | |
| Corporate expenses, net (a) | 39,414 | | | 41,221 | | | 41,970 | |
| Income (loss) before income taxes | (160,030) | | | 32,844 | | | 67,110 | |
| Income tax expense (benefit) (a) | (54,125) | | | 4,389 | | | 9,284 | |
| | | | | |
| | | | | |
| Net income (loss) | $ | (105,905) | | | $ | 28,455 | | | $ | 57,826 | |
Refer to Notes to Financial Tables that follow these tables.
| | | | | | | | | | | |
| Identifiable Assets |
| (In thousands) | 2023 | | 2022 |
| Aluminum Extrusions | $ | 255,756 | | | $ | 293,308 | |
| PE Films | 56,536 | | | 102,431 | |
| Flexible Packaging Films | 84,062 | | | 103,448 | |
| Subtotal | 396,354 | | | 499,187 | |
| General corporate | 36,652 | | | 23,674 | |
| Cash, cash equivalents and restricted cash (b) | 13,455 | | | 19,232 | |
| | | |
| Total | $ | 446,461 | | | $ | 542,093 | |
| | | | | | | | | | | | | | | | | | | | | | | | | | | | | | | | | | | |
| | Depreciation and Amortization | | Capital Expenditures |
| (In thousands) | 2023 | | 2022 | | 2021 | | 2023 | | 2022 | | 2021 |
| Aluminum Extrusions | $ | 17,927 | | | $ | 17,414 | | | $ | 15,326 | | | $ | 20,339 | | | $ | 23,664 | | | $ | 18,914 | |
| PE Films | 6,522 | | | 6,280 | | | 6,263 | | | 1,772 | | | 3,289 | | | 2,997 | |
| Flexible Packaging Films | 2,865 | | | 2,444 | | | 1,988 | | | 4,323 | | | 8,151 | | | 5,603 | |
| Subtotal | 27,314 | | | 26,138 | | | 23,577 | | | 26,434 | | | 35,104 | | | 27,514 | |
| General corporate (d) | 369 | | | 264 | | | 207 | | | 12 | | | 1,771 | | | (153) | |
| | | | | | | | | | | |
| Total | $ | 27,683 | | | $ | 26,402 | | | $ | 23,784 | | | $ | 26,446 | | | $ | 36,875 | | | $ | 27,361 | |
| | | | | | | | | | | | | | | | | |
| Net Sales by Geographic Area (c) |
| (In thousands) | 2023 | | 2022 | | 2021 |
| United States | $ | 537,818 | | | $ | 717,049 | | | $ | 614,987 | |
| Exports from the United States to: | | | | | |
| Asia | 26,239 | | | 41,995 | | | 59,242 | |
| Canada | 15,597 | | | 15,264 | | | 17,776 | |
| Europe | 1,905 | | | 3,885 | | | 4,489 | |
| Latin America | 6,704 | | | 6,867 | | | 4,937 | |
| Operations outside the United States: | | | | | |
| Brazil | 89,077 | | | 117,896 | | | 96,792 | |
| Asia | 552 | | | 626 | | | — | |
| Total | $ | 677,892 | | | $ | 903,582 | | | $ | 798,223 | |
| | | | | | | | | | | | | | | | | | | | | | | |
| | Identifiable Assets
by Geographic Area (c) | | Property, Plant & Equipment,
Net by Geographic Area (c) |
| (In thousands) | 2023 | | 2022 | | 2023 | | 2022 |
| United States | $ | 320,604 | | | $ | 413,512 | | | $ | 143,729 | | | $ | 146,437 | |
| Operations outside the United States: | | | | | | | |
| Brazil | 65,495 | | | 72,725 | | | 28,121 | | | 25,385 | |
| China | 10,255 | | | 12,950 | | | 9,361 | | | 11,903 | |
| General corporate | 36,652 | | | 23,674 | | | 2,244 | | | 2,686 | |
| Cash, cash equivalents and restricted cash (b) | 13,455 | | | 19,232 | | | n/a | | n/a |
| | | | | | | |
| Total | $ | 446,461 | | | $ | 542,093 | | | $ | 183,455 | | | $ | 186,411 | |
Refer to Notes to Financial Tables that follow these tables.
The Company’s facilities in Pottsville, PA (“PV”) and Guangzhou, China (“GZ”) have a tolling arrangement whereby certain surface protection films are manufactured in GZ for a fee with raw materials supplied from PV that are then shipped by GZ directly to customers principally in the Asian market but paid by customers directly to PV.Amounts associated with this intercompany tolling arrangement are reported in the table above as export sales from the U.S. to Asia, and include net sales of $15.9 million in the fourth quarter of 2020. The Company recognizes termination benefits that are covered by a contract or an ongoing benefit arrangement when it is probable that employees will be entitled to benefits2023, $20.1 million in 2022 and the amount can be reasonably estimated. Other accrued expenses$32.7 million in 2021.
| | | | | | | | | | | | | | | | | |
| Net Sales by Product Group |
| (In thousands) | 2023 | | 2022 | | 2021 |
| Aluminum Extrusions: | | | | | |
| Nonresidential building & construction | $ | 264,780 | | | $ | 338,981 | | | $ | 269,252 | |
| Consumer durables | 38,897 | | | 62,541 | | | 53,578 | |
| Automotive | 48,046 | | | 51,286 | | | 43,256 | |
| Machinery & equipment | 43,759 | | | 63,326 | | | 42,721 | |
| Distribution | 14,331 | | | 29,732 | | | 45,639 | |
| Residential building & construction | 38,388 | | | 64,268 | | | 52,236 | |
| Electrical | 26,602 | | | 27,738 | | | 32,643 | |
| Subtotal | 474,803 | | | 637,872 | | | 539,325 | |
| PE Films: | | | | | |
| Surface protection films | 47,463 | | | 68,140 | | | 88,436 | |
| Packaging | 29,300 | | | 29,431 | | | 30,484 | |
| | | | | |
| Subtotal | 76,763 | | | 97,571 | | | 118,920 | |
| Flexible Packaging Films | 126,326 | | | 168,139 | | | 139,978 | |
| Total | $ | 677,892 | | | $ | 903,582 | | | $ | 798,223 | |
(a)See Notes 1, 5, 9 and 12 for more information on losses related toassociated with plant shutdowns, asset impairments and costs associated with exitrestructurings, unusual items, gains or losses from sale of assets, gains or losses on an investment accounted for under the fair value method and disposal activitiesother items.
(b)Cash, cash equivalents and restricted cash includes funds held in locations outside the U.S. of $9.8 million and $10.3 million at December 31, 2023 and 2022, respectively.
(c)Export sales relate mostly to PE Films. Operations in Brazil relate to Flexible Packaging Films.
(d)Corporate depreciation and amortization are included in corporate expenses, net, on the EBITDA from ongoing operations table above.
14. SAVINGS PLAN
Tredegar has a savings plan that allows eligible employees to voluntarily contribute a percentage of their compensation, up to IRS limitations. Charges recognized for continuing operationsthe savings plan were not material$4.0 million in 2023, $3.9 million in 2022 and $3.3 million in 2021. The provisions of the savings plan provided the following benefits for salaried and certain hourly employees:
•The Company makes matching contributions to the savings plan of $1 for every $1 an employee contributes per pay period up to a maximum of 5% of eligible compensation.
•The savings plan includes immediate vesting of matching contributions and automatic enrollment at 3% of eligible compensation unless the employee opts out or elects a different percentage.
The Company also has a non-qualified plan that restores matching benefits for employees suspended from the savings plan due to certain limitations imposed by income tax regulations (“restoration plan”). The Company’s liability under the restoration plan was $0.4 million at December 31, 2023 (consisting of 79,124 phantom shares of common stock) and $0.7 million at December 31, 2022 (consisting of 70,266 phantom shares of common stock) and valued at the closing market price on those dates. Charges recognized for the restoration plan were immaterial for the years 2023, 2022 and 2021.
The Tredegar Corporation Benefits Plan Trust (the “Trust”) purchased 7,200 shares of the Company’s common stock in 1998 for $0.2 million and 46,671 shares of its common stock in 1997 for $1.0 million. There have been no shares purchased since 1998 except for re-invested dividends. The cost of the shares held by the Trust is shown as a reduction to shareholders’ equity in the consolidated balance sheets.
15. SUPPLY CHAIN FINANCING
The Company has supply chain finance service agreements with third-party financial institutions to provide platforms that facilitate the ability of participating suppliers to finance payment obligations from the Company with the third-party financial institution. The Company’s obligations to its suppliers, including amounts due and scheduled payment dates, are not affected by suppliers’ decisions to finance amounts under the supply chain finance agreements. As of December 31, 2023 and 2022, $15.8 million and $25.9 million, respectively, of the Company’s accounts payable were financed by participating suppliers through third-party financial institutions.
A reconciliation of the beginning and ending balances of the supply chain financing for the year ended December 31, 2020, 2019 and 2018, respectively.2023 is as follows:
| | | | | |
| (In thousands) | 2023 |
| Balance, beginning of year | $ | 25,927 | |
| New obligations entered | 79,630 | |
| Less payments made | (90,365) | |
| Foreign exchange | 588 | |
| Balance, end of year | $ | 15,780 | |
1816. CONTINGENCIES
Tredegar is involved in various stages of investigation and remediation relating to environmental matters at certain current and former plant locations. Where the Company has determined the nature and scope of any required environmental remediation activity, estimates of cleanup costs have been obtained and accrued. As efforts continue to maintain compliance with applicable environmental laws and regulations, additional contingencies may be identified.identified continue. If additional contingencies are identified in the future, the Company’s practice is to determine at that time the nature and scope of those contingencies, obtain and accrue estimates of the cost of remediation, and perform remediation. While the Company believes it is currently adequately accrued for known environmental issues, it is possible that unexpected future costs for known or unknown environmental issues could have a material adverse effect on its financial condition, results of operations and cash flows at that time.
The Company is involved in various other legal actions arising in the normal course of business. After taking into consideration the relevant information, the Company believes that it has sufficiently accrued for probable losses and that the actions will not have a material adverse effect on its financial position.
From time to time, the Company enters into transactions with third parties in connection with the sale of assets or businesses in which it agrees to indemnify the buyers or third parties involved in the transaction, or in which the sellers or third parties involved in the transaction agree to indemnify Tredegar, for certain liabilities or risks related to the assets or business. Also, in the ordinary course of its business, the Company may enter into agreements with third parties for the sale of goods or services that may contain indemnification provisions. In the event that an indemnification claim is asserted, liability for indemnification would be subject to an assessment of the underlying facts and circumstances under the terms of the applicable agreement. For these reasons, Tredegar is unable to estimate the maximum amount of the potential future liability under the indemnity provisions of these agreements. The Company does, however, accrue for losses for any known contingent liability, including those that may arise from indemnification provisions, when future payment is probable and the amount is reasonably estimable. The Company discloses contingent liabilities if the probability of loss is reasonably possible and material.
19 SELECTED QUARTERLY FINANCIAL DATA
Tredegar Corporation and Subsidiaries
(In Thousands, Except Per-Share Amounts)
(Unaudited)
| | | | | | | | | | | | | | | | | | | | | | | |
| First
Quarter | | Second
Quarter | | Third
Quarter | | Fourth
Quarter |
| For the year ended December 31, 2020 | | | | | | | |
| Sales | $ | 192,136 | | | $ | 186,260 | | | $ | 184,370 | | | $ | 192,524 | |
| Gross profit | 40,092 | | | 46,331 | | | 41,909 | | | 42,305 | |
| | | | | | | |
| Income (loss) from continuing operations, net of tax | (20,663) | | | 14,332 | | | (16,976) | | | 6,475 | |
| Income (loss) from discontinued operations, net of tax | (1,658) | | | (3,136) | | | (48,237) | | | (5,580) | |
| Net income (loss) | $ | (22,321) | | | $ | 11,196 | | | $ | (65,213) | | | $ | 895 | |
| | | | | | | |
| Earnings (loss) per share: | | | | | | | |
| Basic: | | | | | | | |
| Continuing operations | $ | (0.62) | | | $ | 0.43 | | | $ | (0.51) | | | $ | 0.19 | |
| Discontinued operations | (0.05) | | | (0.10) | | | (1.44) | | | (0.17) | |
| Basic | $ | (0.67) | | | $ | 0.33 | | | $ | (1.95) | | | $ | 0.02 | |
| | | | | | | |
| Diluted: | | | | | | | |
| Continuing operations | $ | (0.62) | | | $ | 0.43 | | | $ | (0.51) | | | $ | 0.19 | |
| Discontinued operations | (0.05) | | | (0.10) | | | (1.44) | | | (0.17) | |
| Diluted | $ | (0.67) | | | $ | 0.33 | | | $ | (1.95) | | | $ | 0.02 | |
| | | | | | | |
| For the year ended December 31, 2019 | | | | | | | |
| Sales | $ | 207,948 | | | $ | 214,095 | | | $ | 205,968 | | | $ | 198,313 | |
| Gross profit | 34,986 | | | 44,375 | | | 38,892 | | | 37,951 | |
| | | | | | | |
| Income (loss) from continuing operations, net of tax | 22,548 | | | 19,871 | | | 15,052 | | | 990 | |
| Income (loss) from discontinued operations, net of tax | (2,763) | | | (5,394) | | | 2,081 | | | (4,126) | |
| Net income | $ | 19,785 | | | $ | 14,477 | | | $ | 17,133 | | | $ | (3,136) | |
| | | | | | | |
| Earnings per share: | | | | | | | |
| Basic: | | | | | | | |
| Continuing operations | $ | 0.68 | | | $ | 0.60 | | | $ | 0.45 | | | $ | 0.03 | |
| Discontinued operations | (0.08) | | | (0.16) | | | 0.06 | | | (0.12) | |
| Basic | $ | 0.60 | | | $ | 0.44 | | | $ | 0.51 | | | $ | (0.09) | |
| | | | | | | |
| Diluted: | | | | | | | |
| Continuing operations | $ | 0.68 | | | $ | 0.60 | | | $ | 0.45 | | | $ | 0.03 | |
| Discontinued operations | (0.08) | | | (0.16) | | | 0.06 | | | (0.12) | |
| Diluted | $ | 0.60 | | | $ | 0.44 | | | $ | 0.51 | | | $ | (0.09) | |
Dueconsidered to rounding, the sum of quarterly amounts presented in the table above may not add up precisely to the corresponding full year amounts.be material.
Item 16. FORM 10-K SUMMARY
Not Applicable.
EXHIBIT INDEX
| | | | | |
| 2.1 | Stock Purchase and Sale Agreement, dated as of FebruarySeptember 1, 2017,2023, by and among Futura IndustriesPackfilm US LLC, Film Trading Importacao e Representacao Ltda., Terphane LLC, Terphane Limitada, Tredegar Film Products (Latin America), Inc., Terphane Acquisition Corporation FuturaII, TAC Holdings, LLC, Tredegar Investments LLC, Tredegar Corporation Susan D. Johnson, The Susan D. Johnson Trust, Ken Wells, The William L. Bonnell Company, Inc., and in his capacity as Sellers’ Representative, Brent F. LloydOben Holding Group S.A.C. (filed as Exhibit 2.1 toof Tredegar’s Current Report on Form 8-K (File No. 1-10258), filed on February 2, 2017, and incorporated herein by reference) |
2.2 | Amended and Restated Purchase and Sale Agreement, dated as of October 30, 2020, by and among Fitesa Nao Tecidos S.A., Fitesa US LLC, Miramar Participações Ltda, Tredegar Corporation, Tredegar Far East Corporation, Tredegar Film Products (Latin America), Inc., Tredegar Investments, LLC and Fitesa S.A. (filed as Exhibit 2.1 to Tredegar’s Current Report on Form 8-K (File No. 1-10258), filed on November 3, 2020,September 5, 2023, and incorporated herein by reference). |
| 3.1 | |
| 3.1.1 | |
| 3.1.2 | |
| 3.1.3 | |
| 3.2 | |
| 3.3 | |
| 4.1 | |
| 10.1 | Second Amended and Restated Credit Agreement, dated as of June 28, 2019,29, 2022, among Tredegar, as borrower, the lenders named therein, JPMorgan Chase Bank N.A., as administrative agent, SunTrust Bank, Citizens Bank N.A.N.A and PNC Bank, National Association, as co-syndication agents, and Bank of America, N.A., U.S. Bank National Association Bank of America, N.A. and Wells Fargo Bank, National Association, as co-documentation agents, and the other lenders party thereto (filed as Exhibit 4.1 to Tredegar’sTredegar's Current Report on Form 8-K (File No. 1-10258), filed on July 1, 2019,June 30, 2022, and incorporated herein by reference) |
| 10.1.1 | Second Amended and Restated Guaranty, dated as of June 28, 2019,29, 2022, by and among the subsidiaries of Tredegar listed on the signature pages thereto in favor of JPMorgan Chase Bank, N.A., as administrative agent, for the ratable benefit of the Holders of Guaranteed Obligations (as defined therein) (filed(filed as Exhibit 4.2 to Tredegar’sTredegar's Current Report on Form 8-K (File No. 1-10258), filed on July 1, 2019,June 30, 2022, and incorporated herein by reference) |
| 10.1.2 | Second Amended and Restated Pledge and Security Agreement, dated as of June 28, 2019,29, 2022, by and among Tredegar and the subsidiaries of Tredegar listed on the signature pages thereto and JPMorgan Chase Bank, N.A., as administrative agent, for the ratable benefit of the Secured Parties (as defined therein) (filed as Exhibit 4.3 to Tredegar’sTredegar's Current Report on Form 8-K (File No. 1-10258), filed on July 1, 2019,June 30, 2022, and incorporated herein by reference) |
| 10.1.3 | Amendment No. 1 to theSecond Amended and Restated Credit Agreement, dated as of December 1, 2020,November 29, 2022, among Tredegar Corporation, as borrower, the lenders named therein, JPMorgan Chase Bank, N.A., as administrative agent, Truist Bank, Citizens Bank, N.A. and PNC Bank, National Association, as co-syndication agents, and Bank of America, N.A., U.S. Bank National Association Bank of America, N.A. and Wells Fargo Bank, National Association, as co-documentation agents, and the other lenders party thereto (filed as Exhibit 10.1 of Tredegar's Second Quarter 2023 Form 10-Q (File No. 1-10258), filed on August 9, 2023, and incorporated herein by reference). |
| 10.1.4 | Amendment No. 2 to Second Amended and Restated Credit Agreement, dated as of August 3, 2023, among Tredegar Corporation, as borrower, the lenders named therein, JPMorgan Chase Bank, N.A., as administrative agent, Citizens Bank, N.A. and PNC Bank, National Association, as co-syndication agents, and Bank of America, N.A., U.S. Bank National Association and Wells Fargo Bank, National Association, as co-documentation agents, and the other lenders party thereto (filed as Exhibit 10.2 of Tredegar's Second Quarter 2023 Form 10-Q (File No. 1-10258), filed on August 9, 2023, and incorporated herein by reference). |
| 10.1.5 | Amendment No. 3, dated December 27, 2023, to the Second Amended and Restated Credit Agreement, dated June 29, 2022, by and among Tredegar Corporation, as borrower, certain of Tredegar Corporation’s material domestic subsidiaries, as guarantors, the lenders named therein, JPMorgan Chase Bank, N.A., as administrative agent, Citizens Bank, N.A. and PNC Bank, National Association, as co-syndication agents, and Bank of America, N.A., U.S. Bank National Association and Wells Fargo Bank, National Association, as co-documentation agents (filed as Exhibit 4.1 to Tredegar’s Current Report on Form 8-K (File No. 1-10258), filed on December 28, 2023, and incorporated herein by reference). |
| 10.1.6 | Third Amended and Restated Pledge and Security Agreement, dated as of December 27, 2023, by and among Tredegar Corporation and the subsidiaries of Tredegar Corporation listed on the signature pages thereto and JPMorgan Chase Bank, N.A., as administrative agent, for the ratable benefit of the Secured Parties (as defined therein)(filed as Exhibit 4.1 to Tredegar’s Current Report on Form 8-K (File No. 1-10258), filedfiled on December 3, 2020,28, 2023, and incorporated herein by reference). |
| | | | | |
| *10.6.1 | |
| *10.7 | |
| *10.7.1 | |
| *10.8 | |
| *10.9 | |
| *10.10 | |
| *10.11 | |
| *10.12 | |
| *10.13 | |
| *10.14 | |
| *10.15 | |
| *10.16 | |
| *10.17 | |
| *10.18 | |
| 10.19 | |
| +21 | |
| +23 | |
| +31.1 | |
| | | | | |
| +31.2 | |
| +32.1 | |
| +32.2 | |
| +97 | |
| +101 | XBRL Instance Document and Related Items |
| +104 | Cover Page Interactive Data File (formatted in iXBRL and contained in Exhibit 101) |
| | | | | |
| * | Denotes compensatory plans or arrangements or management contracts. |
SIGNATURES
Pursuant to the requirements of Section 13 or 15(d) of the Securities Exchange Act of 1934, the registrant has duly caused this report to be signed on its behalf by the undersigned, thereunto duly authorized.
| | | | | | | | | | | | | | |
| | TREDEGAR CORPORATION
(Registrant) |
| | | | |
| Dated: | March 16, 202115, 2024 | By | | /s/ John M. Steitz |
| | | | John M. Steitz |
| | | | President and Chief Executive Officer |
Pursuant to the requirements of the Securities Exchange Act of 1934, this report has been signed below by the following persons on behalf of the registrant and in the capacities indicated on March 16, 2021.15, 2024.
| | | | | | | | | | | |
| Signature | | Title |
| | | |
| /s/ | John M. Steitz | | President, Chief Executive Officer and Director |
| (John M. Steitz) | | (Principal Executive Officer) |
| | | |
| /s/ | D. Andrew Edwards | | Executive Vice President and Chief Financial Officer |
| (D. Andrew Edwards) | | (Principal Financial Officer) |
| | | |
| /s/ | Frasier W. Brickhouse, II | | Corporate Treasurer and Controller |
| (Frasier W. Brickhouse, II) | | (Principal Accounting Officer) |
| | | |
| /s/ | John D. GottwaldGregory A. Pratt | | Chairman of the Board of Directors |
| (John D. Gottwald) | | |
| | | |
/s/ | Gregory A. Pratt | | Lead Director |
| (Gregory A. Pratt) | | |
| | | |
| /s/ | George C. Freeman, III | | Director |
| (George C. Freeman, III) | | |
| | | |
/s/ | William M. Gottwald | | Director |
| (William M. Gottwald) | | |
| | | |
| /s/ | Kenneth R. Newsome | | Director |
| (Kenneth R. Newsome) | | |
| | | |
| /s/ | Thomas G. Snead, Jr. | | Director |
| (Thomas G. Snead, Jr.) | | |
| | | |
| /s/ | Carl E. Tack, III | | Director |
| (Carl E. Tack, III) | | |
| | | |
/s/ | Anne G. Waleski | | Director |
| (Anne G. Waleski) | | |