
| Delaware | 51-0002090 | |
| (State or other jurisdiction of incorporation or organization) | (I.R.S. Employer Identification Number) |
| Securities registered pursuant to Section 12(b) of the Act: | ||
| Title of each class | Trading Symbol (s) | Name of each exchange on which registered |
| Common Stock | ARTNA | The Nasdaq Stock Market |
| □ | Yes | ☑ | No |
| □ | Yes | ☑ | No |
| ☑ | Yes | □ | No |
| ☑ | Yes | □ | No |
Large Accelerated Filer □ | Accelerated Filer □ | Non-Accelerated Filer ☑ | Smaller Reporting Company ☑ |
Emerging Growth Company ☐ | |||
| - | general economic, employment and business conditions; |
| - | material costs and availability; |
| - | consumer and producer price inflation; |
| - | the impact of recent acquisitions on our ability to expand and foster relationships; |
| - | strategic plans for goals, priorities, growth and expansion; |
| - | expectations for our water and wastewater subsidiaries and non-utility subsidiaries; |
| - | customer base growth opportunities in Delaware and Cecil County, Maryland; |
| - | our belief regarding our capacity to provide water services for the foreseeable future to our customers; |
| - | our belief relating to our compliance and the cost to achieve compliance with relevant governmental regulations; |
| - | our expectation of the timing of decisions by regulatory authorities; |
| - | the impact of weather and climate change on our operations; |
| - | the execution of our strategic initiatives; |
| - | our expectation regarding the timing for construction on new projects; |
| - | the adoption of recent accounting pronouncements from time to |
| - | contract operations opportunities; |
| - | legal proceedings; |
| - | our properties; |
| - | deferred tax assets; |
| - | the adequacy of our available sources of financing; |
| - | the expected recovery of expenses related to our long-term debt; |
| - | our expectation to be in compliance with financial covenants in our debt instruments; |
| - | our ability to refinance our debt as it comes due; |
| - | our ability to adjust our debt level, interest rate, maturity schedule and structure; |
| - | the timing and terms of renewals of our lines of credit; |
| - | changes in interest rates; |
| - | plans to increase our wastewater treatment operations, engineering services and other revenue streams less affected by weather; |
| - | expected future contributions to our postretirement benefit plan; |
| - | anticipated growth in our non-utility subsidiaries; |
| - | anticipated investments in certain of our facilities and systems and the sources of funding for such investments; |
| - | sufficiency of internally generated funds and credit facilities to provide working capital and our liquidity needs; and |
| - | the specific and overall impacts of |
| - | changes in |
| - | changes in our contractual obligations; |
| - | ability to sufficiently control certain operating expenses which are necessary to provide public utility services; |
| - | changes in government policies; |
| - | timely availability of materials and supplies for essential infrastructure projects and operations; |
| - | the timing and results of our rate requests; |
| - | failure to receive regulatory approvals; |
| - | cyber-attacks; |
| - | changes in economic and market conditions generally; |
| - | effectiveness of internal control over financial reporting; |
| - | unexpected events, restrictions and policies related to a public health |
| - | other matters discussed elsewhere in this Annual Report on Form 10-K. |
| - | a signed service agreement with the developer of a proposed subdivision or development, which subdivision or development has been duly approved by the respective county government; |
| - | a petition requesting such service signed by a majority of the landowners of the proposed territory to be served; or |
| - | a duly certified copy of a resolution from the governing body of a county or municipality requesting the applicant to provide service to the proposed territory to be served. |
| - | Dilutive issuance of our equity securities; |
| - | Incurrence of debt and contingent liabilities; |
| - | Difficulties in integrating the operations and personnel of the acquired |
| - | Diversion of our management’s attention from ongoing business concerns; |
| - | Failure to have effective internal control over financial reporting; |
| - | Overload of human capital resources; and |
| - | Other acquisition-related expense. |
| ITEM 1B. | UNRESOLVED STAFF COMMENTS |
| ITEM 2. | PROPERTIES |
Utility plant comprises: | ||||||||||||||||
| In thousands | ||||||||||||||||
Estimated Useful Life (In Years) | December 31, 2022 | Estimated Useful Life (In Years) | December 31, 2023 | |||||||||||||
| Utility plant at original cost | ||||||||||||||||
| Utility plant in service-Water | ||||||||||||||||
| Intangible plant | --- | $ | 140 | --- | $ | 140 | ||||||||||
| Source of supply plant | 45-85 | 25,223 | 45-85 | 29,960 | ||||||||||||
| Pumping and water treatment plant | 8-62 | 116,915 | 8-62 | 130,337 | ||||||||||||
| Transmission and distribution plant | ||||||||||||||||
| Mains | 81 | 338,368 | 81 | 370,977 | ||||||||||||
| Services | 39 | 56,396 | 39 | 60,818 | ||||||||||||
| Storage tanks | 76 | 34,567 | 76 | 40,933 | ||||||||||||
| Meters | 26 | 29,720 | 26 | 30,318 | ||||||||||||
| Hydrants | 60 | 17,751 | 60 | 18,980 | ||||||||||||
| General plant | 5-31 | 65,632 | 5-31 | 67,317 | ||||||||||||
| Utility plant in service-Wastewater | ||||||||||||||||
| Intangible plant | --- | 117 | --- | 116 | ||||||||||||
| Treatment and disposal plant | 21-81 | 66,420 | 21-81 | 67,789 | ||||||||||||
| Collection mains and lift stations | 81 | 49,189 | 81 | 51,539 | ||||||||||||
| General plant | 5-31 | 1,845 | 5-31 | 2,478 | ||||||||||||
| Property held for future use | --- | 4,489 | --- | 4,028 | ||||||||||||
| Construction work in progress | --- | 34,213 | --- | 23,724 | ||||||||||||
| 840,985 | 899,454 | |||||||||||||||
| Less – accumulated depreciation | 172,954 | 185,170 | ||||||||||||||
| $ | 668,031 | $ | 714,284 | |||||||||||||
| ITEM 4. | MINE SAFETY DISCLOSURES |
| ITEM 5. | MARKET FOR REGISTRANT’S COMMON EQUITY, RELATED STOCKHOLDER MATTERS AND ISSUER PURCHASES OF EQUITY SECURITIES |
| Stock Price | Stock Price | |||||||||||||
| High | Low | |||||||||||||
| 2023 | ||||||||||||||
| First Quarter | $ | 63.00 | $ | 51.30 | ||||||||||
| Second Quarter | $ | 58.41 | $ | 46.37 | ||||||||||
| Third Quarter | $ | 49.73 | $ | 41.26 | ||||||||||
| Fourth Quarter | $ | 44.78 | $ | 38.76 | ||||||||||
| High | Low | |||||||||||||
| 2022 | ||||||||||||||
| First Quarter | $ | 50.88 | $ | 43.02 | $ | 50.88 | $ | 43.02 | ||||||
| Second Quarter | $ | 50.00 | $ | 44.08 | $ | 50.00 | $ | 44.08 | ||||||
| Third Quarter | $ | 60.36 | $ | 47.96 | $ | 60.36 | $ | 47.96 | ||||||
| Fourth Quarter | $ | 59.98 | $ | 45.44 | $ | 59.98 | $ | 45.44 | ||||||
| 2021 | ||||||||||||||
| First Quarter | $ | 42.70 | $ | 36.68 | ||||||||||
| Second Quarter | $ | 42.10 | $ | 35.90 | ||||||||||
| Third Quarter | $ | 40.44 | $ | 36.55 | ||||||||||
| Fourth Quarter | $ | 47.99 | $ | 37.60 | ||||||||||
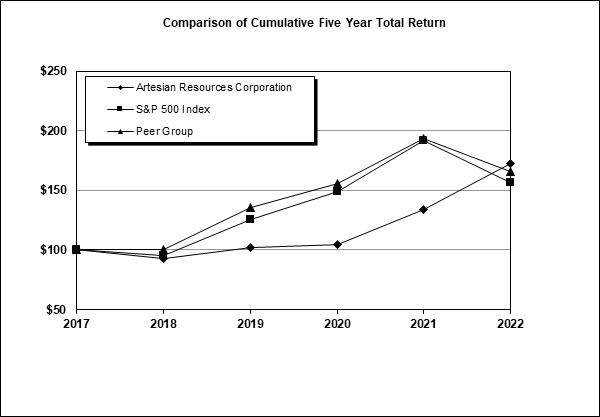

| INDEXED RETURNS | INDEXED RETURNS | |||||||||||||||||||||||
| Base Period | Years Ending December 31 | Base Period | Years Ending December 31 | |||||||||||||||||||||
| Company Name / Index | 2017 | 2018 | 2019 | 2020 | 2021 | 2022 | 2018 | 2019 | 2020 | 2021 | 2022 | 2023 | ||||||||||||
| Artesian Resources Corporation | 100 | 92.81 | 101.77 | 104.28 | 133.71 | 172.88 | 100 | 109.66 | 112.37 | 144.07 | 186.27 | 134.81 | ||||||||||||
| S&P 500 Index | 100 | 95.62 | 125.72 | 148.85 | 191.58 | 156.88 | 100 | 131.49 | 155.68 | 200.37 | 164.08 | 207.21 | ||||||||||||
| Peer Group | 100 | 100.28 | 135.27 | 156.00 | 193.40 | 165.56 | 100 | 134.89 | 155.56 | 192.86 | 165.11 | 141.97 | ||||||||||||
| ITEM 6. | RESERVED |
| ITEM 7. | MANAGEMENT'S DISCUSSION AND ANALYSIS OF FINANCIAL CONDITION AND RESULTS OF OPERATIONS |
| Percentage of Operating Revenues | ||||||||||||
| 2023 | 2022 | 2021 | ||||||||||
| Water Sales | ||||||||||||
| Residential | 50.1 | % | 48.7 | % | 53.0 | % | ||||||
| Commercial | 17.9 | 17.6 | 19.4 | |||||||||
| Industrial | 0.1 | 0.1 | 0.1 | |||||||||
| Government and Other | 12.9 | 12.8 | 13.2 | |||||||||
| Other utility operating revenues | 12.3 | 11.6 | 7.9 | |||||||||
| Non-utility operating revenues | 6.7 | 9.2 | 6.4 | |||||||||
| Total | 100.0 | % | 100.0 | % | 100.0 | % | ||||||
| Percentage of Operating Revenues | ||||||||||||
| 2022 | 2021 | 2020 | ||||||||||
| Water Sales | ||||||||||||
| Residential | 48.7 | % | 53.0 | % | 53.8 | % | ||||||
| Commercial | 17.6 | 19.4 | 19.5 | |||||||||
| Industrial | 0.1 | 0.1 | 0.1 | |||||||||
| Government and Other | 12.8 | 13.2 | 13.4 | |||||||||
| Other utility operating revenues | 11.6 | 7.9 | 7.4 | |||||||||
| Non-utility operating revenues | 9.2 | 6.4 | 5.8 | |||||||||
| Total | 100.0 | % | 100.0 | % | 100.0 | % | ||||||
| — | Payroll and employee benefit costs increased |
| — | Administrative costs increased $0.7 million, primarily due to increases in computer system maintenance costs, and customer billing costs. |
| — | Supply and treatment costs increased |
| — | Transmission, distribution and collection costs increased $0.3 million, primarily associated with tank painting costs and maintenance and repair of transmission mains. |
| — | Purchased power costs increased |
| — | Purchased water costs decreased |
| Percentage of Operating and Maintenance Expenses | Percentage of Operating and Maintenance Expenses | Percentage of Operating and Maintenance Expenses | ||||||||||||||||||||||
| 2022 | 2021 | 2020 | 2023 | 2022 | 2021 | |||||||||||||||||||
| Payroll and Associated Expenses | 48.1 | % | 49.9 | % | 51.0 | % | 49.5 | % | 47.5 | % | 49.2 | % | ||||||||||||
| Administrative | 13.2 | 12.3 | 14.1 | 16.9 | 15.3 | 15.7 | ||||||||||||||||||
| Supply and Treatment | 11.9 | 10.8 | 9.4 | |||||||||||||||||||||
| Purchased Power | 5.7 | 5.2 | 4.8 | |||||||||||||||||||||
| Transmission, Distribution and Collection | 4.6 | 4.1 | 2.7 | |||||||||||||||||||||
| Purchased Water | 3.6 | 9.5 | 9.9 | 2.7 | 3.6 | 9.5 | ||||||||||||||||||
| Repair and Maintenance | 11.1 | 10.2 | 8.3 | |||||||||||||||||||||
| Purchased Power | 5.7 | 5.4 | 5.5 | |||||||||||||||||||||
| Water Treatment | 4.8 | 4.0 | 3.7 | |||||||||||||||||||||
| Non-utility Operating | 13.5 | 8.7 | 7.5 | 8.7 | 13.5 | 8.7 | ||||||||||||||||||
| Total | 100.0 | % | 100.0 | % | 100.0 | % | 100.0 | % | 100.0 | % | 100.0 | % | ||||||||||||
| In thousands | 2022 | 2021 | 2020 | 2023 | 2022 | 2021 | ||||||||||||||||||
| Source of supply, treatment and pumping | $ | 14,158 | $ | 9,681 | $ | 14,999 | $ | 20,327 | $ | 14,158 | $ | 9,681 | ||||||||||||
| Transmission and distribution | 17,712 | 20,951 | 15,993 | 26,886 | 17,712 | 20,951 | ||||||||||||||||||
| General plant and equipment | 3,856 | 1,739 | 3,089 | |||||||||||||||||||||
| General plant | 4,553 | 3,856 | 1,739 | |||||||||||||||||||||
| Developer financed utility plant | 8,038 | 6,866 | 4,132 | 8,301 | 8,038 | 6,866 | ||||||||||||||||||
| Wastewater facilities | 5,613 | 2,133 | 2,586 | 3,353 | 5,613 | 2,133 | ||||||||||||||||||
| Allowance for Funds Used During Construction, AFUDC | (894 | ) | (556 | ) | (781 | ) | ||||||||||||||||||
| Allowance for Funds Used During Construction, AFUDC, equity portion | (1,243 | ) | (894 | ) | (556 | ) | ||||||||||||||||||
| Total | $ | 48,483 | $ | 40,814 | $ | 40,018 | $ | 62,177 | $ | 48,483 | $ | 40,814 | ||||||||||||
| Material Cash Requirements | Payments Due by Period | |||||||||||||||||||
| In thousands | Less than 1 Year | 1-3 Years | 4-5 Years | After 5 Years | Total | |||||||||||||||
| First mortgage bonds (principal and interest) | $ | 7,902 | $ | 15,714 | $ | 40,610 | $ | 204,564 | $ | 268,790 | ||||||||||
| State revolving fund loans (principal and interest) | 979 | 2,147 | 2,068 | 10,287 | 15,481 | |||||||||||||||
| Promissory note (principal and interest) | 1,200 | 1,923 | 1,924 | 9,652 | 14,699 | |||||||||||||||
| Asset purchase contractual obligation (principal and interest) | 339 | 659 | 320 | --- | 1,318 | |||||||||||||||
| Lines of credit | --- | --- | --- | --- | --- | |||||||||||||||
| Operating leases | 35 | 70 | 64 | 1,429 | 1,598 | |||||||||||||||
| Operating agreements | 76 | 112 | 109 | 749 | 1,046 | |||||||||||||||
| Unconditional purchase obligations | 870 | 1,762 | 114 | 312 | 3,058 | |||||||||||||||
| Tank painting contractual obligation | 626 | 313 | --- | --- | 939 | |||||||||||||||
| Total contractual cash obligations | $ | 12,027 | $ | 22,700 | $ | 45,209 | $ | 226,993 | $ | 306,929 | ||||||||||
| Material Cash Requirements | Payments Due by Period | |||||||||||||||||||
| In thousands | Less than 1 Year | 1-3 Years | 4-5 Years | After 5 Years | Total | |||||||||||||||
| First mortgage bonds (principal and interest) | $ | 7,924 | $ | 15,773 | $ | 15,659 | $ | 237,358 | $ | 276,714 | ||||||||||
| State revolving fund loans (principal and interest) | 937 | 1,699 | 1,463 | 6,364 | 10,463 | |||||||||||||||
| Promissory note (principal and interest) | 961 | 1,921 | 1,924 | 10,613 | 15,419 | |||||||||||||||
| Asset purchase contractual obligation (principal and interest) | 345 | 672 | 647 | --- | 1,664 | |||||||||||||||
| Lines of credit | 20,174 | --- | --- | --- | 20,174 | |||||||||||||||
| Operating leases | 25 | 51 | 52 | 1,406 | 1,534 | |||||||||||||||
| Operating agreements | 60 | 79 | 84 | 782 | 1,005 | |||||||||||||||
| Unconditional purchase obligations | 809 | 1,568 | 770 | --- | 3,147 | |||||||||||||||
| Tank painting contractual obligation | 626 | 939 | --- | --- | 1,565 | |||||||||||||||
| Total contractual cash obligations | $ | 31,861 | $ | 22,702 | $ | 20,599 | $ | 256,523 | $ | 331,685 | ||||||||||
| ITEM 7A. | QUANTITATIVE AND QUALITATIVE DISCLOSURE ABOUT MARKET RISK |
| ITEM 8. | FINANCIAL STATEMENTS AND SUPPLEMENTARY DATA |
| For the Year Ended | For the Year Ended | |||||||||||||||
| ASSETS | December 31, 2022 | December 31, 2021 | December 31, 2023 | December 31, 2022 | ||||||||||||
| Utility plant, at original cost less accumulated depreciation | $ | 668,031 | $ | 590,431 | $ | 714,284 | $ | 668,031 | ||||||||
| Current assets | ||||||||||||||||
| Cash and cash equivalents | 1,309 | 92 | 2,505 | 1,309 | ||||||||||||
Accounts receivable (less allowance for doubtful accounts 2022 - $416; 2021-$429) | 13,511 | 8,367 | ||||||||||||||
Accounts and other receivables (less provision for expected credit loss 2023 - $328; 2022 - $416) | 12,830 | 13,511 | ||||||||||||||
| Income tax receivable | 1,632 | 2,234 | 1,799 | 1,632 | ||||||||||||
| Unbilled operating revenues | 1,586 | 1,080 | 1,934 | 1,586 | ||||||||||||
| Materials and supplies | 4,702 | 1,933 | 5,983 | 4,702 | ||||||||||||
| Prepaid property taxes | 2,186 | 2,306 | 2,269 | 2,186 | ||||||||||||
| Prepaid expenses and other | 2,878 | 2,652 | 3,297 | 2,878 | ||||||||||||
| Total current assets | 27,804 | 18,664 | 30,617 | 27,804 | ||||||||||||
| Other assets | ||||||||||||||||
Non-utility property (less accumulated depreciation 2022-$990; 2021-$919) | 3,740 | 3,751 | ||||||||||||||
Non-utility property (less accumulated depreciation 2023 - $1,052; 2022 - $990) | 3,693 | 3,740 | ||||||||||||||
| Other deferred assets | 10,536 | 5,097 | 8,504 | 10,536 | ||||||||||||
| Goodwill | 1,939 | — | 1,939 | 1,939 | ||||||||||||
| Operating lease right of use assets | 467 | 451 | 506 | 467 | ||||||||||||
| Total other assets | 16,682 | 9,299 | 14,642 | 16,682 | ||||||||||||
| Regulatory assets, net | 7,274 | 6,321 | 7,289 | 7,274 | ||||||||||||
| Total Assets | $ | 719,791 | $ | 624,715 | $ | 766,832 | $ | 719,791 | ||||||||
| LIABILITIES AND STOCKHOLDERS’ EQUITY | ||||||||||||||||
| Stockholders’ equity | ||||||||||||||||
| Common stock | $ | 9,503 | $ | 9,414 | $ | 10,285 | $ | 9,502 | ||||||||
| Preferred stock | — | — | — | — | ||||||||||||
| Additional paid-in capital | 107,142 | 104,989 | 143,369 | 107,142 | ||||||||||||
| Retained earnings | 71,286 | 63,607 | 76,743 | 71,286 | ||||||||||||
| Total stockholders’ equity | 187,931 | 178,010 | 230,397 | 187,930 | ||||||||||||
| Long-term debt, net of current portion | 175,619 | 143,259 | 178,307 | 175,619 | ||||||||||||
| 363,550 | 321,269 | 408,704 | 363,549 | |||||||||||||
| Current liabilities | ||||||||||||||||
| Lines of credit | 20,174 | 26,703 | — | 20,174 | ||||||||||||
| Current portion of long-term debt | 2,003 | 1,591 | 2,235 | 2,003 | ||||||||||||
| Accounts payable | 10,929 | 10,206 | 9,697 | 10,929 | ||||||||||||
| Accrued expenses | 4,246 | 4,038 | 3,519 | 4,246 | ||||||||||||
| Overdraft payable | 43 | 30 | 9 | 43 | ||||||||||||
| Accrued interest | 989 | 917 | 2,275 | 989 | ||||||||||||
| Income taxes payable | 6 | — | 2 | 6 | ||||||||||||
| Customer and other deposits | 2,489 | 2,273 | 2,983 | 2,489 | ||||||||||||
| Other | 3,190 | 1,448 | 1,694 | 3,191 | ||||||||||||
| Total current liabilities | $ | 44,069 | $ | 47,206 | $ | 22,414 | $ | 44,070 | ||||||||
| Commitments and contingencies (Note 11) | — | — | — | — | ||||||||||||
| Deferred credits and other liabilities | ||||||||||||||||
| Net advances for construction | $ | 3,686 | $ | 4,295 | $ | 2,797 | $ | 3,686 | ||||||||
| Operating lease liabilities | 466 | 440 | 503 | 466 | ||||||||||||
| Regulatory liabilities | 28,721 | 21,260 | 25,676 | 28,721 | ||||||||||||
| Deferred investment tax credits | 439 | 456 | 423 | 439 | ||||||||||||
| Deferred income taxes | 54,552 | 53,133 | 58,381 | 54,552 | ||||||||||||
| Total deferred credits and other liabilities | $ | 87,864 | $ | 79,584 | $ | 87,780 | $ | 87,864 | ||||||||
| Net contributions in aid of construction | 224,308 | 176,656 | 247,934 | 224,308 | ||||||||||||
| Total Liabilities and Stockholders’ Equity | $ | 719,791 | $ | 624,715 | $ | 766,832 | $ | 719,791 | ||||||||
| For the Year Ended December 31, | For the Year Ended December 31, | |||||||||||||||||||||||
| 2022 | 2021 | 2020 | 2023 | 2022 | 2021 | |||||||||||||||||||
| Operating revenues | ||||||||||||||||||||||||
| Water sales | $ | 78,318 | $ | 77,821 | $ | 76,476 | $ | 80,033 | $ | 78,318 | $ | 77,821 | ||||||||||||
| Other utility operating revenue | 11,506 | 7,195 | 6,525 | 12,195 | 11,506 | 7,195 | ||||||||||||||||||
| Non-utility operating revenue | 9,073 | 5,843 | 5,140 | 6,633 | 9,073 | 5,843 | ||||||||||||||||||
| Total Operating Revenues | 98,897 | 90,859 | 88,141 | 98,861 | 98,897 | 90,859 | ||||||||||||||||||
| Operating expenses | ||||||||||||||||||||||||
| Utility operating expenses | 43,772 | 41,414 | 40,338 | 46,205 | 43,772 | 41,414 | ||||||||||||||||||
| Non-utility operating expenses | 6,850 | 3,942 | 3,277 | 4,428 | 6,850 | 3,942 | ||||||||||||||||||
| Depreciation and amortization | 12,620 | 11,885 | 11,143 | 13,335 | 12,620 | 11,885 | ||||||||||||||||||
| Taxes | ||||||||||||||||||||||||
| State and federal income tax expense (benefit) | ||||||||||||||||||||||||
| Current | 4,285 | 3,360 | 8,073 | 2,962 | 4,285 | 3,360 | ||||||||||||||||||
| Deferred | 1,593 | 2,377 | (2,389 | ) | 3,386 | 1,593 | 2,377 | |||||||||||||||||
| Property and other taxes | 5,871 | 5,587 | 5,404 | 6,099 | 5,871 | 5,587 | ||||||||||||||||||
| Total Operating Expenses | 74,991 | 68,565 | 65,846 | 76,415 | 74,991 | 68,565 | ||||||||||||||||||
| Operating income | 23,906 | 22,294 | 22,295 | 22,446 | 23,906 | 22,294 | ||||||||||||||||||
| Other income, net | ||||||||||||||||||||||||
| Allowance for funds used during construction (AFUDC) | 1,329 | 823 | 1,170 | 2,002 | 1,329 | 823 | ||||||||||||||||||
| Miscellaneous | 1,265 | 1,302 | 971 | 1,407 | 1,265 | 1,302 | ||||||||||||||||||
| 2,594 | 2,125 | 2,141 | 3,409 | 2,594 | 2,125 | |||||||||||||||||||
| Income before interest charges | 26,500 | 24,419 | 24,436 | 25,855 | 26,500 | 24,419 | ||||||||||||||||||
| Interest charges | 8,502 | 7,592 | 7,619 | 9,156 | 8,502 | 7,592 | ||||||||||||||||||
| Net income applicable to common stock | $ | 17,998 | $ | 16,827 | $ | 16,817 | $ | 16,699 | $ | 17,998 | $ | 16,827 | ||||||||||||
| Income per common share: | ||||||||||||||||||||||||
| Net income per common share: | ||||||||||||||||||||||||
| Basic | $ | 1.90 | $ | 1.79 | $ | 1.80 | $ | 1.67 | $ | 1.90 | $ | 1.79 | ||||||||||||
| Diluted | $ | 1.90 | $ | 1.79 | $ | 1.79 | $ | 1.67 | $ | 1.90 | $ | 1.79 | ||||||||||||
| Weighted average common shares outstanding: | ||||||||||||||||||||||||
| Basic | 9,462 | 9,394 | 9,327 | 10,018 | 9,462 | 9,394 | ||||||||||||||||||
| Diluted | 9,481 | 9,426 | 9,369 | 10,022 | 9,481 | 9,426 | ||||||||||||||||||
| Cash dividends per share of common stock | $ | 1.09 | $ | 1.05 | $ | 1.01 | $ | 1.14 | $ | 1.09 | $ | 1.05 | ||||||||||||
| For the Year Ended December 31, | For the Year Ended December 31, | |||||||||||||||||||||||
| 2022 | 2021 | 2020 | 2023 | 2022 | 2021 | |||||||||||||||||||
| CASH FLOWS FROM OPERATING ACTIVITIES | ||||||||||||||||||||||||
| Net income | $ | 17,998 | $ | 16,827 | $ | 16,817 | $ | 16,699 | $ | 17,998 | $ | 16,827 | ||||||||||||
| Adjustments to reconcile net income to net cash provided by operating activities: | ||||||||||||||||||||||||
| Adjustments to reconcile net income to net cash provided by (used in) operating activities: | ||||||||||||||||||||||||
| Depreciation and amortization | 12,620 | 11,885 | 11,143 | 13,335 | 12,620 | 11,885 | ||||||||||||||||||
| Amortization of debt expense | 355 | 354 | 351 | |||||||||||||||||||||
| Provision for bad debt expense | 92 | 68 | (224 | ) | ||||||||||||||||||||
| Deferred income taxes, net | 2,282 | 2,803 | (1,963 | ) | 3,813 | 2,282 | 2,803 | |||||||||||||||||
| Stock compensation | 152 | 193 | 178 | 254 | 152 | 193 | ||||||||||||||||||
| AFUDC, equity portion | (894 | ) | (556 | ) | (781 | ) | (1,243 | ) | (894 | ) | (556 | ) | ||||||||||||
| Changes in assets and liabilities, net of acquisitions: | ||||||||||||||||||||||||
| Accounts receivable, net of allowance for doubtful accounts | (3,779 | ) | 94 | (2,324 | ) | |||||||||||||||||||
| Accounts and other receivables | 807 | (3,847 | ) | 318 | ||||||||||||||||||||
| Income tax receivable | 602 | (1,605 | ) | (610 | ) | (167 | ) | 602 | (1,605 | ) | ||||||||||||||
| Unbilled operating revenues | (141 | ) | 86 | 45 | (348 | ) | (141 | ) | 86 | |||||||||||||||
| Materials and supplies | (2,769 | ) | (398 | ) | (271 | ) | (1,281 | ) | (2,769 | ) | (398 | ) | ||||||||||||
| Income taxes payable | 6 | (28 | ) | (106 | ) | (4 | ) | 6 | (28 | ) | ||||||||||||||
| Prepaid property taxes | 697 | (415 | ) | 63 | (83 | ) | 697 | (415 | ) | |||||||||||||||
| Prepaid expenses and other | (216 | ) | (444 | ) | 42 | (419 | ) | (216 | ) | (444 | ) | |||||||||||||
| Other deferred assets | (5,473 | ) | (445 | ) | (409 | ) | 1,998 | (5,473 | ) | (445 | ) | |||||||||||||
| Regulatory assets | 317 | 115 | 390 | (497 | ) | (37 | ) | (236 | ) | |||||||||||||||
| Regulatory liabilities | 6,799 | (535 | ) | (635 | ) | (3,168 | ) | 6,799 | (535 | ) | ||||||||||||||
| Accounts payable | (3,989 | ) | 3,547 | (1,835 | ) | 284 | (3,989 | ) | 3,547 | |||||||||||||||
| Accrued expenses | (564 | ) | (71 | ) | 301 | 614 | (564 | ) | (71 | ) | ||||||||||||||
| Accrued interest | 72 | (13 | ) | 100 | 1,286 | 72 | (13 | ) | ||||||||||||||||
| Revenue reserved for refund | — | — | — | — | — | — | ||||||||||||||||||
| Customer deposits and other | 545 | 270 | 213 | (476 | ) | 545 | 270 | |||||||||||||||||
| NET CASH PROVIDED BY OPERATING ACTIVITIES | 24,265 | 31,310 | 20,358 | 31,851 | 24,265 | 31,310 | ||||||||||||||||||
| CASH FLOWS USED IN INVESTING ACTIVITIES | ||||||||||||||||||||||||
| Capital expenditures (net of AFUDC, equity portion) | (48,483 | ) | (40,814 | ) | (34,277 | ) | (62,177 | ) | (48,483 | ) | (40,814 | ) | ||||||||||||
| Investment in acquisitions, net of cash acquired | (6,341 | ) | — | (5,741 | ) | — | (6,341 | ) | — | |||||||||||||||
| Proceeds from sale of assets | 65 | 90 | 46 | 99 | 65 | 90 | ||||||||||||||||||
| NET CASH USED IN INVESTING ACTIVITIES | (54,759 | ) | (40,724 | ) | (39,972 | ) | (62,078 | ) | (54,759 | ) | (40,724 | ) | ||||||||||||
| CASH FLOWS FROM FINANCING ACTIVITIES | ||||||||||||||||||||||||
| Net (repayments) borrowings under lines of credit agreements | (6,529 | ) | (110 | ) | 19,313 | |||||||||||||||||||
| Increase (decrease) in overdraft payable | 13 | (75 | ) | 90 | ||||||||||||||||||||
| Net advances and contributions in aid of construction | 16,431 | 15,817 | 9,280 | |||||||||||||||||||||
| Repayments under lines of credit agreements | (23,477 | ) | (41,038 | ) | (10,797 | ) | ||||||||||||||||||
| Borrowings under lines of credit agreements | 3,303 | 34,509 | 10,687 | |||||||||||||||||||||
| (Decrease) increase in overdraft payable | (34 | ) | 13 | (75 | ) | |||||||||||||||||||
| Proceeds from contributions in aid of construction and advances | 24,747 | 17,494 | 17,059 | |||||||||||||||||||||
| Payouts for contributions in aid of construction and advances | (2,228 | ) | (1,063 | ) | (1,242 | ) | ||||||||||||||||||
| Net proceeds from issuance of common stock | 2,090 | 1,390 | 1,539 | 37,073 | 2,090 | 1,390 | ||||||||||||||||||
| Equity issuance cost | (317 | ) | — | — | ||||||||||||||||||||
| Issuance of long-term debt | 31,803 | 4,126 | — | 5,608 | 31,803 | 4,126 | ||||||||||||||||||
| Dividends paid | (10,319 | ) | (9,826 | ) | (9,376 | ) | (11,242 | ) | (10,319 | ) | (9,826 | ) | ||||||||||||
| Debt issuance costs | (135 | ) | (19 | ) | (28 | ) | — | (135 | ) | (19 | ) | |||||||||||||
| Principal repayments of long-term debt | (1,643 | ) | (1,825 | ) | (1,772 | ) | (2,010 | ) | (1,643 | ) | (1,825 | ) | ||||||||||||
| NET CASH PROVIDED BY FINANCING ACTIVITIES | 31,711 | 9,478 | 19,046 | 31,423 | 31,711 | 9,478 | ||||||||||||||||||
| NET INCREASE (DECREASE) IN CASH AND CASH EQUIVALENTS | 1,217 | 64 | (568 | ) | ||||||||||||||||||||
| NET INCREASE IN CASH AND CASH EQUIVALENTS | 1,196 | 1,217 | 64 | |||||||||||||||||||||
| CASH AND CASH EQUIVALENTS AT BEGINNING OF YEAR | 92 | 28 | 596 | 1,309 | 92 | 28 | ||||||||||||||||||
| CASH AND CASH EQUIVALENTS AT END OF YEAR | $ | 1,309 | $ | 92 | $ | 28 | $ | 2,505 | $ | 1,309 | $ | 92 | ||||||||||||
| Non-cash Investing and Financing Activity: | ||||||||||||||||||||||||
| Utility plant received as construction advances and contributions in aid of construction | $ | 8,416 | $ | 3,538 | $ | 2,403 | $ | 3,492 | $ | 8,416 | $ | 3,538 | ||||||||||||
| Contractual amounts of contributions in aid of construction due from developers included in accounts receivable | $ | 726 | $ | 545 | $ | 1,705 | $ | 1,695 | $ | 726 | $ | 545 | ||||||||||||
| Contractual amounts of contributions in aid of construction received from developers previously included in accounts receivable | $ | 356 | $ | 1,749 | $ | 781 | $ | 799 | $ | 356 | $ | 1,749 | ||||||||||||
Change in amounts included in accounts payable and accrued payables related to capital expenditures | $ | 3,182 | $ | 3,763 | $ | 3,122 | $ | (3,384 | ) | $ | 3,182 | $ | 641 | |||||||||||
| Supplemental Cash Flow Information: | ||||||||||||||||||||||||
| Interest paid | $ | 8,430 | $ | 7,605 | $ | 7,519 | $ | 7,515 | $ | 8,430 | $ | 7,605 | ||||||||||||
| Income taxes paid | $ | 3,482 | $ | 5,181 | $ | 8,792 | $ | 3,590 | $ | 3,482 | $ | 5,181 | ||||||||||||
| Purchase price allocation of investment in acquisitions: | ||||||||||||||||||||||||
| Utility plant | $ | 33,345 | $ | — | $ | 5,118 | $ | — | $ | 33,345 | $ | — | ||||||||||||
| Cash | 280 | — | — | — | 280 | — | ||||||||||||||||||
| Goodwill | 1,939 | — | — | — | 1,939 | — | ||||||||||||||||||
| Other assets | 1,033 | — | 623 | — | 1,033 | — | ||||||||||||||||||
| Total assets | 36,597 | — | 5,741 | — | 36,597 | — | ||||||||||||||||||
| Less: | ||||||||||||||||||||||||
| Liabilities | 2,828 | — | — | — | 2,828 | — | ||||||||||||||||||
| Future contractual obligation payable to seller | 1,569 | — | — | — | 1,569 | — | ||||||||||||||||||
| Contributions in aid of construction | 25,579 | — | — | — | 25,597 | — | ||||||||||||||||||
| Cash paid for acquisitions | 6,621 | — | 5,741 | — | 6,621 | — | ||||||||||||||||||
| Cash received from acquisitions | 280 | — | — | — | 280 | — | ||||||||||||||||||
| Net cash paid for acquisitions | $ | 6,341 | $ | — | $ | 5,741 | ||||||||||||||||||
| Investment in acquisitions, net of cash acquired | $ | — | $ | 6,341 | $ | — | ||||||||||||||||||
Common Shares Outstanding Class A Non-Voting (1) (3) (4) | Common Shares Outstanding Class B Voting (2) | $1 Par Value Class A Non-Voting | $1 Par Value Class B Voting | Additional Paid-in Capital | Retained Earnings | Total | Common Shares Outstanding Class A Non-Voting (1) (3) (4) | Common Shares Outstanding Class B Voting (2) | $1 Par Value Class A Non-Voting | $1 Par Value Class B Voting | Additional Paid-in Capital | Retained Earnings | Total | |||||||||||||||||||||||||||||||||||||||||||
| Balance as of December 31, 2019 | 8,410 | 882 | $ | 8,410 | $ | 882 | $ | 101,811 | $ | 49,165 | $ | 160,268 | ||||||||||||||||||||||||||||||||||||||||||||
| Net income | — | — | — | — | — | 16,817 | 16,817 | |||||||||||||||||||||||||||||||||||||||||||||||||
| Cash dividends declared | ||||||||||||||||||||||||||||||||||||||||||||||||||||||||
| Common stock | — | — | — | — | — | (9,376 | ) | (9,376 | ) | |||||||||||||||||||||||||||||||||||||||||||||||
| Issuance of common stock | ||||||||||||||||||||||||||||||||||||||||||||||||||||||||
| Dividend reinvestment plan | 11 | — | 11 | — | 377 | — | 388 | |||||||||||||||||||||||||||||||||||||||||||||||||
Employee stock options and awards(4) | 42 | — | 42 | — | 832 | — | 874 | |||||||||||||||||||||||||||||||||||||||||||||||||
Employee Retirement Plan(3) | 12 | — | 12 | — | 443 | — | 455 | |||||||||||||||||||||||||||||||||||||||||||||||||
| Balance as of December 31, 2020 | 8,475 | 882 | $ | 8,475 | $ | 882 | $ | 103,463 | $ | 56,606 | $ | 169,426 | 8,475 | 881 | $ | 8,475 | $ | 881 | $ | 103,463 | $ | 56,606 | $ | 169,425 | ||||||||||||||||||||||||||||||||
| Net income | — | — | — | — | — | 16,827 | 16,827 | — | — | — | — | — | 16,827 | 16,827 | ||||||||||||||||||||||||||||||||||||||||||
| Cash dividends declared | ||||||||||||||||||||||||||||||||||||||||||||||||||||||||
| Common stock | — | — | — | — | — | (9,826 | ) | (9,826 | ) | — | — | — | — | — | (9,826 | ) | (9,826 | ) | ||||||||||||||||||||||||||||||||||||||
| Issuance of common stock | ||||||||||||||||||||||||||||||||||||||||||||||||||||||||
| Dividend reinvestment plan | 10 | — | 10 | — | 382 | — | 392 | 10 | — | 10 | — | 382 | — | 392 | ||||||||||||||||||||||||||||||||||||||||||
Employee stock options and awards(4) | 38 | — | 38 | — | 790 | — | 828 | 38 | — | 38 | — | 790 | — | 828 | ||||||||||||||||||||||||||||||||||||||||||
Employee Retirement Plan(3) | 9 | — | 9 | — | 354 | — | 363 | 9 | — | 9 | — | 354 | — | 363 | ||||||||||||||||||||||||||||||||||||||||||
| Balance as of December 31, 2021 | 8,532 | 882 | $ | 8,532 | $ | 882 | $ | 104,989 | $ | 63,607 | $ | 178,010 | 8,532 | 881 | $ | 8,532 | $ | 881 | $ | 104,989 | $ | 63,607 | $ | 178,009 | ||||||||||||||||||||||||||||||||
| Net income | — | — | — | — | — | 17,998 | 17,998 | — | — | — | — | — | 17,998 | 17,998 | ||||||||||||||||||||||||||||||||||||||||||
| Cash dividends declared | ||||||||||||||||||||||||||||||||||||||||||||||||||||||||
| Common stock | — | — | — | — | — | (10,319 | ) | (10,319 | ) | — | — | — | — | — | (10,319 | ) | (10,319 | ) | ||||||||||||||||||||||||||||||||||||||
| Issuance of common stock | ||||||||||||||||||||||||||||||||||||||||||||||||||||||||
| Dividend reinvestment plan | 7 | — | 7 | — | 366 | — | 373 | 7 | — | 7 | — | 366 | — | 373 | ||||||||||||||||||||||||||||||||||||||||||
Employee stock options and awards(4) | 82 | — | 82 | — | 1,787 | — | 1,869 | 82 | — | 82 | — | 1,787 | — | 1,869 | ||||||||||||||||||||||||||||||||||||||||||
Employee Retirement Plan(3) | — | — | — | — | — | — | — | — | — | — | — | — | — | — | ||||||||||||||||||||||||||||||||||||||||||
| Balance as of December 31, 2022 | 8,621 | 882 | $ | 8,621 | $ | 882 | $ | 107,142 | $ | 71,286 | $ | 187,931 | 8,621 | 881 | $ | 8,621 | $ | 881 | $ | 107,142 | $ | 71,286 | $ | 187,930 | ||||||||||||||||||||||||||||||||
| Net income | — | — | — | — | — | 16,699 | 16,699 | |||||||||||||||||||||||||||||||||||||||||||||||||
| Cash dividends declared | ||||||||||||||||||||||||||||||||||||||||||||||||||||||||
| Common stock | — | — | — | — | — | (11,242 | ) | (11,242 | ) | |||||||||||||||||||||||||||||||||||||||||||||||
| Issuance of common stock | ||||||||||||||||||||||||||||||||||||||||||||||||||||||||
| Public offering, net of costs | 763 | — | 763 | — | 35,464 | — | 36,227 | |||||||||||||||||||||||||||||||||||||||||||||||||
| Dividend reinvestment plan | 8 | — | 8 | — | 373 | — | 381 | |||||||||||||||||||||||||||||||||||||||||||||||||
Employee stock options and awards(4) | 12 | — | 12 | — | 390 | — | 402 | |||||||||||||||||||||||||||||||||||||||||||||||||
Employee Retirement Plan(3) | — | — | — | — | — | — | — | |||||||||||||||||||||||||||||||||||||||||||||||||
| Balance as of December 31, 2023 | 9,404 | 881 | $ | 9,404 | $ | 881 | $ | 143,369 | $ | 76,743 | $ | 230,397 | ||||||||||||||||||||||||||||||||||||||||||||
| (1) | At December 31, 2023, 2022, |
| (2) | At December 31, 2023, 2022, |
| (3) | Artesian Resources Corporation registered 200,000 shares of Class A |
| (4) | Under the Equity Compensation Plan, effective December 9, 2015, Artesian Resources Corporation authorized up to 331,500 shares of Class A |
Utility plant comprises: | ||||||||||||
| In thousands | ||||||||||||
| December 31, | ||||||||||||
Estimated Useful Life (In Years) | 2022 | 2021 | ||||||||||
| Utility plant at original cost | ||||||||||||
| Utility plant in service-Water | ||||||||||||
| Intangible plant | — | $ | 140 | $ | 140 | |||||||
| Source of supply plant | 45-85 | 25,223 | 25,045 | |||||||||
| Pumping and water treatment plant | 8-62 | 116,915 | 109,087 | |||||||||
| Transmission and distribution plant | ||||||||||||
| Mains | 81 | 338,368 | 320,767 | |||||||||
| Services | 39 | 56,396 | 53,210 | |||||||||
| Storage tanks | 76 | 34,567 | 29,972 | |||||||||
| Meters | 26 | 29,720 | 28,778 | |||||||||
| Hydrants | 60 | 17,751 | 16,789 | |||||||||
| General plant | 5-31 | 65,632 | 62,604 | |||||||||
| Utility plant in service-Wastewater | ||||||||||||
| Intangible plant | — | 117 | 116 | |||||||||
| Treatment and disposal plant | 21-81 | 66,420 | 43,725 | |||||||||
| Collection mains & lift stations | 81 | 49,189 | 33,901 | |||||||||
| General plant | 5-31 | 1,845 | 1,665 | |||||||||
| Property held for future use | — | 4,489 | 5,536 | |||||||||
| Construction work in progress | — | 34,213 | 18,481 | |||||||||
| 840,985 | 749,816 | |||||||||||
| Less – accumulated depreciation | 172,954 | 159,385 | ||||||||||
| $ | 668,031 | $ | 590,431 | |||||||||
| In thousands | ||||||||
| 2023 | 2022 | 2021 | ||||||
| AFUDC - Debt | $ | 759 | $ | 435 | $ | 267 | ||
| AFUDC - Equity | $ | 1,243 | $ | 894 | $ | 556 |
Utility plant comprises: | ||||||||||||
| In thousands | ||||||||||||
| December 31, | ||||||||||||
Estimated Useful Life (In Years) | 2023 | 2022 | ||||||||||
| Utility plant at original cost | ||||||||||||
| Utility plant in service-Water | ||||||||||||
| Intangible plant | — | $ | 140 | $ | 140 | |||||||
| Source of supply plant | 45-85 | 29,960 | 25,223 | |||||||||
| Pumping and water treatment plant | 8-62 | 130,337 | 116,915 | |||||||||
| Transmission and distribution plant | ||||||||||||
| Mains | 81 | 370,977 | 338,368 | |||||||||
| Services | 39 | 60,818 | 56,396 | |||||||||
| Storage tanks | 76 | 40,933 | 34,567 | |||||||||
| Meters | 26 | 30,318 | 29,720 | |||||||||
| Hydrants | 60 | 18,980 | 17,751 | |||||||||
| General plant | 5-31 | 67,317 | 65,632 | |||||||||
| Utility plant in service-Wastewater | ||||||||||||
| Intangible plant | — | 116 | 117 | |||||||||
| Treatment and disposal plant | 21-81 | 67,789 | 66,178 | |||||||||
| Collection mains & lift stations | 81 | 51,539 | 49,431 | |||||||||
| General plant | 5-31 | 2,478 | 1,845 | |||||||||
| Property held for future use | — | 4,028 | 4,489 | |||||||||
| Construction work in progress | — | 23,724 | 34,213 | |||||||||
| 899,454 | 840,985 | |||||||||||
| Less – accumulated depreciation | 185,170 | 172,954 | ||||||||||
| $ | 714,284 | $ | 668,031 | |||||||||
| Expense | Years Amortized |
| Deferred contract costs and other | 5 |
| Rate case studies | 5 |
| Delaware rate proceedings | |
| Maryland rate proceedings | 5 |
| Debt related costs | 15 to 30 (based on term of related debt) |
| Deferred costs affiliated interest agreement | 20 |
| Goodwill (resulting from acquisition of Mountain Hill Water Company in 2008) | 50 |
| Deferred acquisition costs (resulting from purchase of water assets in Cecil County, Maryland in 2011 and Port Deposit, Maryland in 2010) | 20 |
| Franchise Costs (resulting from purchase of water assets in Cecil County, Maryland in 2011) | 80 |
| (in thousands) | December 31, 2022 | December 31, 2021 | December 31, 2023 | December 31, 2022 | ||||||
| Deferred contract costs and other | $ | 209 | $ | 227 | ||||||
| Rate case studies | 136 | 57 | ||||||||
| Rate proceedings | 385 | — | ||||||||
| Deferred income taxes | $ | 465 | $ | 355 | 444 | 465 | ||||
| Deferred contract costs and other | 227 | 288 | ||||||||
| Debt related costs | 4,682 | 4,902 | 4,322 | 4,682 | ||||||
| Deferred costs affiliated interest agreement | 1,110 | 1,114 | ||||||||
| Goodwill | 266 | 273 | 258 | 266 | ||||||
| Deferred costs affiliated interest agreement | 1,114 | — | ||||||||
| Deferred acquisition and franchise costs | 520 | 503 | 425 | 463 | ||||||
| $ | 7,274 | $ | 6,321 | $ | 7,289 | $ | 7,274 | |||
| In thousands | 2022 | 2021 | ||||||
| Investment in CoBank | $ | 5,351 | $ | 4,850 | ||||
| Settlement agreement receivable-long term | 4,991 | — | ||||||
| Other deferred assets | 194 | 247 | ||||||
| $ | 10,536 | $ | 5,097 | |||||
| In thousands | 2023 | 2022 | ||||||
| Investment in CoBank | $ | 5,882 | $ | 5,351 | ||||
| Settlement agreement receivable-long term | 2,496 | 4,991 | ||||||
| Other deferred assets | 126 | 194 | ||||||
| $ | 8,504 | $ | 10,536 | |||||
| Regulatory liabilities comprise: | ||||||||
(in thousands) | ||||||||
| December 31, 2022 | December 31, 2021 | |||||||
| Utility plant retirement cost obligation | $ | — | $ | 149 | ||||
| Deferred settlement refunds | 7,487 | — | ||||||
| Deferred income taxes (related to TCJA) | 21,234 | 21,111 | ||||||
| $ | 28,721 | $ | 21,260 | |||||
| December 31, | ||||||||
| In thousands | 2022 | 2021 | ||||||
| Customer accounts receivable – water | $ | 5,981 | $ | 5,986 | ||||
| Customer accounts receivable – wastewater | 482 | 1,326 | ||||||
| Settlement agreement receivable | 2,532 | — | ||||||
| Miscellaneous accounts receivable | 3,781 | 786 | ||||||
| Developer receivable | 1,151 | 698 | ||||||
| 13,927 | 8,796 | |||||||
| Less allowance for doubtful accounts | 416 | 429 | ||||||
| Net accounts receivable | $ | 13,511 | $ | 8,367 | ||||
| December 31, | ||||||||||||
| In thousands | 2023 | 2022 | 2021 | |||||||||
| Customer accounts receivable – water | $ | 6,573 | $ | 5,981 | $ | 5,986 | ||||||
| Customer accounts receivable – wastewater | 513 | 482 | 1,326 | |||||||||
| Settlement agreement receivable – short term | 2,747 | 2,532 | — | |||||||||
| Miscellaneous accounts receivable | 1,236 | 3,781 | 786 | |||||||||
| Developer receivable | 2,089 | 1,151 | 698 | |||||||||
| 13,158 | 13,927 | 8,796 | ||||||||||
| Less provision for expected credit loss | 328 | 416 | 429 | |||||||||
| Net accounts receivable | $ | 12,830 | $ | 13,511 | $ | 8,367 | ||||||
| December 31, | December 31, | |||||||||||||||
| In thousands | 2022 | 2021 | 2023 | 2022 | ||||||||||||
| Beginning balance | $ | 429 | $ | 862 | $ | 416 | $ | 429 | ||||||||
| Allowance adjustments | 146 | (236 | ) | |||||||||||||
| Provision adjustments | 92 | 146 | ||||||||||||||
| Recoveries | 28 | 25 | 48 | 28 | ||||||||||||
| Write off of uncollectible accounts | (187 | ) | (222 | ) | (228 | ) | (187 | ) | ||||||||
| Ending balance | $ | 416 | $ | 429 | $ | 328 | $ | 416 | ||||||||
| For the Year Ended December 31, | For the Year Ended December 31, | |||||||||||||||||||||||
| (in thousands) | 2022 | 2021 | 2020 | 2023 | 2022 | 2021 | ||||||||||||||||||
| Tariff Revenue | ||||||||||||||||||||||||
| Consumption charges | $ | 47,809 | $ | 47,924 | $ | 47,145 | $ | 49,051 | $ | 47,809 | $ | 47,924 | ||||||||||||
| Fixed fees | 31,431 | 27,977 | 27,109 | 33,074 | 31,431 | 27,977 | ||||||||||||||||||
| Service charges | 597 | 579 | 351 | 682 | 597 | 579 | ||||||||||||||||||
| DSIC | 5,085 | 5,093 | 4,997 | 4,727 | 5,085 | 5,093 | ||||||||||||||||||
| Metered wastewater services | 649 | — | — | 602 | 649 | — | ||||||||||||||||||
| Industrial wastewater services | 1,853 | 675 | 1,448 | 1,851 | 1,853 | 675 | ||||||||||||||||||
| Total Tariff Revenue | $ | 87,424 | $ | 82,248 | $ | 81,050 | $ | 89,987 | $ | 87,424 | $ | 82,248 | ||||||||||||
| Non-Tariff Revenue | ||||||||||||||||||||||||
Non-Tariff Revenue | ||||||||||||||||||||||||
| Service line protection plans | $ | 5,020 | $ | 4,594 | $ | 4,381 | $ | 5,632 | $ | 5,020 | $ | 4,594 | ||||||||||||
| Contract operations | 931 | 884 | 840 | 1,046 | 931 | 884 | ||||||||||||||||||
| Design and installation | 3,315 | 562 | 88 | 181 | 3,315 | 562 | ||||||||||||||||||
| Inspection fees | 326 | 341 | 266 | 424 | 326 | 341 | ||||||||||||||||||
| Total Non-Tariff Revenue | $ | 9,592 | $ | 6,381 | 5,575 | |||||||||||||||||||
Total Non-Tariff Revenue | $ | 7,283 | $ | 9,592 | $ | 6,381 | ||||||||||||||||||
| Other Operating Revenue | $ | 1,881 | $ | 2,230 | 1,516 | $ | 1,591 | $ | 1,881 | $ | 2,230 | |||||||||||||
| Total Operating Revenue | $ | 98,897 | $ | 90,859 | $ | 88,141 | $ | 98,861 | $ | 98,897 | $ | 90,859 | ||||||||||||
| (in thousands) | December 31, 2022 | December 31, 2021 | December 31, 2023 | December 31, 2022 | December 31, 2021 | |||||||||||||||
| Contract Assets – Tariff | $ | 2,618 | $ | 2,144 | $ | 3,043 | $ | 2,618 | $ | 2,144 | ||||||||||
| Deferred Revenue | ||||||||||||||||||||
| Deferred Revenue – Tariff | $ | 1,231 | $ | 1,227 | $ | 1,300 | $ | 1,231 | $ | 1,227 | ||||||||||
| Deferred Revenue – Non-Tariff | 438 | 287 | 539 | 438 | 287 | |||||||||||||||
| Total Deferred Revenue | $ | 1,669 | $ | 1,514 | $ | 1,839 | $ | 1,669 | $ | 1,514 | ||||||||||
For the Twelve Months Ended December 31, | For the Twelve Months Ended December 31, | |||||||||||||||
| (in thousands) | ||||||||||||||||
| 2022 | 2021 | 2023 | 2022 | |||||||||||||
| Minimum rentals | $ | 32 | $ | 45 | $ | 34 | $ | 32 | ||||||||
| Contingent rentals | — | — | — | — | ||||||||||||
| $ | 32 | $ | 45 | $ | 34 | $ | 32 | |||||||||
| Twelve Months Ended | Twelve Months Ended | |||||
| December 31, | December 31, | |||||
| 2022 | 2021 | |||||
| Cash paid for amounts included in the measurement of lease liabilities: | ||||||
| Operating cash flows from operating leases | $ | 32 | $ | 45 | ||
| Right-of-use assets obtained in exchange for lease obligations: | ||||||
| Operating leases | $ | 467 | $ | 451 | ||
| Twelve Months Ended | Twelve Months Ended | |||||
| December 31, | December 31, | |||||
| 2023 | 2022 | |||||
| Cash paid for amounts included in the measurement of lease liabilities: | ||||||
| Operating cash flows from operating leases | $ | 34 | $ | 32 | ||
| Right-of-use assets obtained in exchange for lease obligations: | ||||||
| Operating leases | $ | 506 | $ | 467 | ||
| (in thousands, except lease term and discount rate) | ||||||||||||||||
| December 31, 2022 | December 31, 2021 | December 31, 2023 | December 31, 2022 | |||||||||||||
| Operating Leases: | ||||||||||||||||
| Operating lease right-of-use assets | $ | 467 | $ | 451 | $ | 506 | $ | 467 | ||||||||
Other current liabilities | $ | 2 | $ | 6 | $ | 9 | $ | 2 | ||||||||
Operating lease liabilities | 466 | 440 | 503 | 466 | ||||||||||||
Total operating lease liabilities | $ | 468 | $ | 446 | $ | 512 | $ | 468 | ||||||||
| Weighted Average Remaining Lease Term | ||||||||||||||||
| Operating leases | 61 years | 61 years | 58 years | 61 years | ||||||||||||
| Weighted Average Discount Rate | ||||||||||||||||
| Operating leases | 5.0 | % | 5.0 | % | 5.0 | % | 5.0 | % | ||||||||
(in thousands) | (in thousands) | |||||||
| Operating Leases | Operating Leases | |||||||
| Year | ||||||||
| 2023 | $ | 25 | ||||||
| 2024 | 26 | $ | 35 | |||||
| 2025 | 26 | 35 | ||||||
| 2026 | 26 | 35 | ||||||
| 2027 | 26 | 35 | ||||||
| 2028 | 29 | |||||||
| Thereafter | 1,406 | 1,429 | ||||||
| Total undiscounted lease payments | $ | 1,535 | $ | 1,598 | ||||
| Less effects of discounting | (1,067 | ) | (1,086 | ) | ||||
| Total lease liabilities recognized | 468 | 512 | ||||||
| In thousands | December 31, | December 31, | ||||||||||||||
| 2022 | 2021 | 2023 | 2022 | |||||||||||||
| Carrying amount | $ | 177,622 | $ | 144,850 | $ | 180,542 | $ | 177,622 | ||||||||
| Estimated fair value | 155,425 | 163,182 | 162,720 | 155,425 | ||||||||||||
| Components of Income Tax Expense | ||||||||||||||||||||||||
| In thousands | For the Year Ended December 31, | For the Year Ended December 31, | ||||||||||||||||||||||
| State income taxes | 2022 | 2021 | 2020 | |||||||||||||||||||||
| Federal income taxes | 2023 | 2022 | 2021 | |||||||||||||||||||||
| Current | $ | 1,373 | $ | 1,216 | $ | 2,348 | $ | 1,946 | $ | 2,912 | $ | 2,144 | ||||||||||||
| Deferred | 663 | 776 | (279 | ) | 1,968 | 930 | 1,601 | |||||||||||||||||
| Total state income tax expense | $ | 2,036 | $ | 1,992 | $ | 2,069 | ||||||||||||||||||
| Total federal income tax expense | $ | 3,914 | $ | 3,842 | $ | 3,745 | ||||||||||||||||||
| For the Year Ended December 31, | ||||||||||||
| Federal income taxes | 2022 | 2021 | 2020 | |||||||||
| Current | $ | 2,912 | $ | 2,144 | $ | 5,725 | ||||||
| Deferred | 930 | 1,601 | (2,110 | ) | ||||||||
| Total federal income tax expense | $ | 3,842 | $ | 3,745 | $ | 3,615 | ||||||
| Reconciliation of effective tax rate: | ||||||||||||||||||||||||
| For the Year Ended December 31, | ||||||||||||||||||||||||
| In thousands | 2022 | 2022 | 2021 | 2021 | 2020 | 2020 | ||||||||||||||||||
| Amount | Percent | Amount | Percent | Amount | Percent | |||||||||||||||||||
| Reconciliation of effective tax rate | ||||||||||||||||||||||||
| Income before federal and state income taxes | $ | 23,876 | 100.0 | % | $ | 22,564 | 100.0 | % | $ | 22,501 | 100.0 | % | ||||||||||||
| Amount computed at statutory rate | 5,014 | 21.0 | % | 4,738 | 21.0 | % | 4,725 | 21.0 | % | |||||||||||||||
| Reconciling items | ||||||||||||||||||||||||
| State income tax-net of federal tax benefit | 1,696 | 7.1 | % | 1,600 | 7.1 | % | 1,704 | 7.6 | % | |||||||||||||||
| Regulatory liability adjustment | (450 | ) | (1.9 | )% | (451 | ) | (2.0 | )% | (451 | ) | (2.0 | )% | ||||||||||||
| Other | (382 | ) | (1.6 | )% | (150 | ) | (0.7 | )% | (294 | ) | (1.3 | )% | ||||||||||||
| Total income tax expense and effective rate | $ | 5,878 | 24.6 | % | $ | 5,737 | 25.4 | % | $ | 5,684 | 25.3 | % | ||||||||||||
| For the Year Ended December 31, | ||||||||||||
| State income taxes | 2023 | 2022 | 2021 | |||||||||
| Current | $ | 1,016 | $ | 1,373 | $ | 1,216 | ||||||
| Deferred | 1,418 | 663 | 776 | |||||||||
| Total state income tax expense | $ | 2,434 | $ | 2,036 | $ | 1,992 | ||||||
| Reconciliation of effective tax rate: | ||||||||||||||||||||||||
| For the Year Ended December 31, | ||||||||||||||||||||||||
| In thousands | 2023 | 2023 | 2022 | 2022 | 2021 | 2021 | ||||||||||||||||||
| Amount | Percent | Amount | Percent | Amount | Percent | |||||||||||||||||||
| Reconciliation of effective tax rate | ||||||||||||||||||||||||
| Income before federal and state income taxes | $ | 23,047 | 100.0 | % | $ | 23,876 | 100.0 | % | $ | 22,564 | 100.0 | % | ||||||||||||
| Amount computed at statutory rate | 4,840 | 21.0 | % | 5,014 | 21.0 | % | 4,738 | 21.0 | % | |||||||||||||||
| Reconciling items | ||||||||||||||||||||||||
| State income tax-net of federal tax benefit | 1,918 | 8.3 | % | 1,696 | 7.1 | % | 1,600 | 7.1 | % | |||||||||||||||
| Regulatory liability adjustment | (449 | ) | (1.9 | )% | (450 | ) | (1.9 | )% | (451 | ) | (2.0 | )% | ||||||||||||
| Other | 39 | 0.2 | % | (382 | ) | (1.6 | )% | (150 | ) | (0.7 | )% | |||||||||||||
| Total income tax expense and effective rate | $ | 6,348 | 27.6 | % | $ | 5,878 | 24.6 | % | $ | 5,737 | 25.4 | % | ||||||||||||
For the Year Ended December 31, | For the Year Ended December 31, | |||||||||||||||
| In thousands | 2022 | 2021 | 2023 | 2022 | ||||||||||||
| Deferred tax assets related to: | ||||||||||||||||
| Federal and state operating loss carry-forwards | $ | 922 | $ | 629 | ||||||||||||
| State operating loss carry-forwards | $ | 1,037 | $ | 922 | ||||||||||||
| Less: valuation allowance | (600 | ) | (493 | ) | (906 | ) | (600 | ) | ||||||||
| Bad debt allowance | 116 | 240 | 92 | 116 | ||||||||||||
| Stock options | 47 | 148 | 47 | 47 | ||||||||||||
| Other | 28 | 75 | 48 | 28 | ||||||||||||
| Total deferred tax assets | $ | 513 | $ | 599 | $ | 318 | $ | 513 | ||||||||
| Deferred tax liabilities related to: | ||||||||||||||||
| Property plant and equipment basis differences | $ | (52,565 | ) | $ | (48,536 | ) | $ | (56,012 | ) | $ | (52,565 | ) | ||||
| Bond retirement costs | (1,058 | ) | (1,210 | ) | (982 | ) | (1,058 | ) | ||||||||
| Property taxes | (609 | ) | (481 | ) | (624 | ) | (609 | ) | ||||||||
| Other | (833 | ) | (685 | ) | (1,081 | ) | (833 | ) | ||||||||
| Total deferred tax liabilities | $ | (55,065 | ) | $ | (50,912 | ) | $ | (58,699 | ) | $ | (55,065 | ) | ||||
| Net deferred tax liability | $ | (54,552 | ) | $ | (50,313 | ) | $ | (58,381 | ) | $ | (54,552 | ) | ||||
| Schedule of Valuation Allowance | Schedule of Valuation Allowance | Schedule of Valuation Allowance | ||||||||||||||||||||||||||||||
Balance at Beginning of Period | Additions Charged to Costs and Expenses | Deductions | Balance at End of Period | Balance at Beginning of Period | Additions Charged to Costs and Expenses | Deductions | Balance at End of Period | |||||||||||||||||||||||||
| In thousands | ||||||||||||||||||||||||||||||||
| Classification | ||||||||||||||||||||||||||||||||
For the Year Ended December 31, 2023 Valuation allowance for deferred tax assets | $ | 600 | $ | 312 | $ | 6 | $ | 906 | ||||||||||||||||||||||||
For the Year Ended December 31, 2022 Valuation allowance for deferred tax assets | $ | 546 | $ | 54 | — | $ | 600 | $ | 546 | $ | 54 | $ | — | $ | 600 | |||||||||||||||||
For the Year Ended December 31, 2021 Valuation allowance for deferred tax assets | $ | 493 | $ | 53 | — | $ | 546 | $ | 493 | $ | 53 | $ | — | $ | 546 | |||||||||||||||||
For the Year Ended December 31, 2020 Valuation allowance for deferred tax assets | $ | 335 | $ | 158 | — | $ | 493 | |||||||||||||||||||||||||
| For the years ended December 31, | For the years ended December 31, | |||||||||||||||
| In thousands | 2022 | 2021 | 2023 | 2022 | ||||||||||||
| Balance at beginning of year | $ | 202 | $ | 209 | $ | 146 | $ | 202 | ||||||||
| Additions based on tax positions related to the current year | 146 | — | — | 146 | ||||||||||||
| Additions based on tax positions related to prior years | 10 | 19 | 12 | 10 | ||||||||||||
| Reductions for tax positions of prior years | — | — | — | — | ||||||||||||
| Lapses in statutes of limitations | (212 | ) | (26 | ) | — | (212 | ) | |||||||||
| Balance at end of year | $ | 146 | $ | 202 | $ | 158 | $ | 146 | ||||||||
| December 31, | December 31, | |||||||||||||||
| In thousands | 2022 | 2021 | 2023 | 2022 | ||||||||||||
| First mortgage bonds | ||||||||||||||||
Series R, 5.96%, due December 31, 2028 | $ | 25,000 | $ | 25,000 | $ | 25,000 | $ | 25,000 | ||||||||
Series S, 4.45%, due December 31, 2033 | 6,600 | 7,200 | 6,000 | 6,600 | ||||||||||||
Series T, 4.24%, due December 20, 2036 | 40,000 | 40,000 | 40,000 | 40,000 | ||||||||||||
Series U, 4.71%, due January 31, 2038 | 25,000 | 25,000 | 25,000 | 25,000 | ||||||||||||
Series V, 4.42%, due October 31, 2049 | 30,000 | 30,000 | 30,000 | 30,000 | ||||||||||||
| Series W, 4.43%, due April 30, 2047 | 30,000 | — | 30,000 | 30,000 | ||||||||||||
| 156,600 | 127,200 | 156,000 | 156,600 | |||||||||||||
| State revolving fund loans | ||||||||||||||||
3.57%, due September 1, 2023 | 102 | 200 | — | 102 | ||||||||||||
3.64%, due May 1, 2025 | 373 | 513 | 228 | 373 | ||||||||||||
3.41%, due February 1, 2031 | 1,577 | 1,735 | 1,415 | 1,577 | ||||||||||||
3.40%, due July 1, 2032 | 1,590 | 1,729 | 1,445 | 1,590 | ||||||||||||
1.187%, due November 1, 2041 | 617 | 646 | 588 | 617 | ||||||||||||
1.187%, due November 1, 2041 | 724 | 758 | 690 | 724 | ||||||||||||
1.187%, due November 1, 2041 | 1,128 | 1,181 | 1,075 | 1,128 | ||||||||||||
| 2.00%, due February 1, 2043 | 846 | — | 828 | 846 | ||||||||||||
| 2.00%, due February 1, 2043 | 974 | — | 1,143 | 974 | ||||||||||||
| 2.00%, due June 1, 2043 | 1,044 | — | 1,002 | 1,044 | ||||||||||||
| 2.00%, due June 1, 2043 | 1,022 | — | ||||||||||||||
| 2.00%, due February 1, 2044 | 2,696 | — | ||||||||||||||
| 2.00%, due January 1, 2043 | 1,000 | — | ||||||||||||||
| 8,975 | 6,762 | 13,132 | 8,975 | |||||||||||||
| Notes Payable | ||||||||||||||||
Promissory Note, 5.12%, due December 30, 2028 | $ | 10,478 | $ | 10,888 | $ | 10,155 | $ | 10,478 | ||||||||
| Asset Purchase, 2.00%, due May 26, 2027 | 1,569 | — | 1,255 | 1,569 | ||||||||||||
| 12,047 | 10,888 | 11,410 | 12,047 | |||||||||||||
| Sub-total | 177,622 | 144,850 | 180,542 | 177,622 | ||||||||||||
| Less: current maturities (principal amount) | 2,003 | 1,591 | 2,235 | 2,003 | ||||||||||||
| Total long-term debt | $ | 175,619 | $ | 143,259 | $ | 178,307 | $ | 175,619 | ||||||||
| In thousands | 2023 | 2024 | 2025 | 2026 | 2027 | Thereafter | 2024 | 2025 | 2026 | 2027 | 2028 | Thereafter | ||||||||||||||||||||||||||||||||||||
| First Mortgage bonds | $ | 600 | $ | 600 | $ | 600 | $ | 600 | $ | 600 | $ | 153,600 | $ | 600 | $ | 600 | $ | 600 | $ | 600 | $ | 25,600 | $ | 128,000 | ||||||||||||||||||||||||
| State revolving fund loans | 656 | 702 | 643 | 581 | 597 | 5,796 | 756 | 852 | 794 | 813 | 834 | 9,083 | ||||||||||||||||||||||||||||||||||||
| Asset Purchase-Contractual Obligation | 314 | 314 | 314 | 314 | 313 | — | 314 | 314 | 314 | 313 | — | — | ||||||||||||||||||||||||||||||||||||
| Promissory note | 433 | 454 | 480 | 505 | 532 | 8,074 | 565 | 480 | 505 | 532 | 559 | 7,514 | ||||||||||||||||||||||||||||||||||||
| Total payments | $ | 2,003 | $ | 2,070 | $ | 2,037 | $ | 2,000 | $ | 2,042 | $ | 167,470 | $ | 2,235 | $ | 2,246 | $ | 2,213 | $ | 2,258 | $ | 26,993 | $ | 144,597 | ||||||||||||||||||||||||
2022 Shares | 2022 Weighted Average Exercise Price | 2021 Shares | 2021 Weighted Average Exercise Price | 2020 Shares | 2020 Weighted Average Exercise Price | 2023 Shares | 2023 Weighted Average Exercise Price | 2022 Shares | 2022 Weighted Average Exercise Price | 2021 Shares | 2021 Weighted Average Exercise Price | |||||||||||||||||||||||
| Plan options | ||||||||||||||||||||||||||||||||||
| Outstanding at beginning of year | 83,000 | $ | 21.65 | 116,347 | $ | 20.90 | 153,250 | $ | 20.40 | 6,750 | $ | 21.86 | 83,000 | $ | 21.65 | 116,347 | $ | 20.90 | ||||||||||||||||
| Granted | — | — | — | — | — | — | — | — | — | — | — | — | ||||||||||||||||||||||
| Exercised | (76,250) | 21.63 | (33,347) | 19.04 | (36,903) | 18.83 | (6,750) | 21.86 | (76,250) | 21.63 | (33,347) | 19.04 | ||||||||||||||||||||||
| Expired | — | — | — | — | — | — | — | — | — | — | — | — | ||||||||||||||||||||||
| Outstanding at end of year | 6,750 | $ | 21.86 | 83,000 | $ | 21.65 | 116,347 | $ | 20.90 | — | $ | — | 6,750 | $ | 21.86 | 83,000 | $ | 21.65 | ||||||||||||||||
| Options exercisable at year end | 6,750 | $ | 21.86 | 83,000 | $ | 21.65 | 116,347 | $ | 20.90 | — | $ | — | 6,750 | $ | 21.86 | 83,000 | $ | 21.65 | ||||||||||||||||
| Options Outstanding and Exercisable | |||||||||||
Range of Exercise Price | Shares Outstanding at December 31, 2022 | Weighted Average Remaining Life | Weighted Average Exercise Price | Aggregate Intrinsic Value | |||||||
| $ | 21.86 | 6,750 | 1.35 Years | $ | 21.86 | $ | 248,000 | ||||
| Options Outstanding and Exercisable | |||||||||||
Range of Exercise Price | Shares Outstanding at December 31, 2023 | Weighted Average Remaining Life | Weighted Average Exercise Price | Aggregate Intrinsic Value | |||||||
| $ | 00.00 | 0 | 0 Years | $ | 00.00 | $ | 0 | ||||
2022 Shares | 2022 Weighted Average Grant Date Fair Value | 2021 Shares | 2021 Weighted Average Grant Date Fair Value | 2020 Shares | 2020 Weighted Average Exercise Price | 2023 Shares | 2023 Weighted Average Grant Date Fair Value | 2022 Shares | 2022 Weighted Average Grant Date Fair Value | 2021 Shares | 2021 Weighted Average Exercise Price | |||||||||||||||||||||||||||||||||||||
| Plan RSA’s | ||||||||||||||||||||||||||||||||||||||||||||||||
| Outstanding at beginning of year | 5,000 | $ | 40.11 | 5,000 | $ | 35.01 | 5,000 | $ | 36.11 | 5,000 | $ | 45.58 | 5,000 | $ | 40.11 | 5,000 | $ | 35.01 | ||||||||||||||||||||||||||||||
| Granted | 5,000 | 45.58 | 5,000 | 40.11 | 5,000 | 35.01 | 5,000 | 54.88 | 5,000 | 45.58 | 5,000 | 40.11 | ||||||||||||||||||||||||||||||||||||
| Vested/Released | (5,000 | ) | 40.11 | (5,000 | ) | 35.01 | (5,000 | ) | 36.11 | (5,000 | ) | 45.58 | (5,000 | ) | 40.11 | (5,000 | ) | 35.01 | ||||||||||||||||||||||||||||||
| Cancelled | — | — | — | — | — | — | — | — | — | — | — | — | ||||||||||||||||||||||||||||||||||||
| Unvested Outstanding at end of year | 5,000 | $ | 45.58 | 5,000 | $ | 40.11 | 5,000 | $ | 35.01 | 5,000 | $ | 54.88 | 5,000 | $ | 45.58 | 5,000 | $ | 40.11 | ||||||||||||||||||||||||||||||
| In thousands | ||||||||
| 2023 | $ | 60 | ||||||
| 2024 | 39 | $ | 67 | |||||
| 2025 | 40 | 47 | ||||||
| 2026 | 41 | 49 | ||||||
| 2027 | 43 | 50 | ||||||
| 2028 through 2043 | 782 | |||||||
| 2028 | 52 | |||||||
| 2029 through 2043 | 868 | |||||||
| $ | 1,005 | $ | 1,133 | |||||
| In thousands | ||||||||
| 2023 | $ | 809 | ||||||
| 2024 | 798 | $ | 870 | |||||
| 2025 | 770 | 881 | ||||||
| 2026 | 770 | 881 | ||||||
| 2027 | — | 57 | ||||||
| 2028 | 57 | |||||||
| $ | 3,147 | $ | 2,746 | |||||
| In thousands | ||||||||
| 2023 | $ | 2,218 | ||||||
| 2024 | 8,780 | $ | 8,200 | |||||
| 2025 | 5,170 | 8,500 | ||||||
| 2026 | 8,550 | |||||||
| $ | 16,168 | $ | 25,250 | |||||
| Application Date | 11/15/2019 | 5/29/2020 | 11/20/2020 |
| DEPSC Approval Date | 12/12/2019 | 6/17/2020 | 12/14/2020 |
| Effective Date | 01/01/2020 | 07/1/2020 | 01/1/2021 |
| Cumulative DSIC Rate | 7.50% | 7.50% | 7.50% |
| Net Eligible Plant Improvements – Cumulative Dollars (in millions) | 43.1 | 43.1 | 43.1 |
| Eligible Plant Improvements – Installed Beginning Date | 10/01/2014 | 10/01/2014 | 10/01/2014 |
| Eligible Plant Improvements – Installed Ending Date | 04/30/2019 | 04/30/2019 | 04/30/2019 |
| Application Date | 11/20/2020 |
| DEPSC Approval Date | 12/14/2020 |
| Effective Date | 01/01/2021 |
| Cumulative DSIC Rate | 7.50% |
| Net Eligible Plant Improvements – Cumulative Dollars (in millions) | $43.1 |
| Eligible Plant Improvements – Installed Beginning Date | 10/01/2014 |
| Eligible Plant Improvements – Installed Ending Date | 04/30/2019 |
| For the Year | ||||||||||||
| Ended December 31, | ||||||||||||
| 2022 | 2021 | 2020 | ||||||||||
| (in thousands) | ||||||||||||
| Weighted average common shares outstanding during the period for Basic computation | $ | 9,462 | $ | 9,394 | $ | 9,327 | ||||||
| Dilutive effect of employee stock options | 19 | 32 | 42 | |||||||||
| Weighted average common shares outstanding during the period for Diluted computation | $ | 9,481 | $ | 9,426 | $ | 9,369 | ||||||
| For the Year | ||||||||||||
| Ended December 31, | ||||||||||||
| 2023 | 2022 | 2021 | ||||||||||
| (in thousands) | ||||||||||||
| Weighted average common shares outstanding during the period for basic computation | $ | 10,018 | $ | 9,462 | $ | 9,394 | ||||||
| Dilutive effect of employee stock options | 4 | 19 | 32 | |||||||||
| Weighted average common shares outstanding during the period for diluted computation | $ | 10,022 | $ | 9,481 | $ | 9,426 | ||||||
(In thousands) | ||||
TESI | ||||
Utility plant | $ | 25,354 | ||
Cash | 280 | |||
Goodwill | 1,939 | |||
Other assets | 1,033 | |||
Total assets | 28,606 | |||
Less: Liabilities and contributions in aid of construction (CIAC) | ||||
Liabilities | 2,808 | |||
CIAC | 22,676 | |||
Net cash purchase price | $ | 3,122 | ||
(in thousands) | ||||
TESI | ||||
Utility plant | $ | 25,354 | ||
Cash | 280 | |||
Goodwill | 1,939 | |||
Other assets | 1,033 | |||
Total assets | 28,606 | |||
Less: Liabilities and contributions in aid of construction (CIAC) | ||||
Liabilities | 2,808 | |||
CIAC | 22,676 | |||
Net cash purchase price | $ | 3,122 | ||
| In thousands | ||||||||||||||||||||||||
| Years Ended December 31, | Years Ended December 31, | |||||||||||||||||||||||
| 2022 | 2021 | 2020 | 2023 | 2022 | 2021 | |||||||||||||||||||
| Revenues: | ||||||||||||||||||||||||
| Regulated Utility | $ | 89,818 | $ | 85,016 | $ | 83,001 | $ | 92,228 | $ | 89,818 | $ | 85,016 | ||||||||||||
| Other (non-utility) | 9,248 | 5,996 | 5,327 | 6,877 | 9,248 | 5,996 | ||||||||||||||||||
| Inter-segment elimination | (169 | ) | (153 | ) | (187 | ) | (244 | ) | (169 | ) | (153 | ) | ||||||||||||
| Consolidated Revenues | $ | 98,897 | $ | 90,859 | $ | 88,141 | $ | 98,861 | $ | 98,897 | $ | 90,859 | ||||||||||||
| Operating Income: | ||||||||||||||||||||||||
| Regulated Utility | $ | 22,580 | $ | 21,103 | $ | 21,148 | $ | 21,246 | $ | 22,411 | $ | 20,950 | ||||||||||||
| Other (non-utility) | 1,326 | 1,191 | 1,147 | 1,200 | 1,495 | 1,344 | ||||||||||||||||||
| Consolidated Operating Income | $ | 23,906 | $ | 22,294 | $ | 22,295 | $ | 22,446 | $ | 23,906 | $ | 22,294 | ||||||||||||
| Income Taxes: | ||||||||||||||||||||||||
| Regulated Utility | $ | 5,091 | $ | 5,146 | $ | 5,093 | $ | 5,216 | $ | 5,091 | $ | 5,146 | ||||||||||||
| Other (non-utility) | 787 | 591 | 591 | 1,132 | 787 | 591 | ||||||||||||||||||
| Consolidated Income Taxes | $ | 5,878 | $ | 5,737 | $ | 5,684 | $ | 6,348 | $ | 5,878 | $ | 5,737 | ||||||||||||
| Assets: | ||||||||||||||||||||||||
| Regulated Utility | $ | 713,113 | $ | 618,751 | $ | 760,339 | $ | 713,113 | ||||||||||||||||
| Other (non-utility) | 6,678 | 5,964 | 6,493 | 6,678 | ||||||||||||||||||||
| Consolidated Assets | $ | 719,791 | $ | 624,715 | $ | 766,832 | $ | 719,791 | ||||||||||||||||
| CHIEF EXECUTIVE OFFICER: | CHIEF FINANCIAL OFFICER: | ||
| /s/ DIAN C. TAYLOR | /s/ DAVID B. SPACHT | ||
| Dian C. Taylor | David B. Spacht |
| Name | Age | Position |
| Dian C. Taylor | Biography: Director since 1991 - Chair of the Board of Directors of the Company, or the Board, since July 1993, and Chief Executive Officer of Artesian Resources Corporation and its subsidiaries since September 1992. Ms. Taylor has been employed by the Company since August 1991. Prior to joining the Company, Ms. Taylor had extensive marketing and small business ownership experience. She was formerly a consultant to the Small Business Development Center at the University of Delaware from February 1991 to August 1991 and Owner and President of Achievement Resources Inc. from 1977 to 1991. Achievement Resources, Inc. specialized in strategic planning, marketing, entrepreneurial and human resources development consulting. Ms. Taylor was a marketing director for SMI, Inc. from 1982 to 1985. Ms. Taylor is the aunt of John R. Eisenbrey, Jr. and Nicholle R. Taylor. She serves on the Budget and Finance Committee. Qualifications: Ms. Dian Taylor has over 30 years of experience as Chief Executive Officer and President of the Company, during which the Company has continuously |
| Kenneth R. Biederman Ph. D. | Biography:Director since 1991 - Currently retired and former Professor of Finance at the Lerner College of Business and Economics of the University of Delaware, from May 1996 to May 2011. Interim Dean of the College of Business and Economics of the University of Delaware from February 1999 to June 2000. Dean of the College of Business and Economics of the University of Delaware from 1990 to 1996. Former Director of the Mid-Atlantic Farm Credit Association from 2006 to 2010. Director of Chase Manhattan Bank USA from 1993 to 1996. Formerly a financial and banking consultant from 1989 to 1990 and President of Gibraltar Bank from 1987 to 1989. Previously Chief Executive Officer and Chairman of the Board of West Chester Savings Bank; Economist and former Treasurer of the State of New Jersey and Staff Economist for the United States Senate Budget Committee. He serves on the Executive; Audit; Budget and Finance; Governance and Nominating; and Compensation Committees. | |
John R. Eisenbrey, Jr. | Biography:Director since 1993 – Small Business Executive. For more than 40 years, Owner and President of Bear Industries, Inc., a contracting firm providing building fire sprinkler protection installations for businesses throughout the Delmarva Peninsula. In 2021, Mr. Eisenbrey was appointed to the Board of Trustees of St. Andrews School. Mr. Eisenbrey is the nephew of Dian C. Taylor and the cousin of Nicholle R. Taylor. He serves on the Audit; Budget and Finance; Governance and Nominating; and Compensation Committees. Qualifications: The Board | |
| Michael Houghton, Esq. | Biography:Director appointed September 2018 – Mr. Houghton retired as of January 1, 2022 as Partner | |
| Nicholle R. Taylor | Biography:Director since 2007 – Senior Vice President of Artesian Resources Corporation and its subsidiaries since May 9, 2012 and President of Artesian Water Company since August 16, 2021. Previously served as Chief Operating Officer of Artesian Water Company from August 2019 to August 2021. She was Vice President of Artesian Resources Corporation and its subsidiaries from May 2004 to May 2012. Ms. Taylor has been employed by the Company since 1991 and has held various management level and operational positions within the Company. She serves on the Budget and Finance Committee. Ms. Taylor is the niece of Dian C. Taylor and the cousin of John R. Eisenbrey, Jr. | |
Pierre A. Anderson | Chief Information Officer and Senior Vice President of Artesian Resources Corporation and its subsidiaries since May 19, 2021. Mr. Anderson previously served as Vice President of Information Technologies of Artesian Resources Corporation and its subsidiaries from May 2012 to May 2021, Director of Information Technologies from April 2008 to May 2012, and Manager of Information Technologies from December 2006 to April 2008. Prior to joining the Company, Mr. Anderson was employed by the Christina School District as Manager, Project & Support Services. From 2000 to 2005, while with MBNA (now Bank of America), he served in several information technology roles. He received his Bachelors of Science degree in Computer Science from Delaware State University and both an Mr. Anderson serves on the Boards of Easterseals of Delaware & Maryland’s Eastern Shore | |
| Joseph A. DiNunzio, CPA, CGMA | Executive Vice President and Secretary of Artesian Resources Corporation and Subsidiaries since May 2007 and President of Artesian Water Maryland, Inc. since May 2017. Mr. DiNunzio previously served as Senior Vice President and Secretary since March 2000 and as Vice President and Secretary since January 1995. He served as Secretary of Artesian Resources Corporation and Subsidiaries from July 1992 to January 1995. Prior to joining Artesian in 1989, Mr. DiNunzio was employed by PriceWaterhouseCoopers LLP. He earned a Mr. DiNunzio is Past Chairman of the Board of the Cecil County Chamber of Commerce and served on the Board of the Cecil Business Leaders from June 2013 to January 2023. He is Past Chairman of the Delaware Chapter of the National Association of Water Companies. Mr. DiNunzio is a member of the Cecil County Maryland Economic Development Commission, the Delaware Source Water Assessment and Protection Program’s Citizens and Technical Advisory Committee, the American Institute of Certified Public Accountants, the Pennsylvania Institute of Certified Public Accountants, and was a member of the 2003 Delaware Legislative Drinking Water Task Force. |
| Courtney A. Emerson, Esq. | 40 | General Counsel of Artesian Resources Corporation and its subsidiaries since August 2021 and Assistant Secretary of Artesian Resources Corporation and its subsidiaries since November 2022. Prior to joining Artesian in 2021, Ms. Emerson practiced law at Fox Rothschild LLP. She previously served as an emergency manager for the State of Delaware for nearly a decade and was an educator at a multinational bank. She earned her J.D. from the Delaware Law School of Widener University and her B.S. in Political Science from the University of Delaware. Ms. Emerson has served as Vice Chair of the Environmental Section of the Delaware State Bar Association, as Vice Chair of the American Bar Association’s Disaster Legal Services Team, and as Vice President of the University of Delaware Alumni Lawyers Society. She is a member of the General Counsel Section of the National Association of Water Companies, the American Bar Association, the Delaware State Bar Association, and the Committee of 100. |
| Jennifer L. Finch, CPA | Senior Vice President of Finance & Corporate Treasurer of Artesian Resources Corporation & Subsidiaries since November 2020. Prior to that, Ms. Finch was the Assistant Treasurer and Vice President of Prior to joining Artesian in 2008, Ms. Finch held various accounting positions for Handler Corporation, a homebuilder and developer located in Wilmington, Delaware, where she worked for 14 years. She also worked | |
Raymond T. Kelly, CPA, CISA | Vice President of Information Technology for Artesian Resources Corporation and Subsidiaries since November 4, 2022. Mr. Kelly joined Artesian in 2013 as Manager of Business Applications and was promoted to the Director of Information Technology in 2016. Prior to joining Artesian he served as a Manager for PricewaterhouseCoopers, where he progressively advanced from an Associate; leading information technology audits, financial audits of publicly traded institutions, and utility meter to cash system engagements. During his time at Artesian, Mr. Kelly, who is responsible for all Information Technology functions, has directly led and overseen all enhancements to the technology portfolio including; enterprise applications, infrastructure, business process automation, analytics, and cybersecurity. Mr. Kelly earned both a Bachelor of Science in Computer Science and Business and a Bachelor of Science in Business and Economics from Lehigh University. He is a Certified Public | |
| Daniel W. Konstanski | ||
| | ||
| David B. Spacht | 64 | |
| John M. Thaeder | 65 | Senior Vice President of Operations. Mr. Thaeder has served as an officer since February 1998. He currently serves as an officer of Artesian Resources Corporation and Subsidiaries. Prior to joining the company, Mr. Thaeder was with Hydro Group, Inc. from 1996 to 1998 as Southeastern District Manager of Sales and Operations from Maryland to Florida. During 1995 and 1996, he was Sales Manager of the |
Name | Fees Earned or Paid in Cash ($) | Stock Awards ($)(1) | All other Compensation ($)(2) | Total ($) | Fees Earned or Paid in Cash ($) | Stock Awards ($)(1) | All other Compensation ($) | Total ($) | ||||||||||||||||||||||||
| Kenneth R. Biederman | 87,250 | 45,580 | --- | 132,830 | 95,000 | 54,880 | --- | 149,880 | ||||||||||||||||||||||||
| John R. Eisenbrey, Jr. | 87,250 | 45,580 | --- | 132,830 | 95,000 | 54,880 | --- | 149,880 | ||||||||||||||||||||||||
| Michael Houghton | 82,250 | 45,580 | --- | 127,830 | 95,000 | 54,880 | --- | 149,880 | ||||||||||||||||||||||||
| William C. Wyer (2) | 27,250 | N/A | --- | 27,250 | 7,500 | N/A | --- | 7,500 | ||||||||||||||||||||||||
| On May |
Option Shares Outstanding at December 31, | Restricted Shares Outstanding at December 31, | |
| Kenneth R. Biederman | --- | 1,000 |
| John R. Eisenbrey, Jr. | --- | 1,000 |
| Michael Houghton | --- | 1,000 |
| Board Diversity Matrix (As of March 1, 2024) | ||||
| Total Number of Directors | 5 | |||
| Female | Male | Non- Binary | Did Not Disclose Gender | |
| Part I: Gender Identify | ||||
| Directors | 2 | 3 | ||
| Part II: Demographic Background | ||||
| African American or Black | ||||
| Alaskan Native or Native American | ||||
| Asian | ||||
| Hispanic or Latinx | ||||
| Native Hawaiian or Pacific Islander | ||||
| White | 2 | 3 | ||
| Two or More Races or Ethnicities | ||||
| LGBTQ+ | ||||
| Did Not Disclose Demographic Background | ||||
| Board Diversity Matrix (As of March 1, 2023) | ||||
| Total Number of Directors | 5 | |||
| Female | Male | Non- Binary | Did Not Disclose Gender | |
| Part I: Gender Identify | ||||
| Directors | 2 | 3 | ||
| Part II: Demographic Background | ||||
| African American or Black | ||||
| Alaskan Native or Native American | ||||
| Asian | ||||
| Hispanic or Latinx | ||||
| Native Hawaiian or Pacific Islander | ||||
| White | 2 | 3 | ||
| Two or More Races or Ethnicities | ||||
| LGBTQ+ | ||||
| Did Not Disclose Demographic Background | ||||
| 2022 Total Compensation | 2023 Total Compensation | |||||||
Median employee total annual compensation | $ | 93,432 | $ | 89,289 | ||||
Annual total compensation of Dian C. Taylor, CEO | $ | 1,005,375 | $ | 828,593 | ||||
| Ratio of CEO to median employee compensation | 11:1 | 9:1 | ||||||
| Name and Principal Position | Year | Salary ($) | Bonus ($) | Stock Awards ($)(1) | All Other Compensation ($)(2),(3),(4) | Total ($) | ||||||
| Dian C. Taylor, Chair, Chief Executive | 2022 | 611,330 | 175,000 | 46,620 | 172,425 | 1,005,375 | ||||||
| Officer & President | 2021 | 592,712 | 153,000 | 40,980 | 153,595 | 940,287 | ||||||
| 2020 | 575,574 | 250,000 | 35,010 | 214,924 | 1,075,508 | |||||||
| David B. Spacht, Chief Financial | 2022 | 409,973 | 100,000 | N/A | 39,583 | 549,556 | ||||||
| Officer | 2021 | 395,272 | 75,000 | N/A | 36,404 | 506,676 | ||||||
| 2020 | 383,064 | 104,000 | N/A | 34,955 | 522,019 | |||||||
| Joseph A. DiNunzio, Executive Vice | 2022 | 444,589 | 150,000 | N/A | 35,725 | 630,314 | ||||||
| President & Secretary | 2021 | 431,046 | 75,000 | N/A | 31,900 | 537,946 | ||||||
| 2020 | 418,585 | 100,000 | N/A | 32,483 | 551,068 | |||||||
| Nicholle R. Taylor, Senior Vice | 2022 | 394,608 | 150,000 | 46,620 | 100,511 | 691,739 | ||||||
| President | 2021 | 350,864 | 78,000 | 40,980 | 98,953 | 568,797 | ||||||
| 2020 | 322,595 | 100,000 | 35,010 | 99,355 | 556,960 | |||||||
Jennifer L. Finch, Senior Vice | 2022 | 363,832 | 100,000 | N/A | 20,819 | 484,651 | ||||||
| President & Treasurer | 2021 | 352,749 | 75,000 | N/A | 16,035 | 443,784 | ||||||
| 2020 | 301,459 | 100,000 | N/A | 14,793 | 416,252 | |||||||
| Name and Principal Position | Year | Salary ($) | Bonus ($) | Stock Awards ($)(1) | All Other Compensation ($)(2),(3),(4) | Total ($) | ||||||
| Dian C. Taylor, Chair, Chief Executive | 2023 | 635,787 | -0- | 54,520 | 138,286 | 828,593 | ||||||
| Officer & President | 2022 | 611,330 | 175,000 | 46,620 | 172,425 | 1,005,375 | ||||||
| 2021 | 592,712 | 153,000 | 40,980 | 153,595 | 940,287 | |||||||
| David B. Spacht, Chief Financial | 2023 | 426,366 | -0- | N/A | 37,444 | 463,810 | ||||||
| Officer | 2022 | 409,973 | 100,000 | N/A | 39,583 | 549,556 | ||||||
| 2021 | 395,272 | 75,000 | N/A | 36,404 | 506,676 | |||||||
| Joseph A. DiNunzio, Executive Vice | 2023 | 462,371 | -0- | N/A | 38,594 | 500,965 | ||||||
| President & Secretary | 2022 | 444,589 | 150,000 | N/A | 35,725 | 630,314 | ||||||
| 2021 | 431,046 | 75,000 | N/A | 31,900 | 537,946 | |||||||
| Nicholle R. Taylor, President | 2023 | 410,397 | -0- | 54,520 | 106,427 | 571,344 | ||||||
| 2022 | 394,608 | 150,000 | 46,620 | 100,511 | 691,739 | |||||||
| 2021 | 350,864 | 78,000 | 40,980 | 98,953 | 568,797 | |||||||
Jennifer L. Finch, Senior Vice | 2023 | 378,382 | 1,500 | N/A | 18,159 | 398,041 | ||||||
| President & Treasurer | 2022 | 363,832 | 100,000 | N/A | 20,819 | 484,651 | ||||||
| 2021 | 352,749 | 75,000 | N/A | 16,035 | 443,784 | |||||||
| (1) | On May |
| (2) | Under the Company’s defined contribution 401(k) Plan, the Company contributes two percent of an eligible |
| Dian C. Taylor | $ | 33,550 | $ | 36,300 | ||||
| David B. Spacht | $ | 33,550 | $ | 36,300 | ||||
| Joseph A. DiNunzio | $ | 33,550 | $ | 36,300 | ||||
| Nicholle R. Taylor | $ | 33,550 | $ | 36,300 | ||||
| Jennifer L. Finch | $ | 15,250 | $ | 16,500 |
| (3) | Included in the |
| (4) | Executive officers are reimbursed for eligible medical expenses not otherwise covered by the |
| Name | Grant Date | Vest Date | All Other Stock Awards: Number of Shares of Stock or Units (#) | All Other Option Awards: Number of Securities Underlying Options (#) | Exercise or Base Price of Option Awards ($/share) | Grant Date Fair Value of Stock & Option Awards ($) | Grant Date | Vest Date | All Other Stock Awards: Number of Shares of Stock or Units (#) | All Other Option Awards: Number of Securities Underlying Options (#) | Exercise or Base Price of Option Awards ($/share) | Grant Date Fair Value of Stock & Option Awards ($) | ||||||||||||||||||||||||
| Dian C. Taylor | 5/03/2022 | 5/03/2023 | 1,000 | - | - | 45,580 | 5/09/2023 | 5/09/2024 | 1,000 | - | - | 54,880 | ||||||||||||||||||||||||
| Nicholle R. Taylor | 5/03/2022 | 5/03/2023 | 1,000 | - | - | 45,580 | 5/09/2023 | 5/09/2024 | 1,000 | - | - | 54,880 | ||||||||||||||||||||||||
| Option Awards | ||||||||||||||||
| Name | Number of Securities Underlying Unexercised Options(#) Exercisable | Number of Securities Underlying Unexercised Options (#) Unexercisable | Option Exercise Price($) | Option Expiration Date | ||||||||||||
| Nicholle R. Taylor | -0- | --- | -0- | -0- | ||||||||||||
| Option Awards | Stock Awards | |||||||||||||||
Name | Number of Shares Acquired on Exercise (#) | Value Realized on Exercise ($) | Number of Shares Acquired on Vesting (#) | Value Realized on Vesting ($) | ||||||||||||
| Dian C. Taylor | -0- | -0- | 1,000 | 54,520 | ||||||||||||
| Nicholle R. Taylor | 6,750 | 137,363 | 1,000 | 54,520 | ||||||||||||
| Option Awards | |||||||||||||
| Name | Number of Securities Underlying Unexercised Options(#) Exercisable | Number of Securities Underlying Unexercised Options (#) Unexercisable | Option Exercise Price($) | Option Expiration Date | |||||||||
| Nicholle R. Taylor | 6,750 | --- | 21.86 | 5/07/2024 | |||||||||
| Option Awards | Stock Awards | |||||||||||||||
Name | Number of Shares Acquired on Exercise (#) | Value Realized on Exercise ($) | Number of Shares Acquired on Vesting (#) | Value Realized on Vesting ($) | ||||||||||||
| Dian C. Taylor | 6,750 | 634,311 | 1,000 | 46,620 | ||||||||||||
| Nicholle R. Taylor | 8,750 | 284,953 | 1,000 | 46,620 | ||||||||||||
Class A Non-Voting Common Stock(1) | Class B Common Stock(1) | |||||||||||||||
| Shares | Percent(2) | Shares | Percent(2) | |||||||||||||
Dian C. Taylor (3) 664 Churchmans Road Newark, Delaware 19702 | 146,543 | 1.7 | 159,509 | 18.1 | ||||||||||||
Kenneth R. Biederman (3) | 23,875 | * | --- | --- | ||||||||||||
John R. Eisenbrey, Jr. (3)(4)(5) 15 Albe Drive Newark, Delaware 19702 | 53,751 | * | 45,707 | 5.2 | ||||||||||||
Nicholle R. Taylor (3)(6) 20 Brendle Lane Wilmington, Delaware 19807 | 30,999 | * | 281,719 | 32.0 | ||||||||||||
| Michael Houghton | 1,000 | --- | --- | --- | ||||||||||||
| Joseph A. DiNunzio | 19,144 | * | 203 | * | ||||||||||||
| David B. Spacht | 4,109 | * | 189 | * | ||||||||||||
| Jennifer L. Finch | 1,815 | * | --- | --- | ||||||||||||
Louisa Taylor Welcher 219 Laurel Avenue Newark, DE 19711 | 87,324 | 1.0 | 135,862 | 15.4 | ||||||||||||
Directors and Executive Officers as a Group (13 Individuals)(3) | 311,860 | 3.6 | 488,677 | 55.4 | ||||||||||||
| * less than 1% | ||||||||||||||||
Class A Non-Voting Common Stock(1) | Class B Common Stock(1) | |||||||||||||||
| Shares | Percent(2) | Shares | Percent(2) | |||||||||||||
Dian C. Taylor (3) | 148,500 | 1.6 | 159,509 | 18.1 | ||||||||||||
Kenneth R. Biederman (3) | 24,875 | * | --- | --- | ||||||||||||
John R. Eisenbrey, Jr. (3)(4)(5) | 54,751 | * | 45,707 | 5.2 | ||||||||||||
Nicholle R. Taylor (3)(6) | 27,308 | * | 281,719 | 32.0 | ||||||||||||
| Michael Houghton | 2,000 | * | --- | --- | ||||||||||||
| Joseph A. DiNunzio | 19,240 | * | 203 | * | ||||||||||||
| David B. Spacht | 4,210 | * | 189 | * | ||||||||||||
| Jennifer L. Finch | 1,861 | * | --- | --- | ||||||||||||
Louisa Taylor Welcher 219 Laurel Avenue Newark, DE 19711 | 89,690 | 1.0 | 135,862 | 15.4 | ||||||||||||
Directors and Executive Officers as a Group (13 Individuals)(3) | 310,447 | 3.3 | 488,677 | 55.4 | ||||||||||||
| * less than 1% | ||||||||||||||||
| (1) | The nature of ownership consists of sole voting and investment power unless otherwise indicated. The amount also includes all shares issuable to such person or group upon the exercise of options or vesting of restricted shares held by such person or group to the extent such options are exercisable or restricted shares vest within 60 days after March |
| (2) | The percentage of the total number of shares of the class outstanding is shown where that percentage is one percent or greater. Percentages for each person are based on the aggregate number of shares of the applicable class outstanding as of March |
| (3) | Includes vesting of restricted shares and options to purchase shares of the Company’s Class A Non-Voting Stock, as follows: Ms. D. Taylor (1,000 shares); Mr. Biederman (1,000 shares); Mr. Eisenbrey, Jr. (1,000 shares); Ms. N. Taylor |
| (4) | 89,123 shares were pledged by Mr. Eisenbrey, Jr. as collateral for a loan. |
| (5) | Includes 780 shares of the Class B Stock owned by a trust, of which Mr. Eisenbrey, Jr. is a trustee and has a beneficial ownership interest, and 1,555 shares of the Class B Stock held in custodial accounts for Mr. Eisenbrey, Jr.’s daughters. |
| (6) | Includes |
| Class A Non-Voting Common Stock | |||||
| Shares | Percent | ||||
BlackRock, Inc. (1) 50 Hudson Yards New York, NY 10001 | 1,026,106 | 10.9 | |||
The Vanguard Group (2) 100 Vanguard Blvd. | 530,947 | 5.7 | |||
Malvern, PA 19355 | |||||
T. Rowe Price Investment Management, Inc. (3) 101 E. Pratt Street Baltimore, MD 21201 | 773,384 | 8.2 | |||
| (1) | Pursuant to a Schedule 13G/A filed by BlackRock, Inc., or BlackRock, with the SEC on January 24, 2024, BlackRock is the beneficial owner of 1,026,106 shares of Class A Non-Voting Stock, and, to the extent it has voting rights under Delaware law, BlackRock has reported having sole voting power with respect to 1,006,293 shares and shared voting power with respect to 0 shares, as well as sole dispositive power with respect to 1,026,106 shares and shared dispositive power with respect to 0 shares. |
| (2) | Pursuant to a Schedule 13G filed by The Vanguard Group, or Vanguard, with the SEC on February 13, 2024, Vanguard is the beneficial owner of 530,947 shares of Class A Non-Voting Stock, and, to the extent it has voting rights under Delaware law, Vanguard has reported having sole voting power with respect to 0 shares and shared voting power with respect to 13,696 shares, as well as sole dispositive power with respect to 508,599 shares and shared dispositive power with respect to 22,438 shares. |
| (3) | Pursuant to a Schedule 13G filed by T. Rowe Price Investment Management, Inc., or T. Rowe Price, with the SEC on February 14, 2024, T. Rowe Price is the beneficial owner of 773,384 shares of Class A Non-Voting Stock, and, to the extent it has voting rights under Delaware law, T. Rowe Price has reported having sole voting power with respect to 277,650 shares and shared voting power with respect to 0 shares, as well as sole dispositive power with respect to 773,384 shares and shared dispositive power with respect to 0 shares. |
| Equity Compensation Plan Information | Equity Compensation Plan Information | Equity Compensation Plan Information | ||||||||||||||||||||||
| Plan category | Number of securities to be issued upon exercise of outstanding options (a) | Weighted-average exercise price of outstanding options | Number of securities remaining available for future issuance under equity compensation plans (excluding securities reflected in column (a)) | Number of securities to be issued upon exercise of outstanding options (a) | Weighted-average exercise price of outstanding options | Number of securities remaining available for future issuance under equity compensation plans (excluding securities reflected in column (a)) | ||||||||||||||||||
| Equity compensation plans approved by security holders | 11,750 | $ | 12.560 | 284,932 | 5,000 | $ | -0- | 279,932 | ||||||||||||||||
| Total | 11,750 | $ | 12.560 | 284,932 | 5,000 | $ | -0- | 279,932 | ||||||||||||||||
| - | the nature of the related person’s interest in the transaction; |
| - | the material terms of the transaction, including, without limitation, the amount and type of transaction; |
| - | the importance of the transaction to the related person; |
| - | the importance of the transaction to the Company; |
| - | whether the transaction would impair the judgment of a director or executive officer to act in the best interest of the Company; and |
| - | any other matters the Audit Committee deems important or appropriate. |
| (In thousands) | 2022 | 2021 | 2023 | 2022 | ||||||||||||
| Audit Fees | $ | 415 | $ | 387 | $ | 527 | $ | 415 | ||||||||
| Audit-Related Fees | 21 | 17 | 40 | 21 | ||||||||||||
| Tax Fees | --- | --- | --- | --- | ||||||||||||
| All Other Fees | --- | --- | --- | --- | ||||||||||||
| Total Fees | $ | 436 | $ | 404 | $ | 567 | $ | 436 | ||||||||
| The following documents are filed as part of this report: | Page(s)* | |
| (1) | ||
Reports of Independent Registered Public Accountants (BDO USA, | ||
| (2) | Exhibits: see the exhibit list below | |
* Page number shown refers to page number in this Annual Report on Form 10-K |
| EXHIBIT LIST | |
Exhibit Number | Description |
| Amended and Restated By-laws of Artesian Resources Corporation incorporated by reference to Exhibit 3.1 filed with the Company’s Form 8-K filed on November 23, 2020. | |
Restated Certificate of Incorporation of the Company effective April 28, 2004 incorporated by reference to Exhibit 3.1 filed with the Company’s Form 10-Q filed on May 3, 2004 for the quarterly period ended March 31, 2004. | |
| First Amendment to Second Amended and Restated Revolving Credit Agreement between Artesian Water Company, Inc. and CoBank, ACB dated October 25, 2022. Incorporated by reference to Exhibit 4.1 to the Company’s Quarterly Report on Form 10-Q filed on November 4, 2022 for the quarter ended September 30, 2022. | |
| Twenty-Fifth Supplemental Indenture dated as of April 29, 2022, between Artesian Water Company, Inc. and Wilmington Trust Company, as trustee. Incorporated by reference to Exhibit 4.1 to the Company’s Quarterly Report on Form 10-Q filed on May 5, 2022 for the quarter ended March 31, 2022. | |
| Bond Purchase Agreement, dated April 29, 2022, by and between Artesian Water Company, Inc., and CoBank, ACB. | |
| Incorporated by reference to Exhibit 4.2 to the Company’s Quarterly Report on Form 10-Q filed on May 5, 2022 for the quarter ended March 31, 2022. | |
| Twenty-Fourth Supplemental Indenture dated as of December 17, 2019, between Artesian Water Company, Inc., subsidiary of the Company, and Wilmington Trust Company, as Trustee. Incorporated by reference to Exhibit 4.1 filed with the Company’s Form 8-K filed on December 19, 2019. | |
| Bond Purchase Agreement, dated December 17, 2019 by and between Artesian Water Company, Inc., subsidiary of the Company, and the Wilmington Trust Company, as Trustee. Incorporated by reference to Exhibit 4.2 filed with the Company’s Form 8-K filed on December 17, 2019. | |
| Twenty-Third Supplemental Indenture dated as of January 31, 2018, between Artesian Water Company, Inc., subsidiary of the Company, and Wilmington Trust Company, as Trustee. Incorporated by reference to Exhibit 4.1 filed with the Company’s Form 8-K filed on February 2, 2018. | |
| Bond Purchase Agreement, dated January 31, 2018 by and between Artesian Water Company, Inc., subsidiary of the Company, and CoBank, ACB. Incorporated by reference to Exhibit 4.2 filed with the Company’s Form 8-K filed on February 2, 2018. | |
| Twenty-Second Supplemental Indenture dated as of January 18, 2017, between Artesian Water Company, Inc., subsidiary of the Company, and Wilmington Trust Company, as Trustee. Incorporated by reference to Exhibit 4.1 filed with the Company’s Form 8-K filed on January 20, 2017. | |
| Bond Purchase Agreement, dated January 18, 2017 by and between Artesian Water Company, Inc., subsidiary of the Company, and CoBank, ACB. Incorporated by reference to Exhibit 4.2 filed with the Company’s Form 8-K filed on January 20, 2017. | |
| First Amendment to Indenture of Mortgage and to the Sixteenth, Eighteenth and Twentieth Supplemental Indentures dated as of January 18, 2017, between Artesian Water Company, Inc., subsidiary of the Company, and Wilmington Trust Company, as Trustee. Incorporated by reference to Exhibit 4.3 filed with the Company’s Form 10-K for the year ended December 31, | |
| Letter Agreement, dated as of September 15, 2015, by and between Artesian Water Company, Inc. and CoBank ACB. Incorporated by reference to Exhibit 4.1 filed with the Company’s Form 8-K filed on September 18, 2015. | |
| Twenty-First Supplemental Indenture dated as of November 20, 2009, between Artesian Water Company, Inc., subsidiary of the Company, and Wilmington Trust Company, as Trustee. Incorporated by reference to Exhibit 4.4 filed with the Company’s Form 10-K for the year ended December 31, 2017. | |
| Twentieth Supplemental Indenture dated as of December 1, 2008, between Artesian Water Company, Inc., subsidiary of the Company, and Wilmington Trust Company, as Trustee. Incorporated by reference to Exhibit 4.1 filed with the Company’s Form 8-K filed on December 4, 2008. | |
| First Amendment to Bond Purchase Agreement, dated as of January 18, 2017 by and between Artesian Water Company, Inc., subsidiary of the Company, and CoBank, ACB. Incorporated by reference to Exhibit 4.13 filed with the Company’s Annual Report on Form 10-K for the year ended December 31, | |
| Bond Purchase Agreement, dated December 1, 2008 by and between Artesian Water Company, Inc., subsidiary of the Company, and CoBank, ACB. Incorporated by reference to Exhibit 4.2 filed with the Company’s Form 8-K filed on December 4, 2008. | |
| Eighteenth Supplemental Indenture dated as of August 1, 2005, between Artesian Water Company, Inc., subsidiary of the Company, and Wilmington Trust Company, as Trustee. Incorporated by reference to Exhibit 10.1 to the Company’s Quarterly Report on Form 10-Q for the quarter ended June 30, 2005 filed on August 9, 2005. | |
| Sixteenth Supplemental Indenture dated as of January 31, 2003 between Artesian Water Company, Inc., subsidiary of the Company, and the Wilmington Trust Company, as Trustee. Incorporated by reference to Exhibit 4.2 filed with the Company’s Annual Report on Form 10-K for the year ended December 31, | |
Indenture of Mortgage dated July 1, 1961, between Artesian Water Company, Inc., subsidiary of the Company, and the Wilmington Trust Company, as Trustee. Incorporated by reference to Exhibit 4.10 filed with the Company’s Annual Report on Form 10-K for the year ended December 31, | |
Second Amendment to Master Loan Agreement, dated as of November 13, 2019, by and between Artesian Wastewater Management, Inc. and CoBank, ACB. Incorporated by reference to Exhibit 4.16 filed with the Company’s Annual Report on Form 10-K for the year ended December 31, | |
First Amendment to Master Loan Agreement, dated as of January 10, 2019, by and between Artesian Wastewater Management, Inc. and CoBank, ACB. Incorporated by reference to Exhibit 4.17 filed with the Company’s Annual Report on Form 10-K for the year ended December 31, | |
| Guarantee of Payment, dated as of August 8, 2018, by and between Artesian Resources Corporation and CoBank, ACB. Incorporated by reference to Exhibit 4.3 filed with the Company’s Form 10-Q filed on August 9, 2018. | |
| Master Loan Agreement, dated as of August 8, 2018, by and between Artesian Wastewater Management, Inc. and CoBank, ACB. Incorporated by reference to Exhibit 4.2 filed with the Company’s Form 10-Q filed on August 9, 2018. | |
| Artesian Resources Corporation 2015 Equity Compensation Plan. Incorporated by reference to Exhibit 4.1 filed with the Company’s Registration Statement on Form S-8 filed December 16, 2015. | |
| Interest Rate Lock Agreement, dated as of October 8, 2019, by and between Artesian Water Company, Inc. and CoBank, ACB, Incorporated by reference to Exhibit 4.1 filed with the Company’s Form 8-K filed on October 11, 2019. | |
| Description of the Company’s Securities. Incorporated by reference to Exhibit 4.22 filed with the Company’s Annual Report on Form 10-K for the year ended December 31, | |
| Interest Rate Lock Agreement, dated as of February 7, 2022, by and between Artesian Water Company, Inc. and CoBank, ACB. Incorporated by reference to Exhibit 4.1 filed with the Company’s Form 8-K filed on February 10, 2022. | |
| Amended and Restated Demand Line of Credit Agreement between Artesian Resources Corporation, and Citizens Bank, N.A. dated July August 3, 2023. Incorporated by reference to Exhibit 10.1 filed with the Company’s Form 10-Q filed on November 7, 2023. | |
| Financing Agreement, Loan No. 22000033, dated as of December 9, 2022, between Artesian Water Company, Inc. and Delaware Drinking Water State Revolving Fund, acting by and through the Delaware Department of Health & Social Services, Division of Public Health., incorporated by reference to Exhibit 10.1 filed with the Company’s Form 8-K filed on December 12, 2022. | |
General Obligation Note (New Castle County Water Main Transmission Replacements Projects), Series 2022D-DWSRF, dated as of December 9, 2022, issued by Artesian Water Company, Inc. in favor of Delaware Drinking Water State Revolving Fund, acting by and through the Delaware Department of Health & Social Services, Division of Public Health., incorporated by reference to Exhibit 10.2 filed with the Company’s Form 8-K filed on December 12, 2022. | |
| Financing Agreement, Loan No. 22000032, dated as of December 9, 2022, between Artesian Water Company, Inc. and Delaware Drinking Water State Revolving Fund, acting by and through the Delaware Department of Health & Social Services, Division of Public Health., incorporated by reference to Exhibit 10.3 filed with the Company’s Form 8-K filed on December 12, 2022. | |
| General Obligation Note (New Castle County Water Main Transmission Replacements Projects), Series 2022E-DWSRF, dated as of December 9, 2022, issued by Artesian Water Company, Inc. in favor of Delaware Drinking Water State Revolving Fund, acting by and through the Delaware Department of Health & Social Services, Division of Public Health., incorporated by reference to Exhibit 10.4 filed with the Company’s Form 8-K filed on December 12, 2022. | |
| Financing Agreement, Loan No. 22000031, dated as of December 9, 2022, between Artesian Water Company, Inc. and Delaware Drinking Water State Revolving Fund, acting by and through the Delaware Department of Health & Social Services, Division of Public Health., incorporated by reference to Exhibit 10.5 filed with the Company’s Form 8-K filed on December 12, 2022. | |
| General Obligation Note (New Castle County Water Main Transmission Replacements Projects), Series 2022F-DWSRF, dated as of December 9, 2022, issued by Artesian Water Company, Inc. in favor of Delaware Drinking Water State Revolving Fund, acting by and through the Delaware Department of Health & Social Services, Division of Public Health., incorporated by reference to Exhibit 10.6 filed with the Company’s Form 8-K filed on December 12, 2022. | |
| Financing Agreement, Loan No. 22000030, dated as of August 12, 2022, between Artesian Water Company, Inc. and Delaware Drinking Water State Revolving Fund, acting by and through the Delaware Department of Health & Social Services, Division of Public Health., incorporated by reference to Exhibit 10.1 filed with the Company’s Form 8-K filed on August 15, 2022. | |
| General Obligation Note (New Castle County Water Main Transmission Replacements Projects), Series 2022A-DWSRF, dated as of August 12, 2022, issued by Artesian Water Company, Inc. in favor of Delaware Drinking Water State Revolving Fund, acting by and through the Delaware Department of Health & Social Services, Division of Public Health., incorporated by reference to Exhibit 10.2 filed with the Company’s Form 8-K filed on August 15, 2022. | |
| Financing Agreement, Loan No. 22000029, dated as of August 12, 2022, between Artesian Water Company, Inc. and Delaware Drinking Water State Revolving Fund, acting by and through the Delaware Department of Health & Social Services, Division of Public Health., incorporated by reference to Exhibit 10.3 filed with the Company’s Form 8-K filed on August 15, 2022. | |
| General Obligation Note (New Castle County Water Main Transmission Replacements Projects), Series 2022B-DWSRF, dated as of August 12, 2022, issued by Artesian Water Company, Inc. in favor of Delaware Drinking Water State Revolving Fund, acting by and through the Delaware Department of Health & Social Services, Division of Public Health., incorporated by reference to Exhibit 10.4 filed with the Company’s Form 8-K filed on August 15, 2022. | |
| Financing Agreement, Loan No. 22000028, dated as of August 12, 2022, between Artesian Water Company, Inc. and Delaware Drinking Water State Revolving Fund, acting by and through the Delaware Department of Health & Social Services, Division of Public Health., incorporated by reference to Exhibit 10.5 filed with the Company’s Form 8-K filed on August 15, 2022. | |
| General Obligation Note (New Castle County Water Main Transmission Replacements Projects), Series 2022C-DWSRF, dated as of August 12, 2022, issued by Artesian Water Company, Inc. in favor of Delaware Drinking Water State Revolving Fund, acting by and through the Delaware Department of Health & Social Services, Division of Public Health., incorporated by reference to Exhibit 10.6 filed with the Company’s Form 8-K filed on August 15, | |
| Settlement Agreement upon which The Chemours Company FC, LLC, Hercules, LLC, Waste Management of Delaware, Inc., SC Holdings, Inc., Cytec Industries, Inc., Zeneca Inc., and Bayer CropScience Inc., collectively the Percentage Settlors, and the Delaware Sand and Gravel Remedial Trust, on one hand, and Artesian Water Company, Inc., on the other hand, have agreed to resolve certain of Artesian Water’s claims and issues relating to releases of contaminants from the Delaware Sand & Gravel Landfill Superfund Site, incorporated by reference to Exhibit 10.2 filed with the Company’s Quarterly Report on Form 10-Q filed on August 5, 2022 | |
| Amendment to Asset Purchase Agreement, dated May 11, 2022, by and among Artesian Water Company, Inc., a Delaware corporation, and the Town of Clayton, a Delaware municipality, incorporated by reference to Exhibit 10.1 filed with the Company’s Form 10-Q filed on August 5, 2022. | |
| Stock Purchase Agreement, dated August 27, 2021, by and among Artesian Wastewater Management, Inc., a Delaware corporation, and Middlesex Water Company, a New Jersey corporation. Incorporated by reference to Exhibit 10.1 filed with the Company’s Form 10-Q filed on November 5, 2021. | |
| Asset Purchase Agreement, dated February 16, 2022, by and among Artesian Water Company, Inc. a Delaware corporation, and the Town of Clayton, a Delaware municipality. Incorporated by reference to Exhibit 10.2 filed with the Company’s Annual Report on Form 10-K for the year ended December 31, | |
| Asset Purchase Agreement, dated June 11, 2020 by and among Artesian Water Company, Inc., a Delaware corporation, and the City of Delaware City, a Delaware municipality. Incorporated by reference to Exhibit 10.1 filed with Company’s Form 8-K filed on June 16, 2020. | |
| Asset Purchase Agreement, dated February 27, 2020 by and among Artesian Water Company, Inc., a Delaware corporation, and the Town of Frankford, a Delaware municipality. Incorporated by reference to Exhibit 10.1 filed with Company’s Form 8-K filed on March 4, 2020. | |
| Financing Agreement, dated as of April 28, 2020, between Artesian Water Company, Inc. and Delaware Drinking Water State Revolving Fund, acting by and through the Delaware Department of Health & Social Services, Division of Public Health. Incorporated by reference to Exhibit 10.1 filed with the Company’s Form 8-K filed on April 30, 2020. | |
| General Obligation Note (New Castle County Water Main Transmission Replacements Projects), Series 2020A-SRF, dated as of April 28, 2020, issued by Artesian Water Company, Inc. in favor of Delaware Drinking Water State Revolving Fund, acting by and through the Delaware Department of Health & Social Services, Division of Public Health. Incorporated by reference to Exhibit 10.2 filed with the Company’s Form 8-K filed on April 30, 2020. | |
| Financing Agreement, dated as of April 28, 2020, between Artesian Water Company, Inc. and Delaware Drinking Water State Revolving Fund, acting by and through the Delaware Department of Health & Social Services, Division of Public Health. Incorporated by reference to Exhibit 10.3 filed with the Company’s Form 8-K filed on April 30, 2020. | |
| General Obligation Note (New Castle County Water Main Transmission Replacements Projects), Series 2020B-SRF, dated as of April 28, 2020, issued by Artesian Water Company, Inc. in favor of Delaware Drinking Water State Revolving Fund, acting by and through the Delaware Department of Health & Social Services, Division of Public Health. Incorporated by reference to Exhibit 10.4 filed with the Company’s Form 8-K filed on April 30, 2020. | |
| Financing Agreement, dated as of April 28, 2020, between Artesian Water Company, Inc. and Delaware Drinking Water State Revolving Fund, acting by and through the Delaware Department of Health & Social Services, Division of Public Health. Incorporated by reference to Exhibit 10.5 filed with the Company’s Form 8-K filed on April 30, 2020. | |
| General Obligation Note (New Castle County Water Main Transmission Replacements Projects), Series 2020C-SRF, dated as of April 28, 2020, issued by Artesian Water Company, Inc. in favor of Delaware Drinking Water State Revolving Fund, acting by and through the Delaware Department of Health & Social Services, Division of Public Health. Incorporated by reference to Exhibit 10.6 filed with the Company’s Form 8-K filed on April 30, 2020. | |
| General Obligation Note (New Castle County Water Main Transmission Replacements Projects), Series 2011-SRF, dated as of July 15, 2011, issued by Artesian Water Company, Inc. in favor of Delaware Drinking Water State Revolving Fund, acting by and through the Delaware Department of Health & Social Services, Division of Public Health. Incorporated by reference to Exhibit 10.2 filed with the Company’s Form 8-K filed on July 19, 2011. | |
| Financing Agreement, dated as of July 15, 2011, between Artesian Water Company, Inc. and Delaware Drinking Water State Revolving Fund, acting by and through the Delaware Department of Health & Social Services, Division of Public Health. Incorporated by reference to Exhibit 10.1 filed with the Company’s Form 8-K filed on July 19, 2011. | |
| Financing Agreement and General Obligation Note dated February 12, 2010 between Artesian Water Company, Inc. and Delaware Drinking Water State Revolving Fund Delaware Department of Health and Social Services, Division of Public Health. Incorporated by reference to Exhibit 10.1 filed with the Company’s Form 8-K filed on February 17, 2010. | |
| Second Amended and Restated Revolving Credit Agreement between Artesian Water Company, Inc. and CoBank, ACB dated September 20, 2019. Incorporated by reference to Exhibit 4.2 filed with the Company’s Form 10-Q filed on November 8, 2019. | |
| Demand Line of Credit Agreement dated January 19, 2010 between Artesian Resources Corporation and each of its subsidiaries and Citizens Bank of Pennsylvania, as amended or modified from time to time. Incorporated by reference to Exhibit 10.2 filed with the Company’s Form 8-K filed on January 25, 2010. | |
| Amendment to Agreement for Purchase of Water Assets of the Town of Port Deposit and for the provision of Potable Water Services, dated November 1, 2010 by and among Artesian Water Maryland, Inc., a Delaware Corporation, Artesian Resources Corporation, a Delaware Corporation and the Mayor and Town Council of Port Deposit, Maryland, a body corporate and politic organized under the laws of the State of Maryland. Incorporated by reference to Exhibit 10.2 filed with the Company’s Form 8-K filed on November 4, 2010. | |
| Water Asset Purchase Agreement, dated December 1, 2009 by and among Artesian Water Maryland, Inc., a Delaware Corporation, Artesian Resources Corporation, a Delaware Corporation and the Mayor and Town Council of Port Deposit, Maryland, a body corporate and politic organized under the laws of the State of Maryland. Incorporated by reference to Exhibit 10.1 filed with the Company’s Form 8-K filed on December 2, 2009. | |
| Limited Liability Interest Purchase Agreement, | |
| Artesian Resources Corporation 2005 Equity Compensation Plan. Incorporated by reference to Exhibit 4.1 to the Company’s Quarterly Report on Form 10-Q for the quarter ended June 30, 2005 filed on August 9, 2005. *** | |
| Amended and Restated Artesian Resources Corporation 1992 Non-Qualified Stock Option Plan, as amended. Incorporated by reference to Exhibit 10.4 filed with the Company’s Form 10-Q for the quarterly period ended June 30, 2003 filed on July 31, 2003.*** | |
| Artesian Resources Corporation Incentive Stock Option Plan. Incorporated by reference to Exhibit 10(e) filed with the Company’s Annual Report on Form 10-K for the year ended December 31, 1995.*** | |
| Officer’s Medical Reimbursement Plan dated May 27, 1992. Incorporated by reference to Exhibit 10.6 filed with the Company’s Annual Report on Form 10-K/A for the year ended December 31, 2001.*** | |
| Subsidiaries of the Company as of December 31, | |
| Consent of BDO USA, | |
| Certification of Chief Executive Officer pursuant to Section 302 of the Sarbanes-Oxley Act of 2002. * | |
| Certification of Chief Financial Officer pursuant to Section 302 of the Sarbanes-Oxley Act of 2002. * | |
| Certification of Chief Executive Officer and Chief Financial Officer pursuant to Section 906 of the Sarbanes-Oxley Act of 2002. ** | |
| Artesian Resources Corporation Clawback Policy, effective as of August 7, 2023. * | |
| 101.INS | Inline XBRL Instance Document (the instance document does not appear in the Interactive Data File because its XBRL tags are embedded within the Inline XBRL document). * |
| 101.SCH | Inline XBRL Taxonomy Extension Schema Document. * |
| 101.CAL | Inline XBRL Taxonomy Extension Calculation Linkbase Document. * |
| 101.DEF | Inline XBRL Taxonomy Extension Definition Linkbase Document. * |
| 101.LAB | Inline XBRL Taxonomy Extension Label Linkbase Document. * |
| 101.PRE | Inline XBRL Taxonomy Extension Presentation Linkbase Document. * |
| 104 | Cover Page Interactive Data File (formatted as inline XBRL and contained in Exhibit 101). * |
| * | Filed herewith. |
| ** | Furnished herewith. |
| *** | Compensation plan or arrangement required to be filed or incorporated as an exhibit. |
| Date March | By: /s/ DAVID B. SPACHT | |
| David B. Spacht | ||
Chief Financial Officer (Principal Financial Officer) |
| Signature | Title | Date |
| /s/ DIAN C. TAYLOR | Chair of the Board of Directors, President | |
| Dian C. Taylor | and Chief Executive Officer (Principal | March |
Executive Officer) | ||
| /s/ DAVID B. SPACHT | Chief Financial Officer (Principal Financial | |
| David B. Spacht | Officer) | March |
/s/ JENNIFER L. FINCH | Corporate Treasurer and Senior Vice | |
| Jennifer L. Finch | President of Finance (Principal Accounting Officer) | March |
| /s/ KENNETH R. BIEDERMAN | ||
| Kenneth R. Biederman | Director | March |
| /s/ JOHN R. EISENBREY, JR. | ||
| John R. Eisenbrey, Jr. | Director | March |
| /s/ MICHAEL HOUGHTON | ||
| Michael Houghton | Director | March |
| /s/ NICHOLLE R. TAYLOR | ||
| Nicholle R. Taylor | Director | March |