10
The following table contains certain information as of December 31, 20062008 relating to the loan portfolio of the BankBancorp with the dollar amounts of loans due after one year that have fixed and floating rates. All loans are shown maturing based upon contractual maturities and include scheduled payments but not possible prepayments.
| Fixed | Floating | Total | ||||||||
| (dollars in thousands) | ||||||||||
| One to four family residential | $ | 131,387 | $ | 136,686 | $ | 268,073 | ||||
| Multifamily | 2,425 | 2,974 | 5,399 | |||||||
| Commercial and industrial real estate | 75,961 | 112,178 | 188,139 | |||||||
| Construction and land acquisition | ||||||||||
| and development loans | 12,320 | 42,930 | 55,250 | |||||||
| Land | 39,217 | 25,313 | 64,530 | |||||||
| Commercial, non-real estate | 1,845 | 1,807 | 3,652 | |||||||
| Consumer | 1,319 | - | 1,319 | |||||||
| Total | $ | 264,474 | $ | 321,888 | $ | 586,362 | ||||
| Fixed | Floating | Total | ||||||||||
| (dollars in thousands) | ||||||||||||
| One to four family residential | $ | 195,217 | $ | 176,105 | $ | 371,322 | ||||||
| Multifamily | 1,634 | 8,059 | 9,693 | |||||||||
| Commercial and industrial real estate | 87,218 | 104,201 | 191,419 | |||||||||
| Construction and land acquisition | ||||||||||||
| and development loans | 24,445 | 25,050 | 49,495 | |||||||||
| Land | 25,309 | 15,797 | 41,106 | |||||||||
| Commercial, non-real estate | 1,833 | 1,914 | 3,747 | |||||||||
| Consumer | 866 | 37 | 903 | |||||||||
| Total | $ | 336,522 | $ | 331,163 | $ | 667,685 | ||||||
Loans to One Borrower
Under regulatory guidelines, the aggregate amount of loans that the Bank may make to one borrower is 15% of the Bank’s unimpaired capital and unimpaired surplus. The Bank’s largest single loansurplus, which was $19,934,000 at December 31, 2006 was2008. The Bank’s three largest loans at December 31, 2008 were a $7,158,000 loan secured by commercial property located in Annapolis, Maryland, a $7,000,000 line of credit secured by assignments of notes, Deeds of Trust, pledged stock and certificates of deposit. The second largestdeposit, and a $6,818,000 loan is in the amount of $5,518,000 and is secured by four single-family dwellings in Potomac, MD, Silver Spring, MD, Washington, DC and Annapolis, MD in addition to a life insurance policy. The third largest loan is in the amount of $5,075,000 and is secured by commercial property located in Culpeper, VA.California, Maryland.
Origination and Purchase and Sale of Loans
The Bank originates residential loans in conformity with standard underwriting criteria to assure maximum eligibility for possible resale in the secondary market. Although the Bank has authority to lend anywhere in the United States, they haveit has confined theirits loan origination activities primarily to the states of Maryland, Virginia and Delaware.
Loan originations are developed from a number of sources, primarily from referrals from real estate brokers, builders, and existing and walk-in customers. The Bank also utilizes the services of loan brokers in its market area. Loan brokers are paid on a commission basis (generally 1% of the loan amount) for loans brokered to the Bank.
The Bank’s mortgage loan approval process is intended to assess the borrower's ability to repay the loan, the viability of the loan, and the adequacy of the value of the property that will secure the loan. The loan committee of the Bank can approve single residential and commercial loans up to $2 million,$2,000,000, and loans that aggregate up to $5 million$4,000,000 to one borrower. Single loans greater than $2 million,$2,000,000, or relationships greaterloans to one borrower aggregating more than $5 million,$4,000,000, up to $14,917,000$19,934,000 (the maximum amount of a loan to one borrower as of December 31, 2006)2008), must also have Board of DirectorDirectors’ approval. The Bank utilizes independent qualified appraisers approved by the Board of Directors to appraise the properties securing its loans and requires title insurance or title opinions so as to insure that the Bank has a valid lien on the mortgaged real estate. The Bank requires borrowers to maintain fire and casualty insurance on its secured properties.
The procedure for approval of construction loans is the same as for residential mortgage loans, except that the appraiser evaluates the building plans, construction specifications, and estimates of construction costs. The Bank also evaluates the feasibility of the proposed construction project and the experience and track record of the developer. In addition, all construction loans generally require a commitment from a third-party lender or from the Bank for a permanent long-term loan to replace the construction loan upon completion of construction.
11
Consumer loans are underwritten on the basis of the borrower's credit history and an analysis of the borrower's income and expenses, ability to repay the loan, and the value of the collateral, if any.
Currently, it is the Bank’s policy to originate both fixed-rate and adjustable-rate loans. The Bank is currently active in the secondary market and sells the majoritya portion of its fixed-rate loan products.loans.
Interest Rates, Points and Fees
The Bank realizes interest, point, and fee income from its lending activities. The Bank also realizes income from commitment fees for making commitments to originate loans, and from prepayment and late charges, loan fees, application fees, and fees for other miscellaneous services.
The Bank accounts for loan origination fees in accordance with the Statement of Financial Accounting Standards (“SFAS”) on Accounting for Nonrefundable Fees and Costs Associated with Originating or Acquiring Loans ("SFAS No. 91") issued by the Financial Accounting Standards Board (the "FASB"). SFAS No. 91 prohibits the immediate recognition of loan origination fees as revenues and requires that such income (net of certain direct loan origination costs) for each loan be amortized, generally by the interest method, over the estimated life of the loan as an adjustment of yield. The Bank also realizes income from gains on sales of loans, and servicing released fees for loans sold with servicing released.
Delinquency and Classified Assets
Delinquencies
The Board of Directors reviews delinquencies on all loans monthly. The Bank’sBancorp’s collection procedures include sending a past due notice to the borrower on the 17th day of nonpayment, making telephone contact with the borrower between 20 and 30 days after nonpayment, and sending a letter after the 30th day of nonpayment. A notice of intent to foreclose is sent between 60 and 90 days after delinquency. When the borrower is contacted, the BankBancorp attempts to obtain full payment of the past due amount. However, the BankBancorp generally will seek to reach agreement with the borrower on a payment plan to avoid foreclosure.
The Bank allocates reservesfirst group is made up of impaired loans as determined using SFAS 114. Loans are classified as impaired if they meet either of the following two criteria:
| · | Loans that are 90 days or more in arrears (non-accrual loans); or |
| · | Loans that are deemed impaired when, based on current information and events, it is probable that a borrower will be unable to collect all amounts due according to the contractual terms of the loan agreement (as per SFAS 114). |
Impaired loans are individually analyzed to its allowance for loan losses in two ways. Where the Bank has classified an asset it generally allocates the percentage of that asset under its classification system todetermine if a specific reserve ifis required. Management uses the asset is classified as Doubtful or Loss. In cases where loans are classified as Special Mention or Substandardcurrent appraisals of the Bank usually does not allocate its allowance for loan loss reservesunderlying collateral to determine if a specific reserve. The Bank doesreserve is necessary to reduce the loan’s carrying value down to the current fair market value of the underlying collateral. In addition, management, as appropriate, measures impairment based on the present value of expected future cash flows of the loan for loans that are not allocate its allowance for loan losses based upon the unclassified portion of its loan portfolio to specific loan reserves.solely collateral dependent.
The second group contains any loans that management deems “problem loans” that are not included in the impaired loan group. These loans have a general reserve placed on them based on several factors, including the inherent risk of the loan, current market conditions, the risk rating assigned to the loan and the historical performance of similar loans.
12
Management considers all loans with an internal risk rating of 6 or higher that are not included in impaired loans as problem loans. The general reserves in this group range from 2% to 8% primarily due to management’s assessment of historical performance of similar loans and to current market conditions.
The following table sets forth informationthird group is made up of all remaining loans, which are the loans performing as agreed upon in the underlying loan agreement. These loans have a general reserve placed on them based on the inherent risk of the loan, current market conditions, and the historical performance of similar loans. The general reserves in this group are approximately 1% primarily due to non-accrual loans. the loan type and management’s assessment of historical performance of similar loans and to current market conditions.
The Bank discontinues the accrual of interest on loans 90 days or more past due, at which time all previously accrued but uncollected interest is deducted from income. As of the most recent reported period, $416,000$4,430,000 in interest income would have been recorded for the year ended December 31, 20062008 if the loans had been current in accordance with their original terms and had been outstanding throughout the year ended December 31, 20062008 or since their origination (if held for only part of the fiscal year). For the year ended December 31, 2006, $188,0002008, $2,045,000 in interest income on such loans was actually included in net income. The following table sets forth information as to non-accrual loans and other non performing assets.
| At December 31, | ||||||||||||||||
| 2006 | 2005 | 2004 | 2003 | 2002 | ||||||||||||
| (dollars in thousands) | ||||||||||||||||
| Loans accounted for on a non-accrual basis: | ||||||||||||||||
| Mortgage loans: | ||||||||||||||||
| One-to-four family real estate | $ | 3,487 | $ | 1,693 | $ | 915 | $ | 378 | $ | 1,366 | ||||||
| Home equity lines of credit | - | - | - | 50 | - | |||||||||||
| Commercial | 98 | - | - | - | 253 | |||||||||||
| Land | 2,342 | - | 24 | 24 | 139 | |||||||||||
| Non-mortgage loans: | ||||||||||||||||
| Consumer | - | - | - | 17 | - | |||||||||||
| Commercial loans | - | - | - | - | - | |||||||||||
| Total non-accrual loans | $ | 5,927 | $ | 1,693 | $ | 939 | $ | 469 | $ | 1,758 | ||||||
| Accruing loans greater than 90 days past due | $ | - | $ | - | $ | - | $ | - | $ | - | ||||||
| Foreclosed real-estate | $ | 970 | $ | - | $ | - | $ | - | $ | 224 | ||||||
| Total non-performing assets | $ | 6,897 | $ | 1,693 | $ | 939 | $ | 469 | $ | 1,982 | ||||||
| Total non-accrual loans to net loans | 0.7 | % | 0.2 | % | 0.1 | % | 0.1 | % | 0.4 | % | ||||||
| Allowance for loan losses to total non-performing loans, | ||||||||||||||||
| including loans contractually past due 90 days or more | 152.3 | % | 443.3 | % | 632.1 | % | 1030.5 | % | 227.0 | % | ||||||
| Total non-accrual and accruing loans greater than | ||||||||||||||||
| 90 days past due to total assets | 0.7 | % | 0.2 | % | 0.1 | % | 0.1 | % | 0.4 | % | ||||||
| Total non-performing assets to total assets | 0.8 | % | 0.2 | % | 0.1 | % | 0.1 | % | 0.4 | % | ||||||
| At December 31, | ||||||||||||||||||||
| 2008 | 2007 | 2006 | 2005 | 2004 | ||||||||||||||||
| (dollars in thousands) | ||||||||||||||||||||
| Loans accounted for on a non-accrual basis: | ||||||||||||||||||||
| Mortgage loans: | ||||||||||||||||||||
| One-to-four family real estate | $ | 35,829 | $ | 4,992 | $ | 3,487 | $ | 1,693 | $ | 915 | ||||||||||
| Home equity lines of credit | 189 | - | - | - | - | |||||||||||||||
| Commercial | 3,047 | 336 | 98 | - | - | |||||||||||||||
| Land | 15,721 | 2,372 | 2,342 | - | 24 | |||||||||||||||
| Non-mortgage loans: | ||||||||||||||||||||
| Consumer | 9 | - | - | - | - | |||||||||||||||
| Commercial loans | - | - | - | - | - | |||||||||||||||
| Total non-accrual loans | $ | 54,795 | $ | 7,700 | $ | 5,927 | $ | 1,693 | $ | 939 | ||||||||||
| Accruing loans greater than 90 days past due | $ | - | $ | - | $ | - | $ | - | $ | - | ||||||||||
| Foreclosed real-estate | $ | 6,317 | $ | 2,993 | $ | 970 | $ | - | $ | - | ||||||||||
| Total non-performing assets | $ | 61,112 | $ | 10,693 | $ | 6,897 | $ | 1,693 | $ | 939 | ||||||||||
| Total non-accrual loans to net loans | 6.1 | % | 0.9 | % | 0.7 | % | 0.2 | % | 0.1 | % | ||||||||||
| Allowance for loan losses to total non-performing loans, | ||||||||||||||||||||
| including loans contractually past due 90 days or more | 27.0 | % | 140.0 | % | 152.3 | % | 443.3 | % | 632.1 | % | ||||||||||
| Total non-accrual and accruing loans greater than | ||||||||||||||||||||
| 90 days past due to total assets | 5.5 | % | 0.8 | % | 0.7 | % | 0.2 | % | 0.1 | % | ||||||||||
| Total non-performing assets to total assets | 6.2 | % | 1.1 | % | 0.8 | % | 0.2 | % | 0.1 | % | ||||||||||
Included in non-accrual one-to-four family loans at December 31, 2008 were 46 loans totaling $18,811,000 to consumers and 39 loans totaling $17,018,000 to builders. Included in non-accrual land loans at December 31, 2008 were 27 loans totaling $11,769,000 to consumers and 6 loans totaling $3,952,000 to builders.
13
Classified Assets and Allowance for Loan Losses
Federal regulations provide for the classification of loans and other assets, such as debt and equity securities, considered by the OTS to be of lesser quality, as “substandard,” “doubtful” or “loss assets.” An asset is considered substandard if the paying capacity and net worth of the obligor or the collateral pledged, if any, inadequately protects it. Substandard assets include those characterized by the distinct possibility that the insured institution will sustain some loss if the deficiencies are not corrected. Assets classified as doubtful have all of the weaknesses inherent in those classified substandard with the added characteristic that the weaknesses present make collection or liquidation in full highly questionable and improbable, on the basis of currently existing facts, conditions, and values. Assets classified as loss assets are those considered uncollectible and of such little value that their continuance as assets without the establishment of a specific loss reserve is not warranted. Assets that do not currently expose the insured institution to a sufficient degree of risk to warrant classification in one of these categories but possess credit deficiencies or potential weakness are required to be designated special mention by management.
When an insured institution classifies problem assets as either substandard or doubtful, it is required to establish general allowanceallowances for losses in an amount deemed prudent by management. General allowances represent loss allowances which have been established to recognize the inherent risk associated with lending activities, but which, unlike specific allowances, have not been allocated to particular problem assets. When an insured institution classifies problem assets as loss assets, it is required either to establish a specific allowance for losses equal to the full amount of the asset so classified or to charge-off such amount. An institution’s determination as to the classification of its assets is subject to scrutiny by the OTS, which can require the establishment of additional general or specific loss allowances. The Bank reviews monthly the assets in its portfolio to determine whether any assets require classification in accordance with applicable regulations.
Total classified loans as of December 31, 20062008 were $10,038,000. Allowance$83,964,000. The allowance for loan losses as of December 31, 20062008 was $9,026,000,$14,813,000, which is 0.9%was 1.6% of gross loans receivable and 152.3%27.0% of total non-performing loans.
[see table on following page]
14
The following table summarizes the allocation of the allowance for loan losses by loan type and the percent of loans in each category compared to total loans at the dates indicated:
| 2006 | 2005 | 2004 | 2003 | 2002 | |||||||||||||||
| Percentage of | Percentage of | Percentage of | Percentage of | Percentage of | |||||||||||||||
| Loans in each | Loans in each | Loans in each | Loans in each | Loans in each | |||||||||||||||
| Allowance | Category to | Allowance | Category to | Allowance | Category to | Allowance | Category to | Allowance | Category to | ||||||||||
| Amount | Total Loans | Amount | Total Loans | Amount | Total Loans | Amount | Total Loans | Amount | Total Loans | ||||||||||
| (dollars in thousands) | |||||||||||||||||||
| Residential, one to four family | $2,202 | 32.41% | $1,706 | 29.74% | $2,000 | 30.20% | $1,938 | 36.20% | $1,542 | 36.58% | |||||||||
| Multifamily | 33 | 0.57% | 67 | 0.49% | 20 | 0.34% | 21 | 0.14% | 21 | 0.27% | |||||||||
| Commercial and industrial real estate | 2,512 | 20.45% | 1,965 | 17.73% | 1,009 | 16.17% | 1.154 | 18.48% | 881 | 19.33% | |||||||||
| Construction and land acquisition and | |||||||||||||||||||
| development loans | 2,253 | 35.44% | 2,684 | 42.07% | 2,577 | 43.42% | 1,173 | 39.58% | 1,202 | 38.77% | |||||||||
| Land | 1,731 | 10.10% | 882 | 8.78% | 251 | 8.54% | 476 | 4.25% | 300 | 4.08% | |||||||||
| Business, commercial | 288 | 0.87% | 193 | 1.00% | 70 | 1.18% | 59 | 1.16% | 33 | 0.79% | |||||||||
| Other | 7 | 0.16% | 8 | 0.19% | 8 | 0.15% | 11 | 0.19% | 12 | 0.18% | |||||||||
| Total | $9,026 | 100.00% | $7,505 | 100.00% | $5,935 | 100.00% | $4,832 | 100.00% | $3,991 | 100.00% | |||||||||
| 2008 | 2007 | 2006 | 2005 | 2004 | ||||||||||||||||||||||||||||||||||||
| Percentage of Loans | Percentage of Loans | Percentage of Loans | Percentage of Loans | Percentage of Loans | ||||||||||||||||||||||||||||||||||||
| in each | in each | in each | in each | in each | ||||||||||||||||||||||||||||||||||||
| Allowance | Category to | Allowance | Category to | Allowance | Category to | Allowance | Category to | Allowance | Category to | |||||||||||||||||||||||||||||||
| Amount | Total Loans | Amount | Total Loans | Amount | Total Loans | Amount | Total Loans | Amount | Total Loans | |||||||||||||||||||||||||||||||
| (dollars in thousands) | ||||||||||||||||||||||||||||||||||||||||
| One to four family residential | $ | 5,765 | 42.46 | % | $ | 3,378 | 40.73 | % | $ | 2,202 | 32.41 | % | $ | 1,706 | 29.74 | % | $ | 2,000 | 30.20 | % | ||||||||||||||||||||
| Multifamily | 42 | 1.14 | % | 35 | 0.76 | % | 33 | 0.57 | % | 67 | 0.49 | % | 20 | 0.34 | % | |||||||||||||||||||||||||
| Commercial and industrial real estate | 3,080 | 21.63 | % | 3,332 | 22.41 | % | 2,512 | 20.45 | % | 1,965 | 17.73 | % | 1,009 | 16.17 | % | |||||||||||||||||||||||||
| Construction and land acquisition and | ||||||||||||||||||||||||||||||||||||||||
| development loans | 2,559 | 24.89 | % | 1,849 | 24.29 | % | 2,253 | 35.44 | % | 2,684 | 42.07 | % | 2,577 | 43.42 | % | |||||||||||||||||||||||||
| Land | 3,286 | 8.96 | % | 2,027 | 10.72 | % | 1,731 | 10.10 | % | 882 | 8.78 | % | 251 | 8.54 | % | |||||||||||||||||||||||||
| Commercial, non-real estate | 77 | 0.80 | % | 150 | 0.83 | % | 288 | 0.87 | % | 193 | 1.00 | % | 70 | 1.18 | % | |||||||||||||||||||||||||
| Other | 4 | 0.12 | % | 10 | 0.26 | % | 7 | 0.16 | % | 8 | 0.19 | % | 8 | 0.15 | % | |||||||||||||||||||||||||
| Total | $ | 14,813 | 100.00 | % | $ | 10,781 | 100.00 | % | $ | 9,026 | 100.00 | % | $ | 7,505 | 100.00 | % | $ | 5,935 | 100.00 | % | ||||||||||||||||||||
15
The following table contains information with respect to Bancorp’s allowance for loan losses for the periods indicated:
| At or for the Year Ended | ||||||||||||||||
| December 31 | ||||||||||||||||
| 2006 | 2005 | 2004 | 2003 | 2002 | ||||||||||||
| (dollars in thousands) | ||||||||||||||||
| Average loans outstanding, net | $ | 819,038 | $ | 738,028 | $ | 600,030 | $ | 466,512 | $ | 384,537 | ||||||
| Total gross loans outstanding at end of period | $ | 953,962 | $ | 927,993 | $ | 790,254 | $ | 608,222 | $ | 493,083 | ||||||
| Total net loans outstanding at end of period | $ | 835,477 | $ | 779,333 | $ | 656,967 | $ | 506,026 | $ | 418,825 | ||||||
| Allowance balance at beginning of period | $ | 7,505 | $ | 5,935 | $ | 4,832 | $ | 3,991 | $ | 3,353 | ||||||
| Provision for loan losses | 1,561 | 1,570 | 1,200 | 900 | 670 | |||||||||||
| Actual charge-offs | ||||||||||||||||
| 1-4 family residential real estate | - | - | 97 | 25 | - | |||||||||||
| Other | 40 | - | - | 34 | 32 | |||||||||||
| Total charge-offs | 40 | - | 97 | 59 | 32 | |||||||||||
| Recoveries | ||||||||||||||||
| Total recoveries | - | - | - | - | - | |||||||||||
| Net charge offs | - | - | 97 | 59 | 32 | |||||||||||
| Allowance balance at end of period | $ | 9,026 | $ | 7,505 | $ | 5,935 | $ | 4,832 | $ | 3,991 | ||||||
| Net charge offs as a percent of average loans | 0.00 | % | 0.00 | % | 0.02 | % | 0.01 | % | 0.01 | % | ||||||
| Allowance for loan losses to total gross loans at end of period | 0.95 | % | 0.81 | % | 0.75 | % | 0.79 | % | 0.81 | % | ||||||
| Allowance for loan losses to net loans at end of period | 1.08 | % | 0.96 | % | 0.90 | % | 0.95 | % | 0.95 | % | ||||||
| At or for the Year Ended | ||||||||||||||||||||
| December 31 | ||||||||||||||||||||
| 2008 | 2007 | 2006 | 2005 | 2004 | ||||||||||||||||
| (dollars in thousands) | ||||||||||||||||||||
| Average loans outstanding, net | $ | 893,030 | $ | 858,305 | $ | 819,038 | $ | 738,028 | $ | 600,030 | ||||||||||
| Total gross loans outstanding at end of period | $ | 973,651 | $ | 986,931 | $ | 953,962 | $ | 927,993 | $ | 790,254 | ||||||||||
| Total net loans outstanding at end of period | $ | 896,459 | $ | 893,014 | $ | 835,477 | $ | 779,333 | $ | 656,967 | ||||||||||
| Allowance balance at beginning of period | $ | 10,781 | $ | 9,026 | $ | 7,505 | $ | 5,935 | $ | 4,832 | ||||||||||
| Provision for loan losses | 7,481 | 2,462 | 1,561 | 1,570 | 1,200 | |||||||||||||||
| Actual charge-offs | ||||||||||||||||||||
| 1-4 family residential real estate | 2,571 | 270 | - | - | 97 | |||||||||||||||
| Other | 878 | 449 | 40 | - | - | |||||||||||||||
| Total charge-offs | 3,449 | 719 | 40 | - | 97 | |||||||||||||||
| Recoveries | ||||||||||||||||||||
| Total recoveries | - | 12 | - | - | - | |||||||||||||||
| Net charge offs | 3,449 | 707 | 40 | - | 97 | |||||||||||||||
| Allowance balance at end of period | $ | 14,813 | $ | 10,781 | $ | 9,026 | $ | 7,505 | $ | 5,935 | ||||||||||
| Net charge offs as a percent of average loans | 0.39 | % | 0.08 | % | 0.00 | % | 0.00 | % | 0.02 | % | ||||||||||
| Allowance for loan losses to total gross loans at end of period | 1.52 | % | 1.09 | % | 0.95 | % | 0.81 | % | 0.75 | % | ||||||||||
| Allowance for loan losses to net loans at end of period | 1.65 | % | 1.21 | % | 1.08 | % | 0.96 | % | 0.90 | % | ||||||||||
Investment Activities
Federal thrift institutions, such as the Bank, have authority to invest in various types of liquid assets, including United States Treasury obliga-tionsobligations and securities of various federal agencies, certificates of deposit at insured banks, bankers' acceptances and federal funds. As a member of the FHLB System, the Bank must maintain minimum levels of liquid assets specified by the OTS, which vary from time to time. Subject to various regulatory restrictions, federal thrift institutions may also invest a portion of their assets in certain commercial paper, corporate debt securities and mutual funds whose assets conform to the investments that a federal thrift institution is authorized to make directly.
The carrying amounts of the Bank’s investment securities held to maturity, as of the dates indicated are presented in the following table:
| At December 31, | ||||
| 2008 | 2007 | 2006 | ||
| (dollars in thousands) | ||||
| FHLB notes | $- | $1,000 | $5,000 | |
| Mortgage-backed securities | 1,345 | 1,383 | 2,271 | |
| Total Investment Securities Held to Maturity | $1,345 | $2,383 | $7,271 | |
| At December 31, | ||||||||||
| 2006 | 2005 | 2004 | ||||||||
| (dollars in thousands) | ||||||||||
| FHLB Notes | $ | 5,000 | $ | 5,000 | $ | 5,000 | ||||
| Mortgage-backed securities | 2,271 | 3,290 | 4,955 | |||||||
| Total Investment Securities Held to Maturity | $ | 7,271 | $ | 8,290 | $ | 9,955 | ||||
16
Investment Scheduled Maturity Table
As of December 31, 20062008
| More than One to | More than Five to | ||||||||||||||
| One Year or Less | Five Years | Ten Years | More than Ten Years | Total Investment Securities | |||||||||||
| Carrying | Average | Carrying | Average | Carrying | Average | Carrying | Average | Carrying | Average | Fair | |||||
| Amount | Yield | Amount | Yield | Amount | Yield | Amount | Yield | Amount | Yield | Value | |||||
| (dollars in thousands) | |||||||||||||||
| FHLB Notes | 4,000 | 2.58% | - | - | $1,000 | 5.05% | - | - | $5,000 | 3.07% | $4,925 | ||||
| Mortgage-backed securities | 796 | 4.50% | - | - | - | - | 1,475 | 5.47% | 2,271 | 5.13% | 2,192 | ||||
| Total | $4,796 | 2.90% | $- | - | $1,000 | 5.05% | $1,475 | 5.47% | $7,271 | 3.62% | $7,117 | ||||
| More than One to | More than Five to | More than | |||||||||||||
| One Year or Less | Five Years | Ten Years | Ten Years | Total Investment Securities | |||||||||||
| Carrying | Average | Carrying | Average | Carrying | Average | Carrying | Average | Carrying | Average | Fair | |||||
| Amount | Yield | Amount | Yield | Amount | Yield | Amount | Yield | Amount | Yield | Value | |||||
| (dollars in thousands) | |||||||||||||||
| Mortgage-backed securities | $- | - | $- | - | $- | - | $1,345 | 5.58% | $1,345 | 5.58% | $1,329 | ||||
17
Deposits
Deposits are attracted principally from within the Bank’s primary market areas through the offering of a variety of deposit instruments, including passbook and statement accounts and certificates of deposit ranging in terms from three months to five years. Deposit account terms vary, principally on the basis of the minimum balance required, the time periods the funds must remain on deposit and the interest rate. The Bank also offers individual retirement accounts.
The Bank’s policies are designed primarily to attract deposits from local residents rather than to solicit deposits from areas outside theirthe Bank’s primary markets. Interest rates paid, maturity terms, service fees and withdrawal penalties are established by the Bank on a periodic basis. Determination of rates and terms are predicated upon funds acquisition and liquidity requirements, rates paid by competitors, growth goals and federal regulations.
Deposits in the Bank as of December 31, 2006, 20052008, 2007 and 20042006 consisted of savings programs described below:
| 2006 | 2005 | 2004 | ||||||||
| (dollars in thousands) | ||||||||||
| NOW accounts | $ | 9,314 | $ | 7,683 | $ | 4,872 | ||||
| Money market accounts | 89,120 | 99,911 | 131,014 | |||||||
| Passbooks | 18,526 | 17,505 | 18,198 | |||||||
| Certificates of deposit | 490,865 | 445,592 | 356,447 | |||||||
| Non-interest bearing accounts | 18,699 | 24,202 | 16,882 | |||||||
| Total deposits | $ | 626,524 | $ | 594,893 | $ | 527,413 | ||||
| 2008 | 2007 | 2006 | ||||||||||
| (dollars in thousands) | ||||||||||||
| NOW accounts | $ | 12,813 | $ | 11,152 | $ | 9,314 | ||||||
| Money market accounts | 44,012 | 87,688 | 89,120 | |||||||||
| Passbooks | 53,319 | 14,891 | 18,526 | |||||||||
| Certificates of deposit | 554,747 | 523,698 | 490,865 | |||||||||
| Non-interest bearing accounts | 18,975 | 15,344 | 18,699 | |||||||||
| Total deposits | $ | 683,866 | $ | 652,773 | $ | 626,524 | ||||||
The following table contains information pertaining to the certificates of deposit held by the Bank in excess of $100,000 as of December 31, 2006.2008.
| Jumbo Certificates | ||||
| of Deposit | ||||
| Time Remaining Until Maturity | (dollars in thousands) | |||
| Less than three months | $ | 46,891 | ||
| 3 months to 6 months | 57,719 | |||
| 6 months to 12 months | 84,943 | |||
| Greater than 12 months | 42,106 | |||
| Total | $ | 231,659 | ||
18
Liquidity and Asset/Liability Management
Two major objectives of asset and liability management are to maintain adequate liquidity and to control the interest sensitivity of the balance sheet.
Liquidity is the measure of a company’s ability to maintain sufficient cash flow to fund operations and to meet financial obligations to depositors and borrowers. Liquidity is provided by the ability to attract and retain deposits and by principal and interest payments on loans and maturing securities in the investment portfolio. A strong core deposit base, supplemented by other deposits of varying maturities and rates, contributes to the Bank’s liquidity.
Interest rate sensitivity is maintaining the ability to reprice interest earning assets and interest bearing liabilities in relationship to changes in the general level of interest rates. Management attributes interest rate sensitivity to a steady net interest margin through all phases of interest rate cycles. Management attempts to make the necessary adjustments to constrain adverse swings in net interest income resulting from interest rate movements through gap analysis and income simulation modeling techniques.
Short Term Borrowings
The Bank has an available line of credit, secured by various loans in its portfolio, in the amount of thirty percent (30%) of its total assets, with the FHLB-Atlanta. As of December 31, 2006,2008, the total available line of credit with the FHLB-Atlanta for short term and long-term borrowings was $273,575,000.$303,971,000. The Bank, from time to time, utilizes the line of credit when interest rates are more favorable thenthan obtaining deposits from the public. The following table sets forth short-term borrowings with the FHLB-Atlanta, with original maturities of one year or less.
| Years ended December 31, | ||||||||||
| 2006 | 2005 | 2004 | ||||||||
| (dollars in thousands) | ||||||||||
| Short term borrowings and notes payable | ||||||||||
| Average balance outstanding during the period | $ | 8,250 | $ | 25,833 | $ | 15,567 | ||||
| Maximum amount outstanding at any month-end during | ||||||||||
| the period | 26,000 | 41,000 | 41,000 | |||||||
| Weighted Average interest rate during the period | 5.31 | % | 3.30 | % | 1.67 | % | ||||
| Total short term borrowings at period end | 18,000 | 26,000 | - | |||||||
| Weighted average interest rate at period end | 5.41 | % | 3.33 | % | 0.00 | % | ||||
| Years ended December 31, | ||||||||||||
| 2008 | 2007 | 2006 | ||||||||||
| (dollars in thousands) | ||||||||||||
| Short term borrowings | ||||||||||||
| Average balance outstanding during the period | $ | 1,667 | $ | 10,417 | $ | 8,250 | ||||||
| Maximum amount outstanding at any month-end during | ||||||||||||
| the period | 10,000 | 25,000 | 26,000 | |||||||||
| Weighted average interest rate during the period | 3.74 | % | 4.68 | % | 5.31 | % | ||||||
| Total short term borrowings at period end | - | 15,000 | 18,000 | |||||||||
| Weighted average interest rate at period end | - | 4.40 | % | 5.41 | % | |||||||
19
Employees
As of December 31, 2006,2008, Bancorp and its subsidiaries had approximately 121106 full-time equivalent employees. Bancorp’s employees are not represented by any collective bargaining group, and management considers its relations with its employees to be excellent.
SBI Mortgage Company
SBI is a subsidiary of Bancorp that has engaged in the origination of mortgages not suitable for the Bank. It owns subsidiary companies that have or are negotiating to purchase real estate for investment purposes. As of December 31, 2006,2008, SBI had $1,685,000$2,664,000 in outstanding mortgage loans and it had $408,000$468,000 invested in subsidiaries, which funds were held in cash, pending potential acquisition of investment real estate.
Crownsville Development Corporation
HS West, LLC
HS West, LLC (“HS”) is a subsidiary of the Bank, and is constructingconstructed a building in Annapolis, Maryland that effective January 2007 will serveserves as Bancorp’s and the Bank’s administrative headquarters. A branch office of the Bank is included. As of December 31, 2006, HS West, LLC has incurred approximately $26,312,000 of costs, which are included in land and construction in progress. The total cost, which includes build-out costs on leased space, is expected to be approximately $28,000,000 with completion mid 2007. HS has entered into agreements to lease all the remaining spacealso located in the building not occupied bybuilding. In addition, HS leases space to four unrelated companies and to a law firm of which the President of Bancorp and the Bank and Bancorp.is a partner.
Homeowners Title and Escrow Corporation
Homeowners Title and Escrow Corporation, is a subsidiary of the Bank, and iswas engaged in the business of conducting loan settlements for the Bank. During 2008, Homeowners Title and Escrow Corporation ceased operations.
20
Regulation
The financial services industry in the Bank’s market area is highly competitive, including competition from commercial banks, savings banks, credit unions, finance companies and non-bank providers of financial services. Several of the Bank’s competitors have legal lending limits that exceed that of the Bank’s, as well as funding sources in the capital markets that exceeds the Bank’s availability. The increased competition has resulted from a changing legal and regulatory climate, as well as from the economic climate.
General
Savings and loan holding companies and savings associations are extensively regulated under both federal and state law. This regulation is intended primarily for the protection ofto protect depositors and the DIFDeposit Insurance Fund (“DIF”), and not for the benefit of stockholders of Bancorp. The following informationsummary below describes certain aspects ofbriefly the regulation that regulationis applicable to Bancorp and the Bank, and does not purport to be complete. The discussioncomplete and is qualified in its entirety by reference to all particular statutory or regulatory provisions.applicable laws and regulations.
Regulation of Bancorp
General. Bancorp isAs a unitary savings and loan holding company, subject to regulatory oversight by the OTS. As such, Bancorp is required to register and file reports with the OTS and is subject to regulation and examination by the OTS. In addition, the OTS has enforcement authority over Bancorp and its subsidiaries, which also permits the OTS to restrict or prohibit activities that are determined to be a serious risk to the subsidiary savings association.
Activities Restriction Test. As a unitary savings and loan holding company, Bancorp generally is not subject to activity restrictions, provided the Bank satisfies the Qualified Thrift Lender (“QTL”) test. The termination of the “unitary thrift holding company exemption” in 1999 did not affect Bancorp because Bancorp was grandfathered under the law. Under certain circumstances, Bancorp could lose its grandfathered status. If the Bank failed to meet the QTL test, or meetsthen Bancorp would become subject to the definition of domestic buildingactivities restrictions applicable to multiple savings and loan association pursuantholding companies and, unless the Bank qualified as a QTL within one year thereafter, Bancorp would be required to register as, and would become subject to the Code.restrictions applicable to, a bank holding company. Additionally, if Bancorp were to acquire control of another savings association, either through merger or other combination with the Bank or other than in a supervisory acquisition where the acquired association also met the QTL test, Bancorp would thereupon become a multiple savings and loan holding company and would thereafter be subject to further restrictions on its activities. Bancorp presently intends to continue to operate as a unitary savings and loan holding company. Recent legislation terminated the “unitary thrift holding company exemption” for all companies that apply to acquire savings associations after May 4, 1999. Since Bancorp is grandfathered, its unitary holding company powers and authorities were not affected. See “Regulation of Bancorp - Financial Modernization Legislation.” However, if Bancorp acquires control of another savings association as a separate subsidiary, it would become a multiple
Restrictions on Acquisitions. Except under limited circumstances, savings and loan holding companies, such as Bancorp, are prohibited from acquiring, without prior approval of the OTS, (i) more than 5% of the voting shares of a savings association or a holding company which is not a subsidiary thereof or (ii) acquiring control of an uninsured institution, or retaining, for more than one year after the date of any savings association becomes uninsured, control of such association. In evaluating proposed acquisitions of savings institutions by holding companies, the OTS considers the financial and managerial resources and future prospects of the holding company and the activities of Bancorp and any of its subsidiaries (other thantarget institution, the Bank or any other DIF-insured savings association) would become subject to restrictions applicable to bank holding companies unless such other associations each also qualify as a QTL or domestic building and loan association and were acquired in a supervisory acquisition. Furthermore, if Bancorp were in the future to sell controleffect of the Bank to any other company, such company would not succeed to Bancorp grandfathered status underacquisition on the GLB (as defined below in “Regulation of Bancorp - Financial Services Modernization Legislation”) and would be subjectrisk to the same business activity restrictions as any other bank holding company. See “- RegulationDIF, the convenience and the needs of the Bank - Qualified Thrift Lender Test.”community and competitive factors.
21
The OTS is prohibited from approving any acquisition that would result in a multiple savings and loan holding company controlling savings institutions in more than one state, subject to two exceptions: (i) the approval of interstate supervisory acquisitions by savings and loan holding companies; and (ii) the acquisition of a savings institution in another state if the laws of the state of the target savings institution specifically permit such acquisitions. The states vary in the extent to which they permit interstate savings and loan holding company acquisitions.
Federal Securities Law. Bancorp’s securities are currently registered with the Securities and Exchange Commission under the Securities Exchange Act of 1934, as amended. As such, Bancorp is subject to the information, proxy solicitation, insider trading, and other requirements and restrictions of the Securities Exchange Act of 1934.
Financial Services Modernization Legislation. In November 1999, the Gramm-Leach-Bliley Act of 1999 (the “GLB”(“GLBA”) was enacted. As a result of GLB new opportunities became available to financial institution holding companies as it removed the restrictions that resulted from a regulatory framework that had its origin in the Great Depression of the 1930s. In addition, the GLB also contains provisions that expressly preempt any state law restricting the establishment of financial affiliations, primarily related to insurance.
The general effect of GLB is to permitGLBA generally permits banks, other depository institutions, insurance companies and securities firms to enter into combinations that result in a single financial services organization to offer customers a wider array of financial services and products through a new entity knownso long as a “financial holding company.” “Financial activities” is broadly defined to include not only banking, insurance and securities activities, but other activities incidental to such financial activities or complementary activities thatthey do not pose a substantial risk to the safety and soundness of depository institutions or the financial system generally.
The GLB also permits national banks to engage in expanded activities through the formation of financial subsidiaries. A national bank may have a subsidiary engaged in any activity authorized for national banks directly or any financial activity, except for insurance underwriting, insurance investments, real estate investment or development, or merchant banking, which may only be conducted through a subsidiary of a financial holding company. Financial activities include all activities permitted under new sections of the Bank Holding Company Act or permitted by regulation.
Troubled Assets Relief Program. During the fourth quarter of 2008, the U.S. Department of the Treasury (the “Treasury”) instituted the Troubled Assets Relief Program (the “TARP”) pursuant to the Emergency Economic Stabilization Act of 2008 (the “EESA”) in an effort to stabilize the nation’s capital markets. To carry out the TARP, the Treasury established the Capital Purchase Program (the “CPP”) which financial institutions may participate in on a voluntary basis.
Bancorp elected to participate in the CPP and entered into agreements to sell certain securities to the Treasury on November 21, 2008 (the “CPP Agreements”). As a result of, and condition to, the CPP Agreements, Bancorp will be subject to certain restrictions, requirements and limitations related to executive compensation (which are generally applicable to the CEO, CFO and three next most highly compensated executive officers of Bancorp), dividend payments and stock repurchase activities.
Maryland Corporation Law. Bancorp is incorporated under the laws of the State of Maryland, and is therefore subject to regulation by the state of Maryland. The rights of Bancorp’s stockholders are governed by the Maryland General Corporation Law.
Regulation of the Bank
General. As a federally chartered, DIF-insured savings association, the Bank is subject to extensive regulation by the OTS and the FDIC. Lending activities and other investments of the Bank must comply with various statutory and regulatory requirements. The Bank is also subject to certain reserve requirements promulgated by the FRB.
The OTS, in conjunction with the FDIC, regularly examines the Bank and prepares reports for the consideration of the Bank’s Board of Directors on any deficiencies found in the operations of the Bank. The relationship between the Bank and depositors and borrowers is also regulated by federal and state laws, especially in such matters as the ownership of savings accounts and the form and content of mortgage documents utilized by the Bank.
22
The Bank must file reports with the OTS and the FDIC concerning its activities and financial condition, in addition to obtaining regulatory approvals prior to entering into certain transactions such as mergers with or acquisitions of other financial institutions. This regulation and supervision establishes a comprehensive framework of activities in which an institution can engage and is intended primarily for the protection of the DIF and depositors. The regulatory structure also gives the regulatory authorities extensive discretion in connection with their supervisory and enforcement activities and examination policies, including policies with respect to the classification of assets and the establishment of adequate loan loss reserves for regulatory purposes. Any change in such regulations, whether by the OTS, the FDIC, the FRB or the Congress could have a material adverse impact on Bancorp, the Bank, and their operations.
Regulatory Capital Requirements. The federal banking agencies have adoptedOTS regulations require that the Bank meet three minimum requirement standards including: (i) tangible capital equal to at least 1.5% of adjusted total assets; (ii) a leverage ratio consisting of Tier I or “core” capital equal to at least 4% (or 3%, if the Bank is rated 1 CAMELS under the OTS examination rating system) of adjusted total assets; and (iii) risk-based minimum capital guidelines intendedequal to provide a measureat least 8% of capital that reflects the degree of risk associated with a banking organization’s operations for both transactions reported on the balance sheet as assets and transactions which are recorded as off balance sheet items. Under these guidelines, nominal dollar amounts of assets and credit equivalent amounts of off balance sheet items are multiplied by one of several risk adjustment percentages, which range from 0% for assets with low credit risk federal banking agencies, to 100% for assets with relatively high credit risk.total risk-weighted assets.
Tangible capital is generally defined the same as core capital but does not include an exception for qualifying supervisory goodwill and is reduced by the amount of hybridall the savings association’s intangible assets with only a limited exception for certain mortgage servicing rights. Both core and tangible capital instruments,are further reduced by an amount equal to a savings institution’s debt and equity investments in subsidiaries engaged in activities not permissible for national banks (other than subsidiaries engaged in activities undertaken as agent for customers or in mortgage banking activities and subsidiary depository institutions or their holding companies). Investments in and extensions of credit to such subsidiaries are required to be fully netted against tangible and core capital. At December 31, 2008, the Bank had no such investments.
Total capital equals the sum of Tier I (Core) capital and supplementary capital, to the extent that supplementary capital does not exceed Tier I (Core) capital. Supplementary capital includes, among other items, cumulative perpetual preferred stock, perpetual subordinate debt, mandatory convertible subordinate debt, securities, a limited amount of subordinated debt,intermediate-term preferred stock, that does not qualify as Tier I capital, a limited amountthe portion of the allowance for loan losses not designated for specific loan losses (up to 1.25% of risk-weighted assets) and lease losses and a limited amountup to 45% of unrealized holding gains on equity securities. “Tier III capital” consistsFor purposes of qualifying unsecured subordinated debt. The sum of Tier II and Tier IIIdetermining total capital, may not exceeda savings institution’s assets are reduced by the amount of Tier I capital.capital instruments held by other depository institutions pursuant to reciprocal arrangements and by the amount of the institution’s equity investments (other than those deducted from core and tangible capital) and its high loan-to-value ratio land loans and non-residential construction loans.
A savings institution’s risk based capital requirement is measured against risk-weighted assets, which equal the sum of each on-balance sheet asset and the credit-equivalent amount of each off-balance-sheet item after being multiplied by an assigned risk weight. These risk weights range from 0% for cash to 100% for delinquent loans, property acquired through foreclosure, commercial loans, and certain other assets.
23
As shown below, the Bank’s regulatory capital exceeded all minimum regulatory capital requirements applicable to it as of December 31, 2006.2008.
Actual | Required For Capital Adequacy Purposes | Required To Be Well Capitalized Under Prompt Corrective Action Provisions | |||||||||||||||||
| Amount | % | Amount | % | Amount | % | ||||||||||||||
| (dollars in thousands) | |||||||||||||||||||
| December 31, 2006 | |||||||||||||||||||
| Tangible (1) | $ | 99,445 | 11.0 | % | $ | 13,513 | 1.50 | % | N/A | N/A | |||||||||
| Tier I capital (2) | 99,445 | 13.1 | % | N/A | N/A | $ | 45,582 | 6.00 | % | ||||||||||
| Core (1) | 99,445 | 11.0 | % | 36,034 | 4.00 | % | 45,043 | 5.00 | % | ||||||||||
| Total (2) | 108,452 | 14.3 | % | 60,776 | 8.00 | % | 75,971 | 10.00 | % | ||||||||||
| December 31, 2005 | |||||||||||||||||||
| Tangible (1) | $ | 86,354 | 10.3 | % | $ | 12,619 | 1.50 | % | N/A | N/A | |||||||||
| Tier I capital (2) | 86,354 | 12.2 | % | N/A | N/A | $ | 42,395 | 6.00 | % | ||||||||||
| Core (1) | 86,354 | 10.3 | % | 33,651 | 4.00 | % | 42,064 | 5.00 | % | ||||||||||
| Total (2) | 93,851 | 13.3 | % | 56,527 | 8.00 | % | 70,659 | 10.00 | % | ||||||||||
Actual | Required For Capital Adequacy Purposes | Required To Be Well Capitalized Under Prompt Corrective Action Provisions | ||||||||||||||||||||||
| Amount | % | Amount | % | Amount | % | |||||||||||||||||||
| (dollars in thousands) | ||||||||||||||||||||||||
| December 31, 2008 | ||||||||||||||||||||||||
| Tangible (1) | $ | 132,890 | 13.5 | % | $ | 14,743 | 1.50 | % | N/A | N/A | ||||||||||||||
| Tier I capital (2) | 132,890 | 16.9 | % | N/A | N/A | $ | 47,047 | 6.00 | % | |||||||||||||||
| Core (1) | 132,890 | 13.5 | % | 39,314 | 4.00 | % | 49,142 | 5.00 | % | |||||||||||||||
| Total (2) | 142,199 | 18.1 | % | 62,730 | 8.00 | % | 78,412 | 10.00 | % | |||||||||||||||
| December 31, 2007 | ||||||||||||||||||||||||
| Tangible (1) | $ | 107,734 | 11.3 | % | $ | 14,321 | 1.50 | % | N/A | N/A | ||||||||||||||
| Tier I capital (2) | 107,734 | 13.7 | % | N/A | N/A | $ | 47,144 | 6.00 | % | |||||||||||||||
| Core (1) | 107,734 | 11.3 | % | 38,190 | 4.00 | % | 47,737 | 5.00 | % | |||||||||||||||
| Total (2) | 117,205 | 14.9 | % | 62,859 | 8.00 | % | 78,573 | 10.00 | % | |||||||||||||||
____________ |
(1) To adjusted total assets.
(2) To risk-weighted assets.
Enforcement. The Home Owners’ Loan Act (“HOLA”) permitsOTS has primary enforcement responsibility over federal savings associations notinstitutions and has the authority to bring enforcement action against all “institution-affiliated parties,” including stockholders, attorneys, appraisers and accountants who knowingly or recklessly participate in compliance with the OTS capital standardswrongful action likely to seekhave an exemption from certain penalties or sanctions for noncompliance. Suchadverse effect on an exemption will be granted only if certain strict requirements are met, and must be denied under certain circumstances. If an exemption is grantedinsured institution. Formal enforcement actions by the OTS may range from issuance of a capital directive or cease and desist order, to removal of officers or directors of the institution and the appointment of a receiver or conservator. The FDIC also has the authority to terminate deposit insurance or recommend to the director of the OTS that enforcement action be taken with respect to a particular savings association still may be subjectinstitution. If action is not taken by the director of the OTS, the FDIC has authority to enforcement actions for other violations of law or unsafe or unsound practices or conditions.take action under specific circumstances.
Safety and Soundness Standards. Pursuant to the requirements of the Federal Deposit Insurance Corporation Improvement Act, as amended by the Riegle Community Development and Regulatory Improvement Act of 1994,law requires each federal banking agency, including the OTS, has adopted guidelines establishing generalto prescribe to certain standards relating to internal controls, information and internal audit systems, loan documentation, credit underwriting, interest rate risk exposure, asset growth, asset quality, earnings and compensation, fees and benefits. In general, the guidelines require, among other things, appropriate systems and practices to identify and manage the risks and exposures specified in the guidelines. The guidelines prohibitfurther provide that savings institutions should maintain safeguards to prevent the payment of compensation, fees and benefits that are excessive or that could lead to material financial loss, and should take into account factors such as comparable compensation as an unsafe and unsound practice and describe compensation as excessive when the amounts paid are unreasonable or disproportionate to the services performed by an executive officer, employee, director, or principal stockholder.
Prompt Corrective Action. TheUnder the prompt corrective action regulation ofregulations, the OTS requires certain mandatoryis required and authorized to take supervisory actions and authorizes certain other discretionary actions to be taken by the OTS against aundercapitalized savings association that falls within certain undercapitalized capital categories specified in the regulation.
associations. The regulation establishes five categories of capital classification:
| · | “well capitalized” (at least 5% leverage capital, 6% Tier I risk-based capital and 10% total risk-based capital); |
| · | “adequately capitalized” (at least 4% leverage capital, 4% Tier I risk-based capital and 8% total risk-based capital); |
| · | “undercapitalized” (less than 4% leverage capital, 4% Tier I risk-based capital or 8% total risk-based capital); |
| · | “significantly undercapitalized” (less than 3% leverage capital, 3% Tier I risk-based capital or 6% total risk-based capital); and |
| · | “critically undercapitalized” (less than 2% tangible capital). |
24
Generally, the banking regulator is required to appoint a receiver or conservator for an institution that is “critically undercapitalized”. The regulation also provides that a capital restoration plan must be filed with the OTS within 45 days of the date an institution receives notice that it is “undercapitalized”, “significantly undercapitalized” or “critically undercapitalized”. In addition, numerous mandatory supervisory actions become immediately applicable to the institution, including, but not limited to, restrictions on growth, investment activities, payment of dividends and other capital distributions, and affiliate transactions. The OTS may also take any one of a number of discretionary supervisory actions against the undercapitalized institutions, including the issuance of a capital directive and the replacement of senior executive officers and directors.
As of December 31, 2006,2008, the Bank met the capital requirements of a “well capitalized” institution under applicable OTS regulations.
On December 16, 2008, the FDIC adopted a final rule increasing risk-based assessment rates uniformly by 7 basis points. Under this rule, FDIC assessments will range from 12 to 50 basis points of assessable deposits during the first quarter of 2009 with the expectation that most institutions would be charged between 12 and 14 basis points.
The amended restoration plan was accompanied by a final rule that sets assessment rates and makes adjustments that improve how the assessment system differentiates for risk. Under the final rule, banks in the Bank were insured by the Savings Association Insurance Fund (“SAIF”), administered by the FDIC. On February 8, 2006 the Federal Deposit Insurance Reform Act of 2005 was enacted, which among other things, merged the SAIF with the Bank Insurance Fund (“BIF”), creating the DIF, effective as of March 31, 2006.best risk category will pay initial base rates ranging from 12 to 16 cents per $100 on an annual basis, beginning on April 1, 2009.
The FDIC has also adopted an interim rule imposing a new risk-based premium system that provides for quarterly assessments based20 basis point emergency special assessment on the industry on June 30, 2009. The assessment is to be collected on September 30, 2009. The interim rule would also permit the FDIC to impose an insured institution's rankingemergency special assessment after June 30, 2009, of up to 10 basis points if necessary to maintain public confidence in one of four risk categories that are based upon supervisory and capital evaluations. The FDIC’s regulations establish four risk categories. Risk Category I, for well-capitalized institutions that are financially sound with only a few minor weaknesses, includes about 95% of FDIC-insured institutions based on FDIC estimates. Bancorp is within Risk Category I. Risk Categories II, III and IV present progressively greater risksfederal deposit insurance.
In response to the DIF. Effectiveeconomic turbulence of 2008, deposit insurance per account has been raised to $250,000 of all types of accounts until January 1, 2007, Risk Category I2010. Further, the FDIC has adopted a Temporary Liquidity Guarantee Program pursuant to which, for a fee, non-interest bearing transaction accounts would be insured without limit through December 31, 2009 and certain unsecured debt issued by institutions pay quarterly assessments for deposit insurance at annual rates of 5 to 7 basis points (i.e., $0.05 to $0.07 per $100 of assessable deposits). The rates for Risk Categories II, III and IV are 10, 28their holding companies on or after October 14, 2008 through and 43 basis points, respectively. With advance notice to insured institutions, rates are subject to change. Within Risk Category I, the precise rate for an individual institution with less than $10 billion in assets is generally determined by a formula using CAMELS ratings, which are bank ratings assigned in examinations, and financial ratios. A different method applies for larger institutions. The rate for an individual institution is applied to its assessment base, consisting generally of its deposit liabilities subject to certain adjustments. An institution insuredincluding June 30, 2009 would be guaranteed by the FDIC on December 31, 1996 which had previously paid assessments (or its successor) is eligible for certain credit against deposit insurance assessments. Any increase in assessments or the assessment rate could have a material adverse effect on Bancorp’s earning, depending on the amount of the increase.through June 30, 2012.
The FDIC is authorized to terminate a depository institution’s deposit insurance upon a finding by the FDIC that the institution’s financial condition is unsafe or unsound or that the institution has engaged in unsafe or unsound practices or has violated any applicable rule, regulation, order or condition enacted or imposed by the institution’s regulatory agency. The termination of deposit insurance for one or more of Bancorp’s subsidiary depository institutionsthe Bank could have a material adverse effect on Bancorp’s earnings, depending on the collective size of the particular institutions involved.
25
All FDIC-insured depository institutions must pay an annual assessment to provide funds for the payment of interest on bonds issued by the Financing Corporation, a federal corporation chartered under the authority of the Federal Housing Finance Board. The bonds, commonly referred to as Financing Corporation (“FICO”) bonds, were issued to capitalize the Federal Savings and Loan Insurance Corporation. The annual FICO assessment rate as of the first quarter of 20072009 is 1.221.14 basis points (i.e. $0.0122$0.0114 for every $100 of assessable deposits). The FICO assessments are adjusted quarterly to reflect changes in the assessment bases of the FDIC’s insurance funds and do not vary depending on a depository institution’s capitalization or supervisory evaluations.
The FDIC has authority to increase insurance assessments. A significant increase in insurance premiums would likely have an adverse effect on the operating expenses of the Bank.
Privacy. Federal banking rules limit the ability of banks and other financial institutions to disclose non-public information about consumers to nonaffiliated third parties. Pursuant to these rules, financial institutions must provide:
| · |
| · | a reasonable method for customers to “opt out” of disclosures to nonaffiliated third parties. |
Loans-to-One Borrower Limitations. Savings associations generally are subject to the lending limits applicable to national banks. With certain limited exceptions, the maximum amount that a savings association or a national bank may lend to any borrower (including certain related entities of the borrower) at one time may not exceed 15% of the unimpaired capital and surplus of the institution, plus an additional 10% of unimpaired capital and surplus for loans fully secured by readily marketable collateral. Savings associations are additionally authorized to make loans to one borrower, for any purpose, in an amount not to exceed $500,000 or, by order of the Director of the OTS, in an amount not to exceed the lesser of $30,000,000 or 30% of unimpaired capital and surplus to develop residential housing, provided:
| · | the purchase price of each single-family dwelling in the development does not exceed $500,000; |
| · | the savings association is in compliance with its fully phased-in capital requirements; |
| · | the loans comply with applicable loan-to-value requirements; and |
| · | the aggregate amount of loans made under this authority does not exceed 150% of unimpaired capital and surplus. |
At December 31, 2006,2008, the Bank’s loans-to-one-borrower limit was $14,917,000$19,934,000 based upon the 15% of unimpaired capital and surplus measurement. At December 31, 2006,2008, the Bank’s two largest single lending relationshiprelationships had an outstanding balance of $7,158,000 secured by commercial property located in Annapolis, Maryland and a $7,000,000 and consistedloan consisting of a line of credit secured by assignments of notes, Deeds of Trust, pledged stock and certificates of deposit. The loan wasloans were performing in accordance with itstheir terms.
Qualified Thrift Lender Test. Savings associations must meet a QTL test, which test may be met either by maintaining a specified levelat least 65% of its portfolio assets in qualified thrift investments as specified in HOLA or by meeting the definition of a “domestic building and loan association” as defined in the Code.Code, in either case in at least nine of the most recent twelve month period. “Portfolio Assets” generally means total assets of a savings institution, less the sum of specified liquid assets up to 20% of total assets, goodwill and other intangible assets, and the value of property used in the conduct of the savings association’s business. Qualified thrift investments are primarily residential mortgages and related investments, including certain mortgage-related securities. The required percentage of investments under HOLA is 65% of assets while the Code requires investments of 60% of assets. An association must be in compliance with the QTL test or the definition of domestic building and loan association on a monthly basis in nine out of every 12 months. Associations that fail to meet the QTL test will generally be prohibited from engaging in any activity not permitted for bothmust either convert to a national bank and a savings association.charter or operate under specified restrictions. As of December 31, 2006,2008, the Bank was in compliance with its QTL requirement and met the definition of a domestic building and loan association.
26
Affiliate Transactions. TransactionsGenerally, transactions between a savings associationbank or its subsidiaries and its "affiliates" are quantitatively and qualitatively restricted underaffiliates (i.e. companies that control the Federal Reserve Act and regulations adopted by the Federal Reserve. Affiliates of a savings association include, among other entities, the savings association's holding company and companies thatBank or are under common control with the savings association. In general, a savings association or its subsidiaries are limited in their ability to engage in "covered transactions" with affiliates:
non-affiliates. In addition, undercertain of these transactions are restricted to a percentage of the OTS regulations:
The bank’s authority to extend credit to executive officers, directors, trustees and 10% stockholders, as well as entities under such person’s control, is currently governed by Section 22(g) and 22(h) of the Federal Reserve Act and Regulation O promulgated by the FRB. Among other things, these regulations alsogenerally require savings associationssuch loans to be made on terms substantially similar to those offered to unaffiliated individuals, place limits on the amounts of the loans the Bank may make to such persons based, in part, on the Bank’s capital position, and retain records that reflect affiliate transactions in reasonable detail and provide that specified classesrequire certain board of savings associations maydirectors’ approval procedures to be required to give the OTS prior notice of affiliate transactions.followed.
Capital Distribution Limitations. OTS regulations impose limitations upon all capital distributions by savings associations, such as cash dividends, payments to repurchase or otherwise acquire its shares, payments to shareholders of another institution in a cash-out merger and other distributions charged against capital.
The OTS regulations require a savings association to file an application for approval of a capital distribution if:
| · |
| · | the total amount of all of capital distributions, including the proposed capital distribution, for the applicable calendar year exceeds its net income for that year to date plus retained net income for the preceding two years; |
| · |
| · | the |
In addition, a savings association must give the OTS notice of a capital distribution if the savings association is not required to file an application, but:
| · | would not be well capitalized under the prompt corrective action regulations of the OTS following the distribution; |
| · | the proposed capital distribution would reduce the amount of or retire any part of the savings association's common or preferred stock or retire any part of debt instruments like notes or debentures included in capital, other than regular payments required under a debt instrument approved by the OTS; or |
| · | the savings association is a subsidiary of a savings and loan holding company. |
Branching. Under OTS branching regulations, the Bank is generally authorized to open branches within or beyond the State of Maryland if the Bank (1) continuesqualifies as a “domestic building and loan association” under the Code, which qualification requirements are similar to meetthose for a Qualified Thrift Lender under the requirements of a “highly-rates” federal savings bank. AndHome Owners’ Loan Act, and (2) publishes public notice at least 3530 days before opening a branch and no one opposes the branch. If a comment in opposition to a branch opening is filed and the OTS determines the comment to be relevant to the approval process standards, and to require action in response, the OTS may, among other things, require a branch application or elect to hold a meeting with the Bank and the person who submitted the comment. The OTS authority preempts any state law purporting to regulate branching by federal savings banks. Commercial banks can also branch across state lines, subject to any state law limitations or prohibitions. Competition may increase further as banks branch across state lines and enter new markets.
Community Reinvestment Act and the Fair Lending Laws. Savings associations have a responsibility under the Community Reinvestment Act and related regulations of the OTS to help meet the credit needs of their communities, including low- and moderate-income neighborhoods. In addition, the Equal Credit Opportunity Act and the Fair Housing Act prohibit lenders from discriminating in their lending practices on the basis of characteristics specified in those statutes. An institution's failure to comply with the provisions of the Community Reinvestment Act could, at a minimum, result in regulatory restrictions on its activities and the denial of applications. In addition, an institution's failure to comply with the Equal Credit Opportunity Act and the Fair Housing Act could result in the OTS, other federal regulatory agencies as well as the Department of Justice taking enforcement actions. Based on an examination conducted July 7, 2003,May 30, 2006, the Bank received a satisfactory rating.
27
Federal Home Loan Bank System. The Bank is a member of the FHLB-Atlanta. Among other benefits, each FHLB serves as a reserve or central bank for its members within its assigned region. Each FHLB is financed primarily from the sale of consolidated obligations of the FHLB system. Each FHLB makes available loans or advances to its members in compliance with the policies and procedures established by the Board of Directors of the individual FHLB. As an FHLB member, the Bank is required to own capital stock in an FHLB in an amount equal to the greater of:
Federal Reserve System. The FRB requires all depository institutions to maintain non-interest bearing reserves at specified levels against their transaction accounts (primarily checking, NOW, and Super NOW checking accounts) and non-personal time deposits. At December 31, 2006,2008, the Bank was in compliance with these requirements.
Activities of Subsidiaries. A savings association seeking to establish a new subsidiary, acquire control of an existing company or conduct a new activity through a subsidiary must provide 30 days prior notice to the FDIC and the OTS and conduct any activities of the subsidiary in compliance with regulations and orders of the OTS. The OTS has the power to require a savings association to divest any subsidiary or terminate any activity conducted by a subsidiary that the OTS determines to pose a serious threat to the financial safety, soundness or stability of the savings association or to be otherwise inconsistent with sound banking practices.
Tying Arrangements. Federal savings associations are prohibited, subject to some exceptions, from extending credit to or offering any other services, or fixing or varying the consideration for such extension of credit or service, on the condition that the customer obtain some additional service from the institution or its affiliates or not obtain services of a competitor of the institution.
Item 1A. Risk Factors
Unless the context indicates otherwise, all references to “we,” “us,” “our” in this subsection “Risk Factors” refer to the Bancorp and its subsidiaries. You should carefully consider the risks and uncertainties described below as well as elsewhere in this Annual Report on Form 10-K. If any of the risks or uncertainties actually occur,occurs, our business, financial condition or results of future operations could be materially adversely affected. The risks and uncertainties described in this Form 10-K are not the only ones we face. Additional risks and uncertainties that we are unaware of, or that we currently deem immaterial, also may become important factors that affect us. This Annual Report on Form 10-K contains forward-looking statements that involve riskrisks and uncertainties. Our actual results could differ materially from those anticipated in the forward-looking statements as a result of many factors, including the risks faced by us described below and elsewhere in this Annual Report on Form 10-K.
We may be adversely affected by changes in economic and political conditions and by governmental monetary and fiscal policies.
The thrift industry is affected, directly and indirectly, by local, domestic, and international economic and political conditions, and by governmental monetary and fiscal policies. Conditions such as inflation, recession, unemployment, volatile interest rates, tight money supply, real estate values, international conflicts and other factors beyond our control may adversely affect our potential profitability. Any future rises in interest rates, while increasing the income yield on our earning assets, may adversely affect loan demand and the cost of funds and, consequently, our profitability. Any future decreases in interest rates may adversely affect our profitability because such decreases may reduce the amounts that we may earn on our assets. Economic downturns couldhave resulted and may continue to result in the delinquency of outstanding loans. We do not expect any one particular factor to materially affect our results of operations. However, downtrends in several areas, including real estate, construction and consumer spending, could have a material adverse impact on our ability to remain profitable. Further, there can be no assurance that the asset values of the loans included in our loan portfolio, or the value of properties and other collateral securing such loans, will remain at the levels existing on the dates of origination of such loans.
28
The changing economic environment poses significant challenges for the Company.
In 2007 and in 2008, negative developments in the financial services industry have resulted in uncertainty in the financial markets in general and a related general economic downturn globally, which have continued into 2009. In addition, as a consequence of the United States recession, business activity across a wide range of industries face serious difficulties due to the decline in the housing market, lack of consumer spending and the extreme lack of liquidity in the global credit markets. Unemployment has also increased significantly.
As a result of these financial economic crises, many lending institutions, including us, have experienced declines in the performance of their loans, including construction, land and residential building lots, multi-family, commercial and consumer loans. Moreover, competition among depository institutions for deposits and quality loans has increased significantly while the significant decline in economic growth has led to a slowdown in banking related activities. In addition, the values of real estate collateral supporting many commercial loans and home mortgages have declined and may continue to decline. A worsening of these conditions would likely exacerbate the adverse effects of these difficult market conditions on us and others in the financial services industry.
As a result, there is a potential for new federal or state laws and regulations regarding lending and funding practices and liquidity standards, and bank regulatory agencies are expected to be very aggressive in responding to concerns and trends identified in examinations, including the expected issuance of many formal or informal enforcement actions or orders. The impact of new legislation in response to those developments may negatively impact our operations by restricting our business operations, including our ability to originate or sell loans, and adversely impact our financial performance or our stock price.
We are operating in a challenging economic environment, including generally uncertain national and local market conditions. Negative market developments may affect consumer confidence levels and may cause adverse changes in payment patterns, causing increases in delinquencies and default rates, which may impact our charge-offs and provision for credit losses. Continued declines in real estate values, home sales volumes and financial stress on borrowers as a result of the uncertain economic environment, including job losses and other factors, could have adverse effects on our borrowers, which could adversely affect our financial condition and results of operations. For instance, because payments on loans secured by commercial real estate properties are often dependent upon the successful operation of management of the properties, repayment of these loans are subject to adverse conditions in the economy. As consumer spending decreases, businesses located in commercial real estate property may close reducing the rental income of the Bank’s borrower. The reduction in rental income may result in the borrower being unable to make payments on the loan. The deterioration in economic conditions could drive losses beyond that which is provided for in our allowance for loan losses and could result in the following:
| · | an increase in loan delinquencies, problem assets and foreclosures; |
| · | a decline in demand for our products and services; |
| · | a decrease in low cost or non-interest-bearing deposits; and |
| · | a decline in the value of the collateral for our loans, which in turn may reduce customers’ borrowing capacities, and reduce the value of assets and collateral supporting our existing loans. |
During the past year, we have experienced an increase in non-performing loans. No assurance can be given that these conditions will improve in the near term or will not worsen. Moreover, such conditions may result in a further increase in loan delinquencies, causing a decrease in our interest income, and may continue to have an adverse impact on our loan loss experience, possibly requiring us to add to our allowance for loan losses. Until conditions improve, we expect our business, financial condition and results of operations to be adversely affected.
29
Changes in interest rates could adversely affect our financial condition and results of operations.
The operations of financial institutions, such as us,ours, are dependent to a large degree on net interest income, which is the difference between interest income from loans and investments and interest expense on deposits and borrowings. Our net interest income is significantly affected by market rates of interest that in turn are affected by prevailing economic conditions, by the fiscal and monetary policies of the federal government and by the policies of various regulatory agencies. Like all financial institutions, our balance sheet is affected by fluctuations in interest rates. Volatility in interest rates can also result in disintermediation, which is the flow of funds away from financial institutions into direct investments, such as USU.S. Government andbonds, corporate securities and other investment vehicles, including mutual funds, which, because of the absence of federal insurance premiums and reserve requirements, generally pay higher rates of return than those offered by financial institutions.institutions such as ours.
We believe that, in the current market environment, we have adequate policies and procedures for maintaining a conservative interest rate sensitive position. However, there is no assurance that this condition will continue. A sharp movement up or down in deposit rates, loan rates, investment fund rates and other interest-sensitive instruments on our balance sheet could have a significant, adverse impact on our net interest income and operating results.
Most of our loans are secured by real estate located in our market area. If there is a continuing downturn in ourthe real estate market, theseadditional borrowers may default on their loans and we may not be able to fully recover our loans.
A continuing downturn in the real estate market could hurtadversely affect our business because most of our loans are secured by real estate. Substantially all of our real propertyestate collateral is located in the states of Maryland, Virginia and Delaware. As of December 31, 2006, approximately 95% of the book value of our loan portfolio consisted of loans collateralized by various types of real estate. Real estate values and real estate markets are generally affected by changes in national, regional or local economic conditions, fluctuations in interest rates and the availability of loans to potential purchasers, changes in tax laws and other governmental statutes, regulations and policies and acts of nature.
In addition to the risks generally present with respect to mortgage lending activities, our operations are affected by other factors affecting our borrowers, including:
| · | the ability of our mortgagors to make mortgage payments, |
| · | the ability of our borrowers to attract and retain buyers or tenants, which may in turn be affected by local conditions such as an oversupply of space or a reduction in demand for rental space in the area, the attractiveness of properties to buyers and tenants, and competition from other available space, or by the ability of the owner to pay leasing commissions, provide adequate maintenance and insurance, pay tenant improvements costs and make other tenant concessions, |
| · | interest rate levels and the availability of credit to refinance loans at or prior to maturity, and |
| · | increased operating costs, including energy costs, real estate taxes and costs of compliance with environmental controls and regulations. |
As of December 31, 2008, approximately 99% of the book value of our loan portfolio consisted of loans collateralized by various types of real estate. If real estate prices decline, the value of real estate collateral securing our loans couldwill be reduced. Our ability to recover on defaulted loans by foreclosing and selling the real estate collateral would then be diminished, and we would be more likely to sufferincur financial losses on defaulted loans. Any such downturn could have a material adverse effect on our business, financial condition and results of operations.
In addition, approximately 65%55% of the book value of our loans consisted of construction, land acquisition and development loans, commercial real estate loans and land loans, which present additional risks described in “Item 1. Business”.Business - Construction Loans” of this Form 10-K.
30
Our loan portfolio exhibits a high degree of risk.
We have a significant amount of nonresidential loans, as well as construction and land loans granted on a speculative basis. Although permanent single-family, owner-occupied loans represent the largest single component of assets and currently impaired loans, a significant level of nonresidential loans, construction loans, and land loans, results in an above-average risk exposure. Our monitoring of higher risk loans may be inadequate and the internal asset review function may be inadequate in view of current real estate market weaknesses.
At December 31, 2008 and December 31, 2007, our nonperforming loans (those loans 90 or more days in arrears) equaled $54.8 million and $7.7 million, respectively. There were 118 residential loans in non-accrual status totaling $51.7 million and eleven commercial loans in non-accrual status totaling $3.1 million at December 31, 2008 compared to 17 residential loans in non-accrual status totaling $7.4 million and two commercial loans in non-accrual status totaling $0.3 million at December 31, 2007. For the year ended December 31, 2008, there were $3.5 million of loan charge-offs. At December 31, 2008, the total allowance for loan losses was $14.8 million, which was 1.65% of total net loans, compared with $10.8 million, which was 1.21% of total net loans, as of December 31, 2007.
We are exposed to risk of environmental liabilities with respect to properties to which we takeit takes title.
In the course of our business, we may foreclose and take title to real estate, and could be subject to environmental liabilities with respect to these properties. We may be held liable to a governmental entity or to third parties for property damage, personal injury, investigation and clean-up costs incurred by these parties in connection with environmental contamination, or may be required to investigate or clean up hazardous or toxic substances, or chemical releases at a property. The costs associated with investigation or remediation activities could be substantial. In addition, if we are the owner or former owner of a contaminated site, we may be subject to common law claims by third parties based on damages and costs resulting from environmental contamination emanating from the property. If we become subject to significant environmental liabilities, our business, financial condition, results of operations and cash flows could be materially and adversely affected.
Our operations are located in Anne Arundel County, Maryland, which makes our business highly susceptible to local economic conditions, and anconditions. An economic downturn or recession in thatthis area may adversely affect our ability to operate profitably.
Unlike larger banking organizations that are more geographically diversified, our operations are currently concentrated in Anne Arundel County, Maryland. In addition, almostnearly all of our loans have been made to borrowers in the states of Maryland, Virginia and Delaware. As a result of this geographic concentration, our financial results depend largely upon economic conditions in thisour market area. A deterioration or recession in economic conditions in this market could result in one or more of the following:
| · | a decrease in deposits; |
| · | an increase in loan delinquencies; |
| · | an increase in problem assets and foreclosures; |
| · | a decrease in the demand for our products and services; and |
| · | a decrease in the value of collateral for loans, especially real estate, and reduction in |
Any of the foregoing factors may adversely affect our ability to operate profitably.
We are subject to federal and state regulationand the monetary policies of the Federal Reserve Board.FRB. Such regulation and policies can have a material adverse effect on our earnings and prospects.
Our operations are heavily regulated and will be affected by present and future legislation and by the policies established from time to time by various federal and state regulatory authorities. In particular, the monetary policies of the Federal Reserve BoardFRB have had a significant effect on the operating results of banks in the past, and are expected to continue to do so in the future. Among the instruments of monetary policy used by the Federal Reserve BoardFRB to implement its objectives are changes in the discount rate charged on bank borrowings and changes in the reserve requirements on bank deposits. It is not possible to predict what changes, if any, will be made to the monetary polices of the Federal Reserve BoardFRB or to existing federal and state legislation or the effect that such changes may have on our future business and earnings prospectsprospects.
31
If the Bank becomes “undercapitalized” as determined under the “prompt corrective action” initiatives of the federal bank regulators, such regulatory authorities will have the authority to require the Bank to, among other things, alter, reduce or terminate any activity that the regulator determines poses an excessive risk to the Bank. The Bank could further be directed to take any other action that the regulatory agency determines will better carry out the purpose of prompt corrective action. The Bank could be subject to these prompt corrective action restrictions if federal regulators determine that the Bank is in an unsafe or unsound condition or engaging in an unsafe or unsound practice. Some or all of the foregoing actions and restrictions could have a material adverse effect on our operations.
We have established an allowance for loan losses based on our management's estimate.estimates. Actual losses could differ significantly from those estimates.If the allowance is not adequate, it could have a material adverse effect on our earnings and the price of our common stock.
We have establishedmaintain an allowance for loan losses, which is a reserve established through a provision for loan losses charged to expense, that represents management's best estimate of probable incurred losses within the existing portfolio of loans. The allowance, in the judgment of management, believesis necessary to be adequate to offset probable losses on our existing loans. However, there is no precise method of estimatingreserve for estimated loan losses and our ongoing analysis may cause this estimate to changerisks inherent in the loan portfolio. The level of the allowance reflects management's continuing evaluation of specific credit risks; loan loss experience; current loan portfolio quality; present economic, political and regulatory conditions; industry concentrations and other unidentified losses inherent in the current loan portfolio. The determination of the appropriate level of the allowance for loan losses inherently involves a high degree of subjectivity and judgment and requires us to make significant estimates of current credit risks and future and actual lossestrends, all of which may differ materially from this estimate. In addition, there can be no assurance that any future declinesundergo material changes. Changes in real estate market conditions, general economic conditions or changesaffecting borrowers, new information regarding existing loans, identification of additional problem loans and other factors, both within and outside of our control, may require an increase in regulatory policies will not require us to increasethe allowance for loan losses. Increases in nonperforming loans have a significant impact on our allowance for loan losses. Generally, our non-performing loans and assets reflect operating difficulties of individual borrowers resulting from weakness in the economy of our market area. If current trends in the real estate markets continue, we expect that we will continue to experience increased delinquencies and credit losses, particularly with respect to construction, land and residential building lots, multi-family, commercial and consumer loans. Moreover, with the country currently in a recession, we expect that it will negatively impact economic conditions in our market areas and that we could experience significantly higher delinquencies and credit losses.
In addition, bank regulatory agencies periodically review our allowance for loan losses and may require an increase in the provision for loan losses or the recognition of further loan charge-offs, based on judgments different than those of management. If charge-offs in future periods exceed the allowance for loan losses, we will need additional provisions to increase the allowance for loan losses. Furthermore, growth in the loan portfolio would generally lead to an increase in the provision for loan losses.
Any increaseincreases in the allowance for loan losses will reduce our earningsresult in a decrease in net income and capital, and may adversely affect the pricehave a material adverse effect on our financial condition, results of our common stock.operations and cash flows.
We compete with a number of local, regional and national financial institutions for customers.customers.
We face strong competition from other thrifts,savings and loan associations, banks, savings institutions and other financial institutions that have branch offices or otherwise operate in our market area, as well as many other companies now offering a range of financial services. Many of these competitors have substantially greater financial resources and larger branch systems than we do.us. In addition, many of our competitors have higher legal lending limits than we do.us. Particularly intense competition exists for sources of funds including savings and retail time deposits andas well as for loans deposits and other services that we offer.offered by us. In addition, over the last several years, the banking industry has undergone substantial consolidation, and this trend is expected to continue. Significant ongoing consolidation in the banking industry may result in one or more large competitors emerging in our primary target market. The financial resources, human capital and expertise of one or more large institutions could threaten our ability to maintain our competitiveness.
32
During the past several years, significant legislative attention has been focused on the regulation and deregulation of the financial services industry. Non-bank financial institutions, such as securities brokerage firms, insurance companies and money marketmutual funds, have been permitted to engage in activities that compete directly with traditional bank business. Competition with various financial institutions could hinder our ability to maintain profitable operations and grow our business.
We face intense competitive pressure on customer pricing, which may materially and adversely affect revenues and profitability.
We generate net interest income, and charge our customers fees, based on prevailing market conditions for deposits, loans and other financial services. In order to increase deposit, loan and other service volumes, enter new market segments and expand our base of customers and the size of individual relationships, we must provide competitive pricing for such products and services. In order to stay competitive, we have had to intensify our efforts around attractively pricing our products and services. To the extent that we must continue to adjust our pricing to stay competitive, we will need to grow our volumes and balances in order to offset the effects of declining net interest income and fee-based margins. Increased pricing pressure also enhances the importance of cost containment and productivity initiatives, and we may not succeed in these efforts.
Our brand, reputation and relationship with our customers are key assets of our business and may be affected by how we are perceived in the marketplace.
Our brand and its attributes are key assets of our business. The ability to attract and retain customers to our Company’s products and services is highly dependent upon the external perceptions of us and the industry in which we operate. Our business may be affected by actions taken by competitors, customers, third party providers, employees, regulators, suppliers or others that impact the perception of the brand, such as creditor practices that may be viewed as “predatory,” customer service quality issues, and employee relations issues. Adverse developments with respect to our industry may also, by association, impair our reputation, or result in greater regulatory or legislative scrutiny.
If our information systems mayor those of our third party providers experience an interruption or breach in security, whichour revenues and operating results and the perception of our brand could result in a loss of business.be materially and adversely affected.
We rely heavily on communications and information systems to conduct our business. Any failure, interruption or breach in security of these systems could result in failures or disruptions in our customer relationship management, general ledger, deposit, loan and other systems. In addition, we operate a number of money transfer and related electronic, check and other payment connections that are vulnerable to individuals engaging in fraudulent activities that seek to compromise payments and related financial systems illegally. While we have policies and procedures designed to prevent or limit the effect of the failure, interruption or security breach of our information systems, there can be no assurance that failures, interruptions or security breaches will not occur or, if they do occur, that they will be adequately addressed. The occurrence of any failures, interruptions or security breaches of our information systems could damage our reputation, result in a loss of customer business, subject us to additional regulatory scrutiny, or expose us to civil litigation and possible financial liability, any of which could have a material adverse effect on our financial condition and results of operations. We depend on third-party providers for many of our systems and if these providers experience financial, operational or technological difficulties, or if there is any other disruption in our relationships with them, we may be required to locate alternative sources of such services, and we cannot assure you that we would be able to negotiate terms that are as favorable to us, or could obtain services with similar functionality as found in our existing systems without the need to expend substantial resources, if at all.
33
We continually encounter technological change, and, if we are unable to develop and implement efficient and customer friendly technology, we could lose business.
The financial services industry is continually undergoing rapid technological change, with frequent introductions of new technology-driven products and services. The effective use of technology increases efficiency and enables financial institutions to better serve customers and to reduce costs. Our future success depends, in part, upon our ability to address the needs of our customers by using technology to provide products and services that will satisfy customer demands, as well as to createachieve additional efficiencies in our operations. Many of our competitors have substantially greater resources to invest in technological improvements. We may not be able to effectively implement new technology-driven products and services or be successful in marketing these products and services to our customers. Failure to successfully keep pace with technological change affecting the financial services industry could have a material adverse impact on our business and, in turn, our financial condition and results of operations.
Our success depends on our senior management team, and if we are not able to retain them,our senior management team, it could have a materiallymaterial adverse effect on us.
We are highly dependent upon the continued services and experience of our senior management team, including Alan J. Hyatt, our Chairman, President and Chief Executive Officer. We depend on the services of Mr. Hyatt and the other members of our senior management team to, among other things, continue the development and implementation of our strategies, and maintain and develop our clientcustomer relationships. We do not have an employment agreement with members of our senior management, nor do we maintain “key-man” life insurance on our senior management. If we are unable to retain Mr. Hyatt and other members of our senior management team, our business could be materially and adversely affected.
If we fail to maintain an effective system of internal control over financial reporting and disclosure controls and procedures, we may be unable to accurately report our financial results and comply with the reporting requirements under the Securities Exchange Act of 1934. As a result, current and potential shareholdersstockholders may lose confidence in our financial reporting and disclosure required under the Securities Exchange Act of 1934, which could adversely affect our business and we could be subject us to regulatory scrutiny.
Pursuant to Section 404 of the Sarbanes-Oxley Act of 2002, referred to as Section 404, we are required to include in our Annual Reports on Form 10-K, our management’s report on internal control over financial reporting and our registered public accounting firm’s attestation report on our management’s assessment of our internal control over financial reporting. While we have reported no “significant deficiencies” or “material weaknessesweaknesses” in thisthe Form 10-K for the fiscal year ended December 31, 2008, we cannot guarantee that we will not have any “significant deficiencies” or “material weaknesses” reported by our independent registered public accounting firm in the future. Compliance with the requirements of Section 404 is expensive and time-consuming. If, in the future, we fail to complete this evaluation in a timely manner, or if our independent registered public accounting firm cannot timely attest to our evaluation, we could be subject to regulatory scrutiny and a loss of public confidence in our internal control over financial reporting. In addition, any failure to establish an effective system of disclosure controls and procedures could cause our current and potential shareholdersstockholders and customers to lose confidence in our financial reporting and disclosure required under the Securities Exchange Act of 1934, which could adversely affect our business.
Terrorist attacks and threats or actual war may impact all aspects of our operations, revenues, costs and stock price in unpredictable ways.
34
Our Series A preferred stock, Series B preferred stock and 2035 Debentures contain restrictions on our ability to declare and pay dividends on, or repurchase, our common stock.
Our ability to declare dividends on our common stock is limited by the terms of our Series A preferred stock and Series B preferred stock. We may not declare or pay any dividend on, make any distributions relating to, or redeem, purchase, acquire or make a liquidation payment relating to, or make any guarantee payment with respect to our common stock in any quarter until the dividend on the Series A Preferred Stock has been declared and paid for such quarter, subject to certain minor exceptions. Additionally, prior to November 21, 2011, unless we have redeemed the Series B preferred stock or the Treasury Department has transferred the Series B preferred stock to a third party, we may not, without the consent of the Treasury (1) declare or pay any dividend or make any distribution on our common stock (other than regular quarterly cash dividends of not more than $0.06 per share) or (2) redeem, purchase or acquire any shares of our common stock or other equity or capital securities, other than in connection with benefit plans consistent with past practice and certain other circumstances specified in the Letter Agreement with the Treasury Department.
Additionally, under the terms of our 2035 Debentures, if (i) there has occurred and is continuing an event of default, (ii) we are in default with respect to payment of any obligations under the related guarantee or (iii) we have given notice of our election to defer payments of interest on the 2035 Debentures by extending the interest distribution period as provided in the indenture governing the 2035 Debentures and such period, or any extension thereof, has commenced and is continuing, then we may not, among other things, declare or pay any dividends or distributions on, or redeem, purchase, acquire, or make a liquidation payment with respect to, any of our capital stock, including our common stock.
There can be no assurance that we will continue to pay dividends in the future.
Although we expect to continue our policy of quarterly dividend payments, this dividend policy will be reviewed periodically in light of future earnings, regulatory restrictions and other considerations. No assurance can be given, therefore, that cash dividends on our common stock will be paid in the future.
An investment in our securities is not insured against loss.
Investments in our common stock, are not deposits insured against loss by the FDIC or any other entity. As a result, an investor may lose some or all of his, her or its investment.
Conversion of our Series A preferred stock or exercise of the warrant issued to the Treasury Department will dilute the ownership interest of existing stockholders.
In private placements conducted in November 2008, we issued Series A preferred stock convertible into 437,500 shares of our common stock, subject to adjustment, and a warrant to purchase 556,976 shares of our common stock, subject to adjustment. The conversion of some or all of the Series A preferred stock or the exercise of the warrant will dilute the ownership interest of existing stockholders. Any sales in the public market of the common stock issuable upon such conversion or exercise could adversely affect prevailing market prices of our common stock. In addition, the existence of the Series A preferred stock or warrant may encourage short selling by market participants because the conversion of the Series A preferred stock or exercise of the warrant could depress the price of our common stock.
“Anti-takeover” provisions will make it more difficult for a third party to acquire control of us, even if the change in control would be beneficial to our equity holders.
Our charter presently contains certain provisions that may be deemed to be “anti-takeover” and “anti-greenmail” in nature in that such provisions may deter, discourage or make more difficult the assumption of control of us by another corporation or person through a tender offer, merger, proxy contest or similar transaction or series of transactions. For example, currently, our charter provides that our Board of Directors may amend the charter, without stockholder approval, to increase or decrease the aggregate number of shares of our stock or the number of shares of any class that we have authority to issue. In addition, our charter provides for a classified Board, with each Board member serving a staggered three-year term. Directors may be removed only for cause and only with the approval of the holders of at least 75 percent of our common stock. The overall effects of the “anti-takeover” and “anti-greenmail” provisions may be to discourage, make more costly or more difficult, or prevent a future takeover offer, prevent stockholders from receiving a premium for their securities in a takeover offer, and enhance the possibility that a future bidder for control of us will be required to act through arms-length negotiation with our Board of Directors. These provisions may also have the effect of perpetuating incumbent management.
35
Item 1B. Unresolved Staff Comments
None
Item 2. Properties
HS constructed a building in Annapolis, Maryland that serves as Bancorp’s and the Bank’s administrative headquarters. A branch office of the Bank is also included in the building. Bancorp and the Bank lease their executive and administrative offices from HS. In addition, HS leases space to four unrelated companies and to a law firm in which the President of Bancorp and the Bank is a partner.
Bancorp has four retail branch locations in Anne Arundel County, Maryland, of which it owns three and leases the fourth.fourth from a third party. The Bank, Homeowner’s Title, and HC all lease their executive and administrative offices located in Annapolis, Maryland from HS West LLC, a wholly owned subsidiary ofexpires July 2010, with the Bank. HS West LLC owns its office building in Annapolis, Maryland.option to renew the lease for two additional five year terms. In addition, the Bank leases office space in Annapolis, Maryland from a third party. The lease expires January 2010, with the option to renew the lease for two additional five year terms.
Item 3. Legal Proceedings
There are no material pending legal proceedings to which Bancorp, the Bank or any subsidiary is a party or to which any of their property is subject.
Item 4. Submission of Matters to a Vote of Security Holders
None.
Item 4.1. Executive Officers of the Registrant that are not Directors.Directors
Thomas G. Bevivino, age 51,53, joined Bancorp in August 2004 as Controller, and has served as the Chief Financial Officer of Bancorp since July 1, 2005. He serves in the same capacity for the Bank. Mr. Bevivino was a financial consultant from 2002 until 2004, and served as Chief Financial Officer of Luminant Worldwide Corporation from 1999 until 2002.
36
PART II
Item 5. Market for Registrant's Common Equity, Related Stockholder Matters and Issuer Purchases of Equity Securities
The common stock of Bancorp is traded on the Nasdaq Capital Market under the symbol “SVBI”. As of March 3, 2009, there were 1,510 stockholders of record of Bancorp’s common stock.
Registrar and Transfer Company, 10 Commerce Drive, Cranford, New Jersey 07016-3572, serves as the Transfer Agent and Registrar for Bancorp.
The following table sets forth the high and low sales prices per share of Bancorp’s common stock for the periods indicated, as reported on the Nasdaq Capital Market:
Quarterly Stock Information*
| 2008 | 2007 | ||||||||||||||||||||||||
| Stock Price Range | Per Share | Stock Price Range | Per Share | ||||||||||||||||||||||
| Quarter | Low | High | Dividend | Quarter | Low | High | Dividend | ||||||||||||||||||
1st | $ | 7.80 | $ | 12.00 | $ | .060 | 1st | $ | 16.78 | $ | 22.55 | $ | .060 | ||||||||||||
2nd | 6.52 | 9.45 | .060 | 2nd | 16.24 | 20.23 | .060 | ||||||||||||||||||
3rd | 5.50 | 6.99 | .060 | 3rd | 12.25 | 17.00 | .060 | ||||||||||||||||||
4th | 3.70 | 6.54 | .060 | 4th | 8.21 | 13.28 | .060 | ||||||||||||||||||
*Retroactively adjusted to reflect a 10% stock dividend declared February 20, 2007 effective for shares outstanding March 15, 2007.
Dividend Policy
Bancorp’s main source of income is dividends from the Bank. As a result, Bancorp's dividends to its shareholders will depend primarily upon receipt of dividends from the Bank.
OTS regulations limit the payment of dividends and other capital distributions by the Bank. The Bank is required to obtain OTS approval if the total amount of the Bank’s capital distribution (including the proposed dividend) for the current year exceeds net income for that year to date plus the Bank’s retained net income for the preceding two years. Additionally, the Bank may not pay dividends on its stock in an amount that would reduce its capital levels below its regulatory capital requirements. For further information, see Note 12 to the consolidated financial statements and “Item 1. Business Regulation – Regulation of the Bank – Capital Distribution Limitations.”
Bancorp’s ability to declare dividends on its common stock is limited by the terms of Bancorp’s Series A preferred stock and Series B preferred stock. Bancorp may not declare or pay any dividend on, make any distributions relating to, or redeem, purchase, acquire or make a liquidation payment relating to, or make any guarantee payment with respect to its common stock in any quarter until the dividend on the Series A Preferred Stock has been declared and paid for such quarter, subject to certain minor exceptions. Additionally, prior to November 21, 2011, unless Bancorp has redeemed the Series B preferred stock or the Treasury Department has transferred the Series B preferred stock to a third party, Bancorp may not, without the consent of the Treasury (1) declare or pay any dividend or make any distribution on its common stock (other than regular quarterly cash dividends of not more than $0.06 per share) or (2) redeem, purchase or acquire any shares of our common stock or other equity or capital securities, other than in connection with benefit plans consistent with past practice and certain other circumstances specified in the Letter Agreement with the Treasury Department.
37
Additionally, under the terms of Bancorp's 2035 Debentures, if (i) there has occurred and is continuing an event of default, (ii) Bancorp is in default with respect to payment of any obligations under the related guarantee or (iii) Bancorp has given notice of its election to defer payments of interest on the 2035 Debentures by extending the interest distribution period as provided in the indenture governing the 2035 Debentures and such period, or any extension thereof, has commenced and is continuing, then Bancorp may not, among other things, declare or pay any dividends or distributions on, or redeem, purchase, acquire, or make a liquidation payment with respect to, any of its capital stock, including common stock.
38
Stock Performance Graph
The graph below sets forth comparative information regarding the Company’s cumulative shareholder return on its Common Stock over the last five years. Total shareholder return is measured by dividing total dividends (assuming dividend reinvestment) for the measurement period plus share price change for a period by the share price at the beginning of the measurement period. Severn Bancorp, Inc.'s cumulative shareholder return is based on an investment of $100 on December 31, 2001,2003, and is compared to the cumulative total return of the NASDAQ Composite Index and the SNL Securities LC Thrift Index for thrifts with total assets between $500 million and $1.0 billion (the "SNL Thrift ($500M to $1.0B) Index")
Comparison of Cumulative Total Return Among Severn, NASDAQ Composite Index
and SNL Thrift ($500M to $1.0B) Index from December 31, 20012003 to December 31, 20062008
| Severn Bancorp, Inc. |
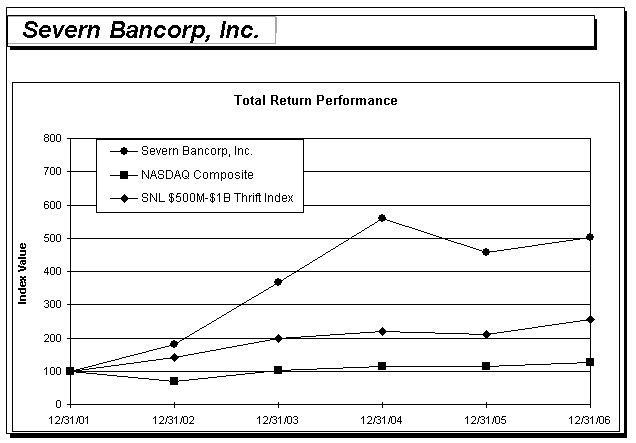
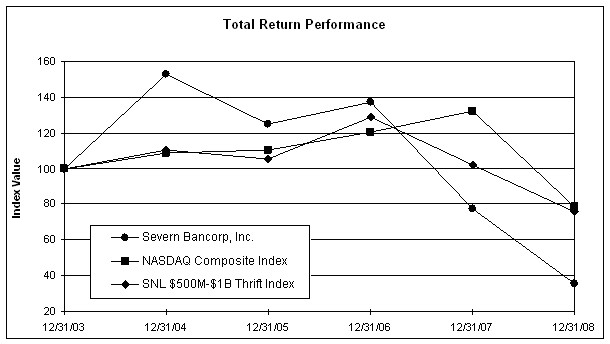
Period Ending | Period Ending | |||||||||||
Index | 12/31/01 | 12/31/02 | 12/31/03 | 12/31/04 | 12/31/05 | 12/31/06 | 12/31/03 | 12/31/04 | 12/31/05 | 12/31/06 | 12/31/07 | 12/31/08 |
| Severn Bancorp, Inc. | 100.00 | 180.88 | 364.92 | 559.00 | 456.67 | 502.73 | 100.00 | 152.76 | 124.80 | 137.39 | 77.56 | 35.49 |
| NASDAQ Composite Index | 100.00 | 68.76 | 103.67 | 113.16 | 115.57 | 127.58 | 100.00 | 108.59 | 110.08 | 120.56 | 132.39 | 78.72 |
| SNL $500M-$1B Thrift Index | 100.00 | 140.09 | 199.47 | 220.65 | 209.70 | 256.94 | 100.00 | 110.61 | 105.12 | 128.81 | 101.83 | 75.51 |
2006 Closing | 2005 Closing | |||||||
| Stock Price Range | Per Share | Stock Price Range | Per Share | |||||
| Quarter | Low | High | Dividend | Quarter | Low | High | Dividend | |
1st | $16.72 | $19.97 | $.060 | 1st | $17.28 | $21.02 | $.055 | |
2nd | 17.86 | 20.13 | .060 | 2nd | 15.79 | 17.87 | .055 | |
3rd | 18.48 | 19.97 | .060 | 3rd | 15.83 | 17.87 | .055 | |
4th | 18.55 | 19.80 | .060 | 4th | 16.20 | 17.56 | .055 | |
See Item 12 in Part III of this Annual Report on Form 10-K and Notes 9 and 11 to the consolidated financial statements for information regarding equity compensation plans.
39
Item 6. Selected Financial Data
For information concerning quarterly financial data for Bancorp, see noteNote 17 to the consolidated financial statements.
The following financial information is derived from the audited financial statements of Bancorp. The information is a summary and should be read in conjunction with Bancorp’s audited financial statements and Management’s Discussion and Analysis of Financial Condition and Results of Operations.
Summary Financial and Other Data
| At December 31, | ||||||||||||||||
| 2006 | 2005 | 2004 | 2003 | 2002 | ||||||||||||
| (dollars in thousands, except per share information) | ||||||||||||||||
| Balance Sheet Data | ||||||||||||||||
| Total assets | $ | 911,916 | $ | 849,774 | $ | 703,616 | $ | 540,471 | $ | 458,415 | ||||||
| Total loans, net | 835,477 | 779,333 | 656,967 | 506,026 | 418,825 | |||||||||||
| Investment securities held to maturity | 7,271 | 8,290 | 9,955 | 12,721 | 9,661 | |||||||||||
| Non-performing loans | 5,927 | 1,693 | 939 | 469 | 1,758 | |||||||||||
| Total non-performing assets | 6,897 | 1,693 | 939 | 469 | 1,982 | |||||||||||
| Deposits | 626,524 | 594,893 | 527,413 | 419,726 | 377,925 | |||||||||||
| Short-term borrowings | 18,000 | 26,000 | - | 6,000 | - | |||||||||||
| Long-term debt | 155,000 | 132,000 | 89,000 | 59,000 | 34,000 | |||||||||||
| Total liabilities | 825,474 | 777,062 | 639,462 | 487,501 | 415,233 | |||||||||||
| Stockholders’ equity | 86,442 | 72,712 | 60,154 | 48,970 | 39,181 | |||||||||||
| Book value per common share * | $ | 9.45 | $ | 7.95 | $ | 6.57 | $ | 5.35 | $ | 4.30 | ||||||
| Common shares outstanding * | 9,150,850 | 9,150,002 | 9,150,002 | 9,150,002 | 9,113,702 | |||||||||||
| Other Data: | ||||||||||||||||
| Number of: | ||||||||||||||||
| Full service retail banking facilities | 3 | 3 | 3 | 2 | 2 | |||||||||||
| Full-time equivalent employees | 121 | 111 | 105 | 81 | 69 | |||||||||||
| * Retroactively adjusted to reflect 10% stock dividend declared February 21, 2006 effective for shares outstanding on March 28, 2006 and a two-for-one stock split declared November 17, 2004 effective for shares outstanding December 15, 2004. | ||||||||||||||||
| At December 31, | ||||||||||||||||||||
| 2008 | 2007 | 2006 | 2005 | 2004 | ||||||||||||||||
| (dollars in thousands, except per share information) | ||||||||||||||||||||
| Balance Sheet Data | ||||||||||||||||||||
| Total assets | $ | 987,651 | $ | 962,234 | $ | 911,916 | $ | 849,774 | $ | 703,616 | ||||||||||
| Total loans, net | 896,459 | 893,014 | 835,477 | 779,333 | 656,967 | |||||||||||||||
| Investment securities held to maturity | 1,345 | 2,383 | 7,271 | 8,290 | 9,955 | |||||||||||||||
| Non-performing loans | 54,795 | 7,700 | 5,927 | 1,693 | 939 | |||||||||||||||
| Total non-performing assets | 61,112 | 10,693 | 6,897 | 1,693 | 939 | |||||||||||||||
| Deposits | 683,866 | 652,773 | 626,524 | 594,893 | 527,413 | |||||||||||||||
| Short-term borrowings | - | 15,000 | 18,000 | 26,000 | - | |||||||||||||||
| Long-term debt | 153,000 | 175,000 | 155,000 | 132,000 | 89,000 | |||||||||||||||
| Total liabilities | 863,984 | 866,958 | 825,474 | 777,062 | 639,462 | |||||||||||||||
| Stockholders’ equity | 123,667 | 95,276 | 86,442 | 72,712 | 60,154 | |||||||||||||||
| Book value per common share * | $ | 9.64 | $ | 9.46 | $ | 8.59 | $ | 7.23 | $ | 5.97 | ||||||||||
| Common shares outstanding * | 10,066,679 | 10,066,679 | 10,065,935 | 10,065,002 | 10,065,002 | |||||||||||||||
| Other Data: | ||||||||||||||||||||
| Number of: | ||||||||||||||||||||
| Full service retail banking facilities | 4 | 4 | 3 | 3 | 3 | |||||||||||||||
| Full-time equivalent employees | 106 | 118 | 121 | 111 | 105 | |||||||||||||||
| * Retroactively adjusted to reflect a 10% stock dividend declared February 20, 2007 and a 10% stock dividend declared February 21, 2006. | ||||||||||||||||||||
40
Summary of Operations
| For the Year Ended December 31, | ||||||||||||||||||||
| 2008 | 2007 | 2006 | 2005 | 2004 | ||||||||||||||||
| (dollars in thousands, except per share information) | ||||||||||||||||||||
| Interest income | $ | 62,472 | $ | 71,814 | $ | 70,175 | $ | 57,135 | $ | 44,829 | ||||||||||
| Interest expense | 33,503 | 38,176 | 32,060 | 21,955 | 14,631 | |||||||||||||||
| Net interest income | 28,969 | 33,638 | 38,115 | 35,180 | 30,198 | |||||||||||||||
| Provision for loan losses | 7,481 | 2,462 | 1,561 | 1,570 | 1,200 | |||||||||||||||
| Net interest income after provision for loan losses | 21,488 | 31,176 | 36,554 | 33,610 | 28,998 | |||||||||||||||
| Non-interest income | 2,791 | 4,336 | 3,867 | 2,748 | 3,402 | |||||||||||||||
| Non-interest expense | 17,293 | 16,492 | 14,065 | 12,878 | 11,211 | |||||||||||||||
| Income before income tax provision | 6,986 | 19,020 | 26,356 | 23,480 | 21,189 | |||||||||||||||
| Provision for income taxes | 2,873 | 7,909 | 10,608 | 8,926 | 8,258 | |||||||||||||||
| Net income | $ | 4,113 | $ | 11,111 | $ | 15,748 | $ | 14,554 | $ | 12,931 | ||||||||||
| Per Share Data: | ||||||||||||||||||||
| Basic earnings per share * | $ | 0.39 | $ | 1.10 | $ | 1.56 | $ | 1.45 | $ | 1.29 | ||||||||||
| Diluted earnings per share * | $ | 0.39 | $ | 1.10 | $ | 1.56 | $ | 1.45 | $ | 1.29 | ||||||||||
| Cash dividends declared per share* | $ | .24 | $ | .24 | $ | .22 | $ | .20 | $ | .17 | ||||||||||
| Weighted number of shares outstanding basic * | 10,066,679 | 10,066,283 | 10,065,289 | 10,065,002 | 10,065,002 | |||||||||||||||
| Weighted number of shares outstanding diluted * | 10,066,679 | 10,066,283 | 10,069,056 | 10,065,002 | 10,065,002 | |||||||||||||||
| * Retroactively adjusted to reflect a 10% stock dividend declared February 20, 2007 and a 10% stock dividend declared February 21, 2006. |