0000874766 hig:OtherInvestmentsandOtherLiabilitiesMember us-gaap:DerivativeFinancialInstrumentsAssetsMember 2018-12-31 0000874766 hig:HomeownersMember us-gaap:ShortdurationInsuranceContractsAccidentYear2009Member 2013-12-31
UNITED STATES
SECURITIES AND EXCHANGE COMMISSION
Washington, D.C. 20549
FORM 10-K
|
| | |
| þ | | ANNUAL REPORT PURSUANT TO SECTION 13 OR 15(d) OF THE SECURITIES EXCHANGE ACT OF 1934 |
For the fiscal year ended December 31, 20172018
or
|
| | |
| o | | TRANSITION REPORT PURSUANT TO SECTION 13 OR 15(d) OF THE SECURITIES EXCHANGE ACT OF 1934 |
For the transition period from to
Commission file number 001-13958
THE HARTFORD FINANCIAL SERVICES GROUP, INC.
(Exact name of registrant as specified in its charter)
|
| | |
| Delaware | | 13-3317783 |
| (State or other jurisdiction of incorporation or organization) | | (I.R.S. Employer Identification No.) |
One Hartford Plaza, Hartford, Connecticut 06155
(Address of principal executive offices) (Zip Code)
(860) 547-5000
(Registrant’s telephone number, including area code)
SECURITIES REGISTERED PURSUANT TO SECTION 12 (b) OF THE ACT
(ALL OF WHICH ARE LISTED ON THE NEW YORK STOCK EXCHANGE INC.):
Common Stock, par value $0.01 per share
Warrants (expiring June 26, 2019)
6.10% Notes due October 1, 2041
7.875% Fixed-to-Floating Rate Junior Subordinated Debentures due 2042
Depositary Shares, Each Representing a 1/1,000th Interest in a Share of 6.000% Non-Cumulative Preferred Stock, Series G, par value $0.01 per share
SECURITIES REGISTERED PURSUANT TO SECTION 12 (g) OF THE ACT:
None
|
| | | |
| Indicate by check mark: | Yes | No |
| • | if the registrant is a well-known seasoned issuer, as defined in Rule 405 of the Securities Act. | þ | |
| • | if the registrant is not required to file reports pursuant to Section 13 or Section 15(d) of the Exchange Act. | | þ |
| • | whether the registrant (1) has filed all reports required to be filed by Section 13 or 15(d) of the Securities Exchange Act of 1934 during the preceding 12 months (or for such shorter period that the registrant was required to file such reports), and (2) has been subject to such filing requirements for the past 90 days. | þ | |
| • | whether the registrant has submitted electronically and posted on its corporate Web site, if any, every Interactive Data File required to be submitted and posted pursuant to Rule 405 of Regulation S-T during the preceding 12 months (or for such shorter period that the registrant was required to submit and post such files). | þ | |
| • | if disclosure of delinquent filers pursuant to Item 405 of Regulation S-K is not contained herein, and will not be contained, to the best of registrant’s knowledge, in definitive proxy or information statements incorporated by reference in Part III of this Form 10-K or any amendment to this Form 10-K. | þ | |
| • | whether the registrant is a large accelerated filer, an accelerated filer, a non-accelerated filer, a smaller reporting company or an emerging growth company. See definitions of “large accelerated filer,” “accelerated filer,” “smaller reporting company” and "emerging growth company" in Rule 12b-2 of the Exchange Act. | | |
| | Large accelerated filer þ Accelerated filer o Non-accelerated filer o Smaller reporting company o Emerging growth company o | | |
| • | whether the registrant is a shell company (as defined in Rule 12b-2 of the Exchange Act.) | | þ |
If an emerging growth company, indicate by check mark if the registrant has elected not to use the extended transition period for complying with any new or revised financial accounting standards provided pursuant to Section 13(a) of the Exchange Act. ¨
The aggregate market value of the shares of Common Stock held by non-affiliates of the registrant as of June 30, 201729, 2018 was approximately $19$18 billion, based on the closing price of $52.57$51.13 per share of the Common Stock on the New York Stock Exchange on June 30, 2017.29, 2018.
As of February 21, 2018,20, 2019, there were outstanding 356,981,387359,470,401 shares of Common Stock, $0.01 par value per share, of the registrant.
Documents Incorporated by Reference
Portions of the registrant’s definitive proxy statement for its 20182019 annual meeting of shareholdersstockholders are incorporated by reference in Part III of this Form 10-K.
THE HARTFORD FINANCIAL SERVICES GROUP, INC.
ANNUAL REPORT ON FORM 10-K
FOR THE FISCAL YEAR ENDED DECEMBER 31, 20172018
TABLE OF CONTENTS
| | | Item | Description | Page | Description | Page |
| | | | | |
| 1 | | | | |
| 1A. | | | | |
| 1B. | | None | | None |
| 2 | | | | |
| 3 | | | | |
| 4 | | Not Applicable | | Not Applicable |
| | | | | |
| 5 | | | | |
| 6 | | | | |
| 7 | | | | |
| 7A. | | [a] | | [a] |
| 8 | | [b] | | [b] |
| 9 | | None | | None |
| 9A. | | | | |
| 9B. | | None | | None |
| | | | | |
| 10 | | | | |
| 11 | | [c] | | [c] |
| 12 | | | | |
| 13 | | [d] | | [d] |
| 14 | | [e] | | [e] |
| | | | | |
| 15 | | | | |
| | EXHIBITS INDEX |
| EXHIBITS INDEX | |
| 16 | FORM 10-K SUMMARY | Not Applicable | FORM 10-K SUMMARY | Not Applicable |
| | | | | |
[a] The information required by this item is set forth in the Enterprise Risk Management section of Item 7, Management's Discussion and Analysis of Financial Condition and Results of Operations and is incorporated herein by reference.
[b] See Index to Consolidated Financial Statements and Schedules elsewhere herein.
[c] The information called for by Item 11 will be set forth in the Proxy Statement under the subcaptions "Compensation Discussion and Analysis", "Executive Compensation", "Director Compensation", "Report of the Compensation and Management Development Committee", and "Compensation and Management Development Committee Interlocks and Insider Participation" and is incorporated herein by reference.
[d] Any information called for by Item 13 will be set forth in the Proxy Statement under the caption and subcaption "Board and Governance Matters" and "Director Independence" and is incorporated herein by reference.
[e] The information called for by Item 14 will be set forth in the Proxy Statement under the caption "Audit Matters" and is incorporated herein by reference.
Forward-Looking Statements
Certain of the statements contained herein are forward-looking statements made pursuant to the safe harbor provisions of the Private Securities Litigation Reform Act of 1995. Forward-looking statements can be identified by words such as “anticipates,” “intends,” “plans,” “seeks,” “believes,” “estimates,” “expects,” “projects,” and similar references to future periods.
Forward-looking statements are based on management's current expectations and assumptions regarding future economic, competitive, legislative and other developments and their potential effect upon The Hartford Financial Services Group, Inc. and its subsidiaries (collectively, the “Company” or “The Hartford”). Because forward-looking statements relate to the future, they are subject to inherent uncertainties, risks and changes in circumstances that are difficult to predict. Actual results could differ materially from expectations, depending on the evolution of various factors, including the risks and uncertainties identified below, as well as factors described in such forward-looking statements or in Part I, Item 1A. Risk Factors, in Part II, Item 7. Management's Discussion and Analysis of Financial Condition and Results of Operations, and those identified from time to time in our other filings with the Securities and Exchange Commission.
Risks Relating to Economic, Political and Global Market Conditions:
| |
| ◦ | challenges related to the Company’s current operating environment, including global political, economic and market conditions, and the effect of financial market disruptions, economic downturns, changes in trade regulation including tariffs and other barriers or other potentially adverse macroeconomic developments on the demand for our products and returns in our investment portfolios; |
| |
◦ | financial risk related to the continued reinvestment of our investment portfolios; |
| |
| ◦ | market risks associated with our business, including changes in credit spreads, equity prices, interest rates, inflation rate, and market volatility and foreign exchange rates;volatility; |
| |
| ◦ | the impact on our investment portfolio if our investment portfolio is concentrated in any particular segment of the economy; |
| |
| ◦ | the impacts of changing climate and weather patterns on our businesses, operations and investment portfolio including on claims, demand and pricing of our products, the availability and cost of reinsurance, our modeling data used to evaluate and manage risks of catastrophes and severe weather events, the value of our investment portfolios and credit risk with reinsurers and other counterparties; |
| |
| ◦ | the risks associated with the change in or replacement of the London Inter-Bank Offered Rate ("LIBOR") on the securities we hold or may have issued, other financial instruments and any other assets and liabilities whose value is tied to LIBOR; |
Insurance Industry and Product-Related Risks:
| |
| ◦ | the possibility of unfavorable loss development, including with respect to long-tailed exposures; |
| |
| ◦ | the significant uncertainties that limit our ability to estimate the ultimate reserves necessary for asbestos and environmental claims |
| |
| ◦ | the possibility of a pandemic, earthquake, or other natural or man-made disaster that may adversely affect our businesses; |
| |
| ◦ | weather and other natural physical events, including the severityintensity and frequency of storms, hail, wildfires, flooding, winter storms, hurricanes and tropical storms, as well as climate change and its potential impact on weather patterns; |
| |
| ◦ | the possible occurrence of terrorist attacks and the Company’s inability to contain its exposure as a result of, among other factors, the inability to exclude coverage for terrorist attacks from workers' compensation policies and limitations on reinsurance coverage from the federal government under applicable laws; |
| |
| ◦ | the Company’s ability to effectively price its property and casualty policies, including its ability to obtain regulatory consents to pricing actions or to non-renewal or withdrawal of certain product lines; |
| |
| ◦ | actions by competitors that may be larger or have greater financial resources than we do; |
| |
| ◦ | technological changes, such as usage-based methods of determining premiums, advancements in automotive safety features, the development of autonomous vehicles, and platforms that facilitate ride sharing, which may alter demand for the Company's products, impact the frequency or severity of losses, and/or impact the way the Company markets, distributes and underwrites its products; |
| |
| ◦ | the Company's ability to market, distribute and provide insurance products and investment advisory services through current and future distribution channels and advisory firms; |
| |
| ◦ | the uncertain effects of emerging claim and coverage issues; |
Financial Strength, Credit and Counterparty Risks:
| |
| ◦ | risks to our business, financial position, prospects and results associated with negative rating actions or downgrades in the Company’s financial strength and credit ratings or negative rating actions or downgrades relating to our investments; |
| |
| ◦ | the impact on our statutory capital of various factors, including many that are outside the Company’s control, which can in turn affect our credit and financial strength ratings, cost of capital, regulatory compliance and other aspects of our business and results; |
| |
| ◦ | losses due to nonperformance or defaults by others, including sourcing partners, derivativecredit risk with counterparties associated with investments, derivatives, premiums receivable, reinsurance recoverables and otherindemnifications provided by third parties;parties in connection with previous dispositions; |
| |
| ◦ | the potential for losses due to our reinsurers' unwillingness or inability to meet their obligations under reinsurance contracts and the availability, pricing and adequacy of reinsurance to protect the Company against losses; |
| |
| ◦ | regulatory limitations on the ability of the Company and certain of its subsidiaries to declare and pay dividends; |
Risks Relating to Estimates, Assumptions and Valuations:
| |
| ◦ | risk associated with the use of analytical models in making decisions in key areas such as underwriting, pricing, capital management, hedging, reserving, investments, reinsurance and catastrophe risk management; |
| |
| ◦ | the potential for differing interpretations of the methodologies, estimations and assumptions that underlie the Company’s fair value estimates for its investments and the evaluation of other-than-temporary impairments on available-for-sale securities; |
| |
| ◦ | the significant uncertainties that limitpotential for further impairments of our ability to estimategoodwill or the ultimate reserves necessarypotential for asbestos and environmental claims;changes in valuation allowances against deferred tax assets; |
Strategic and Operational Risks:
| |
| ◦ | the Company’s ability to maintain the availability of its systems and safeguard the security of its data in the event of a disaster, cyber or other information security incident or other unanticipated event; |
| |
| ◦ | the potential for difficulties arising from outsourcing and similar third-party relationships; |
| |
| ◦ | the risks, challenges and uncertainties associated with capital management plans, expense reduction initiatives and other actions, which may include acquisitions, divestitures or restructurings; |
| |
| ◦ | failure to complete our proposed acquisition of The Navigators Group, Inc. may cause volatility in our securities; |
| |
| ◦ | risks associated with acquisitions and divestitures including the potential for difficulties arisingchallenges of integrating acquired companies or businesses or separating from outsourcingour divested businesses that may result in our not being able to achieve the anticipated benefits and similar third-party relationships;synergies and may result in unintended consequences; |
| |
| ◦ | difficulty in attracting and retaining talented and qualified personnel including key employees, such as executives, managers and employees with strong technological, analytical and other specialized skills; |
| |
| ◦ | the Company’s ability to protect its intellectual property and defend against claims of infringement; |
Regulatory and Legal Risks:
| |
| ◦ | the cost and other potential effects of increased regulatory and legislative developments, including those that could adversely impact the demand for the Company’s products, operating costs and required capital levels; |
| |
| ◦ | unfavorable judicial or legislative developments; |
| |
| ◦ | the impact of changes in federal or state tax laws; |
| |
| ◦ | regulatory requirements that could delay, deter or prevent a takeover attempt that shareholdersstockholders might consider in their best interests; and |
| |
| ◦ | the impact of potential changes in accounting principles and related financial reporting requirements; |
Risks Related to the Company's Life and Annuity Business in Discontinued Operations
| |
◦ | the risks related to the Company's ability to close its previously announced sale of its life and annuity run-off book of business, which is subject to several closing conditions, including many that are outside of the Company's control; |
| |
◦ | the risks related to political, economic and global economic conditions, including interest rate, equity and credit spread risks; |
| |
◦ | the impact on our investment portfolio if our investment portfolio is concentrated in any particular segment of the economy; |
| |
◦ | risks related to negative rating actions or downgrades in the financial strength and credit ratings of Hartford Life Insurance Company or Hartford Life and Annuity Insurance Company or negative rating actions or downgrades relating to our investments; |
| |
◦ | the volatility in our statutory and United States ("U.S.") Generally Accepted Accounting Principles ("GAAP") earnings and potential material changes to our results resulting from our risk management program to emphasize protection of economic value; |
| |
◦ | the potential for losses due to our reinsurers’ unwillingness or inability to meet their obligations under reinsurance contracts; |
| |
◦ | the potential for differing interpretations of the methodologies, estimations and assumptions that underlie the fair value estimates for investments and the evaluation of other-than-temporary impairments on available for sale securities; |
| |
◦ | the potential for further acceleration of deferred policy acquisition cost amortization and an increase in reserves for certain guaranteed benefits in our variable annuities; |
| |
◦ | changes in federal or state tax laws that would impact the tax-favored status of life and annuity contracts; and |
| |
◦ | changes in accounting and financial reporting of the liability for future policy benefits, including how the life and annuity businesses account for deferred acquisition costs and market risk benefits on variable annuity contracts and the discounting of life contingent fixed annuities.requirements. |
Any forward-looking statement made by the Company in this document speaks only as of the date of the filing of this Form 10-K. Factors or events that could cause the Company’s actual results to differ may emerge from time to time, and it is not possible for the Company to predict all of them. The Company undertakes no obligation to publicly update any forward-looking statement, whether as a result of new information, future developments or otherwise.
Part I - Item 1. Business
Item 1. BUSINESS
(Dollar amounts in millions, except for per share data, unless otherwise stated)
GENERAL
The Hartford Financial Services Group, Inc. (together with its subsidiaries, “The Hartford”, the “Company”, “we”, or “our”) is a holding company for a group of subsidiaries that provide property and casualty insurance, group benefits, and mutual funds and exchange-traded products to individual and business customers in the United States. In December 2017, the Company announced the signing of a definitive agreement to sell its life and annuity operating subsidiaries and, accordingly, the assets and liabilities of those subsidiaries have been presented as held for sale with results of operations from that business reflected as discontinued operations. See Note 20 - Business Dispositions and Discontinued Operations of Notes to Consolidated Financial Statements. The Hartford is headquartered in Connecticut and its oldest subsidiary, Hartford Fire Insurance Company, dates back to 1810. At December 31, 2017,2018, total assets and total stockholders’ equity of The Hartford were $225.362.3 billion and $13.513.1 billion, respectively.
ORGANIZATION
The Hartford strives to maintain and enhance its position as a market leader within the financial services industry. The Company sells diverse and innovative products through multiple distribution channels to individuals and businesses and is considered a leading property and casualty and employee group benefits insurer. The Company endeavors to expand its insurance product offerings and distribution and capitalize on the strength of the Company's brand. The Hartford Stag logo is one of the most recognized symbols in the financial services industry. The Company is also working to increase efficiencies through investments in technology.
As a holding company, The Hartford Financial Services Group, Inc. is separate and distinct from its subsidiaries and has no significant business operations of its own. The Companyholding company relies on the dividends from its insurance companies and other subsidiaries as the principal source of cash flow to meet its obligations, pay dividends and repurchase common stock. Information regarding the cash flow and liquidity needs of The Hartford Financial Services Group, Inc. may be found in Part II, Item 7, Management’s Discussion and Analysis of Financial Condition and Results of Operations (“MD&A”) — Capital Resources and Liquidity.
REPORTING SEGMENTS
The Hartford conducts business principally in five reporting segments including Commercial Lines, Personal Lines, Property & Casualty ("P&C") Other Operations, Group Benefits and MutualHartford Funds (previously referred to as "Mutual Funds"), as well as a Corporate category. The HartfordCompany includes in itsthe Corporate category discontinued operations ofrelated to the Company's life and annuity run-off business accounted for as held for sale,sold in May 2018, reserves for run-off structured settlement and terminal funding agreement liabilities, retained, capital raising activities (including debt financing and related interest expense), purchase accounting adjustments related to goodwill and other expenses not allocated to the reporting segments. Corporate also includes investment management fees and expenses related to managing third party business, including management of the invested assets of Talcott Resolution Life, Inc. and its subsidiaries ("Talcott Resolution"). Talcott Resolution is the new holding company of the life and annuity business that we
2017sold in May 2018. In addition, Corporate includes a 9.7% ownership interest in the legal entity that acquired the life and annuity business sold.
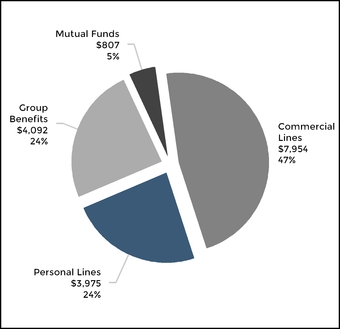
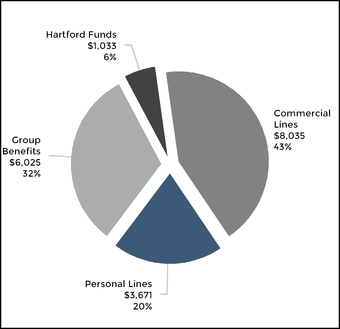
2018 Revenues of $16,974$18,955 [1] by Segment
[1]Includes Revenue of $120$86 for P&C Other Operations and $26$105 for Corporate.
The following discussion describes the principal products and services, marketing and distribution, and competition of The Hartford's reporting segments. For further discussion of the reporting segments, including financial disclosures of revenues by product line, net income (loss), and assets for each reporting segment, see Note 4 - Segment Information of Notes to Consolidated Financial Statements.
Part I - Item 1. Business
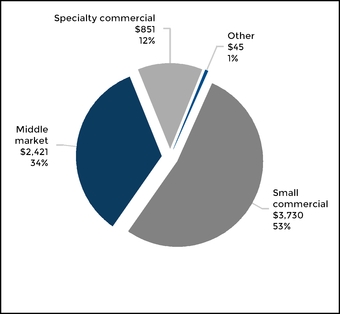
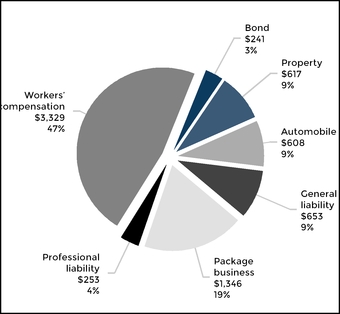
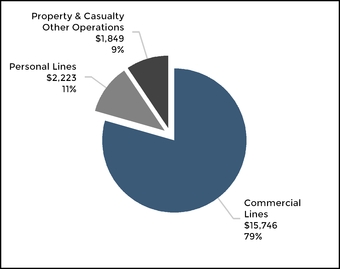
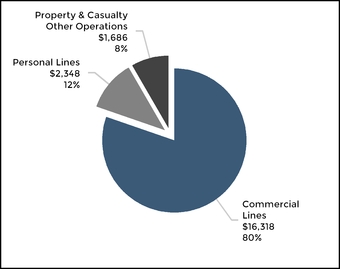
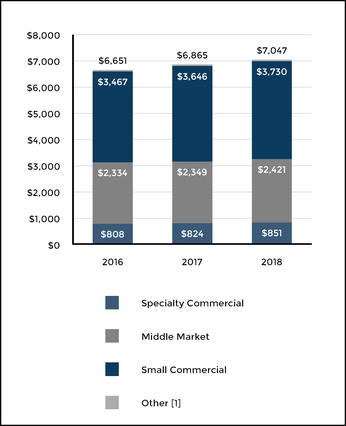
20172018 Earned Premiums of $6,865$7,047 by Line of Business
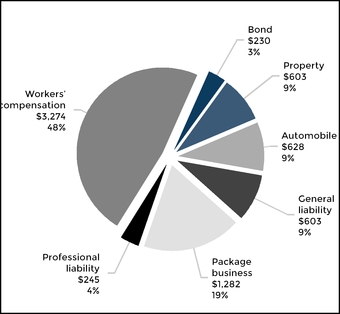
20172018 Earned Premiums of $6,865$7,047 by Product
Principal Products and Services |
| |
| Automobile | Covers damage to a business's fleet of vehicles due to collision or other perils (automobile physical damage). In addition to first party automobile physical damage, commercial automobile covers liability for bodily injuries and property damage suffered by third parties and losses caused by uninsured or under-insured motorists. |
| Property | Covers the building a business owns or leases as well as its personal property, including tools and equipment, inventory, and furniture. A commercial property insurance policy covers losses resulting from fire, wind, hail, earthquake, theft and other covered perils, including coverage for assets such as accounts receivable and valuable papers and records. Commercial property may include specialized equipment insurance, which provides coverage for loss or damage resulting from the mechanical breakdown of boilers and machinery, and ocean and inland marine insurance, which provides coverage for goods in transit and unique, one-of-a-kind exposures. |
| General Liability | Covers a business in the event it is sued for causing harm to a person and/or damage to property. General liability insurance covers third-party claims arising from accidents occurring on the insured’s premises or arising out of their operations. General liability insurance may also cover losses arising from product liability and provide replacement of lost income due to an event that interrupts business operations. |
| Package Business | Covers both property and general liability damages. |
| Workers' Compensation | Covers employers for losses incurred due to employees sustaining an injury, illness or disability in connection with their work. Benefits paid under workers’ compensation policies may include reimbursement of medical care costs, replacement income, compensation for permanent injuries and benefits to survivors. Workers’ compensation is provided under both guaranteed cost policies (coverage for a fixed premium) and loss sensitive policies where premiums are adjustable based on the loss experience of the employer. |
| Professional Liability | Covers liability arising from directors and officers acting in their official capacity and liability for errors and omissions committed by professionals and others. Coverage may also provide employment practices insurance relating to allegations of wrongful termination and discrimination. |
| Bond | Encompasses fidelity and surety insurance, including commercial surety, contract surety and fidelity bonds. Commercial surety includes bonds that insure non-performance by contractors, license and permit bonds to help meet government-mandated requirements and probate and judicial bonds for fiduciaries and civil court proceedings. Contract surety bonds may include payment and performance bonds for contractors. Fidelity bonds may include ERISA bonds related to the handling of retirement plan assets and bonds protecting against employee theft or fraud. The Company also provides credit and political risk insurance offered to clients with global operations. |
Through its three lines of business of small commercial, middle market and specialty, Commercial Lines principally provides workers’ compensation, property, automobile and general liability insurance products to businesses, primarily throughout the
United States. In addition, the specialty line of business provides
professional liability, bond, credit and political risk, loss-sensitive workers compensation, general liability, automobile liability and automobile physical damage.damage coverages. The majority of
Part I - Item 1. Business
Commercial Lines written premium is generated by small commercial and middle market, which provide coverage options and customized pricing based on the
Part I - Item 1. Business
policyholder’s individual risk characteristics. Within small commercial, both property and general liability coverages are offered under a single package policy, marketed under the Spectrum name. Specialty provides a variety of customized insurance products and services.
Small commercial provides coverages for small businesses, which the Company considers to be businesses with an annual payroll under $12, revenues under $25 and property values less than $20 per location. Through Maxum Specialty Insurance Group ("Maxum"), small commercial also provides excess and surplus lines coverage to small businesses including umbrella, general liability, property and other coverages. Middle market provides insurance coverages to medium-sized businesses, which are companies whose payroll, revenue and property values exceed the small business definition. The Company has a small amount of property and casualty business written internationally. For U.S. exporters and other U.S. companies with international exposures, the Company covers property, marine and liability risks outside the U.S. as the assuming reinsurer under a reinsurance agreementagreements with a third party.parties.
In addition to offering standard commercial lines products, middle market includes program business which provides tailored programs, primarily to customers with common risk characteristics. Within specialty, a significant portion of the business is written through large deductible programs for national accounts. Other programs written within specialty are retrospectively-rated where the premiums are adjustable based on loss experience. Also within specialty, the Company writes captive programs business, which provides tailored programs to those seeking a loss sensitive solution where premiums are adjustable based on loss experience. On August 22, 2018, the Company entered into a definitive agreement to acquire The Navigators Group, Inc., a global specialty underwriter. This acquisition could change the way we go to market as a commercial lines carrier.
Marketing and Distribution
Commercial Lines provides insurance products and services through the Company’s regional offices, branches and sales and policyholder service centers throughout the United States. The products are marketed and distributed nationally using independent agents, brokers and wholesalers. The independent agent and broker distribution channel is consolidating and this trend is expected to continue. This will likely result in a larger proportion of written premium being concentrated among fewer agents and brokers. In addition, the Company offers insurance products to customers of payroll service providers through its relationships with major national payroll companies and to members of affinity organizations.
Competition
Small Commercial
In small commercial, The Hartford competes against large national carriers, regional carriers and direct writers. Competitors include stock companies, mutual companies and other underwriting organizations. The small commercial market remains highly competitive and fragmented as carriers seek to differentiate themselves through product expansion, price
reduction, enhanced service and leading technology. Larger carriers such as The Hartford continually advance their pricing sophistication and ease of doing business with agents and customers through the use of technology, analytics and other capabilities that improve the process of evaluating a risk, quoting new business and servicing customers. The Company also hascontinuously enhances digital capabilities as customers and distributors demand more
access and convenience, and expandingexpands product and underwriting capabilities to accommodate both larger accounts and a broader risk appetite.
The small commercial market has experienced low written premium growth rates due to current economic conditions. Competitors seek Existing competitors and new business by increasing their underwriting appetite, and deepening their relationships with distribution partners. Also, carriers serving middle market-sized accounts are more aggressively competing for small commercial accounts, which are generally less price-sensitive. Some carriers,entrants, including start-up and non-traditional carriers, are actively looking to expand sales of business insurance products to small commercial market insuredsbusinesses through increasing their underwriting appetite, deepening their relationships with distribution partners, and through on-line and direct-to-consumer marketing.
Middle Market
Middle market business is considered “high touch” and involves individual underwriting and pricing decisions. The pricing of middle market accounts is prone to significant volatility over time due to changes in individual account characteristics and exposure, as well as legislative and macro-economic forces. National and regional carriers participate in the middle market insurance sector, resulting in a competitive environment where pricing and policy terms are critical to securing new business and retaining existing accounts. Within this competitive environment, The Hartford is working to deepen its product and underwriting capabilities, and leverage its sales and underwriting talent with tools it has introduced in recent years. Through advanced training and expand its use of data analytics the Company’s field underwriters are working to improvemake risk selection and pricing decisions. In product development and related areas such as claims and risk engineering, the Company is extending its capabilities in industry verticals, such as energy, construction, automobile parts manufacturing, food processing and hospitality. Through a partnership with AXA Corporate Solutions,business partner, the Company offers business insurance coverages to exporters and other U.S. companies with a physical presence overseas. The Company has also added newHartford’s middle market underwritersbusiness will leverage the investments in product, underwriting, and technology to better match price to individual risk as the Midwest and Western U.S.firm pursues responsible growth strategies to deepen relationships with its distribution partners.deliver target returns.
Specialty Commercial
Specialty commercial competes on an account-by-account basis due to the complex nature of each transaction. Competition in this market includes stock companies, mutual companies, alternative risk sharing groups and other underwriting organizations.
For specialty casualty businesses, pricing competition continues to be significant, particularly for the larger individual accounts. As a means to mitigate the cost of insurance on larger accounts, more insureds may opt for the loss-sensitive products offered in our national accounts segment, including retrospectively rated contracts, in lieu of guaranteed cost policies. Under a retrospectively-rated contract, the ultimate premium collected from the insured is adjusted based on how incurred losses for the policy year develop over time, subject to a minimum and maximum premium. Within national accounts, the Company is implementing a phased roll out ofimplemented a new risk management platform, allowing customers better access to claims data and other information needed by corporate risk managers. This investment will allowsystem allows the Company to work more closely with customers to improve long-term account performance.
Part I - Item 1. Business
In the bond business, favorable underwriting results in recent years has led to increased competition for market share, setting the stage for potential written price decreases.share.
In professional liability, large and medium-sized businesses are in differing competitive environments. Large public director &
officers coverage, specifically excess layers, is under significant competitive price pressure. The middle market private management liability segment is in a more stable competitive and pricing environment.
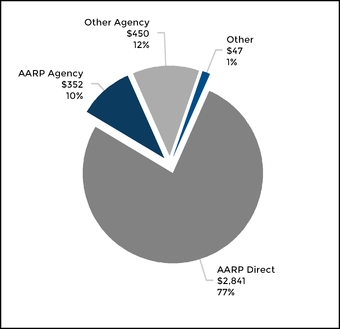
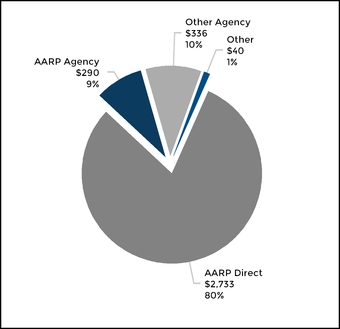
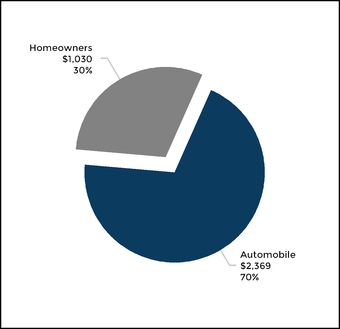
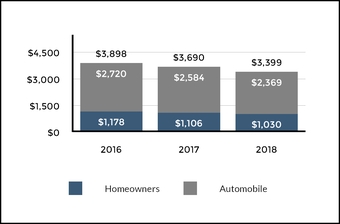
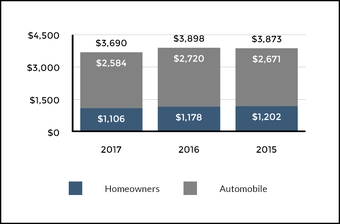
20172018 Earned Premiums of $3,690$3,399 by Line of Business
20172018 Earned Premiums of $3,690$3,399 by Product
Principal Products and Services |
| |
| Automobile | Covers damage to an individual insured’s own vehicle due to collision or other perils and is referred to as automobile physical damage. In addition to first party automobile physical damage, automobile insurance covers liability for bodily injuries and property damage suffered by third parties and losses caused by uninsured or underinsured motorists. Also, under no-fault laws, policies written in some states provide first party personal injury protection. Some of the Company’s personal automobile insurance policies also offer personal umbrella liability coverage for an additional premium. |
| Homeowners | Insures against losses to residences and contents from fire, wind and other perils. Homeowners insurance includes owned dwellings, rental properties and coverage for tenants. The policies may provide other coverages, including loss related to recreation vehicles or watercraft, identity theft and personal items such as jewelry. |
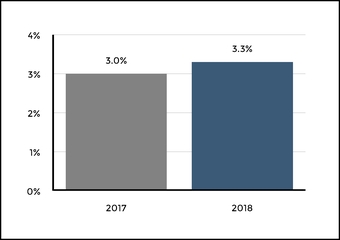
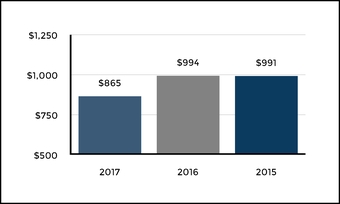
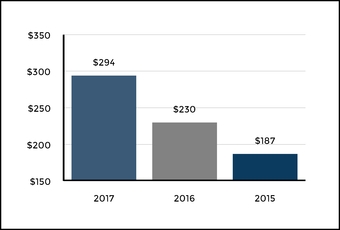
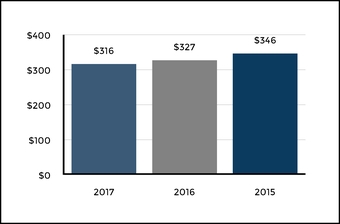
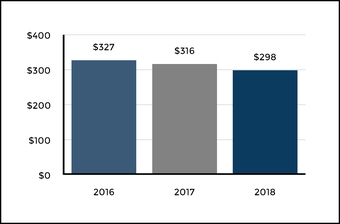
Personal Lines provides automobile, homeowners and personal umbrella coverages to individuals across the United States, including a program designed exclusively for members of AARP (“AARP Program”). The Hartford's automobile and homeowners products provide coverage options and pricing tailored to a customer's individual risk. The Hartford has individual customer relationships with AARP Program policyholders and, as a group, they represent a significant portion of the total Personal Lines' business. Business sold to AARP members, either direct or through independent agents, amounted to earned premiums of $3.0 billion, $3.2 billion and $3.3 billion in 2018, 2017 and $3.2 billion in 2017, 2016, and 2015, respectively.
During 2017,2018, Personal Lines continued to refine its automobile and home product offerings i.e., itsmarketed under the Open Road Auto and Home Advantage products.names. Overall rate
levels, price segmentation, rating factors
and underwriting procedures were examined and updated to reflect the company’s actual experience with these products. In addition, Personal Lines also continued working with carrier partners to provide risk protection options for AARP members with needs beyond the company’s current product offering.
Marketing and Distribution
Personal Lines reaches diverse customers through multiple distribution channels, including direct-to-consumer and independent agents. In direct-to-consumer, Personal Lines markets its products through a mix of media, including direct mail, digital marketing, television as well as digital and print advertising. Through the agency channel, Personal Lines provides products and services to customers through a network of independent agents in the standard personal lines market,
Part I - Item 1. Business
independent agents in the standard personal lines market, primarily serving mature, preferred consumers. These independent agents are not employees of the Company.
Personal Lines has made significant investments in offering direct and agency-based customers the opportunity to interact with the company online, including via mobile devices. In addition, its technology platform for telephone sales centers enables sales representatives to provide an enhanced experience for direct-to-consumer customers, positioning Thethe Company to offer unique capabilities to AARP’s member base.
Most of Personal Lines' sales are associated with its exclusive licensing arrangement with AARP, with the current agreement in place through January 1, 2023, to market automobile, homeowners and personal umbrella coverages to AARP's approximately 3837 million members, primarily direct but also through independent agents. This relationship with AARP, which has been in place since 1984, provides Personal Lines with an important competitive advantage given the expected growth ofincrease in the population of those over age 50 and the strength of the AARP brand. The Company has expanded its relationship withIn most states, auto and home policies issued to AARP to enable its members whoinclude a lifetime continuation agreement endorsement, providing that the policies will be renewed as long as certain terms are small business owners to purchase the Company's industry-leading small business products offered by Commercial Lines.met, such as timely payment of premium and maintaining a driver’s license in good standing.
In addition to selling to AARP members, Personal Lines offers its automobile and homeowners products to non-AARP customers, primarily through the independent agent channel within select underwriting markets where we believe we have a competitive advantage. Personal Lines leverages its agency channel to target AARP members and other customer segments that value the advice of an independent agent and recognize the differentiated experience the Company provides. In particular, the Company has taken action to distinguish its brand and improve profitability in the independent agent channel with fewer and more highly partnered agents.
Competition
The personal lines automobile and homeowners insurance
markets are highly competitive. Personal lines insurance is written by insurance companies of varying sizes that compete principally on the basis of price, product, service, including claims handling, the insurer's ratings and brand recognition. Companies with strong ratings, recognized brands, direct sales capability and economies of scale will have a competitive advantage. In recent years, insurers have increased their advertising in the direct-to-consumer market, in an effort to gain new business and retain profitable business. The growth of direct-to-consumer sales continues to outpace sales in the agency distribution channel.
Insurers that distribute products principally through agency channels compete by offering commissions and additional incentives to attract new business. To distinguish themselves in the marketplace, top tier insurers are offering online and self service capabilities that make it easier for agents and consumers to do business with the insurer. A large majority of agents have been using “comparative rater” tools that allow the agent to compare premium quotes among several insurance companies. The use of comparative rater tools increases price competition. Insurers that are able to capitalize on their brand and reputation, differentiate their products and deliver strong customer service are more likely to be successful in this market.
The use of data mining and predictive modeling is used by more and more carriers to target the most profitable business, and carriers have further segmented their pricing plans to expand market share in what they believe to be the most profitable segments. The Company is investingcontinues to invest in capabilities to better utilize data and analytics, and thereby, refine and manage underwriting and pricing.
Also, new automobile technology advancements, including lane departure warnings, backup cameras, automatic braking and active collision alerts, are being deployed rapidly and are expected to improve driver safety and reduce the likelihood of vehicle collisions. However, these features include expensive parts, potentially increasing average claim severity.
|
|
| PROPERTY & CASUALTY OTHER OPERATIONS |
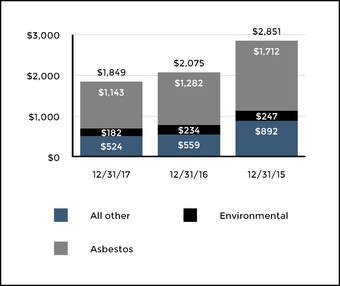
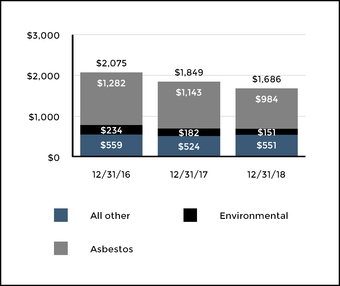
Property & Casualty Other Operations includes certain property and casualty operations, managed by the Company, that have discontinued writing new business and includes substantially all of the Company's asbestos and environmental ("A&E") exposures.
For a discussion of coverages provided under policies written with exposure to A&E, assumed reinsurance and all other non-A&E, see Part II, Item 7, MD&A - Critical Accounting Estimates, Property & Casualty Insurance Product Reserves.
Part I - Item 1. Business
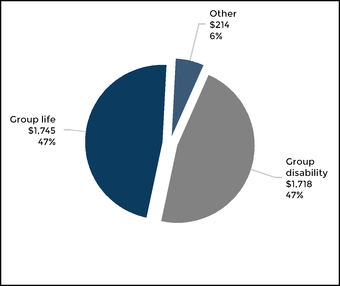
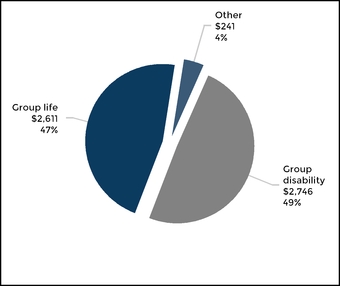
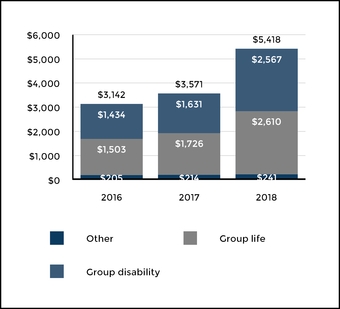
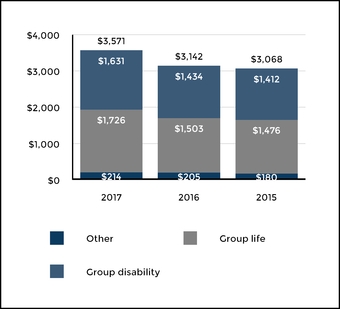
20172018 Premiums and Fee Income of $3,677$5,598
Principal Products and Services
|
| |
| Group Life | Typically is term life insurance provided in the form of yearly renewable term life insurance. Other life coverages in this category include accidental death and dismemberment and travel accident insurance. |
| Group Disability | Typically comprised of both short-term and long-term disability coverage that pays a percentage of an employee’s salary for a period of time if they are ill or injured and cannot perform the duties of their job. Short-term and long-term disability policies have elimination periods that must be satisfied prior to benefit payments. In addition to premiums, administrative service fees are paid by employers forThe Company also earns fee income from leave management services and the administration of underwriting, enrollment and claims processing for employer self-funded plans. |
| Other Products | Includes other group coverages such as retiree health insurance, critical illness, accident, hospital indemnity and participant accident coverages. |
Group insurance typically covers an entire group of people under a single contract, most typically the employees of a single employer or members of an association.
Group Benefits provides group life, disability and other group coverages to members of employer groups, associations and affinity groups through direct insurance policies and provides reinsurance to other insurance companies. In addition to employer paid coverages, Group Benefitsthe segment offers voluntary product coverages which are offered through employee payroll deductions. Group Benefits also offers disability underwriting, administration, and claims processing to self-funded employer plans. In addition, Group Benefitsthe segment offers a single-company leave management solution,The Hartford Productivity Advantage, which integrates work absence data from the insurer’s short-term and long-term group disability and workers’ compensation insurance with its leave management administration services.
Group Benefits generally offers term insurance policies, allowing for the adjustment of rates or policy terms in order to minimize the adverse effect of market trends, loss costs, declining interest rates and other factors. Policies are typically sold with one, two or three-year rate guarantees depending upon the product and market segment.
On November 1, 2017, the Company's group benefits subsidiary, Hartford Life and Accident Insurance Company ("HLA") acquired Aetna's U.S. group life and disability business through a reinsurance transaction. Revenues and earnings of the Aetna U.S. group life and disability business are included in operating results of the Company's Group Benefits segment since the acquisition date. For discussion of this transaction, see Note 2- Business Acquisitions of Notes to Consolidated Financial Statements.
Marketing and Distribution
The Group Benefits distribution network is managed through a regional sales office system to distribute its group insurance products and services through a variety of distribution outlets including brokers, consultants, third-party administrators and trade associations. Additionally, Group Benefitsthe segment has relationships with several private exchanges which offer its products to employer groups.
The acquisition of Aetna's U.S. group life and disability business further enhancesenhanced Group Benefit's distribution footprint by increasing its sales force. The acquisition also providesprovided Group Benefits an exclusive, multi year collaboration to sell it's group life and disability products through Aetna's medical sales team.
Part I - Item 1. Business
Competition
Group Benefits competes with numerous insurance companies and financial intermediaries marketing insurance products. In order to differentiate itself, Group Benefits uses its risk management expertise and economies of scale to derive a competitive advantage. Competitive factors include the extent of products offered, price, the quality of customer and claims handling services, and the Company's relationship with third-party distributors and private exchanges. Active price competition continues in the marketplace, resulting in multi-year rate guarantees being offered to customers. Top tier insurers in the marketplace also offer on-line and self service capabilities to third party distributors and consumers. The relatively large size and underwriting capacity of the Group Benefits business provides a competitive advantage over smaller companies.competitors.
Group Benefits' recent acquisition of Aetna's U.S. group life and disability business further increasesincreased its market presence and
competitive capabilities through the addition of industry-leading digital technology and an integrated absence management and claims platform.
Additionally, as employers continue to focus on reducing the cost of employee benefits, we expect more companies to offer voluntary products paid for by employees. Competitive factors affecting the sale of voluntary products include the breadth of products, product education, enrollment capabilities and overall customer service.
The Company has expanded its employer group product offerings, including the voluntary product suite, including coverages for short term absences from work, critical illness and accident coverages. The Company's enhanced enrollment and marketing tools, such as My Tomorrow©, are providing additional opportunities to educate individual participants about supplementary benefits and deepen their knowledge about product selection.
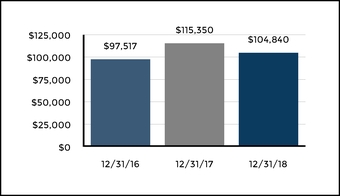
MutualHartford Funds Segment AUM of $115,350 [1]$104,840 as of December 31, 2017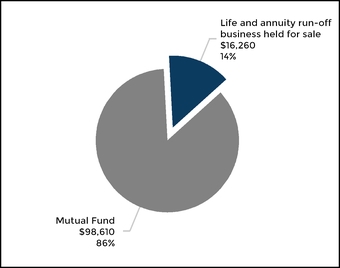
[1] Includes Mutual Fund Segment AUM for ETPs of $480.2018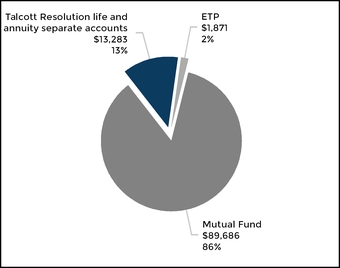
Mutual Fund AUM as of December 31, 20172018
Principal Products and Services
|
| |
Mutual FundFunds | Includes over 7570 actively managed open-ended mutual funds across a variety of asset classes including domestic and international equity, fixed income, and multi-strategy investments, principally subadvised by two unaffiliated institutional asset management firms that have comprehensive global investment capabilities. |
| ETP | Includes a suite of exchange-traded products (“ETP”) traded on the New York Stock Exchange that is comprised of strategic beta and actively managed fixed income of exchange-traded funds ("ETF"). Strategic beta ETF’s are designed to track indices using both active and passive investment techniques that strive to improve performance relative to traditional capitalization weighted indices.
|
LifeTalcott Resolution life and annuity run-offseparate accounts | Relates to assets of the life and annuity business held for sale | Includes assets heldsold in separate accounts classified as assets held for sale, which support legacy run-off variable insurance contracts.May 2018 that are still managed by the Company's Hartford Funds segment. |
The MutualHartford Funds segment provides investment management, administration, product distribution and related services to investors through a diverse set of investment products in domestic and international markets. Our comprehensive range ofHartford Funds'
comprehensive range of products and services assist clients in achieving their desired investment objectives. Our assetsAssets under management are separated into three distinct categories referred to as mutual funds, (“Funds”), ETP and Talcott Resolution life and annuity run-off business held for
Part I - Item 1. Business
sale (formerly referredseparate accounts, which relate to as “Talcott Resolution”).the life and annuity business sold in May 2018. The MutualHartford Funds segment expectswill continue to continue managingmanage the mutual fund assets of the life and annuity run-off business after the Company closes the sale during 2018,Talcott Resolution, though thosethese assets are expected to continue to decline over time.
Marketing and Distribution
Our Fundsfunds and ETPs are sold through national and regional broker-dealer organizations, independent financial advisers, defined contribution plans, financial consultants, bank trust groups and registered investment advisers. Our distribution team is organized to sell primarily in the United States. The investment products for the life and annuity run-off business held for saleTalcott Resolution are not actively distributed.
Competition
The investment management industry is mature and highly competitive. Firms are differentiated by investment performance, range of products offered, brand recognition, financial strength, proprietary distribution channels, quality of service and level of fees charged relative to quality of investment products. The MutualHartford Funds segment competes with a large number of asset management firms and other financial institutions and differentiates itself through superior fund performance, product breadth, strong distribution and competitive fees. In recent years demand for lower cost passive investment strategies has outpaced demand for actively managed strategies and has taken market share from active managers.
The Company includes in the Corporate category discontinued operations frominvestment management fees and expenses related to managing third party business, including management of the Company's life and annuity run-off business accounted for as held for sale,invested assets of Talcott Resolution, reserves for run-off structured settlement and terminal funding agreement liabilities, retained, capital raising
activities (including debt financing and related interest expense), purchase accounting adjustments related to goodwill and other expenses not allocated to the reporting segments.
Additionally, included in the Corporate category are discontinued operations from the Company's life and annuity business sold in May 2018 and a 9.7% ownership interest in the legal entity that acquired this business. The assets and liabilities of this business had been accounted for as held for sale until closing and operating results of the life and annuity business are included in discontinued operations for all periods prior to the closing date.
RESERVES
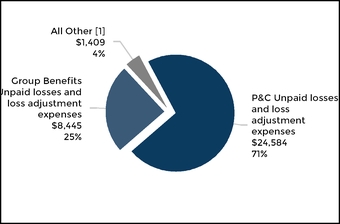
Total Reserves as of December 31, 20172018
| |
| [1] | Includes reserves for future policy benefits and other policyholder funds and benefits payable of $713642 and $816767, respectively, of which $441427 and $492455, respectively, relate to the Group Benefits segment with the remainder related to retained liferun-off structured settlement and annuity run-off business reservesterminal funding agreements within Corporate. |
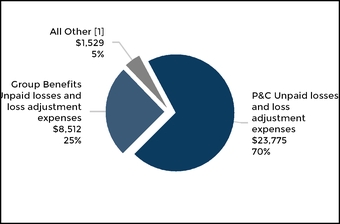
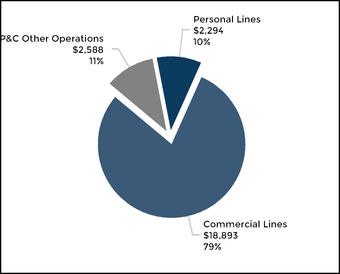
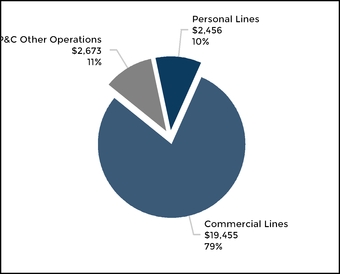
Total Property & Casualty Reserves as of December 31, 20172018
The reserve for unpaid losses and loss adjustment expenses includes a liability for unpaid losses, including those that have been incurred but not yet reported, as well as estimates of all expenses associated with processing and settling these insurance claims, including reserves related to both Property & Casualty and Group Benefits.
Further discussion of The Hartford’s property and casualty insurance product reserves, including asbestos and environmental claims reserves within P&C Other Operations,
Part I - Item 1. Business
may be found in Part II, Item 7, MD&A — Critical Accounting Estimates — Property and Casualty Insurance Product Reserves. Additional discussion may be found in Notes to Consolidated
Part I - Item 1. Business
Financial Statements, including in the Company’s accounting policies for insurance product reserves within Note 1 - Basis of Presentation and Significant Accounting Policies and in Note 11 - Reserve for Unpaid Losses and Loss Adjustment Expenses of Notes to Consolidated Financial Statements.
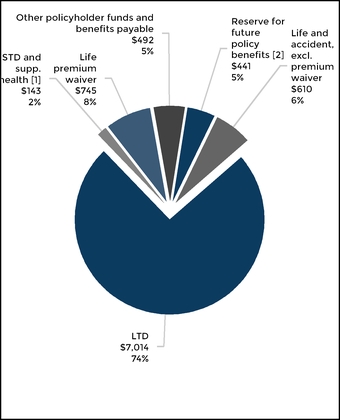
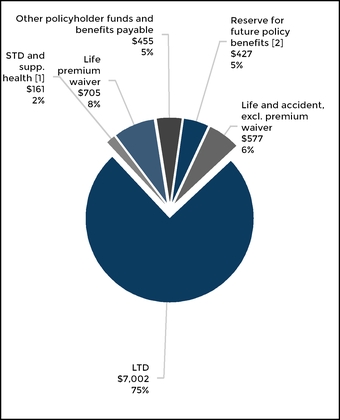
Total Group Benefits Reserves as of December 31, 20172018
[1]Includes $104$118 of short-term disability ("STD") reserves and $39$43 of supplemental health reserves.
[2]Includes $320$311 of paid up life reserves $110and policy reserves on life policies, $107 of reserves for conversions to individual life and $11$9 of other reserves.
Other policyholder funds and benefits payable represent deposits from policyholders where the company does not have insurance risk but is subject to investment risk. Reserves for future policy benefits represent life-contingent reserves for which the company is subject to insurance and investment risk.
Further discussion of The HartfordHartford's Group Benefits long-term disability reserves may be found in Part II, Item 7, MD&A — Critical Accounting Estimates — Group Benefits Long-term Disability ("LTD") Reserves, Net of Reinsurance. Additional discussion may be found in Note 11 - Reserve for Unpaid Losses and Loss Adjustment Expenses of Notes to Consolidated Financial Statements.
UNDERWRITING FOR P&C AND GROUP BENEFITS
The Company underwrites the risks it insures in order to manage exposure to loss through favorable risk selection and diversification. Risk modeling is used to manage, within specified limits, the aggregate exposure taken in each line of business and across the Company. For property and casualty business, aggregate exposure limits are set by geographic zone and peril. Products are priced according to the risk characteristics of the insured’s exposures. Rates charged for Personal Lines products are filed with the states in which we write business. Rates for Commercial Lines products are also filed with the states but the premium charged may be modified based on the insured’s relative risk profile and workers’ compensation policies may be subject to modification based on prior loss experience. Pricing for Group Benefits products, including long-term disability and life insurance, is also based on an underwriting of the risks and a projection of estimated losses, including consideration of investment income.
Pricing adequacy depends on a number of factors, including the ability to obtain regulatory approval for rate changes, proper evaluation of underwriting risks, the ability to project future loss cost frequency and severity based on historical loss experience adjusted for known trends, the Company’s response to rate actions taken by competitors, its expense levels and expectations about regulatory and legal developments. The Company seeks to price its insurance policies such that insurance premiums and future net investment income earned on premiums received will cover underwriting expenses and the ultimate cost of paying claims reported on the policies and provide for a profit margin.
Geographic Distribution of Earned Premium (% of total)
|
| | | | | | | | |
| Location | Commercial Lines | Personal Lines | Group Benefits | Total |
| California | 8 | % | 2 | % | 3 | % | 13 | % |
| New York | 5 | % | 1 | % | 3 | % | 9 | % |
| Texas | 3 | % | 2 | % | 2 | % | 7 | % |
| Florida | 2 | % | 2 | % | 2 | % | 6 | % |
| New Jersey | 3 | % | — | % | 2 | % | 5 | % |
| All other [1] | 23 | % | 15 | % | 22 | % | 60 | % |
| Total | 44 | % | 22 | % | 34 | % | 100 | % |
|
| | | | | | | | |
| Location | Commercial Lines | Personal Lines | Group Benefits | Total |
| California | 8 | % | 3 | % | 2 | % | 13 | % |
| Texas | 4 | % | 2 | % | 1 | % | 7 | % |
| New York | 5 | % | 2 | % | 1 | % | 8 | % |
| Florida | 2 | % | 2 | % | 1 | % | 5 | % |
| All other [1] | 30 | % | 17 | % | 20 | % | 67 | % |
| Total | 49 | % | 26 | % | 25 | % | 100 | % |
| |
| [1] | No other single state or country accounted for 5% or more of the Company's consolidated earned premium written in 2017.2018. |
Part I - Item 1. Business
CLAIMS ADMINISTRATION FOR P&C AND GROUP BENEFITS
Claims administration includes the functions associated with the receipt of initial loss notices, claims adjudication and estimates,
Part I - Item 1. Business
legal representation for insureds where appropriate, establishment of case reserves, payment of losses and notification to reinsurers. These activities are performed by approximately 6,6006,720 claim professionals located in 49 states, organized to meet the specific claim service needs for our various product offerings. Our combined Workers’ Compensation and Group Benefits units enable us to leverage synergies for improved outcomes.
Claim payments for benefit, loss and loss adjustment expenses are the largest expenditure for the Company.
REINSURANCE
For discussion of reinsurance, see Part II, Item 7, MD&A — Enterprise Risk Management and Note 8 - Reinsurance of Notes to Consolidated Financial Statements.
INVESTMENT OPERATIONS
Hartford Investment Management Company (“HIMCO”) is an SEC registered investment advisor and manages the Company's investment operations. HIMCO provides customized investment strategies primarily for The Hartford's investment portfolio, as well as for The Hartford's pension plan certain investment options in Hartford Life Insurance Company's corporate owned life insurance products, a variable insurance trust and institutional clients. In connection with the pending sale of the Company’s life and annuity run-off business sold in May 2018, HIMCO will continue to manage a significant majority of the assetsentered into an agreement for an initial five year term.term to manage the invested assets of Talcott Resolution.
As of December 31, 20172018 and 20162017, the fair value of HIMCO’s total assets under management was approximately $89.6 billion and $98.6 billion and $98.3 billion, respectively, of which $40.2 billion and $2.1 billion and $2.2 billion, respectively, were held in HIMCO managed third party accounts and of which $29.6 billion and $30.9 billion, respectively, relate to assets of the life and annuity run-off business accounted for as held for sale.accounts.
Management of The Hartford's Investment Portfolio
HIMCO manages the Company's investment portfolios to maximize economic value and generate the returns necessary to support the Hartford’s various product obligations, within internally established objectives, guidelines and risk tolerances. The portfolio objectives and guidelines are developed based upon the asset/liability profile, including duration, convexity and other characteristics within specified risk tolerances. The risk tolerances considered include, but are not limited to, asset sector, credit issuer allocation limits, and maximum portfolio limits for below investment grade holdings. The Company attempts to minimize adverse impacts to the portfolio and the Company’s results of operations from changes in economic conditions
through asset diversification, asset allocation limits, asset/liability duration matching and the use of derivatives. For further discussion of HIMCO’s portfolio management approach, see Part II, Item 7, MD&A — Enterprise Risk Management.
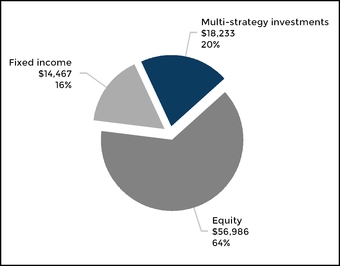
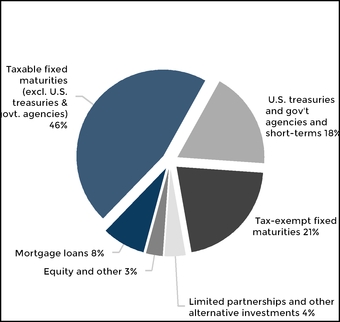
The Hartford's Investment Portfolio of $46.8 billion as of December 31, 20172018
ENTERPRISE RISK MANAGEMENT
The Company has insurance, operational and financial risks. For discussion on how The Hartford manages these risks, see Part II, Item 7, MD&A - Enterprise Risk Management.
REGULATION
State Insurance Laws
State insurance laws are intended to supervise and regulate insurers with the goal of protecting policyholders and ensuring the solvency of the insurers. As such, the insurance laws and regulations grant broad authority to state insurance departments (the “Departments”) to oversee and regulate the business of insurance. The Departments monitor the financial stability of an insurer by requiring insurers to maintain certain solvency standards and minimum capital and surplus requirements; invested asset requirements; state deposits of securities; guaranty fund premiums; restrictions on the size of risks which may be insured under a single policy; and adequate reserves and other necessary provisions for unearned premiums, unpaid losses and loss adjustment expenses and other liabilities, both reported and unreported. In addition, the Departments perform periodic market and financial examinations of insurers and require insurers to file annual and other reports on the financial condition of the companies. Policyholder protection is also regulated by the Departments through licensing of insurers, sales employees, agents and brokers and others; approval of premium rates and
Part I - Item 1. Business
policy forms; claims administration requirements; and maintenance of minimum rates for accumulation of surrender values.
Many states also have laws regulating insurance holding company systems. These laws require insurance companies, which are
Part I - Item 1. Business
formed and chartered in the state (referred to as “domestic insurers”), to register with the state department of insurance (referred to as their “domestic state or regulator”) and file information concerning the operations of companies within the holding company system that may materially affect the operations, management or financial condition of the insurers within the system. Insurance holding company regulations principally relate to (i) state insurance approval of the acquisition of domestic insurers, (ii) prior review or approval of certain transactions between the domestic insurer and its affiliates, and (iii) regulation of dividends made by the domestic insurer. All transactions within a holding company system affecting domestic insurers must be determined to be fair and equitable.
The National Association of Insurance Commissioners (“NAIC”), the organization that works to promote standardization of best practices and assists state insurance regulatory authorities and insurers, conducted the “Solvency Modernization Initiative” (the “Solvency Initiative” ).). The effort focused on reviewing the U.S. financial regulatory system and financial regulation affecting insurance companies including: (1) capital requirements; (2) corporate governance and risk management; (3) group supervision; (4) statutory accounting and financial reporting; and (5) reinsurance. As a result of the Solvency Initiative, among other items, the NAIC adopted the Corporate Governance Annual Disclosure Model Act, , which was enacted by the Company’s lead domestic state of Connecticut. The model law requires insurers to make an annual confidential filing regarding their corporate governance policies commencing in 2016. In addition, the NAIC adopted the Risk Management and Own Risk and Solvency Assessment Model Act (“ORSA”), which also has been adopted by Connecticut. ORSA requires insurers to maintain a risk management framework and conduct an internal risk and solvency assessment of the insurer’s material risks in normal and stressed environments. Many state insurance holding company laws, including those of Connecticut, have also been amended to require insurers to file an annual confidential enterprise risk report with their lead domestic regulator, disclosing material risks within the entire holding company system that could pose an enterprise risk to the insurer.
Federal and State Securities and Financial Regulation Laws
Certain subsidiaries of theThe Company soldsells and distributed the Company’s retaildistributes its mutual funds variable annuitiesthrough a broker dealer subsidiary, and other securities as broker-dealers and areis subject to regulation promulgated and enforced by the Financial Industry Regulatory Authority (“FINRA”), the SEC and/or, in some instances, state securities administrators. Other subsidiaries operate as investment advisers registered with the SEC under the Investment Advisers’ Act of 1940, as amended, and are registered as investment advisers under certain state laws, as applicable. Because federal and state laws and regulations are primarily intended to protect investors in securities markets, they generally grant regulators broad rulemaking and enforcement authority. Some of these regulations include, among other things, regulations impacting sales methods, trading practices, suitability of investments, use
and safekeeping of customers’ funds, corporate governance, capital, record keeping,recordkeeping, and reporting requirements.
The Hartford operates in limited foreign jurisdictions. The extent of financial services regulation on business outside the United
States varies significantly among the countries in which The Hartford operates. Some countries have minimal regulatory requirements, while others regulate financial services providers extensively. Foreign financial services providers in certain countries are faced with greater restrictions than domestic competitors domiciled in that particular jurisdiction.
Failure to comply with federal and state laws and regulations may result in fines, the issuance of cease-and-desist orders or suspension, termination or limitation of the activities of our operations and/or our employees.
INTELLECTUAL PROPERTY
We rely on a combination of contractual rights and copyright, trademark, patent and trade secret laws to establish and protect our intellectual property.
We have a trademark portfolio that we consider important in the marketing of our products and services, including, among others, the trademarks of The Hartford name, the Stag Logo and the combination of these two trademarks. The duration of trademark registrations may be renewed indefinitely subject to country-specific use and registration requirements. We regard our trademarks as highly valuable assets in marketing our products and services and vigorously seek to protect them against infringement. In addition, we own a number of patents and patent applications relating to on-line quoting, insurance related processing, insurance telematics, proprietary interface platforms, and other matters, some of which may be important to our business operations. Patents are of varying duration depending on filing date, and will typically expire at the end of their natural term.
EMPLOYEES
The Hartford has approximately 16,40018,500 employees as of December 31, 20172018.
AVAILABLE INFORMATION
The Company’s Internet address is www.thehartford.com. Our annual report on Form 10-K, quarterly reports on Form 10-Q, current reports on Form 8-K, and amendments to those reports are available, without charge, on the investor relations section of our website, https://ir.thehartford.com, as soon as reasonably practicable after they are filed electronically with the SEC. Reports filed with the SEC may be viewed at www.sec.gov or obtained at the SEC’s Public Reference Room at 100 F Street, N.E., Washington D.C. Information regarding the operation of the Public Reference Room may be obtained by calling the SEC at 1-800-SEC-0330.www.sec.gov. References in this report to our website address are provided only as a convenience and do not constitute, and should not be viewed as, an incorporation by reference of the information contained on, or available through, the website. Therefore, such information should not be considered part of this report.
Part I - Item 1A. Risk Factors
Item 1A. RISK FACTORS
In deciding whether to invest in The Hartford, you should carefully consider the following risks, any of which could have a material adverse effect on our business, financial condition, results of operation or liquidity and could also impact the trading price of our securities. These risks are not exclusive, and additional risks to which we are subject include, but are not limited to, the factors mentioned under “Forward-Looking Statements” above and the risks of our businesses described elsewhere in this Annual Report on Form 10-K.
The following risk factors have been organized by category for ease of use, however many of the risks may have impacts in more than one category. The occurrence of certain of them may, in turn, cause the emergence or exacerbate the effect of others. Such a combination could materially increase the severity of the impact of these risks on our business, results of operations, financial condition or liquidity.
As noted below under “Risks Relating to the Pending Sale of Our Life and Annuity Business," the assets and liabilities of the life and annuity run-off business, consisting primarily of the operations of Hartford Life Insurance Company and Hartford Life and Annuity Insurance Company (formerly known as Talcott Resolution), have been accounted for as held for sale as of December 31, 2017, with the operating results of that business included in discontinued operations for all periods presented. The Company expects the sale to close by June 30, 2018, subject to regulatory approval and other closing conditions. Apart from interest expense on debt issued and outstanding of Hartford Life, Inc., the holding company of the life and annuity run-off business, and certain tax benefits to be retained by The Hartford, the results from the discontinued operations inure to the buyer. Accordingly, any earnings or losses of the life and annuity run-off business up until closing will not change the Company's results. If the sale of the business does not close, we would retain the risks associated with the life and annuity run-off business.
Risks Relating to Economic, Political and Global Market Conditions
Unfavorable economic, political and global market conditions may adversely impact our business and results of operations.
The Company’s investment portfolio and insurance liabilities are sensitive to changes in economic, political and global capital market conditions, such as the effect of a weak economy and changes in credit spreads, equity prices, interest rates and inflation. Weak economic conditions, such as high unemployment, low labor force participation, lower family income, a weak real estate market, lower business investment and lower consumer spending may adversely affect the demand for insurance and financial products and lower the Company’s profitability in some cases. In addition, a deterioration in global economic conditions, including due to a trade war, tariffs or other actions with respect to international trade agreements or policies, has the potential to, among other things, reduce demand for our products, reduce exposures we insure, drive higher inflation that could increase the Company’s loss costs and result in increased incidence of claims, particularly for workers’ compensation and disability claims. The Company’s investment portfolio includes limited partnerships and other alternative investments and equity securities for which
changes in value are reported in earnings. These investments may be adversely impacted by political turmoil and economic volatility, including real estate market deterioration, which could impact our net investment returns and result in an adverse impact on operating results.
Below are several key factors impacted by changes in economic, political, and global market conditions and their potential effect on the Company’s business and results of operation:
| |
| • | Credit Spread Risk - Credit spread exposure is reflected in the market prices of fixed income instruments where lower |
Credit Spread Risk- Credit spread exposure is reflected in the market prices of fixed income instruments where lower rated securities generally trade at a higher credit spread. If issuer credit spreads increase or widen, the market value of our investment portfolio may decline. If the credit spread widening is significant and occurs over an extended period of time, the Company may recognize other-than-temporary impairments, resulting in decreased earnings. If credit spreads tighten, significantly, the Company’s net investment income associated with new purchases of fixed maturities may be reduced. In addition, the value of credit derivatives under which the Company assumes exposure or purchases protection are impacted by changes in credit spreads, with losses occurring when credit spreads widen for assumed exposure or when credit spreads tighten if credit protection has been purchased.
Equity Markets Risk - A decline in equity markets may result in unrealized capital losses on investments in equity securities recorded against net income and lower earnings from Mutual Funds where fee income is earned based upon the fair value of the assets under management. Equity markets are unpredictable. In early 2018, the equity markets were more volatile than in the months prior, which could be indicative of a greater risk of a decline.
Interest Rate Risk -Global economic conditions may result in the persistence of a low interest rate environment which would continue to pressure our net investment income and could result in lower margins on certain products.
| |
| • | Equity Markets Risk - A decline in equity markets may result in unrealized capital losses on investments in equity securities recorded against net income and lower earnings from Hartford Funds where fee income is earned based upon the fair value of the assets under management. Equity markets are unpredictable. During 2018, the equity markets were more volatile than in prior periods, which could be indicative of a greater risk of a decline. For additional information on equity market sensitivity, see Part II, Item 7 Management's Discussion and Analysis of Financial Condition and Results of Operation (MD&A), Enterprise Risk Management, Financial Risk- Equity Risk. |
| |
| • | Interest Rate Risk -Global economic conditions may result in the persistence of a low interest rate environment which would continue to pressure our net investment income and could result in lower margins on certain products. For additional information on interest rate sensitivity, see Part II, Item 7, MD&A, Enterprise Risk Management, Financial Risk - Interest Rate Risk |
New and renewal business for our property and casualty and group benefits products is priced based onconsidering prevailing interest rates. As interest rates decline, in order to achieve the same economic return, we would have to increase product prices to offset the lower anticipated investment income earned on invested premiums. Conversely, as interest rates rise, pricing targets will tend to decrease to reflect higher anticipated investment income. Our ability to effectively react to such changes in interest rates may affect our competitiveness in the marketplace, and in turn, could reduce written premium and earnings. For additional information on interest rate sensitivity, see Part II, Item 7 Management's Discussion and Analysis of Financial Condition and Results of Operation (MD&A), Enterprise Risk Management, Financial Risk - Interest Rate Risk.
In addition, due to the long-term nature of the liabilities within our Group Benefits operations, particularly for long-term disability, declines in interest rates over an extended period of time would result in our having to reinvest at lower yields. On the other hand, a rise in interest rates, in the absence of other countervailing changes, would reduce the market value of our investment portfolio. A decline in market value of invested assets due to an increase in interest rates could also limit our ability to realize tax benefits from previously recognized capital losses.
Part I - Item 1A. Risk Factors
Inflation Risk - Inflation is a risk to our property and casualty business because, in many cases, claims are paid out many years after a policy is written and premium is collected for the risk. Accordingly, a greater than expected increase in inflation related to the cost of medical services and repairs over the claim settlement period can result in higher claim costs than what was estimated at the time the policy was written. Inflation can also affect consumer spending and business investment which can reduce the demand for our products and services.
| |
| • | Inflation Risk - Inflation is a risk to our property and casualty business because, in many cases, claims are paid out many years after a policy is written and premium is collected for the risk. Accordingly, a greater than expected increase in inflation related to the cost of medical services and repairs over the claim settlement period can result in higher claim costs than what was estimated at the time the policy was written. Inflation can also affect consumer spending and business investment which can reduce the demand for our products and services. |
Concentration of our investment portfolio increases the potential for significant losses.
The concentration of our investment portfolios in any particular industry, collateral type, group of related industries or geographic sector could have an adverse effect on our investment portfolios and consequently on our business, financial condition, results of operations, and liquidity. Events or developments that have a negative impact on any particular industry, collateral type, group of related industries or geographic region may have a greater adverse effect on our investment portfolio to the extent that the portfolio is concentrated rather than diversified.
Further, if issuers of securities or loans we hold are acquired, merge or otherwise consolidate with other issuers of securities or loans held by the Company, our investment portfolio’s credit concentration risk to issuers could increase for a period of time, until the Company is able to sell securities to get back in compliance with the established investment credit policies.
Changing climate and weather patterns may adversely affect our business, financial condition and results of operation.
Climate change presents risks to us as an insurer, investor and employer. Climate models indicate that rising temperatures will likely result in rising sea levels over the decades to come and may increase the frequency and intensity of natural catastrophes and severe weather events. Extreme weather events such as abnormally high temperatures may result in increased losses associated with our property, auto, workers’ compensation and group benefits businesses. Changing climate patterns may also increase the duration, frequency and intensity of heat/cold waves, which may result in increased claims for property damage, business interruption and losses under workers’ compensation, group disability and group life coverages. Precipitation patterns across the U.S. are projected to change, which if realized, may increase risks of flash floods and wildfires. Additionally, there may be an impact on the demand, price and availability of automobile and homeowners insurance, and there is a risk of higher reinsurance costs or more limited availability of reinsurance coverage. Changes in climate conditions may also cause our underlying modeling data to not adequately reflect frequency and severity, limiting our ability to effectively evaluate and manage risks of catastrophes and severe weather events. Among other impacts, this could result in not charging enough premiums or not obtaining timely state approvals for rate increases to cover the risks we insure. We may also experience significant interruptions to the Company’s systems and operations that hinder our ability to sell and service business, manage claims and operate our business.
In addition, climate change-related risks may adversely impact the value of the securities that we hold. The effects of climate
change could also lead to increased credit risk of other counterparties we transact business with, including reinsurers. Rising sea levels may lead to decreases in real estate values in coastal areas, reducing premium and demand for commercial property and homeowners insurance and adversely impacting the value of our real estate-related investments. Additionally, government policies or regulations to slow climate change, such as emission controls or technology mandates, may have an adverse impact on sectors such as utilities, transportation and manufacturing, affecting demand for our products and our investments in these sectors.
Changes in security asset prices may impact the value of our fixed income, real estate and commercial mortgage investments, resulting in realized or unrealized losses on our invested assets. Our decision to invest in certain securities and loans may also be impacted by changes in climate patterns due to:
changes in supply/demand characteristics for fuel (e.g., coal, oil, natural gas)
advances in low-carbon technology and renewable energy development and
effects of extreme weather events on the physical and operational exposure of industries and issuers
Because there is significant variability associated with the impacts of climate change, we cannot predict how physical, legal, regulatory and social responses may impact our business.
A change in or replacement of the London Inter-Bank Offered Rate ("LIBOR") may adversely affect the value of certain derivatives and floating rate securities we hold and floating rate securities we have issued, and any other assets or liabilities whose value may be tied to LIBOR.
Should financial institutions stop reporting the benchmark interest rate known as LIBOR or change how the rate is calculated, the Company could suffer economic loss to the extent it has fixed maturity investments or other financial instruments that do not provide for a replacement reference rate and which mature after the date LIBOR is changed or is no longer published. LIBOR is the interest rate at which banks have historically offered to lend funds to one another for short-term loans. Actions by regulators or law enforcement agencies, as well as the Intercontinental Exchange (ICE) Benchmark Administration (the current administrator of LIBOR) may result in changes to the way LIBOR is determined or the establishment of alternative reference rates. For example, on July 27, 2017, the U.K. Financial Conduct Authority announced that it intends to stop persuading or compelling banks to submit LIBOR rates after 2021. The U.S. Federal Reserve, based on the recommendations of the New York Federal Reserve’s Alternative Reference Rate Committee (constituted of major derivative market participants and their regulators), has begun publishing a Secured Overnight Funding Rate (“SOFR”) which is intended to replace U.S. dollar LIBOR. Plans for alternative reference rates for other currencies have also been announced. At this time, it is not possible to predict how markets will respond to these new rates, and the effect that any changes in LIBOR or discontinuation of LIBOR might have on new or existing financial instruments. If LIBOR ceases to exist or if the
Part I - Item 1A. Risk Factors
methods of calculating LIBOR change from current methods for any reason, outstanding contracts with interest rates tied to LIBOR may be adversely affected if those contracts either do not automatically provide for a replacement rate such as SOFR or convert to another reference rate that could be less favorable to the Company. Outstanding contracts that could be affected include interest rates on certain derivatives and floating rate securities we hold, securities we have issued, and any other assets or liabilities whose value is tied to LIBOR. Further, any uncertainty regarding the continued use and reliability of LIBOR as a benchmark interest rate could adversely affect the value of such instruments.
Insurance Industry and Product Related Risks
Unfavorable loss development may adversely affect our business, financial condition, results of operations and liquidity.
We establish property and casualty loss reserves to cover our estimated liability for the payment of all unpaid losses and loss expenses incurred with respect to premiums earned on our policies. Loss reserves are estimates of what we expect the ultimate settlement and administration of claims will cost, less what has been paid to date. These estimates are based upon actuarial projections and on our assessment of currently available data, as well as estimates of claims severity and frequency, legal theories of liability and other factors.
Loss reserve estimates are refined periodically as experience develops and claims are reported and settled, potentially resulting in increases to our reserves. Increases in reserves would be recognized as an expense during the periods in which these determinations are made, thereby adversely affecting our results of operations for those periods. In addition, since reserve estimates of aggregate loss costs for prior years are used in pricing our insurance products, inaccurate reserves can lead to our products not being priced adequately to cover actual losses and related loss expenses in order to generate a profit.
We continue to receive asbestos and environmental ("A&E")claims, the vast majority of which relate to policies written before 1986. Estimating the ultimate gross reserves needed for unpaid losses and related expenses for asbestos and
environmental claims is particularly difficult for insurers and reinsurers. The actuarial tools and other techniques used to estimate the ultimate cost of more traditional insurance exposures tend to be less precise when used to estimate reserves for some A&E exposures.
Moreover, the assumptions used to estimate gross reserves for A&E claims, such as claim frequency over time, average severity, and how various policy provisions will be interpreted, are subject to significant uncertainty. It is also not possible to predict changes in the legal and legislative environment and their effect on the future development of A&E claims. These factors, among others, make the variability of gross reserves estimates for these longer-tailed exposures significantly greater than for other more traditional exposures.
Effective December 31, 2016, the Company entered into an agreement with National Indemnity Company (“NICO”), a
subsidiary of Berkshire Hathaway Inc. (“Berkshire”) whereby the Company is reinsured for subsequent adverse development on substantially all of its net A&E reserves up to an aggregate net limit of $1.5 billion. The adverse development cover excludes risk of adverse development on net A&E reserves held by the Company's U.K. Property and Casualty run-off subsidiaries which have been accounted for as liabilities held for sale in the consolidated balance sheets as of December 31, 2016. We remain directly liable to claimants and if the reinsurer does not fulfill its obligations under the agreement or if future adverse development exceeds the $1.5 billion aggregate limit, we may need to increase our recorded net reserves which could have a material adverse effect on our financial condition, results of operations and liquidity. As of December 31, 2018, $977 of aggregated limit remained available under the adverse development cover. Furthermore, if cumulative A&E losses ceded to NICO were to exceed the $650 of ceded premium paid to NICO, the Company would defer recognition of the reinsurance benefit related to incurred losses above $650, resulting in a charge to earnings until such periods as reinsurance recoveries begin to be collected. As of December 31, 2018, the Company had ceded cumulative losses of $523 to NICO. For additional information related to risks associated with the adverse development cover, see Note 8 - Reinsurance and Note 14 - Commitments and Contingencies of Notes to Consolidated Financial Statements.
We are vulnerable to losses from catastrophes, both natural and man-made.
Our insurance operations expose us to claims arising out of catastrophes. Catastrophes can be caused by various unpredictable natural events, including, among others, earthquakes, hurricanes, hailstorms, severe winter weather, wind storms, fires, tornadoes, and pandemics. Catastrophes can also be man-made, such as terrorist attacks, cyber-attacks, explosions or infrastructure failures.
The geographic distribution of our business subjects us to catastrophe exposure for events occurring in a number of areas, including, but not limited to: hurricanes in Florida, the Gulf Coast, the Northeast and the Atlantic coast regions of the United States; tornadoes and hail in the Midwest and Southeast; earthquakes in geographical regions exposed to seismic activity; wildfires in the West and the spread of disease. Any increases in the values and concentrations of insured employeesinsureds and property in these areas would increase the severity of catastrophic events in the future. In addition, over time,changes in climate changeand/or weather patterns may increase the severityfrequency and/or intensity of certainsevere weather and natural catastrophe events.events potentially leading to increased insured losses. Potential examples include, but are not limited to:
an increase in the frequency or severityintensity of wind and thunderstorm and tornado/hailstorm events due to increased convection in the atmosphere,
more frequent and larger wildfires in certain geographies,
Part I - Item 1A. Risk Factors
higher incidence of deluge flooding, and
the potential for an increase in frequency and severity of hurricane events.
For a further discussion of climate-related risks, see the largest hurricane events due to higher sea surface temperatures.above-referenced Risk Factor,“Changing climate and weather patterns
Part I - Item 1A. Risk Factors
may adversely affect our business, financial condition and results of operation.”
Our businesses also have exposure to global or nationally occurring pandemics caused by highly infectious and potentially fatal diseases spread through human, animal or plant populations.
In the event of one or more catastrophes, policyholders may be unable to meet their obligations to pay premiums on our insurance policies. Further, our liquidity could be constrained by a catastrophe, or multiple catastrophes, which could result in extraordinary losses. In addition, in part because accounting rules do not permit insurers to reserve for such catastrophic events until they occur, claims from catastrophic events could have a material adverse effect on our business, financial condition, results of operations or liquidity. The amount we charge for catastrophe exposure may be inadequate if the frequency or severity of catastrophe losses changes over time or if the models we use to estimate the exposure prove inadequate. In addition, regulators or legislators could limit our ability to charge adequate pricing for catastrophe exposures or shift more responsibility for covering risk.
Terrorism is an example of a significant man-made caused potential catastrophe. Private sector catastrophe reinsurance is limited and generally unavailable for terrorism losses caused by attacks with nuclear, biological, chemical or radiological weapons. In addition, workers' compensation policies generally do not have exclusions or limitations for terrorism losses. Reinsurance coverage from the federal government under the Terrorism Risk Insurance Program Reauthorization Act of 2015 (“TRIPRA”) is also limited and only applies for certified acts of terrorism that exceed a certain threshold of industry losses. Accordingly, the effects of a terrorist attack in the geographic areas we serve may result in claims and related losses for which we do not have adequate reinsurance. Further, the continued threat of terrorism and the occurrence of terrorist attacks, as well as heightened security measures and military action in response to these threats and attacks or other geopolitical or military crises, may cause significant volatility in global financial markets, disruptions to commerce and reduced economic activity. These consequences could have an adverse effect on the value of the assets in our investment portfolio as well as those in our separate accounts.portfolio. Terrorist attacks also could disrupt our operation centers. In addition, TRIPRA expires on December 31, 2020 and if the U.S. Congress does not reauthorize the program or significantly reduces the government’s share of covered terrorism losses, the Company’s exposure to terrorism losses could increase materially unless it can purchase alternative terrorism reinsurance protection in the private markets at affordable prices or takes actions to materially reduce its exposure in lines of business subject to terrorism risk. For a further discussion of TRIPRA, see Part II, Item 7, MD&A - Enterprise Risk Management - Insurance Risk Management, Reinsurance as a Risk Management Strategy.
As a result, it is possible that any, or a combination of all, of these factors related to a catastrophe, or multiple catastrophes, whether natural or man-made, can have a material adverse effect on our business, financial condition, results of operations or liquidity.
Pricing for our products is subject to our ability to adequately assess risks, estimate losses and comply with state insurance regulations.
We seek to price our property and casualty and group benefits insurance policies such that insurance premiums and future net investment income earned on premiums received will provide for an acceptable profit in excess of underwriting expenses and the cost of paying claims. Pricing adequacy depends on a number of factors, including proper evaluation of underwriting risks, the
ability to project future claim costs, our expense levels, net investment income realized, our response to rate actions taken by competitors, legal and regulatory developments, and the ability to obtain regulatory approval for rate changes.
State insurance departments regulate many of the premium rates we charge and also propose rate changes for the benefit of the property and casualty consumer at the expense of the insurer, which may not allow us to reach targeted levels of profitability. In addition to regulating rates, certain states have enacted laws that require a property and casualty insurer to participate in assigned risk plans, reinsurance facilities, joint underwriting associations and other residual market plans. State regulators also require that an insurer offer property and casualty coverage to all consumers and often restrict an insurer's ability to charge the price it might otherwise charge or restrict an insurer's ability to offer or enforce specific policy deductibles. In these markets, we may be compelled to underwrite significant amounts of business at lower than desired rates or accept additional risk not contemplated in our existing rates, participate in the operating losses of residual market plans or pay assessments to fund operating deficits of state-sponsored funds, possibly leading to lower returns on equity. The laws and regulations of many states also limit an insurer's ability to withdraw from one or more lines of insurance in the state, except pursuant to a plan that is approved by the state's insurance department. Additionally, certain states require insurers to participate in guaranty funds for impaired or insolvent insurance companies. These funds periodically assess losses against all insurance companies doing business in the state. Any of these factors could have a material adverse effect on our business, financial condition, results of operations or liquidity.
Additionally, the property and casualty and group benefits insurance markets have been historically cyclical, experiencing periods characterized by relatively high levels of price competition, less restrictive underwriting standards, more expansive coverage offerings, multi-year rate guarantees and declining premium rates, followed by periods of relatively low levels of competition, more selective underwriting standards, more coverage restrictions and increasing premium rates. In all of our property and casualty and group benefits insurance product lines and states, there is a risk that the premium we charge may ultimately prove to be inadequate as reported losses emerge. In addition, there is a risk that regulatory constraints, price competition or incorrect pricing assumptions could prevent us from achieving targeted returns. Inadequate pricing could have a material adverse effect on our results of operations and financial condition.
Part I - Item 1A. Risk Factors
Competitive activity, use of data analytics, or technological changes may adversely affect our market share, demand for our products, or our financial results.
The industries in which we operate are highly competitive. Our principal competitors are other property and casualty insurers, group benefits providers and providers of mutual funds and exchange-traded products. Competitors may expand their risk appetites in products and services where The Hartford currently enjoys a competitive advantage. Larger competitors with more capital and new entrants to the market could result in increased pricing pressures on a number of our products and services and may harm our ability to maintain or increase our profitability. For
Part I - Item 1A. Risk Factors
example, larger competitors, including those formed through consolidation or who may acquire new entrants to the market, such as insurtech firms, may have lower operating costs and an ability to absorb greater risk while maintaining their financial strength ratings, thereby allowing them to price their products more competitively. In addition, a number of insurers are making use of "big data" analytics to, among other things, improve pricing accuracy, be more targeted in marketing, strengthen customer relationships and provide more customized loss prevention services. If they are able to use big data more effectively than we are, it may give them a competitive advantage. Because of the highly competitive nature of the industries we compete in, there can be no assurance that we will continue to compete effectively with our industry rivals, or that competitive pressure will not have a material adverse effect on our business and results of operations.
Our business could also be affected by technological changes, including further advancements in automotive safety features, the development of autonomous or “self-driving” vehicles, and platforms that facilitate ride sharing. These technologies could impact the frequency or severity of losses, disrupt the demand for certain of our products, or reduce the size of the automobile insurance market as a whole. In addition, the risks we insure are affected by the increased use of technology in homes and businesses, including technology used in heating, ventilation, air conditioning and security systems and the introduction of more automated loss control measures. While there is substantial uncertainty about the timing, penetration and reliability of such technologies, and the legal frameworks that may apply, such as for example to autonomous vehicles, any such impacts could have a material adverse effect on our business and results of operations.
We may experience difficulty in marketing and providing insurance products and investment advisory services through distribution channels and advisory firms.
We distribute our insurance products, mutual funds and Exchange Traded Products (ETPs)ETPs through a variety of distribution channels and financial intermediaries, including brokers, independent agents, broker-dealers, banks, registered investment advisors, affinity partners, our own internal sales force and other third-party organizations. In some areas of our business, we generate a significant portion of our business through third-party arrangements. For example, we market personal lines products in large part through an exclusive licensing arrangement with AARP that continues through January 1, 2023. Our ability to distribute products through the AARP
program may be adversely impacted by membership levels and the pace of membership growth. In addition, the independent agent and broker distribution channel is consolidating which could result in a larger proportion of written premium being concentrated among fewer agents and brokers, potentially increasing our cost of acquiring new business. While we periodically seek to renew or extend third party arrangements, there can be no assurance that our relationship with these third parties will continue or that the economics of these relationships won't change to make them less financially attractive to the Company. An interruption in our relationship with certain of these third parties could materially affect our ability to market our products and could have a material adverse effect on our business, financial condition, results of operations and liquidity.
Unexpected and unintended claim and coverage issues under our insurance contracts may adversely impact our financial performance.
Changes in industry practices and in legal, judicial, social and other environmental conditions, technological advances or fraudulent activities, may require us to pay claims we did not intend to cover when we wrote the policies. These issues may either extend coverage beyond our underwriting intent or increase the frequency or severity of claims. In some instances, these changes, advances or activities may not become apparent until some time after we have issued insurance contracts that are affected by the changes, advances or activities. As a result, the full extent of liability under our insurance contracts may not be known for many years after a contract is issued, and this liability may have a material adverse effect on our business, financial condition, results of operations and liquidity at the time it becomes known.
Financial Strength, Credit and Counterparty Risks
Downgrades in our financial strength or credit ratings may make our products less attractive, increase our cost of capital and inhibit our ability to refinance our debt.
Financial strength and credit ratings are important in establishing the competitive position of insurance companies. Rating agencies assign ratings based upon several factors. While most of the factors relate to the rated company, others relate to the views of the rating agency (including its assessment of the strategic importance of the rated company to the insurance group), general economic conditions, and circumstances outside the rated company's control. In addition, rating agencies may employ different models and formulas to assess the financial strength of a rated company, and from time to time rating agencies have altered these models. Changes to the models or factors used by the rating agencies to assign ratings could adversely impact a rating agency's judgment of its internal rating and the publicly issued rating it assigns us.
Part I - Item 1A. Risk Factors
Our financial strength ratings, which are intended to measure our ability to meet policyholder obligations, are an important factor affecting public confidence in most of our products and, as a result, our competitiveness. A downgrade or a potential downgrade in the rating of our financial strength or of one of our principal insurance subsidiaries could affect our competitive position and reduce future sales of our products.
Our credit ratings also affect our cost of capital. A downgrade or a potential downgrade of our credit ratings could make it more difficult or costly to refinance maturing debt obligations, to support business growth at our insurance subsidiaries and to maintain or improve the financial strength ratings of our principal insurance subsidiaries. These events could materially adversely affect our business, financial condition, results of operations and liquidity. For a further discussion of potential impacts of ratings
Part I - Item 1A. Risk Factors
downgrades on derivative instruments, including potential collateral calls, see Part II, Item 7, MD&A - Capital Resources and Liquidity - Derivative Commitments.
The amount of statutory capital that we must hold to maintain our financial strength and credit ratings and meet other requirements can vary significantly from time to time and is sensitive to a number of factors outside of our control.
We conduct the vast majority of our business through licensed insurance company subsidiaries. Statutory accounting standards and statutory capital and reserve requirements for these entities are prescribed by the applicable insurance regulators and the National Association of Insurance Commissioners (“NAIC”). The minimum capital we must hold is based on risk-based capital (“RBC”) formulas for both life and property and casualty companies. The RBC formula for life companies is applicable to our group benefits business and establishes capital requirements relating to insurance, business, asset, credit, interest rate and off-balance sheet risks. The RBC formula for property and casualty companies sets required statutory surplus levels based on underwriting, asset, credit and off-balance sheet risks.
In any particular year, statutory surplus amounts and RBC ratios may increase or decrease depending on a variety of factors, including
the amount of statutory income or losses generated by our insurance subsidiaries,
the amount of additional capital our insurance subsidiaries must hold to support business growth,
the amount of dividends or distributions taken out of our insurance subsidiaries,
changes in equity market levels,
the value of certain fixed-income and equity securities in our investment portfolio,
the value of certain derivative instruments,
changes in interest rates,
admissibility of deferred tax assets, and
changes to the NAIC RBC formulas.
Most of these factors are outside of the Company's control. The Company's financial strength and credit ratings are significantly influenced by the statutory surplus amounts and RBC ratios of our insurance company subsidiaries. In addition, rating agencies may implement changes to their internal models that have the effect of increasing the amount of statutory capital we must hold in order to maintain our current ratings. ProjectingThe RBC ratio could also be negatively affected if the NAIC or state insurance regulators change the statutory capital and the related RBC ratios is complex.accounting guidance for determining statutory capital. If our statutory capital resources are insufficient to maintain a particular rating by one or more rating agencies, we may need to use holding company resources or seek to raise capital through public or private equity or debt financing. If we were not to raise additional capital, either at our discretion or because we were unable to do so, our financial strength and credit ratings might be downgraded by one or more rating agencies.
Losses due to nonperformance or defaults by counterparties can have a material adverse effect on the value of our investments, reduce our profitability or sources of liquidity.
We have credit risk with counterparties onassociated with investments, derivatives, premiums receivable, reinsurance recoverables and reinsurance recoverables.indemnifications provided by third parties in connection with previous dispositions. Among others, our counterparties include issuers of fixed maturity and equity securities we hold, borrowers of mortgage loans we hold, customers, trading counterparties, counterparties under swaps and other derivative contracts, reinsurers, clearing agents, exchanges, clearing houses and other financial intermediaries and guarantors. These counterparties may default on their obligations to us due to bankruptcy, insolvency, lack of liquidity, adverse economic conditions, operational failure, fraud, government intervention and other reasons. In addition, for exchange-traded derivatives, such as futures, options and "cleared" over-the-counter derivatives, the Company is generally exposed to the credit risk of the relevant central counterparty clearing house. Defaults by these counterparties on their obligations to us could have a material adverse effect on the value of our investments, business, financial condition, results of operations and liquidity. Additionally, if the underlying assets supporting the structured securities we invest in default on their payment obligations, our securities will incur losses.
The availability of reinsurance and our ability to recover under reinsurance contracts may not be sufficient to protect us against losses.
As an insurer, we frequently use reinsurance to reduce the effect of losses that may arise from, among other things, catastrophes and other risks that can cause unfavorable results of operations. Under these reinsurance arrangements, other insurers assume a portion of our losses and related expenses; however, we remain liable as the direct insurer on all risks reinsured. Consequently, ceded reinsurance arrangements do not eliminate our obligation to pay claims, and we are subject to our reinsurers' credit risk with respect to our ability to recover amounts due from them. The inability or unwillingness of any reinsurer to meet its financial obligations to us, including the impact of any insolvency or rehabilitation proceedings involving a reinsurer that could affect the Company's access to collateral held in trust, could have a
Part I - Item 1A. Risk Factors
material adverse effect on our financial condition, results of operations and liquidity.
In addition, should the availability and cost of reinsurance change materially, we may have to pay higher reinsurance costs, accept an increase in our net liability exposure, reduce the amount of business we write, or access to the extent possible other alternatives to reinsurance, such as use of the capital markets. Further, due to the inherent uncertainties as to collection and the length of time before reinsurance recoverables will be due, it is possible that future adjustments to the Company’s reinsurance recoverables, net of the allowance, could be required, which could have a material adverse effect on the Company’s consolidated results of operations or cash flows in a particular quarterly or annual period.
Our ability to declare and pay dividends is subject to limitations.
The payment of future dividends on our capital stock is subject to the discretion of our board of directors, which considers, among
Part I - Item 1A. Risk Factors
other factors, our operating results, overall financial condition, credit-risk considerations and capital requirements, as well as general business and market conditions. Our board of directors may only declare such dividends out of funds legally available for such payments. Moreover, our common stockholders are subject to the prior dividend rights of any holders of depositary shares representing such preferred stock then outstanding. The terms of our outstanding junior subordinated debt securities prohibit us from declaring or paying any dividends or distributions on our capital stock or purchasing, acquiring, or making a liquidation payment on such stock, if we have given notice of our election to defer interest payments and the related deferral period has not yet commenced or a deferral period is continuing.
Moreover, as a holding company that is separate and distinct from our insurance subsidiaries, we have no significant business operations of our own. Therefore, we rely on dividends from our insurance company subsidiaries and other subsidiaries as the principal source of cash flow to meet our obligations. Subsidiary dividends fund payments on our debt securities and the payment of dividends to shareholdersstockholders on our capital stock. Connecticut state laws and certain other jurisdictions in which we operate limit the payment of dividends and require notice to and approval by the state insurance commissioner for the declaration or payment of dividends above certain levels. Dividends paid from our insurance subsidiaries are further dependent on their cash requirements. In addition, in the event of liquidation or reorganization of a subsidiary, prior claims of a subsidiary’s creditors may take precedence over the holding company’s right to a dividend or distribution from the subsidiary except to the extent that the holding company may be a creditor of that subsidiary. For further discussion on dividends from insurance subsidiaries, see Part II, Item 7, MD&A - Capital Resources & Liquidity.
Risks Relating to Estimates, Assumptions and Valuations
Actual results could materially differ from the analytical models we use to assist our decision making in key areas such as underwriting, pricing, capital hedging,management, reserving, investments, reinsurance and catastrophe risks.
We use models to help make decisions related to, among other things, underwriting, pricing, capital allocation, reserving, investments, hedging, reinsurance, and catastrophe risk. Both proprietary and third party models we use incorporate numerous assumptions and forecasts about the future level and variability of interest rates, capital requirements, loss frequency and severity, currency exchange rates, policyholder behavior, equity markets and inflation, among others. The models are subject to the inherent limitations of any statistical analysis as the historical internal and industry data and assumptions used in the models may not be indicative of what will happen in the future. Consequently, actual results may differ materially from our modeled results. The profitability and financial condition of the Company substantially depends on the extent to which our actual experience is consistent with assumptions we use in our models
and ultimate model outputs. If, based upon these models or other factors, we misprice our products or our estimates of the risks we are exposed to prove to be materially inaccurate, our business, financial condition, results of operations or liquidity may be adversely affected.
The valuation of our securities and investments and the determination of allowances and impairments are highly subjective and based on methodologies, estimations and assumptions that are subject to differing interpretations and market conditions.
Estimated fair values of the Company’s investments are based on available market information and judgments about financial instruments, including estimates of the timing and amounts of expected future cash flows and the credit standing of the issuer or counterparty. During periods of market disruption, it may be difficult to value certain of our securities if trading becomes less frequent and/or market data becomes less observable. There may be certain asset classes that were in active markets with significant observable data that become illiquid due to the financial environment. In addition, there may be certain securities whose fair value is based on one or more unobservable inputs, even during normal market conditions. As a result, the determination of the fair values of these securities may include inputs and assumptions that require more estimation and management judgment and the use of complex valuation methodologies. These fair values may differ materially from the value at which the investments may be ultimately sold. Further, rapidly changing or unprecedented credit and equity market conditions could materially impact the valuation of securities and
Part I - Item 1A. Risk Factors
the period-to-period changes in value could vary significantly. Decreases in value could have a material adverse effect on our business, results of operations, financial condition and liquidity.
Similarly, management’s decision on whether to record an other-than-temporary impairment or write down is subject to significant judgments and assumptions regarding changes in general economic conditions, the issuer's financial condition or future recovery prospects, estimated future cash flows, the effects of changes in interest rates or credit spreads, the expected recovery period and the accuracy of third party information used in internal assessments. As a result, management’s evaluations and assessments are highly judgmental and its projections of future cash flows over the life of certain securities may ultimately prove incorrect as facts and circumstances change.
If our businesses do not perform well, we may be required to establish a valuation allowance against the deferred income tax asset or to recognize an impairment of our goodwill.
Our income tax expense includes deferred income taxes arising from temporary differences between the financial reporting and tax bases of assets and liabilities and carry-forwards for possible foreign tax credits, capital losses and net operating losses. Deferred tax assets are assessed periodically by management to determine if it is more likely than not that the deferred income tax assets will be realized. Factors in management's determination include the performance of the business, including the ability to generate, from a variety of sources and tax planning strategies, sufficient
Part I - Item 1A. Risk Factors
future taxable income and capital gains before net operating loss and capital loss carry-forwards expire.As interest rates rise, it may be difficult to generate realized capital gains from the sale of fixed maturity securities to use capital loss carryforwards. If based on available information, it is more likely than not that we are unable to recognize a full tax benefit on deferred tax assets, then a valuation allowance will be established with a corresponding charge to net income (loss). Charges to increase our valuation allowance could have a material adverse effect on our results of operations and financial condition.
Goodwill represents the excess of the amounts we paid to acquire subsidiaries and other businesses over the fair value of their net assets at the date of acquisition. We test goodwill at least annually for impairment. Impairment testing is performed based upon estimates of the fair value of the “reporting unit” to which the goodwill relates. The reporting unit is the operating segment or a business one level below an operating segment if discrete financial information is prepared and regularly reviewed by management at that level. The fair value of the reporting unit could decrease if new business, customer retention, profitability or other drivers of performance differ from expectations. If it is determined that the goodwill has been impaired, the Company must write down the goodwill by the amount of the impairment, with a corresponding charge to net income (loss). These write downs could have a material adverse effect on our results of operations or financial condition.
Strategic and Operational Risks
Our businesses may suffer and we may incur substantial costs if we are unable to access our systems and safeguard the security of our data in the event of a disaster, cyber breach or other information security incident.
We use technology to process, store, retrieve, evaluate and utilize customer and company data and information. Our information technology and telecommunications systems, in turn, interface with and rely upon third-party systems. We and our third party vendors must be able to access our systems to provide insurance quotes, process premium payments, make changes to existing policies, file and pay claims, administer mutual funds, provide customer support, manage our investment portfolios, and hedge programs, report on financial results and perform other necessary business functions.
Systems failures or outages could compromise our ability to perform these business functions in a timely manner, which could harm our ability to conduct business and hurt our relationships with our business partners and customers. In the event of a disaster such as a natural catastrophe, a pandemic, an industrial accident, a cyber-attack, a blackout, a terrorist attack (including conventional, nuclear, biological, chemical or radiological) or war, systems upon which we rely may be inaccessible to our employees, customers or business partners for an extended period of time. Even if our employees and business partners are able to report to work, they may be unable to perform their duties for an extended period of time if our data or systems used to conduct our business are disabled or destroyed.
Our systems have been, and will likely continue to be, subject to viruses or other malicious codes, unauthorized access, cyber-
attackscyber-attacks or other computer related penetrations. The frequency and sophistication of such threats continue to increase as well. While, to date, The Hartford is not aware of having experienced a material breach of our cyber security systems, administrative and technical controls as well as other preventive actions may be insufficient to prevent physical and electronic break-ins, denial of service, cyber-attacks or other security breaches to our systems or those of third parties with whom we do business. Such an event could compromise our confidential information as well as that of our clients and third parties, impede or interrupt our business operations and result in other negative consequences, including remediation costs, loss of revenue, additional regulatory scrutiny and litigation and reputational damage. In addition, we routinely transmit to third parties personal, confidential and proprietary information, which may be related to employees and customers, by email and other electronic means, along with receiving and storing such information on our systems. Although we attempt to protect privileged and confidential information, we may be unable to secure the information in all events, especially with clients, vendors, service providers, counterparties and other third parties who may not have appropriate controls to protect confidential information.
Our businesses must comply with regulations to control the privacy of customer, employee and third party data, and state and federal regulations regarding data privacy are becoming increasingly more onerous. A misuse or mishandling of
Part I - Item 1A. Risk Factors
confidential or proprietary information could result in legal liability, regulatory action and reputational harm.
Third parties, including third party administrators, are also subject to cyber-breaches of confidential information, along with the other risks outlined above, any one of which may result in our incurring substantial costs and other negative consequences, including a material adverse effect on our business, reputation, financial condition, results of operations and liquidity. While we maintain cyber liability insurance that provides both third party liability and first party insurance coverages, our insurance may not be sufficient to protect against all loss.
Performance problems due to outsourcing and other third-party relationships may compromise our ability to conduct business.
We outsource certain business and administrative functions and rely on third-party vendors to perform certain functions or provide certain services on our behalf and have a significant number of information technology and business processes outsourced with a single vendor. If we are unable to reach agreement in the negotiation of contracts or renewals with certain third-party providers, or if such third-party providers experience disruptions or do not perform as anticipated, we may be unable to meet our obligations to customers and claimants, incur higher costs and lose business which may have a material adverse effect on our business and results of operations. For other risks associated with our outsourcing of certain functions, see the immediately preceding risk factor.
Part I - Item 1A. Risk Factors
Our ability to execute on capital management plans, expense reduction initiatives and other actions which may include acquisitions, divestitures or restructurings, is subject to material challenges, uncertainties and risks.
The ability to execute on capital management plans is subject to material challenges, uncertainties and risks. From time to time, our capital management plans may include the repurchase of common stock, the paydown of outstanding debt or both. We may not achieve all of the benefits we expect to derive from these plans. While we currently do not haveIn the case an equity repurchase plan is approved for 2018, anyby the Board, such capital management plan would be subject to execution risks, including, among others, risks related to market fluctuations, investor interest and potential legal constraints that could delay execution at an otherwise optimal time. There can be no assurance that we will fully execute any such plan. In addition, we may not be successful in keeping our ongoing businesses cost efficient. In particular, theThe Company may not be able to achieve all the revenue increases, expense reductions and other synergies that it expects to getrealize as a result of acquiring Aetna's U.S. group life and disability business which could adversely affect the profitability of the Group Benefits segment.acquisitions, divestitures or restructurings. We may take future actions, including acquisitions, divestitures or restructurings that may involve additional uncertainties and risks that negatively impact our business, financial condition, results of operations and liquidity.
Failure to complete our proposed acquisition of The Navigators Group, Inc. could impact our securities.
The completion of the acquisition of The Navigators Group, Inc. (Navigators Group) is subject to a number of conditions, including required regulatory approvals. The failure to satisfy all the required conditions could prevent the acquisition from occurring.
In addition, regulators could impose additional requirements or obligations as conditions for their approval. We can provide no assurance that we will obtain the necessary approvals within the estimated timeframe or at all, or that any such requirements that are imposed by regulators would not result in the termination of the transaction. Investors’ reactions to a failure to complete the acquisition of Navigators Group, including possible speculation about alternative uses of capital, may cause volatility in our securities. A failure to complete a proposed transaction of this nature can also result in litigation by stockholders and other disaffected parties. Furthermore, we will have incurred costs, and devoted management time and resources, in connection with the transaction for which we will receive little or no benefit. In addition, even if we complete the proposed Navigators Group acquisition, we may not be able to successfully integrate Navigators Group into our business and therefore may not be able to achieve the synergies we would expect to receive as a result of the acquisition.
Acquisitions and divestitures may not produce the anticipated benefits and may result in unintended consequences, which could have a material adverse impact on our financial condition and results of operations.
We may not be able to successfully integrate acquired businesses or achieve the expected synergies as a result of such acquisitions or divestitures. The process of integrating an acquired company or business can be complex and costly and may create unforeseen operating difficulties including ineffective integration of underwriting, risk management, claims handling, finance, information technology and actuarial practices. Difficulties integrating an acquired business may also result in the acquired business performing differently than we expected including through the loss of customers or in our failure to realize anticipated increased premium growth or expense-related efficiencies. We could be adversely affected by the acquisition due to unanticipated performance issues and additional expense, unforeseen liabilities, transaction-related charges, downgrades of third-party rating agencies, diversion of management time and resources to integration challenges, loss of key employees, regulatory requirements, exposure to tax liabilities, amortization of expenses related to intangibles and charges for impairment of long-term assets or goodwill. In addition, we may be adversely impacted by uncertainties related to reserve estimates of the acquired company and its design and operation of internal controls over financial reporting. We may be unable to distribute as much capital to the holding company as planned due to regulatory restrictions or other reasons that may adversely affect our liquidity.
In addition in the case of business dispositions, we may have difficulties in separating from our divested businesses which may result in our incurring additional, unforeseen expenses, and diversion of management’s time and resources to the challenges of business separation. In the case of business or asset dispositions, we may have continued financial exposure to the divested businesses through reinsurance, indemnification or other financial arrangements following the transaction. We may also retain a position in securities of the acquirer that purchased the divested business, which subjects us to risks related to the price of the equity securities and our ability to monetize such securities. The expected benefits of acquired or divested
Part I - Item 1A. Risk Factors
businesses may not be realized and involve additional uncertainties and risks that may negatively impact our business, financial condition, results of operations and liquidity.
Difficulty in attracting and retaining talented and qualified personnel may adversely affect the execution of our business strategies.
Our ability to attract, develop and retain talented employees, managers and executives is critical to our success. There is significant competition within and outside the insurance and financial services industry for qualified employees, particularly for individuals with highly specialized knowledge in areas such as underwriting, actuarial, data and analytics, technology and digital commerce. Our continued ability to compete effectively in our businesses and to expand into new business areas depends on our ability to attract new employees and to retain and motivate our existing employees. The loss of any one or more key employees, including executives, managers and employees with strong technological, analytical and other specialized skills, may adversely impact the execution of our business objectives or result in loss of important institutional knowledge. Our inability to attract and retain key personnel could have a material adverse effect on our financial condition and results of operations.
We may not be able to protect our intellectual property and may be subject to infringement claims.
We rely on a combination of contractual rights and copyright, trademark, patent and trade secret laws to establish and protect our intellectual property. Although we use a broad range of measures to protect our intellectual property rights, third parties may infringe or misappropriate our intellectual property. We may have to litigate to enforce and protect our intellectual property and to determine its scope, validity or enforceability, which could divert significant resources and may not prove successful. Litigation to enforce our intellectual property rights may not be successful and cost a significant amount of money. The inability to secure or enforce the protection of our intellectual property assets could harm our reputation and have a material adverse effect on our business and our ability to compete. We also may be subject to costly litigation in the event that another party alleges our operations or activities infringe upon their intellectual property rights, including patent rights, or violate license usage rights. Any such intellectual property claims and any resulting litigation could result in significant expense and liability for damages, and in some circumstances we could be enjoined from providing certain products or services to our customers, or utilizing and benefiting from certain patent, copyrights, trademarks, trade secrets or licenses, or alternatively could be required to enter into costly licensing arrangements with third parties, all of which could have a material adverse effect on our business, results of operations and financial condition.
Regulatory and Legal Risks
Regulatory and legislative developments could have a material adverse impact on our business, financial condition, results of operations and liquidity.
In the U.S., regulatory initiatives and legislative developments may significantly affect our operations and prospects in ways that we cannot predict.
For example, the impact of the elimination of the individual mandate offurther reforms to the Affordable Care Act, and potential modification of the Dodd-Frank Act could have unanticipated consequences for the Company and its businesses. With respect to the impact of the elimination of the individual mandate of the Affordable Care Act, see Part II, Item 7, MD&A - Capital Resources and Liquidity - Contingencies - Regulatory and Legal Developments.
The Dodd-Frank Act was enacted on July 21, 2010, mandating changes to the regulation of the financial services industry that could adversely affect our financial condition and results of operations. The Dodd-Frank Act requires central clearing of certain derivatives transactions and greater margin requirements for those transactions, which increases the costs of hedging. In addition, the proprietary trading and market making limitation of the Volcker Rule could adversely affect the pricing and liquidity of our investment securities and limitations of banking entity involvement in and ownership of certain asset-backed securities transactions could adversely affect the market for insurance-linked securities, including catastrophe bonds. It is unclear whether and to what extent Congress will make changes to the Dodd-Frank Act, and how those changes might impact the Company, its business, financial conditions, results of operations and liquidity.
We are subject to extensive laws and regulations that are complex, subject to change and often conflicting in their approach or intended outcomes. Compliance with these laws and regulations can increase cost, affect our strategy, and constrain our ability to adequately price our products.
Our insurance subsidiaries are regulated by the insurance departments of the states in which they are domiciled, licensed or authorized to conduct business. State regulations generally seek to protect the interests of policyholders rather than an insurer or the insurer’s shareholdersstockholders and other investors. U.S. state laws grant insurance regulatory authorities broad administrative powers with respect to, among other things, licensing and authorizing lines of business, approving policy forms and premium rates, setting statutory capital and reserve requirements, limiting the types and amounts of certain investments and restricting underwriting practices. State insurance departments also set constraints on domestic insurer transactions with affiliates and dividends and, in many cases, must approve affiliate transactions and extraordinary dividends as well as strategic transactions such as acquisitions and divestitures.
In addition, future regulatory initiatives could be adopted at the federal or state level that could impact the profitability of our businesses. For example, the NAIC and state insurance regulators
Part I - Item 1A. Risk Factors
are continually reexamining existing laws and regulations, specifically focusing on modifications to statutory accounting principles, interpretations of existing laws and the development of new laws and regulations. The NAIC continues to enhance the U.S. system of insurance solvency regulation, with a particular focus on group supervision, risk-based capital, accounting and financial reporting, enterprise risk management and reinsurance. reinsurance which could, among other things, affect statutory measures of capital sufficiency, including risk-based capital ratios.
Any proposed or future legislation or NAIC initiatives, if adopted, may be more restrictive on our ability to conduct business than current regulatory requirements or may result in higher costs or increased statutory capital and reserve requirements. In addition, the Federal Reserve Board and the International Association of Insurance Supervisors ("IAIS") each have initiatives underway to develop insurance group capital standards. While the Company would not currently be subject to either of these capital standard regimes, it is possible that in the future standards similar to what
Part I - Item 1A. Risk Factors
is being contemplated by the Federal Reserve Board or the IAIS could apply to the Company. The NAIC is in the process of developing a U.S. group capital calculation that will employ a methodology based on aggregated risk-based capital.
Further, a particular regulator or enforcement authority may interpret a legal, accounting, or reserving issue differently than we have, exposing us to different or additional regulatory risks. The application of these regulations and guidelines by insurers involves interpretations and judgments that may be challenged by state insurance departments. The result of those potential challenges could require us to increase levels of statutory capital and reserves or incur higher operating and/or tax costs.
In addition, our asset management businesses are also subject to extensive regulation in the various jurisdictions where they operate..operate. These laws and regulations are primarily intended to protect investors in the securities markets or investment advisory clients and generally grant supervisory authorities broad administrative powers. Compliance with these laws and regulations is costly, time consuming and personnel intensive, and may have an adverse effect on our business, financial condition, results of operations and liquidity.
Our insurance business is sensitive to significant changes in the legal environment that could adversely affect The Hartford’s results of operations or financial condition or harm its businesses.
Like any major P&C insurance company, litigation is a routine part of The Hartford’s business - both in defending and indemnifying our insureds and in litigating insurance coverage disputes. The Hartford accounts for such activity by establishing unpaid loss and loss adjustment expense reserves. Significant changes in the legal environment could cause our ultimate liabilities to change from our current expectations. Such changes could be judicial in nature, like trends in the size of jury awards, developments in the law relating to tort liability or the liability of insurers, and rulings concerning the scope of insurance coverage or the amount or types of damages covered by insurance. Legislative developments, like changes in federal or state laws relating to the liability of policyholders or insurers, could have a similar effect. It is impossible to forecast such changes reliably, much less to predict how they might affect our loss reserves or how those changes might adversely affect our ability to price our insurance products appropriately. Thus, significant judicial or legislative
developments could adversely affect The Hartford’s business, financial condition, results of operations and liquidity.
Changes in federal or state tax laws could adversely affect our business, financial condition, results of operations and liquidity.
Changes in federal or state tax laws and tax rates or regulations could have a material adverse effect on our profitability and financial condition. For example, the recent reduction in tax rates due to the Tax Cuts and Jobs Act reduced our deferred tax assets resulting in a charge against earnings. A reduction in tax rates or change in laws could adversely affect the Company’s ability to realize the benefits of its net operating loss carryovers and alternative minimum tax credits.
In addition, the Company’s tax return reflects certain items such as tax-exempt bond interest, tax credits, and insurance reserve deductions. There is an increasing risk that, in the context of deficit reduction or overall tax reform, federal and/or state tax
legislation could modify or eliminate these items, impacting the Company, its investments, investment strategies, and/or its policyholders. In the context of deficit reduction or overall tax reform, federal and/or state tax legislation could modify or eliminate provisions of current tax law that are beneficial to the Company, including tax-exempt bond interest, tax credits, and insurance reserve deductions, or could impose new taxes such as on goods or services purchased overseas.
On December 22, 2017, the U.S. government enacted comprehensive tax legislation commonly referred to as the "Tax Cuts and Jobs Act" ("Tax Reform"). Tax Reform reduced the U.S. federal corporate income tax rate from 35% to 21%. It also eliminated the corporate alternative minimum tax (AMT) and changed how existing AMT credits can be realized. Certain provisions in the law are intended to increase insurance companies' taxable earnings. The new method for discounting property and casualty loss reserves for tax purposes decreases the amount of incurred lossesThere is a risk that are currently deductible, delaying the timing of when incurred losses may be deducted. The effect of the difference on the December 31, 2017 tax basis reserve between discounting under the existing method and the new method will be included in taxable income ratably over the next 8 years. In addition, new limitations on the deductibility of certain executive compensation and limitations on net operating losses (NOLs) generated after December 31, 2017 will also increase the taxable income base. The exact impacts of many of the provisions will not be fully known until Treasury and the IRS provide clarification by issuing rules, regulations and advice. Furthermore, Congress may enact a technical corrections bill or other legislation that could affect how provisions of the ActTax Reform apply to The Hartford. In response to the recent changes in the federal tax law, we could see states enact changes to their tax laws which, in turn, could affect the Company negatively. Among other risks, there is risk that these additional clarifications could increase the taxes on the Company, further increase administrative costs, make the sale of our products more costly and/or make our products less competitive.
While the Company expects a benefit to earnings from lower corporate federal income tax rates, in 2018, there is uncertainty about how insurance carriers will adjust their product pricing, if at all, going forward. If the Company reduces its pricing in response to competition or to state regulatory action, product price
Part I - Item 1A. Risk Factors
reductions could serve to reduce, or even eliminate, the benefit of lower Corporate federal tax rates in periods after 2018.
Regulatory requirements could delay, deter or prevent a takeover attempt that shareholdersstockholders might consider in their best interests.
Before a person can acquire control of a U.S. insurance company, prior written approval must be obtained from the insurance commissioner of the state where the domestic insurer is domiciled. Prior to granting approval of an application to acquire control of a domestic insurer, the state insurance commissioner will consider such factors as the financial strength of the applicant, the acquirer's plans for the future operations of the domestic insurer, and any such additional information as the insurance commissioner may deem necessary or appropriate for the protection of policyholders or in the public interest. Generally, state statutes provide that control over a domestic insurer is presumed to exist if any person, directly or indirectly, owns, controls, holds with the power to vote, or holds proxies representing 10 percent or more of the voting securities of the domestic insurer or its parent company. Because a person acquiring 10 percent or more of our common stock would indirectly control the same percentage of the stock of our U.S. insurance subsidiaries, the insurance change of control laws of various U.S. jurisdictions would likely apply to such a transaction. Other laws or required approvals pertaining to one or more of our existing subsidiaries, or a future subsidiary, may contain similar or additional restrictions on the acquisition of control of the Company. These laws may discourage potential acquisition proposals and may delay, deter, or prevent a change of control, including transactions that our Board of Directors and some or all of our shareholdersstockholders might consider to be desirable.
Part I - Item 1A. Risk Factors
Changes in accounting principles and financial reporting requirements could adversely affect our results of operations or financial condition.
As an SEC registrant, we are currently required to prepare our financial statements in accordance with U.S. GAAP, as promulgated by the Financial Accounting Standards Board
("FASB"). Accordingly, we are required to adopt new guidance or interpretations which may have a material effect on our results of operations and financial condition that is either unexpected or has a greater impact than expected. For a description of changes in accounting standards that are currently pending and, if known, our estimates of their expected impact, see Note 1 of the consolidated financial statements.
Risks Relating to the Pending Sale of Our Life and Annuity Business
The closing of the sale of our life and annuity run-off business is subject to risks and uncertainties.
On December 4, 2017, the Company announced the sale of its life and annuity run-off business to Hopmeadow Acquisition, Inc.
(“Buyer”) whereby a subsidiary of the Company will sell all of the issued and outstanding equity of Hartford Life, Inc. (“HLI”) to Buyer. The sale is expected to close by June 30, 2018.
The closing of the sale is subject to regulatory approval and other closing conditions, many of which are beyond the Company’s control. The Company cannot predict with certainty whether all of the required closing conditions will be satisfied or waived or if other uncertainties may arise. In addition, regulators could impose additional requirements or obligations as conditions for their approvals, which may beburdensome. As a result, the sale may not be completed or may be delayed and the Company may lose some or all of the intended benefits of the sale.
The assets and liabilities of the life and annuity run-off business, consisting primarily of the operations of Hartford Life Insurance Company and Hartford Life and Annuity Insurance Company (formerly known as Talcott Resolution), have been accounted for as held for sale as of December 31, 2017, with the operating results of that business included in discontinued operations for all periods presented. Under the terms of the purchase and sale agreement, apart from interest expense on HLI debt and certain tax benefits retained by the Company, results from the discontinued operations inure to the Buyer. Accordingly, any earnings or losses of the life and annuity run-off business up until closing will not change the Company's results.
Should the transaction not close, the Company would retain and continue to bear the risks inherent in this businesses and, thus, its operating results and financial condition may be adversely affected by those risks.
The investment portfolio and insurance liabilities of the Company's life and annuity business included in discontinued operations are sensitive to changes in economic, political and global capital market conditions, such as the effect of a weak economy and changes in credit spreads, equity prices, interest rates and inflation.
In addition to credit exposure in the life and annuity business investment portfolio, the statutory surplus of the life and annuity business is also affected by widening credit spreads as a result of the accounting for the assets and liabilities on fixed market value adjusted (“MVA”) annuities. Statutory separate account assets supporting the fixed MVA annuities are recorded at fair value. In determining the statutory reserve for the fixed MVA annuity payments owed to contract-holders, current crediting rates are used. In many capital market scenarios, current crediting rates are highly correlated with market rates implicit in the fair value of statutory separate account assets. As a result, the change in the statutory reserve from period to period will likely substantially offset the change in the fair value of the statutory separate account assets. However, in periods of volatile credit markets, actual credit spreads on investment assets may increase sharply for certain sub-sectors of the overall credit market, resulting in statutory separate account asset market value losses. As actual credit spreads are not fully reflected in current crediting rates, the calculation of statutory reserves may not substantially offset the change in fair value of the statutory separate account assets, resulting in reductions in statutory surplus. This may result in the need to devote significant additional capital to support the fixed MVA product.
Part I - Item 1A. Risk Factors
A decline in equity markets may result in lower earnings from the life and annuity business where fee income is earned based upon the fair value of the assets under management. In addition, certain annuity products have guaranteed minimum death benefits ("GMDB") or guaranteed minimum withdrawal benefits ("GMWB") that increase when equity markets decline requiring more statutory capital to be held. While hedging programs are used to reduce the net economic sensitivity of our potential obligations from guaranteed benefits due to market fluctuations, rising equity markets and/or rising interest rates may nevertheless result in statutory or GAAP losses because of accounting asymmetries between hedging targets and statutory and GAAP accounting principles for the guaranteed benefits.
A low interest rate environment puts pressure on net investment income and could result in lower margins and lower estimated gross profits on certain annuity products included in discontinued operations.
A rise in interest rates, in the absence of other countervailing changes, would reduce the market value of the life and annuity business investment portfolio and, if long-term interest rates were to rise dramatically, certain products within that business might be exposed to disintermediation risk. Disintermediation risk refers to the risk that policyholders may surrender their contracts in a rising interest rate environment, requiring the liquidation of assets in an unrealized loss position.
Some of the in-force variable annuity contracts included in discontinued operations offer guaranteed benefits, including GMDBs and GMWBs. These GMBDs and GMWBs are exposed to interest rate risk and significant equity risk. A decline in equity markets would not only result in lower fee income, but would also increase the Company's exposure to liability for benefit claims. Reinsurance and benefit designs, such as caps, are used to mitigate the exposure associated with GMDB. To minimize the claim exposure and to reduce the volatility of net income associated with the GMWB liability, reinsurance is used in combination with product management actions, such as rider fee increases, investment restrictions and buyout offers, as well as derivative instruments. The contract issuer remains liable for the guaranteed benefits in the event that reinsurers or derivative counterparties are unable or unwilling to pay, which could result in a need for additional capital to support in-force business.
From time to time, the risk management program may be adjusted based on contracts in force, market conditions, or other factors. While these actions may improve the efficiency of our risk management efforts related to these benefits, changes to the risk management program may result in greater statutory and GAAP earnings volatility and, based upon the types of hedging instruments used, can result in potentially material changes to net income (loss) in periods of rising equity market pricing levels, higher interest rates and declines in volatility. The life and annuity run-off business is also subject to the risk that these management actions prove ineffective or that unanticipated policyholder behavior, combined with adverse market events, produces economic losses beyond the scope of the risk management techniques employed, which individually or collectively may have a material adverse effect on the business, financial condition, results of operations and liquidity of the discontinued operations.
The minimum capital that must be held by the life and annuity companies is based on risk-based capital (“RBC”) formulas for life
companies. The RBC formula for life companies establishes capital requirements relating to insurance, business, asset and interest rate risks, including equity, interest rate and expense recovery risks associated with variable annuities and group annuities that contain death benefits or certain withdrawal benefits.
In extreme scenarios of equity market declines and other capital market volatility, the amount of additional statutory reserves that must be held for variable annuity guarantees increases at a greater than linear rate. This reduces the statutory surplus used in calculating RBC ratios. When equity markets increase, surplus levels and RBC ratios would generally be expected to increase. However, as a result of a number of factors and market conditions, including the level of hedging costs and other risk transfer activities, statutory reserve requirements for death and withdrawal benefit guarantees and increases in RBC requirements, surplus and RBC ratios may not increase when equity markets increase. Due to these factors, projecting statutory capital and the related RBC ratios is complex.
The investment portfolio of the life and annuity business included in discontinued operations is also exposed to losses due to nonperformance or defaults by counterparties. For example, if the counterparties to the underlying assets supporting the structured securities we invest in default on their payment obligations, the securities held will incur losses.
While a portion of contracts with GMWB riders are reinsured and the majority of GMDB contracts with net amount at risk are reinsured, the insurers that wrote the contracts remain liable as the direct insurer on all risks reinsured. The inability or unwillingness of any reinsurer to meet its financial obligations, including the impact of any insolvency or rehabilitation proceedings involving a reinsurer, could affect the life and annuity companies’ access to collateral held in trust. This risk may be magnified by a concentration of reinsurance-related credit risk resulting from the sale of the Individual Life and Retirement Products businesses in 2013 though that business is part of the Talcott Resolution operations being sold to the Buyer.
Life and annuity products also contain risks relating to estimates, assumptions and valuations. If assumptions used in estimating future gross profits differ from actual experience, it may accelerate the amortization of deferred acquisition costs ("DAC") and increase reserves for GMDB and GMWB on variable annuities.
Deferred acquisition costs for the variable annuity products included in discontinued operations are amortized over the expected life of the contracts. The remaining deferred but not yet amortized cost is referred to as the DAC asset. These costs are amortized based on the ratio of actual gross profits in the period to the present value of current and future estimated gross profits (“EGPs”). EGP’s are used to determine if a DAC impairment exists. Certain reserves for GMDB and the life contingent portion of GMWB are valued using components of EGPs. The projection of EGPs, or components of EGPs, requires the use of certain assumptions that may not prove accurate, including those related to changes in the separate account fund returns, full or partial surrender rates, mortality, withdrawal benefit utilization, withdrawal rates, annuitization and hedging costs.
In addition, if assumptions about policyholder behavior (e.g., full or partial surrenders, benefit utilization and annuitization) and costs related to mitigating risks, including hedging costs, prove to
Part I - Item 1A. Risk Factors
be inaccurate or if significant or sustained equity market declines occur, there could be a further acceleration of DAC amortization related to variable annuity contracts, and increased reserves for GMDB and life-contingent GMWB.
As noted above, the 2017 tax reform reduced the value of net deferred tax assets, including net deferred tax assets to be transferred to the Buyer. Provisions included in the tax reform legislation further limited the corporate dividends received deduction and there is a risk that Congress could further reduce or eliminate the corporate dividends received deduction altogether.
The 2017 tax reform legislation also changed the formula for calculating life insurance reserves, the effect of which is to reduce the amount of tax deductible life insurance reserves. The 2017 tax reform provided that the amount of that difference be included in income ratably over an eight year period. In addition,
the 2017 tax reform legislation increased the amount of acquisition expenses that are required to be amortized and lengthened the period of time to fifteen years over which these deferred expenses can be amortized. Both provisions were intended to increase a life insurer's taxable income base.
Moreover, many of the life and annuity products included in discontinued operations benefit from one or more forms of tax-favored status under current federal and state income tax regimes. For example, some of the annuity contracts previously sold, allowed policyholders to defer the recognition of taxable income earned within the contract. If, however, the tax treatment of earnings accrued inside an annuity contract changed prospectively, and the tax favored status of existing contracts was grandfathered, holders of existing contracts would be less likely to surrender their annuity contracts.
Item 2. PROPERTIES
As of December 31, 2017,2018, The Hartford owned building space of approximately 1.8 million square feet which comprised its Hartford, Connecticut location and other properties within the greater Hartford, Connecticut area. In addition, as of December 31, 2017,2018, The Hartford leased approximately 1.71.5 million square feet, throughout the United States of America, and
approximately two thousand square feet in other countries.Canada. All of the properties owned or leased are used by one or more of all five reporting segments, depending on the location. For more information on reporting segments, see Part I, Item 1, Business — Reporting Segments. The Company believes its properties and facilities are suitable and adequate for current operations.
Item 3. LEGAL PROCEEDINGS
LITIGATION
The Hartford is involved in claims litigation arising in the ordinary course of business, both as a liability insurer defending or providing indemnity for third-party claims brought against insureds and as an insurer defending coverage claims brought against it. The Hartford accounts for such activity through the establishment of unpaid loss and loss adjustment expense reserves. Subject to the uncertainties related to The Hartford's asbestos and environmental claims discussed in Note 14 - Commitments and Contingencies of the Notes to Consolidated Financial Statements, management expects that the ultimate liability, if any, with respect to such ordinary-course claims litigation, after consideration of provisions made for potential losses and costs of defense, will not be material to the consolidated financial condition, results of operations or cash flows of The Hartford.
The Hartford is also involved in other kinds of legal actions, some of which assert claims for substantial amounts. In addition, to the matters described below, these actions include, among others, putative state and federal class actions seeking certification of a state or national class. Such putative class actions have alleged, for example, underpayment of claims or improper underwriting practices in connection with various kinds of insurance policies, such as personal and commercial automobile, property, disability, and inland marine. The Hartford also is involved in individual actions in which punitive damages are sought, such as claims alleging bad faith in the handling of insurance claims or other allegedly unfair or improper business practices. Like many other insurers, The Hartford also has been joined in actions by asbestos plaintiffs asserting, among other things, that insurers had a duty to protect the public from the dangers of asbestos and that
insurers committed unfair trade practices by asserting defenses on behalf of their policyholders in the underlying asbestos cases.
Management expects that the ultimate liability, if any, with respect to such lawsuits, after consideration of provisions made for estimated losses, will not be material to the consolidated financial condition of The Hartford. Nonetheless, given the large or indeterminate amounts sought in certain of these actions, and the inherent unpredictability of litigation, the outcome in certain
matters could, from time to time, have a material adverse effect on the Company's results of operations or cash flows in particular quarterly or annual periods.
In addition to the inherent difficulty of predicting litigation outcomes, the Mutual Funds Litigation identified below purports to seek substantial damages for unsubstantiated conduct spanning a multi-year period based on novel applications of complex legal theories. The alleged damages are not quantified or factually supported in the complaint, and, in any event, the Company's experience shows that demands for damages often bear little relation to a reasonable estimate of potential loss. The application of the legal standard identified by the court for assessing the potentially available damages, as described below, is inherently unpredictable, and no legal precedent has been identified that would aid in determining a reasonable estimate of potential loss. Accordingly, management cannot reasonably estimate the possible loss or range of loss, if any.Mutual Funds Litigation
In February 2011, a derivative action was brought on behalf of six Hartford retail mutual funds in the United States District Court for the District of New Jersey, alleging that Hartford Investment Financial Services, LLC (“HIFSCO”), an indirect subsidiary of the Company, received excessive advisory and distribution fees in violation of its statutory fiduciary duty under Section 36(b) of the
Part I - Item 3. Legal Proceedings
Investment Company Act of 1940. During course of litigation, the claims regarding distribution fees were dismissed without prejudice, the lineup funds as plaintiffs changed several times, and the plaintiffs added as a defendant Hartford Funds Management Company (“HFMC”), an indirect subsidiary of the Company that assumed the role of advisor to the funds as of January 2013. In June 2015, HFMC and HIFSCO moved for summary judgment, and plaintiffs cross-moved for partial summary judgment with respect to one fund. In March 2016, the court denied the plaintiff's motion, and granted summary judgment for HIFSCO and HFMC with respect to one fund, leaving six funds and plaintiffs: The Hartford Balanced Fund, The Hartford Capital Appreciation Fund, The Hartford Floating Rate Fund, The
Hartford Growth Opportunities Fund, The Hartford Healthcare Fund and The Hartford Inflation Plus Fund. The court further ruled that the appropriate measure of damages on the surviving claims would be the difference, if any, between the actual advisory fees paid through trial and the fees permitted under the applicable legal standard. A bench trial on the issue of liability was held in November 2016. In February 2017, the court granted judgment for HIFSCO and HFMC as to all claims. Plaintiffs have appealed to the United States Court of Appeals for the Third Circuit.
Part II - Item 5. Market for the Hartford's Common Equity, Related Stockholder Matters and Issuer Purchases of Equity Securities
Item 5. MARKET FOR THE HARTFORD’S COMMON EQUITY, RELATED STOCKHOLDER MATTERS AND ISSUER PURCHASES OF EQUITY SECURITIES
The Hartford’s common stock is traded on the New York Stock Exchange (“NYSE”) under the trading symbol “HIG”.
High and Low Closing Prices and Quarterly Dividends Declared per Share for the Common Stock of The Hartford
|
| | | | | | | | | | | | |
| | 1st Qtr. | 2nd Qtr. | 3rd Qtr. | 4th Qtr. |
| 2017 | | | | |
| Common Stock Price | | | | |
| High | $ | 49.87 |
| $ | 52.75 |
| $ | 56.81 |
| $ | 57.65 |
|
| Low | $ | 47.05 |
| $ | 47.26 |
| $ | 51.64 |
| $ | 54.06 |
|
| Dividends Declared | $ | 0.23 |
| $ | 0.23 |
| $ | 0.23 |
| $ | 0.25 |
|
| 2016 | | | | |
| Common Stock Price | | | | |
| High | $ | 46.31 |
| $ | 46.80 |
| $ | 44.77 |
| $ | 48.58 |
|
| Low | $ | 37.63 |
| $ | 40.98 |
| $ | 39.85 |
| $ | 42.50 |
|
| Dividends Declared | $ | 0.21 |
| $ | 0.21 |
| $ | 0.21 |
| $ | 0.23 |
|
On February 22, 2018, The Hartford’s Board of Directors declared a quarterly dividend of $0.25 per common share payable on April 2, 2018 to common shareholders of record as of March 5, 2018. As of February 21, 2018,2019, the Company had approximately 11,64111,146 registered holders of record of the Company's common stock. A substantially greater number of holders of our common stock are “street name” holders or beneficial holders, whose shares are held of record by banks, brokers and other financial institutions. The closing price of The Hartford’s common stock on the NYSE on February 21, 2018 was $53.95.
On June 12, 2017,1, 2018, the Company’s Chief Executive Officer certified to the NYSE that he is not aware of any violation by the Company of NYSE corporate governance listing standards, as required by Section 303A.12(a) of the NYSE’s Listed Company Manual.
There are also various legal and regulatory limitations governing the extent to which The Hartford’s insurance subsidiaries may
extend credit, pay dividends or otherwise provide funds to The Hartford Financial Services Group, Inc. as discussed in the Liquidity Requirements and Sources of Capital section of Part II, Item 7, MD&A — Capital Resources and Liquidity.
For information related to securities authorized for issuance under equity compensation plans, see Part III, Item 12, Security Ownership of Certain Beneficial Owners and Management and Related Stockholder Matters.
During the period October 1, 2017 through October 13, 2017,year ended December 31, 2018, the Company repurchased 0.9 milliondid not repurchase any common shares at an average price of $55.70 per share. All 0.9 million shares were purchased as part of publicly announced plans or programs.
Effective October 13, 2017,shares. In February, 2019, the Company suspended 2017 equity repurchases. Theannounced a $1.0 billion share repurchase authorization by the Board of Directors which is effective through December 31, 2020. Based on projected holding company resources, the Company does not currently expectexpects to authorize anuse a portion of the authorization in 2019 but anticipates using the majority of the program in 2020. Any repurchase of shares under the equity repurchase plan in 2018.program is dependent on market conditions and other factors.
Part II - Item 5. Market for the Hartford's Common Equity, Related Stockholder Matters and Issuer Purchases of Equity Securities
Total Return to ShareholdersStockholders
The following tables present The Hartford’s annual return percentage and five-year total return on its common stock including reinvestment of dividends in comparison to the S&P 500 and the S&P Insurance Composite Index.
| | Annual Return Percentage | | | For the years ended | For the years ended |
| Company/Index | 2013 | 2014 | 2015 | 2016 | 2017 | 2014 | 2015 | 2016 | 2017 | 2018 |
| The Hartford Financial Services Group, Inc. | 64.12 | % | 17.13 | % | 6.12 | % | 11.76 | % | 20.26 | % | 17.13 | % | 6.12 | % | 11.76 | % | 20.26 | % | (19.24 | %) |
| S&P 500 Index | 32.39 | % | 13.69 | % | 1.38 | % | 11.96 | % | 21.83 | % | 13.69 | % | 1.38 | % | 11.96 | % | 21.83 | % | (4.38 | %) |
| S&P Insurance Composite Index | 46.71 | % | 8.29 | % | 2.33 | % | 17.58 | % | 16.19 | % | 8.29 | % | 2.33 | % | 17.58 | % | 16.19 | % | (11.21 | %) |
| | Cumulative Five-Year Total Return | | | Base | | Base | |
| | Period | For the years ended | Period | For the years ended |
| Company/Index | 2012 | 2013 | 2014 | 2015 | 2016 | 2017 | 2013 | 2014 | 2015 | 2016 | 2017 | 2018 |
| The Hartford Financial Services Group, Inc. | $ | 100 |
| 164.12 |
| 192.24 |
| 204.00 |
| 227.99 |
| 274.18 |
| $ | 100 |
| 117.13 |
| 124.30 |
| 138.92 |
| 167.06 |
| 134.92 |
|
| S&P 500 Index | $ | 100 |
| 132.39 |
| 150.51 |
| 152.59 |
| 170.84 |
| 208.14 |
| $ | 100 |
| 113.69 |
| 115.26 |
| 129.05 |
| 157.22 |
| 150.33 |
|
| S&P Insurance Composite Index | $ | 100 |
| 146.71 |
| 158.86 |
| 162.56 |
| 191.15 |
| 222.09 |
| $ | 100 |
| 108.29 |
| 110.81 |
| 130.29 |
| 151.38 |
| 134.42 |
|
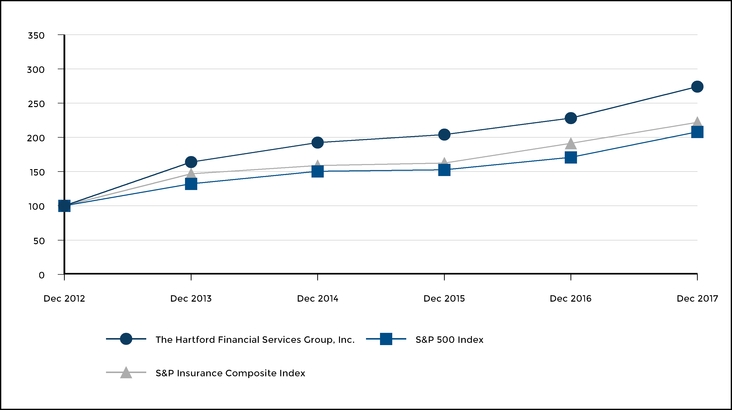
Part II - Item 5. Market for the Hartford's Common Equity, Related Stockholder Matters and Issuer Purchases of Equity Securities
Part II - Item 6. Selected Financial Data
Item 6. SELECTED FINANCIAL DATA
The following table sets forth the Company's selected consolidated financial data at the dates and for the periods indicated below. The selected financial data should be read in conjunction with Management’s Discussion and Analysis of
Financial Condition and Results of Operations ("MD&A") presented in Item 7 and the Company's Consolidated Financial Statements and the related Notes beginning on page F-1.
| | | in millions, except per share data | 2017 | 2016 | 2015 | 2014 | 2013 | |
| (In millions, except per share data) | | 2018 | 2017 | 2016 | 2015 | 2014 |
| Income Statement Data | | | | |
| Total revenues | $ | 16,974 |
| $ | 16,107 |
| $ | 15,997 |
| $ | 15,713 |
| $ | 15,966 |
| $ | 18,955 |
| $ | 17,162 |
| $ | 16,291 |
| $ | 16,187 |
| $ | 15,905 |
|
| Income from continuing operations before income taxes | $ | 723 |
| $ | 447 |
| $ | 1,478 |
| $ | 1,232 |
| $ | 987 |
| $ | 1,753 |
| $ | 723 |
| $ | 447 |
| $ | 1,478 |
| $ | 1,232 |
|
| (Loss) Income from continuing operations, net of tax | $ | (262 | ) | $ | 613 |
| $ | 1,189 |
| $ | 925 |
| $ | 759 |
| |
| (Loss) Income from discontinued operations, net of tax | $ | (2,869 | ) | $ | 283 |
| $ | 493 |
| $ | (127 | ) | $ | (583 | ) | |
| Net (loss) income | $ | (3,131 | ) | $ | 896 |
| $ | 1,682 |
| $ | 798 |
| $ | 176 |
| |
| Income (loss) from continuing operations, net of tax | | $ | 1,485 |
| $ | (262 | ) | $ | 613 |
| $ | 1,189 |
| $ | 925 |
|
| Income (loss) from continuing operations, net of tax, available to common stockholders | | $ | 1,479 |
| $ | (262 | ) | $ | 613 |
| $ | 1,189 |
| $ | 925 |
|
| Income (loss) from discontinued operations, net of tax | | $ | 322 |
| $ | (2,869 | ) | $ | 283 |
| $ | 493 |
| $ | (127 | ) |
| Net income (loss) | | $ | 1,807 |
| $ | (3,131 | ) | $ | 896 |
| $ | 1,682 |
| $ | 798 |
|
| Balance Sheet Data | |
|
| Total assets | $ | 225,260 |
| $ | 224,576 |
| $ | 229,616 |
| $ | 245,566 |
| $ | 278,339 |
| $ | 62,307 |
| $ | 225,260 |
| $ | 224,576 |
| $ | 229,616 |
| $ | 245,566 |
|
| Short-term debt | $ | 320 |
| $ | 416 |
| $ | 275 |
| $ | 456 |
| $ | 438 |
| $ | 413 |
| $ | 320 |
| $ | 416 |
| $ | 275 |
| $ | 456 |
|
| Total debt (including capital lease obligations) | $ | 4,998 |
| $ | 4,910 |
| $ | 5,216 |
| $ | 5,966 |
| $ | 6,401 |
| $ | 4,678 |
| $ | 4,998 |
| $ | 4,910 |
| $ | 5,216 |
| $ | 5,966 |
|
| Preferred stock | | $ | 334 |
| $ | — |
| $ | — |
| $ | — |
| $ | — |
|
| Total stockholders’ equity | $ | 13,494 |
| $ | 16,903 |
| $ | 18,024 |
| $ | 19,130 |
| $ | 19,217 |
| $ | 13,101 |
| $ | 13,494 |
| $ | 16,903 |
| $ | 18,024 |
| $ | 19,130 |
|
| Net (loss) income per common share | | |
| Income (loss) from continuing operations, net of tax, available to common stockholders per common share | |
|
| Basic | $ | (8.61 | ) | $ | 2.31 |
| $ | 4.05 |
| $ | 1.81 |
| $ | 0.37 |
| $ | 4.13 |
| $ | (0.72 | ) | $ | 1.58 |
| $ | 2.86 |
| $ | 2.09 |
|
| Diluted | $ | (8.61 | ) | $ | 2.27 |
| $ | 3.96 |
| $ | 1.73 |
| $ | 0.36 |
| $ | 4.06 |
| $ | (0.72 | ) | $ | 1.55 |
| $ | 2.80 |
| $ | 2.01 |
|
| Cash dividends declared per common share | $ | 0.94 |
| $ | 0.86 |
| $ | 0.78 |
| $ | 0.66 |
| $ | 0.50 |
| $ | 1.10 |
| $ | 0.94 |
| $ | 0.86 |
| $ | 0.78 |
| $ | 0.66 |
|
Part II - Item 7. Management's Discussion and Analysis of Financial Condition and Results of Operations
Item 7. MANAGEMENT’S DISCUSSION AND ANALYSIS OF FINANCIAL CONDITION AND RESULTS OF OPERATIONS
(Dollar amounts in millions, except for per share data, unless otherwise stated)
The Hartford provides projections and other forward-looking information in the following discussions, which contain many forward-looking statements, particularly relating to the Company’s future financial performance. These forward-looking statements are estimates based on information currently available to the Company, are made pursuant to the safe harbor provisions of the Private Securities Litigation Reform Act of 1995 and are subject to the cautionary statements set forth on pages 4 and 5 of this Form 10-K. Actual results are likely to differ, and in the past have differed, materially from those forecast by the Company, depending on the outcome of various factors, including, but not limited to, those set forth in the following discussion and in Part I, Item 1A, Risk Factors, and those identified from time to time in our other filings with the Securities and Exchange Commission. The Hartford undertakes no obligation to publicly update any forward-looking statements, whether as a result of new information, future developments or otherwise.
On December 3, 2017,August 22, 2018, the Company announced it entered into a definitive agreement to acquire all outstanding common shares of The Navigators Group, Inc. ("Navigators Group"), a global specialty underwriter, for $70 a share, or $2.1 billion in cash. The transaction is expected to close in late March or April 2019, subject to customary closing conditions, including receipt of regulatory approvals.
On May 31, 2018, Hartford Holdings, Inc., a wholly owned subsidiary of the Company, entered into a definitive agreement to sell allcompleted the sale of the issued and outstanding equity of Hartford Life, Inc. (“HLI”), a holding company, and its life and annuity operating subsidiaries. For discussion of this transaction, see Note 20 - Business Dispositions and Discontinued Operations of Notes to Consolidated Financial Statements.
On February 16, 2018, The Hartford entered into a renewal rights agreement with the Farmers Exchanges, of the Farmers Insurance Group of Companies, to acquire its Foremost-branded small commercial business sold through independent agents. Written premium from this agreement began in the third quarter of 2018.
On November 1, 2017, Hartford Life and Accident Insurance Company ("HLA"), a wholly owned subsidiary of the Company, completed the acquisition of Aetna's U.S. group life and disability business through a reinsurance transaction. Aetna's U.S. group life and disability revenue and earnings since the acquisition date are included in the operating results of the Company's Group Benefits reporting segment. For discussion of this transaction, see Note 2 - Business Acquisitions of Notes to Consolidated Financial Statements.
On May 10, 2017, the Company completed the sale of its U.K.
property and casualty run-off subsidiaries. The operating results of the Company's U.K. property and casualty run-off subsidiaries are included in the P&C Other Operations reporting segment. For discussion of this transaction, see Note 20 - Business Dispositions and Discontinued Operations of Notes to Consolidated Financial Statements.
On July 29, 2016, the Company completed the acquisition of Maxum Specialty Insurance Group and Lattice Strategies LLC. Maxum's revenue and earnings since the acquisition date are included in the operating results of the Company's Commercial Lines reporting segment. Lattice's revenue and earnings since the acquisition date are included in the operating results of the Company's MutualHartford Funds reporting segment. For discussion of
these transactions, see Note 2 - Business Acquisitions of Notes to Consolidated Financial Statements.
Certain reclassifications have been made to historical financial information presented in Management's Discussion and Analysis of Financial Condition and Results of Operations ("MD&A") to conform to the current period presentation.
Fee income from installment fees reported byDistribution costs within the Commercial Lines and Personal Lines reporting segments has been reclassified from underwriting expenses toHartford Funds segment that were previously netted against fee income and includedare presented gross in total revenues. The reclassification of installment fees did not impact previously reported underwriting gain (loss), underwriting ratios, or net income (loss) either in the Commercial Lines or Personal Lines reporting segments and did not impact previously reported consolidated net income or core earnings.
Separately, the flood servicing business has been realigned from specialty commercial within the Commercial Lines reporting segment to the Personal Lines reporting segment. This realignment did not materially impact previously reported Commercial Lines or Personal Lines underwriting results or net income. The realignment of the flood servicing business did not impact previously reported consolidated net income or core earnings.
Assets and liabilities associated with the Company's life and annuity run-off business are now classified as held for sale.
Unpaid losses and loss adjustment expenses and reinsurance recoverables for structured settlements reserves and recoverables due from the Company's life and annuity run-off business now classified as held for sale have been reclassified into the Company's P&C commercial lines business. Annuities purchased from third-party life insurers under structured settlements, including from life and annuity run-off obligations held for sale, are recognized as reinsurance recoverables in cases where the Company has not obtained a release from the claimant. These amounts were previously eliminated in consolidation.
Policy loans have been reclassified to Other investments on the Consolidated Balance Sheets.
Other intangible assets have been reclassified out of Other assets on the Consolidated Balance Sheets into their own line item.
Likewise, amortization of intangible assets has been reclassified out of Insuranceinsurance operating costs and other expenses on the Consolidated Statements of Operations into their own line item.expenses.
The Hartford defines increases or decreases greater than or equal to 200% as “NM” or not meaningful.
Part II - Item 7. Management's Discussion and Analysis of Financial Condition and Results of Operations
Index
|
| |
| Description | Page |
| Key Performance Measures and Ratios | |
| The Hartford's Operations | |
| Consolidated Results of Operations | |
| Investment Results | |
| Critical Accounting Estimates | |
| Commercial Lines | |
| Personal Lines | |
| |
| Group Benefits | |
| |
| |
| |
| |
| |
Part II - Item 7. Management's Discussion and Analysis of Financial Condition and Results of Operations
KEY PERFORMANCE MEASURES AND RATIOS
The Company considers the measures and ratios in the following discussion to be key performance indicators for its businesses. Management believes that these ratios and measures are useful in understanding the underlying trends in The Hartford’s businesses. However, these key performance indicators should only be used in conjunction with, and not in lieu of, the results presented in the segment discussions that follow in this MD&A. These ratios and measures may not be comparable to other performance measures used by the Company’s competitors.
Definitions of Non-GAAP and Other Measures and Ratios
Assets Under Management (“AUM”)- include mutual fund and ETPexchange-traded products ("ETP") assets. AUM is a measure used by the CompanyCompany's Hartford Funds segment because a significant portion of the Company’s mutual fund and ETP revenues are based upon asset values. These revenues increase or decrease with a rise or fall in AUM whether caused by changes in the market or through net flows.
Book Value per Diluted Share-Share excluding AOCI, accumulated other comprehensive income ("AOCI")-is calculated based upon a non-GAAP financial measure. It is calculated by dividing (a) totalcommon stockholders' equity, excluding AOCI, after tax, by (b) common shares outstanding and dilutive potential common shares. Book value per diluted share is the most directly comparable U.S. GAAP ("GAAP") measure. The Company provides this measure to enable investors to analyze the amount of the Company's net worth that is primarily attributable to the Company's business operations. The Company believes it is useful to investors
because it eliminates the effect of items in AOCI that can fluctuate significantly from period to period, primarily based on changes in interest rates.
Current Accident Year Catastrophe Ratio- (a a component of the loss and loss adjustment expense ratio)ratio, represents the ratio of catastrophe losses incurred in the current calendaraccident year (net of reinsurance) to earned premiums and includes catastrophe losses incurred for both the current and prior accident years.premiums. A catastrophe is an event that causes $25 or more in industry insured property losses and affects a significant number of property and casualty policyholders and insurers, as defined by the Property Claim Service office of Verisk. The current accident year catastrophe ratio includes the effect of catastrophe losses, but does not include the effect of reinstatement premiums.
Combined Ratio- the sum of the loss and loss adjustment expense ratio, the expense ratio and the policyholder dividend ratio. This ratio is a relative measurement that describes the related cost of losses and expenses for every $100 of earned premiums. A combined ratio below 100 demonstrates underwriting profit; a combined ratio above 100 demonstrates underwriting losses.
Core Earnings-a non-GAAP measure, is an important measure of the Company’s operating performance. The Company believes that core earnings provides investors with a valuable measure of the underlying performance of the Company’s businesses because it reveals trends in our insurance and financial services businesses that may be obscured by including the net effect of certain realized capital gains and losses, certain restructuring and other costs, loss on extinguishment of debt, pension settlements, integration and transaction costs in connection with an acquired business, pension settlements, loss on extinguishment of debt, gains and losses on reinsurance transactions, income tax benefit from a reduction in deferred income tax valuation allowance, impact of tax reformthe Tax Cuts and Jobs Act of 2017 ("Tax Reform") on net deferred tax assets, and results of discontinued operations. Some realized capital gains and losses are primarily driven by investment decisions and external economic developments, the nature and timing of which are unrelated to the insurance and underwriting aspects of our business. Accordingly, core earnings excludes the effect of all realized gains and losses that tend to be variable from period to period based on capital market conditions. The Company believes, however, that some realized capital gains and losses are integrally related to our insurance operations, so core earnings includes net realized gains and losses such as net periodic settlements on credit derivatives. These net realized gains and losses are directly related to an offsetting item included in the income statement such as net investment income. Core earnings are net of preferred stock dividends declared since they are a cost of financing more akin to interest expense on debt and are expected to be a recurring expense as long as the preferred stock is outstanding. Net income (loss) is, net income (loss) available to common stockholders and income (loss) from continuing operations, net of tax, available to common stockholders are the most directly comparable U.S. GAAP measure.measures to core earnings. Core earnings should not be considered as a substitute for net income (loss), net income (loss) available to common stockholders or income (loss) from continuing operations, net of tax, available to common stockholders and does not reflect the overall profitability of the Company’s business. Therefore, the Company believes that it is useful for investors to evaluate both net income (loss), net income (loss) available to common stockholders, income (loss) from continuing operations, net of tax, available to common stockholders and core earnings when reviewing the Company’s performance.
Part II - Item 7. Management's Discussion and Analysis of Financial Condition and Results of Operations
Reconciliation of Net Income (Loss) to Core Earnings | | | | For the years ended December 31, | For the years ended December 31, |
| | 2017 | 2016 | 2015 | 2018 | 2017 | 2016 |
| Net income | $ | (3,131 | ) | $ | 896 |
| $ | 1,682 |
| |
| Net income (loss) | | $ | 1,807 |
| $ | (3,131 | ) | $ | 896 |
|
| Preferred stock dividends | | 6 |
| — |
| — |
|
| Net income (loss) available to common stockholders | | 1,801 |
| $ | (3,131 | ) | $ | 896 |
|
| Less: Net realized capital gains (losses) excluded from core earnings, before tax | 160 |
| (112 | ) | (15 | ) | (118 | ) | 160 |
| (112 | ) |
| Less: Restructuring and other costs, before tax | — |
| — |
| (20 | ) | |
| Less: Loss on extinguishment of debt, before tax | — |
| — |
| (21 | ) | (6 | ) | — |
| — |
|
| Less: Loss on reinsurance transactions, before tax | — |
| (650 | ) | — |
| — |
| — |
| (650 | ) |
| Less: Pension settlement, before tax | (750 | ) | — |
| — |
| — |
| (750 | ) | — |
|
| Less: Integration and transaction costs associated with acquired business, before tax | (17 | ) | — |
| — |
| (47 | ) | (17 | ) | — |
|
| Less: Income tax (expense) benefit [1] | (669 | ) | 463 |
| 114 |
| |
| Less: (Loss) income from discontinued operations,after-tax | (2,869 | ) | 283 |
| 493 |
| |
| Less: Income tax benefit (expense) [1] | | 75 |
| (669 | ) | 463 |
|
| Less: Income (loss) from discontinued operations, net of tax | | 322 |
| (2,869 | ) | 283 |
|
| Core earnings | $ | 1,014 |
| $ | 912 |
| $ | 1,131 |
| $ | 1,575 |
| $ | 1,014 |
| $ | 912 |
|
| |
| [1] | Includes income tax benefit on items not included in core earnings and other federal income tax benefits and charges, including an $877 charge in 2017 primarily due to a reduction in net deferred tax assets as a result of the decrease in the Federal income tax rate from 35% to 21%. |
Core Earnings Margin-a non-GAAP financial measure that the Company uses to evaluate, and believes is an important measure of, the Group Benefits segment’s operating performance. Core earnings margin is calculated by dividing (a) core earnings by (b) revenues excluding buyouts and realized gains (losses). Net income margin is the most directly comparable U.S. GAAP measure. The Company believes that core earnings margin provides investors with a valuable measure of the performance of Group Benefits because it reveals trends in the business that may be obscured by the effect of buyouts and realized gains (losses). on revenues or obscured by the effect on net income of realized capital gains (losses), integration costs, and the impact of Tax Reform on net deferred tax assets. Core earnings margin should not be considered as a substitute for net income margin and does not reflect the overall profitability of Group Benefits. Therefore, the Company believes it is important for investors to evaluate both core earningsnet income margin and net incomecore earnings margin when reviewing performance. A reconciliation of net income margin to core earnings margin for the years ended December 31, 2017, 2016 and 2015 is set forth in the Results of Operations section within MD&A - Group Benefits.
Expense Ratio-for the underwriting segments of Commercial Lines and Personal Lines is the ratio of underwriting expenses less fee income, to earned premiums. Underwriting expenses include the amortization of deferred policy acquisition costs ("DAC") and insurance operating costs and expenses, including certain centralized services costs and bad debt expense. Deferred policy acquisition costs include commissions, taxes, licenses and fees and other incremental direct underwriting expenses and are amortized over the policy term.
The expense ratio for Group Benefits is expressed as the ratio of insurance operating costs and other expenses including amortization of intangibles and amortization of deferred policy acquisition costs,DAC, to premiums and other considerations, excluding buyout premiums. The expense ratio does not include integration and other transaction costs associated with an acquired business.
Fee Income-is largely driven from amounts earned as a result of contractually defined percentages of assets under management.management in our Hartford Funds business. These fees are generally earned on a daily basis. Therefore, the growth in assets
under management either through positive net flows or favorable market performance will have a favorable impact on fee income. Conversely, either
negative net flows or unfavorable market performance will reduce fee income.
Loss and Loss Adjustment Expense Ratio- a measure of the cost of claims incurred in the calendar year divided by earned premium and includes losses and loss adjustment expenses incurred for both the current and prior accident years. Among other factors, the loss and loss adjustment expense ratio needed for the Company to achieve its targeted return on equity fluctuates from year to year based on changes in the expected investment yield over the claim settlement period, the timing of expected claim settlements and the targeted returns set by management based on the competitive environment.
The loss and loss adjustment expense ratio is affected by claim frequency and claim severity, particularly for shorter-tail property lines of business, where the emergence of claim frequency and severity is credible and likely indicative of ultimate losses. Claim frequency represents the percentage change in the average number of reported claims per unit of exposure in the current accident year compared to that of the previous accident year. Claim severity represents the percentage change in the estimated average cost per claim in the current accident year compared to that of the previous accident year. As one of the factors used to determine pricing, the Company’s practice is to first make an overall assumption about claim frequency and severity for a given line of business and then, as part of the ratemaking process, adjust the assumption as appropriate for the particular state, product or coverage.
Loss and Loss Adjustment Expense Ratio before Catastrophes and Prior Accident Year Development-a measure of the cost of non-catastrophe claimsloss and loss adjustment expenses incurred in the current accident year divided by earned premiums. Management believes that the current accident year loss and loss adjustment expense ratio before catastrophes is a performance measure that is useful to investors as it removes the impact of volatile and unpredictable catastrophe losses and prior accident year development.
Part II - Item 7. Management's Discussion and Analysis of Financial Condition and Results of Operations
Loss Ratio, excluding Buyouts-utilized for the Group Benefits segment and is expressed as a ratio of benefits, losses and loss adjustment expenses to premiums and other
Part II - Item 7. Management's Discussion and Analysis of Financial Condition and Results of Operations
considerations, excluding buyout premiums. Since Group Benefits occasionally buys a block of claims for a stated premium amount, the Company excludes this buyout from the loss ratio used for evaluating the underwriting resultsprofitability of the business as buyouts may distort the loss ratio. Buyout premiums represent takeover of open claim liabilities and other non-recurring premium amounts.
Mutual Fund and Exchange-Traded Product Assets-are owned by the shareholders of those products and not by the Company and, therefore, are not reflected in the Company’s consolidated financial statements.statements except in instances where the Company seeds new investment products and holds an investment in the fund for a period of time. Mutual fund and ETP assets are a measure used by the Company primarily because a significant portion of the Company’s Hartford Funds segment revenues are based upon asset values. These revenues increase or decrease with a rise or fall in AUM whether caused by changes in the market or through net flows.
New Business Written Premium-represents the amount of premiums charged for policies issued to customers who were not insured with the Company in the previous policy term. New business written premium plus renewal policy written premium equals total written premium.
Policies in Force- represent represents the number of policies with coverage in effect as of the end of the period. The number of policies in force is a growth measure used for Personal Lines and standard commercial lines within Commercial Lines and is affected by both new business growth and policy count retention.
Policy Count Retention- represents the ratio of the number of policies renewed during the period divided by the number of policies available to renew. The number of policies available to renew represents the number of policies, net of any cancellations, written in the previous policy term. Policy count retention is affected by a number of factors, including the percentage of renewal policy quotes accepted and decisions by the Company to non-renew policies because of specific policy underwriting concerns or because of a decision to reduce premium writings in certain classes of business or states. Policy count retention is also affected by advertising and rate actions taken by competitors.
Policyholder Dividend Ratio- the ratio of policyholder dividends to earned premium.
Prior Accident Year Loss and Loss Adjustment Expense Ratio- represents the increase (decrease) in the estimated cost of settling catastrophe and non-catastrophe claims incurred in prior accident years as recorded in the current calendar year divided by earned premiums.
Reinstatement Premiums- represents additional ceded premium paid for the reinstatement of the amount of reinsurance coverage that was reduced as a result of a reinsurance loss payment.the Company ceding losses to reinsurers.
Renewal Earned Price Increase (Decrease)-Written premiums are earned over the policy term, which is six months for certain Personal Lines automobile business and
twelve months for substantially all of the remainder of the Company’s Property and Casualty business. Since the Company earns premiums over the six to twelve month term of the policies,
renewal earned price increases (decreases) lag renewal written price increases (decreases) by six to twelve months.
Renewal Written Price Increase (Decrease)-for Commercial Lines, represents the combined effect of rate changes, amount of insurance and individual risk pricing decisions per unit of exposure on policies that renewed. For Personal Lines, renewal written price increases represent the total change in premium per policy since the prior year on those policies that renewed and includes the combined effect of rate changes, amount of insurance and other changes in exposure. For Personal Lines, other changes in exposure include, but are not limited to, the effect of changes in number of drivers, vehicles and incidents, as well as changes in customer policy elections, such as deductibles and limits. The rate component represents the change in rate filed with and approved by state regulators during the period and the amount of insurance represents the change in the value of the rating base, such as model year/vehicle symbol for automobiles, building replacement costs for property and wage inflation for workers’ compensation. A number of factors affect renewal written price increases (decreases) including expected loss costs as projected by the Company’s pricing actuaries, rate filings approved by state regulators, risk selection decisions made by the Company’s underwriters and marketplace competition. Renewal written price changes reflect the property and casualty insurance market cycle. Prices tend to increase for a particular line of business when insurance carriers have incurred significant losses in that line of business in the recent past or the industry as a whole commits less of its capital to writing exposures in that line of business. Prices tend to decrease when recent loss experience has been favorable or when competition among insurance carriers increases. Renewal written price statistics are subject to change from period to period, based on a number of factors, including changes in actuarial estimates and the effect of subsequent cancellations and non-renewals, and modifications made to better reflect ultimate pricing achieved.
Return on Assets (“ROA”), Core Earnings- a non-GAAP financial measure that the Company uses to evaluate, and believes is an important measure of, the MutualHartford Funds segment’s operating performance. ROA, core earnings is calculated by dividing core earnings by a daily average AUM. ROA is the most directly comparable U.S. GAAP measure. The Company believes that ROA, core earnings, provides investors with a valuable measure of the performance of the MutualHartford Funds segment because it reveals trends in our business that may be obscured by the effect of realized gains (losses). ROA, core earnings, should not be considered as a substitute for ROA and does not reflect the overall profitability of our MutualHartford Funds business. Therefore, the Company believes it is important for investors to evaluate both ROA, and ROA, core earnings and ROA when reviewing the MutualHartford Funds segment performance. ROA, core earnings is calculated by dividing core earnings by a daily average AUM. A reconciliation of ROA to ROA, core earnings for the years ended December 31, 2017, 2016 and 2015, is set forth in the Results of Operations section within MD&A - MutualHartford Funds.
Underlying Combined Ratio- a non-GAAP financial measure, represents the combined ratio before catastrophes and prior accident year development. Combined ratio is the most directly comparable U.S. GAAP measure. The Company believes the underlying combined ratio is an important measure of the trend in profitability since it removes the impact of volatile and unpredictable catastrophe losses and prior accident year loss and loss adjustment expense reserve development. A reconciliation of
Part II - Item 7. Management's Discussion and Analysis of Financial Condition and Results of Operations
unpredictable catastrophe losses and prior accident year loss and loss adjustment expense reserve development. A reconciliation of combined ratio to underlying combined ratio for the years ended December 31, 2017, 2016 and 2015 is set forth in the Results of Operations section within MD&A - Commercial Lines and Personal Lines.
Underwriting Gain (Loss)-The Company's management evaluates profitability of the P&C businesses primarily on the basis of underwriting gain (loss). Underwriting gain (loss) is a before-taxbefore tax measure that represents earned premiums less incurred losses, loss adjustment expenses, amortization of deferred policy acquisition costs, underwriting expenses, amortization of other intangible assets and underwriting expenses.dividends to policyholders. Underwriting gain (loss) is influenced significantly by earned premium growth and the adequacy of the Company's pricing. Underwriting profitability over time is also greatly influenced by the Company's pricing and underwriting discipline, which seeks to manage exposure to loss through favorable risk selection and diversification, its management of claims, its use of reinsurance and its ability to manage its expense ratio, which it accomplishes through economies of scale and its management of acquisition costs and other underwriting expenses. Net income (loss) is the most directly comparable GAAP measure. The Company believes that underwriting gain (loss) provides investors with a valuable measure of before-taxbefore tax profitability derived from underwriting activities, which are managed separately from the Company's investing activities. A reconciliation of underwriting gainnet income (loss) to net incomeunderwriting gain (loss) for Commercial Lines, Personal Lines and Property & Casualty Other Operations is set forth in segment sections of MD&A.
Written and Earned Premiums-Written premium is a statutory accounting financial measure which represents the amount of premiums charged for policies issued, net of reinsurance, during a fiscal period. Earned premium is a U.S. GAAP and statutory measure. Premiums are considered earned and are included in the financial results on a pro rata basis over the policy period. Management believes that written premium is a performance measure that is useful to investors as it reflects current trends in the Company’s sale of property and casualty insurance products. Written and earned premium are recorded net of ceded reinsurance premium.
Traditional life and disability insurance type products, such as those sold by Group Benefits, collect premiums from policyholders in exchange for financial protection for the policyholder from a specified insurable loss, such as death or disability. These premiums, together with net investment income earned, from the overall investment strategy are used to pay the contractual obligations under these insurance contracts. Two major factors, new sales and persistency, impact premium growth. Sales can increase or decrease in a given year based on a number of factors including, but not limited to, customer demand for the Company’s product offerings, pricing competition, distribution channels and the Company’s reputation and ratings. Persistency refers to the percentage of policiespremium remaining in-force from year-to-year.
THE HARTFORD'S OPERATIONS
Overview
The Hartford conducts business principally in five reporting segments including Commercial Lines, Personal Lines, Property &
Casualty Other Operations, Group Benefits and MutualHartford Funds, as well as a Corporate category. The HartfordCompany includes in itsthe Corporate category investment management fees and expenses related to managing third party business, including management of the invested assets of Talcott Resolution, discontinued operations ofrelated to the Company's life and annuity run-off business accounted for as held for sale,sold in May 2018, reserves for run-off structured settlement and terminal funding agreement liabilities, retained, capital raising activities (including debt financing and related interest expense), purchase accounting adjustments related to goodwill and other expenses not allocated to the reporting segments. In addition, Corporate includes a 9.7% ownership interest in the legal entity that acquired the life and annuity business sold in May 2018.
The Company derives its revenues principally from: (a) premiums earned for insurance coverage provided to insureds; (b) asset management fees on mutual fund and ETP assets; (c) net investment income; (d) fees earned for services provided to third parties; and (e) net realized capital gains and losses. Premiums charged for insurance coverage are earned principally on a pro rata basis over the terms of the related policies in-force.
The profitability of the Company's property and casualty insurance businesses over time is greatly influenced by the Company’s underwriting discipline, which seeks to manage exposure to loss through favorable risk selection and diversification, its management of claims, its use of reinsurance, the size of its in force block, actual mortality and morbidity experience, and its ability to manage its expense ratio which it accomplishes through economies of scale and its management of acquisition costs and other underwriting expenses. Pricing adequacy depends on a number of factors, including the ability to obtain regulatory approval for rate changes, proper evaluation of underwriting risks, the ability to project future loss cost frequency and severity based on historical loss experience adjusted for known trends, the Company’s response to rate actions taken by competitors, its expense levels and expectations about regulatory and legal developments. The Company seeks to price its insurance policies such that insurance premiums and future net investment income earned on premiums received will cover underwriting expenses and the ultimate cost of paying claims reported on the policies and provide for a profit margin. For many of its insurance products, the Company is required to obtain approval for its premium rates from state insurance departments.
Similar to Property & Casualty, profitability of the Group Benefits business depends, in large part, on the ability to evaluate and price risks appropriately and make reliable estimates of mortality, morbidity, disability and longevity. To manage the pricing risk, Group Benefits generally offers term insurance policies, allowing for the adjustment of rates or policy terms in order to minimize the adverse effect of market trends, loss costs, declining interest rates and other factors. However, as policies are typically sold with rate guarantees of up to three years, pricing for the
Part II - Item 7. Management's Discussion and Analysis of Financial Condition and Results of Operations
Company’s products could prove to be inadequate if loss and expense trends emerge adversely during the rate guarantee period. For some of its products, the Company is required to obtain approval for its premium rates from state insurance departments. New and renewal business for group benefits business, particularly for long-term disability, are priced using an assumption about expected investment yields over time. While the Company employs asset-liability duration matching strategies to mitigate risk and may use interest-rate sensitive derivatives to hedge its exposure in the Group Benefits investment portfolio, cash flow patterns related to the payment of benefits and claims are uncertain and actual investment yields could differ significantly from expected investment yields, affecting profitability of the
Part II - Item 7. Management's Discussion and Analysis of Financial Condition and Results of Operations
business. In addition to appropriately evaluating and pricing risks, the profitability of the Group Benefits business depends on other factors, including the Company’s response to pricing decisions and other actions taken by competitors, its ability to offer voluntary products and self-service capabilities, the persistency of its sold business and its ability to manage its expenses which it seeks to achieve through economies of scale and operating efficiencies.
The financial results inof the Company’s mutual fund and ETP businesses depend largely on the amount of assets under management on which it earns fees and the level of fees charged.charged based, in part, on asset share class and product type. Changes in assets under management are driven by two main factors:factors, net flows and the market return of the funds, which isare heavily influenced by the return realized in the equity and bond markets. Net flows are
comprised of new sales less redemptions by mutual fund and ETP shareholders.stockholders. Financial results are highly correlated to the growth in assets under management since these products generally earn fee income on a daily basis.
The investment return, or yield, on invested assets is an important element of the Company’s earnings since insurance products are
priced with the assumption that premiums received can be invested for a period of time before benefits, losslosses and loss adjustment expenses are paid. Due to the need to maintain sufficient liquidity to satisfy claim obligations, the majority of the Company’s invested assets have been held in available-for-sale securities, including, among other asset classes, equities, corporate bonds, municipal bonds, government debt, short-term debt, mortgage-backed securities, and asset-backed securities and collateralized debtloan obligations.
The primary investment objective for the Company is to maximize economic value, consistent with acceptable risk parameters, including the management of credit risk and interest rate sensitivity of invested assets, while generating sufficient after-taxafter tax income to meet policyholder and corporate obligations. Investment strategies are developed based on a variety of factors including business needs, regulatory requirements and tax considerations.
For further information on the Company's reporting segments, refer to Part I, Item 1, Business — Reporting Segments.
|
| | |
Net Income (Loss) IncomeAvailable to Common Stockholders | Net Income (Loss) Available to Common Stockholders per Diluted Share | Book Value per Diluted Share |
Net LossIncome (loss) available to common stockholdersof $1,801, or $5.03 per basic share and $4.95 per diluted share, compared with prior year net loss of $3,131, or $8.61 per basic and diluted share, compared with prior year net income of $896, or $2.31 per basic share and $2.27 per diluted share. The change from net incomeloss in 20162017 to a net lossincome in 20172018 was mostlyprimarily due to a number of charges in 2017, including a $3.3 billion loss on discontinued operations of $2.9 billion related to the pending sale of the life and annuity run-off business a charge tosold in May 2018, net of tax, $877 of income tax expense of $877 arising primarily from the reduction ofreducing net deferred tax assets due to the enactmentreduction of lowerthe corporate Federal income tax ratesrate, and the effect of a pension settlement charge of $488, after-tax.
Common share repurchases duringnet of tax. Apart from these charges in 2017, totaled $1,028 million, or 20.2 million sharesnet income available to common stockholders increased, driven by higher net income in Commercial Lines, Group Benefits and $341 of dividends were paid to shareholders.
Book value per diluted common sharedecreased to $37.11 from $44.35 as of December 31, 2016 as a result of a $3.4 billion, or 20%, decrease in shareholders' equity largely dueHartford Funds that was partially attributable to a $3.3 billion loss on the pending sale of the life and annuity run-off business, partially offset by the effect of a 5% decreaselower corporate Federal income tax rate in common shares outstanding and dilutive potential common shares.2018.
Part II - Item 7. Management's Discussion and Analysis of Financial Condition and Results of Operations
Book value per diluted common sharedecreased to $35.06 from $37.11 as of December 31, 2017 as a result of a 5% decrease in common stockholders' equity resulting primarily from a decrease in AOCI over the period, partially offset by net income in excess of stockholder dividends.
|
| |
| Net Investment Income | Investment Yield After-taxAfter Tax |
Net investment income increased 2%11% to $1,603$1,780 compared with the prior year primarily due to higher average fixed maturities asset levels during 2018 as compared to 2017 largely driven by the acquisition of Aetna's U.S. group life and disability business in November 2017 and, to a lesser extent, higher income from limited partnerships and other alternative investments partially offset by lower make-whole payment incomeand a higher reinvestment rate on fixed maturities and increased investment expenses.maturities.
Net realized capital gains (losses) changed to net losses of $112 from net gains of $165 comparedfor the year ended December 31, 2017, with losses in 2018 primarily driven by net losses on sales of fixed maturity securities due to sector repositioning and duration, liquidity and credit management as well as net realized capital losses on equity securities resulting from depreciation in value due to lower equity market levels, partially offset by gains on sales due to tactical repositioning.
Annualized investment yield, after taxof $110 in 2016,3.3%, was up 30 basis points from 2017 primarily due to higher net gains on sales, lower impairments and the effect of losses in 2016 related to the sale of the Company's U.K. property and casualty run-off subsidiaries and the write-down of investments in solar energy partnerships that generateda lower corporate Federal income tax benefits.rate.
Annualized investment yield, after-taxof 3.0%, was up 0.1 points from 2016 as the effect of higher returns on limited partnerships and alternative investments was partially offset by the effect of lower make-whole payment income and reinvesting at lower yields.
Net unrealized gains, after-tax,after taxfor fixed maturities in the investment portfolio increaseddecreased by $655$2,180 compared with the prior year primarily due primarily to tighterthe effect of credit spreads.spread widening and higher interest rates and the removal of AOCI related to the life and annuity business sold in May 2018.
|
| |
| P&C Written Premiums | P&C Combined Ratio |

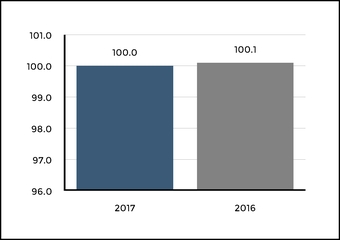
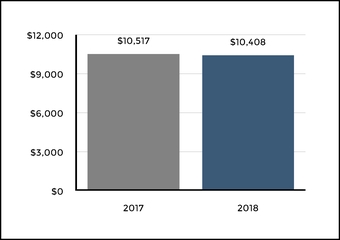
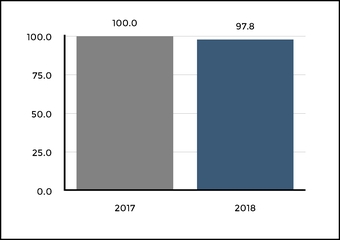
Written premiums for Property & Casualty decreased slightly1.0% compared with the prior year, for Property & Casualty, comprised of 3% growth in Commercial Lines andreflecting a 7% decrease in Personal Lines.
Combined ratioof 100.0 compared with 100.1 in the prior year for Property & Casualty, as a higher combined ratio in Commercial Lines, was largely offset by the effect of asbestos and environmental reserve strengtheningan increase in P&C Other Operations in 2016 and modest improvement in the Personal Lines combined ratio.
Catastrophe lossesof $836, before tax, increased from catastrophe losses of $416, before tax, in the prior year, largely due to losses in 2017 from hurricanes Harvey and Irma and wildfires in California.Commercial Lines.
Part II - Item 7. Management's Discussion and Analysis of Financial Condition and Results of Operations
Prior accident year development was favorable $41 inCombined ratio for Property & Casualty decreased 2.2 points to 97.8 compared with a combined ratio of 100.0 for 2017 compared to unfavorable reserve development of $457 in 2016 with reserve increases in 2016 largely due to a $268lower current accident year loss and loss adjustment expense ratio for Personal Lines and favorable prior accident year development, partially offset by higher expenses.
Catastrophe lossesof $821, before tax, decreased from catastrophe losses of $836, before tax, in the prior year, with catastrophes in both years including losses from California wildfires, hurricanes, winter storms and various wind and hail events.
Prior accident year developmentfor property and casualty was a net favorable $167, before tax, in 2018 primarily due to a decrease in reserves for workers' compensation, automobile liability and 2017 catastrophes, partially offset by an increase in asbestosreserves for general liability. Reserve development was a net favorable $41, before tax, in 2017 primarily due to a decrease in reserves for workers compensation and environmental reserves andpackage business, partially offset by a $160reserve increase in Personal Lines auto liability reserves.for customs bond claims.
|
|
| Group Benefits Net Income Margin |

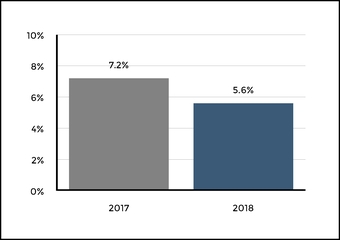
Net income margin increased to 7.2% from 6.3% in the prior year for Group Benefits declined from 7.2% in 2017 to 5.6% in 2018 primarily due to net realized capital losses of $39, net of tax, in 2018 as compared to net realized capital gains of $19, net of tax, in 2017, integration costs of $37, net of tax, in 2018 as compared to $11, net of tax, in 2017, and a tax benefit of $52 of income tax benefits arising primarilyin 2017 from the reduction ofreducing net deferred tax liabilities due to the enactment of lower Federalcorporate income tax rates.rate, partially offset by an increase in favorable prior incurral year development on long-term disability and premium waiver primarily due to favorable incidence trends and the effect of scale from the acquisition of Aetna’s U.S. group life and disability business on fixed expenses. Prior accident year development, pre-tax, for Group Benefits increased from $185 in 2017 to $324 in 2018 with most of that development from the 2017 incurral year as incidence trends become known after the elimination period is satisfied.
CONSOLIDATED RESULTS OF OPERATIONS
The Consolidated Results of Operations should be read in conjunction with the Company's Consolidated Financial Statements and the related Notes beginning on page F-1 as well as with the segment operating results sections of MD&A.
|
| | | | | | | | | | | | | | | |
| | 2017 | 2016 | 2015 | Increase
(Decrease) From 2016 to 2017 | Increase
(Decrease) From 2015 to 2016 |
| Earned premiums | $ | 14,141 |
| $ | 13,697 |
| $ | 13,485 |
| $ | 444 |
| $ | 212 |
|
| Fee income [1] | 980 |
| 857 |
| 876 |
| 123 |
| (19 | ) |
| Net investment income | 1,603 |
| 1,577 |
| 1,561 |
| 26 |
| 16 |
|
| Net realized capital gains (losses) | 165 |
| (110 | ) | (12 | ) | 275 |
| (98 | ) |
| Other revenues | 85 |
| 86 |
| 87 |
| (1 | ) | (1 | ) |
| Total revenues | 16,974 |
| 16,107 |
| 15,997 |
| 867 |
| 110 |
|
| Benefits, losses and loss adjustment expenses | 10,174 |
| 9,961 |
| 9,325 |
| 213 |
| 636 |
|
| Amortization of deferred policy acquisition costs | 1,372 |
| 1,377 |
| 1,364 |
| (5 | ) | 13 |
|
| Insurance operating costs and other expenses | 4,375 |
| 3,341 |
| 3,459 |
| 1,034 |
| (118 | ) |
| Loss on extinguishment of debt | — |
| — |
| 21 |
| — |
| (21 | ) |
| Loss on reinsurance transactions | — |
| 650 |
| — |
| (650 | ) | 650 |
|
| Interest expense | 316 |
| 327 |
| 346 |
| (11 | ) | (19 | ) |
| Amortization of other intangible assets | 14 |
| 4 |
| 4 |
| 10 |
| — |
|
| Total benefits, losses and expenses | 16,251 |
| 15,660 |
| 14,519 |
| 591 |
| 1,141 |
|
| Income from continuing operations before income taxes | 723 |
| 447 |
| 1,478 |
| 276 |
| (1,031 | ) |
| Income tax expense (benefit) | 985 |
| (166 | ) | 289 |
| 1,151 |
| (455 | ) |
| (Loss) Income from continuing operations, net of tax | (262 | ) | 613 |
| 1,189 |
| (875 | ) | (576 | ) |
| (Loss) income from discontinued operations,net of tax | (2,869 | ) | 283 |
| 493 |
| (3,152 | ) | (210 | ) |
| Net (loss) income | $ | (3,131 | ) | $ | 896 |
| $ | 1,682 |
| $ | (4,027 | ) | $ | (786 | ) |
| |
[1] | Commercial Lines includes installment fees of $37, $39 and $40, for 2017, 2016 and 2015, respectively. Personal Lines includes installment fees of $44, $39, and $37, for 2017, 2016 and 2015, respectively.
|
Part II - Item 7. Management's Discussion and Analysis of Financial Condition and Results of Operations
Consolidated Results of Operations
|
| | | | | | | | | | | | | | | |
| 2018 | 2017 | 2016 | Increase (Decrease) From 2017 to 2018 | Increase (Decrease) From 2016 to 2017 |
| Earned premiums | $ | 15,869 |
| $ | 14,141 |
| $ | 13,697 |
| $ | 1,728 |
| $ | 444 |
|
| Fee income [1] | 1,313 |
| 1,168 |
| 1,041 |
| 145 |
| 127 |
|
| Net investment income | 1,780 |
| 1,603 |
| 1,577 |
| 177 |
| 26 |
|
| Net realized capital gains (losses) | (112 | ) | 165 |
| (110 | ) | (277 | ) | 275 |
|
| Other revenues | 105 |
| 85 |
| 86 |
| 20 |
| (1 | ) |
| Total revenues | 18,955 |
| 17,162 |
| 16,291 |
| 1,793 |
| 871 |
|
| Benefits, losses and loss adjustment expenses | 11,165 |
| 10,174 |
| 9,961 |
| 991 |
| 213 |
|
| Amortization of deferred policy acquisition costs | 1,384 |
| 1,372 |
| 1,377 |
| 12 |
| (5 | ) |
| Insurance operating costs and other expenses | 4,281 |
| 4,563 |
| 3,525 |
| (282 | ) | 1,038 |
|
| Loss on extinguishment of debt | 6 |
| — |
| — |
| 6 |
| — |
|
| Loss on reinsurance transactions | — |
| — |
| 650 |
| — |
| (650 | ) |
| Interest expense | 298 |
| 316 |
| 327 |
| (18 | ) | (11 | ) |
| Amortization of other intangible assets | 68 |
| 14 |
| 4 |
| 54 |
| 10 |
|
| Total benefits, losses and expenses | 17,202 |
| 16,439 |
| 15,844 |
| 763 |
| 595 |
|
| Income from continuing operations, before tax | 1,753 |
| 723 |
| 447 |
| 1,030 |
| 276 |
|
| Income tax expense (benefit) | 268 |
| 985 |
| (166 | ) | (717 | ) | 1,151 |
|
| Income (loss) from continuing operations, net of tax | 1,485 |
| (262 | ) | 613 |
| 1,747 |
| (875 | ) |
| Income (loss) from discontinued operations, net of tax | 322 |
| (2,869 | ) | 283 |
| 3,191 |
| (3,152 | ) |
| Net income (loss) | 1,807 |
| (3,131 | ) | 896 |
| 4,938 |
| (4,027 | ) |
| Preferred stock dividends | 6 |
| — |
| — |
| 6 |
| — |
|
| Net income (loss) available to common stockholders | $ | 1,801 |
| $ | (3,131 | ) | $ | 896 |
| $ | 4,932 |
| $ | (4,027 | ) |
| |
| [1] | Excludes distribution costs of $188 and $184 for the years ended December 31, 2017, and 2016, respectively, that were previously netted against fee income and are now presented gross in insurance operating costs and other expenses. |
Year ended December 31, 2018 compared to year ended December 31, 2017
Net income (loss) available to common stockholdersincreased from a net loss in 2017, primarily due to a number of charges in 2017, including a $3.3 billion after tax loss on sale of the life and annuity business sold in May 2018, $877 of income tax expense primarily from reducing net deferred tax assets due to the reduction of the corporate Federal income tax rate, and the effect of a pension settlement charge of $488, after tax. Apart from these charges in 2017, net income available to common stockholders increased, driven by higher net income in Commercial Lines, Group Benefits and Hartford Funds that was partially attributable to a lower corporate Federal income tax rate in 2018. Higher earned premium and net investment income in Commercial Lines and Group Benefits, including from the acquisition of Aetna’s U.S. group life and disability business, increased fee income in Hartford Funds, more favorable prior accident year development in workers’ compensation, a lower current accident year loss ratio before catastrophes in Personal Lines and improved long term disability results, were partially offset by the effect of lower Personal Lines earned premium and higher insurance operating costs and other expenses, and a change to net realized capital losses.
Earned premiumsincreased primarily due to the acquisition of Aetna's U.S. group life and disability benefits business that has increased earned premiums in the Group Benefits segment. Earned premiums in Property and Casualty declined reflecting an 8% decline in Personal Lines, partially
offset by a 3% increase in Commercial Lines. For a discussion of the Company's operating results by segment, see MD&A - Segment Operating Summaries.
Fee income increased, reflecting higher income in Group Benefits related to an increase in administrative service contracts as a result of the acquisition from Aetna and in Hartford Funds largely due to higher average daily AUM during the year despite a decline in AUM at the end of the year.
Net investment incomeincreased primarily due to a higher level of invested assets due to the acquisition of Aetna's U.S. group life and disability business. For further discussion of investment results, see MD&A - Investment Results, Net Investment Income.
Net realized capital losses of $112 in 2018 were down from net realized capital gains of $165 in 2017. Net losses in 2018 were primarily driven by net losses on sales of fixed maturity securities due to sector repositioning and duration, liquidity and credit management as well as net losses on equity securities resulting from depreciation in value due to lower equity market levels, partially offset by gains on sales due to tactical repositioning. For further discussion of investment results, see MD&A - Investment Results, Net Realized Capital Gains.
Benefits, losses and loss adjustment expenses increased in Group Benefits, partially offset by a decrease in Property & Casualty with the increase in Group Benefits primarily due to the effect of growth in earned premium
Part II - Item 7. Management's Discussion and Analysis of Financial Condition and Results of Operations
largely resulting from the acquisition of Aetna's U.S. group life and disability business, partially offset by a lower group disability loss ratio. The decrease in incurred losses for Property & Casualty was driven by:
| |
| • | Current accident year loss and loss adjustment expenses before catastrophes in Property & Casualty decreased, primarily resulting from the effect of lower Personal Lines earned premium and lower loss costs in auto, homeowners and general liability, partially offset by higher loss costs in workers’ compensation. |
| |
| • | Current accident year catastrophe losses of $821, before tax, for the year ended December 31, 2018 decreased compared to $836, before tax, for the prior year period. Catastrophe losses in 2018 were primarily from wildfires in California, hurricanes Florence and Michael in the Southeast, wind and hail storms in Colorado, and various wind storms and winter storms across the country and are net of an estimated reinsurance recoverable of $82 under the 2018 Property Aggregate reinsurance treaty. Catastrophe losses in 2017 were primarily due to hurricanes Harvey and Irma in the third quarter, California wildfires, and multiple wind and hail events across various U.S. geographic regions, primarily in the Midwest, Colorado, Texas and the Southeast. For additional information, see MD&A - Critical Accounting Estimates, Property & Casualty Insurance Product Reserves, Net of Reinsurance. |
| |
| • | Net prior accident year reserve development in Property & Casualty was favorable$167, before tax, for the year ended December 31, 2018 compared to favorable net reserve development of $41, before tax, for the prior year period. Prior accident year development in 2018 primarily included a decrease in reserves for workers’ compensation and a decrease in catastrophe reserves for the 2017 hurricanes. |
Amortization of deferred policy acquisition costs was relatively flat year over year as an increase in Commercial Lines was largely offset by a decrease in Personal Lines.
Insurance operating costs and other expenses decreased due to a $750 pension settlement charge in the 2017 period, partially offset by an increase in operating costs associated with the acquisition of Aetna's U.S. group life and disability business, increased commissions in Commercial Lines, and higher variable expenses in Hartford Funds.
Amortization of other intangible assetsincreased, reflecting the amortization of customer relationship intangibles in the Group Benefits segment that arose from the acquisition of the Aetna U.S. group life and disability business.
Income tax expensedecreased primarily due to an $877 charge in 2017 due to a reduction in net deferred tax assets as a result of the lower corporate Federal income tax rate partially offset by an increase in before tax income and the effect of a lower corporate Federal income tax rate in 2018. Differences between the Company's effective income tax rate and the U.S. statutory rate of 21% and 35% in 2018 and 2017, respectively, are due primarily to tax-exempt interest earned on invested assets, stock-based compensation, non-deductible executive compensation and the effects of Tax Reform on net deferred tax
assets. For further discussion of income taxes, see Note 16 - Income Taxes of Notes to Consolidated Financial Statements.
Income from discontinued operations, net of tax of $322 in 2018, increased from a net loss from discontinued operations of $2.9 billion in 2017. The $322 of income from discontinued operations in 2018 was mostly attributable to recognizing additional retained tax benefits from the sale of the life and annuity business in May 2018 and the reclassification of $193 of stranded tax effects from AOCI to retained earnings related to this sale, both of which reduced the estimated loss on sale. The reclassification of stranded tax effects resulted in a corresponding increase in AOCI related to the assets held for sale. For more information on the reclassification of stranded tax effects, see Note 1 - Basis of Presentation and Significant Accounting Policies of Notes to Consolidated Financial Statements. The $2.9 billion net loss on discontinued operations in 2017 was driven by a $3.3 billion net loss on the sale of the life and annuity business which closed on May 31, 2018.
Year ended December 31, 2017 compared to the year ended December 31, 2016
Net income (loss) available to common stockholdersdecreased from net income in 2016 to a net loss in 2017 primarily due to a loss on discontinued operations of $2.9 billion related to the pending sale of the life and annuity run-off business, a charge to income tax expense of $877 arising primarily from the reduction of net deferred tax assets due to the enactment of lower Federal income tax rates and a pension settlement charge of $488 after-tax.after tax. Partially offsetting the decline were the effects of a $179 after-taxafter tax change from net realized capital losses in 2016 to net realized capital gains in 2017, the effect of a $423 after-taxafter tax charge in 2016 related to a loss on reinsurance covering the Company’s asbestos and environmental exposures and a reduction in the valuation allowance on capital loss carryovers in 2016. In addition, a $324 after-taxafter tax improvement in P&C prior accident year development and higher earnings in Group Benefits and MutualHartford Funds were largely offset by a $273 after-taxafter tax increase in current accident year catastrophes and higher variable incentive compensation.
Earned premiumsincreased by $444, before tax, reflecting growth of 3% in Commercial Lines, including the effect of the Maxum acquisition, and 14% in Group Benefits, including the effect of acquiring the Aetna U.S. group life and disability business, partially offset by a 5% decrease in Personal Lines. For a discussion of the Company's operating results by segment, see MD&A - Results of Operations by segment.
Fee income increased reflecting a 15% increase in MutualHartford Funds due to higher assets under management driven by market appreciation and positive net flows and the addition of Schroders funds in the fourth quarter of 2016. For a discussion of the Company's operating results by segment, see MD&A - Results of Operations by segment.
Net investment incomeincreased 2%, primarily due to higher income from limited partnerships and other alternative investments, partially offset by lower make-whole payment income on fixed maturities and increased investment expenses. For further discussion of investment results, see MD&A - Investment Results, Net Investment Income (Loss).
Part II - Item 7. Management's Discussion and Analysis of Financial Condition and Results of Operations
Net realized capital gains of $165 before-taxbefore tax compared to net realized capital losses of $110 before-taxbefore tax in 2016, primarily due to higher net gains on sales, lower impairments and the effect of losses in 2016 related to the sale of the Company's U.K. property and casualty run-off subsidiaries and the write-down of investments in solar energy partnerships in 2016 that generated tax benefits. For further discussion of investment results, see MD&A - Investment Results, Net Realized Capital Gains (Losses).
Benefits, losses and loss adjustment expenses increased 11% in Group Benefits and decreased 1% in P&C. The increase in Group Benefits was largely due to the acquisition of Aetna’s U.S. group life and disability business. The decrease in P&C was primarily due to the effect of unfavorable prior accident year reserve development in 2016, largely offset by higher catastrophe losses in 2017.
Current accident year losses and loss adjustment expenses before catastrophes in Property & Casualty were relatively flat, primarily resulting from improved loss ratios and lower
earned premiums in Personal Lines, offset by higher loss ratios in workers' compensation and general liability.
Current accident year catastrophe losses of $836,$836, before tax, compared to $416,$416, before tax, for the prior year period. Catastrophe losses in 2017 were primarily due to hurricanes Harvey and Irma, California wildfires and multiple wind and hail events across various U.S. geographic regions, primarily in the Midwest, Colorado, Texas and the Southeast. Catastrophe losses in 2016 were primarily due to multiple wind and hail and winter storm events across various U.S. geographic regions, concentrated in Texas and the central and southern plains and, to a lesser extent, winter storms and hurricane Matthew. For additional information, see MD&A - Critical Accounting Estimates, Property & Casualty Insurance Product Reserves, Net of Reinsurance.
Favorable prior accident year reserve development in Property & Casualty of $41,$41, before tax, compared to unfavorable reserve development of $457,$457, before tax, for the prior year period. Prior accident year development in 2017 primarily included decreases in reserves for workers’ compensation and Small Commercialsmall commercial package business, partially offset by an increase in reserves for bond claims. Prior accident year development in 2016 was largely due to a $268 increase in asbestos and environmental reserves and a $160$160 increase in Personal Lines autoautomobile liability reserves. For additional information, see MD&A - Critical Accounting Estimates, Reserve Roll ForwardsRollforwards and Development.
Amortization of deferred policy acquisition costs was relatively flat as higher amortization on higher earned premium for Commercial Lines was offset by lower amortization on lower earned premium for Personal Lines.
Insurance operating costs and other expenses increased primarily due to a $750 pre-tax pension
settlement charge. Apart from the pension settlement charge, insurance operating costs and other expenses increased by 9%, primarily driven by higher variable incentive plan compensation, increased IT costs in Commercial Lines, higher variable expenses in MutualHartford Funds and $20, before tax, of state guaranty fund assessments in Group Benefits, partially offset by lower direct marketing and operation costs in Personal Lines. Effective with awards granted in March 2017, long-term incentive compensation awards to retirement-eligible employees now fully vest when they are granted, which resulted in an accelerated recognition of compensation expense in 2017 of $22 before-tax.before tax. For additional information on the pension settlement charge in second quarter 2017, see Note 15 - Employee Benefit Plans of Notes to Condensed Consolidated Financial Statements.
Amortization of other intangible assetsincreased by $10 largely due to amortization of identifiable intangible assets recorded as a result of the acquisition of the Aetna U.S. group life and disability business, including in-force contracts, customer relationships and a marketing agreement with Aetna.
Income tax expenseincreased primarily due to a charge of $877 as a result of the Tax Cuts and Jobs Act ("Tax Reform") enacted in December, 2017. Among other changes, Tax Reform reduced the Federal corporate income tax rate from 35% to 21% effective January 1, 2018 which resulted in a reduction of the
Part II - Item 7. Management's Discussion and Analysis of Financial Condition and Results of Operations
Company's net deferred tax assets, including its net operating loss carryovers. Also contributing to the increase in income tax expense were federalFederal income tax benefits of $113 in 2016 arising from investments in solar energy partnerships that generated tax benefits and the effect of a federal income tax benefit of $65 in 2016 related to the sale of the Company's U.K. property and casualty run-off subsidiaries.
Differences between the Company's effective income tax rate and the U.S. statutory rate of 35% are due primarily to the effects of Tax Reform on net deferred tax assets, tax exempt interest earned on invested assets, changes in the valuation allowance recorded on capital loss carryovers and federal tax credits associated with investments in solar energy partnerships. For further discussion of income taxes, see Note 16 - Income Taxes of Notes to Consolidated Financial Statements.
Income (loss) from discontinued operations, net of tax decreased from income of $283 in 2016 to a net loss of $2.9 billion in 2017 with the net loss in 2017 due to a loss on sale of the Company’s life and annuity run-off business of $3.3 billion, partially offset by operating income from discontinued operations of $388. Operating income from discontinued operations increased from $283 in 2016 primarily due to lower net realized capital losses in 2017. Apart from the reduction in net realized capital losses, earnings were relatively flat as an increase in the unlock benefit and lower interest credited were largely offset by lower net investment income and lower fee income due to the continued run-offrun off of the variable annuity block.
Year ended December 31, 2016 compared to the year ended December 31, 2015
Net income decreased primarily due to a loss on a reinsurance transaction covering the Company's asbestos and environmental exposure, an increase in Property & Casualty and Group Benefits incurred losses, especially in Personal Lines, higher net realized capital losses, lower income from discontinued operations and lower mutual funds fee income, partially offset by higher earned premiums, higher net investment income and lower insurance operating costs and other expenses.
Earned premiums increased 2% or $212, before tax, reflecting growth of 2% in Commercial Lines, 1% in Personal Lines and 3% in Group Benefits. For a discussion of the Company's operating results by segment, see MD&A - Results of Operations by segment.
Fee income decreased in 2016 compared to the prior year period, primarily due to lower investment management fees in Mutual Funds as a result of lower daily assets under management.
Net investment incomeincreased, primarily due to higher asset levels partially offset by lower make-whole payments on fixed maturities, as well as reinvesting at lower interest rates. For further discussion of investment results, see the Net Investment Income (Loss) section within MD&A - Investment Results.
Net realized capital losseswere $110 in 2016 an increase from net realized capital losses of $12 in 2015 primarily due to losses associated with the sale of the Company's U.K. property and casualty run-off subsidiaries and a change from net
gains to net losses on non-qualifying derivatives, partially offset by lower impairments and an increase in net realized gains on sale of corporate securities, U.S. Treasury securities, municipal bonds and equity securities. Also contributing to the increase in net realized capital losses was a $96 write-down of an investment in solar energy partnerships that generated tax credits and other tax benefits of $113 in 2016. For further discussion of investment results, see the Net Realized Capital Gains (Losses) section within MD&A - Investment Results,
Benefits, losses and loss adjustment expensesincreased in both Property & Casualty and Group Benefits with the increase in Group Benefits due to the effect of growth in earned premium and higher group life loss severity. The net increase in incurred losses for Property & Casualty was due to:
Losses and loss adjustment expenses before catastrophes and prior accident year development in Property & Casualty increased $259, before tax, primarily resulting from higher personal and commercial auto loss costs and the effect of earned premium growth in Small Commercial and Personal Lines, partially offset by lower workers' compensation loss costs.
Current accident year catastrophe losses of $416, before tax, in 2016, compared to $332, before tax, in 2015. Catastrophe losses in 2016 were primarily due to multiple wind and hail events across various U.S. geographic regions, concentrated in Texas and the central and southern plains and, to a lesser extent, winter storms and Hurricane Matthew. Catastrophe losses in 2015 were primarily due to multiple winter storms and wind and hail events across various U.S. geographic regions as well as tornadoes and wildfires. For additional information, see MD&A - Critical Accounting Estimates, Property & Casualty Insurance Product Reserves.
Unfavorable prior accident year reserve development in Property & Casualty of $457, before tax, in 2016, compared to unfavorable reserve development of $250, before tax, in 2015.
| |
▪ | Prior accident year reserve development in 2016 was primarily due to a $268 increase in asbestos and environmental reserves and a $160 increase in personal auto liability reserves. An increase in asbestos reserves of $197 primarily related to greater than expected mesothelioma claim filings for a small percentage of defendants in specific, adverse jurisdictions. As a result, aggregate indemnity and defense costs have not declined as expected. Environmental reserves increased $71 in 2016 primarily due to deterioration associated with the tendering of new sites for policy coverage, increased defense costs stemming from individual bodily injury liability suits, and increased clean-up costs associated with waterways. Reserves were increased in Personal Lines auto liability for accident years 2014 and 2015, primarily due to higher than expected emerged auto liability frequency and severity. |
| |
▪ | Prior accident year reserve development in 2015 was primarily due to an increase in asbestos reserves of $146 and environmental reserves of $52. For additional information, see MD&A - Critical Accounting Estimates, Reserve Roll-forwards and Development. |
Part II - Item 7. Management's Discussion and Analysis of Financial Condition and Results of Operations
Insurance operating costs and other expenses decreased $118 primarily due to a reduction in direct marketing expenses in Personal Lines.
Loss on extinguishment of debtdecreaseddue to the redemption of $296 aggregate principal amount outstanding of 4.0% senior notes in 2015. There were no early debt extinguishments in 2016.
Loss on reinsurance transaction in 2016 represents paid premium for an asbestos and environmental adverse development cover (“ADC”) reinsurance agreement with NICO, a subsidiary of Berkshire Hathaway Inc. (“Berkshire”), to reduce uncertainty about potential adverse development. For more information on this transaction, see MD&A -Critical Accounting Estimates, Annual Reserve Reviews.
Income tax benefitof $166 in 2016 compared to income tax expense of $289 in 2015, primarily due to a decrease in taxable income and the effect of $113 of federal tax credits and
other tax benefits in 2016 associated with investments in solar energy partnerships, as well as tax benefits in 2016 from the sale of the Company's U.K property and casualty run-off subsidiaries.
Differences between the Company's effective income tax rate and the U.S. statutory rate of 35% are due primarily to tax exempt interest earned on invested assets, changes in the valuation allowance recorded on capital loss carryovers and federal tax credits associated with investments in solar energy partnerships.
Income from discontinued operations, net of tax,decreased from 2015 to 2016 primarily due to lower tax benefits recognized in 2016, a write-off of DAC associated with fixed annuities, lower investment income and a reinsurance gain on disposition in 2015, partially offset by lower net realized capital losses. In addition, the continued run-off of the variable and fixed annuity block resulted in lower fee income, partially offset by lower amortization of DAC and lower insurance operating costs and other expenses.
INVESTMENT RESULTS
| | Composition of Invested Assets | | | December 31, 2017 | December 31, 2016 | December 31, 2018 | | December 31, 2017 |
| | Amount | Percent | Amount | Percent | Amount | Percent | | Amount | Percent |
| Fixed maturities, available-for-sale ("AFS"), at fair value | $ | 36,964 |
| 81.9 | % | $ | 32,182 |
| 80.9 | % | $ | 35,652 |
| 76.2 | % | | $ | 36,964 |
| 81.9 | % |
| Fixed maturities, at fair value using the fair value option ("FVO") | 41 |
| 0.1 | % | 211 |
| 0.5 | % | 22 |
| — | % | | 41 |
| 0.1 | % |
| Equity securities, AFS, at fair value | 1,012 |
| 2.3 | % | 945 |
| 2.4 | % | |
| Equity securities, at fair value [1] | | 1,214 |
| 2.6 | % | |
|
|
|
|
| Equity securities, AFS, at fair value [1] | |
|
|
|
| | 1,012 |
| 2.3 | % |
| Mortgage loans | 3,175 |
| 7.0 | % | 2,886 |
| 7.3 | % | 3,704 |
| 7.9 | % | | 3,175 |
| 7.0 | % |
| Limited partnerships and other alternative investments | 1,588 |
| 3.5 | % | 1,527 |
| 3.8 | % | 1,723 |
| 3.7 | % | | 1,588 |
| 3.5 | % |
| Other investments [1] | 96 |
| 0.2 | % | 111 |
| 0.3 | % | |
| Other investments [2] | | 192 |
| 0.4 | % | | 96 |
| 0.2 | % |
| Short-term investments | 2,270 |
| 5.0 | % | 1,895 |
| 4.8 | % | 4,283 |
| 9.2 | % | | 2,270 |
| 5.0 | % |
| Total investments | $ | 45,146 |
| 100 | % | $ | 39,757 |
| 100 | % | $ | 46,790 |
| 100.0 | % | | $ | 45,146 |
| 100.0 | % |
| |
| [1] | Effective January 1, 2018, with the adoption of new accounting standards for financial instruments, equity securities, AFS were reclassified to equity securities at fair value. |
| |
| [2] | Primarily relates toconsists of investments of consolidated investment funds and derivative instruments.instruments which are carried at fair value. |
Year ended December 31, 20172018 compared to the year ended December 31, 20162017
Total investmentsincreased primarily due to an increase in fixed maturities, AFS, short-term investments and mortgage loans.loans, largely offset by a decrease in fixed maturities, AFS.
Fixed maturities, AFS increaseddecreased primarily due the transfer in of fixed maturities, AFS related to the acquisition of Aetna's U.S. group life and disability business as well as an increasea decrease in valuations due to tighter credit spreads.widening of spreads and higher interest rates.
Short-term investments increased largely as a resultdue to proceeds from the sale of the Company's securities lending agreements. For more information onlife and annuity business sold in May 2018 and holding additional short-term investments in preparation to fund the Company's securities lending agreements, see Note 6 - Investments.Navigators acquisition and debt that matured in January 2019.
Mortgage Loans increased largely due to new originations of commercial mortgage loans within the industrial, multifamily commercial whole loans.and single family markets.
Part II - Item 7. Management's Discussion and Analysis of Financial Condition and Results of Operations
| | Net Investment Income | | | For the years ended December 31, | For the years ended December 31, |
| | 2017 | 2016 | 2015 | 2018 | | 2017 | | 2016 |
| (Before tax) | Amount | Yield [1] | Amount | Yield [1] | Amount | Yield [1] | Amount | Yield [1] | | Amount | Yield [1] | | Amount | Yield [1] |
| Fixed maturities [2] | $ | 1,303 |
| 3.9 | % | $ | 1,319 |
| 4.0 | % | $ | 1,301 |
| 3.9 | % | $ | 1,459 |
| 3.9 | % | | $ | 1,303 |
| 3.9 | % | | $ | 1,319 |
| 4.0 | % |
| Equity securities | 24 |
| 2.8 | % | 22 |
| 3.2 | % | 17 |
| 2.6 | % | 32 |
| 3.1 | % | | 24 |
| 2.8 | % | | 22 |
| 3.2 | % |
| Mortgage loans | 124 |
| 4.1 | % | 116 |
| 4.2 | % | 115 |
| 4.4 | % | 141 |
| 4.1 | % | | 124 |
| 4.1 | % | | 116 |
| 4.2 | % |
| Limited partnerships and other alternative investments | 174 |
| 12.0 | % | 128 |
| 8.6 | % | 130 |
| 8.0 | % | 205 |
| 13.2 | % | | 174 |
| 12.0 | % | | 128 |
| 8.6 | % |
| Other [3] | 49 |
|
| 51 |
|
| 57 |
|
| 20 |
|
| | 49 |
|
| | 51 |
|
|
| Investment expense | (71 | ) |
| (59 | ) |
| (59 | ) |
| (77 | ) |
| | (71 | ) |
| | (59 | ) |
|
| Total net investment income | $ | 1,603 |
| 4.0 | % | $ | 1,577 |
| 4.0 | % | $ | 1,561 |
| 3.9 | % | $ | 1,780 |
| 4.0 | % | | $ | 1,603 |
| 4.0 | % | | $ | 1,577 |
| 4.0 | % |
| Total net investment income excluding limited partnerships and other alternative investments | $ | 1,429 |
| 3.7 | % | $ | 1,449 |
| 3.8 | % | $ | 1,431 |
| 3.8 | % | $ | 1,575 |
| 3.7 | % | | $ | 1,429 |
| 3.7 | % | | $ | 1,449 |
| 3.8 | % |
| |
| [1] | Yields calculated using annualized net investment income divided by the monthly average invested assets at amortized cost as applicable, excluding repurchase agreement and securities lending collateral, if any, and derivatives book value. |
| |
| [2] | Includes net investment income on short-term investments. |
| |
| [3] | Primarily includes income from derivatives that qualify for hedge accounting and hedge fixed maturities. |
Year ended December 31, 2018 compared to the year ended December 31, 2017
Total net investment income increased primarily due to higher income from fixed maturities as a result of higher average asset levels during 2018 as compared to 2017 largely driven by the acquisition of Aetna's U.S. group life and disability business in November 2017. In addition, total net investment
income increased due to higher returns on private equity and real estate limited partnership investments as well as a higher reinvestment rate on fixed maturities.
Annualized net investment income yield,excluding non-routine items which include prepayment penalties on mortgage loans and make-whole payments on fixed maturities, was 3.7% in 2018 up from 3.6% for the same period for 2017.
Part II - Item 7. Management's Discussion and Analysis of Financial Condition and Results of Operations
Average reinvestment rate,excluding certain U.S. Treasury securities and cash equivalent securities, for the year ended December 31, 2018, was approximately 4.0% which was above the average yield of sales and maturities of 3.7% for the same period. For the year ended December 31, 2018, the average reinvestment rate of 4.0% increased from 3.5% for the 2017 period, due to higher interest rates.
We expect the annualized net investment income yield for the 2019 calendar year, excluding limited partnerships and other alternative investments, to approximate the portfolio yield earned in 2018 though it could be higher depending on if reinvestment rates stay above the sales/maturity yield. The estimated impact on net investment income yield is subject to change as the composition of the portfolio changes through portfolio management and changes in market conditions.
Year ended December 31, 2017 compared to the year ended December 31, 2016
Total net investment incomeincreased primarily due to higher income from limited partnerships and other alternative investments, partially offset by lower make-wholemake whole payment income on fixed maturities and increased investment expense. Income from limited partnerships and other alternative investments increased due to higher valuation write-ups of private equity partnerships and strong returns on real estate investments in 2017.
Annualized net investment income yieldexcluding limited partnerships and other alternative investments, was 3.7% in 2017 and 3.8% in 2016. Excluding make-whole payment income on fixed maturities, income received from previously impaired securities, and prepayment penalties on mortgage loans, the annualized investment income yield, excluding limited partnerships and other alternative investments, was 3.6% in 2017 consistent with that of the same period for 2016.
Average reinvestment rateexcluding certain U.S. Treasury securities and cash equivalent securities, for the year ended December 31, 2017, was approximately 3.5% which was
below the average yield of sales and maturities of 3.7% for the same period. For the year ended December 31, 2017, the average reinvestment rate of 3.5% remained consistent with that of the same period in 2016.
We expect the annualized net investment income yield for the 2018 calendar year, excluding limited partnerships and other alternative investments, to be slightly below the portfolio yield earned in 2017. This assumes the Company earns less income in 2018 from make-whole payment income on fixed maturities and recoveries on previously impaired securities than it did in 2017 and that reinvestment rates continue to be below the average yield of sales and maturities. The estimated impact on net investment income is subject to change as the composition of the portfolio changes through portfolio management and changes in market conditions.
Year ended December 31, 2016 compared to the year ended December 31, 2015
Total net investment income increased primarily due to higher asset levels, partially offset by lower make-whole payments on fixed maturities as well as reinvesting at lower interest rates.
Part II - Item 7. Management's Discussion and Analysis of Financial Condition and Results of Operations
| | Net Realized Capital Gains (Losses) | | | For the years ended December 31, | For the years ended December 31, |
| (Before tax) | 2017 | 2016 | 2015 | 2018 | 2017 | 2016 |
| Gross gains on sales | $ | 275 |
| $ | 222 |
| $ | 219 |
| $ | 114 |
| $ | 275 |
| $ | 222 |
|
| Gross losses on sales | (113 | ) | (159 | ) | (194 | ) | (172 | ) | (113 | ) | (159 | ) |
| Net other-than-temporary impairment ("OTTI") losses recognized in earnings [1] | (8 | ) | (27 | ) | (41 | ) | |
| Valuation allowances on mortgage loans [2] | (1 | ) | — |
| (1 | ) | |
| Equity securities [1] | | (48 | ) | — |
| — |
|
| Net other-than-temporary impairment ("OTTI") losses recognized in earnings [2] | | (1 | ) | (8 | ) | (27 | ) |
| Valuation allowances on mortgage loans [3] | | — |
| (1 | ) | — |
|
| Transactional foreign currency revaluation | 14 |
| (78 | ) | — |
| 1 |
| 14 |
| (78 | ) |
| Non-qualifying foreign currency derivatives | (14 | ) | 83 |
| 13 |
| 3 |
| (14 | ) | 83 |
|
| Other, net [3] | 12 |
| (151 | ) | (8 | ) | |
| Other, net [4] | | (9 | ) | 12 |
| (151 | ) |
| Net realized capital gains (losses) | $ | 165 |
| $ | (110 | ) | $ | (12 | ) | $ | (112 | ) | $ | 165 |
| $ | (110 | ) |
| |
| [1] | Effective January 1, 2018. with the adoption of new accounting standards for equity securities at fair value, includes all changes in fair value and trading gains and losses for equity securities. |
| |
| [2] | See Other-Than-Temporary Impairments within the Investment Portfolio Risks and Risk Management section of the MD&A. |
| |
[2]3] | See Valuation Allowances on Mortgage Loans within the Investment Portfolio Risks and Risk Management section of the MD&A. |
| |
[3]4] | Primarily consists of changes in value of non-qualifying derivatives, including credit derivatives and interest rate derivatives used to manage duration. Also included for the year ended December 31, 2016, is a loss related to the write-down of investments in solar energy partnerships, which generated tax benefits, and a loss related to the sale of the Company's U.K. property and casualty run-off subsidiaries. |
Year ended December 31, 20172018
Gross gains and losses on saleswere primarily the result of sector repositioning and duration, liquidity and credit management within corporate securities, U.S. treasury securities and tax-exempt municipal bonds.
Equity securitiesnet losses were driven by depreciation of equity securities due to lower equity market levels, partially offset by gains on sales due to tactical repositioning.
Other, net losses included losses of $11 related to credit derivatives due to credit spread widening.
Year ended December 31, 2017
Gross gains and losses on saleswere primarily a result of duration, liquidity and credit management within corporate securities, U.S. treasury securities, equity securities, and tax-exempt municipal bonds.
Other, net gain included gains of $21 related to credit derivatives due to credit spread tightening, partially offset by losses of $7 related to equity derivatives hedging against the
impact of a decline in the equity market on the investment portfolio.
Year ended December 31, 2016
Gross gains and losses on saleswere primarily a result of duration, liquidity and credit management within corporate securities, U.S. treasury securities, equity securities, and tax-exempt municipal and equity securities.bonds.
Other, net loss included losses of $96 related to the write-down of investments in solar energy partnerships that generated solar tax credits and losses of $81 associated with the Company's U.K. property and casualty run-off subsidiaries that were sold in May 2017. For further information related to the investment in solar energy partnerships and resulting solar tax credits, refer to Note 16 - Income Taxes of Notes to Consolidated Financial Statements. In addition, there were losses of $15 related to equity derivatives which were hedging against the impact of a decline in the equity market on the investment portfolio.
Year ended December 31, 2015
Gross gains and losses on sales were primarily a
result of duration, liquidity and credit management, as well as
tactical changes to the portfolio as a result of changing market
conditions. This included sales to reduce exposure to energy,
emerging markets and below investment grade corporate
securities as well as sales within corporate, U.S. treasury and
equity securities.
Other, net losses were primarily related to losses of $7 on credit derivatives driven by widening credit spreads.
Part II - Item 7. Management's Discussion and Analysis of Financial Condition and Results of Operations
CRITICAL ACCOUNTING ESTIMATES
The preparation of financial statements in conformity with U.S. GAAP requires management to make estimates and assumptions that affect the reported amounts of assets and liabilities and disclosure of contingent assets and liabilities at the date of the financial statements and the reported amounts of revenues and expenses during the reporting period. Actual results could differ, and in the past have differed, from those estimates.
The Company has identified the following estimates as critical in that they involve a higher degree of judgment and are subject to a significant degree of variability:
property and casualty insurance product reserves, net of reinsurance;
group benefit long-term disability (LTD) reserves, net of reinsurance;
evaluation of goodwill for impairment;
valuation of investments and derivative instruments including evaluation of other-than-temporary impairments on available-for-sale securities and valuation allowances on mortgage loans;
valuation allowance on deferred tax assets; and
contingencies relating to corporate litigation and regulatory matters.
Certain of these estimates are particularly sensitive to market conditions, and deterioration and/or volatility in the worldwide debt or equity markets could have a material impact on the Consolidated Financial Statements. In developing these estimates
management makes subjective and complex judgments that are inherently uncertain and subject to material change as facts and circumstances develop. Although variability is inherent in these estimates, management believes the amounts provided are appropriate based upon the facts available upon compilation of the financial statements.
Part II - Item 7. Management's Discussion and Analysis of Financial Condition and Results of Operations
Property & Casualty Insurance Product Reserves
P&C Loss and Loss Adjustment Expense Reserves,
Net of Reinsurance, by Segment as of December 31, 20172018
Loss and LAE Reserves, Net of Reinsurance as of December 31, 20172018
| | | | Commercial Lines | Personal Lines | Property & Casualty Other Operations | Total Property & Casualty Insurance | % Total Reserves-net | Commercial Lines | Personal Lines | Property & Casualty Other Operations | Total Property & Casualty Insurance | % Total Reserves-net |
| Workers’ compensation | $ | 9,600 |
| $ | — |
| $ | — |
| $ | 9,600 |
| 48.4% | $ | 10,005 |
| $ | — |
| $ | — |
| $ | 10,005 |
| 49.2% |
| General liability | 2,167 |
| — |
| — |
| 2,167 |
| 10.9% | 2,276 |
| — |
| — |
| 2,276 |
| 11.2% |
| Package business [1] | 1,500 |
| — |
| — |
| 1,500 |
| 7.6% | 1,609 |
| — |
| — |
| 1,609 |
| 7.9% |
| Commercial property | 390 |
| — |
| — |
| 390 |
| 2.0% | 384 |
| — |
| — |
| 384 |
| 1.9% |
| Automobile liability | 927 |
| 1,707 |
| — |
| 2,634 |
| 13.3% | 878 |
| 1,652 |
| — |
| 2,530 |
| 12.4% |
| Automobile physical damage | 13 |
| 32 |
| — |
| 45 |
| 0.2% | 13 |
| 40 |
| — |
| 53 |
| 0.3% |
| Professional liability | 561 |
| — |
| — |
| 561 |
| 2.8% | 578 |
| — |
| — |
| 578 |
| 2.8% |
| Bond | 286 |
| — |
| — |
| 286 |
| 1.4% | 290 |
| — |
| — |
| 290 |
| 1.4% |
| Homeowners | — |
| 471 |
| — |
| 471 |
| 2.4% | — |
| 642 |
| — |
| 642 |
| 3.2% |
| Asbestos and environmental | 116 |
| 11 |
| 1,325 |
| 1,452 |
| 7.3% | 108 |
| 11 |
| 1,135 |
| 1,254 |
| 6.2% |
| Assumed reinsurance | — |
| — |
| 122 |
| 122 |
| 0.6% | — |
| — |
| 113 |
| 113 |
| 0.6% |
| All other | 186 |
| 2 |
| 402 |
| 590 |
| 3.0% | 177 |
| 3 |
| 438 |
| 618 |
| 3.0% |
| Total reserves-net | 15,746 |
| 2,223 |
| 1,849 |
| 19,818 |
| 100.0% | 16,318 |
| 2,348 |
| 1,686 |
| 20,352 |
| 100.0% |
| Reinsurance and other recoverables | 3,147 |
| 71 |
| 739 |
| 3,957 |
| | 3,137 |
| 108 |
| 987 |
| 4,232 |
| |
| Total reserves-gross | $ | 18,893 |
| $ | 2,294 |
| $ | 2,588 |
| $ | 23,775 |
| | $ | 19,455 |
| $ | 2,456 |
| $ | 2,673 |
| $ | 24,584 |
| |
| |
| [1] | Commercial Lines policy packages that include property and general liability coverages are generally referred to as the package line of business. |
For descriptions of the coverages provided under the lines of
Part II - Item 7. Management's Discussion and Analysis of Financial Condition and Results of Operations
business shown above, see Part I - Item1, Business.
Overview of Reserving for Property and Casualty Insurance Claims
It typically takes many months or years to pay claims incurred under a property and casualty insurance product; accordingly, the Company must establish reserves at the time the loss is incurred. Most of the Company’s policies provide for occurrence-based
coverage where the loss is incurred when a claim event happens like an automobile accident, house or building fire or injury to an employee under a workers’ compensation policy. Some of the Company's policies, mostly for directors and officers insurance and errors and omissions insurance, are claims-made policies where the loss is incurred in the period the claim event is reported to the Company even if the loss event itself occurred in an earlier period.
Part II - Item 7. Management's Discussion and Analysis of Financial Condition and Results of Operations
Loss and loss adjustment expense reserves provide for the estimated ultimate costs of paying claims under insurance policies written by the Company, less amounts paid to date. These reserves include estimates for both claims that have been reported and those that have not yet been reported, and include estimates of all expenses associated with processing and settling these claims. Incurred but not reported (“IBNR”) reserves represent the difference between the estimated ultimate cost of all claims and the actual loss and loss adjustment expenses reported to the Company by claimants (“reported losses”). Reported losses represent cumulative loss and loss adjustment expenses paid plus case reserves for outstanding reported claims. Company actuaries evaluate the total reserves (IBNR and case reserves) on an accident year basis. An accident year is the calendar year in which a loss is incurred, or, in the case of claims-made policies, the calendar year in which a loss is reported.
Factors that Change Reserve Estimates-Reserve estimates can change over time because of unexpected changes in the external environment. Inflation in medical care, hospital care, automobile parts, wages and home and building repair would cause claims to settle for more than they are initially reserved. Changes in the economy can cause an increase or decrease in the number of reported claims (claim frequency). For example, an improving economy could result in more automobile miles driven and a higher number of automobile reported claims, whileor a contracting economychange in economic conditions can sometimes lead to an increase inmore or less workers’ compensation reported claims. An increase in the number or percentage of claims litigated can increase the average settlement amount per claim (claim severity). Changes in the judicial environment can affect interpretations of damages and how policy coverage applies which could increase or decrease claim severity. Over time, judges or juries in certain jurisdictions may be more inclined to determine liability and award damages. New legislation can also change how damages are defined resulting in greater frequency or severity. In addition, new types of injuries may arise from exposures not contemplated when the policies were written. Past examples include pharmaceutical products, silica, lead paint, molestation or abuse and construction defects.
Reserve estimates can also change over time because of changes in internal Company operations. A delay or acceleration in handling claims may signal a need to increase or reduce reserves from what was initially estimated. New lines of business may have loss development patterns that are not well established. Changes in the geographic mix of business, changes in the mix of business
by industry and changes in the mix of business by policy limit or deductible can increase the risk that losses will ultimately develop differently than the loss development patterns assumed in our reserving. In addition, changes in the quality of risk selection in underwriting and changes in interpretations of policy language could increase or decrease ultimate losses from what was assumed in establishing the reserves.
In the case of assumed reinsurance, all of the above risks apply. The Company assumes insurance risk from certain pools and associations and, prior to 2004, assumed property and casualty risks from other insurance companies. Changes in the case reserving and reporting patterns of insurance companies ceding to The Hartford can create additional uncertainty in estimating the reserves. Due to the inherent complexity of the assumptions used, final claim settlements may vary significantly from the
present estimates of direct and assumed reserves, particularly when those settlements may not occur until well into the future.
Reinsurance Recoverables-Through both facultative and treaty reinsurance agreements, the Company cedes a share of the risks it has underwritten to other insurance companies. The Company records reinsurance recoverables for loss and loss adjustment expenses ceded to its reinsurers representing the anticipated recovery from reinsurers of unpaid claims, including IBNR.
The Company estimates the portion of losses and loss adjustment expenses to be ceded based on the terms of any applicable facultative and treaty reinsurance, including an estimate of how IBNR for losses will ultimately be ceded.
The Company provides an allowance for uncollectible reinsurance, reflecting management’s best estimate of reinsurance cessions that may be uncollectible in the future due to reinsurers’ unwillingness or inability to pay. The estimated allowance considers the credit quality of the Company's reinsurers, recent outcomes in arbitration and litigation in disputes between reinsurers and cedants and recent communication activity between reinsurers and cedants that may signal how the Company’s own reinsurance claims may settle. Where its reinsurance contracts permit, the Company secures funding of future claim obligations with various forms of collateral, including irrevocable letters of credit, secured trusts, funds held accounts and group-wide offsets. The allowance for uncollectible reinsurance was $104$126 as of December 31, 2017,2018, comprised of $18$20 related to Commercial Lines, $1 related to Personal Lines and $86$105 related to Property & Casualty Other Operations.
The Company’s estimate of reinsurance recoverables, net of an allowance for uncollectible reinsurance, is subject to similar risks and uncertainties as the estimate of the gross reserve for unpaid losses and loss adjustment expenses for direct and assumed exposures.
Review of Reserve Adequacy-The Hartford regularly reviews the appropriateness of reserve levels at the line of business or more detailed level, taking into consideration the variety of trends that impact the ultimate settlement of claims. For Property & Casualty Other Operations, asbestos and environmental (“A&E”) reserves are reviewed by type of event rather than by line of business.
Reserve adjustments, which may be material, are reflected in the operating results of the period in which the adjustment is
Part II - Item 7. Management's Discussion and Analysis of Financial Condition and Results of Operations
determined to be necessary. In the judgment of management, information currently available has been properly considered in establishing the reserves for unpaid losses and loss adjustment expenses and in recording the reinsurance recoverables for ceded unpaid losses.
Reserving Methodology
For a discussion of how A&E reserves are set, see MD&A - P&C Insurance Product Reserves, Reserving for Asbestos and Environmental Claims within Property & Casualty Other Operations. The following is a discussion of the reserving methods used for the Company's property and casualty lines of business other than asbestos and environmental.
How Reserves Are Set-Reserves are set by line of business within the operating segments. A single line of business
Part II - Item 7. Management's Discussion and Analysis of Financial Condition and Results of Operations
may be written in more than one segment. Case reserves are established by a claims handler on each individual claim and are adjusted as new information becomes known during the course of handling the claim. Lines of business for which reported losses emerge over a long period of time are referred to as long-tail lines of business. Lines of business for which reported losses emerge more quickly are referred to as short-tail lines of business. The Company’s shortest-tail lines of business are homeowners, commercial property and automobile physical damage. The longest tail lines of business include workers’ compensation, general liability, professional liability and assumed reinsurance. For short-tail lines of business, emergence of paid loss and case reserves is credible and likely indicative of ultimate losses. For long-tail lines of business, emergence of paid losses and case reserves is less credible in the early periods after a given accident year and, accordingly, may not be indicative of ultimate losses.
Use of Actuarial Methods and Judgments-The Company’s reserving actuaries regularly review reserves for both current and prior accident years using the most current claim data. A variety of actuarial methods and judgments are used for most lines of business to arrive at selections of estimated ultimate losses and loss adjustment expenses.These In 2018, new methods were added to inform these selections where appropriate. The reserve selections incorporate input, as appropriate, from claims personnel, pricing actuaries and operating management about reported loss cost trends and other factors that could affect the reserve estimates. Most reserves are reviewed fully each quarter, including loss and loss adjustment expense reserves for homeowners, commercial property, automobile physical damage, automobile liability, package property business, and workers’ compensation,compensation. Other reserves, including most general liability and professional liability. Otherliability lines, are reviewed semi-annually. Certain additional reserves are also reviewed semi-annually (twice per year) or annually. These primarily includeannually, including reserves for losses incurred in accident years older than twelve years for Personal Lines and older than twenty years for Commercial Lines, as well as reserves for bond, assumed reinsurance, latent exposures such as construction defects, and unallocated loss adjustment expenses. For reserves that are reviewed semi-annually or annually, management monitors the emergence of paid and reported losses in the intervening quarters and, if necessary, performs a reserve review to determine whether the reserve estimate should change.
An expected loss ratio is used in initially recording the reserves for both short-tail and long-tail lines of business. This expected
loss ratio is determined by starting with the average loss ratio of recent prior accident years and adjusting that ratio for the effect of expected changes to earned pricing, loss frequency and severity, mix of business, ceded reinsurance and other factors. For short-tail lines, IBNR for the current accident year is initially recorded as the product of the expected loss ratio for the period, earned premium for the period and the proportion of losses expected to be reported in future calendar periods for the current accident period. For long-tailed lines, IBNR reserves for the current accident year are initially recorded as the product of the expected loss ratio for the period and the earned premium for the period, less reported losses for the period.
As losses emerge or develop in periods subsequent to a given accident year, reserving actuaries use other methods to estimate ultimate unpaid losses in addition to the expected loss ratio method. These primarily include paid and reported loss development methods, frequency/severity techniques and the Bornhuetter-Ferguson method (a combination of the expected loss ratio and paid development or reported development method). Within any one line of business, the methods that are given more influence vary based primarily on the maturity of the accident year, the mix of business and the particular internal and external influences impacting the claims experience or the methods. The output of the reserve reviews are reserve estimates that are referred to herein as the “actuarial indication”.
Reserve Discounting-Most of the Company’s property and casualty insurance product reserves are not discounted. However, the Company has discounted liabilities funded through structured settlements and has discounted certain reserves for indemnity payments due to permanently disabled claimants under workers’ compensation policies. For further discussion of these discounted liabilities, see Note 1 - Basis of Presentation and Significant Accounting Policies of Notes to Consolidated Financial Statements.
Differences Between GAAP and Statutory Basis Reserves-As of December 31, 20172018 and 2016,2017, U.S. property and casualty insurance product reserves for losses and loss adjustment expenses, net of reinsurance recoverables, reported under U.S. GAAP were approximately equal toless than net reserves reported on a statutory basis. The primary difference between the statutory and GAAP reserve amounts is due to a reinsurance recoverable on ceded asbestos and environmental ADC which isadverse reserve development under a retroactive reinsurance agreement between the Company and NICO thatNational Indemnity Company ("NICO"), a subsidiary of Berkshire Hathaway Inc. ("Berkshire"), which is not included in insuranceas a reduction of other liabilities for statutory accounting. This difference is largely offset by liabilities for unpaid losses for permanently disabled workers’ compensation claimants discounted under U.S. GAAP at rates that are no higher than risk-free interest rates in effect at the time the claims are incurred which can vary from the statutory discount rates set by regulators. In addition, a portion of the U.S. GAAP provision for uncollectible reinsurance is not recognized under statutory accounting.
Reserving Methods by Line of Business-Apart from A&E which is discussed in the following section on Property & Casualty Other Operations, below is a general discussion of which reserving methods are preferred by line of business. Because the actuarial estimates are generated at a much finer level of detail than line of business (e.g., by distribution channel, coverage, accident period), other methods than those described for the line of business may also be employed for a coverage and accident year within a line of business. Also, as circumstances change, the methods that are given more influence will change.
Part II - Item 7. Management's Discussion and Analysis of Financial Condition and Results of Operations
Preferred Reserving Methods by Line of Business
|
| |
| Commercial property, homeowners and automobile physical damage | These short-tailed lines are fast-developing and paid and reported development techniques are used as these methods use historical data to develop paid and reported loss development patterns, which are then applied to cumulative paid and reported losses by accident period to estimate ultimate losses. In addition to paid and reported development methods, for the most immature accident months, the Company uses frequency and severity techniques and the initial expected loss ratio. The advantage of frequency/severity techniques is that frequency estimates are generally easier to predict and external information can be used to supplement internal data in estimating average severity. |
| Personal automobile liability | For automobile liability, and bodily injury in particular, the Company performs a greater number of techniques than it does for commercial property, homeowners and automobile physical damage. In addition to traditional paid and reported development methods, the Company relies on frequency/severity techniques and Berquist-Sherman techniques. Because the paid development technique is affected by changes in claim closure patterns and the reported development method is affected by changes in case reserving practices, the Company uses Berquist-Sherman techniques which adjust these patterns to reflect current settlement rates and case reserving practices. The Company generally uses the reported development method for older accident years and a combination of reported development, frequency/severity and Berquist-Sherman methods for more recent accident years. For older accident periods, reported losses are a good indicator of ultimate losses given the high percentage of ultimate losses reported to date. For more recent periods, the frequency/severity techniques are not affected as much by changes in case reserve practices and changing disposal rates and the Berquist-Sherman techniques specifically adjust for these changes. |
Automobile liability for commercial lines and short-tailed general liability | For older, more mature accident years, the Company primarily uses reported development techniques. For more recent accident years, the Company typically prefers frequency / relies on several methods that incorporate expected loss ratios, reported loss development, paid loss development, frequency/severity, techniques. These techniques separately analyze losses abovecase reserve adequacy, and below a capping level (average severity) as larger claims typically behave differently than smaller claims.claim settlement rates. |
| Professional liability | Reported and paid loss development patterns for this line tend to be volatile. Therefore, the Company typically relies on frequency and severity techniques. |
Long-tailed generalGeneral liability, bond and large deductible workers’ compensation | For these long-tailed lines of business, the Company generally relies on the expected loss ratio and reported development techniques. The Company generally weights these techniques together, relying more heavily on the expected loss ratio method at early ages of development and more on the reported development method as an accident year matures. |
| Workers’ compensation | Workers’ compensation is the Company’s single largest reserve line of business and a wide range of methods are used. Methods include paid and reported development techniques, the expected loss ratio and Bornhuetter-Ferguson methods, and an in-depth analysis on the largest states. In recent years, we have seen an acceleration of paid losses relative to historical patterns and have adjusted our expected loss development patterns accordingly. This acceleration has largely beenis due to two factors. First, in more recent accident years, we have seen a higher concentration of first dollar workers' compensation business and less excess of loss business resulting in fewer longer-tailed, excess workers' compensation claims. Second, the Company has seen an increase in lump sum settlements to claimants across multiple accident years. Adjusting for the effect of an acceleration in payments compared to historical patterns, paid loss development techniques are generally preferred for the workers' compensation line, particularly for more mature accident years. For less mature accident years, the Company places greater reliance on the expected loss ratio and reported development methods, open claim approaches, and state-by-state analysis.methods. |
| Assumed reinsurance and all other | For these lines, the Company tends to rely mostly on reported development techniques. In assumed reinsurance, assumptions are influenced by information gained from claim and underwriting audits. |
| Allocated loss adjustment expenses (ALAE) | For some lines of business (e.g., professional liability and assumed reinsurance), ALAE and losses are analyzed together. For most lines of business, however, ALAE is analyzed separately, using paid development techniques and a ratio of paid ALAE to paid loss is applied to loss reserves to estimate unpaid ALAE. |
| Unallocated loss adjustment expenses (ULAE) | ULAE is analyzed separately from loss and ALAE. For most lines of business, incurred ULAE costs to be paid in the future are projected based on an expected claim handling cost per claim year, the anticipated claim closure pattern and the ratio of paid ULAE to paid loss is applied to estimated unpaid losses. |
In the final step of the reserve review process, senior reserving actuaries and senior management apply their judgment to determine the appropriate level of reserves considering the actuarial indications and other factors not contemplated in the actuarial indications. Those factors include, but are not limited to, the assessed reliability of key loss trends and assumptions used in the current actuarial indications, the maturity of the accident year, pertinent trends observed over the recent past, the level of volatility within a particular line of business, and the improvement or deterioration of actuarial indications in the current period as compared to the prior periods. The Company also considers the magnitude of the difference between the actuarial indication and the recorded reserves. As of December 31, 2018, recorded reserves were above the actuarial indications by an amount comparable with December 31, 2017.
Based on the results of the quarterly reserve review process, the Company determines the appropriate reserve adjustments, if any,
to record. In general, adjustments are made more quickly to more mature accident years and less volatile lines of business. Such
adjustments of reserves are referred to as “prior accident year development”. Increases in previous estimates of ultimate loss costs are referred to as either an increase in prior accident year reserves or as unfavorable reserve development. Decreases in previous estimates of ultimate loss costs are referred to as either a decrease in prior accident year reserves or as favorable reserve development. Reserve development can influence the comparability of year over year underwriting results.
Total recorded net reserves, excluding asbestos and environmental, were 4.7% higher than the actuarial indication of the reserves as of December 31, 2017.
Part II - Item 7. Management's Discussion and Analysis of Financial Condition and Results of Operations
For a discussion of changes to reserve estimates recorded in 2017,2018, see the Reserve Development section below.
Current Trends Contributing to Reserve Uncertainty
The Hartford is a multi-line company in the property and casualty insurance business. The Hartford is therefore subject to reserve uncertainty stemming from changes in loss trends and other conditions which could become material at any point in time. As market conditions and loss trends develop, management must
Part II - Item 7. Management's Discussion and Analysis of Financial Condition and Results of Operations
assess whether those conditions constitute a long-term trend that should result in a reserving action (i.e., increasing or decreasing the reserve).
Difficult to Estimate Tort Exposures-General liability-Within Commercial Lines and Property & Casualty Other Operations, the Company has exposure to general liability claims, including from bodily injury, property damage and product liability. Reserves for these exposures can be particularly difficult to estimate due to the long development pattern and uncertainty about how cases will settle. In particular, the Company has exposure to bodily injury claims as athat is the result of long-term or continuous exposure to harmful products or substances. Examples include, but are not limited to, pharmaceutical products, silica, talcum powder, head injuries and lead paint. The Company also has exposure to claims from construction defects, where property damage or bodily injury from negligent construction is alleged. In addition, the Company has exposure to claims asserted against religious institutions and other organizations relating to molestation or abuse. Such exposures may involve potentially long latency periods and may implicate coverage in multiple policy periods. These factors make reserves for such claims more uncertain than other bodily injury or property damage claims. With regard to these exposures, the Company monitors trends in litigation, the external environment, the similarities to other mass torts and the potential impact on the Company’s reserves.
Standard Commercial Lines-In standardWorkers’ compensation- Included in middle market and specialty commercial, lines, workers’ compensation is the Company’s single biggest line of business and the property and casualty line of business with the longest pattern of loss emergence. To the extent that patterns in the frequency of settlement payments deviate from historical patterns, loss reserve estimates would be less reliable. Medical costs make up more thanapproximately 50% of workers’ compensation payments. As such, reserve estimates for workers’ compensation are particularly sensitive to changes in medical inflation, the changing use of medical care procedures and changes in state legislative and regulatory environments. In addition, a deteriorating economic environment can reduce the ability of an injured worker to return to work and lengthen the time a worker receives disability benefits.
Specialty Lines-In Within specialty lines, many lines of insurance are “long-tail”, including large deductible workers’ compensation insurance; as such, reserve estimates for these lines are more difficult to determine than reserve estimates for shorter-tail lines of insurance. Reservescommercial, reserves for large deductible workers’ compensation insurance require estimating losses attributable to the deductible amount that will be paid by the insured; if such losses are not paid by the insured due to financial difficulties, the Company is contractually liable.
Commercial Lines automobile-Uncertainty in estimated claim severity causes reserve variability for commercial automobile losses including reserve variability due to changes in internal claim handling and case reserving practices as well as due to changes in the external environment. Another example of reserve variability is with directors’
Directors' and officers’ insurance where uncertaintyofficers' insurance-Uncertainty regarding the number and severity of class action
suits can result in reserve volatility.volatility for both directors' and officers' insurance claims. Additionally, the Company’s exposure to losses under directors’ and officers’ insurance policies is primarily in excess layers, making estimates of loss more complex.
Personal Lines-Lines automobile-In Personal Lines, while claims emerge over relatively shorter periods, estimates can still vary due to a number of factors, including uncertain estimates of frequency and severity trends.trends, particularly for auto liability
claims. Severity trends are affected by changes in internal claim handling and case reserving practices as well as by changes in the external environment. Changes in claim practices increase the uncertainty in the interpretation of case reserve data, which increases the uncertainty in recorded reserve levels. Severity trends have increased in recent accident years, in part driven by more expensive parts associated with new automobile technology, causing additional uncertainty about the reliability of past patterns. In addition, the introduction of new products and class plans has led to a different mix of business by type of insured than the Company experienced in the past. Such changes in mix increase the uncertainty of the reserve projections, since historical data and reporting patterns may not be applicable to the new business.
Impact of Key Assumptions on Reserves
As stated above, the Company’s practice is to estimate reserves using a variety of methods, assumptions and data elements within its reserve estimation process for reserves other than asbestos and environmental.process. The Company does not consistently use statistical loss distributions or confidence levels around its reserve estimate and, as a result, does not disclose reserve ranges.
Across most lines of business, the most important reserve assumptions are future loss development factors applied to paid or reported losses to date. The trend in loss cost frequency and severity is also a key assumption, particularly in the most recent accident years, where loss development factors are less credible.
The following discussion discloses possible variation from current estimates of loss reserves due to a change in certain key indicators of potential losses. For automobile liability lines in both Personal Lines and Commercial Lines, the key indicator is the annual loss cost trend, particularly the severity trend component of loss costs. For workers’ compensation and general liability, loss development patterns are a key indicator, particularly for more mature accident years. For workers’ compensation, paid loss development patterns have been impacted by medical cost inflation and other changes in loss cost trends. For general liability, loss development patterns have been impacted by, among other things, emergence of new types of claims (e.g., construction defect claims) and a shift in the mixture between smaller, more routine claims and larger, more complex claims.
Each of the impacts described below is estimated individually, without consideration for any correlation among key indicators or among lines of business. Therefore, it would be inappropriate to take each of the amounts described below and add them together in an attempt to estimate volatility for the Company’s reserves in total. For any one reserving line of business, the estimated variation in reserves due to changes in key indicators is a reasonable estimate of possible variation that may occur in the future, likely over a period of several calendar years. The variation discussed is not meant to be a worst-case scenario, and, therefore, it is possible that future variation may be more than the amounts discussed below.
Part II - Item 7. Management's Discussion and Analysis of Financial Condition and Results of Operations
therefore, it is possible that future variation may be more than the amounts discussed below.
|
| | | |
| | Possible Change in Key Indicator | Reserves, Net of Reinsurance December 31, 20172018 | Estimated Range of Variation in Reserves |
Personal Automobile Liability | +/- 2.52.5. points to the annual assumed change in loss cost severity for the two most recent accident years | $1.7 billion | +/- $80 |
| Commercial Automobile Liability | +/- 2.5 points to the annual assumed change in loss cost severity for the two most recent accident years | $0.9 billion | +/- $20 |
| Workers' Compensation | 2%2.0% change in paid loss development patterns | $9.610.0 billion | +/- $400 |
| General Liability | 10% change in reported loss development patterns | $2.22.3 billion | +/- $200 |
Reserving for Asbestos and Environmental Claims
How A&E Reserves are Set- The process for establishing reserves for asbestos and environmental claims first involves estimating the required reserves gross of ceded reinsurance and then estimating reinsurance recoverables. In establishing reserves for gross asbestos claims, the Company evaluates its insureds’ estimated liabilities for such claims by examining exposures for individual insureds and assessing how coverage applies. The Company considers a variety of factors, including the jurisdictions where underlying claims have been brought, past, pending and anticipated future claim activity, the level of plaintiff demands, disease mix, past settlement values of similar claims, dismissal rates, allocated loss adjustment expense, and potential bankruptcy impact.impact of other defendants being in bankruptcy.
Similarly, the Company reviews exposures to establish gross environmental reserves. The Company considers several factors in estimating environmental liabilities, including historical values of similar claims, the number of sites involved, the insureds’ alleged activities at each site, the alleged environmental damage, the respective shares of liability of potentially responsible parties, the appropriateness and cost of remediation, the nature of governmental enforcement activities or mandated remediation efforts and potential bankruptcy impact.impact of other defendants being in bankruptcy.
After evaluating its insureds’ probable liabilities for asbestos and/or environmental claims, the Company evaluates the insurance coverage in place for such claims. The Company considers its insureds’ total available insurance coverage, including the coverage issued by the Company. The Company also considers
relevant judicial interpretations of policy language, the nature of how policy limits are enforced on multi-year policies and applicable coverage defenses or determinations, if any.
The estimated liabilities of insureds and the Company’s exposure to the insureds depends heavily on an analysis of the relevant legal issues and litigation environment. This analysis is conducted by the Company’s lawyers and is subject to applicable privileges.
For both asbestos and environmental reserves, the Company also analyzes its historical paid and reported losses and expenses year by year, to assess any emerging trends, fluctuations or characteristics suggested by the aggregate paid and reported activity. The historical losses and expenses are analyzed on both a direct basis and net of reinsurance.
Once the gross ultimate exposure for indemnity and allocated loss adjustment expense is determined for its insureds by each policy year, the Company calculates its ceded reinsurance projection based on any applicable facultative and treaty reinsurance and the Company’s experience with reinsurance collections. See the section that follows entitled Adverse Development Cover that discusses the impact the reinsurance agreement with NICO may have on future adverse development of asbestos and environmental reserves, if any.
Uncertainties Regarding Adequacy of A&E Reserves-A number of factors affect the variability of estimates for gross asbestos and environmental reserves including assumptions with respect to the frequency of claims, the average severity of those claims settled with payment, the dismissal rate of claims with no payment, resolution of coverage disputes with our policyholders and the expense to indemnity ratio. Reserve estimates for gross asbestos and environmental reserves are subject to greater variability than reserve estimates for more traditional exposures.
The process of estimating asbestos and environmental reserves remains subject to a wide variety of uncertainties, which are detailed in Note 14 - Commitments and Contingencies of Notes to Consolidated Financial Statements. The Company believes that its current asbestos and environmental reserves are appropriate. While futureFuture developments could cause the Company to change its estimates of its gross asbestos and environmental reserves and if cumulative ceded losses under the adverse development cover (“ADC”) with NICO will likely lessenexceed the effect that these changes would have on the Company's consolidated operating resultsceded premium paid of $650, there could be significant variability in net income due to timing differences between when gross reserves are increased and liquidity.when reinsurance recoveries are recognized. Consistent with past practice, the Company will continue to monitor its reserves in Property & Casualty Other Operations regularly, including its annual reviews of asbestos liabilities, reinsurance recoverables, the allowance for uncollectible reinsurance, and environmental liabilities. Where future developments indicate, we will make appropriate adjustments to the reserves at that time. In 2018 and 2017, the Company completed the comprehensive annual review of asbestos and environmental reserves during the fourth quarter, instead of the second quarter as it had done in previous years.
Total P&C Insurance Product Reserves Development
In the opinion of management, based upon the known facts and current law, the reserves recorded for the Company’s property and casualty insurance products at December 31, 20172018 represent the Company’s best estimate of its ultimate liability for losses and loss adjustment expenses related to losses covered by policies written by the Company. However, because of the significant
Part II - Item 7. Management's Discussion and Analysis of Financial Condition and Results of Operations
uncertainties surrounding reserves, it is possible that management’s estimate of the ultimate liabilities for these claims may change in the future and that the required adjustment to
currently recorded reserves could be material to the Company’s results of operations and liquidity.
Roll-forwardRollforward of Property and Casualty Insurance Product Liabilities for Unpaid Losses and LAE for the Year Ended December 31, 20172018
| | | | Commercial Lines | Personal
Lines | Property & Casualty Other Operations | Total Property & Casualty Insurance | Commercial Lines | Personal
Lines | Property & Casualty Other Operations | Total Property & Casualty Insurance |
| Beginning liabilities for unpaid losses and loss adjustment expenses, gross [1] | $ | 17,950 |
| $ | 2,094 |
| $ | 2,501 |
| $ | 22,545 |
| |
| Reinsurance and other recoverables [1] | 3,037 |
| 25 |
| 426 |
| 3,488 |
| |
| Beginning liabilities for unpaid losses and loss adjustment expenses, gross | | $ | 18,893 |
| $ | 2,294 |
| $ | 2,588 |
| $ | 23,775 |
|
| Reinsurance and other recoverables | | 3,147 |
| 71 |
| 739 |
| 3,957 |
|
| Beginning liabilities for unpaid losses and loss adjustment expenses, net | 14,913 |
| 2,069 |
| 2,075 |
| 19,057 |
| 15,746 |
| 2,223 |
| 1,849 |
| 19,818 |
|
| Provision for unpaid losses and loss adjustment expenses | | |
| Current accident year before catastrophes | 3,961 |
| 2,584 |
| — |
| 6,545 |
| 4,037 |
| 2,249 |
| — |
| 6,286 |
|
| Current accident year catastrophes | 383 |
| 453 |
| — |
| 836 |
| |
| Prior accident year development | (22 | ) | (37 | ) | 18 |
| (41 | ) | |
| Current accident year ("CAY") catastrophes | | 275 |
| 546 |
| — |
| 821 |
|
| Prior accident year development ("PYD") | | (200 | ) | (32 | ) | 65 |
| (167 | ) |
| Total provision for unpaid losses and loss adjustment expenses | 4,322 |
| 3,000 |
| 18 |
| 7,340 |
| 4,112 |
| 2,763 |
| 65 |
| 6,940 |
|
| Less: payments | 3,489 |
| 2,846 |
| 244 |
| 6,579 |
| 3,540 |
| 2,638 |
| 228 |
| 6,406 |
|
| Ending liabilities for unpaid losses and loss adjustment expenses, net | 15,746 |
| 2,223 |
| 1,849 |
| 19,818 |
| 16,318 |
| 2,348 |
| 1,686 |
| 20,352 |
|
| Reinsurance and other recoverables [1] | 3,147 |
| 71 |
| 739 |
| 3,957 |
| |
| Ending liabilities for unpaid losses and loss adjustment expenses, gross [1] | $ | 18,893 |
| $ | 2,294 |
| $ | 2,588 |
| $ | 23,775 |
| |
| Reinsurance and other recoverables | | 3,137 |
| 108 |
| 987 |
| 4,232 |
|
| Ending liabilities for unpaid losses and loss adjustment expenses, gross | | $ | 19,455 |
| $ | 2,456 |
| $ | 2,673 |
| $ | 24,584 |
|
| Earned premiums and fee income | $ | 6,902 |
| $ | 3,734 |
| | $ | 7,081 |
| $ | 3,439 |
| |
| Loss and loss expense paid ratio [2] | 50.6 |
| 76.2 |
| | |
| Loss and loss expense paid ratio [1] | | 50.0 |
| 76.7 |
| |
| Loss and loss expense incurred ratio | 63.0 |
| 81.3 |
| | 58.4 |
| 81.3 |
| |
| Prior accident year development (pts) [3] | (0.3 | ) | (1.0 | ) | | |
| Prior accident year development (pts) [2] | | (2.8 | ) | (0.9 | ) | |
[1]Commercial Lines reflectsThe “loss and loss expense paid ratio” represents the additionratio of $712paid losses and loss adjustment expenses to the beginning gross reserves and reinsurance recoverables and $688 to the ending gross reserves and reinsurance recoverables for structured settlements reserves and recoverables due from the Company's life and annuity run-off business now classified as held for sale. These amounts were previously eliminated in consolidation.earned premiums.
| |
| [2] | “Prior accident year development (pts)” represents the ratio of prior accident year development to earned premiums. |
|
| | | | | | | | | |
| Current Accident Year Catastrophe Losses for the Year Ended December 31, 2018, Net of Reinsurance |
| | Commercial Lines | Personal
Lines | Total |
| Wind and hail | $ | 124 |
| $ | 164 |
| $ | 288 |
|
| Winter storms | 50 |
| 25 |
| 75 |
|
| Flooding | 1 |
| 1 |
| 2 |
|
| Volcanic eruption | — |
| 2 |
| 2 |
|
| Wildfire | 56 |
| 384 |
| 440 |
|
| Hurricanes | 71 |
| 23 |
| 94 |
|
| Massachusetts gas explosion | 1 |
| — |
| 1 |
|
| Earthquake | — |
| 1 |
| 1 |
|
| Total catastrophe losses | 303 |
| 600 |
| 903 |
|
| Less: reinsurance recoverable under the property aggregate treaty [1] | (28 | ) | (54 | ) | (82 | ) |
| Net catastrophe losses | $ | 275 |
| $ | 546 |
| $ | 821 |
|
[1]Refers to reinsurance recoverable under the Company's Property Aggregate treaty. For further information on the treaty, refer to Part II, Item 7, MD&A — Enterprise Risk Management — Insurance Risk.
Part II - Item 7. Management's Discussion and Analysis of Financial Condition and Results of Operations
|
| | | | | | | | | | | | |
| Unfavorable (Favorable) Prior Accident Year Development for the Year Ended December 31, 2018 |
| | Commercial Lines | Personal Lines | Property & Casualty Other Operations | Total Property & Casualty Insurance |
| Workers’ compensation | $ | (164 | ) | $ | — |
| $ | — |
| $ | (164 | ) |
| Workers’ compensation discount accretion | 40 |
| — |
| — |
| 40 |
|
| General liability | 52 |
| — |
| — |
| 52 |
|
| Package business | (26 | ) | — |
| — |
| (26 | ) |
| Commercial property | (12 | ) | — |
| — |
| (12 | ) |
| Professional liability | (12 | ) | — |
| — |
| (12 | ) |
| Bond | 2 |
| — |
| — |
| 2 |
|
| Automobile liability | (15 | ) | (18 | ) | — |
| (33 | ) |
| Homeowners | — |
| (25 | ) | — |
| (25 | ) |
| Net asbestos reserves | — |
| — |
| — |
| — |
|
| Net environmental reserves | — |
| — |
| — |
| — |
|
| Catastrophes | (67 | ) | 18 |
| — |
| (49 | ) |
| Uncollectible reinsurance | — |
| — |
| 22 |
| 22 |
|
| Other reserve re-estimates, net | 2 |
| (7 | ) | 43 |
| 38 |
|
| Total prior accident year development | $ | (200 | ) | $ | (32 | ) | $ | 65 |
| $ | (167 | ) |
During 2018, the Company’s re-estimates of prior accident year reserves included the following significant reserve changes:
Workers’ compensation reserveswere reduced in small commercial and middle market, primarily for accident years 2014 and 2015, as claim severity has emerged favorably compared to previous reserve estimates. Also contributing was a reduction in estimated reserves for unallocated loss adjustment expense ("ULAE").
General liability reserveswere increased, primarily due to an increase in reserves for higher hazard general liability exposures in middle market for accident years 2009 to 2017, partially offset by a decrease in reserves for other lines within middle market, including premises and operations, umbrella and products liability, principally for accident years 2015 and prior. Contributing to the increase in reserves for higher hazard general liability exposures was an increase in average claim severity, including from large losses and, in more recent accident years, an increase in claim frequency. Contributing to the reduction in reserves for other middle market lines were more favorable outcomes due to initiatives to reduce legal expenses. In addition, reserve increases for claims with lead paint exposure were offset by reserve decreases for other mass torts and extra-contractual liability claims.
Package business reserveswere reduced, primarily due to lower reserve estimates for both liability and property for accident years 2010 and prior, including a recovery of loss adjustment expenses for the 2005 accident year.
Commercial property reserves were reduced, driven by an increase in estimated reinsurance recoverables on middle market property losses from the 2017 accident year.
Professional liability reserveswere reduced, principally for accident years 2014 and prior, for directors and
officers liability claims principally due to a number of older claims closing with limited or no payment.
Automobile liability reserveswere reduced, primarily driven by reduced estimates of loss adjustment expenses in small commercial for recent accident years and favorable development in personal automobile liability for accident years 2014 to 2017, principally due to lower severity, including with uninsured and underinsured motorist claims.
Homeowners reserveswere reduced, primarily in accident years 2013 to 2017, driven by lower than expected severity across multiple perils.
Asbestos and environmental reserveswere unchanged as $238 of adverse development arising from the fourth quarter 2018 comprehensive annual review was offset by a $238 recoverable from NICO. For additional information related to the adverse development cover with NICO, see Note 8 - Reinsurance and Note 14 - Commitments and Contingencies of Notes to Consolidated Financial Statements.
Catastrophe reserveswere reduced, primarily as a result of lower estimated net losses from 2017 catastrophes, principally related to hurricanes Harvey and Irma. Before reinsurance, estimated losses for 2017 catastrophe events decreased by $133, resulting in a decrease in reinsurance recoverables of $90 as the Company no longer expects to recover under the 2017 Property Aggregate reinsurance treaty as aggregate ultimate losses for 2017 catastrophe events are now projected to be less than $850.
Uncollectible reinsurance reserves were increased due to lower anticipated recoveries related to older accident years.
Other reserve re-estimates, net, primarily represents an increase in ULAE reserves in Property & Casualty
Part II - Item 7. Management's Discussion and Analysis of Financial Condition and Results of Operations
Other Operations that was principally driven by an increase in expected claim handling costs associated with asbestos and environmental and mass tort claims.
Rollforward of Property and Casualty Insurance Product Liabilities for Unpaid Losses and LAE for the Year Ended December 31, 2017 |
| | | | | | | | | | | | |
| | Commercial Lines | Personal Lines | Property & Casualty Other Operations | Total Property & Casualty Insurance |
| Beginning liabilities for unpaid losses and loss adjustment expenses, gross | $ | 17,950 |
| $ | 2,094 |
| $ | 2,501 |
| $ | 22,545 |
|
| Reinsurance and other recoverables | 3,037 |
| 25 |
| 426 |
| 3,488 |
|
| Beginning liabilities for unpaid losses and loss adjustment expenses, net | 14,913 |
| 2,069 |
| 2,075 |
| 19,057 |
|
| Provision for unpaid losses and loss adjustment expenses | | | | |
| Current accident year before catastrophes | 3,961 |
| 2,584 |
| — |
| 6,545 |
|
| Current accident year catastrophes | 383 |
| 453 |
| — |
| 836 |
|
| Prior accident year development | (22 | ) | (37 | ) | 18 |
| (41 | ) |
| Total provision for unpaid losses and loss adjustment expenses | 4,322 |
| 3,000 |
| 18 |
| 7,340 |
|
| Less: payments | 3,489 |
| 2,846 |
| 244 |
| 6,579 |
|
| Ending liabilities for unpaid losses and loss adjustment expenses, net | 15,746 |
| 2,223 |
| 1,849 |
| 19,818 |
|
| Reinsurance and other recoverables | 3,147 |
| 71 |
| 739 |
| 3,957 |
|
| Ending liabilities for unpaid losses and loss adjustment expenses, gross | $ | 18,893 |
| $ | 2,294 |
| $ | 2,588 |
| $ | 23,775 |
|
| Earned premiums and fee income | $ | 6,902 |
| $ | 3,734 |
| | |
| Loss and loss expense paid ratio [1] | 50.6 |
| 76.2 |
| | |
| Loss and loss expense incurred ratio | 63.0 |
| 81.3 |
| | |
| Prior accident year development (pts) [2] | (0.3 | ) | (1.0 | ) | | |
| |
| [1] | The “loss and loss expense paid ratio” represents the ratio of paid losses and loss adjustment expenses to earned premiums and fee income. |
| |
[3]2] | “Prior accident year development (pts)” represents the ratio of prior accident year development to earned premiums. |
Part II - Item 7. Management's Discussion and Analysis of Financial Condition and Results of Operations
2017 Catastrophe Losses, Net of Reinsurance
| | | Current Accident Year Catastrophe Losses for the Year Ended December 31, 2017, Net of Reinsurance | | Current Accident Year Catastrophe Losses for the Year Ended December 31, 2017, Net of Reinsurance |
| | Commercial Lines | Personal
Lines | Commercial Lines | Personal
Lines | Total |
| Wind and hail | $ | 138 |
| $ | 176 |
| $ | 138 |
| $ | 176 |
| $ | 314 |
|
| Hurricanes [1] | 236 |
| 68 |
| 236 |
| 68 |
| 304 |
|
| Wildfires | 51 |
| 253 |
| 51 |
| 253 |
| 304 |
|
| Winter Storms | 1 |
| 3 |
| |
| Total Catastrophe Losses | $ | 426 |
| $ | 500 |
| |
| Winter storms | | 1 |
| 3 |
| 4 |
|
| Total catastrophe losses | | 426 |
| 500 |
| 926 |
|
| Less: reinsurance recoverable under the property aggregate treaty [2] | (43 | ) | (47 | ) | (43 | ) | (47 | ) | (90 | ) |
| Net Catastrophe losses | $ | 383 |
| $ | 453 |
| |
| Net catastrophe losses | | $ | 383 |
| $ | 453 |
| $ | 836 |
|
[1]Includes catastrophe losses from Hurricane Harvey and Hurricane Irma of $170 and $121, respectively.
[2]Refers to reinsurance recoverable under the Company's Property Aggregate treaty. For further information on the treaty, refer to Part II, Item 7, MD&A — Enterprise Risk Management — Insurance Risk.
(Favorable) Unfavorable Prior Accident Year Development for the Year Ended December 31, 2017
Part II - Item 7. Management's Discussion and Analysis of Financial Condition and Results of Operations
| | | Unfavorable (Favorable) Prior Accident Year Development for the Year Ended December 31, 2017 | | Unfavorable (Favorable) Prior Accident Year Development for the Year Ended December 31, 2017 |
| | Commercial Lines | Personal Lines | Property & Casualty Other Operations | Total Property & Casualty Insurance | Commercial Lines | Personal Lines | Property & Casualty Other Operations | Total Property & Casualty Insurance |
| Workers’ compensation | $ | (79 | ) | $ | — |
| $ | — |
| $ | (79 | ) | $ | (79 | ) | $ | — |
| $ | — |
| $ | (79 | ) |
| Workers’ compensation discount accretion | 28 |
| — |
| — |
| 28 |
| 28 |
| — |
| — |
| 28 |
|
| General liability | 11 |
| — |
| — |
| 11 |
| 11 |
| — |
| — |
| 11 |
|
| Package business | (25 | ) | — |
| — |
| (25 | ) | (25 | ) | — |
| — |
| (25 | ) |
| Commercial property | (8 | ) | — |
| — |
| (8 | ) | (8 | ) | — |
| — |
| (8 | ) |
| Professional liability | 1 |
| — |
| — |
| 1 |
| 1 |
| — |
| — |
| 1 |
|
| Bond | 32 |
| — |
| — |
| 32 |
| 32 |
| — |
| — |
| 32 |
|
| Automobile liability | 17 |
| — |
| — |
| 17 |
| 17 |
| — |
| — |
| 17 |
|
| Homeowners | — |
| (14 | ) | — |
| (14 | ) | — |
| (14 | ) | — |
| (14 | ) |
| Net asbestos reserves | — |
| — |
| — |
| — |
| — |
| — |
| — |
| — |
|
| Net environmental reserves | — |
| — |
| — |
| — |
| — |
| — |
| — |
| — |
|
| Catastrophes | — |
| (16 | ) | — |
| (16 | ) | — |
| (16 | ) | — |
| (16 | ) |
| Uncollectible reinsurance | (15 | ) | — |
| — |
| (15 | ) | (15 | ) | — |
| — |
| (15 | ) |
| Other reserve re-estimates, net | 16 |
| (7 | ) | 18 |
| 27 |
| 16 |
| (7 | ) | 18 |
| 27 |
|
| Total prior accident year development | $ | (22 | ) | $ | (37 | ) | $ | 18 |
| $ | (41 | ) | $ | (22 | ) | $ | (37 | ) | $ | 18 |
| $ | (41 | ) |
During 2017,, the Company’s re-estimates of prior accident year reserves included the following significant reserve changes:
Workers’ compensation reserves were reduced in Small Commercialsmall commercial and Middle Market,middle market, given the continued emergence of favorable frequency, primarily for accident years 2013 to 2015, as well as a reduction in estimated reserves for ULAE, partially offset by strengthening reserves for captive programs within Specialty Commercial.specialty commercial.
General liability reserves were increased for the 2013 to 2016 accident years on a class of business that insures service and maintenance contractors. This increase was partially offset by a decrease in recent accident year reserves for other Middle Marketmiddle market general liability reserves.
Package business reserveswere reduced for accident years 2013 and prior largely due to reducing the Company’s estimate of allocated loss adjustment expenses incurred to settle the claims.
Bond business reserves increased for customs bonds written between 2000 and 2010 which was partly offset by a reduction in reserves for recent accident years as reported losses for commercial and contract surety have emerged favorably.
Automobile liability reserves within Commercial Lines were increased in Small Commercialsmall commercial and large national accounts for the 2013 to 2016 accident years, driven by higher frequency of more severe accidents, including litigated claims.
Asbestos and environmental reserves were unchanged as $285 of adverse development arising from the fourth quarter 2017 comprehensive annual review was offset by a $285 recoverable from NICO. For additional information related to the adverse development cover with NICO, see Note 8 - Reinsurance and Note 14 - Commitments and Contingencies of Notes to Consolidated Financial Statements.
Part II - Item 7. Management's Discussion and Analysis of Financial Condition and Results of Operations
Catastrophes reserveswere reduced primarily due to lower estimates of 2016 wind and hail event losses and a decrease in losses on a 2015 wildfire.
Uncollectible reinsurance reserves decreased as a result of giving greater weight to favorable collectibility
experience in recent calendar periods in estimating future collections.
Roll-forward
Part II - Item 7. Management's Discussion and Analysis of Financial Condition and Results of Operations
Rollforward of Property and Casualty Insurance Product Liabilities for Unpaid Losses and LAE for theYear Ended December 31, 2016 | | | | Commercial Lines | Personal Lines | Property & Casualty Other Operations | Total Property & Casualty Insurance | Commercial Lines | Personal Lines | Property & Casualty Other Operations | Total Property & Casualty Insurance |
| Beginning liabilities for unpaid losses and loss adjustment expenses, gross [1] | $ | 17,302 |
| $ | 1,845 |
| $ | 3,421 |
| $ | 22,568 |
| |
| Reinsurance and other recoverables [1] | 3,036 |
| 19 |
| 570 |
| 3,625 |
| |
| Beginning liabilities for unpaid losses and loss adjustment expenses, gross | | $ | 17,302 |
| $ | 1,845 |
| $ | 3,421 |
| $ | 22,568 |
|
| Reinsurance and other recoverables | | 3,036 |
| 19 |
| 570 |
| 3,625 |
|
| Beginning liabilities for unpaid losses and loss adjustment expenses, net | 14,266 |
| 1,826 |
| 2,851 |
| 18,943 |
| 14,266 |
| 1,826 |
| 2,851 |
| 18,943 |
|
| Add: Maxum acquisition | 122 |
| — |
| — |
| 122 |
| |
| Add: Maxum Acquisition | | 122 |
| — |
| — |
| 122 |
|
| Provision for unpaid losses and loss adjustment expenses | | |
| Current accident year before catastrophes | 3,766 |
| 2,808 |
| — |
| 6,574 |
| 3,766 |
| 2,808 |
| — |
| 6,574 |
|
| Current accident year catastrophes | 200 |
| 216 |
| — |
| 416 |
| 200 |
| 216 |
| — |
| 416 |
|
| Prior accident year development | 28 |
| 151 |
| 278 |
| 457 |
| 28 |
| 151 |
| 278 |
| 457 |
|
| Total provision for unpaid losses and loss adjustment expenses | 3,994 |
| 3,175 |
| 278 |
| 7,447 |
| 3,994 |
| 3,175 |
| 278 |
| 7,447 |
|
| Less: payments | 3,469 |
| 2,932 |
| 567 |
| 6,968 |
| 3,469 |
| 2,932 |
| 567 |
| 6,968 |
|
| Less: net reserves transferred to liabilities held for sale [4] | — |
| — |
| 487 |
| 487 |
| |
| Less: net reserves transferred to liabilities held for sale [1] | | — |
| — |
| 487 |
| 487 |
|
| Ending liabilities for unpaid losses and loss adjustment expenses, net | 14,913 |
| 2,069 |
| 2,075 |
| 19,057 |
| 14,913 |
| 2,069 |
| 2,075 |
| 19,057 |
|
| Reinsurance and other recoverables [1] | 3,037 |
| 25 |
| 426 |
| 3,488 |
| |
| Ending liabilities for unpaid losses and loss adjustment expenses, gross [1] | $ | 17,950 |
| $ | 2,094 |
| $ | 2,501 |
| $ | 22,545 |
| |
| Reinsurance and other recoverables | | 3,037 |
| 25 |
| 426 |
| 3,488 |
|
| Ending liabilities for unpaid losses and loss adjustment expenses, gross | | $ | 17,950 |
| $ | 2,094 |
| $ | 2,501 |
| $ | 22,545 |
|
| Earned premiums and fee income | $ | 6,690 |
| $ | 3,937 |
| | $ | 6,690 |
| $ | 3,937 |
| |
| Loss and loss expense paid ratio [2] | 51.9 |
| 74.5 |
| | 51.9 |
| 74.5 |
| |
| Loss and loss expense incurred ratio | 60.1 |
| 81.5 |
| | 60.1 |
| 81.5 |
| |
| Prior accident year development (pts) [3] | 0.4 |
| 3.9 |
| | 0.4 |
| 3.9 |
| |
| |
| [1] | Commercial Lines reflects the additionRepresents liabilities classified as held-for-sale as of $743December 31, 2016 and subsequently transferred to the beginning gross reserves and reinsurance recoverables and $712 tobuyer in connection with the ending gross reserves and reinsurance recoverables for structured settlements reserves and recoverables due fromsale of the Company's lifeU.K. property and annuitycasualty run-off business now classified as held for sale. These amounts were previously eliminatedsubsidiaries in consolidation.May 2017. For discussion of the sale transaction, see Note 20 - Business Dispositions and Discontinued Operations of Notes to Consolidated Financial Statements. |
| |
| [2] | The “loss and loss expense paid ratio” represents the ratio of paid losses and loss adjustment expenses to earned premiums and fee income. |
| |
| [3] | “Prior accident year development (pts)” represents the ratio of prior accident year development to earned premiums. |
| |
[4] | Represents liabilities classified as held-for-sale as of December 31, 2016 and subsequently transferred to the buyer in connection with the sale of the Company's U.K. property and casualty run-off subsidiaries in May 2017. For discussion of the sale transaction, see Note 20 - Business Dispositions and Discontinued Operations of Notes to Consolidated Financial Statements.
|
|
| | | | | | | | | |
| Current Accident Year Catastrophe Losses for the Year Ended December 31, 2016, Net of Reinsurance |
| | Commercial Lines | Personal
Lines | Total |
| Wind and hail | $ | 156 |
| $ | 186 |
| $ | 342 |
|
| Winter storms | 24 |
| 7 |
| $ | 31 |
|
| Hurricane Matthew | 17 |
| 16 |
| $ | 33 |
|
| Wildfires | 3 |
| 7 |
| 10 |
|
| Total Catastrophe Losses | $ | 200 |
| $ | 216 |
| $ | 416 |
|
Part II - Item 7. Management's Discussion and Analysis of Financial Condition and Results of Operations
2016 Catastrophe Losses, Net of Reinsurance
|
| | | | | | |
| | Commercial Lines | Personal
Lines |
| Wind and hail | $ | 156 |
| $ | 186 |
|
| Winter storms | 24 |
| 7 |
|
| Hurricane Matthew | 17 |
| 16 |
|
| Wildfires | 3 |
| 7 |
|
| Total Catastrophe Losses | $ | 200 |
| $ | 216 |
|
(Favorable) Unfavorable Prior Accident Year Development for the Year Ended December 31, 2016
| | | Unfavorable (Favorable) Prior Accident Year Development for the Year Ended December 31, 2016 | | Unfavorable (Favorable) Prior Accident Year Development for the Year Ended December 31, 2016 |
| | Commercial Lines | Personal Lines | Property & Casualty Other Operations | Total Property & Casualty Insurance | Commercial Lines | Personal Lines | Property & Casualty Other Operations | Total Property & Casualty Insurance |
| Workers’ compensation | $ | (119 | ) | $ | — |
| $ | — |
| $ | (119 | ) | $ | (119 | ) | $ | — |
| $ | — |
| $ | (119 | ) |
| Workers’ compensation discount accretion | 28 |
| — |
| — |
| 28 |
| 28 |
| — |
| — |
| 28 |
|
| General liability | 65 |
| — |
| — |
| 65 |
| 65 |
| — |
| — |
| 65 |
|
| Package business | 65 |
| — |
| — |
| 65 |
| 65 |
| — |
| — |
| 65 |
|
| Commercial property | 1 |
| — |
| — |
| 1 |
| 1 |
| — |
| — |
| 1 |
|
| Professional liability | (37 | ) | — |
| — |
| (37 | ) | (37 | ) | — |
| — |
| (37 | ) |
| Bond | (8 | ) | — |
| — |
| (8 | ) | (8 | ) | — |
| — |
| (8 | ) |
| Automobile liability | 57 |
| 160 |
| — |
| 217 |
| 57 |
| 160 |
| — |
| 217 |
|
| Homeowners | — |
| (10 | ) | — |
| (10 | ) | — |
| (10 | ) | — |
| (10 | ) |
| Net asbestos reserves | — |
| — |
| 197 |
| 197 |
| — |
| — |
| 197 |
| 197 |
|
| Net environmental reserves | — |
| — |
| 71 |
| 71 |
| — |
| — |
| 71 |
| 71 |
|
| Catastrophes | (4 | ) | (3 | ) | — |
| (7 | ) | (4 | ) | (3 | ) | — |
| (7 | ) |
| Uncollectible reinsurance | (30 | ) | — |
| — |
| (30 | ) | (30 | ) | — |
| — |
| (30 | ) |
| Other reserve re-estimates, net | 10 |
| 4 |
| 10 |
| 24 |
| 10 |
| 4 |
| 10 |
| 24 |
|
| Total prior accident year development | $ | 28 |
| $ | 151 |
| $ | 278 |
| $ | 457 |
| $ | 28 |
| $ | 151 |
| $ | 278 |
| $ | 457 |
|
During 2016, the Company’s re-estimates of prior accident year reserves included the following significant reserve changes:
Workers' compensation reservesconsider favorable emergence on reported losses for recent accident years as well as a partially offsetting adverse impact related to two recent Florida Supreme Court rulings that have increased the Company’s exposure to workers’ compensation claims in that state. The favorable emergence has been driven by lower frequency and, to a lesser extent, lower medical severity and management has placed additional weight on this favorable experience as it becomes more credible.
General liability reserves increased for accident years 2012 - 2015 primarily due to higher severity losses incurred on a class of business that insures service and maintenance contractors and increased for accident years 2008 and 2010 primarily due to indemnity losses and legal costs associated with a litigated claim.
Package business reserves increased due to higher than expected severity on liability claims, principally for accident years 2013 - 2015. Severity for these accident years has developed unfavorably and management has placed more weight on emerged experience.
Professional liability reserves decreased for claims made years 2008 - 2013, primarily for large accounts, including on non-securities class action cases. Claim costs have emerged favorably as these years have matured and management has placed more weight on the emerged experience.
Automobile liability reserves increased due to increases in both commercial lines automobile and personal lines automobile. Commercial automobile liability reserves increased, predominately for the 2015 accident year, primarily due to increased frequency of large claims. Personal automobile liability reserves increased, primarily related to increased bodily injury
frequency and severity for the 2015 accident year, including for uninsured and under-insured motorist claims, and increased bodily injury severity for the 2014 accident year. Increases in automobile liability loss costs were across both the direct and agency distribution channels.
Asbestos and environmental reserves were increased during the period as a result of the second quarter 2016 comprehensive annual review.
Uncollectible reinsurance reserves decreased as a result of giving greater weight to favorable collectibility
Part II - Item 7. Management's Discussion and Analysis of Financial Condition and Results of Operations
experience in recent calendar periods in estimating future collections.
Roll-forward of Property and Casualty Insurance Product Liabilities for Unpaid Losses and LAE for theYear Ended December 31, 2015 |
| | | | | | | | | | | | |
| | Commercial Lines | Personal Lines | Property & Casualty Other Operations | Total Property & Casualty Insurance |
| Beginning liabilities for unpaid losses and loss adjustment expenses, gross [1] | $ | 17,238 |
| $ | 1,874 |
| $ | 3,467 |
| $ | 22,579 |
|
| Reinsurance and other recoverables [1] | 3,232 |
| 18 |
| 564 |
| 3,814 |
|
| Beginning liabilities for unpaid losses and loss adjustment expenses, net | 14,006 |
| 1,856 |
| 2,903 |
| 18,765 |
|
| Provision for unpaid losses and loss adjustment expenses | | | | |
| Current accident year before catastrophes | 3,712 |
| 2,578 |
| 25 |
| 6,315 |
|
| Current accident year catastrophes | 121 |
| 211 |
| — |
| 332 |
|
| Prior accident year development | 53 |
| (21 | ) | 218 |
| 250 |
|
| Total provision for unpaid losses and loss adjustment expenses | 3,886 |
| 2,768 |
| 243 |
| 6,897 |
|
| Less: payments | 3,626 |
| 2,798 |
| 295 |
| 6,719 |
|
| Ending liabilities for unpaid losses and loss adjustment expenses, net | 14,266 |
| 1,826 |
| 2,851 |
| 18,943 |
|
| Reinsurance and other recoverables [1] | 3,036 |
| 19 |
| 570 |
| 3,625 |
|
| Ending liabilities for unpaid losses and loss adjustment expenses, gross [1] | $ | 17,302 |
| $ | 1,845 |
| $ | 3,421 |
| $ | 22,568 |
|
| Earned premiums and fee income | $ | 6,551 |
| $ | 3,910 |
| | |
| Loss and loss expense paid ratio [2] | 55.4 |
| 71.6 |
| | |
| Loss and loss expense incurred ratio | 59.7 |
| 71.5 |
| | |
| Prior accident year development (pts) [3] | 0.8 |
| (0.5 | ) | | |
| |
[1] | Commercial Lines reflects the addition of $773 to the beginning gross reserves and reinsurance recoverables and $743 to the ending gross reserves and reinsurance recoverables for structured settlements reserves and recoverables due from the Company's life and annuity run-off business now classified as held for sale. These amounts were previously eliminated in consolidation. |
| |
[2] | The “loss and loss expense paid ratio” represents the ratio of paid losses and loss adjustment expenses to earned premiums and fee income. |
| |
[3] | “Prior accident year development (pts)” represents the ratio of prior accident year development to earned premiums. |
2015 Catastrophe Losses, Net of Reinsurance
|
| | | | | | |
| | Commercial Lines | Personal
Lines |
| Wind and hail | $ | 43 |
| $ | 114 |
|
| Winter storms | 57 |
| 27 |
|
| Tornadoes | 18 |
| 29 |
|
| Other [1] | 3 |
| 41 |
|
| Total Catastrophe Losses | $ | 121 |
| $ | 211 |
|
[1]Consists primarily of wildfires.
Part II - Item 7. Management's Discussion and Analysis of Financial Condition and Results of Operations
(Favorable) Unfavorable Prior Accident Year Development for the Year Ended December 31, 2015
|
| | | | | | | | | | | | |
| | Commercial Lines | Personal Lines | Property & Casualty Other Operations | Total Property & Casualty Insurance |
| Workers’ compensation | $ | (37 | ) | $ | — |
| $ | — |
| $ | (37 | ) |
| Workers’ compensation discount accretion | 29 |
| — |
| — |
| 29 |
|
| General liability | 8 |
| — |
| — |
| 8 |
|
| Package business | 28 |
| — |
| — |
| 28 |
|
| Commercial property | (6 | ) | — |
| — |
| (6 | ) |
| Professional liability | (36 | ) | — |
| — |
| (36 | ) |
| Bond | (2 | ) | — |
| — |
| (2 | ) |
| Automobile liability | 62 |
| (8 | ) | — |
| 54 |
|
| Homeowners | — |
| 9 |
| — |
| 9 |
|
| Net asbestos reserves | — |
| — |
| 146 |
| 146 |
|
| Net environmental reserves | — |
| — |
| 55 |
| 55 |
|
| Catastrophes | — |
| (18 | ) | — |
| (18 | ) |
| Other reserve re-estimates, net | 7 |
| (4 | ) | 17 |
| 20 |
|
| Total prior accident year development | $ | 53 |
| $ | (21 | ) | $ | 218 |
| $ | 250 |
|
During 2015, the Company’s re-estimates of prior accident year reserves included the following significant reserve changes:
Workers' compensation reserves decreased due to an improvement in claim closure rates resulting in a decrease in outstanding claims for permanently disabled claimants. In addition, accident years 2013 and 2014 continue to exhibit favorable frequency and medical severity trends; management has been placing additional weight on this favorable experience as it becomes more credible.
Package business reserves increased due to higher than expected severity on liability claims, impacting recent accident years.
Professional liability reserves decreased for claims made years 2009 through 2012 primarily for large accounts. Claim costs have emerged favorably as these years have matured and management has placed more weight on the emerged experience.
Automobile liability reserveswithin Commercial Lines were increased due to increased severity of large claims predominantly for accident years 2010 to 2013.
Asbestos and environmental reserves were increased during the period as a result of the 2015 comprehensive annual review.
Catastrophe reserves decreased primarily for accident year 2014, as fourth quarter 2014 catastrophes have developed favorably.
Other reserve re-estimates, net decreased due to decreased contract surety reserves across several accident years and decreased commercial surety reserves for accident years 2012 through 2014 as a result of lower emerged losses. These reserve decreases were offset by an increase in commercial
surety reserves related to accident years 2007 and prior, as the number of new claims reported has outpaced expectations.
Property & Casualty Other Operations
Net reserves and reserve activity in Property & Casualty Other Operations are categorized and reported as Asbestos, Environmental, and “All other”. The “All other” category of reserves covers a wide range of insurance and assumed reinsurance coverages, including, but not limited to, potential liability for construction defects, lead paint, silica, pharmaceutical products, head injuries, molestation and other long-tail liabilities. In addition to various insurance and assumed reinsurance exposures, "All other" includes unallocated loss adjustment expense reserves. "All other" also includes the Company’s allowance for uncollectible reinsurance. When the Company commutes a ceded reinsurance contract or settles a ceded reinsurance dispute, net reserves for the related cause of loss (including asbestos, environmental or all other) are increased for the portion of the allowance for uncollectible reinsurance attributable to that commutation or settlement.
Part II - Item 7. Management's Discussion and Analysis of Financial Condition and Results of Operations
P&C Other Operations
Total Reserves, Net of Reinsurance
Asbestos and Environmental Reserves
Reserves for asbestos and environmental are primarily within P&C Other Operations with less significant amounts of asbestos and environmental reserves included within Commercial Lines and Personal Lines. The following tables include all asbestos and environmental reserves, including reserves in P&C Other Operations and Commercial Lines and Personal Lines.
Asbestos and Environmental Net Reserves | | | | Asbestos | Environmental | Asbestos | Environmental |
| 2018 | | |
| Property and Casualty Other Operations | | $ | 984 |
| $ | 151 |
|
| Commercial Lines and Personal Lines | | 67 |
| 52 |
|
| Ending liability — net | | $ | 1,051 |
| $ | 203 |
|
| 2017 | | |
| Property and Casualty Other Operations | $ | 1,143 |
| $ | 182 |
| $ | 1,143 |
| $ | 182 |
|
| Commercial Lines and Personal Lines | 72 |
| 55 |
| 72 |
| 55 |
|
| Ending liability — net | $ | 1,215 |
| $ | 237 |
| $ | 1,215 |
| $ | 237 |
|
| 2016 | | |
| Property and Casualty Other Operations | $ | 1,282 |
| $ | 234 |
| $ | 1,282 |
| $ | 234 |
|
| Commercial Lines and Personal Lines | 81 |
| 58 |
| 81 |
| 58 |
|
| Ending liability — net | $ | 1,363 |
| $ | 292 |
| $ | 1,363 |
| $ | 292 |
|
| 2015 | | |
| Property and Casualty Other Operations | $ | 1,712 |
| $ | 247 |
| |
| Commercial Lines and Personal Lines | 91 |
| 71 |
| |
| Ending liability — net | $ | 1,803 |
| $ | 318 |
| |
Property & Casualty Reserves
Asbestos and Environmental Summary as of December 31, 20172018
| | | | | Asbestos | Environmental | Total A&E | | Asbestos | Environmental | Total A&E |
| Gross | Gross | | Gross | |
| | Direct | $ | 1,413 |
| $ | 333 |
| $ | 1,746 |
| Direct | $ | 1,442 |
| $ | 359 |
| $ | 1,801 |
|
| | Assumed Reinsurance | 425 |
| 46 |
| 471 |
| Assumed Reinsurance | 431 |
| 54 |
| 485 |
|
| | Total | 1,838 |
| 379 |
| 2,217 |
| Total | 1,873 |
| 413 |
| 2,286 |
|
| Ceded- other than NICO | Ceded- other than NICO | (440 | ) | (40 | ) | (480 | ) | Ceded- other than NICO | (472 | ) | (37 | ) | (509 | ) |
| Ceded - NICO ADC | Ceded - NICO ADC | (183 | ) | (102 | ) | (285 | ) | Ceded - NICO ADC | (350 | ) | (173 | ) | (523 | ) |
| Net | Net | $ | 1,215 |
| $ | 237 |
| $ | 1,452 |
| Net | $ | 1,051 |
| $ | 203 |
| $ | 1,254 |
|
Roll-ForwardRollforward of Asbestos and Environmental Losses and LAE | | | | Asbestos | Environmental | Asbestos | Environmental |
| 2018 | | |
| Beginning liability — net | | $ | 1,215 |
| $ | 237 |
|
| Losses and loss adjustment expenses incurred [1] | | — |
| — |
|
| Losses and loss adjustment expenses paid | | (164 | ) | (34 | ) |
| Reclassification of allowance for uncollectible insurance [4] | | — |
| — |
|
| Ending liability — net | | $ | 1,051 |
| $ | 203 |
|
| 2017 | | |
| Beginning liability — net | $ | 1,363 |
| $ | 292 |
| $ | 1,363 |
| $ | 292 |
|
| Losses and loss adjustment expenses incurred [1] | — |
| — |
| — |
| — |
|
| Losses and loss adjustment expenses paid | (149 | ) | (55 | ) | (149 | ) | (55 | ) |
| Reclassification of allowance for uncollectible insurance [4] | 1 |
| — |
| 1 |
| — |
|
| Ending liability — net | $ | 1,215 |
| $ | 237 |
| $ | 1,215 |
| $ | 237 |
|
| 2016 | | |
| Beginning liability — net | $ | 1,803 |
| $ | 318 |
| $ | 1,803 |
| $ | 318 |
|
| Losses and loss adjustment expenses incurred | 197 |
| 71 |
| 197 |
| 71 |
|
| Losses and loss adjustment expenses paid [2] | (462 | ) | (56 | ) | (462 | ) | (56 | ) |
| Reclassification of allowance for uncollectible insurance [4] | 30 |
| — |
| 30 |
| — |
|
| Net reserves transferred to liabilities held for sale [3] | (205 | ) | (41 | ) | (205 | ) | (41 | ) |
| Ending liability — net | $ | 1,363 |
| $ | 292 |
| $ | 1,363 |
| $ | 292 |
|
| 2015 | | |
| Beginning liability — net | $ | 1,811 |
| $ | 316 |
| |
| Losses and loss adjustment expenses incurred | 157 |
| 57 |
| |
| Losses and loss adjustment expenses paid | (165 | ) | (55 | ) | |
| Ending liability — net | $ | 1,803 |
| $ | 318 |
| |
| |
| [1] | IncurredCumulative incurred losses of $285,$523, net, have been ceded to NICO under an adverse development cover reinsurance agreement. See the section that follows entitled ADC for additional information. |
| |
| [2] | Included $289 related to the settlement in 2016 of PPG Industries, Inc. ("PPG") asbestos liabilities, net of reinsurance billed to third-party reinsurers. |
| |
| [3] | A&E liabilities classified as held for sale related to the sale of the Company's U.K. property and casualty run-off subsidiaries. |
| |
| [4] | Related to the reclassification of an allowance for uncollectible reinsurance from the "All Other" category of P&C Other Operations reserves. |
Part II - Item 7. Management's Discussion and Analysis of Financial Condition and Results of Operations
Adverse Development Cover
InEffective December 31, 2016, the Company entered into an asbestos and environmentalA&E ADC reinsurance agreement with NICO, a subsidiary of Berkshire Hathaway Inc. (“Berkshire”), to reduce uncertainty about potential adverse development of asbestos and environmental reserves.development. Under the ADC, the Company paid a reinsurance agreement,premium of $650 for NICO assumesto assume adverse net loss and allocated loss adjustment expense reserve development up to $1.5 billion above the Company'sCompany’s existing net asbestos and environmentalA&E reserves recorded as of December 31, 2016. 2016 of approximately $1.7 billion. The $650 reinsurance premium was placed in a collateral trust account as security for NICO’s claim payment obligations to the Company. The Company has retained the risk of collection on amounts due from other third-party reinsurers and continues to be responsible for claims handling and other administrative services, subject to certain conditions. The ADC covers substantially all the Company’s A&E reserve development up to the reinsurance limit.
Under retroactive reinsurance accounting, net adverse A&E reserve development after December 31, 2016, will result in an offsetting reinsurance recoverable up to the $1.5 billion limit. Cumulative ceded losses up to the $650 reinsurance premium paid are recognized as a dollar-for-dollar offset to net losses incurred before ceding to the ADC. Cumulative ceded losses exceeding the $650 reinsurance premium paid would result in a deferred gain. The deferred gain would be recognized over the claim settlement period in the proportion of the amount of cumulative ceded losses collected from the reinsurer to the estimated ultimate reinsurance recoveries. Consequently, until periods when the deferred gain is recognized as a benefit to earnings, cumulative adverse development of A&E claims after December 31, 2016 in excess of $650 may result in significant charges against earnings.
As of December 31, 2017,2018, the Company has incurred $285a cumulative $523 in adverse development on asbestos and environmentalA&E reserves that have been ceded under the ADC treaty with NICO, leaving approximately $1.2 billion$977 of coverage available for future adverse net reserve development, if any. For additional information related to the adverse development cover, see Note 8 - Reinsurance and Note 14 - Commitments and Contingencies of Notes to Consolidated Financial Statements.any.
Net and Gross Survival Ratios
Net and Grossgross survival ratios are a measure of the quotient of the carried reserves divided by average annual payments (net of reinsurance and on a gross basis) and is an indication of the number of years that carried reserves would last (i.e. survive) if future annual payments were consistent with the calculated historical average.
The survival ratios shown below are calculated for the one and three year periods ended December 31, 2017.2018. The net basis survival ratio has been materially affected by the adverse development cover entered into between the Company and NICO.NICO. The Company cedes adverse asbestos and environmental development in excess of its December 31, 2016 net carried reserves of $1.7 billion to NICO up to a limit of $1.5 billion. Since December 31, 2016, net reserves for asbestos and environmental have been declining as the Company has had no net incurred losses but continues to pay down net loss reserves. As a result, thisThis has the effect of reducing the one- and three-year net survival ratios shown in the table below. For asbestos, the table also presents the net survival ratios excluding the effect of the PPG settlement in 2016. See section that follows entitled Major Categories of Asbestos Accounts for discussion of the PPG settlement.
Net and Gross Survival Ratios |
| | |
| | Asbestos | Environmental |
| One year net survival ratio | 6.4 | 5.9 |
| Three year net survival ratio- excluding PPG settlement | 6.6 | 4.2 |
| One year gross survival ratio | 8.6 | 8.3 |
| Three year gross survival ratio - excluding PPG settlement | 9.1 | 7.1 |
|
| | |
| | Asbestos | Environmental |
| One year net survival ratio | 8.2 | 4.3 |
| Three year net survival ratio- excluding PPG | 7.5 | 4.6 |
| One year gross survival ratio | 9.2 | 5.7 |
| Three year gross survival ratio - excluding PPG settlement | 9.0 | 6.5 |
Asbestos and Environmental
Paid and Incurred Losses and LAE Development | | | | Asbestos | Environmental | Asbestos | Environmental |
| | Paid Losses & LAE | Incurred Losses & LAE | Paid Losses & LAE | Incurred Losses & LAE | Paid Losses & LAE | Incurred Losses & LAE | Paid Losses & LAE | Incurred Losses & LAE |
| 2018 | | |
Gross
| | $ | 218 |
| $ | 252 |
| $ | 50 |
| $ | 83 |
|
| Ceded- other than NICO | | (54 | ) | (85 | ) | (16 | ) | (12 | ) |
| Ceded - NICO ADC | | — |
| (167 | ) | | (71 | ) |
| Net | | $ | 164 |
| $ | — |
| $ | 34 |
| $ | — |
|
| 2017 | | |
Gross
| $ | 199 |
| $ | 306 |
| $ | 66 |
| $ | 126 |
| $ | 199 |
| $ | 306 |
| $ | 66 |
| $ | 126 |
|
Ceded- other than NICO
| (50 | ) | (123 | ) | (11 | ) | (24 | ) | (50 | ) | (123 | ) | (11 | ) | (24 | ) |
Ceded - NICO ADC
| — |
| (183 | ) | — |
| (102 | ) | — |
| (183 | ) | — |
| (102 | ) |
| Net | $ | 149 |
| $ | — |
| $ | 55 |
| $ | — |
| $ | 149 |
| $ | — |
| $ | 55 |
| $ | — |
|
| 2016 | | |
| Gross | $ | 535 |
| $ | 257 |
| $ | 61 |
| $ | 77 |
| $ | 535 |
| $ | 257 |
| $ | 61 |
| $ | 77 |
|
Ceded- other than NICO
| (73 | ) | (60 | ) | (5 | ) | (6 | ) | (73 | ) | (60 | ) | (5 | ) | (6 | ) |
Ceded - NICO ADC
| — |
| — |
| — |
| — |
| — |
| — |
| — |
| — |
|
| Net | $ | 462 |
| $ | 197 |
| $ | 56 |
| $ | 71 |
| $ | 462 |
| $ | 197 |
| $ | 56 |
| $ | 71 |
|
| 2015 | | |
| Gross | $ | 230 |
| $ | 251 |
| $ | 68 |
| $ | 82 |
| |
Ceded- other than NICO
| (65 | ) | (94 | ) | (13 | ) | (25 | ) | |
Ceded - NICO ADC
| — |
| — |
| — |
| — |
| |
| Net | $ | 165 |
| $ | 157 |
| $ | 55 |
| $ | 57 |
| |
Annual Reserve Reviews
Review of Asbestos Reserves
Beginning inSince 2017, the Company performshas performed its regular comprehensive annual review of asbestos reserves in the fourth quarter. As part of thisthe evaluation in the fourth quarter of 2017,2018, the Company reviewed all of its open direct domestic insurance accounts exposed to asbestos liability, as well as assumed reinsurance accounts.
During the 2018 fourth quarter review, the Company increased estimated reserves before NICO reinsurance by $167, primarily due to an increase in average mesothelioma settlement values driven by elevated plaintiff demands and defendant bankruptcies. The rise in plaintiff demands also resulted in higher than anticipated defense costs for a small subset of peripheral defendants with a high concentration of asbestos filings in specific, adverse jurisdictions. In addition, the Company observed unfavorable developments in the application of coverage that resulted in increased liability shares on certain insureds. An
Part II - Item 7. Management's Discussion and Analysis of Financial Condition and Results of Operations
increase in reserves from umbrella and excess policies in the 1981-1985 policy years contributed to the adverse development. The increase in reserves was offset by a $167 reinsurance recoverable under the NICO treaty.
As a result of the 2017 fourth quarter review, the Company increased estimated reserves before NICO reinsurance by $183, primarily due to mesothelioma claim filings not declining as expected, unfavorable developments in coverage law in some jurisdictions and continued filings in specific, adverse jurisdictions. An increased share of adverse development from the fourth quarter review isincrease in reserves from umbrella and excess policies in the 1981-1985 policy years.years contributed to the adverse development. This increase in reserves was offset by a $183 reinsurance recoverable under the NICO treaty.
During the 2016 second quarter review, a substantial majority of the Company’s direct accounts trended as expected, and the Company observed no material changes in the underlying legal environment. However, mesothelioma claims filings have not declined as expected for a small subset of peripheral defendants with a high concentration of asbestos filings in specific, adverse jurisdictions. As a result, aggregate indemnity and defense costs did not decline as expected. While the mesothelioma and adverse jurisdiction claim trends observed in the 2016 comprehensive annual review were similar to the 2015 comprehensive annual review, most of the defendants that had reserve increases in the
Part II - Item 7. Management's Discussion and Analysis of Financial Condition and Results of Operations
2016 review did not have a material impact in the 2015 review. Based on this evaluation, the Company increased its net asbestos reserves for prior year development by $197 in second quarter 2016.
During the 2015 comprehensive annual review, the Company found a substantial majority of direct accounts trended as expected, and the Company saw no material changes in the underlying legal environment during the past year. However, a small percentage of the Company’s direct accounts experienced greater than expected claim filings, including mesothelioma claims. This was driven by a subset of peripheral defendants with a high concentration of filings in specific, adverse jurisdictions. As a result, the aggregate indemnity and defense costs did not decline as expected. To a lesser degree, the Company also saw unfavorable development on certain assumed reinsurance accounts, driven by various account-specific factors, including filing activity experienced by the direct accounts. Based on this evaluation, the Company increased its net asbestos reserves for prior year development by $146 in second quarter 2015.
Review of Environmental Reserves
Beginning inSince 2017, the Company performshas performed its regular comprehensive annual review of environmental reserves in the fourth quarter. As part of its evaluation in the fourth quarter of 2017,2018, the Company reviewed all of its open direct domestic insurance accounts exposed to environmental liability, as well as assumed reinsurance accounts.
As a result of the 2018 fourth quarter review, the Company increased estimated reserves before NICO reinsurance by $71 due to increased defense and clean-up costs associated with increasingly complex remediation plans at Superfund sites, intensifying regulatory scrutiny by state agencies (particularly in the Pacific Northwest), and increased liability shares due to unavailability of other responsible parties. The increase in environmental reserves was offset by a $71 reinsurance recoverable under the NICO treaty.
As a result of the 2017 comprehensive annual review, the Company increased estimated reserves before NICO reinsurance by $102. This increase was offset by a reinsurance recoverable of $102 under the NICO cover. A substantial majority of the Company'sCompany’s direct environmental accounts trended as expected. However, a small percentage of the Company'sCompany’s direct accounts exhibited deterioration due to increased clean-up costs and liability shares associated with Superfund sites and sedimentsediments in waterways, as well as adverse legal rulings, most notably from jurisdictions in the Pacific Northwest.
During the 2016 comprehensive annual review, a substantial majority of the Company's direct environmental accounts trended as expected. However, a small percentage of the Company's direct accounts exhibited deterioration associated with the tendering of new sites for coverage, increased defense
costs stemming from individual bodily injury liability suits, and increased clean-up costs associated with waterways. Based on this evaluation, the Company increased its net environmental reserves for prior year development by $71 in second quarter 2016.
During the 2015 comprehensive annual review, a substantial majority of the Company's environmental exposures trended as expected, however the Company found loss and expense estimates for certain individual account exposures increased based upon an increase in clean-up costs, including at a handful of Superfund sites. In addition, new claim severity deteriorated, although frequency continued to decline as expected. The net effect of these account-specific changes as well as quarterly actuarial evaluations of new account emergence and historical loss and expense paid experience resulted in an increase of $57 in net environmental reserves for prior years development.
Major Categories of Asbestos Accounts
Direct asbestos exposures include both Known and Unallocated Direct Accounts.
Known Direct Accounts- includes both Major Asbestos Defendants and Non-Major Accounts, and represent approximately 63% of the Company's total Direct gross asbestos reserves as of December 31, 2017 compared to approximately 61% as of June 30, 2016. Major Asbestos Defendants have been defined as the “Top 70” accounts in Tillinghast's published Tiers 1 and 2 and Wellington accounts, while Non-Major accounts are comprised of all other direct asbestos accounts and largely represent smaller and more peripheral defendants. Major Asbestos Defendants have the fewest number of asbestos accounts and up through second quarter 2016 had included reserves related to PPG Industries, Inc. (“PPG”). In May 2016, the Company pre-paid its funding obligation in the amount of $315 as permitted under the settlement agreement, arising from participation in a 2002 settlement of asbestos liabilities of PPG. The Company's funding obligation approximated the amount reserved for this exposure.
Unallocated Direct Accounts- includes an estimate of the reserves necessary for asbestos claims related to direct insureds that have not previously tendered asbestos claims to the Company and exposures related to liability claims that may not be subject to an aggregate limit under the applicable policies. These exposures represent approximately 37% of the Company's Direct gross asbestos reserves as of December 31, 2017 compared to approximately 39% as of June 30, 2016.
| |
| • | Known Direct Accounts- includes both Major Asbestos Defendants and Non-Major Accounts, and represent approximately 69% of the Company's total Direct gross asbestos reserves as of December 31, 2018 compared to approximately 63% as of December 31, 2017. Major Asbestos Defendants have been defined as the “Top 70” accounts in Tillinghast's published Tiers 1 and 2 and Wellington accounts, while Non-Major accounts are comprised of all other direct asbestos accounts and largely represent smaller and more peripheral defendants. Major Asbestos Defendants have the fewest number of asbestos accounts and up through second quarter 2016 had included reserves related to PPG Industries, Inc. (“PPG”). In May 2016, the Company pre-paid its funding obligation in the amount of $315 as permitted under the settlement agreement, arising from participation in a 2002 settlement of asbestos liabilities of PPG. The Company's funding obligation approximated the amount reserved for this exposure. |
| |
| • | Unallocated Direct Accounts- includes an estimate of the reserves necessary for asbestos claims related to direct insureds that have not previously tendered asbestos claims to the Company and exposures related to liability claims that may not be subject to an aggregate limit under the applicable policies. These exposures represent approximately 31% of the Company's Direct gross asbestos reserves as of December 31, 2018 compared to approximately 37% as of December 31, 2017. |
Review of "All Other" Reserves in Property & Casualty Other Operations
In the fourth quarters of 2018, 2017 2016 and 2015,2016, the Company completed evaluations of certain of its non-asbestos and non-environmental reserves in Property & Casualty Other Operations, including its assumed reinsurance liabilities, unallocated loss adjustment expense reserves, and allowance for uncollectible reinsurance. Overall prior year development on all other reserves was immaterial with reserves increasing (decreasing) byresulted in increases (decreases) of $65, $18 ($20), and $29$(20), respectively for calendar years 2018, 2017 2016 and 2015.2016. Included in the 2018 adverse reserve development was a $38 increase in reserves for unallocated loss adjustment expenses, primarily due to an increase in expected aggregate claim handling costs associated with asbestos and environmental claims.
The Company provides an allowance for uncollectible reinsurance, reflecting management’s best estimate of reinsurance cessions that may be uncollectible in the future due to reinsurers’ unwillingness or inability to pay. During the second and third quarters of 2018, the Company increased the allowance by $19, largely driven by potential coverage disputes on a limited number of claims. During the fourth quarterquarters of 2018 and 2017, and second quartersquarter of 2016, and 2015, the Company completed its annual evaluations of the collectibilitycollectability of the reinsurance recoverables and the adequacy of the allowance for uncollectible reinsurance associated with older, long-term casualty liabilities reported in
Part II - Item 7. Management's Discussion and Analysis of Financial Condition and Results of Operations
Property & Casualty Other Operations. In conducting these evaluations, the Companycompany used its most recent detailed evaluations of ceded liabilities reported in the segment. The Company analyzed the overall credit quality of the Company’s reinsurers, recent trends in arbitration and litigation outcomes in disputes between cedants and reinsurers, and recent developments in commutation activity between reinsurers and cedants. The evaluations in the fourth quarter of 2017, and second quarters of 2016 and 2015, resulted in no material adjustments to the Property & Casualty Other Operations' overall ceded reinsurance reserves, including the
Part II - Item 7. Management's Discussion and Analysis of Financial Condition and Results of Operations
allowance for uncollectible reinsurance. As of December 31, 2018, 2017, 2016, and 20152016 the allowance for uncollectible reinsurance for Property & Casualty Other Operations totaled $105, $86 and $136, and $220 respectively. Reductions in the allowance since 2015 are primarily the result of actuarial reserve evaluations that have given greater weight to favorable collectibility experience in recent calendar year periods in estimating future collections, and to a lesser extent impacts from the sale of the Company's UK P&C run-off subsidiaries in 2017. Due to the inherent uncertainties as to collection and the length of time before reinsurance recoverables become due, particularly for older, long-term casualty liabilities, it is possible that future adjustments to the Company'sCompany’s reinsurance recoverables, net of the allowance, could be required.
Impact of Re-estimates on Property and Casualty Insurance Product Reserves
Estimating property and casualty insurance product reserves uses a variety of methods, assumptions and data elements.
Ultimate losses may vary materially from the current estimates. Many factors can contribute to these variations and the need to change the previous estimate of required reserve levels. Prior accident year reserve development is generally due to the emergence of additional facts that were not known or anticipated at the time of the prior reserve estimate and/or due to changes in interpretations of information and trends.
The table below shows the range of annual reserve re-estimates experienced by The Hartford over the past ten years. The amount of prior accident year development (as shown in the reserve roll-forward)rollforward) for a given calendar year is expressed as a percent of the beginning calendar year reserves, net of reinsurance. The ranges presented are significantly influenced by the facts and circumstances of each particular year and by the fact that only the last ten years are included in the range. Accordingly, these percentages are not intended to be a prediction of the range of possible future variability. For further discussion of the potential for variability in recorded loss reserves, see Preferred Reserving Methods by Line of Business - Impact of Changes in Key Assumptions on Reserve Volatility section.
Range of Prior Accident Year Unfavorable (Favorable) Development for the Ten Years EndedDecember 31, 20172018 |
| | | | |
| | Commercial Lines | Personal Lines | Property & Casualty Other Operations | Total Property & Casualty [1] |
Annual range of prior accident year unfavorable (favorable) development for the ten years ended December 31, 20172018 | (3.1%) - 1.0% | (6.9%) - 8.3% | 0.9% - 9.8% | (1.2%(1.1%) - 2.4% |
| |
| [1] | Excluding the reserve increases for asbestos and environmental reserves, over the past ten years, reserve re-estimates for total property and casualty insurance ranged from (2.5%) to 1.0%. |
The potential variability of the Company’s property and casualty insurance product reserves would normally be expected to vary by segment and the types of loss exposures insured by those segments. Illustrative factors influencing the potential reserve variability for each of the segments are discussed under Critical Accounting Estimates for Property & Casualty Insurance Product Reserves and Asbestos and Environmental Reserves. See the section entitled Property & Casualty Other Operations, Annual Reserve Reviews about the impact that the ADC retroactive reinsurance agreement with NICO may have on net reserve changes of asbestos and environmental reserves going forward.
The following table summarizes the effect of reserve re-estimates, net of reinsurance, on calendar year operations for the ten-year period ended December 31, 20172018. The total of each column details the amount of reserve re-estimates made in the indicated calendar year and shows the accident years to which the re-estimates are applicable. The amounts in the total column on the far right represent the cumulative reserve re-estimates during the ten year period ended December 31, 20172018 for the indicated accident year in each row.
Part II - Item 7. Management's Discussion and Analysis of Financial Condition and Results of Operations
Effect of Net Reserve Re-estimates on Calendar Year Operations
| | | | Calendar Year | Calendar Year |
| | 2008 | 2009 | 2010 | 2011 | 2012 | 2013 | 2014 | 2015 | 2016 | 2017 | Total | 2009 | 2010 | 2011 | 2012 | 2013 | 2014 | 2015 | 2016 | 2017 | 2018 | Total |
| By Accident Year | | |
| 2007 & Prior | $ | (226 | ) | $ | (147 | ) | $ | (158 | ) | $ | 166 |
| $ | (18 | ) | $ | 9 |
| $ | 358 |
| $ | 284 |
| $ | 296 |
| $ | 75 |
| $ | 639 |
| |
| 2008 | | (39 | ) | 1 |
| (31 | ) | (1 | ) | (37 | ) | (13 | ) | 43 |
| (5 | ) | 8 |
| (74 | ) | |
| 2008 & Prior | | $ | (186 | ) | $ | (157 | ) | $ | 135 |
| $ | (19 | ) | $ | (28 | ) | $ | 345 |
| $ | 327 |
| $ | 291 |
| $ | 83 |
| $ | (58 | ) | $ | 733 |
|
| 2009 | | (39 | ) | (13 | ) | (24 | ) | (8 | ) | 7 |
| 7 |
| 10 |
| (12 | ) | (72 | ) | | (39 | ) | (13 | ) | (24 | ) | (8 | ) | 7 |
| 7 |
| 10 |
| (12 | ) | 20 |
| (52 | ) |
| 2010 | | 245 |
| 3 |
| 61 |
| (22 | ) | 16 |
| 15 |
| 16 |
| 334 |
| | 245 |
| 3 |
| 61 |
| (22 | ) | 16 |
| 15 |
| 16 |
| 1 |
| 335 |
|
| 2011 | | 36 |
| 148 |
| (4 | ) | 12 |
| (6 | ) | 6 |
| 192 |
| | 36 |
| 148 |
| (4 | ) | 12 |
| (6 | ) | 6 |
| 11 |
| 203 |
|
| 2012 | | 19 |
| — |
| (55 | ) | (35 | ) | (12 | ) | (83 | ) | | 19 |
| — |
| (55 | ) | (35 | ) | (12 | ) | (15 | ) | (98 | ) |
| 2013 | | (98 | ) | (43 | ) | (29 | ) | (33 | ) | (203 | ) | | (98 | ) | (43 | ) | (29 | ) | (33 | ) | (2 | ) | (205 | ) |
| 2014 | | (14 | ) | 20 |
| (19 | ) | (13 | ) | | (14 | ) | 20 |
| (19 | ) | (54 | ) | (67 | ) |
| 2015 | | 191 |
| (41 | ) | 150 |
| | 191 |
| (41 | ) | (93 | ) | 57 |
|
| 2016 | | (29 | ) | (29 | ) | | (29 | ) | 14 |
| (15 | ) |
| 2017 | | | 9 |
| 9 |
|
| Increase (decrease) in net reserves | $ | (226 | ) | $ | (186 | ) | $ | (196 | ) | $ | 367 |
| $ | (4 | ) | $ | 192 |
| $ | 228 |
| $ | 250 |
| $ | 457 |
| $ | (41 | ) | $ | 841 |
| $ | (186 | ) | $ | (196 | ) | $ | 367 |
| $ | (4 | ) | $ | 192 |
| $ | 228 |
| $ | 250 |
| $ | 457 |
| $ | (41 | ) | $ | (167 | ) | $ | 900 |
|
Accident years 20072008 and Prior
The net reserve re-estimatesincreases in estimates of ultimate losses for accident years 20062008 and prior are driven mostly by increased reserves for asbestos and environmental reserves, and also forby increased estimates on assumed casualty reinsurance, workers’ compensationfor customs bonds and general liabilityother mass torts claims.
Partially offsetting these reserve increases for accident years 2007 and prior was favorable development mainly related toin general liability and workers’ compensation claims, driven, in part, by state regulatory reforms in California and Florida, underwriting actions and expense reduction initiatives.compensation. Additionally, reserves for professional liability were reduced due to a lower estimate of claim severity in both directors’ and officers’ and errors and omissions insurance claims. Reserves for personal automobile liability claims were reduced largely due to improvement in emerged claim severity.
Accident years 2008 andyear 2009
Estimates of ultimate losses have emerged favorably for accident years 2008 andyear 2009 mainly related to personal automobile liability.
Accident years 2010 and 2011
Unfavorable reserve re-estimateschanges in estimates of ultimate losses on accident years 2010 and 2011 were primarily related to workers' compensation and commercial automobile liability. Workers' compensation loss cost trends were higher than initially expected as an increase in frequency outpaced a moderation of severity trends. Unfavorable commercial automobile liability reserve re-estimates were driven by higher frequency of large loss bodily injury claims.
Accident years 2012 and 2013
Estimates of ultimate unpaid losses were decreased for accident years 2012 and 2013 due to favorable frequency and/or medical severity trends for workers’ compensation, favorable professional liability claim emergence, and lower frequency of late emerging general liability claims for the 2012 accident year. Favorable emergence of property lines of business, including catastrophes, for the 2013 accident year, is partially offset by increased reserves in automobile liability due to increased severity of large claims.
Accident years 2014 and 2015
Reserve changesChanges in estimates of ultimate losses for accident years 2014 and 2015 were largely driven by unfavorable frequency and
severity trends for personal and commercial automobile liability and increased severity of liability claims on package business, offset by favorable frequency and medical severity trends for workers' compensation.
Accident year 2016
ReservesEstimates of ultimate losses were decreased for the 2016 accident year largely due to reserve decreases on short-tail lines of business, where results emerge more quickly.quickly, somewhat offset by unfavorable reserve estimates for higher hazard general liability exposures due to increased frequency and severity trends.
Accident year 2017
Ultimate loss estimates were increased for the 2017 accident year mainly due to unfavorable reserve estimates in general liability, bond and commercial auto liability, largely offset by a reserve release related to catastrophes. General liability was related to higher hazard exposures which experienced increased frequency and severity trends. Unfavorable bond reserve re-estimates were driven by one large claim.
Group Benefit Long-term Disability ("LTD") Reserves, Net of Reinsurance
The Company establishes reserves for group life and accident & health contracts, including long-term disability coverage, for both outstanding reported claims and claims related to insured events that the Company estimates have been incurred but have not yet been reported. These reserve estimates can change over time based on facts and interpretations of circumstances, and consideration of various internal factors including The Hartford’s experience with similar cases, claim payment patterns, loss control programs and mix of business. In addition, the reserve estimates are influenced by various external factors including court decisions and economic conditions. The effects of inflation are implicitly considered in the reserving process. Long-tail claim liabilities are discounted because the payment pattern and the ultimate costs are reasonably fixed and determinable on an
Part II - Item 7. Management's Discussion and Analysis of Financial Condition and Results of Operations
individual claim basis. The majority of Group Benefits’ reserves are for LTD claimants who are known to be disabled and are currently receiving benefits. The Company held $6,807$6,767 and $4,687$6,807 of LTD unpaid losses and loss adjustment expenses, net of reinsurance, as of December 31, 2018 and 2017, and 2016, respectively, with the increase from 2016 to 2017 largely due to the acquisition of Aetna's U.S. group life and disability business.respectively.
Part II - Item 7. Management's Discussion and Analysis of Financial Condition and Results of Operations
Reserving Methodology
How Reserves are Set -A Disabled Life Reserve (DLR)("DLR") is calculated for each LTD claim. The DLR for each claim is the expected present value of all future benefit payments starting with the known monthly gross benefit which is reduced for estimates of the expected claim recovery due to return to work or claimant death, offsets from other income including offsets from Social Security benefits, and discounting where the discount rate is tied to expected investment yield at the time the claim is incurred. Estimated future benefit payments represent the monthly income benefit that is paid until recovery, death or expiration of benefits. Claim recoveries are estimated based on claim characteristics such as age and diagnosis and represent an estimate of benefits that will terminate, generally as a result of the claimant returning to work or being deemed able to return to work. For claims recently closed due to recovery, a portion of the DLR is retained for the possibility that the claim reopens upon further evidence of disability. In addition, a reserve for estimated unpaid claim expenses is included in the DLR.
The DLR also includes a liability for potential payments to pending claimants beyond the elimination period who have not yet been approved for LTD either because they have not yet satisfied the waiting (or elimination) period or because the approval or denial decision has not yet been made.LTD. In these cases, the present value of future benefits is reduced for the likelihood of recovery before benefit onset or claim denial based on Company experience. For claims recently closed due to denial, a portion of the DLR is retained for the possibility that the claim is later approved upon further evidence of disability.
Estimates for incurred but not reported (IBNR)("IBNR") claims are made by applying completion factors to the dollar amountexpected emerged experience by line of business. Included within IBNR are bulk reserves for claims reported but still within the waiting period, typically 3 or expected6 months depending on the reporting segment.contract. Completion factors are derived from standard actuarial techniques using triangles that display historical claim count emergence by incurral month. These estimates are reviewed for reasonableness and are adjusted for current trends and other factors expected to cause a change in claim emergence. The reserves include an estimate of unpaid claim expenses, including a provision for the cost of initial set-up of the claim once reported.
For all products, including LTD, there is a period generally ranging from two to twelve months, depending on the product and reporting segment,line of business, where emerged claims for an incurral year are not yet credible enough to be a basis for estimating reserves. In these cases, the ultimate loss is estimated using earned premium multiplied by an expected loss ratio based on pricing assumptions of claim incidence, claim severity, and earned pricing.
Current Trends Contributing to Reserve Uncertainty
In group insurance, Long-Term Disability (LTD)LTD has the longest pattern of loss emergence and the highest reserve amount. One significant risk to the reserve would be a slowdown in recoveries. In particular, the economic environment can affect the ability of a disabled employee to return-to-work and the length of time an employee receives disability benefits. Another significant risk is a change in benefit offsets. Often the Company pays a reduced benefit due to offsets from other income sources such as pensions or Social Security Disability Insurance (SSDI)("SSDI"). Possible changes to the frequency, timing, or amount of offsets, such as a change in SSDI
approval standards or benefit offerings, create a risk that the amount to settle open claims will exceed initial
estimates. Since the monthly income benefit for a claimant is established based on the individual’s salary at the time of disability and the level of coverages and benefits provided, inflation is not considered a significant risk to the reserve estimate. Few of the Company’s LTD policies provide for cost of living adjustments to the monthly income benefit.
Impact of Key Assumptions on Reserves
The key assumptions affecting our group life and accident & health reserves include:
Discount Rate -The discount rate is the interest rate at which expected future claim cash flows are discounted to determine the present value. A higher selected discount rate results in a lower reserve. If the discount rate is higher than our future investment returns, our invested assets will not earn enough investment income to cover the discount accretion on our claim reserves which would negatively affect our profit.profits. For each incurral year, the discount rates are estimated based on investment yields expected to be earned net of investment expenses. The incurral year is the year in which the claim is incurred and the estimated settlement pattern is determined. Once established, discount rates for each incurral year are unchanged except that LTD reserves assumed from the acquisition of Aetna's U.S. group life and disability business are all discounted using current rates as of the November 1, 2017 acquisition date. The weighted average discount rate on LTD reserves was 3.4% and 3.5% in 2018 and 4.3% in 2017, and 2016, respectively, with the decrease from 2016 to 2017 largely due to Aetna U.S. group life and disability business LTD reserves being discounted at current rates as of the acquisition date.respectively. Had the discount rate for each incurral year been 10 basis points lower at the time they were established, our Group BenefitsLTD unpaid loss and loss adjustment expense reserves would be higher by $34,$32, pretax, as of December 31, 2017.2018.
Claim Termination Rates (inclusive of mortality, recoveries, and expiration of benefits) -Claim termination rates are an estimate of the rate at which claimants will cease receiving benefits during a given calendar year. Terminations result from a number of factors, including death, recoveries and expiration of benefits. The probability that benefits will terminate in each future month for each claim is estimated using a predictive model that uses past Company experience, contract provisions, job characteristics and other claimant-specific characteristics such as diagnosis, time since disability began, and age. Actual claim termination experience will vary from period to period. Over the past 10 years, claim termination rates for a single incurral year have generally increased and have ranged from 7%6% below to 8%13% above current assumptions over that time period. For a single recent incurral year (such as 2017)2018), a one percent decrease in our assumption for LTD claim termination rates would increase our reserves by $7.$9. For all incurral years combined, as of December 31, 2017,2018, a one percent decrease in our assumption for our LTD claim termination rates would increase our Group Benefits unpaid losses and loss adjustment expense reserves by $20.$22.
Part II - Item 7. Management's Discussion and Analysis of Financial Condition and Results of Operations
Evaluation of Goodwill for Impairment
Goodwill balances are reviewed for impairment at least annually, or more frequently if events occur or circumstances change that would indicate that a triggering event for a potential impairment has occurred. The goodwill impairment test follows a two-step process. In the first step, the fair value of a reporting unit is compared to its carrying value. If the carrying value of a reporting unit exceeds its fair value, the second step of the impairment test is performed for purposes of measuring the impairment. In the second step, the fair value of the reporting unit is allocated to all of the assets and liabilities of the reporting unit to determine an implied goodwill value. If the carrying amount of the reporting unit’s goodwill exceeds the implied goodwill value, an impairment loss is recognized in an amount equal to that excess, not to exceed the goodwill carrying value.
The estimated fair value of each reporting unit incorporates multiple inputs into discounted cash flow calculations including assumptions that market participants would make in valuing the reporting unit. Assumptions include levels of economic capital, future business growth, earnings projections, assets under management for MutualHartford Funds, and the weighted average cost of capital used for purposes of discounting. Decreases in business growth, decreases in earnings projections and increases in the weighted average cost of capital will all cause a reporting unit’s fair value to decrease, increasing the possibility of impairment.
A reporting unit is defined as an operating segment or one level below an operating segment. The Company’s reporting units, for which goodwill has been allocated include Small Commercialsmall commercial within the Commercial Lines segment, Group Benefits, Personal Lines and MutualHartford Funds.
The carrying value of goodwill is $1,290 as of December 31, 20172018 and is comprised of $38 for Small Commercial,small commercial, $272 for MutualHartford Funds, $861 for Group Benefits and $119 for Personal Lines.
The annual goodwill assessment for the Small Commercial, Mutualsmall commercial, Hartford Funds, Group Benefits and Personal Lines reporting units was completed as of October 31, 2017,2018, and resulted in no write-downs of goodwill for the year ended December 31, 2017.2018. All reporting units passed the first step of the annual impairment test with a significant margin. For information regarding the 20162017 and 20152016 impairment tests see Note 10 -Goodwill & Other Intangible Assets of Notes to Consolidated Financial Statements.
Valuation of Investments and Derivative Instruments
Fixed Maturities, Equity Securities, Short-term Investments and Free-standing Derivatives
The Company generally determines fair values using valuation techniques that use prices, rates, and other relevant information evident from market transactions involving identical or similar instruments. Valuation techniques also include, where appropriate, estimates of future cash flows that are converted into a single discounted amount using current market expectations. The Company uses a "waterfall" approach comprised of the following pricing sources which are listed in
priority order: quoted prices, prices from third-party pricing services, internal matrix pricing, and independent broker quotes. The fair value of free-standing derivative instruments are determined primarily using a discounted cash flow model or option model technique and incorporate counterparty credit risk. In some cases, quoted market prices for exchange-traded transactions and transactions cleared through central clearing houses ("OTC-cleared") may be used and in other cases independent broker quotes may be used. For further discussion, see the Fixed Maturities, Equity Securities, Short-term Investments and Free-standing Derivatives section in Note 5 - Fair Value Measurements of Notes to Consolidated Financial Statements.
Evaluation of OTTI on Available-for-sale Securities and Valuation Allowances on Mortgage Loans
Each quarter, a committee of investment and accounting professionals evaluates investments to determine if an other-than-temporary impairment (“impairment”) is present for AFS securities or a valuation allowance is required for mortgage loans. This evaluation is a quantitative and qualitative process, which is subject to risks and uncertainties. For further discussion of the accounting policies, see the Significant Investment Accounting Policies Section in Note 1 - Basis of Presentation and Significant Accounting Policies of Notes to Consolidated Financial Statements. For a discussion of impairments recorded, see the Other-than-temporary Impairments within the Investment Portfolio Risks and Risk Management section of the MD&A.
Valuation Allowance on Deferred Tax Assets
Deferred tax assets represent the tax benefit of future deductible temporary differences and certain tax carryforwards. Deferred tax assets are measured using the enacted tax rates expected to be in effect when such benefits are realized if there is no change in tax law. Under U.S. GAAP, we test the value of deferred tax assets for impairment on a quarterly basis at the entity level within each tax jurisdiction, consistent with our filed tax returns. Deferred tax assets are reduced by a valuation allowance if, based on the weight of available evidence, it is more likely than not that some portion, or all, of the deferred tax assets will not be realized. The determination of the valuation allowance for our deferred tax assets requires management to make certain judgments and assumptions. In evaluating the ability to recover deferred tax assets, we have considered all available evidence as of December 31, 20172018, including past operating results, forecasted earnings, future taxable income, and prudent and feasible tax planning strategies. In the event we determine it is more likely than not that we will not be able to realize all or part of our deferred tax assets in the future, an increase to the valuation allowance would be charged to earnings in the period such determination is made. Likewise, if it is later determined that it is more likely than not that those deferred tax assets would be realized, the previously provided valuation allowance would be reversed. Our judgments and assumptions are subject to change given the inherent uncertainty in predicting future performance and specific industry and investment market conditions.
As of December 31, 20172018 and December 31, 2016,2017, the Company had no valuation allowance. The reduction in the valuation allowance in 2016 stems primarily from taxable gains on the
Part II - Item 7. Management's Discussion and Analysis of Financial Condition and Results of Operations
allowance in 2016 stems primarily from taxable gains on the termination of derivatives during the period. The Company’s net operating loss carryovers, if unused, would expire between 2026 and 2036. As of December 31, 2018, the Company projects there will be sufficient future taxable income to fully recover the remainder of its loss carryovers, though the Company's estimate of the likely realization may change over time. As of December 31, 2018, the Company had no capital lossAMT credit carryovers as of December 31, 2017. As a result of the Tax Cuts and Jobs Act ("Tax Reform") enacted by the federal government on December 22, 2017, the Company reclassified AMT credits of $790, net of a sequestration fee payable, from deferred taxes to$841 which are reflected as a current income tax receivable sincewithin Other Assets in the law allowsaccompanying consolidated balance sheet. AMT credits may be used to offset a regular tax liability for any taxable year beginning after December 31, 2017, and are refundable at an amount equal to 50 percent of the excess of the minimum tax credit for the refundtaxable year over the amount of AMTthe credit allowable for the year against regular tax liability. Any remaining credits over time but no later thannot used against regular tax liability are refundable in the 2021 tax year to be realized in 2022. For additional information about Tax Reform, see Note - 16, Income Taxes of Notes to Consolidated Financial Statements.
In assessing the need for a valuation allowance, management considered future taxable temporary difference reversals, future taxable income exclusive of reversing temporary differences and carryovers, taxable income in open carry back years and other tax planning strategies. From time to time, tax planning strategies could include holding a portion of debt securities with market value losses until recovery, altering the level of tax exempt securities held, making investments which have specific tax characteristics, and business considerations such as asset-liability matching. Management views such tax planning strategies as prudent and feasible, and would implement them, if necessary, to realize the deferred tax assets.
Contingencies Relating to Corporate Litigation and Regulatory Matters
Management evaluates each contingent matter separately. A loss is recorded if probable and reasonably estimable. Management
establishes reserves for these contingencies at its “best estimate,” or, if no one number within the range of possible losses is more probable than any other, the Company records an estimated reserve at the low end of the range of losses.
The Company has a quarterly monitoring process involving legal and accounting professionals. Legal personnel first identify outstanding corporate litigation and regulatory matters posing a reasonable possibility of loss. These matters are then jointly reviewed by accounting and legal personnel to evaluate the facts and changes since the last review in order to determine if a provision for loss should be recorded or adjusted, the amount that should be recorded, and the appropriate disclosure. The outcomes of certain contingencies currently being evaluated by the Company, which relate to corporate litigation and regulatory matters, are inherently difficult to predict, and the reserves that have been established for the estimated settlement amounts are subject to significant changes. Management expects that the ultimate liability, if any, with respect to such lawsuits, after consideration of provisions made for estimated losses, will not be material to the consolidated financial condition of the Company. In view of the uncertainties regarding the outcome of these matters, as well as the tax-deductibility of payments, it is possible that the ultimate cost to the Company of these matters could exceed the reserve by an amount that would have a material adverse effect on the Company’s consolidated results of operations and liquidity in a particular quarterly or annual period.
Part II - Item 7. Management's Discussion and Analysis of Financial Condition and Results of Operations
SEGMENT OPERATING SUMMARIES
Results of Operations
Underwriting Summary
| | | | 2017 | 2016 | 2015 | 2018 | 2017 | 2016 |
| Written premiums | $ | 6,956 |
| $ | 6,732 |
| $ | 6,625 |
| $ | 7,136 |
| $ | 6,956 |
| $ | 6,732 |
|
| Change in unearned premium reserve | 91 |
| 81 |
| 114 |
| 89 |
| 91 |
| 81 |
|
| Earned premiums | 6,865 |
| 6,651 |
| 6,511 |
| 7,047 |
| 6,865 |
| 6,651 |
|
| Fee income | 37 |
| 39 |
| 40 |
| 34 |
| 37 |
| 39 |
|
| Losses and loss adjustment expenses | | |
| Current accident year before catastrophes | 3,961 |
| 3,766 |
| 3,712 |
| 4,037 |
| 3,961 |
| 3,766 |
|
| Current accident year catastrophes [1] | 383 |
| 200 |
| 121 |
| 275 |
| 383 |
| 200 |
|
| Prior accident year development [1] | (22 | ) | 28 |
| 53 |
| (200 | ) | (22 | ) | 28 |
|
| Total losses and loss adjustment expenses | 4,322 |
| 3,994 |
| 3,886 |
| 4,112 |
| 4,322 |
| 3,994 |
|
| Amortization of DAC | 1,009 |
| 973 |
| 951 |
| 1,048 |
| 1,009 |
| 973 |
|
| Underwriting expenses | 1,348 |
| 1,230 |
| 1,218 |
| 1,369 |
| 1,347 |
| 1,230 |
|
| Amortization of other intangible assets | | 4 |
| 1 |
| — |
|
| Dividends to policyholders | 35 |
| 15 |
| 17 |
| 23 |
| 35 |
| 15 |
|
| Underwriting gain | 188 |
| 478 |
| 479 |
| 525 |
| 188 |
| 478 |
|
| Net servicing income | 1 |
| 2 |
| 2 |
| 2 |
| 1 |
| 2 |
|
| Net investment income [2] | 949 |
| 917 |
| 910 |
| 997 |
| 949 |
| 917 |
|
| Net realized capital gains (losses) [2] | 103 |
| 13 |
| (6 | ) | (43 | ) | 103 |
| 13 |
|
| Other income (expenses) | 1 |
| (1 | ) | 2 |
| (2 | ) | 1 |
| (1 | ) |
| Income from continuing operations before income taxes | 1,242 |
| 1,409 |
| 1,387 |
| |
| Income before income taxes | | 1,479 |
| 1,242 |
| 1,409 |
|
| Income tax expense [3] | 377 |
| 415 |
| 403 |
| 267 |
| 377 |
| 415 |
|
| Income from continuing operations, net of tax | 865 |
| 994 |
| 984 |
| |
| Income from discontinued operations, net of tax | — |
| — |
| 7 |
| |
| Net income | $ | 865 |
| $ | 994 |
| $ | 991 |
| $ | 1,212 |
| $ | 865 |
| $ | 994 |
|
| |
| [1] | For discussion of current accident year catastrophes and prior accident year development, see MD&A - Critical Accounting Estimates, Total Property and Casualty Insurance Product Reserves Development.Development, Net of Reinsurance. |
| |
| [2] | For discussion of consolidated investment results, see MD&A - Investment Results, Net Investment Income (Loss) and Net Realized Capital Gains (Losses).Results. |
| |
| [3] | 2017 includes $25For discussion of income tax expense primarily from reducing net deferred tax assets due to the reduction in the corporate Federal income tax rate from 35% to 21%. For further discussion,taxes, see Note 16 - Income Taxes of Notes to Consolidated Financial Statements.
|
Premium Measures [1]
| | | | 2017 | 2016 | 2015 | 2018 | 2017 | 2016 |
| New business premium | $ | 1,183 |
| $ | 1,140 |
| $ | 1,121 |
| $ | 1,298 |
| $ | 1,183 |
| $ | 1,140 |
|
| Standard commercial lines policy count retention | 84 | % | 84 | % | 84 | % | 82 | % | 84 | % | 84 | % |
| Standard commercial lines renewal written price increase | 3.2 | % | 2.2 | % | 2.2 | % | 2.1 | % | 3.2 | % | 2.2 | % |
| Standard commercial lines renewal earned price increase | 2.9 | % | 2.3 | % | 3.5 | % | 3.0 | % | 2.8 | % | 2.3 | % |
| Standard commercial lines policies in-force as of end of period (in thousands) | 1,338 |
| 1,346 |
| 1,325 |
| 1,340 |
| 1,338 |
| 1,346 |
|
| |
| [1] | Standard commercial lines consists of small commercial and middle market. Standard commercial premium measures exclude Maxum, higher hazard general liability in middle market programs and livestock lines of business. |
Part II - Item 7. Management's Discussion and Analysis of Financial Condition and Results of Operations
| | | | 2017 | 2016 | 2015 | 2018 | 2017 | 2016 |
| Loss and loss adjustment expense ratio | | |
| Current accident year before catastrophes | 57.7 |
| 56.6 |
| 57.0 |
| 57.3 |
| 57.7 |
| 56.6 |
|
| Current accident year catastrophes | 5.6 |
| 3.0 |
| 1.9 |
| 3.9 |
| 5.6 |
| 3.0 |
|
| Prior accident year development | (0.3 | ) | 0.4 |
| 0.8 |
| (2.8 | ) | (0.3 | ) | 0.4 |
|
| Total loss and loss adjustment expense ratio | 63.0 |
| 60.1 |
| 59.7 |
| 58.4 |
| 63.0 |
| 60.1 |
|
| Expense ratio | 33.8 |
| 32.5 |
| 32.7 |
| 33.9 |
| 33.8 |
| 32.5 |
|
| Policyholder dividend ratio | 0.5 |
| 0.2 |
| 0.3 |
| 0.3 |
| 0.5 |
| 0.2 |
|
| Combined ratio | 97.3 |
| 92.8 |
| 92.6 |
| 92.6 |
| 97.3 |
| 92.8 |
|
| Current accident year catastrophes and prior year development | 5.3 |
| 3.4 |
| 2.7 |
| 1.1 |
| 5.3 |
| 3.4 |
|
| Underlying combined ratio | 92.0 |
| 89.4 |
| 90.0 |
| 91.5 |
| 92.0 |
| 89.4 |
|
20182019 Outlook
The Company expects higher Commercial Lines written premiums in 2018,2019, driven by increasescontinued strong policy retention in small commercial and national accounts, growth in industry verticals in middle market and an increase in new business across Small Commercial Middle Market and Specialty Commercial, reflecting a mixLines. Management expects positive renewal written pricing in all lines of business except workers' compensation, which is expected continuedto be flat to down modestly. In addition to the impact of pricing trends, written premium growth in 2019 will depend on economic conditions as economic growth distribution expansion, and the effect of competitive conditions on written pricing. Management expects the written premium increases will be driven by higher new business, partially offset by lower renewal premium. In workers’ compensation, market conditions areis expected to put downward pressure on rates and increase competition for new business. In auto, profit improvement initiatives will drive lower retention, partially offset by higher written pricing. moderate in 2019.
Pricing varies significantly by product line with mid-singlelow-to-mid single digit pricing increases expected in property and general liability and higher written pricing increases expected in commercial automobile. In workers’ compensation, given favorable profitability trends, rates are expected to be flat to declining.decline in 2019.
The Company expects the Commercial Lines combined ratio will be between approximately 93.094.5 and 95.596.5 for 2018,2019, compared to 97.392.6 in 2017,2018, largely due to higherlower favorable prior year development, partially offset by lower catastrophe losses incurredexpected in 2017.2019. The underlying combined ratio is expected to decreasebe flat to slightly due to the effect of continuedhigher as earned pricing increases may not keep pace with moderate increases in loss costs, and moderate average claim severity, but the improvement is subjectCompany continues to changesinvest in market pricing and loss cost trends.the business . Current accident year catastrophes are assumed to be 2.63.0 points of the combined ratio in 20182019 compared to 5.63.9 points in 2017.2018.
Net Income
Year ended December 31, 2018 compared to the year ended December 31, 2017
Net income increased in 2018 due to a higher underwriting gain, a lower corporate Federal income tax rate and, to a lesser extent, an increase in net investment income, partially offset by a shift from net realized capital gains in 2017 to net realized capital losses in 2018. (For further discussion of investment results, see MD&A - Investment Results).
Year ended December 31, 2017 compared to the year ended December 31, 2016
Net income decreased in 2017 due to a lower underwriting gain, partially offset by increases in net investment income and net realized capital gains. For(For further discussion of investment results, see MD&A - Investment Results, Net Investment Income (Loss)Results).
Underwriting Gain
Year ended December 31, 20162018 compared to the year ended December 31, 20152017
Net incomeUnderwriting gainincreased in 20162018 primarily due to a shiftmore favorable prior accident year reserve development in 2018 compared to net realized capital gains in the2017, lower current accident year from net realized capital losses in the prior yearcatastrophes, and higher net investment income.earned premium, partially offset by higher underwriting expenses, including higher amortization of DAC.
Underwriting Gain
Part II - Item 7. Management's Discussion and Analysis of Financial Condition and Results of Operations
Year ended December 31, 2017 compared to the year ended December 31, 2016
Underwriting gaindecreased in 2017 primarily due to higher catastrophe losses and higher underwriting expenses largely driven by an increase in variable incentive compensation and higher IT costs. Also contributing to the decrease were higher current accident year loss costs for workers’ compensation, general liability and non-catastrophe property, offset by the effect of earned premium growth and a change from unfavorable prior accident year development in 2016 to favorable development in 2017.
Earned Premiums
| |
| [1] | Other of $45, $46, and $42 for 2018, 2017, and 2016, respectively, is included in the total. |
Part II - Item 7. Management's Discussion and Analysis of Financial Condition and Results of Operations
Year ended December 31, 20162018 compared to the year ended December 31, 20152017
Underwriting gain decreased slightly driven by higher lossesEarned premiums increased in 2018 reflecting written premium growth over the preceding twelve months.
Written premiums increased in 2018 primarily due to growth in middle market, small commercial and loss adjustment expensesspecialty commercial. In standard commercial lines, renewal written price increases declined in 2018, mostly attributable to bigger rate decreases in small commercial workers' compensation. New business and higher underwriting expenses,renewal written premium increased across most lines of business, particularly in middle market, partially offset by earneddeclines in small commercial workers' compensation.
Small commercial written premium growth.increased in 2018, primarily driven by the business acquired under a renewal
Earned Premiums
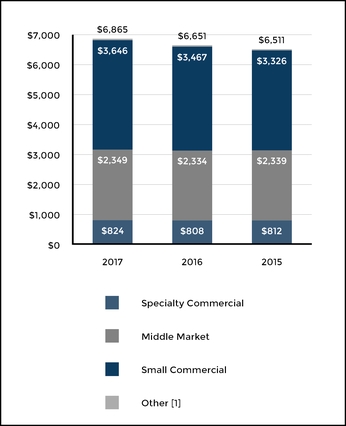
rights agreement with Farmers Group to acquire its Foremost-branded small commercial business. The increase in new business premium was largely offset by the decline in renewal premium. The decline in renewal premium was driven by the effect of lower policy retention, partially offset by renewal written price increases.
| |
[1] | Other of $46, $42, and $34 for 2017, 2016, and 2015, respectively, is included in the total.
|
Middle market written premium growth in 2018 was primarily due to strong new business growth, improved retention and higher renewal written price increases.
Specialty commercial written premium increased in 2018 driven by growth in financial products and bond, partially offset by a decline in National Accounts.
Year ended December 31, 2017 compared to the year ended December 31, 2016
Earned premiums increased in 2017 reflecting written premium growth over the preceding twelve months.
Written premiums increased in 2017 primarily due to growth in Small Commercial.small commercial.
Small Commercialcommercial written premium growth for 2017 was primarily due to higher renewal premium driven by renewal written price increases and growth from the acquisition of Maxum, partially offset by lower new business premium, excluding Maxum, and the effect of lower policy retention.
Middle Marketmarket written premiums in 2017 were up modestly as higher new and renewal premium was partially offset by modestly higher property reinsurance costs.
Specialty Commercialcommercial written premiums in 2017 were up slightly as growth in Bond was largely offset by new business declines in National Accounts.
Year ended December 31, 2016 compared to the year ended December 31, 2015
Earned premiums increased in 2016 reflecting written premium growth over the preceding twelve months.
Written premiums increased in 2016 due to growth in Small Commercial. Renewal written pricing increases and policy retention for standard commercial lines were both unchanged in 2016 compared to 2015.
Small Commercial increased primarily due to workers’ compensation driven by higher new business, renewal and audit premium, and Spectrum package business driven by higher renewal premium, as well as the acquisition of Maxum.
The decrease in Middle Market was driven primarily by lower new business, renewal and endorsement premium in workers’ compensation, and lower new business and renewal premium in general liability and specialty programs, partially offset by higher new business and renewal premium in construction.
Specialty Commercial decreased primarily as a result of lower retrospective premium on loss sensitive business in national accounts.
Renewal written pricing increases averaged 2% in standard commercial, which included 3% for Small Commercial and 1% for Middle Market.
Loss and LAE Ratio before Catastrophes and Prior Accident Year Development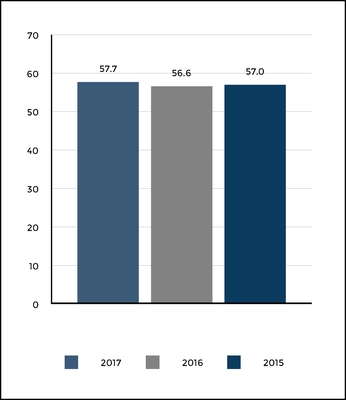
Part II - Item 7. Management's Discussion and Analysis of Financial Condition and Results of Operations
Loss and LAE Ratio before Catastrophes and Prior Accident Year Development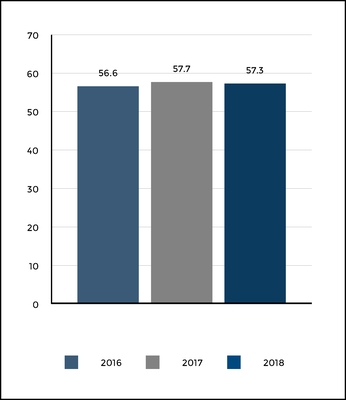
Year ended December 31, 2018 compared to the year ended December 31, 2017
Loss and LAE ratio before catastrophes and prior accident year developmentdecreased slightly in 2018, primarily due to a lower loss and loss adjustment expense ratio in general liability and commercial auto. The current accident year loss and loss adjustment expense ratio for workers' compensation was relatively flat as the effect of higher claim frequency was largely offset by the benefit of increased audit premium driven by higher than initially estimated insured payroll.
Year ended December 31, 2017 compared to the year ended December 31, 2016
Loss and LAE ratio before catastrophes and prior accident year developmentincreased in 2017, primarily due to a higher loss and loss adjustment expense ratio in both workers' compensation and general liability, as well as higher commercial property losses in Middle Market.middle market. The workers’ compensation current accident year loss ratio deteriorated from 2016 to 2017 as increases in average claim severity outpaced the effect of earned pricing and a modest reduction in loss cost frequency.
Catastrophes and Prior Accident Year Development
Year ended December 31, 20162018 compared to the year ended December 31, 20152017
LossCurrent accident year catastrophe losses for 2018 were lower than in 2017 with catastrophes in 2018 primarily from hurricanes Florence and LAE ratioMichael in the Southeast, wildfires in California, wind and hail storms in Colorado, and various wind storms and winter storms across the country. Catastrophe losses in 2018 are net of an estimated reinsurance recoverable of $28 under the 2018 Property Aggregate reinsurance treaty that was allocated to Commercial Lines. Catastrophe losses in 2017 were primarily from hurricanes Harvey and Irma as well as from wind and hail events in the Midwest, Texas and Colorado.
Prior accident year development was a net favorable $200, before tax, for 2018 compared to favorable $22, before tax, for 2017. Net reserve decreases for 2018 were primarily related to decreases for workers' compensation, catastrophes and prior accident year development decreased in 2016, as compared to the prior year period, primarily due to a lower loss andunallocated loss adjustment expense ratio in workers' compensation, driven by favorable frequency,reserves, partially offset by an increase in general liability reserves. Estimated losses for 2017 catastrophe events in Commercial Lines decreased by $93 in 2018 resulting in a higher loss and loss adjustment expense ratiodecrease in commercial automobile, driven by elevated frequency and severity.reinsurance recoverables of $43 as the Company no longer expects to recover under the 2017 Property Aggregate reinsurance treaty.
Catastrophes and Prior Accident Year Development
Year ended December 31, 2017 compared to the year ended December 31, 2016
Current accident year catastrophe lossesfor 2017 were primarily from hurricanes Harvey and Irma as well as from wind and hail events in the Midwest, Texas and Colorado. Catastrophe losses for 2016 were primarily due to wind and hail events and winter storms across various U.S. geographic regions.
Prior accident year development was favorable in 2017 compared to unfavorable prior accident year development
Part II - Item 7. Management's Discussion and Analysis of Financial Condition and Results of Operations
in 2016. Net reserve decreases for 2017 were primarily related to reduced loss reserve estimates for workers' compensation and small commercial package business, partially offset by reservesreserve increases for bond.
Year ended December 31, 2016 compared to the year ended December 31, 2015
Current accident year catastrophe lossestotaled $200, before tax, in 2016, compared to $121, before tax, in 2015. Catastrophe losses for both years were primarily due to wind and hail events and winter storms across various U.S. geographic regions.
Prior accident year development of $28, before tax, was unfavorable in 2016, compared to unfavorable prior accident year development of $53, before tax, in 2015. Net reserve increases in 2016 were primarily related to package business, general liability and commercial automobile liability, largely offset by a decrease in reserves for workers’ compensation, professional liability and uncollectible reinsurance.
Part II - Item 7. Management's Discussion and Analysis of Financial Condition and Results of Operations
Results of Operations
Underwriting Summary
| | | | 2017 | 2016 | 2015 | 2018 | 2017 | 2016 |
| Written premiums | $ | 3,561 |
| $ | 3,837 |
| $ | 3,918 |
| $ | 3,276 |
| $ | 3,561 |
| $ | 3,837 |
|
| Change in unearned premium reserve | (129 | ) | (61 | ) | 45 |
| (123 | ) | (129 | ) | (61 | ) |
| Earned premiums | 3,690 |
| 3,898 |
| 3,873 |
| 3,399 |
| 3,690 |
| 3,898 |
|
| Fee income | 44 |
| 39 |
| 37 |
| 40 |
| 44 |
| 39 |
|
| Losses and loss adjustment expenses | | |
| Current accident year before catastrophes | 2,584 |
| 2,808 |
| 2,578 |
| 2,249 |
| 2,584 |
| 2,808 |
|
| Current accident year catastrophes [1] | 453 |
| 216 |
| 211 |
| 546 |
| 453 |
| 216 |
|
| Prior accident year development [1] | (37 | ) | 151 |
| (21 | ) | (32 | ) | (37 | ) | 151 |
|
| Total losses and loss adjustment expenses | 3,000 |
| 3,175 |
| 2,768 |
| 2,763 |
| 3,000 |
| 3,175 |
|
| Amortization of DAC | 309 |
| 348 |
| 359 |
| 275 |
| 309 |
| 348 |
|
| Underwriting expenses | 581 |
| 603 |
| 665 |
| 611 |
| 577 |
| 599 |
|
| Underwriting (Loss) Gain | (156 | ) | (189 | ) | 118 |
| |
| Amortization of other intangible assets | | 4 |
| 4 |
| 4 |
|
| Underwriting loss | | (214 | ) | (156 | ) | (189 | ) |
| Net servicing income [2] | 16 |
| 20 |
| 22 |
| 16 |
| 16 |
| 20 |
|
| Net investment income [3] | 141 |
| 135 |
| 128 |
| 155 |
| 141 |
| 135 |
|
| Net realized capital gains [3] | 15 |
| 2 |
| 4 |
| |
| Other income [4] | 1 |
| — |
| 15 |
| |
| Net realized capital gains (losses) [3] | | (7 | ) | 15 |
| 2 |
|
| Other income (expenses) | | (1 | ) | 1 |
| — |
|
| Income (loss) before income taxes | 17 |
| (32 | ) | 287 |
| (51 | ) | 17 |
| (32 | ) |
| Income tax expense (benefit) [5] | 26 |
| (23 | ) | 88 |
| |
| Net (loss) income | $ | (9 | ) | $ | (9 | ) | $ | 199 |
| |
| Income tax expense (benefit) [4] | | (19 | ) | 26 |
| (23 | ) |
| Net loss | | $ | (32 | ) | $ | (9 | ) | $ | (9 | ) |
| |
| [1] | For discussion of current accident year catastrophes and prior accident year development, see MD&A - Critical Accounting Estimates, Total Property and Casualty Insurance Product Reserves, Development.Net of Reinsurance. |
| |
| [2] | Includes servicing revenues of $84, $85, $86, and $86 for 20172018, 20162017, and 20152016, respectively and includes servicing expenses of $68, $69, and $66 and $64 for 20172018, 20162017, and 20152016, respectively. |
| |
| [3] | For discussion of consolidated investment results, see MD&A - Investment Results, Net Investment Income (Loss) and Net Realized Capital Gains (Losses).Results. |
| |
| [4] | Includes a benefit of $17, before tax, for the year ended December 31, 2015, from the resolution of litigation. |
| |
[5] | 2017 includes $33For discussion of income tax expense primarily from reducing net deferred tax assets due to the reduction in the corporate Federal income tax rate from 35% to 21%. For further discussion,taxes, see Note 16 - Income Taxes of Notes to Consolidated Financial Statements.
|
Written and Earned Premiums
| | | Written Premiums | 2017 | 2016 | 2015 | 2018 | 2017 | 2016 |
| Product Line | | |
| Automobile | $ | 2,497 |
| $ | 2,694 |
| $ | 2,721 |
| $ | 2,273 |
| $ | 2,497 |
| $ | 2,694 |
|
| Homeowners | 1,064 |
| 1,143 |
| 1,197 |
| 1,003 |
| 1,064 |
| 1,143 |
|
| Total | $ | 3,561 |
| $ | 3,837 |
| $ | 3,918 |
| $ | 3,276 |
| $ | 3,561 |
| $ | 3,837 |
|
| Earned Premiums | | | | |
| Product Line | | | | |
| Automobile | $ | 2,584 |
| $ | 2,720 |
| $ | 2,671 |
| $ | 2,369 |
| $ | 2,584 |
| $ | 2,720 |
|
| Homeowners | 1,106 |
| 1,178 |
| 1,202 |
| 1,030 |
| 1,106 |
| 1,178 |
|
| Total | $ | 3,690 |
| $ | 3,898 |
| $ | 3,873 |
| $ | 3,399 |
| $ | 3,690 |
| $ | 3,898 |
|
Part II - Item 7. Management's Discussion and Analysis of Financial Condition and Results of Operations
Premium Measures
| | | | 2017 | 2016 | 2015 | 2018 | 2017 | 2016 |
| Policies in-force end of period (in thousands) | | |
| Automobile | 1,702 |
| 1,965 |
| 2,062 |
| 1,510 |
| 1,702 |
| 1,965 |
|
| Homeowners | 1,038 |
| 1,176 |
| 1,272 |
| 927 |
| 1,038 |
| 1,176 |
|
| New business written premium | | |
| Automobile | $ | 152 |
| $ | 311 |
| $ | 422 |
| $ | 169 |
| $ | 152 |
| $ | 311 |
|
| Homeowners | $ | 44 |
| $ | 74 |
| $ | 110 |
| $ | 46 |
| $ | 44 |
| $ | 74 |
|
| Policy count retention | | | | |
| Automobile | 81 | % | 84 | % | 84 | % | 82 | % | 81 | % | 84 | % |
| Homeowners | 83 | % | 84 | % | 85 | % | 83 | % | 83 | % | 84 | % |
| Renewal written price increase | | |
| Automobile | 11.0 | % | 7.6 | % | 5.7 | % | 7.2 | % | 10.9 | % | 7.6 | % |
| Homeowners | 8.9 | % | 8.0 | % | 7.0 | % | 9.7 | % | 8.9 | % | 8.0 | % |
| Renewal earned price increase | | |
| Automobile | 9.6 | % | 6.3 | % | 5.1 | % | 9.6 | % | 9.6 | % | 6.3 | % |
| Homeowners | 8.5 | % | 7.6 | % | 6.8 | % | 9.3 | % | 8.5 | % | 7.6 | % |
Underwriting Ratios
| | | | 2017 | 2016 | 2015 | 2018 | 2017 | 2016 |
| Loss and loss adjustment expense ratio | | |
| Current accident year before catastrophes | 70.0 |
| 72.0 |
| 66.6 |
| 66.2 |
| 70.0 |
| 72.0 |
|
| Current accident year catastrophes | 12.3 |
| 5.5 |
| 5.4 |
| 16.1 |
| 12.3 |
| 5.5 |
|
| Prior accident year development | (1.0 | ) | 3.9 |
| (0.5 | ) | (0.9 | ) | (1.0 | ) | 3.9 |
|
| Total loss and loss adjustment expense ratio | 81.3 |
| 81.5 |
| 71.5 |
| 81.3 |
| 81.3 |
| 81.5 |
|
| Expense ratio | 22.9 |
| 23.4 |
| 25.5 |
| 25.0 |
| 22.9 |
| 23.4 |
|
| Combined ratio | 104.2 |
| 104.8 |
| 97.0 |
| 106.3 |
| 104.2 |
| 104.8 |
|
| Current accident year catastrophes and prior year development | 11.3 |
| 9.4 |
| 4.9 |
| 15.2 |
| 11.3 |
| 9.4 |
|
| Underlying combined ratio | 93.0 |
| 95.4 |
| 92.0 |
| 91.2 |
| 93.0 |
| 95.4 |
|
Product Combined Ratios
| | | | 2017 | 2016 | 2015 | 2018 | 2017 | 2016 |
| Automobile | | |
| Combined ratio | 101.6 |
| 111.6 |
| 99.4 |
| 98.6 |
| 101.6 |
| 111.6 |
|
| Underlying combined ratio | 99.7 |
| 103.9 |
| 99.0 |
| 98.2 |
| 99.7 |
| 103.9 |
|
| Homeowners | | |
| Combined ratio | 110.4 |
| 89.3 |
| 92.1 |
| 124.3 |
| 110.4 |
| 89.3 |
|
| Underlying combined ratio | 77.1 |
| 75.9 |
| 76.8 |
| 75.1 |
| 77.1 |
| 75.9 |
|
20182019 Outlook
In 2018,2019, the Company expects the ratelevel of pricing increases for automobile and homeowners across the industry to decrease, slightly, as loss cost trends have moderated. Accordingly, the Company expects written pricing increases in 2018 for both automobile and homeowners2019 to be in the mid single-digits for automobile and high single-digits for homeowners. Written premium is expected to decline slightly below written pricing increases for 2017. Managementin 2019 as non-renewal of premium more than offsets new business growth, particularly in the agency channel. The Company expects continued automobile profitability improvement in 2018 as loss cost frequency and severity have moderated and the book of business continues to benefit from earned pricing increases. While the Company will continue to execute on multiple
profitability improvement initiatives in personal automobile in 2018, the Company also plans to drive new business growth in selectmore states in 2019, particularly in the direct channel. Due to those actions, the Company expects a low-single digit decline in Personal Lines written premiums in 2018, with AARP direct premiums expected to be flat to slightly higher and AARP agency and other agency premium expected to decline.
The Company expects the combined ratio for Personal Lines will be between approximately 96.097.5 and 98.099.5 for 20182019 compared to 104.2106.3 in 2017,2018, primarily due to lower current accident year catastrophes and continued improvement inwith the underlying automobile loss ratio.combined ratio flat to slightly higher, as the Company increases spending on marketing. Current accident year catastrophes are budgeted to be 6.5 points of the combined ratio in 2019 compared with 16.1 points in 2018. For automobile, we expect the underlying combined ratio to improve slightly as a modest loss ratio improvement is partially offset by an increase in acquisition costs to increase new business. While management actions, including the effect of earned pricing, are expected to modestly exceed an increase in loss cost severity,
Part II - Item 7. Management's Discussion and Analysis of Financial Condition and Results of Operations
assumed tothose will be 5.6 points of the combined ratio in 2018 compared to 12.3 points in 2017. For automobile, we expect that management actions, including the effect of earned pricing, will exceedpartially offset by an expected increase in loss cost severity and higher direct marketing and other expenses resulting in a lower underlying combined ratio.to generate new business. The underlying combined ratio for homeowners is expected to remain relatively flatincrease slightly in 2018,2019, driven by a return to a more normal level of non-catastrophe weather loss experience and higher acquisition costs, partially offset by earned pricing increases,increases.
Net Loss
Year ended December 31, 2018 compared to the year ended December 31, 2017
Net loss was higher in 2018 than in 2017 due to a higher underwriting loss, a change to net realized capital losses and the effect of a lower corporate income tax rate, partially offset by increased average claim severity and higher expenses.net investment income.
Net (Loss) Income
Year ended December 31, 2017 compared to the year ended December 31, 2016
Net lossin 2017 was unchanged from 2016 as lower underwriting loss and higher net realized capital gains was offset by $33 of income tax expense arising primarily from the reduction of net deferred tax assets due to the enactment of lower Federal income tax rates.
Underwriting Loss
Year ended December 31, 20162018 compared to the year ended December 31, 20152017
NetUnderwriting lossincreased in 2016 compared to net income in 20152018 primarily due to a change fromhigher current accident year catastrophe losses, higher underwriting gainexpenses and the effect of lower earned premium, partially offset by lower current accident year loss ratios before catastrophes in both auto and homeowners and lower amortization of DAC. The increase in underwriting expenses was largely driven by an increase in direct marketing spending, selling expenses, and operational costs to underwriting loss.generate new business.
Underwriting (Loss) Gain
Year ended December 31, 2017 compared to the year ended December 31, 2016
Underwriting loss decreased in 2017primarily due to a change from unfavorable prior accident year development in 2016 to favorable development in 2017 and lower current accident year loss costs in both auto and homeowners, partially offset by higher current accident year catastrophe losses. The decrease in underwriting expenses was primarily due to lower marketing and operations costs, partially offset by higher variable incentive compensation and the decrease in DAC amortization was driven primarily by lower Agency commissions.
Earned Premiums
Year ended December 31, 20162018 compared to the year ended December 31, 20152017
Underwriting lossEarned premiums decreased in 2016 compared2018, reflecting a decline in written premium over the prior six to twelve months in both Agency channels and, to a lesser extent, in AARP Direct.
Written premiums decreased in 2018 in AARP Direct and both Agency channels. Despite an underwriting gainincrease in 2015new business and stable policy count retention in both auto and homeowners, written premium declined primarily due to an increasenot generating enough new business to offset the loss of non-renewed premium.
Renewal written pricing increases in 2018 were higher in homeowners driven by actions taken to improve profitability and were lower in automobile liabilityas loss costs, with higher current accident year losscost trends have moderated and loss adjustment expenses and more unfavorable prior accident year reserve development, principally relatedthe Company has sought to the 2015 accident year. The increase new business.
Policy count retention increased in automobile as renewal written price increases decreased. Policy count
Part II - Item 7. Management's Discussion and Analysis of Financial Condition and Results of Operations
retention in homeowners was flat despite higher renewal written price increases.
Policies in-forcedecreased in 2018 in both automobile and homeowners, driven by not generating enough new business to offset the loss costs was partially offset by lower direct marketing expenses.of non-renewed policies.
Earned Premiums
Year ended December 31, 2017 compared to the year ended December 31, 2016
Earned premiumsdecreased in 2017, reflecting a decline in written premium over the prior six to twelve months in the Other Agency channel and, to a lesser extent, in AARP Direct.
Written premiums decreased in 2017 in AARP Direct and both Agency channels primarily due to a decline in new business and lower policy count retention in both automobile and homeowners partially offset by the effect of renewal written price increases.
Renewal written pricing increases were higher in 2017 in both automobile and home, as the Company increased rates to improve profitability.
Policy count retention decreased in 2017 in both automobile and homeowners, driven in part by renewal written pricing increases.
Part II - Item 7. Management's Discussion and Analysis of Financial Condition and Results of Operations
Policies in-forcedecreased in 2017 in both automobile and homeowners, driven by low new business and low policy count retention.
Year ended December 31, 2016 compared to the year ended December 31, 2015
Earned premiums increased in 2016 reflecting written premium growth in 2015 over the prior six to twelve months.
Written premiums decreased in 2016 primarily due a decline in new business in both automobile and homeowners, partially offset by higher premium retention in automobile, driven by higher written pricing increases.
Renewal written pricing increased in both automobile and home as the Company increased rates to improve profitability.
Policy count retentionfor homeowners was lower in 2015 driven in part by renewal written pricing increases.
Loss and Loss Adjustment Expense Ratio before Catastrophes and Prior Accident Year Development
Year ended December 31, 2018 compared to the year ended December 31, 2017
Loss and loss adjustment expense ratio before catastrophes and prior accident year development decreased in 2018, primarily due to the effect of earned pricing increases in both automobile and homeowners and lower non-catastrophe weather-related homeowners loss costs.
Year ended December 31, 2017 compared to the year ended December 31, 2016
Loss and loss adjustment expense ratio before catastrophes and prior accident year development decreased in 2017, primarily as a result of lower automobile liability and auto physical damage frequency and lower non-catastrophe weather-related homeowners losses and the effect of earned pricing increases.
Current Accident Year Catastrophes and Unfavorable (Favorable) Prior Accident Year Development
Year ended December 31, 20162018 compared to the year ended December 31, 20152017
Loss and loss adjustment expense ratio before catastrophes and priorCurrent accident year development increasedcatastrophe lossesfor 2018 were primarily from wildfires in California, wind and hail storms in Colorado, hurricanes Florence and Michael in the Southeast and various wind storms and winter storms across the country. Catastrophe losses in 2018 are net of an estimated
Part II - Item 7. Management's Discussion and Analysis of Financial Condition and Results of Operations
reinsurance recoverable of $54 under the 2018 Property Aggregate reinsurance treaty that was allocated to Personal Lines. Catastrophe losses for 2017 were primarily due to hurricanes Harvey and Irma and wildfires in California as a result of higherwell as multiple wind and hail events across various U.S. geographic regions, concentrated in Texas, Colorado, the Midwest and the Southeast.
Prior accident year developmentwas less favorable in 2018 than in 2017 with favorable development in 2018 primarily in automobile liability frequency and severity, partially offset by the effect of increases in earned pricing.liability.
Catastrophes and Prior Accident Year Development
Year ended December 31, 2017 compared to the year ended December 31, 2016
Current accident year catastrophe lossesfor 2017 were primarily due to hurricanes Harvey and Irma and wildfires in California as well as multiple wind and hail events across various U.S. geographic regions, concentrated in Texas, Colorado, the Midwest and the Southeast. Catastrophe losses for 2016 were primarily due to multiple wind and hail events across various U.S. geographic regions, concentrated in the Midwest and central plains.
Prior accident year developmentwas favorable for 2017 compared to unfavorable prior accident year development for 2016. Net reserves decreased in 2017primarily due to decreases in reserves for prior accident year catastrophes and homeowners.
Part II - Item 7. Management's Discussion and Analysis of Financial Condition and Results of Operations
Year ended December 31, 2016 compared to the year ended December 31, 2015
Current accident year catastrophe losses of $216, before tax, in 2016 increased compared to $211, before tax, in 2015. Catastrophe losses in 2016 were primarily due to multiple wind and hail events across various U.S. geographic regions, concentrated in the Midwest and central plains. Catastrophe losses in 2015 were primarily due to wildfires in California and multiple events (wind and hail primarily) across various U.S. geographic regions.
Prior accident year development of $151, before tax, was unfavorable in 2016, compared to favorable prior accident year development of $21, before tax, in 2015. Net reserves increased for 2016 primarily due to increased bodily injury frequency and severity for the 2015 accident year and increased bodily injury severity for the 2014 accident year. Net reserves decreased for 2015 primarily due to accident year 2014 catastrophes.
|
|
| PROPERTY & CASUALTY OTHER OPERATIONS |
Results of Operations
Underwriting Summary
| | | | 2017 | 2016 | 2015 | 2018 | 2017 | 2016 |
| Written premiums | $ | — |
| $ | (1 | ) | $ | 35 |
| $ | (4 | ) | $ | — |
| $ | (1 | ) |
| Change in unearned premium reserve | — |
| (1 | ) | 3 |
| (4 | ) | — |
| (1 | ) |
| Earned premiums | — |
| — |
| 32 |
| — |
| — |
| — |
|
| Losses and loss adjustment expenses | | |
| Current accident year | — |
| — |
| 25 |
| |
| Prior accident year development [1] | 18 |
| 278 |
| 218 |
| 65 |
| 18 |
| 278 |
|
| Total losses and loss adjustment expenses | 18 |
| 278 |
| 243 |
| 65 |
| 18 |
| 278 |
|
| Underwriting expenses | 14 |
| 19 |
| 32 |
| 12 |
| 14 |
| 19 |
|
| Underwriting loss | (32 | ) | (297 | ) | (243 | ) | (77 | ) | (32 | ) | (297 | ) |
| Net investment income [2] | 106 |
| 127 |
| 133 |
| 90 |
| 106 |
| 127 |
|
| Net realized capital gains (losses) [2] | 14 |
| (70 | ) | 3 |
| (4 | ) | 14 |
| (70 | ) |
| Loss on reinsurance transaction | — |
| 650 |
| — |
| — |
| — |
| 650 |
|
| Other income | 5 |
| 6 |
| 7 |
| |
| Other income (expenses) | | (1 | ) | 5 |
| 6 |
|
| Income (loss) before income taxes | 93 |
| (884 | ) | (100 | ) | 8 |
| 93 |
| (884 | ) |
| Income tax expense (benefit) | 24 |
| (355 | ) | (47 | ) | |
| Income tax expense (benefit) [3] | | (7 | ) | 24 |
| (355 | ) |
| Net income (loss) | $ | 69 |
| $ | (529 | ) | $ | (53 | ) | $ | 15 |
| $ | 69 |
| $ | (529 | ) |
| |
| [1] | For discussion of prior accident year development, see MD&A - Critical Accounting Estimates, Property and Casualty Insurance Product Reserves, Net of Reinsurance. |
| |
| [2] | For discussion of consolidated investment results, see MD&A - Investment Results. |
| |
| [3] | For discussion of income taxes, see Note 16 - Income Taxes of Notes to Consolidated Financial Statements. |
[1]For discussion of prior accident year development, see MD&A - Critical Accounting Estimates, Total Property and Casualty Insurance Product Reserves Development.
[2]For discussion of consolidated investment results, see MD&A - Investment Results, Net Investment Income (Loss) and Net Realized Capital Gains (Losses).
Part II - Item 7. Management's Discussion and Analysis of Financial Condition and Results of Operations
Net Income (Loss)
Year ended December 31, 2018 compared to the year ended December 31, 2017
Net income decreased from 2017 to 2018, primarily due to greater adverse reserve development in 2018 related to unallocated loss adjustment expenses, the allowance for uncollectible reinsurance and certain mass torts. Also contributing to the decrease was lower net investment income driven by the decline in invested assets associated with this run-off business.
Year ended December 31, 2017 compared to the year ended December 31, 2016
Net income (loss)loss improved from a net loss of $529 to net income of $69 primarily due to lossesceded premium of $423 after tax incurred in 2016 including a lossfor an Adverse Reserve Development ("ADC") reinsurance cover on reinsurance transaction for premium paid to NICO covering adverse reserve development of asbestos and environmental reserves after 2016, as well adverse development in 2016 due to2016. (For further discussion on the second quarter study ofADC, see MD&A - Critical Accounting Estimates, Property and Casualty Other Operations). Prior accident year asbestos and environmental reserves.
Year ended December 31,losses in 2016 comparedbefore execution of the ADC also contributed to the year ended December 31, 2015
Net loss increased in 2016 primarily due to a $423 after-tax loss on the reinsurance transaction that cedes adverse development on asbestos and environmental reserves and higher unfavorable net asbestos and environmental prior accidentover year development associated with the Company's comprehensive annual review. Net realized capital losses before tax in 2016 included an $81 estimated capital loss on the pending sale of the Company's U.K. property and casualty run-off subsidiaries. Net of tax benefits, the pending sale resulted in an estimated after-tax loss of $5.
improvement.
Pre-tax Charge for Asbestos and Environmental Reserve Increases
Year ended December 31, 2018 compared to the year ended December 31, 2017
Asbestos Reservesreflected no net incurred losses and allocated loss adjustment expenses in 2018 as a $167 increase in estimated reserves before NICO reinsurance was offset by $167 of losses recoverable under the NICO treaty. The increase in reserves before NICO reinsurance was primarily due to a higher than previously expected number of mesothelioma claim filings, an increase in the average settlement value of mesothelioma claims, an increase in defense costs, and the Company assuming a greater share of liability due to unfavorable interpretations of coverage. An increase in reserves from umbrella and excess policies in the 1981-1985 policy years contributed to the adverse development.
Environmental Reservesreflected no net incurred losses and allocated loss adjustment expenses in 2018 as a $71 increase in estimated reserves before NICO reinsurance was offset by $71 of loss recoverable under the NICO treaty. The increase in reserves before NICO reinsurance was primarily due to increased clean-up costs and liability shares associated with Superfund sites and sediment in waterways, increased defense costs and adverse legal rulings, most notably from jurisdictions in the Pacific Northwest.
Year ended December 31, 2017 compared to the year ended December 31, 2016
Asbestos Reserves were virtually unchangedreflected no net incurred losses and allocated loss adjustment expenses in 2017 as a $183 increase in estimated reserves before NICO reinsurance was offset by $183 of losses recoverable under the NICO treaty. The increase in reserves before NICO reinsurance was primarily due to mesothelioma claim filings not declining as expected, unfavorable developments in coverage law in some jurisdictions and continued filings in specific, adverse jurisdictions. An increased share of adverse development from the fourth quarter review is from umbrella and excess policies in the 1981-1985 policy years.
Environmental Reserveswere unchangedreflected no net incurred losses and allocated loss adjustment expenses in 2017 as a $102 increase in estimated reserves before NICO reinsurance was offset by $102 of loss recoverable under the NICO treaty. The
Part II - Item 7. Management's Discussion and Analysis of Financial Condition and Results of Operations
increase in reserves before NICO reinsurance was primarily due to increased clean-up costs and liability shares associated with Superfund sites and sediment in waterways, as well as adverse
legal rulings, most notably from jurisdictions in the Pacific Northwest.
Year ended December 31, 2016 compared to the year ended December 31, 2015
Asbestos Reserves increased by $197 in 2016 arising from the second quarter reserve study which found that mesothelioma claims filings have not declined as expected in specific, adverse jurisdictions. As a result, aggregate indemnity and defense costs have not declined as expected resulting in unfavorable net asbestos reserve development.
Environmental Reservesincreased by $71 in 2016primarily due to deterioration associated with the tendering of new sites for policy coverage, increased defense costs stemming from individual bodily injury liability suits, and increased clean-up costs associated with waterways.
Part II - Item 7. Management's Discussion and Analysis of Financial Condition and Results of Operations
Operating Summary
| | | | 2017 [1] | 2016 | 2015 | 2018 | 2017 [1] | 2016 |
| Premiums and other considerations | $ | 3,677 |
| $ | 3,223 |
| $ | 3,136 |
| $ | 5,598 |
| $ | 3,677 |
| $ | 3,223 |
|
| Net investment income [2] | 381 |
| 366 |
| 371 |
| 474 |
| 381 |
| 366 |
|
| Net realized capital gains (losses) [2] | 34 |
| 45 |
| (11 | ) | (47 | ) | 34 |
| 45 |
|
| Total revenues | 4,092 |
| 3,634 |
| 3,496 |
| 6,025 |
| 4,092 |
| 3,634 |
|
| Benefits, losses and loss adjustment expenses | 2,803 |
| 2,514 |
| 2,427 |
| 4,214 |
| 2,803 |
| 2,514 |
|
| Amortization of DAC | 33 |
| 31 |
| 31 |
| 45 |
| 33 |
| 31 |
|
| Insurance operating costs and other expenses | 915 |
| 776 |
| 788 |
| 1,282 |
| 915 |
| 776 |
|
| Amortization of Other Intangible Assets | 9 |
| — |
| — |
| |
| Amortization of other intangible assets | | 60 |
| 9 |
| — |
|
| Total benefits, losses and expenses | 3,760 |
| 3,321 |
| 3,246 |
| 5,601 |
| 3,760 |
| 3,321 |
|
| Income before income taxes | 332 |
| 313 |
| 250 |
| 424 |
| 332 |
| 313 |
|
| Income tax expense [3] | 38 |
| 83 |
| 63 |
| 84 |
| 38 |
| 83 |
|
| Net income | $ | 294 |
| $ | 230 |
| $ | 187 |
| $ | 340 |
| $ | 294 |
| $ | 230 |
|
| |
| [1] | The Results of Operations related to 2017 include two months of results from Aetna's U.S. group life and disability business due to the acquisition that occurred on November 1, 2017. For discussion of the acquisition, see Note 2 - Business Acquisitions.Acquisitions of Notes to the Consolidated Financial Statements. |
| |
| [2] | For discussion of consolidated investment results, see MD&A - Investment Results, Investment Income (Loss) and Net Realized Capital Gains (Losses).Results. |
| |
| [3] | 2017 includes $52 of income tax benefit primarily from reducing net deferred tax liabilities due to the reduction in the corporate Federal income tax rate from 35% to 21%. For discussion of income taxes, see Note 16 - Income Taxes of Notes to the Consolidated Financial Statements.
|
Premiums and Other Considerations
| | | | 2017 | 2016 | 2015 | 2018 | 2017 | 2016 |
| Fully insured — ongoing premiums | $ | 3,571 |
| $ | 3,142 |
| $ | 3,068 |
| $ | 5,418 |
| $ | 3,571 |
| $ | 3,142 |
|
| Buyout premiums | 15 |
| 6 |
| 1 |
| 5 |
| 15 |
| 6 |
|
| Fee income | 91 |
| 75 |
| 67 |
| 175 |
| 91 |
| 75 |
|
| Total premiums and other considerations | $ | 3,677 |
| $ | 3,223 |
| $ | 3,136 |
| $ | 5,598 |
| $ | 3,677 |
| $ | 3,223 |
|
| Fully insured ongoing sales, excluding buyouts | $ | 449 |
| $ | 450 |
| $ | 467 |
| $ | 704 |
| $ | 449 |
| $ | 450 |
|
Ratios, Excluding Buyouts
|
| | | | | | |
| | 2018 | 2017 | 2016 |
| Group disability loss ratio | 73.1 | % | 76.5 | % | 81.4 | % |
| Group life loss ratio | 78.4 | % | 76.7 | % | 75.7 | % |
| Total loss ratio | 75.3 | % | 76.1 | % | 78.0 | % |
| Expense ratio [1] | 24.0 | % | 25.7 | % | 25.1 | % |
|
| | | | | | |
| | 2017 | 2016 | 2015 |
| Group disability loss ratio | 76.5 | % | 81.4 | % | 81.6 | % |
| Group life loss ratio | 76.7 | % | 75.7 | % | 74.7 | % |
| Total loss ratio | 76.1 | % | 78.0 | % | 77.4 | % |
| Expense ratio | 25.7 | % | 25.1 | % | 26.1 | % |
Margin
|
| | | | | | |
| | 2017 | 2016 | 2015 |
| Net income margin | 7.2 | % | 6.3 | % | 5.4 | % |
| Less: Net realized capital gains (losses) excluded from core earnings, after tax | 0.4 | % | 0.6 | % | (0.2 | )% |
| Less: Integration and transaction costs associated with acquired business, after tax | (0.3 | )% | — | % | — | % |
| Less: Income tax benefit | 1.3 | % | — | % | — | % |
| Core earnings margin | 5.8 | % | 5.7 | % | 5.6 | % |
2018 Outlook
The Company expects Group Benefits fully insured ongoing premiums to increase significantly in 2018 due[1] Integration and transaction costs related to the acquisition of Aetna's U.S. group life and disability business are not included in Novemberthe expense ratio.
Margin
|
| | | | | | |
| | 2018 | 2017 | 2016 |
| Net income margin | 5.6 | % | 7.2 | % | 6.3 | % |
| Less: Net realized capital gains (losses) excluded from core earnings, after tax | (0.6 | %) | 0.4 | % | 0.6 | % |
| Less: Integration and transaction costs associated with acquired business, after tax | (0.6 | %) | (0.3 | %) | — | % |
| Less: Income tax benefit | (0.2 | %) | 1.3 | % | — | % |
| Core earnings margin | 7.0 | % | 5.8 | % | 5.7 | % |
2017. Excluding the impact of the acquisition, the Company expects a mid-single digit percentage increase in fully insured ongoing premiums in 2018 due, in part, to growth in national accounts, sales of voluntary products and the addition of a new Paid Family Leave product. The segment’s net income is expected
Part II - Item 7. Management's Discussion and Analysis of Financial Condition and Results of Operations
2019 Outlook
The Company expects Group Benefits fully insured ongoing premiums to decline slightlybe relatively flat in 2019, driven by an expected decrease in sales, partly due to the introduction of the New York Paid Family Leave product in 2018, as additional earnings fromoffset by strong persistency. In 2019, the segment's net income margin is expected to be between 5.5% and 6.5%, compared to a net income margin of 5.6% in 2018. The expected increase largely reflects net realized capital losses and higher integration costs associated with the acquired business will be offset by the fact that 2017 included a $52 million tax benefit associated with Tax Reform. Expected net income for 2018 is in the range of $275 to $295 million.2018. Management expects that the 20182019 core earnings margin, which does not include the effect of net realized capital gains (losses) or integration and transaction costs associated with the acquired business, will be in the range of 6.0% to 7.0%, down slightly from 5.8% in 2017prior year as strong investment returns from limited partnerships and strong long term disability recoveries in 20172018 are not expectedassumed to repeat in 2019. The total loss ratio and expense ratio are expected to be consistent with 2018.
Net Income
Year ended December 31, 2018 compared to the year ended December 31, 2017
Net incomeincreased in 2018 compared to 2017, primarily due to higher premiums and other considerations and higher net investment income, including from the acquisition of Aetna's U.S. group life and disability business, a lower loss ratio, and the benefit of a lower corporate income tax rate, partially offset by higher insurance operating costs and other expenses, including integration costs, and amortization of intangible assets in connection with the acquisition, and a change to net realized capital losses. The benefit of the lower corporate income tax rate was largely offset by a $52 tax benefit in 2017 that was primarily due to reducing net deferred tax liabilities given the reduction in the corporate income tax rate.
Insurance operating costs and other expenses increased 40% primarily due to the acquisition of Aetna's U.S. group life and disability business, including integration costs and amortization of intangible assets, partially offset by state guaranty fund assessments of $20 before tax related to the liquidation of a life and health insurance company in 2017. Integration costs were $47 in 2018 compared to $17 in 2017.
Year ended December 31, 2017 compared to the year ended December 31, 2016
Net incomeincreased in 2017 compared to 2016, primarily due to $52 of income tax benefits arising primarily from the reduction of net deferred tax liabilities due to the enactment of lower Federal income tax rates. In addition, net income increased as a result of growth in premiums and other considerations and a lower group disability loss ratio, partially offset by an increase in insurance operating costs and other expenses due, in part, to higher variable incentive compensation as well as integration and transaction costs related to the acquisition of Aetna's U.S. group life and disability business. Insurance operating costs and other expenses in 2017 also included state guaranty fund assessments of $20 before tax related to the liquidation of a life and health insurance company. The acquisition of Aetna's U.S. group life and disability business, which closed on November 1, 2017, did not have a material impact on results in 2017.
Insurance operating costs and other expenses increased 18%, primarily due to the inclusion of two months of expenses for the acquired Aetna's U.S. group life and disability business, state guaranty fund assessments of $20 before tax related to the liquidation of a life and health insurance company and an increase in variable incentive compensation.
Fully Insured Ongoing Premiums
Year ended December 31, 20162018 compared to the year ended December 31, 20152017
Net incomeFully insured ongoing premiumsincreased 52% in 20162018 driven primarily by the acquisition of Aetna's U.S. group life and disability business, sales in excess of cancellations with strong group life and disability persistency, and premium from the New York Paid Family Leave product.
Fully insured ongoing sales, excluding buyouts increased 57% primarily due to higher net realized capital gains, higher premiumsnew business generated by our larger combined sales force following the acquisition of Aetna's U.S. group life and other considerationsdisability business. The
Part II - Item 7. Management's Discussion and lower insurance operating costsAnalysis of Financial Condition and other expenses, partially offset by higher benefits, lossesResults of Operations
Company also saw an increase in the sale of voluntary products and loss adjustment expenses.
sales of fully insured disability in 2018 due, in part, to the addition of the New York Paid Family Leave product.Insurance operating costs and other expenses decreased 2% due primarily to decreased administrative expenses.
Fully Insured Ongoing Premiums
Year ended December 31, 2017 compared to the year ended December 31, 2016
Fully insured ongoing premiumsincreased in 2017, in part, because it included two months of premiums for the acquired Aetna's U.S. group life and disability business. Excluding the impact of the acquisition, fully insured ongoing premiums increased 3% due to sales, strong persistency and modest group disability pricing increases.
Fully insured ongoing sales, excluding buyouts were essentially flat to prior year reflecting higher group disability sales offset by lower group life and other sales.
Ratios
Year ended December 31, 20162018 compared to the year ended December 31, 20152017
Fully insured ongoing premiumsTotal loss ratio decreased 0.8 points from 2017 to 2018 as a decrease in the group disability loss ratio was partially offset by an increase in the group life loss ratio. The group disability loss ratio decreased 3.4 points driven by continued favorable incidence trends, including favorable prior incurral year development of approximately $230 with most of that development from the 2017 incurral year as incidence trends become known after the elimination period is satisfied. In addition, the group disability loss ratio benefited from the lower discount accretion associated with the disability business acquired from Aetna.
The group life loss ratio increased 2%1.7 points primarily driven by higher expected loss ratios associated with the group life business acquired from Aetna. Group life business (including group life premium waiver) included favorable prior incurral year development of approximately $90 in 2018, mostly from the 2017 incurral year.
Expense ratio decreased 1.7 points due to strong persistencya greater mix of lower commission national accounts business due to the acquisition of Aetna's group life and pricing increases.
Fully insured ongoing sales, excluding buyouts decreased 4%disability business, higher revenues to cover fixed costs and the effect of state guaranty assessments in 2016, reflecting lower disability sales.
2017 related to the liquidation of a life and health
Part II - Item 7. Management's Discussion and Analysis of Financial Condition and Results of Operations
Ratiosinsurance company, partially offset by higher intangible asset amortization incurred in 2018.
Year ended December 31, 2017 compared to the year ended December 31, 2016
Total loss ratio decreased 1.9 points, primarily due to a lower group disability loss ratio. The group disability loss ratio decreased 4.9 points, driven by continued improvements in incidence trends, higher recoveries and modest pricing increases. The group life loss ratio increased 1.0 points, primarily driven by favorable changes in reserve estimates of 1.3 points in 2016 partially offset by favorable mortality in the current year.
Expense ratio increased 0.6 points primarily due to state guaranty fund assessments related to the liquidation of a life and health insurance company, an increase in variable incentive compensation and amortization of intangible assets recorded in connection with the acquisition of Aetna's U.S. group life and disability business. Integration and transaction costs of $17 in 2017 related to the acquisition are not included in the expense ratio.
Year ended December 31, 2016 compared to the year ended December 31, 2015
Total loss ratio increased 0.6 points in 2016 to 78.0% due to a higher group life loss ratio. The group life loss ratio increased 1.0 point due to higher severity in 2016. Included in the life loss ratio were favorable changes in reserve estimates of 1.3 points in 2016. The group disability loss ratio decreased 0.2 points primarily driven by increased pricing and improved incidence trends, partially offset by an increase in long-term disability claim severity. Included in the disability loss ratio were favorable changes in long-term disability reserve estimates of 0.4 points compared to 1.2 points in the prior year.
Expense ratio improved 1.0 points in 2016, reflecting premium growth and lower insurance operating costs and other expenses.
Part II - Item 7. Management's Discussion and Analysis of Financial Condition and Results of Operations
Results of Operations
Operating Summary
| | | | 2017 | 2016 | 2015 | 2018 | 2017 | 2016 |
| Fee income and other revenue | $ | 804 |
| $ | 701 |
| $ | 723 |
| $ | 1,032 |
| $ | 992 |
| $ | 885 |
|
| Net investment income | 3 |
| 1 |
| 1 |
| 5 |
| 3 |
| 1 |
|
| Net realized capital losses | | (4 | ) | — |
| — |
|
| Total revenues | 807 |
| 702 |
| 724 |
| 1,033 |
| 995 |
| 886 |
|
| Amortization of DAC | 21 |
| 24 |
| 22 |
| 16 |
| 21 |
| 24 |
|
| Operating costs and other expenses | 617 |
| 557 |
| 568 |
| |
| Operating costs and other expenses [1] | | 831 |
| 805 |
| 741 |
|
| Total benefits, losses and expenses | 638 |
| 581 |
| 590 |
| 847 |
| 826 |
| 765 |
|
| Income before income taxes | 169 |
| 121 |
| 134 |
| 186 |
| 169 |
| 121 |
|
| Income tax expense [2] | 63 |
| 43 |
| 48 |
| 38 |
| 63 |
| 43 |
|
| Net income | $ | 106 |
| $ | 78 |
| $ | 86 |
| $ | 148 |
| $ | 106 |
| $ | 78 |
|
| Daily Average Total Mutual Funds segment AUM | $ | 107,593 |
| $ | 92,042 |
| $ | 94,687 |
| |
| Return on Assets ("ROA") [1] | 9.9 |
| 8.5 |
| 9.1 |
| |
| Daily average total Hartford Funds segment AUM | | $ | 116,876 |
| $ | 107,593 |
| $ | 92,042 |
|
| Return on Assets ("ROA") [3] | | 12.6 |
| 9.9 |
| 8.5 |
|
| Less: Effect of net realized capital losses, excluded from core earnings, before tax | | (0.4 | ) | — |
| — |
|
| Less: Effect of income tax expense | (0.3 | ) | — |
| — |
| 0.1 |
| (0.3 | ) | — |
|
| Return on Assets ("ROA"), core earnings [1] | 10.2 |
| 8.5 |
| 9.1 |
| |
| Return on Assets ("ROA"), core earnings [3] | | 12.9 |
| 10.2 |
| 8.5 |
|
| |
| [1] | Represents annualized earnings divided by a daily averageIncludes distribution costs of assets under management, as measured$188 and $184 for the twelve months ended December 31, 2017 and 2016, respectively, that were previously netted against fee income and are now presented gross in basis points.insurance operating costs and other expenses. |
| |
| [2] | 2017 includes $4 of income tax expense primarily from reducing net deferred tax assets due to the reduction in the corporate Federal income tax rate from 35% to 21%. For further discussion, see Note 16 - Income Taxes of Notes to Consolidated Financial Statements. |
| |
| [3] | Represents annualized earnings divided by a daily average of assets under management, as measured in basis points. |
Hartford Funds Segment AUM
|
| | | | | | | | | |
| | 2018 | 2017 [1] | 2016 [1] |
| Mutual Fund and ETP AUM - beginning of period | $ | 99,090 |
| $ | 81,507 |
| $ | 74,413 |
|
| Sales - mutual fund | 22,198 |
| 23,654 |
| 19,135 |
|
| Redemptions - mutual fund | (23,888 | ) | (20,409 | ) | (20,055 | ) |
| Net flows - ETP | 1,404 |
| 157 |
| 8 |
|
| Net Flows - mutual fund and ETP | (286 | ) | 3,402 |
| (912 | ) |
| Change in market value and other | (7,247 | ) | 14,181 |
| 8,006 |
|
| Mutual Fund and ETP AUM - end of period | 91,557 |
| 99,090 |
| 81,507 |
|
| Talcott Resolution life and annuity separate account AUM [2] | 13,283 |
| 16,260 |
| 16,010 |
|
| Hartford Funds AUM | $ | 104,840 |
| $ | 115,350 |
| $ | 97,517 |
|
| |
| [1] | ETP AUM has been combined with mutual fund AUM. Previously ETPs were shown separately. |
| |
| [2] | Represents AUM of the life and annuity business sold in May, 2018 that is still managed by the Company's Hartford Funds segment. |
Mutual Fund AUM by Asset Class
|
| | | | | | | | | |
| | 2018 | 2017 | 2016 |
| Equity | $ | 56,986 |
| $ | 63,740 |
| $ | 50,826 |
|
| Fixed Income | 14,467 |
| 14,401 |
| 13,301 |
|
| Multi-Strategy Investments [1] | 18,233 |
| 20,469 |
| 17,171 |
|
| Exchange-traded products | 1,871 |
| 480 |
| 209 |
|
| Mutual Fund and ETP AUM | $ | 91,557 |
| $ | 99,090 |
| $ | 81,507 |
|
| |
| [1] | Includes balanced, allocation, and alternative investment products. |
Part II - Item 7. Management's Discussion and Analysis of Financial Condition and Results of Operations
Mutual Funds Segment AUM
|
| | | | | | | | | |
| | 2017 | 2016 | 2015 |
| Mutual Fund AUM - beginning of period | $ | 81,298 |
| $ | 74,413 |
| $ | 73,035 |
|
| Sales | 23,654 |
| 19,135 |
| 17,527 |
|
| Redemptions | (20,409 | ) | (20,055 | ) | (16,036 | ) |
| Net Flows | 3,245 |
| (920 | ) | 1,491 |
|
| Change in market value and other [1] | 14,067 |
| 7,805 |
| (113 | ) |
| Mutual Fund AUM - end of period | 98,610 |
| 81,298 |
| 74,413 |
|
| Exchange-Traded Products AUM [2] | 480 |
| 209 |
| |
| Mutual Funds segment AUM | 99,090 |
| 81,507 |
| 74,413 |
|
| Life and annuity run-off business | 16,260 |
| 16,010 |
| 17,549 |
|
| Total Mutual Funds segment AUM | $ | 115,350 |
| $ | 97,517 |
| $ | 91,962 |
|
| |
[1] | Other includes AUM from adoption of ten U.S. mutual funds with aggregate AUM of approximately $3.0 billion (as of October 2016) from Schroder Investment Management North America Inc. |
| |
[2] | Includes AUM of approximately $200 acquired upon acquisition in July 2016 of Lattice Strategies, LLC and subsequent net flows and change in market value. |
Mutual Fund AUM by Asset Class
|
| | | | | | | | | |
| | 2017 | 2016 | 2015 |
| Equity | $ | 63,740 |
| $ | 50,826 |
| $ | 47,369 |
|
| Fixed Income | 14,401 |
| 13,301 |
| 12,625 |
|
| Multi-Strategy Investments | 20,469 |
| 17,171 |
| 14,419 |
|
| Mutual Fund AUM | $ | 98,610 |
| $ | 81,298 |
| $ | 74,413 |
|
20182019 Outlook
The Company expectsDue in large part to increase salesthe effect of the decline in 2018 from a diversified lineup of mutual funds and ETPs. Assuming markets continue to grow,on assets under management since October 2018, the Company expects assets under management and earnings growth innet income for Hartford Funds to be relatively flat from 2018 to 2019, provided the Company continues deliveringto deliver strong fund performance and generates positive net flows. The growthCompany expects to increase net sales in 2019 from a diversified lineup of mutual funds and ETPs, though net flows are more uncertain given the increased volatility in the markets. Assuming the Company can generate positive net flows and fund performance is strong, assets under management and earnings will beare expected to increase modestly despite the continued decline of the Talcott Resolution AUM.
Net Income
Year ended December 31, 2018 compared to the year ended December 31, 2017
Net income increased in 2018 due to higher investment management fees driven by higher average daily assets under management, partially offset by higher variable costs. Also contributing to the continued run offincrease was the effect of the life and annuity business held for sale. After the sale of the life and annuity run-off business, which is expected to close by June 30, 2018, the Mutual Funds segment expects to continue to manage the mutual fund assets of that business.
a lower corporate Federal income tax rate.Net Income
Year ended December 31, 2017 compared to the year ended December 31, 2016
Net income increased in 2017 due to higher investment management fees resulting from higher daily average AUM levels driven in part by the addition of Schroders' funds in late 2016, as well as a reduction in estimated state income tax expense, partially offset by higher variable costs including sub-advisory and distribution and service expenses.
Hartford Funds AUM
Year ended December 31, 20162018 compared to the year ended December 31, 20152017
Net incomeHartford Funds AUMdecreased from December 31, 2017 to December 31, 2018 largely due to a decline in 2016,markets in the fourth quarter of 2018 and the continued expected decline of the Talcott Resolution AUM still managed by the Company. Despite the decline in AUM in the fourth quarter of 2018, average daily assets under management for the year were up 9% due to market appreciation and net positive flows during the first 9 months of 2018.
Year ended December 31, 2017 compared to the prior year period,ended December 31, 2016
Hartford Funds AUMincreased in 2017 primarily due to lower investment management fees as a resultpositive net flows and market appreciation, partially offset by the continued expected decline of lower daily averagethe Talcott Resolution AUM combined with transactionstill managed by the Company.
Part II - Item 7. Management's Discussion and Analysis of Financial Condition and Results of Operations
costs of approximately of $3 associated with the acquisition of Lattice Strategies, LLC and the adoption of ten Schroders' funds during 2016. Daily average AUM decreased primarily due to market volatility early in the year and the continued run off of AUM related to the life and annuity run-off business held for sale.
Total Mutual Funds Segment AUM
Year ended December 31, 2017 compared to the year ended December 31, 2016
Total Mutual Funds segment AUMincreased in 2017 primarily due to positive net flows and market appreciation, partially offset by the continued run off of AUM related to the life and annuity run-off business held for sale.
Year ended December 31, 2016 compared to the year ended December 31, 2015
Total Mutual Funds segment AUM increased in 2016 primarily due to market appreciation and the adoption of 10 Schroders' funds partially offset by net outflows and the continued run off of AUM related to the life and annuity run-off business held for sale.
Results of Operations
Operating Summary
| | | | 2017 | 2016 | 2015 | 2018 | 2017 | 2016 |
| Fee income | $ | 4 |
| $ | 3 |
| $ | 9 |
| $ | 32 |
| $ | 4 |
| $ | 3 |
|
| Other revenue | | 21 |
| — |
| — |
|
| Net investment income | 23 |
| 31 |
| 18 |
| 59 |
| 23 |
| 31 |
|
| Net realized capital gains (losses) | (1 | ) | (100 | ) | (2 | ) | |
| Total revenues | 26 |
| (66 | ) | 25 |
| |
| Net realized capital losses | | (7 | ) | (1 | ) | (100 | ) |
| Total revenues (losses) | | 105 |
| 26 |
| (66 | ) |
| Benefits, losses and loss adjustment expenses [1] | 31 |
| — |
| — |
| 11 |
| 31 |
| — |
|
| Insurance operating costs and other expenses | 59 |
| 87 |
| 118 |
| 83 |
| 59 |
| 87 |
|
| Pension Settlement | 750 |
| — |
| — |
| |
| Pension settlement | | — |
| 750 |
| — |
|
| Loss on extinguishment of debt [2] | — |
| — |
| 21 |
| 6 |
| — |
| — |
|
| Interest expense [2] | 316 |
| 327 |
| 346 |
| 298 |
| 316 |
| 327 |
|
| Restructuring and other costs | — |
| — |
| 20 |
| |
| Total benefits, losses and expenses | 1,156 |
| 414 |
| 505 |
| 398 |
| 1,156 |
| 414 |
|
| (Loss) before income taxes | (1,130 | ) | (480 | ) | (480 | ) | |
| Loss before income taxes | | (293 | ) | (1,130 | ) | (480 | ) |
| Income tax expense (benefit) [3] | 457 |
| (329 | ) | (266 | ) | (95 | ) | 457 |
| (329 | ) |
| Loss from continuing operations, net of tax | (1,587 | ) | (151 | ) | (214 | ) | (198 | ) | (1,587 | ) | (151 | ) |
| (Loss) income from discontinued operations,net of tax | (2,869 | ) | 283 |
| 486 |
| |
| Net (loss) income | $ | (4,456 | ) | $ | 132 |
| $ | 272 |
| |
| Income (loss) from discontinued operations,net of tax | | 322 |
| (2,869 | ) | 283 |
|
| Net income (loss) | | $ | 124 |
| $ | (4,456 | ) | $ | 132 |
|
| Preferred stock dividends | | 6 |
| — |
| — |
|
| Net income (loss) available to common stockholders | | $ | 118 |
| $ | (4,456 | ) | $ | 132 |
|
| |
| [1] | Represents benefits expense on life and annuity business retainedpreviously underwritten by the Company. |
| |
| [2] | For discussion of debt, see Note 13 - Debt of Notes to Consolidated Financial Statements. |
| |
| [3] | 2017 includes $867 of income tax expense primarily from reducing net deferred tax assets due to the reduction in the corporate Federal income tax rate from 35% to 21%. For discussion of income taxes, see Note 16 - Income Taxes of Notes to Consolidated Financial Statements. |
Net Income (Loss)
Year ended December 31, 2018 compared to the year ended December 31, 2017
Net income compared to a net loss in 2017, primarily due to a number of charges in 2017, including a $3.3 billion after tax loss on the life and annuity business sold in May 2018, $867 of income tax expense primarily from reducing net deferred tax assets due to the reduction of the corporate Federal income tax rate from 35% to 21%, and the effect of a pension settlement charge of
$488, after tax. The settlement charge in 2017 related to the purchase of a group annuity contract to transfer $1.6 billion of certain U.S. qualified pension plan liabilities to a third party. Apart from the effect of these charges in 2017, an increase in fee income from managing Talcott Resolution invested assets post-sale and lower interest expense, as well as higher net investment income and lower benefits and losses incurred related to run-off structured settlement and terminal funding agreement liabilities was partially offset by higher investment management expenses and a lower tax benefit due to the reduction in the corporate Federal income tax rate. Other revenue in 2018 from providing transition services to Talcott Resolution was offset by the cost of providing those services.
Insurance operating costs and other expenses increased in 2018 largely due to costs incurred to manage the invested assets of Talcott Resolution post-sale, partially offset by a reduction in centralized services costs previously allocated to the life and annuity business sold in May 2018.
Income (loss) from discontinued operationsincreased from loss of $2,869 in 2017 to income of $322 in 2018 with the net loss in 2017 due to a loss on sale of the Company’s life and annuity business of $3.3 billion in 2017. A $202 reduction in loss on sale in 2018 was largely offset by a decline in operating income from the life and annuity business sold in May 2018. The reduction in loss on sale was largely attributable to an increase in
Part II - Item 7. Management's Discussion and Analysis of Financial Condition and Results of Operations
Net (Loss) Incomethe estimated retained net operating loss carryover tax benefits from the life and annuity business sold in May 2018 as well as the reclassification to retained earnings of $193 of tax effects stranded in AOCI due to the accounting for Tax Reform. For more information on the reclassification of stranded tax effects, see Note 1-Basis of Presentation and Significant Accounting Policies within Notes to the Consolidated Financial Statements.
Year ended December 31, 2017 compared to the year ended December 31, 2016
Net loss increased primarily due to a $3.3 billion estimated loss on sale of the life and annuity run-off business, $867 of income tax expense arising primarily from the reduction of net deferred tax assets due to the enactment of lower Federal income tax rates and a $488 after-taxafter tax pension settlement charge.
Insurance operating costs and other expenses decreased in 2017 largely due to lower centralized services costs and lower estimated state income tax expense. Upon reporting the life and annuity run-off business as discontinued operations, centralized services costs were reallocated to Corporate for all periods presented and those reallocated costs declined from 2016 to 2017 principally due to a lower allocation of IT costs.
Income (loss) from discontinued operationsIncome (loss) from discontinued operations decreased from income of $283 in 2016 to a net loss of $2.9 billion in 2017 with the net loss in 2017 due to a loss on sale of the Company’s life and annuity run-off business of $3.3 billion, partially offset by operating income from discontinued operations of $388. Operating income from discontinued operations increased from $283 in 2016 primarily due to lower net realized capital losses in 2017. Apart from the reduction in net realized capital losses, earnings were relatively flat as an increase in the assumption study benefit and lower interest credited were largely offset by lower net investment income and lower fee income due to the continued run-offrun off of the variable annuity block.
Year ended December 31, 2016 compared to the year ended December 31, 2015
Net income decreased primarily due to lower income from discontinued operations, net of tax, partially offset by a decrease
in insurance operating costs and other expenses, an increase in net investment income and lower interest expense. The income tax benefit of $113 associated with the investments in solar energy partnerships was offset by realized capital losses of $96. before tax, associated with the write-down of investments in solar energy partnerships.
Insurance operating costs and other expenses decreased in 2016 largely due a reduction in restructuring costs.
Income (loss) from discontinued operationsOperating income from discontinued operations decreased from $486 in 2015 primarily due to lower tax benefits recognized in 2016, a write-off of DAC associated with fixed annuities, lower investment income and a reinsurance gain on disposition in 2015. In addition, the continued run-off of the variable and fixed annuity block resulted in lower fee income, partially offset by lower amortization of DAC and lower insurance operating costs and other expenses.
Interest Expense
Year ended December 31, 2018 compared to the year ended December 31, 2017
Interest expense decreased primarily due to the redemption of junior subordinated debentures. On June 15, 2018, The Hartford redeemed $500 aggregate principal amount of its 8.125% Fixed-to-Floating Rate Junior Subordinated Debentures due 2068 and recognized a $6 loss on extinguishment of debt for unamortized deferred debt issuance costs. On March 15, 2018, the Company issued $500 of 4.4% senior notes due March 15, 2048 for net proceeds of approximately $490. The Company used a portion of the net proceeds to repay the Company's $320 of 6.3% senior notes at maturity. See Note 13 -Debt of Notes to the Consolidated Financial Statements.
Year ended December 31, 2017 compared to the year ended December 31, 2016
Interest expense decreased primarily due to a decrease in outstanding debt due to debt maturities and the paydown of senior notes. Since December 31, 2016, $416 of senior notes have either matured or been paid down.
Year ended December 31, 2016 compared to the year ended December 31, 2015
Interest expense decreased in 2016 primarily due to a decrease in outstanding debt from debt maturities and the paydown of senior notes. In 2016, $275 of senior notes matured.
Part II - Item 7. Management's Discussion and Analysis of Financial Condition and Results of Operations
ENTERPRISE RISK MANAGEMENT
The Company’s Board of Directors has ultimate responsibility for risk oversight, as described more fully in our Proxy Statement, while management is tasked with the day-to-day management of the Company’s risks.
The Company manages and monitors risk through risk policies, controls and limits. At the senior management level, an Enterprise Risk and Capital Committee (“ERCC”) oversees the risk profile and risk management practices of the Company. As illustrated below, a number of functional committees sit underneath the ERCC, providing oversight of specific risk areas and recommending risk mitigation strategies to the ERCC.
|
|
| ERCC Members |
| CEO (Chair) |
| President |
| Chief Financial Officer |
| Chief Investment Officer |
| Chief Risk Officer |
| General Counsel |
| Others as deemed necessary by the Committee Chair |
Part II - Item 7. Management's Discussion and Analysis of Financial Condition and Results of Operations
|
| | | | | | | | | | | | | | | | | | | |
| | | | | | | | | | ERCC | | | | | | | | | |
| | | | | | | | | | | | | | | | | | | | |
| | | | | | | | | | | | | | | | | | | | |
| Asset Liability Committee | | Underwriting Risk Committee | | Emerging Risk Steering Committee | | Operational Risk Committee | | Catastrophe Risk Steering Committee | | Economic Capital Executive Committee | | Model Oversight Committee |
The Company's enterprise risk management ("ERM") function supports the ERCC and functional committees, and is tasked with, among other things:
risk identification and assessment;
the development of risk appetites, tolerances, and limits;
risk monitoring; and
internal and external risk reporting.
The Company categorizes its main risks as insurance risk, operational risk and financial risk, each of which is described in more detail below.
Insurance Risk
Insurance risk is the risk of losses of both a catastrophic and non-catastrophic nature on the P&C and lifegroup benefits products the Company has sold. Catastrophe insurance risk is the exposure arising from both natural (e.g., weather, earthquakes, wildfires, pandemics) and man-made catastrophes (e.g., terrorism, cyber-attacks) that create a concentration or aggregation of loss across the Company's insurance or asset portfolios.
Sources of Insurance RiskNon-catastrophe insurance risks exist within each of the Company's divisions except MutualHartford Funds and include:
Property- Risk of loss to personal or commercial property from automobile related accidents, weather, explosions, smoke, shaking, fire, theft, vandalism, inadequate installation, faulty equipment, collisions and falling objects, and/or machinery mechanical breakdown resulting in physical damage and other covered perils.
| |
| • | Property- Risk of loss to personal or commercial property from automobile related accidents, weather, explosions, smoke, shaking, fire, theft, vandalism, inadequate installation, faulty equipment, collisions and falling objects, and/or machinery mechanical breakdown resulting in physical damage and other covered perils. |
| |
| • | Liability- Risk of loss from automobile related accidents, uninsured and underinsured drivers, lawsuits from accidents, defective products, breach of warranty, negligent acts by professional practitioners, environmental claims, latent exposures, fraud, coercion, forgery, failure to fulfill obligations per contract surety, liability from errors and omissions, losses from political and credit coverages, losses derivative lawsuits, and other securities actions and covered perils. |
| |
| • | Mortality- Risk of loss from unexpected trends in insured deaths impacting timing of payouts from group life insurance, personal or commercial automobile related accidents, and death of employees or executives during the course of employment, while on disability, or while collecting workers compensation benefits. |
Liability- Risk of loss from automobile related accidents, uninsured and underinsured drivers, lawsuits from accidents, defective products, breach of warranty, negligent acts by professional practitioners, environmental claims, latent exposures, fraud, coercion, forgery, failure to fulfill obligations per contract surety, liability from errors and omissions, derivative lawsuits, and other securities actions and covered perils.
Mortality- Risk of loss from unexpected trends in insured deaths impacting timing of payouts from life insurance, personal or commercial automobile related accidents, and death of employees or executives during the course of employment, while on disability, or while collecting workers compensation benefits.
Morbidity- Risk of loss to an insured from illness incurred during the course of employment or illness from other covered perils.
Disability- Risk of loss incurred from personal or commercial automobile related losses, accidents arising outside of the workplace, injuries or accidents incurred during the course of employment, or from equipment, with each loss resulting in short term or long-term disability payments.
Longevity- Risk of loss from increased life expectancy trends among policyholders receiving long-term benefit payments.
| |
| • | Morbidity- Risk of loss to an insured from illness incurred during the course of employment or illness from other covered perils. |
| |
| • | Disability- Risk of loss incurred from personal or commercial automobile related losses, accidents arising outside of the workplace, injuries or accidents incurred during the course of employment, or from equipment, with each loss resulting in short term or long-term disability payments. |
| |
| • | Longevity- Risk of loss from increased life expectancy trends among policyholders receiving long-term benefit payments. |
Catastrophe risk primarily arises in the property, automobile, group life, group disability, property, and workers' compensation product lines.
ImpactNon-catastrophe insurance risk can arise from unexpected loss experience, underpriced business and/or underestimation of loss reserves and can have significant effects on the Company’s earnings. Catastrophe insurance risk can arise from various unpredictable events and can have significant
Part II - Item 7. Management's Discussion and Analysis of Financial Condition and Results of Operations
effects on the Company's earnings and may result in losses that could constrain its liquidity.
ManagementThe Company's policies and procedures for managing these risks include disciplined underwriting protocols, exposure controls, sophisticated risk-based pricing, risk modeling, risk transfer, and capital management strategies. The Company has established underwriting guidelines for both individual risks, including individual policy limits, and risks in the aggregate,
including aggregate exposure limits by geographic zone and peril. The Company uses both internal and third-party models to estimate the potential loss resulting from various catastrophe events and the potential financial impact those events would have on the Company's financial position and results of operations across its businesses.
In addition, certain insurance products offered by The Hartford provide coverage for losses incurred due to cyber events and the Company has assessed and modeled how those products would respond to different events in order to manage its aggregate exposure to losses incurred under the insurance policies we sell. The Company models numerous deterministic scenarios including losses caused by malware, data breach, distributed denial of service attacks, intrusions of cloud environments and attacks of power grids.
Among specific risk tolerances set by the Company, risk limits are set for natural catastrophes, terrorism risk and pandemic risk.
Part II - Item 7. Management's Discussion and Analysis of Financial Condition and Results of Operations
|
| | | |
| Risk | Definition | Details and Company Limits |
| Natural catastrophe | Exposure arising from natural phenomena (e.g., weather, earthquakes, wildfires, etc.) that create a concentration or aggregation of loss across the Company's insurance or asset portfolios.portfolios and the inherent volatility of weather or climate pattern changes. | The Company generally limits its estimated pre-tax loss as a result of natural catastrophes for property & casualty exposures from a single 250-year event to less than 30% of statutory surplus of the property and casualty insurance subsidiaries prior to reinsurance and to less than 15% of statutory surplus of the property and casualty insurance subsidiaries after reinsurance. From time to time the estimated loss to natural catastrophes from a single 250-year event prior to reinsurance may fluctuate above or below these limits due to changes in modeled loss estimates, exposures or statutory surplus. |
| | - The estimated 250 year pre-tax probable maximum loss from earthquake events is estimated to be $982$917 before reinsurance and $515$470 net of reinsurance. [1] |
| | - The estimated 250 year pre-tax probable maximum losses from hurricane events are estimated to be $1.6 billion before reinsurance and $777$877 net of reinsurance. [1] |
| Terrorism | The risk of losses from terrorist attacks, including losses caused by single-site and multi-site conventional attacks, as well as the potential for attacks using nuclear, biological, chemical or radiological weapons (“NBCR”). | Enterprise limits for terrorism apply to aggregations of risk across property-casualty, group benefits and specific asset portfolios and are defined based on a deterministic, single-site conventional terrorism attack scenario. The Company manages its potential estimated loss from a conventional terrorism loss scenario, up to $1.7$2.0 billion net of reinsurance and $2.0$2.5 billion gross of reinsurance, before coverage under the Terrorism Risk Insurance Program established under “TRIPRA”. In addition, the Company monitors exposures monthly and employs both internally developed and vendor-licensed loss modeling tools as part of its risk management discipline. Our modeled exposures to conventional terrorist attacks around landmark locations may fluctuate above and below our stated limits. |
| Pandemic | The exposure to loss arising from widespread influenza or other pathogens or bacterial infections that create an aggregation of loss across the Company's insurance or asset portfolios. | The Company generally limits its estimated pre-tax loss from a single 250 year pandemic event to less than 15%18% of statutory surplus of the property and casualty and group benefits insurance subsidiaries. In evaluating these scenarios, the Company assesses the impact on group life policies, short-term and long-term disability, property & casualty claims, and losses in the investment portfolio associated with market declines in the event of a widespread pandemic. While ERM has a process to track and manage these limits, from time to time, the estimated loss for pandemics may fluctuate above or below these limits due to changes in modeled loss estimates, exposures, or statutory surplus. |
| |
| [1] | The loss estimates represent total property losses for hurricane events and property and workers compensation losses for earthquake events resulting from a single event. The estimates provided are based on 250-year return period loss estimates that have a 0.4% likelihood of being exceeded in any single year. The net loss estimates provided assume that the Company is able to recover all losses ceded to reinsurers under its reinsurance programs. The Company also manages natural catastrophe risk for group life and group disability, which in combination with property and workers compensation loss estimates are subject to separate enterprise risk management net aggregate loss limits as a percent of enterprise surplus. |
Reinsurance as a Risk Management Strategy
In addition to the policies and procedures outlined above, the Company uses reinsurance to transfer certain risks to reinsurance companies based on specific geographic or risk concentrations. A variety of traditional reinsurance products are used as part of the Company's risk management strategy, including excess of loss occurrence-based products that reinsure property and workers' compensation exposures, and individual risk (including facultative reinsurance) or quota share arrangements, that reinsure losses from specific classes or lines of business. The Company has no significant finite risk contracts in
place and the statutory surplus benefit from all such prior year contracts is immaterial.
Facultative reinsurance is used by the Company to manage policy-specific risk exposures based on established underwriting guidelines. The Hartford also participates in governmentally administered reinsurance facilities such as the Florida Hurricane Catastrophe Fund (“FHCF”), the Terrorism Risk Insurance Program established under “TRIPRA”(“TRIPRA”) and other reinsurance programs relating to particular risks or specific lines of business.
Reinsurance for Catastrophes-The Company has several catastrophe reinsurance programs, including reinsurance treaties that cover property and workers’ compensation losses aggregating from single catastrophe events.
Part II - Item 7. Management's Discussion and Analysis of Financial Condition and Results of Operations
Primary Catastrophe Treaty Reinsurance Coverages as of January 1, 20182019
|
| | | | | | | | | | | | |
| | | Effective for the period | | % of layer(s) reinsurance | | Per occurrence limit | | Retention |
| Property losses arising from a single catastrophe event [1] [2] | | 1/1/2018 to 1/1/2019 | | 89% | | $ | 850 |
| | $ | 350 |
|
| Property catastrophe losses from a Personal Lines Florida hurricane | | 6/1/2017 to 6/1/2018 | | 90% | | $ | 102 |
| [3] | $ | 31 |
|
| Workers compensation losses arising from a single catastrophe event [4] | | 1/1/2018 to 12/31/2018 | | 80% | | $ | 350 |
| | $ | 100 |
|
|
| | |
| Portion of losses reinsured | Portion of losses retained by The Hartford |
| Per Occurrence Property Catastrophe Treaty for 1/1/2019 to 12/31/2019 [1] | | |
| Losses of $0 to $350 from one event | None | 100% retained |
| Losses of $350 to $500 from one event | 75% of $150 in excess of $350 | 25% co-participation |
| Losses of $500 to $1.1 billion from one event [2] | 90% of $600 in excess of $500 | 10% co-participation |
| Aggregate Property Catastrophe Treaty for 1/1/2019 to 12/31/2019 [3] |
|
|
| $0 to $775 of aggregate losses | None | 100% retained |
| $775 to $1.0 billion of aggregate losses | 100% | None |
| Workers' Compensation Catastrophe Treaty for 1/1/2019 to 12/31/2019 |
|
|
| Losses of $0 to $100 from one event | None | 100% retained |
| Losses of $100 to $450 from one event [4] | 80% of $350 in excess of $100 | 20% co-participation |
| |
| [1] | Certain aspectsIn addition to the Property Occurrence Treaty, for Florida events, The Hartford has purchased the mandatory FHCF reinsurance for the period from 6/1/2018 to 5/30/2019. Retention and coverage varies by writing company. The writing company with the largest coverage under FHCF is Hartford Insurance Company of our principal catastrophe treaty have terms that extend beyond the traditional one year term. While the overall treaty is placed at 89%, each layer's placement varies slightly.Midwest, with coverage for $84 of per event losses in excess of a $29 retention. |
| |
| [2] | $100Portions of this layer of coverage extend beyond the property occurrence treaty can alternatively be used as part of the Property Aggregate treaty referenced below.traditional one year term. |
| |
| [3] | The per occurrenceaggregate treaty is not limited to a single event; rather, it is designed to provide reinsurance protection for the aggregate of all events designated as catastrophes by PCS (Property Claims Services/Verisk) with a $350 limit on the FHCF treaty is $102 for the 6/1/2017 to 6/1/2018 treaty year based on the Company's election to purchase the required coverage from FHCF. Coverage is based on the best available information from FHCF, which was updated in January 2018.any one event. |
| |
| [4] | In addition to the limitlimits shown, the workersworker's compensation reinsurance includes a non-catastrophe, industrial accident layer, providing coverage for 80% of a $30 in per event limitlosses in excess of a $20 retention. |
In addition to the property catastrophe reinsurance coverage described in the above table, the Company has other catastrophe and working layer treaties and facultative reinsurance agreements that cover property catastrophe losses on an aggregate excess of losslosses. The Per Occurrence Property Catastrophe Treaty and on a per risk basis. The principal property catastrophe reinsurance program and certain other reinsurance programsWorkers' Compensation Catastrophe Treaty include a provision to reinstate limits in the event that a catastrophe loss exhausts limits on one or more layers under the treaties. In addition, covering the period from January 1, 2018 to December 31, 2018, the Company has a Property Aggregate treaty in place which provides one limit of $200 of aggregate qualifying property catastrophe losses in excess of a net retention of $825.
Reinsurance for Terrorism- For the risk of terrorism, private sector catastrophe reinsurance capacity is generally limited and largely unavailable for terrorism losses caused by NBCRnuclear, biological, chemical or radiological attacks. As such, the Company's principal reinsurance protection against large-scale terrorist attacks is the coverage currently provided through TRIPRA to the end of 2020.
TRIPRA provides a backstop for insurance-related losses resulting from any “act of terrorism”, which is certified by the Secretary of the Treasury, in consultation with the Secretary of Homeland Security and the Attorney General, for losses that exceed a threshold of industry losses of $160$180 in 2018,2019, with the threshold increasing to $200 by 2020. Under the program, in any one calendar year, the federal government would pay a percentage of losses incurred from a certified act of terrorism after an insurer's losses exceed 20% of the Company's eligible direct commercial earned premiums of the prior calendar year up to a combined annual aggregate limit for the federal government and all insurers of $100 billion. The percentage of losses paid by the federal government is 82%81% in 2018,2019, decreasing by 1 point annually to 80% in the year 2020. The Company's estimated deductible under the program is $1.3 billion for 2018.2019. If an act of terrorism or acts of terrorism result in covered losses exceeding the $100 billion annual industry aggregate limit, Congress would be responsible for determining how additional losses in excess of $100 billion will be paid.
Reinsurance for Asbestos and EnvironmentalA&E Reserve Development- Under an ADC reinsurance agreement, NICO a subsidiary of Berkshire Hathaway Inc. (“Berkshire”), assumes adverse net loss and allocated loss adjustment expense reserve
development up to $1.5 billion above the Company’s net asbestos and environmentalA&E reserves recorded as of December 31, 2016. Under retroactive reinsurance accounting, net adverse asbestos and environmentalA&E reserve development after December 31, 2016 results in an offsetting reinsurance recoverable up to the $1.5 billion limit. Cumulative ceded losses up to the $650 reinsurance premium paid for the ADC are recognized as a dollar-for-dollar offset to direct losses incurred. As of December 31, 2017, $2852018, $523 of incurred asbestos and environmental losses had been ceded to NICO.NICO, leaving approximately $977 of coverage available for future adverse net reserve development, if any. Cumulative ceded losses exceeding the $650 reinsurance premium paid would result in a deferred gain. The deferred gain would be recognized over the claim settlement period in the proportion of the amount of cumulative ceded losses collected from the reinsurer to the estimated ultimate reinsurance recoveries. Consequently, until periods when the deferred gain is recognized as a benefit to earnings, cumulative adverse development of asbestos and environmentalA&E claims after December 31, 2016 in excess of $650 may result in significant charges against earnings. Furthermore, there is a risk that cumulative adverse development of asbestos and environmentalA&E claims could ultimately exceed the $1.5 billion treaty limit in which case all adverse development in excess of the treaty limit would be absorbed as a charge to earnings by the Company. In these scenarios, the effect of these changescharges could be material to the Company’s consolidated operating results and liquidity.
Reinsurance Recoverables
Property and casualty insurance product reinsurance recoverables represent loss and loss adjustment expense recoverables from a number of entities, including reinsurers and pools.
Part II - Item 7. Management's Discussion and Analysis of Financial Condition and Results of Operations
Property & Casualty Reinsurance Recoverables | | | | As of December 31, | As of December 31, |
| | 2017 | 2016 | 2018 | 2017 |
| Paid loss and loss adjustment expenses | $ | 84 |
| $ | 89 |
| $ | 127 |
| $ | 84 |
|
| Unpaid loss and loss adjustment expenses | 3,496 |
| 3,161 |
| 3,773 |
| 3,496 |
|
| Gross reinsurance recoverables | 3,580 |
| 3,250 |
| 3,900 |
| 3,580 |
|
| Less: Allowance for uncollectible reinsurance | (104 | ) | (165 | ) | (126 | ) | (104 | ) |
| Net reinsurance recoverables [1] | $ | 3,476 |
| $ | 3,085 |
| |
| Net reinsurance recoverables | | $ | 3,774 |
| $ | 3,476 |
|
| |
[1] | Includes Property & Casualty Commercial Lines reinsurance recoverables of $688 and $712 as of December 31, 2017 and 2016, respectively, for structured settlements recoverables due from the Company's life and annuity run-off business now classified as held for sale. These amounts were previously eliminated in consolidation.
|
As shown in the following table, a portion of the total gross reinsurance recoverables relates to the Company’s mandatory participation in various involuntary assigned risk pools and the value of annuity contracts held under structured settlement agreements. Reinsurance recoverables due from mandatory pools are backed by the financial strength of the property and casualty insurance industry. Annuities purchased from third-party life insurers under structured settlements are recognized as reinsurance recoverables in cases where the Company has not obtained a release from the claimant. Of the remaining gross reinsurance recoverables, the portion of recoverables due from companies rated by A.M. Best is as follows:
Distribution of Gross Reinsurance Recoverables
| | | | As of December 31, | As of December 31, |
| | 2017 | 2016 | 2018 | 2017 |
| Gross reinsurance recoverables [1] | $ | 3,580 |
| | $ | 3,250 |
| | |
| Less: mandatory (assigned risk) pools and structured settlements [1] | (1,199 | ) | | (1,240 | ) | | |
| Gross reinsurance recoverables | | $ | 3,900 |
| | $ | 3,580 |
| |
| Less: mandatory (assigned risk) pools and structured settlements | | (1,220 | ) | | (1,199 | ) | |
| Gross reinsurance recoverables excluding mandatory pools and structured settlements | $ | 2,381 |
| | $ | 2,010 |
| | $ | 2,680 |
| | $ | 2,381 |
| |
| | | % of Total | | % of Total | | % of Total | | % of Total |
| Rated A- (Excellent) or better by A.M. Best [2] | $ | 1,836 |
| 77.1 | % | $ | 1,470 |
| 73.1 | % | |
| Rated A- (excellent) or better by A.M. Best [1] | | $ | 2,194 |
| 81.8 | % | $ | 1,836 |
| 77.1 | % |
| Other rated by A.M. Best | 1 |
| 0.1 | % | 1 |
| 0.1 | % | 1 |
| 0.1 | % | 1 |
| 0.1 | % |
| Total rated companies | 1,837 |
| 77.2 | % | 1,471 |
| 73.2 | % | 2,195 |
| 81.9 | % | 1,837 |
| 77.2 | % |
| Voluntary pools | 37 |
| 1.5 | % | 79 |
| 3.9 | % | 35 |
| 1.3 | % | 37 |
| 1.5 | % |
| Captives | 323 |
| 13.6 | % | 336 |
| 16.7 | % | 302 |
| 11.3 | % | 323 |
| 13.6 | % |
| Other not rated companies | 184 |
| 7.7 | % | 124 |
| 6.2 | % | 148 |
| 5.5 | % | 184 |
| 7.7 | % |
| Total | $ | 2,381 |
| 100.0 | % | $ | 2,010 |
| 100.0 | % | $ | 2,680 |
| 100.0 | % | $ | 2,381 |
| 100.0 | % |
| |
| [1] | Includes Property & Casualty Commercial Lines reinsurance recoverables of $688 and $712 as of December 31, 2017 and 2016, respectively, for structured settlements recoverables due from the Company's life and annuity run-off business now classified as held for sale. These amounts were previously eliminated in consolidation.
|
| |
[2] | Based on A.M. Best ratings as of December 31, 20172018 and 20162017, respectively. |
To manage reinsurer credit risk, a reinsurance security review committee evaluates the credit standing, financial performance, management and operational quality of each potential reinsurer. In placing reinsurance, the Company considers the nature of the risk reinsured, including the expected liability payout duration, and establishes limits tiered by reinsurer credit rating.
Where its contracts permit, the Company secures future claim obligations with various forms of collateral, including irrevocable letters of credit, secured trusts, funds held accounts and group wide offsets. As part of its reinsurance recoverable review, the Company analyzes recent developments in commutation activity between reinsurers and cedants, recent trends in arbitration and litigation outcomes in disputes between cedants and reinsurers and the overall credit quality of the Company’s reinsurers. As indicated in the above table, 77.1%81.8% of the gross reinsurance recoverables due from reinsurers rated by A.M. Best were rated A- (excellent) or better as of December 31, 2017.2018.
Annually, the Company completes evaluations of the reinsurance recoverable asset associated with older, long-term casualty liabilities reported in the Property & Casualty Other Operations reporting segment, and the allowance for uncollectible reinsurance reported in the Commercial Lines reporting segment. For a discussion regarding the results of these evaluations, see MD&A - Critical Accounting Estimates, Property and Casualty Insurance Product Reserves, Net of Reinsurance.
Part II - Item 7. Management's Discussion and Analysis of Financial Condition and Results of Operations
Group benefits and life insurance productBenefits reinsurance recoverables
represent reserve for future policy benefits and unpaid loss and loss adjustment expenses and other policyholder funds and benefits payable that are recoverable from a number of reinsurers.
Group Benefits Reinsurance Recoverables
| | | | As of December 31, | As of December 31, |
| | 2017 | 2016 | 2018 | 2017 |
| Future policy benefits and unpaid loss and loss adjustment expenses and other policyholder funds and benefits payable | $ | 236 |
| $ | 208 |
| |
| Paid loss and loss adjustment expenses | | $ | 12 |
| $ | 27 |
|
| Unpaid loss and loss adjustment expenses | | 239 |
| 209 |
|
| Gross reinsurance recoverables | | 251 |
| 236 |
|
| Less: Allowance for uncollectible reinsurance [1] | — |
| — |
| — |
| — |
|
| Net reinsurance recoverables | $ | 236 |
| $ | 208 |
| $ | 251 |
| $ | 236 |
|
| |
| [1] | No allowance for uncollectible reinsurance was required as of December 31, 20172018 and 20162017. |
Guaranty Funds and Other Insurance-related Assessments
As part of its risk management strategy, the Company regularly monitors the financial strength of other insurers and, in particular, activity by insurance regulators and various state guaranty associations relating to troubled insurers. In all states, insurers licensed to transact certain classes of insurance are required to become members of a guaranty fund.
Operational Risk
Operational risk is the risk of loss resulting from inadequate or failed internal processes and systems, human error, or from external events.
Sources of Operational RiskOperational risk is inherent in the Company's business and functional areas. Operational risks include legal; cyberinclude: compliance with laws and information security; models;regulation, cybersecurity, business disruption, technology failure, inadequate execution or process management, reliance on model and data analytics, internal fraud, external fraud, third party vendors; technology; operations; business continuity; disaster recovery; internaldependency and external fraud;attraction and compliance.retention of talent.
Part II - Item 7. Management's Discussion and Analysis of Financial Condition and Results of Operations
Impact Operational risk can result in financial loss, disruption of our business, regulatory actions or damage to our reputation.
Management Responsibility for day-to-day management of operational risk lies within each business unit and functional area. ERM provides an enterprise-wide view of the Company's operational risk on an aggregate basis. ERM is responsible for establishing, maintaining and communicating the framework, principles and guidelines of the Company's operational risk management program. Operational risk mitigation strategies include the following:
Establishing policies and monitoring risk tolerances and exceptions;
Conducting business risk assessments and implementing action plans where necessary;
Validating existing crisis management protocols;
Identifying and monitoring emerging risks; and
Purchasing insurance coverage.
Cybersecurity Risk
The Hartford has implemented an information protection program with established governance routines that promote an adaptive approach for assessing and managing risks. The Hartford has invested to build a ‘defense-in-depth’ strategy that uses multiple security measures to protect the integrity of the Company's information assets. This ‘defense-in-depth’ strategy aligns to the National Institute of Standards and Technology (NIST)("NIST") Cyber Security Framework and provides preventative, detective and responsive measures that collectively protects the company.Company. Various cyber assurance methods, including security metrics, third party security assessments, external penetration testing, red team exercises, and cyber war game exercises are used to test the effectiveness of the overall cybersecurity control environment.
The Hartford, like many other large financial services companies, blocks attempted cyber intrusions on a daily basis. In the event of a cyber intrusion, the companyCompany invokes its Cyber Incident Response Program (the "Program") commensurate with the nature of the intrusion. While the actual methods employed differ based on the event, our approach employs internal teams and outside advisors with specialized skills to support the response and recovery efforts and requires elevation of issues, as necessary, to senior management. In addition, we have procedures to ensure timely notification of critical cybersecurity incidents pursuant to the Program to help identify employees who may have material non-public information and to implement blackout restrictions on trading the Company's securities during the investigation and assessment of such cybersecurity incidents.
From a governance perspective, senior members of our Enterprise Risk Management, Information Protection and Internal Audit functions provide detailed, regular reports on cybersecurity matters to the Board, including the Finance, Investment, and Risk Management Committee (FIRMCo), a committee comprised of all directors, which has principal responsibility for oversight of cybersecurity risk, and/or the Audit Committee, which oversees controls for the Company's major risk exposures. The topics covered by these updates include the company'sCompany's activities, policies and procedures to prevent, detect and respond to cybersecurity incidents, as well as lessons learned
from cybersecurity incidents and internal and external testing of our protection measures. FIRMCo meets at each regular Board meeting and is briefed on cyber risks at least annually.defenses.
Financial Risk
Financial risks include direct and indirect risks to the Company's financial objectives coming from events that impact market conditions or prices. Some events may cause correlated movement in multiple risk factors. The primary sources of financial risks are the Company's invested assets. Consistent with its risk appetite, the Company establishes financial risk limits to control potential loss on a U.S. GAAP, statutory, and economic basis. Exposures are actively monitored and mitigated where appropriate. The Company uses various risk management strategies, including reinsurance and over-the-counter ("OTC") and exchange traded derivatives with counterparties meeting the appropriate regulatory and due diligence requirements. Derivatives are utilized to achieve one of four Company-approved objectives: hedging risk arising from interest rate, equity market, commodity market, credit spread and issuer default, price or currency exchange rate risk or volatility; managing liquidity; controlling transaction costs; or entering into synthetic replication transactions. Derivative activities are monitored and evaluated by the Company’s compliance and risk management teams and reviewed by senior management.
Part II - Item 7. Management's Discussion and Analysis of Financial Condition and Results of Operations
The Company identifies different categories of financial risk, including liquidity, credit, interest rate, equity and foreign currency exchange, as described below.
Liquidity Risk
Liquidity risk is the risk to current or prospective earnings or capital arising from the Company's inability or perceived inability to meet its contractual funding obligations as they come due.
Sources of Liquidity RiskSources of liquidity risk include funding risk, company-specific liquidity risk and market liquidity risk resulting from differences in the amount and timing of sources and uses of cash as well as company-specific and general market conditions. Stressed market conditions may impact the ability to sell assets or otherwise transact business and may result in a significant loss in value.
ImpactInadequate capital resources and liquidity could negatively affect the Company’s overall financial strength and its ability to generate cash flows from its businesses, borrow funds at competitive rates, and raise new capital to meet operating and growth needs.
Management The Company has defined ongoing monitoring and reporting requirements to assess liquidity across the enterprise under both current and stressed market conditions. The Company measures and manages liquidity risk exposures and funding needs within prescribed limits across legal entities, taking into account legal, regulatory and operational limitations to the transferability of liquidity.liquid assets. The Company also monitors internal and external conditions, and identifies material risk changes and emerging risks that may impact liquidity.operating cash flows or liquid assets. The liquidity requirements of the Holding Company have been and will continue to be met by the Holding Company's fixed maturities, short-term investments and cash, and dividends from its subsidiaries, principally its insurance operations, as well as the issuance of common stock, debt or other capital securities and borrowings from its credit
Part II - Item 7. Management's Discussion and Analysis of Financial Condition and Results of Operations
facilities as needed. The Company maintains multiple sources of contingent liquidity including a revolving credit facility, a commercial paper program, an intercompany liquidity agreement that allows for short-term advances of funds among the HFSG Holding Company and certain affiliates, and access to collateralized advances from the Federal Home Loan Bank of Boston ("FHLBB") for certain affiliates. The Company's CFO has primary responsibility for liquidity risk.
For further discussion on liquidity see the section on Capital Resources and Liquidity.
Credit Risk and Counterparty Risk
Credit risk is the risk to earnings or capital due to uncertainty of an obligor’s or counterparty’s ability or willingness to meet its obligations in accordance with contractually agreed upon terms. Credit risk is comprised of three major factors: the risk of change in credit quality, or credit migration risk; the risk of default; and the risk of a change in value due to changes in credit spreads.
Sources of Credit RiskThe majority of the Company’s credit risk is concentrated in its investment holdings, but it is also present in the Company’s reinsurance and insurance portfolios.
Impact A decline in creditworthiness is typically associated with an increase in an investment’s credit spread, and potentially resultresulting in an increase in other-than-temporary impairmentsimpairment, and an increased probability of a realized loss upon sale. Premiums receivable and reinsurance recoverables are also subject to credit risk based on the counterparty’s unwillingness or inability to pay.
Management The objective of the Company’s enterprise credit risk management strategy is to identify, quantify, and manage credit risk on an aggregate portfolio basis and to limit potential losses in accordance with an established credit risk management policy. The Company primarily manages its credit risk by holding a diversified mix of investment grade issuers and counterparties across its investment, reinsurance, and insurance
portfolios. Potential losses are also limited within portfolios by diversifying across geographic regions, asset types, and sectors.
The Company manages credit risk on an on-going basis through the use of various processes and analyses. Both the investment and reinsurance areas have formulated procedures for counterparty approvals and authorizations, which establish minimum levels of creditworthiness and financial stability. Credits considered for investment are subjected to underwriting reviews. Within the investment portfolio, private securities are subject to committee review formanagement approval. Mitigation strategies vary across the three sources of credit risk, but may include:
Investing in a portfolio of high-quality and diverse securities;
Selling investments subject to credit risk;
Hedging through use of credit default swaps;
Clearing transactions through central clearing houses that require daily variation margin;
Entering into contracts only with strong creditworthy institutions
Requiring collateral; and
Non-renewing policies/contracts or reinsurance treaties.
The Company has developed credit exposure thresholds which are based upon counterparty ratings. Aggregate counterparty credit quality and exposure are monitored on a daily basis utilizing an enterprise-wide credit exposure information system that contains data on issuers, ratings, exposures, and credit limits. Exposures are tracked on a current and potential basis and aggregated by ultimate parent of the counterparty across investments, reinsurance receivables, insurance products with credit risk, and derivatives.
As of December 31, 2017,2018, the Company had no investment exposure to any credit concentration risk of a single issuer or counterparty greater than 10% of the Company's stockholders' equity, other than the U.S. government and certain U.S. government securities.agencies. For further discussion of concentration of credit risk in the investment portfolio, see the Concentration of Credit Risk section in Note 6 - Investments of Notes to Consolidated Financial Statements.
Assets and Liabilities Subject to Credit RiskAssets and Liabilities Subject to Credit Risk InvestmentsEssentially all of the Company's invested assets are subject to credit risk. Credit related impairments on investments were $1 and $2, in 2018 and $21, in 2017, and 2016, respectively. (See the Enterprise Risk Management section of the MD&A under “Other-Than-Temporary Impairments.”)
Reinsurance recoverablesReinsurance recoverables, net of an allowance for uncollectible reinsurance, were $4,061$4,357 and $3,659,$4,061, as of December 31, 20172018 and 2016,2017, respectively. (See the Enterprise Risk Management section of the MD&A under “Reinsurance as a Risk Management Strategy.”)
Premiums receivable and agents' balancesPremiums receivable and agents’ balances, net of an allowance for doubtful accounts, were $3,910$3,995 and $3,730,$3,910, as of December 31, 20172018 and 2016,2017, respectively. (For a discussion regarding collectibility of these balances, see Note 1, Basis of Presentation and Significant Accounting Policies of Notes to Consolidated Financial Statements under the section labeled “Revenue Recognition.”)
Credit Risk of Derivatives
The Company uses various derivative counterparties in executing its derivative transactions. The use of counterparties creates credit risk that the counterparty may not perform in accordance with the terms of the derivative transaction.
Downgrades to the credit ratings of the Company’s insurance operating companies may have adverse implications for its use of derivatives. In some cases, downgrades may give derivative counterparties for over-the-counterOTC derivatives and clearing brokers for OTC-cleared derivatives the right to cancel and settle outstanding derivative trades or require additional collateral to be posted. In addition, downgrades may result in counterparties and clearing brokers becoming unwilling to engage in or clear additional derivatives or may require collateralization before entering into any new trades.
Managing the Credit Risk of Counterparties to Derivative Instruments
The Company also has derivative counterparty exposure policies which limit the Company’s exposure to credit risk. The Company monitors counterparty exposure on a monthly basis to ensure compliance with Company policies and statutory limitations. The Company’s policies with respect to derivative counterparty exposure establishes market-based credit limits, favors long-term financial stability and creditworthiness of the counterparty and typically requires credit enhancement/credit risk reducing agreements, which are monitored and evaluated by the Company’s risk management team and reviewed by senior management.
The Company minimizes the credit risk of derivative instruments by entering into transactions with high quality counterparties primarily rated A or better. The Company also generally requires that OTC derivative contracts be governed by an International Swaps and Derivatives Association ("ISDA") Master Agreement,
which is structured by legal entity and by counterparty and permits right of offset. The Company enters into credit support annexes in conjunction with the ISDA agreements, which require daily collateral settlement based upon agreed upon thresholds.
The Company has developed credit exposure thresholds which are based upon counterparty ratings. Credit exposures are measured usinggenerally quantified based on the marketprior business day's net fair value, of the derivatives,including income accruals, resulting in amounts owed to the Company by its counterparties or potential payment obligations from the Company to its counterparties. The notional amounts of derivative contracts represent the basis upon which pay or receive amounts are calculated and are not reflective of credit risk. For purposes of daily derivative collateral maintenance, credit exposures are generally quantified based on the prior business day’s market value and collateral is pledged to and held by, or on behalf of, the Company to the extent the current value of the derivatives exceed the contractualis greater than zero, subject to minimum transfer thresholds. In accordance with industry standards and the contractual agreements, collateral is typically settled on the same business day. The Company has exposure to credit risk for amounts below the exposure thresholds which are uncollateralized, as well as for market fluctuations that may occur between contractual settlement periods of collateral movements.
For the company’s derivative programs, the maximum uncollateralized threshold for a derivative counterparty for a single legal entity is $10. The Company currently transacts OTC derivatives in three legal entities that have a threshold greater than zero. The maximum combined threshold for a single counterparty across all legal entities that use derivatives and have a threshold greater than zero is $10. In addition, the Company may have exposure to multiple counterparties in a single corporate family due to a common credit support provider. As of December 31, 2017, the maximum combined threshold for all counterparties under a single credit support provider across all legal entities that use derivatives and have a threshold greater than zero was $10. Based on the contractual terms of the collateral agreements, these thresholds may be immediately reduced due to a downgrade in either party’s credit rating. For further discussion, see the Derivative Commitments section of Note 14 Commitments and Contingencies of Notes to Consolidated Financial Statements.
For the year ended December 31, 2017,2018, the Company incurred no losses on derivative instruments due to counterparty default.
Use of Credit Derivatives
The Company may also use credit default swaps to manage credit exposure or to assume credit risk to enhance yield.
Credit Risk Reduced Through Credit Derivatives
The Company uses credit derivatives to purchase credit protection with respect to a single entity or referenced index. The Company purchases credit protection through credit default swaps to economically hedge and manage credit risk of certain fixed maturity investments across multiple sectors of the investment portfolio. As of December 31, 20172018 and 2016,2017, the notional amount related to credit derivatives that purchase credit protection was $61$6 and $78,$61, respectively, while the fair value was $1$0 and $(1),$1, respectively. These amounts do not include positions that are in offsetting relationships.
Credit Risk Assumed Through Credit Derivatives
The Company also enters into credit default swaps that assume credit risk as part of replication transactions. Replication
transactions are used as an economical means to synthetically replicate the characteristics and performance of assets that are
permissible investments under the Company’s investment policies. These swaps reference investment grade single corporate issuers and indexes. As of December 31, 20172018 and 2016,2017, the notional amount related to credit derivatives that assume credit risk was $823$1.1 billion and $851,$823, respectively, while the fair value was $3 and $6, respectively.for both periods. These amounts do not include positions that are in offsetting relationships.
For further information on credit derivatives, see Note 7 Derivatives of Notes to Consolidated Financial Statements.
Credit Risk of Business Operations
A portion of the company's commercial business is written with large deductible policies or retrospectively-rated plans. Under some commercial insurance contracts with deductible features, the Company is obligated to pay the claimant the full amount of the claim. The Company is subsequently reimbursed by the contract holder for the deductible amount, and is subject to credit risk until such reimbursement is made. Additionally, retrospectively rated policies are utilized primarily for workers compensation coverage, whereby the ultimate premium is determined based on actual loss activity. Although the retrospectively rated feature of the policy substantially reduces insurance risk for the Company, it does introduce credit risk to the Company. The Company’s results of operations could be adversely affected if a significant portion of such contract holders failed to reimburse the Company for the deductible amount or the retrospectively rated policyholders failed to pay additional premiums owed. While the Company attempts to manage the risks discussed above through underwriting, credit analysis, collateral requirements, provision for bad debt, and other oversight mechanisms, the Company’s efforts may not be successful.
Interest Rate Risk
Interest rate risk is the risk of financial loss due to adverse changes in the value of assets and liabilities arising from movements in interest rates. Interest rate risk encompasses exposures with respect to changes in the level of interest rates, the shape of the term structure of rates and the volatility of interest rates. Interest rate risk does not include exposure to changes in credit spreads.
Sources of Interest Rate RiskThe Company has exposure to interest rates arising from its fixed maturity securities, long-term debt obligations, short and long-term disability claim reserves, and discount rate assumptions associated with the Company’s pension and other post retirement benefit obligations. In addition, certain product liabilities expose the Company to interest rate risk, in particular short and long-term disability claim reserves.
ImpactChanges in interest rates from current levels can have both favorable and unfavorable effects for the Company.
Part II - Item 7. Management's Discussion and Analysis of Financial Condition and Results of Operations
|
| | |
| Change in Interest Rates | Favorable Effects | Unfavorable Effects |
| ñ | Additional net investment income due to reinvesting at higher yields | Decrease in the fair value of the fixed income investment portfolio |
| | Potential impact on Company's tax planning strategies and, in particular, its ability to utilize tax benefits of previously recognized realized capital losses |
| Higher interest expense on variable rate debt obligations |
| ò | Increase in the fair value of the fixed income investment portfolio | Lower net investment income due to reinvesting at lower investment yields |
Lower interest expense on variable rate debt obligations | Acceleration in paydowns and prepayments or calls of certain mortgage-backed and municipal securities |
Potential increase in Mutual Funds fee income | |
Management The Company primarily manages its exposure to interest rate risk by constructing investment portfolios that seek to protect the firm from the economic impact associated with changes in interest rates by setting portfolio duration targets that are aligned with the duration of the liabilities that they support. The Company analyzes interest rate risk using various models including parametric models and cash flow simulation under various market scenarios of the liabilities and their supporting investment portfolios. Key metrics that the Company uses to quantify its exposure to interest rate risk inherent in its invested assets and the associated liabilities include duration, convexity and key rate duration.
The Company may also utilize a variety of derivative instruments to mitigate interest rate risk associated with its investment portfolio or to hedge liabilities. Interest rate caps, floors, swaps, swaptions, and futures may be used to manage portfolio duration. Interest rate swaps are primarily used to convert interest receipts or payments to a fixed or variable rate. The use of such swaps enables the Company to customize contract terms and conditions to desired objectives and manage the duration profile within established tolerances. Interest rate swaps are also used to hedge the variability in the cash flows of a forecasted purchase or sale of fixed rate securities due to changes in interest rates. As of December 31, 20172018 and 2016,2017, notional amounts pertaining to derivatives utilized to manage interest rate risk, including offsetting positions, totaled $10.5 billion and $10.2 billion, and $10.6 billion, respectively primarily related to investments. The fair value of these derivatives was $(83)$(61) and $(565)$(83) as of December 31, 2018 and 2017, and 2016, respectively.
Assets and Liabilities Subject to Interest Rate Risk
Fixed income investmentsThe fair value of fixed income investments, which include fixed maturities, commercial mortgage loans, and short-term investments, was $42.5$43.7 billion and $37.2$42.5 billion at December 31, 20172018 and 2016,2017, respectively. The weighted average duration of the portfolio, including derivative instruments, was approximately 5.24.7 years and 5.05.2 years as of December 31, 2018 and 2017, and 2016, respectively. Changes in the fair value of fixed maturities due to changes in interest rates are reflected as a component of AOCI.
Long-term debt obligations The Company's variable rate debt obligations will generally result in increased interest expense as a result of higher interest rates; the inverse is true during a declining interest rate environment. Changes in the value of long-term debt as a result of changes in interest rates will impact the fair value of these instruments but not the carrying value in the Company's Consolidated Balance Sheets. Group life and disability product liabilities The cash outflows associated with contracts issued by the Company's Group Benefits segment, primarily group life and short and long-term disability policy liabilities, are not interest rate sensitive but vary based on timing. Though the aggregate cash flow payment streams are relatively predictable, these products may rely upon actuarial pricing assumptions (including mortality and morbidity) and have an element of cash flow uncertainty. As of December 31, 20172018 and 2016,2017, the Company had $8,512$8,445 and $5,772,$8,512, respectively of reserves for group life and disability contracts withcontracts. Changes in the increase since December 31, 2016 largely due tovalue of the acquisitionliabilities as a result of Aetna's U.S. group life and disability business.changes in interest rates will impact the fair value of these instruments but not the carrying value in the Company's Consolidated Balance Sheets.
Part II - Item 7. Management's Discussion and Analysis of Financial Condition and Results of Operations
Pension and other post-retirement benefit obligationsThe Company’s pension and other post-retirement benefit obligations are exposed to interest rate risk based upon the sensitivity of present value obligations to changes in liability discount rates as well as the sensitivity of the fair value of investments in the plan portfolios to changes in interest rates. The discount rate assumption is based upon an interest rate yield curve that reflects high-quality fixed income investments consistent with the maturity profile of the expected liability cash flows. The Company is exposed to the risk of having to make additional plan contributions if the plans’ investment returns, including from investments in fixed maturities, are lower than expected. (For further discussion of discounting pension and other postretirement benefit obligations, refer to Note 18 - Employee Benefit Plans of Notes to Consolidated Financial Statements.) As of December 31, 20172018 and 2016,2017, the Company had $926$791 and $1,106,$926, respectively, of unfunded liabilities for pension and post-retirement benefit obligations recorded within Other Liabilities in the accompanying Balance Sheets.
Interest Rate Sensitivity
Invested Assets Supporting Group Life and Disability Reserves and Invested Assets Supporting Them
Included in the following table is the before-taxbefore tax change in the net economic value of contracts issued by the Company’s Group Benefits segment, primarily group life and disability, for which fixed valuation discount rate assumptions are established based upon investment returns assumed in pricing, along with the corresponding invested assets. Also included in this analysis are the interest rate sensitive derivatives used by the Company to hedge its exposure to interest rate risk in the investment portfolios supporting these contracts. This analysis does not include the assets and corresponding liabilities of other insurance products such as automobile, property, workers' compensation and general liability insurance. Certain financial instruments, such as limited partnerships and other alternative investments, have been omitted from the analysis as the interest rate sensitivity of these investments is generally lower and less predictable than fixed income investments. The calculation of the estimated hypothetical change in net economic value below assumes a 100 basis point upward and downward parallel shift in the yield curve.
Interest Rate Sensitivity of Group Benefits Short and Long-term Disability Reserves and Invested Assets Supporting Them
|
| | | | | | | | | | | | |
| Change in Net Economic Value as of December 31, |
| | 2017 | 2016 |
| Basis point shift | -100 |
| +100 |
| -100 |
| +100 |
|
| Increase (decrease) in economic value, before tax | $ | 51 |
| $ | (75 | ) | $ | 34 |
| $ | (45 | ) |
The carrying value of assets supporting the liabilities related to the businesses included in the table above was $10.1 billion and $6.6 billion, as of December 31, 2017 and 2016, respectively, and included fixed maturities, commercial mortgage loans and short-term investments. The assets supporting the liabilities are monitored and managed within set duration guidelines and are evaluated on a daily basis, as well as annually, using scenario
simulation techniques in compliance with regulatory requirements.
Invested Assets not Supporting Group Life and Disability Reserves
The following table provides an analysis showing the estimated before-tax change in the fair value of the Company’s investments and related derivatives, excluding assets supporting group life and disability reserves which are included in the table above, assuming 100 basis point upward and downward parallel shifts in the yield curve as of December 31, 2017 and 2016. Certain financial instruments, such as limited partnerships and other alternative investments, have been omitted from the analysis as the interest rate sensitivity of these investments is generally lower and less predictable than fixed income investments.
Interest Rate Sensitivity of Invested Assets Not Supporting Group Benefits Short and Long-term Disability Reserves
|
| | | | | | | | | | | | |
| Change in Fair Value as of December 31, |
| | 2017 | 2016 |
| Basis point shift | -100 |
| +100 |
| -100 |
| +100 |
|
| Increase (decrease) in fair value, before tax | $ | 1,819 |
| $ | (1,710 | ) | $ | 1,775 |
| $ | (1,661 | ) |
The carrying value of fixed maturities, commercial mortgage loans and short-term investments related to the businesses included in the table above was $32.4 billion and $30.6 billion, as of December 31, 2017 and 2016, respectively. The selection of the 100 basis point parallel shift in the yield curve was made only as an illustration of the potential hypothetical impact of such an event and should not be construed as a prediction of future market events. Actual results could differ materially from those illustrated abovebelow due to the nature of the estimates and assumptions used in the above analysis. The Company’s sensitivity analysis calculation assumes that the composition of invested assets and liabilities remain materially consistent throughout the year and that the current relationship between short-term and long-term interest rates will remain constant over time. As a result, these calculations may not fully capture the impact of portfolio re-allocations, significant product sales or non-parallel changes in interest rates.
Interest Rate Sensitivity of Group Benefits Short and Long-term Disability Reserves and Invested Assets Supporting Them
|
| | | | | | | | | | | | |
| Change in Net Economic Value as of December 31, |
| | 2018 | 2017 |
| Basis point shift | -100 |
| +100 |
| -100 |
| +100 |
|
| Increase (decrease) in economic value, before tax | $ | 47 |
| $ | (68 | ) | $ | 51 |
| $ | (75 | ) |
The carrying value of assets supporting the liabilities related to the businesses included in the table above was $10.0 billion and $10.1 billion, as of December 31, 2018 and 2017, respectively, and included fixed maturities, commercial mortgage loans and short-term investments. The assets supporting the liabilities are monitored and managed within set duration guidelines and are evaluated on a daily basis, as well as annually, using scenario simulation techniques in compliance with regulatory requirements.
Invested Assets not Supporting Group Life and Disability Reserves
The following table provides an analysis showing the estimated before tax change in the fair value of the Company’s investments and related derivatives, excluding assets supporting group life and disability reserves which are included in the table above, assuming 100 basis point upward and downward parallel shifts in the yield curve as of December 31, 2018 and 2017. Certain financial instruments, such as limited partnerships and other alternative investments, have been omitted from the analysis as the interest rate sensitivity of these investments is generally lower and less predictable than fixed income investments.
Interest Rate Sensitivity of Invested Assets Not Supporting Group Benefits Short and Long-term Disability Reserves
|
| | | | | | | | | | | | |
| Change in Fair Value as of December 31, |
| | 2018 | 2017 |
| Basis point shift | -100 |
| +100 |
| -100 |
| +100 |
|
| Increase (decrease) in fair value, before tax | $ | 1,761 |
| $ | (1,511 | ) | $ | 1,819 |
| $ | (1,710 | ) |
The carrying value of fixed maturities, commercial mortgage loans and short-term investments related to the businesses included in the table above was $33.7 billion and $32.4 billion, as of December 31, 2018 and 2017, respectively.
Long-term Debt
A 100 basis point parallel decrease in the yield curve would result in an increase in the fair value of the liability of $331 and $340 as of December 31, 2018 and 2017, respectively. A 100 basis point parallel increase in the yield curve would result in a decrease in the fair value of the liability of $(279) and $(287) as of December 31, 2018 and 2017, respectively. Changes in the value of long-term debt as a result of changes in interest rates will not impact the carrying value in the Company's Consolidated Balance Sheets.
Part II - Item 7. Management's Discussion and Analysis of Financial Condition and Results of Operations
Pension and Other Post-Retirement Plan Obligations
A 100 basis point parallel decrease in the yield curve would impact both the value of the underlying pension assets and the value of the liability, resulting in an increase in the net pension and other post-retirement plan obligations liability of $178 and $226 as of December 31, 2018 and 2017, respectively. A 100 basis point parallel increase in the yield curve would have the inverse effect and result in a decrease in the net pension and other post-retirement plan obligations liability of $(134) and $(170) as of December 31, 2018 and 2017, respectively. Gains or losses due to changes in interest rates on the pension and post-retirement plan obligations are recorded within AOCI and are amortized into the actuarial loss component of net periodic benefit cost when they exceed a threshold.
Equity Risk
Equity risk is the risk of financial loss due to changes in the value of global equities or equity indices.
Sources of Equity Risk The Company has exposure to equity risk from invested assets, mutual fund assets under management, and assets that support the Company’s pension and other post retirementpost-retirement benefit plans.plans, and fee income derived from Hartford Funds assets under management.
ImpactDeclines inThe investment portfolio is exposed to losses from market declines affecting equity marketssecurities, alternative assets and limited partnerships which could negatively impact the Company's reported earnings. For assets supporting pension and other post-retirement benefit plans, the Company may result in losses duebe required to sales or impairments that are recognized as realized losses in earnings or in reductions in market value that are recognized as unrealized losses in accumulated other comprehensive income ("AOCI"). Beginning in 2018, changesmake additional plan contributions if equity investments in the market value of equity securities will be recorded within our reported earnings. Declinesplan portfolios decline in equity markets mayvalue. Hartford Funds earnings are also decrease the value of limited partnerships and other alternative investments or result in losses
Part II - Item 7. Management's Discussion and Analysis of Financial Condition and Results of Operations
on derivatives, including on embedded product derivatives, thereby negatively impacting our reported earnings.
The Company’s mutual funds are significantly influenced by the U.S. and other equity markets. Generally, declines in equity markets will reduce the value of assets under management and the amount of fee income generated from those assets.
Increases in equity markets will generally have the inverse impact.
Management The Company uses various approaches in managing its equity exposure, including limits on the proportion of assets invested in equities, diversification of the equity portfolio, and hedging of changes in equity indexes.indices.
Assets and Liabilities Subject to Equity Risk The investmentInvestment portfoliois exposed to losses from market declines affecting equity securities and certain alternative assets and limited partnerships. Generally, declines in equity markets will reduce the value of these types of investments and could negatively impact the Company’s earnings while increases in equity will have the inverse impact. For equity securities, the changes in fair value are reported in net realized capital gains and losses. For alternative assets and limited partnerships, the Company's share of earnings for the period is recorded in net investment income, though typically on a delay based on the availability of the underlying financial statements. For a discussion of equity sensitivity, see below.
Assets under management in Mutual Funds may experience lower earnings during equity market declines because fee income is earned based upon the value of assets under management.Assets supporting pension and other post-retirement benefit plansThe Company may be required to make additional plan contributions if equity investments in the plan portfolios decline in value. For a discussion of equity sensitivity, see below.
The asset allocation mix is reviewed on a periodic basis. In order to minimize the risk, the pension plans maintain a listing of permissible and prohibited investments and impose concentration limits and investment quality requirements on permissible investment options. Declines in value are recognized as unrealized losses in AOCI. Increases in equity markets are recognized as unrealized gains in AOCI. Unrealized gains and losses in AOCI are amortized into the actuarial loss component of net periodic benefit cost when they exceed a threshold. For further discussion of equity risk associated with the pension plans, see Note 18 Employee Benefit Plans of Notes to Consolidated Financial Statements.
Assets under managementin Hartford Funds may decrease in value during equity market declines, which would result in lower earnings because fee income is earned based upon the value of assets under management. Equity Sensitivity
Investment portfolio and the assets supporting pension and other post-retirement benefit plans
Included in the following tables are the estimated before tax change in the economic value of the Company’s invested assets and assets supporting pension and other post-retirement benefit plans with sensitivity to equity risk. The calculation of the hypothetical change in economic value below assumes a 20% upward and downward shock to the Standard & Poor's 500 Composite Price Index ("S&P 500"). For limited partnerships and other alternative investments, the movement in economic value is calculated using a beta analysis largely derived from historical experience relative to the S&P 500.
The selection of the 20% shock to the S&P 500 was made only as an illustration to the potential hypothetical impact of such an event and should not be construed as a prediction of future market events. Actual results could differ materially from those illustrated below due to the nature of the estimates and assumptions used in the analysis. These calculations may not fully capture the impact of portfolio re-allocations or significant product sales.
Part II - Item 7. Management's Discussion and Analysis of Financial Condition and Results of Operations
Equity Sensitivity [1]
|
| | | | | | | | | | | | | | | | | | | |
| | As of December 31, 2018 | | As of December 31, 2017 |
| | | Shock to S&P 500 | | | Shock to S&P 500 |
| (Before tax) | Fair Value | +20% | -20% | | Fair Value | +20% | -20% |
| Investment Portfolio | $ | 3,045 |
| $ | 419 |
| $ | (418 | ) | | $ | 2,676 |
| $ | 360 |
| $ | (360 | ) |
| Assets supporting pension and other post-retirement benefit plans | $ | 1,226 |
| $ | 209 |
| $ | (209 | ) | | $ | 1,459 |
| $ | 251 |
| $ | (251 | ) |
| |
| [1] | Table excludes the Company's investment in Hopmeadow Holdings LP which is reported in other assets on the Company's Consolidated Balance Sheets. |
Hartford Funds assets under management
Hartford Funds earnings are significantly influenced by the U.S. and other equity markets. If equity markets were to hypothetically decline 20% and remain depressed for one year, the estimated before tax impact on reported earnings for that one year period is $(37) as of December 31, 2018. The selection of the 20% shock to the S&P 500 was made only as an illustration to the potential hypothetical impact of such an event and should not be construed as a prediction of future market events. Actual results could differ materially due to the nature of the estimates and assumptions used in the analysis.
Foreign Currency Exchange Risk
Foreign currency exchange risk is the risk of financial loss due to changes in the relative value between currencies.
Sources of currency riskCurrency RiskThe Company has foreign currency exchange risk in non-U.S. dollar denominated investments, which primarily consist of fixed maturity and equity investments and foreign denominated cash.
ImpactChanges in relative values between currencies can create variability in cash flows and realized or unrealized gains and losses on changes in the fair value of assets and liabilities.
Based on the fair values of the Company’s non-U.S. dollar denominated securities and derivative instruments as of December 31, 20172018 and 2016,2017, management estimates that a hypothetical 10% unfavorable change in exchange rates would decrease the fair values by a before-taxbefore tax total of $9 and $10, and $11, respectively, and as of December 31, 2016 excludes the impact of the assets that transferred to held for sale related to the U.K. property and casualty run-off subsidiaries .respectively. Actual results could
differ materially due to the nature of the estimates and assumptions used in the analysis.
ManagementThe open foreign currency exposure of non-U.S. dollar denominated investments will most commonly be reduced through the sale of the assets or through hedges using currency futures/forwards/swaps. In order to manage the currency risk related to any non-U.S. dollar denominated liability contracts, the Company enters into foreign currency swaps or holds non-U.S. dollar denominated investments.
investments which match the underlying currency exposure of the liabilities. Assets and Liabilities Subject to Foreign Currency Exchange Risk
Non-U.S. dollar denominated fixed maturities, equities, and cashThe fair values of the non-U.S. dollar denominated fixed maturities, , equities and cash, excluding assets held for sale, at December 31, 2017 2018
and 20162017 were approximately $298$178 and $213,$298, respectively. Included in these amounts are $128$119 and $116$128 at December 31, 20172018 and 2016,2017, respectively, related to non-U.S. dollar denominated fixed maturities, equities and cash that directly support liabilities denominated in the same currencies. The currency risk of the remaining non-U.S. dollar denominated fixed maturities and equities are hedged with foreign currency swaps. In addition, the Company holds $55 of euro-denominated cash which is hedged with foreign currency forwards.
Investment in a P&C run-off entity in the United KingdomDuring 2015, the Company entered into certain foreign currency forwards to hedge the currency impacts on changes in equity of a P&C run-off entity in the United Kingdom that was sold during 2017. At December 31, 2016, the derivatives used to hedge the currency impacts had a total notional amount of $200, and a total fair value of $(2), respectively. The Company no longer heldterminated these hedges as of December 31,in 2017.
Financial Risk on Statutory Capital
Statutory surplus amounts and risk-based capital (“RBC”) ratios may increase or decrease in any period depending upon a variety of factors and may be compounded in extreme scenarios or if multiple factors occur at the same time. In general, as equity market levels and interest rates decline, the amount and volatility of botheither our actual or potential obligation, as well as the related statutory surplus and capital margin can be materially negatively affected, sometimes at a greater than linear rate. At times the impact of changes in certain market factors or a combination of multiple factors on RBC ratios can be counterintuitive. Factors include:
A decrease in the value of certain fixed-income and equity securities in our investment portfolio, due in part to credit spreads widening, may result in a decrease in statutory surplus and RBC ratios.
Part II - Item 7. Management's Discussion and Analysis of Financial Condition and Results of Operations
Decreases in the value of certain derivative instruments that do not get hedge accounting, may reduce statutory surplus and RBC ratios.
Non-market factors which can also impact the amount and volatility of botheither our actual or potential obligation, as well as the related statutory surplus and capital margin.
Most of these factors are outside of the Company’s control. The Company’s financial strength and credit ratings are significantly influenced by the statutory surplus amounts and RBC ratios of
Part II - Item 7. Management's Discussion and Analysis of Financial Condition and Results of Operations
our insurance company subsidiaries. In addition, rating agencies may implement changes to their internal models that have the effect of increasing or decreasing the amount of statutory capital we must hold in order to maintain our current ratings.
Investment Portfolio Risk
The following table presents the Company’s fixed maturities, AFS, by credit quality. The credit ratings referenced throughout this
section are based on availability and are generally the midpoint of the available ratings among Moody’s, S&P, Fitch and Morningstar.Fitch. If no rating is available from a rating agency, then an internally developed rating is used.
Fixed Maturities by Credit Quality
| | | | December 31, 2017 | December 31, 2016 | December 31, 2018 | | December 31, 2017 |
| | Amortized Cost | Fair Value | Percent of Total Fair Value | Amortized Cost | Fair Value | Percent of Total Fair Value | Amortized Cost | Fair Value | Percent of Total Fair Value | | Amortized Cost | Fair Value | Percent of Total Fair Value |
| United States Government/Government agencies | $ | 4,492 |
| $ | 4,536 |
| 12.3 | % | $ | 4,349 |
| $ | 4,351 |
| 13.5 | % | $ | 4,446 |
| $ | 4,430 |
| 12.4 | % | | $ | 4,492 |
| $ | 4,536 |
| 12.3 | % |
| AAA | 5,864 |
| 6,072 |
| 16.4 | % | 5,137 |
| 5,319 |
| 16.5 | % | 6,366 |
| 6,440 |
| 18.1 | % | | 5,864 |
| 6,072 |
| 16.4 | % |
| AA | 7,467 |
| 7,810 |
| 21.1 | % | 6,337 |
| 6,621 |
| 20.6 | % | 6,861 |
| 6,985 |
| 19.6 | % | | 7,467 |
| 7,810 |
| 21.1 | % |
| A | 8,510 |
| 8,919 |
| 24.1 | % | 6,880 |
| 7,138 |
| 22.2 | % | 8,314 |
| 8,370 |
| 23.5 | % | | 8,510 |
| 8,919 |
| 24.1 | % |
| BBB | 7,632 |
| 7,931 |
| 21.5 | % | 6,748 |
| 6,881 |
| 21.4 | % | 8,335 |
| 8,163 |
| 22.9 | % | | 7,632 |
| 7,931 |
| 21.5 | % |
| BB & below | 1,647 |
| 1,696 |
| 4.6 | % | 1,845 |
| 1,872 |
| 5.8 | % | 1,281 |
| 1,264 |
| 3.5 | % | | 1,647 |
| 1,696 |
| 4.6 | % |
| Total fixed maturities, AFS | $ | 35,612 |
| $ | 36,964 |
| 100 | % | $ | 31,296 |
| $ | 32,182 |
| 100 | % | $ | 35,603 |
| $ | 35,652 |
| 100.0 | % | | $ | 35,612 |
| $ | 36,964 |
| 100.0 | % |
The fair value of securities increased,fixed maturities, AFS decreased as compared to December 31, 2016,2017, primarily due the transfer in of fixed maturities, AFS related to the acquisition of Aetna's U.S. group life and disability business as well as an increasea decrease in valuations due to widening of credit spreads and higher interest rates. Fixed
tighter credit spreads. Fixed maturities,Maturities, FVO, are not included in the preceding table. For further discussion on FVO securities, see Note 5 - Fair Value Measurements of Notes to Consolidated Financial Statements.
Part II - Item 7. Management's Discussion and Analysis of Financial Condition and Results of Operations
Securities by Type
| | | | December 31, 2017 | December 31, 2016 | December 31, 2018 | | December 31, 2017 |
| | Cost or Amortized Cost | Gross Unrealized Gains | Gross Unrealized Losses | Fair Value | Percent of Total Fair Value | Cost or Amortized Cost | Gross Unrealized Gains | Gross Unrealized Losses | Fair Value | Percent of Total Fair Value | Cost or Amortized Cost | Gross Unrealized Gains | Gross Unrealized Losses | Fair Value | Percent of Total Fair Value | | Cost or Amortized Cost | Gross Unrealized Gains | Gross Unrealized Losses | Fair Value | Percent of Total Fair Value |
| Asset-backed securities ("ABS") | | | | | | | | | |
| Consumer loans | $ | 925 |
| $ | 7 |
| $ | (2 | ) | $ | 930 |
| 2.5 | % | $ | 1,229 |
| $ | 6 |
| $ | (4 | ) | $ | 1,231 |
| 3.8 | % | $ | 1,159 |
| $ | 5 |
| $ | (1 | ) | $ | 1,163 |
| 3.3 | % | | $ | 925 |
| $ | 7 |
| $ | (2 | ) | $ | 930 |
| 2.5 | % |
| Other | 194 |
| 2 |
| — |
| 196 |
| 0.5 | % | 156 |
| 2 |
| — |
| 158 |
| 0.5 | % | 113 |
| — |
| — |
| 113 |
| 0.3 | % | | 194 |
| 2 |
| — |
| 196 |
| 0.5 | % |
| Collateralized debt obligations ("CDOs") | | | | | |
| CLOs | 1,257 |
| 3 |
| — |
| 1,260 |
| 3.4 | % | 855 |
| 5 |
| (2 | ) | 858 |
| 2.7 | % | |
| Other | — |
| — |
| — |
| — |
| — | % | 105 |
| 13 |
| — |
| 118 |
| 0.4 | % | |
| Collateralized loan obligations ("CLOs") | | 1,455 |
| 2 |
| (20 | ) | 1,437 |
| 4.0 | % | | 1,257 |
| 3 |
| — |
| 1,260 |
| 3.4 | % |
| CMBS | | | | | | | | | |
| Agency [1] | 1,199 |
| 16 |
| (14 | ) | 1,201 |
| 3.2 | % | 855 |
| 16 |
| (12 | ) | 859 |
| 2.7 | % | 1,447 |
| 13 |
| (33 | ) | 1,427 |
| 4.0 | % | | 1,199 |
| 16 |
| (14 | ) | 1,201 |
| 3.2 | % |
| Bonds | 1,726 |
| 32 |
| (9 | ) | 1,749 |
| 4.7 | % | 1,439 |
| 30 |
| (14 | ) | 1,455 |
| 4.5 | % | 1,845 |
| 13 |
| (29 | ) | 1,829 |
| 5.1 | % | | 1,726 |
| 32 |
| (9 | ) | 1,749 |
| 4.7 | % |
| Interest only (“IOs”) | 379 |
| 10 |
| (3 | ) | 386 |
| 1.0 | % | 478 |
| 6 |
| (8 | ) | 476 |
| 1.5 | % | |
| Interest only | | 289 |
| 9 |
| (2 | ) | 296 |
| 0.8 | % | | 379 |
| 10 |
| (3 | ) | 386 |
| 1.0 | % |
| Corporate | | | | | | | | | |
| Basic industry | 523 |
| 28 |
| (1 | ) | 550 |
| 1.5 | % | 420 |
| 15 |
| (3 | ) | 432 |
| 1.3 | % | 604 |
| 8 |
| (21 | ) | 591 |
| 1.7 | % | | 523 |
| 28 |
| (1 | ) | 550 |
| 1.5 | % |
| Capital goods | 1,050 |
| 44 |
| (4 | ) | 1,090 |
| 2.9 | % | 676 |
| 31 |
| (9 | ) | 698 |
| 2.2 | % | 1,132 |
| 8 |
| (31 | ) | 1,109 |
| 3.1 | % | | 1,050 |
| 44 |
| (4 | ) | 1,090 |
| 2.9 | % |
| Consumer cyclical | 857 |
| 33 |
| (2 | ) | 888 |
| 2.4 | % | 766 |
| 24 |
| (7 | ) | 783 |
| 2.4 | % | 943 |
| 9 |
| (29 | ) | 923 |
| 2.6 | % | | 857 |
| 33 |
| (2 | ) | 888 |
| 2.4 | % |
| Consumer non-cyclical | 1,643 |
| 46 |
| (7 | ) | 1,682 |
| 4.6 | % | 1,637 |
| 47 |
| (27 | ) | 1,657 |
| 5.1 | % | 1,936 |
| 11 |
| (71 | ) | 1,876 |
| 5.3 | % | | 1,643 |
| 46 |
| (7 | ) | 1,682 |
| 4.6 | % |
| Energy | 1,056 |
| 43 |
| (3 | ) | 1,096 |
| 3.0 | % | 762 |
| 32 |
| (8 | ) | 786 |
| 2.4 | % | 1,156 |
| 14 |
| (43 | ) | 1,127 |
| 3.1 | % | | 1,056 |
| 43 |
| (3 | ) | 1,096 |
| 3.0 | % |
| Financial services | 2,722 |
| 77 |
| (10 | ) | 2,789 |
| 7.5 | % | 2,032 |
| 62 |
| (17 | ) | 2,077 |
| 6.5 | % | 3,368 |
| 17 |
| (99 | ) | 3,286 |
| 9.2 | % | | 2,722 |
| 77 |
| (10 | ) | 2,789 |
| 7.5 | % |
| Tech./comm. | 1,618 |
| 87 |
| (9 | ) | 1,696 |
| 4.6 | % | 1,522 |
| 80 |
| (12 | ) | 1,590 |
| 4.9 | % | 1,720 |
| 34 |
| (54 | ) | 1,700 |
| 4.8 | % | | 1,618 |
| 87 |
| (9 | ) | 1,696 |
| 4.6 | % |
| Transportation | 555 |
| 18 |
| — |
| 573 |
| 1.6 | % | 372 |
| 12 |
| (3 | ) | 381 |
| 1.2 | % | 548 |
| 4 |
| (18 | ) | 534 |
| 1.5 | % | | 555 |
| 18 |
| — |
| 573 |
| 1.6 | % |
| Utilities | 2,097 |
| 110 |
| (19 | ) | 2,188 |
| 5.9 | % | 2,359 |
| 93 |
| (40 | ) | 2,412 |
| 7.5 | % | 2,017 |
| 43 |
| (69 | ) | 1,991 |
| 5.6 | % | | 2,097 |
| 110 |
| (19 | ) | 2,188 |
| 5.9 | % |
| Other | 249 |
| 4 |
| (1 | ) | 252 |
| 0.7 | % | 157 |
| 3 |
| (3 | ) | 157 |
| 0.5 | % | 272 |
| — |
| (11 | ) | 261 |
| 0.7 | % | | 249 |
| 4 |
| (1 | ) | 252 |
| 0.7 | % |
| Foreign govt./govt. agencies | 1,071 |
| 43 |
| (4 | ) | 1,110 |
| 3.0 | % | 827 |
| 15 |
| (16 | ) | 826 |
| 2.6 | % | 866 |
| 7 |
| (26 | ) | 847 |
| 2.4 | % | | 1,071 |
| 43 |
| (4 | ) | 1,110 |
| 3.0 | % |
| Municipal bonds | | | | | | | | | |
| Taxable | 537 |
| 30 |
| (5 | ) | 562 |
| 1.5 | % | 399 |
| 19 |
| (14 | ) | 404 |
| 1.3 | % | 629 |
| 14 |
| (17 | ) | 626 |
| 1.8 | % | | 537 |
| 30 |
| (5 | ) | 562 |
| 1.5 | % |
| Tax-exempt | 11,206 |
| 724 |
| (7 | ) | 11,923 |
| 32.3 | % | 9,328 |
| 616 |
| (51 | ) | 9,893 |
| 30.7 | % | 9,343 |
| 407 |
| (30 | ) | 9,720 |
| 27.3 | % | | 11,206 |
| 724 |
| (7 | ) | 11,923 |
| 32.3 | % |
| RMBS | | | | | | | | | |
| Agency | 1,530 |
| 10 |
| (4 | ) | 1,536 |
| 4.2 | % | 1,565 |
| 17 |
| (17 | ) | 1,565 |
| 4.9 | % | 1,508 |
| 7 |
| (29 | ) | 1,486 |
| 4.2 | % | | 1,530 |
| 10 |
| (4 | ) | 1,536 |
| 4.2 | % |
| Non-agency | 227 |
| 3 |
| — |
| 230 |
| 0.6 | % | 109 |
| 3 |
| - |
| 112 |
| 0.3 | % | 933 |
| 5 |
| (6 | ) | 932 |
| 2.6 | % | | 227 |
| 3 |
| — |
| 230 |
| 0.6 | % |
| Alt-A | 58 |
| 4 |
| — |
| 62 |
| 0.2 | % | 69 |
| - |
| - |
| 69 |
| 0.2 | % | 43 |
| 4 |
| — |
| 47 |
| 0.1 | % | | 58 |
| 4 |
| — |
| 62 |
| 0.2 | % |
| Sub-prime | 1,170 |
| 46 |
| — |
| 1,216 |
| 3.3 | % | 1,252 |
| 12 |
| (4 | ) | 1,260 |
| 3.9 | % | 786 |
| 28 |
| — |
| 814 |
| 2.3 | % | | 1,170 |
| 46 |
| — |
| 1,216 |
| 3.3 | % |
| U.S. Treasuries | 1,763 |
| 46 |
| (10 | ) | 1,799 |
| 4.9 | % | 1,927 |
| 29 |
| (31 | ) | 1,925 |
| 6.0 | % | 1,491 |
| 41 |
| (15 | ) | 1,517 |
| 4.2 | % | | 1,763 |
| 46 |
| (10 | ) | 1,799 |
| 4.9 | % |
| Fixed maturities, AFS | 35,612 |
| 1,466 |
| (114 | ) | 36,964 |
| 100 | % | 31,296 |
| 1,188 |
| (302 | ) | 32,182 |
| 100 | % | 35,603 |
| 703 |
| (654 | ) | 35,652 |
| 100.0 | % | | 35,612 |
| 1,466 |
| (114 | ) | 36,964 |
| 100.0 | % |
| Equity securities | | | | | | | | | |
| Financial services | 115 |
| 19 |
| — |
| 134 |
| 13.3 | % | 134 |
| 14 |
| - |
| 148 |
| 15.7 | % | | | | 115 |
| 19 |
| — |
| 134 |
| 13.3 | % |
| Other | 792 |
| 102 |
| (16 | ) | 878 |
| 86.7 | % | 744 |
| 70 |
| (17 | ) | 797 |
| 84.3 | % | | | | 792 |
| 102 |
| (16 | ) | 878 |
| 86.7 | % |
| Equity securities, AFS | 907 |
| 121 |
| (16 | ) | 1,012 |
| 100 | % | 878 |
| 84 |
| (17 | ) | 945 |
| 100 | % | |
| Equity securities, AFS [2] | | | | | 907 |
| 121 |
| (16 | ) | 1,012 |
| 100.0 | % |
| Total AFS securities | $ | 36,519 |
| $ | 1,587 |
| $ | (130 | ) | $ | 37,976 |
| | $ | 32,174 |
| $ | 1,272 |
| $ | (319 | ) | $ | 33,127 |
| | $ | 35,603 |
| $ | 703 |
| $ | (654 | ) | $ | 35,652 |
| | | $ | 36,519 |
| $ | 1,587 |
| $ | (130 | ) | $ | 37,976 |
| |
| Fixed maturities, FVO | | $ | 41 |
| | | | $ | 211 |
| | | $ | 22 |
| | | | $ | 41 |
| |
| Equity securities, at fair value [2] | | | $ | 1,214 |
| | | | |
| |
| [1] | Includes securities with pools of loans issued by the Small Business Administration which are backed by the full faith and credit of the U.S. government. |
| |
| [2] | Effective January 1, 2018, with the adoption of new accounting standards for financial instruments, equity securities, AFS were reclassified to equity securities, at fair value. |
The fair value of AFS securities increased,decreased as compared with December 31, 2016,2017, primarily due to the transfer in of fixed maturities, AFS related to the acquisition of Aetna's U.S. group life and disability business as well as an increasea decrease in valuations due to tighterwidening of credit spreads.spreads and higher interest rates. Also,
tax-exempt municipal bonds were reallocated into corporate bonds and structured securities during the period.
Part II - Item 7. Management's Discussion and Analysis of Financial Condition and Results of Operations
European Exposure
TheWhile the European economy performed better than expectedis still growing, the International Monetary Fund cut its 2019 growth forecasts for the region, citing the prospect for a more turbulent external environment, including escalating trade tensions and slowing global demand. Political risk will likely remain elevated in 2017, propelled by resilient private consumption, stronger growth aroundEurope during 2019 due to uncertainty surrounding Great Britain's pending departure from the worldEuropean Union ("Brexit"), increasing pressure on centrist governments in France and lower unemployment. While some
Part II - Item 7. Management's DiscussionGermany and Analysis of Financial Condition and Results of Operations
economic conditions have improved, sluggish wage growth points towards continued accommodative monetary policy throughout Europe in 2018.ongoing concern over Italian fiscal policy. The Company manages the credit risk associated with theits European securities within the investment portfolio on an on-going basis using several processes which are supported by macroeconomic analysis and issuer credit analysis. For additional details regarding the Company’s management of credit risk, see the Credit Risk section of this MD&A.
As of December 31, 2017,2018, the Company’s European investment exposure had both an amortized cost and fair value of $1.9$2.5 billion, and $2 billion, respectively, or 4%5% of total invested assets; as of December 31, 2016,2017, amortized cost and fair value totaled $1.6$1.9 billion and $1.7$2 billion,
respectively. The investment exposure largely relates to corporate entities which are domiciled in or generate a significant portion of their revenue within the United Kingdom, Germany, Sweden, Switzerland, and the Netherlands, Germany and Switzerland.Netherlands. As of both December 31, 20172018 and 2016,2017, the weighted average credit
quality of European investments was A-. Entities domiciled in the United Kingdom comprise the Company's largest European exposure; as of December 31, 20172018 and 2016,2017, the U.K. exposure totals less than 2% of total invested assets and largely relates to the industrial and financial services corporate securitiessector and has an average credit rating of BBB+. The majority of the European investments are U.S. dollar-denominated, and those securities that are British pound or euro-denominated are hedged to U.S. dollars. For a discussion of foreign currency risks, see the Foreign Currency Exchange Risk section of this MD&A.
Financial ServicesCommercial & Residential Real Estate
The Company’s investment in the financial services sector is predominantly through investment grade banking and insurance institutions. The following table presents the Company’s fixed maturitiesexposure to CMBS and equity, AFS securities in the financial services sector that areRMBS by current credit quality included in the preceding Securities by Type table.
Financial Services by Credit QualityExposure to CMBS and RMBS as of December 31, 2018
|
| | | | | | | | | | | | | | | | | | |
| | December 31, 2017 | December 31, 2016 |
| | Amortized Cost | Fair Value | Net Unrealized Gain/(Loss) | Amortized Cost | Fair Value | Net Unrealized Gain/(Loss) |
| AAA | $ | 25 |
| $ | 26 |
| $ | 1 |
| $ | 8 |
| $ | 10 |
| $ | 2 |
|
| AA | 147 |
| 150 |
| 3 |
| 264 |
| 267 |
| 3 |
|
| A | 1,525 |
| 1,575 |
| 50 |
| 859 |
| 892 |
| 33 |
|
| BBB | 1,061 |
| 1,089 |
| 28 |
| 885 |
| 906 |
| 21 |
|
| BB & below | 79 |
| 83 |
| 4 |
| 150 |
| 150 |
| — |
|
| Total [1] | $ | 2,837 |
| $ | 2,923 |
| $ | 86 |
| $ | 2,166 |
| $ | 2,225 |
| $ | 59 |
|
| |
[1] | Includes equity, AFS securities with an amortized cost and fair value of $115 and $134, respectively as of December 31, 2017 and an amortized cost and fair value of $134 and $148, respectively, as of December 31, 2016 included in the AFS by type table above.
|
The Company's investments in the financial services sector increased, as compared to December 31, 2016, due to purchases of corporate securities and the transfer in of fixed maturities, AFS related to the acquisition of Aetna's U.S. group life and disability business.
Commercial Real Estate
Through December 31, 2017, commercial real estate market conditions, including property prices, occupancies, financial conditions, transaction volume, and delinquencies, remained mostly favorable and delinquencies remained very low. In
|
| | | | | | | | | | | | | | | | | | | | | | | | | | | | | | | | | | | | |
| | AAA | AA | A | BBB | BB and Below | Total |
| | Amortized Cost | Fair Value | Amortized Cost | Fair Value | Amortized Cost | Fair Value | Amortized Cost | Fair Value | Amortized Cost | Fair Value | Amortized Cost | Fair Value |
| CMBS | | | | | | | | | | | | |
| Agency [1] | $ | 1,447 |
| $ | 1,427 |
| $ | — |
| $ | — |
| $ | — |
| $ | — |
| $ | — |
| $ | — |
| $ | — |
| $ | — |
| $ | 1,447 |
| $ | 1,427 |
|
| Bonds | 983 |
| 973 |
| 444 |
| 436 |
| 368 |
| 370 |
| 50 |
| 50 |
| — |
| — |
| 1,845 |
| 1,829 |
|
| Interest Only | 204 |
| 210 |
| 77 |
| 79 |
| 1 |
| 1 |
| 5 |
| 4 |
| 2 |
| 2 |
| 289 |
| 296 |
|
| Total CMBS | 2,634 |
| 2,610 |
| 521 |
| 515 |
| 369 |
| 371 |
| 55 |
| 54 |
| 2 |
| 2 |
| 3,581 |
| 3,552 |
|
| RMBS | | | | | | | | | | | | |
| Agency | 1,508 |
| 1,486 |
| — |
| — |
| — |
| — |
| — |
| — |
| — |
| — |
| 1,508 |
| 1,486 |
|
| Non-Agency | 611 |
| 610 |
| 167 |
| 167 |
| 111 |
| 109 |
| 33 |
| 33 |
| 11 |
| 13 |
| 933 |
| 932 |
|
| Alt-A | — |
| — |
| 10 |
| 10 |
| 4 |
| 5 |
| 9 |
| 9 |
| 20 |
| 23 |
| 43 |
| 47 |
|
| Sub-Prime | 31 |
| 32 |
| 72 |
| 73 |
| 211 |
| 217 |
| 179 |
| 186 |
| 293 |
| 306 |
| 786 |
| 814 |
|
| Total RMBS | 2,150 |
| 2,128 |
| 249 |
| 250 |
| 326 |
| 331 |
| 221 |
| 228 |
| 324 |
| 342 |
| 3,270 |
| 3,279 |
|
| Total CMBS & RMBS | $ | 4,784 |
| $ | 4,738 |
| $ | 770 |
| $ | 765 |
| $ | 695 |
| $ | 702 |
| $ | 276 |
| $ | 282 |
| $ | 326 |
| $ | 344 |
| $ | 6,851 |
| $ | 6,831 |
|
addition, the availability of credit has has been adequate to refinance loans that have come due.
The following table presents the Company’s exposure to CMBS bonds by current credit quality and vintage year included in the preceding Securities by Type table. Credit protection represents the current weighted average percentage of the outstanding capital structure subordinated to the Company’s investment holding that is available to absorb losses before the security incurs the first dollar loss of principal and excludes any equity interest or property value in excess of outstanding debt.
Part II - Item 7. Management's Discussion and Analysis of Financial Condition and Results of Operations
Exposure to CMBS Bondsand RMBS as of December 31, 2017
|
| | | | | | | | | | | | | | | | | | | | | | | | | | | | | | | | | | | | |
| | AAA | AA | A | BBB | BB and Below | Total |
| Vintage Year [1] | Amortized Cost | Fair Value | Amortized Cost | Fair Value | Amortized Cost | Fair Value | Amortized Cost | Fair Value | Amortized Cost | Fair Value | Amortized Cost | Fair Value |
| 2008 & Prior | 32 |
| 32 |
| 5 |
| 6 |
| — |
| — |
| — |
| — |
| 9 |
| 9 |
| 46 |
| 47 |
|
| 2009 | — |
| — |
| 2 |
| 2 |
| — |
| — |
| — |
| — |
| — |
| — |
| 2 |
| 2 |
|
| 2010 | 18 |
| 19 |
| — |
| — |
| — |
| — |
| — |
| — |
| — |
| — |
| 18 |
| 19 |
|
| 2011 | 40 |
| 42 |
| — |
| — |
| 2 |
| 2 |
| — |
| — |
| — |
| — |
| 42 |
| 44 |
|
| 2012 | 17 |
| 18 |
| 9 |
| 9 |
| — |
| — |
| 5 |
| 5 |
| — |
| — |
| 31 |
| 32 |
|
| 2013 | — |
| — |
| 11 |
| 11 |
| 36 |
| 38 |
| — |
| — |
| — |
| — |
| 47 |
| 49 |
|
| 2014 | 284 |
| 292 |
| 36 |
| 37 |
| 43 |
| 43 |
| 4 |
| 4 |
| 5 |
| 5 |
| 372 |
| 381 |
|
| 2015 | 206 |
| 207 |
| 111 |
| 112 |
| 155 |
| 159 |
| 25 |
| 25 |
| 3 |
| 3 |
| 500 |
| 506 |
|
| 2016 | 201 |
| 200 |
| 107 |
| 107 |
| 78 |
| 81 |
| 9 |
| 9 |
| — |
| — |
| 395 |
| 397 |
|
| 2017 | 131 |
| 131 |
| 142 |
| 141 |
| — |
| — |
| — |
| — |
| — |
| — |
| 273 |
| 272 |
|
| Total | $ | 929 |
| $ | 941 |
| $ | 423 |
| $ | 425 |
| $ | 314 |
| $ | 323 |
| $ | 43 |
| $ | 43 |
| $ | 17 |
| $ | 17 |
| $ | 1,726 |
| $ | 1,749 |
|
| Credit protection | 30.8% | 21.4% | 14.1% | 11.3% | 41.0% | 25.1% |
|
| | | | | | | | | | | | | | | | | | | | | | | | | | | | | | | | | | | | |
| | AAA | AA | A | BBB | BB and Below | Total |
| | Amortized Cost | Fair Value | Amortized Cost | Fair Value | Amortized Cost | Fair Value | Amortized Cost | Fair Value | Amortized Cost | Fair Value | Amortized Cost | Fair Value |
| CMBS | | | | | | | | | | | | |
| Agency [1] | $ | 1,199 |
| $ | 1,201 |
| $ | — |
| $ | — |
| $ | — |
| $ | — |
| $ | — |
| $ | — |
| $ | — |
| $ | — |
| $ | 1,199 |
| $ | 1,201 |
|
| Bonds | 929 |
| 940 |
| 423 |
| 424 |
| 314 |
| 323 |
| 43 |
| 44 |
| 17 |
| 18 |
| 1,726 |
| 1,749 |
|
| Interest Only | 264 |
| 269 |
| 104 |
| 106 |
| 1 |
| 1 |
| 6 |
| 6 |
| 4 |
| 4 |
| 379 |
| 386 |
|
| Total CMBS | 2,392 |
| 2,410 |
| 527 |
| 530 |
| 315 |
| 324 |
| 49 |
| 50 |
| 21 |
| 22 |
| 3,304 |
| 3,336 |
|
| RMBS | | | | | | | | | | | | |
| Agency | 1,530 |
| 1,536 |
| — |
| — |
| — |
| — |
| — |
| — |
| — |
| — |
| 1,530 |
| 1,536 |
|
| Non-Agency | 122 |
| 123 |
| 15 |
| 14 |
| 56 |
| 56 |
| 21 |
| 22 |
| 13 |
| 15 |
| 227 |
| 230 |
|
| Alt-A | 2 |
| 3 |
| 5 |
| 5 |
| 4 |
| 4 |
| 13 |
| 13 |
| 34 |
| 37 |
| 58 |
| 62 |
|
| Sub-Prime | 35 |
| 36 |
| 74 |
| 75 |
| 249 |
| 255 |
| 159 |
| 165 |
| 653 |
| 685 |
| 1,170 |
| 1,216 |
|
| Total RMBS | 1,689 |
| 1,698 |
| 94 |
| 94 |
| 309 |
| 315 |
| 193 |
| 200 |
| 700 |
| 737 |
| 2,985 |
| 3,044 |
|
| Total CMBS & RMBS | $ | 4,081 |
| $ | 4,108 |
| $ | 621 |
| $ | 624 |
| $ | 624 |
| $ | 639 |
| $ | 242 |
| $ | 250 |
| $ | 721 |
| $ | 759 |
| $ | 6,289 |
| $ | 6,380 |
|
Exposure to CMBS Bonds as[1]Includes securities with pools of December 31, 2016loans issued by the Small Business Administration which are backed by the full faith and credit of the U.S. government.
|
| | | | | | | | | | | | | | | | | | | | | | | | | | | | | | | | | | | | |
| | AAA | AA | A | BBB | BB and Below | Total |
| Vintage Year [1] | Amortized Cost | Fair Value | Amortized Cost | Fair Value | Amortized Cost | Fair Value | Amortized Cost | Fair Value | Amortized Cost | Fair Value | Amortized Cost | Fair Value |
| 2008 & Prior | 122 |
| 126 |
| 42 |
| 42 |
| 49 |
| 49 |
| 9 |
| 9 |
| 20 |
| 21 |
| 242 |
| 247 |
|
| 2009 | 3 |
| 2 |
| — |
| — |
| — |
| — |
| — |
| — |
| — |
| — |
| 3 |
| 2 |
|
| 2010 | 18 |
| 19 |
| — |
| — |
| — |
| — |
| — |
| — |
| — |
| — |
| 18 |
| 19 |
|
| 2011 | 41 |
| 44 |
| — |
| — |
| 8 |
| 8 |
| 2 |
| 2 |
| — |
| — |
| 51 |
| 54 |
|
| 2012 | 18 |
| 19 |
| 6 |
| 6 |
| 12 |
| 12 |
| 6 |
| 5 |
| — |
| — |
| 42 |
| 42 |
|
| 2013 | — |
| 1 |
| 11 |
| 12 |
| 41 |
| 42 |
| — |
| — |
| — |
| — |
| 52 |
| 55 |
|
| 2014 | 285 |
| 292 |
| 41 |
| 42 |
| 42 |
| 39 |
| 1 |
| 1 |
| — |
| — |
| 369 |
| 374 |
|
| 2015 | 96 |
| 97 |
| 111 |
| 111 |
| 157 |
| 156 |
| 57 |
| 57 |
| — |
| — |
| 421 |
| 421 |
|
| 2016 | 38 |
| 38 |
| 109 |
| 108 |
| 75 |
| 76 |
| 19 |
| 19 |
| — |
| — |
| 241 |
| 241 |
|
| Total | $ | 621 |
| $ | 638 |
| $ | 320 |
| $ | 321 |
| $ | 384 |
| $ | 382 |
| $ | 94 |
| $ | 93 |
| $ | 20 |
| $ | 21 |
| $ | 1,439 |
| $ | 1,455 |
|
| Credit protection | 33.3% | 23.5% | 17.2% | 18.1% | 33.4% | 25.8% |
| |
[1] | The vintage year represents the year the pool of loans was originated. |
The Company also has exposure to commercial mortgage loans as presented in the following table.loans. These loans are collateralized by a variety of commercialreal estate properties andthat are diversified both geographically throughout the United States and by property type. These loans are primarily inoriginated by the form ofCompany as high quality whole loans where the Company is the sole lender, but may include participations.
and are participated out to third parties. Loan participations are loans where the Company has purchased or retained a portion of an outstanding loan or package of loans and participates on a pro-rata basis in collecting interest and principal pursuant to the terms of the participation agreement.
As of December 31, 2018, commercial mortgage loans had an amortized cost and carrying value of $3.7 billion, with a valuation allowance of $1. As of December 31, 2017, commercial mortgage loans had an amortized cost and carrying value of $3.2 billion with a valuation allowance of $1.
Commercial Mortgage Loans
|
| | | | | | | | | | | | | | | | | | |
| | December 31, 2017 | December 31, 2016 |
| | Amortized Cost [1] | Valuation Allowance | Carrying Value | Amortized Cost [1] | Valuation Allowance | Carrying Value |
| Whole loans | $ | 3,176 |
| $ | (1 | ) | $ | 3,175 |
| $ | 2,886 |
| $ | — |
| $ | 2,886 |
|
| Total | $ | 3,176 |
| $ | (1 | ) | $ | 3,175 |
| $ | 2,886 |
| $ | — |
| $ | 2,886 |
|
| |
[1] | Amortized cost represents carrying value prior to valuation allowances, if any. |
Part II - Item 7. Management's Discussion and Analysis of Financial Condition and Results of Operations
During 2017, theThe Company funded $510$664 of commercial whole loans with a weighted average loan-to-value (“LTV”) ratio of 63%59% and a weighted average yield of 4.0%.4.4% during the twelve months ended December 31, 2018. The Company continues to originate commercial whole loans within primary markets, such as office, industrial and multi-family, focusing on loans with strong LTV ratios and high quality property collateral. There were no mortgage loans held for sale as of December 31, 20172018 or December 31, 2016.2017.
Municipal Bonds
The following table presents the Company’s exposure to municipal bonds by type and weighted average credit quality included in the preceding Securities by Type table.
Part II - Item 7. Management's Discussion and Analysis of Financial Condition and Results of Operations
Available For Sale Investments in Municipal Bonds
| | | | December 31, 2017 | | December 31, 2016 | December 31, 2018 | | December 31, 2017 |
| | Amortized Cost | | Fair Value | | Weighted Average Credit Quality | | Amortized Cost | | Fair Value | | Weighted Average Credit Quality | Amortized Cost | Fair Value | Weighted Average Credit Quality | | Amortized Cost | Fair Value | Weighted Average Credit Quality |
| General Obligation | $ | 1,976 |
| | $ | 2,087 |
| | AA | | $ | 1,608 |
| | $ | 1,685 |
| | AA | $ | 1,222 |
| $ | 1,275 |
| AA | | $ | 1,976 |
| $ | 2,087 |
| AA |
| Pre-refunded [1] | 1,960 |
| | 2,067 |
| | AAA | | 1,580 |
| | 1,683 |
| | AA+ | 1,845 |
| 1,904 |
| AAA | | 1,960 |
| 2,067 |
| AAA |
| Revenue |
|
| |
|
| |
| |
|
| |
|
| |
| | | | | |
| Transportation | 1,638 |
| | 1,790 |
| | A+ | | 1,371 |
| | 1,485 |
| | A+ | 1,449 |
| 1,537 |
| A+ | | 1,638 |
| 1,790 |
| A+ |
| Health Care | 1,278 |
| | 1,359 |
| | AA- | | 1,179 |
| | 1,246 |
| | AA- | 1,270 |
| 1,304 |
| AA- | | 1,278 |
| 1,359 |
| AA- |
| Education | | 941 |
| 953 |
| AA | | 1,079 |
| 1,130 |
| AA |
| Water & Sewer | 1,069 |
| | 1,131 |
| | AA | | 978 |
| | 1,025 |
| | AA | 816 |
| 847 |
| AA | | 1,069 |
| 1,131 |
| AA |
| Education | 1,079 |
| | 1,130 |
| | AA | | 852 |
| | 874 |
| | AA | |
| Leasing [2] | | 772 |
| 799 |
| AA- | | 809 |
| 858 |
| AA- |
| Sales Tax | 537 |
| | 590 |
| | AA | | 510 |
| | 555 |
| | AA | 507 |
| 541 |
| AA | | 537 |
| 590 |
| AA |
| Leasing [2] | 809 |
| | 858 |
| | AA- | | 588 |
| | 628 |
| | AA- | |
| Power | 442 |
| | 478 |
| | AA- | | 421 |
| | 451 |
| | A+ | 308 |
| 328 |
| A+ | | 442 |
| 478 |
| AA- |
| Housing | 79 |
| | 82 |
| | AA- | | 83 |
| | 84 |
| | A+ | 33 |
| 35 |
| A+ | | 79 |
| 82 |
| AA- |
| Other | 876 |
| | 913 |
| | AA- | | 557 |
| | 581 |
| | AA | 809 |
| 823 |
| AA- | | 876 |
| 913 |
| AA- |
| Total Revenue | 7,807 |
| | 8,331 |
| | AA- | | 6,539 |
| | 6,929 |
| | AA- | 6,905 |
| 7,167 |
| AA- | | 7,807 |
| 8,331 |
| AA- |
| Total Municipal | $ | 11,743 |
| | $ | 12,485 |
| | AA | | $ | 9,727 |
| | $ | 10,297 |
| | AA | $ | 9,972 |
| $ | 10,346 |
| AA | | $ | 11,743 |
| $ | 12,485 |
| AA |
| |
| [1] | Pre-Refunded bonds are bonds for which an irrevocable trust containing sufficient U.S. treasury, agency, or other securities has been established to fund the remaining payments of principal and interest. |
| |
| [2] | Leasing revenue bonds are generally the obligations of a financing authority established by the municipality that leases facilities back to a municipality. The notes are typically secured by lease payments made by the municipality that is leasing the facilities financed by the issue. Lease payments may be subject to annual appropriation by the municipality or the municipality may be obligated to appropriate general tax revenues to make lease payments. |
As of both December 31, 2018 and December 31, 2017, the largest issuer concentrations were the New York Dormitory Authority, the New York City Transitional Finance Authority and, the Commonwealth of Massachusetts, which each comprised less than 3% of the municipal bond portfolio and were primarily comprised of general obligation and revenue bonds. As of December 31, 2016, the largest issuer concentrations were the Commonwealth of Massachusetts, the New York Dormitory Authority, and the StateCommonwealth of California,Massachusetts, which each comprised less than 3% of the municipal bond portfolio and were primarily comprised of general obligation and revenue bonds. In total, municipal bonds make up 28%22% of the fair value of the Company's investment portfolio .portfolio. The Company has evaluated its portfolio allocation to municipal bonds with respect to the changes in corporate income tax rates beginningthat began in 2018 and does not expect to make significant allocation changes at this time. Tax-exempt municipal debt remains a high qualityhas reduced exposure through both asset class with very low expected defaultssales and is a source of portfolio diversification.principal repayments. The Company will continue to actively assess the impacts of the income tax ratesector’s relative value over time.
changes on the municipal market and may make portfolio changes over time based upon our view of the value of the sector. If we feel that value deteriorates relative to other high quality sectors, we may allow the portfolio to reduce over time as principal is repaid.
Limited Partnerships and Other Alternative Investments
The following table presents the Company’s investments in limited partnerships and other alternative investments which include hedge funds, real estate funds and private equity funds. Real estate funds consist of investments primarily in real estate joint ventures and, to a lesser extent, equity funds, including some funds with public market exposure.funds. Private equity funds primarily consist of investments in funds whose assets typically consist of a diversified pool of investments in small to mid-sized non-public businesses with high growth potential as well as limited exposure to public markets.
Limited Partnerships and Other Alternative Investments - Net Investment Income
|
| | | | | | | | | | | | | | | | | |
| | Year Ended December 31, |
| | 2018 | | 2017 | | 2016 |
| | Amount | Yield | | Amount | Yield | | Amount | Yield |
| Hedge funds | $ | 4 |
| 9.3 | % | | $ | 3 |
| 23.6 | % | | $ | (4 | ) | (5.5 | %) |
| Real estate funds | 58 |
| 12.0 | % | | 43 |
| 9.1 | % | | 32 |
| 7.2 | % |
| Private equity funds | 144 |
| 22.5 | % | | 122 |
| 20.7 | % | | 105 |
| 17.6 | % |
| Other alternative investments [1] | (1 | ) | (0.2 | %) | | 6 |
| 1.6 | % | | (5 | ) | (1.3 | %) |
| Total | $ | 205 |
| 13.2 | % | | $ | 174 |
| 12.0 | % | | $ | 128 |
| 8.6 | % |
Part II - Item 7. Management's Discussion and Analysis of Financial Condition and Results of Operations
Limited Partnerships and Other Alternative Investments - Net Investment Income |
| | | | | | | | | | | | | | | | | |
| | Year Ended December 31, |
| | 2017 | | 2016 | | 2015 |
| | Amount | Yield | | Amount | Yield | | Amount | Yield |
| Hedge funds | $ | 3 |
| 23.6 | % | | $ | (4 | ) | (5.5 | )% | | $ | (10 | ) | (2.6 | )% |
| Real estate funds | 43 |
| 9.1 | % | | 32 |
| 7.2 | % | | 40 |
| 11.4 | % |
| Private equity funds | 122 |
| 20.7 | % | | 105 |
| 17.6 | % | | 99 |
| 17.7 | % |
| Other alternative investments | 6 |
| 1.6 | % | | (5 | ) | (1.3 | )% | | 1 |
| 0.3 | % |
| Total | $ | 174 |
| 12.0 | % | | $ | 128 |
| 8.6 | % | | $ | 130 |
| 8.0 | % |
Investments in Limited Partnerships and Other Alternative Investments
| | | | December 31, 2017 | December 31, 2016 | December 31, 2018 | | December 31, 2017 |
| | Amount | Percent | Amount | Percent | Amount | Percent | | Amount | Percent |
| Hedge funds | $ | 22 |
| 1.4 | % | $ | 14 |
| 0.9 | % | $ | 51 |
| 3.0 | % | | $ | 22 |
| 1.4 | % |
| Real estate funds | 486 |
| 30.6 | % | 488 |
| 32.0 | % | 499 |
| 29.0 | % | | 486 |
| 30.6 | % |
| Private equity and other funds | 693 |
| 43.6 | % | 644 |
| 42.1 | % | 788 |
| 45.7 | % | | 693 |
| 43.6 | % |
| Other alternative investments [1] | 387 |
| 24.4 | % | 381 |
| 25.0 | % | 385 |
| 22.3 | % | | 387 |
| 24.4 | % |
| Total | $ | 1,588 |
| 100 | % | $ | 1,527 |
| 100 | % | $ | 1,723 |
| 100.0 | % | | $ | 1,588 |
| 100.0 | % |
| |
| [1] | Consists of an insurer-owned life insurance policy which is invested in hedge funds and other investments. This amount was previously included in hedge funds. |
Available-for-sale Securities — Unrealized Loss Aging
The total gross unrealized losses were $130$654 as of December 31, 2017,2018, and have improved $189, or 59%,increased $524 from December 31, 2016,2017, due to tighterwidening of credit spreads.spreads and higher interest rates. As of December 31, 2017, (117)2018, $631 of the gross unrealized losses were associated with securities depressed less than 20% of cost or amortized cost. The remaining (13)$23 of gross unrealized losses were associated with securities depressed greater than 20%. The securities depressed more than 20% are primarily equity securities depressed duerelated to one corporate issuer specific deterioration, as well as securities with exposure todeclining credit fundamentals and commercial real estate which are depressed primarily due to higher rates since the securities that were purchased.purchased at tighter credit spreads.
As part of the Company’s ongoing security monitoring process, the Company has reviewed its AFS securities in an unrealized loss position and concluded that these securities are temporarily depressed and are expected to recover in value as the securities approach maturity or as market spreads tighten. For these securities in an unrealized loss position where a credit impairment has not been recorded, the Company’s best estimate of expected future cash flows are sufficient to recover the amortized cost basis of the security. Furthermore, the Company neither has an intention to sell nor does it expect to be required to sell these securities. For further information regarding the Company’s impairment analysis, see Other-Than-Temporary Impairments in the Investment Portfolio Risks and Risk Management section of this MD&A.
Unrealized Loss Aging for AFS Securities
| | | | December 31, 2017 | December 31, 2016 | December 31, 2018 | | December 31, 2017 |
| Consecutive Months | Items | Cost or Amortized Cost | Fair Value | Unrealized Loss | Items | Cost or Amortized Cost | Fair Value | Unrealized Loss | Items | Cost or Amortized Cost | Fair Value | Unrealized Loss | | Items | Cost or Amortized Cost | Fair Value | Unrealized Loss |
| Three months or less | 1,286 |
| $ | 4,315 |
| $ | 4,289 |
| $ | (26 | ) | 977 |
| $ | 6,940 |
| $ | 6,773 |
| $ | (167 | ) | 468 |
| $ | 3,191 |
| $ | 3,153 |
| $ | (38 | ) | | 1,286 |
| $ | 4,315 |
| $ | 4,289 |
| $ | (26 | ) |
| Greater than three to six months | 342 |
| 1,694 |
| 1,673 |
| (21 | ) | 819 |
| 1,269 |
| 1,196 |
| (73 | ) | 359 |
| 2,530 |
| 2,487 |
| (43 | ) | | 342 |
| 1,694 |
| 1,673 |
| (21 | ) |
| Greater than six to nine months | 157 |
| 601 |
| 594 |
| (7 | ) | 89 |
| 294 |
| 278 |
| (16 | ) | 347 |
| 2,243 |
| 2,186 |
| (57 | ) | | 157 |
| 601 |
| 594 |
| (7 | ) |
| Greater than nine to eleven months | 89 |
| 188 |
| 183 |
| (5 | ) | 106 |
| 282 |
| 276 |
| (6 | ) | 817 |
| 5,921 |
| 5,688 |
| (233 | ) | | 89 |
| 188 |
| 183 |
| (5 | ) |
| Twelve months or more | 652 |
| 2,040 |
| 1,969 |
| (71 | ) | 299 |
| 1,340 |
| 1,283 |
| (57 | ) | 969 |
| 5,272 |
| 4,989 |
| (283 | ) | | 652 |
| 2,040 |
| 1,969 |
| (71 | ) |
| Total | 2,526 |
| $ | 8,838 |
| $ | 8,708 |
| $ | (130 | ) | 2,290 |
| $ | 10,125 |
| $ | 9,806 |
| $ | (319 | ) | 2,960 |
| $ | 19,157 |
| $ | 18,503 |
| $ | (654 | ) | | 2,526 |
| $ | 8,838 |
| $ | 8,708 |
| $ | (130 | ) |
Unrealized Loss Aging for AFS Securities Continuously Depressed Over 20% |
| | | | | | | | | | | | | | | | | | | | | | | |
| | December 31, 2018 | | December 31, 2017 |
| Consecutive Months | Items | Cost or Amortized Cost | Fair Value | Unrealized Loss | | Items | Cost or Amortized Cost | Fair Value | Unrealized Loss |
| Three months or less | 13 |
| $ | 59 |
| $ | 43 |
| $ | (16 | ) | | 30 |
| $ | 14 |
| $ | 10 |
| $ | (4 | ) |
| Greater than three to six months | — |
| — |
| — |
| — |
| | 12 |
| 10 |
| 7 |
| (3 | ) |
| Greater than six to nine months | 3 |
| 3 |
| 2 |
| (1 | ) | | — |
| — |
| — |
| — |
|
| Greater than nine to eleven months | 2 |
| 2 |
| 1 |
| (1 | ) | | — |
| — |
| — |
| — |
|
| Twelve months or more | 36 |
| 13 |
| 8 |
| (5 | ) | | 47 |
| 13 |
| 7 |
| (6 | ) |
| Total | 54 |
| $ | 77 |
| $ | 54 |
| $ | (23 | ) | | 89 |
| $ | 37 |
| $ | 24 |
| $ | (13 | ) |
Part II - Item 7. Management's Discussion and Analysis of Financial Condition and Results of Operations
Unrealized Loss Aging for AFS Securities Continuously Depressed Over 20% |
| | | | | | | | | | | | | | | | | | | | | | |
| | December 31, 2017 | December 31, 2016 |
| Consecutive Months | Items | Cost or Amortized Cost | Fair Value | Unrealized Loss | Items | Cost or Amortized Cost | Fair Value | Unrealized Loss |
| Three months or less | 30 |
| $ | 14 |
| $ | 10 |
| $ | (4 | ) | 44 |
| $ | 22 |
| $ | 16 |
| $ | (6 | ) |
| Greater than three to six months | 12 |
| 10 |
| 7 |
| (3 | ) | 25 |
| 12 |
| 8 |
| (4 | ) |
| Greater than six to nine months | — |
| — |
| — |
| — |
| 11 |
| 10 |
| 7 |
| (3 | ) |
| Greater than nine to eleven months | — |
| — |
| — |
| — |
| 6 |
| 1 |
| — |
| (1 | ) |
| Twelve months or more | 47 |
| 13 |
| 7 |
| (6 | ) | 30 |
| 12 |
| 7 |
| (5 | ) |
| Total | 89 |
| $ | 37 |
| $ | 24 |
| $ | (13 | ) | 116 |
| $ | 57 |
| $ | 38 |
| $ | (19 | ) |
Other-than-temporary Impairments Recognized in Earnings by Security Type
| | | | For the years ended December 31, | For the years ended December 31, |
| | 2017 | 2016 | 2015 | 2018 | 2017 | 2016 |
| Credit Impairments | | |
| CMBS | 2 |
| 1 |
| 2 |
| 1 |
| 2 |
| 1 |
|
| Corporate | — |
| 20 |
| 4 |
| — |
| — |
| 20 |
|
| Equity Impairments | 6 |
| 4 |
| 2 |
| — |
| 6 |
| 4 |
|
| Intent-to-Sell Impairments | | |
| Corporate | — |
| 1 |
| 25 |
| — |
| — |
| 1 |
|
| Foreign Government | — |
| — |
| 5 |
| |
| US Treasuries | — |
| 1 |
| — |
| — |
| — |
| 1 |
|
| Other Impairments | — |
| — |
| 3 |
| |
| Total | $ | 8 |
| $ | 27 |
| $ | 41 |
| $ | 1 |
| $ | 8 |
| $ | 27 |
|
Year ended December 31, 20172018
For the year ended December 31, 2017,2018, impairments recognized in earnings were comprised of credit impairments of $2 and impairments on equity securities of $6. There were no securities that the Company intends to sell ("intent-to-sell impairments").
For the year ended December 31, 2017, credit impairments were primarily$1 related to CMBS interest-only securities that are notand were identified through security specific review of the expected to generate enoughfuture cash flow for the Company to recover the investment. flows.
The Company incorporates its best estimate of future performance using internal assumptions and judgments that are informed by economic and industry specific trends, as well as our expectations with respect to security specific developments.
Non-credit impairments recognized in other comprehensive income were $6 for the year ended December 31, 2018.
Future impairments may develop as the result of changes in intent to sell specific securities that are in an unrealized loss position or if modeling assumptions, such as macroeconomic factors or security specific developments, change unfavorably from our current modeling assumptions resulting in lower cash flow expectations.
Year ended December 31, 2017
For the year ended December 31, 2017, impairments recognized in earnings were comprised of credit impairments of $2 related to CMBS interest-only securities that were not expected to generate enough cash flow for the Company to recover the investment. Impairments onof equity securities of $6 were comprised of securities in an unrealized loss position that the Company doesdid not expect to recover.
Non-credit impairments recognized in other comprehensive income were $7 for the year ended December 31, 2017.
Future impairments may develop as the result of changes in intent-to-sell specific securities or if actual results underperform current modeling assumptions, which may be the result of, but are not limited to, macroeconomic factors and security-specific performance below current expectations.
Year endedDecember 31, 2016
For the year ended December 31, 2016, impairments recognized in earnings were comprised of credit impairments of $21 primarily related to corporate securities due to changes in the financial condition of the issuer, impairments on equity securities of $4, and intent-to-sell impairments of $2.
Year endedDecember 31, 2015
For the year ended December 31, 2015, impairments recognized in earnings were comprised of intent-to-sell impairments of $30 and credit impairments of $6, both of which were primarily concentrated in corporate securities. Also, impairments recognized in earnings included impairments on equity securities of $2 that were in an unrealized loss position and the Company no longer believed the securities would recover in the foreseeable future, as well as $3 of other impairments.
CAPITAL RESOURCES AND LIQUIDITY
The following section discusses the overall financial strength of The Hartford and its insurance operations including their ability to generate cash flows from each of their business segments, borrow funds at competitive rates and raise new capital to meet
operating and growth needs over the next twelve months.
SUMMARY OF CAPITAL RESOURCES AND LIQUIDITY
Capital available at the holding company as of December 31, 2017:2018:
$1.1 billion | |
| • | $3.4 billion in fixed maturities, short-term investments, and cash at HFSG Holding Company. |
| |
| • | A senior unsecured five-year revolving credit facility that provides for borrowing capacity up to $750 of unsecured credit through March 29, 2023. No borrowings were outstanding as of December 31, 2018. |
| |
| • | Borrowings available under a commercial paper program to a maximum of $750. As of December 31, 2018, there was no commercial paper outstanding. |
| |
| • | The Hartford has an intercompany liquidity agreement that allows for short-term advances of funds among the HFSG Holding Company and certain affiliates of up to $2 billion for liquidity and other general corporate purposes. |
| |
| • | The Company’s subsidiaries, Hartford Fire Insurance Company (“Hartford Fire”) and Hartford Life and Accident Insurance Company (“HLA”), are members of the Federal Home Loan Bank of Boston (“FHLBB”) and have access to collateralized advances of up to $1.1 billion and $0.6 billion, respectively, without prior approval of the Connecticut Department of Insurance (“CTDOI”). |
2019 expected dividends and other sources of capital:
| |
| • | P&C - The Company does not anticipate receiving net dividends from its property and casualty insurance subsidiaries in 2019. |
| |
| • | Group Benefits - Hartford Life and Accident Insurance Company ("HLA") has $380 dividend capacity for 2019, and anticipates paying $250 to $300 in dividends in 2019. |
| |
| • | Hartford Funds - Anticipates paying $100 to $125 of dividends in 2019. |
In addition, The Hartford Financial Services Group, Inc, ("HFSG Holding Company
Borrowings available under a commercial paper programCompany") anticipates cash tax receipts of approximately $600 to a maximum$700, including realization of $1 billion. As of December 31, 2017, there was no commercial paper outstanding
net operating losses and AMT credits.
Part II - Item 7. Management's Discussion and Analysis of Financial Condition and Results of Operations
A senior unsecured five-year revolving credit facility that provides for borrowing capacity up to $1 billion of unsecured credit through October 31, 2019. No borrowings were outstanding as of December 31, 2017
Expected liquidity requirements for the next twelve months as of December 31, 2017:2018:
$320 maturing debt payment due in March of 2018
$500 junior subordinated debt expected to be called in June of 2018
$295 interest on debt, of which $7 is related to debt included in liabilities held for sale
$362 common stockholders dividends, subject to the discretion of the Board of Directors
| |
| • |
$413 maturing debt payment made in January of 2019. |
Equity repurchase program:
Authorization for equity repurchases of up to $1.3 billion for the period October 31, 2016 through December 31, 2017. Under the program, the Company repurchased 20.2 million shares in 2017 for $1,028.
Effective October 13, 2017, the Company suspended 2017 equity repurchases. The Company does not currently expect to authorize an equity repurchase plan in 2018.
| |
| • | $21 dividends on preferred stock, subject to the discretion of the Board of Directors. |
| |
| • | $440 common stockholders' dividends, subject to the discretion of the Board of Directors and before share repurchases and any change in common stockholder dividend rate. |
2018 subsidiary dividend capacity:
The Company has dividend capacity$2.2 billion of $1.4 billion from its property and casualty subsidiaries with $350 net dividends expected in 2018.
Hartford Life and Accident Insurance Company ("HLA") has no dividend capacity for 2018 and does not anticipate paying dividendscash consideration including transaction expenses to the HFSG Holding Company.
In connection with the announced saleacquire all outstanding common shares of Hartford Life, Inc. (“HLI”),Navigators Group, a holding Company, and its life and annuity operating subsidiaries, Hartford Life Insurance Company ("HLIC") expects to pay a pre-closing dividend to the Company of up to $300, subject to approval by the Connecticut Insurance Commissioner. Other intercompany transactions with HLI will be net settled prior to closing.global specialty underwriter.
Liquidity Requirements and Sources of Capital
The Hartford Financial Services Group, Inc. (Holding Company)
The liquidity requirements of the holding company of The Hartford Financial Services Group, Inc. (“HFSG Holding Company”) have been and will continue to be met by HFSG Holding Company’s fixed maturities, short-term investments and cash, and dividends from its subsidiaries, principally its insurance
operations, as well asand tax receipts, including realization of HFSG Holding Company net operating losses and refunds of prior period AMT credits. In addition HFSG Holding Company can meet its liquidity requirements through the issuance of common stock, debt or other capital securities and borrowings from its credit facilities, as needed.
As of December 31, 2017,2018, HFSG Holding Company held fixed maturities, short-term investments, and cash of $1.1$3.4 billion. Expected liquidity requirements of the HFSG Holding Company for the next twelve months include paymentspayment of 6.3% Notes, due 2018the 6.0% senior note of $320$413 at maturity $500 junior subordinated notes expected to be called in June 2018,January 2019, interest payments on debt of approximately $295$265, preferred stock dividends of approximately $21 and common stockholder dividends of approximately $440, subject to the discretion of the Board of Directors, as well as $2.2 billion of approximately $362.cash consideration including transaction expenses to acquire all outstanding common shares of Navigators Group.
The Hartford has an intercompany liquidity agreement that allows for short-term advancesExpected sources of funds amongcapital of the HFSG Holding Company for the next twelve months include dividends from Group Benefits (HLA) of $250 to $300 , dividends from Hartford Funds of $100 to $125 and certain affiliatescash tax receipts of upapproximately $600 to $2.0 billion for liquidity$700, including realization of net operating losses and other general corporate purposes. The Connecticut Insurance Department ("CTDOI") granted approval for certain affiliated insurance companies that are parties to the agreement to treat receivables from a parent, including the HFSG Holding Company, as admitted assets for statutory accounting purposes. As of December 31, 2017, there were no amounts outstanding from the HFSG Holding Company.AMT credits.
Debt
On March 15, 2017,2018, The Hartford issued $500 of 4.4% senior notes ("4.4% Notes") due March 15, 2048 for net proceeds of approximately $490, after deducting underwriting discounts and expenses from the Companyoffering. The Hartford used a portion of the net proceeds from this issuance to repay $320 principal amount
of its 6.3% senior notes due March 15, 2018, and the balance of the proceeds will be used for general corporate purposes.
On June 15, 2018, The Hartford redeemed $500 aggregate principal amount of its 8.125% Fixed-to-Floating Rate Junior Subordinated Debentures due 2068.
On January 15, 2019, The Hartford repaid its $416, 5.375%$413, 6.0% senior notes at maturity.
On February 15, 2017, pursuant to the put option agreement with the Glen Meadow ABC Trust, the Company issued $500 junior subordinated notes with a scheduled maturity of February 12, 2047, and a final maturity of February 12, 2067. The junior subordinated notes bear interest at an annual rate of three-month LIBOR plus 2.125%, payable quarterly. The Hartford will have the right, on one or more occasions, to defer interest payments due on the junior subordinated notes under specified circumstances. The Company expects to use the proceeds to fund the call of $500 in 8.125% junior subordinated debentures that are due 2068 and that are first callable in June 2018. As such, the proceeds of the $500 of junior subordinated notes issued under the contingent capital facility will be held at the holding company until June of 2018, resulting in an increase in debt to capital ratios during that time..
For further information regarding debt, see Note 13 - Debt of Notes to Consolidated Financial Statements.
Intercompany Liquidity Agreements
On January 5, 2017, Hartford Fire Insurance Company, a subsidiary of the Company, issued a Revolving Note (the "Note") in the principal amount of $230 to Hartford Accident and Indemnity Company, an indirectly wholly-owned subsidiary of the Company, under the intercompany liquidity agreement. The note was issued to fund the liquidity needs associated with the $650 ceded premium paid in January 2017 for the adverse development cover with NICO. The Note was repaid on March 29, 2017. The Company has $2.0 billion available under the intercompany liquidity agreement as of December 31, 2017.
Equity
During the year ended December 31, 2017,2018, the Company repurchased 20.2 milliondid not repurchase any common shares for $1,028. Effective October 13, 2017,shares. In February, 2019, the Company suspended 2017 equity repurchases. Theannounced a $1.0 billion share repurchase authorization by the Board of Directors which is effective through December 31, 2020. Based on projected holding company resources, the Company does not currently expectexpects to authorize anuse a portion of the authorization in 2019 but anticipates using the majority of the program in 2020. Any repurchase of shares under the equity repurchase plan in 2018.
Part II - Item 7. Management's Discussionprogram is dependent on market conditions and Analysis of Financial Condition and Results of Operationsother factors.
For further information about equity repurchases, see Part II - Item 5. Market for the Hartford's Common Equity, Related Stockholder Matters and Issuer Purchases of Equity Securities.
On November 6, 2018, the Company issued 13.8 million depositary shares of the Company’s 6.0% Series G non-cumulative perpetual preferred stock (the “Preferred Stock”) with a liquidation preference of $25,000 per share (equivalent to $25.00 per depositary share), for net proceeds of $334. The Preferred Stock is perpetual and has no maturity date but is redeemable at the Company's option in whole or in part, on or after November 15, 2023 at a redemption price of $25,000 per share, plus unpaid dividends attributable to the current dividend period.
The Hartford used the net proceeds from this offering to help fund repayment of the Company's 6.000% Senior Notes due January 15, 2019.
For further information regarding Preferred Stock, see Note 15 - Equity of Notes to Consolidated Financial Statements.
Dividends
On February 22, 2018,21, 2019, The Hartford’s Board of Directors declared a quarterly dividend of $0.25$0.30 per common share payable on April 2, 20181, 2019 to common shareholdersstockholders of record as of March 5, 2018. 4, 2019.
On February 21, 2019, The Hartford's Board of Directors declared a dividend of $375.00 on each share of the Series G preferred stock (equivalent to $0.3750 per depository share) payable on May 15, 2019 to stockholders of record at the close of business on May 1, 2019.
On December 13, 2018, The Hartford’s board of directors declared a dividend of $412.50 on each share of the Series G preferred stock (equivalent to $0.4125 per depository share) which was paid on February 15, 2019, to stockholders of record at the close of business on February 1, 2019.
There are no current restrictions on the HFSG Holding Company's ability to pay dividends to its shareholders.stockholders. For a discussion of restrictions on dividends to the HFSG Holding
Part II - Item 7. Management's Discussion and Analysis of Financial Condition and Results of Operations
Company from its insurance subsidiaries, see "Dividends from Insurance Subsidiaries" below. For a discussion of potential limitations on the HFSG Holding Company's ability to pay dividends, see Part I, Item 1A, — Risk Factors for the risk factor "Our ability to declare and pay dividends is subject to limitations".
Pension Plans and Other Postretirement Benefits
While the Company has significant discretion in making voluntary contributions to the U. S. qualified defined benefit pension plan, minimum contributions are mandated in certain circumstances pursuant to the Employee Retirement Income Security Act of 1974, as amended by the Pension Protection Act of 2006, the Worker, Retiree, and Employer Recovery Act of 2008, the Preservation of Access to Care for Medicare Beneficiaries and Pension Relief Act of 2010, the Moving Ahead for Progress in the 21st Century Act of 2012 (MAP-21) and Internal Revenue Code regulations. The Company made contributions to the U. S. qualified defined benefit pension plan of approximately $101, $280 and $300 in 2018, 2017 and $100 in 2017, 2016, and 2015, respectively. No contributions were made to the other postretirement plans in 2018, 2017 2016 and 2015.2016. The Company’s 2018, 2017 2016 and 20152016 required minimum funding contributions were immaterial. The Company does not have a 20182019 required minimum funding contribution for the U.S. qualified defined benefit pension plan and the funding requirements for all pension plans are expected to be immaterial. The Company has not determined whether, and to what extent, contributions may be made to the U. S. qualified defined benefit pension plan in 2018.2019. The Company will monitor the funded status of the U.S. qualified defined benefit pension plan during 20182019 to make this determination.
Beginning in 2017, the Company began to use a full yield-curve approach in the estimation of the interest cost component of net periodic benefit costs for its qualified and non-qualified pension plans and the postretirement benefit plan. The full yield curve approach applies the specific spot rates along the yield curve that are used in its determination of the projected benefit obligation at the beginning of the year. The change was made to provide a better estimate of the interest cost component of net periodic benefit cost by better aligning projected benefit cash flows with corresponding spot rates on the yield curve rather than using a single weighted average discount rate derived from the yield curve as had been done historically.
This change did not affect the measurement of the Company's total benefit obligations as the change in the interest cost in net income is completely offset in the actuarial (gain) loss reported for the period in other comprehensive income. The change resulted in a reduction of the interest cost component of net periodic benefit cost for 2017 of $32 before tax. The discount
rate used to measure interest cost during 2017 was 3.58% for the period from January 1, 2017 to June 30, 2017 and 3.37% for the period from July 1, 2017 to December 31, 2017 for the qualified pension plan, 3.55% for the non-qualified pension plan, and 3.13% for the postretirement benefit plan. Under the Company's historical estimation approach, the weighted average discount rate for the interest cost component would have been 4.22% for the period from January 1, 2017 to June 30, 2017 and 3.92% for the period from July 1, 2017 to December 31, 2017 for the qualified pension plan, 4.19% for the non-qualified pension plan and 3.97% for the postretirement benefit plan. The Company accounted for this change as a change in estimate, and
accordingly, recognized the effect prospectively beginning in 2017.
On June 30, 2017, the Company purchased a group annuity contract to transfer approximately $1.6 billion of the Company’s outstanding pension benefit obligations related to certain U.S. retirees, terminated vested participants, and beneficiaries. As a result of this transaction, in the second quarter of 2017, the Company recognized a pre-tax settlement charge of $750 ($488 after-tax)after tax) and a reduction to shareholders'stockholders' equity of $144.
In connection with this transaction, the Company made a contribution of $280 in September 2017 to the U.S. qualified pension plan in order to maintain the plan’s pre-transaction funded status.
Dividends from Insurance Subsidiaries
Dividends to the HFSG Holding Company from its insurance subsidiaries are restricted by insurance regulation. The payment of dividends by Connecticut-domiciled insurers is limited under the insurance holding company laws of Connecticut. These laws require notice to and approval by the state insurance commissioner for the declaration or payment of any dividend, which, together with other dividends or distributions made within the preceding twelve months, exceeds the greater of (i) 10% of the insurer’s policyholder surplus as of December 31 of the preceding year or (ii) net income (or net gain from operations, if such company is a life insurance company) for the twelve-month period ending on the thirty-first day of December last preceding, in each case determined under statutory insurance accounting principles. In addition, if any dividend of a Connecticut-domiciled insurer exceeds the insurer’s earned surplus, it requires the prior approval of the Connecticut Insurance Commissioner. The insurance holding company laws of the other jurisdictions in which The Hartford’s insurance subsidiaries are domiciled orincorporated (or deemed commercially domiciled under applicable state insurance lawsdomiciled) generally contain similar or(although in certain state(s)instances more restrictiverestrictive) limitations on the payment of dividends. In addition, if any dividend of a domiciled insurer exceeds the insurer's earned surplus or certain other thresholds as calculated under applicable state insurance law, the dividend requires the prior approval of the domestic regulator. Dividends paid to HFSG Holding Company by its life insurance subsidiaries are further dependent on cash requirements of Hartford Life, Inc. ("HLI"), the holding company of its life and annuity run-off business held for sale, and Hartford Life and Accident Insurance Company ("HLA") and other factors. Dividends paid to HFSG from HLI are subject to provisions of the Stock and Asset Purchase agreement related to the sale of HLI and its run-off life and annuity insurance business and provides for expected dividends from HLI of $300 prior to closing of the sale, subject to regulatory approval. In addition to statutory limitations on paying dividends, the Company also takes other items into consideration when determining dividends from subsidiaries. These considerations include, but are not limited to, expected earnings and capitalization of the subsidiaries, regulatory capital requirements and liquidity requirements of the individual operating company.
Total dividends paid by P&C subsidiaries to HFSG holding company in 2018 were $3.1 billion. This includes extraordinary dividends of $3.0 billion comprised of a $1.9 billion principal paydown on the intercompany note owed by Hartford Holdings, Inc. ("HHI") to Hartford Fire Insurance Company related to the life and annuity business sold in May 2018, $226 related to interest payments on the note and $900 to fund near-term obligations of the HFSG holding company. In addition, there was $50 of ordinary P&C dividends that were paid to HFSG holding company, and $110 of capital contributed by the HFSG holding company to a run-off P&C subsidiary. Excluding the interest payments on the intercompany note and dividends that were subsequently contributed to a P&C subsidiary, regulatorynet dividends paid by P&C subsidiaries to HFSG holding company were $2.8 billion during 2018.
Total net dividends received by HFSG holding company in 2018 were $2.9 billion, including the $2.8 billion from P&C subsidiaries and $119 from Hartford Funds during the year. There were no dividends received from Hartford Life and Accident in 2018.
Part II - Item 7. Management's Discussion and Analysis of Financial Condition and Results of Operations
capital requirements and liquidity requirements of the individual operating company.
Total dividends received by HFSG in 2017 from its P&C insurance subsidiaries were $2.4 billion. In connection with the purchase of Aetna's U.S. group life and disability business in the fourth quarter of 2017, the P&C insurance subsidiaries received approval and paid an extraordinary dividend to the HFSG Holding Company of $1.4 billion, of which $800 was funded by approved extraordinary dividends from HLIC. The $800 of extraordinary dividends from HLIC was used to pay down principal on the intercompany note owed by Hartford Holdings, Inc. (HHI) to Hartford Fire Insurance Company. In addition, $100 of Hartford Fire Insurance Company dividends were subsequently contributed to a run-off P&C subsidiary and $63 of P&C insurance subsidiary dividends relate to principal and interest payments on an intercompany note owed by HHI to Hartford Fire Insurance Company. Accordingly, the net dividend to HFSG Holding Company for the 2017 full year from P&C insurance subsidiaries was approximately $1.5 billion.
The $800 of extraordinary dividends from HLIC were funded in part by $550 of extraordinary dividends from HLIC's indirect wholly-owned subsidiary, Hartford Life and Annuity Insurance Company ("HLAI").
Total net dividends received by HFSG from subsidiaries in 2017 were $3.1 billion, including the $1.5 billion of net dividends from P&C subsidiaries, $1.4 billion from HLIC, $188 from HLA and $75 from Mutual Funds.
20182019 Dividend Capacity
P&C - The Company’s property and casualty insurance subsidiaries are permitted to pay up to a maximum of approximately $1.4 billion in dividends to HFSG Holding Company without prior approval from the applicable insurance commissioner. In 2018, HFSG Holding Company anticipates receiving net dividends of approximately $350 from its property and casualty insurance subsidiaries.
Group Benefits - Hartford Life and Accident Insurance Company ("HLA") has no dividend capacity for 2018 and does not anticipate paying dividends to the HSFG Holding Company.
Life and annuity run-off business - On December 4, 2017, The Hartford announced it had entered into a definitive agreement to sell its life and annuity run-off businesses to a group of investors led by Cornell Capital LLC, Atlas Merchant Capital LLC, TRB Advisors LP, Global Atlantic Financial Group, Pine Brook and J. Safra Group. Up until the anticipated close of the sale, HLIC does not have any additional dividend capacity. Prior to the expected close in 2018, HSFG Holding company anticipates receiving $300 of dividends from HLIC through HLI, subject to approval by the Connecticut Insurance Commissioner. Other intercompany transactions with HLI will be net settled prior to closing.
| |
| • | P&C - Under the formula described above, the Company’s property and casualty insurance subsidiaries are permitted to pay up to a maximum of approximately $1.2 billion in dividends to HFSG Holding Company for 2019 without prior approval from the applicable insurance commissioner, though only $200 of this dividend capacity could be paid before the fourth quarter of 2019. In 2019, HFSG Holding Company does not anticipate receiving net dividends from its property and casualty insurance subsidiaries, as planned 2019 dividends were received in the fourth quarter 2018. The HFSG Holding Company generally expects to receive net dividends of $850 to $900 a year from its property and casualty insurance subsidiaries subject to the profitability of those subsidiaries and their capital needs. |
| |
| • | Group Benefits - Hartford Life and Accident Insurance Company ("HLA") has $380 dividend capacity for 2019, and anticipates paying $250 to $300 dividends in 2019. |
Other Sources of Capital for the HFSG Holding Company
The Hartford endeavors to maintain a capital structure that provides financial and operational flexibility to its insurance subsidiaries, ratings that support its competitive position in the financial services marketplace (see the “Ratings”"Ratings" section below
for further discussion), and shareholderstockholder returns. As a result, the Company may from time to time raise capital from the issuance of debt, common equity, preferred stock, equity-related debt or other capital securities and is continuously evaluating strategic opportunities. The issuance of debt, common equity, equity-related debt or other capital securities could result in the dilution of shareholderstockholder interests or reduced net income due to additional interest expense.
Shelf Registrations
The Hartford filed an automatic shelf registration statement with the Securities and Exchange Commission (the “SEC”("the SEC") on July 29, 2016 that permits it to offer and sell debt and equity securities during the three-year life of the registration statement.
Contingent CapitalRevolving Credit Facility and Commercial Paper
The Hartford was party to a put option agreement that provided The Hartford with the right to require the Glen Meadow ABC Trust, a Delaware statutory trust, at any time and from time to time, to purchase The Hartford’s junior subordinated notes in a maximum aggregate principal amount not to exceed $500. Revolving Credit Facilities
On February 8, 2017, The Hartford exercised the put option resulting in the issuance of $500 in junior subordinated notes with proceeds received on February 15, 2017. Under the Put Option Agreement, The Hartford had been paying the Glen Meadow ABC Trust premiums on a periodic basis, calculated with respect to the aggregate principal amount of notes that The Hartford had the right to put to the Glen Meadow ABC Trust for such period. The Hartford agreed to reimburse the Glen Meadow ABC Trust for certain fees and ordinary expenses. Up until the Company exercised the put option, the Company held a variable interest in the Glen Meadow ABC Trust where the Company was not the primary beneficiary. As a result, the Company did not consolidate the Glen Meadow ABC Trust.
The junior subordinated notes have a scheduled maturity of February 12, 2047, and a final maturity of February 12, 2067. The Company is required to use reasonable efforts to sell certain qualifying replacement securities in order to repay the debentures at the scheduled maturity date. The junior subordinated notes bear interest at an annual rate of three-month LIBOR plus 2.125%, payable quarterly, and are unsecured, subordinated indebtedness of The Hartford. The Hartford will have the right, on one or more occasions, to defer interest payments due on the junior subordinated notes under specified circumstances.
Upon receipt of the proceeds,March 29, 2018, the Company entered into a replacement capital covenant (the "RCC"). Underan amendment to its Five-Year Credit Agreement dated October 31, 2014. The Amendment reset the termslevel of the RCC, ifCompany's minimum consolidated net worth financial covenant to $9 billion, excluding AOCI, from its former $13.5 billion (where net worth was defined as stockholders' equity excluding AOCI and including junior subordinated debt), among other updates. Among other changes, under an amended and restated credit agreement that became effective in June 2018, after the Company redeems the debentures at any time prior to February 12, 2047 (or such earlier date on which the RCC terminates by its terms) it can only do so with the proceeds fromclosing of the sale of the Company's life and annuity business, the aggregate amount of principal of the credit facility decreased from $1 billion to $750, including a reduction to the amount available for letters of credit from $250 to $100, the maturity date was extended to March 29, 2023, and the liens covenant and certain qualifying replacement securities. The RCC also prohibits other covenants were modified.
As of December 31, 2018, no borrowings were outstanding and $3 in letters of credit were issued under the Credit Facility and
the Company from redeemingwas in compliance with all or any portionfinancial covenants.
For further information regarding revolving credit facilities, see Note 13 - Debt of the notes on or priorNotes to February 15, 2022.
Commercial Paper and Revolving Credit FacilityConsolidated Financial Statements.
Commercial Paper
The Hartford’s maximum borrowings available under its commercial paper program are $1 billion. The Company is dependent upon market conditions to access short-term financing through the issuance of commercial paper to investors.$750. As of December 31, 20172018 there was no commercial paper outstanding.
For further information regarding commercial paper, see Note 13 - Debt of Notes to Consolidated Financial Statements.
Part II - Item 7. Management's Discussion and Analysis of Financial Condition and Results of Operations
Revolving Credit FacilitiesIntercompany Liquidity Agreements
The Company has a senior unsecured five-year revolving credit facility (the “Credit Facility”)$2.0 billion available under an intercompany liquidity agreement that providesallows for borrowing capacityshort-term advances of funds among the HFSG Holding Company and certain affiliates of up to $1$2 billion for liquidity and other general corporate purposes. The Connecticut Department of unsecured credit through October 31, 2019 available in U.S. dollars, Euro, Sterling, Canadian dollars and Japanese Yen. Insurance ("CTDOI") granted approval for certain affiliated insurance companies that are parties to the agreement to treat receivables from a parent, including the HFSG Holding Company, as admitted assets for statutory accounting purposes.
As of December 31, 2017,2018, there were no borrowings wereamounts outstanding underat the Credit Facility. HFSG Holding Company.
Collateralized Advances with Federal Home Loan Bank of Boston
In August 2018, the Company’s subsidiaries, Hartford Fire Insurance Company (“Hartford Fire”) and Hartford Life and Accident Insurance Company (“HLA”), became members of the Federal Home Loan Bank of Boston (“FHLBB”). Membership allows these subsidiaries access to collateralized advances, which may be short or long-term with fixed or variable rates.
As of December 31, 2017, the Company was in compliance2018, there were no advances outstanding under either FHLBB facility.
For further information regarding collateralized advances with all financial covenants within the Credit Facility.Federal Home Loan Bank of Boston, see Note 13 - Debt of Notes to Consolidated Financial Statements.
Derivative Commitments
Certain of the Company’s derivative agreements contain provisions that are tied to the financial strength ratings, as set by nationally recognized statistical agencies, of the individual legal entity that entered into the derivative agreement. If the legal entity’s financial strength were to fall below certain ratings, the counterparties to the derivative agreements could demand immediate and ongoing full collateralization and in certain instances enable the counterparties to terminate the agreements and demand immediate settlement of all outstanding derivative positions traded under each impacted bilateral agreement. The settlement amount is determined by netting the derivative positions transacted under each agreement. If the termination rights were to be exercised by the counterparties, it could impact the legal entity’s ability to conduct hedging activities by increasing the associated costs and decreasing the willingness of counterparties to transact with the legal entity. The aggregate fair value of all derivative instruments with credit-risk-related contingent features that are in a net liability position as of December 31, 20172018 was $534.$76. For this $534,$76, the legal entities have posted collateral of $609, which is inclusive of initial margin requirements,$71, in the normal course of business. Based on derivative market values as of December 31, 2017,2018, a downgrade of one level below the current financial strength ratings rates
Part II - Item 7. Management's Discussion and Analysis of Financial Condition and Results of Operations
by either Moody’s or S&P would not require additional assets to be posted as collateral. Based on derivative market values as of December 31, 2017,2018, a downgrade of two levels below the current financial strength ratings by either Moody’s or S&P would require an additional $10$7 of assets to be posted as collateral. These collateral amounts could change as derivative market values change, as a result of changes in our hedging activities or to the extent changes in contractual terms are negotiated. The nature of the collateral that we would post, if required, would be primarily in the form of U.S. Treasury bills, U.S. Treasury notes and government agency securities.
As of December 31, 2017, the Company did not participate in any2018, no derivative relationships thatpositions would be subject to an immediate termination in the event of a downgrade of one level below the current financial strength ratings. This could change as a result of changes in our hedging activities or to the extent changes in contractual terms are negotiated.
Insurance Operations
While subject to variability period to period, claim frequencyunderwriting and severity patternsinvestment cash flows continue to be within historical norms and, therefore, the Company’s insurance operations’ current liquidity position is considered to be sufficient to meet anticipated demands over the next twelve months. For a discussion and tabular presentation of the Company’s current contractual obligations by period, refer to Off-Balance Sheet Arrangements and Aggregate Contractual Obligations within the Capital Resources and Liquidity section of the MD&A.
The principal sources of operating funds are premiums, fees earned from assets under management and investment income, while investing cash flows originate from maturities and sales of invested assets. The primary uses of funds are to pay claims, claim adjustment expenses, commissions and other underwriting and insurance operating costs, to pay taxes, to purchase new investments and to make dividend payments to the HFSG Holding Company.
The Company’s insurance operations consist of property and casualty insurance products (collectively referred to as “Property & Casualty Operations”) and Group Benefits.
Property & Casualty Operations
Property & Casualty Operations holdsThe Company's insurance operations hold fixed maturity securities including a significant short-term investment position (securities with maturities of one year or less at the time of purchase) to meet liquidity needs.
|
| | | |
| | As of |
| | December 31, 2017 |
| Fixed maturities | $ | 25,601 |
|
| Short-term investments | 1,268 |
|
| Cash | 156 |
|
| Less: Derivative collateral | 86 |
|
| Total | $ | 26,939 |
|
Liquidity requirements that are unable to be funded by Property & Casualty Operation’sthe Company's insurance operations' short-term investments would be satisfied with current operating
funds, including premiums or investing cash flows, which includes proceeds received through the sale of invested assets. A sale of invested assets could result in significant realized capital losses.
Group Benefits Operations
Group Benefits operations’ total unpaid loss and loss adjustment expense reserves of $8.5 billion are supported by $12.1 billion ofThe following tables represent the fixed maturity holdings, including the aforementioned cash and invested assets, including assets availableshort-term investments necessary to meet liquidity needs, as shown below.for each of the Company’s insurance operations.
|
| | | |
| | As of |
| | December 31, 2018 |
| Fixed maturities | $ | 24,779 |
|
| Short-term investments | 1,081 |
|
| Cash | 91 |
|
| Less: Derivative collateral | 58 |
|
| Total | $ | 25,893 |
|
Group Benefits Operations | | | | As of | As of |
| | December 31, 2017 | December 31, 2018 |
| Fixed maturities | $ | 10,500 |
| $ | 9,882 |
|
| Short-term investments | 398 |
| 398 |
|
| Cash | 12 |
| 18 |
|
| Less: Derivative collateral | 25 |
| 18 |
|
| Total | $ | 10,885 |
| $ | 10,280 |
|
Capital resources available to pay Group Benefits loss and loss adjustment expense reserves will be funded by Hartford Life and Accident Insurance Company.
Off-balance Sheet Arrangements and Aggregate Contractual Obligations
The Company does not have any off-balance sheet arrangements that are reasonably likely to have a material effect on the financial condition, results of operations, liquidity, or capital resources of the Company, except for unfunded commitments to purchase
Part II - Item 7. Management's Discussion and Analysis of Financial Condition and Results of Operations
investments in limited partnerships and other alternative investments, private placements, and mortgage loans as disclosed in Note 14 - Commitments and Contingencies of Notes to Consolidated Financial Statements.
Part II - Item 7. Management's Discussion and Analysis of Financial Condition and Results of Operations
Aggregate Contractual Obligations as of December 31, 20172018
| | | | Payments due by period | Payments due by period |
| | Total | Less than 1 year | 1-3 years | 3-5 years | More than 5 years | Total | Less than 1 year | 1-3 years | 3-5 years | More than 5 years |
| Property and casualty obligations [1] | $ | 24,186 |
| $ | 5,705 |
| $ | 5,730 |
| $ | 2,752 |
| $ | 9,999 |
| $ | 24,972 |
| $ | 5,740 |
| $ | 5,882 |
| $ | 2,868 |
| $ | 10,482 |
|
| Group life and disability obligations [2] | 11,320 |
| 1,438 |
| 3,679 |
| 1,665 |
| 4,538 |
| 11,041 |
| 1,315 |
| 3,749 |
| 1,630 |
| 4,347 |
|
| Operating lease obligations [3] | 185 |
| 45 |
| 68 |
| 31 |
| 41 |
| 173 |
| 44 |
| 61 |
| 34 |
| 34 |
|
| Long-term debt obligations [4] | 9,213 |
| 586 |
| 1,374 |
| 1,187 |
| 6,066 |
| 9,803 |
| 674 |
| 956 |
| 1,180 |
| 6,993 |
|
| Purchase obligations [5] | 2,283 |
| 1,695 |
| 475 |
| 71 |
| 42 |
| 2,107 |
| 1,515 |
| 375 |
| 181 |
| 36 |
|
| Other liabilities reflected on the balance sheet [6] | 1,145 |
| 1,143 |
| 2 |
| — |
| — |
| 933 |
| 933 |
| — |
| — |
| — |
|
| Total | $ | 48,332 |
| $ | 10,612 |
| $ | 11,328 |
| $ | 5,706 |
| $ | 20,686 |
| $ | 49,029 |
| $ | 10,221 |
| $ | 11,023 |
| $ | 5,893 |
| $ | 21,892 |
|
| |
| [1] | The following points are significant to understanding the cash flows estimated for obligations (gross of reinsurance) under property and casualty contracts: |
Reserves for Property & Casualty unpaid losses and loss adjustment expenses include IBNR and case reserves. While payments due on claim reserves are considered contractual obligations because they relate to insurance policies issued by the Company, the ultimate amount to be paid to settle both case reserves and IBNR is an estimate, subject to significant uncertainty. The actual amount to be paid is not finally determined until the Company reaches a settlement with the claimant. Final claim settlements may vary significantly from the present estimates, particularly since many claims will not be settled until well into the future.
In estimating the timing of future payments by year, the Company has assumed that its historical payment patterns will continue. However, the actual timing of future payments could vary materially from these estimates due to, among other things, changes in claim reporting and payment patterns and large unanticipated settlements. In particular, there is significant uncertainty over the claim payment patterns of asbestos and environmental claims. In addition, the table does not include future cash flows related to the receipt of premiums that may be used, in part, to fund loss payments.
| |
| • | Under U.S. GAAP, the Company is only permitted to discount reserves for losses and loss adjustment expenses in cases where the payment pattern and ultimate loss costs are fixed and determinable on an individual claim basis. For the Company, these include claim settlements with permanently disabled claimants. As of December 31, 2018, the total property and casualty reserves in the above table are gross of a reserve discount of $388. |
Amounts shown do not consider $4.2 billion of reinsurance and other recoverables the Company is only permittedexpects to discount reserves for losses and loss adjustment expenses in cases where the payment pattern and ultimate loss costs are fixed and determinable on an individual claim basis. For the Company, these include claim settlements with permanently disabled claimants. As of December 31, 2017, the totalcollect related to property and casualty reserves in the above table are gross of a reserve discount of $410.
obligations. | |
| [2] | Estimated group life and disability obligations are based on assumptions comparable with the Company’s historical experience, modified for recent observed trends. Due to the significance of the assumptions used, the amounts presented could materially differ from actual results. As of December 31, 2017,2018, the total group life and disability obligations in the above table are gross of a reserve discount of $1.5 billion.$1.5 billion. |
| |
| [3] | Includes future minimum lease payments on operating lease agreements. See Note 14 - Commitments and Contingencies of Notes to Consolidated Financial Statements for additional discussion on lease commitments. |
| |
| [4] | Includes contractual principal and interest payments. See Note 13 - Debt of Notes to Consolidated Financial Statements for additional discussion of long-term debt obligations. |
| |
| [5] | Includes $989 million954 in commitments to purchase investments including approximately $829707 of limited partnership and other alternative investments, $54163 of private placements,debt and equity securities, and $10684 of mortgage loans. Of the $954 in commitments to purchase investments, $48 are related to mortgage loan commitments which the Company can cancel unconditionally. Outstanding commitments under these limited partnerships and mortgage loans are included in payments due in less than 1 year since the timing of funding these commitments cannot be reliably estimated. The remaining commitments to purchase investments primarily represent payables for securities purchased which are reflected on the Company’s Consolidated Balance Sheets. Also included in purchase obligations is $701688 relating to contractual commitments to purchase various goods and services such as maintenance, human resources, and information technology in the normal course of business. Purchase obligations exclude contracts that are cancelable without penalty or contracts that do not specify minimum levels of goods or services to be purchased. |
| |
| [6] | Includes cash collateral of $119 which the Company has accepted in connection with the Company’s derivative instruments. Since the timing of the return of the collateral is uncertain, the return of the collateral has been included in the payments due in less than 1 year. Also included in other long-term liabilities are net unrecognized tax benefits of $914. |
| | Capital Structure | | | December 31, 2017 | December 31, 2016 | Change | December 31, 2018 | December 31, 2017 | Change |
| Short-term debt (includes current maturities of long-term debt) | $ | 320 |
| $ | 416 |
| (23 | )% | $ | 413 |
| $ | 320 |
| 29 | % |
| Long-term debt | 4,678 |
| 4,493 |
| 4 | % | 4,265 |
| 4,678 |
| (9 | %) |
| Total debt | 4,998 |
| 4,909 |
| 2 | % | 4,678 |
| 4,998 |
| (6 | %) |
| Stockholders’ equity excluding accumulated other comprehensive income (loss), net of tax (“AOCI”) | 12,831 |
| 17,240 |
| (26 | )% | |
| Common stockholders' equity, excluding AOCI | | 14,346 |
| 12,831 |
| 12 | % |
| Preferred stock | | 334 |
| — |
| — | % |
| AOCI, net of tax | 663 |
| (337 | ) | (297 | )% | (1,579 | ) | 663 |
| (338 | %) |
| Total stockholders’ equity | $ | 13,494 |
| $ | 16,903 |
| (20 | )% | $ | 13,101 |
| $ | 13,494 |
| (3 | %) |
| Total capitalization | $ | 18,492 |
| $ | 21,812 |
| (15 | )% | $ | 17,779 |
| $ | 18,492 |
| (4 | %) |
| Debt to stockholders’ equity | 37 | % | 29 | % | | 36 | % | 37 | % |
|
| Debt to capitalization | 27 | % | 23 | % | | 26 | % | 27 | % |
|
Total stockholders' equity decreased in 2018 primarily due to a decrease in AOCI, partially offset by net income in excess of stockholder dividends and the issuance of preferred stock in 2018. AOCI decreased mainly due to the removal of AOCI
related to the life and annuity business sold in May 2018, as well as due to lower net unrealized capital gains on fixed maturities. Total capitalization decreased $713, or 4%, as of December 31,
Part II - Item 7. Management's Discussion and Analysis of Financial Condition and Results of Operations
Total stockholders' equity decreased in 2017 primarily due to the net loss in 2017, share repurchases and common stockholder dividends. Total capitalization decreased $3,320, or 15%, as of December 31, 20172018 compared with December 31, 20162017 primarily due to the decrease in stockholders' equity.equity and decrease in total debt.
For additional information regarding AOCI, net of tax, see Note
17 - Changes in and Reclassifications From Accumulated Other Comprehensive Income (Loss) of Notes to Consolidated Financial Statements.
| | | | 2017 | 2016 | 2015 | 2018 | 2017 | 2016 |
| Net cash provided by operating activities | $ | 2,186 |
| $ | 2,066 |
| $ | 2,756 |
| $ | 2,843 |
| $ | 2,186 |
| $ | 2,066 |
|
| Net cash (used for) provided by investing activities | $ | (1,442 | ) | $ | 949 |
| $ | 485 |
| |
| Net cash provided by (used for) investing activities | | $ | (1,962 | ) | $ | (1,442 | ) | $ | 949 |
|
| Net cash used for financing activities | $ | (979 | ) | $ | (2,541 | ) | $ | (3,144 | ) | $ | (1,467 | ) | $ | (979 | ) | $ | (2,541 | ) |
| Cash — end of year | $ | 180 |
| $ | 328 |
| $ | 143 |
| $ | 121 |
| $ | 180 |
| $ | 328 |
|
[1] Cash activities include cash flows from Discontinued Operations; see Note 20 - Business Dispositions and Discontinued Operations of Notes to Consolidated Financial Statements for information on cash flows from Discontinued Operations.
Year ended December 31, 2018 compared to the year ended December 31, 2017
Cash provided by operating activities increased in 2018 as compared to the prior year period primarily due to the effect of a $650 payment in 2017 for the ADC reinsurance agreement with NICO and the effect of an increase in premium and fee income received, partially offset by an increase in payments for benefits, losses, and loss adjustment expenses as well as operating expenses that were mostly driven by the acquisition of the Aetna U.S. group life and disability business.
Cash used for investing activities increased in 2018 compared to the prior year period primarily due to payments for short term investments and an increase in net payments for equity securities and mortgage loans, partially offset by proceeds from the life and annuity business sold in May 2018 and an increase in net proceeds from available for sale securities.
Cash used for financing activitiesincreased from the 2017 period primarily due to a change to a decrease in securities loaned or sold under agreements to repurchase, as well as an increase in debt repayments in 2018, partially offset by a reduction in treasury stock acquired, proceeds raised from preferred stock issued net of issuance costs and a decline in separate account activity.
Year ended December 31, 2017 compared to the year ended December 31, 2016
Cash provided by operating activities increased in 2017 as compared to the prior year due, in part, to an increase in fee income received, a decrease in taxes paid and a decrease in Property & Casualty claim payments, largely offset by the $650 ceded premium paid to NICO for the asbestos and environmental adverse development cover entered into in 2016.
Cash used for investing activities in 2017 primarily relates to the acquisition of Aetna's U.S. group life and disability business for $1.4 billion (net of cash acquired), net of $222 of net proceeds from the sale of the Company's P&C U.K. run-off business. Cash provided by investing activities in 2016 primarily related to net proceeds from available-for-sale securities of $2.7 billion, partially offset by net payments for short-term investments of $1.4 billion.
Cash used for financing activities in 2017 consists primarily of net payments for deposits, transfers and withdrawals for investments and universal life products of $991, the
repurchase of common shares outstanding and the payment of common stock dividends, offset by an increase in cash from securities loaned or sold under agreements to repurchase securities and issuance of debt. Cash used for financing activities in 2016 consisted primarily of repurchases of common shares outstanding of $1.3 billion, net payments for deposits, transfers and withdrawals for investments and universal life products of $782 and repayment of debt of $275.
Year ended December 31, 2016 compared to the year ended December 31, 2015
Cash provided by operating activities decreased in 2016 as compared to the prior year period primarily due to an increase in claims paid, including the Company's payment of $315 related to the settlement of PPG asbestos liabilities. In addition, the Company contributed $300 to its U.S. qualified pension plan in 2016 versus a contribution of $100 in 2015.
Cash provided by investing activitiesin 2016 primarily related to net proceeds from available-for-sale securities of $2.7 billion, partially offset by net payments for short-term investments of $1.4 billion. Cash provided by investing activities in 2015 primarily relates to net proceeds from
short-term investments of $3.1 billion, partially offset by net payments for available-for-sale securities of $1.9 billion and additions to property and equipment of $307.
Cash used for financing activities in 2016 consisted primarily of acquisition of treasury stock of $1.3 billion, net payments for deposits, transfers and withdrawals for investments and universal life products of $782 and repayment of debt of $275. Cash used for financing activities in 2015 consists primarily of net payments for deposits, transfers and withdrawals for investments and universal life products of $1.3 billion and acquisition of treasury stock of $1.3 billion and repayment of debt of $773, partially offset by $507 in proceeds from securities sold under repurchase agreements.
Equity Markets
For a discussion of the potential impact of the equity markets on capital and liquidity, see the Financial Risk on Statutory Capital and Liquidity Risk section in this MD&A.
Ratings
Ratings are an important factor in establishing a competitive position in the insurance marketplace and impact the Company's ability to access financing and its cost of borrowing. There can be no assurance that the Company’s ratings will continue for any given period of time, or that they will not be changed. In the event the Company’s ratings are downgraded, the Company’s competitive position, ability to access financing, and its cost of borrowing, may be adversely impacted.
The following ratings actions were announced in connection with the definitive agreement to acquire Aetna's U.S. group life and disability business:
On October 23, 2017, Moody's Investor Service affirmed the A2 insurance financial strength rating of HLA and downgraded the insurance financial strength rating of HLIC and HLAI to Baa3 from Baa2. The ratings outlook on these companies remains stable. The debt ratings of The Hartford Financial Services Group and the insurance financial strength rating of Hartford Fire Insurance Company were not affected.
On October 23, 2017, Standard & Poor’s Global Ratings affirmed it's A long-term issuer credit rating on HLA. All other ratings were not affected.
On October 23, 2017, A.M. Best commented that the credit ratings of The Hartford Financial Services Group and its
Part II - Item 7. Management's Discussion and Analysis of Financial Condition and Results of Operations
subsidiaries remain unchanged following The Hartford’s announcement that it had entered a definitive agreement to acquire Aetna’s U.S. group life and disability business.
The following ratings actions were announced in connection with the definitive agreement to sell Life and Annuity legal entities:
On December 4, 2017, Moody's Investors Service placed the long-term debt ratings of The Hartford Financial Services Group, Inc. (senior debt Baa2) on review for upgrade following the Company's announcement of a definitive agreement to sell its life and annuity run-off business. In the same action, Moody's has affirmed the A1 insurance financial strength ratings of Hartford's P&C's active insurance subsidiaries and the A2 insurance financial strength rating of HLA, both with stable outlooks. Moody's also placed its ratings for the life and annuity run-off business held for sale, under review for further downgrade, including HLIC and HLAI, both rated Baa3 for insurance financial strength ratings, and downgraded the senior debt rating of HLI to Ba3 from Baa2 with a continuing review for downgrade.
On December 4, 2017, S&P Global Ratings lowered its issuer credit rating on HLI to BB/B from BBB/A-2. At the same time, they lowered the issuer and financial strength ratings on HLIC and HLAI to BBB from BBB+. The above ratings were placed on CreditWatch with Negative implications. The BBB+/A-2 issuer credit rating on Hartford Financial Services Group, A+ long-term issuer and financial strength ratings on Hartford's core property and casualty operating companies, and the A long-term issuer and financial strength ratings on Hartford Life and Accident Insurance Company were unaffected by this announcement.
On December 5, 2017, A.M. Best downgraded the Financial Strength Rating to B++ (Good) from A- (Excellent) and the Long-Term Issuer Credit Ratings (Long-Term ICR) to bbb+ from a- of Hartford Life Insurance Company and Hartford Life and Annuity Insurance Company. Additionally, A.M. Best downgraded the Long-Term ICR to bbb- from bbb of HLI. Concurrently, A.M. Best has placed all credit ratings for these entities under review with developing implications. In addition, A.M. Best has indicated that the ratings of The Hartford Financial Services Group, Inc., its P&C subsidiaries, and HLA are unchanged by these rating actions.
Insurance Financial Strength Ratings as of February 21, 201820, 2019 |
| | | |
| As of | February 21, 201820, 2019 |
| | A.M. Best | Standard & Poor's | Moody's |
| Hartford Fire Insurance Company | A+ | A+ | A1 |
| Hartford Life and Accident Insurance Company | A | A | A2 |
| | | |
Life and Annuity Legal Entities To Be Sold |
Hartford Life Insurance Company and Hartford Life and Annuity Insurance Company ratings are under review with developing implications at A.M. Best, on CreditWatch with negative implications at Standard and Poor's, and are under review for downgrade at Moody's. |
Hartford Life Insurance Company | B++ | BBB | Baa3 |
Hartford Life and Annuity Insurance Company | B++ | BBB | Baa3 |
| Other Ratings: | | | |
| The Hartford Financial Services Group, Inc.: | | | |
| Senior debt | a- | BBB +BBB+ | Baa2Baa1 |
| Commercial paper | AMB-1 | A-2 | P-2 |
These ratings are not a recommendation to buy or hold any of The Hartford’s securities and they may be revised or revoked at any time at the sole discretion of the rating organization.
The agencies consider many factors in determining the final rating of an insurance company. One consideration is the relative
Part II - Item 7. Management's Discussion and Analysis of Financial Condition and Results of Operations
level of statutory capital and surplus (referred to collectively as "statutory capital") necessary to support the business written and is reported in accordance with accounting practices prescribed by the applicable state insurance department. See Part I, Item 1A.
Risk Factors — “Downgrades in our financial strength or credit ratings may make our products less attractive, increase our cost of capital and inhibit our ability to refinance our debt.”
Part II - Item 7. Management's Discussion and Analysis of Financial Condition and Results of Operations
Statutory Capital
|
| | | | | | | | | | | | |
| Statutory Capital Rollforward for the Company's Insurance Subsidiaries |
| | Property and Casualty Insurance Subsidiaries | Group Benefits Insurance Subsidiary | Life and Annuity Run-Off Business | Total |
| U.S. statutory capital at January 1, 2017 | $ | 8,261 |
| $ | 1,624 |
| $ | 4,398 |
| $ | 14,283 |
|
| Variable annuity surplus impacts | — |
| — |
| 63 |
| 63 |
|
| Statutory income (loss) | 950 |
| (1,066 | ) | 179 |
| 63 |
|
| Contributions from (dividends to) parent | (1,543 | ) | 1,469 |
| (1,397 | ) | (1,471 | ) |
| Other items | (272 | ) | 2 |
| 309 |
| 39 |
|
| Net change to U.S. statutory capital | (865 | ) | 405 |
| (846 | ) | (1,306 | ) |
| U.S. statutory capital at December 31, 2017 | $ | 7,396 |
| $ | 2,029 |
| $ | 3,552 |
| $ | 12,977 |
|
|
| | | | | | | | | |
| Statutory Capital Rollforward for the Company's Insurance Subsidiaries |
| | Property and Casualty Insurance Subsidiaries [1] | Group Benefits Insurance Subsidiary | Total |
| U.S. statutory capital at January 1, 2018 | $ | 7,396 |
| $ | 2,029 |
| $ | 9,425 |
|
| Statutory income | 1,114 |
| 390 |
| 1,504 |
|
| Dividends to parent | (840 | ) | — |
| (840 | ) |
| Other items | (235 | ) | (12 | ) | (247 | ) |
| Net change to U.S. statutory capital | 39 |
| 378 |
| 417 |
|
| U.S. statutory capital at December 31, 2018 | $ | 7,435 |
| $ | 2,407 |
| $ | 9,842 |
|
| |
| [1] | The statutory capital for property and casualty insurance subsidiaries in this table does not include the value of an intercompany note owed by HHI to Hartford Fire Insurance Company. Accordingly, neither the $1.9 billion principal paydown of the note nor an associated $1.9 billion of dividends to the holding company during the year endedDecember 31, 2018 are reflected in this table. |
A portion of dividends from P&C insurance subsidiaries in 2017 was used to help fund the purchase of Aetna's U.S. group life and disability business. In connection with the acquisition, the Company paid a ceding commission of $1.38 billion which drove the 2017 statutory net loss of the Group Benefits subsidiary, HLA. To support the newly acquired business and fund the ceding commission, HLA received capital contributions of $1,650 from its parent.
Stat to GAAP Differences
Significant differences between U.S. GAAP stockholders’ equity and aggregate statutory capital prepared in accordance with U.S. STAT include the following:
U.S. STAT excludes equity of non-insurance and foreign insurance subsidiaries not held by U.S. insurance subsidiaries.
Costs incurred by the Company to acquire insurance policies are deferred under U.S. GAAP while those costs are expensed immediately under U.S. STAT.
Temporary differences between the book and tax basis of an asset or liability which are recorded as deferred tax assets are evaluated for recoverability under U.S. GAAP while those amounts deferred are subject to limitations under U.S. STAT.
The assumptions used in the determination of Life benefitGroup Benefits reserves (i.e. for Group Benefits contracts) are prescribed under U.S. STAT, while the assumptions used under U.S. GAAP are generally the Company’s best estimates.
The difference between the amortized cost and fair value of fixed maturity and other investments, net of tax, is recorded as an increase or decrease to the carrying value of the related asset and to equity under U.S. GAAP, while U.S. STAT only records certain securities at fair value, such as equity securities and certain lower rated bonds required by the NAIC to be recorded at the lower of amortized cost or fair value.
U.S. STAT for life insurance companies like HLA establishes a formula reserve for realized and unrealized losses due to default and equity risks associated with certain invested assets (the Asset Valuation Reserve), while U.S. GAAP does not. Also, for those realized gains and losses caused by changes in interest rates, U.S. STAT for life insurance companies defers and amortizes the gains and losses, caused by changes in interest rates, into income over the original life to maturity of the asset sold (the Interest Maintenance Reserve) while U.S. GAAP does not.
Goodwill arising from the acquisition of a business is tested for recoverability on an annual basis (or more frequently, as necessary) for U.S. GAAP, while under U.S. STAT goodwill is amortized over a period not to exceed 10 years and the amount of goodwill admitted as an asset is limited.
In addition, certain assets, including a portion of premiums receivable and fixed assets, are non-admitted (recorded at zero value and charged against surplus) under U.S. STAT. U.S. GAAP generally evaluates assets based on their recoverability.
Risk-Based Capital
The Company's U.S. insurance companies' states of domicile impose RBC requirements. The requirements provide a means of measuring the minimum amount of statutory capital appropriate for an insurance company to support its overall business operations based on its size and risk profile. Regulatory compliance is determined by a ratio of a company's total adjusted capital (“TAC”) to its authorized control level RBC (“ACL RBC”). Companies below specific trigger points or ratios are classified within certain levels, each of which requires specified corrective action. The minimum level of TAC before corrective action commences (“Company Action Level”) is two times the ACL RBC. The adequacy of a company's capital is determined by the ratio of a company's TAC to its Company Action Level, known as the "RBC ratio". All of the Company's operating insurance subsidiaries had RBC ratios in excess of the minimum levels required by the applicable insurance regulations. On an aggregate basis, the Company's U.S. property and casualty insurance companies' RBC ratio was in excess of 200% of its Company Action Level as of December 31, 2017 and 2016. The RBC ratios for the Company's group benefits insurance operating subsidiary (HLA) was in excess of 300% of its Company Action Level as of December 31, 2017 and 2016. The RBC ratio of the Company's held for sale life
Part II - Item 7. Management's Discussion and Analysis of Financial Condition and Results of Operations
insurance and annuity run-off entities was in excess of 300% of its respective Company Action Levels as of December 31, 2017 and 2016. The reporting of RBC ratios is not intended for the purpose of ranking any insurance company, or for use in connection with any marketing, advertising, or promotional activities.
Similar to the RBC ratios that are employed by U.S. insurance regulators, regulatory authorities in the international jurisdictions in which the Company operates generally establish minimum solvency requirements for insurance companies. All of the Company's international insurance subsidiaries have solvency marginscapital levels in excess of the minimum levels required by the applicable regulatory authorities.
Sensitivity
In any particular year, statutory capital amounts and RBC ratios may increase or decrease depending upon a variety of factors. The amount of change in the statutory capital or RBC ratios can vary based on individual factors and may be compounded in extreme scenarios or if multiple factors occur at the same time. At times the impact of changes in certain market factors or a combination of multiple factors on RBC ratios can be counterintuitive. For further discussion on these factors and the potential impacts to the life insurance subsidiaries, see MD&A - Enterprise Risk Management, Financial Risk on Statutory Capital.
Part II - Item 7. Management's Discussion and Analysis of Financial Condition and Results of Operations
Statutory capital at the property and casualty subsidiaries has historically been maintained at or above the capital level required to meet “AA level” ratings from rating agencies. Statutory capital generated by the property and casualty subsidiaries in excess of the capital level required to meet “AA level” ratings is available for use by the enterprise or for corporate purposes. The amount of statutory capital can increase or decrease depending on a number of factors affecting property and casualty results including, among other factors, the level of catastrophe claims incurred, the amount of reserve development, the effect of changes in interest rates on investment income and the discounting of loss reserves, and the effect of realized gains and losses on investments.
Contingencies
Legal Proceedings
For a discussion regarding contingencies related to The Hartford’s legal proceedings, please see the information contained under “Litigation” and “Asbestos and Environmental Claims,” in Note 14 - Commitments and Contingencies of the Notes to Consolidated Financial Statements and Part II,I, Item 13 Legal Proceedings, which are incorporated herein by reference.
Legislative and Regulatory Developments
Patient Protection and Affordable Care Act of 2010 (the "Affordable Care Act")It is unclear whether the Administration, and Congress or the courts will seek to reverse, amend or alter the ongoing operation of the Affordable Care Act ("ACA"). If such actions were to occur, they may have an impact on various aspects of our business, including our insurance businesses. It is unclear what an amended ACA would entail, and to what extent there may be a transition period for the phase out of the ACA. The impact to The Hartford as an employer would be consistent with other large employers. The Hartford’s core business does not involve the issuance of health insurance, and we have not observed any material impacts on the Company’s workers’
compensation business or group benefits business from the enactment of the ACA. We will continue to monitor the impact of the ACA and any reforms on consumer, broker and medical provider behavior for leading indicators of changes in medical costs or loss payments primarily on the Company's workers' compensation and disability liabilities.liabilities.
United States Department of Labor Fiduciary RuleOn April 6, 2016, the U.S. Department of Labor (“DOL”) issued a final regulation expanding the range of activities considered to be fiduciary investment advice under the Employee Retirement Income Security Act of 1974 (“ERISA”) and the Internal Revenue Code. While implementation of the rule was to be phased in, the DOL has since delayed those dates. Based on comments received, the DOL has delayed the transition period to July 1, 2019. DOL intends to continue coordination with the SEC and other regulators, including state insurance regulators.
The impact of the new regulation on our mutual fund business is difficult to assess because the regulation is new and is still being studied. While we continue to analyze the regulation, we believe the regulation may impact the compensation paid to the financial intermediaries who sell our mutual funds to their retirement clients and could negatively impact our mutual funds business.
In 2016, several plaintiffs, including insurers and industry groups such as the U.S. Chamber of Commerce and the Securities Industry and Financial Markets Association (SIFMA), filed a lawsuit against the DOL challenging the constitutionality of the fiduciary rule, and the DOL's rulemaking authority. In most cases, the district courts have entered a summary judgment in favor of the DOL. Certain cases were appealed to the Fifth Circuit and on July 5, 2017, the DOL filed a brief in support of upholding the rule. We continue to monitor potential effects of case law and the regulatory landscape on our mutual funds business.
Tax ReformAt the end of 2017, Congress passed and the president signed, the Tax Cuts and Jobs Act of 2017 ("Tax Reform"), which enacted significant reforms to the U.S. tax code. The major areas of interest to the company include the reduction of the corporate tax rate from 35% to 21% and the repeal of the corporate alternative minimum tax (AMT) and the refunding of AMT credits. We continue to analyze Tax Reform for other potential impacts. The U.S. Treasury and IRS will developare developing guidance implementing Tax Reform, and Congress may consider additional technical corrections to the legislation. Tax proposals and regulatory initiatives which have been or are being considered by Congress and/or the U.S. Treasury Department could have a material effect on the company and its insurance businesses. The nature and timing of any Congressional or regulatory action with respect to any such efforts is unclear. For additional information on risks to the Company related to Tax Reform, please see the risk factor entitled "Changes in federal or state tax laws could adversely affect our business, financial
condition, results of operations and liquidity" under "Risk Factors" in Part I.
Guaranty Fund and Other Insurance-related Assessments
For a discussion regarding Guaranty Fund and Other Insurance-related Assessments, see Note 14 Commitments and Contingencies of Notes to Consolidated Financial Statements.
Part II - Item 7. Management's Discussion and Analysis of Financial Condition and Results of Operations
IMPACT OF NEW ACCOUNTING STANDARDS
For a discussion of accounting standards, see Note 1 - Basis of Presentation and Significant Accounting Policies of Notes to Consolidated Financial Statements.
Part II - Item 9A. Controls and Procedures
Item 9A. CONTROLS AND PROCEDURES
Evaluation of disclosure controls and procedures
The Company's principal executive officer and its principal financial officer, based on their evaluation of the Company's disclosure controls and procedures (as defined in Exchange Act Rule 13a-15(e)) have concluded that the Company's disclosure controls and procedures are effective for the purposes set forth in the definition thereof in Exchange Act Rule 13a-15(e) as of December 31, 2017.2018.
Management’s annual report on internal control over financial reporting
The management of The Hartford Financial Services Group, Inc. and its subsidiaries (“The Hartford”) is responsible for establishing and maintaining adequate internal control over financial reporting for The Hartford as defined in Rule 13a-15(f) under the Securities Exchange Act of 1934.
A company's internal control over financial reporting is a process designed to provide reasonable assurance regarding the reliability of financial reporting and the preparation of financial statements for external purposes in accordance with accounting principles generally accepted in the United States. A company's internal control over financial reporting includes policies and procedures that (1) pertain to the maintenance of records that in reasonable detail accurately and fairly reflect the transactions and dispositions of the assets of the company; (2) provide reasonable assurance that transactions are recorded as necessary to permit preparation of financial statements in accordance with accounting principles generally accepted in the United States, and that receipts and expenditures of the company are being made only in accordance with authorizations of management and directors of the company; and (3) provide reasonable assurance regarding prevention or timely detection of unauthorized acquisition, use or disposition of the company's assets that could have a material effect on the financial statements.
Because of its inherent limitations, internal control over financial reporting may not prevent or detect misstatements. Also, projections of any evaluation of effectiveness to future periods are subject to the risk that controls may become inadequate because of changes in conditions, or that the degree of compliance with the policies or procedures may deteriorate.
As discussed in Note 2 - Business Acquisitions of Notes to Consolidated Financial Statements, the Company acquired Aetna's U.S. group life and disability business on November 1, 2017. The Company is currently in the process of assessing the internal controls over financial reporting associated with this acquired business. At December 31, 2017, the acquisition accounted for approximately 2.4% of consolidated assets and 2.2% of consolidated revenue. As a result of the timing of this
acquisition, we have excluded this business from the annual assessment of our internal control over financial reporting for the year ended December 31, 2017.
The Hartford's management assessed its internal controls over financial reporting as of December 31, 20172018 in relation to criteria for effective internal control over financial reporting described in “Internal Control-Integrated Framework (2013)” issued by the Committee of Sponsoring Organizations of the Treadway Commission. Based on this assessment under those criteria, The Hartford's management concluded that its internal control over financial reporting was effective as of December 31, 2017.2018.
Changes in internal control over financial reporting
There were no changes in the Company's internal control over financial reporting that occurred during the Company's fourth fiscal quarter of 20172018 that have materially affected, or are reasonably likely to materially affect, the Company's internal control over financial reporting.
Attestation report of the Company’s registered public accounting firm
The Hartford's independent registered public accounting firm, Deloitte & Touche LLP, has issued their attestation report on the Company's internal control over financial reporting which is set forth below.
Part II - Item 9A. Controls and Procedures
Report of Independent Registered Public Accounting Firm
To the Board of Directors and Stockholders of
The Hartford Financial Services Group, Inc.
Hartford, Connecticut
Opinion on Internal Control over Financial Reporting
We have audited the internal control over financial reporting of The Hartford Financial Services Group, Inc. and its subsidiaries (collectively, the "Company") as of December 31, 2017,2018, based on criteria established in Internal Control - Integrated Framework (2013) issued by the Committee of Sponsoring Organizations of the Treadway Commission (COSO). In our opinion, the Company maintained, in all material respects, effective internal control over financial reporting as of December 31, 2017,2018, based on criteria established in Internal Control - Integrated Framework (2013) issued by COSO.
We have also audited, in accordance with the standards of the Public Company Accounting Oversight Board (United States) (PCAOB), the consolidated financial statements as of and for the year ended December 31, 2017,2018, of the Company and our report dated February 23, 201822, 2019, expressed an unqualified opinion on those financial statements.
As described in Management’s Annual Report on Internal Control over Financial Reporting, management excluded from its assessment the internal control over financial reporting of Aetna's U.S. group life and disability business, which was acquired on November 1, 2017 and whose financial statements constitutes 2.4% of total assets and 2.2% of revenues of the consolidated financial statements of the Company as of and for the year ended December 31, 2017. Accordingly, our audit did not include the internal control over financial reporting at the acquired business.
Basis for Opinion
The Company’s management is responsible for maintaining effective internal control over financial reporting and for its assessment of the effectiveness of internal control over financial reporting, included in the accompanying Management’s Annual Report on Internal Control over Financial Reporting. Our responsibility is to express an opinion on the Company’s internal control over financial reporting based on our audit. We are a public accounting firm registered with the PCAOB and are required to be independent with respect to the Company in accordance with the U.S. federal securities laws and the applicable rules and regulations of the Securities and Exchange Commission and the PCAOB.
We conducted our audit in accordance with the standards of the PCAOB. Those standards require that we plan and perform the audit to obtain reasonable assurance about whether effective internal control over financial reporting was maintained in all material respects. Our audit included obtaining an understanding of internal control over financial reporting, assessing the risk that a material weakness exists, testing and evaluating the design and operating effectiveness of internal control based on the assessed risk, and performing such other procedures as we considered necessary in the circumstances. We believe that our audit provides a reasonable basis for our opinion.
Definition and Limitations of Internal Control over Financial Reporting
A company’s internal control over financial reporting is a process designed to provide reasonable assurance regarding the reliability of financial reporting and the preparation of financial statements for external purposes in accordance with generally accepted accounting principles. A company’s internal control over financial reporting includes those policies and procedures that (1) pertain to the maintenance of records that, in reasonable detail, accurately and fairly reflect the transactions and dispositions of the assets of the company; (2) provide reasonable assurance that transactions are recorded as necessary to permit preparation of financial statements in accordance with generally accepted accounting principles, and that receipts and expenditures of the company are being made only in accordance with authorizations of management and directors of the company; and (3) provide reasonable assurance regarding prevention or timely detection of unauthorized acquisition, use, or disposition of the company’s assets that could have a material effect on the financial statements.
Because of its inherent limitations, internal control over financial reporting may not prevent or detect misstatements. Also, projections of any evaluation of effectiveness to future periods are subject to the risk that controls may become inadequate because of changes in conditions, or that the degree of compliance with the policies or procedures may deteriorate.
/s/ DELOITTE & TOUCHE LLP
Hartford, Connecticut
February 23, 201822, 2019
Part III - Item 10. Directors, and Executive Officers and Corporate Governance of the Hartford
Item 10. DIRECTORS, AND EXECUTIVE OFFICERS AND CORPORATE GOVERNANCE OF THE HARTFORD
Certain of the information called for by Item 10 will be set forth in the definitive proxy statement for the 20182019 annual meeting of shareholdersstockholders (the “Proxy Statement”) to be filed by The Hartford with the Securities and Exchange Commission within 120 days after the end of the fiscal year covered by this Form 10-K under the captions and subcaptions “Board and Governance Matters”, “Director Nominees" and "Section (16)(a) Beneficial Ownership Reporting Compliance" and is incorporated herein by reference.
The Company has adopted a Code of Ethics and Business Conduct, which is applicable to all employees of the Company, including the principal executive officer, the principal financial officer and the principal accounting officer. The Code of Ethics and Business Conduct is available on the investor relations section of the Company’s website at: http://ir.thehartford.com.
Any waiver of, or material amendment to, the Code of Ethics and Business Conduct will be posted promptly to our web site in accordance with applicable NYSE and SEC rules.
Executive Officers of Basis for Opinion
The Hartford
Information about the executive officers of The Hartford who are also nomineesCompany’s management is responsible for election as directors will be set forth in The Hartford’s Proxy Statement. Set forth below is information about the other executive officersmaintaining effective internal control over financial reporting and for its assessment of the effectiveness of internal control over financial reporting, included in the accompanying Management’s Annual Report on Internal Control over Financial Reporting. Our responsibility is to express an opinion on the Company’s internal control over financial reporting based on our audit. We are a public accounting firm registered with the PCAOB and are required to be independent with respect to the Company in accordance with the U.S. federal securities laws and the applicable rules and regulations of the Securities and Exchange Commission and the PCAOB.
We conducted our audit in accordance with the standards of the PCAOB. Those standards require that we plan and perform the audit to obtain reasonable assurance about whether effective internal control over financial reporting was maintained in all material respects. Our audit included obtaining an understanding of internal control over financial reporting, assessing the risk that a material weakness exists, testing and evaluating the design and operating effectiveness of internal control based on the assessed risk, and performing such other procedures as we considered necessary in the circumstances. We believe that our audit provides a reasonable basis for our opinion.
Definition and Limitations of Internal Control over Financial Reporting
A company’s internal control over financial reporting is a process designed to provide reasonable assurance regarding the reliability of financial reporting and the preparation of financial statements for external purposes in accordance with generally accepted accounting principles. A company’s internal control over financial reporting includes those policies and procedures that (1) pertain to the maintenance of records that, in reasonable detail, accurately and fairly reflect the transactions and dispositions of the assets of the company; (2) provide reasonable assurance that transactions are recorded as necessary to permit preparation of financial statements in accordance with generally accepted accounting principles, and that receipts and expenditures of the company are being made only in accordance with authorizations of management and directors of the company; and (3) provide reasonable assurance regarding prevention or timely detection of unauthorized acquisition, use, or disposition of the company’s assets that could have a material effect on the financial statements.
Because of its inherent limitations, internal control over financial reporting may not prevent or detect misstatements. Also, projections of any evaluation of effectiveness to future periods are subject to the risk that controls may become inadequate because of changes in conditions, or that the degree of compliance with the policies or procedures may deteriorate.
/s/ DELOITTE & TOUCHE LLP
Hartford, Connecticut
February 15, 2018:22, 2019
|
| | |
Name | Age | Position with The Hartford and Business Experience For the Past Five Years |
William A. Bloom | 54 | Executive Vice President of Operations and Technology (August 2014 - present); President of Global Client Services, EXL (July 2010-July 2014) |
Beth A. Bombara | 50 | Executive Vice President and Chief Financial Officer (July 2014-present); President of Talcott Resolution (July 2012-July 2014) |
Kathy Bromage
| 60 | Chief Marketing and Communications Officer (June 2015-present); Senior Vice President of Strategy and Marketing, Small Commercial and Senior Vice President of Brand Marketing (July 2012-June 2015) |
James E. Davey | 53 | Executive Vice President and President of The Hartford Mutual Funds (2010-present) |
Doug Elliot | 57 | President (July 2014-present); Executive Vice President and President of Commercial Lines (April 2011-July 2014) |
Martha Gervasi | 56 | Executive Vice President, Human Resources (May 2012-present) |
Brion Johnson | 58 | President of Talcott Resolution (July 2014-present); Executive Vice President, Chief Investment Officer (May 2012-Present) |
Scott R. Lewis | 55 | Senior Vice President and Controller (May 2013-present); Senior Vice President and Chief Financial Officer, Personal Lines (2009-May 2013) |
Robert Paiano | 56 | Executive Vice President and Chief Risk Officer (June 2017-Present); Senior Vice President & Treasurer (July 2010-May 2017)
|
David C. Robinson | 52 | Executive Vice President and General Counsel (June 2015-present); Senior Vice President and Director of Commercial Markets Law (August 2014-May 2015); Senior Vice President and Head of Enterprise Transformation, Strategy and Corporate Development (April 2012-August 2014) |
John Wilcox | 52 | Chief Strategy and Ventures Officer (September 2016-present); President and Chief Operating Officer, Risk Strategies Company (June 2012-September 2016) |
Part III - Item 12. Security Ownership10. Directors, and Executive Officers and Corporate Governance of Certain Beneficial Owners and Management and Related Stockholder Mattersthe Hartford
Item 12. SECURITY OWNERSHIP10. DIRECTORS, AND EXECUTIVE OFFICERS AND CORPORATE GOVERNANCE OF CERTAIN BENEFICIAL OWNERS AND MANAGEMENT AND RELATED STOCKHOLDER MATTERSTHE HARTFORD
Certain of the information called for by Item 1210 will be set forth in the Proxy Statementdefinitive proxy statement for the 2019 annual meeting of stockholders (the “Proxy Statement”) to be filed by The Hartford with the Securities and Exchange Commission within 120 days after the end of the fiscal year covered by this Form 10-K under the caption “Information on Stock Ownership”captions and subcaptions “Board and Governance Matters”, “Director Nominees" and "Section (16)(a) Beneficial Ownership Reporting Compliance" and is incorporated herein by reference.
Equity Compensation Plan Information
The following table provides information asCompany has adopted a Code of December 31, 2017 aboutEthics and Business Conduct, which is applicable to all employees of the securities authorized for issuance underCompany, including the principal executive officer, the principal financial officer and the principal accounting officer. The Code of Ethics and Business Conduct is available on the investor relations section of the Company’s equity compensation plans. The Company maintains The Hartford 2005 Incentive Stock Plan (the “2005 Stock Plan”), The Hartford 2010 Incentive Stock Plan (the “2010 Stock Plan”), The Hartford 2014 Incentive Stock Plan (the "2014 Stock Plan") (collectively the "Stock Plans") and The Hartford Employee Stock Purchase Plan (the “ESPP”). On May 21, 2014, the shareholders ofwebsite at: http://ir.thehartford.com.
the Company approved the 2014 Stock Plan, which superseded the earlier plans. PursuantAny waiver of, or material amendment to, the provisionsCode of the 2014 Stock Plan, no additional shares mayEthics and Business Conduct will be issued from the 2010 Stock Plan. To the extent that any awards under the 2005 Stock Plan and the 2010 Stock Plan are forfeited, terminated, surrendered, exchanged, expire unexercised or are settled in cash in lieu of stock (includingposted promptly to effect tax withholding) or for the issuance of a lesser number of shares than the number of shares subject to the award, the shares subject to such awards (or the relevant portion thereof) shall be available for award under the 2014 Stock Plan and such shares shall be added to the total number of shares available under the 2014 Stock Plan. For a description of the 2014 Stock Plan and the ESPP, see Note 19 - Stock Compensation Plans of Notes to Consolidated Financial Statements.
|
| | | | | | | |
| | (a) | (b) | (c) |
| | Number of Securities
to be Issued Upon Exercise of Outstanding Options, Warrants and Rights [1] | Weighted-average
Exercise Price of Outstanding Options, Warrants and Rights [2] | Number of Securities Remaining
Available for Future Issuance Under Equity Compensation Plans (Excluding Securities Reflected in Column (a)) [3] |
| Equity compensation plans approved by stockholders | 10,383,348 |
| $ | 37.25 |
| 12,915,416 |
|
| Equity compensation plans not approved by stockholders | — |
| — |
| — |
|
| Total | 10,383,348 |
| $ | 37.25 |
| 12,915,416 |
|
| |
[1] | The amount shown in this column includes 5,212,045 outstanding options awarded under the 2005 Stock Plan and the 2010 Stock Plan. The amount shown in this column includes 4,444,226 outstanding restricted stock units and 795,044 outstanding performance shares at 100% of target (which excludes 353,087 shares that vested on December 31, 2017, related to the 2015-2017 performance period) as of December 31, 2017 under the 2010 Stock Plan and the 2014 Stock Plan. The maximum number of performance shares that could be awarded is 1,590,088 (200% of target) if the Company achieved the highest performance level. Under the 2010 and 2014 Stock Plans, no more than 500,000 shares in the aggregate can be earned by an individual employee with respect to restricted stock unit and performance share awards made in a single calendar year. As a result, the number of shares ultimately distributed to an employee with respect to awards made in the same year will be reduced, if necessary, so that the number does not exceed this limit.
|
| |
[2] | The weighted-average exercise price reflects outstanding options and does not reflect outstanding restricted stock units or performance shares because they do not have exercise prices. |
| |
[3] | Of these shares, 4,517,632 remain available for purchase under the ESPP as of December 31, 2017. 8,397,784 shares remain available for issuance as options, restricted stock units, restricted stock awards or performance shares under the 2014 Stock Plan as of December 31, 2017.
|
Part IV. Item 15. Exhibits, Financial Statement Schedules
Item 15. EXHIBITS, FINANCIAL STATEMENT SCHEDULES
| |
(a) | Documents filed as a part of this report: |
| |
(1) | Consolidated Financial Statements. See Index to Consolidated Financial Statements and Schedules elsewhere herein.
|
| |
(2) | Consolidated Financial Statement Schedules. See Index to Consolidated Financial Statement and Schedules elsewhere herein.
|
| |
(3) | Exhibits. See Exhibit Index elsewhere herein.
|
Part IV. Item 15. Exhibits, Financial Statement Schedules
THE HARTFORD FINANCIAL SERVICES GROUP, INC.
INDEX TO CONSOLIDATED FINANCIAL STATEMENTS AND SCHEDULES
|
| |
Description | Page |
| |
| |
| |
| |
| |
| |
| |
| |
| S-2 |
| S-4 |
| S-6 |
| S-7 |
| S-8 |
Part IV. Item 15. Exhibits, Financial Statement Schedules
REPORT OF INDEPENDENT REGISTERED PUBLIC ACCOUNTING FIRM
To the Board of Directors and Stockholders of
The Hartford Financial Services Group, Inc.
Hartford, Connecticut
Opinion on the Financial Statements
We have audited the accompanying consolidated balance sheets of The Hartford Financial Services Group, Inc. and its subsidiaries (collectively, the “Company”) as of December 31, 2017 and 2016, and the related consolidated statements of operations, comprehensive income, changes in stockholders’ equity, and cash flows for each of the three years in the period ended December 31, 2017, and the related notes and the consolidated financial statement schedules listed in the Index at Item 15 (collectively referred to as the "financial statements"). In our opinion, the financial statements present fairly, in all material respects, the financial position of the Company as of December 31, 2017 and 2016, and the results of its operations and its cash flows for each of the three years in the period ended December 31, 2017, in conformity accounting principles generally accepted in the United States of America.
We have also audited,web site in accordance with the standards of the Public Company Accounting Oversight Board (United States) (PCAOB), the Company's internal control over financial reporting as of December 31, 2017, based on criteria established in Internal Control - Integrated Framework (2013) issued by the Committee of Sponsoring Organizations of the Treadway Commissionapplicable NYSE and our report dated February 23, 2018, expressed an unqualified opinion on the Company's internal control over financial reporting.SEC rules.
Basis for Opinion
The Company’s management is responsible for maintaining effective internal control over financial reporting and for its assessment of the effectiveness of internal control over financial reporting, included in the accompanying Management’s Annual Report on Internal Control over Financial Reporting. Our responsibility is to express an opinion on the Company’s internal control over financial reporting based on our audit. We are a public accounting firm registered with the PCAOB and are required to be independent with respect to the Company in accordance with the U.S. federal securities laws and the applicable rules and regulations of the Securities and Exchange Commission and the PCAOB.
We conducted our audit in accordance with the standards of the PCAOB. Those standards require that we plan and perform the audit to obtain reasonable assurance about whether effective internal control over financial reporting was maintained in all material respects. Our audit included obtaining an understanding of internal control over financial reporting, assessing the risk that a material weakness exists, testing and evaluating the design and operating effectiveness of internal control based on the assessed risk, and performing such other procedures as we considered necessary in the circumstances. We believe that our audit provides a reasonable basis for our opinion.
Definition and Limitations of Internal Control over Financial Reporting
A company’s internal control over financial reporting is a process designed to provide reasonable assurance regarding the reliability of financial reporting and the preparation of financial statements for external purposes in accordance with generally accepted accounting principles. A company’s internal control over financial reporting includes those policies and procedures that (1) pertain to the maintenance of records that, in reasonable detail, accurately and fairly reflect the transactions and dispositions of the assets of the company; (2) provide reasonable assurance that transactions are recorded as necessary to permit preparation of financial statements in accordance with generally accepted accounting principles, and that receipts and expenditures of the company are being made only in accordance with authorizations of management and directors of the company; and (3) provide reasonable assurance regarding prevention or timely detection of unauthorized acquisition, use, or disposition of the company’s assets that could have a material effect on the financial statements.
Because of its inherent limitations, internal control over financial reporting may not prevent or detect misstatements. Also, projections of any evaluation of effectiveness to future periods are subject to the risk that controls may become inadequate because of changes in conditions, or that the degree of compliance with the policies or procedures may deteriorate.
/s/ DELOITTE & TOUCHE LLP
Hartford, Connecticut
February 22, 2019
Part III - Item 10. Directors, and Executive Officers and Corporate Governance of the Hartford
Item 10. DIRECTORS, AND EXECUTIVE OFFICERS AND CORPORATE GOVERNANCE OF THE HARTFORD
Certain of the information called for by Item 10 will be set forth in the definitive proxy statement for the 2019 annual meeting of stockholders (the “Proxy Statement”) to be filed by The Hartford with the Securities and Exchange Commission within 120 days after the end of the fiscal year covered by this Form 10-K under the captions and subcaptions “Board and Governance Matters”, “Director Nominees" and "Section (16)(a) Beneficial Ownership Reporting Compliance" and is incorporated herein by reference.
The Company has adopted a Code of Ethics and Business Conduct, which is applicable to all employees of the Company, including the principal executive officer, the principal financial officer and the principal accounting officer. The Code of Ethics and Business Conduct is available on the investor relations section of the Company’s website at: http://ir.thehartford.com.
Any waiver of, or material amendment to, the Code of Ethics and Business Conduct will be posted promptly to our web site in accordance with applicable NYSE and SEC rules.
Executive Officers of The Hartford
Information about the executive officers of The Hartford who are also nominees for election as directors will be set forth in The Hartford’s Proxy Statement. Set forth below is information about the other executive officers of the Company as of February 15, 2019:
|
| | |
| Name | Age | Position with The Hartford and Business Experience For the Past Five Years |
| William A. Bloom | 55 | Executive Vice President of Operations and Technology (August 2014 - present); President of Global Client Services, EXL (July 2010-July 2014) |
| Kathleen M. Bromage | 61 | Chief Marketing and Communications Officer (June 2015-present); Senior Vice President of Strategy and Marketing, Small Commercial and Senior Vice President of Brand Marketing (July 2012-June 2015) |
| Beth A. Costello | 51 | Executive Vice President and Chief Financial Officer (July 2014-present); President of the life and annuity business sold in May 2018 and formerly referred to as Talcott Resolution (July 2012-July 2014) |
| Douglas G. Elliot | 58 | President (July 2014-present); Executive Vice President and President of Commercial Lines (April 2011-July 2014) |
| Martha Gervasi | 57 | Executive Vice President, Human Resources (May 2012-present) |
| Brion S. Johnson | 59 | Executive Vice President, Chief Investment Officer (May 2012-Present); President of the life and annuity business sold in May 2018 and formerly referred to as Talcott Resolution (July 2014-May 2018) |
| Scott R. Lewis | 56 | Senior Vice President and Controller (May 2013-present); Senior Vice President and Chief Financial Officer, Personal Lines (2009-May 2013) |
| Robert W. Paiano | 57 | Executive Vice President and Chief Risk Officer (June 2017-Present); Senior Vice President & Treasurer (July 2010-May 2017)
|
| David C. Robinson | 53 | Executive Vice President and General Counsel (June 2015-present); Senior Vice President and Director of Commercial Markets Law (August 2014-May 2015); Senior Vice President and Head of Enterprise Transformation, Strategy and Corporate Development (April 2012-August 2014) |
Part III - Item 12. Security Ownership of Certain Beneficial Owners and Management and Related Stockholder Matters
Item 12. SECURITY OWNERSHIP OF CERTAIN BENEFICIAL OWNERS AND MANAGEMENT AND RELATED STOCKHOLDER MATTERS
Certain of the information called for by Item 12 will be set forth in the Proxy Statement under the caption “Information on Stock Ownership” and is incorporated herein by reference.
Equity Compensation Plan Information
The following table provides information as of December 31, 2018 about the securities authorized for issuance under the Company’s equity compensation plans. The Company maintains The Hartford 2005 Incentive Stock Plan (the “2005 Stock Plan”), The Hartford 2010 Incentive Stock Plan (the “2010 Stock Plan”), The Hartford 2014 Incentive Stock Plan (the "2014 Stock Plan") (collectively the "Stock Plans") and The Hartford Employee Stock Purchase Plan (the “ESPP”). On May 21, 2014, the stockholders of
the Company approved the 2014 Stock Plan, which superseded the earlier plans. Pursuant to the provisions of the 2014 Stock Plan, no additional shares may be issued from the 2010 Stock Plan. To the extent that any awards under the 2005 Stock Plan and the 2010 Stock Plan are forfeited, terminated, surrendered, exchanged, expire unexercised or are settled in cash in lieu of stock (including to effect tax withholding) or for the issuance of a lesser number of shares than the number of shares subject to the award, the shares subject to such awards (or the relevant portion thereof) shall be available for award under the 2014 Stock Plan and such shares shall be added to the total number of shares available under the 2014 Stock Plan. For a description of the 2014 Stock Plan and the ESPP, see Note 19 - Stock Compensation Plans of Notes to Consolidated Financial Statements.
|
| | | | | | | |
| | (a) | (b) | (c) |
| | Number of Securities
to be Issued Upon Exercise of Outstanding Options, Warrants and Rights [1] | Weighted-average
Exercise Price of Outstanding Options, Warrants and Rights [2] | Number of Securities Remaining
Available for Future Issuance Under Equity Compensation Plans (Excluding Securities Reflected in Column (a)) [3] |
| Equity compensation plans approved by stockholders | 9,671,076 |
| $ | 40.84 |
| 11,592,452 |
|
| Equity compensation plans not approved by stockholders | — |
| — |
| — |
|
| Total | 9,671,076 |
| $ | 40.84 |
| 11,592,452 |
|
| |
| [1] | The amount shown in this column includes 5,489,908 outstanding options awarded under the 2005 Stock Plan and the 2010 Stock Plan. The amount shown in this column includes 3,446,535 outstanding restricted stock units and 734,633 outstanding performance shares at 100% of target (which excludes 187,798 shares that vested on December 31, 2018, related to the 2016-2018 performance period) as of December 31, 2018 under the 2010 Stock Plan and the 2014 Stock Plan. The maximum number of performance shares that could be awarded is 1,469,266 (200% of target) if the Company achieved the highest performance level. Under the 2010 and 2014 Stock Plans, no more than 500,000 shares in the aggregate can be earned by an individual employee with respect to restricted stock unit and performance share awards made in a single calendar year. As a result, the number of shares ultimately distributed to an employee with respect to awards made in the same year will be reduced, if necessary, so that the number does not exceed this limit. |
| |
| [2] | The weighted-average exercise price reflects outstanding options and does not reflect outstanding restricted stock units or performance shares because they do not have exercise prices. |
| |
| [3] | Of these shares, 4,297,972 remain available for purchase under the ESPP as of December 31, 2018. 7,294,481 shares remain available for issuance as options, restricted stock units, restricted stock awards or performance shares under the 2014 Stock Plan as of December 31, 2018. |
Part IV. Item 15. Exhibits, Financial Statement Schedules
Item 15. EXHIBITS, FINANCIAL STATEMENT SCHEDULES
| |
| (a) | Documents filed as a part of this report: |
| |
| (1) | Consolidated Financial Statements. See Index to Consolidated Financial Statements and Schedules elsewhere herein. |
| |
| (2) | Consolidated Financial Statement Schedules. See Index to Consolidated Financial Statement and Schedules elsewhere herein. |
| |
| (3) | Exhibits. See Exhibit Index elsewhere herein. |
THE HARTFORD FINANCIAL SERVICES GROUP, INC.
INDEX TO CONSOLIDATED FINANCIAL STATEMENTS AND SCHEDULES
|
| |
| Description | Page |
| |
| |
| |
| |
| |
| |
| |
| |
| S-2 |
| S-4 |
| S-6 |
| S-7 |
| S-8 |
Part IV. Item 15. Exhibits, Financial Statement Schedules
REPORT OF INDEPENDENT REGISTERED PUBLIC ACCOUNTING FIRM
To the Board of Directors and Stockholders of
The Hartford Financial Services Group, Inc.
Hartford, Connecticut
Opinion on the Financial Statements
We have audited the accompanying consolidated balance sheets of The Hartford Financial Services Group, Inc. and its subsidiaries (collectively, the “Company”) as of December 31, 2018 and 2017, the related consolidated statements of operations, comprehensive income (loss), changes in stockholders’ equity, and cash flows, for each of the three years in the period ended December 31, 2018, and the related notes and the schedules listed in the Index at Item 15 (collectively referred to as the "financial statements"). In our opinion, the financial statements present fairly, in all material respects, the financial position of the Company as of December 31, 2018 and 2017, and the results of its operations and its cash flows for each of the three years in the period ended December 31, 2018, in conformity with accounting principles generally accepted in the United States of America.
We have also audited, in accordance with the standards of the Public Company Accounting Oversight Board (United States) (PCAOB), the Company's internal control over financial reporting as of December 31, 2018, based on criteria established in Internal Control - Integrated Framework (2013) issued by the Committee of Sponsoring Organizations of the Treadway Commission and our report dated February 22, 2019, expressed an unqualified opinion on the Company's internal control over financial reporting.
Basis for Opinion
These financial statements are the responsibility of the Company's management. Our responsibility is to express an opinion on the Company's financial statements based on our audits. We are a public accounting firm registered with the PCAOB and are required to be independent with respect to the Company in accordance with the U.S. federal securities laws and the applicable rules and regulations of the Securities and Exchange Commission and the PCAOB.
We conducted our audits in accordance with the standards of the PCAOB. Those standards require that we plan and perform the audit to obtain reasonable assurance about whether the financial statements are free of material misstatement, whether due to error or fraud.
Our audits included performing procedures to assess the risks of material misstatement of the financial statements, whether due to error or fraud, and performing procedures that respond to those risks. Such procedures included examining, on a test basis, evidence regarding the amounts and disclosures in the financial statements. Our audits also included evaluating the accounting principles used and significant estimates made by management, as well as evaluating the overall presentation of the financial statements. We believe that our audits provide a reasonable basis for our opinion.
/s/ DELOITTE & TOUCHE LLP
Hartford, Connecticut
February 23, 201822, 2019
We have served as the Company’s auditor since 2002.
THE HARTFORD FINANCIAL SERVICES GROUP, INC.
Consolidated Statements of Operations
| | | | For the years ended December 31, | For the years ended December 31, |
| (In millions, except for per share data) | 2017 | 2016 | 2015 | 2018 | 2017 | 2016 |
| Revenues | | |
| Earned premiums | $ | 14,141 |
| $ | 13,697 |
| $ | 13,485 |
| $ | 15,869 |
| $ | 14,141 |
| $ | 13,697 |
|
| Fee income | 980 |
| 857 |
| 876 |
| 1,313 |
| 1,168 |
| 1,041 |
|
| Net investment income | 1,603 |
| 1,577 |
| 1,561 |
| 1,780 |
| 1,603 |
| 1,577 |
|
| Net realized capital gains (losses): | |
| |
| |
| |
| |
| |
|
| Total other-than-temporary impairment (“OTTI”) losses | (15 | ) | (35 | ) | (47 | ) | (7 | ) | (15 | ) | (35 | ) |
| OTTI losses recognized in other comprehensive income | 7 |
| 8 |
| 6 |
| 6 |
| 7 |
| 8 |
|
| Net OTTI losses recognized in earnings | (8 | ) | (27 | ) | (41 | ) | (1 | ) | (8 | ) | (27 | ) |
| Other net realized capital gains (losses) | 173 |
| (83 | ) | 29 |
| (111 | ) | 173 |
| (83 | ) |
| Total net realized capital gains (losses) | 165 |
| (110 | ) | (12 | ) | (112 | ) | 165 |
| (110 | ) |
| Other revenues | 85 |
| 86 |
| 87 |
| 105 |
| 85 |
| 86 |
|
| Total revenues | 16,974 |
| 16,107 |
| 15,997 |
| 18,955 |
| 17,162 |
| 16,291 |
|
| Benefits, losses and expenses | |
| |
| |
| |
| |
| |
|
| Benefits, losses and loss adjustment expenses | 10,174 |
| 9,961 |
| 9,325 |
| 11,165 |
| 10,174 |
| 9,961 |
|
| Amortization of deferred policy acquisition costs ("DAC") | 1,372 |
| 1,377 |
| 1,364 |
| 1,384 |
| 1,372 |
| 1,377 |
|
| Insurance operating costs and other expenses | 4,375 |
| 3,341 |
| 3,459 |
| 4,281 |
| 4,563 |
| 3,525 |
|
| Loss on extinguishment of debt | — |
| — |
| 21 |
| 6 |
| — |
| — |
|
| Loss on reinsurance transaction | — |
| 650 |
| — |
| — |
| — |
| 650 |
|
| Interest expense | 316 |
| 327 |
| 346 |
| 298 |
| 316 |
| 327 |
|
| Amortization of other intangible assets | 14 |
| 4 |
| 4 |
| 68 |
| 14 |
| 4 |
|
| Total benefits, losses and expenses | 16,251 |
| 15,660 |
| 14,519 |
| 17,202 |
| 16,439 |
| 15,844 |
|
| Income from continuing operations before income taxes | 723 |
| 447 |
| 1,478 |
| 1,753 |
| 723 |
| 447 |
|
| Income tax expense (benefit) | 985 |
| (166 | ) | 289 |
| 268 |
| 985 |
| (166 | ) |
| (Loss) Income from continuing operations, net of tax | (262 | ) | 613 |
| 1,189 |
| |
| (Loss) income from discontinued operations, net of tax | (2,869 | ) | 283 |
| 493 |
| |
| Net (loss) income | $ | (3,131 | ) | $ | 896 |
| $ | 1,682 |
| |
| (Loss) income from continuing operations, net of tax, per common share | | |
| Income (loss) from continuing operations, net of tax | | 1,485 |
| (262 | ) | 613 |
|
| Income (loss) from discontinued operations, net of tax | | 322 |
| (2,869 | ) | 283 |
|
| Net income (loss) | | 1,807 |
| $ | (3,131 | ) | $ | 896 |
|
| Preferred stock dividends | | 6 |
| — |
| — |
|
| Net income (loss) available to common stockholders | | $ | 1,801 |
| $ | (3,131 | ) | $ | 896 |
|
| |
|
|
|
|
|
|
| Income (loss) from continuing operations, net of tax, available to common stockholders per common share | |
|
|
|
|
|
|
| Basic | $ | (0.72 | ) | $ | 1.58 |
| $ | 2.86 |
| $ | 4.13 |
| $ | (0.72 | ) | $ | 1.58 |
|
| Diluted | $ | (0.72 | ) | $ | 1.55 |
| $ | 2.80 |
| $ | 4.06 |
| $ | (0.72 | ) | $ | 1.55 |
|
| Net (loss) income per common share | | |
| Net income (loss) available to common stockholders per common share | |
|
|
|
|
|
|
| Basic | $ | (8.61 | ) | $ | 2.31 |
| $ | 4.05 |
| $ | 5.03 |
| $ | (8.61 | ) | $ | 2.31 |
|
| Diluted | $ | (8.61 | ) | $ | 2.27 |
| $ | 3.96 |
| $ | 4.95 |
| $ | (8.61 | ) | $ | 2.27 |
|
| Cash dividends declared per common share | $ | 0.94 |
| $ | 0.86 |
| $ | 0.78 |
| |
See Notes to Consolidated Financial Statements.
THE HARTFORD FINANCIAL SERVICES GROUP, INC.
Consolidated Statements of Comprehensive Income (Loss)
| | | | For the years ended December 31, | For the years ended December 31, |
| (In millions) | 2017 | 2016 | 2015 | 2018 | 2017 | 2016 |
| Net (loss) income | $ | (3,131 | ) | $ | 896 |
| $ | 1,682 |
| |
| Net income (loss) | | $ | 1,807 |
| $ | (3,131 | ) | $ | 896 |
|
| Other comprehensive income (loss): | |
| |
| |
| |
| |
| |
|
| Changes in net unrealized gain on securities | 655 |
| (3 | ) | (1,091 | ) | (2,180 | ) | 655 |
| (3 | ) |
| Changes in OTTI losses recognized in other comprehensive income | — |
| 4 |
| (2 | ) | (1 | ) | — |
| 4 |
|
| Changes in net gain on cash flow hedging instruments | (58 | ) | (54 | ) | (20 | ) | (25 | ) | (58 | ) | (54 | ) |
| Changes in foreign currency translation adjustments | 28 |
| 61 |
| (47 | ) | (8 | ) | 28 |
| 61 |
|
| Changes in pension and other postretirement plan adjustments | 375 |
| (16 | ) | (97 | ) | (23 | ) | 375 |
| (16 | ) |
| OCI, net of tax | 1,000 |
| (8 | ) | (1,257 | ) | (2,237 | ) | 1,000 |
| (8 | ) |
| Comprehensive (loss) income | $ | (2,131 | ) | $ | 888 |
| $ | 425 |
| |
| Comprehensive income (loss) | | $ | (430 | ) | $ | (2,131 | ) | $ | 888 |
|
See Notes to Consolidated Financial Statements.
THE HARTFORD FINANCIAL SERVICES GROUP, INC.
Consolidated Balance Sheets
| | | | As of December 31, | As of December 31, |
| (In millions, except for share and per share data) | 2017 | 2016 | 2018 | 2017 |
| Assets | | |
| Investments: | | |
| Fixed maturities, available-for-sale, at fair value (amortized cost of $35,612 and $31,296) | $ | 36,964 |
| $ | 32,182 |
| |
| Fixed maturities, available-for-sale, at fair value (amortized cost of $35,603 and $35,612) | | $ | 35,652 |
| $ | 36,964 |
|
| Fixed maturities, at fair value using the fair value option | 41 |
| 211 |
| 22 |
| 41 |
|
| Equity securities, available-for-sale, at fair value (cost of $907 and $878) | 1,012 |
| 945 |
| |
| Mortgage loans (net of allowances for loan losses of $1 and $0) | 3,175 |
| 2,886 |
| |
| Equity securities, at fair value | | 1,214 |
| — |
|
| Equity securities, available-for-sale, at fair value (cost of $0 and $907) | | — |
| 1,012 |
|
| Mortgage loans (net of allowances for loan losses of $1 and $1) | | 3,704 |
| 3,175 |
|
| Limited partnerships and other alternative investments | 1,588 |
| 1,527 |
| 1,723 |
| 1,588 |
|
| Other investments | 96 |
| 111 |
| 192 |
| 96 |
|
| Short-term investments | 2,270 |
| 1,895 |
| 4,283 |
| 2,270 |
|
| Total investments | 45,146 |
| 39,757 |
| 46,790 |
| 45,146 |
|
| Cash (includes variable interest entity assets, at fair value, of $0 and $5) | 180 |
| 328 |
| |
| Cash | | 121 |
| 180 |
|
| Premiums receivable and agents’ balances, net | 3,910 |
| 3,730 |
| 3,995 |
| 3,910 |
|
| Reinsurance recoverables, net | 4,061 |
| 3,659 |
| 4,357 |
| 4,061 |
|
| Deferred policy acquisition costs | 650 |
| 645 |
| 670 |
| 650 |
|
| Deferred income taxes, net | 1,164 |
| 2,999 |
| 1,248 |
| 1,164 |
|
| Goodwill | 1,290 |
| 567 |
| 1,290 |
| 1,290 |
|
| Property and equipment, net | 1,034 |
| 991 |
| 1,006 |
| 1,034 |
|
| Other intangible assets | 659 |
| 44 |
| |
| Other intangible assets, net | | 657 |
| 659 |
|
| Other assets | 2,230 |
| 2,836 |
| 2,173 |
| 2,230 |
|
| Assets held for sale | 164,936 |
| 169,020 |
| — |
| 164,936 |
|
| Total assets | $ | 225,260 |
| $ | 224,576 |
| $ | 62,307 |
| $ | 225,260 |
|
| Liabilities | |
| |
| |
| |
|
| Unpaid losses and loss adjustment expenses | $ | 32,287 |
| $ | 28,317 |
| $ | 33,029 |
| $ | 32,287 |
|
| Reserve for future policy benefits | 713 |
| 322 |
| 642 |
| 713 |
|
| Other policyholder funds and benefits payable | 816 |
| 602 |
| 767 |
| 816 |
|
| Unearned premiums | 5,322 |
| 5,392 |
| 5,282 |
| 5,322 |
|
| Short-term debt | 320 |
| 416 |
| 413 |
| 320 |
|
| Long-term debt | 4,678 |
| 4,494 |
| 4,265 |
| 4,678 |
|
| Other liabilities (includes variable interest entity liabilities of $0 and $5) | 5,188 |
| 4,596 |
| |
| Other liabilities | | 4,808 |
| 5,188 |
|
| Liabilities held for sale | 162,442 |
| 163,534 |
| — |
| 162,442 |
|
| Total liabilities | 211,766 |
| 207,673 |
| 49,206 |
| 211,766 |
|
| Commitments and Contingencies (Note 14) |
|
|
|
|
|
|
|
|
| Stockholders’ Equity | |
| |
| |
| |
|
| Common stock, $0.01 par value — 1,500,000,000 shares authorized, 384,923,222 and 402,923,222 shares issued | 4 |
| 4 |
| |
| Preferred stock, $0.01 par value — 50,000,000 shares authorized, 13,800 shares issued as of December 31, 2018, aggregate liquidation preference of $345 | | 334 |
| — |
|
| Common stock, $0.01 par value — 1,500,000,000 shares authorized, 384,923,222 shares issued at December 31, 2018 and December 31, 2017 | | 4 |
| 4 |
|
| Additional paid-in capital | 4,379 |
| 5,247 |
| 4,378 |
| 4,379 |
|
| Retained earnings | 9,642 |
| 13,114 |
| 11,055 |
| 9,642 |
|
| Treasury stock, at cost — 28,088,186 and 28,974,069 shares | (1,194 | ) | (1,125 | ) | |
| Treasury stock, at cost — 25,772,238 and 28,088,186 shares | | (1,091 | ) | (1,194 | ) |
| Accumulated other comprehensive income (loss), net of tax | 663 |
| (337 | ) | (1,579 | ) | 663 |
|
| Total stockholders' equity | 13,494 |
| 16,903 |
| 13,101 |
| 13,494 |
|
| Total liabilities and stockholders’ equity | $ | 225,260 |
| $ | 224,576 |
| $ | 62,307 |
| $ | 225,260 |
|
See Notes to Consolidated Financial Statements.
THE HARTFORD FINANCIAL SERVICES GROUP, INC.
Consolidated Statements of Changes in Stockholders' Equity
| | | | For the years ended December 31, | For the years ended December 31, |
| (In millions, except for share data) | 2017 | 2016 | 2015 | 2018 | 2017 | 2016 |
| Preferred Stock | |
|
|
|
|
|
|
| Preferred Stock, beginning of period | | $ | — |
| $ | — |
| $ | — |
|
| Issuance of preferred stock | | 334 |
| — |
| — |
|
| Preferred Stock, end of period | | 334 |
| — |
| — |
|
| Common Stock | $ | 4 |
| $ | 4 |
| $ | 5 |
| 4 |
| 4 |
| 4 |
|
| Additional Paid-in Capital | |
|
|
|
|
|
|
| Additional Paid-in Capital, beginning of period | 5,247 |
| 8,973 |
| 9,123 |
| 4,379 |
| 5,247 |
| 8,973 |
|
| Issuance of shares under incentive and stock compensation plans | (76 | ) | (143 | ) | (165 | ) | (110 | ) | (76 | ) | (143 | ) |
| Stock-based compensation plans expense | 104 |
| 74 |
| 78 |
| 123 |
| 104 |
| 74 |
|
| Tax benefit on employee stock options and share-based awards | — |
| 5 |
| 27 |
| — |
| — |
| 5 |
|
| Issuance of shares for warrant exercise | (67 | ) | (16 | ) | (90 | ) | (14 | ) | (67 | ) | (16 | ) |
| Treasury stock retired | (829 | ) | (3,646 | ) | — |
| — |
| (829 | ) | (3,646 | ) |
| Additional Paid-in Capital, end of period | 4,379 |
| 5,247 |
| 8,973 |
| 4,378 |
| 4,379 |
| 5,247 |
|
| Retained Earnings | |
|
|
|
|
|
|
| Retained Earnings, beginning of period | 13,114 |
| 12,550 |
| 11,191 |
| 9,642 |
| 13,114 |
| 12,550 |
|
| Net (loss) income | (3,131 | ) | 896 |
| 1,682 |
| |
| Cumulative effect of accounting changes, net of tax | | 5 |
| — |
| — |
|
| Adjusted balance beginning of period | | 9,647 |
| 13,114 |
| 12,550 |
|
| Net income (loss) | | 1,807 |
| (3,131 | ) | 896 |
|
| Dividends declared on preferred stock | | (6 | ) | — |
| — |
|
| Dividends declared on common stock | (341 | ) | (332 | ) | (323 | ) | (393 | ) | (341 | ) | (332 | ) |
| Retained Earnings, end of period | 9,642 |
| 13,114 |
| 12,550 |
| 11,055 |
| 9,642 |
| 13,114 |
|
| Treasury Stock, at cost | |
|
|
|
|
|
|
| Treasury Stock, at cost, beginning of period | (1,125 | ) | (3,557 | ) | (2,527 | ) | (1,194 | ) | (1,125 | ) | (3,557 | ) |
| Treasury stock acquired | (1,028 | ) | (1,330 | ) | (1,250 | ) | — |
| (1,028 | ) | (1,330 | ) |
| Treasury stock retired | 829 |
| 3,647 |
| — |
| — |
| 829 |
| 3,647 |
|
| Issuance of shares under incentive and stock compensation plans | 100 |
| 153 |
| 184 |
| 132 |
| 100 |
| 153 |
|
| Net shares acquired related to employee incentive and stock compensation plans | (37 | ) | (54 | ) | (54 | ) | (43 | ) | (37 | ) | (54 | ) |
| Issuance of shares for warrant exercise | 67 |
| 16 |
| 90 |
| 14 |
| 67 |
| 16 |
|
| Treasury Stock, at cost, end of period | (1,194 | ) | (1,125 | ) | (3,557 | ) | (1,091 | ) | (1,194 | ) | (1,125 | ) |
| Accumulated Other Comprehensive Income (Loss), net of tax | |
|
|
|
|
|
|
| Accumulated Other Comprehensive Income (Loss), net of tax, beginning of period | (337 | ) | (329 | ) | 928 |
| 663 |
| (337 | ) | (329 | ) |
| Cumulative effect of accounting changes, net of tax | | (5 | ) | — |
| — |
|
| Adjusted balance beginning of period | | 658 |
| (337 | ) | (329 | ) |
| Total other comprehensive income (loss) | 1,000 |
| (8 | ) | (1,257 | ) | (2,237 | ) | 1,000 |
| (8 | ) |
| Accumulated Other Comprehensive Income (Loss), net of tax, end of period | 663 |
| (337 | ) | (329 | ) | |
| Accumulated Other Comprehensive (Loss) Income, net of tax, end of period | | (1,579 | ) | 663 |
| (337 | ) |
| Total Stockholders’ Equity | $ | 13,494 |
| $ | 16,903 |
| $ | 17,642 |
| $ | 13,101 |
| $ | 13,494 |
| $ | 16,903 |
|
| | |
|
|
|
|
|
|
| Preferred Shares Outstanding | |
|
|
|
|
|
|
| Preferred Shares Outstanding, beginning of period | | — |
| — |
| — |
|
| Issuance of preferred shares | | 13,800 |
| — |
| — |
|
| Preferred Shares Outstanding, end of period | | 13,800 |
| — |
| — |
|
| Common Shares Outstanding | |
|
|
|
|
|
|
| Common Shares Outstanding, beginning of period (in thousands) | 373,949 |
| 401,821 |
| 424,416 |
| 356,835 |
| 373,949 |
| 401,821 |
|
| Treasury stock acquired | (20,218 | ) | (30,782 | ) | (28,431 | ) | — |
| (20,218 | ) | (30,782 | ) |
| Issuance of shares under incentive and stock compensation plans | 2,301 |
| 3,766 |
| 4,877 |
| 2,856 |
| 2,301 |
| 3,766 |
|
| Return of shares under incentive and stock compensation plans to treasury stock | (747 | ) | (1,243 | ) | (1,311 | ) | (849 | ) | (747 | ) | (1,243 | ) |
| Issuance of shares for warrant exercise | 1,550 |
| 387 |
| 2,270 |
| 309 |
| 1,550 |
| 387 |
|
| Common Shares Outstanding, end of period | 356,835 |
| 373,949 |
| 401,821 |
| 359,151 |
| 356,835 |
| 373,949 |
|
| Cash dividends declared per common share | | $ | 1.10 |
| $ | 0.94 |
| $ | 0.86 |
|
See Notes to Consolidated Financial Statements.
THE HARTFORD FINANCIAL SERVICES GROUP, INC.
Consolidated Statements of Cash Flows
| | | | For the years ended December 31, | For the years ended December 31, |
| (In millions) | 2017 | 2016 | 2015 | 2018 | 2017 | 2016 |
| Operating Activities | | |
| |
| |
|
| Net income (loss) | $ | (3,131 | ) | $ | 896 |
| $ | 1,682 |
| $ | 1,807 |
| $ | (3,131 | ) | $ | 896 |
|
| Adjustments to reconcile net income (loss) to net cash provided by operating activities | |
| |
| |
| |
| |
| |
|
| Net realized capital (gains) losses | (111 | ) | 187 |
| 156 |
| |
| Net realized capital losses (gains) | | 165 |
| (111 | ) | 187 |
|
| Amortization of deferred policy acquisition costs | 1,417 |
| 1,523 |
| 1,502 |
| 1,442 |
| 1,417 |
| 1,523 |
|
| Additions to deferred policy acquisition costs | (1,383 | ) | (1,390 | ) | (1,390 | ) | (1,404 | ) | (1,383 | ) | (1,390 | ) |
| Depreciation and amortization | 399 |
| 398 |
| 373 |
| 467 |
| 399 |
| 398 |
|
| Pension settlement expense | 747 |
| — |
| — |
| — |
| 747 |
| — |
|
| Loss on extinguishment of debt | — |
| — |
| 21 |
| 6 |
| — |
| — |
|
| Loss (gain) on sale of business | 3,257 |
| 81 |
| (6 | ) | (202 | ) | 3,257 |
| 81 |
|
| Other operating activities, net | 408 |
| 178 |
| 153 |
| 408 |
| 408 |
| 178 |
|
| Change in assets and liabilities: | | |
| (Increase) decrease in reinsurance recoverables | (935 | ) | 272 |
| 176 |
| |
| Decrease (increase) in reinsurance recoverables | | (323 | ) | (935 | ) | 272 |
|
| Increase (decrease) in accrued and deferred income taxes | 170 |
| (250 | ) | 363 |
| (103 | ) | 170 |
| (250 | ) |
| Impact of tax reform on accrued and deferred income taxes | 877 |
| — |
| — |
| — |
| 877 |
| — |
|
| Increase in unpaid losses and loss adjustment expenses, reserve for future policy benefits, and unearned premiums | 1,648 |
| 322 |
| 275 |
| |
| Increase (decrease) in insurance liabilities | | 493 |
| 1,648 |
| 322 |
|
| Net change in other assets and other liabilities | (1,177 | ) | (151 | ) | (549 | ) | 87 |
| (1,177 | ) | (151 | ) |
| Net cash provided by operating activities | 2,186 |
| 2,066 |
| 2,756 |
| 2,843 |
| 2,186 |
| 2,066 |
|
| Investing Activities | |
| |
| |
| |
| |
| |
|
| Proceeds from the sale/maturity/prepayment of: | |
| |
| |
| |
| |
| |
|
| Fixed maturities, available-for-sale | 31,646 |
| 24,486 |
| 25,946 |
| 24,700 |
| 31,646 |
| 24,486 |
|
| Fixed maturities, fair value option | 148 |
| 238 |
| 181 |
| 23 |
| 148 |
| 238 |
|
| Equity securities at fair value | | 1,230 |
| — |
| — |
|
| Equity securities, available-for-sale | 810 |
| 709 |
| 1,319 |
| — |
| 810 |
| 709 |
|
| Mortgage loans | 734 |
| 647 |
| 792 |
| 483 |
| 734 |
| 647 |
|
| Partnerships | 274 |
| 779 |
| 624 |
| 433 |
| 274 |
| 779 |
|
| Payments for the purchase of: | |
| |
| |
| |
| |
| |
|
| Fixed maturities, available-for-sale | (30,923 | ) | (21,844 | ) | (27,744 | ) | (23,173 | ) | (30,923 | ) | (21,844 | ) |
| Fixed maturities, fair value option | — |
| (94 | ) | (251 | ) | — |
| — |
| (94 | ) |
| Equity securities at fair value | | (1,500 | ) | — |
| — |
|
| Equity securities, available-for-sale | (638 | ) | (662 | ) | (1,454 | ) | — |
| (638 | ) | (662 | ) |
| Mortgage loans | (1,096 | ) | (717 | ) | (870 | ) | (983 | ) | (1,096 | ) | (717 | ) |
| Partnerships | (509 | ) | (441 | ) | (620 | ) | (481 | ) | (509 | ) | (441 | ) |
| Net payments for derivatives | (314 | ) | (247 | ) | (173 | ) | (224 | ) | (314 | ) | (247 | ) |
| Net additions to property and equipment | (250 | ) | (224 | ) | (307 | ) | (122 | ) | (250 | ) | (224 | ) |
| Net (payments for) proceeds from short-term investments | (144 | ) | (1,377 | ) | 3,071 |
| |
| Net (payments for) short-term investments | | (3,460 | ) | (144 | ) | (1,377 | ) |
| Other investing activities, net | 21 |
| (129 | ) | (29 | ) | (3 | ) | 21 |
| (129 | ) |
| Proceeds from businesses sold, net of cash transferred | 222 |
| — |
| — |
| 1,115 |
| 222 |
| — |
|
| Amounts paid for business acquired, net of cash acquired | (1,423 | ) | (175 | ) | — |
| — |
| (1,423 | ) | (175 | ) |
| Net cash (used for) provided by investing activities | (1,442 | ) | 949 |
| 485 |
| |
| Net cash provided by (used for) investing activities | | (1,962 | ) | (1,442 | ) | 949 |
|
| Financing Activities | |
| |
| |
| |
| |
| |
|
| Deposits and other additions to investment and universal life-type contracts | 4,602 |
| 4,186 |
| 4,718 |
| 1,814 |
| 4,602 |
| 4,186 |
|
| Withdrawals and other deductions from investment and universal life-type contracts | (13,562 | ) | (14,790 | ) | (17,085 | ) | (9,210 | ) | (13,562 | ) | (14,790 | ) |
| Net transfers from separate accounts related to investment and universal life-type contracts | 7,969 |
| 9,822 |
| 11,046 |
| 6,949 |
| 7,969 |
| 9,822 |
|
| Repayments at maturity or settlement of consumer notes | (13 | ) | (17 | ) | (33 | ) | (2 | ) | (13 | ) | (17 | ) |
| Net increase in securities loaned or sold under agreements to repurchase | 1,320 |
| 188 |
| 507 |
| |
| Net increase (decrease) in securities loaned or sold under agreements to repurchase | | (621 | ) | 1,320 |
| 188 |
|
| Repayment of debt | (416 | ) | (275 | ) | (773 | ) | (826 | ) | (416 | ) | (275 | ) |
| Proceeds from the issuance of debt | 500 |
| — |
| — |
| 490 |
| 500 |
| — |
|
| Net (return) issuance of shares under incentive and stock compensation plans | (10 | ) | 9 |
| 42 |
| |
| Preferred stock issued, net of issuance costs | | 334 |
| — |
| — |
|
| Net issuance (return) of shares under incentive and stock compensation plans | | (16 | ) | (10 | ) | 9 |
|
| Treasury stock acquired | (1,028 | ) | (1,330 | ) | (1,250 | ) | — |
| (1,028 | ) | (1,330 | ) |
| Dividends paid on common stock | (341 | ) | (334 | ) | (316 | ) | (379 | ) | (341 | ) | (334 | ) |
| Net cash used for financing activities | (979 | ) | (2,541 | ) | (3,144 | ) | (1,467 | ) | (979 | ) | (2,541 | ) |
| Foreign exchange rate effect on cash | 70 |
| (40 | ) | (48 | ) | (10 | ) | 70 |
| (40 | ) |
| Net (decrease) increase in cash, including cash classified as assets held for sale | (165 | ) | 434 |
| 49 |
| |
| Less: Net (decrease) increase in cash classified as assets held for sale | (17 | ) | 249 |
| 47 |
| |
| Net (decrease) increase in cash | (148 | ) | 185 |
| 2 |
| |
| Net increase (decrease) in cash, including cash classified as assets held for sale | | (596 | ) | (165 | ) | 434 |
|
| Less: Net increase (decrease) in cash classified as assets held for sale | | (537 | ) | (17 | ) | 249 |
|
| Net increase (decrease) in cash | | (59 | ) | (148 | ) | 185 |
|
| Cash — beginning of period | 328 |
| 143 |
| 141 |
| 180 |
| 328 |
| 143 |
|
| Cash — end of period | $ | 180 |
| $ | 328 |
| $ | 143 |
| $ | 121 |
| $ | 180 |
| $ | 328 |
|
| Supplemental Disclosure of Cash Flow Information | |
| |
| |
| |
| |
| |
|
| Income tax received (paid) | $ | 6 |
| $ | (130 | ) | $ | 80 |
| $ | 9 |
| $ | 6 |
| $ | (130 | ) |
| Interest paid | $ | 322 |
| $ | 336 |
| $ | 361 |
| $ | 292 |
| $ | 322 |
| $ | 336 |
|
See Notes to Consolidated Financial Statements.
THE HARTFORD FINANCIAL SERVICES GROUP, INC.
NOTES TO CONSOLIDATED FINANCIAL STATEMENTS
(Dollar amounts in millions, except for per share data, unless otherwise stated)
1. Basis of Presentation and Significant Accounting Policies
Basis of Presentation1. BASIS OF PRESENTATION AND SIGNIFICANT ACCOUNTING POLICIES
The Hartford Financial Services Group, Inc. is a holding company for insurance and financial services subsidiaries that provide property and casualty insurance, group life and disability products and mutual funds and exchange-traded products to individual and business customers in the United States (collectively, “The Hartford”, the “Company”, “we” or “our”).
On December 3, 2017,August 22, 2018, the Company announced it entered into a definitive agreement to acquire all outstanding common shares of The Navigators Group, Inc. ("Navigators Group"), a global specialty underwriter, for $70 a share, or $2.1 billion in cash. The transaction is expected to close in late March or April 2019, subject to customary closing conditions, including receipt of regulatory approvals.
On May 31, 2018, Hartford Holdings, Inc., a wholly owned subsidiary of the Company, entered into a definitive agreement to sell allcompleted the sale of the issued and outstanding equity of Hartford Life, Inc. (“HLI”), a holding company, andfor its life and annuity operating subsidiaries.
On November 1, 2017, Hartford Life and Accident Insurance Company (HLA)("HLA"), a wholly owned subsidiary of the Company, completed the acquisition of Aetna's U.S. group life and disability business through a reinsurance transaction.
On May 10, 2017, the Company completed the sale of its United Kingdom ("U.K.") property and casualty run-off subsidiaries.
On July 29, 2016, the Company completed the acquisition of Northern Homelands Company, the holding company of Maxum Specialty Insurance Group (collectively "Maxum"). On July 29, 2016, the Company completed the acquisition of Lattice Strategies LLC ("Lattice").
For further discussion of these transactions, see Note 2 - Business Acquisitions and Note 20 - Business Dispositions and Discontinued Operations of Notes to Consolidated Financial Statements.
The Consolidated Financial Statements have been prepared in accordance with accounting principles generally accepted in the United States of America (“U.S. GAAP”) which differ materially from the accounting practices prescribed by various insurance regulatory authorities.
Consolidation
The Consolidated Financial Statements include the accounts of The Hartford Financial Services Group, Inc., and entities in which the Company directly or indirectly has a controlling financial interest. Entities in which the Company has significant influence over the operating and financing decisions but does not control are reported using the equity method. All intercompany transactions and balances between The Hartford and its subsidiaries and affiliates that are not held for sale have been eliminated .eliminated.
Discontinued Operations
The results of operations of a component of the Company are reported in discontinued operations when certain criteria are met as of the date of disposal, or earlier if classified as held-for-sale. When a component is identified for discontinued operations reporting, amounts for prior periods are retrospectively reclassified as discontinued operations. Components are identified as discontinued operations if they are a major part of an entity's operations and financial results such as a separate major
line of business or a separate major geographical area of operations.
Use of Estimates
The preparation of financial statements in conformity with U.S. GAAP requires management to make estimates and assumptions that affect the reported amounts of assets and liabilities and the disclosure of contingent assets and liabilities at the date of the financial statements and the reported amounts of revenues and expenses during the reporting period. Actual results could differ from those estimates.
The most significant estimates include those used in determining property and casualty and group long-term disability insurance product reserves, net of reinsurance; evaluation of goodwill for impairment; valuation of investments and derivative instruments; valuation allowance on deferred tax assets; and contingencies relating to corporate litigation and regulatory matters.
Reclassifications
Certain reclassifications have been made to prior year financial information to conform to the current year presentation. In particular:
With respect toDistribution costs within the Consolidated Statement of Operations:
Billing installment feesHartford Funds segment that were previously reflected as an offset tonetted against fee income are presented gross in insurance operating costs and other expenses are now classified as fee income.
Flood servicing business has been realigned from specialty commercialexpenses. Refer to the "Revenue Recognition" passage within the Commercial Lines reporting segment to the Personal Lines reporting segment.
Amortization"Adoption of other intangible assets has been reclassified out of insurance operating costs and other expenses.
With respect to the Consolidated Balance Sheets:
Assets and liabilities associated with the Company's life and annuity run-off business are now classified as assets and liabilities heldNew Accounting Standards" section below for sale.further information.
Unpaid losses and loss adjustment expenses and reinsurance recoverables for structured settlements reserves and recoverables due from the Company's life and annuity run-off business now classified as held for sale have been reclassified into the Company's P&C commercial lines business. Annuities purchased from the Company's life and annuity run-off business are recognized as reinsurance recoverables in cases where the Company has not obtained a release from the claimant. These amounts were previously eliminated in consolidation.
Policy loans have been reclassified to other investments.
Other intangible assets have been reclassified out of other assets.
THE HARTFORD FINANCIAL SERVICES GROUP, INC.
NOTES TO CONSOLIDATED FINANCIAL STATEMENTS (continued)
1. Basis of Presentation and Significant Accounting Policies (continued)
Adoption of New Accounting Standards
Stock Compensation
On January 1, 2017 the Company adopted new stock compensation guidance issued by the Financial Accounting Standards Board ("FASB") on a prospective basis. The updated guidance requires the excess tax benefit or tax deficiency on vesting or settlement of stock-based awards to be recognized in earnings as an income tax benefit or expense, respectively, instead of as an adjustment to additional paid-in capital. The new guidance also requires the related cash flows to be presented in operating activities instead of in financing activities. The amount of excess tax benefit or tax deficiency realized on vesting or
THE HARTFORD FINANCIAL SERVICES GROUP, INC.
NOTES TO CONSOLIDATED FINANCIAL STATEMENTS (continued)
settlement of awards depends upon the difference between the market value of awards at vesting or settlement and the grant date fair value recognized through compensation expense. The excess tax benefit or tax deficiency is a discrete item in the reporting period in which it occurs and is not considered in determining the annual estimated effective tax rate for interim reporting. The excess tax benefit recognized in earnings for the year ended December 31, 2018 and 2017 was $5 and $15, respectively, and the excess tax benefit recognized in additional paid-in capital for the yearsyear ended December 31, 2016 and 2015 was $5 and $27, respectively.
Future Adoption of New Accounting Standards$5.
Reclassification of Effect of Tax Rate Change from AOCI to Retained Earnings
In February,On January 1, 2018, the FASB issuedCompany adopted the FASB's new accounting guidance for the effect on deferred tax assets and liabilities related to items recorded in accumulated other comprehensive income ("AOCI") resulting from legislated tax reformthe Tax Cuts and Jobs Act of 2017 ("Tax Reform") enacted on December 22, 2017. The tax reformTax Reform reduced the federal tax rate applied to the Company’s deferred tax balances from 35% to 21% on enactment. Under U.S. GAAP, the Company recorded the total effect of the change in enacted tax rates on deferred tax balances in theas a charge to income tax expense componentwithin net income during the fourth quarter of net income.2017, including the change in deferred tax balances related to components of AOCI. The new accounting guidance permitspermitted the Company to reclassify the “stranded” tax effects out of AOCI and into retained earnings that resulted from recording the tax effects of unrealized investment gains, unrecognized actuarial losses on pension and other postretirement benefit plans, and cumulative translation adjustments at a 35% tax rate because the 14 point reduction in tax rate was recognized in net income instead of other comprehensive income. TheOn adoption, the Company will adopt the new guidance asrecorded a reclassification of January 1, 2018.$88 from AOCI to retained earnings. As a result of the reclassification, on January 1,in the first quarter of 2018, the Company will reducereduced the estimated loss on sale recorded in income from discontinued operations by $193, net of tax, for the increase in AOCI related to the assets held for sale. The reduction in the loss on sale will resultresulted in a corresponding increase in assets held for sale and AOCI as of January 1, 2018 and the AOCI associated with assets held for sale will bewas removed from the balance sheet when the sale closes.
closed on May 31, 2018. Additionally, as of January 1, 2018, the Company will reclassifyreclassified $105 of stranded tax effects related to continuing operations which will have the effect of reducingreduced AOCI and increasingincreased retained earnings.
Hedging Activities
The FASB issued updated guidance on hedge accounting. The updates allow hedge accounting for new types of interest rate hedges of financial instruments and simplify documentation requirements to qualify for hedge accounting. In addition, any gain or loss from hedge ineffectiveness will be reported in the same income statement line with the effective hedge results and the hedged transaction. For cash flow hedges, the ineffectiveness will be recognized in earnings only when the hedged transaction affects earnings; otherwise, the ineffectiveness gains or losses will remain in AOCI. Under current accounting, total hedge ineffectiveness is reported separately in realized gains and losses apart from the hedged transaction. The updated guidance is effective January 1, 2019 through a cumulative effect adjustment that will reclassify cumulative ineffectiveness on open cash flow hedges from retained earnings to AOCI. Early adoption is permitted as of the beginning of a year. The Company has not yet determined the timing for adoption or estimated the effect on the Company’s financial statements.
Goodwill
The FASB issued updated guidance on testing goodwill for impairment. The updated guidance requires recognition and measurement of goodwill impairment based on the excess of the carrying value of the reporting unit compared to its estimated fair value, with the amount of the impairment not to exceed the carrying value of the reporting unit’s goodwill. Under existing guidance, if the reporting unit’s carrying value exceeds its estimated fair value, the Company allocates the fair value of the reporting unit to all of the assets and liabilities of the reporting unit to determine an implied goodwill value. An impairment loss is then recognized for the excess, if any, of the carrying value of the reporting unit’s goodwill compared to the implied goodwill value. The Company expects to adopt the updated guidance January 1, 2020 on a prospective basis as required, although earlier adoption is permitted. While the Company would not have recognized a goodwill impairment loss for the years presented, the impact of the adoption will depend on the estimated fair value of the Company’s reporting units compared to the carrying value at adoption.
Financial Instruments - Credit Losses
The FASB issued updated guidance for recognition and measurement of credit losses on financial instruments. The new guidance will replace the “incurred loss” approach with an “expected loss” model for recognizing credit losses for instruments carried at other than fair value, which will initially result in the recognition of greater allowances for losses. The allowance will be an estimate of credit losses expected over the life of debt instruments, such as mortgage loans, reinsurance recoverables and receivables. Credit losses on fixed maturities available-for-sale (“AFS”) carried at fair value will continue to be measured like other-than-temporary impairments ("OTTI"); however, the losses will be recognized through an allowance and no longer as an adjustment to the cost basis. Recoveries of OTTI
THE HARTFORD FINANCIAL SERVICES GROUP, INC.
NOTES TO CONSOLIDATED FINANCIAL STATEMENTS (continued)
1. Basis of Presentation and Significant Accounting Policies (continued)
will be recognized as reversals of valuation allowances and no longer accreted as investment income through an adjustment to the investment yield. The allowance on fixed maturities AFS cannot cause the net carrying value to be below fair value and, therefore, it is possible that future increases in fair value due to decreases in market interest rates could cause the reversal of a valuation allowance and increase net income. The new guidance also requires purchased financial assets with a more-than-insignificant amount of credit deterioration since original issuance to be recorded based on contractual amounts due and an initial allowance recorded at the date of purchase. The guidance is effective January 1, 2020, through a cumulative-effect adjustment to retained earnings for the change in the allowance for credit losses for debt instruments carried at other than fair value. No allowance will be recognized at adoption for fixed maturities AFS; rather, their cost basis will be evaluated for an allowance for credit losses prospectively. The Company expects to adopt the updated guidance January 1, 2020, as required, although earlier adoption is permitted as of January 1, 2019. The Company has not yet determined the effect on the Company’s consolidated financial statements and the ultimate impact of the adoption will depend on the composition of the debt instruments and market conditions at the adoption date. Significant implementation matters yet to be addressed include estimating lifetime expected losses on debt instruments carried at other than fair value, determining the impact of valuation allowances on net investment income from fixed maturities AFS, updating our investment accounting system functionality to maintain adjustable valuation allowance on fixed maturities, AFS, subject to a fair value floor, and developing a detailed implementation plan.
Leases
The FASB issued updated guidance on lease accounting. Under the new guidance, lessees with operating leases will be required to recognize a liability for the present value of future minimum lease payments with a corresponding asset for the right of use of the property. Under existing guidance, future minimum lease payments on operating leases are commitments that are not recognized as liabilities on the balance sheet. The updated guidance is to be adopted effective January 1, 2019 through a cumulative effect adjustment to retained earnings for the earliest period presented, with early application permitted. Leases will be classified as financing or operating leases. Where the lease is economically similar to a purchase because The Hartford obtains control of the underlying asset, the lease will be a financing lease and the Company will recognize amortization of the right of use asset and interest expense on the liability. Where the lease provides The Hartford with only the right to control the use of the underlying asset over the lease term and the lease term is greater than one year, the lease will be an operating lease and the lease costs will be recognized as rental expense over the lease term on a straight-line basis. Leases with a term of one year or less will also be expensed over the lease term but will not be recognized on the balance sheet. The Company will adopt the new lease guidance effective January 1, 2019, and is currently evaluating the potential impact of the new guidance to the consolidated financial statements and the method of adoption. We do not expect a material impact to the consolidated financial statements; however, it is expected that assets and liabilities will increase
based on the present value of remaining lease payments for leases in place at the adoption date.
Financial Instruments- Recognition and Measurement
The FASB issuedOn January 1, 2018, the Company adopted updated guidance issued by the FASB for the recognition and measurement of
financial instruments.instruments through a cumulative effect adjustment to the opening balances of retained earnings and AOCI. The new guidance will requirerequires investments in equity securities to be measured at fair value with any changes in valuation reported in net income except for investments that are consolidated or are accounted for under the equity method of accounting. The new guidance will also requirerequires a deferred tax asset resulting from net unrealized losses on available-for-sale fixed maturities, available-for-sale that are recognized in AOCI to be evaluated for recoverability in combination with the Company’s other deferred tax assets. Under existingprior guidance, the Company measures investments inreported equity securities, AFSavailable-for-sale ("AFS"), at fair value with changes in fair value reported in other comprehensive income. As required, the Company will adopt the guidance effective January 1, 2018 through a cumulative effect adjustment to retained earnings. Early adoption is not allowed. The impact to the Company will be increased volatility in net income beginning in 2018. Any difference in the evaluation of deferred tax assets may also affect stockholders' equity. Cash flows will not be affected. The impact will depend on the composition of the Company’s investment portfolio in the future and changes in fair value of the Company’s investments. As of January 1, 2018, the Company will reclassifyreclassified from AOCI to retained earnings net unrealized gains of $83, after tax, related to equity securities AFS having a fair value of $1.0 billion. HadIn addition, $10 of net unrealized gains net of shadow DAC related to discontinued operations were reclassified from AOCI to retained earnings of the new accounting guidance beenlife and annuity business held for sale, which increased the estimated loss on sale in place since2018 by the beginning of 2017,same amount. Beginning in 2018, the Company would have recognized mark-to-market gains of $25 after-taxreports equity securities at fair value with changes in fair value reported in net income for the year ended December 31, 2017.realized capital gains and losses.
Revenue Recognition
The FASB issuedOn January 1, 2018, the Company adopted the FASB’s updated guidance for recognizing revenue. The guidancerevenue from contracts with customers, which excludes insurance contracts and financial instruments. Revenue issubject to bethe guidance is recognized when, or as, goods or services are transferred to customers in an amount that reflects the consideration that an entity is expected to receive in exchange for those goods or services, and this accountingservices. For all but certain revenues associated with our Hartford Funds business, the updated guidance is similar to current accountingconsistent with previous guidance for many transactions. Thisthe Company’s transactions and did not have an effect on the Company’s financial position, cash flows or net income. The updated guidance is effective retrospectively on January 1, 2018, with a choice of restating prior periods or recognizing a cumulative effectalso updated criteria for contracts in place as of the adoption date. Upon adoption on January 1, 2018,determining when the Company will present fee income withinacts as a principal or an agent. The Company determined that it is the Mutual Funds segment grossprincipal for some of relatedits mutual fund distribution costs that are currently netted against revenues. Distributionservice contracts and, upon adoption, reclassified distribution costs of $188 $184, and $190$184 for the years ended December 31, 2017, and 2016, and 2015, respectively, will be reclassified fromthat were previously netted against fee income to insurance operating costs and other expenses.
Information about the nature, amount, timing of recognition and cash flows for the Company’s revenues subject to the updated guidance follows.
THE HARTFORD FINANCIAL SERVICES GROUP, INC.
NOTES TO CONSOLIDATED FINANCIAL STATEMENTS (continued)
Revenue from Non-Insurance Contracts with Customers
|
| | | | | | | | | | |
| | | Year ended December 31, |
| | Revenue Line Item | 2018 | 2017 | 2016 |
| Commercial Lines | | | | |
| Installment billing fees | Fee income | $ | 34 |
| $ | 37 |
| $ | 39 |
|
| Personal Lines | | | | |
| Installment billing fees | Fee income | 40 |
| 44 |
| 39 |
|
| Insurance servicing revenues | Other revenues | 84 |
| 85 |
| 86 |
|
| Group Benefits | | | | |
| Administrative services | Fee income | 175 |
| 91 |
| 75 |
|
| Hartford Funds | | | | |
| Advisor, distribution and other management fees | Fee income | 947 |
| 897 |
| 797 |
|
| Other fees | Fee income | 85 |
| 95 |
| 88 |
|
| Corporate | | | | |
| Investment management and other fees | Fee income | 32 |
| 4 |
| 3 |
|
| Transition service revenues | Other revenues | 21 |
| — |
| — |
|
| Total revenues subject to updated guidance | | $ | 1,418 |
| $ | 1,253 |
| $ | 1,127 |
|
Installment fees are charged on property and casualty insurance contracts for billing the insurance customer in installments over the policy term. These fees are recognized in fee income as earned on collection.
Insurance servicing revenues within Personal Lines consist of up-front commissions earned for collecting premiums and processing claims on insurance policies for which The Hartford does not assume underwriting risk, predominantly related to the National Flood Insurance Plan program. These insurance servicing revenues are recognized over the period of the flood program's policy terms.
Group Benefits products earn fee income from employers for the administration of underwriting, implementation and claims processing for employer self-funded plans and for leave management services. Fees are recognized as services are provided and collected monthly.
Hartford Funds provides investment management, administrative and distribution services to mutual funds and exchange-traded products. The Company assesses investment advisory, distribution and other asset management fees primarily based on the average daily net asset values from mutual funds and exchange-traded products, which are recorded in the period in which the services are provided and collected monthly. Fluctuations in domestic and international markets and related investment performance, volume and mix of sales and redemptions of mutual funds or exchange-traded products, and other changes to the composition of assets under management are all factors that ultimately have a direct effect on fee income earned.
Hartford Funds other fees primarily include transfer agent fees, generally assessed as a charge per account, and are recognized as fee income in the period in which the services are provided with payments collected monthly.
Corporate investment management and other fees are primarily for managing third party invested assets, including management of the invested assets of Talcott Resolution Life, Inc. and its subsidiaries ("Talcott Resolution"). Talcott Resolution is the new
holding company of the life and annuity business the Company sold in May 2018. These fees, calculated based on the average quarterly net asset values, are recorded in the period in which the services are provided and are collected quarterly. Fluctuations in markets and interest rates and other changes to the composition of assets under management are all factors that ultimately have a direct effect on fee income earned.
Corporate transition service revenues consist of operational services provided to The Hartford’s former life and annuity business that will be provided for a period up to twenty-four months from the May 31, 2018 sale date. The transition service revenues are recognized as other revenues in the period in which the services are provided with payments collected monthly.
Future Adoption of New Accounting Standards
Hedging Activities
The FASB issued updated guidance on hedge accounting. The updates allow hedge accounting for new types of interest rate hedges of financial instruments and simplify documentation requirements to qualify for hedge accounting. In addition, any gain or loss from hedge ineffectiveness will be reported in the same income statement line with the effective hedge results and the hedged transaction. For cash flow hedges, the ineffectiveness will be recognized in earnings only when the hedged transaction affects earnings; otherwise, the ineffectiveness gains or losses will remain in AOCI. Under current accounting, total hedge ineffectiveness is reported separately in realized gains and losses apart from the hedged transaction. The Company will adopt the guidance effective January 1, 2019 through a cumulative effect adjustment of less than $1 to reclassify cumulative ineffectiveness on open cash flow hedges from retained earnings to AOCI. The adoption will not affect the Company’s financial position or cash flows or have a material effect on the Company’s financial position, cash flows or net income.
THE HARTFORD FINANCIAL SERVICES GROUP, INC.
NOTES TO CONSOLIDATED FINANCIAL STATEMENTS (continued)
1. Basis
Goodwill
The FASB issued updated guidance on testing goodwill for impairment. The updated guidance requires recognition and measurement of Presentationgoodwill impairment based on the excess of the carrying value of the reporting unit compared to its estimated fair value, with the amount of the impairment not to exceed the carrying value of the reporting unit’s goodwill. Under existing guidance, if the reporting unit’s carrying value exceeds its estimated fair value, the Company allocates the fair value of the reporting unit to all of the assets and liabilities of the reporting unit to determine an implied goodwill value. An impairment loss is then recognized for the excess, if any, of the carrying value of the reporting unit’s goodwill compared to the implied goodwill value. The Company expects to adopt the updated guidance January 1, 2020 on a prospective basis as required, although earlier adoption is permitted. While the Company would not have recognized a goodwill impairment loss for the years presented, the impact of the adoption will depend on the estimated fair value of the Company’s reporting units compared to the carrying value at adoption.
Financial Instruments - Credit Losses
The FASB issued updated guidance for recognition and measurement of credit losses on financial instruments. The new guidance will replace the “incurred loss” approach with an “expected loss” model for recognizing credit losses for financial instruments carried at other than fair value, which will initially result in the recognition of greater allowances for losses. The allowance will be an estimate of credit losses expected over the life of financial instruments carried at other than fair value, such as mortgage loans, reinsurance recoverables and receivables. Credit losses on fixed maturities AFS carried at fair value will continue to be measured like other-than-temporary impairments ("OTTI"); however, the losses will be recognized through an allowance and no longer as an adjustment to the cost basis. Recoveries of impairments on fixed maturities AFS will be recognized as reversals of valuation allowances and no longer accreted as investment income through an adjustment to the investment yield. The allowance on fixed maturities AFS cannot cause the net carrying value to be below fair value and, therefore, it is possible that future increases in fair value due to decreases in market interest rates could cause the reversal of a valuation allowance and increase net income. The new guidance also requires purchased financial assets with a more-than-insignificant amount of credit deterioration since original issuance to be recorded based on contractual amounts due and an initial allowance recorded at the date of purchase. The Company will adopt the guidance effective January 1, 2020, through a cumulative-effect adjustment to retained earnings for the change in the allowance for credit losses for financial instruments carried at other than fair value. No allowance will be recognized at adoption for fixed maturities AFS; rather, their cost basis will be evaluated for an allowance for credit losses prospectively. The Company has not yet determined the effect on the Company’s consolidated financial statements and the ultimate impact of the adoption will depend on the composition of the financial instruments and market conditions at the adoption date. Significant Accounting Policies (continued)implementation matters yet to be addressed include estimating lifetime expected losses on financial instruments carried at other than fair value, determining the impact of valuation allowances on net investment income from fixed maturities AFS, and updating our investment accounting system functionality to maintain
adjustable valuation allowances on fixed maturities AFS, subject to a fair value floor.
Leases
The FASB issued updated guidance on lease accounting. Under the new guidance, effective January 1, 2019, lessees with operating leases are required to recognize a liability for the present value of future minimum lease payments with a corresponding asset for the right of use of the property. Under guidance effective through December 31, 2018, future minimum lease payments on operating leases are commitments that are not recognized as liabilities on the balance sheet. Under the new guidance, leases will be classified as financing or operating leases. Where the lease is economically similar to a purchase because The Hartford obtains control of the underlying asset, the lease will be a financing lease and the Company will recognize amortization of the right of use asset and interest expense on the liability. Where the lease provides The Hartford with only the right to control the use of the underlying asset over the lease term and the lease term is greater than one year, the lease will be an operating lease and the lease costs will be recognized as rental expense over the lease term on a straight-line basis. Leases with a term of one year or less will also be expensed over the lease term but will not be recognized on the balance sheet. The Company will adopt the guidance as of the January 1, 2019, effective date with no change to comparative periods and record a lease payment obligation of approximately $160 for outstanding leases and a right of use asset of approximately $150, which is net of $10 in lease incentives received. The Hartford will elect to apply the package of practical expedients and not reassess expired or existing contracts that are or contain leases; all operating leases will remain classified as operating leases on adoption; and initial direct costs on existing leases will not be reassessed to determine if deferred costs should be written-off or recorded on adoption. The adoption will not impact net income or cash flows.
Reserve for Future Policy Benefits
The FASB issued new guidance on accounting for long-duration insurance contracts. The Company’s long-duration insurance contracts include paid-up life insurance and whole-life insurance policies resulting from conversion from group life policies and run-off structured settlement and terminal funding agreement liabilities with total future policy benefit reserves of $642 as of December 31, 2018. Under existing guidance, a reserve for future policy benefits is calculated as the present value of future benefits and related expenses less the present value of any future premiums using assumptions “locked in” at the time the policies were issued, including discount rate, lapse rate, mortality, and expense assumptions. Under existing guidance, assumptions are only updated if there is an expected premium deficiency. The new guidance will require that underlying cash flow assumptions (such as for lapse rate, mortality and expenses) be reviewed and updated at least annually in the same quarter each year. The new guidance also requires that the discount rate assumption be updated each quarter and be based on an upper-medium grade (low-credit-risk) fixed-income investment yield. The change in the reserve estimate as a result of updating cash flow assumptions will be recognized in net income. The change in the reserve estimate as a result of updating the discount rate assumption will be recognized in other comprehensive income. Because reserves will be based on updated assumptions and no longer locked in at contract inception, there will no longer be a test for premium deficiency. The new guidance will be effective January 1, 2021,
THE HARTFORD FINANCIAL SERVICES GROUP, INC.
NOTES TO CONSOLIDATED FINANCIAL STATEMENTS (continued)
and will be applied to balances in place as of the earliest period presented. Early adoption is permitted. The Company has not yet determined the method or timing for adoption or estimated the effect on the Company’s financial statements.
Significant Accounting Policies
The Company’s significant accounting policies are as follows:
Revenue Recognition
Property and casualty insurance premiums are earned on a pro rata basis over the policy period and include accruals for ultimate premium revenue anticipated under auditable and retrospectively rated policies. Unearned premiums represent the premiums applicable to the unexpired terms of policies in force. An estimated allowance for doubtful accounts is recorded on the basis of periodic evaluations of balances due from insureds, management’s experience and current economic conditions. The Company charges off any balances that are determined to be uncollectible. The allowance for doubtful accounts included in premiums receivable and agents’ balances in the Consolidated Balance Sheets was $132135 and $137 $132 as of December 31, 20172018 and 20162017, respectively.
Group life, disability and accident premiums are generally both due from policyholders and recognized as revenue on a pro rata basis over the period of the contracts.
The Company provides investment management, administrative and distribution services to mutual funds and exchange-traded products. The Company earns fees, primarily based on the average daily net asset valuesRevenue from non-insurance contracts with customers is discussed above in "Adoption of the mutual funds and exchange-traded products, which are recorded as fee income in the period in which the services are provided. Commission fees are based on the sale proceeds and recognized at the time of the transaction. Transfer agent fees are assessed as a charge per account and recognized as fee income in the period in which the services are provided.
Other revenues primarily consists of servicing revenues which are recognized as services are performed.New Accounting Standards, Revenue Recognition."
Dividends to Policyholders
Policyholder dividends are paid to certain property and casualty policyholders. Policies that receive dividends are referred to as participating policies. Participating dividends to policyholders are accrued and reported in insurance operating costs and other expenses and other liabilities using an estimate of the amount to be paid based on underlying contractual obligations under policies and applicable state laws.
Net written premiums for participating property and casualty insurance policies represented 10%, 9%10% and 10%9% of total net written premiums for the years ended December 31, 20172018, 20162017 and 20152016, respectively. Participating dividends to property and casualty policyholders were $23, $35 $15 and $17$15 for the years ended December 31, 20172018, 20162017 and 20152016, respectively.
There were no additional amounts of income allocated to participating policyholders.
Investments
Overview
The Company’s investments in fixed maturities include bonds, structured securities, redeemable preferred stock and commercial paper. Most of these investments along with certain equity securities, which include common and non-redeemable
preferred stocks, are classified as available-for-sale ("AFS") and are carried at fair value. The after-taxafter tax difference between fair value and cost or amortized cost is reflected in stockholders’ equity as a component of AOCI. Effective January 1, 2018, equity securities will beare measured at fair value with any changes in valuation reported in net income. For further information, see Financial Instruments - Recognition and Measurement discussion above. Fixed maturities for which the Company elected the fair value option are classified as FVO, generally certain securities that contain embedded credit
derivatives, and are carried at fair value with changes in value recorded in realized capital gains and losses. Mortgage loans are recorded at the outstanding principal balance adjusted for amortization of premiums or discounts and net of valuation allowances. Short-term investments are carried at amortized cost, which approximates fair value. Limited partnerships and other alternative investments are reported at their carrying value and are primarily accounted for under the equity method with the Company’s share of earnings included in net investment income. Recognition of income related to limited partnerships and other alternative investments is delayed due to the availability of the related financial information, as private equity and other funds are generally on a three-month delay and hedge funds on a one-month delay. Accordingly, income for the years ended December 31, 20172018, 20162017, and 20152016 may not include the full impact of current year changes in valuation of the underlying assets and liabilities of the funds, which are generally obtained from the limited partnerships and other alternative investments’ general partners.partnerships. Other investments primarily consist of investments of consolidated investment funds and derivative instruments which are carried at fair value. The Company has provided seed money for investment funds and reports the underlying investments at fair value with changes in the fair value recognized in income consistent with accounting requirements for investment companies.
Net Realized Capital Gains and Losses
Net realized capital gains and losses from investment sales are reported as a component of revenues and are determined on a specific identification basis. Net realized capital gains and losses also result from fair value changes in fixed maturities, andFVO, equity securities, FVO, and derivatives contracts (both free-standing and embedded) that do not qualify, or are not designated, as a hedge for accounting purposes as well as ineffectiveness on derivatives that qualify for hedge accounting treatment. Impairments and mortgage loan valuation allowances are recognized as net realized capital losses in accordance with the Company’s impairment and mortgage loan valuation allowance policies as discussed in Note 6 - Investments of Notes to Consolidated Financial Statements. Foreign currency transaction remeasurements are also included in net realized capital gains and losses.
Net Investment Income
Interest income from fixed maturities and mortgage loans is recognized when earned on the constant effective yield method based on estimated timing of cash flows. The amortization of premiumMost premiums and accretion of discount fordiscounts on fixed maturities also takes into considerationare amortized to the maturity date. Premiums on callable bonds may be amortized to call and maturity dates that produce the lowest yield.based on call prices. For securitized financial assets subject to prepayment risk, yields are recalculated and adjusted periodically to reflect historical and/or estimated future prepayments using the retrospective method; however, if these investments are impaired and for certain other asset-backed securities, any yield adjustments are made using the prospective method. Prepayment fees and make-whole payments on fixed maturities and mortgage loans are recorded in net investment income when earned. For
THE HARTFORD FINANCIAL SERVICES GROUP, INC.
NOTES TO CONSOLIDATED FINANCIAL STATEMENTS (continued)
1. Basis of Presentation and Significant Accounting Policies (continued)
equity securities, dividends are recognized as investment income on the ex-dividend date. Limited partnerships and other alternative investments primarily use the equity method of accounting to recognize the Company’s share of earnings; however, for a portion of those investments, the Company used investment fund accounting applied to a wholly-owned fund of funds which was liquidated during 2016.earnings. For impaired debt securities, the Company accretes the new cost basis to the estimated future cash flows over the expected remaining life of the security by prospectively adjusting the security’s yield, if necessary. The Company’s non-income
THE HARTFORD FINANCIAL SERVICES GROUP, INC.
NOTES TO CONSOLIDATED FINANCIAL STATEMENTS (continued)
producing investments were not material for the years ended December 31, 2018, 2017 2016 and 2015.2016.
Derivative Instruments
Overview
The Company utilizes a variety of over-the-counter ("OTC"), transactions derivatives, derivatives cleared through central clearing houses ("OTC-cleared") and exchange traded derivative instruments as part of its overall risk management strategy as well as to enter into replication transactions. The types of instruments may include swaps, caps, floors, forwards, futures and options to achieve one of four Company-approved objectives:
to hedge risk arising from interest rate, equity market, commodity market, credit spread and issuer default, price or currency exchange rate risk or volatility;
to manage liquidity;
to control transaction costs;
to enter into synthetic replication transactions.
Interest rate and credit default swaps involve the periodic exchange of cash flows with other parties, at specified intervals, calculated using agreed upon rates or other financial variables and notional principal amounts. Generally, little to no cash or principal payments are exchanged at the inception of the contract. Typically, at the time a swap is entered into, the cash flow streams exchanged by the counterparties are equal in value.
Interest rate cap and floor contracts entitle the purchaser to receive from the issuer at specified dates, the amount, if any, by which a specified market rate exceeds the cap strikeThe Company clears certain interest rate or falls belowswap and credit default swap derivative transactions through central clearing houses. OTC-cleared derivatives require initial collateral at the floor strike interest rate, applied to a notional principal amount. A premium payment determined at inception is made by the purchaser of the contracttrade in the form of cash or highly liquid securities, such as U.S. Treasuries and no principal paymentsgovernment agency investments. Central clearing houses also require additional cash as variation margin based on daily market value movements. For information on collateral, see the derivative collateral arrangements section in Note 7 - Derivatives of Notes to Consolidated Financial Statements. In addition, OTC-cleared transactions include price alignment amounts either received or paid on the variation margin, which are exchanged.reflected in realized capital gains and losses or, if characterized as interest, in net investment income.
Forward contracts are customized commitments that specify a rate of interest or currency exchange rate to be paid or received on an obligation beginning on a future start date and are typically settled in cash.
Financial futures are standardized commitments to either purchase or sell designated financial instruments, at a future date, for a specified price and may be settled in cash or through delivery of the underlying instrument. Futures contracts trade on organized exchanges. Margin requirements for futures are met by pledging securities or cash, and changes in the futures’ contract values are settled daily in cash.
Option contracts grant the purchaser, for a premium payment, the right to either purchase from or sell to the issuer a financial instrument at a specified price, within a specified period or on a stated date. The contracts may reference commodities, which grant the purchaser the right to either purchase from or sell to the issuer commodities at a specified price, within a specified period or on a stated date. Option contracts are typically settled in cash.
Foreign currency swaps exchange an initial principal amount in two currencies, agreeing to re-exchange the currencies at a future date, at an agreed upon exchange rate. There may also be a periodic exchange of payments at specified intervals calculated using the agreed upon rates and exchanged principal amounts.
The Company’s derivative transactions conducted in insurance company subsidiaries are used in strategies permitted under the derivative use plans required by the State of Connecticut, the State of Illinois and the State of New York insurance departments.
Accounting and Financial Statement Presentation of Derivative Instruments and Hedging Activities
Derivative instruments are recognized on the Consolidated Balance Sheets at fair value and are reported in Other Investments and Other Liabilities. For balance sheet presentation purposes, the Company has elected to offset the fair value amounts, income accruals, and related cash collateral receivables and payables of OTC derivative instruments executed in a legal entity and with the same counterparty or under a master netting agreement, which provides the Company with the legal right of offset.
The Company clears certain interest rate swap and credit default swap derivative transactions through central clearing houses. OTC-cleared derivatives require initial collateral at the inception of the trade in the form of cash or highly liquid securities, such as U.S. Treasuries and government agency investments. Central clearing houses also require additional cash as variation margin based on daily market value movements. For information on collateral, see the derivative collateral arrangements section in Note 7 - Derivatives of Notes to Consolidated Financial Statements. In addition, OTC-cleared transactions include price alignment amounts either received or paid on the variation margin, which are reflected in realized capital gains and losses or, if characterized as interest, in net investment income.
On the date the derivative contract is entered into, the Company designates the derivative as (1) a hedge of the fair value of a recognized asset or liability (“fair value” hedge), (2) a hedge of the variability in cash flows of a forecasted transaction or of amounts to be received or paid related to a recognized asset or liability (“cash flow” hedge), (3) a hedge of a net investment in a foreign operation (“net investment” hedge) or (4) held for other investment and/or risk management purposes, which primarily involve managing asset or liability related risks and do not qualify for hedge accounting. The Company currently does not designate any derivatives as fair value or net investment hedges.
Cash Flow Hedges - Changes in the fair value of a derivative that is designated and qualifies as a cash flow hedge, including foreign-currency cash flow hedges, are recorded in AOCI and are
THE HARTFORD FINANCIAL SERVICES GROUP, INC.
NOTES TO CONSOLIDATED FINANCIAL STATEMENTS (continued)
1. Basis of Presentation and Significant Accounting Policies (continued)
reclassified into earnings when the variability of the cash flow of the hedged item impacts earnings. Gains and losses on derivative contracts that are reclassified from AOCI to current period earnings are included in the line item in the Consolidated Statements of Operations in which the cash flows of the hedged item are recorded. Any hedge ineffectiveness is recorded immediately in current period earnings as net realized capital gains and losses. Periodic derivative net coupon settlements are recorded in the line item of the Consolidated Statements of Operations in which the cash flows of the hedged item are recorded. Cash flows from cash flow hedges are presented in the same category as the cash flows from the items being hedged in the Consolidated Statement of Cash Flows.
Other Investment and/or Risk Management Activities - The Company’s other investment and/or risk management activities primarily relate to strategies used to reduce economic risk or replicate permitted investments and do not receive hedge accounting treatment. Changes in the fair value, including periodic derivative net coupon settlements, of derivative instruments held for other investment and/or risk management purposes are reported in current period earnings as net realized capital gains and losses.
THE HARTFORD FINANCIAL SERVICES GROUP, INC.
NOTES TO CONSOLIDATED FINANCIAL STATEMENTS (continued)
Hedge Documentation and Effectiveness Testing
To qualify for hedge accounting treatment, a derivative must be highly effective in mitigating the designated changes in fair value or cash flow of the hedged item. At hedge inception, the Company formally documents all relationships between hedging instruments and hedged items, as well as its risk-management objective and strategy for undertaking each hedge transaction. The documentation process includes linking derivatives that are designated as fair value, cash flow, or net investment hedges to specific assets or liabilities on the balance sheet or to specific forecasted transactions and defining the effectiveness and ineffectiveness testing methods to be used. The Company also formally assesses both at the hedge’s inception and ongoing on a quarterly basis, whether the derivatives that are used in hedging transactions have been and are expected to continue to be highly effective in offsetting changes in fair values, cash flows or net investment in foreign operations of hedged items. Hedge effectiveness is assessed primarily using quantitative methods as well as using qualitative methods. Quantitative methods include regression or other statistical analysis of changes in fair value or cash flows associated with the hedge relationship. Qualitative methods may include comparison of critical terms of the derivative to the hedged item. Hedge ineffectiveness of the hedge relationships are measured each reporting period using the “Change in Variable Cash Flows Method”, the “Change in Fair Value Method”, the “Hypothetical Derivative Method”, or the “Dollar Offset Method”.
Discontinuance of Hedge Accounting
The Company discontinues hedge accounting prospectively when (1) it is determined that the qualifying criteria are no longer met; (2) the derivative is no longer designated as a hedging instrument; or (3) the derivative expires or is sold, terminated or exercised.
When hedge accounting is discontinued because it is determined that the derivative no longer qualifies as an effective fair value
hedge, the derivative continues to be carried at fair value on the balance sheet with changes in its fair value recognized in current period earnings. Changes in the fair value of the hedged item attributable to the hedged risk is no longer adjusted through current period earnings and the existing basis adjustment is amortized to earnings over the remaining life of the hedged item through the applicable earnings component associated with the hedged item.
When cash flow hedge accounting is discontinued because the Company becomes aware that it is not probable that the forecasted transaction will occur, the derivative continues to be carried on the balance sheet at its fair value, and gains and losses that were accumulated in AOCI are recognized immediately in earnings.
In other situations in which hedge accounting is discontinued, including those where the derivative is sold, terminated or exercised, amounts previously deferred in AOCI are reclassified into earnings when earnings are impacted by the hedged item.
Embedded Derivatives
The Company purchases investments that contain embedded derivative instruments. When it is determined that (1) the embedded derivative possesses economic characteristics that are not clearly and closely related to the economic characteristics of the host contract and (2) a separate instrument with the same terms would qualify as a derivative instrument, the embedded
derivative is bifurcated from the host for measurement purposes. The embedded derivative, which is reported with the host instrument in the Consolidated Balance Sheets, is carried at fair value with changes in fair value reported in net realized capital gains and losses.
Credit Risk of Derivative Instruments
Credit risk is defined as the risk of financial loss due to uncertainty of an obligor’s or counterparty’s ability or willingness to meet its obligations in accordance with agreed upon terms. Credit exposures are measured using the market value of the derivatives, resulting in amounts owed to the Company by its counterparties or potential payment obligations from the Company to its counterparties. The Company generally requires that OTC derivative contracts, other than certain forward contracts, be governed by International Swaps and Derivatives Association ("ISDA") agreements which are structured by legal entity and by counterparty, and permit right of offset. Some agreements require daily collateral settlement based upon agreed upon thresholds. For purposes of daily derivative collateral maintenance, credit exposures are generally quantified based on the prior business day’s market value and collateral is pledged to and held by, or on behalf of, the Company to the extent the current value of the derivatives exceed the contractualis greater than zero, subject to minimum transfer thresholds. For the Company’s domestic derivative programs, the maximum uncollateralized threshold for a derivative counterparty for a single legal entity is $10. The Company also minimizes the credit risk of derivative instruments by entering into transactions with high quality counterparties primarily rated A or better, which are monitored and evaluated by the Company’s risk management team and reviewed by senior management. OTC-cleared derivatives are governed by clearing house rules. Transactions cleared through a central clearing house reduce risk
THE HARTFORD FINANCIAL SERVICES GROUP, INC.
NOTES TO CONSOLIDATED FINANCIAL STATEMENTS (continued)
1. Basis of Presentation and Significant Accounting Policies (continued)
due to their ability to require daily variation margin and act as an independent valuation source. In addition, the Company monitors counterparty credit exposure on a monthly basis to ensure compliance with Company policies and statutory limitations.
Cash
Cash represents cash on hand and demand deposits with banks or other financial institutions.
Reinsurance
The Company cedes insurance to affiliated and unaffiliated insurers in order to limit its maximum losses and to diversify its exposures and provide statutory surplus relief. Such arrangements do not relieve the Company of its primary liability to policyholders. Failure of reinsurers to honor their obligations could result in losses to the Company. The Company also assumes reinsurance from other insurers and is a member of and participates in reinsurance pools and associations. Assumed reinsurance refers to the Company’s acceptance of certain insurance risks that other insurance companies or pools have underwritten.
Reinsurance accounting is followed for ceded and assumed transactions that provide indemnification against loss or liability relating to insurance risk (i.e. risk transfer). To meet risk transfer requirements, a reinsurance agreement must include insurance risk, consisting of underwriting and timing risk, and a reasonable possibility of a significant loss to the reinsurer. If the ceded and assumed transactions do not meet risk transfer requirements, the Company accounts for these transactions as financing transactions.
Premiums, benefits, losses and loss adjustment expenses reflect the net effects of ceded and assumed reinsurance transactions.
THE HARTFORD FINANCIAL SERVICES GROUP, INC.
NOTES TO CONSOLIDATED FINANCIAL STATEMENTS (continued)
Included in other assets are prepaid reinsurance premiums, which represent the portion of premiums ceded to reinsurers applicable to the unexpired terms of the reinsurance contracts. Reinsurance recoverables are balances due from reinsurance companies for paid and unpaid losses and loss adjustment expenses and are presented net of an allowance for uncollectible reinsurance. Changes in the allowance for uncollectible reinsurance are reported in benefits, losses and loss adjustment expenses in the Company's Consolidated Statements of Operations.
The Company evaluates the financial condition of its reinsurers and concentrations of credit risk. Reinsurance is placed with reinsurers that meet strict financial criteria established by the Company.
Deferred Policy Acquisition Costs
Deferred policy acquisition costs ("DAC") represent costs that are directly related to the acquisition of new and renewal insurance contracts and incremental direct costs of contract acquisition that are incurred in transactions with either independent third parties or in compensation to employees. Such costs primarily include commissions, premium taxes, costs of policy issuance and underwriting, and certain other expenses that are directly related to successfully issued contracts.
For property and casualty insurance products and group life, disability and accident contracts, costs are deferred and amortized ratably over the period the related premiums are
earned. Deferred acquisition costs are reviewed to determine if they are recoverable from future income, and if not, are charged to expense. Anticipated investment income is considered in the determination of the recoverability of DAC.
Income Taxes
The Company recognizes taxes payable or refundable for the current year and deferred taxes for the tax consequences of temporary differences between the financial reporting and tax basis of assets and liabilities. Deferred tax assets and liabilities are measured using enacted tax rates expected to apply to taxable income in the years the temporary differences are expected to reverse. A deferred tax provision is recorded for the tax effects of differences between the Company's current taxable income and its income before tax under generally accepted accounting principles in the Consolidated Statements of Operations. For deferred tax assets, the Company records a valuation allowance that is adequate to reduce the total deferred tax asset to an amount that will more likely than not be realized.
Goodwill
Goodwill represents the excess of the cost to acquire a business over the fair value of net assets acquired. Goodwill is not amortized but is reviewed for impairment at least annually or more frequently if events occur or circumstances change that would indicate that a triggering event for a potential impairment has occurred. The goodwill impairment test follows a two-step process. In the first step, the fair value of a reporting unit is compared to its carrying value. A reporting unit is defined as an operating segment or one level below an operating segment. The Company’s reporting units, for which goodwill has been allocated include small commercial within the Commercial Lines segment, Group Benefits, Personal Lines and Hartford Funds. If the carrying value of a reporting unit exceeds its fair value, the second step of the impairment test is performed for purposes of measuring the impairment. In the second step, the fair value of
the reporting unit is allocated to all of the assets and liabilities of the reporting unit to determine an implied goodwill value. If the carrying amount of the reporting unit’s goodwill exceeds the implied goodwill value, an impairment loss is recognized in an amount equal to that excess.
Management’s determination of the fair value of each reporting unit incorporates multiple inputs into discounted cash flow calculations, including assumptions that market participants would make in valuing the reporting unit. Assumptions include levels of economic capital required to support the business, future business growth, earnings projections and, for the Hartford Funds segment, assets under management for certain reporting units and the weighted average cost of capital used for purposes of discounting. Decreases in business growth, decreases in earnings projections and increases in the weighted average cost of capital will all cause a reporting unit’s fair value to decrease, increasing the possibility of impairments.
Intangible Assets
Acquired intangible assets on the Consolidated Balance Sheets include purchased customer relationship and agency or other distribution relationshipsrights and licenses measured at fair value at acquisition. The Company amortizes finite-lived other intangible assets over their useful lives generally on a straight-line basis over the period of expected benefit, ranging from 1 to 15 years. Management revises amortization periods if it believes there has been a change in the length of time that an intangible asset will continue to have value. Indefinite-lived intangible assets are not subject to amortization. Intangible assets are assessed for impairment
THE HARTFORD FINANCIAL SERVICES GROUP, INC.
NOTES TO CONSOLIDATED FINANCIAL STATEMENTS (continued)
1. Basis of Presentation and Significant Accounting Policies (continued)
generally when events or circumstances indicate a potential impairment and at least annually for indefinite-lived intangibles. If the carrying amount is not recoverable from undiscounted cash flows, the impairment is measured as the difference between the carrying amount and fair value.
Property and Equipment
Property and equipment, which includes capitalized software, is carried at cost net of accumulated depreciation. Depreciation is based on the estimated useful lives of the various classes of property and equipment and is determined principally on the straight-line method. Accumulated depreciation was $2.6$1.6 billion and $2.5$2.6 billion as of December 31, 20172018 and 20162017, respectively.respectively, with the decrease due to the removal of fully depreciated assets in 2018. Depreciation expense was $232, $197, $186, and $164$186 for the years ended December 31, 20172018, 20162017 and 20152016, respectively.
Unpaid Losses and Loss Adjustment Expenses
For property and casualty and group life and disability insurance products, the Company establishes reserves for unpaid losses and loss adjustment expenses to provide for the estimated costs of paying claims under insurance policies written by the Company. These reserves include estimates for both claims that have been reported and those that have been incurred but not reported ("IBNR"), and include estimates of all losses and loss adjustment expenses associated with processing and settling these claims. Estimating the ultimate cost of future losses and loss adjustment expenses is an uncertain and complex process. This estimation process is based significantly on the assumption that past developments are an appropriate predictor of future events, and involves a variety of actuarial techniques that analyze experience, trends and other relevant factors. The effects of inflation are
THE HARTFORD FINANCIAL SERVICES GROUP, INC.
NOTES TO CONSOLIDATED FINANCIAL STATEMENTS (continued)
implicitly considered in the reserving process. A number of complex factors influence the uncertainties involved with the reserving process including social and economic trends and changes in the concepts of legal liability and damage awards. Accordingly, final claim settlements may vary from the present estimates, particularly when those payments may not occur until well into the future. The Company regularly reviews the adequacy of its estimated losses and loss adjustment expense reserves by reserve line within the various reporting segments. Adjustments to previously established reserves are reflected in the operating results of the period in which the adjustment is determined to be necessary. Such adjustments could possibly be significant, reflecting any variety of new and adverse or favorable trends.
Most of the Company’s property and casualty insurance products reserves are not discounted. However, the Company has discounted to present value certain reserves for indemnity payments that are due to permanently disabled claimants under workers’ compensation policies because the payment pattern and the ultimate costs are reasonably fixed and determinable on an individual claim basis. The discount rate is based on the risk free rate for the expected claim duration as determined in the year the claims were incurred. The Company also has discounted liabilities for run-off structured settlement agreements that provide fixed periodic payments to claimants. These structured settlements include annuities purchased to fund unpaid losses for permanently disabled claimants. Most of the annuities have been issued by the
life and annuity run-off business held for sale and the annuity obligations are now included as part of liabilities held for sale, recognized at present value. Upon classifying the life and annuity run-off business as held-for-sale, the Company increased property & casualty reinsurance recoverables and unpaid losses and loss adjustment expenses for annuities issued by the life and annuity run-off business to fund structured settlement payments where the claimant has not released the Company of its obligation totaling $688 and $712 as of December 31, 2017 and 2016, respectively. These structured settlement liabilities wereare discounted to present value using an average interestthe rate of 6.70%implicit in 2017the purchased annuities and 6.69% in 2016.the purchased annuities are accounted for within reinsurance recoverables.
Group life and disability contracts with long-tail claim liabilities are discounted because the payment pattern and the ultimate costs are reasonably fixed and determinable on an individual claim basis. The discount rates are estimated based on investment yields expected to be earned on the cash flows net of investment expenses and expected credit losses. The Company establishes discount rates for these reserves in the year the claims are incurred (the incurral year) which is when the estimated settlement pattern is determined. The discount rate for life and disability reserves acquired from Aetna's U.S. group life and disability business were based on interest rates in effect at the acquisition date of November 1, 2017.
For further information about how unpaid losses and loss adjustment expenses are established, see Note 11 - Reserve for Unpaid Losses and Loss Adjustment Expenses of Notes to Consolidated Financial Statements.
Foreign Currency
Foreign currency translation gains and losses are reflected in stockholders’ equity as a component of AOCI. The Company’s foreign subsidiaries’ balance sheet accounts are translated at the exchange rates in effect at each year end and income statement accounts are translated at the average rates of exchange prevailing during the year. The national currencies of the international operations are generally their functional currencies. Gains and losses resulting from the remeasurement of foreign currency transactions are reflected in earnings in realized capital gains (losses) in the period in which they occur.
THE HARTFORD FINANCIAL SERVICES GROUP, INC.NOTES TO CONSOLIDATED FINANCIAL STATEMENTS (continued)
2. Business Acquisitions
BUSINESS ACQUISITIONS
Aetna Group Insurance
On November 1, 2017, The Hartford acquired Aetna's U.S. group life and disability business through a reinsurance transaction for total consideration of $1.452 billion, comprised of cash of $1.450 billion and share-based awards of $2.$2, and recorded provisional estimates of the fair value of the assets acquired and liabilities assumed. The acquisition enables the Company to increase its market share in the group life and disability industry. In 2018, The Hartford and Aetna agreed on the final assets acquired and liabilities assumed as of the acquisition date and The Hartford
finalized its provisional estimates with a final cash settlement within the one year measurement period allowed under U.S. GAAP ("GAAP"). As a result, in the third quarter of 2018, The Hartford recorded additional assets and liabilities at fair value of $80 and $80, respectively, with no change in goodwill. The following table presents the preliminary allocation of the purchase price to the assets acquired and liabilities assumed as of the acquisition date, the measurement period adjustments recorded, and the final purchase price allocation.
THE HARTFORD FINANCIAL SERVICES GROUP, INC.
NOTES TO CONSOLIDATED FINANCIAL STATEMENTS (continued)
Fair Value of Assets Acquired and Liabilities Assumed at the Acquisition Date | | | | As of November 1, 2017
| Preliminary Value as of November 1, 2017 (as previously reported as of December 31, 2017) | Measurement Period Adjustments | As Adjusted Value as of November 1, 2017 |
| Assets | |
| |
| Cash and invested assets | $ | 3,360 |
| $ | 3,360 |
| $ | 45 |
| $ | 3,405 |
|
| Premiums receivable | 96 |
| 96 |
| 7 |
| 103 |
|
| Deferred income taxes, net | 56 |
| 56 |
| 13 |
| 69 |
|
| Other intangible assets | 629 |
| 629 |
| — |
| 629 |
|
| Property and equipment | 68 |
| 68 |
| — |
| 68 |
|
| Reinsurance recoverables | | — |
| 31 |
| 31 |
|
| Other assets | 16 |
| 16 |
| (16 | ) | — |
|
| Total Assets Acquired | 4,225 |
| 4,225 |
| 80 |
| 4,305 |
|
| Liabilities | |
| |
| Unpaid losses and loss adjustment expenses | 2,833 |
| 2,833 |
| 71 |
| 2,904 |
|
| Reserve for future policy benefits | 346 |
| |
| Reserve for future policy benefits payable | | 346 |
| 1 |
| 347 |
|
| Other policyholder funds and benefits payable | 245 |
| 245 |
| 1 |
| 246 |
|
| Unearned premiums | 3 |
| 3 |
| 1 |
| 4 |
|
| Other liabilities | 69 |
| 69 |
| 6 |
| 75 |
|
| Total Liabilities Assumed | 3,496 |
| 3,496 |
| 80 |
| 3,576 |
|
| Net identifiable assets acquired | 729 |
| 729 |
| — |
| 729 |
|
| Goodwill [1] | 723 |
| 723 |
| — |
| 723 |
|
| Net Assets Acquired | $ | 1,452 |
| $ | 1,452 |
| $ | — |
| $ | 1,452 |
|
| |
| [1] | Approximately $623610 is deductible for income tax purposes. |
The effect of measurement period adjustments on the Consolidated Statements of Operations for the year ended December 31, 2018 was immaterial and was determined as if the accounting had been completed as of the acquisition date.
Intangible Assets Recorded in Connection with the Acquisition |
| | | | |
| Asset | Amount | Estimated Useful Life |
| Value of in-force contracts | $ | 23 |
| 1 year |
| Customer relationships | 590 |
| 15 years |
| Marketing agreement with Aetna | 16 |
| 15 years |
| Total | $ | 629 |
|
|
The value of in-force contracts represents the estimated profits relating to the unexpired contracts in force at the acquisition date through expiry of the contracts. The value of customer relationships was estimated using net cash flows expected to come from the renewals of in-force contracts acquired less costs to service the related policies. The value of the marketing agreement with Aetna was estimated using net cash flows expected to come from incremental new business written during the three-year duration of the agreement, less costs to service
the related contracts. The value for each of the identifiable intangible assets was estimated using a discounted cash flow method. Significant inputs to the valuation models include estimates of expected premiums, persistency rates, investment returns, claim costs, expenses and discount rates based on a weighted average cost of capital.
Property and equipment represents an internally developed integrated absence management software acquired that was valued based on estimated replacement cost. The software will beis amortized over five5 years on a straight-line basis.
Unpaid losses and loss adjustment expenses acquired were recorded at estimated fair value equal to the present value of expected future unpaid loss and loss adjustment expense payments discounted using the net investment yield estimated as of the acquisition date plus a risk margin. The fair value adjustment for the risk margin will beis amortized over 12 years based on the payout pattern of losses and loss expenses as estimated as of the acquisition date.
Since the acquisition date of November 1, 2017, theThe revenues and earnings of the business acquired have beenare included in the Company's Consolidated Statements of Operations in the Group Benefits reporting segment and were $370 and $(37) in the year of acquisition, respectively.
The $723 of goodwill recognized is largely attributable to the acquired employee workforce, expected expense synergies, economies of scale, and tax benefits not included within the value of identifiable intangibles. Goodwill is allocated to the Company's Group Benefits reporting segment.
The Company recognized $17 of acquisition related costs forin the year ended December 31, 2017.of acquisition. These costs are included in insurance operating costs and other expenses in the Consolidated Statement of Operations.
The acquisition date fair values of certain assets and liabilities, including insurance reserves and intangible assets, as well as the related estimated useful lives of intangibles, are provisional and are subject to revision within one year of the acquisition date. Under the terms of the agreement, a final balance sheet will be agreed to in 2018 and our estimates of fair values are pending finalization.
The following table presents supplemental unaudited pro forma amounts of revenue and net income for the Company in 2016 and 2017 as though the business was acquired on January 1, 2016.
THE HARTFORD FINANCIAL SERVICES GROUP, INC.
NOTES TO CONSOLIDATED FINANCIAL STATEMENTS (continued)
Pro Forma Results (Unaudited)
|
| | | | | | |
| Twelve months ended December 31, 2017 [1] | Twelve months ended December 31, 2016 [1] |
| Total Revenue | $ | 18,899 |
| $ | 18,348 |
|
| Net Income | $ | (3,077 | ) | $ | 953 |
|
[1]Pro forma adjustments include the revenue and earnings of the Aetna U.S. group life and disability business for each period as well as amortization of identifiable intangible assets acquired and of the fair value adjustment to acquired insurance reserves. Pro forma adjustments do not include retrospective adjustments to defer and amortize acquisition costs as would be recorded under the Company’s accounting policy.
THE HARTFORD FINANCIAL SERVICES GROUP, INC.
NOTES TO CONSOLIDATED FINANCIAL STATEMENTS (continued)
2. Business Acquisitions (continued)
Pro Forma Results
|
| | | | | | |
| | Revenue | Earnings |
| 2017 Supplemental (unaudited) combined pro forma | $ | 18,899 |
| $ | (3,077 | ) |
| 2016 Supplemental (unaudited) combined pro forma | $ | 18,348 |
| $ | 953 |
|
Maxum
On July 29, 2016, the Company acquired 100% of the outstanding shares of Northern Homelands Company, the holding company of Maxum Specialty Insurance Group headquartered in Alpharetta, Georgia in a cash transaction for approximately $169. The acquisition adds excess and surplus lines capability to the Company's Small Commercialsmall commercial line of business. Maxum will maintainis maintaining its brand and limited wholesale distribution model. Maxum's revenues and earnings since the acquisition date are included in the Company's Consolidated Statements of Operations and are not material toin the Company's consolidated results of operations.Commercial Lines reporting segment.
Fair Value of Assets Acquired and Liabilities Assumed at the Acquisition Date
|
| | | |
| | As of July 29, 2016 |
| Assets | |
| Cash and investments (including cash of $12) | $ | 274 |
|
| Reinsurance recoverables | 113 |
|
| Intangible assets [1] | 11 |
|
| Other assets | 79 |
|
| Total assets acquired | 477 |
|
| Liabilities | |
| Unpaid losses | 235 |
|
| Unearned premiums | 77 |
|
| Other liabilities | 34 |
|
| Total liabilities assumed | 346 |
|
| Net identifiable assets acquired | 131 |
|
| Goodwill [2] | 38 |
|
| Net assets acquired | $ | 169 |
|
| |
| [1] | Comprised of indefinite lived intangibles of $4 related to state insurance licenses acquired and other intangibles of $7 related to agency distribution relationships of Maxum which will amortizeare amortized over 10 years. |
| |
| [2] | Non-deductible for income tax purposes. |
The goodwill recognized is attributable to expected growth from the opportunity to sell both existing products and excess and surplus lines coverage to a broader customer base and has been allocated to the Small Commercialsmall commercial reporting unit within the Commercial Lines reporting segment.
The Company recognized $1 of acquisition related costs for the year ended December 31, 2016. These costs are included in insurance operating costs and other expenses in the Consolidated Statement of Operations.
Lattice
On July 29, 2016, an indirect wholly-owned subsidiary of the Company acquired 100% of the membership interests outstanding of Lattice Strategies LLC, an investment management firm and provider of strategic beta exchange-traded products ("ETP") with approximately $200 of assets under management ("AUM") at the acquisition date.
Fair Value of the Consideration Transferred at the Acquisition Date
|
| | | |
| Cash | $ | 19 |
|
| Contingent consideration | 23 |
|
| Total | $ | 42 |
|
Fair Value of Assets Acquired and Liabilities Assumed at the Acquisition Date
|
| | | |
| | As of July 29, 2016 |
| Assets | |
| Intangible assets [1] | $ | 11 |
|
| Cash | 1 |
|
| Total assets acquired | 12 |
|
| Liabilities | |
| Total liabilities assumed | 1 |
|
| Net identifiable assets acquired | 11 |
|
| Goodwill [2] | 31 |
|
| Net assets acquired | $ | 42 |
|
| |
| [1] | Comprised of indefinite lived intangibles of $10 related to customer relationships and $1 of other intangibles, which are amortizableamortized over 5 to 8 years. |
| |
| [2] | Deductible for federal income tax purposes. |
Lattice's revenues and earnings since the acquisition date are included in the Company's Consolidated Statements of Operations in the MutualHartford Funds reporting segment and are not material to the Company's consolidated results of operations.segment.
In addition to the initial cash consideration, the Company is required to make future payments to the former owners of Lattice of up to $60 based upon growth in ETP AUM over a four-year periodfour years beginning on the date of acquisition. The contingent consideration was measured at fair value at the acquisition date by projecting future ETP AUM and discounting expected payments back to the valuation date. The projected ETP AUM and risk-adjusted discount rate are significant unobservable inputs to fair value.
The goodwill recognized is attributable to the fact that the acquisition of Lattice enables the Company to offer ETPs which are expected to be a significant source of future revenue and earnings growth. Goodwill is allocated to the MutualHartford Funds reporting segment.
The Company recognized $1 of acquisition related costs for the year ended December 31, 2016. These costs are included in insurance operating costs and other expenses in the Consolidated Statement of Operations.
THE HARTFORD FINANCIAL SERVICES GROUP, INC.
NOTES TO CONSOLIDATED FINANCIAL STATEMENTS (continued)
3. Earnings Per Common Share
EARNINGS (LOSS) PER COMMON SHARE
Computation of Basic and Diluted Earnings per Common Share
|
| | | | | | | | | |
| | For the years ended December 31, |
| (In millions, except for per share data) | 2018 | 2017 | 2016 |
| Earnings | | | |
| Income (loss) from continuing operations, net of tax | $ | 1,485 |
| $ | (262 | ) | $ | 613 |
|
| Less: Preferred stock dividends | 6 |
| — |
| — |
|
| Income (loss) from continuing operations, net of tax, available to common stockholders | 1,479 |
| (262 | ) | 613 |
|
| Income (loss) from discontinued operations, net of tax, available to common stockholders | 322 |
| (2,869 | ) | 283 |
|
| Net income (loss) available to common stockholders | 1,801 |
| (3,131 | ) | 896 |
|
| Shares | |
| |
| |
|
| Weighted average common shares outstanding, basic | 358.4 |
| 363.7 |
| 387.7 |
|
| Dilutive effect of warrants | 1.9 |
| — |
| 3.6 |
|
| Dilutive effect of stock-based awards under compensation plans | 3.8 |
| — |
| 3.5 |
|
| Weighted average common shares outstanding and dilutive potential common shares [1] | 364.1 |
| 363.7 |
| 394.8 |
|
| Earnings per common share | | | |
| Basic | | | |
| Income (loss) from continuing operations, net of tax, available to common stockholders | $ | 4.13 |
| $ | (0.72 | ) | $ | 1.58 |
|
| Income (loss) from discontinued operations, net of tax, available to common stockholders | 0.90 |
| (7.89 | ) | 0.73 |
|
| Net income (loss) available to common stockholders | $ | 5.03 |
| $ | (8.61 | ) | $ | 2.31 |
|
| Diluted | |
| |
| |
|
| Income (loss) from continuing operations, net of tax, available to common stockholders | $ | 4.06 |
| $ | (0.72 | ) | $ | 1.55 |
|
| Income (loss) from discontinued operations, net of tax, available to common stockholders | 0.89 |
| (7.89 | ) | 0.72 |
|
| Net income (loss) available to common stockholders | $ | 4.95 |
| $ | (8.61 | ) | $ | 2.27 |
|
|
| | | | | | | | | |
| | For the years ended December 31, |
| (In millions, except for per share data) | 2017 | 2016 | 2015 |
| Earnings | | | |
| (Loss) income from continuing operations, net of tax | $ | (262 | ) | $ | 613 |
| $ | 1,189 |
|
| (Loss) income from discontinued operations, net of tax | (2,869 | ) | 283 |
| 493 |
|
| Net (loss) income | $ | (3,131 | ) | $ | 896 |
| $ | 1,682 |
|
| Shares | |
| |
| |
|
| Weighted average common shares outstanding, basic | 363.7 |
| 387.7 |
| 415.5 |
|
| Dilutive effect of warrants | — |
| 3.6 |
| 4.7 |
|
| Dilutive effect of stock-based awards under compensation plans | — |
| 3.5 |
| 5.0 |
|
| Weighted average shares outstanding and dilutive potential common shares [1] | 363.7 |
| 394.8 |
| 425.2 |
|
| Net income per common share | | | |
| Basic | | | |
| (Loss) income from continuing operations, net of tax | $ | (0.72 | ) | $ | 1.58 |
| $ | 2.86 |
|
| (Loss) income from discontinued operations, net of tax | (7.89 | ) | 0.73 |
| 1.19 |
|
| Net income per common share | $ | (8.61 | ) | $ | 2.31 |
| $ | 4.05 |
|
| Diluted | |
| |
| |
|
| (Loss) income from continuing operations, net of tax | $ | (0.72 | ) | $ | 1.55 |
| $ | 2.80 |
|
| (Loss) income from discontinued operations, net of tax | (7.89 | ) | 0.72 |
| 1.16 |
|
| Net (loss) income per common share | $ | (8.61 | ) | $ | 2.27 |
| $ | 3.96 |
|
| |
| [1] | For additional information, see Note 15 - Equity and Note 19 - Stock Compensation Plans of Notes to Consolidated Financial Statements. |
Basic earnings per common share is computed based on the weighted average number of common shares outstanding during the year. Diluted earnings per common share includes the dilutive effect of assumed exercise or issuance of warrants and stock-based awards under compensation plans. Diluted potential
In periods where a loss from continuing operations available to common stockholders or net loss available to common stockholders is recognized, inclusion of incremental dilutive shares would be antidilutive. Due to the antidilutive impact, such shares are included inexcluded from the diluted earnings per share calculation of diluted per share amounts provided there is income (loss) from continuing operations, net of tax.tax, available to common stockholders and net income (loss) available to common stockholders in such periods. As a result, for the year
ended December 31, 2017, the Company was required to use basic weighted average common shares outstanding in the diluted calculations, since the inclusion of 4.3 million shares for stock compensation plans and 2.5 million shares for warrants would have been antidilutive to the calculations.
Under the treasury stock method, for warrants and stock-based awards, shares are assumed to be issued and then reduced for the number of shares repurchaseable with theoretical proceeds at the average market price for the period. Contingently issuable shares are included for the number of shares issuable assuming the end of the reporting period was the end of the contingency period, if dilutive.
4. SEGMENT INFORMATION
The Company currently conducts business principally in five reporting segments including Commercial Lines, Personal Lines, Property & Casualty ("P&C") Other Operations, Group Benefits and Hartford Funds (previously referred to as "Mutual Funds"), as well as a resultCorporate category. The Company includes in the Corporate category discontinued operations related to the life and annuity business sold in May 2018, reserves for run-off structured settlement and terminal funding agreement liabilities, capital raising activities (including debt financing and related interest expense), purchase accounting adjustments related to goodwill and other expenses not allocated to the reporting
segments. Corporate also includes investment management fees and expenses related to managing third party business, including management of the net loss from continuing operations for the year ended December 31, 2017, the Company was required to use basic weighted average common shares outstandinginvested assets of Talcott Resolution Life. In addition, Corporate includes a 9.7% ownership interest in the calculationlegal entity that acquired the life and annuity business sold. For further discussion of diluted loss per share, sincecontinued involvement in the inclusionlife and annuity business sold in May 2018, see Note 20 - Business Dispositions and Discontinued Operations of 4.3 million shares for stock compensation plans and 2.5 million shares for warrants would have been antidilutiveNotes to Consolidated Financial Statements.
The Company’s reporting segments, as well as the earnings (loss) per share calculation. In the absence of the net loss, weighted average common shares outstanding and dilutive potential common shares would have totaled 370.5 million.Corporate category, are as follows:
THE HARTFORD FINANCIAL SERVICES GROUP, INC.
NOTES TO CONSOLIDATED FINANCIAL STATEMENTS (continued)
4. Segment Information
The Company currently conducts business principally in five reporting segments, as well as a Corporate category. The Company's revenues from continuing operations are generated primarily in the United States ("U.S."). Any foreign sourced revenue in continuing operations is immaterial.
The Company’s reporting segments, as well as the Corporate category, are as follows:
Commercial Lines
Commercial Lines provides workers’ compensation, property, automobile, marine, livestock, liability and umbrella coverages primarily throughout the U.S., along with a variety of customized insurance products and risk management services including professional liability, bond, surety, and specialty casualty coverages.
Personal Lines
Personal Lines provides standard automobile, homeowners and personal umbrella coverages to individuals across the U.S., including a special program designed exclusively for members of AARP.
Property & Casualty Other Operations
Property & Casualty Other Operations includes certain property and casualty operations, managed by the Company, that have discontinued writing new business and includes substantially all of the Company’s asbestos and environmental exposures.
Group Benefits
Group Benefits provides employers, associations and financial institutions with group life, accident and disability coverage, along with other products and services, including voluntary benefits, and group retiree health.
MutualHartford Funds
MutualHartford Funds offers investment products for retail and retirement accounts as well as ETPs and provides investment management and administrative services such as product design, implementation and oversight. This business also includesmanages a portion of the mutual funds which support the variable annuity products within the Company's life and annuity run-off business held for sale.sold in May 2018.
Corporate
The Company includes in the Corporate category investment management fees and expenses related to managing third party business, including management of the invested assets of Talcott Resolution, discontinued operations ofrelated to the Company's life and annuity run-off business accounted for as held for sale,sold in May 2018, reserves for run-off structured settlement and terminal funding agreement liabilities, retained, capital raising activities (including debt financing and related interest expense), purchase accounting adjustments related to goodwill and other expenses not allocated to the reporting segments. In addition, Corporate includes a 9.7% ownership interest in the legal entity that acquired the life and annuity business sold in May 2018.
Financial Measures and Other Segment Information
Certain transactions between segments occur during the year that primarily relate to tax settlements, insurance coverage, expense reimbursements, services provided, investment transfers and capital contributions. In addition, certain inter-segment transactions occur that relate to interest income on allocated
surplus. Consolidated net investment income is unaffected by such transactions.
|
| | | | | | | | | |
| | For the years ended December 31, |
| | 2017 | 2016 | 2015 |
| Earned premiums and fee income: | | | |
| Commercial Lines | | | |
| Workers’ compensation | $ | 3,287 |
| $ | 3,187 |
| $ | 3,065 |
|
| Liability | 604 |
| 585 |
| 568 |
|
| Package business | 1,301 |
| 1,249 |
| 1,223 |
|
| Property | 604 |
| 577 |
| 638 |
|
| Professional liability | 246 |
| 231 |
| 222 |
|
| Bond | 230 |
| 218 |
| 218 |
|
| Automobile | 630 |
| 643 |
| 617 |
|
| Total Commercial Lines [1] | 6,902 |
| 6,690 |
| 6,551 |
|
| Personal Lines | |
| |
| |
|
| Automobile | 2,617 |
| 2,749 |
| 2,698 |
|
| Homeowners | 1,117 |
| 1,188 |
| 1,212 |
|
| Total Personal Lines [1] [2] | 3,734 |
| 3,937 |
| 3,910 |
|
| Property & Casualty Other Operations | — |
| — |
| 32 |
|
| Group Benefits | |
| |
| |
|
| Group disability | 1,718 |
| 1,506 |
| 1,479 |
|
| Group life | 1,745 |
| 1,512 |
| 1,477 |
|
| Other | 214 |
| 205 |
| 180 |
|
| Total Group Benefits | 3,677 |
| 3,223 |
| 3,136 |
|
| Mutual Funds | | | |
| Mutual Fund | 706 |
| 601 |
| 607 |
|
| Life and annuity run-off business held for sale | 98 |
| 100 |
| 116 |
|
| Total Mutual Funds | 804 |
| 701 |
| 723 |
|
| Corporate [3] | 4 |
| 3 |
| 9 |
|
| Total earned premiums and fee income | 15,121 |
| 14,554 |
| 14,361 |
|
| Total net investment income | 1,603 |
| 1,577 |
| 1,561 |
|
| Net realized capital gains (loss) | 165 |
| (110 | ) | (12 | ) |
| Other revenues | 85 |
| 86 |
| 87 |
|
| Total revenues | $ | 16,974 |
| $ | 16,107 |
| $ | 15,997 |
|
Revenues |
| | | | | | | | | |
| | For the years ended December 31, |
| | 2018 | 2017 | 2016 |
| Earned premiums and fee income: | | | |
| Commercial Lines | | | |
| Workers’ compensation | $ | 3,341 |
| $ | 3,287 |
| $ | 3,187 |
|
| Liability | 653 |
| 604 |
| 585 |
|
| Package business | 1,364 |
| 1,301 |
| 1,249 |
|
| Property | 618 |
| 604 |
| 577 |
|
| Professional liability | 254 |
| 246 |
| 231 |
|
| Bond | 241 |
| 230 |
| 218 |
|
| Automobile | 610 |
| 630 |
| 643 |
|
| Total Commercial Lines | 7,081 |
| 6,902 |
| 6,690 |
|
| Personal Lines | |
| |
| |
|
| Automobile | 2,398 |
| 2,617 |
| 2,749 |
|
| Homeowners | 1,041 |
| 1,117 |
| 1,188 |
|
| Total Personal Lines [1] | 3,439 |
| 3,734 |
| 3,937 |
|
| Property & Casualty Other Operations | — |
| — |
| — |
|
| Group Benefits | |
| |
| |
|
| Group disability | 2,746 |
| 1,718 |
| 1,506 |
|
| Group life | 2,611 |
| 1,745 |
| 1,512 |
|
| Other | 241 |
| 214 |
| 205 |
|
| Total Group Benefits | 5,598 |
| 3,677 |
| 3,223 |
|
| Hartford Funds | | | |
| Mutual fund and Exchange-Traded Products ("ETP") | 932 |
| 888 |
| 779 |
|
| Talcott Resolution life and annuity separate accounts [3] | 100 |
| 104 |
| 106 |
|
| Total Hartford Funds [2] | 1,032 |
| 992 |
| 885 |
|
| Corporate | 32 |
| 4 |
| 3 |
|
| Total earned premiums and fee income | 17,182 |
| 15,309 |
| 14,738 |
|
| Total net investment income | 1,780 |
| 1,603 |
| 1,577 |
|
| Net realized capital gains (losses) | (112 | ) | 165 |
| (110 | ) |
| Other revenues | 105 |
| 85 |
| 86 |
|
| Total revenues | $ | 18,955 |
| $ | 17,162 |
| $ | 16,291 |
|
| |
| [1] | Commercial Lines includes installment feesFor 2018, 2017 and 2016, AARP members accounted for earned premiums of $373.0 billion, $393.2 billion and $40, for 2017, 2016 and 20153.3 billion, respectively. Personal Lines includes installment fees of $44, $39, and $37, for 2017, 2016 and 2015, respectively.
|
| |
| [2] | For Excludes distribution costs of $188 and $184 for the years ended December 31, 2017, 2016and 20152016, AARP members accounted for earned premiums of $3.2 billion, $3.3 billionrespectively, that were previously netted against fee income and $3.2 billion, respectively.are now presented gross in insurance operating costs and other expenses.
|
| |
| [3] | IncludesRepresents revenues earned on the life and expenses not allocated to remaining reporting segments.annuity separate account AUM sold in May 2018 that is still managed by the Company's Hartford Funds segment. |
THE HARTFORD FINANCIAL SERVICES GROUP, INC.
NOTES TO CONSOLIDATED FINANCIAL STATEMENTS (continued)
4. Segment Information (continued)
Net Income (Loss)
|
| | | | | | | | | |
| | For the years ended December 31, |
| | 2018 | 2017 | 2016 |
| Commercial Lines | $ | 1,212 |
| $ | 865 |
| $ | 994 |
|
| Personal Lines | (32 | ) | (9 | ) | (9 | ) |
| Property & Casualty Other Operations | 15 |
| 69 |
| (529 | ) |
| Group Benefits | 340 |
| 294 |
| 230 |
|
| Hartford Funds | 148 |
| 106 |
| 78 |
|
| Corporate | 124 |
| (4,456 | ) | 132 |
|
| Net income (loss) | $ | 1,807 |
| $ | (3,131 | ) | $ | 896 |
|
| Preferred stock dividends | 6 |
| — |
| — |
|
| Net income (loss) available to common stockholders | $ | 1,801 |
| $ | (3,131 | ) | $ | 896 |
|
Net Investment Income
|
| | | | | | | | | |
| | For the years ended December 31, |
| | 2017 | 2016 | 2015 |
| Commercial Lines [1] | $ | 865 |
| $ | 994 |
| $ | 991 |
|
| Personal Lines [1] | (9 | ) | (9 | ) | 199 |
|
| Property & Casualty Other Operations | 69 |
| (529 | ) | (53 | ) |
| Group Benefits | 294 |
| 230 |
| 187 |
|
| Mutual Funds | 106 |
| 78 |
| 86 |
|
| Corporate | (4,456 | ) | 132 |
| 272 |
|
| Net (loss) income | $ | (3,131 | ) | $ | 896 |
| $ | 1,682 |
|
| |
[1] | For 2016 and 2015, there was a segment change which resulted in a movement from Commercial Lines to Personal Lines of $13 and $12 of net servicing income associated with our participation in the National Flood Insurance Program.
|
Net investment income
| | | | For the years ended December 31, | For the years ended December 31, |
| | 2017 | 2016 | 2015 | 2018 | 2017 | 2016 |
| Commercial Lines | $ | 949 |
| $ | 917 |
| $ | 910 |
| $ | 997 |
| $ | 949 |
| $ | 917 |
|
| Personal Lines | 141 |
| 135 |
| 128 |
| 155 |
| 141 |
| 135 |
|
| Property & Casualty Other Operations | 106 |
| 127 |
| 133 |
| 90 |
| 106 |
| 127 |
|
| Group Benefits | 381 |
| 366 |
| 371 |
| 474 |
| 381 |
| 366 |
|
| Mutual Funds | 3 |
| 1 |
| 1 |
| |
| Hartford Funds | | 5 |
| 3 |
| 1 |
|
| Corporate | 23 |
| 31 |
| 18 |
| 59 |
| 23 |
| 31 |
|
| Net investment income | $ | 1,603 |
| $ | 1,577 |
| $ | 1,561 |
| $ | 1,780 |
| $ | 1,603 |
| $ | 1,577 |
|
Amortization of Deferred Policy Acquisition Costs
|
| | | | | | | | | |
| | For the years ended December 31, |
| | 2018 | 2017 | 2016 |
| Commercial Lines | $ | 1,048 |
| $ | 1,009 |
| $ | 973 |
|
| Personal Lines | 275 |
| 309 |
| 348 |
|
| Group Benefits | 45 |
| 33 |
| 31 |
|
| Hartford Funds | 16 |
| 21 |
| 24 |
|
| Corporate | — |
| — |
| 1 |
|
| Total amortization of deferred policy acquisition costs | $ | 1,384 |
| $ | 1,372 |
| $ | 1,377 |
|
|
| | | | | | | | | |
| | For the years ended December 31, |
| | 2017 | 2016 | 2015 |
| Commercial Lines | $ | 1,009 |
| $ | 973 |
| $ | 951 |
|
| Personal Lines | 309 |
| 348 |
| 359 |
|
| Group Benefits | 33 |
| 31 |
| 31 |
|
| Mutual Funds | 21 |
| 24 |
| 22 |
|
| Corporate [1] | — |
| 1 |
| 1 |
|
| Total amortization of deferred policy acquisition costs | $ | 1,372 |
| $ | 1,377 |
| $ | 1,364 |
|
| |
[1] | Certain retained expenses of the Company's life and annuity run-off business have been reclassified to Corporate for the prior periods. |
Amortization of Other Intangible Assets
| | | | For the years ended December 31, | For the years ended December 31, |
| | 2017 | 2016 | 2015 | 2018 | 2017 | 2016 |
| Commercial Lines | $ | 1 |
| $ | — |
| $ | — |
| $ | 4 |
| $ | 1 |
| $ | — |
|
| Personal Lines | 4 |
| 4 |
| 4 |
| 4 |
| 4 |
| 4 |
|
| Group Benefits | 9 |
| — |
| — |
| 60 |
| 9 |
| — |
|
| Total amortization of other intangible assets | $ | 14 |
| $ | 4 |
| $ | 4 |
| $ | 68 |
| $ | 14 |
| $ | 4 |
|
Income Tax Expense (Benefit)
|
| | | | | | | | | |
| | For the years ended December 31, |
| | 2018 | 2017 | 2016 |
| Commercial Lines | $ | 267 |
| 377 |
| 415 |
|
| Personal Lines | (19 | ) | 26 |
| (23 | ) |
| Property & Casualty Other Operations | (7 | ) | 24 |
| (355 | ) |
| Group Benefits | 84 |
| 38 |
| 83 |
|
| Hartford Funds | 38 |
| 63 |
| 43 |
|
| Corporate | (95 | ) | 457 |
| (329 | ) |
| Total income tax expense (benefit) | $ | 268 |
| $ | 985 |
| $ | (166 | ) |
|
| | | | | | | | | |
| | For the years ended December 31, |
| | 2017 | 2016 | 2015 |
| Commercial Lines | $ | 377 |
| 415 |
| 403 |
|
| Personal Lines | 26 |
| (23 | ) | 88 |
|
| Property & Casualty Other Operations | 24 |
| (355 | ) | (47 | ) |
| Group Benefits | 38 |
| 83 |
| 63 |
|
| Mutual Funds | 63 |
| 43 |
| 48 |
|
| Corporate | 457 |
| (329 | ) | (266 | ) |
| Total income tax expense (benefit) | $ | 985 |
| $ | (166 | ) | $ | 289 |
|
Assets
|
| | | | | | |
| | As of December 31, |
| | 2018 | 2017 |
| Commercial Lines | $ | 31,693 |
| $ | 31,281 |
|
| Personal Lines | 6,180 |
| 6,251 |
|
| Property & Casualty Other Operations | 3,351 |
| 3,568 |
|
| Group Benefits | 14,114 |
| 14,478 |
|
| Hartford Funds | 583 |
| 547 |
|
| Corporate | 6,386 |
| 169,135 |
|
| Total assets | $ | 62,307 |
| $ | 225,260 |
|
|
| | | | | | |
| | As of December 31, |
| | 2017 | 2016 |
| Commercial Lines [1] [2] | $ | 31,281 |
| $ | 29,845 |
|
| Personal Lines [1] | 6,251 |
| 6,091 |
|
| Property & Casualty Other Operations | 3,568 |
| 4,732 |
|
| Group Benefits [3] | 14,478 |
| 8,825 |
|
| Mutual Funds | 547 |
| 480 |
|
| Corporate | 169,135 |
| 174,603 |
|
| Total assets | $ | 225,260 |
| $ | 224,576 |
|
| |
[1] | For 2016, there was a segment change which resulted in a movement from Commercial Lines to Personal Lines of $8 of total assets associated with our participation in the National Flood Insurance Program.
|
| |
[2] | 2017 and 2016 reflect the addition of $688 and $712, respectively, of gross reserves and reinsurance recoverables for structured settlements reserves and recoverables due from the Company's life and annuity business now classified as held for sale. These amounts were previously eliminated in consolidation.
|
| |
[3] | Certain retained assets of the Company's life and annuity run-off business have been reclassified to Corporate for the prior period. |
THE HARTFORD FINANCIAL SERVICES GROUP, INC.
NOTES TO CONSOLIDATED FINANCIAL STATEMENTS (continued)
5. Fair Value Measurements
FAIR VALUE MEASUREMENTS
The Company carries certain financial assets and liabilities at estimated fair value. Fair value is defined as the price that would be received to sell an asset or paid to transfer a liability in the principal or most advantageous market in an orderly transaction between market participants. Our fair value framework includesinclu
des a hierarchy that gives the highest priority to the use of quoted prices in active markets, followed by the use of market observable inputs, followed by the use of unobservable inputs. The fair value hierarchy levels are as follows:
THE HARTFORD FINANCIAL SERVICES GROUP, INC.
NOTES TO CONSOLIDATED FINANCIAL STATEMENTS (continued)
| |
| Level 1 | Fair values based primarily on unadjusted quoted prices for identical assets, or liabilities, in active markets that the Company has the ability to access at the measurement date. |
| |
| Level 2 | Fair values primarily based on observable inputs, other than quoted prices included in Level 1, or based on prices for similar assets and liabilities. |
| |
| Level 3 | Fair values derived when one or more of the significant inputs are unobservable (including assumptions about risk). With little or no observable market, the determination of fair values uses considerable judgment and represents the Company’s best estimate of an amount that could be realized in a market exchange for the asset or liability. Also included are securities that are traded within illiquid markets and/or priced by independent brokers. |
Company’s best estimate of an amount that could be realized in a market exchange for the asset or liability. Also included are securities that are traded within illiquid markets and/or priced by independent brokers.
The Company will classify the financial asset or liability by level based upon the lowest level input that is significant to the determination of the fair value. In most cases, both observable inputs (e.g., changes in interest rates) and unobservable inputs (e.g., changes in risk assumptions) are used to determine fair values that the Company has classified within Level 3.
|
| | | | | | | | | | | | |
| Assets and (Liabilities) Carried at Fair Value by Hierarchy Level as of December 31, 2018 |
| | Total | Quoted Prices in Active Markets for Identical Assets (Level 1) | Significant Observable Inputs (Level 2) | Significant Unobservable Inputs (Level 3) |
| Assets accounted for at fair value on a recurring basis | | | | |
| Fixed maturities, AFS | | | | |
| Asset backed securities ("ABS") | $ | 1,276 |
| $ | — |
| $ | 1,266 |
| $ | 10 |
|
| Collateralized loan obligations ("CLOs") | 1,437 |
| — |
| 1,337 |
| 100 |
|
| Commercial mortgage-backed securities ("CMBS") | 3,552 |
| — |
| 3,540 |
| 12 |
|
| Corporate | 13,398 |
| — |
| 12,878 |
| 520 |
|
| Foreign government/government agencies | 847 |
| — |
| 844 |
| 3 |
|
| Municipal | 10,346 |
| — |
| 10,346 |
| — |
|
| Residential mortgage-backed securities ("RMBS") | 3,279 |
| — |
| 2,359 |
| 920 |
|
| U.S. Treasuries | 1,517 |
| 330 |
| 1,187 |
| — |
|
| Total fixed maturities | 35,652 |
| 330 |
| 33,757 |
| 1,565 |
|
| Fixed maturities, FVO | 22 |
| — |
| 22 |
| — |
|
| Equity securities, at fair value | 1,214 |
| 1,093 |
| 44 |
| 77 |
|
| Derivative assets | | | | |
| Credit derivatives | 5 |
| — |
| 5 |
| — |
|
| Equity derivatives | 3 |
| — |
| — |
| 3 |
|
| Foreign exchange derivatives | (2 | ) | — |
| (2 | ) | — |
|
| Interest rate derivatives | 1 |
| — |
| 1 |
| — |
|
| Total derivative assets [1] | 7 |
| — |
| 4 |
| 3 |
|
| Short-term investments | 4,283 |
| 1,039 |
| 3,244 |
| — |
|
| Total assets accounted for at fair value on a recurring basis | $ | 41,178 |
| $ | 2,462 |
| $ | 37,071 |
| $ | 1,645 |
|
| Liabilities accounted for at fair value on a recurring basis | |
| |
| |
| |
|
| Derivative liabilities | |
| |
| |
| |
|
| Credit derivatives | (2 | ) | — |
| (2 | ) | — |
|
| Equity derivatives | 1 |
| — |
| 1 |
| — |
|
| Foreign exchange derivatives | (5 | ) | — |
| (5 | ) | — |
|
| Interest rate derivatives | (62 | ) | — |
| (63 | ) | 1 |
|
| Total derivative liabilities [2] | (68 | ) | — |
| (69 | ) | 1 |
|
| Contingent consideration [3] | (35 | ) | — |
| — |
| (35 | ) |
| Total liabilities accounted for at fair value on a recurring basis | $ | (103 | ) | $ | — |
| $ | (69 | ) | $ | (34 | ) |
|
| | | | | | | | | | | | |
| Assets and (Liabilities) Carried at Fair Value by Hierarchy Level as of December 31, 2017 |
| | Total | Quoted Prices in Active Markets for Identical Assets (Level 1) | Significant Observable Inputs (Level 2) | Significant Unobservable Inputs (Level 3) |
| Assets accounted for at fair value on a recurring basis | | | | |
| Fixed maturities, AFS | | | | |
| Asset backed securities ("ABS") | $ | 1,126 |
| $ | — |
| $ | 1,107 |
| $ | 19 |
|
| Collateralized debt obligations ("CDOs") | 1,260 |
| — |
| 1,165 |
| 95 |
|
| Commercial mortgage-backed securities ("CMBS") | 3,336 |
| — |
| 3,267 |
| 69 |
|
| Corporate | 12,804 |
| — |
| 12,284 |
| 520 |
|
| Foreign government/government agencies | 1,110 |
| — |
| 1,108 |
| 2 |
|
| Municipal | 12,485 |
| — |
| 12,468 |
| 17 |
|
| Residential mortgage-backed securities ("RMBS") | 3,044 |
| — |
| 1,814 |
| 1,230 |
|
| U.S. Treasuries | 1,799 |
| 333 |
| 1,466 |
| — |
|
| Total fixed maturities | 36,964 |
| 333 |
| 34,679 |
| 1,952 |
|
| Fixed maturities, FVO | 41 |
| — |
| 41 |
| — |
|
| Equity securities, AFS | 1,012 |
| 887 |
| 49 |
| 76 |
|
| Derivative assets | | | | |
| Credit derivatives | 9 |
| — |
| 9 |
| — |
|
| Equity derivatives | 1 |
| — |
| — |
| 1 |
|
| Foreign exchange derivatives | (1 | ) | — |
| (1 | ) | — |
|
| Interest rate derivatives | 1 |
| — |
| 1 |
| — |
|
| Total derivative assets [1] | 10 |
| — |
| 9 |
| 1 |
|
| Short-term investments | 2,270 |
| 1,098 |
| 1,172 |
| — |
|
| Total assets accounted for at fair value on a recurring basis | $ | 40,297 |
| $ | 2,318 |
| $ | 35,950 |
| $ | 2,029 |
|
| Liabilities accounted for at fair value on a recurring basis | |
| |
| |
| |
|
| Derivative liabilities | |
| |
| |
| |
|
| Credit derivatives | (3 | ) | — |
| (3 | ) | — |
|
| Foreign exchange derivatives | (13 | ) | — |
| (13 | ) | — |
|
| Interest rate derivatives | (84 | ) | — |
| (85 | ) | 1 |
|
| Total derivative liabilities [2] | (100 | ) | — |
| (101 | ) | 1 |
|
| Contingent consideration [3] | (29 | ) | — |
| — |
| (29 | ) |
| Total liabilities accounted for at fair value on a recurring basis | $ | (129 | ) | $ | — |
| $ | (101 | ) | $ | (28 | ) |
THE HARTFORD FINANCIAL SERVICES GROUP, INC.
NOTES TO CONSOLIDATED FINANCIAL STATEMENTS (continued)
5. Fair Value Measurements (continued)
|
| | | | | | | | | | | | |
| Assets and (Liabilities) Carried at Fair Value by Hierarchy Level as of December 31, 2016 |
| | Total | Quoted Prices in Active Markets for Identical Assets (Level 1) | Significant Observable Inputs (Level 2) | Significant Unobservable Inputs (Level 3) |
| Assets accounted for at fair value on a recurring basis | | | | |
| Fixed maturities, AFS | | | | |
| ABS | $ | 1,389 |
| $ | — |
| $ | 1,344 |
| $ | 45 |
|
| CDOs | 976 |
| — |
| 822 |
| 154 |
|
| CMBS | 2,790 |
| — |
| 2,731 |
| 59 |
|
| Corporate | 10,973 |
| — |
| 10,459 |
| 514 |
|
| Foreign government/government agencies | 826 |
| — |
| 779 |
| 47 |
|
| Municipal | 10,297 |
| — |
| 10,251 |
| 46 |
|
| RMBS | 3,006 |
| — |
| 1,745 |
| 1,261 |
|
| U.S. Treasuries | 1,925 |
| 390 |
| 1,535 |
| — |
|
| Total fixed maturities | 32,182 |
| 390 |
| 29,666 |
| 2,126 |
|
| Fixed maturities, FVO | 211 |
| 1 |
| 199 |
| 11 |
|
| Equity securities, AFS | 945 |
| 801 |
| 89 |
| 55 |
|
| Derivative assets | | | | |
| Credit derivatives | 18 |
| — |
| 18 |
| — |
|
| Foreign exchange derivatives | 23 |
| — |
| 23 |
| — |
|
| Interest rate derivatives | (457 | ) | — |
| (457 | ) | — |
|
| Other derivative contracts | 1 |
| — |
| — |
| 1 |
|
| Total derivative assets [1] | (415 | ) | — |
| (416 | ) | 1 |
|
| Short-term investments | 1,895 |
| 241 |
| 1,654 |
| — |
|
| Total assets accounted for at fair value on a recurring basis | $ | 34,818 |
| $ | 1,433 |
| $ | 31,192 |
| $ | 2,193 |
|
| Liabilities accounted for at fair value on a recurring basis | | | | |
| Derivative liabilities | | | | |
| Credit derivatives | (14 | ) | — |
| (14 | ) | — |
|
| Foreign exchange derivatives | 10 |
| — |
| 10 |
| — |
|
| Interest rate derivatives | (108 | ) | — |
| (117 | ) | 9 |
|
| Total derivative liabilities [2] | (112 | ) | — |
| (121 | ) | 9 |
|
| Contingent consideration [3] | (25 | ) | — |
| — |
| (25 | ) |
| Total liabilities accounted for at fair value on a recurring basis | $ | (137 | ) | $ | — |
| $ | (121 | ) | $ | (16 | ) |
| |
| [1] | Includes OTC and OTC-cleared derivative instruments in a net positive fair value position after consideration of the accrued interest and impact of collateral posting requirements which may be imposed by agreements clearing house rules and applicable law. See footnote 2 to this table for derivative liabilities. |
| |
| [2] | Includes OTC and OTC-cleared derivative instruments in a net negative fair value position (derivative liability) after consideration of the accrued interest and impact of collateral posting requirements which may be imposed by agreements clearing house rulesand applicable law. |
| |
| [3] | For additional information see the Contingent Consideration section below. |
THE HARTFORD FINANCIAL SERVICES GROUP, INC.
NOTES TO CONSOLIDATED FINANCIAL STATEMENTS (continued)
|
| | | | | | | | | | | | |
| Assets and (Liabilities) Carried at Fair Value by Hierarchy Level as of December 31, 2017 |
| | Total | Quoted Prices in Active Markets for Identical Assets (Level 1) | Significant Observable Inputs (Level 2) | Significant Unobservable Inputs (Level 3) |
| Assets accounted for at fair value on a recurring basis | | | | |
| Fixed maturities, AFS | | | | |
| Asset-backed-securities ("ABS") | $ | 1,126 |
| $ | — |
| $ | 1,107 |
| $ | 19 |
|
| Collateralized loan obligations ("CLOs") | 1,260 |
| — |
| 1,165 |
| 95 |
|
| Commercial mortgage-backed securities ("CMBS") | 3,336 |
| — |
| 3,267 |
| 69 |
|
| Corporate | 12,804 |
| — |
| 12,284 |
| 520 |
|
| Foreign government/government agencies | 1,110 |
| — |
| 1,108 |
| 2 |
|
| Municipal | 12,485 |
| — |
| 12,468 |
| 17 |
|
| Residential mortgage-backed securities ("RMBS") | 3,044 |
| — |
| 1,814 |
| 1,230 |
|
| U.S. Treasuries | 1,799 |
| 333 |
| 1,466 |
| — |
|
| Total fixed maturities | 36,964 |
| 333 |
| 34,679 |
| 1,952 |
|
| Fixed maturities, FVO | 41 |
| — |
| 41 |
| — |
|
| Equity securities, AFS | 1,012 |
| 887 |
| 49 |
| 76 |
|
| Derivative assets | | | | |
| Credit derivatives | 9 |
| — |
| 9 |
| — |
|
| Foreign exchange derivatives | (1 | ) | — |
| (1 | ) | — |
|
| Equity derivatives | 1 |
| — |
| — |
| 1 |
|
| Interest rate derivatives | 1 |
| — |
| 1 |
| — |
|
| Total derivative assets [1] | 10 |
| — |
| 9 |
| 1 |
|
| Short-term investments | 2,270 |
| 1,098 |
| 1,172 |
| — |
|
| Total assets accounted for at fair value on a recurring basis | $ | 40,297 |
| $ | 2,318 |
| $ | 35,950 |
| $ | 2,029 |
|
| Liabilities accounted for at fair value on a recurring basis | | | | |
| Derivative liabilities | | | | |
| Credit derivatives | (3 | ) | — |
| (3 | ) | — |
|
| Foreign exchange derivatives | (13 | ) | — |
| (13 | ) | — |
|
| Interest rate derivatives | (84 | ) | — |
| (85 | ) | 1 |
|
| Total derivative liabilities [2] | (100 | ) | — |
| (101 | ) | 1 |
|
| Contingent consideration [3] | (29 | ) | — |
| — |
| (29 | ) |
| Total liabilities accounted for at fair value on a recurring basis | $ | (129 | ) | $ | — |
| $ | (101 | ) | $ | (28 | ) |
| |
| [1] | Includes derivative instruments in a net positive fair value position after consideration of the accrued interest and impact of collateral posting requirements which may be imposed by agreements and applicable law. See footnote 2 to this table for derivative liabilities. |
| |
| [2] | Includes derivative instruments in a net negative fair value position (derivative liability) after consideration of the accrued interest and impact of collateral posting requirements which may be imposed by agreements and applicable law. |
| |
| [3] | For additional information see the Contingent Consideration section below. |
Fixed Maturities, Equity Securities, Short-term Investments, and Free-standing Derivatives
Valuation Techniques
The Company generally determines fair values using valuation techniques that use prices, rates, and other relevant information evident from market transactions involving identical or similar instruments. Valuation techniques also include, where appropriate, estimates of future cash flows that are converted into a single discounted amount using current market expectations. The Company uses a "waterfall" approach
comprised of the following pricing sources and techniques, which are listed in priority order:
Quoted prices, unadjusted, for identical assets or liabilities in active markets, which are classified as Level 1.
Prices from third-party pricing services, which primarily utilize a combination of techniques. These services utilize recently reported trades of identical, similar, or benchmark securities making adjustments for market observable inputs available through the reporting date. If there are no recently reported trades, they may use a discounted cash flow technique to develop a price using expected cash flows based upon the anticipated future performance of the underlying collateral discounted at an estimated market rate. Both techniques develop prices that consider the time value of future cash flows and provide a margin for risk, including liquidity and credit risk. Most prices provided by third-party
THE HARTFORD FINANCIAL SERVICES GROUP, INC.
NOTES TO CONSOLIDATED FINANCIAL STATEMENTS (continued)
5. Fair Value Measurements (continued)
pricing services are classified as Level 2 because the inputs used in pricing the securities are observable. However, some
THE HARTFORD FINANCIAL SERVICES GROUP, INC.
NOTES TO CONSOLIDATED FINANCIAL STATEMENTS (continued)
securities that are less liquid or trade less actively are classified as Level 3. Additionally, certain long-dated securities, including certainsuch as municipal securities, foreign government/government agency securities and bank loans, include benchmark interest rate or credit spread assumptions that are not observable in the marketplace and are thus classified as Level 3.
Internal matrix pricing, which is a valuation process internally developed for private placement securities for which the Company is unable to obtain a price from a third-party pricing service. Internal pricing matrices determine credit spreads that, when combined with risk-free rates, are applied to contractual cash flows to develop a price. The Company develops credit spreads using market based data for public securities adjusted for credit spread differentials between public and private securities, which are obtained from a survey of multiple private placement brokers. The market-based reference credit spread considers the issuer’s financial strength and term to maturity, using an independent public security index and trade information, while the credit spread differential considers the non-public nature of the security. Securities priced using internal matrix pricing are classified as Level 2 because the inputs are observable or can be corroborated with observable data.
Independent broker quotes, which are typically non-binding, use inputs that can be difficult to corroborate with observable market based data. Brokers may use present value techniques using assumptions specific to the security types, or they may use recent transactions of similar securities. Due to the lack of transparency in the process that brokers use to develop prices, valuations that are based on independent broker quotes are classified as Level 3.
The fair value of free-standing derivative instruments is determined primarily using a discounted cash flow model or option model technique and incorporate counterparty credit risk. In some cases, quoted market prices for exchange-traded and OTC-cleared derivatives may be used and in other cases independent broker quotes may be used. The pricing valuation models primarily use inputs that are observable in the market or can be corroborated by observable market data. The valuation of certain derivatives may include significant inputs that are unobservable, such as volatility levels, and reflect the Company’s view of what other market participants would use when pricing such instruments.
Valuation Controls
The fair value process for investments is monitored by the Valuation Committee, which is a cross-functional group of senior management within the Company that meets at least quarterly. The purpose of the committee is to oversee the pricing policy and procedures, as well as to approve changes to valuation methodologies and pricing sources. Controls and procedures used to assess third-party pricing services are reviewed by the Valuation Committee, including the results of annual due-diligence reviews.
There are also two working groups under the Valuation Committee: a Securities Fair Value Working Group (“Securities
Working Group”) and a Derivatives Fair Value Working Group ("Derivatives Working Group"). The working groups, which include various investment, operations, accounting and risk
management professionals, meet monthly to review market data trends, pricing and trading statistics and results, and any proposed pricing methodology changes.
The Securities Working Group reviews prices received from third parties to ensure that the prices represent a reasonable estimate of the fair value. The group considers trading volume, new issuance activity, market trends, new regulatory rulings and other factors to determine whether the market activity is significantly different than normal activity in an active market. A dedicated pricing unit follows up with trading and investment sector professionals and challenges prices of third-party pricing services when the estimated assumptions used differ from what the unit believes a market participant would use. If the available evidence indicates that pricing from third-party pricing services or broker quotes is based upon transactions that are stale or not from trades made in an orderly market, the Company places little, if any, weight on the third party service’s transaction price and will estimate fair value using an internal process, such as a pricing matrix.
The Derivatives Working Group reviews the inputs, assumptions and methodologies used to ensure that the prices represent a reasonable estimate of the fair value. A dedicated pricing team works directly with investment sector professionals to investigate the impacts of changes in the market environment on prices or valuations of derivatives. New models and any changes to current models are required to have detailed documentation and are validated to a second source. The model validation documentation and results of validation are presented to the Valuation Committee for approval.
The Company conducts other monitoring controls around securities and derivatives pricing including, but not limited to, the following:
Review of daily price changes over specific thresholds and new trade comparison to third-party pricing services.
Daily comparison of OTC derivative market valuations to counterparty valuations.
Review of weekly price changes compared to published bond prices of a corporate bond index.
Monthly reviews of price changes over thresholds, stale prices, missing prices, and zero prices.
Monthly validation of prices to a second source for securities in most sectors and for certain derivatives.
In addition, the Company’s enterprise-wide Operational Risk Management function, led by the Chief Risk Officer, is responsible for model risk management and provides an independent review of the suitability and reliability of model inputs, as well as an analysis of significant changes to current models.
Valuation Inputs
Quoted prices for identical assets in active markets are considered Level 1 and consist of on-the-run U.S. Treasuries, money market funds, exchange-traded equity securities, open-open-ended mutual funds, certain short-term investments, and exchange traded futures and option contracts.
THE HARTFORD FINANCIAL SERVICES GROUP, INC.
NOTES TO CONSOLIDATED FINANCIAL STATEMENTS (continued)
5. Fair Value Measurements (continued)
ended mutual funds, short-term investments, and exchange traded futures and option contracts.
Valuation Inputs Used in Levels 2 and 3 Measurements for Securities and Freestanding Derivatives
|
| | |
| | Level 2 Primary Observable Inputs | Level 3 Primary Unobservable Inputs |
| Fixed Maturity Investments | |
Structured securities (includes ABS, CDOsCLOs CMBS and RMBS) | |
| | • Benchmark yields and spreads • Monthly payment information • Collateral performance, which varies by vintage year and includes delinquency rates, loss severity rates and refinancing assumptions • Credit default swap indices
Other inputs for ABS and RMBS: • Estimate of future principal prepayments, derived from the characteristics of the underlying structure • Prepayment speeds previously experienced at the interest rate levels projected for the collateral | • Independent broker quotes • Credit spreads beyond observable curve • Interest rates beyond observable curve
Other inputs for less liquid securities or those that trade less actively, including subprime RMBS: • Estimated cash flows • Credit spreads, which include illiquidity premium • Constant prepayment rates • Constant default rates • Loss severity |
| Corporates | |
| | • Benchmark yields and spreads • Reported trades, bids, offers of the same or similar securities • Issuer spreads and credit default swap curves
Other inputs for investment grade privately placed securities that utilize internal matrix pricing : • Credit spreads for public securities of similar quality, maturity, and sector, adjusted for non-public nature | • Independent broker quotes • Credit spreads beyond observable curve • Interest rates beyond observable curve
Other inputs for below investment grade privately placed securities: • Independent broker quotes • Credit spreads for public securities of similar quality, maturity, and sector, adjusted for non-public nature |
| U.S Treasuries, Municipals, and Foreign government/government agencies |
| | • Benchmark yields and spreads • Issuer credit default swap curves • Political events in emerging market economies • Municipal Securities Rulemaking Board reported trades and material event notices • Issuer financial statements | • Credit spreads beyond observable curve • Interest rates beyond observable curve |
| Equity Securities | |
| | • Quoted prices in markets that are not active | • For privately traded equity securities, internal discounted cash flow models utilizing earnings multiples or other cash flow assumptions that are not observable |
| Short Term Investments | |
| | • Benchmark yields and spreads • Reported trades, bids, offers • Issuer spreads and credit default swap curves • Material event notices and new issue money market rates | Not applicable |
| Derivatives | |
| Credit derivatives | |
| | • Swap yield curve • Credit default swap curves | Not applicable |
| Equity derivatives | |
| | • Equity index levels • Swap yield curve | • Independent broker quotes • Equity volatility |
| Foreign exchange derivatives | |
| | • Swap yield curve • Currency spot and forward rates • Cross currency basis curves | Not applicable |
| Interest rate derivatives | |
| | • Swap yield curve | • Independent broker quotes • Interest rate volatility |
THE HARTFORD FINANCIAL SERVICES GROUP, INC.
NOTES TO CONSOLIDATED FINANCIAL STATEMENTS (continued)
5. Fair Value Measurements (continued)
Significant Unobservable Inputs for Level 3 - Securities | | | Assets accounted for at fair value on a recurring basis | Fair Value | Predominant Valuation Technique | Significant Unobservable Input | Minimum | Maximum | Weighted Average [1] | Impact of Increase in Input on Fair Value [2] | Fair Value | Predominant Valuation Technique | Significant Unobservable Input | Minimum | Maximum | Weighted Average [1] | Impact of Increase in Input on Fair Value [2] |
| As of December 31, 2018 | | As of December 31, 2018 |
| CMBS [3] | | $ | 2 |
| Discounted cash flows | Spread (encompasses prepayment, default risk and loss severity) | 9 bps | 1,040 bps | 182 bps | Decrease |
| Corporate [4] | | 274 |
| Discounted cash flows | Spread | 145 bps | 1,175 bps | 263 bps | Decrease |
| RMBS [3] | | 815 |
| Discounted cash flows | Spread [6] | 12 bps | 215 bps | 86 bps | Decrease |
| | | | | Constant prepayment rate [6] | 1% | 15% | 6% | Decrease [5] |
| | | | | Constant default rate [6] | 1% | 8% | 3% | Decrease |
| | | | | Loss severity [6] | —% | 100% | 61% | Decrease |
As of December 31, 2017 | | CMBS [3] | $ | 56 |
| Discounted cash flows | Spread (encompasses prepayment, default risk and loss severity) | 9 bps | 1,040 bps | 400 bps | Decrease | $ | 56 |
| Discounted cash flows | Spread (encompasses prepayment, default risk and loss severity) | 9 | bps | 1,040 | bps | 400 | bps | Decrease |
| Corporate [4] | 251 |
| Discounted cash flows | Spread | 103 bps | 1,000 bps | 242 bps | Decrease | 251 |
| Discounted cash flows | Spread | 103 | bps | 1,000 | bps | 242 | bps | Decrease |
| Municipal | 17 |
| Discounted cash flows | Spread | 192 bps | 250 bps | 219 bps | Decrease | 17 |
| Discounted cash flows | Spread | 192 | bps | 250 | bps | 219 | bps | Decrease |
| RMBS [3] | 1,215 |
| Discounted cash flows | Spread | 24 bps | 351 bps | 74 bps | Decrease | 1,215 |
| Discounted cash flows | Spread [6] | 24 | bps | 351 | bps | 74 | bps | Decrease |
| | | | Constant prepayment rate | 1.0% | 25% | 6% | Decrease [5] | | | Constant prepayment rate [6] | 1% | 25% | 6% | Decrease [5] |
| | | | Constant default rate | —% | 9% | 4% | Decrease | | | Constant default rate [6] | —% | 9% | 4% | Decrease |
| | | | Loss severity | —% | 100% | 66% | Decrease | | | Loss severity [6] | —% | 100% | 66% | Decrease |
| As of December 31, 2016 | |
| CMBS [3] | $ | 42 |
| Discounted cash flows | Spread (encompasses prepayment, default risk and loss severity) | 10 | bps | 1,084 | bps | 405 | bps | Decrease | |
| Corporate [4] | 245 |
| Discounted cash flows | Spread | 122 | bps | 1,302 | bps | 345 | bps | Decrease | |
| Municipal [3] | 46 |
| Discounted cash flows | Spread | 135 | bps | 286 | bps | 252 | bps | Decrease | |
| RMBS [3] | 1,260 |
| Discounted cash flows | Spread | 16 | bps | 731 | bps | 193 | bps | Decrease | |
| | | | Constant prepayment rate | —% | 17% | 4% | Decrease [5] | |
| | | | Constant default rate | —% | 11% | 5% | Decrease | |
| | | | Loss severity | —% | 100% | 75% | Decrease | |
| |
| [1] | The weighted average is determined based on the fair value of the securities. |
| |
| [2] | Conversely, the impact of a decrease in input would have the opposite impact to the fair value as that presented in the table. |
| |
| [3] | Excludes securities for which the Company basedbases fair value on broker quotations. |
| |
| [4] | Excludes securities for which the Company bases fair value on broker quotations; however, included are broker priced lower-rated private placement securities for which the Company receives spread and yield information to corroborate the fair value. |
| |
| [5] | Decrease for above market rate coupons and increase for below market rate coupons. |
| |
| [6] | Generally, a change in the assumption used for the constant default rate would have been accompanied by a directionally similar change in the assumption used for the loss severity and a directionally opposite change in the assumption used for constant prepayment rate and would have resulted in wider spreads. |
THE HARTFORD FINANCIAL SERVICES GROUP, INC.
NOTES TO CONSOLIDATED FINANCIAL STATEMENTS (continued)
5. Fair Value Measurements (continued)
Significant Unobservable Inputs for Level 3 - Freestanding Derivatives |
| | | | | | | | | |
| | Fair Value | Predominant Valuation Technique | Significant Unobservable Input | Minimum | Maximum | Impact of Increase in Input on Fair Value [1] |
| As of December 31, 2017 |
| Interest rate swaptions [2] | 1 |
| Option model | Interest rate volatility | 2 | % | 2 | % | Increase |
| Equity options | 1 |
| Option model | Equity volatility | 18 | % | 22 | % | Increase |
| As of December 31, 2016 |
| Interest rate derivatives | | | | | | |
| Interest rate swaptions | 9 |
| Option model | Interest rate volatility | 2 | % | 2 | % | Increase |
|
| | | | | | | | | | | |
| | Fair Value | Predominant Valuation Technique | Significant Unobservable Input | Minimum | Maximum | Weighted Average [1] | Impact of Increase in Input on Fair Value [2] |
| As of December 31, 2018 |
| Interest rate swaptions [3] | 1 |
| Option model | Interest rate volatility | 3 | % | 3 | % | 3 | % | Increase |
| Equity options | 3 |
| Option model | Equity volatility | 19 | % | 21 | % | 20 | % | Increase |
| As of December 31, 2017 |
| Interest rate swaptions [3] | 1 |
| Option model | Interest rate volatility | 2 | % | 2 | % | 2 | % | Increase |
| Equity options | 1 |
| Option model | Equity volatility | 18 | % | 22 | % | 20 | % | Increase |
| |
| [1] | The weighted average is determined based on the fair value of the derivatives. |
| |
| [2] | Conversely, the impact of a decrease in input would have the opposite impact to the fair value as that presented in the table. Changes are based on long positions, unless otherwise noted. Changes in fair value will be inversely impacted for short positions. |
| |
[2]3] | The swaptions presented are purchased options that have the right to enter into a pay-fixed swap. |
THE HARTFORD FINANCIAL SERVICES GROUP, INC.
NOTES TO CONSOLIDATED FINANCIAL STATEMENTS (continued)
The tables above exclude the portion of ABS, CRE CDOs and certain corporate securities for which fair values are predominately based on independent broker quotes. While the Company does not have access to the significant unobservable inputs that independent brokers may use in their pricing process, the Company believes brokers likely use inputs similar to those used by the Company and third-party pricing services to price similar instruments. As such, in their pricing models, brokers likely use estimated loss severity rates, prepayment rates, constant default rates and credit spreads. Therefore, similar to non-broker priced securities, increases in these inputs would generally cause fair values to decrease. For the year ended December 31, 2017,2018, no significant adjustments were made by the Company to broker prices received.
Transfers between Levels
Transfers of securities among the levels occur at the beginning of the reporting period. The amount of transfers from Level 1 to Level 2 was $1.3 billion and $1.1 billion, for the years ended December 31, 2017 and 2016, respectively, which represented previously on-the-run U.S. Treasury securities that are now off-the-run. For the years ended December 31, 2017 and 2016, there were no transfers from Level 2 to Level 1. See the fair value roll-forward tables for the years ended December 31, 2017 and 2016, for the transfers into and out of Level 3.
Contingent Consideration
The acquisition of Lattice Strategies LLC ("Lattice") inon July 29, 2016 requires the Company to make payments to former owners of
Lattice of up to $60 contingent upon growth in exchange-traded products ("ETP") AUM over a four-year period of four years beginning on the date of acquisition. The contingent consideration is measured at fair value on a quarterly basis by projecting future eligible ETP AUM over the contingency period to estimate the amount of expected payout. The future expected payout is discounted back to the valuation date using a risk-adjusted discount rate of 18.8%16.6%. The risk-adjusted discount rate is an internally generated and significant unobservable input to fair value.
The contingency period for ETP AUM growth ends July 29, 2020 and management adjusts the fair value of the contingent consideration when it revises its projection of ETP AUM for the acquired business. Before discounting to fair value, the Company has accrued consideration payable of $40 assuming ETP AUM for the acquired business grows to approximately $4 billion over the contingency period. This contingent consideration payable included $10 payable in the first quarter of 2019 given that ETP AUM reached $1 billion in the fourth quarter of 2018.
Level 3 Assets and Liabilities Measured at Fair Value on a Recurring Basis Using Significant Unobservable Inputs
The Company uses derivative instruments to manage the risk associated with certain assets and liabilities. However, the derivative instrument may not be classified with the same fair value hierarchy level as the associated asset or liability. Therefore, the realized and unrealized gains and losses on derivatives reported in the Level 3 roll-forwardrollforward may be offset by realized and unrealized gains and losses of the associated assets and liabilities in other line items of the financial statements.
THE HARTFORD FINANCIAL SERVICES GROUP, INC.
NOTES TO CONSOLIDATED FINANCIAL STATEMENTS (continued)
5.
Fair Value Measurements (continued)
Fair Value Roll-forwardsRollforwards for Financial Instruments Classified as Level 3 for the Year Ended December 31, 20172018 |
| | | | | | | | | | | | | | | | | | | | | | | | | | | | |
| | Total realized/unrealized gains (losses) | | | | | | |
| | | Fair value as of January 1, 2018 | Included in net income [1] | Included in OCI [2] | Purchases | Settlements | Sales | Transfers into Level 3 [3] | Transfers out of Level 3 [3] | Fair value as of December 31, 2018 |
| Assets | | | | | | | | | |
| Fixed Maturities, AFS | | | | | | | | | |
| | ABS | $ | 19 |
| $ | — |
| $ | — |
| $ | 90 |
| $ | (5 | ) | $ | (4 | ) | $ | 12 |
| $ | (102 | ) | $ | 10 |
|
| | CLOs | 95 |
| — |
| — |
| 330 |
| — |
| (13 | ) | — |
| (312 | ) | 100 |
|
| | CMBS | 69 |
| (1 | ) | — |
| 25 |
| (14 | ) | (8 | ) | — |
| (59 | ) | 12 |
|
| | Corporate | 520 |
| 1 |
| (18 | ) | 197 |
| (36 | ) | (52 | ) | 31 |
| (123 | ) | 520 |
|
| | Foreign Govt./Govt. Agencies | 2 |
| — |
| — |
| 1 |
| — |
| — |
| — |
| — |
| 3 |
|
| | Municipal | 17 |
| — |
| (1 | ) | — |
| — |
| (1 | ) | — |
| (15 | ) | — |
|
| | RMBS | 1,230 |
| — |
| (16 | ) | 273 |
| (319 | ) | (52 | ) | 4 |
| (200 | ) | 920 |
|
| Total Fixed Maturities, AFS | 1,952 |
| — |
| (35 | ) | 916 |
| (374 | ) | (130 | ) | 47 |
| (811 | ) | 1,565 |
|
| Equity Securities, at fair value | 76 |
| 29 |
| — |
| 12 |
| — |
| (40 | ) | — |
| — |
| 77 |
|
| Derivatives, net [4] | | | | | | | | | |
| | Equity | 1 |
| 3 |
| — |
| 1 |
| — |
| (2 | ) | — |
| — |
| 3 |
|
| | Interest rate | 1 |
| — |
| — |
| — |
| — |
| — |
| — |
| — |
| 1 |
|
| Total Derivatives, net [4] | 2 |
| 3 |
| — |
| 1 |
| — |
| (2 | ) | — |
| — |
| 4 |
|
| Total Assets | 2,030 |
| 32 |
| (35 | ) | 929 |
| (374 | ) | (172 | ) | 47 |
| (811 | ) | 1,646 |
|
| Liabilities | | | | | | | | | |
| Contingent Consideration [5] | (29 | ) | (6 | ) | — |
| — |
| — |
| — |
| — |
| — |
| (35 | ) |
| Total Liabilities | $ | (29 | ) | $ | (6 | ) | $ | — |
| $ | — |
| $ | — |
| $ | — |
| $ | — |
| $ | — |
| $ | (35 | ) |
|
| | | | | | | | | | | | | | | | | | | | | | | | | | | | |
| | Total realized/unrealized gains (losses) | | | | | | |
| | | Fair value as of January 1, 2017 | Included in net income [1][5] | Included in OCI [2] | Purchases | Settlements | Sales | Transfers into Level 3 [3] | Transfers out of Level 3 [3] | Fair value as of December 31, 2017 |
| Assets | | | | | | | | | |
| Fixed Maturities, AFS | | | | | | | | | |
| | ABS | $ | 45 |
| $ | — |
| $ | — |
| $ | 56 |
| $ | (6 | ) | $ | (6 | ) | $ | 27 |
| $ | (97 | ) | $ | 19 |
|
| | CDOs | 154 |
| 18 |
| (13 | ) | 214 |
| (101 | ) | (24 | ) | — |
| (153 | ) | 95 |
|
| | CMBS | 59 |
| (2 | ) | — |
| 76 |
| (9 | ) | (10 | ) | — |
| (45 | ) | 69 |
|
| | Corporate | 514 |
| 1 |
| 19 |
| 232 |
| (76 | ) | (157 | ) | 71 |
| (84 | ) | 520 |
|
| | Foreign Govt./Govt. Agencies | 47 |
| — |
| 3 |
| 12 |
| (1 | ) | (2 | ) | — |
| (57 | ) | 2 |
|
| | Municipal | 46 |
| 4 |
| 1 |
| 1 |
| — |
| (35 | ) | — |
| — |
| 17 |
|
| | RMBS | 1,261 |
| — |
| 36 |
| 209 |
| (268 | ) | (7 | ) | — |
| (1 | ) | 1,230 |
|
| Total Fixed Maturities, AFS | 2,126 |
| 21 |
| 46 |
| 800 |
| (461 | ) | (241 | ) | 98 |
| (437 | ) | 1,952 |
|
| Fixed Maturities, FVO | 11 |
| — |
| — |
| 4 |
| (2 | ) | (13 | ) | — |
| — |
| — |
|
| Equity Securities, AFS | 55 |
| — |
| (3 | ) | 24 |
| — |
| — |
| — |
| — |
| 76 |
|
| Freestanding Derivatives, net [4] | | | | | | | | | |
| | Equity | — |
| (4 | ) | — |
| 5 |
| — |
| — |
| — |
| — |
| 1 |
|
| | Interest rate | 9 |
| (8 | ) | — |
| — |
| — |
| — |
| — |
| — |
| 1 |
|
| | Other contracts | 1 |
| (1 | ) | — |
| — |
| — |
| — |
| — |
| — |
| — |
|
| Total Freestanding Derivatives, net [4] | 10 |
| (13 | ) | — |
| 5 |
| — |
| — |
| — |
| — |
| 2 |
|
| Total Assets | 2,202 |
| 8 |
| 43 |
| 833 |
| (463 | ) | (254 | ) | 98 |
| (437 | ) | 2,030 |
|
| Liabilities | | | | | | | | | |
| Contingent Consideration [6] | (25 | ) | (4 | ) | — |
| — |
| — |
| — |
| — |
| — |
| (29 | ) |
| Total Liabilities | $ | (25 | ) | $ | (4 | ) | $ | — |
| $ | — |
| $ | — |
| $ | — |
| $ | — |
| $ | — |
| $ | (29 | ) |
THE HARTFORD FINANCIAL SERVICES GROUP, INC.
NOTES TO CONSOLIDATED FINANCIAL STATEMENTS (continued)
5. Fair Value Measurements (continued)
Fair Value Roll-forwards for Financial Instruments Classified as Level 3 for the Year Ended December 31, 2016 |
| | | | | | | | | | | | | | | | | | | | | | | | | | | | |
| | Total realized/unrealized gains (losses) | | | | | | |
| | | Fair value as of January 1, 2016 | Included in net income [1][5] | Included in OCI [2] | Purchases [6] | Settlements | Sales | Transfers into Level 3 [3] | Transfers out of Level 3 [3] | Fair value as of December 31, 2016 |
| Assets | | | | | | | | | |
| Fixed Maturities, AFS | | | | | | | | | |
| | ABS | $ | 32 |
| $ | — |
| $ | (1 | ) | $ | 33 |
| $ | (6 | ) | $ | — |
| $ | 16 |
| $ | (29 | ) | $ | 45 |
|
| | CDOs | 211 |
| — |
| 9 |
| 36 |
| (102 | ) | — |
| — |
| — |
| 154 |
|
| | CMBS | 88 |
| (4 | ) | (1 | ) | 45 |
| (15 | ) | (1 | ) | 1 |
| (54 | ) | 59 |
|
| | Corporate | 320 |
| (12 | ) | 1 |
| 197 |
| (34 | ) | (102 | ) | 265 |
| (121 | ) | 514 |
|
| | Foreign Govt./Govt. Agencies | 43 |
| 1 |
| 2 |
| 16 |
| — |
| (15 | ) | — |
| — |
| 47 |
|
| | Municipal | — |
| — |
| (1 | ) | 39 |
| — |
| — |
| 8 |
| — |
| 46 |
|
| | RMBS | 994 |
| (1 | ) | 9 |
| 463 |
| (174 | ) | (21 | ) | 3 |
| (12 | ) | 1,261 |
|
| Total Fixed Maturities, AFS | 1,688 |
| (16 | ) | 18 |
| 829 |
| (331 | ) | (139 | ) | 293 |
| (216 | ) | 2,126 |
|
| Fixed Maturities, FVO | 14 |
| (1 | ) | — |
| 14 |
| (4 | ) | (3 | ) | — |
| (9 | ) | 11 |
|
| Equity Securities, AFS | 55 |
| (1 | ) | 4 |
| 2 |
| — |
| (5 | ) | — |
| — |
| 55 |
|
| Freestanding Derivatives, net [4] | | | | | | | | | |
| | Equity | — |
| (8 | ) | — |
| 8 |
| — |
| — |
| — |
| — |
| — |
|
| | Interest rate | 7 |
| 2 |
| — |
| — |
| — |
| — |
| — |
| — |
| 9 |
|
| | Other contracts | 7 |
| (6 | ) | — |
| — |
| — |
| — |
| — |
| — |
| 1 |
|
| Total Freestanding Derivatives, net [4] | 14 |
| (12 | ) | — |
| 8 |
| — |
| — |
| — |
| — |
| 10 |
|
| Total Assets | 1,771 |
| (30 | ) | 22 |
| 853 |
| (335 | ) | (147 | ) | 293 |
| (225 | ) | 2,202 |
|
| Liabilities | | | | | | | | | |
| Contingent Considerations [6] | — |
| (2 | ) | — |
| (23 | ) | — |
| — |
| — |
| — |
| (25 | ) |
| Total Liabilities | $ | — |
| $ | (2 | ) | $ | — |
| $ | (23 | ) | $ | — |
| $ | — |
| $ | — |
| $ | — |
| $ | (25 | ) |
| |
| [1] | Amounts in these rowscolumns are generally reported in net realized capital gains (losses). All amounts are before income taxes. |
| |
| [2] | All amounts are before income taxes. |
| |
| [3] | Transfers in and/or (out) of Level 3 are primarily attributable to the availability of market observable information and the re-evaluation of the observability of pricing inputs. |
| |
| [4] | Derivative instruments are reported in this table on a net basis for asset (liability) positions and reported in the Consolidated Balance Sheets in other investments and other liabilities. |
| |
| [5] | For additional information, see Note 2 - Business Acquisitions of Notes to Consolidated Financial Statement for discussion of the contingent consideration in connection with the acquisition of Lattice. Includes both market and non-market impacts in deriving realized and unrealized gains (losses). |
THE HARTFORD FINANCIAL SERVICES GROUP, INC.
NOTES TO CONSOLIDATED FINANCIAL STATEMENTS (continued)
Fair Value Rollforwards for Financial Instruments Classified as Level 3 for the Year Ended December 31, 2017 |
| | | | | | | | | | | | | | | | | | | | | | | | | | | | |
| | Total realized/unrealized gains (losses) | | | | | | |
| | | Fair value as of January 1, 2017 | Included in net income [1] | Included in OCI [2] | Purchases | Settlements | Sales | Transfers into Level 3 [3] | Transfers out of Level 3 [3] | Fair value as of December 31, 2017 |
| Assets | | | | | | | | | |
| Fixed Maturities, AFS | | | | | | | | | |
| | ABS | $ | 45 |
| $ | — |
| $ | — |
| $ | 56 |
| $ | (6 | ) | $ | (6 | ) | $ | 27 |
| $ | (97 | ) | $ | 19 |
|
| | CLOs | 154 |
| 18 |
| (13 | ) | 214 |
| (101 | ) | (24 | ) | — |
| (153 | ) | 95 |
|
| | CMBS | 59 |
| (2 | ) | — |
| 76 |
| (9 | ) | (10 | ) | — |
| (45 | ) | 69 |
|
| | Corporate | 514 |
| 1 |
| 19 |
| 232 |
| (76 | ) | (157 | ) | 71 |
| (84 | ) | 520 |
|
| | Foreign Govt./Govt. Agencies | 47 |
| — |
| 3 |
| 12 |
| (1 | ) | (2 | ) | — |
| (57 | ) | 2 |
|
| | Municipal | 46 |
| 4 |
| 1 |
| 1 |
| — |
| (35 | ) | — |
| — |
| 17 |
|
| | RMBS | 1,261 |
| — |
| 36 |
| 209 |
| (268 | ) | (7 | ) | — |
| (1 | ) | 1,230 |
|
| Total Fixed Maturities, AFS | 2,126 |
| 21 |
| 46 |
| 800 |
| (461 | ) | (241 | ) | 98 |
| (437 | ) | 1,952 |
|
| Fixed Maturities, FVO | 11 |
| — |
| — |
| 4 |
| (2 | ) | (13 | ) | — |
| — |
| — |
|
| Equity Securities, AFS | 55 |
| — |
| (3 | ) | 24 |
| — |
| — |
| — |
| — |
| 76 |
|
| Derivatives, net [4] | | | | | | | | | |
| | Equity | — |
| (4 | ) | — |
| 5 |
| — |
| — |
| — |
| — |
| 1 |
|
| | Interest rate | 9 |
| (8 | ) | — |
| — |
| — |
| — |
| — |
| — |
| 1 |
|
| | Other contracts | 1 |
| (1 | ) | — |
| — |
| — |
| — |
| — |
| — |
| — |
|
| Total Derivatives, net [4] | 10 |
| (13 | ) | — |
| 5 |
| — |
| — |
| — |
| — |
| 2 |
|
| Total Assets | 2,202 |
| 8 |
| 43 |
| 833 |
| (463 | ) | (254 | ) | 98 |
| (437 | ) | 2,030 |
|
| Liabilities | | | | | | | | | |
| Contingent Considerations [5] | (25 | ) | (4 | ) | — |
| — |
| — |
| — |
| — |
| — |
| (29 | ) |
| Total Liabilities | $ | (25 | ) | $ | (4 | ) | $ | — |
| $ | — |
| $ | — |
| $ | — |
| $ | — |
| $ | — |
| $ | (29 | ) |
| |
[6]1] | Amounts in these columns are generally reported in net realized capital gains (losses). All amounts are before income taxes. |
| |
| [2] | All amounts are before income taxes. |
| |
| [3] | Transfers in and/or (out) of Level 3 are primarily attributable to the availability of market observable information and the re-evaluation of the observability of pricing inputs. |
| |
| [4] | Derivative instruments are reported in this table on a net basis for asset (liability) positions and reported in the Consolidated Balance Sheets in other investments and other liabilities. |
| |
| [5] | For additional information, see Note 2 - Business Acquisitions of Notes to Consolidated Financial StatementsStatement for discussion of the contingent consideration in connection with the acquisition of Lattice. Includes both market and non-market impacts in deriving realized and unrealized gains (losses). |
THE HARTFORD FINANCIAL SERVICES GROUP, INC.
NOTES TO CONSOLIDATED FINANCIAL STATEMENTS (continued)
5. Fair Value Measurements (continued)
Changes in Unrealized Gains (Losses) Included in Net Income for Financial Instruments Classified as Level 3 Still Held at Year End | | | | | December 31, |
| | | | | | | | 2018 | 2017 |
| | | Changes in Unrealized Gain/(Loss) included in Net Income as of December 31, 2017 [1] [2] | Changes in Unrealized Gain/(Loss) included in Net Income as of December 31, 2016 [1] [2] | | Changes in Unrealized Gain/(Loss) included in Net Income [1] [2] | Changes in Unrealized Gain/(Loss) included in OCI [3] | Changes in Unrealized Gain/(Loss) included in Net Income [1] [2] |
| Assets | Assets | | Assets | |
| Fixed Maturities, AFS | Fixed Maturities, AFS | | Fixed Maturities, AFS | |
| | CMBS | (2 | ) | (2 | ) | ABS | $ | — |
| $ | 1 |
| $ | — |
|
| | Corporate | — |
| (5 | ) | CMBS | (1 | ) | 28 |
| (2 | ) |
| Total Fixed Maturities, AFS | (2 | ) | (7 | ) | |
| Equity Securities, AFS | — |
| (1 | ) | |
| Freestanding Derivatives, net | | |
| | Equity | (5 | ) | — |
| Corporate | — |
| (42 | ) | — |
|
| | Interest rate | (7 | ) | — |
| Municipal | — |
| 24 |
| — |
|
| | Other Contracts | — |
| (1 | ) | RMBS | — |
| 17 |
| — |
|
| Total Freestanding Derivatives, net | (12 | ) | (1 | ) | |
| Total Fixed Maturities, AFS | | Total Fixed Maturities, AFS | (1 | ) | 28 |
| (2 | ) |
| Derivatives, net | | Derivatives, net | |
| | | Equity | 1 |
|
|
| (5 | ) |
| | | Interest rate | — |
| — |
| (7 | ) |
| Total Derivatives, net | | Total Derivatives, net | 1 |
| — |
| (12 | ) |
| Total Assets | Total Assets | (14 | ) | (9 | ) | Total Assets | — |
| 28 |
| (14 | ) |
| Liabilities | Liabilities | | Liabilities | |
| Contingent Consideration [3] | (4 | ) | (2 | ) | |
| Contingent Consideration [4] | | Contingent Consideration [4] | (6 | ) |
|
| (4 | ) |
| Total Liabilities | Total Liabilities | $ | (4 | ) | $ | (2 | ) | Total Liabilities | $ | (6 | ) | $ | — |
| $ | (4 | ) |
| |
| [1] | All amounts in these rows are reported in net realized capital gains (losses). All amounts are before income taxes. |
| |
| [2] | Amounts presented are for Level 3 only and therefore may not agree to other disclosures included herein. |
| |
| [3] | Changes in unrealized gain/(loss) on fixed maturities, AFS are reported in changes in net unrealized gain on securities in the Consolidated Statements of Comprehensive Income. Changes in interest rate derivatives are reported in changes in net gain on cash flow hedging instruments in the Consolidated Statements of Comprehensive Income. |
| |
| [4] | For additional information, see Note 2 - Business Acquisitions of Notes to Consolidated Financial Statements for discussion of the contingent consideration in connection with the acquisition of Lattice. |
Fair Value Option
The Company has elected the fair value option for certain securities that contain embedded credit derivatives with underlying credit risk primarily related to residential real estate, and these securities are included within Fixed Maturities,fixed maturities, FVO on the Condensed Consolidated Balance Sheets. For certain previously consolidated investment funds, the Company classified the underlying fixed maturities within Fixed Maturities, FVO as a result of the Company's management, control and significant ownership interest of the funds. The Company reported the underlying fixed maturities of these consolidated investment companies at fair value withreports changes in the fair value of these securities recognized in net realized capital gains and losses, which is consistent with accounting requirements for investment companies.losses.
As of December 31, 2018 and December 31, 2017, the fair value of assets and liabilities using the fair value option was $22 and $41, respectively, within the residential real estate sector.
The Company also previously elected the fair value option for certain equity securities in order to align the accounting with total return swap contracts that hedged the risk associated with the investments. The swaps did not qualify for hedge accounting and the change in value of both the equity securities and the total
return swaps were recorded in net realized capital gains and losses. These equity securities were classified within equity securities, AFS on the Condensed Consolidated Balance Sheets. Income earned from FVO securities was recorded in net investment income and changes in fair value were recorded in net realized capital gains and losses. The Company did not hold any
For the year-ended December 31, 2018, the realized capital gains (losses) related to the fair value of these equity securities as ofassets using the fair value option were $(1) within the residential real estate sector. For the year-ended December 31, 2017, orthe income earned from FVO and the changes recorded in net realized capital gains (losses) were driven by corporate bond and equity securities of $(1) and $1, respectively. For the year-ended December 31, 2016 .
Changes in Fair Valuethe realized capital gains (losses) related to the fair value of Assetsassets using Fair Value Option |
| | | | | | | | | |
| | For the year ended December 31, |
| | 2017 | 2016 | 2015 |
| Assets | | | |
| Fixed maturities, FVO | | | |
| Corporate | $ | (1 | ) | $ | — |
| $ | (4 | ) |
| Foreign government | — |
| (1 | ) | — |
|
| RMBS | — |
| 5 |
| — |
|
| Total fixed maturities, FVO | (1 | ) | 4 |
| (4 | ) |
| Equity, FVO | 1 |
| — |
| — |
|
| Total realized capital gains (losses) | $ | — |
| $ | 4 |
| $ | (4 | ) |
THE HARTFORD FINANCIAL SERVICES GROUP, INC.
NOTES TO CONSOLIDATED FINANCIAL STATEMENTS (continued)
5. Fair Value Measurements (continued)
Fair Value of Assets and Liabilities using the Fair Value Option |
| | | | | | |
| | As of December 31, |
| | 2017 | 2016 |
| Assets | | |
| Fixed maturities, FVO | | |
| ABS | $ | — |
| $ | 7 |
|
| CDOs | — |
| 3 |
|
| CMBS | — |
| 8 |
|
| Corporate | — |
| 40 |
|
| U.S. government | — |
| 7 |
|
| RMBS | 41 |
| 146 |
|
| Total fixed maturities, FVO | 41 |
| 211 |
|
Financial Instruments Not Carried at Fair Value
Financial Assets and Liabilities Not Carried at Fair Value |
| | | | | | | | | | | | | | | |
| | December 31, 2018 | | December 31, 2017 |
| | Fair Value Hierarchy Level | Carrying Amount | Fair Value | | Fair Value Hierarchy Level | Carrying Amount | Fair Value |
| Assets | | | | | | | |
| Mortgage loans | Level 3 | $ | 3,704 |
| $ | 3,746 |
| | Level 3 | $ | 3,175 |
| $ | 3,220 |
|
| Liabilities | | | | | | | |
| Other policyholder funds and benefits payable | Level 3 | $ | 774 |
| $ | 775 |
| | Level 3 | $ | 825 |
| $ | 827 |
|
| Senior notes [1] | Level 2 | $ | 3,589 |
| $ | 3,887 |
| | Level 2 | $ | 3,415 |
| $ | 4,054 |
|
| Junior subordinated debentures [1] | Level 2 | $ | 1,089 |
| $ | 1,052 |
| | Level 2 | $ | 1,583 |
| $ | 1,699 |
|
|
| | | | | | | |
| | Fair Value Hierarchy Level | Carrying Amount | Fair Value |
| | December 31, 2017 |
| Assets | | | |
| Mortgage loans | Level 3 | $ | 3,175 |
| $ | 3,220 |
|
| Liabilities | | | |
| Other policyholder funds and benefits payable | Level 3 | $ | 825 |
| $ | 827 |
|
| Senior notes [1] | Level 2 | $ | 3,415 |
| $ | 4,054 |
|
| Junior subordinated debentures [1] | Level 2 | $ | 1,583 |
| $ | 1,699 |
|
| | December 31, 2016 |
| Assets | | | |
| Mortgage loans | Level 3 | $ | 2,886 |
| $ | 2,878 |
|
| Liabilities | | | |
| Other policyholder funds and benefits payable | Level 3 | $ | 611 |
| $ | 613 |
|
| Senior notes [1] | Level 2 | $ | 3,826 |
| $ | 4,316 |
|
| Junior subordinated debentures [1] | Level 2 | $ | 1,083 |
| $ | 1,246 |
|
[1]Included in long-term debt in the Consolidated Balance Sheets, except for current maturities, which are included in short-term debt.
Fair values for mortgage loans were estimated using discounted cash flow calculations based on current lending rates for similar type loans. Current lending rates reflect changes in credit spreads and the remaining terms of the loans.Fair values for other policyholder funds and benefits payable, not carried at fair value, are estimated based on the cash surrender
values of the underlying policies or by estimating future cash flows discounted at current interest rates adjusted for credit risk.
Fair values for senior notes and junior subordinated debentures are determined using the market approach based on reported trades, benchmark interest rates and issuer spread for the Company which may consider credit default swaps.
THE HARTFORD FINANCIAL SERVICES GROUP, INC.
NOTES TO CONSOLIDATED FINANCIAL STATEMENTS (continued)
6. Investments
INVESTMENTS
Net Investment Income | | | | For the years ended December 31, | For the years ended December 31, |
| (Before-tax) | 2017 | 2016 | 2015 | |
| (Before tax) | | 2018 | 2017 | 2016 |
| Fixed maturities [1] | $ | 1,303 |
| $ | 1,319 |
| $ | 1,301 |
| $ | 1,459 |
| $ | 1,303 |
| $ | 1,319 |
|
| Equity securities | 24 |
| 22 |
| 17 |
| 32 |
| 24 |
| 22 |
|
| Mortgage loans | 124 |
| 116 |
| 115 |
| 141 |
| 124 |
| 116 |
|
| Limited partnerships and other alternative investments | 174 |
| 128 |
| 130 |
| 205 |
| 174 |
| 128 |
|
| Other investments [2] | 49 |
| 51 |
| 57 |
| 20 |
| 49 |
| 51 |
|
| Investment expenses | (71 | ) | (59 | ) | (59 | ) | (77 | ) | (71 | ) | (59 | ) |
| Total net investment income | $ | 1,603 |
| $ | 1,577 |
| $ | 1,561 |
| $ | 1,780 |
| $ | 1,603 |
| $ | 1,577 |
|
| |
| [1] | Includes net investment income on short-term investments. |
| |
| [2] | Includes income from derivatives that hedge fixed maturities and qualify for hedge accounting. |
Net Realized Capital Gains (Losses) |
| | | | | | | | | |
| | For the years ended December 31, |
| (Before tax) | 2018 | 2017 | 2016 |
| Gross gains on sales | $ | 114 |
| $ | 275 |
| $ | 222 |
|
| Gross losses on sales | (172 | ) | (113 | ) | (159 | ) |
| Equity securities [1] | (48 | ) | — |
| — |
|
| Net OTTI losses recognized in earnings | (1 | ) | (8 | ) | (27 | ) |
| Valuation allowances on mortgage loans | — |
| (1 | ) | — |
|
| Transactional foreign currency revaluation | 1 |
| 14 |
| (78 | ) |
| Non-qualifying foreign currency derivatives | 3 |
| (14 | ) | 83 |
|
| Other, net [2] | (9 | ) | 12 |
| (151 | ) |
| Net realized capital gains (losses) | $ | (112 | ) | $ | 165 |
| $ | (110 | ) |
|
| | | | | | | | | |
| | For the years ended December 31, |
| (Before-tax) | 2017 | 2016 | 2015 |
| Gross gains on sales | $ | 275 |
| $ | 222 |
| $ | 219 |
|
| Gross losses on sales | (113 | ) | (159 | ) | (194 | ) |
| Net OTTI losses recognized in earnings | (8 | ) | (27 | ) | (41 | ) |
| Valuation allowances on mortgage loans | (1 | ) | — |
| (1 | ) |
| Transactional foreign currency revaluation | 14 |
| (78 | ) | — |
|
| Non-qualifying foreign currency derivatives | (14 | ) | 83 |
| 13 |
|
| Other, net [1] | 12 |
| (151 | ) | (8 | ) |
| Net realized capital gains (losses) | $ | 165 |
| $ | (110 | ) | $ | (12 | ) |
| |
| [1] | Effective January 1, 2018, with adoption of new accounting guidance for equity securities at fair value, includes all changes in fair value and trading gains and losses for equity securities. |
| |
| [2] | Includes gains (losses) on non-qualifying derivatives, excluding foreign currency derivatives, of $(15), $8, $(9), and $(20)(9), respectively for 20172018, 20162017 and 20152016. Also included for the year ended December 31, 2016, is a loss related to the write-down of investments in solar energy partnerships, which generated tax benefits, and a loss related to the sale of the Company's U.K. property and casualty run-off subsidiaries. |
Net realized capital gains and losses(losses) from investment sales are reported as a component of revenues and are determined on a specific identification basis. Before tax, net gains and losses(losses) on sales and impairments previously reported as unrealized gains or losses in AOCI were $(80), $152, $36, and $(5)$36 for the years ended December 31, 2018, 2017, and 2016, and 2015, respectively. Effective January 1, 2018, with adoption of new accounting guidance for equity securities, the proceeds from sales of AFS securities no longer includes equity securities.
The net unrealized gain (loss) on equity securities included in net realized capital gains (losses) related to equity securities still held as of December 31, 2018, was $(80) for the year-ended
THE HARTFORD FINANCIAL SERVICES GROUP, INC.
NOTES TO CONSOLIDATED FINANCIAL STATEMENTS (continued)
December 31, 2018. Prior to January 1, 2018, changes in net unrealized gains (losses) on equity securities were included in AOCI.
Sales of AFS Securities | | | | For the years ended December 31, | For the years ended December 31, |
| | 2017 | 2016 | 2015 | 2018 | 2017 | 2016 |
| Fixed maturities, AFS | | |
| Sale proceeds | $ | 17,614 |
| $ | 9,984 |
| $ | 11,161 |
| $ | 21,327 |
| $ | 17,614 |
| $ | 9,984 |
|
| Gross gains | 204 |
| 196 |
| 177 |
| 90 |
| 204 |
| 196 |
|
| Gross losses | (90 | ) | (138 | ) | (156 | ) | (169 | ) | (90 | ) | (138 | ) |
| Equity securities, AFS | | |
| Sale proceeds | $ | 607 |
| $ | 359 |
| $ | 733 |
| | $ | 607 |
| $ | 359 |
|
| Gross gains | 69 |
| 26 |
| 35 |
| | 69 |
| 26 |
|
| Gross losses | (23 | ) | (20 | ) | (20 | ) | | (23 | ) | (20 | ) |
Sales of AFS securities in 20172018 were primarily a result of duration and liquidity management as well as tactical changes to the portfolio as a result of changing market conditions.
Recognition and Presentation of Other-Than-Temporary Impairments
The Company will record an other-than-temporary impairment (“OTTI”) for fixed maturities and certain equity securities with debt-like characteristics (collectively “debt securities”) if the Company intends to sell or it is more likely than not that the Company will be required to sell the security before a recovery in value. A corresponding charge is recorded in net realized capital losses equal to the difference between the fair value and amortized cost basis of the security.
The Company will also record an OTTI for those debt securitiesfixed maturities for which the Company does not expect to recover the entire amortized cost basis. For these securities, the excess of the amortized cost basis over its fair value is separated into the portion representing a credit OTTI, which is recorded in net realized capital losses, and the remaining non-credit amount, which is recorded in OCI. The credit OTTI amount is the excess of its amortized cost basis over the Company’s best estimate of discounted expected future cash flows. The non-credit amount is the excess of the best estimate of the discounted expected future cash flows over the fair value. The Company’s best estimate of discounted expected future cash flows becomes the new cost basis and accretes prospectively into net investment income over the estimated remaining life of the security.
TheDeveloping the Company’s best estimate of expected future cash flows is a quantitative and qualitative process that incorporates information received from third-party sources along with certain internal assumptions regarding the future performance. The Company's considerations include, but are not limited to, (a) changes in the financial condition of the issuer and the underlying collateral, (b) whether the issuer is current on contractually obligated interest and principal payments, (c) credit ratings, (d) payment structure of the security and (e) the extent to which the fair value has been less than the amortized cost of the security.
For non-structured securities, assumptions include, but are not limited to, economic and industry-specific trends and fundamentals, security-specific developments, industry earnings
THE HARTFORD FINANCIAL SERVICES GROUP, INC.
NOTES TO CONSOLIDATED FINANCIAL STATEMENTS (continued)
6. Investments (continued)
multiples and the issuer’s ability to restructure and execute asset sales.
For structured securities, assumptions include, but are not limited to, various performance indicators such as historical and projected default and recovery rates, credit ratings, current and projected delinquency rates, loan-to-value ("LTV") ratios, average cumulative collateral loss rates that vary by vintage year, prepayment speeds, and property value declines. These assumptions require the use of significant management judgment and include the probability of issuer default and estimates regarding timing and amount of expected recoveries which may include estimating the underlying collateral value.
Prior to January 1, 2018, the Company recorded an OTTI for certain equity securities with debt-like characteristics if the Company intended to sell or it was more likely than not that the Company was required to sell the security before a recovery in value as well as for those equity securities for which the Company did not expect to recover the entire amortized cost basis. The Company will also recordrecorded an OTTI for equity securities where the decline in the fair value iswas deemed to be other-than-temporary. A corresponding charge is recorded in net realized capital losses equal to the difference between the fair value and cost basis of the security. The previous cost basis less the impairment becomes the new cost basis. The Company’s evaluation and assumptions used to determine an equity OTTI include, but is not limited to, (a) the length of time and extent to which the fair value has been less than the cost of the security, (b) changes in the financial condition, credit rating and near-term prospects of the issuer, (c) whether the issuer is current on preferred stock dividends and (d) the intent and ability of the Company to retain the investment for a period of time sufficient to allow for recovery. For the remaining equity securities which are determined to be temporarily impaired, the Company asserts its intent and ability to retain those equity securities until the price recovers.
Impairments in Earnings by Type | | | | For the years ended December 31, | For the years ended December 31, |
| | 2017 | 2016 | 2015 | 2018 | 2017 | 2016 |
| Credit impairments | $ | 2 |
| $ | 21 |
| $ | 6 |
| $ | 1 |
| $ | 2 |
| $ | 21 |
|
| Impairments on equity securities | 6 |
| 4 |
| 2 |
| | 6 |
| 4 |
|
| Intent-to-sell impairments | — |
| 2 |
| 30 |
| — |
| — |
| 2 |
|
| Other impairments | — |
| — |
| 3 |
| |
| Total impairments | $ | 8 |
| $ | 27 |
| $ | 41 |
| $ | 1 |
| $ | 8 |
| $ | 27 |
|
Cumulative Credit Impairments | | | | For the years ended December 31, | For the years ended December 31, |
| (Before-tax) | 2017 | 2016 | 2015 | |
| (Before tax) | | 2018 | 2017 | 2016 |
| Balance as of beginning of period | $ | (110 | ) | $ | (113 | ) | $ | (128 | ) | $ | (25 | ) | $ | (110 | ) | $ | (113 | ) |
| Additions for credit impairments recognized on [1]: | | |
| Securities not previously impaired | (1 | ) | (16 | ) | (4 | ) | — |
| (1 | ) | (16 | ) |
| Securities previously impaired | (1 | ) | (5 | ) | (2 | ) | (1 | ) | (1 | ) | (5 | ) |
| Reductions for credit impairments previously recognized on: | | |
| Securities that matured or were sold during the period | 76 |
| 15 |
| 10 |
| 7 |
| 76 |
| 15 |
|
| Securities the Company made the decision to sell or more likely than not will be required to sell | — |
| — |
| 1 |
| |
| Securities due to an increase in expected cash flows | 11 |
| 9 |
| 10 |
| — |
| 11 |
| 9 |
|
| Balance as of end of period | $ | (25 | ) | $ | (110 | ) | $ | (113 | ) | $ | (19 | ) | $ | (25 | ) | $ | (110 | ) |
| |
| [1] | These additions are included in the net OTTI losses recognized in earnings in the Consolidated Statements of Operations. |
THE HARTFORD FINANCIAL SERVICES GROUP, INC.
NOTES TO CONSOLIDATED FINANCIAL STATEMENTS (continued)
6. Investments (continued)
Available-for-Sale Securities
AFS Securities by Type
| | | | December 31, 2017 | December 31, 2016 | December 31, 2018 | | December 31, 2017 |
| | Cost or Amortized Cost | Gross Unrealized Gains | Gross Unrealized Losses | Fair Value | Non- Credit OTTI [1] | Cost or Amortized Cost | Gross Unrealized Gains | Gross Unrealized Losses | Fair Value | Non- Credit OTTI [1] | Cost or Amortized Cost | Gross Unrealized Gains | Gross Unrealized Losses | Fair Value | Non- Credit OTTI [1] | | Cost or Amortized Cost | Gross Unrealized Gains | Gross Unrealized Losses | Fair Value | Non- Credit OTTI [1] |
| ABS | $ | 1,119 |
| $ | 9 |
| $ | (2 | ) | $ | 1,126 |
| $ | — |
| $ | 1,385 |
| $ | 8 |
| $ | (4 | ) | $ | 1,389 |
| $ | — |
| $ | 1,272 |
| $ | 5 |
| $ | (1 | ) | $ | 1,276 |
| $ | — |
| | $ | 1,119 |
| $ | 9 |
| $ | (2 | ) | $ | 1,126 |
| $ | — |
|
| CDOs | 1,257 |
| 3 |
| — |
| 1,260 |
| — |
| 960 |
| 18 |
| (2 | ) | 976 |
| — |
| |
| CLOs | | 1,455 |
| 2 |
| (20 | ) | 1,437 |
| — |
| | 1,257 |
| 3 |
| — |
| 1,260 |
| — |
|
| CMBS | 3,304 |
| 58 |
| (26 | ) | 3,336 |
| (5 | ) | 2,772 |
| 52 |
| (34 | ) | 2,790 |
| (5 | ) | 3,581 |
| 35 |
| (64 | ) | 3,552 |
| (5 | ) | | 3,304 |
| 58 |
| (26 | ) | 3,336 |
| (5 | ) |
| Corporate | 12,370 |
| 490 |
| (56 | ) | 12,804 |
| — |
| 10,703 |
| 399 |
| (129 | ) | 10,973 |
| — |
| 13,696 |
| 148 |
| (446 | ) | 13,398 |
| — |
| | 12,370 |
| 490 |
| (56 | ) | 12,804 |
| — |
|
| Foreign govt./govt. agencies | 1,071 |
| 43 |
| (4 | ) | 1,110 |
| — |
| 827 |
| 15 |
| (16 | ) | 826 |
| — |
| 866 |
| 7 |
| (26 | ) | 847 |
| — |
| | 1,071 |
| 43 |
| (4 | ) | 1,110 |
| — |
|
| Municipal | 11,743 |
| 754 |
| (12 | ) | 12,485 |
| — |
| 9,727 |
| 635 |
| (65 | ) | 10,297 |
| — |
| 9,972 |
| 421 |
| (47 | ) | 10,346 |
| — |
| | 11,743 |
| 754 |
| (12 | ) | 12,485 |
| — |
|
| RMBS | 2,985 |
| 63 |
| (4 | ) | 3,044 |
| — |
| 2,995 |
| 32 |
| (21 | ) | 3,006 |
| — |
| 3,270 |
| 44 |
| (35 | ) | 3,279 |
| — |
| | 2,985 |
| 63 |
| (4 | ) | 3,044 |
| — |
|
| U.S. Treasuries | 1,763 |
| 46 |
| (10 | ) | 1,799 |
| — |
| 1,927 |
| 29 |
| (31 | ) | 1,925 |
| — |
| 1,491 |
| 41 |
| (15 | ) | 1,517 |
| — |
| | 1,763 |
| 46 |
| (10 | ) | 1,799 |
| — |
|
| Total fixed maturities, AFS | 35,612 |
| 1,466 |
| (114 | ) | 36,964 |
| (5 | ) | 31,296 |
| 1,188 |
| (302 | ) | 32,182 |
| (5 | ) | 35,603 |
| 703 |
| (654 | ) | 35,652 |
| (5 | ) | | 35,612 |
| 1,466 |
| (114 | ) | 36,964 |
| (5 | ) |
| Equity securities, AFS | 907 |
| 121 |
| (16 | ) | 1,012 |
| — |
| 878 |
| 84 |
| (17 | ) | 945 |
| — |
| |
| Equity securities, AFS [2] | |
|
|
|
|
|
|
|
|
|
| | 907 |
| 121 |
| (16 | ) | 1,012 |
| — |
|
| Total AFS securities | $ | 36,519 |
| $ | 1,587 |
| $ | (130 | ) | $ | 37,976 |
| $ | (5 | ) | $ | 32,174 |
| $ | 1,272 |
| $ | (319 | ) | $ | 33,127 |
| $ | (5 | ) | $ | 35,603 |
| $ | 703 |
| $ | (654 | ) | $ | 35,652 |
| $ | (5 | ) | | $ | 36,519 |
| $ | 1,587 |
| $ | (130 | ) | $ | 37,976 |
| $ | (5 | ) |
| |
| [1] | Represents the amount of cumulative non-credit OTTI losses recognized in OCI on securities that also had credit impairments. These losses are included in gross unrealized losses as of December 31, 20172018 and 20162017. |
| |
| [2] | Effective January 1, 2018, with the adoption of new accounting standards for financial instruments, equity securities, AFS were reclassified to equity securities at fair value and are excluded from the table above as of December 31, 2018. |
Fixed maturities, AFS, by Contractual Maturity Year
|
| | | | | | | | | | | | | |
| | December 31, 2018 | | December 31, 2017 |
| | Amortized Cost | Fair Value | | Amortized Cost | Fair Value |
| One year or less | $ | 999 |
| $ | 1,002 |
| | $ | 1,507 |
| $ | 1,513 |
|
| Over one year through five years | 5,786 |
| 5,791 |
| | 5,007 |
| 5,119 |
|
| Over five years through ten years | 6,611 |
| 6,495 |
| | 6,505 |
| 6,700 |
|
| Over ten years | 12,629 |
| 12,820 |
| | 13,928 |
| 14,866 |
|
| Subtotal | 26,025 |
| 26,108 |
| | 26,947 |
| 28,198 |
|
| Mortgage-backed and asset-backed securities | 9,578 |
| 9,544 |
| | 8,665 |
| 8,766 |
|
| Total fixed maturities, AFS | $ | 35,603 |
| $ | 35,652 |
| | $ | 35,612 |
| $ | 36,964 |
|
|
| | | | | | | | | | | | | |
| | December 31, 2017 | | December 31, 2016 |
| | Amortized Cost | Fair Value | | Amortized Cost | Fair Value |
| One year or less | $ | 1,507 |
| $ | 1,513 |
| | $ | 1,174 |
| $ | 1,185 |
|
| Over one year through five years | 5,007 |
| 5,119 |
| | 4,830 |
| 4,987 |
|
| Over five years through ten years | 6,505 |
| 6,700 |
| | 5,476 |
| 5,596 |
|
| Over ten years | 13,928 |
| 14,866 |
| | 11,704 |
| 12,253 |
|
| Subtotal | 26,947 |
| 28,198 |
| | 23,184 |
| 24,021 |
|
| Mortgage-backed and asset-backed securities | 8,665 |
| 8,766 |
| | 8,112 |
| 8,161 |
|
| Total fixed maturities, AFS | $ | 35,612 |
| $ | 36,964 |
| | $ | 31,296 |
| $ | 32,182 |
|
Estimated maturities may differ from contractual maturities due to security call or prepayment provisions. Due to the potential for variability in payment speeds (i.e. prepayments or extensions), mortgage-backed and asset-backed securities are not categorized by contractual maturity.
Concentration of Credit Risk
The Company aims to maintain a diversified investment portfolio including issuer, sector and geographic stratification, where applicable, and has established certain exposure limits, diversification standards and review procedures to mitigate credit risk. The Company had no investment exposure to any credit concentration risk of a single issuer greater than 10% of the Company's stockholders' equity, other than the U.S. government and certain U.S. government agencies as of December 31, 20172018 or December 31, 2016.2017. As of December 31, 2017,2018, other than U.S. government and certain U.S. government
agencies, the Company’s three largest exposures by issuer were the New York State Dormitory Authority, Commonwealth of Massachusetts and the New York City Transitional Finance Authority and the Commonwealth of Massachusetts which each comprised less than 1% of total invested assets. As of December 31, 2016,2017, other than U.S. government and certain U.S. government agencies, the Company’s three largest exposures by issuer were Commonwealth of Massachusetts,New York City Transitional Finance Authority, New York State Dormitory Authority and the StateCommonwealth of CaliforniaMassachusetts which each comprised less than 1% of total invested assets. The Company’s three largest exposures by sector as of December 31, 2018 were the municipal securities, CMBS and the financial services sector which comprised approximately 22%, 8% and 7%, respectively, of total invested assets. The Company’s three largest exposures by sector as of December 31, 2017 were municipal securities, CMBS and RMBS which comprised approximately 28%, 7% and 7%, respectively, of total invested assets. The Company’s three largest exposures by sector as of December 31, 2016 were municipal investments, RMBS, and CMBS which comprised approximately 26%, 8% and 7%, respectively, of total invested assets.
THE HARTFORD FINANCIAL SERVICES GROUP, INC.
NOTES TO CONSOLIDATED FINANCIAL STATEMENTS (continued)
6. Investments (continued)
Unrealized Losses on AFS Securities
Unrealized Loss Aging for AFS Securities by Type and Length of Time as of December 31, 20172018
| | | | Less Than 12 Months | | 12 Months or More | | Total | Less Than 12 Months | | 12 Months or More | | Total |
| | Amortized Cost | Fair Value | Unrealized Losses | | Amortized Cost | Fair Value | Unrealized Losses | | Amortized Cost | Fair Value | Unrealized Losses | Amortized Cost | Fair Value | Unrealized Losses | | Amortized Cost | Fair Value | Unrealized Losses | | Amortized Cost | Fair Value | Unrealized Losses |
| ABS | $ | 461 |
| $ | 460 |
| $ | (1 | ) | | $ | 30 |
| $ | 29 |
| $ | (1 | ) | | $ | 491 |
| $ | 489 |
| $ | (2 | ) | $ | 566 |
| $ | 566 |
| $ | — |
| | $ | 113 |
| $ | 112 |
| $ | (1 | ) | | $ | 679 |
| $ | 678 |
| $ | (1 | ) |
| CDOs | 359 |
| 359 |
| — |
| | 1 |
| 1 |
| — |
| | 360 |
| 360 |
| — |
| |
| CLOs | | 1,358 |
| 1,338 |
| (20 | ) | | 7 |
| 7 |
| — |
| | 1,365 |
| 1,345 |
| (20 | ) |
| CMBS | 1,178 |
| 1,167 |
| (11 | ) | | 243 |
| 228 |
| (15 | ) | | 1,421 |
| 1,395 |
| (26 | ) | 896 |
| 882 |
| (14 | ) | | 1,129 |
| 1,079 |
| (50 | ) | | 2,025 |
| 1,961 |
| (64 | ) |
| Corporate | 2,322 |
| 2,302 |
| (20 | ) | | 1,064 |
| 1,028 |
| (36 | ) | | 3,386 |
| 3,330 |
| (56 | ) | 7,174 |
| 6,903 |
| (271 | ) | | 2,541 |
| 2,366 |
| (175 | ) | | 9,715 |
| 9,269 |
| (446 | ) |
| Foreign govt./govt. agencies | 244 |
| 242 |
| (2 | ) | | 51 |
| 49 |
| (2 | ) | | 295 |
| 291 |
| (4 | ) | 407 |
| 391 |
| (16 | ) | | 203 |
| 193 |
| (10 | ) | | 610 |
| 584 |
| (26 | ) |
| Municipal | 511 |
| 507 |
| (4 | ) | | 236 |
| 228 |
| (8 | ) | | 747 |
| 735 |
| (12 | ) | 1,643 |
| 1,613 |
| (30 | ) | | 292 |
| 275 |
| (17 | ) | | 1,935 |
| 1,888 |
| (47 | ) |
| RMBS | 889 |
| 887 |
| (2 | ) | | 137 |
| 135 |
| (2 | ) | | 1,026 |
| 1,022 |
| (4 | ) | 1,344 |
| 1,329 |
| (15 | ) | | 648 |
| 628 |
| (20 | ) | | 1,992 |
| 1,957 |
| (35 | ) |
| U.S. Treasuries | 658 |
| 652 |
| (6 | ) | | 254 |
| 250 |
| (4 | ) | | 912 |
| 902 |
| (10 | ) | 497 |
| 492 |
| (5 | ) | | 339 |
| 329 |
| (10 | ) | | 836 |
| 821 |
| (15 | ) |
| Total fixed maturities, AFS | 6,622 |
| 6,576 |
| (46 | ) | | 2,016 |
| 1,948 |
| (68 | ) | | 8,638 |
| 8,524 |
| (114 | ) | |
| Equity securities, AFS | 176 |
| 163 |
| (13 | ) | | 24 |
| 21 |
| (3 | ) | | 200 |
| 184 |
| (16 | ) | |
| Total securities in an unrealized loss position | $ | 6,798 |
| $ | 6,739 |
| $ | (59 | ) | | $ | 2,040 |
| $ | 1,969 |
| $ | (71 | ) | | $ | 8,838 |
| $ | 8,708 |
| $ | (130 | ) | |
| Total fixed maturities, AFS in an unrealized loss position | | $ | 13,885 |
| $ | 13,514 |
| $ | (371 | ) | | $ | 5,272 |
| $ | 4,989 |
| $ | (283 | ) | | $ | 19,157 |
| $ | 18,503 |
| $ | (654 | ) |
Unrealized Loss Aging for AFS Securities by Type and Length of Time as of December 31, 20162017
|
| | | | | | | | | | | | | | | | | | | | | | | | | | | | | |
| | Less Than 12 Months | | 12 Months or More | | Total |
| | Amortized Cost | Fair Value | Unrealized Losses | | Amortized Cost | Fair Value | Unrealized Losses | | Amortized Cost | Fair Value | Unrealized Losses |
| ABS | $ | 461 |
| $ | 460 |
| $ | (1 | ) | | $ | 30 |
| $ | 29 |
| $ | (1 | ) | | $ | 491 |
| $ | 489 |
| $ | (2 | ) |
| CLOs | 359 |
| 359 |
| — |
| | 1 |
| 1 |
| — |
| | 360 |
| 360 |
| — |
|
| CMBS | 1,178 |
| 1,167 |
| (11 | ) | | 243 |
| 228 |
| (15 | ) | | 1,421 |
| 1,395 |
| (26 | ) |
| Corporate | 2,322 |
| 2,302 |
| (20 | ) | | 1,064 |
| 1,028 |
| (36 | ) | | 3,386 |
| 3,330 |
| (56 | ) |
| Foreign govt./govt. agencies | 244 |
| 242 |
| (2 | ) | | 51 |
| 49 |
| (2 | ) | | 295 |
| 291 |
| (4 | ) |
| Municipal | 511 |
| 507 |
| (4 | ) | | 236 |
| 228 |
| (8 | ) | | 747 |
| 735 |
| (12 | ) |
| RMBS | 889 |
| 887 |
| (2 | ) | | 137 |
| 135 |
| (2 | ) | | 1,026 |
| 1,022 |
| (4 | ) |
| U.S. Treasuries | 658 |
| 652 |
| (6 | ) | | 254 |
| 250 |
| (4 | ) | | 912 |
| 902 |
| (10 | ) |
| Total fixed maturities, AFS in an unrealized loss position | 6,622 |
| 6,576 |
| (46 | ) | | 2,016 |
| 1,948 |
| (68 | ) | | 8,638 |
| 8,524 |
| (114 | ) |
| Equity securities, AFS [1] | 176 |
| 163 |
| (13 | ) | | 24 |
| 21 |
| (3 | ) | | 200 |
| 184 |
| (16 | ) |
| Total securities in an unrealized loss position | $ | 6,798 |
| $ | 6,739 |
| $ | (59 | ) | | $ | 2,040 |
| $ | 1,969 |
| $ | (71 | ) | | $ | 8,838 |
| $ | 8,708 |
| $ | (130 | ) |
|
| | | | | | | | | | | | | | | | | | | | | | | | | | | | | |
| | Less Than 12 Months | | 12 Months or More | | Total |
| | Amortized Cost | Fair Value | Unrealized Losses | | Amortized Cost | Fair Value | Unrealized Losses | | Amortized Cost | Fair Value | Unrealized Losses |
| ABS | $ | 333 |
| $ | 331 |
| $ | (2 | ) | | $ | 103 |
| $ | 101 |
| $ | (2 | ) | | $ | 436 |
| $ | 432 |
| $ | (4 | ) |
| CDOs | 316 |
| 315 |
| (1 | ) | | 160 |
| 159 |
| (1 | ) | | 476 |
| 474 |
| (2 | ) |
| CMBS | 1,018 |
| 997 |
| (21 | ) | | 154 |
| 141 |
| (13 | ) | | 1,172 |
| 1,138 |
| (34 | ) |
| Corporate | 2,883 |
| 2,784 |
| (99 | ) | | 433 |
| 403 |
| (30 | ) | | 3,316 |
| 3,187 |
| (129 | ) |
| Foreign govt./govt. agencies | 409 |
| 395 |
| (14 | ) | | 21 |
| 19 |
| (2 | ) | | 430 |
| 414 |
| (16 | ) |
| Municipal | 1,401 |
| 1,338 |
| (63 | ) | | 43 |
| 41 |
| (2 | ) | | 1,444 |
| 1,379 |
| (65 | ) |
| RMBS | 1,107 |
| 1,089 |
| (18 | ) | | 393 |
| 390 |
| (3 | ) | | 1,500 |
| 1,479 |
| (21 | ) |
| U.S. Treasuries | 1,047 |
| 1,016 |
| (31 | ) | | — |
| — |
| — |
| | 1,047 |
| 1,016 |
| (31 | ) |
| Total fixed maturities, AFS | 8,514 |
| 8,265 |
| (249 | ) | | 1,307 |
| 1,254 |
| (53 | ) | | 9,821 |
| 9,519 |
| (302 | ) |
| Equity securities, AFS | 271 |
| 258 |
| (13 | ) | | 33 |
| 29 |
| (4 | ) | | 304 |
| 287 |
| (17 | ) |
| Total securities in an unrealized loss position | $ | 8,785 |
| $ | 8,523 |
| $ | (262 | ) | | $ | 1,340 |
| $ | 1,283 |
| $ | (57 | ) | | $ | 10,125 |
| $ | 9,806 |
| $ | (319 | ) |
| |
| [1] | Effective January 1, 2018 , with the adoption of new accounting standards for financial instruments, equity securities, AFS were reclassified to equity securities at fair value and are excluded from the table above as of December 31, 2018. |
As of December 31, 2017,2018, AFS securities in an unrealized loss position consisted of 2,5262,960 securities, primarily in the corporate sector,and commercial real estate sectors, which were depressed primarily due to widening of credit spreads and an increase in interest rates and/or widening of credit spreads since the securities were purchased. As of December 31, 2017, 96%2018, 98% of these securities were depressed less than 20% of cost or amortized cost. The improvementincrease in unrealized losses during 20172018 was primarily attributable to tighterwidening of credit spreads.spreads and higher interest rates.
Most of the securities depressed for twelve months or more relate to corporate securities and structured securities with exposure to commercial real estate. Corporate securities and commercial real estate securities were primarily depressed because current market spreads are wider and interest rates are higher than spreads at the securities' respective purchase dates. Certain other corporate securities were depressed because the securities have floating-rate coupons and have long-dated maturities, and current credit spreads are wider than when these securities were purchased. The Company neither has an intention to sell nor does it expect to be required to sell the securities outlined in the preceding discussion.
Mortgage Loans
Mortgage Loan Valuation Allowances
Commercial mortgageMortgage loans are considered to be impaired when management estimates that, based upon current information and events, it is probable that the Company will be unable to collect amounts due according to the contractual terms of the loan agreement. The Company reviews mortgage loans on a quarterly basis to identify potential credit losses. Among other factors, management reviews current and projected macroeconomic trends, such as unemployment rates and property-specific factors such as rental rates, occupancy levels, LTV ratios and debt service coverage ratios (“DSCR”). In addition, the Company considers historical, current and projected delinquency rates and property values. Estimates of collectibility require the use of significant management judgment and include the probability and timing of borrower default and loss severity estimates. In addition, cash flow projections may change based upon new information about the borrower's ability to pay and/or the value of underlying collateral such as changes in projected property value estimates.
THE HARTFORD FINANCIAL SERVICES GROUP, INC.
NOTES TO CONSOLIDATED FINANCIAL STATEMENTS (continued)
6. Investments (continued)
For mortgage loans that are deemed impaired, a valuation allowance is established for the difference between the carrying amount and estimated fair value. The mortgage loan's estimated fair value is most frequently the Company's share of the fair value of the collateral but may also be the Company’s share of either (a) the present value of the expected future cash flows discounted at the loan’s effective interest rate or (b) the loan’s observable market price. A valuation allowance may be recorded for an individual loan or for a group of loans that have an LTV ratio of 90% or greater, a low DSCR or have other lower credit quality characteristics. Changes in valuation allowances are recorded in net realized capital gains and losses. Interest income on impaired loans is accrued to the extent it is deemed collectible and the borrowers continue to make payments under the original or restructured loan terms. The Company stops accruing interest income on loans when it is probable that the Company will not receive interest and principal payments according to the contractual terms of the loan agreement. The companyCompany resumes accruing interest income when it determines that sufficient collateral exists to satisfy the full amount of the loan principal and interest payments and when it is probable cash will be received in the foreseeable future. Interest income on defaulted loans is recognized when received.
As of December 31, 2018 and December 31, 2017 commercial mortgage loans had an amortized cost and carrying value of $3.7 billion and $3.2 billion. Asbillion, respectively, with a valuation allowance of December 31, 2016, commercial mortgage loans had an amortized cost and carrying value of $2.9 billion. Amortized cost represents carrying value prior to valuation allowances, if any.$1 for both periods.
As of December 31, 20172018 the carrying value of mortgage loans that had a valuation allowance was $24.$23. There were no mortgage loans held-for-sale as of both December 31, 2018 and December 31, 2017. As of December 31, 2016, there were no mortgage loans that had a valuation allowance or were held-for-sale. As of December 31, 2017,2018, the Company had an immaterial amount ofno mortgage loans that have had extensions or restructurings other than what is allowable under the original terms of the contract.
The following table presents the activity within the Company’s valuation allowance for mortgage loans. These loans have been evaluated both individually and collectively for impairment. Loans evaluated collectively for impairment are immaterial.
Valuation Allowance Activity
|
| | | | | | | | | |
| | For the years ended December 31, |
| | 2018 | 2017 | 2016 |
| Balance as of January 1 | $ | (1 | ) | $ | — |
| $ | (4 | ) |
| Reversals/(Additions) | — |
| (1 | ) | — |
|
| Deductions | — |
| — |
| 4 |
|
| Balance as of December 31 | $ | (1 | ) | $ | (1 | ) | $ | — |
|
|
| | | | | | | | | |
| | For the years ended December 31, |
| | 2017 | 2016 | 2015 |
| Balance as of January 1 | $ | — |
| $ | (4 | ) | $ | (3 | ) |
| (Additions)/Reversals | (1 | ) | — |
| (3 | ) |
| Deductions | — |
| 4 |
| 2 |
|
| Balance as of December 31 | $ | (1 | ) | $ | — |
| $ | (4 | ) |
The weighted-average LTV ratio of the Company’s commercial mortgage loan portfolio was 52% as of December 31, 2017,2018, while the weighted-average LTV ratio at origination of these loans was 61%. LTV ratios compare the loan amount to the value of the underlying property collateralizing the loan. The loan collateral values are updated no less than annually through reviews of the underlying properties. Factors considered in estimating property values include, among other things, actual and expected property
cash flows, geographic market data and the ratio of the property's net operating income to its value. DSCR compares a property’s net operating income to the borrower’s principal and interest payments. As of December 31, 20172018 and December 31, 2016 ,2017, the
Company held no delinquent commercial mortgages loan past due by 90 days or more.
Commercial Mortgage Loans Credit Quality |
| | | | | | | | | |
| | December 31, 2018 | | December 31, 2017 |
| Loan-to-value | Carrying Value | Avg. Debt-Service Coverage Ratio | | Carrying Value | Avg. Debt-Service Coverage Ratio |
| Greater than 80% | $ | — |
| 0.00x | | $ | 18 |
| 1.27x |
| 65% - 80% | 386 |
| 1.60x | | 265 |
| 1.95x |
| Less than 65% | 3,318 |
| 2.59x | | 2,892 |
| 2.76x |
| Total mortgage loans | $ | 3,704 |
| 2.49x | | $ | 3,175 |
| 2.69x |
|
| | | | | | | | |
| | December 31, 2017 | December 31, 2016 |
| Loan-to-value | Carrying Value | Avg. Debt-Service Coverage Ratio | Carrying Value | Avg. Debt-Service Coverage Ratio |
| Greater than 80% | $ | 18 |
| 1.27x | $ | — |
| 0.00x |
| 65% - 80% | 265 |
| 1.95x | 386 |
| 2.16x |
| Less than 65% | 2,892 |
| 2.76x | 2,500 |
| 2.95x |
| Total commercial mortgage loans | $ | 3,175 |
| 2.69x | $ | 2,886 |
| 2.83x |
Mortgage Loans by Region |
| | | | | | | | | | | |
| | December 31, 2018 | | December 31, 2017 |
| | Carrying Value | Percent of Total | | Carrying Value | Percent of Total |
| East North Central | $ | 250 |
| 6.8 | % | | $ | 251 |
| 7.9 | % |
| Middle Atlantic | 270 |
| 7.3 | % | | 272 |
| 8.6 | % |
| Mountain | 30 |
| 0.8 | % | | 31 |
| 1.0 | % |
| New England | 330 |
| 8.9 | % | | 293 |
| 9.2 | % |
| Pacific | 917 |
| 24.8 | % | | 760 |
| 23.9 | % |
| South Atlantic | 712 |
| 19.2 | % | | 710 |
| 22.4 | % |
| West North Central | 148 |
| 4.0 | % | | 149 |
| 4.7 | % |
| West South Central | 420 |
| 11.3 | % | | 278 |
| 8.7 | % |
| Other [1] | 627 |
| 16.9 | % | | 431 |
| 13.6 | % |
| Total mortgage loans | $ | 3,704 |
| 100.0 | % | | $ | 3,175 |
| 100.0 | % |
|
| | | | | | | | | | |
| | December 31, 2017 | December 31, 2016 |
| | Carrying Value | Percent of Total | Carrying Value | Percent of Total |
| East North Central | $ | 251 |
| 7.9 | % | $ | 239 |
| 8.3 | % |
| Middle Atlantic | 272 |
| 8.6 | % | 297 |
| 10.3 | % |
| Mountain | 31 |
| 1.0 | % | 61 |
| 2.1 | % |
| New England | 293 |
| 9.2 | % | 252 |
| 8.7 | % |
| Pacific | 760 |
| 23.9 | % | 795 |
| 27.5 | % |
| South Atlantic | 710 |
| 22.4 | % | 585 |
| 20.3 | % |
| West North Central | 149 |
| 4.7 | % | 40 |
| 1.4 | % |
| West South Central | 278 |
| 8.7 | % | 210 |
| 7.3 | % |
| Other [1] | 431 |
| 13.6 | % | 407 |
| 14.1 | % |
| Total mortgage loans | $ | 3,175 |
| 100.0 | % | $ | 2,886 |
| 100.0 | % |
| |
| [1] | Primarily represents loans collateralized by multiple properties in various regions. |
Mortgage Loans by Property Type | | | | December 31, 2017 | December 31, 2016 | December 31, 2018 | | December 31, 2017 |
| | Carrying Value | Percent of Total | Carrying Value | Percent of Total | Carrying Value | Percent of Total | | Carrying Value | Percent of Total |
| Commercial | | | | | | | | | |
| Industrial | 817 |
| 25.7 | % | 675 |
| 23.4 | % | 1,108 |
| 29.9 | % | | 817 |
| 25.7 | % |
| Multifamily | 1,006 |
| 31.7 | % | 830 |
| 28.8 | % | 1,138 |
| 30.7 | % | | 1,006 |
| 31.7 | % |
| Office | 751 |
| 23.7 | % | 756 |
| 26.2 | % | 708 |
| 19.1 | % | | 751 |
| 23.7 | % |
| Retail | 367 |
| 11.5 | % | 425 |
| 14.7 | % | 392 |
| 10.6 | % | | 367 |
| 11.5 | % |
| Single Family | | 82 |
| 2.2 | % | | — |
| — | % |
| Other | 234 |
| 7.4 | % | 200 |
| 6.9 | % | 276 |
| 7.5 | % | | 234 |
| 7.4 | % |
| Total mortgage loans | $ | 3,175 |
| 100.0 | % | $ | 2,886 |
| 100.0 | % | $ | 3,704 |
| 100.0 | % | | $ | 3,175 |
| 100.0 | % |
THE HARTFORD FINANCIAL SERVICES GROUP, INC.
NOTES TO CONSOLIDATED FINANCIAL STATEMENTS (continued)
6. Investments (continued)
Mortgage Servicing
The Company originates, sells and services commercial mortgage loans on behalf of third parties and recognizes servicing fees income over the period that services are performed. As of December 31, 2017,2018, under this program, the Company serviced commercial
THE HARTFORD FINANCIAL SERVICES GROUP, INC.
NOTES TO CONSOLIDATED FINANCIAL STATEMENTS (continued)
mortgage loans with a total outstanding principal of $6.0 billion, of which $3.6 billion was serviced on behalf of third parties and $2.4 billion was retained and reported in total investments on the Company's Consolidated Balance Sheets. As of December 31, 2017, the Company serviced mortgage loans with a total outstanding principal balance of $1.3 billion, of which $402 was serviced on behalf of third parties, $566 was retained and reported in total investments and $356 was reported in assets held for sale on the Company's Consolidated Balance Sheets. As of December 31, 2016, under this program the Company serviced commercial mortgage loans with a total outstanding principal balance of $901, of which $251 was serviced on behalf of third parties, $417 was retained and reported in total investments and $233 was reported in assets held for sale on the Company's Consolidated Balance Sheets. Servicing rights are carried at the lower of cost or fair value and were zero as of December 31, 20172018 and 20162017, because servicing fees were market-level fees at origination and remain adequate to compensate the Company for servicing the loans.
Variable Interest Entities
The Company is engaged with various special purpose entities and other entities that are deemed to be VIEs primarily as an investor through normal investment activities but also as an investment manager and previously as a means of accessing capital through a contingent capital facility ("facility").manager.
A VIE is an entity that either has investors that lack certain essential characteristics of a controlling financial interest, such as simple majority kick-out rights, or lacks sufficient funds to finance its own activities without financial support provided by other entities. The Company performs ongoing qualitative assessments of its VIEs to determine whether the Company has a controlling financial interest in the VIE and therefore is the primary beneficiary. The Company is deemed to have a controlling financial interest when it has both the ability to direct the activities that most significantly impact the economic performance of the VIE and the obligation to absorb losses or right to receive benefits from the VIE that could potentially be significant to the VIE. Based on the Company’s assessment, if it determines it is the primary beneficiary, the Company consolidates the VIE in the Company’s Consolidated Financial Statements.
Consolidated VIEs
As of December 31, 2018 and December 31, 2017, the Company did not hold any securities for which it is the primary beneficiary. As of December 31, 2016, the Company held one CDO for which it was the primary beneficiary. The CDO represented a structured investment vehicle for which the Company had a controlling financial interest. As of December 31, 2016 the Company held total CDO assets of $5 included in cash with an associated liability of $5 included in other liabilities on the Company's Consolidated Balance Sheets. The Company did not have any additional exposure to loss associated with this investment.
Non-Consolidated VIEs
The Company, through normal investment activities, makes passive investments in limited partnerships and other alternative investments. For these non-consolidated VIEs, the Company has
determined it is not the primary beneficiary as it has no ability to direct activities that could significantly affect the economic performance of the investments. The Company’s maximum exposure to loss as of December 31, 20172018 and 20162017 is limited to the total carrying value of $920$1 billion and $871,$920, respectively, which are included in limited partnerships and other alternative investments in the Company's Consolidated Balance Sheets. As of December 31, 20172018 and 2016,2017, the Company has outstanding commitments totaling $787$718 and $701,$787, respectively, whereby the Company is committed to fund these investments and may be called by the partnership during the commitment period to fund the purchase of new investments and partnership expenses. These investments are generally of a passive nature in that the Company does not take an active role in management.
In addition, the Company also makes passive investments in structured securities issued by VIEs for which the Company is not the manager. These investments are included in ABS, CDOs,CLOs, CMBS and RMBS in the Available-for-Sale Securities table and
fixed maturities, FVO, in the Company’s Consolidated Balance Sheets. The Company has not provided financial or other support with respect to these investments other than its original investment. For these investments, the Company determined it is not the primary beneficiary due to the relative size of the Company’s investment in comparison to the principal amount of the structured securities issued by the VIEs, the level of credit subordination which reduces the Company’s obligation to absorb losses or right to receive benefits and the Company’s inability to direct the activities that most significantly impact the economic performance of the VIEs. The Company’s maximum exposure to loss on these investments is limited to the amount of the Company’s investment.
As of December 31, 2016, the Company held a significant variable interest in a VIE for which it was not the primary beneficiary. This VIE represented a contingent capital facility that had been held by the Company since February 2007. Assets and liabilities recorded were $1 and $3, respectively, as of December 31, 2016, as well as a maximum exposure to loss of $3. The Company did not have a controlling financial interest and as such, did not consolidate its variable interest in the facility. As of December 31, 2017, the Company no longer held an interest in the facility. For further information on the facility, see Note 13 of these financial statements.
Securities Lending, Repurchase Agreements and Other Collateral Transactions
The Company enters into securities financing transactions as a way to earn additional income or manage liquidity, primarily through securities lending and repurchase agreements.
Securities Lending
Under a securities lending program, the Company lends certain fixed maturities within the corporate, foreign government/government agencies, and municipal sectors as well as equity securities to qualifying third-party borrowers in return for collateral in the form of cash or securities. For domestic and non-domestic loaned securities, respectively, borrowers provide
THE HARTFORD FINANCIAL SERVICES GROUP, INC.
NOTES TO CONSOLIDATED FINANCIAL STATEMENTS (continued)
6. Investments (continued)
collateral of 102% and 105% of the fair value of the securities lent at the time of the loan. Borrowers will return the securities to the Company for cash or securities collateral at maturity dates generally of 90 days or less. Security collateral on deposit from counterparties in connection with securities lending transactions may not be sold or re-pledged, except in the event of default by the counterparty, and is not reflected on the Company’s Condensed Consolidated Balance Sheets. Additional collateral is obtained if the fair value of the collateral falls below 100% of the fair value of the loaned securities. The agreements are continuous and do not have stated maturity dates and provide the counterparty the right to sell or re-pledge the securities loaned. If cash, rather than securities, is received as collateral, the cash is typically invested in short-term investments or fixed maturities and is reported as an asset on the Company's Consolidated Balance Sheets. Income associated with securities lending transactions is reported as a component of net investment income in the Company’s Consolidated Statements of Operations.
Repurchase Agreements
From time to time, the Company enters into repurchase agreements to manage liquidity or to earn incremental income. A repurchase agreement is a transaction in which one party (transferor) agrees to sell securities to another party (transferee) in return for cash (or securities), with a simultaneous agreement to repurchase the same securities at a specified price at a later date. These transactions generally have a contractualremaining maturity of ninety days or less. Repurchase agreements include master netting provisions that provide both counterparties the right to offset claims and apply securities held by them with respect to their obligations in the event of a default. Although the Company has the contractual right to offset claims, the Company's current positions do not meet the specific conditions for net presentation.
THE HARTFORD FINANCIAL SERVICES GROUP, INC.
NOTES TO CONSOLIDATED FINANCIAL STATEMENTS (continued)
Under repurchase agreements, the Company transfers collateral of U.S. government and government agency securities and receives cash. For repurchase agreements, the Company obtains cash in an amount equal to at least 95% of the fair value of the securities transferred. The agreements require additional collateral to be transferred when necessary and provide the counterparty the right to sell or re-pledge the securities transferred. The cash received from the repurchase program is typically invested in short-term investments or fixed maturities and is reported as an asset on the Company's Consolidated Balance Sheets. The Company accounts for the repurchase agreements as collateralized borrowings. The securities transferred under repurchase agreements are included in fixed maturities, AFS with the obligation to repurchase those securities recorded in other liabilities on the Company's Consolidated Balance Sheets.
From time to time, the Company enters into reverse repurchase agreements where the Company purchases securities and simultaneously agrees to resell the same or substantially the same securities. The agreements require additional collateral to be transferred to the Company when necessary and the Company has the right to sell or re-pledge the securities received. The Company accounts for reverse repurchase agreements as collateralized financing. The receivable for reverse repurchase agreements is included within short-term investments in the Company's Consolidated Balance Sheets.
collateralized financing. | | Securities Lending and Repurchase Agreements | | | December 31, 2017 | December 31, 2016 | December 31, 2018 | December 31, 2017 |
| | Fair Value | Fair Value |
| Fair Value | Fair Value |
|
| Securities Lending Transactions: | | |
| Gross amount of securities on loan | $ | 922 |
| $ | 53 |
| $ | 820 |
| $ | 922 |
|
| Gross amount of associated liability for collateral received [1] | $ | 945 |
| $ | 54 |
| $ | 840 |
| $ | 945 |
|
| | | |
| Repurchase agreements: | | |
| Gross amount of recognized liabilities for repurchase agreements | $ | 174 |
| $ | 123 |
| $ | 72 |
| $ | 174 |
|
| Gross amount of collateral pledged related to repurchase agreements [2] | $ | 176 |
| $ | 127 |
| $ | 73 |
| $ | 176 |
|
| Gross amount of recognized receivables for reverse repurchase agreements | | $ | 64 |
| $ | — |
|
| |
| [1] | Cash collateral received is reinvested in fixed maturities, AFS and short term investments which are included in the Consolidated Balance Sheets. Amount includes additional securities collateral received of $03 and $130 million which are excluded from the Company's Consolidated Balance Sheets as of December 31, 2018 and December 31, 2017 and December 31, 2016, respectively. |
| |
| [2] | Collateral pledged is included within fixed maturities, AFS and short term investments in the Company's Consolidated Balance Sheets. |
Other Collateral Transactions
The Company is required by law to deposit securities with government agencies in certain states in which it conducts business. As of December 31, 20172018 and December 31, 2016,2017, the fair value of securities on deposit was $2.5$2.2 billion and $2.5 billion, respectively.
As of December 31, 20172018 and December 31, 2016,2017, the Company has pledged collateral of $104$47 and $102,$104, respectively, of U.S. government securities and government agency securities or cash primarily related to certain bank loan participations committed to through a limited partnership agreement. These amounts also include collateral related to letters of credit.
For disclosure of collateral in support of derivative transactions, refer to the Derivative Collateral Arrangements section ofin Note 7 - Derivatives of these financial statements.Notes to Consolidated Financial Statements.
Equity Method Investments
The majority of the Company's investments in limited partnerships and other alternative investments, including hedge funds, real estate funds, and private equity funds (collectively, “limited partnerships”), are accounted for under the equity method of accounting. The remainder of investments in limited partnerships and other alternative investments consists primarily of investments in insurer-owned life insurance accounted for at cash surrender value. The Company's investment in Hopmeadow Holdings LP is reported in other assets on the Company's Consolidated Balance Sheets and is accounted for under the equity method of accounting. For those limited partnershipsfurther discussion on Hopmeadow Holdings LP, refer to Sale of Life and Annuity Business within Note 20 - Business Dispositions and Discontinued Operations of Notes to the Consolidated Financial Statements. The Company recognized total equity method income of $214, $168, and $137 for the periods ended December 31, 2018, 2017 and 2016, respectively. Equity method income is reported in net investment income except amounts related to strategic investments classified in other alternativeassets are reported in other revenues. For investments accounted for under the equity method, the Company’s maximum exposure to loss as of December 31, 20172018 is limited to the total carrying value of $1.2$1.5 billion. In addition, the Company has outstanding commitments totaling $829$741 to fund limited partnership and other alternative investments as of December 31, 2017.2018. The Company’s investments in limited partnershipsaccounted for under the equity method are generally of a passive nature in that the Company does not take an active role in the
THE HARTFORD FINANCIAL SERVICES GROUP, INC.
NOTES TO CONSOLIDATED FINANCIAL STATEMENTS (continued)
6. Investments (continued)
management of the limited partnerships. management. In 2017,2018, aggregate investment income from limited partnerships and other alternative investments accounted for under the equity method exceeded 10% of the Company’s pre-tax consolidated net income (loss). Accordingly, the Company is disclosing aggregated summarized financial data for the Company’s limited partnership investments.investments accounted for under the equity method. This aggregated summarized financial data does not represent the Company’s proportionate share of limited partnershipinvestees' assets or earnings. Aggregate total assets of the limited partnerships in which the Company investedinvestees totaled $165.9$311 billion and $93.7$165.9 billion as of December 31, 20172018 and 2016,2017, respectively. Aggregate total liabilities of the limited partnerships in which the Company investedinvestees totaled $47.8$187.7 billion and $13.6$47.8 billion as of December 31, 20172018 and 2016,2017, respectively. Aggregate net investment income of the limited partnerships in which the Company investedinvestees totaled $773, $1.9 billion, $844, and $914$844 for the periods ended December 31, 2018, 2017 2016 and 2015,2016, respectively. Aggregate net income excluding net investment income of the limited partnerships in which the Company investedinvestees totaled $12.3 billion, $9.8 billion $7.7 billion and $6.5$7.7 billion for the periods ended December 31, 2018, 2017 2016 and 2015,2016, respectively. As of, and for the period ended, December 31, 2017,2018, the aggregated summarized financial data reflects the latest available financial information.
THE HARTFORD FINANCIAL SERVICES GROUP, INC.
NOTES TO CONSOLIDATED FINANCIAL STATEMENTS (continued)
7. Derivatives
DERIVATIVES
The Company utilizes a variety of OTC, OTC-cleared and exchange traded derivative instruments as a part of its overall risk management strategy as well as to enter into replication transactions. Derivative instruments are used to manage risk associated with interest rate, equity market, commodity market, credit spread, issuer default, price, and currency exchange rate risk or volatility. Replication transactions are used as an economical means to synthetically replicate the characteristics and performance of assets that are permissible investments under the Company’s investment policies.
Strategies that Qualify for Hedge Accounting
Some of the Company's derivatives satisfy hedge accounting requirements as outlined in Note 1 - Basis of these financial statements.Presentation and Significant Accounting Policies of Notes to Consolidated Financial Statements. Typically, these hedging instruments include interest rate swaps and, to a lesser extent, foreign currency swaps where the terms or expected cash flows of the hedged item closely match the terms of the swap. The interest rate swaps are typically used to manage interest rate duration of certain fixed maturity securities. The hedge strategies by hedge accounting designation include:
Cash Flow Hedges
Interest rate swaps are predominantly used to manage portfolio duration and better match cash receipts from assets with cash disbursements required to fund liabilities. These derivatives primarily convert interest receipts on floating-rate fixed maturity securities to fixed rates. In addition, during 2017, theThe Company has also entered into interest rate swaps to convert the variable interest payments on 3 month Libor + 2.125% junior subordinated debt to fixed interest payments. For further information, see the Junior Subordinated Debentures section within Note 13 - Debt of these financial statements.Notes to Consolidated Financial Statements.
Foreign currency swaps are used to convert foreign currency-denominated cash flows related to certain investment receipts and liability payments to U.S. dollars in order to reduce cash flow fluctuations due to changes in currency rates.
The Company also enterspreviously entered into forward starting swap agreements to hedge the interest rate exposure related to the future purchase of fixed-rate securities, primarily to hedge interest rate risk inherent in the assumptions used to price certain group benefits liabilities.
Foreign currency swaps are used to convert foreign currency-denominated cash flows related to certain investment receipts and liability payments to U.S. dollars in order to reduce cash flow fluctuations due to changes in currency rates.
Non-qualifying Strategies
Derivative relationships that do not qualify for hedge accounting (“non-qualifying strategies”) primarily include hedging and replication strategies that utilize credit default swaps. In addition, hedges of interest rate, foreign currency and equity risk of certain fixed maturities and equities do not qualify for hedge accounting. The non-qualifying strategies include:
Credit Contracts
Credit default swaps are used to purchase credit protection on an individual entity or referenced index to economically hedge against default risk and credit-related changes in the value of fixed maturity securities. Credit default swaps are also used to
assume credit risk related to an individual entity or referenced index as a part of replication transactions. These contracts require the Company to pay or receive a periodic fee in exchange
for compensation from the counterparty should the referenced security issuers experience a credit event, as defined in the contract. In addition, the Company enters into credit default swaps to terminate existing credit default swaps, thereby offsetting the changes in value of the original swap going forward.
Interest Rate Swaps, Swaptions and Futures
The Company uses interest rate swaps, swaptions and futures to manage interest rate duration between assets and liabilities in certain investment portfolios. In addition, the Company enters into interest rate swaps to terminate existing swaps, thereby offsetting the changes in value of the original swap.swap going forward. As of December 31, 20172018 and 2016,2017, the notional amount of interest rate swaps in offsetting relationships was $7.1 billion and $7.3 billion, and $7.9 billion, respectively.
Foreign Currency Swaps and Forwards
The Company enters into foreign currency swaps to convert the foreign currency exposures of certain foreign currency-denominated fixed maturity investments to U.S. dollars. The Company also entersmay at times enter into foreign currency forwards to hedge non-U.S. dollar denominated cash and, previously, equity securities. In addition, theThe Company previously entered into foreign currency forwards to hedge currency impacts on changes in equity of the U.K. property and casualty run-off subsidiaries that were sold in May 2017. For further information on the disposition, see Note 220 - Business Dispositions and Discontinued Operations of these financial statements.Notes to Consolidated Financial Statements.
Equity Index Options
The Company enters into equity index options to hedge the impact of a decline in the equity markets on the investment portfolio. The Company also enters into call options on equity securities to generate additional return. The Company previously entered into total return swaps to hedge equity risk of specific common stock investments which were accounted for using fair value option in order to align the accounting treatment within net realized capital gains (losses). The Company has not held these total return swaps since January 2016.
Commodity Contracts
The Company previously used put options contracts on oil futures to partially offset potential losses related to certain fixed maturity securities that could be impacted by changes in oil prices. These options were terminated at the end of 2015.
Contingent Capital Facility Put Option
The Company previously entered into a put option agreement that provided the Company the right to require a third-party trust to purchase, at any time, The Hartford’s junior subordinated notes in a maximum aggregate principal amount of $500. On February 8, 2017, The Hartford exercised the put option resulting in the issuance of $500 in junior subordinated notes with proceeds received on February 15, 2017. Under the put option agreement, The Hartford had been paying premiums on a periodic basis and had agreed to reimburse the trust for certain fees and ordinary expenses. For further information on the put option agreement, see the Contingent Capital Facility section within Note 13 of these financial statements.
THE HARTFORD FINANCIAL SERVICES GROUP, INC.
NOTES TO CONSOLIDATED FINANCIAL STATEMENTS (continued)
7. Derivatives (continued)
Derivative Balance Sheet Classification
For reporting purposes, the Company has elected to offset within assets or liabilities based upon the net of the fair value amounts, income accruals, and related cash collateral receivables and payables of OTC derivative instruments executed in a legal entity and with the same counterparty under a master netting agreement, which provides the Company with the legal right of offset. The following fair value amounts do not include income
accruals or related cash collateral receivables and payables,
which are netted with derivative fair value amounts to determine balance sheet presentation. Derivative fair value reported as liabilities after taking into account the master netting agreements was $100 and $112 as of December 31, 2017 and 2016, respectively. The Company’s derivative instruments are held for risk management purposes, unless otherwise noted in the following table. The notional amount of derivative contracts represents the basis upon which pay or receive amounts are calculated and is presented in the table to quantify the volume of the Company’s derivative activity. Notional amounts are not necessarily reflective of credit risk.
Derivative Balance Sheet Presentation
|
| | | | | | | | | | | | | | | | | | | | | | | | |
| | Net Derivatives | Asset Derivatives [1] | Liability Derivatives [1] |
| | Notional Amount | Fair Value | Fair Value | Fair Value |
| Hedge Designation/ Derivative Type | Dec 31, 2018 | Dec 31, 2017 | Dec 31, 2018 | Dec 31, 2017 | Dec 31, 2018 | Dec 31, 2017 | Dec 31, 2018 | Dec 31, 2017 |
| Cash flow hedges | | | | | | | | |
| Interest rate swaps | $ | 2,040 |
| $ | 2,190 |
| $ | 1 |
| $ | — |
| $ | 2 |
| $ | 1 |
| $ | (1 | ) | $ | (1 | ) |
| Foreign currency swaps | 153 |
| 153 |
| (6 | ) | (13 | ) | 2 |
| — |
| (8 | ) | (13 | ) |
| Total cash flow hedges | 2,193 |
| 2,343 |
| (5 | ) | (13 | ) | 4 |
| 1 |
| (9 | ) | (14 | ) |
| Non-qualifying strategies | | | | | | | | |
| Interest rate contracts | | | | | | | | |
| Interest rate swaps and futures | 8,451 |
| 7,986 |
| (62 | ) | (83 | ) | 8 |
| 7 |
| (70 | ) | (90 | ) |
| Foreign exchange contracts | | | | | | | | |
| Foreign currency swaps and forwards | 287 |
| 213 |
| (1 | ) | (1 | ) | — |
| — |
| (1 | ) | (1 | ) |
| Credit contracts | | | | | | | | |
| Credit derivatives that purchase credit protection | 6 |
| 61 |
| — |
| 1 |
| — |
| 2 |
| — |
| (1 | ) |
| Credit derivatives that assume credit risk [2] | 1,102 |
| 823 |
| 3 |
| 3 |
| 8 |
| 3 |
| (5 | ) | — |
|
| Credit derivatives in offsetting positions | 41 |
| 1,046 |
| — |
| 2 |
| 6 |
| 11 |
| (6 | ) | (9 | ) |
| Equity contracts | | | | | | | | |
| Equity index swaps and options | 211 |
| 258 |
| 4 |
| 1 |
| 5 |
| 1 |
| (1 | ) | — |
|
| Total non-qualifying strategies | 10,098 |
| 10,387 |
| (56 | ) | (77 | ) | 27 |
| 24 |
| (83 | ) | (101 | ) |
| Total cash flow hedges and non-qualifying strategies | $ | 12,291 |
| $ | 12,730 |
| $ | (61 | ) | $ | (90 | ) | $ | 31 |
| $ | 25 |
| $ | (92 | ) | $ | (115 | ) |
| Balance Sheet Location | | | | | | | | |
| Fixed maturities, available-for-sale | $ | 153 |
| $ | 153 |
| $ | — |
| $ | — |
| $ | — |
| $ | — |
| $ | — |
| $ | — |
|
| Other investments | 9,864 |
| 9,957 |
| 7 |
| 10 |
| 23 |
| 16 |
| (16 | ) | (6 | ) |
| Other liabilities | 2,274 |
| 2,620 |
| (68 | ) | (100 | ) | 8 |
| 9 |
| (76 | ) | (109 | ) |
| Total derivatives | $ | 12,291 |
| $ | 12,730 |
| $ | (61 | ) | $ | (90 | ) | $ | 31 |
| $ | 25 |
| $ | (92 | ) | $ | (115 | ) |
|
| | | | | | | | | | | | | | | | | | | | | | | | |
| | Net Derivatives | Asset Derivatives | Liability Derivatives |
| | Notional Amount | Fair Value | Fair Value | Fair Value |
| Hedge Designation/ Derivative Type | Dec 31, 2017 | Dec 31, 2016 | Dec 31, 2017 | Dec 31, 2016 | Dec 31, 2017 | Dec 31, 2016 | Dec 31, 2017 | Dec 31, 2016 |
| Cash flow hedges | | | | | | | | |
| Interest rate swaps | $ | 2,190 |
| $ | 1,646 |
| $ | — |
| $ | (86 | ) | $ | 94 |
| $ | 2 |
| $ | (94 | ) | $ | (88 | ) |
| Foreign currency swaps | 153 |
| 75 |
| (13 | ) | 1 |
| — |
| 1 |
| (13 | ) | — |
|
| Total cash flow hedges | 2,343 |
| 1,721 |
| (13 | ) | (85 | ) | 94 |
| 3 |
| (107 | ) | (88 | ) |
| Non-qualifying strategies | | | | | | | | |
| Interest rate contracts | | | | | | | | |
| Interest rate swaps and futures | 7,986 |
| 8,969 |
| (83 | ) | (479 | ) | 340 |
| 15 |
| (423 | ) | (494 | ) |
| Foreign exchange contracts | | | | | | | | |
| Foreign currency swaps and forwards | 213 |
| 682 |
| (1 | ) | 32 |
| — |
| 34 |
| (1 | ) | (2 | ) |
| Credit contracts | | | | | | | | |
| Credit derivatives that purchase credit protection | 61 |
| 78 |
| 1 |
| (1 | ) | 1 |
| — |
| — |
| (1 | ) |
| Credit derivatives that assume credit risk [1] | 823 |
| 851 |
| 3 |
| 6 |
| 20 |
| 10 |
| (17 | ) | (4 | ) |
| Credit derivatives in offsetting positions | 1,046 |
| 2,311 |
| 2 |
| — |
| 13 |
| 23 |
| (11 | ) | (23 | ) |
| Equity contracts | | | | | | | | |
| Equity index options | 258 |
| 5 |
| 1 |
| — |
| 1 |
| — |
| — |
| — |
|
| Other | | | | | | | | |
| Contingent capital facility put option | — |
| 500 |
| — |
| 1 |
| — |
| 1 |
| — |
| — |
|
| Total non-qualifying strategies | 10,387 |
| 13,396 |
| (77 | ) | (441 | ) | 375 |
| 83 |
| (452 | ) | (524 | ) |
| Total cash flow hedges and non-qualifying strategies | $ | 12,730 |
| $ | 15,117 |
| $ | (90 | ) | $ | (526 | ) | $ | 469 |
| $ | 86 |
| $ | (559 | ) | $ | (612 | ) |
| Balance Sheet Location | | | | | | | | |
| Fixed maturities, available-for-sale | $ | 153 |
| $ | 201 |
| $ | — |
| $ | 1 |
| $ | — |
| $ | 1 |
| $ | — |
| $ | — |
|
| Other investments | 9,957 |
| 10,888 |
| 10 |
| (415 | ) | 448 |
| 52 |
| (438 | ) | (467 | ) |
| Other liabilities | 2,620 |
| 4,028 |
| (100 | ) | (112 | ) | 21 |
| 33 |
| (121 | ) | (145 | ) |
| Total derivatives | $ | 12,730 |
| $ | 15,117 |
| $ | (90 | ) | $ | (526 | ) | $ | 469 |
| $ | 86 |
| $ | (559 | ) | $ | (612 | ) |
| |
| [1] | Certain prior year amounts have been restated to conform to the current year presentation for OTC-cleared derivatives. |
| |
| [2] | The derivative instruments related to this strategy are held for other investment purposes. |
Offsetting of Derivative Assets/Liabilities
The following tables present the gross fair value amounts, the amounts offset, and net position of derivative instruments eligible for offset in the Company's Consolidated Balance Sheets. Amounts offset include fair value amounts, income accruals and related cash collateral receivables and payables associated with
derivative instruments that are traded under a common master netting agreement, as described in the preceding discussion. Also included in the tables are financial collateral receivables and payables, which are contractually permitted to be offset upon an event of default, although are disallowed for offsetting under U.S. GAAP.
THE HARTFORD FINANCIAL SERVICES GROUP, INC.
NOTES TO CONSOLIDATED FINANCIAL STATEMENTS (continued)
7. Derivatives (continued)
Offsetting Derivative Assets and Liabilities
|
| | | | | | | | | | | | | | | | | | |
| | (i) | (ii) | (iii) = (i) - (ii) | (iv) | (v) = (iii) - (iv) |
| | | | Net Amounts Presented in the Statement of Financial Position | Collateral Disallowed for Offset in the Statement of Financial Position | |
| | Gross Amounts of Recognized Assets (Liabilities) [1] | Gross Amounts Offset in the Statement of Financial Position | Derivative Assets [2] (Liabilities) [3] | Accrued Interest and Cash Collateral (Received) [4] Pledged [3] | Financial Collateral (Received) Pledged [5] | Net Amount |
| As of December 31, 2018 | | | | | | |
| Other investments | $ | 31 |
| $ | 26 |
| $ | 7 |
| $ | (2 | ) | $ | 2 |
| $ | 3 |
|
| Other liabilities | $ | (92 | ) | $ | (20 | ) | $ | (68 | ) | $ | (4 | ) | $ | (65 | ) | $ | (7 | ) |
| As of December 31, 2017 | | | | | | |
| Other investments | $ | 25 |
| $ | 22 |
| $ | 10 |
| $ | (7 | ) | $ | 1 |
| $ | 2 |
|
| Other liabilities | $ | (115 | ) | $ | (10 | ) | $ | (100 | ) | $ | (5 | ) | $ | (96 | ) | $ | (9 | ) |
|
| | | | | | | | | | | | | | | | | | |
| | (i) | (ii) | (iii) = (i) - (ii) | (iv) | (v) = (iii) - (iv) |
| | | | Net Amounts Presented in the Statement of Financial Position | Collateral Disallowed for Offset in the Statement of Financial Position | |
| | Gross Amounts of Recognized Assets (Liabilities) | Gross Amounts Offset in the Statement of Financial Position | Derivative Assets [1] (Liabilities) [2] | Accrued Interest and Cash Collateral (Received) [3] Pledged [2] | Financial Collateral (Received) Pledged [4] | Net Amount |
| As of December 31, 2017 | | | | | | |
| Other investments | $ | 469 |
| $ | 466 |
| $ | 10 |
| $ | (7 | ) | $ | 1 |
| $ | 2 |
|
| Other liabilities | $ | (559 | ) | $ | (454 | ) | $ | (100 | ) | $ | (5 | ) | $ | (96 | ) | $ | (9 | ) |
| As of December 31, 2016 | | | | | | |
| Other investments | $ | 85 |
| $ | 82 |
| $ | (415 | ) | $ | 418 |
| $ | 2 |
| $ | 1 |
|
| Other liabilities | $ | (612 | ) | $ | (488 | ) | $ | (112 | ) | $ | (12 | ) | $ | (108 | ) | $ | (16 | ) |
| |
| [1] | For amounts shown as of December 31, 2017, certain amounts have been restated to conform to the current year presentation for OTC-cleared derivatives. |
| |
| [2] | Included in other investments in the Company's Consolidated Balance Sheets. |
| |
[2]3] | Included in other liabilities in the Company's Consolidated Balance Sheets and is limited to the net derivative payable associated with each counterparty. |
| |
[3]4] | Included in other investments in the Company's Consolidated Balance Sheets and is limited to the net derivative receivable associated with each counterparty. |
| |
[4]5] | Excludes collateral associated with exchange-traded derivative instruments. |
Cash Flow Hedges
For derivative instruments that are designated and qualify as cash flow hedges, the effective portion of the gain or loss on the derivative is reported as a component of OCI and reclassified into earnings in the same period or periods during which the hedged transaction affects earnings. Gains and losses on the derivative representing hedge ineffectiveness are recognized in current period earnings. All components of each derivative’s gain or loss were included in the assessment of hedge effectiveness.
Derivatives in Cash Flow Hedging Relationships | | | | Gain (Loss) Recognized in OCI on Derivative (Effective Portion) | Gain (Loss) Recognized in OCI on Derivative (Effective Portion) |
| | 2017 | 2016 | 2015 | 2018 | 2017 | 2016 |
| Interest rate swaps | $ | 8 |
| $ | — |
| $ | 25 |
| $ | 5 |
| $ | 8 |
| $ | — |
|
| Foreign currency swaps | (14 | ) | 1 |
| — |
| 7 |
| (14 | ) | 1 |
|
| Total | $ | (6 | ) | $ | 1 |
| $ | 25 |
| $ | 12 |
| $ | (6 | ) | $ | 1 |
|
| | Gain (Loss) Reclassified from AOCI into Income (Effective Portion) | Gain Reclassified from AOCI into Income (Effective Portion) |
| | 2017 | 2016 | 2015 | 2018 | 2017 | 2016 |
| Interest rate swaps | | |
| Net realized capital gain/(loss) | $ | 5 |
| $ | 10 |
| $ | 5 |
| $ | 6 |
| $ | 5 |
| $ | 10 |
|
| Net investment income | 37 |
| 37 |
| 31 |
| 30 |
| 37 |
| 37 |
|
| Total | $ | 42 |
| $ | 47 |
| $ | 36 |
| $ | 36 |
| $ | 42 |
| $ | 47 |
|
During the years ended December 31, 2018, 2017, 2016, and 20152016 the Company had no ineffectiveness recognized in income within net realized capital gains (losses).
As of December 31, 2017,2018, the before-taxbefore tax deferred net gains on derivative instruments recorded in AOCI that are expected to be reclassified to earnings during the next twelve months are $86.$23. This expectation is based on the anticipated interest payments on hedged investments in fixed maturity securities that will occur over the next twelve months, at which time the Company will recognize the deferred net gains (losses) as an adjustment to net investment income over the term of the investment cash flows. The maximum term over which the Company is hedging its exposure to the variability of future cash flows for forecasted transactions, excluding interest payments on existing variable-rate financial instruments, is less than one year.
During the years ended December 31, 2018, 2017, 2016, and 2015,2016, the Company had no net reclassifications from AOCI to earnings resulting from the discontinuance of cash-flow hedges due to forecasted transactions that were no longer probable of occurring.
Non-qualifyingNon-Qualifying Strategies
For non-qualifying strategies, including embedded derivatives that are required to be bifurcated from their host contracts and accounted for as derivatives, the gain or loss on the derivative is recognized currently in earnings within net realized capital gains (losses).
THE HARTFORD FINANCIAL SERVICES GROUP, INC.
NOTES TO CONSOLIDATED FINANCIAL STATEMENTS (continued)
7. Derivatives (continued)
Non-Qualifying Strategies Recognized within Net Realized Capital Gains (Losses) |
| | | | | | | | | |
| | For the Year Ended December 31, |
| | 2018 | 2017 | 2016 |
| Foreign exchange contracts | | | |
| Foreign currency swaps and forwards | $ | 3 |
| $ | (14 | ) | $ | 83 |
|
| Other non-qualifying derivatives | | | |
| Interest rate contracts | | | |
| Interest rate swaps, swaptions and futures | (3 | ) | (5 | ) | 1 |
|
| Credit contracts | | | |
| Credit derivatives that purchase credit protection | — |
| 28 |
| (17 | ) |
| Credit derivatives that assume credit risk | (14 | ) | (7 | ) | 28 |
|
| Equity contracts | | | |
| Equity options | 2 |
| (7 | ) | (15 | ) |
| Other | | | |
| Contingent capital facility put option | — |
| (1 | ) | (6 | ) |
| Total other non-qualifying derivatives | (15 | ) | 8 |
| (9 | ) |
| Total [1] | $ | (12 | ) | $ | (6 | ) | $ | 74 |
|
|
| | | | | | | | | |
| | For the Year Ended December 31, |
| | 2017 | 2016 | 2015 |
| Foreign exchange contracts | | | |
| Foreign currency swaps and forwards | (14 | ) | 83 |
| 13 |
|
| Other non-qualifying derivatives | | | |
| Interest rate contracts | | | |
| Interest rate swaps, swaptions and futures | (5 | ) | 1 |
| (8 | ) |
| Credit contracts | | | |
| Credit derivatives that purchase credit protection | 28 |
| (17 | ) | 5 |
|
| Credit derivatives that assume credit risk | (7 | ) | 28 |
| (7 | ) |
| Equity contracts | | | |
| Equity options | (7 | ) | (15 | ) | — |
|
| Commodity contracts | | | |
| Commodity options | — |
| — |
| (4 | ) |
| Other | | | |
| Contingent capital facility put option | (1 | ) | (6 | ) | (6 | ) |
| Total other non-qualifying derivatives | 8 |
| (9 | ) | (20 | ) |
| Total [1] | $ | (6 | ) | $ | 74 |
| $ | (7 | ) |
| |
| [1] | Excludes investments that contain an embedded credit derivative for which the Company has elected the fair value option. For further discussion, see the Fair Value Option section in Note 5 - Fair Value Measurements.Measurements of Notes to Consolidated Financial Statements. |
Credit Risk Assumed through Credit Derivatives
The Company enters into credit default swaps that assume credit risk of a single entity or referenced index in order to synthetically replicate investment transactions that are permissible under the Company's investment policies. The Company will receive periodic payments based on an agreed upon rate and notional amount and will only make a payment if there is a credit event. A credit event payment will typically be equal to the notional value of the swap contract less the value of the referenced security
issuer’s debt obligation after the occurrence of the credit event. A credit event is generally defined as a default on contractually obligated interest or principal payments or bankruptcy of the referenced entity. The credit default swaps in which the Company assumes credit risk primarily reference investment grade single corporate issuers and baskets, which include standard diversified portfolios of corporate and CMBS issuers. The diversified portfolios of corporate issuers are established within sector concentration limits and may be divided into tranches that possess different credit ratings.
THE HARTFORD FINANCIAL SERVICES GROUP, INC.
NOTES TO CONSOLIDATED FINANCIAL STATEMENTS (continued)
7. Derivatives (continued)
Credit Risk Assumed Derivatives by Type | | | | | | Underlying Referenced Credit Obligation(s) [1] | | | | Underlying Referenced Credit Obligation(s) [1] | |
| | Notional Amount [2] | Fair Value | Weighted Average Years to Maturity | | Type | Average Credit Rating | Offsetting Notional Amount [3] | Offsetting Fair Value [3] | Notional Amount [2] | Fair Value | Weighted Average Years to Maturity | | Type | Average Credit Rating | Offsetting Notional Amount [3] | Offsetting Fair Value [3] |
| As of December 31, 2018 | | As of December 31, 2018 |
| Single name credit default swaps | | | | |
| Investment grade risk exposure | | $ | 169 |
| $ | 2 |
| 4 years | | Corporate Credit/
Foreign Gov. | A | $ | — |
| $ | — |
|
| Basket credit default swaps [4] | | | | |
| Investment grade risk exposure | | 799 |
| (1 | ) | 6 years | | Corporate Credit | BBB+ | — |
| — |
|
| Below investment grade risk exposure | | 125 |
| 2 |
| 5 years | | Corporate Credit | B+ | — |
| — |
|
| Investment grade risk exposure | | 11 |
| — |
| 5 years | | CMBS Credit | A- | 2 |
| — |
|
| Below investment grade risk exposure | | 19 |
| (6 | ) | Less than 1 year | | CMBS Credit | CCC | 19 |
| 6 |
|
| Total [5] | | $ | 1,123 |
| $ | (3 | ) | | $ | 21 |
| $ | 6 |
|
As of December 31, 2017 | | Single name credit default swaps | | | | | | |
| Investment grade risk exposure | $ | 130 |
| $ | 3 |
| 5 years | | Corporate Credit/
Foreign Gov. | A- | $ | — |
| $ | — |
| $ | 130 |
| $ | 3 |
| 5 years | | Corporate Credit/
Foreign Gov. | A- | $ | — |
| $ | — |
|
| Below investment grade risk exposure | 9 |
| — |
| Less than 1 year | | Corporate Credit | B | 9 |
| — |
| 9 |
| — |
| Less than 1 year | | Corporate Credit | B | 9 |
| — |
|
| Basket credit default swaps [4] | | | | | | |
| Investment grade risk exposure | 1,137 |
| 2 |
| 3 years | | Corporate Credit | BBB+ | 454 |
| (2 | ) | 1,137 |
| 2 |
| 3 years | | Corporate Credit | BBB+ | 454 |
| (2 | ) |
| Below investment grade risk exposure | 27 |
| 2 |
| 3 years | | Corporate Credit | B+ | 27 |
| — |
| 27 |
| 2 |
| 3 years | | Corporate Credit | B+ | 27 |
| — |
|
| Investment grade risk exposure | 13 |
| (1 | ) | 5 years | | CMBS Credit | A | 3 |
| — |
| 13 |
| (1 | ) | 5 years | | CMBS Credit | A | 3 |
| — |
|
| Below investment grade risk exposure | 30 |
| (6 | ) | Less than 1 year | | CMBS Credit | CCC | 30 |
| 7 |
| 30 |
| (6 | ) | Less than 1 year | | CMBS Credit | CCC | 30 |
| 7 |
|
| Total [5] | $ | 1,346 |
| $ | — |
| | $ | 523 |
| $ | 5 |
| $ | 1,346 |
| $ | — |
| | $ | 523 |
| $ | 5 |
|
| As of December 31, 2016 | |
| Single name credit default swaps | | | | |
| Investment grade risk exposure | $ | 81 |
| $ | — |
| 4 years | | Corporate Credit/
Foreign Gov. | A- | $ | 6 |
| $ | — |
| |
| Below investment grade risk exposure | 34 |
| — |
| Less than 1 year | | Corporate Credit | BBB- | 34 |
| — |
| |
| Basket credit default swaps [4] | | | | |
| Investment grade risk exposure | 1,572 |
| 17 |
| 2 years | | Corporate Credit | A- | 979 |
| (8 | ) | |
| Below investment grade risk exposure | 28 |
| 2 |
| 4 years | | Corporate Credit | BB- | 28 |
| (2 | ) | |
| Investment grade risk exposure | 139 |
| (3 | ) | 3 years | | CMBS Credit | AA+ | 56 |
| — |
| |
| Below investment grade risk exposure | 53 |
| (13 | ) | 1 year | | CMBS Credit | CCC | 53 |
| 13 |
| |
| Embedded credit derivatives | | | | |
| Investment grade risk exposure | 100 |
| 100 |
| Less than 1 year | | Corporate Credit | A+ | — |
| — |
| |
| Total [5] | $ | 2,007 |
| $ | 103 |
| | $ | 1,156 |
| $ | 3 |
| |
| |
| [1] | The average credit ratings are based on availability and are generally the midpoint of the available ratings among Moody’s, S&P, Fitch and Morningstar.Fitch. If no rating is available from a rating agency, then an internally developed rating is used. |
| |
| [2] | Notional amount is equal to the maximum potential future loss amount. These derivatives are governed by agreements clearing house rules and applicable law which include collateral posting requirements. There is no additional specific collateral related to these contracts or recourse provisions included in the contracts to offset losses. |
| |
| [3] | The Company has entered into offsetting credit default swaps to terminate certain existing credit default swaps, thereby offsetting the future changes in value of, or losses paid related to, the original swap. |
| |
| [4] | Comprised of swaps of standard market indices of diversified portfolios of corporate and CMBS issuers referenced through credit default swaps. These swaps are subsequently valued based upon the observable standard market index. |
| |
| [5] | Excludes investments that contain an embedded credit derivative for which the Company has elected the fair value option. For further discussion, see the Fair Value Option section in Note 5 - Fair Value Measurements. of Notes to Consolidated Financial Statements. |
Derivative Collateral Arrangements
The Company enters into various collateral arrangements in connection with its derivative instruments, which require both the pledging and accepting of collateral. As of December 31, 2017
2018 and 2016,2017, the Company pledged cash collateral associated with derivative instruments with a fair value of $4 and $1 and $489, respectively, for which theassociated with derivative instruments. The collateral receivable has been primarily included withinrecorded in other investmentsassets or other liabilities on the Company's Consolidated Balance Sheets.Sheets as determined by the Company's election to offset on the balance sheet. As of December 31, 20172018 and 2016,2017, the Company also pledged securities collateral associated with derivative instruments with a fair value of $67 and $101, and $240,
respectively, whichTHE HARTFORD FINANCIAL SERVICES GROUP, INC.
NOTES TO CONSOLIDATED FINANCIAL STATEMENTS (continued)
7. Derivatives (continued)
respectively, which have been included in fixed maturities on the Consolidated Balance Sheets. In addition, as of December 31, 2018 and 2017 , the Company has also pledged initial margin of securities related to OTC-cleared and exchange traded derivatives with a fair value of $89 and $96, respectively, which are included within fixed maturities on the Company's Consolidated Balance Sheets. The counterparties generally have the right to sell or re-pledge these securities.
As of December 31, 20172018 and 2016,2017, the Company accepted cash collateral associated with derivative instruments of $11$9 and $53,$11, respectively, which was invested and recorded in the Consolidated Balance Sheets in fixed maturities and short-term investments with corresponding amounts recorded in other investments or other liabilities as determined by the Company's election to offset on the balance sheet. The Company also
THE HARTFORD FINANCIAL SERVICES GROUP, INC.
NOTES TO CONSOLIDATED FINANCIAL STATEMENTS (continued)
accepted securities collateral as of December 31, 20172018 and 20162017 with a fair value of $2$5 and $2, respectively, none of which the Company has the ability to sell or repledge. As of December 31, 20172018 and 2016,2017, the Company had no repledged securities and did not sell any securities.securities held as collateral. In addition, as of
December 31, 20172018 and 2016,2017, non-cash collateral accepted was held in separate custodial accounts and was not included in the Company’s Consolidated Balance Sheets.
THE HARTFORD FINANCIAL SERVICES GROUP, INC.NOTES TO CONSOLIDATED FINANCIAL STATEMENTS (continued)
8. Reinsurance
REINSURANCE
The Company cedes insurance risk to affiliated and unaffiliated insurersreinsurers to enable the Company to manage capital and risk exposure. Such arrangements do not relieve the Company of its primary liability to policyholders. Failure of reinsurers to honor their obligations could result in losses to the Company. The Company's procedures include carefully selecting its reinsurers, structuring agreements to provide collateral funds where necessary, and regularly monitoring the financial condition and ratings of its reinsurers.
InOn December 31, 2016, the Company entered into an asbestos and environmental adverse development cover (“ADC”) reinsurance agreement with National Indemnity Company (“NICO”), a subsidiary of Berkshire Hathaway Inc. (“Berkshire”), to reduce uncertainty about potential adverse development of asbestos and environmental reserves. Under the ADC, the Company paid a reinsurance premium of $650 for NICO to assume adverse net loss reserve development up to $1.5 billion above the Company’s existing net asbestos and environmental (“A&E”) reserves as of December 31, 2016 of approximately $1.7 billion. The $650 reinsurance premium was placed into a collateral trust account as security for NICO’s claim payment obligations to the Company. As of December 31, 2016, other liabilities included $650 for the accrued reinsurance premium.premium paid in January, 2017. The Company has retained the risk of collection on amounts due from other third-party reinsurers and continues to be responsible for claims handling and other administrative services, subject to certain conditions. The ADC covers substantially all the Company’s A&E reserve development up to the reinsurance limit.
The ADC has been accounted for as retroactive reinsurance and the Company reported the $650 cost as a loss on reinsurance transaction in 2016 in the Consolidated Statements of Operations. For segment reporting, the loss on reinsurance was reported in Property and Casualty Other Operations. Under retroactive reinsurance accounting, net adverse asbestos and environmentalA&E reserve development after December 31, 2016 will result in an offsetting reinsurance recoverable up to the $1.5 billion limit. Cumulative
billion limit. Cumulative ceded losses up to the $650 reinsurance premium paid are recognized as a dollar-for-dollar offset to direct losses incurred. Cumulative ceded losses exceeding the $650 reinsurance premium paid would result in a deferred gain. The deferred gain would be recognized over the claim settlement period in the proportion of the amount of cumulative ceded losses collected from the reinsurer to the estimated ultimate reinsurance recoveries. Consequently, until periods when the deferred gain is recognized as a benefit to earnings, cumulative adverse development of asbestos and environmental claims after December 31, 2016 in excess of $650 may result in significant charges against earnings. As of December 31, 2017,2018, the Company has incurred $285$523 in cumulative adverse development on asbestos and environmental reserves that have been ceded under the ADC treaty with NICO.
Reinsurance Recoverables
Reinsurance recoverables include balances due from reinsurance companies and are presented net of an allowance for uncollectible reinsurance. Reinsurance recoverables include an estimate of the amount of gross losses and loss adjustment expense reserves that may be ceded under the terms of the reinsurance agreements, including incurred but not reported unpaid losses. The Company’s estimate of losses and loss adjustment expense reserves ceded to reinsurers is based on assumptions that are consistent with those used in establishing the gross reserves for amounts the Company owes to its claimants. The Company estimates its ceded reinsurance recoverables based on the terms of any applicable facultative and treaty reinsurance, including an estimate of how incurred but not reported losses will ultimately be ceded under reinsurance agreements. Accordingly, the Company’s estimate of reinsurance recoverables is subject to similar risks and uncertainties as the estimate of the gross reserve for unpaid losses and loss adjustment expenses.
Reinsurance Recoverables
|
| | | | | | |
| | As of |
| | December 31, 2018 | December 31, 2017 |
| Property and Casualty Insurance Products | | |
| Paid loss and loss adjustment expenses | $ | 127 |
| $ | 84 |
|
| Unpaid loss and loss adjustment expenses | 3,773 |
| 3,496 |
|
| Gross reinsurance recoverables | 3,900 |
| 3,580 |
|
| Allowance for uncollectible reinsurance | (126 | ) | (104 | ) |
| Net P&C reinsurance recoverables | 3,774 |
| 3,476 |
|
| Group Benefits net reinsurance recoverables [1] | 251 |
| 236 |
|
| Recoverable related to reserves in Corporate | 332 |
| 349 |
|
| Reinsurance recoverables, net | $ | 4,357 |
| $ | 4,061 |
|
|
| | | | | | |
| | As of |
| | December 31, 2017 | December 31, 2016 |
| Property and Casualty Insurance Products | | |
| Paid loss and loss adjustment expenses | $ | 84 |
| $ | 89 |
|
| Unpaid loss and loss adjustment expenses [1] | 3,496 |
| 3,161 |
|
| Gross reinsurance recoverables [1] | 3,580 |
| 3,250 |
|
| Allowance for uncollectible reinsurance | (104 | ) | (165 | ) |
| Net reinsurance recoverables [1] | 3,476 |
| 3,085 |
|
| Group Benefits net reinsurance recoverables [2] | 236 |
| 208 |
|
| Retained life and annuity business in Corporate | 349 |
| 366 |
|
| Reinsurance recoverables, net | $ | 4,061 |
| $ | 3,659 |
|
| |
| [1] | Reflects the addition of $688 and $712 into Property & Casualty Commercial Lines of reinsurance recoverables as of December 31, 2017 and 2016, respectively, for structured settlements recoverables due from the Company's life and annuity run-off business now classified as held for sale. These amounts were previously eliminated in consolidation.
|
| |
[2] | No allowance for uncollectible reinsurance was required as of December 31, 20172018 and 20162017. |
THE HARTFORD FINANCIAL SERVICES GROUP, INC.
NOTES TO CONSOLIDATED FINANCIAL STATEMENTS (continued)
The allowance for uncollectible reinsurance reflects management’s best estimate of reinsurance cessions that may be uncollectible in the future due to reinsurers’ unwillingness or inability to pay. The Company analyzes recent developments in
commutation activity between reinsurers and cedants, recent trends in arbitration and litigation outcomes in disputes between reinsurers and cedants and the overall credit quality of the Company’s reinsurers. Based on this analysis, the Company may
THE HARTFORD FINANCIAL SERVICES GROUP, INC.
NOTES TO CONSOLIDATED FINANCIAL STATEMENTS (continued)
8. Reinsurance (continued)
adjust the allowance for uncollectible reinsurance or charge off reinsurer balances that are determined to be uncollectible. Where its contracts permit, the Company secures future claim obligations with various forms of collateral, including irrevocable letters of credit, secured trusts, funds held accounts and group-wide offsets.
Due to the inherent uncertainties as to collection and the length of time before reinsurance recoverables become due, it is possible that future adjustments to the Company’s reinsurance
recoverables, net of the allowance, could be required, which could have a material adverse effect on the Company’s consolidated results of operations or cash flows in a particular quarter or annual period.
Insurance Revenues
The effect of reinsurance on insurance revenues is as follows:
Property and Casualty Insurance Revenue
|
| | | | | | | | | |
| | For the years ended December 31, |
| Premiums Written | 2018 | 2017 | 2016 |
| Direct | $ | 10,784 |
| $ | 10,865 |
| $ | 10,906 |
|
| Assumed | 217 |
| 223 |
| 253 |
|
| Ceded | (593 | ) | (571 | ) | (591 | ) |
| Net | $ | 10,408 |
| $ | 10,517 |
| $ | 10,568 |
|
| Premiums Earned | |
| |
| |
|
| Direct | $ | 10,824 |
| $ | 10,923 |
| $ | 10,871 |
|
| Assumed | 221 |
| 232 |
| 261 |
|
| Ceded | (599 | ) | (600 | ) | (583 | ) |
| Net | $ | 10,446 |
| $ | 10,555 |
| $ | 10,549 |
|
|
| | | | | | | | | |
| | For the years ended December 31, |
| Premiums Written | 2017 | 2016 | 2015 |
| Direct | $ | 10,865 |
| $ | 10,906 |
| $ | 10,861 |
|
| Assumed | 223 |
| 253 |
| 297 |
|
| Ceded | (571 | ) | (591 | ) | (580 | ) |
| Net | $ | 10,517 |
| $ | 10,568 |
| $ | 10,578 |
|
| Premiums Earned | |
| |
| |
|
| Direct | $ | 10,923 |
| $ | 10,871 |
| $ | 10,704 |
|
| Assumed | 232 |
| 261 |
| 298 |
|
| Ceded | (600 | ) | (583 | ) | (586 | ) |
| Net | $ | 10,555 |
| $ | 10,549 |
| $ | 10,416 |
|
Ceded losses, which reduce losses and loss adjustment expenses incurred, were $661, $901 $388 and $336$388 for the years ended December 31, 2018, 2017 2016 and 2015,2016, respectively.
Group Benefits Revenue
|
| | | | | | | | | |
| | For the years ended December 31, |
| | 2018 | 2017 | 2016 |
| Gross earned premiums, fees and other considerations | $ | 3,615 |
| $ | 3,281 |
| $ | 3,160 |
|
| Reinsurance assumed | 2,044 |
| 446 |
| 107 |
|
| Reinsurance ceded | (61 | ) | (50 | ) | (44 | ) |
| Net earned premiums, fees and other considerations | $ | 5,598 |
| $ | 3,677 |
| $ | 3,223 |
|
|
| | | | | | | | | |
| | For the years ended December 31, |
| | 2017 | 2016 | 2015 |
| Gross earned premiums, fees and other considerations | $ | 3,281 |
| $ | 3,160 |
| $ | 3,107 |
|
| Reinsurance assumed | 446 |
| 107 |
| 97 |
|
| Reinsurance ceded | (50 | ) | (44 | ) | (68 | ) |
| Net earned premiums, fees and other considerations | $ | 3,677 |
| $ | 3,223 |
| $ | 3,136 |
|
For its group benefits products, the Company reinsures certain of its risks to other reinsurers under yearly renewable term and coinsurance arrangements and variations thereto. Yearly renewable term and coinsurance arrangements result in passing all or a portion of the risk to the reinsurer. Generally, the reinsurer receives a proportionate amount of the premiums less an
allowance for commissions and expenses and is liable for a corresponding proportionate amount of all benefit payments. The increase in premiums assumed in 2018 and 2017 was primarily due to premiums related to Aetna's U.S. group life and disability business acquired by the Company effective November 1, 2017 whereby Aetna is fronting the business for a period of time.
THE HARTFORD FINANCIAL SERVICES GROUP, INC.
NOTES TO CONSOLIDATED FINANCIAL STATEMENTS (continued)
9. Deferred Policy Acquisition CostsDEFERRED POLICY ACQUISITION COSTS
Changes in the DAC Balance |
| | | | | | | | | |
| | For the years ended December 31, |
| | 2017 | 2016 | 2015 |
| Balance, beginning of period | $ | 645 |
| $ | 636 |
| $ | 623 |
|
| Deferred costs | 1,377 |
| 1,378 |
| 1,377 |
|
| Amortization — DAC | (1,372 | ) | (1,377 | ) | (1,364 | ) |
| Add: Maxum acquisition | — |
| 8 |
| — |
|
| Balance, end of period | $ | 650 |
| $ | 645 |
| $ | 636 |
|
|
| | | | | | | | | |
| | For the years ended December 31, |
| | 2018 | 2017 | 2016 |
| Balance, beginning of period | $ | 650 |
| $ | 645 |
| $ | 636 |
|
| Deferred costs | 1,404 |
| 1,377 |
| 1,378 |
|
| Amortization — DAC | (1,384 | ) | (1,372 | ) | (1,377 | ) |
| Add: Maxum acquisition | — |
| — |
| 8 |
|
| Balance, end of period | $ | 670 |
| $ | 650 |
| $ | 645 |
|
THE HARTFORD FINANCIAL SERVICES GROUP, INC.NOTES TO CONSOLIDATED FINANCIAL STATEMENTS (continued)
10. GoodwillGOODWILL & Other Intangible Assets
OTHER INTANGIBLE ASSETS
Goodwill Carrying Value as of December 31, 20172018
|
| | | | | | | | | | | | | | | | | | |
| | Commercial Lines | Personal Lines | Hartford Funds | Group Benefits | Corporate [1] | Total |
| Balance at December 31, 2016 | $ | 38 |
| $ | 119 |
| $ | 180 |
| $ | — |
| $ | 230 |
| $ | 567 |
|
| Goodwill related to acquisitions [2] | — |
| — |
| — |
| 723 |
| — |
| 723 |
|
| Balance at December 31, 2017 | $ | 38 |
| $ | 119 |
| $ | 180 |
| $ | 723 |
| $ | 230 |
| $ | 1,290 |
|
| Goodwill related to acquisitions | — |
| — |
| — |
| — |
| — |
| — |
|
| Balance at December 31, 2018 | $ | 38 |
| $ | 119 |
| $ | 180 |
| $ | 723 |
| $ | 230 |
| $ | 1,290 |
|
|
| | | | | | | | | | | | | | | | | | |
| | Small Commercial | Personal Lines | Mutual Funds | Group Benefits | Corporate [1] | Total |
| Balance at December 31, 2015 | $ | — |
| $ | 119 |
| $ | 149 |
| $ | — |
| $ | 230 |
| $ | 498 |
|
| Goodwill related to acquisitions [2] | 38 |
| — |
| 31 |
| — |
| — |
| 69 |
|
| Balance at December 31, 2016 | $ | 38 |
| $ | 119 |
| $ | 180 |
| $ | — |
| $ | 230 |
| $ | 567 |
|
| Goodwill related to acquisitions [2] | — |
| — |
| — |
| 723 |
| — |
| 723 |
|
| Balance at December 31, 2017 | $ | 38 |
| $ | 119 |
| $ | 180 |
| $ | 723 |
| $ | 230 |
| $ | 1,290 |
|
| |
| [1] | The Corporate category includes goodwill that was acquired at a holding company level and not pushed down to a subsidiary within a reportable segment. Carrying value of goodwill within Corporate as of December 31, 2018, 2017, and 2016 includes $138and 2015 includes$138 and $92 for the Group Benefits and MutualHartford Funds reporting units, respectively. |
| |
| [2] | For further discussion on goodwill related to the acquisition of Aetna's U.S. group life and disability business, refer to Note 2 - Business Acquisitions to Consolidated Financial Statements. |
The annual goodwill assessment for The Hartford's reporting units was completed as of October 31, 2018, 2017, 2016, and 2015,2016, which resulted in no write-downs of goodwill in the respective
years then ended. In 2017,2018, all reporting units passed the first step of their annual impairment test with a significant margin.
Other Intangible Assets |
| | | | | | | | | | | | | | | | | | | | | |
| As of December 31, 2018 | | As of December 31, 2017 | | |
| Gross Carrying Amount | Accumulated Amortization | Net Carrying Amount | | Gross Carrying Amount | Accumulated Amortization | Net Carrying Amount | | Weighted Average Expected Life |
| Amortized Intangible Assets: |
|
|
| |
|
|
| |
|
| Value of in-force contracts | $ | 23 |
| $ | (23 | ) | $ | — |
| | $ | 23 |
| $ | (3 | ) | $ | 20 |
| | 1 |
| Customer relationships [1] | 636 |
| (49 | ) | 587 |
| | 590 |
| (6 | ) | 584 |
| | 15 |
| Marketing agreement with Aetna | 16 |
| (1 | ) | 15 |
| | 16 |
| — |
| 16 |
| | 15 |
| Distribution Agreement | 79 |
| (56 | ) | 23 |
| | 70 |
| (52 | ) | 18 |
| | 15 |
| Agency relationships & Other [2] | 21 |
| (3 | ) | 18 |
| | 9 |
| (2 | ) | 7 |
| | 13 |
| Total Finite Life Intangibles | 775 |
| (132 | ) | 643 |
| | 708 |
| (63 | ) | 645 |
| | 14 |
| Total Indefinite Life Intangible Assets | 14 |
| — |
| 14 |
| | 14 |
| — |
| 14 |
| |
|
| Total Other Intangible Assets | $ | 789 |
| $ | (132 | ) | $ | 657 |
| | $ | 722 |
| $ | (63 | ) | $ | 659 |
| |
|
|
| | | | | | | | | | | | | | | | | | | | | |
| | As of December 31, 2017 | | As of December 31, 2016 | | |
| | Gross Carrying Amount | Accumulated Amortization | Net Carrying Amount | | Gross Carrying Amount | Accumulated Amortization | Net Carrying Amount | | Weighted Average Expected Life |
| Amortized Intangible Assets: | | | | | | | | | |
| Value of in-force contracts [1] | $ | 23 |
| $ | (3 | ) | $ | 20 |
| | $ | — |
| $ | — |
| $ | — |
| | 1 |
| Customer relationships [1] | 590 |
| (6 | ) | 584 |
| | — |
| — |
| — |
| | 15 |
| Marketing agreement with Aetna [1] | 16 |
| — |
| 16 |
| | — |
| — |
| — |
| | 15 |
| Distribution Agreement | 70 |
| (52 | ) | 18 |
| | 70 |
| (48 | ) | 22 |
| | 15 |
| Agency relationships & Other | 9 |
| (2 | ) | 7 |
| | 9 |
| (1 | ) | 8 |
| | 9 |
| Total Finite Life Intangibles | 708 |
| (63 | ) | 645 |
| | 79 |
| (49 | ) | 30 |
| | 15 |
| Total Indefinite Life Intangible Assets | 14 |
| — |
| 14 |
| | 14 |
| — |
| 14 |
| | |
| Total Other Intangible Assets | $ | 722 |
| $ | (63 | ) | $ | 659 |
| | $ | 93 |
| $ | (49 | ) | $ | 44 |
| | |
[1] For additional information associated with the fair value of consideration transferred and identifiable intangible assets assumed as a result of the acquisition of Aetna's U.S. group life and disability business, see Note 2 - Business Acquisitions.
Expected Pre-tax Amortization Expense |
| | | |
| For the years ended December 31, |
| 2018 | $ | 64 |
|
| 2019 | $ | 45 |
|
| 2020 | $ | 45 |
|
| 2021 | $ | 45 |
|
| 2022 | $ | 45 |
|
| |
| [1] | On February 16, 2018, The Company entered into a renewal rights agreement with Farmers Exchanges of the Farmers Group of Companies to acquire its Foremost-branded small commercial business sold through independent agents. In connection with the renewal rights agreement, the Company recorded a customer relationships intangible asset of $46 which will be amortized over 10 years. |
| |
| [2] | On December 1, 2018, the Company acquired Y-Risk LLC and recorded an agency relationships intangible asset of $12 which will be amortized over 15 years. |
THE HARTFORD FINANCIAL SERVICES GROUP, INC.
NOTES TO CONSOLIDATED FINANCIAL STATEMENTS (continued)
11. Reserve for Unpaid Losses and Loss Adjustment Expenses
Expected Pre-tax Amortization Expense |
| | | |
| For the years ended December 31, |
| 2019 | $ | 53 |
|
| 2020 | $ | 53 |
|
| 2021 | $ | 53 |
|
| 2022 | $ | 52 |
|
| 2023 | $ | 47 |
|
11. RESERVE FOR UNPAID LOSSES AND LOSS ADJUSTMENT EXPENSES
Property and Casualty Insurance Products
Roll-forwardRollforward of Liabilities for Unpaid Losses and Loss Adjustment Expenses
|
| | | | | | | | | |
| | For the years ended December 31, |
| | 2018 | 2017 | 2016 |
| Beginning liabilities for unpaid losses and loss adjustment expenses, gross | $ | 23,775 |
| $ | 22,545 |
| $ | 22,568 |
|
| Reinsurance and other recoverables | 3,957 |
| 3,488 |
| 3,625 |
|
| Beginning liabilities for unpaid losses and loss adjustment expenses, net | 19,818 |
| 19,057 |
| 18,943 |
|
| Add: Maxum acquisition | — |
| — |
| 122 |
|
| Provision for unpaid losses and loss adjustment expenses | |
| |
| |
|
| Current accident year | 7,107 |
| 7,381 |
| 6,990 |
|
| Prior accident year development | (167 | ) | (41 | ) | 457 |
|
| Total provision for unpaid losses and loss adjustment expenses | 6,940 |
| 7,340 |
| 7,447 |
|
| Less: payments | |
| |
| |
|
| Current accident year | 2,452 |
| 2,751 |
| 2,749 |
|
| Prior accident years | 3,954 |
| 3,828 |
| 4,219 |
|
| Total payments | 6,406 |
| 6,579 |
| 6,968 |
|
| Less: net reserves transferred to liabilities held for sale | — |
| — |
| 487 |
|
| Ending liabilities for unpaid losses and loss adjustment expenses, net | 20,352 |
| 19,818 |
| 19,057 |
|
| Reinsurance and other recoverables | 4,232 |
| 3,957 |
| 3,488 |
|
| Ending liabilities for unpaid losses and loss adjustment expenses, gross | $ | 24,584 |
| $ | 23,775 |
| $ | 22,545 |
|
|
| | | | | | | | | |
| | For the years ended December 31, |
| | 2017 | 2016 | 2015 |
| Beginning liabilities for unpaid losses and loss adjustment expenses, gross [1] | $ | 22,545 |
| $ | 22,568 |
| $ | 22,579 |
|
| Reinsurance and other recoverables [1] | 3,488 |
| 3,625 |
| 3,814 |
|
| Beginning liabilities for unpaid losses and loss adjustment expenses, net | 19,057 |
| 18,943 |
| 18,765 |
|
| Add: Maxum acquisition | — |
| 122 |
| — |
|
| Provision for unpaid losses and loss adjustment expenses | |
| |
| |
|
| Current accident year | 7,381 |
| 6,990 |
| 6,647 |
|
| Prior accident year development | (41 | ) | 457 |
| 250 |
|
| Total provision for unpaid losses and loss adjustment expenses | 7,340 |
| 7,447 |
| 6,897 |
|
| Less: payments | |
| |
| |
|
| Current accident year | 2,751 |
| 2,749 |
| 2,653 |
|
| Prior accident years | 3,828 |
| 4,219 |
| 4,066 |
|
| Total payments | 6,579 |
| 6,968 |
| 6,719 |
|
| Less: net reserves transferred to liabilities held for sale | — |
| 487 |
| — |
|
| Ending liabilities for unpaid losses and loss adjustment expenses, net | 19,818 |
| 19,057 |
| 18,943 |
|
| Reinsurance and other recoverables [1] | 3,957 |
| 3,488 |
| 3,625 |
|
| Ending liabilities for unpaid losses and loss adjustment expenses, gross | $ | 23,775 |
| $ | 22,545 |
| $ | 22,568 |
|
| |
[1] | Reflects the addition of $688, $712 and $743 into Property & Casualty Commercial Lines of gross reserves and reinsurance recoverables for 2017, 2016 and 2015, respectively, for structured settlements reserves and recoverables due from the Company's life and annuity run-off business now classified as held for sale. These amounts were previously eliminated in consolidation.
|
Property and Casualty Insurance Products Reserves, Net of Reinsurance, that are Discounted
|
| | | | | | | | | | | | | | | | | | |
| | For the years ended December 31, |
| | 2018 | 2017 | 2016 |
| Liability for unpaid losses and loss adjustment expenses, at undiscounted amounts | $ | 1,331 | | $ | 1,387 | | $ | 1,504 | |
| Less: amount of discount | 388 | | 410 | | 483 | |
| Carrying value of liability for unpaid losses and loss adjustment expenses | $ | 943 | | $ | 977 | | $ | 1,021 | |
| Discount accretion included in losses and loss adjustment expenses | $ | 40 | | $ | 30 | | $ | 29 | |
| Weighted average discount rate | 2.98 | % | 3.06 | % | 3.11 | % |
| Range of discount rates | 1.77 | % | - | 14.15 | % | 1.77 | % | - | 14.15 | % | 1.77 | % | - | 14.15 | % |
|
| | | | | | | | | | | | | | | | | | |
| | For the years ended December 31, |
| | 2017 | 2016 | 2015 |
| Liability for unpaid losses and loss adjustment expenses, at undiscounted amounts | $ | 1,387 | | $ | 1,504 | | $ | 1,607 | |
| Less: amount of discount | 410 | | 483 | | 523 | |
| Carrying value of liability for unpaid losses and loss adjustment expenses | $ | 977 | | $ | 1,021 | | $ | 1,084 | |
| Discount accretion included in losses and loss adjustment expenses | $ | 30 | | $ | 29 | | $ | 38 | |
| Weighted average discount rate | 3.06 | % | 3.11 | % | 3.24 | % |
| Range of discount rates | 1.77 | % | - | 14.15 | % | 1.77 | % | - | 14.15 | % | 1.77 | % | - | 14.15 | % |
The current accident year benefit from discounting property and casualty insurance product reserves was $12 in 2018, $15 in 2017 and $27 in 2016 and $35 in 2015. The reduction in the discount benefit in 2017 as compared to 2016 and in 2016 as compared to 2015 reflects lower claim volume and a shorter than expected payment pattern.2016. Reserves are discounted at rates in effect
at the time claims were incurred, ranging from 1.77% for accident year 2012 to 14.15% for accident year 1981.
The reserves recorded for the Company’s property and casualty insurance products at December 31, 20172018 represent the
THE HARTFORD FINANCIAL SERVICES GROUP, INC.
NOTES TO CONSOLIDATED FINANCIAL STATEMENTS (continued)
Company’s best estimate of its ultimate liability for losses and loss adjustment expenses related to losses covered by policies written by the Company. However, because of the significant
uncertainties surrounding reserves it is possible that management’s estimate of the ultimate liabilities for these claims may change and that the required adjustment to recorded reserves could exceed the currently recorded reserves by an amount that could be material to the Company’s results of operations or cash flows.
Losses and loss adjustment expenses are also impacted by trends including frequency and severity as well as changes in the legislative and regulatory environment. In the case of the reserves for asbestos exposures, factors contributing to the high degree of uncertainty in the ultimate settlement of the liabilities gross of reinsurance include inadequate loss development patterns, plaintiffs’ expanding theories of liability, the risks
THE HARTFORD FINANCIAL SERVICES GROUP, INC.
NOTES TO CONSOLIDATED FINANCIAL STATMENTS (continued)
11. Reserve for Unpaid Losses and Loss Adjustment Expenses (continued)
inherent in major litigation, and inconsistent emerging legal doctrines. In the case of the reserves for environmental exposures before reinsurance, factors contributing to the high degree of uncertainty in gross reserves include expanding theories of liabilities and damages, the risks inherent in major litigation, inconsistent decisions concerning the existence and scope of coverage for environmental claims, and uncertainty as to the monetary amount being sought by the claimant from the insured.
(Favorable) Unfavorable Prior Accident Year Development
|
| | | | | | | | | |
| | For the years ended December 31, |
| | 2018 | 2017 | 2016 |
| Workers’ compensation | $ | (164 | ) | $ | (79 | ) | $ | (119 | ) |
| Workers’ compensation discount accretion | 40 |
| 28 |
| 28 |
|
| General liability | 52 |
| 11 |
| 65 |
|
| Package business | (26 | ) | (25 | ) | 65 |
|
| Commercial property | (12 | ) | (8 | ) | 1 |
|
| Professional liability | (12 | ) | 1 |
| (37 | ) |
| Bond | 2 |
| 32 |
| (8 | ) |
| Automobile liability - Commercial Lines | (15 | ) | 17 |
| 57 |
|
| Automobile liability - Personal Lines | (18 | ) | — |
| 160 |
|
| Homeowners | (25 | ) | (14 | ) | (10 | ) |
| Net asbestos reserves | — |
| — |
| 197 |
|
| Net environmental reserves | — |
| — |
| 71 |
|
| Catastrophes | (49 | ) | (16 | ) | (7 | ) |
| Uncollectible reinsurance | 22 |
| (15 | ) | (30 | ) |
| Other reserve re-estimates, net | 38 |
| 27 |
| 24 |
|
| Total prior accident year development | $ | (167 | ) | $ | (41 | ) | $ | 457 |
|
|
| | | | | | | | | |
| | For the years ended December 31, |
| | 2017 | 2016 | 2015 |
| Workers’ compensation | $ | (79 | ) | $ | (119 | ) | $ | (37 | ) |
| Workers’ compensation discount accretion | 28 |
| 28 |
| 29 |
|
| General liability | 11 |
| 65 |
| 8 |
|
| Package business | (25 | ) | 65 |
| 28 |
|
| Commercial property | (8 | ) | 1 |
| (6 | ) |
| Professional liability | 1 |
| (37 | ) | (36 | ) |
| Bond | 32 |
| (8 | ) | (2 | ) |
| Automobile liability - Commercial Lines | 17 |
| 57 |
| 62 |
|
| Automobile liability - Personal Lines | — |
| 160 |
| (8 | ) |
| Homeowners | (14 | ) | (10 | ) | 9 |
|
| Net asbestos reserves | — |
| 197 |
| 146 |
|
| Net environmental reserves | — |
| 71 |
| 55 |
|
| Catastrophes | (16 | ) | (7 | ) | (18 | ) |
| Uncollectible reinsurance | (15 | ) | (30 | ) | — |
|
| Other reserve re-estimates, net | 27 |
| 24 |
| 20 |
|
| Total prior accident year development | $ | (41 | ) | $ | 457 |
| $ | 250 |
|
20172018 re-estimates of prior accident year reserves
| |
| • | Workers’ compensation reserveswere reduced in small commercial and middle market, primarily for accident years 2014 and 2015, as claim severity has emerged favorably compared to previous reserve estimates. Also |
Workers’ compensation reserves were reduced in Small Commercial and Middle Market, given the continued emergence of favorable frequency, primarily for accident years 2013 to 2015, as well ascontributing was a reduction in estimated reserves for unallocated loss adjustment expensesexpense ("ULAE"), partially offset by strengthening reserves for captive programs within Specialty Commercial..
General liability reserves were increased for the 2013 to 2016 accident years on a class of business that insures service and maintenance contractors. This increase was partially offset by a decrease in recent accident year reserves for other Middle Market general liability reserves.
Package business reserves were reduced for accident years 2013 and prior largely due to reducing the Company’s estimate of allocated loss adjustment expenses incurred to settle the claims.
Bond business reserves increased for customs bonds written between 2000 and 2010 which was partly offset by a reduction in reserves for recent accident years as reported losses for commercial and contract surety have emerged favorably.
Automobile liability reserves within Commercial Lines were increased in Small Commercial and large national accounts for the 2013 to 2016 accident years, driven by higher frequency of more severe accidents, including litigated claims.
Asbestos and environmental reserves were unchanged as $285 of adverse development arising from the fourth quarter 2017 comprehensive annual review was offset by a $285 recoverable from NICO. For additional information related to the adverse development cover with NICO, see Note 8 - Reinsurance and Note 14 - Commitments and Contingencies of Notes to Consolidated Financial Statements.
Catastrophes reserveswere reduced primarily due to lower estimates of 2016 wind and hail event losses and a decrease in losses on a 2015 wildfire.
Uncollectible reinsurance reserves decreased as a result of giving greater weight to favorable collectibility experience in recent calendar periods in estimating future collections.
2016 re-estimates of prior accident year reserves
Workers' compensation reservesconsider favorable emergence on reported losses for recent accident years as well as a partially offsetting adverse impact related to two recent Florida Supreme Court rulings that have increased the Company’s exposure to workers’ compensation claims in that state. The favorable emergence has been driven by lower frequency and, to a lesser extent, lower medical severity and management has placed additional weight on this favorable experience as it becomes more credible.
General liability reserves increased for accident years 2012 - 2015 primarily due to higher severity losses incurred on a class of business that insures service and maintenance contractors and increased reserves in general liability for accident years 2008 and 2010 primarily due to indemnity losses and legal costs associated with a litigated claim.
Package business reserves increased due to higher than expected severity on liability claims, principally for accident years 2013 - 2015. Severity for these accident years has developed unfavorably and management has placed more weight on emerged experience.
| |
| • | General liability reserveswere increased, primarily due to an increase in reserves for higher hazard general liability exposures in middle market for accident years 2009 to 2017, partially offset by a decrease in reserves for other lines within middle market, including premises and operations, umbrella and products liability, principally for accident years 2015 and prior. Contributing to the increase in reserves for higher hazard general liability exposures was an increase in average claim severity, including from large losses and, in more recent accident years, an increase in claim frequency. Contributing to the reduction in reserves for other middle market lines were more favorable outcomes due to initiatives to reduce legal expenses. In addition, reserve increases for claims with lead paint exposure were offset by reserve decreases for other mass torts and extra-contractual liability claims. |
| |
| • | Package business reserveswere reduced, primarily due to lower reserve estimates for both liability and property for accident years 2010 and prior, including a recovery of loss adjustment expenses for the 2005 accident year. |
| |
| • | Commercial property reserves were reduced, driven by an increase in estimated reinsurance recoverables on middle market property losses from the 2017 accident year. |
| |
| • | Professional liability reserveswere reduced, principally for accident years 2014 and prior, for directors and officers liability claims principally due to a number of older claims closing with limited or no payment. |
| |
| • | Automobile liability reserveswere reduced, primarily driven by reduced estimates of loss adjustment expenses in small commercial for recent accident years and favorable development in personal automobile liability for accident years 2014 to 2017, principally due to lower severity, including with uninsured and underinsured motorist claims. |
| |
| • | Homeowners reserveswere reduced, primarily in accident years 2013 to 2017, driven by lower than expected severity across multiple perils. |
| |
| • | Asbestos and environmental reserveswere unchanged as $238 of adverse development arising from the fourth quarter 2018 comprehensive annual review was offset by a $238 recoverable from NICO. For additional information related to the adverse development cover with NICO, see Note 8 - Reinsurance and Note 14 - Commitments and Contingencies of Notes to Consolidated Financial Statements. |
| |
| • | Catastrophe reserveswere reduced, primarily as a result of lower estimated net losses from 2017 catastrophes, principally related to hurricanes Harvey and Irma. Before reinsurance, estimated losses for 2017 catastrophe events decreased by $133, resulting in a decrease in reinsurance recoverables of $90 as the Company no longer expects to recover under the 2017 Property Aggregate reinsurance |
THE HARTFORD FINANCIAL SERVICES GROUP, INC.
NOTES TO CONSOLIDATED FINANCIAL STATMENTSSTATEMENTS (continued)
11. Reserve for Unpaid Losses and Loss Adjustment Expenses (continued)
Professional liability reserves decreasedtreaty as aggregate ultimate losses for claims made years 2008 - 2013, primarily for large accounts, including on non-securities class action cases. Claim costs have emerged favorably as these years have matured and management has placed more weight on the emerged experience.
Automobile liability reserves increased due2017 catastrophe events are now projected to increases in both commercial lines automobile and personal lines automobile. Commercial automobile liability reserves increased, predominately for the 2015be less than $850.
| |
| • | Uncollectible reinsurance reserves were increased due to lower anticipated recoveries related to older accident years. |
| |
| • | Other reserve re-estimates, net, primarily represents an increase in ULAE reserves in Property & Casualty Other Operations that was principally driven by an increase in expected claim handling costs associated with asbestos and environmental and mass tort claims. |
2017 re-estimates of prior accident year primarily due to increased frequency of large claims. Personal automobile liability reserves increased, primarily related to increased bodily injury frequency and severity for the 2015 accident year, including for uninsured and under-insured motorist claims, and increased bodily injury severity for the 2014 accident year. Increases in automobile liability loss costs were across both the direct and agency distribution channels.
| |
| • | Workers’ compensation reserves were reduced in small commercial and middle market, given the continued emergence of favorable frequency, primarily for accident years 2013 to 2015, as well as a reduction in estimated reserves for unallocated loss adjustment expenses, partially offset by strengthening reserves for captive programs within specialty commercial. |
| |
| • | General liability reserves were increased for the 2013 to 2016 accident years on a class of business that insures service and maintenance contractors. This increase was partially offset by a decrease in recent accident year reserves for other middle market general liability reserves. |
| |
| • | Package business reserves were reduced for accident years 2013 and prior largely due to reducing the Company’s estimate of allocated loss adjustment expenses incurred to settle the claims. |
| |
| • | Bond business reserves increased for customs bonds written between 2000 and 2010 which was partly offset by a reduction in reserves for recent accident years as reported losses for commercial and contract surety have emerged favorably. |
| |
| • | Automobile liability reserves within Commercial Lines were increased in small commercial and large national accounts for the 2013 to 2016 accident years, driven by higher frequency of more severe accidents, including litigated claims |
| |
| • | Asbestos and environmental reserves were unchanged as $285 of adverse development arising from the fourth quarter 2017 comprehensive annual review was offset by a $285 recoverable from NICO. For additional information related to the adverse development cover with NICO, see Note 8 - Reinsurance and Note 14 - Commitments and Contingencies of Notes to Consolidated Financial Statements. |
| |
| • | Catastrophes reserveswere reduced primarily due to lower estimates of 2016 wind and hail event losses and a decrease in losses on a 2015 wildfire. |
| |
| • | Uncollectible reinsurance reserves decreased as a result of giving greater weight to favorable collectibility |
Asbestos and environmental reserves were increased during the period as a result of the second quarter 2016 comprehensive annual review.
Uncollectible reinsurance reserves decreased as a result of giving greater weight to favorable collectibility experience in recent calendar periods in estimating future collections.
20152016 re-estimates of prior accident year reserves
Workers' compensation reserves decreased due to an improvement in claim closure rates resulting in a decrease in outstanding claims for permanently disabled
claimants. In addition, accident years 2013 and 2014 continue to exhibit favorable frequency and medical severity trends; management has been placing additional weight on this favorable experience as it becomes more credible.
Package business reserves increased due to higher than expected severity on liability claims, impacting recent accident years.
Professional liability reserves decreased for claims made years 2009 through 2012 primarily for large accounts. Claim costs have emerged favorably as these years have matured and management has placed more weight on the emerged experience.
Automobile liability reserves within Commercial Lines were increased due to increased severity of large claims predominantly for accident years 2010 to 2013.
Asbestos and environmental reserves were increased during the period as a result of the 2015 comprehensive annual review.
Catastrophe reservesdecreased primarily for accident year 2014 as fourth quarter 2014 catastrophes have developed favorably.
Other reserve re-estimates, net, decreased due to decreased contract surety reserves across several accident years and decreased commercial surety reserves for accident years 2012 through 2014 as a result of lower emerged losses. These reserve decreases were offset by an increase in commercial surety reserves related to accident years 2007 and prior, as the number of new claims reported has outpaced expectations.
| |
| • | Workers' compensation reservesconsider favorable emergence on reported losses for recent accident years as well as a partially offsetting adverse impact related to two recent Florida Supreme Court rulings that have increased the Company’s exposure to workers’ compensation claims in that state. The favorable emergence has been driven by lower frequency and, to a lesser extent, lower medical severity and management has placed additional weight on this favorable experience as it becomes more credible. |
| |
| • | General liability reserves increased for accident years 2012 - 2015 primarily due to higher severity losses incurred on a class of business that insures service and maintenance contractors and increased for accident years 2008 and 2010 primarily due to indemnity losses and legal costs associated with a litigated claim. |
| |
| • | Package business reserves increased due to higher than expected severity on liability claims, principally for accident years 2013 - 2015. Severity for these accident years has developed unfavorably and management has placed more weight on emerged experience. |
| |
| • | Professional liability reserves decreased for claims made years 2008 - 2013, primarily for large accounts, including on non-securities class action cases. Claim costs have emerged favorably as these years have matured and management has placed more weight on the emerged experience. |
| |
| • | Automobile liability reserves increased due to increases in both commercial lines automobile and personal lines automobile. Commercial automobile liability reserves increased, predominately for the 2015 accident year, primarily due to increased frequency of large claims. Personal automobile liability reserves increased, primarily related to increased bodily injury frequency and severity for the 2015 accident year, including for uninsured and under-insured motorist claims, and increased bodily injury severity for the 2014 accident year. Increases in automobile liability loss costs were across both the direct and agency distribution channels. |
| |
| • | Asbestos and environmental reserves were increased during the period as a result of the second quarter 2016 comprehensive annual review. |
| |
| • | Uncollectible reinsurance reserves decreased as a result of giving greater weight to favorable collectibility experience in recent calendar periods in estimating future collections. |
THE HARTFORD FINANCIAL SERVICES GROUP, INC.
NOTES TO CONSOLIDATED FINANCIAL STATMENTSSTATEMENTS (continued)
11. Reserve for Unpaid Losses and Loss Adjustment Expenses (continued)
Reconciliation of Loss Development to Liability for Unpaid Losses and Loss Adjustment Expenses As of December 31, 20172018
| | | | Losses and Allocated Loss Adjustment Expenses, Net of Reinsurance | | Subtotal | | Losses and Allocated Loss Adjustment Expenses, Net of Reinsurance | | Subtotal | |
| Reserve Line | Cumulative Incurred for Accident Years Displayed in Triangles | Cumulative Paid for Accident Years Displayed in Triangles | Unpaid for Accident Years not Displayed in Triangles [1] | Unpaid Unallocated Loss Adjustment Expenses, Net of Reinsurance | Discount | Unpaid Losses and Loss Adjustment Expenses, Net of Reinsurance | Reinsurance and Other Recoverables | Liability for Unpaid Losses and Loss Adjustment Expenses | Cumulative Incurred for Accident Years Displayed in Triangles | Cumulative Paid for Accident Years Displayed in Triangles | Unpaid for Accident Years not Displayed in Triangles [1] | Unpaid Unallocated Loss Adjustment Expenses, Net of Reinsurance | Discount | Unpaid Losses and Loss Adjustment Expenses, Net of Reinsurance | Reinsurance and Other Recoverables | Liability for Unpaid Losses and Loss Adjustment Expenses |
| Workers' compensation | $ | 18,351 |
| $ | (10,945 | ) | $ | 2,242 |
| $ | 346 |
| $ | (394 | ) | $ | 9,600 |
| $ | 2,166 |
| $ | 11,766 |
| $ | 18,685 |
| $ | (10,965 | ) | $ | 2,316 |
| $ | 341 |
| $ | (372 | ) | $ | 10,005 |
| $ | 2,160 |
| $ | 12,165 |
|
| General liability | 3,473 |
| (1,894 | ) | 500 |
| 88 |
| — |
| 2,167 |
| 239 |
| 2,406 |
| 3,605 |
| (1,840 | ) | 417 |
| 94 |
| — |
| 2,276 |
| 234 |
| 2,510 |
|
| Package business | 6,553 |
| (5,198 | ) | 46 |
| 99 |
| — |
| 1,500 |
| 45 |
| 1,545 |
| 6,600 |
| (5,128 | ) | 43 |
| 94 |
| — |
| 1,609 |
| 44 |
| 1,653 |
|
| Commercial property | 3,263 |
| (2,898 | ) | 15 |
| 10 |
| — |
| 390 |
| 53 |
| 443 |
| 3,124 |
| (2,763 | ) | 14 |
| 9 |
| — |
| 384 |
| 41 |
| 425 |
|
| Commercial automobile liability | 3,446 |
| (2,559 | ) | 17 |
| 23 |
| — |
| 927 |
| 41 |
| 968 |
| 3,442 |
| (2,604 | ) | 17 |
| 23 |
| — |
| 878 |
| 43 |
| 921 |
|
| Commercial automobile physical damage | 238 |
| (227 | ) | 2 |
| — |
| — |
| 13 |
| — |
| 13 |
| 221 |
| (210 | ) | 2 |
| — |
| — |
| 13 |
| — |
| 13 |
|
| Professional liability | 1,647 |
| (1,146 | ) | 43 |
| 17 |
| — |
| 561 |
| 282 |
| 843 |
| 1,491 |
| (973 | ) | 41 |
| 19 |
| — |
| 578 |
| 306 |
| 884 |
|
| Bond | 598 |
| (333 | ) | 4 |
| 17 |
| — |
| 286 |
| 15 |
| 301 |
| 598 |
| (356 | ) | 28 |
| 20 |
| — |
| 290 |
| 12 |
| 302 |
|
| Personal automobile liability | 12,363 |
| (10,749 | ) | 19 |
| 74 |
| — |
| 1,707 |
| 21 |
| 1,728 |
| 12,262 |
| (10,703 | ) | 21 |
| 72 |
| — |
| 1,652 |
| 25 |
| 1,677 |
|
| Personal automobile physical damage | 1,884 |
| (1,856 | ) | 1 |
| 3 |
| — |
| 32 |
| — |
| 32 |
| 1,752 |
| (1,716 | ) | 1 |
| 3 |
| — |
| 40 |
| — |
| 40 |
|
| Homeowners | 7,588 |
| (7,161 | ) | 4 |
| 40 |
| — |
| 471 |
| 50 |
| 521 |
| 7,714 |
| (7,110 | ) | 2 |
| 36 |
| — |
| 642 |
| 83 |
| 725 |
|
| Other ongoing business | | 204 |
| — |
| (16 | ) | 188 |
| 308 |
| 496 |
| | 197 |
| (1 | ) | (16 | ) | 180 |
| 297 |
| 477 |
|
| Asbestos and environmental [2] | | 1,452 |
| — |
| — |
| 1,452 |
| 765 |
| 2,217 |
| | 1,254 |
| — |
| — |
| 1,254 |
| 1,032 |
| 2,286 |
|
| Other operations [2] | | 402 |
| 122 |
| — |
| 524 |
| (28 | ) | 496 |
| | 413 |
| 138 |
| — |
| 551 |
| (45 | ) | 506 |
|
| Total P&C | $ | 59,404 |
| $ | (44,966 | ) | $ | 4,951 |
| $ | 839 |
| $ | (410 | ) | $ | 19,818 |
| $ | 3,957 |
| $ | 23,775 |
| $ | 59,494 |
| $ | (44,368 | ) | $ | 4,766 |
| $ | 848 |
| $ | (388 | ) | $ | 20,352 |
| $ | 4,232 |
| $ | 24,584 |
|
| |
| [1] | Amounts represent reserves for claims that were incurred more than ten years ago for long-tail lines and more than three years ago for short-tail lines. |
| |
| [2] | Asbestos and environmental and other operations include asbestos, environmental and other latent exposures not foreseen when coverages were written, including, but not limited to, potential liability for pharmaceutical products, silica, talcum powder, head injuries, lead paint, construction defects, molestation and other long-tail liabilities. These reserve lines do not have significant paid or incurred loss development for the most recent ten accident years and therefore do not have loss development displayed in triangles. |
The reserve lines in the above table and the loss triangles that follow represent the significant lines of business for which the Company regularly reviews the appropriateness of reserve levels. These reserve lines differ from the reserve lines reported on a statutory basis, as prescribed by the National Association of Insurance Commissioners ("NAIC").
The following loss triangles present historical loss development for incurred and paid claims by accident year. Triangles are limited
to the number of years for which claims incurred typically remain outstanding, not exceeding ten years. Short-tail lines, which represent claims generally expected to be paid within a few years, have three years of claim development displayed. IBNR reserves shown in loss triangles include reserve for incurred but not reported claims as well as reserves for expected development on reported claims.
THE HARTFORD FINANCIAL SERVICES GROUP, INC.
NOTES TO CONSOLIDATED FINANCIAL STATMENTSSTATEMENTS (continued)
11. Reserve for Unpaid Losses and Loss Adjustment Expenses (continued)
Workers' Compensation
|
| | | | | | | | | | | | | | | | | | | | | | | | | | | | | | | | | | | |
| Incurred Losses & Allocated Loss Adjustment Expenses, Net of Reinsurance |
| | For the years ended December 31, | | |
| | (Unaudited) | | | |
| Accident Year | 2009 | 2010 | 2011 | 2012 | 2013 | 2014 | 2015 | 2016 | 2017 | 2018 | IBNR
Reserves | Claims
Reported |
| 2009 | $ | 1,462 |
| $ | 1,455 |
| $ | 1,478 |
| $ | 1,493 |
| $ | 1,504 |
| $ | 1,504 |
| $ | 1,519 |
| $ | 1,529 |
| $ | 1,522 |
| $ | 1,534 |
| $ | 168 |
| 135,804 |
|
| 2010 | | 1,560 |
| 1,775 |
| 1,814 |
| 1,858 |
| 1,857 |
| 1,882 |
| 1,881 |
| 1,878 |
| 1,892 |
| 236 |
| 156,747 |
|
| 2011 | | | 2,013 |
| 2,099 |
| 2,204 |
| 2,206 |
| 2,221 |
| 2,224 |
| 2,232 |
| 2,242 |
| 342 |
| 177,819 |
|
| 2012 | | | | 2,185 |
| 2,207 |
| 2,207 |
| 2,181 |
| 2,168 |
| 2,169 |
| 2,154 |
| 385 |
| 171,219 |
|
| 2013 | | | | | 2,020 |
| 1,981 |
| 1,920 |
| 1,883 |
| 1,861 |
| 1,861 |
| 451 |
| 151,153 |
|
| 2014 | | | | | | 1,869 |
| 1,838 |
| 1,789 |
| 1,761 |
| 1,713 |
| 532 |
| 125,840 |
|
| 2015 | | | | | | | 1,873 |
| 1,835 |
| 1,801 |
| 1,724 |
| 613 |
| 113,493 |
|
| 2016 | | | | | | | | 1,772 |
| 1,772 |
| 1,780 |
| 787 |
| 111,190 |
|
| 2017 | | | | | | | | | 1,862 |
| 1,869 |
| 1,061 |
| 109,982 |
|
| 2018 | | | | | | | | | | 1,916 |
| 1,363 |
| 109,842 |
|
| Total | | | | | | | | | | $ | 18,685 |
| | |
|
| | | | | | | | | | | | | | | | | | | | | | | | | | | | | | | | | | | |
| Incurred Losses & Allocated Loss Adjustment Expenses, Net of Reinsurance |
| | For the years ended December 31, | | |
| | (Unaudited) | | | |
| Accident Year | 2008 | 2009 | 2010 | 2011 | 2012 | 2013 | 2014 | 2015 | 2016 | 2017 | IBNR
Reserves | Claims
Reported |
| 2008 | $ | 1,456 |
| $ | 1,444 |
| $ | 1,456 |
| $ | 1,470 |
| $ | 1,473 |
| $ | 1,477 |
| $ | 1,477 |
| $ | 1,492 |
| $ | 1,493 |
| $ | 1,493 |
| $ | 123 |
| 141,627 |
|
| 2009 | | 1,462 |
| 1,455 |
| 1,478 |
| 1,493 |
| 1,504 |
| 1,504 |
| 1,519 |
| 1,529 |
| 1,522 |
| 166 |
| 135,731 |
|
| 2010 | | | 1,560 |
| 1,775 |
| 1,814 |
| 1,858 |
| 1,857 |
| 1,882 |
| 1,881 |
| 1,878 |
| 242 |
| 156,515 |
|
| 2011 | | | | 2,013 |
| 2,099 |
| 2,204 |
| 2,206 |
| 2,221 |
| 2,224 |
| 2,232 |
| 361 |
| 177,652 |
|
| 2012 | | | | | 2,185 |
| 2,207 |
| 2,207 |
| 2,181 |
| 2,168 |
| 2,169 |
| 443 |
| 171,021 |
|
| 2013 | | | | | | 2,020 |
| 1,981 |
| 1,920 |
| 1,883 |
| 1,861 |
| 510 |
| 150,884 |
|
| 2014 | | | | | | | 1,869 |
| 1,838 |
| 1,789 |
| 1,761 |
| 638 |
| 125,487 |
|
| 2015 | | | | | | | | 1,873 |
| 1,835 |
| 1,801 |
| 806 |
| 112,970 |
|
| 2016 | | | | | | | | | 1,772 |
| 1,772 |
| 944 |
| 110,072 |
|
| 2017 | | | | | | | | | | 1,862 |
| 1,349 |
| 102,626 |
|
| Total | | | | | | | | | | $ | 18,351 |
| | |
| | Cumulative Paid Losses & Allocated Loss Adjustment Expenses, Net of Reinsurance | | | For the years ended December 31, | For the years ended December 31, |
| | (Unaudited) | | (Unaudited) | |
| Accident Year | 2008 | 2009 | 2010 | 2011 | 2012 | 2013 | 2014 | 2015 | 2016 | 2017 | 2009 | 2010 | 2011 | 2012 | 2013 | 2014 | 2015 | 2016 | 2017 | 2018 |
| 2008 | $ | 264 |
| $ | 581 |
| $ | 781 |
| $ | 917 |
| $ | 1,015 |
| $ | 1,089 |
| $ | 1,146 |
| $ | 1,190 |
| $ | 1,216 |
| $ | 1,242 |
| |
| 2009 | | 265 |
| 587 |
| 792 |
| 937 |
| 1,042 |
| 1,115 |
| 1,170 |
| 1,208 |
| 1,242 |
| $ | 265 |
| $ | 587 |
| $ | 792 |
| $ | 937 |
| $ | 1,042 |
| $ | 1,115 |
| $ | 1,170 |
| $ | 1,208 |
| $ | 1,242 |
| $ | 1,263 |
|
| 2010 | | 316 |
| 709 |
| 970 |
| 1,154 |
| 1,287 |
| 1,374 |
| 1,439 |
| 1,489 |
| | 316 |
| 709 |
| 970 |
| 1,154 |
| 1,287 |
| 1,374 |
| 1,439 |
| 1,489 |
| 1,522 |
|
| 2011 | | 371 |
| 841 |
| 1,156 |
| 1,368 |
| 1,518 |
| 1,622 |
| 1,690 |
| | 371 |
| 841 |
| 1,156 |
| 1,368 |
| 1,518 |
| 1,622 |
| 1,690 |
| 1,746 |
|
| 2012 | | 359 |
| 809 |
| 1,106 |
| 1,313 |
| 1,436 |
| 1,529 |
| | 359 |
| 809 |
| 1,106 |
| 1,313 |
| 1,436 |
| 1,529 |
| 1,587 |
|
| 2013 | | 304 |
| 675 |
| 917 |
| 1,071 |
| 1,175 |
| | 304 |
| 675 |
| 917 |
| 1,071 |
| 1,175 |
| 1,260 |
|
| 2014 | | 275 |
| 598 |
| 811 |
| 960 |
| | 275 |
| 598 |
| 811 |
| 960 |
| 1,041 |
|
| 2015 | | 261 |
| 576 |
| 778 |
| | 261 |
| 576 |
| 778 |
| 909 |
|
| 2016 | | 255 |
| 579 |
| | 255 |
| 579 |
| 779 |
|
| 2017 | | 261 |
| | 261 |
| 575 |
|
| 2018 | | | 283 |
|
| Total | | $ | 10,945 |
| | $ | 10,965 |
|
THE HARTFORD FINANCIAL SERVICES GROUP, INC.
NOTES TO CONSOLIDATED FINANCIAL STATMENTSSTATEMENTS (continued)
11. Reserve for Unpaid Losses and Loss Adjustment Expenses (continued)
General Liability
| | Incurred Losses & Allocated Loss Adjustment Expenses, Net of Reinsurance | | | For the years ended December 31, | | | For the years ended December 31, | | |
| | (Unaudited) | | | (Unaudited) | | |
| Accident Year | 2008 | 2009 | 2010 | 2011 | 2012 | 2013 | 2014 | 2015 | 2016 | 2017 | IBNR
Reserves | Claims
Reported | 2009 | 2010 | 2011 | 2012 | 2013 | 2014 | 2015 | 2016 | 2017 | 2018 | IBNR
Reserves | Claims
Reported |
| 2008 | $ | 501 |
| $ | 457 |
| $ | 468 |
| $ | 454 |
| $ | 451 |
| $ | 416 |
| $ | 398 |
| $ | 401 |
| $ | 398 |
| $ | 394 |
| $ | 40 |
| 21,374 |
| |
| 2009 | | 382 |
| 398 |
| 394 |
| 382 |
| 359 |
| 348 |
| 347 |
| 346 |
| 341 |
| 33 |
| 20,530 |
| $ | 382 |
| $ | 398 |
| $ | 394 |
| $ | 382 |
| $ | 359 |
| $ | 348 |
| $ | 347 |
| $ | 346 |
| $ | 341 |
| $ | 351 |
| $ | 39 |
| 20,714 |
|
| 2010 | | 355 |
| 362 |
| 352 |
| 355 |
| 343 |
| 345 |
| 376 |
| 377 |
| 33 |
| 18,729 |
| | 355 |
| 362 |
| 352 |
| 355 |
| 343 |
| 345 |
| 376 |
| 377 |
| 393 |
| 46 |
| 18,949 |
|
| 2011 | | 353 |
| 343 |
| 323 |
| 316 |
| 315 |
| 320 |
| 318 |
| 49 |
| 16,637 |
| | 353 |
| 343 |
| 323 |
| 316 |
| 315 |
| 320 |
| 318 |
| 326 |
| 52 |
| 16,854 |
|
| 2012 | | 321 |
| 315 |
| 310 |
| 295 |
| 304 |
| 298 |
| 66 |
| 11,614 |
| | 321 |
| 315 |
| 310 |
| 295 |
| 304 |
| 298 |
| 304 |
| 69 |
| 11,761 |
|
| 2013 | | 318 |
| 321 |
| 332 |
| 352 |
| 344 |
| 88 |
| 9,715 |
| | 318 |
| 321 |
| 332 |
| 352 |
| 344 |
| 352 |
| 80 |
| 9,906 |
|
| 2014 | | 317 |
| 318 |
| 336 |
| 342 |
| 128 |
| 10,048 |
| | 317 |
| 318 |
| 336 |
| 342 |
| 351 |
| 112 |
| 10,358 |
|
| 2015 | | 316 |
| 346 |
| 345 |
| 194 |
| 10,326 |
| | 316 |
| 346 |
| 345 |
| 364 |
| 164 |
| 10,805 |
|
| 2016 | | 352 |
| 351 |
| 262 |
| 11,028 |
| | 352 |
| 351 |
| 380 |
| 241 |
| 11,960 |
|
| 2017 | | 363 |
| 302 |
| 8,823 |
| | 363 |
| 385 |
| 289 |
| 10,965 |
|
| 2018 | | | 399 |
| 352 |
| 10,023 |
|
| Total | | $ | 3,473 |
| | | | $ | 3,605 |
| | |
| | Cumulative Paid Losses & Allocated Loss Adjustment Expenses, Net of Reinsurance | | | For the years ended December 31, | For the years ended December 31, |
| | (Unaudited) | | (Unaudited) | |
| Accident Year | 2008 | 2009 | 2010 | 2011 | 2012 | 2013 | 2014 | 2015 | 2016 | 2017 | 2009 | 2010 | 2011 | 2012 | 2013 | 2014 | 2015 | 2016 | 2017 | 2018 |
| 2008 | $ | 31 |
| $ | 69 |
| $ | 141 |
| $ | 216 |
| $ | 270 |
| $ | 300 |
| $ | 318 |
| $ | 330 |
| $ | 337 |
| $ | 343 |
| |
| 2009 | | 22 |
| 63 |
| 124 |
| 181 |
| 227 |
| 256 |
| 277 |
| 287 |
| 297 |
| $ | 22 |
| $ | 63 |
| $ | 124 |
| $ | 181 |
| $ | 227 |
| $ | 256 |
| $ | 277 |
| $ | 287 |
| $ | 297 |
| $ | 304 |
|
| 2010 | | 14 |
| 51 |
| 115 |
| 181 |
| 224 |
| 259 |
| 314 |
| 331 |
| | 14 |
| 51 |
| 115 |
| 181 |
| 224 |
| 259 |
| 314 |
| 331 |
| 337 |
|
| 2011 | | 11 |
| 47 |
| 93 |
| 154 |
| 198 |
| 234 |
| 252 |
| | 11 |
| 47 |
| 93 |
| 154 |
| 198 |
| 234 |
| 252 |
| 264 |
|
| 2012 | | 8 |
| 39 |
| 75 |
| 124 |
| 167 |
| 198 |
| | 8 |
| 39 |
| 75 |
| 124 |
| 167 |
| 198 |
| 215 |
|
| 2013 | | 7 |
| 35 |
| 95 |
| 152 |
| 207 |
| | 7 |
| 35 |
| 95 |
| 152 |
| 207 |
| 242 |
|
| 2014 | | 11 |
| 31 |
| 88 |
| 142 |
| | 11 |
| 31 |
| 88 |
| 142 |
| 195 |
|
| 2015 | | 7 |
| 32 |
| 80 |
| | 7 |
| 32 |
| 80 |
| 139 |
|
| 2016 | | 8 |
| 32 |
| | 8 |
| 32 |
| 79 |
|
| 2017 | | 12 |
| | 12 |
| 48 |
|
| 2018 | | | 17 |
|
| Total | | $ | 1,894 |
| | $ | 1,840 |
|
THE HARTFORD FINANCIAL SERVICES GROUP, INC.
NOTES TO CONSOLIDATED FINANCIAL STATMENTSSTATEMENTS (continued)
11. Reserve for Unpaid Losses and Loss Adjustment Expenses (continued)
Package Business
| | Incurred Losses & Allocated Loss Adjustment Expenses, Net of Reinsurance | | | For the years ended December 31, | | | For the years ended December 31, | | |
| | (Unaudited) | | | (Unaudited) | | |
| Accident Year | 2008 | 2009 | 2010 | 2011 | 2012 | 2013 | 2014 | 2015 | 2016 | 2017 | IBNR
Reserves | Claims
Reported | 2009 | 2010 | 2011 | 2012 | 2013 | 2014 | 2015 | 2016 | 2017 | 2018 | IBNR
Reserves | Claims
Reported |
| 2008 | $ | 667 |
| $ | 703 |
| $ | 709 |
| $ | 677 |
| $ | 675 |
| $ | 674 |
| $ | 676 |
| $ | 673 |
| $ | 675 |
| $ | 674 |
| $ | 16 |
| 58,109 |
| |
| 2009 | | 587 |
| 584 |
| 584 |
| 572 |
| 578 |
| 577 |
| 576 |
| 576 |
| 574 |
| 20 |
| 50,351 |
| $ | 587 |
| $ | 584 |
| $ | 584 |
| $ | 572 |
| $ | 578 |
| $ | 577 |
| $ | 576 |
| $ | 576 |
| $ | 574 |
| $ | 569 |
| $ | 15 |
| 50,413 |
|
| 2010 | | 657 |
| 662 |
| 654 |
| 652 |
| 652 |
| 651 |
| 653 |
| 651 |
| 24 |
| 52,345 |
| | 657 |
| 662 |
| 654 |
| 652 |
| 652 |
| 651 |
| 653 |
| 651 |
| 649 |
| 19 |
| 52,410 |
|
| 2011 | | 810 |
| 792 |
| 790 |
| 800 |
| 808 |
| 814 |
| 813 |
| 37 |
| 60,892 |
| | 810 |
| 792 |
| 790 |
| 800 |
| 808 |
| 814 |
| 813 |
| 812 |
| 31 |
| 60,967 |
|
| 2012 | | 736 |
| 725 |
| 728 |
| 731 |
| 736 |
| 735 |
| 38 |
| 59,621 |
| | 736 |
| 725 |
| 728 |
| 731 |
| 736 |
| 735 |
| 739 |
| 39 |
| 59,715 |
|
| 2013 | | 579 |
| 565 |
| 573 |
| 585 |
| 586 |
| 50 |
| 43,284 |
| | 579 |
| 565 |
| 573 |
| 585 |
| 586 |
| 592 |
| 46 |
| 43,415 |
|
| 2014 | | 566 |
| 578 |
| 601 |
| 602 |
| 86 |
| 42,718 |
| | 566 |
| 578 |
| 601 |
| 602 |
| 603 |
| 70 |
| 42,928 |
|
| 2015 | | 582 |
| 588 |
| 585 |
| 137 |
| 41,202 |
| | 582 |
| 588 |
| 585 |
| 583 |
| 94 |
| 41,678 |
|
| 2016 | | 655 |
| 638 |
| 228 |
| 42,042 |
| | 655 |
| 638 |
| 632 |
| 170 |
| 43,129 |
|
| 2017 | | 695 |
| 348 |
| 39,524 |
| | 695 |
| 702 |
| 257 |
| 44,709 |
|
| 2018 | | | 719 |
| 335 |
| 38,034 |
|
| Total | | $ | 6,553 |
| | | | $ | 6,600 |
| | |
| | Cumulative Paid Losses & Allocated Loss Adjustment Expenses, Net of Reinsurance | | | For the years ended December 31, | For the years ended December 31, |
| | (Unaudited) | | (Unaudited) | |
| Accident Year | 2008 | 2009 | 2010 | 2011 | 2012 | 2013 | 2014 | 2015 | 2016 | 2017 | 2009 | 2010 | 2011 | 2012 | 2013 | 2014 | 2015 | 2016 | 2017 | 2018 |
| 2008 | $ | 278 |
| $ | 451 |
| $ | 510 |
| $ | 562 |
| $ | 595 |
| $ | 620 |
| $ | 633 |
| $ | 643 |
| $ | 649 |
| $ | 652 |
| |
| 2009 | | 227 |
| 351 |
| 411 |
| 463 |
| 503 |
| 527 |
| 539 |
| 547 |
| 550 |
| $ | 227 |
| $ | 351 |
| $ | 411 |
| $ | 463 |
| $ | 503 |
| $ | 527 |
| $ | 539 |
| $ | 547 |
| $ | 550 |
| $ | 551 |
|
| 2010 | | 270 |
| 414 |
| 487 |
| 539 |
| 570 |
| 601 |
| 613 |
| 618 |
| | 270 |
| 414 |
| 487 |
| 539 |
| 570 |
| 601 |
| 613 |
| 618 |
| 625 |
|
| 2011 | | 377 |
| 555 |
| 621 |
| 684 |
| 727 |
| 748 |
| 762 |
| | 377 |
| 555 |
| 621 |
| 684 |
| 727 |
| 748 |
| 762 |
| 772 |
|
| 2012 | | 286 |
| 486 |
| 560 |
| 616 |
| 652 |
| 673 |
| | 286 |
| 486 |
| 560 |
| 616 |
| 652 |
| 673 |
| 687 |
|
| 2013 | | 225 |
| 339 |
| 414 |
| 467 |
| 504 |
| | 225 |
| 339 |
| 414 |
| 467 |
| 504 |
| 522 |
|
| 2014 | | 226 |
| 345 |
| 416 |
| 468 |
| | 226 |
| 345 |
| 416 |
| 468 |
| 507 |
|
| 2015 | | 212 |
| 332 |
| 383 |
| | 212 |
| 332 |
| 383 |
| 445 |
|
| 2016 | | 225 |
| 353 |
| | 225 |
| 353 |
| 410 |
|
| 2017 | | 235 |
| | 235 |
| 372 |
|
| 2018 | | | 237 |
|
| Total | | $ | 5,198 |
| | $ | 5,128 |
|
THE HARTFORD FINANCIAL SERVICES GROUP, INC.
NOTES TO CONSOLIDATED FINANCIAL STATMENTSSTATEMENTS (continued)
11. Reserve for Unpaid Losses and Loss Adjustment Expenses (continued)
Commercial Property
| | Incurred Losses & Allocated Loss Adjustment Expenses, Net of Reinsurance | | | For the years ended December 31, | | | For the years ended December 31, | | |
| | (Unaudited) | | | | (Unaudited) | | | |
| Accident Year | 2008 | 2009 | 2010 | 2011 | 2012 | 2013 | 2014 | 2015 | 2016 | 2017 | IBNR
Reserves | Claims
Reported | 2009 | 2010 | 2011 | 2012 | 2013 | 2014 | 2015 | 2016 | 2017 | 2018 | IBNR
Reserves | Claims
Reported |
| 2008 | $ | 478 |
| $ | 465 |
| $ | 465 |
| $ | 464 |
| $ | 467 |
| $ | 464 |
| $ | 464 |
| $ | 463 |
| $ | 464 |
| $ | 464 |
| $ | — |
| 31,995 |
| |
| 2009 | | 267 |
| 264 |
| 259 |
| 258 |
| 251 |
| 257 |
| 257 |
| 257 |
| 257 |
| — |
| 28,286 |
| $ | 267 |
| $ | 264 |
| $ | 259 |
| $ | 258 |
| $ | 251 |
| $ | 257 |
| $ | 257 |
| $ | 257 |
| $ | 257 |
| $ | 258 |
| $ | — |
| 28,286 |
|
| 2010 | | 286 |
| 283 |
| 279 |
| 282 |
| 284 |
| 284 |
| 284 |
| 284 |
| — |
| 28,515 |
| | 286 |
| 283 |
| 279 |
| 282 |
| 284 |
| 284 |
| 284 |
| 284 |
| 284 |
| — |
| 28,515 |
|
| 2011 | | 357 |
| 356 |
| 356 |
| 362 |
| 361 |
| 360 |
| 359 |
| — |
| 29,103 |
| | 357 |
| 356 |
| 356 |
| 362 |
| 361 |
| 360 |
| 359 |
| 359 |
| — |
| 29,110 |
|
| 2012 | | 329 |
| 301 |
| 301 |
| 305 |
| 306 |
| 305 |
| 1 |
| 25,785 |
| | 329 |
| 301 |
| 301 |
| 305 |
| 306 |
| 305 |
| 305 |
| 1 |
| 25,789 |
|
| 2013 | | 234 |
| 218 |
| 219 |
| 220 |
| 216 |
| — |
| 20,287 |
| | 234 |
| 218 |
| 219 |
| 220 |
| 216 |
| 215 |
| — |
| 20,289 |
|
| 2014 | | 268 |
| 260 |
| 262 |
| 264 |
| — |
| 19,742 |
| | 268 |
| 260 |
| 262 |
| 264 |
| 263 |
| — |
| 19,758 |
|
| 2015 | | 264 |
| 264 |
| 268 |
| 3 |
| 19,031 |
| | 264 |
| 264 |
| 268 |
| 270 |
| — |
| 19,061 |
|
| 2016 | | 328 |
| 331 |
| 6 |
| 19,868 |
| | 328 |
| 331 |
| 327 |
| 5 |
| 19,945 |
|
| 2017 | | 515 |
| 81 |
| 18,883 |
| | 515 |
| 440 |
| 62 |
| 20,703 |
|
| 2018 | | | 403 |
| 86 |
| 17,839 |
|
| Total | | $ | 3,263 |
| | | | $ | 3,124 |
| | |
| | Cumulative Paid Losses & Allocated Loss Adjustment Expenses, Net of Reinsurance | | | For the years ended December 31, | For the years ended December 31, |
| | (Unaudited) | | (Unaudited) | |
| Accident Year | 2008 | 2009 | 2010 | 2011 | 2012 | 2013 | 2014 | 2015 | 2016 | 2017 | 2009 | 2010 | 2011 | 2012 | 2013 | 2014 | 2015 | 2016 | 2017 | 2018 |
| 2008 | $ | 280 |
| $ | 422 |
| $ | 449 |
| $ | 459 |
| $ | 464 |
| $ | 464 |
| $ | 464 |
| $ | 465 |
| $ | 466 |
| $ | 465 |
| |
| 2009 | | 179 |
| 247 |
| 252 |
| 256 |
| 256 |
| 257 |
| 257 |
| 257 |
| 257 |
| $ | 179 |
| $ | 247 |
| $ | 252 |
| $ | 256 |
| $ | 256 |
| $ | 257 |
| $ | 257 |
| $ | 257 |
| $ | 257 |
| $ | 257 |
|
| 2010 | | 198 |
| 266 |
| 276 |
| 281 |
| 283 |
| 284 |
| 284 |
| 284 |
| | 198 |
| 266 |
| 276 |
| 281 |
| 283 |
| 284 |
| 284 |
| 284 |
| 284 |
|
| 2011 | | 231 |
| 332 |
| 350 |
| 355 |
| 358 |
| 359 |
| 360 |
| | 231 |
| 332 |
| 350 |
| 355 |
| 358 |
| 359 |
| 360 |
| 360 |
|
| 2012 | | 171 |
| 279 |
| 294 |
| 300 |
| 304 |
| 303 |
| | 171 |
| 279 |
| 294 |
| 300 |
| 304 |
| 303 |
| 303 |
|
| 2013 | | 157 |
| 208 |
| 216 |
| 218 |
| 215 |
| | 157 |
| 208 |
| 216 |
| 218 |
| 215 |
| 215 |
|
| 2014 | | 168 |
| 243 |
| 258 |
| 264 |
| | 168 |
| 243 |
| 258 |
| 264 |
| 262 |
|
| 2015 | | 172 |
| 239 |
| 255 |
| | 172 |
| 239 |
| 255 |
| 265 |
|
| 2016 | | 188 |
| 285 |
| | 188 |
| 285 |
| 310 |
|
| 2017 | | 210 |
| | 210 |
| 334 |
|
| 2018 | | | 173 |
|
| Total | | $ | 2,898 |
| | $ | 2,763 |
|
THE HARTFORD FINANCIAL SERVICES GROUP, INC.
NOTES TO CONSOLIDATED FINANCIAL STATMENTSSTATEMENTS (continued)
11. Reserve for Unpaid Losses and Loss Adjustment Expenses (continued)
Commercial Automobile Liability
| | Incurred Losses & Allocated Loss Adjustment Expenses, Net of Reinsurance | | | For the years ended December 31, | | | For the years ended December 31, | | |
| | (Unaudited) | | | (Unaudited) | | |
| Accident Year | 2008 | 2009 | 2010 | 2011 | 2012 | 2013 | 2014 | 2015 | 2016 | 2017 | IBNR
Reserves | Claims
Reported | 2009 | 2010 | 2011 | 2012 | 2013 | 2014 | 2015 | 2016 | 2017 | 2018 | IBNR
Reserves | Claims
Reported |
| 2008 | $ | 303 |
| $ | 311 |
| $ | 304 |
| $ | 303 |
| $ | 304 |
| $ | 304 |
| $ | 302 |
| $ | 307 |
| $ | 306 |
| $ | 306 |
| $ | 4 |
| 43,885 |
| |
| 2009 | | 306 |
| 292 |
| 287 |
| 287 |
| 297 |
| 301 |
| 302 |
| 302 |
| 302 |
| 1 |
| 38,688 |
| $ | 306 |
| $ | 292 |
| $ | 287 |
| $ | 287 |
| $ | 297 |
| $ | 301 |
| $ | 302 |
| $ | 302 |
| $ | 302 |
| $ | 302 |
| $ | — |
| 38,703 |
|
| 2010 | | 277 |
| 280 |
| 296 |
| 319 |
| 323 |
| 328 |
| 327 |
| 324 |
| 7 |
| 38,112 |
| | 277 |
| 280 |
| 296 |
| 319 |
| 323 |
| 328 |
| 327 |
| 324 |
| 322 |
| 4 |
| 38,153 |
|
| 2011 | | 272 |
| 310 |
| 356 |
| 356 |
| 366 |
| 365 |
| 362 |
| 7 |
| 39,262 |
| | 272 |
| 310 |
| 356 |
| 356 |
| 366 |
| 365 |
| 362 |
| 362 |
| 4 |
| 39,293 |
|
| 2012 | | 311 |
| 376 |
| 390 |
| 401 |
| 394 |
| 390 |
| 14 |
| 35,970 |
| | 311 |
| 376 |
| 390 |
| 401 |
| 394 |
| 390 |
| 387 |
| 6 |
| 35,999 |
|
| 2013 | | 309 |
| 314 |
| 329 |
| 336 |
| 335 |
| 24 |
| 31,881 |
| | 309 |
| 314 |
| 329 |
| 336 |
| 335 |
| 333 |
| 18 |
| 31,918 |
|
| 2014 | | 306 |
| 314 |
| 328 |
| 333 |
| 48 |
| 29,171 |
| | 306 |
| 314 |
| 328 |
| 333 |
| 337 |
| 23 |
| 29,260 |
|
| 2015 | | 302 |
| 353 |
| 368 |
| 99 |
| 27,928 |
| | 302 |
| 353 |
| 368 |
| 351 |
| 43 |
| 28,079 |
|
| 2016 | | 372 |
| 380 |
| 155 |
| 27,771 |
| | 372 |
| 380 |
| 376 |
| 90 |
| 28,154 |
|
| 2017 | | 346 |
| 243 |
| 22,665 |
| | 346 |
| 358 |
| 165 |
| 24,587 |
|
| 2018 | | | 314 |
| 205 |
| 20,675 |
|
| Total | | $ | 3,446 |
| | | | $ | 3,442 |
| | |
| | Cumulative Paid Losses & Allocated Loss Adjustment Expense, Net of Reinsurance | | | For the years ended December 31 | For the years ended December 31 |
| | (Unaudited) | | (Unaudited) | |
| Accident Year | 2008 | 2009 | 2010 | 2011 | 2012 | 2013 | 2014 | 2015 | 2016 | 2017 | 2009 | 2010 | 2011 | 2012 | 2013 | 2014 | 2015 | 2016 | 2017 | 2018 |
| 2008 | $ | 61 |
| $ | 124 |
| $ | 185 |
| $ | 238 |
| $ | 270 |
| $ | 289 |
| $ | 295 |
| $ | 299 |
| $ | 300 |
| $ | 302 |
| |
| 2009 | | 56 |
| 115 |
| 175 |
| 237 |
| 274 |
| 291 |
| 298 |
| 300 |
| 301 |
| $ | 56 |
| $ | 115 |
| $ | 175 |
| $ | 237 |
| $ | 274 |
| $ | 291 |
| $ | 298 |
| $ | 300 |
| $ | 301 |
| $ | 301 |
|
| 2010 | | 55 |
| 125 |
| 188 |
| 252 |
| 289 |
| 300 |
| 308 |
| 313 |
| | 55 |
| 125 |
| 188 |
| 252 |
| 289 |
| 300 |
| 308 |
| 313 |
| 316 |
|
| 2011 | | 62 |
| 133 |
| 211 |
| 273 |
| 315 |
| 339 |
| 348 |
| | 62 |
| 133 |
| 211 |
| 273 |
| 315 |
| 339 |
| 348 |
| 352 |
|
| 2012 | | 65 |
| 142 |
| 233 |
| 306 |
| 345 |
| 358 |
| | 65 |
| 142 |
| 233 |
| 306 |
| 345 |
| 358 |
| 371 |
|
| 2013 | | 61 |
| 128 |
| 199 |
| 255 |
| 289 |
| | 61 |
| 128 |
| 199 |
| 255 |
| 289 |
| 306 |
|
| 2014 | | 58 |
| 129 |
| 195 |
| 249 |
| | 58 |
| 129 |
| 195 |
| 249 |
| 295 |
|
| 2015 | | 61 |
| 141 |
| 204 |
| | 61 |
| 141 |
| 204 |
| 264 |
|
| 2016 | | 62 |
| 140 |
| | 62 |
| 140 |
| 222 |
|
| 2017 | | 55 |
| | 55 |
| 123 |
|
| 2018 | | | 54 |
|
| Total | | $ | 2,559 |
| | $ | 2,604 |
|
THE HARTFORD FINANCIAL SERVICES GROUP, INC.
NOTES TO CONSOLIDATED FINANCIAL STATMENTSSTATEMENTS (continued)
11. Reserve for Unpaid Losses and Loss Adjustment Expenses (continued)
Commercial Automobile Physical Damage
| | Incurred Losses & Allocated Loss Adjustment Expenses, Net of Reinsurance | | | For the years ended December 31, | | | For the years ended December 31, | | |
| | (Unaudited) | | | (Unaudited) | | |
| Accident Year | 2015 | 2016 | 2017 | IBNR
Reserves | Claims
Reported | 2016 | 2017 | 2018 | IBNR
Reserves | Claims
Reported |
| 2015 | $ | 74 |
| $ | 75 |
| $ | 75 |
| $ | — |
| 26,812 |
| |
| 2016 | | 79 |
| 78 |
| — |
| 26,320 |
| $ | 79 |
| $ | 78 |
| $ | 78 |
| $ | — |
| 26,367 |
|
| 2017 | | 85 |
| 4 |
| 22,965 |
| | 85 |
| 81 |
| 3 |
| 24,275 |
|
| 2018 | | | 62 |
| 2 |
| 19,167 |
|
| Total | | $ | 238 |
| | | | $ | 221 |
| | |
| | Cumulative Paid Losses & Allocated Loss Adjustment Expenses, Net of Reinsurance | | | For the years ended December 31, | For the years ended December 31, |
| | (Unaudited) | | (Unaudited) | |
| Accident Year | 2015 | 2016 | 2017 | 2016 | 2017 | 2018 |
| 2015 | $ | 69 |
| $ | 75 |
| $ | 75 |
| |
| 2016 | | 71 |
| 78 |
| $ | 71 |
| $ | 78 |
| $ | 77 |
|
| 2017 | | 74 |
| | 74 |
| 79 |
|
| 2018 | | | 54 |
|
| Total | | $ | 227 |
| | $ | 210 |
|
THE HARTFORD FINANCIAL SERVICES GROUP, INC.
NOTES TO CONSOLIDATED FINANCIAL STATMENTSSTATEMENTS (continued)
11. Reserve for Unpaid Losses and Loss Adjustment Expenses (continued)
Professional Liability
| | Incurred Losses & Allocated Loss Adjustment Expenses, Net of Reinsurance | | | For the years ended December 31, | | | For the years ended December 31, | | |
| | (Unaudited) | | | (Unaudited) | | |
| Claims Made Year | 2008 | 2009 | 2010 | 2011 | 2012 | 2013 | 2014 | 2015 | 2016 | 2017 | IBNR
Reserves | Claims
Reported | 2009 | 2010 | 2011 | 2012 | 2013 | 2014 | 2015 | 2016 | 2017 | 2018 | IBNR
Reserves | Claims
Reported |
| 2008 | $ | 281 |
| $ | 253 |
| $ | 244 |
| $ | 274 |
| $ | 280 |
| $ | 276 |
| $ | 276 |
| $ | 282 |
| $ | 277 |
| $ | 284 |
| $ | 16 |
| 4,959 |
| |
| 2009 | | 254 |
| 251 |
| 244 |
| 266 |
| 257 |
| 263 |
| 255 |
| 257 |
| 257 |
| 19 |
| 5,114 |
| $ | 254 |
| $ | 251 |
| $ | 244 |
| $ | 266 |
| $ | 257 |
| $ | 263 |
| $ | 255 |
| $ | 257 |
| $ | 257 |
| $ | 259 |
| $ | 20 |
| 5,115 |
|
| 2010 | | 202 |
| 211 |
| 212 |
| 205 |
| 201 |
| 200 |
| 195 |
| 199 |
| 31 |
| 4,890 |
| | 202 |
| 211 |
| 212 |
| 205 |
| 201 |
| 200 |
| 195 |
| 199 |
| 192 |
| 22 |
| 4,894 |
|
| 2011 | | 226 |
| 228 |
| 232 |
| 226 |
| 219 |
| 219 |
| 220 |
| 44 |
| 4,707 |
| | 226 |
| 228 |
| 232 |
| 226 |
| 219 |
| 219 |
| 220 |
| 215 |
| 38 |
| 4,708 |
|
| 2012 | | 174 |
| 172 |
| 168 |
| 149 |
| 146 |
| 144 |
| 33 |
| 3,729 |
| | 174 |
| 172 |
| 168 |
| 149 |
| 146 |
| 144 |
| 139 |
| 18 |
| 3,734 |
|
| 2013 | | 136 |
| 136 |
| 123 |
| 110 |
| 103 |
| 35 |
| 2,782 |
| | 136 |
| 136 |
| 123 |
| 110 |
| 103 |
| 99 |
| 27 |
| 2,791 |
|
| 2014 | | 116 |
| 123 |
| 118 |
| 114 |
| 44 |
| 2,878 |
| | 116 |
| 123 |
| 118 |
| 114 |
| 109 |
| 33 |
| 2,891 |
|
| 2015 | | 104 |
| 113 |
| 113 |
| 51 |
| 2,943 |
| | 104 |
| 113 |
| 113 |
| 114 |
| 32 |
| 2,957 |
|
| 2016 | | 106 |
| 106 |
| 66 |
| 3,090 |
| | 106 |
| 106 |
| 125 |
| 71 |
| 3,133 |
|
| 2017 | | 107 |
| 82 |
| 2,733 |
| | 107 |
| 113 |
| 75 |
| 3,111 |
|
| 2018 | | | 126 |
| 107 |
| 2,971 |
|
| Total | | $ | 1,647 |
| | | | $ | 1,491 |
| | |
| | Cumulative Paid Losses & Allocated Loss Adjustment Expenses, Net of Reinsurance | | | For the years ended December 31, | For the years ended December 31, |
| | (Unaudited) | | (Unaudited) | |
| Claims Made Year | 2008 | 2009 | 2010 | 2011 | 2012 | 2013 | 2014 | 2015 | 2016 | 2017 | 2009 | 2010 | 2011 | 2012 | 2013 | 2014 | 2015 | 2016 | 2017 | 2018 |
| 2008 | $ | 13 |
| $ | 61 |
| $ | 126 |
| $ | 166 |
| $ | 202 |
| $ | 221 |
| $ | 230 |
| $ | 260 |
| $ | 264 |
| $ | 266 |
| |
| 2009 | | 17 |
| 69 |
| 127 |
| 177 |
| 194 |
| 226 |
| 225 |
| 226 |
| 235 |
| $ | 17 |
| $ | 69 |
| $ | 127 |
| $ | 177 |
| $ | 194 |
| $ | 226 |
| $ | 225 |
| $ | 226 |
| $ | 235 |
| $ | 238 |
|
| 2010 | | 22 |
| 62 |
| 103 |
| 137 |
| 148 |
| 157 |
| 162 |
| 166 |
| | 22 |
| 62 |
| 103 |
| 137 |
| 148 |
| 157 |
| 162 |
| 166 |
| 169 |
|
| 2011 | | 11 |
| 57 |
| 100 |
| 128 |
| 163 |
| 170 |
| 173 |
| | 11 |
| 57 |
| 100 |
| 128 |
| 163 |
| 170 |
| 173 |
| 176 |
|
| 2012 | | 11 |
| 41 |
| 60 |
| 89 |
| 97 |
| 107 |
| | 11 |
| 41 |
| 60 |
| 89 |
| 97 |
| 107 |
| 109 |
|
| 2013 | | 4 |
| 19 |
| 31 |
| 39 |
| 55 |
| | 4 |
| 19 |
| 31 |
| 39 |
| 55 |
| 66 |
|
| 2014 | | 4 |
| 21 |
| 40 |
| 64 |
| | 4 |
| 21 |
| 40 |
| 64 |
| 72 |
|
| 2015 | | 4 |
| 23 |
| 49 |
| | 4 |
| 23 |
| 49 |
| 63 |
|
| 2016 | | 4 |
| 25 |
| | 4 |
| 25 |
| 46 |
|
| 2017 | | 6 |
| | 6 |
| 26 |
|
| 2018 | | | 8 |
|
| Total | | $ | 1,146 |
| | $ | 973 |
|
THE HARTFORD FINANCIAL SERVICES GROUP, INC.
NOTES TO CONSOLIDATED FINANCIAL STATMENTSSTATEMENTS (continued)
11. Reserve for Unpaid Losses and Loss Adjustment Expenses (continued)
Bond
| | Incurred Losses & Allocated Loss Adjustment Expenses, Net of Reinsurance | | | For the years ended December 31, | | | For the years ended December 31, | | |
| | (Unaudited) | | | (Unaudited) | | |
| Accident Year | 2008 | 2009 | 2010 | 2011 | 2012 | 2013 | 2014 | 2015 | 2016 | 2017 | IBNR
Reserves | Claims
Reported | 2009 | 2010 | 2011 | 2012 | 2013 | 2014 | 2015 | 2016 | 2017 | 2018 | IBNR
Reserves | Claims
Reported |
| 2008 | $ | 75 |
| $ | 67 |
| $ | 62 |
| $ | 52 |
| $ | 47 |
| $ | 47 |
| $ | 44 |
| $ | 47 |
| $ | 48 |
| $ | 46 |
| $ | 7 |
| 3,450 |
| |
| 2009 | | 71 |
| 71 |
| 69 |
| 58 |
| 57 |
| 51 |
| 49 |
| 49 |
| 49 |
| 4 |
| 3,309 |
| $ | 71 |
| $ | 71 |
| $ | 69 |
| $ | 58 |
| $ | 57 |
| $ | 51 |
| $ | 49 |
| $ | 49 |
| $ | 49 |
| $ | 49 |
| $ | 5 |
| 3,321 |
|
| 2010 | | 71 |
| 75 |
| 80 |
| 79 |
| 73 |
| 69 |
| 70 |
| 90 |
| 24 |
| 2,670 |
| | 71 |
| 75 |
| 80 |
| 79 |
| 73 |
| 69 |
| 70 |
| 90 |
| 71 |
| 3 |
| 2,674 |
|
| 2011 | | 72 |
| 76 |
| 76 |
| 75 |
| 70 |
| 70 |
| 69 |
| 10 |
| 2,126 |
| | 72 |
| 76 |
| 76 |
| 75 |
| 70 |
| 70 |
| 69 |
| 69 |
| 9 |
| 2,134 |
|
| 2012 | | 69 |
| 69 |
| 60 |
| 53 |
| 48 |
| 48 |
| 16 |
| 1,719 |
| | 69 |
| 69 |
| 60 |
| 53 |
| 48 |
| 48 |
| 43 |
| 9 |
| 1,720 |
|
| 2013 | | 63 |
| 58 |
| 54 |
| 48 |
| 48 |
| 29 |
| 1,452 |
| | 63 |
| 58 |
| 54 |
| 48 |
| 48 |
| 38 |
| 18 |
| 1,456 |
|
| 2014 | | 69 |
| 65 |
| 65 |
| 66 |
| 20 |
| 1,362 |
| | 69 |
| 65 |
| 65 |
| 66 |
| 58 |
| 13 |
| 1,373 |
|
| 2015 | | 65 |
| 65 |
| 62 |
| 29 |
| 1,347 |
| | 65 |
| 65 |
| 62 |
| 59 |
| 23 |
| 1,368 |
|
| 2016 | | 59 |
| 59 |
| 45 |
| 1,227 |
| | 59 |
| 59 |
| 58 |
| 37 |
| 1,272 |
|
| 2017 | | 61 |
| 53 |
| 1,018 |
| | 61 |
| 88 |
| 38 |
| 1,204 |
|
| 2018 | | | 65 |
| 59 |
| 1,040 |
|
| Total | | $ | 598 |
| | | | $ | 598 |
| | |
| | Cumulative Paid Losses & Allocated Loss Adjustment Expenses, Net of Reinsurance | | | For the years ended December 31, | For the years ended December 31, |
| | (Unaudited) | | (Unaudited) | |
| Accident Year | 2008 | 2009 | 2010 | 2011 | 2012 | 2013 | 2014 | 2015 | 2016 | 2017 | 2009 | 2010 | 2011 | 2012 | 2013 | 2014 | 2015 | 2016 | 2017 | 2018 |
| 2008 | $ | 5 |
| $ | 18 |
| $ | 23 |
| $ | 30 |
| $ | 32 |
| $ | 34 |
| $ | 39 |
| $ | 39 |
| $ | 39 |
| $ | 39 |
| |
| 2009 | | 9 |
| 32 |
| 45 |
| 46 |
| 44 |
| 43 |
| 44 |
| 44 |
| 44 |
| $ | 9 |
| $ | 32 |
| $ | 45 |
| $ | 46 |
| $ | 44 |
| $ | 43 |
| $ | 44 |
| $ | 44 |
| $ | 44 |
| $ | 43 |
|
| 2010 | | 13 |
| 46 |
| 59 |
| 58 |
| 59 |
| 63 |
| 66 |
| 66 |
| | 13 |
| 46 |
| 59 |
| 58 |
| 59 |
| 63 |
| 66 |
| 66 |
| 67 |
|
| 2011 | | 12 |
| 39 |
| 51 |
| 56 |
| 57 |
| 59 |
| 59 |
| | 12 |
| 39 |
| 51 |
| 56 |
| 57 |
| 59 |
| 59 |
| 59 |
|
| 2012 | | 12 |
| 25 |
| 26 |
| 24 |
| 25 |
| 25 |
| | 12 |
| 25 |
| 26 |
| 24 |
| 25 |
| 25 |
| 33 |
|
| 2013 | | 3 |
| 9 |
| 17 |
| 18 |
| 18 |
| | 3 |
| 9 |
| 17 |
| 18 |
| 18 |
| 18 |
|
| 2014 | | 18 |
| 31 |
| 40 |
| 43 |
| | 18 |
| 31 |
| 40 |
| 43 |
| 42 |
|
| 2015 | | 9 |
| 19 |
| 23 |
| | 9 |
| 19 |
| 23 |
| 31 |
|
| 2016 | | 2 |
| 11 |
| | 2 |
| 11 |
| 13 |
|
| 2017 | | 5 |
| | 5 |
| 45 |
|
| 2018 | | | 5 |
|
| Total | | $ | 333 |
| | $ | 356 |
|
THE HARTFORD FINANCIAL SERVICES GROUP, INC.
NOTES TO CONSOLIDATED FINANCIAL STATMENTSSTATEMENTS (continued)
11. Reserve for Unpaid Losses and Loss Adjustment Expenses (continued)
Personal Automobile Liability
| | Incurred Losses & Allocated Loss Adjustment Expenses, Net of Reinsurance | | | For the years ended December 31, | | | For the years ended December 31, | | |
| | (Unaudited) | | | (Unaudited) | | |
| Accident Year | 2008 | 2009 | 2010 | 2011 | 2012 | 2013 | 2014 | 2015 | 2016 | 2017 | IBNR
Reserves | Claims
Reported | 2009 | 2010 | 2011 | 2012 | 2013 | 2014 | 2015 | 2016 | 2017 | 2018 | IBNR
Reserves | Claims
Reported |
| 2008 | $ | 1,253 |
| $ | 1,249 |
| $ | 1,227 |
| $ | 1,207 |
| $ | 1,197 |
| $ | 1,196 |
| $ | 1,192 |
| $ | 1,191 |
| $ | 1,188 |
| $ | 1,188 |
| $ | 3 |
| 248,990 |
| |
| 2009 | | 1,351 |
| 1,305 |
| 1,280 |
| 1,255 |
| 1,256 |
| 1,260 |
| 1,259 |
| 1,257 |
| 1,257 |
| 3 |
| 254,551 |
| $ | 1,351 |
| $ | 1,305 |
| $ | 1,280 |
| $ | 1,255 |
| $ | 1,256 |
| $ | 1,260 |
| $ | 1,259 |
| $ | 1,257 |
| $ | 1,257 |
| $ | 1,257 |
| $ | 3 |
| 254,555 |
|
| 2010 | | 1,346 |
| 1,321 |
| 1,293 |
| 1,287 |
| 1,282 |
| 1,275 |
| 1,265 |
| 1,265 |
| 3 |
| 248,944 |
| | 1,346 |
| 1,321 |
| 1,293 |
| 1,287 |
| 1,282 |
| 1,275 |
| 1,265 |
| 1,265 |
| 1,264 |
| 3 |
| 248,944 |
|
| 2011 | | 1,181 |
| 1,170 |
| 1,180 |
| 1,173 |
| 1,166 |
| 1,154 |
| 1,154 |
| 7 |
| 221,879 |
| | 1,181 |
| 1,170 |
| 1,180 |
| 1,173 |
| 1,166 |
| 1,154 |
| 1,154 |
| 1,153 |
| 5 |
| 221,886 |
|
| 2012 | | 1,141 |
| 1,149 |
| 1,146 |
| 1,142 |
| 1,133 |
| 1,130 |
| 8 |
| 210,740 |
| | 1,141 |
| 1,149 |
| 1,146 |
| 1,142 |
| 1,133 |
| 1,130 |
| 1,130 |
| 7 |
| 210,750 |
|
| 2013 | | 1,131 |
| 1,145 |
| 1,144 |
| 1,153 |
| 1,152 |
| 14 |
| 205,428 |
| | 1,131 |
| 1,145 |
| 1,144 |
| 1,153 |
| 1,152 |
| 1,153 |
| 8 |
| 205,462 |
|
| 2014 | | 1,146 |
| 1,153 |
| 1,198 |
| 1,200 |
| 34 |
| 208,817 |
| | 1,146 |
| 1,153 |
| 1,198 |
| 1,200 |
| 1,199 |
| 15 |
| 208,942 |
|
| 2015 | | 1,195 |
| 1,340 |
| 1,338 |
| 92 |
| 216,189 |
| | 1,195 |
| 1,340 |
| 1,338 |
| 1,330 |
| 38 |
| 216,707 |
|
| 2016 | | 1,407 |
| 1,402 |
| 235 |
| 213,563 |
| | 1,407 |
| 1,402 |
| 1,393 |
| 103 |
| 215,126 |
|
| 2017 | | 1,277 |
| 554 |
| 175,871 |
| | 1,277 |
| 1,275 |
| 276 |
| 185,716 |
|
| 2018 | | | 1,108 |
| 510 |
| 146,845 |
|
| Total | | $ | 12,363 |
| | | | $ | 12,262 |
| | |
| | Cumulative Paid Losses & Allocated Loss Adjustment Expenses, Net of Reinsurance | | | For the years ended December 31, | For the years ended December 31, |
| | (Unaudited) | | (Unaudited) | |
| Accident Year | 2008 | 2009 | 2010 | 2011 | 2012 | 2013 | 2014 | 2015 | 2016 | 2017 | 2009 | 2010 | 2011 | 2012 | 2013 | 2014 | 2015 | 2016 | 2017 | 2018 |
| 2008 | $ | 469 |
| $ | 861 |
| $ | 1,031 |
| $ | 1,121 |
| $ | 1,160 |
| $ | 1,175 |
| $ | 1,181 |
| $ | 1,183 |
| $ | 1,184 |
| $ | 1,184 |
| |
| 2009 | | 492 |
| 888 |
| 1,083 |
| 1,171 |
| 1,223 |
| 1,240 |
| 1,246 |
| 1,250 |
| 1,251 |
| $ | 492 |
| $ | 888 |
| $ | 1,083 |
| $ | 1,171 |
| $ | 1,223 |
| $ | 1,240 |
| $ | 1,246 |
| $ | 1,250 |
| $ | 1,251 |
| $ | 1,251 |
|
| 2010 | | 496 |
| 915 |
| 1,108 |
| 1,202 |
| 1,239 |
| 1,251 |
| 1,256 |
| 1,258 |
| | 496 |
| 915 |
| 1,108 |
| 1,202 |
| 1,239 |
| 1,251 |
| 1,256 |
| 1,258 |
| 1,260 |
|
| 2011 | | 447 |
| 826 |
| 1,006 |
| 1,088 |
| 1,126 |
| 1,140 |
| 1,145 |
| | 447 |
| 826 |
| 1,006 |
| 1,088 |
| 1,126 |
| 1,140 |
| 1,145 |
| 1,146 |
|
| 2012 | | 441 |
| 818 |
| 986 |
| 1,067 |
| 1,104 |
| 1,114 |
| | 441 |
| 818 |
| 986 |
| 1,067 |
| 1,104 |
| 1,114 |
| 1,120 |
|
| 2013 | | 442 |
| 816 |
| 1,002 |
| 1,091 |
| 1,121 |
| | 442 |
| 816 |
| 1,002 |
| 1,091 |
| 1,121 |
| 1,135 |
|
| 2014 | | 430 |
| 843 |
| 1,032 |
| 1,125 |
| | 430 |
| 843 |
| 1,032 |
| 1,125 |
| 1,165 |
|
| 2015 | | 475 |
| 935 |
| 1,142 |
| | 475 |
| 935 |
| 1,142 |
| 1,243 |
|
| 2016 | | 505 |
| 968 |
| | 505 |
| 968 |
| 1,188 |
|
| 2017 | | 441 |
| | 441 |
| 836 |
|
| 2018 | | | 359 |
|
| Total | | $ | 10,749 |
| | $ | 10,703 |
|
THE HARTFORD FINANCIAL SERVICES GROUP, INC.
NOTES TO CONSOLIDATED FINANCIAL STATMENTSSTATEMENTS (continued)
11. Reserve for Unpaid Losses and Loss Adjustment Expenses (continued)
Personal Automobile Physical Damage
| | Incurred Losses & Allocated Loss Adjustment Expenses, Net of Reinsurance | | | For the years ended December 31, | | | For the years ended December 31, | | |
| | (Unaudited) | | | (Unaudited) | | |
| Accident Year | 2015 | 2016 | 2017 | IBNR
Reserves | Claims
Reported | 2016 | 2017 | 2018 | IBNR
Reserves | Claims
Reported |
| 2015 | $ | 629 |
| $ | 632 |
| $ | 630 |
| $ | — |
| 395,923 |
| |
| 2016 | | 665 |
| 656 |
| 2 |
| 406,162 |
| $ | 665 |
| $ | 656 |
| $ | 655 |
| $ | 3 |
| 406,588 |
|
| 2017 | | 598 |
| (8 | ) | 343,178 |
| | 598 |
| 588 |
| (3 | ) | 361,857 |
|
| 2018 | | | 509 |
| 3 |
| 288,993 |
|
| Total | | $ | 1,884 |
| | | | $ | 1,752 |
| | |
| | Cumulative Paid Losses & Allocated Loss Adjustment Expenses, Net of Reinsurance | | | For the years ended December 31, | For the years ended December 31, |
| | (Unaudited) | | (Unaudited) | |
| Accident Year | 2015 | 2016 | 2017 | 2016 | 2017 | 2018 |
| 2015 | $ | 610 |
| $ | 630 |
| $ | 629 |
| |
| 2016 | | 634 |
| 653 |
| $ | 634 |
| $ | 653 |
| $ | 651 |
|
| 2017 | | 574 |
| | 574 |
| 591 |
|
| 2018 | | | 474 |
|
| Total | | $ | 1,856 |
| | $ | 1,716 |
|
THE HARTFORD FINANCIAL SERVICES GROUP, INC.
NOTES TO CONSOLIDATED FINANCIAL STATMENTSSTATEMENTS (continued)
11. Reserve for Unpaid Losses and Loss Adjustment Expenses (continued)
Homeowners
| | Incurred Losses & Allocated Loss Adjustment Expenses, Net of Reinsurance | | | For the years ended December 31, | | | For the years ended December 31, | | |
| | (Unaudited) | | | (Unaudited) | | |
| Accident Year | 2008 | 2009 | 2010 | 2011 | 2012 | 2013 | 2014 | 2015 | 2016 | 2017 | IBNR
Reserves | Claims
Reported | 2009 | 2010 | 2011 | 2012 | 2013 | 2014 | 2015 | 2016 | 2017 | 2018 | IBNR
Reserves | Claims
Reported |
| 2008 | $ | 742 |
| $ | 768 |
| $ | 777 |
| $ | 778 |
| $ | 779 |
| $ | 779 |
| $ | 779 |
| $ | 779 |
| $ | 780 |
| $ | 779 |
| $ | — |
| 165,108 |
| |
| 2009 | | 757 |
| 777 |
| 776 |
| 772 |
| 772 |
| 772 |
| 772 |
| 769 |
| 768 |
| — |
| 149,790 |
| $ | 757 |
| $ | 777 |
| $ | 776 |
| $ | 772 |
| $ | 772 |
| $ | 772 |
| $ | 772 |
| $ | 769 |
| $ | 768 |
| $ | 768 |
| $ | — |
| 149,799 |
|
| 2010 | | 838 |
| 850 |
| 838 |
| 840 |
| 840 |
| 840 |
| 836 |
| 834 |
| — |
| 161,581 |
| | 838 |
| 850 |
| 838 |
| 840 |
| 840 |
| 840 |
| 836 |
| 834 |
| 834 |
| — |
| 161,590 |
|
| 2011 | | 955 |
| 920 |
| 919 |
| 916 |
| 914 |
| 911 |
| 908 |
| 1 |
| 179,377 |
| | 955 |
| 920 |
| 919 |
| 916 |
| 914 |
| 911 |
| 908 |
| 907 |
| — |
| 179,389 |
|
| 2012 | | 774 |
| 741 |
| 741 |
| 741 |
| 739 |
| 738 |
| 2 |
| 142,804 |
| | 774 |
| 741 |
| 741 |
| 741 |
| 739 |
| 738 |
| 738 |
| 1 |
| 142,828 |
|
| 2013 | | 673 |
| 638 |
| 637 |
| 634 |
| 632 |
| 4 |
| 113,469 |
| | 673 |
| 638 |
| 637 |
| 634 |
| 632 |
| 630 |
| 1 |
| 113,518 |
|
| 2014 | | 710 |
| 707 |
| 702 |
| 700 |
| 5 |
| 121,809 |
| | 710 |
| 707 |
| 702 |
| 700 |
| 698 |
| 1 |
| 121,863 |
|
| 2015 | | 690 |
| 703 |
| 690 |
| 9 |
| 119,722 |
| | 690 |
| 703 |
| 690 |
| 684 |
| 3 |
| 119,888 |
|
| 2016 | | 669 |
| 673 |
| 20 |
| 118,748 |
| | 669 |
| 673 |
| 663 |
| 7 |
| 119,441 |
|
| 2017 | | 866 |
| 96 |
| 115,488 |
| | 866 |
| 889 |
| 45 |
| 123,426 |
|
| 2018 | | | 903 |
| 89 |
| 94,946 |
|
| Total | | $ | 7,588 |
| | | | $ | 7,714 |
| | |
| | Cumulative Paid Losses & Allocated Loss Adjustment Expenses, Net of Reinsurance | | | For the years ended December 31, | For the years ended December 31, |
| | (Unaudited) | | (Unaudited) | |
| Accident Year | 2008 | 2009 | 2010 | 2011 | 2012 | 2013 | 2014 | 2015 | 2016 | 2017 | 2009 | 2010 | 2011 | 2012 | 2013 | 2014 | 2015 | 2016 | 2017 | 2018 |
| 2008 | $ | 548 |
| $ | 721 |
| $ | 750 |
| $ | 764 |
| $ | 773 |
| $ | 775 |
| $ | 777 |
| $ | 777 |
| $ | 778 |
| $ | 778 |
| |
| 2009 | | 559 |
| 727 |
| 749 |
| 759 |
| 763 |
| 765 |
| 766 |
| 766 |
| 767 |
| $ | 559 |
| $ | 727 |
| $ | 749 |
| $ | 759 |
| $ | 763 |
| $ | 765 |
| $ | 766 |
| $ | 766 |
| $ | 767 |
| $ | 767 |
|
| 2010 | | 599 |
| 789 |
| 815 |
| 825 |
| 829 |
| 832 |
| 833 |
| 833 |
| | 599 |
| 789 |
| 815 |
| 825 |
| 829 |
| 832 |
| 833 |
| 833 |
| 834 |
|
| 2011 | | 709 |
| 871 |
| 891 |
| 899 |
| 903 |
| 905 |
| 908 |
| | 709 |
| 871 |
| 891 |
| 899 |
| 903 |
| 905 |
| 908 |
| 907 |
|
| 2012 | | 547 |
| 696 |
| 719 |
| 727 |
| 731 |
| 734 |
| | 547 |
| 696 |
| 719 |
| 727 |
| 731 |
| 734 |
| 735 |
|
| 2013 | | 467 |
| 590 |
| 611 |
| 622 |
| 626 |
| | 467 |
| 590 |
| 611 |
| 622 |
| 626 |
| 627 |
|
| 2014 | | 526 |
| 663 |
| 684 |
| 691 |
| | 526 |
| 663 |
| 684 |
| 691 |
| 695 |
|
| 2015 | | 487 |
| 645 |
| 665 |
| | 487 |
| 645 |
| 665 |
| 674 |
|
| 2016 | | 481 |
| 621 |
| | 481 |
| 621 |
| 640 |
|
| 2017 | | 538 |
| | 538 |
| 747 |
|
| 2018 | | | 484 |
|
| Total | | $ | 7,161 |
| | $ | 7,110 |
|
Property and casualty reserves, including IBNR reserves
The Company estimates ultimate losses and allocated loss adjustment expenses by accident year. IBNR represents the excess of estimated ultimate loss reserves over case reserves. The process to estimate ultimate losses and loss adjustment expenses is an integral part of the Company's reserve setting. Reserves for allocated and unallocated loss adjustment expenses aregenerally established separate from the reserves for losses.
Reserves for losses are set by line of business within the reporting segments. Case reserves are established by a claims handler on each individual claim and are adjusted as new information
becomes known during the course of handling the claim. Lines of business for which reported losses emerge over a long period of time are referred to as long-tail lines of business. Lines of business for which reported losses emerge more quickly are
referred to as short-tail lines of business. The Company’s shortest tail lines of business are homeowners, commercial property and automobile physical damage. The longest tail lines of business include workers’ compensation, general liability and professional liability. For short-tail lines of business, emergence of paid loss and case reserves is credible and likely indicative of ultimate losses. For long-tail lines of business, emergence of paid losses and case reserves is less credible in the early periods after a given
THE HARTFORD FINANCIAL SERVICES GROUP, INC.
NOTES TO CONSOLIDATED FINANCIAL STATMENTS (continued)
11. Reserve for Unpaid Losses and Loss Adjustment Expenses (continued)
accident year and, accordingly, may not be indicative of ultimate losses.
The Company’s reserving actuaries regularly review reserves for both current and prior accident years using the most current claim data. A variety of actuarial methods and judgments are used for most lines of business to arrive at selections of estimated ultimate losses and loss adjustment expenses. While actuarial methods used and judgments change depending on the age of the
THE HARTFORD FINANCIAL SERVICES GROUP, INC.
NOTES TO CONSOLIDATED FINANCIAL STATEMENTS (continued)
accident year, in 2017,2018, there were no new methods or types of judgments introduced or changes in how those methods and judgments were applied. The reserve selections incorporate input, as appropriate, from claims personnel, pricing actuaries and operating management about reported loss cost trends and other factors that could affect the reserve estimates.
For both short-tail and long-tail lines of business, an expected loss ratio is used to record initial reserves. This expected loss ratio is determined by starting with the average loss ratio of recent prior accident years and adjusting that ratio for the effect of expected changes to earned pricing, loss frequency and severity, mix of business, ceded reinsurance and other factors. For short-tail lines, IBNR for the current accident year is initially recorded as the product of the expected loss ratio for the period, earned premium for the period and the proportion of losses expected to be reported in future calendar periods for the current accident period. For long-tailed lines, IBNR reserves for the current accident year are initially recorded as the product of the expected loss ratio for the period and the earned premium for the period, less reported losses for the period. For certain short-tailed lines of business, IBNR amounts in the above loss development triangles are negative due to anticipated salvage and subrogation recoveries on paid losses.
As losses for a given accident year emerge or develop in subsequent periods, reserving actuaries use other methods to estimate ultimate unpaid losses in addition to the expected loss ratio method. These primarily include paid and reported loss development methods, frequency / frequency/severity techniques and the Bornhuetter-Ferguson method (a combination of the expected loss ratio and paid development or reported development method). Within any one line of business, the methods that are given more weight vary based primarily on the maturity of the accident year, the mix of business and the particular internal and
external influences impacting the claims experience or the methods. The output of the reserve reviews are reserve estimates that are referred to as the “actuarial indication”.
Paid development and reported development techniques are used for most lines of business though more weight is given to the
reported development method for some of the long-tailed lines like general liability. In addition, for long-tailed lines of business, the Company relies on the expected loss ratio method for immature accident years. Frequency/severity techniques are used predominantly for professional liability and are also used for automobile liability. For most lines, reserves for allocated loss adjustment expenses ("ALAE", or those expenses related to specific claims) are analyzed using paid development techniques and an analysis of the relationship between ALAE and loss payments. Reserves for ULAEunallocated loss adjustment expenses ("ULAE") are determined using the expected cost per claim year and the anticipated claim closure pattern as well as the ratio of paid ULAE to paid losses.
In the final step of the reserve review process, senior reserving actuaries and senior management apply their judgment to determine the appropriate level of reserves considering the actuarial indications and other factors not contemplated in the actuarial indications. Those factors include, but are not limited to, the assessed reliability of key loss trends and assumptions used in the current actuarial indications, the maturity of the accident year, pertinent trends observed over the recent past, the level of volatility within a particular line of business, and the improvement or deterioration of actuarial indications.
Cumulative number of reported claims
For property and casualty, claim counts represent the number of claim features on a reported claim where a claim feature is each separate coverage for each claimant affected by the claim event. For example, one car accident that results in two bodily injury claims and one automobile damage liability claim would be counted as three claims within the personal automobile liability triangle. Similarly, a fire that impacts one commercial building may result in multiple claim features due to the potential for claims related to business interruption, structural damage, and loss of the physical contents of the building. Claim features that result in no paid losses are included in the reported claim counts.
|
| | | | | | | | | | | | | | | | | | | | |
| Average Annual Percentage Payout of Incurred Claims by Age, Net of Reinsurance |
| | (Unaudited) | |
| Reserve Line | 1st Year | 2nd Year | 3rd Year | 4th Year | 5th Year | 6th Year | 7th Year | 8th Year | 9th Year | 10th Year |
| Workers' compensation | 15.8 | % | 19.5 | % | 12.9 | % | 9.0 | % | 6.1 | % | 4.6 | % | 3.2 | % | 2.5 | % | 2.0 | % | 1.4 | % |
| General liability | 3.3 | % | 8.7 | % | 14.9 | % | 16.5 | % | 13.7 | % | 9.7 | % | 7.8 | % | 3.6 | % | 2.1 | % | 2.1 | % |
| Package business | 38.1 | % | 21.3 | % | 10.3 | % | 8.7 | % | 5.8 | % | 3.5 | % | 1.9 | % | 1.1 | % | 0.7 | % | 0.3 | % |
| Commercial property | 60.8 | % | 27.6 | % | 4.9 | % | 1.9 | % | 0.3 | % | 0.1 | % | 0.1 | % | — | % | — | % | — | % |
| Commercial automobile liability | 17.2 | % | 20.5 | % | 20.7 | % | 18.1 | % | 11.6 | % | 4.8 | % | 2.7 | % | 1.1 | % | 0.6 | % | 0.1 | % |
| Commercial automobile physical damage | 90.0 | % | 7.1 | % | (0.5 | %) | | | | | | | |
| Professional liability | 5.7 | % | 18.6 | % | 18.1 | % | 16.2 | % | 9.8 | % | 7.6 | % | 1.3 | % | 1.4 | % | 2.5 | % | 1.1 | % |
| Bond | 15.4 | % | 30.8 | % | 13.9 | % | 3.3 | % | 0.3 | % | 1.5 | % | 6.1 | % | (0.1 | %) | 1.0 | % | (1.9 | %) |
| Personal automobile liability | 36.9 | % | 33.0 | % | 15.6 | % | 7.4 | % | 3.3 | % | 1.1 | % | 0.5 | % | 0.2 | % | 0.1 | % | — | % |
| Personal automobile physical damage | 95.9 | % | 2.8 | % | (0.3 | %) | | | | | | | |
| Homeowners | 70.4 | % | 21.1 | % | 3.0 | % | 1.2 | % | 0.5 | % | 0.3 | % | 0.1 | % | 0.1 | % | — | % | — | % |
THE HARTFORD FINANCIAL SERVICES GROUP, INC.
NOTES TO CONSOLIDATED FINANCIAL STATMENTSSTATEMENTS (continued)
11. Reserve for Unpaid Losses and Loss Adjustment Expenses (continued)
|
| | | | | | | | | | | | | | | | | | | | |
| Average Annual Percentage Payout of Incurred Claims by Age, Net of Reinsurance |
| | (Unaudited) | |
| Reserve Line | 1st Year | 2nd Year | 3rd Year | 4th Year | 5th Year | 6th Year | 7th Year | 8th Year | 9th Year | 10th Year |
| Workers' compensation | 16.0 | % | 19.9 | % | 13.1 | % | 9.2 | % | 6.4 | % | 4.7 | % | 3.5 | % | 2.7 | % | 2.0 | % | 1.7 | % |
| General liability | 3.7 | % | 9.0 | % | 16.0 | % | 17.4 | % | 13.8 | % | 9.4 | % | 7.7 | % | 3.6 | % | 2.2 | % | 1.6 | % |
| Package business | 38.9 | % | 22.0 | % | 10.3 | % | 8.3 | % | 5.5 | % | 3.6 | % | 1.9 | % | 1.2 | % | 0.7 | % | 0.4 | % |
| Commercial property | 61.8 | % | 27.8 | % | 4.6 | % | 1.6 | % | 0.5 | % | 0.1 | % | 0.1 | % | 0.1 | % | — | % | — | % |
| Commercial automobile liability | 17.4 | % | 20.5 | % | 20.3 | % | 18.1 | % | 11.0 | % | 5.0 | % | 2.3 | % | 1.1 | % | 0.4 | % | 0.5 | % |
| Commercial automobile physical damage | 90.1 | % | 8.2 | % | (0.3 | )% | | | | | | | |
| Professional liability | 5.5 | % | 18.5 | % | 18.7 | % | 16.2 | % | 10.3 | % | 6.8 | % | 1.6 | % | 4.3 | % | 2.4 | % | 0.4 | % |
| Bond | 14.6 | % | 26.8 | % | 13.6 | % | 3.7 | % | 0.9 | % | 2.0 | % | 3.8 | % | — | % | (0.1 | )% | 0.6 | % |
| Personal automobile liability | 37.6 | % | 33.1 | % | 15.4 | % | 7.4 | % | 3.2 | % | 1.1 | % | 0.4 | % | 0.3 | % | 0.1 | % | — | % |
| Personal automobile physical damage | 96.5 | % | 3.1 | % | (0.2 | )% | | | | | | | |
| Homeowners | 72.1 | % | 20.8 | % | 3.1 | % | 1.3 | % | 0.6 | % | 0.3 | % | 0.1 | % | 0.1 | % | 0.1 | % | — | % |
Group Life, Disability and Accident Products
Roll-forwardRollforward of Liabilities for Unpaid Losses and Loss Adjustment Expenses
| | | | For the years ended December 31, | For the years ended December 31, |
| | 2017 | 2016 | 2015 | 2018 | 2017 | 2016 |
| Beginning liabilities for unpaid losses and loss adjustment expenses, gross | $ | 5,772 |
| $ | 5,889 |
| $ | 6,013 |
| $ | 8,512 |
| $ | 5,772 |
| $ | 5,889 |
|
| Reinsurance recoverables | 208 |
| 218 |
| 209 |
| 209 |
| 208 |
| 218 |
|
| Beginning liabilities for unpaid losses and loss adjustment expenses, net | 5,564 |
| 5,671 |
| 5,804 |
| 8,303 |
| 5,564 |
| 5,671 |
|
| Add: Aetna U.S. group life and disability business acquisition [3] | 2,833 |
| — |
| — |
| |
| Add: Aetna U.S. group life and disability business acquisition [1] | | 42 |
| 2,833 |
| — |
|
| Provision for unpaid losses and loss adjustment expenses | |
|
|
|
|
|
|
| Current incurral year | 2,868 |
| 2,562 |
| 2,447 |
| 4,470 |
| 2,868 |
| 2,562 |
|
| Prior year's discount accretion | 202 |
| 202 |
| 214 |
| 227 |
| 202 |
| 202 |
|
| Prior incurral year development [1] | (185 | ) | (162 | ) | (146 | ) | |
| Total provision for unpaid losses and loss adjustment expenses [2] | 2,885 |
| 2,602 |
| 2,515 |
| |
| Prior incurral year development [2] | | (324 | ) | (185 | ) | (162 | ) |
| Total provision for unpaid losses and loss adjustment expenses [3] | | 4,373 |
| 2,885 |
| 2,602 |
|
| Less: payments | |
|
|
|
|
|
|
| Current incurral year | 1,528 |
| 1,327 |
| 1,257 |
| 2,377 |
| 1,528 |
| 1,327 |
|
| Prior incurral years | 1,451 |
| 1,382 |
| 1,391 |
| 2,135 |
| 1,451 |
| 1,382 |
|
| Total payments | 2,979 |
| 2,709 |
| 2,648 |
| 4,512 |
| 2,979 |
| 2,709 |
|
| Ending liabilities for unpaid losses and loss adjustment expenses, net | 8,303 |
| 5,564 |
| 5,671 |
| 8,206 |
| 8,303 |
| 5,564 |
|
| Reinsurance recoverables | 209 |
| 208 |
| 218 |
| 239 |
| 209 |
| 208 |
|
| Ending liabilities for unpaid losses and loss adjustment expenses, gross | $ | 8,512 |
| $ | 5,772 |
| $ | 5,889 |
| $ | 8,445 |
| $ | 8,512 |
| $ | 5,772 |
|
| |
| [1] | Amount recognized in 2018 represents an adjustment to Aetna U.S. group life and disability business reserves, net of reinsurance as of the acquisition date, upon finalization of the opening balance sheet. |
| |
| [2] | Prior incurral year development represents the change in estimated ultimate incurred losses and loss adjustment expenses for prior incurral years on a discounted basis. |
| |
[2]3] | Includes unallocated loss adjustment expenses of $111194, $100111 and $96100 for the years ended December 31, 20172018, 20162017 and 20152016, respectively, that are recorded in insurance operating costs and other expenses in the Condensed Consolidated Statements of Operations. |
| |
[3] | Represents Aetna U.S. group life and disability business reserves, net as of the acquisition date, subject to final purchase accounting. |
THE HARTFORD FINANCIAL SERVICES GROUP, INC.
NOTES TO CONSOLIDATED FINANCIAL STATMENTS (continued)
11. Reserve for Unpaid Losses and Loss Adjustment Expenses (continued)
Group Life, Disability and Accident Products Reserves, Net of Reinsurance, that are Discounted
|
| | | | | | | | | | | | | | | | | | |
| | For the years ended December 31, |
| | 2018 | 2017 | 2016 |
| Liability for unpaid losses and loss adjustment expenses, at undiscounted amounts | $ | 8,957 | | $ | 9,071 | | $ | 6,382 | |
| Less: amount of discount | 1,505 | | 1,536 | | 1,303 | |
| Carrying value of liability for unpaid losses and loss adjustment expenses | $ | 7,452 | | $ | 7,535 | | $ | 5,079 | |
| Weighted average discount rate | 3.4 | % | 3.5 | % | 4.3 | % |
| Range of discount rate | 2.1 | % | - | 8.0 | % | 2.1 | % | - | 8.0 | % | 3.0 | % | - | 8.0 | % |
|
| | | | | | | | | | | | | | | | | | |
| | For the years ended December 31, |
| | 2017 | 2016 | 2015 |
| Liability for unpaid losses and loss adjustment expenses, at undiscounted amounts | $ | 9,071 | | $ | 6,382 | | $ | 6,565 | |
| Less: amount of discount | 1,536 | | 1,303 | | 1,382 | |
| Carrying value of liability for unpaid losses and loss adjustment expenses | $ | 7,535 | | $ | 5,079 | | $ | 5,183 | |
| Weighted average discount rate | 3.5 | % | 4.3 | % | 4.4 | % |
| Range of discount rate | 2.1 | % | - | 8.0 | % | 3.0 | % | - | 8.0 | % | 3.0 | % | - | 8.0 | % |
Reserves are discounted at rates in effect at the time claims were incurred, ranging from2.1% for life and disability reserves acquired from Aetna based on interest rates in effect at the acquisition date of November 1, 2017, to 8.0%for the Company’s pre-acquisition reserves for incurral year 1990, and vary by product. Prior year's discount accretion has been calculated as the average reserve balance for the year times the weighted average discount rate. The decrease in the weighted average discount rate forfrom 2016 to 2017 was primarily due to the fact that reserves for the Aetna U.S. group life and disability business are discounted at market rates in effect as of the acquisition date.
Re-estimates of prior incurral years reserves in 2018 was driven by the following:
| |
| • | Group disability-Prior period reserve estimates decreased by approximately $230 largely driven by group long-term disability claim recoveries higher than prior reserve assumptions and, primarily for the 2017 incurral year, claim incidence lower than prior assumptions. Short-term disability also experienced favorable claim recoveries. |
| |
| • | Group life and accident (including group life premium waiver)-Prior period reserve estimates decreased by approximately $90 largely driven by lower-than-previously expected claim incidence inclusive of group life, group life premium waiver, and group accidental |
THE HARTFORD FINANCIAL SERVICES GROUP, INC.
NOTES TO CONSOLIDATED FINANCIAL STATEMENTS (continued)
death & dismemberment, principally for the 2017 incurral year.
Re-estimates of prior incurral years reserves in 2017 was driven by the following:
Group Disability-Prior period estimates decreased by approximately $125 driven by group long-term disability favorable claim incidence for incurral year 2016 and claim recoveries higher than prior reserve assumptions.
Group Life and Accident (including Group Life Premium Waiver)-Contributing to an approximately $60 decrease in prior period reserve estimates was favorable claim incidence on group life premium waiver for incurral year 2016.
| |
| • | Group disability- Prior period estimates decreased by approximately $125 driven by group long-term disability favorable claim incidence for incurral year 2016 and claim recoveries higher than prior reserve assumptions. |
| |
| • | Group life and accident (including group life premium waiver)-Contributing to an approximately $60 decrease in prior period reserve estimates was favorable claim incidence on group life premium waiver for incurral year 2016 |
Re-estimates of prior incurral years reserves in 2016 was driven by the following:
Group Disability-Prior period estimates decreased by approximately $90 largely driven by group long-term disability claim recoveries higher than prior reserve assumptions, particularly in the older incurral years. This favorability was partially offset by lower Social Security Disability approvals driven by lower approval rates and backlogs in the Social Security Administration. | |
| • | Group disability-Prior period estimates decreased by approximately $90largely driven by group long-term disability claim recoveries higher than prior reserve assumptions, particularly in the older incurral years. This favorability was partially offset by lower Social Security Disability approvals driven by lower approval rates and backlogs in the Social Security Administration. |
| |
| • | Group life and accident (including group life premium waiver-Contributing to an approximately $75 decrease in prior period reserve estimates was favorable claim incidence on group life premium waiver for incurral year 2015. |
Group Life and Accident (including Group Life Premium Waiver)-Contributing to an approximately $75 decrease in prior period reserve estimates was favorable claim incidence on group life premium waiver for incurral year 2015.
Re-estimates of prior incurral years reserves in 2015 was driven by the following:
Group Disability-Prior period estimates decreased by approximately $90 largely driven by updated assumptions related to the probability and timing of long-term disability claim recoveries, which were updated to reflect recent favorable trends. This favorability was partially offset bylower approval rates and backlogs in the Social Security Administration.
Group Life and Accident (including Group Life Premium Waiver-Prior period estimates decreased by approximately $50 largely driven by favorable claim incidence and recovery experience on group life premium waiver.
THE HARTFORD FINANCIAL SERVICES GROUP, INC.
NOTES TO CONSOLIDATED FINANCIAL STATMENTS (continued)
11. Reserve for Unpaid Losses and Loss Adjustment Expenses (continued)
Reconciliation of Loss Development to Liability for Unpaid Losses and Loss Adjustment Expenses as of December 31, 20172018
|
| | | | | | | | | | | | | | | | | | | | | | | | |
| | Losses and Allocated Loss Adjustment Expenses, Net of Reinsurance | | | Subtotal | | |
| Reserve Line | Cumulative Incurred for Incurral Years Displayed in Triangles | Cumulative Paid for Incurral Years Displayed in Triangles | Unpaid for Incurral Years not Displayed in Triangles | Unpaid Unallocated Loss Adjustment Expenses, Net of Reinsurance | Discount | Unpaid Losses and Loss Adjustment Expenses, Net of Reinsurance | Reinsurance and Other Recoverables | Liability for Unpaid Losses and Loss Adjustment Expenses |
| Group long-term disability | $ | 11,934 |
| $ | (6,217 | ) | $ | 2,243 |
| $ | 171 |
| $ | (1,364 | ) | $ | 6,767 |
| $ | 235 |
| $ | 7,002 |
|
| Group life and accident, excluding premium waiver | 5,820 |
| (5,367 | ) | 139 |
| 2 |
| (19 | ) | 575 |
| 2 |
| 577 |
|
| Group short-term disability | | | 113 |
| 5 |
| — |
| 118 |
| — |
| 118 |
|
| Group life premium waiver | | | 818 |
| 7 |
| (122 | ) | 703 |
| 2 |
| 705 |
|
| Group supplemental health | | | 43 |
| — |
| — |
| 43 |
| — |
| 43 |
|
| Total Group Benefits | $ | 17,754 |
| $ | (11,584 | ) | $ | 3,356 |
| $ | 185 |
| $ | (1,505 | ) | $ | 8,206 |
| $ | 239 |
| $ | 8,445 |
|
|
| | | | | | | | | | | | | | | | | | | | | | | | |
| | Losses and Allocated Loss Adjustment Expenses, Net of Reinsurance | | | Subtotal | | |
| Reserve Line | Cumulative Incurred for Incurral Years Displayed in Triangles | Cumulative Paid for Incurral Years Displayed in Triangles | Unpaid for Incurral Years not Displayed in Triangles | Unpaid Unallocated Loss Adjustment Expenses, Net of Reinsurance | Discount | Unpaid Losses and Loss Adjustment Expenses, Net of Reinsurance | Reinsurance and Other Recoverables | Liability for Unpaid Losses and Loss Adjustment Expenses |
| Group long-term disability | $ | 10,511 |
| $ | (5,138 | ) | $ | 2,651 |
| $ | 166 |
| $ | (1,383 | ) | $ | 6,807 |
| $ | 207 |
| $ | 7,014 |
|
| Group life and accident, excluding premium waiver | 5,839 |
| (5,350 | ) | 138 |
| 3 |
| (21 | ) | 609 |
| 1 |
| 610 |
|
| Group short-term disability | | | 99 |
| 5 |
| — |
| 104 |
| — |
| 104 |
|
| Group life premium waiver | | | 869 |
| 7 |
| (132 | ) | 744 |
| 1 |
| 745 |
|
| Group supplemental health | | | 39 |
| — |
| — |
| 39 |
| — |
| 39 |
|
| Total Group Benefits | $ | 16,350 |
| $ | (10,488 | ) | $ | 3,796 |
| $ | 181 |
| $ | (1,536 | ) | $ | 8,303 |
| $ | 209 |
| $ | 8,512 |
|
The following loss triangles present historical loss development for incurred and paid claims by the year the insured claim occurred, referred to as the incurral year. Triangles are limited to the number of years for which claims incurred typically remain outstanding. For group long-term disability, the Company has
provided seven incurral years of claims data as data for earlier periods was not available with respect to the U.S. group life and disability business acquired from Aetna. Short-tail lines, which represent claims generally expected to be paid within a few years, have three years of claim development displayed.
THE HARTFORD FINANCIAL SERVICES GROUP, INC.
NOTES TO CONSOLIDATED FINANCIAL STATEMENTS (continued)
Group Long-Term Disability
| | Undiscounted Incurred Losses & Allocated Loss Adjustment Expenses, Net of Reinsurance | | | For the years ended December 31, | | | For the years ended December 31, | |
| | (Unaudited) | | | | (Unaudited) | | |
Incurral Year | 2011 | 2012 | 2013 | 2014 | 2015 | 2016 | 2017 | IBNR Reserves | Claims Reported | 2011 | 2012 | 2013 | 2014 | 2015 | 2016 | 2017 | 2018 | IBNR Reserves | Claims Reported |
| 2011 | 1,917 |
| 1,761 |
| 1,660 |
| 1,659 |
| 1,669 |
| 1,660 |
| 1,649 |
| 1 |
| 39,149 |
| 1,917 |
| 1,761 |
| 1,660 |
| 1,659 |
| 1,669 |
| 1,660 |
| 1,649 |
| 1,638 |
| 1 |
| 39,097 |
|
| 2012 | | 1,829 |
| 1,605 |
| 1,539 |
| 1,532 |
| 1,530 |
| 1,515 |
| — |
| 37,438 |
| | 1,829 |
| 1,605 |
| 1,539 |
| 1,532 |
| 1,530 |
| 1,515 |
| 1,504 |
| 1 |
| 37,343 |
|
| 2013 | | 1,660 |
| 1,479 |
| 1,429 |
| 1,429 |
| 1,416 |
| 2 |
| 31,752 |
| | 1,660 |
| 1,479 |
| 1,429 |
| 1,429 |
| 1,416 |
| 1,413 |
| 1 |
| 31,755 |
|
| 2014 | | 1,636 |
| 1,473 |
| 1,430 |
| 1,431 |
| 2 |
| 32,936 |
| | 1,636 |
| 1,473 |
| 1,430 |
| 1,431 |
| 1,431 |
| 3 |
| 32,970 |
|
| 2015 | | 1,595 |
| 1,442 |
| 1,422 |
| 15 |
| 33,349 |
| | 1,595 |
| 1,442 |
| 1,422 |
| 1,420 |
| 5 |
| 33,541 |
|
| 2016 | | 1,651 |
| 1,481 |
| 38 |
| 33,413 |
| | 1,651 |
| 1,481 |
| 1,468 |
| 12 |
| 34,259 |
|
| 2017 | | 1,597 |
| 687 |
| 23,158 |
| | 1,597 |
| 1,413 |
| 36 |
| 31,135 |
|
| 2018 | | | 1,647 |
| 810 |
| 19,386 |
|
| Total | | $ | 10,511 |
| | | $ | 11,934 |
| |
|
| | | | | | | | | | | | | | | | | |
| Cumulative Paid Losses & Allocated Loss Adjustment Expenses, Net of Reinsurance |
| | | For the years ended December 31, |
| | | (Unaudited) | |
| Incurral Year | 2011 | 2012 | 2013 | 2014 | 2015 | 2016 | 2017 | 2018 |
| 2011 | 118 |
| 508 |
| 743 |
| 886 |
| 996 |
| 1,087 |
| 1,167 |
| 1,231 |
|
| 2012 | | 108 |
| 483 |
| 708 |
| 835 |
| 933 |
| 1,014 |
| 1,080 |
|
| 2013 | | | 102 |
| 443 |
| 664 |
| 791 |
| 881 |
| 954 |
|
| 2014 | | | | 103 |
| 448 |
| 675 |
| 801 |
| 884 |
|
| 2015 | | | | | 108 |
| 460 |
| 687 |
| 806 |
|
| 2016 | | | | | | 112 |
| 479 |
| 705 |
|
| 2017 | | | | | | | 109 |
| 452 |
|
| 2018 | | | | | | | | 105 |
|
| Total | | | | | | | | $ | 6,217 |
|
THE HARTFORD FINANCIAL SERVICES GROUP, INC.
NOTES TO CONSOLIDATED FINANCIAL STATMENTSSTATEMENTS (continued)
11. Reserve for Unpaid Losses and Loss Adjustment Expenses (continued)
|
| | | | | | | | | | | | | | | |
| Cumulative Paid Losses & Allocated Loss Adjustment Expenses, Net of Reinsurance |
| | For the years ended December 31, |
| | (Unaudited) | |
| Incurral Year | 2011 | 2012 | 2013 | 2014 | 2015 | 2016 | 2017 |
| 2011 | 118 |
| 508 |
| 743 |
| 886 |
| 996 |
| 1,087 |
| 1,167 |
|
| 2012 | | 108 |
| 483 |
| 708 |
| 835 |
| 933 |
| 1,014 |
|
| 2013 | | | 102 |
| 443 |
| 664 |
| 791 |
| 881 |
|
| 2014 | | | | 103 |
| 448 |
| 675 |
| 801 |
|
| 2015 | | | | | 108 |
| 460 |
| 687 |
|
| 2016 | | | | | | 112 |
| 479 |
|
| 2017 | | | | | | | 109 |
|
| Total | | | | | | | $ | 5,138 |
|
Group Life and Accident, excluding Premium Waiver
| | Undiscounted Incurred Losses & Allocated Loss Adjustment Expenses, Net of Reinsurance | | | For the years ended December 31, | | | For the years ended December 31, | | |
| | (Unaudited) | | | (Unaudited) | | | |
| Incurral Year | 2015 | 2016 | 2017 | IBNR Reserves | Claims Reported | 2016 | 2017 | 2018 | IBNR Reserves | Claims Reported |
| 2015 | $ | 1,983 |
| $ | 1,919 |
| $ | 1,921 |
| $ | 8 |
| 47,954 |
| |
| 2016 | | 1,974 |
| 1,919 |
| 23 |
| 44,762 |
| $ | 1,974 |
| $ | 1,919 |
| $ | 1,915 |
| $ | 5 |
| 45,206 |
|
| 2017 | | 1,999 |
| 401 |
| 35,592 |
| | 1,999 |
| 1,953 |
| 20 |
| 44,539 |
|
| 2018 | | | 1,952 |
| 376 |
| 41,876 |
|
| Total | | $ | 5,839 |
| | | | $ | 5,820 |
| | |
|
| | | | | | | | | |
| Cumulative Paid Losses & Allocated Loss Adjustment Expenses, Net of Reinsurance |
| | For the years ended December 31, |
| | (Unaudited) | |
| Incurral Year | 2016 | 2017 | 2018 |
| 2016 | $ | 1,529 |
| $ | 1,888 |
| $ | 1,906 |
|
| 2017 | | 1,551 |
| 1,929 |
|
| 2018 | | | 1,532 |
|
| Total | | | $ | 5,367 |
|
|
| | | | | | | | | |
| Cumulative Paid Losses & Allocated Loss Adjustment Expenses, Net of Reinsurance |
| | For the years ended December 31, |
| | (Unaudited) | |
| Incurral Year | 2015 | 2016 | 2017 |
| 2015 | $ | 1,541 |
| $ | 1,889 |
| $ | 1,911 |
|
| 2016 | | 1,529 |
| 1,888 |
|
| 2017 | | | 1,551 |
|
| Total | | | $ | 5,350 |
|
Group life, disability and accident reserves, including IBNR
The majority of Group Benefits’ reserves are for long-term disability ("LTD") claimants who are known to be disabled and are
currently receiving benefits. A Disabled Life Reserve ("DLR") is calculated for each LTD claim. The DLR for each claim is the expected present value of all estimated future benefit payments and includes estimates of claim recovery, investment yield, and offsets from other income, including offsets from Social Security benefits and workers’ compensation. Estimated future benefit payments represent the monthly income benefit that is paid until recovery, death or expiration of benefits. Claim recoveries are estimated based on claim characteristics such as age and diagnosis and represent an estimate of benefits that will terminate, generally as a result of the claimant returning to work or being deemed able to return to work. The DLR also includes a liability for payments to claimants who have not yet been approved for LTD either because they have not yet satisfied the waiting (or elimination) period or because the approval or denial decision has not yet been made. In these cases, the present value of future benefits is reduced for the likelihood of claim denial based on Company experience. For claims recently closed due to
recovery, a portion of the DLR is retained for the possibility that the claim reopens upon further evidence of disability. In addition, a reserve for estimated unpaid claim expenses is included in the DLR.
For incurral years with IBNR claims, estimates of ultimate losses are made by applying completion factors to the dollar amount of claims reported or expected depending on the market segment. IBNR represents estimated ultimate losses less both DLR and cumulative paid amounts for all reported claims. Completion factors are derived using standard actuarial techniques using triangles that display historical claim count emergence by incurral month. These estimates are reviewed for reasonableness and are adjusted for current trends and other factors expected to cause a change in claim emergence. The IBNR includes an estimate of unpaid claim expenses, including a provision for the cost of initial set-up of the claim once reported.
For all products, including LTD, there is a period generally ranging from two to twelve months, depending on the product and market segment, where emerged claim information for an incurral year is not yet credible enough to be a basis for an IBNR projection. In
THE HARTFORD FINANCIAL SERVICES GROUP, INC.
NOTES TO CONSOLIDATED FINANCIAL STATMENTS (continued)
11. Reserve for Unpaid Losses and Loss Adjustment Expenses (continued)
these cases, the ultimate losses and allocated loss adjustment expenses are estimated using earned premium multiplied by an expected loss ratio.
The Company also records reserves for future death benefits under group term life policies that provide for premiums to be waived in the event the insured has a permanent and total disablementis unable to work due to disability and has satisfied an elimination period, which is typically nine months ("premium waiver reserves"). The death benefit reserve for these group life premium waiver claims is estimated for a known disabled claimant equal to the present value of expected future cash outflows (typically a lump sum face amount payable at death plus claim expenses) with separate estimates for claimant recovery (when no death benefit is payable) and for death before recovery or benefit expiry (when death benefit is payable). The IBNR for premium waiver death benefits is estimated with standard actuarial development methods.
In addition, the Company also records reserves for group term life, accidental death & dismemberment, short term disability, and other group products that have short claim payout periods. For these products, reserves are determined using paid or reported actuarial development methods. The resulting claim triangles produce a completion pattern and estimate of ultimate loss. IBNR for these lines of business equals the estimated ultimate losses and loss adjustment expenses less the amount of paid or reported claims depending on whether the paid or reported development method was used. Estimates are reviewed for reasonableness and are adjusted for current trends or other factors that affect the development pattern.
Cumulative number of reported claims
For group life, disability and accident coverages, claim counts include claims that are approved, pending approval and terminated and exclude denied claims. Due to the nature of the claims, one claimant represents one event.
|
| | | | | | | | | | | | | | |
| Average Annual Percentage Payout of Incurred Claims by Age, Net of Reinsurance |
| | (Unaudited) |
| | 1st Year | 2nd Year | 3rd Year | 4th Year | 5th Year | 6th Year | 7th Year |
| Group long-term disability | 7.2 | % | 24.4 | % | 15.3 | % | 8.7 | % | 6.5 | % | 5.4 | % | 4.8 | % |
| Group life and accident, excluding premium waiver | 79.2 | % | 18.4 | % | 1.1 | % | | | | |
THE HARTFORD FINANCIAL SERVICES GROUP, INC.
NOTES TO CONSOLIDATED FINANCIAL STATMENTSSTATEMENTS (continued)
|
| | | | | | | | | | | | | | | | |
| Average Annual Percentage Payout of Incurred Claims by Age, Net of Reinsurance |
| | (Unaudited) |
| | 1st Year | 2nd Year | 3rd Year | 4th Year | 5th Year | 6th Year | 7th Year | 8th Year |
| Group long-term disability | 7.3 | % | 24.4 | % | 15.4 | % | 8.7 | % | 6.3 | % | 5.4 | % | 4.6 | % | 3.9 | % |
| Group life and accident, excluding premium waiver | 79.3 | % | 19.0 | % | 0.9 | % | | | | | |
12. Reserve for Future Policy Benefits
RESERVE FOR FUTURE POLICY BENEFITS
| | Changes in Reserves for Future Policy Benefits [1] | Changes in Reserves for Future Policy Benefits [1] | Changes in Reserves for Future Policy Benefits [1] |
| Liability balance as of January 1, 2017 | $ | 322 |
| |
| Acquired [2] | 346 |
| |
| Liability Balance, as of January 1, 2018 | | $ | 713 |
|
| Incurred | 86 |
| 72 |
|
| Paid | (50 | ) | (101 | ) |
| Change in unrealized investment gains and losses | 9 |
| (42 | ) |
| Liability balance as of December 31, 2017 | $ | 713 |
| |
| Reinsurance recoverable asset, as of January 1, 2017 | $ | 28 |
| |
| Liability Balance, as of December 31, 2018 | | $ | 642 |
|
| Reinsurance recoverable asset, as of January 1, 2018 | | $ | 26 |
|
| Incurred | (1 | ) | 1 |
|
| Paid | (1 | ) | — |
|
| Reinsurance recoverable asset, as of December 31, 2017 | $ | 26 |
| |
| Reinsurance recoverable asset, as of December 31, 2018 | | $ | 27 |
|
| | | Liability balance as of January 1, 2016 | $ | 492 |
| |
| Liability Balance, as of January 1, 2017 | | $ | 322 |
|
| Acquired [2] | | 346 |
|
| Incurred | (139 | ) | 86 |
|
| Paid | (45 | ) | (50 | ) |
| Change in unrealized investment gains and losses | 14 |
| 9 |
|
| Liability balance as of December 31, 2016 | $ | 322 |
| |
| Reinsurance recoverable asset, as of January 1, 2016 | $ | 27 |
| |
| Liability Balance, as of December 31, 2017 | | $ | 713 |
|
| Reinsurance recoverable asset, as of January 1, 2017 | | $ | 28 |
|
| Incurred | 1 |
| (1 | ) |
| Paid | — |
| (1 | ) |
| Reinsurance recoverable asset, as of December 31, 2016 | $ | 28 |
| |
| Reinsurance recoverable asset, as of December 31, 2017 | | $ | 26 |
|
| |
| [1] | Reserves for future policy benefits includes paid-up life insurance and whole-life policies resulting from conversion from group life policies included within the Group Benefits segment and reserves for run-off structured settlement and terminal funding agreement liabilities retained which are in the Corporate category. |
| |
| [2] | Represents reserves, net, related to the U.S. group life and disability business acquired from Aetna, as of the acquisition date. For additional information. see Note 2 - Business Acquisitions of Notes to Consolidated Financial Statements. |
THE HARTFORD FINANCIAL SERVICES GROUP, INC.
NOTES TO CONSOLIDATED FINANCIAL STATEMENTS (continued)
13. Debt
DEBT
The Company’s long-term debt securities are issued by HFSG Holding Company, and are unsecured obligations of HFSG Holding Company, and rank on a parity with all other unsecured and unsubordinated indebtedness of HFSG Holding Company. Debt issued by HLI with a carrying amount of $142 is included in liabilities held for sale in the accompanying consolidated balance sheets and, therefore, is not included in the table below.
Debt is carried net of discount and issuance cost.
Interest expense on debt is included in the corporate category for segment reporting.
THE HARTFORD FINANCIAL SERVICES GROUP, INC.
NOTES TO CONSOLIDATED FINANCIAL STATEMENTS (continued)
Short-term and Long-term Debt by Issuance |
| | | | | | |
| | As of December 31, |
| | 2018 | 2017 |
| Revolving Credit Facilities | $ | — |
| $ | — |
|
| Senior Notes and Debentures | |
| |
|
| 6.3% Notes, due 2018 | — |
| 320 |
|
| 6.0% Notes, due 2019 | 413 |
| 413 |
|
| 5.5% Notes, due 2020 | 500 |
| 500 |
|
| 5.125% Notes, due 2022 | 800 |
| 800 |
|
| 5.95% Notes, due 2036 | 300 |
| 300 |
|
| 6.625% Notes, due 2040 | 295 |
| 295 |
|
| 6.1% Notes, due 2041 | 409 |
| 409 |
|
| 6.625% Notes, due 2042 | 178 |
| 178 |
|
| 4.4% Notes, due 2048 | 500 |
| — |
|
| 4.3% Notes, due 2043 | 300 |
| 300 |
|
| Junior Subordinated Debentures | |
| |
|
| 7.875% Notes, due 2042 | 600 |
| 600 |
|
| 3 month Libor + 2.125% Notes, due 2067 [1] | 500 |
| 500 |
|
| 8.125% Notes, due 2068 | — |
| 500 |
|
| Total Notes and Debentures | 4,795 |
| 5,115 |
|
| Unamortized discount and debt issuance cost [2] | (117 | ) | (117 | ) |
| Total Debt | 4,678 |
| 4,998 |
|
| Less: Current maturities | 413 |
| 320 |
|
| Long-Term Debt | $ | 4,265 |
| $ | 4,678 |
|
|
| | | | | | |
| | As of December 31, |
| | 2017 | 2016 |
| Revolving Credit Facilities | $ | — |
| $ | — |
|
| Senior Notes and Debentures | |
| |
|
| 5.375% Notes, due 2017 | — |
| 416 |
|
| 6.3% Notes, due 2018 | 320 |
| 320 |
|
| 6.0% Notes, due 2019 | 413 |
| 413 |
|
| 5.5% Notes, due 2020 | 500 |
| 500 |
|
| 5.125% Notes, due 2022 | 800 |
| 800 |
|
| 5.95% Notes, due 2036 | 300 |
| 300 |
|
| 6.625% Notes, due 2040 | 295 |
| 295 |
|
| 6.1% Notes, due 2041 | 409 |
| 409 |
|
| 6.625% Notes, due 2042 | 178 |
| 178 |
|
| 4.3% Notes, due 2043 | 300 |
| 300 |
|
| Junior Subordinated Debentures | |
| |
|
| 7.875% Notes, due 2042 | 600 |
| 600 |
|
| 3 month Libor + 2.125% Notes, due 2067 [1] | 500 |
| — |
|
| 8.125% Notes, due 2068 | 500 |
| 500 |
|
| Total Notes and Debentures | 5,115 |
| 5,031 |
|
| Unamortized discount and debt issuance cost [2] | (117 | ) | (122 | ) |
| Total Debt | 4,998 |
| 4,909 |
|
| Less: Current maturities | 320 |
| 416 |
|
| Long-Term Debt | $ | 4,678 |
| $ | 4,493 |
|
| |
| [1] | In April 2017, the Company entered into an interest rate swap agreement expiring February 15, 2027 to effectively convert the variable interest payments for this debenture into fixed interest payments of approximately 4.39%. |
| |
| [2] | The amount primarily consists of $78 and $79 and $83 as of December 31, 20172018 and 20162017, respectively, on the 6.1% Notes, due 2041. |
The effective interest rate on the 6.1% senior notes due 2041 is 7.9%. The effective interest rate on the remaining notes does not differ materially from the stated rate. The Company incurred interest expense of $298, $316 $327 and $346$327 on debt for the years ended December 31, 2018, 2017 and 2016, and 2015, respectively.
Senior Notes
On March 15, 2017, the Company repaid its $416, 5.375%2018, The Hartford issued $500 of 4.4% senior notes ("4.4% Notes") due March 15, 2048 for net proceeds of approximately $490, after deducting underwriting discounts and expenses from the offering. Interest is payable semi-annually in arrears on March 15 and September 15, commencing September 15, 2018. The Hartford, at its option, can redeem the 4.4% Notes at any time, in whole or in part, at a redemption price equal to the greater of 100% of the principal amount being redeemed or a make-whole amount based on a comparable maturity US Treasury plus 25 basis points, plus any accrued and unpaid interest, except the option of a make-whole payment is not applicable within the final six months before maturity.
On March 15, 2018, The Hartford repaid at maturity the $320 principal amount of its 6.3% senior notes.
Junior Subordinated Debentures
Junior Subordinated Debentures by Issuance | | | Issue | 7.875% Debentures | 8.125% Debentures [3] | 3 Month Libor + 2.125% | 7.875% Debentures | 3 Month Libor + 2.125% |
| Face Value | $ | 600 | | $ | 500 | | $ | 500 | | $ | 600 | | $ | 500 | |
| Interest Rate [1] | 7.875 | % | [2] | 8.125 | % | [4] | N/A | [5] | 7.875 | % | [2] | N/A | [3] |
| Call Date | April 15, 2022 | | June 15, 2018 | | February 15, 2017 | [6] |
| April 15, 2022 | February 15, 2022 | [4] |
| Interest Rate Subsequent to Call Date [2] | 3 Month Libor + 5.596% | | 3 Month Libor + 4.6025% | | 3 Month Libor + 2.125% | [7] | 3 Month Libor + 5.596% | 3 Month Libor + 2.125% | [5] |
| Final Maturity | April 15, 2042 | | June 15, 2068 | | February 12, 2067 | | April 15, 2042 | February 12, 2067 |
| |
| [1] | Interest rate in effect until call date. |
| |
| [2] | Payable quarterly in arrears. |
| |
| [3] | The 8.125% debentures have a scheduled maturity date of June 15, 2038.
|
| |
[4] | Payable semi-annually in arrears. |
| |
[5] | Debentures were issued on call date. |
| |
[6]4] | ReflectsThe original call date:date was February 15, 2017. Replacement Capital Covenant associated with the debenture prohibits the Company from redeeming all or any portion of the notes on or prior to February 15, 2022. |
| |
[7]5] | In April, 2017 the company entered into an interest rate swap agreement expiring February 15, 2027 to effectively convert the interest payments for the 3 month Libor + 2.125% debenture into fixed interest payments of approximately 4.39%. |
The debentures are unsecured, subordinated and junior in right of payment and upon liquidation to all of the Company’s existing and future senior indebtedness. In addition, the debentures are effectively subordinated to all of the Company’s subsidiaries’ existing and future indebtedness and other liabilities, including obligations to policyholders. The debentures do not limit the Company’s or the Company’s subsidiaries’ ability to incur additional debt, including debt that ranks senior in right of payment and upon liquidation to the debentures.
The Company has the right to defer interest payments for up to a consecutive ten consecutive years without giving rise to an event of default. Deferred interest will continue to accrue and will accrue additional interest at the then applicable interest rate. If the Company defers interest payments, the Company generally may not make payments on or redeem or purchase any shares of its capital stock or any of its debt securities or guarantees that rank upon liquidation, dissolution or winding up equally with or junior to the debentures, subject to certain limited exceptions. If
On June 15, 2018, The Hartford redeemed $500 aggregate principal amount of its 8.125% Fixed-to-Floating Rate Junior Subordinated Debentures due 2068. During the initial offering of the 8.125% debentures, the Company defers interest onentered into a replacement capital covenant ("RCC"), and under the terms of the RCC, if the Company redeemed the 8.125% and 3 month Libor plus 2.125% debentures for five consecutive years or, if earlier, pays current interest during a deferral period,at any time prior to June 15, 2048 it could only do so with the Company will be required to pay deferred interest from proceeds from the sale of certain qualifying replacement securities. The 3 month Libor plus 2.125% debentures issued February 15, 2017 are qualifying replacement securities within the definition of RCC. In connection with this redemption, the Company recognized a $6 loss on extinguishment of debt for unamortized deferred debt issuance costs.
The 7.875% , 8.125% and 3 month Libor plus 2.125% debentures may be redeemed in whole prior to the call date upon certain tax or rating agency events, at a price equal to the greater of 100% of the principal amount being redeemed and the applicable make-whole amount plus any accrued and unpaid interest. The Company may elect to redeem the 8.125% debentures in whole or part at its option prior to the call date at a price equal to the greater of 100% of the principal amount being redeemed and the
THE HARTFORD FINANCIAL SERVICES GROUP, INC.
NOTES TO CONSOLIDATED FINANCIAL STATEMENTS (continued)
13. Debt (continued)
applicable make-whole amount plus any accrued and unpaid interest. The Company may elect to redeem the 7.875% , 8.125% and 3 month Libor plus 2.125% debentures in whole or in part on or after the call date for the principal amount being redeemed plus accrued and unpaid interest to the date of redemption.
In connection with the offering of the 8.125% debentures, the Company entered into a replacement capital covenant ("RCC") for the benefit of holders of one or more designated series of the Company's indebtedness, initially the Company’s 6.1% notes due 2041. Under the terms of the RCC, if the Company redeems the 8.125% debentures at any time prior to June 15, 2048 it can only do so with the proceeds from the sale of certain qualifying replacement securities. On February 7, 2017, the Company executed an amendment to the RCC to lengthen the amount of time the Company has to issue qualifying replacement securities prior to the redemption of the 8.125% debentures and to amend the definition of certain qualifying replacement securities. The 3 month Libor plus 2.125% debentures are qualifying replacement securities within the definition of the RCC, as amended.
In connection with the offering of the three month LIBOR plus 2.125% debenture, the Company entered into a RCC for the benefit of holders of one or more designated series of the Company's indebtedness, initially the Company's 4.3% notes due 2043. Under the terms of the RCC, if the Company redeems the debenture any time prior to February 12, 2047 (or such earlier date on which the RCC terminates by its terms) it can only do so with the proceeds from the sale of certain qualifying replacement securities. The RCC also prohibits the Company from redeeming all or any portion of the notes on or prior to February 15, 2022.
In April, 2017 the company entered into an interest rate swap agreement expiring February 15, 2027 to effectively convert the variable interest payments for the 3 month Libor plus 2.125% debenture into fixed interest payments of approximately 4.39%.
Long-Term Debt
Long-term Debt Maturities (at par value) as ofDecember 31, 20172018
|
| | | |
| 2019 - Current maturities | $ | 413 |
|
| 2020 | $ | 500 |
|
| 2021 | $ | — |
|
| 2022 | $ | 800 |
|
| 2023 | $ | — |
|
| Thereafter | $ | 3,082 |
|
|
| | | |
| 2018 - Current maturities | $ | 320 |
|
| 2019 | $ | 413 |
|
| 2020 | $ | 500 |
|
| 2021 | $ | — |
|
| 2022 | $ | 800 |
|
| Thereafter | $ | 3,082 |
|
Shelf Registrations
On July 29, 2016, the Company filed with the Securities and Exchange Commission (the “SEC”) an automatic shelf registration statement (Registration No. 333-212778) for the potential offering and sale of debt and equity securities. The registration statement allows for the following types of securities to be offered: debt securities, junior subordinated debt securities, preferred stock, common stock, depositary shares, warrants, stock purchase contracts, and stock purchase units. In that The Hartford is a well-known seasoned issuer, as defined in Rule 405 under the Securities Act of 1933, the registration statement went
effective immediately upon filing and The Hartford may offer and sell an unlimited amount of securities under the registration statement during the three-year life of the registration statement.
Contingent Capital FacilityRevolving Credit Facilities
On March 29, 2018, the Company entered into an amendment (the "Amendment") to its Five-Year Credit Agreement dated October 31, 2014. The HartfordAmendment reset the level of the Company's minimum consolidated net worth financial covenant to $9 billion, excluding AOCI, from its former $13.5 billion (where net worth was party to a put optiondefined as stockholders' equity excluding AOCI and including junior subordinated debt), among other updates. Among other changes, under an amended and restated credit agreement that provided The Hartford withbecame effective in June 2018 after the rightclosing of the sale of the Company's life and annuity business, the aggregate
amount of principal of the credit facility decreased from $1 billion to require the Glen Meadow ABC Trust,$750, including a Delaware statutory trust, at any time and from time to time, to purchase The Hartford's junior subordinated notes in a maximum aggregate principal amount not to exceed $500. On February 8, 2017, The Hartford exercised the put option resulting in the issuance of $500 in junior subordinated notes with proceeds received on February 15, 2017. Under the Put Option Agreement, The Hartford had been paying the Glen Meadow ABC Trust premiums on a periodic basis, calculated with respectreduction to the aggregate principal amount available for letters of notes that The Hartford hadcredit from $250 to $100, the rightmaturity date was extended to put toMarch 29, 2023, and the Glen Meadow ABC Trust for such period. The Hartford agreed to reimburseliens covenant and certain other covenants were modified.
Revolving loans from the Glen Meadow ABC Trust for certain fees and ordinary expenses. Up until the Company exercised the put option, the Company held a variable interestCredit Facility may be in the Glen Meadow ABC Trust where the Company was not the primary beneficiary. As a result, the Company did not consolidate the Glen Meadow ABC Trust.
The junior subordinated notes have a scheduled maturity of February 12, 2047, and a final maturity of February 12, 2067. As noted in the table above, the Company is required to use reasonable efforts to sell certain qualifying replacement securities in order to repay the debentures at the scheduled maturity date. The junior subordinated notesmultiple currencies. U.S. dollar loans will bear interest at a floating rate equivalent to an annualindexed rate depending on the type of three-month LIBOR plus 2.125%, payable quarterly,borrowing and are unsecured, subordinated indebtednessa basis point spread based on The Hartford's credit rating and will mature no later than March 29, 2023. Letters of credit issued from the Credit Facility bear a fee based on The Hartford.Hartford's credit rating and expire no later than March 29, 2024. The Credit Facility requires the Company to maintain a minimum consolidated net worth, excluding AOCI, of $9 billion, limit the ratio of senior debt to capitalization, excluding AOCI, at 35% and meet other customary covenants. The Credit Facility is for general corporate purposes.
Revolving Credit Facilities
The Company has a senior unsecured five-year revolving credit facility (the “Credit Facility”) that provides for borrowing capacity up to $1 billion of unsecured credit through October 31, 2019 available in U.S. dollars, Euro, Sterling, Canadian dollars and Japanese Yen. As of December 31, 2017,2018, no borrowings were outstanding, $3 in letters of credit were issued under the Credit Facility. As of December 31, 2017,Facility and the Company was in compliance with all financial covenants within the Credit Facility.
Commercial Paper
The Hartford’sAs of December 31, 2018, the Hartford's maximum borrowings available under its commercial paper program are $1 billion.was $750 and there was no commercial paper outstanding. The Company is dependent upon market conditions to access short-term financing through the issuance of commercial paper to investors. AsOn July 19, 2018, the Board of December 31, 2017, there was noDirectors revised the Company's commercial paper outstanding.issuance authorization from $1 billion to $750 to align the program with the Company's $750 five year revolving credit facility which became effective on June 11, 2018.
Collateralized Advances with Federal Home Loan Bank of Boston
In August 2018, the Company’s subsidiaries, Hartford Fire Insurance Company (“Hartford Fire”) and Hartford Life and Accident Insurance Company (“HLA”), became members of the Federal Home Loan Bank of Boston (“FHLBB”). Membership allows these subsidiaries access to collateralized advances, which may be short- or long-term with fixed or variable rates. FHLBB membership required the purchase of member stock and requires additional member stock ownership of 3% or 4% of any amount borrowed. Acceptable forms of collateral include real estate backed fixed maturities and mortgage loans and the amount of advances that can be taken is limited to a percentage of the fair value of the assets that ranges from a high of 97% for US government-backed fixed maturities maturing within 3 years to a low of 40% for A-rated commercial mortgage-backed fixed maturities maturing in 5 years or more. In its consolidated balance sheets, The Hartford would present the liability for advances taken based on use of the funds with advances for general corporate purposes presented in short- or long-term debt and advances to earn incremental investment income presented in other liabilities, consistent with other collateralized financing transactions such as securities lending and repurchase agreements. The Connecticut Department of Insurance (“CTDOI”) permits Hartford Fire and HLA to pledge up to $1.1 billion and $0.6 billion in qualifying assets, respectively, without prior approval, to secure FHLBB advances in 2019. The pledge
THE HARTFORD FINANCIAL SERVICES GROUP, INC.
NOTES TO CONSOLIDATED FINANCIAL STATEMENTS (continued)
14. Commitments and Contingencies
limit is determined annually based on statutory admitted assets and capital and surplus of Hartford Fire and HLA, respectively. As of December 31, 2018, there were no advances outstanding under the FHLBB facility.
14. COMMITMENTS AND CONTINGENCIES
Management evaluates each contingent matter separately. A loss is recorded if probable and reasonably estimable. Management establishes liabilities for these contingencies at its “best estimate,” or, if no one number within the range of possible losses is more probable than any other, the Company records an estimated liability at the low end of the range of losses.
Litigation
The Hartford is involved in claims litigation arising in the ordinary course of business, both as a liability insurer defending or providing indemnity for third-party claims brought against insureds and as an insurer defending coverage claims brought against it. The Hartford accounts for such activity through the establishment of unpaid loss and loss adjustment expense reserves. Subject to the uncertainties in the following discussion under the caption “Asbestos and Environmental Claims,” management expects that the ultimate liability, if any, with respect to such ordinary-course claims litigation, after consideration of provisions made for potential losses and costs of defense, will not be material to the consolidated financial condition, results of operations or cash flows of The Hartford.
The Hartford is also involved in other kinds of legal actions, some of which assert claims for substantial amounts. These actions include, among others, and in addition to the matters in the following discussion, putative state and federal class actions seeking certification of a state or national class. Such putative class actions have alleged, for example, underpayment of claims or improper underwriting practices in connection with various kinds of insurance policies, such as personal and commercial automobile, property, disability, life and inland marine. The Hartford also is involved in individual actions in which punitive damages are sought, such as claims alleging bad faith in the handling of insurance claims or other allegedly unfair or improper business practices. Like many other insurers, The Hartford also has been joined in actions by asbestos plaintiffs asserting, among other things, that insurers had a duty to protect the public from the dangers of asbestos and that insurers committed unfair trade practices by asserting defenses on behalf of their policyholders in the underlying asbestos cases. Management expects that the ultimate liability, if any, with respect to such lawsuits, after consideration of provisions made for estimated losses, will not be material to the consolidated financial condition of The Hartford. Nonetheless, given the large or indeterminate amounts sought in certain of these actions, and the inherent unpredictability of litigation, the outcome in certain matters could, from time to time, have a material adverse effect on the Company's results of operations or cash flows in particular quarterly or annual periods.
In addition to the inherent difficulty of predicting litigation outcomes, the Mutual Funds Litigation identified below purports to seek substantial damages for unsubstantiated conduct spanning a multi-year period based on novel applications of complex legal theories. The alleged damages are not quantified or factually supported in the complaint, and, in any event, the Company's experience shows that demands for damages often bear little relation to a reasonable estimate of potential loss. The application of the legal standard identified by the court for assessing the potentially available damages, as described below, is inherently unpredictable, and no legal precedent has been
identified that would aid in determining a reasonable estimate of potential loss. Accordingly, management cannot reasonably estimate the possible loss or range of loss, if any.
Mutual Funds Litigation
In February 2011, a derivative action was brought on behalf of six Hartford retail mutual funds in the United States District Court for the District of New Jersey, alleging that Hartford Investment Financial Services, LLC (“HIFSCO”), an indirect subsidiary of the Company, received excessive advisory and distribution fees in violation of its statutory fiduciary duty under Section 36(b) of the Investment Company Act of 1940. During the course of the litigation, the claims regarding distribution fees were dismissed without prejudice, the lineup of funds as plaintiffs changed several times, and the plaintiffs added as a defendant Hartford Funds Management Company(“HFMC”), an indirect subsidiary of the Company that assumed the role of advisor to the funds as of January 2013. In June 2015, HFMC and HIFSCO moved for summary judgment, and plaintiffs cross-moved for partial summary judgment with respect to one fund. In March 2016, the court denied the plaintiff's motion, and granted summary judgment for HIFSCO and HFMC with respect to one fund, leaving six funds as plaintiffs: The Hartford Balanced Fund, The Hartford Capital Appreciation Fund, The Hartford Floating Rate Fund, The Hartford Growth Opportunities Fund, The Hartford Healthcare Fund, and The Hartford Inflation Plus Fund. The court further ruled that the appropriate measure of damages on the surviving claims would be the difference, if any, between the actual advisory fees paid through trial and the fees permitted under the applicable legal standard. A bench trial on the issue of liability was held in November 2016. In February 2017, the court granted judgment for HIFSCO and HFMC as to all claims. Plaintiffs have appealed to the United State Court of Appeals for the Third Circuit.
Asbestos and Environmental Claims
The Company continues to receive asbestos and environmental claims. Asbestos claims relate primarily to bodily injuries asserted by people who came in contact with asbestos or products containing asbestos. Environmental claims relate primarily to pollution and related clean-up costs.
The Company wrote several different categories of insurance contracts that may cover asbestos and environmental claims. First, the Company wrote primary policies providing the first layer of coverage in an insured’s liability program. Second, the Company wrote excess and umbrella policies providing higher layers of coverage for losses that exhaust the limits of underlying coverage. Third, the Company acted as a reinsurer assuming a portion of those risks assumed by other insurers writing primary, excess, umbrella and reinsurance coverages. Fourth, subsidiaries of the Company participated in the London Market, writing both direct insurance and assumed reinsurance business.
Significant uncertainty limits the ability of insurers and reinsurers to estimate the ultimate reserves necessary for unpaid gross losses and expenses related to environmental and particularly asbestos claims. The degree of variability of gross reserve estimates for these exposures is significantly greater than for other more traditional exposures.
THE HARTFORD FINANCIAL SERVICES GROUP, INC.
NOTES TO CONSOLIDATED FINANCIAL STATEMENTS (continued)
14. Commitments and Contingencies (continued)
In the case of the reserves for asbestos exposures, factors contributing to the high degree of uncertainty include inadequate loss development patterns, plaintiffs’ expanding theories of liability, the risks inherent in major litigation, and inconsistent emerging legal doctrines. Furthermore, over time, insurers, including the Company, have experienced significant changes in the rate at which asbestos claims are brought, the claims experience of particular insureds, and the value of claims, making predictions of future exposure from past experience uncertain. Plaintiffs and insureds also have sought to use bankruptcy proceedings, including “pre-packaged” bankruptcies, to accelerate and increase loss payments by insurers. In addition, some policyholders have asserted new classes of claims for coverages to which an aggregate limit of liability may not apply. Further uncertainties include insolvencies of other carriers and unanticipated developments pertaining to the Company’s ability to recover reinsurance for asbestos and environmental claims. Management believes these issues are not likely to be resolved in the near future.
In the case of the reserves for environmental exposures, factors contributing to the high degree of uncertainty include expanding theories of liability and damages, the risks inherent in major litigation, inconsistent decisions concerning the existence and scope of coverage for environmental claims, and uncertainty as to the monetary amount being sought by the claimant from the insured.
The reporting pattern for assumed reinsurance claims, including those related to asbestos and environmental claims, is much longer than for direct claims. In many instances, it takes months or years to determine that the policyholder’s own obligations have been met and how the reinsurance in question may apply to such claims. The delay in reporting reinsurance claims and exposures adds to the uncertainty of estimating the related reserves.
THE HARTFORD FINANCIAL SERVICES GROUP, INC.
NOTES TO CONSOLIDATED FINANCIAL STATEMENTS (continued)
It is also not possible to predict changes in the legal and legislative environment and their effect on the future development of asbestos and environmental claims.
Given the factors described above, the Company believes the actuarial tools and other techniques it employs to estimate the ultimate cost of claims for more traditional kinds of insurance exposure are less precise in estimating reserves for asbestos and environmental exposures. For this reason, thethe Company principally relies on exposure-based analysis to estimate the ultimate costs of these claims, both gross and net of reinsurance, and regularly evaluates new account information in assessing its potential asbestos and environmental exposures. The Company supplements this exposure-based analysis with evaluations of the Company’s historical direct net loss and expense paid and reported experience, and net loss and expense paid and reported experience by calendar and/or report year, to assess any emerging trends, fluctuations or characteristics suggested by the aggregate paid and reported activity.
While the Company believes that its current asbestos and environmental reserves are appropriate, significant uncertainties limit the ability of insurers and reinsurers to estimate the ultimate reserves necessary for unpaid losses and related expenses. The ultimate liabilities, thus, could exceed the currently recorded reserves, and any such additional liability, while not estimable
now, could be material to The Hartford's consolidated operating results and liquidity.
As of December 31, 2017,2018, the Company reported $1.2$1.1 billion of net asbestos reserves and $237$203 of net environmental reserves. While the Company believes that its current asbestos and environmentalA&E reserves are appropriate, significant uncertainties limit theour ability of insurers and reinsurers to estimate the ultimate reserves necessary for unpaid losses and related expenses. The ultimate liabilities, thus, could exceed the currently recorded reserves, and any such additional liability, while not reasonably estimable now, could be material to The Hartford's consolidated operating results and liquidity.
Effective December 31, 2016, the Company entered into an A&E ADC reinsurance agreement with NICO, a subsidiary of Berkshire Hathaway Inc., to reduce uncertainty about potential adverse development of asbestos and environmental reserves. Under the ADC, the Company paid a reinsurance premium of $650 for NICO to assume adverse net loss and allocated loss adjustment expense reserve development up to $1.5 billion above the Company’s existing net asbestos and environmental reserves as of December 31, 2016 of approximately $1.7 billion. The $650 reinsurance premium was placed into a collateral trust account as security for NICO’s claim payment obligations to the Company. Under retroactive reinsurance accounting, net adverse asbestos and environmental reserve development after December 31, 2016 will result in an offsetting reinsurance recoverable up to the $1.5 billion limit. Cumulative ceded losses up to the $650 reinsurance premium paid are recognized as a dollar-for-dollar offset to direct losses incurred. Cumulative ceded losses exceeding the $650 reinsurance premium paid would result in a deferred gain. The deferred gain would be recognized over the claim settlement period in the proportion of the amount of cumulative ceded losses collected from the reinsurer to the estimated ultimate reinsurance recoveries. Consequently, until periods when the deferred gain is recognized as a benefit to earnings, cumulative adverse development of asbestos and environmental claims after December 31, 2016 in excess of $650 may result in significant charges against earnings. Furthermore, cumulative adverse
development of asbestos and environmental claims could ultimately exceed the $1.5 billion treaty limit in which case any adverse development in excess of the treaty limit would be absorbed as a charge to earnings by the Company. In these scenarios, the effect of these changescharges could be material to the Company’s consolidated operating results and liquidity. As of December 31, 2017,2018, the Company has incurred $285cumulative $523 in adverse development on asbestos and environmental reserves that have been ceded under the ADC treaty with NICO.NICO, leaving approximately $977 of coverage available for future adverse reserve development, if any.
Lease Commitments
The total rental expense on operating leases was $56, $57, $53, and $6053 in 20172018, 20162017, and 20152016, respectively, which excludes sublease rental income of $4, $3, $2, and $32 in 20172018, 20162017 and 20152016, respectively.
THE HARTFORD FINANCIAL SERVICES GROUP, INC.
NOTES TO CONSOLIDATED FINANCIAL STATEMENTS (continued)
14. Commitments and Contingencies (continued)
Future minimum lease commitments as ofDecember 31, 20172018 |
| | | |
| | Operating Leases |
| 2018 | $ | 45 |
|
| 2019 | 38 |
|
| 2020 | 30 |
|
| 2021 | 19 |
|
| 2022 | 12 |
|
| Thereafter | 41 |
|
| Total minimum lease payments [1] | $ | 185 |
|
|
| | | |
| | Operating Leases |
| 2019 | $ | 44 |
|
| 2020 | 36 |
|
| 2021 | 25 |
|
| 2022 | 18 |
|
| 2023 | 16 |
|
| Thereafter | 34 |
|
| Total minimum lease payments [1] | $ | 173 |
|
| |
| [1] | Excludes expected future minimum sublease income of approximately $32, $31, $1, $0, $0 and $0 in 20182019, 20192020, 20202021, 20212022, 20222023 and thereafter respectively. |
The Company’s lease commitments consist primarily of lease agreements for office space, automobiles, and office equipment that expire at various dates.
Unfunded Commitments
As of December 31, 20172018, the Company has outstanding commitments totaling $989 million,$954, of which $829 million$707 is committed to fund limited partnership and other alternative investments, which may be called by the partnership during the commitment period to fund the purchase of new investments and partnership expenses. Additionally, $54$163 of the outstanding commitments relate to various funding obligations associated with private placementdebt and equity securities. The remaining outstanding commitments of $106$84 relate to mortgage loansloans. Of the $954 in total outstanding commitments, $48 are related to mortgage loan commitments which the Company is expecting to fund in the first half of 2018.can cancel unconditionally.
Guaranty Funds and Other Insurance-Related Assessments
In all states, insurers licensed to transact certain classes of insurance are required to become members of a guaranty fund. In most states, in the event of the insolvency of an insurer writing any such class of insurance in the state, the guaranty funds may assess its members to pay covered claims of the insolvent insurers. Assessments are based on each member's proportionateproportionat
THE HARTFORD FINANCIAL SERVICES GROUP, INC.
NOTES TO CONSOLIDATED FINANCIAL STATEMENTS (continued)
e share of written premiums in the state for the classes of insurance in which the insolvent insurer was engaged. Assessments are generally limited for any year to one or two percent of the premiums written per year depending on the state. Some states permit member insurers to recover assessments paid through surcharges on policyholders or through full or partial premium tax offsets, while other states permit recovery of assessments through the rate filing process.
Liabilities for guaranty fund and other insurance-related assessments are accrued when an assessment is probable, when it can be reasonably estimated, and when the event obligating the Company to pay an imposed or probable assessment has occurred. Liabilities for guaranty funds and other insurance-related assessments are not discounted and are included as part of other liabilities in the Consolidated Balance Sheets. As of
December 31, 20172018 and 20162017 the liability balance was $113$97 and $126,$113, respectively. As of December 31, 20172018 and 20162017 amounts related to premium tax offsets of $6$2 and $19,$6, respectively, were included in other assets.
Derivative Commitments
Certain of the Company’s derivative agreements contain provisions that are tied to the financial strength ratings, as set by nationally recognized statistical agencies, of the individual legal entity that entered into the derivative agreement. If the legal entity’s financial strength were to fall below certain ratings, the counterparties to the derivative agreements could demand immediate and ongoing full collateralization and in certain instances enable the counterparties to terminate the agreements and demand immediate settlement of all outstanding derivative positions traded under each impacted bilateral agreement. The settlement amount is determined by netting the derivative positions transacted under each agreement. If the termination rights were to be exercised by the counterparties, it could impact the legal entity’s ability to conduct hedging activities by increasing the associated costs and decreasing the willingness of counterparties to transact with the legal entity. The aggregate fair value of all derivative instruments with credit-risk-related contingent features that are in a net liability position as of December 31, 20172018 was $534. Of this $534,$76, of which the legal entities have
posted collateral of $609, which is inclusive of initial margin requirements,$71 in the normal course of business. Based on derivative market values as of December 31, 2017,2018, a downgrade of one level below the current financial strength ratingsrates by either Moody’s or S&P would not require additional assets to be posted as collateral. Based on derivative market values as of December 31, 2017,2018, a downgrade of two levels below the current financial strength ratings by either Moody’s or S&P would require an additional $10$7 of assets to be posted as collateral. These collateral amounts could change as derivative market values change, as a result of changes in our hedging activities or to the extent changes in contractual terms are negotiated. The nature of the collateral that we post, whenif required, is primarily in the form of U.S. Treasury bills, U.S. Treasury notes and government agency securities.
Guarantees
In the ordinary course of selling businesses or entities to third parties, the Company has agreed to indemnify purchasers for losses arising subsequent to the closing due to breaches of representations and warranties with respect to the business or entity being sold or with respect to covenants and obligations of the Company and/or its subsidiaries. These obligations are typically subject to various time limitations, defined by the contract or by operation of law, such as statutes of limitation. In some cases, the maximum potential obligation is subject to contractual limitations, while in other cases such limitations are not specified or applicable. The Company does not expect to make any payments on these guarantees and is not carrying any liabilities associated with these guarantees.
The Hartford has guaranteed the obligations of certain life, accident and health and annuity contracts of the life and annuity business written by Hartford Life Insurance Company between 1990 and 1997 and written by Hartford Life and Annuity Insurance Company between 1993 and 2009. After the sale of this business in May 2018, the purchaser indemnified the Company for any liability arising under the guarantees. The guarantees have no limitation as to maximum potential future payments. The Hartford has not recorded a liability and the likelihood for any payments under these guarantees is remote.
THE HARTFORD FINANCIAL SERVICES GROUP, INC.NOTES TO CONSOLIDATED FINANCIAL STATEMENTS (continued)
15. Equity
EQUITY
Capital Purchase Program ("CPP") Warrants
As of December 31, 20172018 and 2016,2017, respectively, the Company has 2.21.9 million and 4.02.2 million CPP warrants outstanding and exercisable. The CPP warrants were issued in 2009 as part of a program established by the U.S. Department of the Treasury under the Emergency Economic Stabilization Act of 2008. The CPP warrants expire in June 2019.
CPP warrant exercises were 0.3 million, 1.8 million 0.4 million and 2.80.4 million during the years ended December 31, 2018, 2017 2016 and 2015,2016, respectively.
The declaration of common stock dividends by the Company in excess of a threshold triggers a provision in the Company's warrant agreement with The Bank of New York Mellon resulting in adjustments to the CPP warrant exercise price.price and the number of shares deliverable for each warrant exercised (the “Warrant
Share Number”). Accordingly, the CPP warrant exercise price was $8.999, $8.836, $9.1268.999 and $9.264$9.126 and the Warrant Share Number was 1.1, 1.0 and 1.0 as of December 31, 20172018, 20162017 and 2015,2016, respectively. The exercise price will be settled by the Company withholding the number of common shares issuable upon exercise of the warrants equal to the value of the aggregate exercise price of the warrants so exercised determined by reference to the closing price of the Company's common stock on the trading day on which the warrants are exercised and notice is delivered to the warrant agent.
Equity Repurchase Program
In October 2016, the Board of Directors authorized a new equity repurchase program for $1.3 billion for the period commencing October 31, 2016 through December 31, 2017. The $1.3 billion authorization is in addition to the Company's prior authorization for $4.375 billion, which was completed by December 31, 2016.
During the year ended December 31, 2017,2018, the Company repurchased 20.2 milliondid not repurchase any common shares for $1,028. Effective October 13, 2017shares. In February, 2019, the Company suspended 2017 equity repurchases. Theannounced a 1.0 billion share repurchase authorization by the Board of Directors which is effective through December 31, 2020. Based on projected holding company resources, the Company does not currently expectexpects to authorize anuse a portion of the authorization in 2019
THE HARTFORD FINANCIAL SERVICES GROUP, INC.
NOTES TO CONSOLIDATED FINANCIAL STATEMENTS (continued)
but anticipates using the majority of the program in 2020. Any repurchase of shares under the equity repurchase planprogram is dependent on market conditions and other factors.
Preferred Stock
On November 6, 2018, the Company issued 13.8 million depositary shares each representing 1/1000th interest in 2018.a share of the Company’s 6.0% Series G non-cumulative perpetual preferred stock (the “Preferred Stock”) with a liquidation preference of $25,000 per share (equivalent to $25.00 per depositary share), for net cash proceeds of $334. The Preferred Stock is perpetual and has no maturity date. Dividends will be payable, if declared, quarterly in arrears on the 15th day of February, May, August and November of each year, commencing on February 15, 2019. If a dividend is not declared before the dividend payment date for any dividend period, The Hartford will have no obligation to pay dividends otherwise attributable to such dividend period. If a dividend is not declared and paid or made payable on all outstanding shares of the Preferred Stock for the latest completed dividend period, no dividends may be paid or declared on The Hartford’s common stock and The Hartford may not purchase, redeem, or otherwise acquire its common stock.
The Preferred Stock is redeemable at the Company’s option in whole or in part, on or after November 15, 2023 at a redemption price of $25,000 per share, plus unpaid dividends attributable to the current dividend period. Prior to November 15, 2023, the Preferred Stock is redeemable at the Company’s option, in whole but not in part, within 90 days of the occurrence of (a) a rating agency event at a redemption price equal to $25,500 per share, plus unpaid dividends attributable to the current dividend period in circumstances where a rating agency changes its criteria used to assign equity credit to securities like the Preferred Stock; or (b) a regulatory capital event at a redemption price equal to $25,000 per share, plus unpaid dividends attributable to the current dividend period in circumstances where a capital regulator such as a state insurance regulator changes or proposes to change capital adequacy rules.
On December 13, 2018, The Hartford’s board of directors declared a dividend of $412.50 on each share of the Series G preferred stock (equivalent to $0.4125 per depository share) payable on February 15, 2019, to stockholders of record at the close of business on February 1, 2019.
Statutory Results
The domestic insurance subsidiaries of The Hartford prepare their statutory financial statements in conformity with statutory accounting practices prescribed or permitted by the applicable state insurance department which vary materially from U.S. GAAP. Prescribed statutory accounting practices include publications of the National Association of Insurance Commissioners (“NAIC”), as well as state laws, regulations and general administrative rules. The differences between statutory financial statements and financial statements prepared in accordance with U.S. GAAP vary between domestic and foreign jurisdictions. The principal differences are that statutory financial statements do not reflect deferred policy acquisition costs and limit deferred income taxes, predominately use interest rate and mortality assumptions prescribed by the NAIC for life benefit reserves, generally carry bonds at amortized cost, and present reinsurance assets and liabilities net of reinsurance. For reporting purposes, statutory capital and surplus is referred to collectively
as "statutory capital". Life insurance subsidariessubsidiaries include the
Company's group benefits Group Benefits insurance subsidiary Hartford Life and, Accident Insurance Company (HLA) andfor periods up until the Company's run-offsale date, the life and annuity subsidiaries held for sale.business sold in May 2018.
Statutory Net Income (Loss) | | | | For the years ended December 31, | For the years ended December 31, |
| | 2017 | 2016 | 2015 | 2018 | 2017 | 2016 |
| Group Benefits Insurance Subsidiary | $ | (1,066 | ) | $ | 208 |
| $ | 168 |
| $ | 390 |
| $ | (1,066 | ) | $ | 208 |
|
| Property and Casualty Insurance Subsidiaries | 950 |
| 304 |
| 1,486 |
| 1,114 |
| 950 |
| 304 |
|
| Life and Annuity Run-Off Business | 369 |
| 349 |
| 371 |
| |
| Life and annuity business sold in May, 2018 | | 196 |
| 369 |
| 349 |
|
| Total | $ | 253 |
| $ | 861 |
| $ | 2,025 |
| $ | 1,700 |
| $ | 253 |
| $ | 861 |
|
Statutory Capital |
| | | | | | |
| | As of December 31, |
| | 2018 | 2017 |
| Group Benefits Insurance Subsidiary | $ | 2,407 |
| $ | 2,029 |
|
| Property and Casualty Insurance Subsidiaries | 7,435 |
| 7,396 |
|
| Total | $ | 9,842 |
| $ | 9,425 |
|
|
| | | | | | |
| | As of December 31, |
| | 2017 | 2016 |
| Group Benefits Insurance Subsidiary | $ | 2,029 |
| $ | 1,624 |
|
| Property and Casualty Insurance Subsidiaries | 7,396 |
| 8,261 |
|
| Life and Annuity Run-Off Business | 3,552 |
| 4,398 |
|
| Total | $ | 12,977 |
| $ | 14,283 |
|
Regulatory Capital Requirements
The Company's U.S. insurance companies' states of domicile impose risk-based capital (“RBC”) requirements. The requirements provide a means of measuring the minimum amount of statutory capital appropriate for an insurance company to support its overall business operations based on its size and risk profile. Regulatory compliance is determined by a ratio of a company's total adjusted capital (“TAC”) to its authorized control level RBC (“ACL RBC”). Companies below specific trigger points or ratios are classified within certain levels, each of which requires specified corrective action. The minimum level of TAC before corrective action commences (“Company Action Level”) is two times the ACL RBC. The adequacy of a company's capital is determined by the ratio of a company's TAC to its Company Action Level, known as the "RBC ratio". All of the Company's operating insurance subsidiaries had RBC ratios in excess of the minimum levels required by the applicable insurance regulations. On an aggregate basis, the Company's U.S. property and casualty insurance companies' RBC ratio was in excess of 200% of its Company Action Level as of December 31, 2017 and 2016. The RBC ratios for the Company's group benefits insurance operating subsidiary (HLA) was in excess of 300% of its Company Action Level as of December 31, 2017 and 2016. The RBC ratio of the Company's held for sale life insurance and annuity run-off entities was in excess of 300% of its respective Company Action Levels as of December 31, 2017 and 2016. The reporting of RBC ratios is not intended for the purpose of ranking any insurance company, or for use in connection with any marketing, advertising, or promotional activities.
THE HARTFORD FINANCIAL SERVICES GROUP, INC.
NOTES TO CONSOLIDATED FINANCIAL STATEMENTS (continued)
15. Equity(continued)
Similar to the RBC ratios that are employed by U.S. insurance regulators, regulatory authorities in the international jurisdictions in which the Company operates generally establish minimum solvency requirements for insurance companies. All of the Company's international insurance subsidiaries have solvency marginscapital levels in excess of the minimum levels required by the applicable regulatory authorities.
Dividend Restrictions
Dividends to the HFSG Holding Company from its insurance subsidiaries are restricted by insurance regulation. The payment of dividends by Connecticut-domiciled insurers is limited under the insurance holding company laws of Connecticut. These laws require notice to and approval by the state insurance commissioner for the declaration or payment of any dividend, which, together with other dividends or distributions made within the preceding twelve months, exceeds the greater of (i) 10% of the insurer’s policyholder surplus as of December 31 of the preceding year or (ii) net income (or net gain from operations, if such company is a life insurance company) for the twelve-month
THE HARTFORD FINANCIAL SERVICES GROUP, INC.
NOTES TO CONSOLIDATED FINANCIAL STATEMENTS (continued)
period ending on the thirty-first day of December last preceding, in each case determined under statutory insurance accounting principles. In addition, if any dividend of a Connecticut-domiciled insurer exceeds the insurer’s earned surplus, it requires the prior approval of the Connecticut Insurance Commissioner. The insurance holding company laws of the other jurisdictions in which The Hartford’s insurance subsidiaries are domiciled orincorporated (or deemed commercially domiciled under applicable state insurance lawsdomiciled) generally contain similar or(although in certain state(s)instances more restrictiverestrictive) limitations on the payment of dividends. In addition, if any dividend of a domiciled insurer exceeds the insurer's earned surplus or certain other thresholds as calculated under applicable state insurance law, the dividend requires the prior approval of the domestic regulator. Dividends paid to HFSG Holding Company by its life insurance subsidiaries are further dependent on cash requirements of Hartford Life, Inc. ("HLI"), the holding company of its life and annuity run-off business held for sale, and Hartford Life and Accident Insurance Company ("HLA") and other factors. Dividends paid to HFSG from HLI are subject to provisions of the Stock and Asset Purchase agreement related to the sale of HLI and its run-off life and annuity insurance business and provides for expected dividends from HLI of $300 prior to closing of the sale, subject to regulatory approval. In addition to statutory limitations on paying dividends, the Company also takes other items into consideration when determining dividends from subsidiaries. These considerations include, but are not limited to, expected earnings and capitalization of the subsidiary,subsidiaries, regulatory capital requirements and liquidity requirements of the individual operating company.
Total dividends receivedpaid by HFSG in 2017 from its P&C insurance subsidiaries to HFSG holding company in 2018 were $2.4$3.1 billion. In connection with the purchase of Aetna's U.S. group life and disability business in the fourth quarter of 2017, the P&C insurance subsidiaries received approval and paid an extraordinary dividend to the HFSG Holding Company of $1.4 billion, of which $800 was funded by approvedThis includes extraordinary dividends from HLIC. The $800 of extraordinary dividends from HLIC was used to pay down$3.0 billion, comprised of a $1.9 billion principal paydown on the intercompany note owed by Hartford Holdings, Inc. (HHI)("HHI") to Hartford Fire Insurance Company.Company related to the life and annuity business sold in May 2018, $226 related to interest payments on the note and $900 to fund near-term obligations of the HFSG holding company. In addition, $100there was $50 of Hartford Fire Insurance Companyordinary P&C dividends that were paid to HFSG holding company, and $110 of capital contributed by the HFSG holding company to a run-off P&C subsidiary. Excluding the interest payments on the intercompany note and dividends that were subsequently contributed to a run-off P&C subsidiary, and $63 ofnet dividends paid by P&C insurance subsidiary dividends relatesubsidiaries to principal and interest payments on an intercompany note owed by HHI to Hartford Fire InsuranceHFSG holding company were $2.8 billion during 2018.
Company. Accordingly, the net dividend to HFSG Holding Company for the 2017 full year from P&C insurance subsidiaries was approximately $1.5 billion.
The $800 of extraordinary dividends from HLIC were funded in part by $550 of extraordinary dividends from HLIC's indirect wholly-owned subsidiary, Hartford Life and Annuity Insurance Company.
Total net dividends received by HFSG from subsidiariesholding company in 20172018 were $3.1$2.9 billion, including the $1.5$2.8 billion of net dividends from P&C subsidiaries $1.4 billionand $119 from HLIC, $188Hartford Funds during the year. There were no dividends received from HLAHartford Life and $75 from Mutual FundsAccident in 2018.
In 2018, TheUnder the formula described above, in 2019, the Company’s property and casualty insurance subsidiaries are permitted to pay up to a maximum of approximately $1.4$1.2 billion in dividends to HFSG Holding Company without prior approval from the applicable insurance commissioner.commissioner, though only $200 of this dividend capacity could be paid before the fourth quarter of 2019. In 2018,2019, HFSG Holding Company anticipatesdoes not anticipate receiving net dividends of approximately $350 from its property and casualty insurance subsidiaries.subsidiaries, as planned 2019 dividends were received in the fourth quarter 2018. The HFSG Holding Company generally expects to receive net dividends of $850 to $900 a year from its property and casualty insurance subsidiaries subject to the profitability of those subsidiaries and their capital needs.
In 2018, Hartford Life and Accident Insurance Company ("HLA") has no$380 dividend capacity for 20182019 and does not anticipateanticipates paying $250 to $300 dividends to the HSFG Holding Company.in 2019.
On December 4, 2017, The Hartford announced it had entered into a definitive agreement to sell its life and annuity run-off businesses to a group of investors led by Cornell Capital LLC, Atlas Merchant Capital LLC, TRB Advisors LP, Global Atlantic Financial Group, Pine Brook and J. Safra Group. Up until the anticipated close of the sale, HLIC does not have any additional dividend capacity. Prior to the expected close in 2018, HSFG Holding company anticipates receiving $300 of dividends from HLIC through HLI, subject to approval by the Connecticut Insurance Commissioner. Other intercompany transactions with HLI will be net settled prior to closing.
There are no current restrictions on the HFSG Holding Company's ability to pay dividends to its shareholders.stockholders.
Restricted Net Assets
The Company's insurance subsidiaries had net assets of $16$10.1 billion, determined in accordance with U.S. GAAP, that were restricted from payment to the HFSG Holding Company, without prior regulatory approval at December 31, 2017.2018.
THE HARTFORD FINANCIAL SERVICES GROUP, INC.NOTES TO CONSOLIDATED FINANCIAL STATEMENTS (continued)
16. Income Taxes
INCOME TAXES
The Company and its subsidiaries file income tax returns in the U.S. federal jurisdiction, and various state and foreign jurisdictions, as applicable. Income (loss) from continuing operations before income taxes included income from domestic operations of $704, $521 and $1,517 for the years ended December 31, 2017, 2016 and 2015, and income (losses) from foreign operations of $19, $(74) and $(39) for the years ended December 31, 2017, 2016 and 2015.
Tax Reform
On December 22, 2017, the U.S. government enacted comprehensive tax legislation commonly referred to as the Tax Cuts and Jobs Act (“Tax Reform”). Tax Reform establishes new tax laws that will affecteffective January 1, 2018, including, but not limited to, (1) reduction of the U.S. federal corporate income tax rate from 35% to 21%; (2) elimination of the corporate alternative minimum tax (AMT) and changing how existing AMT credits can be realized, (3) limitations on the deductibility of certain executive compensation, (4) changes to the discounting of statutory reserves for tax purposes, and (5) limitations on net operating losses (NOLs) generated after December 31, 2017 though there is no impact to the Company’s current NOL carryforwards.
In connection with our initial analysis of the impact ofRelated to Tax Reform, the Company recorded a provisional net income tax expense of $877 in the period ending December 31, 2017. This net expense consistsconsisted of aan $821 reduction of Thethe Company’s deferred tax assets primarily due to the reduction in the U.S. federal corporate income tax rate and a $56 sequestration fee payable associated with refundable AMT credits. Net
During 2018, the Company recorded income tax expense of $17 as measurement period adjustments related to Tax Reform due to the filing of the Company's 2017 federal income tax return and completion of the Aetna Group Benefits acquisition. In addition, the Company recorded an income tax benefit of $56, reflecting the elimination of the sequestration fee payable,payable. In total, the Company's
Company recorded a net income tax benefit from Tax Reform of $39 in 2018.
As of December 31, 2018, the Company had AMT creditscarryovers of $790 have been reclassified to$841 which are reflected as a current income tax receivable. Tax reform allowsreceivable within Other Assets in the accompanying consolidated balance sheet. AMT credits may be used to offset a regular tax liability for any taxable year beginning after December 31, 2017, and are refundable at an amount equal to 50 percent of the excess of the minimum tax credit for the refund of AMT creditstaxable year over time but no later than 2022.
For components where we have made provisional estimatesthe amount of the impactcredit allowable for the year against regular tax liability. Any remaining credits not used against regular tax liability are refundable in the 2021 tax year to be realized in 2022.
Income Tax Expense
The Company and its subsidiaries file income tax returns in the U.S. federal jurisdiction, and various state and foreign jurisdictions, as applicable. Income (loss) from continuing operations before income taxes included income from domestic operations of $1,753, $704 and $521 for the years ended December 31, 2018, 2017 and 2016, and income (losses) from foreign operations of $0, $19 and $(74) for the years ended December 31, 2018, 2017 and 2016.
THE HARTFORD FINANCIAL SERVICES GROUP, INC.
NOTES TO CONSOLIDATED FINANCIAL STATEMENTS (continued)
Income Tax Expense (Benefit)
|
| | | | | | | | | |
| | For the years ended December 31, |
| | 2018 | 2017 | 2016 |
| Income Tax Expense (Benefit) | | | |
| Current - U.S. Federal | $ | (18 | ) | $ | 116 |
| $ | 10 |
|
| International | — |
| 1 |
| — |
|
| Total current | (18 | ) | 117 |
| 10 |
|
| Deferred - U.S. Federal | 286 |
| 866 |
| (173 | ) |
| International | — |
| 2 |
| (3 | ) |
| Total deferred | 286 |
| 868 |
| (176 | ) |
| Total income tax expense (benefit) | $ | 268 |
| $ | 985 |
| $ | (166 | ) |
Income Tax Rate Reconciliation |
| | | | | | | | | |
| | For the years ended December 31, |
| | 2018 | 2017 | 2016 |
| Tax provision at U.S. federal statutory rate [1] | $ | 368 |
| $ | 253 |
| $ | 157 |
|
| Tax-exempt interest | (66 | ) | (123 | ) | (124 | ) |
| Decrease in deferred tax valuation allowance | — |
| — |
| (79 | ) |
| Executive Compensation | 11 |
| — |
| — |
|
| Stock-based compensation | (5 | ) | (15 | ) | — |
|
| Solar credits | — |
| — |
| (79 | ) |
| Sale of the U.K. property & casualty run-off subsidiaries and foreign rate differential | — |
| 5 |
| (37 | ) |
| Tax Reform | (39 | ) | 877 |
| — |
|
| Other | (1 | ) | (12 | ) | (4 | ) |
| Provision (benefit) for income taxes | $ | 268 |
| $ | 985 |
| $ | (166 | ) |
[1] Due to the passage of Tax Reform future guidance could change these estimates, particularlyon December 22, 2017, current and prior period federal statutory rates are reflected at 21% and 35% respectively.
In addition to the estimated amounteffect of sequestration fee payable. Adjustments totax-exempt interest, the Company's effective tax rate for the year ended December 31, 2018 reflects a federal income tax expense if any, will be madeof $11 related to non-deductible executive compensation and a benefit of $5 related to a deduction for stock-based compensation that vested at a fair value per share greater than the fair value on the date of grant.
Included in 2018 is a benefit of $39 related to Tax Reform, primarily due to the elimination of the sequestration fee on AMT credits.
Included in 2017 is an expense of $877 due to the effects of Tax Reform, primarily due to the reduction in net deferred tax assets as a result of the reduction in the periodfederal corporate income tax rate from 35% to 21%.
Included in 2016 is a benefit of $79 due to the adjustments become knowninvestment in 2018.solar energy partnerships. The total tax benefit from the transaction was $113, which included the tax effects of the related financial statement realized loss from writing down the investment in partnerships.
Income Tax Expense (Benefit)
Also included in 2016 is a tax benefit primarily due to the sale of the Company's U.K. property and casualty run-off subsidiaries. The tax benefit of $37 relates to the difference between the tax basis and book basis of the Company's investment in the subsidiaries net of additional foreign tax rate differentials. The total estimated tax benefit recognized in 2016 related to the sale of the U.K. property and casualty run-off subsidiaries was $76. For discussion of this transaction, see Note 20 - Business Dispositions and Discontinued Operations of Notes to Consolidated Financial Statements. |
| | | | | | | | | |
| | For the years ended December 31, |
| | 2017 | 2016 | 2015 |
| Income Tax Expense (Benefit) | | | |
| Current - U.S. Federal | $ | 116 |
| $ | 10 |
| $ | (91 | ) |
| International | 1 |
| — |
| 3 |
|
| Total current | 117 |
| 10 |
| (88 | ) |
| Deferred - U.S. Federal | 866 |
| (173 | ) | 377 |
|
| International | 2 |
| (3 | ) | — |
|
| Total deferred | 868 |
| (176 | ) | 377 |
|
| Total income tax expense (benefit) | $ | 985 |
| $ | (166 | ) | $ | 289 |
|
Deferred tax assets and liabilities on the consolidated balance sheets represent the tax consequences of differences between the financial reporting and tax basis of assets and liabilities. The deferred tax assets and liabilities as of December 31, 2018 and 2017 shown
in the table below reflect the reduction in deferred taxes requiredlower corporate Federal income tax rate as a result of Tax Reform. In addition, as a result of entering into a definitive agreementDeferred tax balances for the year ended December 31, 2017 related to sell the life and annuity run-off business deferred tax balances that will be transferred tosold in May 2018 are not included in the buyer have been removed from the following table and arebelow as they were included in assets held for sale. Included in deferred taxessale as of December 31, 2017 are deferred tax assets2017. In lieu of recording a benefit of the life and annuity run-off business that will be retained by the Company, including $437 for the tax effect of net operatingcapital loss carryovers, and $23 of foreign tax credits. While the Company recognized a pre-tax loss of $3.3 billion on the sale of the life and annuity run-off business, in 2017, the Company did not record a tax benefit on the sale. Rather the Company plans to electelected to retain tax net operating loss carryovers in lieuwith an estimated benefit of recognizing a tax capital loss in$477 as of December 31, 2018.
Deferred Tax Assets (Liabilities)
| | | | As of December 31, | As of December 31, |
| | 2017 | 2016 | 2018 | 2017 |
| Deferred Tax Assets | |
|
|
|
|
| Loss reserves and tax discount | $ | 104 |
| $ | 262 |
| $ | 150 |
| $ | 104 |
|
| Unearned premium reserve and other underwriting related reserves | 352 |
| 384 |
| 355 |
| 352 |
|
| Investment-related items | 194 |
| 458 |
| 183 |
| 194 |
|
| Employee benefits | 313 |
| 508 |
| 287 |
| 313 |
|
| Alternative minimum tax credit [1] | — |
| 640 |
| |
| General business credit carryover | 3 |
| 99 |
| 1 |
| 3 |
|
| Net operating loss carryover | 710 |
| 1,458 |
| 521 |
| 710 |
|
| Foreign tax credit carryover | 26 |
| 56 |
| — |
| 26 |
|
| Other | 1 |
| — |
| — |
| 1 |
|
| Total Deferred Tax Assets | 1,703 |
| 3,865 |
| 1,497 |
| 1,703 |
|
| Deferred Tax Liabilities | |
|
| Deferred acquisition costs | (103 | ) | (176 | ) | (104 | ) | (103 | ) |
| Net unrealized gains on investments | (306 | ) | (348 | ) | (7 | ) | (306 | ) |
| Other depreciable and amortizable assets | (130 | ) | (243 | ) | (135 | ) | (130 | ) |
| Other | — |
| (99 | ) | (3 | ) | — |
|
| Total Deferred Tax Liabilities | (539 | ) | (866 | ) | (249 | ) | (539 | ) |
| Net Deferred Tax Asset | $ | 1,164 |
| $ | 2,999 |
| $ | 1,248 |
| $ | 1,164 |
|
[1]As of December 31, 2017, alternative minimum tax credits of $790 have been reclassified as a current tax receivable. See further discussion below.
A deferred tax valuation allowance has not been recorded because the Company believes the deferred tax assets will more likely than not be realized. In assessing the need for a valuation allowance, management considered future taxable temporary difference reversals, future taxable income exclusive of reversing temporary differences and carryovers, taxable income in open carry back years and other tax planning strategies. From time to
THE HARTFORD FINANCIAL SERVICES GROUP, INC.
NOTES TO CONSOLIDATED FINANCIAL STATEMENTS (continued)
time, tax planning strategies could include holding a portion of debt securities with market value losses until recovery, altering the level of tax exempt securities held, making investments which have specific tax characteristics, and business considerations such as asset-liability matching. Management views such tax
THE HARTFORD FINANCIAL SERVICES GROUP, INC.
NOTES TO CONSOLIDATED FINANCIAL STATEMENTS (continued)
16. Income Taxes (continued)
planning strategies as prudent and feasible and would implement them, if necessary, to realize the deferred tax assets.
As shown in the deferred tax assets (liabilities) table above, included in net deferred income taxes are the future tax benefits associated with theU.S. net operating loss carryover, foreign tax credit carryover, capital loss carryover, alternative minimum tax credit carryover and general business credit carryover.
Future Tax Benefits
|
| | | | | | | | | | | | |
| | As of | |
| | December 31, 2017 | Expiration |
| | Carryover amount | Expected tax benefit, gross | Dates | Amount |
| Net operating loss carryover - U.S. | $ | 3,380 |
| $ | 710 |
| 2020 | $ | 1 |
|
|
|
| 2023 | - | 2036 | $ | 3,379 |
|
| Net operating loss carryover - foreign | $ | 3 |
| $ | — |
| No expiration | $ | 3 |
|
| Foreign tax credit carryover | $ | 26 |
| $ | 26 |
| 2023 | - | 2024 | $ | 26 |
|
| Alternative minimum tax credit carryover | $ | 790 |
| $ | 790 |
| No expiration | $ | — |
|
| General business credit carryover | $ | 3 |
| $ | 3 |
| 2031 | - | 2037 | $ | 3 |
|
Net Operating Loss Carryover
U.S. NOLs reflected above arose in taxable years prior to 2017 and are still subject to prior tax law which allows for carryback and limits the period over which carryforwards may be used to offset taxable income as shown in the above table.income. Utilization of the Company's loss carryovers is dependent upon the generation of sufficient future taxable income. Most of the net operating loss carryover originated from the Company's U.S. and international annuity business, including from the hedging program. The U.S. net operating loss carryover in the table above included $437 of NOL's of the life and annuity run-off business that the Company will retain. Given the expected earnings of the Company going forward, including earnings of its property and casualty, group benefits and mutual fund businesses, the Company expects to generate sufficient taxable income in the future to utilize its net operating loss carryover. Although the Company projects there will be sufficient future taxable income to fully recover the remainder of the loss carryover, the Company's estimate of the likely realization may change over time.
Uncertain Tax Credit CarryoversPositions
Alternative Minimum Tax Credits- As noted above, because AMT credits are refundable, the Company reflected AMT credits, net of a sequestration fee payable, as a current tax receivable at its undiscounted amount and they are no longer included as deferred tax assets.
Foreign Tax Credits- These credits are available to offset regular federal income taxes from future taxable income. The use of these credits prior to expiration depends on the generation of sufficient taxable income to first utilize all U.S. net operating loss carryovers. However, the Company has purchased certain investments which allow for utilization of the foreign tax credits without first using the net operating loss carryover. Consequently, the Company believes it is more likely than not the foreign tax credit carryover will be fully realized. Accordingly, no valuation allowance has been provided.
Income Tax Rate Reconciliation |
| | | | | | | | | |
| | For the years ended December 31, |
| | 2017 | 2016 | 2015 |
| Tax provision at U.S. federal statutory rate | $ | 253 |
| $ | 157 |
| $ | 517 |
|
| Tax-exempt interest | (123 | ) | (124 | ) | (132 | ) |
| Decrease in deferred tax valuation allowance | — |
| (79 | ) | (102 | ) |
| Stock-based compensation | (15 | ) | — |
| — |
|
| Solar credits | — |
| (79 | ) | — |
|
| Sale of HFPI and foreign rate differential | 5 |
| (37 | ) | — |
|
| Tax Reform | 877 |
| — |
| — |
|
| Other | (12 | ) | (4 | ) | 6 |
|
| Provision (benefit) for income taxes | $ | 985 |
| $ | (166 | ) | $ | 289 |
|
In addition to the effect of tax-exempt interest, the Company's effective tax rate for the year ended December 31, 2017 reflects a federal income tax benefit of $15 related to a deduction for stock-based compensation that vested at a fair value per share greater than the fair value on the date of grant.
The Company recognized an $877 increase in income tax expense in 2017 due to the effects of Tax Reform, primarily due to the reduction in net deferred tax assets as a result of the reduction in the Federal corporate income tax rate from 35% to 21%.
Additionally, reflected above is a benefit of $79 in 2016 due to the investment in solar energy partnerships. The total tax benefit from the transaction was $113 which includes the tax effects of the related financial statement realized loss from writing down the investments in the partnerships.
Also included in 2016 is a tax benefit primarily due to the sale of the Company's U.K. property and casualty run-off subsidiaries.
THE HARTFORD FINANCIAL SERVICES GROUP, INC.
NOTES TO CONSOLIDATED FINANCIAL STATEMENTS (continued)
16. Income Taxes (continued)
The tax benefit of $37 relates to the difference between the tax basis and book basis of the Company's investment in the subsidiaries net of additional foreign tax rate differentials. The total estimated tax benefit recognized in 2016 related to the sale of the U.K. property and casualty run-off subsidiaries was $76. For discussion of this transaction, see Note 20 - Business Dispositions and Discontinued Operations of Notes to Consolidated Financial Statements.
Roll-forwardRollforward of Unrecognized Tax Benefits |
| | | | | | | | | |
| | For the years ended December 31, |
| | 2018 | 2017 | 2016 |
| Balance, beginning of period | $ | 9 |
| $ | 12 |
| $ | 12 |
|
| Gross increases - tax positions in prior period | 5 |
| 3 |
| — |
|
| Gross decreases - tax positions in prior period | — |
| — |
| — |
|
| Gross decreases - tax reform | — |
| (6 | ) | — |
|
| Balance, end of period | $ | 14 |
| $ | 9 |
| $ | 12 |
|
|
| | | | | | | | | |
| | For the years ended December 31, |
| | 2017 | 2016 | 2015 |
| Balance, beginning of period | $ | 12 |
| $ | 12 |
| $ | 48 |
|
| Gross increases - tax positions in prior period | 3 |
| — |
| 12 |
|
| Gross decreases - tax positions in prior period | — |
| — |
| (48 | ) |
| Gross decreases - tax reform | (6 | ) | — |
| — |
|
| Balance, end of period | $ | 9 |
| $ | 12 |
| $ | 12 |
|
The entire amount of unrecognized tax benefits, if recognized, would affect the effective tax rate in the period of the release.
As ofIn addition, for the year ended December 31, 2017,2018 the Company hadrecorded a current income tax receivable of $811, including $790 of AMT credits$5 related to a tax indemnification agreement associated with the life and annuity business sold in May 2018. The receivable which consist of $846 of AMT credits offset by a $56 sequestration fee payable. As of December 31, 2016,is separate from the tax liability and is classified as an other asset on the balance sheet.
Other Tax Matters
The federal audits have been completed through 2013, and the Company had a current income tax receivable of $141.
The federal audit of the years 2012 and 2013 was completed as of March 31, 2017 with no additional adjustments. The federal audit of The Company's recently acquired subsidiary Maxumis not currently under examination for the 2014 tax year was completed as of December 31, 2017 with no adjustments.any open years. Management believes that adequate provision has been made in the consolidated financial statements for any potential adjustments that may result from tax examinations and other tax-relatedtax related matters for all open tax years.
The Company classifies interest and penalties (if applicable) as income tax expense in the consolidated financial statements. The Company recognized no interest expense for the years ended December 31, 2018, 2017 2016 and 2015.2016. The Company had no interest payable as of December 31, 20172018 and 2016.2017. The Company does not believe it would be subject to any penalties in any open tax years and, therefore, has not recorded any accrual for penalties.
THE HARTFORD FINANCIAL SERVICES GROUP, INC.
NOTES TO CONSOLIDATED FINANCIAL STATEMENTS (continued)
17. CHANGES IN AND RECLASSIFICATIONS FROM ACCUMULATED OTHER COMPREHENSIVE INCOME (LOSS)
Changes in and Reclassifications From Accumulated Other Comprehensive Income (Loss)
AOCI, Net of Tax for the Year Ended December 31, 2018 |
| | | | | | | | | | | | | | | | | | |
| | Changes in |
| | Net Unrealized Gain on Securities | OTTI Losses in OCI | Net Gain (Loss) on Cash Flow Hedging Instruments | Foreign Currency Translation Adjustments | Pension and Other Postretirement Plan Adjustments | AOCI, net of tax |
| Beginning balance | $ | 1,931 |
| $ | (3 | ) | $ | 18 |
| $ | 34 |
| $ | (1,317 | ) | $ | 663 |
|
| Cumulative effect of accounting changes, net of tax [1] | 273 |
| — |
| 2 |
| 4 |
| (284 | ) | (5 | ) |
| Adjusted balance, beginning of period | 2,204 |
| (3 | ) | 20 |
| 38 |
| (1,601 | ) | 658 |
|
| OCI before reclassifications [2] | (2,245 | ) | — |
| 8 |
| (8 | ) | (61 | ) | (2,306 | ) |
| Amounts reclassified from AOCI | 65 |
| (1 | ) | (33 | ) | — |
| 38 |
| 69 |
|
| OCI, net of tax | (2,180 | ) | (1 | ) | (25 | ) | (8 | ) | (23 | ) | (2,237 | ) |
| Ending balance | $ | 24 |
| $ | (4 | ) | $ | (5 | ) | $ | 30 |
| $ | (1,624 | ) | $ | (1,579 | ) |
| |
| [1] | Includes reclassification to retained earnings of $88 of stranded tax effects and $93 of net unrealized gains, after tax, related to equity securities. Refer to Note 1 - Basis of Presentation and Significant Accounting Policies of Notes to Consolidated Financial Statements for further information. |
| |
| [2] | The reduction in AOCI included the effect of removing $758 of AOCI from the balance sheet when the life and annuity business was sold in May 2018. |
Changes in AOCI, Net of Tax for the Year Ended December 31, 2017
|
| | | | | | | | | | | | | | | | | | |
| | Changes in |
| | Net Unrealized Gain on Securities | OTTI Losses in OCI | Net Gain on Cash Flow Hedging Instruments | Foreign Currency Translation Adjustments | Pension and Other Postretirement Plan Adjustments | AOCI, net of tax |
| Beginning balance | $ | 1,276 |
| $ | (3 | ) | $ | 76 |
| $ | 6 |
| $ | (1,692 | ) | $ | (337 | ) |
| OCI before reclassifications | 857 |
| — |
| (8 | ) | 28 |
| (146 | ) | 731 |
|
| Amounts reclassified from AOCI | (202 | ) | — |
| (50 | ) | — |
| 521 |
| 269 |
|
| OCI, net of tax | 655 |
| — |
| (58 | ) | 28 |
| 375 |
| 1,000 |
|
| Ending balance | $ | 1,931 |
| $ | (3 | ) | $ | 18 |
| $ | 34 |
| $ | (1,317 | ) | $ | 663 |
|
|
| | | | | | | | | | | | | | | | | | |
| | Changes in |
| | Net Unrealized Gain on Securities | OTTI Losses in OCI | Net Gain on Cash Flow Hedging Instruments | Foreign Currency Translation Adjustments | Pension and Other Postretirement Plan Adjustments | AOCI, net of tax |
| Beginning balance | $ | 1,276 |
| $ | (3 | ) | $ | 76 |
| $ | 6 |
| $ | (1,692 | ) | $ | (337 | ) |
| OCI before reclassifications | 857 |
| — |
| (8 | ) | 28 |
| (146 | ) | 731 |
|
| Amounts reclassified from AOCI | (202 | ) | — |
| (50 | ) | — |
| 521 |
| 269 |
|
| OCI, net of tax | 655 |
| — |
| (58 | ) | 28 |
| 375 |
| 1,000 |
|
| Ending balance | $ | 1,931 |
| $ | (3 | ) | $ | 18 |
| $ | 34 |
| $ | (1,317 | ) | $ | 663 |
|
Changes in AOCI, Net of Tax for the Year Ended December 31, 2016
|
| | | | | | | | | | | | | | | | | | |
| | Changes in |
| | Net Unrealized Gain on Securities | OTTI Losses in OCI | Net Gain on Cash Flow Hedging Instruments | Foreign Currency Translation Adjustments | Pension and Other Postretirement Plan Adjustments | AOCI, net of tax |
| Beginning balance | $ | 1,279 |
| $ | (7 | ) | $ | 130 |
| $ | (55 | ) | $ | (1,676 | ) | $ | (329 | ) |
| OCI before reclassifications | 83 |
| 1 |
| (8 | ) | (37 | ) | (52 | ) | (13 | ) |
| Amounts reclassified from AOCI | (86 | ) | 3 |
| (46 | ) | 98 |
| 36 |
| 5 |
|
| OCI, net of tax | (3 | ) | 4 |
| (54 | ) | 61 |
| (16 | ) | (8 | ) |
| Ending balance | $ | 1,276 |
| $ | (3 | ) | $ | 76 |
| $ | 6 |
| $ | (1,692 | ) | $ | (337 | ) |
Changes in AOCI, Net of Tax for the Year ended December 31, 20152016
|
| | | | | | | | | | | | | | | | | | |
| | Changes in |
| | Net Unrealized Gain on Securities | OTTI Losses in OCI | Net Gain on Cash Flow Hedging Instruments | Foreign Currency Translation Adjustments | Pension and Other Postretirement Plan Adjustments | AOCI, net of tax |
| Beginning balance | $ | 1,279 |
| $ | (7 | ) | $ | 130 |
| $ | (55 | ) | $ | (1,676 | ) | $ | (329 | ) |
| OCI before reclassifications | 83 |
| 1 |
| (8 | ) | (37 | ) | (52 | ) | (13 | ) |
| Amounts reclassified from AOCI | (86 | ) | 3 |
| (46 | ) | 98 |
| 36 |
| 5 |
|
| OCI, net of tax | (3 | ) | 4 |
| (54 | ) | 61 |
| (16 | ) | (8 | ) |
| Ending balance | $ | 1,276 |
| $ | (3 | ) | $ | 76 |
| $ | 6 |
| $ | (1,692 | ) | $ | (337 | ) |
|
| | | | | | | | | | | | | | | | | | |
| | Changes in |
| | Net Unrealized Gain on Securities | OTTI Losses in OCI | Net Gain on Cash Flow Hedging Instruments | Foreign Currency Translation Adjustments | Pension and Other Postretirement Plan Adjustments | AOCI, net of tax |
| Beginning balance | $ | 2,370 |
| $ | (5 | ) | $ | 150 |
| $ | (8 | ) | $ | (1,579 | ) | $ | 928 |
|
| OCI before reclassifications | (1,112 | ) | (3 | ) | 18 |
| (47 | ) | (135 | ) | (1,279 | ) |
| Amounts reclassified from AOCI | 21 |
| 1 |
| (38 | ) | — |
| 38 |
| 22 |
|
| OCI, net of tax | (1,091 | ) | (2 | ) | (20 | ) | (47 | ) | (97 | ) | (1,257 | ) |
| Ending balance | $ | 1,279 |
| $ | (7 | ) | $ | 130 |
| $ | (55 | ) | $ | (1,676 | ) | $ | (329 | ) |
THE HARTFORD FINANCIAL SERVICES GROUP, INC.
NOTES TO CONSOLIDATED FINANCIAL STATEMENTS (continued)
17. Changes in and Reclassifications From Accumulated Other Comprehensive Income (Loss) (continued)
Reclassifications from AOCI |
| | | | | | | | | | |
| AOCI | Amount Reclassified from AOCI | Affected Line Item in the Consolidated Statement of Operations |
| | For the year ended December 31, 2018 | For the year ended December 31, 2017 | For the year ended December 31, 2016 | |
| Net Unrealized Gain on Securities | | | | |
| Available-for-sale securities | $ | (80 | ) | $ | 152 |
| $ | 36 |
| Net realized capital gains (losses) |
| | (80 | ) | 152 |
| 36 |
| Total before tax |
| | (17 | ) | 53 |
| 13 |
| Income tax expense (benefit) |
| | (2 | ) | 103 |
| 63 |
| Income (loss) from discontinued operations, net of tax |
| | $ | (65 | ) | $ | 202 |
| $ | 86 |
| Net income (loss) |
| OTTI Losses in OCI | | | | |
| Other than temporary impairments | $ | — |
| $ | — |
| $ | (2 | ) | Net realized capital gains (losses) |
| | — |
| — |
| (2 | ) | Total before tax |
| | — |
| — |
| (1 | ) | Income tax expense (benefit) |
| | 1 |
| — |
| (2 | ) | Income (loss) from discontinued operations, net of tax |
| | 1 |
| — |
| (3 | ) | Net income (loss) |
| Net Gain on Cash Flow Hedging Instruments | | | | |
| Interest rate swaps | $ | 6 |
| $ | 5 |
| $ | 10 |
| Net realized capital gains (losses) |
| Interest rate swaps | 30 |
| 37 |
| 37 |
| Net investment income |
| | 36 |
| 42 |
| 47 |
| Total before tax |
| | 8 |
| 15 |
| 17 |
| Income tax expense (benefit) |
| | $ | 5 |
| $ | 23 |
| $ | 16 |
| Income (loss) from discontinued operations, net of tax |
| | $ | 33 |
| $ | 50 |
| $ | 46 |
| Net income (loss) |
| Foreign Currency Translation Adjustments | | | | |
| Currency translation adjustments [1] | $ | — |
| $ | — |
| $ | (118 | ) | Net realized capital gains (losses) |
| | — |
| — |
| (118 | ) | Total before tax |
| | — |
| — |
| (20 | ) | Income tax expense (benefit) |
| | $ | — |
| $ | — |
| $ | (98 | ) | Net income (loss) |
| Pension and Other Postretirement Plan Adjustments | | | | |
| Amortization of prior service credit | $ | 7 |
| $ | 7 |
| $ | 6 |
| Insurance operating costs and other expenses |
| Amortization of actuarial loss | (55 | ) | (61 | ) | (61 | ) | Insurance operating costs and other expenses |
| Settlement loss | — |
| (747 | ) | — |
| Insurance operating costs and other expenses |
| | (48 | ) | (801 | ) | (55 | ) | Total before tax |
| | (10 | ) | (280 | ) | (19 | ) | Income tax expense (benefit) |
| | (38 | ) | (521 | ) | (36 | ) | Net income (loss) |
| Total amounts reclassified from AOCI | $ | (69 | ) | $ | (269 | ) | $ | (5 | ) | Net income (loss) |
|
| | | | | | | | | | |
| AOCI | Amount Reclassified from AOCI | Affected Line Item in the Consolidated Statement of Operations |
| | For the year ended December 31, 2017 | For the year ended December 31, 2016 | For the year ended December 31, 2015 | |
| Net Unrealized Gain on Securities | | | | |
| Available-for-sale securities | $ | 152 |
| $ | 36 |
| $ | (5 | ) | Net realized capital gains (losses) |
| | 152 |
| 36 |
| (5 | ) | Total before tax |
| | 53 |
| 13 |
| (2 | ) | Income tax expense (benefit) |
| | 103 |
| 63 |
| (18 | ) | (Loss) income from discontinued operations, net of tax |
| | $ | 202 |
| $ | 86 |
| $ | (21 | ) | Net (loss) income |
| OTTI Losses in OCI | | | | |
| Other than temporary impairments | $ | — |
| $ | (2 | ) | $ | (1 | ) | Net realized capital gains (losses) |
| | — |
| (2 | ) | (1 | ) | Total before tax |
| | — |
| (1 | ) | — |
| Income tax expense (benefit) |
| | — |
| (2 | ) | — |
| (Loss) income from discontinued operations, net of tax |
| | — |
| (3 | ) | (1 | ) | Net (loss) income |
| Net Gain on Cash Flow Hedging Instruments | | | | |
| Interest rate swaps | $ | 5 |
| $ | 10 |
| $ | 5 |
| Net realized capital gains (losses) |
| Interest rate swaps | 37 |
| 37 |
| 31 |
| Net investment income |
| | 42 |
| 47 |
| 36 |
| Total before tax |
| | 15 |
| 17 |
| 13 |
| Income tax expense (benefit) |
| | $ | 23 |
| $ | 16 |
| $ | 15 |
| (Loss) income from discontinued operations, net of tax |
| | $ | 50 |
| $ | 46 |
| $ | 38 |
| Net (loss) income |
| Foreign Currency Translation Adjustments | | | | |
| Currency translation adjustments [1] | $ | — |
| $ | (118 | ) | $ | — |
| Net realized capital gains (losses) |
| | — |
| (118 | ) | — |
| Total before tax |
| | — |
| (20 | ) | — |
| Income tax expense (benefit) |
| | $ | — |
| $ | (98 | ) | $ | — |
| Net (loss) income |
| Pension and Other Postretirement Plan Adjustments | | | | |
| Amortization of prior service credit | $ | 7 |
| $ | 6 |
| $ | 7 |
| Insurance operating costs and other expenses |
| Amortization of actuarial loss | (61 | ) | (61 | ) | (65 | ) | Insurance operating costs and other expenses |
| Settlement loss | (747 | ) | — |
| — |
| Insurance operating costs and other expenses |
| | (801 | ) | (55 | ) | (58 | ) | Total before tax |
| | (280 | ) | (19 | ) | (20 | ) | Income tax expense (benefit) |
| | (521 | ) | (36 | ) | (38 | ) | Net (loss) income |
| Total amounts reclassified from AOCI | $ | (269 | ) | $ | (5 | ) | $ | (22 | ) | Net (loss) income |
| |
| [1] | Amount in 2016 relates to the sale of the U.K. property and casualty. |
THE HARTFORD FINANCIAL SERVICES GROUP, INC.NOTES TO CONSOLIDATED FINANCIAL STATEMENTS (continued)
18. Employee Benefit Plans
EMPLOYEE BENEFIT PLANS
Investment and Savings Plan
Substantially all U.S. employees of the Company are eligible to participate in The Hartford Investment and Savings Plan under
which designated contributions may be invested in a variety of investments, including up to 10% in a fund consisting largely of common stock of The Hartford. The Company's contributions include a non-elective contribution of 2.0% of eligible
THE HARTFORD FINANCIAL SERVICES GROUP, INC.
NOTES TO CONSOLIDATED FINANCIAL STATEMENTS (continued)
compensation and a dollar-for-dollar matching contribution of up to 6.0% of eligible compensation contributed by the employee each pay period. The Company also maintains a non-qualified savings plan, The Hartford Excess Savings Plan, with the dollar-for-dollar matching contributions of employee compensation in excess of the amount that can be contributed under the tax-qualified Investment and Savings Plan. An employee's eligible compensation includes overtime and bonuses but for the Investment and Savings Plan and Excess Savings Plan combined, is limited to $1 annually. The total cost to The Hartford for these plans was approximately $134, $113 $115 and $117$115 for the years ended December 31, 2018, 2017 2016 and 2015,2016, respectively.
Additionally, The Hartford has established defined contribution pension plans for certain employees of the Company’s international subsidiaries. The cost to The Hartford for the years ended December 31, 2018, 2017 2016 and 20152016 for these plans was immaterial.
As of December 31, 2017 and 2016 , Investment and Savings Plan assets totaling $540 and $438, respectively, were invested in the separate accounts of HLIC.
Post Retirement Benefit Plans
Defined Benefit Pension Plan- The Company maintains The Hartford Retirement Plan for U.S. Employees, a U.S. qualified defined benefit pension plan (the “Plan”) that covers substantially all U.S. employees hired prior to January 1, 2013. The Company also maintains non-qualified pension plans to provide retirement benefits previously accrued that are in excess of Internal Revenue Code limitations.
The Plan includes two benefit formulas, both of which are frozen: a final average pay formula (for which all accruals ceased as of December 31, 2008) and a cash balance formula for which benefit accruals ceased as of December 31, 2012, although interest will continue to accrue to existing cash balance formula account balances. Employees who were participants as of December 31, 2012 continue to earn vesting credit with respect to their frozen accrued benefits if they continue to work. The interest crediting rate on the cash balance plan is the greater of the average annual yield on 10-year U.S. Treasury Securities or 3.3%. The Hartford Excess Pension Plan II, the Company's non-qualified excess pension benefit plan for certain highly compensated employees, is also frozen.
Group Retiree Health Plan- The Company provides certain health care and life insurance benefits for eligible retired employees. The Company’s contribution for health care benefits will depend upon the retiree’s date of retirement and years of service. In addition, the plan has a defined dollar cap for certain retirees which limits average Company contributions. The Hartford has prefunded a portion of the health care obligations through a trust fund where such prefunding can be accomplished on a tax effective basis. Beginning January 1, 2017, for retirees 65 and older who were participating in the Retiree PPO Medical
Plan, the Company funds the cost of medical and dental health care benefits through contributions to a Health Reimbursement Account and covered individuals can access a variety of insurance plans from a health care exchange. Effective January 1, 2002, Company-subsidized retiree medical, retiree dental and retiree life insurance benefits were eliminated for employees with original hire dates with the Company on or after January 1, 2002. The Company also amended its postretirement medical, dental and life insurance coverage plans to no longer provide subsidized coverage for employees who retired on or after January 1, 2014.
Assumptions
Pursuant to accounting principles related to the Company’s pension and other postretirement obligations to employees under its various benefit plans, the Company is required to make a significant number of assumptions in order to calculate the related liabilities and expenses each period. The two economic assumptions that have the most impact on pension and other postretirement expense under the defined benefit pension plan and group retiree health plan are the discount rate and the expected long-term rate of return on plan assets. The assumed discount rates and yield curve is based on high-quality fixed income investments consistent with the maturity profile of the expected liability cash flows. Based on all available market and industry information, it was determined that 3.73%4.35% and 3.55%4.23% were the appropriate discount rates as of December 31, 20172018 to calculate the Company’s pension and other postretirement obligations, respectively.
The expected long-term rate of return is based onconsiders the actual compound rates of return earned over various historical time periods. The Company also considers the investment volatility, duration and total returns for various time periods related to the characteristics of the pension obligation, which are influenced by the Company's workforce demographics. In addition, the Company considers long-term market return expectations for an investment mix that generally anticipates 60% fixed income securities and 40% non fixed income securities (global equities, hedge funds and private market alternatives) to derive an expected long-term rate of return. Based upon these analyses, management determined the long-term rate of return assumption to be 6.60% and 6.70%6.60% for the years ended December 31, 20172018 and 2016,2017, respectively. To determine the Company's 20182019 expense, the Company is currently assuming an expected long-term rate of return on plan assets of 6.60%.6.45% and 6.00% for the Company's pension and other post retirement obligations, respectively.
Weighted Average Assumptions Used in Calculating the Benefit Obligations and the Net Amount Recognized
|
| | | | | | | | |
| | Pension Benefits | Other Postretirement Benefits |
| | For the years ended December 31, |
| | 2017 | 2016 | 2017 | 2016 |
| Discount rate | 3.73 | % | 4.22 | % | 3.55 | % | 3.97 | % |
|
| | | | | | | | |
| | Pension Benefits | Other Postretirement Benefits |
| | For the years ended December 31, |
| | 2018 | 2017 | 2018 | 2017 |
| Discount rate | 4.35 | % | 3.73 | % | 4.23 | % | 3.55 | % |
THE HARTFORD FINANCIAL SERVICES GROUP, INC.
NOTES TO CONSOLIDATED FINANCIAL STATEMENTS (continued)
18. Employee Benefit Plans (continued)
Weighted Average Assumptions Used in Calculating the Net Periodic Benefit Cost for Pension Plans
|
| | | | | | |
| | For the years ended December 31, |
| | 2018 | 2017 | 2016 |
| Discount rate | 3.73 | % | 4.22 | % | 4.25 | % |
| Expected long-term rate of return on plan assets | 6.60 | % | 6.60 | % | 6.70 | % |
|
| | | | | | |
| | For the years ended December 31, |
| | 2017 | 2016 | 2015 |
| Discount rate | 4.22 | % | 4.25 | % | 4.00 | % |
| Expected long-term rate of return on plan assets | 6.60 | % | 6.70 | % | 6.90 | % |
NOTES TO CONSOLIDATED FINANCIAL STATEMENTS (continued)
Weighted Average Assumptions Used in Calculating the Net Periodic Benefit Cost for Other Postretirement Plans
|
| | | | | | |
| | For the years ended December 31, |
| | 2018 | 2017 | 2016 |
| Discount rate | 3.55 | % | 3.97 | % | 4.00 | % |
| Expected long-term rate of return on plan assets | 6.60 | % | 6.60 | % | 6.60 | % |
|
| | | | | | |
| | For the years ended December 31, |
| | 2017 | 2016 | 2015 |
| Discount rate | 3.97 | % | 4.00 | % | 3.75 | % |
| Expected long-term rate of return on plan assets | 6.60 | % | 6.60 | % | 6.90 | % |
Assumed Health Care Cost Trend Rates
|
| | | | | | |
| | For the years ended December 31, |
| | 2018 | 2017 | 2016 |
| Pre-65 health care cost trend rate | 6.50 | % | 6.75 | % | 6.90 | % |
| Post-65 health care cost trend rate | N/A |
| N/A |
| N/A |
|
| Rate to which the cost trend rate is assumed to decline (the ultimate trend rate) | 4.50 | % | 4.50 | % | 5.00 | % |
| Year that the rate reaches the ultimate trend rate | 2028 |
| 2028 |
| 2024 |
|
|
| | | | | | |
| | For the years ended December 31, |
| | 2017 | 2016 | 2015 |
| Pre-65 health care cost trend rate | 6.75 | % | 6.90 | % | 7.30 | % |
| Post-65 health care cost trend rate | N/A |
| N/A |
| 5.50 | % |
| Rate to which the cost trend rate is assumed to decline (the ultimate trend rate) | 4.50 | % | 5.00 | % | 5.00 | % |
| Year that the rate reaches the ultimate trend rate | 2028 |
| 2024 |
| 2023 |
|
A one-percentage point change in assumed health care cost trend rates would have an insignificant effect on the amounts reported for other postretirement plans.
Obligations and Funded Status
The following tables set forth a reconciliation of beginning and ending balances of the benefit obligation and fair value of plan assets, as well as the funded status of the Company's defined benefit pension and postretirement health care and life insurance benefit plans. International plans represent an immaterial percentage of total pension assets, liabilities and expense and, for reporting purposes, are combined with domestic plans.
Change in Benefit Obligation | | | | Pension Benefits | Other Postretirement Benefits | Pension Benefits | Other Postretirement Benefits |
| | For the years ended December 31, | For the years ended December 31, |
| | 2017 | 2016 | 2017 | 2016 | 2018 | 2017 | 2018 | 2017 |
| Benefit obligation — beginning of year | $ | 5,650 |
| $ | 5,734 |
| $ | 272 |
| $ | 301 |
| $ | 4,376 |
| $ | 5,650 |
| $ | 256 |
| $ | 272 |
|
| Service cost | 4 |
| 2 |
| — |
| — |
| 4 |
| 4 |
| — |
| — |
|
| Interest cost | 170 |
| 237 |
| 8 |
| 11 |
| 142 |
| 170 |
| 7 |
| 8 |
|
| Plan participants’ contributions | — |
| — |
| 11 |
| 25 |
| — |
| — |
| 11 |
| 11 |
|
| Actuarial loss | 139 |
| 9 |
| 5 |
| 4 |
| |
| Actuarial (gain) loss | | (6 | ) | 139 |
| — |
| 5 |
|
| Settlements | (1,647 | ) | — |
| — |
| — |
| — |
| (1,647 | ) | — |
| — |
|
| Plan Amendment | — |
| — |
| — |
| (1 | ) | |
| Changes in assumptions | 332 |
| (30 | ) | 10 |
| — |
| (329 | ) | 332 |
| (11 | ) | 10 |
|
| Benefits and expenses paid | (273 | ) | (303 | ) | (51 | ) | (68 | ) | (186 | ) | (273 | ) | (45 | ) | (51 | ) |
| Retiree drug subsidy | — |
| — |
| 1 |
| — |
| — |
| — |
| 2 |
| 1 |
|
| Foreign exchange adjustment | 1 |
| 1 |
| — |
| — |
| (1 | ) | 1 |
| — |
| — |
|
| Benefit obligation — end of year | $ | 4,376 |
| $ | 5,650 |
| $ | 256 |
| $ | 272 |
| $ | 4,000 |
| $ | 4,376 |
| $ | 220 |
| $ | 256 |
|
Changes in assumptions in 2018 primarily included a $281 decrease in the benefit obligation for pension benefits as a result of an increase in the discount rate from 3.73% as of the December 31, 2017 primarilyvaluation to 4.35% as of the December 31, 2018 valuation. Changes in assumptions in 2017 included a $350 increase in the benefit obligation for pension benefits as a result of a decline in the discount rate from 4.22% as of the December 31, 2016 valuation to 3.73% as of the December 31, 2017 valuation. Changes
The cash balance plan pension benefit obligation was $412 and $443 as of December 31, 2018 and 2017, respectively. The interest crediting rate was 3.30% in assumptions in 2016 included a decrease of $51 related to the Company's use of updated mortality rates, partially offset by an increase of $21 related to a reduction in the discount rate.2018, 2017, and 2016.
On June 30, 2017, the Company transferred invested assets and cash from plan assets to purchase a group annuity contract that transferred approximately $1.6 billion of the Company's outstanding pension obligations related to certain U.S. retirees, terminated vested participants and beneficiaries. As a result of this transaction, the Company recognized a pre-tax settlement charge of $750. The settlement charge was included in the corporate category for segment reporting.
THE HARTFORD FINANCIAL SERVICES GROUP, INC.
NOTES TO CONSOLIDATED FINANCIAL STATEMENTS (continued)
18. Employee Benefit Plans (continued)
Change in Plan Assets
|
| | | | | | | | | | | | |
| | Pension Benefits | Other Postretirement Benefits |
| | For the years ended December 31, |
| | 2018 | 2017 | 2018 | 2017 |
| Fair value of plan assets — beginning of year | $ | 3,592 |
| $ | 4,678 |
| $ | 114 |
| $ | 138 |
|
| Actual return on plan assets | (172 | ) | 549 |
| (2 | ) | 11 |
|
| Employer contributions | 103 |
| 280 |
| — |
| — |
|
| Benefits paid [1] | (161 | ) | (248 | ) | (27 | ) | (35 | ) |
| Expenses paid | (17 | ) | (21 | ) | — |
| — |
|
| Settlements | — |
| (1,647 | ) | — |
| — |
|
| Foreign exchange adjustment | (1 | ) | 1 |
| — |
| — |
|
| Fair value of plan assets — end of year | $ | 3,344 |
| $ | 3,592 |
| $ | 85 |
| $ | 114 |
|
| Funded status — end of year | $ | (656 | ) | $ | (784 | ) | $ | (135 | ) | $ | (142 | ) |
|
| | | | | | | | | | | | |
| | Pension Benefits | Other Postretirement Benefits |
| | For the years ended December 31, |
| | 2017 | 2016 | 2017 | 2016 |
| Fair value of plan assets — beginning of year | $ | 4,678 |
| $ | 4,430 |
| $ | 138 |
| $ | 162 |
|
| Actual return on plan assets | 549 |
| 250 |
| 11 |
| 9 |
|
| Employer contributions | 280 |
| 301 |
| — |
| — |
|
| Benefits paid [1] | (248 | ) | (279 | ) | (35 | ) | (33 | ) |
| Expenses paid | (21 | ) | (24 | ) | — |
| — |
|
| Settlements | (1,647 | ) | — |
| — |
| — |
|
| Foreign exchange adjustment | 1 |
| — |
| — |
| — |
|
| Fair value of plan assets — end of year | $ | 3,592 |
| $ | 4,678 |
| $ | 114 |
| $ | 138 |
|
| Funded status — end of year | $ | (784 | ) | $ | (972 | ) | $ | (142 | ) | $ | (134 | ) |
| |
| [1] | Other postretirement benefits paid represent non-key employee postretirement medical benefits paid from the Company's prefunded trust fund. |
The fair value of assets for pension benefits, and hence the funded status, presented in the table above excludes assets of $144$139 and $132$144 as of December 31, 20172018 and 2016,2017, respectively, held in rabbi trusts and designated for the non-qualified pension plans. The assets do not qualify as plan assets; however, the assets are available to pay benefits for certain retired, terminated and active participants. Such assets are available to the Company’s general creditors in the event of insolvency. The rabbi trust assets consist of equity and fixed income investments. To the extent the fair value of these rabbi trusts were included in the table above, pension plan assets would have been $3,736$3,483 and $4,811$3,736 as of December 31, 20172018 and 2016,2017, respectively, and the funded status of pension benefits would have been $(640) $(517)and $(840)$(640) as of December 31, 20172018 and 2016,2017, respectively.
Defined Benefit Pension Plans with an Accumulated Benefit Obligation in Excess of Plan Assets
|
| | | | | | |
| | As of December 31, |
| | 2018 | 2017 |
| Projected benefit obligation | $ | 4,000 |
| $ | 4,376 |
|
| Accumulated benefit obligation | $ | 4,000 |
| $ | 4,376 |
|
| Fair value of plan assets | $ | 3,344 |
| $ | 3,592 |
|
|
| | | | | | |
| | As of December 31, |
| | 2017 | 2016 |
| Projected benefit obligation | $ | 4,376 |
| $ | 5,650 |
|
| Accumulated benefit obligation | 4,376 |
| 5,650 |
|
| Fair value of plan assets | 3,592 |
| 4,678 |
|
As of December 31, 2017 and 2016 , pension and other postretirement benefits plan assets totaling $3.7 billion and $4.8 billion, respectively, were invested in the separate accounts of HLIC. On January 2, 2018, all the invested assets of the defined benefit pension plans and post-retirement benefit plan were transferred to a third party custodian.
Amounts Recognized in the Consolidated Balance Sheets
|
| | | | | | | | | | | | |
| | Pension Benefits | Other Postretirement Benefits |
| | As of December 31, |
| | 2018 | 2017 | 2018 | 2017 |
| Other liabilities | $ | 656 |
| $ | 784 |
| $ | 135 |
| $ | 142 |
|
|
| | | | | | | | | | | | |
| | Pension Benefits | Other Postretirement Benefits |
| | As of December 31, |
| | 2017 | 2016 | 2017 | 2016 |
| Other liabilities | $ | 784 |
| $ | 972 |
| $ | 142 |
| $ | 134 |
|
Components of Net Periodic Benefit Cost (Benefit) and Other Amounts Recognized in Other Comprehensive Income (Loss)
As a result of the pension settlement, in 2017, the Company recognized a pre-tax settlement charge of $750 ($488 after-tax)after tax) and a reduction to shareholders'stockholders' equity of $144.
In connection with this transaction, the Company made a contribution of $280 in September 2017 to the U.S. qualified pension plan in order to maintain the plan's pre-transaction funded status.
Beginning with the first quarter of 2017, the Company adopted the full yield curve approach in the estimation of the interest cost component of net periodic benefit costs for its qualified and non-qualified pension plans and the postretirement benefit plan. The full yield curve approach applies the specific spot rates along the yield curve that are used in its determination of the projected benefit obligation at the beginning of the year. The change has been made to provide a better estimate of the interest cost component of net periodic benefit cost by better aligning projected benefit cash flows with corresponding spot rates on the yield curve rather than using a single weighted average discount rate derived from the yield curve as had been done historically.
This change does not affect the measurement of the Company's total benefit obligations as the change in the interest cost in net income is completely offset in the actuarial (gain) loss reported for the period in other comprehensive income. The change reduced the before tax interest cost component of net periodic benefit cost by $32 as offor the year ended December 31, 2017. The discount rate being used to measure interest cost iswas 3.58% for the period from January 1, 2017 to June 30, 2017 and 3.37% for the period from July 1, 2017 to December 31, 2017 for the qualified pension plan, 3.55% for the non-qualified pension plan, and 3.13% for the postretirement benefit plan. Under the Company's historical estimation approach, the weighted average discount rate for the interest cost component would have been 4.22% for the period from January 1, 2017 to June 30, 2017 and 3.92% for the period from July 1, 2017 to December 31, 2017 for the qualified pension plan, 4.19% for the non-qualified pension plan and 3.97% for the postretirement benefit plan. The Company accounted for this change as a change in estimate, and accordingly, has recognized the effect prospectively beginning in 2017.
THE HARTFORD FINANCIAL SERVICES GROUP, INC.
NOTES TO CONSOLIDATED FINANCIAL STATEMENTS (continued)
18. Employee Benefit Plans (continued)
Net Periodic Cost (Benefit)
|
| | | | | | | | | | | | | | | | | | |
| | Pension Benefits | Other Postretirement Benefits |
| | For the years ended December 31, |
| | 2018 | 2017 | 2016 | 2018 | 2017 | 2016 |
| Service cost | $ | 4 |
| $ | 4 |
| $ | 2 |
| $ | — |
| $ | — |
| $ | — |
|
| Interest cost | 142 |
| 170 |
| 237 |
| 7 |
| 8 |
| 11 |
|
| Expected return on plan assets | (227 | ) | (267 | ) | (311 | ) | (7 | ) | (8 | ) | (10 | ) |
| Amortization of prior service credit | — |
| — |
| — |
| (7 | ) | (7 | ) | (6 | ) |
| Amortization of actuarial loss | 49 |
| 56 |
| 56 |
| 6 |
| 5 |
| 5 |
|
| Settlements | — |
| 750 |
| — |
| — |
| — |
| — |
|
| Net periodic cost (benefit) | $ | (32 | ) | $ | 713 |
| $ | (16 | ) | $ | (1 | ) | $ | (2 | ) | $ | — |
|
|
| | | | | | | | | | | | | | | | | | |
| | Pension Benefits | Other Postretirement Benefits |
| | For the years ended December 31, |
| | 2017 | 2016 | 2015 | 2017 | 2016 | 2015 |
| Service cost | $ | 4 |
| $ | 2 |
| $ | 2 |
| $ | — |
| $ | — |
| $ | — |
|
| Interest cost | 170 |
| 237 |
| 235 |
| 8 |
| 11 |
| 12 |
|
| Expected return on plan assets | (267 | ) | (311 | ) | (311 | ) | (8 | ) | (10 | ) | (12 | ) |
| Amortization of prior service credit | — |
| — |
| — |
| (7 | ) | (6 | ) | (7 | ) |
| Amortization of actuarial loss | 56 |
| 56 |
| 60 |
| 5 |
| 5 |
| 5 |
|
| Settlements | 750 |
| — |
| — |
| — |
| — |
| — |
|
| Net periodic cost (benefit) | $ | 713 |
| $ | (16 | ) | $ | (14 | ) | $ | (2 | ) | $ | — |
| $ | (2 | ) |
Amounts Recognized in Other Comprehensive Income (Loss)
|
| | | | | | | | | | | | | | | | | | |
| | Pension Benefits | Other Postretirement Benefits |
| | For the years ended December 31, |
| | 2018 | 2017 | 2016 | 2018 | 2017 | 2016 |
| Amortization of actuarial loss | $ | 49 |
| $ | 56 |
| $ | 56 |
| $ | 6 |
| $ | 5 |
| $ | 5 |
|
| Settlement loss | — |
| 750 |
| — |
| — |
| — |
| — |
|
| Amortization of prior service credit | — |
| — |
| — |
| (6 | ) | (7 | ) | (6 | ) |
| Net loss arising during the year | (91 | ) | (209 | ) | (66 | ) | 3 |
| (12 | ) | (4 | ) |
| Total | $ | (42 | ) | $ | 597 |
| $ | (10 | ) | $ | 3 |
| $ | (14 | ) | $ | (5 | ) |
|
| | | | | | | | | | | | |
| | Pension Benefits | Other Postretirement Benefits |
| | For the years ended December 31, |
| | 2017 | 2016 | 2017 | 2016 |
| Amortization of actuarial loss | $ | 56 |
| $ | 56 |
| $ | 5 |
| $ | 5 |
|
| Settlement loss | 750 |
| — |
| — |
| — |
|
| Amortization of prior service credit | — |
| — |
| (7 | ) | (6 | ) |
| Net loss arising during the year | (209 | ) | (66 | ) | (12 | ) | (4 | ) |
| Total | $ | 597 |
| $ | (10 | ) | $ | (14 | ) | $ | (5 | ) |
Amounts in Accumulated Other Comprehensive Income (Loss), Before Tax, not yet Recognized as Components of Net Periodic Benefit Cost
|
| | | | | | | | | | | | | | | | | | |
| | Pension Benefits | Other Postretirement Benefits |
| | As of December 31, |
| | 2018 | 2017 | 2016 | 2018 | 2017 | 2016 |
| Net loss | $ | (2,008 | ) | $ | (1,966 | ) | $ | (2,563 | ) | $ | (120 | ) | $ | (129 | ) | $ | (122 | ) |
| Prior service credit | — |
| — |
| — |
| 72 |
| 78 |
| 85 |
|
| Total | $ | (2,008 | ) | $ | (1,966 | ) | $ | (2,563 | ) | $ | (48 | ) | $ | (51 | ) | $ | (37 | ) |
|
| | | | | | | | | | | | |
| | Pension Benefits | Other Postretirement Benefits |
| | As of December 31, |
| | 2017 | 2016 | 2017 | 2016 |
| Net loss | $ | (1,966 | ) | $ | (2,563 | ) | $ | (129 | ) | $ | (122 | ) |
| Prior service credit | — |
| — |
| 78 |
| 85 |
|
| Total | $ | (1,966 | ) | $ | (2,563 | ) | $ | (51 | ) | $ | (37 | ) |
The pension settlement transaction resulted in ana decrease to unrecognized net loss of $750 in 2017. The estimated net loss for the defined benefit pension plans that will be amortized from
accumulated other comprehensive income (loss) into net periodic benefit cost during 2018 is $48. The estimated prior service cost for the other postretirement benefit plans that will be amortized from accumulated other comprehensive income (loss) into net periodic benefit cost during 2018 is $(7). The estimated net loss for the other postretirement plans that will be amortized from accumulated other comprehensive income into net periodic benefit cost during 2018 is $6.
Plan Assets
Investment Strategy and Target Allocation
The overall investment strategy of the Plan is to maximize total investment returns to provide sufficient funding for present and anticipated future benefit obligations within the constraints of a prudent level of portfolio risk and diversification. With respect to asset management, the oversight responsibility of the Plan rests with The Hartford’s Pension Fund Trust and Investment Committee composed of individuals whose responsibilities include establishing overall objectives and the setting of investment policy; selecting appropriate investment options and ranges; reviewing the asset allocation mix and asset allocation targets on a regular basis; and monitoring performance to determine whether or not the rate of return objectives are being met and that policy and guidelines are being followed. The Company believes that the asset allocation decision will be the single most important factor determining the long-term performance of the Plan.
Target Asset Allocation
|
| | | | | | | | |
| | Pension Plans | Other Postretirement Plans |
| | Minimum | Maximum | Minimum | Maximum |
| Equity securities | 5 | % | 35 | % | 15 | % | 45 | % |
| Fixed income securities | 50 | % | 70 | % | 55 | % | 85 | % |
| Alternative assets | — | % | 45 | % | — | % | — | % |
|
| | | | | | | | |
| | Pension Plans | Other Postretirement Plans |
| | minimum | maximum | minimum | maximum |
| Equity securities | 5 | % | 35 | % | 15 | % | 45 | % |
| Fixed income securities | 50 | % | 70 | % | 55 | % | 85 | % |
| Alternative assets | — | % | 45 | % | — | % | — | % |
Divergent market performance among different asset classes may, from time to time, cause the asset allocation to deviate from the desired asset allocation ranges. The asset allocation mix is reviewed on a periodic basis. If it is determined that an asset allocation mix rebalancing is required, future portfolio additions and withdrawals will be used, as necessary, to bring the allocation within tactical ranges.
The majority of the Plan assets are invested in Hartford Life Insurance Company separate accounts managed by HIMCO, a wholly-owned subsidiary of the Company. On January 2, 2018, the assets of the plan previously invested in the separate accounts of HLIC were transferred to a third party custodian. The Plan invests in commingled funds and partnerships managed by unaffiliated managers to gain exposure to emerging markets, equity, hedge funds and other alternative investments.
THE HARTFORD FINANCIAL SERVICES GROUP, INC.
NOTES TO CONSOLIDATED FINANCIAL STATEMENTS (continued)
These portfolios encompass multiple asset classes reflecting the current needs of the Plan, the investment preferences and risk tolerance of the Plan and the desired degree of diversification. These asset classes include publicly traded equities, bonds and alternative investments and are made up of individual investments in cash
THE HARTFORD FINANCIAL SERVICES GROUP, INC.
NOTES TO CONSOLIDATED FINANCIAL STATEMENTS (continued)
18. Employee Benefit Plans (continued)
and cash equivalents, equity securities, debt securities, asset-backed securities, mortgage loans and hedge funds. Hedge fund investments represent a diversified portfolio of partnership investments in a variety of strategies.
In addition, the Company uses U.S. Treasury bond futures contracts and U.S. Treasury STRIPS in a duration overlay program to adjust the duration of Plan assets to better match the duration of the benefit obligation.
Investment Valuation
For further discussion of the valuation of investments, see Note 5 - Fair Value Measurements of Notes to Consolidated Financial Statements.
Pension Plan Assets at Fair Value as of December 31, 20172018
| | | Asset Category | Level 1 | Level 2 | Level 3 | Total | Level 1 | Level 2 | Level 3 | Total |
| Short-term investments: | $ | 21 |
| $ | 168 |
| $ | — |
| $ | 189 |
| $ | 50 |
| $ | 60 |
| $ | — |
| $ | 110 |
|
| Fixed Income Securities: | | |
| Corporate | — |
| 1,549 |
| 14 |
| 1,563 |
| — |
| 1,663 |
| 14 |
| 1,677 |
|
| RMBS | — |
| 28 |
| 2 |
| 30 |
| — |
| 62 |
| 1 |
| 63 |
|
| U.S. Treasuries | 3 |
| 74 |
| — |
| 77 |
| 10 |
| 120 |
| — |
| 130 |
|
| Foreign government | — |
| 16 |
| 1 |
| 17 |
| — |
| 15 |
| 2 |
| 17 |
|
| CMBS | — |
| 28 |
| 2 |
| 30 |
| — |
| 22 |
| — |
| 22 |
|
| Other fixed income [1] | — |
| 97 |
| 2 |
| 99 |
| — |
| 52 |
| 1 |
| 53 |
|
| Mortgage Loans | — |
| — |
| 140 |
| 140 |
| — |
| — |
| 133 |
| 133 |
|
| Equity Securities: | | |
| Large-cap domestic | 595 |
| 89 |
| — |
| 684 |
| |
| Mid-cap domestic | 11 |
| — |
| — |
| 11 |
| |
| Domestic | | 376 |
| 3 |
| — |
| 379 |
|
| International | 343 |
| — |
| — |
| 343 |
| 303 |
| — |
| — |
| 303 |
|
| Total pension plan assets at fair value, in the fair value hierarchy [2] | $ | 973 |
| $ | 2,049 |
| $ | 161 |
| $ | 3,183 |
| $ | 739 |
| $ | 1,997 |
| $ | 151 |
| $ | 2,887 |
|
| Other Investments, at net asset value [3]: | | |
| Private Market Alternatives | — |
| — |
| — |
| 168 |
|
|
|
|
|
|
| 272 |
|
| Hedge funds | — |
| — |
| — |
| 212 |
|
|
|
|
|
|
| 186 |
|
| Total pension plan assets at fair value. | $ | 973 |
| $ | 2,049 |
| $ | 161 |
| $ | 3,563 |
| $ | 739 |
| $ | 1,997 |
| $ | 151 |
| $ | 3,345 |
|
| |
| [1] | Includes ABS, municipal bonds, and CDOs. |
| |
| [2] | Excludes approximately $1 of investment payables net of investment receivables that are excluded from this disclosure requirement because they are trade receivables in the ordinary course of business where the carrying amount approximates fair value. |
| |
| [3] | Investments that are measured at net asset value per share or an equivalent and have not been classified in the fair value hierarchy. |
Pension Plan Assets at Fair Value as of December 31, 2017
|
| | | | | | | | | | | | |
| Asset Category | Level 1 | Level 2 | Level 3 | Total |
| Short-term investments: | $ | 21 |
| $ | 168 |
| $ | — |
| $ | 189 |
|
| Fixed Income Securities: | | | | |
| Corporate | — |
| 1,549 |
| 14 |
| 1,563 |
|
| RMBS | — |
| 28 |
| 2 |
| 30 |
|
| U.S. Treasuries | 3 |
| 74 |
| — |
| 77 |
|
| Foreign government | — |
| 16 |
| 1 |
| 17 |
|
| CMBS | — |
| 28 |
| 2 |
| 30 |
|
| Other fixed income [1] | — |
| 97 |
| 2 |
| 99 |
|
| Mortgage Loans | — |
| — |
| 140 |
| 140 |
|
| Equity Securities: | | | | |
| Large-cap domestic | 595 |
| 89 |
| — |
| 684 |
|
| Mid-cap domestic | 11 |
| — |
| — |
| 11 |
|
| International | 343 |
| — |
| — |
| 343 |
|
| Total pension plan assets at fair value, in the fair value hierarchy [2] | $ | 973 |
| $ | 2,049 |
| $ | 161 |
| $ | 3,183 |
|
| Other Investments, at net asset value [3]: | | | | |
| Private Market Alternatives |
|
|
|
|
|
| 168 |
|
| Hedge funds |
|
|
|
|
|
| 212 |
|
| Total pension plan assets at fair value. | $ | 973 |
| $ | 2,049 |
| $ | 161 |
| $ | 3,563 |
|
| |
| [1] | Includes ABS, municipal bonds, and CDOs. |
| |
| [2] | Excludes approximately $1 of investment payables net of investment receivables that are excluded from this disclosure requirement because they are trade receivables in the ordinary course of business where the carrying amount approximates fair value. Also excludes approximately $30 of interest receivable. |
| |
[3] | Investments that are measured at net asset value per share or an equivalent and have not been classified in the fair value hierarchy. |
Pension Plan Assets at Fair Value as of December 31, 2016
|
| | | | | | | | | | | | |
| Asset Category | Level 1 | Level 2 | Level 3 | Total |
| Short-term investments: | $ | 12 |
| $ | 299 |
| $ | — |
| $ | 311 |
|
| Fixed Income Securities: | | | | |
| Corporate | — |
| 1,469 |
| 13 |
| 1,482 |
|
| RMBS | — |
| 266 |
| 10 |
| 276 |
|
| U.S. Treasuries | 69 |
| 649 |
| 4 |
| 722 |
|
| Foreign government | — |
| 37 |
| 1 |
| 38 |
|
| CMBS | — |
| 131 |
| — |
| 131 |
|
| Other fixed income [1] | — |
| 96 |
| 18 |
| 114 |
|
| Mortgage Loans | — |
| — |
| 121 |
| 121 |
|
| Equity Securities: | | | | |
| Large-cap domestic | 589 |
| 107 |
| — |
| 696 |
|
| Mid-cap domestic | 23 |
| — |
| — |
| 23 |
|
| International | 300 |
| — |
| — |
| 300 |
|
| Total pension plan assets at fair value, in the fair value hierarchy [2] | $ | 993 |
| $ | 3,054 |
| $ | 167 |
| $ | 4,214 |
|
| Other Investments, at net asset value [3]: | | | | |
| Private Market Alternatives | — |
| — |
| — |
| 87 |
|
| Hedge funds | — |
| — |
| — |
| 340 |
|
| Total pension plan assets at fair value. | $ | 993 |
| $ | 3,054 |
| $ | 167 |
| $ | 4,641 |
|
| |
[1] | Includes ABS,municipal bonds, and CDOs. |
| |
[2] | Excludes approximately $2 of investment payables net of investment receivables that are excluded from this disclosure requirement because they are trade receivables in the ordinary course of business where the carrying amount approximates fair value. Also excludes approximately $39 of interest receivable.
|
| |
| [3] | Investments that are measured at net asset value per share or an equivalent and have not been classified in the fair value hierarchy. |
The tables below provide fair value level 3 roll-forwardsrollforwards for the Pension Plan Assets for which significant unobservable inputs (Level 3) are used in the fair value measurement on a recurring basis. The Plan classifies the fair value of financial instruments within Level 3 if there are no observable markets for the instruments or, in the absence of active markets, if one or more of the significant inputs used to determine fair value are based on the Plan’s own assumptions. Therefore, the gains and losses in the tables below include changes in fair value due to both observable and unobservable factors.
THE HARTFORD FINANCIAL SERVICES GROUP, INC.
NOTES TO CONSOLIDATED FINANCIAL STATEMENTS (continued)
18. Employee Benefit Plans (continued)
|
| | | | | | | | | | | | | | | | | | |
| 2018 Pension Plan Asset Fair Value Measurements Using Significant Unobservable Inputs (Level 3) |
| Assets | Corporate | RMBS | Foreign government | Mortgage loans | Other [1] | Totals |
| Fair Value as of January 1, 2018 | $ | 14 |
| $ | 2 |
| $ | 1 |
| $ | 140 |
| $ | 4 |
| $ | 161 |
|
| Realized gains,net | — |
| — |
| — |
| — |
| — |
| — |
|
| Changes in unrealized gains (losses), net | (1 | ) | — |
| — |
| (1 | ) | — |
| (2 | ) |
| Purchases | 5 |
| — |
| 1 |
| — |
| — |
| 6 |
|
| Settlements | — |
| — |
| — |
| — |
| — |
| — |
|
| Sales | (4 | ) | (1 | ) | — |
| (6 | ) | (3 | ) | (14 | ) |
| Transfers into Level 3 | — |
| — |
| — |
| — |
| — |
| — |
|
| Transfers out of Level 3 | — |
| — |
| — |
| — |
| — |
| — |
|
| Fair Value as of December 31, 2018 | $ | 14 |
| $ | 1 |
| $ | 2 |
| $ | 133 |
| $ | 1 |
| $ | 151 |
|
|
| | | | | | | | | | | | | | | | | | |
| 2017 Pension Plan Asset Fair Value Measurements Using Significant Unobservable Inputs (Level 3) |
| Assets | Corporate | RMBS | Foreign government | Mortgage loans | Other [1] | Totals |
| Fair Value as of January 1, 2017 | $ | 13 |
| $ | 10 |
| $ | 1 |
| $ | 121 |
| $ | 22 |
| $ | 167 |
|
| Realized gains,net | — |
| — |
| — |
| — |
| 2 |
| 2 |
|
| Changes in unrealized gains, net | 2 |
| — |
| — |
| 2 |
| 2 |
| 6 |
|
| Purchases | 11 |
| 1 |
| — |
| 17 |
| 7 |
| 36 |
|
| Settlements | — |
| (5 | ) | — |
| — |
| (1 | ) | (6 | ) |
| Sales | (12 | ) | (4 | ) | — |
| — |
| (19 | ) | (35 | ) |
| Transfers into Level 3 | — |
| — |
| — |
| — |
| 2 |
| 2 |
|
| Transfers out of Level 3 | — |
| — |
| — |
| — |
| (11 | ) | (11 | ) |
| Fair Value as of December 31, 2017 | $ | 14 |
| $ | 2 |
| $ | 1 |
| $ | 140 |
| $ | 4 |
| $ | 161 |
|
| |
| [1] | "Other" includes U.S. Treasuries, Other fixed income and CMBS investments. |
During the year ended December 31, 2017,2018, transfers into and (out) of Level 3 are primarily attributable to the appearance of or
lack thereof of market observable information and the re-evaluation of the observability of pricing inputs.
| | | 2016 Pension Plan Asset Fair Value Measurements Using Significant Unobservable Inputs (Level 3) | |
| 2017 Pension Plan Asset Fair Value Measurements Using Significant Unobservable Inputs (Level 3) | | 2017 Pension Plan Asset Fair Value Measurements Using Significant Unobservable Inputs (Level 3) |
| Assets | Corporate | RMBS | Foreign government | Mortgage loans | Other [1] | Totals | Corporate | RMBS | Foreign government | Mortgage loans | Other [1] | Totals |
| Fair Value as of January 1, 2016 | $ | 19 |
| $ | 24 |
| $ | 5 |
| $ | 54 |
| $ | 5 |
| $ | 107 |
| |
| Fair Value as of January 1, 2017 | | $ | 13 |
| $ | 10 |
| $ | 1 |
| $ | 121 |
| $ | 22 |
| $ | 167 |
|
| Realized gains,net | — |
| — |
| — |
| — |
| 1 |
| 1 |
| — |
| — |
| — |
| — |
| 2 |
| 2 |
|
| Changes in unrealized gains (losses), net | — |
| — |
| — |
| (3 | ) | — |
| (3 | ) | |
| Changes in unrealized gains, net | | 2 |
| — |
| — |
| 2 |
| 2 |
| 6 |
|
| Purchases | 15 |
| — |
| — |
| 70 |
| 24 |
| 109 |
| 11 |
| 1 |
| — |
| 17 |
| 7 |
| 36 |
|
| Settlements | — |
| (14 | ) | — |
| — |
| (1 | ) | (15 | ) | — |
| (5 | ) | — |
| — |
| (1 | ) | (6 | ) |
| Sales | (10 | ) | — |
| (4 | ) | — |
| (9 | ) | (23 | ) | (12 | ) | (4 | ) | — |
| — |
| (19 | ) | (35 | ) |
| Transfers into Level 3 | — |
| 2 |
| — |
| — |
| 3 |
| 5 |
| — |
| — |
| — |
| — |
| 2 |
| 2 |
|
| Transfers out of Level 3 | (11 | ) | (2 | ) | — |
| — |
| (1 | ) | (14 | ) | — |
| — |
| — |
| — |
| (11 | ) | (11 | ) |
| Fair Value as of December 31, 2016 | $ | 13 |
| $ | 10 |
| $ | 1 |
| $ | 121 |
| $ | 22 |
| $ | 167 |
| |
| Fair Value as of December 31, 2017 | | $ | 14 |
| $ | 2 |
| $ | 1 |
| $ | 140 |
| $ | 4 |
| $ | 161 |
|
and Other fixed income and CMBS investments.During the year ended December 31, 2016,2017, transfers in and/or (out) of Level 3 are primarily attributable to the availability of market observable information and the re-evaluation of the observability of pricing inputs.
There was noless than $1 in Company common stock included in the Plan’s assets as of December 31, 20172018 and 2016.2017.
THE HARTFORD FINANCIAL SERVICES GROUP, INC.
NOTES TO CONSOLIDATED FINANCIAL STATEMENTS (continued)
18. Employee Benefit Plans (continued)
| | Other Postretirement Plan Assets at Fair Value as of December 31, 2017 | |
Other Postretirement Plan Assets at Fair Value as of December 31, 2018 | | Other Postretirement Plan Assets at Fair Value as of December 31, 2018 |
| Asset Category | Level 1 | Level 2 | Level 3 | Total | Level 1 | Level 2 | Level 3 | Total |
| Short-term investments | $ | 4 |
| $ | — |
| $ | — |
| $ | 4 |
| $ | 4 |
| $ | — |
| $ | — |
| $ | 4 |
|
| Fixed Income Securities: | | |
| Corporate | — |
| 25 |
| — |
| 25 |
| — |
| 19 |
| — |
| 19 |
|
| RMBS | — |
| 17 |
| — |
| 17 |
| — |
| 15 |
| — |
| 15 |
|
| U.S. Treasuries | 1 |
| 25 |
| — |
| 26 |
| 6 |
| 13 |
| — |
| 19 |
|
| Foreign government | — |
| 1 |
| — |
| 1 |
| — |
| 1 |
| — |
| 1 |
|
| CMBS | — |
| 5 |
| — |
| 5 |
| — |
| 2 |
| — |
| 2 |
|
| Other fixed income | — |
| 4 |
| 1 |
| 5 |
| — |
| 2 |
| — |
| 2 |
|
| Equity Securities: | | |
| Large-cap | 30 |
| — |
| — |
| 30 |
| 23 |
| — |
| — |
| 23 |
|
| Total other postretirement plan assets at fair value [1] | $ | 35 |
| $ | 77 |
| $ | 1 |
| $ | 113 |
| $ | 33 |
| $ | 52 |
| $ | — |
| $ | 85 |
|
| |
| [1] | Excludes approximately $1 of investment receivables net of investment payables that are excluded from this disclosure requirement because they are trade receivables in the ordinary course of business where the carrying amount approximates fair value. |
|
| | | | | | | | | | | | |
Other Postretirement Plan Assets at Fair Value as of December 31, 2017 |
| Asset Category | Level 1 | Level 2 | Level 3 | Total |
| Short-term investments | $ | 4 |
| $ | — |
| $ | — |
| $ | 4 |
|
| Fixed Income Securities: | | | | |
| Corporate | — |
| 25 |
| — |
| 25 |
|
| RMBS | — |
| 17 |
| — |
| 17 |
|
| U.S. Treasuries | 1 |
| 25 |
| — |
| 26 |
|
| Foreign government | — |
| 1 |
| — |
| 1 |
|
| CMBS | — |
| 5 |
| — |
| 5 |
|
| Other fixed income | — |
| 4 |
| 1 |
| 5 |
|
| Equity Securities: | | | | |
| Large-cap | 30 |
| — |
| — |
| 30 |
|
| Total other postretirement plan assets at fair value [1] | $ | 35 |
| $ | 77 |
| $ | 1 |
| $ | 113 |
|
| |
| [1] | Excludes approximately $0 of investment payables net of investment receivables that are excluded from this disclosure requirement because they are trade receivables in the ordinary course of business where the carrying amount approximates fair value. Also excludes approximately $1 of interest receivable. |
For other postretirement plan assets measured using significant unobservable inputs (level 3), the fair value for other fixed income securities decreased from $1 as of December 31, 2017 to $0 as of December 31, 2018 due to $1 in sales.
For other postretirement plan level 3 assets, the fair value of corporate securities decreased from $1 as of December 31, 2016 to $0 as of December 31, 2017 due to $1 in purchases and $2 in sales. RMBS decreased from $1 to $0 due to $1 in settlements. Other fixed income remained at $1 from 2016 to 2017 due to $1 in purchases and $1 transfers out of level 3.
|
| | | | | | | | | | | | |
Other Postretirement Plan Assets at Fair Value as of December 31, 2016 |
| Asset Category | Level 1 | Level 2 | Level 3 | Total |
| Short-term investments | $ | 4 |
| $ | — |
| $ | — |
| $ | 4 |
|
| Fixed Income Securities: | | | | |
| Corporate | — |
| 35 |
| 1 |
| 36 |
|
| RMBS | — |
| 24 |
| 1 |
| 25 |
|
| U.S. Treasuries | 5 |
| 14 |
| — |
| 19 |
|
| Foreign government | — |
| 2 |
| — |
| 2 |
|
| CMBS | — |
| 9 |
| — |
| 9 |
|
| Other fixed income | — |
| 4 |
| 1 |
| 5 |
|
| Equity Securities: | | | | |
| Large-cap | 37 |
| — |
| — |
| 37 |
|
| Total other postretirement plan assets at fair value [1] | $ | 46 |
| $ | 88 |
| $ | 3 |
| $ | 137 |
|
| |
[1] | Excludes approximately $1 of interest receivable carried at fair value.
|
|
| | | | | | | | | | | | | | | |
| Other Postretirement Plan Asset Fair Value Measurements Using Significant Unobservable Inputs (Level 3) |
| Assets | Corporate | RMBS | Foreign Government | Other Fixed Income | Totals |
| Fair Value as of January 1, 2017 | $ | 1 |
| $ | 1 |
| $ | — |
| $ | 1 |
| $ | 3 |
|
| Changes in unrealized gains (losses), net | — |
| — |
| — |
| — |
| — |
|
| Purchases | 1 |
| — |
| — |
| 1 |
| 2 |
|
| Settlements | — |
| (1 | ) | — |
| — |
| (1 | ) |
| Sales | (2 | ) | — |
| — |
| — |
| (2 | ) |
| Transfers into Level 3 | — |
| — |
| — |
| — |
| — |
|
| Transfers out of Level 3 | — |
| — |
| — |
| (1 | ) | (1 | ) |
| Fair Value as of December 31, 2017 | $ | — |
| $ | — |
| $ | — |
| $ | 1 |
| $ | 1 |
|
|
| | | | | | | | | | | | | | | |
| Other Postretirement Plan Asset Fair Value Measurements Using Significant Unobservable Inputs (Level 3) |
| Assets | Corporate | RMBS | Foreign Government | Other Fixed Income | Totals |
| Fair Value as of January 1, 2016 | $ | 2 |
| $ | 3 |
| $ | — |
| $ | — |
| $ | 5 |
|
| Changes in unrealized gains (losses), net | — |
| — |
| — |
| — |
| — |
|
| Purchases | 1 |
| — |
| — |
| 1 |
| 2 |
|
| Settlements | — |
| (2 | ) | — |
| — |
| (2 | ) |
| Sales | (1 | ) | — |
| — |
| — |
| (1 | ) |
| Transfers into Level 3 | — |
| — |
| — |
| — |
| — |
|
| Transfers out of Level 3 | (1 | ) | — |
| — |
| — |
| (1 | ) |
| Fair Value as of December 31, 2016 | $ | 1 |
| $ | 1 |
| $ | — |
| $ | 1 |
| $ | 3 |
|
THE HARTFORD FINANCIAL SERVICES GROUP, INC.
NOTES TO CONSOLIDATED FINANCIAL STATEMENTS (continued)
18. Employee Benefit Plans (continued)
There was no Company common stock included in the other postretirement benefit plan assets as of December 31, 20172018 and 20162017.
Concentration of Risk
In order to minimize risk, the Plan maintains a listing of permissible and prohibited investments. In addition, the Plan has certain concentration limits and investment quality requirements imposed on permissible investment options. Permissible investments include U.S. equity, international equity, alternative asset and fixed income investments including derivative instruments. DerivativePermissible derivative instruments include futurefutures contracts, options, swaps, currency forwards, caps or floors and willmay be used to control risk or enhance return but will not be used for leverage purposes.
Securities specifically prohibited from purchase include, but are not limited to: shares or fixed income instruments issued by The Hartford, short sales of any type within long-only portfolios, non-derivative securities involving the use of margin, leveraged floaters and inverse floaters, including money market obligations, natural resource real properties such as oil, gas or timber and precious metals.
Other than U.S. government and certain U.S. government agencies backed by the full faith and credit of the U.S. government, the Plan does not have any material exposure to any concentration risk of a single issuer.
Cash Flows
Company Contributions
|
| | | | | | |
| Employer Contributions | Pension Benefits | Other Postretirement Benefits |
| 2018 | $ | 103 |
| $ | — |
|
| 2017 | $ | 281 |
| $ | — |
|
|
| | | | | | |
| Employer Contributions | Pension Benefits | Other Postretirement Benefits |
| 2017 | $ | 281 |
| $ | — |
|
| 2016 | $ | 301 |
| $ | — |
|
In 20172018, the Company, at its discretion, made $280$101 in contributions to the U.S. qualified defined benefit pension plan. The Company does not have a 20182019 required minimum funding contribution for the U.S. qualified defined benefit pension plan. The Company has not determined whether, and to what extent, contributions may be made to the U. S. qualified defined benefit pension plan in 2018.2019. The Company will monitor the funded status of the U.S. qualified defined benefit pension plan during 20182019 to make this determination.
Employer contributions in 20172018 and 20162017 were made in cash and did not include contributions of the Company’s common stock.
THE HARTFORD FINANCIAL SERVICES GROUP, INC.
NOTES TO CONSOLIDATED FINANCIAL STATEMENTS (continued)
Benefit Payments
Amounts of Benefits Expected to be Paid over the next Ten Years from Pension and other Postretirement Plans as of December 31, 20172018
|
| | | | | | |
| | Pension Benefits | Other Postretirement Benefits |
| 2019 | $ | 239 |
| $ | 27 |
|
| 2020 | 239 |
| 24 |
|
| 2021 | 246 |
| 22 |
|
| 2022 | 251 |
| 20 |
|
| 2023 | 250 |
| 18 |
|
| 2024 - 2028 | 1,263 |
| 67 |
|
| Total | $ | 2,488 |
| $ | 178 |
|
|
| | | | | | |
| | Pension Benefits | Other Postretirement Benefits |
| 2018 | $ | 221 |
| $ | 30 |
|
| 2019 | 237 |
| 27 |
|
| 2020 | 240 |
| 24 |
|
| 2021 | 247 |
| 22 |
|
| 2022 | 247 |
| 20 |
|
| 2023 - 2027 | 1,253 |
| 74 |
|
| Total | $ | 2,445 |
| $ | 197 |
|
THE HARTFORD FINANCIAL SERVICES GROUP, INC.NOTES TO CONSOLIDATED FINANCIAL STATEMENTS (continued)
19. Stock Compensation Plans
STOCK COMPENSATION PLANS
The Company's stock-based compensation plans are described below. Shares issued in satisfaction of stock-based compensation may be made available from authorized but unissued shares, shares held by the Company in treasury or from shares purchased in the open market. In 2018, 2017 2016 and 2015,2016, the Company issued shares from treasury in satisfaction of stock-based compensation.
Stock-based compensation expense, included in insurance operating costs and other expenses in the consolidated statement of operations, was as follows:
Stock-Based Compensation Expense
|
| | | | | | | | | |
| | For the years ended December 31, |
| | 2018 | 2017 | 2016 |
| Stock-based compensation plans expense [1] | $ | 130 |
| $ | 116 |
| $ | 81 |
|
| Income tax benefit | (27 | ) | (41 | ) | (29 | ) |
| Excess tax benefit on awards vested, exercised and expired | (5 | ) | (15 | ) | — |
|
Total stock-based compensation plans expense, after tax [2] | $ | 98 |
| $ | 60 |
| $ | 52 |
|
|
| | | | | | | | | |
| | For the years ended December 31, |
| | 2017 | 2016 | 2015 |
| Stock-based compensation plans expense [1] | $ | 116 |
| $ | 81 |
| $ | 78 |
|
| Income tax benefit | (41 | ) | (29 | ) | (27 | ) |
| Excess tax benefit on awards vested, exercised and expired | (15 | ) | — |
| — |
|
| Total stock-based compensation plans expense, after-tax | $ | 60 |
| $ | 52 |
| $ | 51 |
|
| |
| [1] | The increase in stock-based compensation plans expense in 2018 and 2017 was largely due to a change made in 2017 to provide accelerated vesting of newly issued restricted stock unit and performance share awards to retirement eligible employees. |
| |
| [2] | The increase in stock-based compensation plans expense, after-tax in 2018 is primarily related to the reduction of the U.S. federal corporate tax rate from 35% to 21%. |
The Company did not capitalize any cost of stock-based compensation. As of December 31, 2017,2018, the total compensation cost related to non-vested awards not yet recognized was $68,$64, which is expected to be recognized over a weighted average period of 1.51.9 years.
In the second quarter of 2018, The Hartford modified the terms of the portion of its outstanding 2016 and 2017 performance
share awards that are based on actual versus targeted return on equity over the performance period. The modification eliminated the benefit to return on equity that arose from the charge against earnings in 2017 driven by the effect of the lower corporate income tax rate on the carrying value of net deferred tax assets. This modification had no impact on compensation cost recognized over the vesting period since compensation cost based on the original performance share conditions is projected to be higher than what the cost would be based on the performance share conditions as modified.
Stock Plan
Future stock-based awards may be granted under The Hartford's 2014 Incentive Stock Plan (the "Incentive Stock Plan") other than the Subsidiary Stock Plan and the Employee Stock Purchase Plan described below. The Incentive Stock Plan provides for awards to be granted in the form of non-qualified or incentive stock options qualifying under Section 422 of the Internal Revenue Code, stock appreciation rights, performance shares, restricted stock or restricted stock units, or any other form of stock-based award. The maximum number of shares, subject to adjustments set forth in the Incentive Stock Plan, that may be issued to Company employees and third party service providers during the 10-year duration of the Incentive Stock Plan is 12,000,000 shares. If any award under an earlier incentive stock plan is forfeited, terminated, surrendered, exchanged, expires unexercised, or is settled in cash in lieu of stock (including to effect tax withholding) or for the net issuance of a lesser number of shares than the
number subject to the award, the shares of stock subject to such award (or the relevant portion thereof) shall be available for awards under the Incentive Stock Plan and such shares shall be added to the maximum limit. As of December 31, 2017,2018, there were 8,397,7847,294,481 shares available for future issuance.
The fair values of awards granted under the Incentive Stock Plan are measured as of the grant date and expensed ratably over the awards’ vesting periods, generally 3 years. For stock option awards to retirement-eligible employees the Company recognizes the expense over a period shorter than the stated vesting period
THE HARTFORD FINANCIAL SERVICES GROUP, INC.
NOTES TO CONSOLIDATED FINANCIAL STATEMENTS (continued)
because the employees receive accelerated vesting upon retirement and therefore the vesting period is considered non-substantive. Beginning with awards granted in 2017, employees with restricted stock units and performance shares receive accelerated vesting upon meeting certain retirement eligibility criteria.
Stock Option Awards
Under the Incentive Stock Plan, options granted have an exercise price at least equal to the market price of the Company’s common stock on the date of grant, and an option’s maximum term is not to exceed 10 years. Options generally become exercisable over a period of three year periodyears commencing one year from the date of grant. Certain other options become exercisable at the later of three years from the date of grant or upon specified market appreciation of the Company's common shares.
The Company uses a hybrid lattice/Monte-Carlo based option valuation model (the “valuation model”) that incorporates the possibility of early exercise of options into the valuation. The valuation model also incorporates the Company’s historical
termination and exercise experience to determine the option value.
The valuation model incorporates ranges of assumptions for inputs, and those ranges are disclosed below. The term structure of volatility is generally constructed utilizing implied volatilities from exchange-traded options, CPP warrants related to the Company’s stock, historical volatility of the Company’s stock and other factors. The Company uses historical data to estimate option exercise and employee termination within the valuation model, and accommodates variations in employee preference and risk-tolerance by segregating the grantee pool into a series of behavioral cohorts and conducting a fair valuation for each cohort individually. The expected term of options granted is derived from the output of the option valuation model and represents, in a mathematical sense, the period of time that options are expected to be outstanding. The risk-free rate for periods within the contractual life of the option is based on the U.S. Constant Maturity Treasury yield curve in effect at the time of grant.
THE HARTFORD FINANCIAL SERVICES GROUP, INC.
NOTES TO CONSOLIDATED FINANCIAL STATEMENTS (continued)
19. Stock Compensation Plans (continued)
Stock Options Valuation Assumptions
|
| | | | | | | | | | | | |
| | For the years ended December 31, |
| | 2018 | 2017 | 2016 |
| Expected dividend yield | 1.8% | 1.9% | 2.0% |
| Expected annualized spot volatility | 20.8 | % | - | 36.5% | 21.8 | % | - | 37.9% | 27.3 | % | - | 41.3% |
| Weighted average annualized volatility | 29.0% | 29.5% | 34.1% |
| Risk-free spot rate | 1.5 | % | - | 2.9% | 0.4 | % | - | 2.4% | 0.3 | % | - | 1.8% |
| Expected term | 5.7 years | 5.0 years | 5.0 years |
|
| | | | | | | | | | | | |
| | For the years ended December 31, |
| | 2017 | 2016 | 2015 |
| Expected dividend yield | 1.9% | 2.0% | 1.8% |
| Expected annualized spot volatility | 21.8 | % | - | 37.9% | 27.3 | % | - | 41.3% | 22.1 | % | - | 39.4% |
| Weighted average annualized volatility | 29.5% | 34.1% | 32.7% |
| Risk-free spot rate | 0.4 | % | - | 2.4% | 0.3 | % | - | 1.8% | — | % | - | 2.6% |
| Expected term | 5.0 years | 5.0 years | 5.0 years |
Non-qualified Stock Option Activity Under the Incentive Stock Plan
|
| | | | | | | | | |
| | Number of Options (in thousands) | Weighted Average Exercise Price | Weighted Average Remaining Contractual Term | Aggregate Intrinsic Value |
| | For the year ended December 31, 2018 |
| Outstanding at beginning of year | 5,212 |
| $ | 37.25 |
| | |
| Granted | 876 |
| $ | 53.81 |
| | |
| Exercised | (571 | ) | $ | 26.43 |
| | |
| Forfeited | — |
| $ | — |
| | |
| Expired | (27 | ) | $ | 74.88 |
| | |
| Outstanding at end of year | 5,490 |
| $ | 40.84 |
| 6.1 years | $ | 32 |
|
| Outstanding, fully vested and expected to vest | 5,240 |
| $ | 42.79 |
| 6.1 years | $ | 30 |
|
| Exercisable at end of year | 3,737 |
| $ | 36.30 |
| 4.9 years | $ | 32 |
|
|
| | | | | | | | | |
| | Number of Options (in thousands) | Weighted Average Exercise Price | Weighted Average Remaining Contractual Term | Aggregate Intrinsic Value |
| | For the year ended December 31, 2017 |
| Outstanding at beginning of year | 4,599 |
| $ | 34.31 |
| | |
| Granted | 988 |
| $ | 48.89 |
| | |
| Exercised | (330 | ) | $ | 26.47 |
| | |
| Forfeited | (22 | ) | $ | 51.98 |
| | |
| Expired | (23 | ) | $ | 90.26 |
| | |
| Outstanding at end of year | 5,212 |
| $ | 37.25 |
| 6.2 years | $ | 97 |
|
| Outstanding, fully vested and expected to vest | 5,156 |
| $ | 37.66 |
| 6.2 years | $ | 94 |
|
| Exercisable at end of year | 3,331 |
| $ | 32.24 |
| 5.0 years | $ | 79 |
|
Aggregate intrinsic value represents the value of the Company's closing stock price on the last trading day of the period in excess of the exercise price multiplied by the number of options outstanding or exercisable. The aggregate intrinsic value excludes the effect of stock options that have a zero or negative intrinsic value. The weighted average grant-date fair value per share of options granted during the years ended December 31, 2018, 2017, and 2016 was $14.04, $12.38 and 2015 was $12.38, $12.14, and $10.60, respectively. The total intrinsic value of options exercised during the years ended December 31, 2018, 2017 and 2016 was $14, $8, and 2015 was $8, $1, and $16, respectively.
Share Awards
Share awards granted under the Incentive Stock Plan and outstanding include restricted stock units and performance shares.
Restricted Stock and Restricted Stock Units
Restricted stock units are share equivalents that are credited with dividend equivalents. Dividend equivalents are accumulated and paid in incremental shares when the underlying units vest.
THE HARTFORD FINANCIAL SERVICES GROUP, INC.
NOTES TO CONSOLIDATED FINANCIAL STATEMENTS (continued)
Restricted stock are shares of The Hartford's common stock with restrictions as to transferability until vested. Restricted stock units and restricted stock awards are valued equal to the market price of the Company’s common stock on the date of grant. Generally, restricted stock units vest at the end of or over three years; certain restricted stock units vest at the end of 5five years. Beginning in 2017, restricted stock units vest at the earlier of
employees retirement eligibility date or three years. Equity awards granted to non-employee directors generally vest in one year and were made in the form of restricted stock units in 2018, 2017 2016 and 2015.2016.
Performance Shares
Performance shares become payable within a range of 0% to 200% of the number of shares initially granted based upon the attainment of specific performance goals achieved at the end of or over three years. While most performance shares vest at the end of or over three years, certain performance shares vest at the end of five years. Beginning in 2017, performance shares vest at the earlier of employees retirement eligibility date or three years.
Performance share awards that are not dependent on market conditions are valued equal to the market price of the Company's
common stock on the date of grant less a discount for the absence of dividends. Stock-compensation expense for these performance share awards without market conditions is based on a current estimate of the number of awards expected to vest based on the performance level achieved and, therefore, may change during the performance period as new estimates of performance are available.
Other performance share awards or portions thereof have a market condition based upon the Company's total shareholderstockholder return relative to a group of peer companies within a period of three year period.years from the date of grant. Stock compensation expense for these performance share awards is based on the number of awards expected to vest as estimated at the grant date and, therefore, does not change for changes in estimated performance. The Company uses a risk neutral Monte-Carlo valuation model that incorporates time to
THE HARTFORD FINANCIAL SERVICES GROUP, INC.
NOTES TO CONSOLIDATED FINANCIAL STATEMENTS (continued)
19. Stock Compensation Plans (continued)
maturity, implied volatilities of the Company and the peer companies, and correlations between the Company and the peer companies and interest rates.
Assumptions for Total Shareholder Return Performance Shares
|
| | | | | | | | | | | | |
| | For the years ended December 31, |
| | 2018 | 2017 | 2016 |
| Volatility of common stock | 20.8% | 20.3% | 22.2% |
| Average volatility of peer companies | 17.0 | % | - | 25.0% | 15.0 | % | - | 25.0% | 15.0 | % | - | 26.0% |
| Average correlation coefficient of peer companies | 54.0% | 60.0% | 56.0% |
| Risk-free spot rate | 2.4% | 1.5% | 1.0% |
| Term | 3.0 years | 3.0 years | 3.0 years |
|
| | | | | | | | | | | | |
| | For the years ended December 31, |
| | 2017 | 2016 | 2015 |
| Volatility of common stock | 20.3% | 22.2% | 21.4% |
| Average volatility of peer companies | 15.0 | % | - | 25.0% | 15.0 | % | - | 26.0% | 14.0 | % | - | 24.0% |
| Average correlation coefficient of peer companies | 60.0% | 56.0% | 54.0% |
| Risk-free spot rate | 1.5% | 1.0% | 1.1% |
| Term | 3.0 years | 3.0 years | 3.0 years |
Non-vested Share Award Activity Under the Incentive Stock Plan
|
| | | | | | | | | | |
| | Restricted Stock and Restricted Stock Units | Performance Shares |
| | Number of Shares (in thousands) | Weighted-Average Grant-Date Fair Value | Number of Shares (in thousands) | Weighted-Average Grant date Fair Value |
| Non-vested shares | For the year ended December 31, 2018 |
| Non-vested at beginning of year | 4,444 |
| $ | 43.94 |
| 795 |
| $ | 45.16 |
|
| Granted | 1,359 |
| $ | 53.11 |
| 372 |
| $ | 50.26 |
|
| Performance based adjustment | | | 188 |
| $ | 43.59 |
|
| Vested | (1,721 | ) | $ | 41.52 |
| (539 | ) | $ | 43.59 |
|
| Forfeited | (636 | ) | $ | 46.07 |
| (81 | ) | $ | 44.45 |
|
| Non-vested at end of year | 3,446 |
| $ | 48.43 |
| 735 |
| $ | 49.56 |
|
|
| | | | | | | | | | |
| | Restricted Stock and Restricted Stock Units | Performance Shares |
| | Number of Shares (in thousands) | Weighted-Average Grant-Date Fair Value | Number of Shares (in thousands) | Weighted-Average Grant date Fair Value |
| Non-vested shares | For the year ended December 31, 2017 |
| Non-vested at beginning of year | 4,913 |
| $ | 39.87 |
| 941 |
| $ | 40.72 |
|
| Granted | 1,425 |
| $ | 48.90 |
| 404 |
| $ | 48.89 |
|
| Performance based adjustment | | | 353 |
| $ | 42.40 |
|
| Vested | (1,496 | ) | $ | 35.97 |
| (721 | ) | $ | 42.40 |
|
| Forfeited | (398 | ) | $ | 42.86 |
| (182 | ) | $ | 42.95 |
|
| Non-vested at end of year | 4,444 |
| $ | 43.94 |
| 795 |
| $ | 45.16 |
|
The weighted average grant-date fair value per share of restricted stock units and restricted stock granted during the years ended December 31, 2018, 2017, and 2016 was $53.11, $48.90 and 2015 was $48.90, $42.87, and $42.25, respectively. The weighted average grant-date fair value per share of performance shares granted during the years ended December 31, 2018, 2017, and 2016 was $50.26, $48.89 and 2015 was $48.89, $41.50, and $42.40, respectively.
The total fair value of shares vested during the years ended December 31, 2018, 2017 and 2016 was $114, $94 and 2015 was $94, $128, and $144,
respectively, based on actual or estimated performance factors. The Company did not make cash payments in settlement of stock compensation during the years ended December 31, 2018, 2017 2016 and 2015.2016.
Subsidiary Stock Plan
In 2013 the Company established a subsidiary stock-based compensation plan similar to The Hartford Incentive Stock Plan except that it awards non-public subsidiary stock as
THE HARTFORD FINANCIAL SERVICES GROUP, INC.
NOTES TO CONSOLIDATED FINANCIAL STATEMENTS (continued)
compensation. The Company recognized stock-based compensation plan expense of $9, $7$9 and $7 in the years ended December 31, 2018, 2017 2016 and 2015,2016, respectively, for the subsidiary stock plan. Upon employee vesting of subsidiary stock, the Company recognizes a noncontrolling equity interest. Employees are restricted from selling vested subsidiary stock to anyone other than the Company and the Company has discretion on the amount of stock to repurchase. Therefore, the subsidiary
stock is classified as equity because it is not mandatorily redeemable. For the year ended December 31, 2017,2018, the Company repurchased $2$4 in subsidiary stock.
Employee Stock Purchase Plan
The Company sponsors The Hartford Employee Stock Purchase Plan (“ESPP”). Under this plan, eligible employees of The Hartford purchase common stock of the Company at a discount rate of 5%
of the market price per share on the last trading day of the offering period. Accordingly, the plan is a noncompensatorynon-compensatory plan. Employees purchase a variable number of shares of stock through payroll deductions elected as of the beginning of the offering period. The Company may sell up to 15,400,000 shares of stock to eligible employees under the ESPP. As of December 31, 2017,2018, there were 4,517,6334,297,972 shares available for future issuance. During the years ended December 31, 2018, 2017 and 2016, and 2015,219,661 shares, 204,533 shares, 222,113 shares, and 249,344222,113 shares were sold, respectively. The weighted average per share fair value of the discount under the ESPP was $2.56, $2.63 $2.26 and $2.15$2.26 during the years ended December 31, 2018, 2017 2016 and 2015,2016, respectively. The fair value is estimated based on the 5% discount off the market price per share on the last trading day of the offering period.
THE HARTFORD FINANCIAL SERVICES GROUP, INC.NOTES TO CONSOLIDATED FINANCIAL STATEMENTS (continued)
20. Business Dispositions and Discontinued Operations
BUSINESS DISPOSITIONS AND DISCONTINUED OPERATIONS
Business Dispositions
Sale of U.K. business
On May 10, 2017, the Company completed the sale of its U.K. property and casualty run-off subsidiaries, Hartford Financial Products International Limited and Downlands Liability Management Limited, in a cash transaction to Catalina Holdings U.K. Limited ("buyer"), for approximately $272, net of transaction costs. The Company's U.K. property and casualty run-off subsidiaries are included in the P&C Other Operations reporting segment. Revenues and earnings are not material to the Company's consolidated results of operations for the years ended December 31, 2017 2016 and 2015.2016.
The sale resulted in an after-taxafter tax capital loss from the transaction of $5 on the sale for the year ended December 31, 2016.
Major Classes of Assets and Liabilities Transferred by the Company to the Buyer in Connection with the Sale
|
| | | | | | |
| | Carrying Value as of |
| | Closing | December 31, 2016 [2] |
| Assets | | |
| Cash and investments | $ | 669 |
| $ | 657 |
|
| Reinsurance recoverables and other [1] | 268 |
| 213 |
|
| Total assets held for sale | 937 |
| 870 |
|
| Liabilities | | |
| Reserve for future policy benefits and unpaid loss and loss adjustment expenses | 653 |
| 600 |
|
| Other liabilities | 12 |
| 11 |
|
| Total liabilities held for sale | $ | 665 |
| $ | 611 |
|
| |
| [1] | Includes intercompany reinsurance recoverables of $71 as of December 31, 2016, settled in cash at closing. |
| |
| [2] | Classified as assets and liabilities held for sale. |
Discontinued Operations
Sale of life and annuity run-off business
On December 3, 2017,May 31, 2018, the Company’s wholly-owned subsidiary, Hartford Holdings, Inc. (HHI) entered into a definitive agreement to sell, completed the Company'ssale of its life and annuity run-off business to a group of investors led by Cornell Capital LLC, Atlas Merchant Capital LLC, TRB Advisors LP, Global Atlantic Financial Group, Pine Brook and J. Safra Group. Under the terms of the sale agreement signed December 3, 2017, the investor group will formformed a limited partnership, Hopmeadow Holdings LP, that will acquireacquired Hartford Life, Inc. (HLI), a holding company, and its life and annuity operating subsidiaries, for cash of approximately $1.4 billion after a pre-closing dividend to The Hartford of $300 and$300. The Hartford will receivereceived a 9.7% ownership interest in the limited partnership, valued at a cost of $164. All equity investors$164 as of the
limited partnership are restricted from selling their interest for five years. sale date. In addition, as part of the terms of the sale agreement, The Hartford will reducereduced its long-term debt by $142 because the debt, which was issued by HLI, will bewas included as part of the sale. Including cash proceeds and the retained equity interest and net of transaction costs, net proceeds for the sale arewere approximately $1.5 billion.
In addition, The Hartford will retain estimated tax benefits of the life and annuity run-off business totaling approximately $700 based on the newly enacted tax rate of 21%. The estimated retained tax benefits, which will be available for realization subject to the level and timing of The Hartford’s taxable income, include principally $437 of net operating loss carryovers and $235 of alternative minimum tax credits. The amount of net operating loss carryovers ultimately retained will be based on the tax basis of the operations sold. As a result of The Hartford's election to retain a portion of the net operating loss carryovers of the life and annuity run-off business, the Company did not recognize a tax benefit for the loss on sale.
Prior to the closing of the sale, the Company’s group benefits and mutual funds subsidiaries, which are currently subsidiaries of HLI, will be transferred from HLI to HHI and will not be part of the sale.
The transaction completes The Hartford’s exit from the life and annuity run-off businesses and is anticipated to close by June 30, 2018, subject to regulatory approval and other closing conditions. The life and annuity run-off operations meetmet the criteria for reporting as discontinued operations and are reported in the Corporate category.category through the date of sale.
For the year ended December 31, 2017, theThe Company has recognized an estimateda loss on sale within discontinued operations of approximately $3.3 billion. Under the agreement, resultsbillion in 2017 and a reduction in loss on sale of $202 in 2018. The reduction in loss on sale in 2018 primarily resulted from the discontinued operations inurereclassification to retained earnings of $193 of tax effects stranded in AOCI due to the buyer; therefore, theaccounting for Tax Reform and a $141 increase in estimated retained tax benefits, primarily net operating loss carryovers, partially offset by $104 of operating income from discontinued operations during the period between signingup until the closing date and closing will remain largely unchanged as any income earned by the life and annuity run-off business will be offset by a higher loss on sale. At closing, shareholders’ equity will be further reduced for the amountreclassification of accumulated other comprehensive income (AOCI) of the life and annuity run-off business, which was approximately $1.0 billion as of December 31, 2017, largely consisting$10 of net unrealized capital gains from AOCI to retained earnings. See Note 1 - Adoption of New Accounting Standards within Basis of Presentation and Significant Accounting Policies, for additional information about the reclassifications from AOCI to retained earnings. The estimated amount of retained net operating loss carryovers depends on investments, net of shadow DAC.
Following the sale, the Company will manage invested assetsestimated tax basis of the life and annuity run-off business for an initial term of five years and provide transition services for an estimated period of 12 to 24 months.
The following table summarizes the major classes of assets and liabilities of discontinued operations.sold which increased
THE HARTFORD FINANCIAL SERVICES GROUP, INC.
NOTES TO CONSOLIDATED FINANCIAL STATEMENTS (continued)
20. Business Dispositions
subsequent to the date the Company entered into the sale agreement. At closing, stockholders’ equity was further reduced for the amount of AOCI of the life and Discontinuedannuity business, which was approximately $758, largely consisting of net unrealized gains on investments, net of shadow DAC. The AOCI balance was $1 billion as of December 31, 2017.
Cash inflows and outflows from and to the life and annuity business after closing were immaterial to the overall inflows and outflows of the Company. Additionally, the revenues and expenses presented in continuing operations related to pre-disposal operations were immaterial.
The Company will continue to manage invested assets of the life and annuity business sold in May 2018 for an initial term of five years and provide transition services for up to 24 months.
The Hartford reported its 9.7% ownership interest in Hopmeadow Holdings LP, which is accounted for under the equity method, in other assets in the Consolidated Balance Sheet. The Hartford recognizes its share of income in other revenues in the Consolidated Statement of Operations (continued)on a three month delay, when financial information from the investee becomes available. The Company recognized $8 of income for 2018.
Major Classes of Assets and Liabilities to be Transferred to the Buyer in Connection with the Sale
|
| | | | | | |
| | Carrying Value as of |
| | Closing | December 31, 2017 [2] |
| Assets | | |
| Cash and investments | $ | 27,058 |
| $ | 30,135 |
|
| Reinsurance recoverables | 20,718 |
| 20,785 |
|
| Loss accrual [1] | (3,044 | ) | (3,257 | ) |
| Other assets | 2,907 |
| 1,439 |
|
| Separate account assets | 110,773 |
| 115,834 |
|
| Total assets held for sale | $ | 158,412 |
| $ | 164,936 |
|
| Liabilities | | |
| Reserve for future policy benefits and unpaid loss and loss adjustment expenses | $ | 14,308 |
| $ | 14,482 |
|
| Other policyholder funds and benefits payable | 28,680 |
| 29,228 |
|
| Long-term debt | 142 |
| 142 |
|
| Other liabilities | 2,222 |
| 2,756 |
|
| Separate account liabilities | 110,773 |
| 115,834 |
|
| Total liabilities held for sale | $ | 156,125 |
| $ | 162,442 |
|
|
| | | | | | |
| | Carrying Value as of 12/31/2017 | Carrying Value
as of 12/31/2016 |
| Assets | | |
| Cash and investments | $ | 30,135 |
| $ | 31,433 |
|
| Reinsurance recoverables | 20,785 |
| 20,364 |
|
| Loss accrual [1] | (3,257 | ) | — |
|
| Other assets | 1,439 |
| 688 |
|
| Separate account assets | 115,834 |
| 115,665 |
|
| Total assets held for sale | 164,936 |
| 168,150 |
|
| Liabilities | | |
| Reserve for future policy benefits and unpaid loss and loss adjustment expenses | $ | 14,482 |
| $ | 13,609 |
|
| Other policyholder funds and benefits payable | 29,228 |
| 30,574 |
|
| Long-term debt | 142 |
| 142 |
|
| Other liabilities | 2,756 |
| 2,933 |
|
| Separate account liabilities | 115,834 |
| 115,665 |
|
| Total liabilities held for sale | $ | 162,442 |
| $ | 162,923 |
|
| |
| [1] | Represents the estimated accrued loss on sale of the Company's life and annuity run-off business. |
To settle outstanding claims, the Company’s property and casualty operations previously bought structured settlements from the life and annuity run-off business held for sale. As of December 31, 2017 and 2016, the Company had $688 and $712, respectively, of liabilities for structured settlements in cases where the Company did not obtain a release of liability from the claimant which are included in liabilities held for sale. As the life and annuity run-off business will become a third party to the Company upon closing of the sale, as of December 31, 2017 and 2016, the accompanying consolidated balance sheets include a reinsurance recoverable from the life and annuity run-off business of $688 and $712, respectively, with corresponding unpaid loss and loss adjustment expense reserves of $688 and $712, respectively, representing the Company’s direct obligation to claimants.
The Hartford has guaranteed the obligations of certain life, accident and health and annuity contracts of the life and annuity run-off business written by Hartford Life Insurance Company ("HLIC") between 1990 and 1997and written by Hartford Life
| |
| [2] | Classified as assets and liabilities held for sale. |
and Annuity Insurance Company ("HLAIC") between 1993 and 2009. After the sale closes, HLIC, HLAIC and the purchaser will indemnify the Company for any liability arising under the guarantees. The guarantees have no limitation as to maximum potential future payments. The Hartford has not recorded a liability and the likelihood for any payments under these guarantees is remote.
Reconciliation of the Major Line Items Constituting Pretax Profit (Loss) of Discontinued Operations |
| | | | | | | | | |
| | For the years ended December 31, |
| | 2018 | 2017 | 2016 |
| Revenues | | | |
| Earned premiums | $ | 39 |
| $ | 106 |
| $ | 114 |
|
| Fee income and other | 382 |
| 912 |
| 931 |
|
| Net investment income | 519 |
| 1,289 |
| 1,384 |
|
| Net realized capital losses | (68 | ) | (53 | ) | (158 | ) |
| Total revenues | 872 |
| 2,254 |
| 2,271 |
|
| Benefits, losses and expenses | | | |
|
| Benefits, losses and loss adjustment expenses | 535 |
| 1,416 |
| 1,390 |
|
| Amortization of DAC | 58 |
| 45 |
| 146 |
|
| Insurance operating costs and other expenses [1] | 157 |
| 368 |
| 378 |
|
| Total benefits, losses and expenses | 750 |
| 1,829 |
| 1,914 |
|
| Income before income taxes | 122 |
| 425 |
| 357 |
|
| Income tax expense (benefit) | 2 |
| 37 |
| 74 |
|
| Income from operations of discontinued operations, net of tax | 120 |
| 388 |
| 283 |
|
| Net realized capital gain (loss) on disposal, net of tax | 202 |
| (3,257 | ) | — |
|
| Income (loss) from discontinued operations, net of tax | $ | 322 |
| $ | (2,869 | ) | $ | 283 |
|
|
| | | | | | | | | |
| | For the years ended December 31, |
| | 2017 | 2016 | 2015 |
| Revenues | | | |
| Earned premiums | $ | 106 |
| $ | 114 |
| $ | 92 |
|
| Fee income and other | 912 |
| 931 |
| 1,040 |
|
| Net investment income | 1,289 |
| 1,384 |
| 1,469 |
|
| Net realized capital losses | (53 | ) | (158 | ) | (144 | ) |
| Total revenues | 2,254 |
| 2,271 |
| 2,457 |
|
| Benefits, losses and expenses | | |
| |
| Benefits, losses and loss adjustment expenses | 1,416 |
| 1,390 |
| 1,450 |
|
| Amortization of DAC | 45 |
| 146 |
| 138 |
|
| Insurance operating costs and other expenses [1] | 368 |
| 378 |
| 367 |
|
| Total benefits, losses and expenses | 1,829 |
| 1,914 |
| 1,955 |
|
| Income before income taxes | 425 |
| 357 |
| 502 |
|
| Income tax expense | 37 |
| 74 |
| 16 |
|
| Income from operations of discontinued operations, net of tax | 388 |
| 283 |
| 486 |
|
| Net realized capital loss on disposal, net of tax | (3,257 | ) | — |
| — |
|
| (Loss) income from discontinued operations, net of tax | $ | (2,869 | ) | $ | 283 |
| $ | 486 |
|
[1]Corporate allocated overhead has been included in continuing operations.
THE HARTFORD FINANCIAL SERVICES GROUP, INC.
NOTES TO CONSOLIDATED FINANCIAL STATEMENTS (continued)
20. Business Dispositions andCash Flows from Discontinued Operations(continued)
Cash flows from discontinued operations included in the Consolidated Statement of Cash Flows were as follows:
Cash Flows from Discontinued Operations
| | | | Year Ended December 31, | Year Ended December 31, |
| | 2017 | 2016 | 2015 | 2018 | 2017 | 2016 |
| Net cash provided by operating activities from discontinued operations | $ | 797 |
| $ | 784 |
| $ | 682 |
| $ | 603 |
| $ | 797 |
| $ | 784 |
|
| Net cash provided by investing activities from discontinued operations | $ | 1,466 |
| $ | 864 |
| $ | 1,446 |
| $ | 463 |
| $ | 1,466 |
| $ | 864 |
|
| Net cash used in financing activities from discontinued operations [1] | $ | (884 | ) | $ | (647 | ) | $ | (1,080 | ) | $ | (737 | ) | $ | (884 | ) | $ | (647 | ) |
| Cash paid for interest | $ | 11 |
| $ | 11 |
| $ | 11 |
| $ | — |
| $ | 11 |
| $ | 11 |
|
| |
| [1] | Excludes return of capital to parent of $619, $1,396, $752, and $1,001752 for 20172018, 20162017 and 20152016, respectively. |
THE HARTFORD FINANCIAL SERVICES GROUP, INC.
NOTES TO CONSOLIDATED FINANCIAL STATEMENTS (continued)
21. QUARTERLY RESULTS (UNAUDITED)
Current and Historical Quarterly Results (Unaudited)
The following table presents current and historical quarterly results of the Company. As a result of the Company's definitive agreement to sell its life and annuity run-off business, the results of this transaction have been retrospectively reclassified as discontinued operations, and as such, the quarterly results for the prior periods presented below differ from previously reported amounts.
Company
For further discussion of this transaction, see Note 20 - Business Dispositions and Discontinued Operations of Notes to Consolidated Financial Statements. |
| | | | | | | | | | | | | | | | | | | | | | | | | | | |
| | Three months ended |
| | March 31, | | June 30, | | September 30, | | December 31, |
| | 2018 | 2017 | | 2018 | 2017 | | 2018 | 2017 | | 2018 | 2017 |
| Revenues | $ | 4,691 |
| $ | 4,169 |
| | $ | 4,789 |
| $ | 4,214 |
| | $ | 4,842 |
| $ | 4,192 |
| | $ | 4,633 |
| $ | 4,587 |
|
| Benefits, losses and expenses | 4,172 |
| 3,768 |
| | 4,252 |
| 4,495 |
| | 4,312 |
| 4,011 |
| | 4,466 |
| 4,165 |
|
| Income (loss) from continuing operations, net of tax | 428 |
| 303 |
| | 434 |
| (152 | ) | | 427 |
| 145 |
| | 196 |
| (558 | ) |
| Income (loss) from discontinued operations, net of tax | 169 |
| 75 |
| | 148 |
| 112 |
| | 5 |
| 89 |
| | — |
| (3,145 | ) |
| Net income (loss) | $ | 597 |
| $ | 378 |
| | $ | 582 |
| $ | (40 | ) | | $ | 432 |
| $ | 234 |
| | $ | 196 |
| $ | (3,703 | ) |
| Less: Preferred stock dividends | — |
| — |
| | — |
| — |
| | — |
| — |
| | 6 |
| — |
|
| Net income (loss) available to common stockholders | $ | 597 |
| $ | 378 |
| | $ | 582 |
| $ | (40 | ) | | $ | 432 |
| $ | 234 |
| | $ | 190 |
| $ | (3,703 | ) |
| Basic | | | | | | | | | | | |
| Income (loss) from continuing operations, net of tax, available to common stockholders per share | $ | 1.20 |
| $ | 0.82 |
| | $ | 1.21 |
| $ | (0.42 | ) | | $ | 1.19 |
| $ | 0.40 |
| | $ | 0.53 |
| $ | (1.56 | ) |
| Income (loss) from discontinued operations, net of tax per share | $ | 0.47 |
| $ | 0.20 |
| | $ | 0.41 |
| $ | 0.31 |
| | $ | 0.01 |
| $ | 0.25 |
| | $ | — |
| $ | (8.81 | ) |
| Net income (loss) per common share available to common stockholders | $ | 1.67 |
| $ | 1.02 |
| | $ | 1.62 |
| $ | (0.11 | ) | | $ | 1.20 |
| $ | 0.65 |
| | $ | 0.53 |
| $ | (10.37 | ) |
| Diluted | | | | | | | | | | | |
| Income (loss) from continuing operations, net of tax, available to common stockholders per share | $ | 1.18 |
| $ | 0.80 |
| | $ | 1.19 |
| $ | (0.42 | ) | | $ | 1.17 |
| $ | 0.40 |
| | $ | 0.52 |
| $ | (1.56 | ) |
| Income (loss) from discontinued operations, net of tax per share | $ | 0.46 |
| $ | 0.20 |
| | $ | 0.41 |
| $ | 0.31 |
| | $ | 0.02 |
| $ | 0.24 |
| | $ | — |
| $ | (8.81 | ) |
| Net income (loss) per common share available to common stockholders | $ | 1.64 |
| $ | 1.00 |
| | $ | 1.60 |
| $ | (0.11 | ) | | $ | 1.19 |
| $ | 0.64 |
| | $ | 0.52 |
| $ | (10.37 | ) |
| Weighted average common shares outstanding, basic | 357.5 |
| 371.4 |
| | 358.3 |
| 366.0 |
| | 358.6 |
| 360.2 |
| | 359.1 |
| 357.0 |
|
| Weighted average shares outstanding and dilutive potential common shares [1] | 363.9 |
| 378.6 |
| | 364.2 |
| 366.0 |
| | 364.1 |
| 367.0 |
| | 364.0 |
| 357.0 |
|
|
| | | | | | | | | | | | | | | | | | | | | | | | |
| | Three months ended |
| | March 31, | June 30, | September 30, | December 31, |
| | 2017 | 2016 | 2017 | 2016 | 2017 | 2016 | 2017 | 2016 |
| Revenues | $ | 4,123 |
| $ | 3,930 |
| $ | 4,168 |
| $ | 4,085 |
| $ | 4,144 |
| $ | 4,114 |
| $ | 4,539 |
| $ | 3,978 |
|
| Benefits, losses and expenses | 3,722 |
| 3,556 |
| 4,449 |
| 4,060 |
| 3,963 |
| 3,690 |
| 4,117 |
| 4,354 |
|
| Income (loss) from continuing operations, net of tax | 303 |
| 298 |
| (152 | ) | 99 |
| 145 |
| 351 |
| (558 | ) | (135 | ) |
| Income from discontinued operations, net of tax | 75 |
| 25 |
| 112 |
| 117 |
| 89 |
| 87 |
| (3,145 | ) | 54 |
|
| Net income (loss) | $ | 378 |
| $ | 323 |
| $ | (40 | ) | $ | 216 |
| $ | 234 |
| $ | 438 |
| $ | (3,703 | ) | $ | (81 | ) |
| Basic | | | | | | | | |
| (Loss) income from continuing operations, net of tax | $ | 0.82 |
| $ | 0.75 |
| $ | (0.42 | ) | $ | 0.25 |
| $ | 0.40 |
| $ | 0.91 |
| $ | (1.56 | ) | $ | (0.36 | ) |
| (Loss) income from discontinued operations, net of tax | $ | 0.20 |
| $ | 0.06 |
| $ | 0.31 |
| $ | 0.30 |
| $ | 0.25 |
| $ | 0.23 |
| $ | (8.81 | ) | $ | 0.14 |
|
| Net income per common share | $ | 1.02 |
| $ | 0.81 |
| $ | (0.11 | ) | $ | 0.55 |
| $ | 0.65 |
| $ | 1.14 |
| $ | (10.37 | ) | $ | (0.22 | ) |
| Diluted | | | | | | | | |
| (Loss) income from continuing operations, net of tax | $ | 0.80 |
| $ | 0.73 |
| $ | (0.42 | ) | $ | 0.25 |
| $ | 0.40 |
| $ | 0.90 |
| $ | (1.56 | ) | $ | (0.36 | ) |
| (Loss) income from discontinued operations, net of tax | $ | 0.20 |
| $ | 0.06 |
| $ | 0.31 |
| $ | 0.29 |
| $ | 0.24 |
| $ | 0.22 |
| $ | (8.81 | ) | $ | 0.14 |
|
| Net (loss) income per common share | $ | 1.00 |
| $ | 0.79 |
| $ | (0.11 | ) | $ | 0.54 |
| $ | 0.64 |
| $ | 1.12 |
| $ | (10.37 | ) | $ | (0.22 | ) |
| Weighted average common shares outstanding, basic | 371.4 |
| 398.5 |
| 366.0 |
| 391.8 |
| 360.2 |
| 383.8 |
| 357.0 |
| 376.6 |
|
| Weighted average shares outstanding and dilutive potential common shares [1] | 378.6 |
| 406.3 |
| 366.0 |
| 398.6 |
| 367.0 |
| 390.5 |
| 357.0 |
| 376.6 |
|
| |
| [1] | AsIn periods where a result of the net loss from continuing operations, fornet of tax, available to common stockholders or net loss available to common stockholders is recognized, inclusion of incremental dilutive shares would be antidilutive. Due to the quarters ended December 31, 2017, June 30, 2017, and December 31, 2016,antidilutive impact, such shares are excluded from the Company was required to use basic weighted average common shares outstanding in thediluted earnings per share calculation of diluted loss per share, since the inclusionincome (loss) from continuing operations, net of shares for stock compensation planstax, available to common stockholders and warrants would have been antidilutivenet income (loss) available to the earnings (loss) per share calculation.common stockholders in such periods. |
Part IV - Schedule I. Summary of Investments - Other Investments in Affiliates
THE HARTFORD FINANCIAL SERVICES GROUP, INC.
SCHEDULE I
SUMMARY OF INVESTMENTS — OTHER THAN INVESTMENTS IN AFFILIATES
(in millions)
|
| | | | | | | | | |
| | As of December 31, 2018 |
| Type of Investment | Cost | Fair Value | Amount at
which shown on Balance Sheet |
| Fixed Maturities | | | |
| Bonds and notes | | | |
| U.S. government and government agencies and authorities (guaranteed and sponsored) | $ | 4,446 |
| $ | 4,430 |
| $ | 4,430 |
|
| States, municipalities and political subdivisions | 9,972 |
| 10,346 |
| 10,346 |
|
| Foreign governments | 866 |
| 847 |
| 847 |
|
| Public utilities | 2,017 |
| 1,991 |
| 1,991 |
|
| All other corporate bonds | 11,679 |
| 11,407 |
| 11,407 |
|
| All other mortgage-backed and asset-backed securities | 6,623 |
| 6,631 |
| 6,631 |
|
| Total fixed maturities, available-for-sale | 35,603 |
| 35,652 |
| 35,652 |
|
| Fixed maturities, at fair value using fair value option | 21 |
| 22 |
| 22 |
|
| Total fixed maturities | 35,624 |
| 35,674 |
| 35,674 |
|
| Equity Securities | | | |
| Common stocks | | | |
| Industrial, miscellaneous and all other | 1,170 |
| 1,170 |
| 1,170 |
|
| Non-redeemable preferred stocks | 44 |
| 44 |
| 44 |
|
| Total equity securities, at fair value | 1,214 |
| 1,214 |
| 1,214 |
|
| Mortgage loans | 3,704 |
| 3,746 |
| 3,704 |
|
| Futures, options and miscellaneous | 254 |
| 192 |
| 192 |
|
| Short-term investments | 4,282 |
| 4,283 |
| 4,283 |
|
| Investments in partnerships and trusts | 1,723 |
| | 1,723 |
|
| Total investments | $ | 46,802 |
| | $ | 46,790 |
|
|
| | | | | | | | | |
| | As of December 31, 2017 |
| Type of Investment | Cost | Fair Value | Amount at
which shown on Balance Sheet |
| Fixed Maturities | | | |
| Bonds and notes | | | |
| U.S. government and government agencies and authorities (guaranteed and sponsored) | $ | 4,492 |
| $ | 4,536 |
| $ | 4,536 |
|
| States, municipalities and political subdivisions | 11,743 |
| 12,485 |
| 12,485 |
|
| Foreign governments | 1,071 |
| 1,110 |
| 1,110 |
|
| Public utilities | 2,097 |
| 2,188 |
| 2,188 |
|
| All other corporate bonds | 10,273 |
| 10,616 |
| 10,616 |
|
| All other mortgage-backed and asset-backed securities | 5,936 |
| 6,029 |
| 6,029 |
|
| Total fixed maturities, available-for-sale | 35,612 |
| 36,964 |
| 36,964 |
|
| Fixed maturities, at fair value using fair value option | 40 |
| 41 |
| 41 |
|
| Total fixed maturities | 35,652 |
| 37,005 |
| 37,005 |
|
| Equity Securities | | | |
| Common stocks | | | |
| Industrial, miscellaneous and all other | 859 |
| 959 |
| 959 |
|
| Non-redeemable preferred stocks | 48 |
| 53 |
| 53 |
|
| Total equity securities | 907 |
| 1,012 |
| 1,012 |
|
| Mortgage loans | 3,175 |
| 3,220 |
| 3,175 |
|
| Futures, options and miscellaneous | 167 |
| 96 |
| 96 |
|
| Short-term investments | 2,270 |
| 2,270 |
| 2,270 |
|
| Investments in partnerships and trusts | 1,588 |
| | 1,588 |
|
| Total investments | $ | 43,759 |
| | $ | 45,146 |
|
Part IV - Schedule II. Condensed Financial Information of the Hartford Financial Services, Inc.
THE HARTFORD FINANCIAL SERVICES GROUP, INC.
SCHEDULE II
CONDENSED FINANCIAL INFORMATION OF THE HARTFORD FINANCIAL SERVICES GROUP, INC.
(Registrant)
(In millions)
|
| | | | | | |
| | As of December 31, |
| Condensed Balance Sheets | 2017 | 2016 |
| Assets | | |
| Fixed maturities, available-for-sale, at fair value | $ | 637 |
| $ | 849 |
|
| Other investments | (1 | ) | 1 |
|
| Short-term investments | 442 |
| 321 |
|
| Cash | 2 |
| — |
|
| Investment in affiliates [1] | 19,023 |
| 21,889 |
|
| Deferred income taxes | 693 |
| 1,488 |
|
| Unamortized issue costs | 1 |
| 3 |
|
| Other assets | 11 |
| 35 |
|
| Total assets | $ | 20,808 |
| $ | 24,586 |
|
| Liabilities and Stockholders’ Equity | |
| |
|
| Net payable to affiliates | $ | 1,598 |
| $ | 1,503 |
|
| Short-term debt (includes current maturities of long-term debt) | 320 |
| 416 |
|
| Long-term debt | 4,678 |
| 4,494 |
|
| Other liabilities | 718 |
| 1,270 |
|
| Total liabilities | 7,314 |
| 7,683 |
|
| Total stockholders’ equity | 13,494 |
| 16,903 |
|
| Total liabilities and stockholders’ equity | $ | 20,808 |
| $ | 24,586 |
|
|
| | | | | | | | | |
| | For the years ended December 31, |
| Condensed Statements of Operations and Comprehensive Income | 2017 | 2016 | 2015 |
| Net investment income | $ | 15 |
| $ | 21 |
| $ | 14 |
|
| Net realized capital losses | (1 | ) | (6 | ) | (6 | ) |
| Total revenues | 14 |
| 15 |
| 8 |
|
| Interest expense | 316 |
| 328 |
| 346 |
|
| Pension settlement | 750 |
| — |
| — |
|
| Other expenses | 1 |
| 9 |
| 35 |
|
| Total expenses | 1,067 |
| 337 |
| 381 |
|
| Loss before income taxes and earnings of subsidiaries | (1,053 | ) | (322 | ) | (373 | ) |
| Income tax (benefit) | 106 |
| (117 | ) | (131 | ) |
| Loss before earnings of subsidiaries | (1,159 | ) | (205 | ) | (242 | ) |
| Earnings of subsidiaries [1] | (1,972 | ) | 1,101 |
| 1,924 |
|
| Net income (loss) | (3,131 | ) | 896 |
| 1,682 |
|
| Other comprehensive income (loss) - parent company: | | | |
| Change in net gain/loss on cash-flow hedging instruments | 2 |
| — |
| — |
|
| Change in net unrealized gain/loss on securities | 280 |
| 1 |
| (1 | ) |
| Change in pension and other postretirement plan adjustments | 107 |
| (6 | ) | (82 | ) |
| Other comprehensive income (loss), net of taxes before other comprehensive income of subsidiaries | 389 |
| (5 | ) | (83 | ) |
| Other comprehensive income of subsidiaries | 611 |
| (3 | ) | (1,174 | ) |
| Total other comprehensive income (loss) | 1,000 |
| (8 | ) | (1,257 | ) |
| Total comprehensive income (loss) | $ | (2,131 | ) | $ | 888 |
| $ | 425 |
|
|
| | | | | | |
| | As of December 31, |
| Condensed Balance Sheets | 2018 | 2017 |
| Assets | | |
| Fixed maturities, available-for-sale, at fair value | $ | 785 |
| $ | 637 |
|
| Equity securities, at fair value | 30 |
| — |
|
| Other investments | 103 |
| (1 | ) |
| Short-term investments | 2,603 |
| 442 |
|
| Cash | 3 |
| 2 |
|
| Investment in affiliates [1] | 15,074 |
| 19,023 |
|
| Deferred income taxes | 992 |
| 693 |
|
| Unamortized issue costs | 3 |
| 1 |
|
| Other assets | 78 |
| 11 |
|
| Total assets | $ | 19,671 |
| $ | 20,808 |
|
| Liabilities and Stockholders’ Equity | |
| |
|
| Net payable to affiliates | $ | 1,530 |
| $ | 1,598 |
|
| Short-term debt (includes current maturities of long-term debt) | 413 |
| 320 |
|
| Long-term debt | 4,265 |
| 4,678 |
|
| Other liabilities | 362 |
| 718 |
|
| Total liabilities | 6,570 |
| 7,314 |
|
| Total stockholders’ equity | 13,101 |
| 13,494 |
|
| Total liabilities and stockholders’ equity | $ | 19,671 |
| $ | 20,808 |
|
[1] Includes2017 includes amounts for the life and annuity run-offbusiness accounted for as held for sale and operating results for that business included in discontinued operations in the Consolidated Financial Statements. See Note 20 – Business Dispositions and Discontinued Operations of Notes to Consolidated Financial Statements.
Part IV - Schedule II. Condensed Financial Information of the Hartford Financial Services, Inc.
THE HARTFORD FINANCIAL SERVICES GROUP, INC.
SCHEDULE II
CONDENSED FINANCIAL INFORMATION OF THE HARTFORD FINANCIAL SERVICES GROUP, INC. (continued)
(Registrant)
(In millions)
|
| | | | | | | | | |
| | For the years ended December 31, |
| Condensed Statements of Operations and Comprehensive Income | 2018 | 2017 | 2016 |
| Net investment income | $ | 41 |
| $ | 15 |
| $ | 21 |
|
| Net realized capital gains (losses) | 37 |
| (1 | ) | (6 | ) |
| Total revenues | 78 |
| 14 |
| 15 |
|
| Interest expense | 298 |
| 316 |
| 328 |
|
| Loss on extinguishment of debt | 6 |
| — |
| — |
|
| Pension settlement | — |
| 750 |
| — |
|
| Other expense (income) | (6 | ) | 1 |
| 9 |
|
| Total expenses | 298 |
| 1,067 |
| 337 |
|
| Loss before income taxes and earnings of subsidiaries | (220 | ) | (1,053 | ) | (322 | ) |
| Income tax expense (benefit) | (630 | ) | 106 |
| (117 | ) |
| Income (loss) before earnings of subsidiaries | 410 |
| (1,159 | ) | (205 | ) |
| Earnings (losses) of subsidiaries [1] | 1,397 |
| (1,972 | ) | 1,101 |
|
| Net income (loss) | 1,807 |
| (3,131 | ) | 896 |
|
| Other comprehensive income (loss) - parent company: | | | |
| Change in net gain/loss on cash-flow hedging instruments | 8 |
| 2 |
| — |
|
| Change in net unrealized gain/loss on securities | (271 | ) | 280 |
| 1 |
|
| Change in pension and other postretirement plan adjustments | (26 | ) | 107 |
| (6 | ) |
| Other comprehensive income (loss), net of taxes before other comprehensive income of subsidiaries | (289 | ) | 389 |
| (5 | ) |
| Other comprehensive income (loss) of subsidiaries | (1,948 | ) | 611 |
| (3 | ) |
| Total other comprehensive income (loss) | (2,237 | ) | 1,000 |
| (8 | ) |
| Total comprehensive income (loss) | $ | (430 | ) | $ | (2,131 | ) | $ | 888 |
|
[1]2017 and 2016 include amounts for the life and annuity business accounted for as held for sale and operating results for that business included in discontinued operations in the Consolidated Financial Statements. See Note 20 – Business Dispositions and Discontinued Operations of Notes to Consolidated Financial Statements.
Part IV - Schedule II. Condensed Financial Information of the Hartford Financial Services, Inc.
THE HARTFORD FINANCIAL SERVICES GROUP, INC.
SCHEDULE II
CONDENSED FINANCIAL INFORMATION OF THE HARTFORD FINANCIAL SERVICES GROUP, INC. (continued)
(Registrant)
(In millions)
|
| | | | | | | | | |
| | For the years ended December 31, |
| Condensed Statements of Cash Flows | 2018 | 2017 | 2016 |
| Operating Activities | | | |
| Net income (loss) | $ | 1,807 |
| $ | (3,131 | ) | $ | 896 |
|
| Loss on extinguishment of debt | 6 |
| — |
| — |
|
| Equity in net loss (income) of subsidiaries | (1,397 | ) | 1,972 |
| (1,101 | ) |
| Change in operating assets and liabilities | 2,362 |
| 3,220 |
| 1,634 |
|
| Cash provided by operating activities | 2,778 |
| 2,061 |
| 1,429 |
|
| Investing Activities | | | |
| Net proceeds from (payments for) short-term investments | (2,161 | ) | (121 | ) | 30 |
|
| Net additions to property and equipment | (69 | ) | — |
| — |
|
| Capital returned from (contributions to) subsidiaries | (148 | ) | (633 | ) | 491 |
|
| Cash provided by (used for) investing activities | (2,378 | ) | (754 | ) | 521 |
|
| Financing Activities | | | |
| Proceeds from issuance of debt | 490 |
| 500 |
| — |
|
| Repayments of debt | (826 | ) | (416 | ) | (275 | ) |
| Preferred stock issued, net of issuance costs | 334 |
| — |
| — |
|
| Treasury stock acquired | — |
| (1,028 | ) | (1,330 | ) |
| Net issuance (return of) shares under incentive and stock compensation plans | (18 | ) | (20 | ) | (11 | ) |
| Dividends paid on common shares | (379 | ) | (341 | ) | (334 | ) |
| Cash used for financing activities | (399 | ) | (1,305 | ) | (1,950 | ) |
| Net increase in cash | 1 |
| 2 |
| — |
|
| Cash — beginning of period | 2 |
| — |
| — |
|
| Cash — end of period | $ | 3 |
| $ | 2 |
| $ | — |
|
| Supplemental Disclosure of Cash Flow Information | | | |
| Interest Paid | $ | 290 |
| $ | 312 |
| $ | 326 |
|
| Dividends Received from Subsidiaries | $ | 3,115 |
| $ | 2,142 |
| $ | 1,320 |
|
|
| | | | | | | | | |
| | For the years ended December 31, |
| Condensed Statements of Cash Flows | 2017 | 2016 | 2015 |
| Operating Activities | | | |
| Net income | $ | (3,131 | ) | $ | 896 |
| $ | 1,682 |
|
| Loss on extinguishment of debt | — |
| — |
| 21 |
|
| Undistributed earnings of subsidiaries | 1,972 |
| (1,101 | ) | (1,924 | ) |
| Change in operating assets and liabilities | 3,220 |
| 1,634 |
| 1,167 |
|
| Cash provided by operating activities | 2,061 |
| 1,429 |
| 946 |
|
| Investing Activities | | | |
| Net sales of short-term investments | (121 | ) | 30 |
| 609 |
|
| Capital contributions to subsidiaries | (633 | ) | 491 |
| 742 |
|
| Cash provided by (used for) investing activities | (754 | ) | 521 |
| 1,351 |
|
| Financing Activities | | | |
| Proceeds from issuance of long-term debt | 500 |
| — |
| — |
|
| Repayments of long-term debt | (416 | ) | (275 | ) | (773 | ) |
| Treasury stock acquired | (1,028 | ) | (1,330 | ) | (1,250 | ) |
| Proceeds from net issuances of common shares under incentive and stock compensation plans and excess tax benefits | (20 | ) | (11 | ) | 42 |
|
| Dividends paid — Common Shares | (341 | ) | (334 | ) | (316 | ) |
| Cash used for financing activities | (1,305 | ) | (1,950 | ) | (2,297 | ) |
| Net change in cash | 2 |
| — |
| — |
|
| Cash — beginning of year | — |
| — |
| — |
|
| Cash — end of year | $ | 2 |
| $ | — |
| $ | — |
|
| Supplemental Disclosure of Cash Flow Information | | | |
| Interest Paid | $ | 312 |
| $ | 326 |
| $ | 351 |
|
| Dividends Received from Subsidiaries | $ | 2,142 |
| $ | 1,320 |
| $ | 1,127 |
|
Part IV - Schedule III. Supplementary Insurance Information
THE HARTFORD FINANCIAL SERVICES GROUP, INC.
SCHEDULE III
SUPPLEMENTARY INSURANCE INFORMATION
(In millions)
|
| | | | | | | | | | | | | | | | |
| | Segment | Deferred Policy Acquisition Costs |
Unpaid Losses and Loss Adjustment Expenses | Reserve for Future Policy Benefits | Unearned Premiums | Other Policyholder Funds and Benefits Payable |
| |
| | As of December 31, 2018 | | | | | |
| | Commercial Lines | $ | 495 |
| $ | 19,455 |
| $ | — |
| $ | 3,589 |
| $ | — |
|
| | Personal Lines | 117 |
| 2,456 |
| — |
| 1,643 |
| — |
|
| | Property & Casualty Other Operations | — |
| 2,673 |
| — |
| 7 |
| — |
|
| | Group Benefits | 52 |
| 8,445 |
| 427 |
| 43 |
| 455 |
|
| | Hartford Funds | 6 |
| — |
| — |
| — |
| — |
|
| | Corporate | — |
| — |
| 215 |
| — |
| 312 |
|
| | Consolidated | $ | 670 |
| $ | 33,029 |
| $ | 642 |
| $ | 5,282 |
| $ | 767 |
|
| | As of December 31, 2017 | |
| |
| | |
| |
|
| | Commercial Lines | $ | 467 |
| $ | 18,893 |
| $ | — |
| $ | 3,504 |
| $ | — |
|
| | Personal Lines | 127 |
| 2,294 |
| — |
| 1,768 |
| — |
|
| | Property & Casualty Other Operations | — |
| 2,588 |
| — |
| 10 |
| — |
|
| | Group Benefits | 47 |
| 8,512 |
| 441 |
| 40 |
| 492 |
|
| | Hartford Funds | 9 |
| — |
| — |
| — |
| — |
|
| | Corporate | — |
| — |
| 272 |
| — |
| 324 |
|
| | Consolidated | $ | 650 |
| $ | 32,287 |
| $ | 713 |
| $ | 5,322 |
| $ | 816 |
|
|
| | | | | | | | | | | | | | | | |
| | Segment | Deferred Policy Acquisition Costs |
Unpaid Losses and Loss Adjustment Expenses | Reserve for Future Policy Benefits | Unearned Premiums | Other Policyholder Funds and Benefits Payable |
| |
| | As of December 31, 2017 | | | | | |
| | Commercial Lines | $ | 467 |
| $ | 18,893 |
| $ | — |
| $ | 3,504 |
| $ | — |
|
| | Personal Lines | 127 |
| 2,294 |
| — |
| 1,768 |
| — |
|
| | Property & Casualty Other Operations | — |
| 2,588 |
| — |
| 10 |
| — |
|
| | Group Benefits | 47 |
| 8,512 |
| 441 |
| 40 |
| 492 |
|
| | Mutual Funds | 9 |
| — |
| — |
| — |
| — |
|
| | Corporate | — |
| — |
| 272 |
| — |
| 324 |
|
| | Consolidated | $ | 650 |
| $ | 32,287 |
| $ | 713 |
| $ | 5,322 |
| $ | 816 |
|
| | As of December 31, 2016 | |
| |
| | |
| |
|
| | Commercial Lines | $ | 448 |
| $ | 17,950 |
| $ | — |
| $ | 3,441 |
| $ | — |
|
| | Personal Lines | 143 |
| 2,094 |
| — |
| 1,898 |
| — |
|
| | Property & Casualty Other Operations | $ | — |
| $ | 2,501 |
| $ | — |
| $ | 11 |
| $ | — |
|
| | Group Benefits | 42 |
| 5,772 |
| 82 |
| 42 |
| 265 |
|
| | Mutual Funds | $ | 12 |
| $ | — |
| $ | — |
| $ | — |
| $ | — |
|
| | Corporate | — |
| — |
| 240 |
| — |
| 337 |
|
| | Consolidated | $ | 645 |
| $ | 28,317 |
| $ | 322 |
| $ | 5,392 |
| $ | 602 |
|
Part IV - Schedule III. Supplementary Insurance Information
THE HARTFORD FINANCIAL SERVICES GROUP, INC.
SCHEDULE III
SUPPLEMENTARY INSURANCE INFORMATION
(In millions)
|
| | | | | | | | | | | | | | | | | | |
| Segment | Earned Premiums, Fee Income and Other | Net Investment Income | Benefits, Losses and Loss Adjustment Expenses | Amortization of Deferred Policy Acquisition Costs | Insurance Operating Costs and Other Expenses [1] | Net Written Premiums [2] |
| For the year December 31, 2018 | |
| Commercial Lines | $ | 7,081 |
| $ | 997 |
| $ | 4,112 |
| $ | 1,048 |
| $ | 1,396 |
| $ | 7,136 |
|
| Personal Lines | 3,523 |
| 155 |
| 2,763 |
| 275 |
| 684 |
| 3,276 |
|
| Property & Casualty Other Operations | — |
| 90 |
| 65 |
| — |
| 13 |
| (4 | ) |
| Group Benefits | 5,598 |
| 474 |
| 4,214 |
| 45 |
| 1,342 |
| — |
|
| Hartford Funds | 1,032 |
| 5 |
| — |
| 16 |
| 831 |
| — |
|
| Corporate | 53 |
| 59 |
| 11 |
| — |
| 387 |
| — |
|
| Consolidated | $ | 17,287 |
| $ | 1,780 |
| $ | 11,165 |
| $ | 1,384 |
| $ | 4,653 |
| $ | 10,408 |
|
| For the year December 31, 2017 | |
| Commercial Lines | $ | 6,902 |
| $ | 949 |
| $ | 4,322 |
| $ | 1,009 |
| $ | 1,381 |
| $ | 6,956 |
|
| Personal Lines | 3,819 |
| 141 |
| 3,000 |
| 309 |
| 649 |
| 3,561 |
|
| Property & Casualty Other Operations | — |
| 106 |
| 18 |
| — |
| 9 |
| — |
|
| Group Benefits | 3,677 |
| 381 |
| 2,803 |
| 33 |
| 924 |
| — |
|
| Hartford Funds | 992 |
| 3 |
| — |
| 21 |
| 805 |
| — |
|
| Corporate | 4 |
| 23 |
| 31 |
| — |
| 1,125 |
| — |
|
| Consolidated | $ | 15,394 |
| $ | 1,603 |
| $ | 10,174 |
| $ | 1,372 |
| $ | 4,893 |
| $ | 10,517 |
|
| For the year December 31, 2016 | |
| Commercial Lines | $ | 6,690 |
| $ | 917 |
| $ | 3,994 |
| $ | 973 |
| $ | 1,244 |
| $ | 6,732 |
|
| Personal Lines | 4,023 |
| 135 |
| 3,175 |
| 348 |
| 669 |
| 3,837 |
|
| Property & Casualty Other Operations | — |
| 127 |
| 278 |
| — |
| 663 |
| (1 | ) |
| Group Benefits | 3,223 |
| 366 |
| 2,514 |
| 31 |
| 776 |
| — |
|
| Hartford Funds | 885 |
| 1 |
| — |
| 24 |
| 741 |
| — |
|
| Corporate | 3 |
| 31 |
| — |
| 1 |
| 413 |
| — |
|
| Consolidated | $ | 14,824 |
| $ | 1,577 |
| $ | 9,961 |
| $ | 1,377 |
| $ | 4,506 |
| $ | 10,568 |
|
|
| | | | | | | | | | | | | | | | | | |
| Segment | Earned Premiums, Fee Income and Other | Net Investment Income (Loss) | Benefits, Losses and Loss Adjustment Expenses | Amortization of Deferred Policy Acquisition Costs | Insurance Operating Costs and Other Expenses [1] [2] | Net Written Premiums [3] |
| For the year December 31, 2017 | |
| Commercial Lines | $ | 6,902 |
| $ | 949 |
| $ | 4,322 |
| $ | 1,009 |
| $ | 1,381 |
| $ | 6,956 |
|
| Personal Lines | 3,819 |
| 141 |
| 3,000 |
| 309 |
| 649 |
| 3,561 |
|
| Property & Casualty Other Operations | — |
| 106 |
| 18 |
| — |
| 9 |
| — |
|
| Group Benefits | 3,677 |
| 381 |
| 2,803 |
| 33 |
| 924 |
| — |
|
| Mutual Funds | 804 |
| 3 |
| — |
| 21 |
| 617 |
| — |
|
| Corporate | 4 |
| 23 |
| 31 |
| — |
| 1,125 |
| — |
|
| Consolidated | $ | 15,206 |
| $ | 1,603 |
| $ | 10,174 |
| $ | 1,372 |
| $ | 4,705 |
| $ | 10,517 |
|
| For the year December 31, 2016 | |
| Commercial Lines | $ | 6,690 |
| $ | 917 |
| $ | 3,994 |
| $ | 973 |
| $ | 1,244 |
| $ | 6,732 |
|
| Personal Lines | 4,023 |
| 135 |
| 3,175 |
| 348 |
| 669 |
| 3,837 |
|
| Property & Casualty Other Operations | — |
| 127 |
| 278 |
| — |
| 663 |
| (1 | ) |
| Group Benefits | 3,223 |
| 366 |
| 2,514 |
| 31 |
| 776 |
| — |
|
| Mutual Funds | 701 |
| 1 |
| — |
| 24 |
| 557 |
| — |
|
| Corporate | 3 |
| 31 |
| — |
| 1 |
| 413 |
| — |
|
| Consolidated | $ | 14,640 |
| $ | 1,577 |
| $ | 9,961 |
| $ | 1,377 |
| $ | 4,322 |
| $ | 10,568 |
|
| For the year December 31, 2015 | |
| Commercial Lines | $ | 6,551 |
| $ | 910 |
| $ | 3,886 |
| $ | 951 |
| $ | 1,232 |
| $ | 6,625 |
|
| Personal Lines | 3,997 |
| 128 |
| 2,768 |
| 359 |
| 714 |
| 3,918 |
|
| Property & Casualty Other Operations | 32 |
| 133 |
| 243 |
| — |
| 25 |
| 35 |
|
| Group Benefits | 3,136 |
| 371 |
| 2,427 |
| 31 |
| 788 |
| — |
|
| Mutual Funds | 723 |
| 1 |
| — |
| 22 |
| 568 |
| — |
|
| Corporate | 9 |
| 18 |
| — |
| 1 |
| 504 |
| — |
|
| Consolidated | $ | 14,448 |
| $ | 1,561 |
| $ | 9,324 |
| $ | 1,364 |
| $ | 3,831 |
| $ | 10,578 |
|
[1]includes interest expense, loss on extinguishment of debt, restructuring and other costs, and reinsurance loss on disposition
[2] Includes and amortization of intangible assets
[3] 2]Excludes life insurance pursuant to Regulation S-X.
Part IV - Schedule IV. Reinsurance
THE HARTFORD FINANCIAL SERVICES GROUP, INC.
SCHEDULE IV
REINSURANCE
(In millions)
|
| | | | | | | | | | | | | | |
| | Gross Amount | Ceded Amount | Assumed From Other Companies | Net Amount | Percentage of Amount Assumed to Net |
| For the year ended December 31, 2018 | | | | | |
| Life insurance in-force | $ | 722,048 |
| $ | 16,674 |
| $ | 442,817 |
| $ | 1,148,191 |
| 39 | % |
| Insurance revenues | | | | | |
| Property and casualty insurance | $ | 10,824 |
| $ | 599 |
| $ | 221 |
| $ | 10,446 |
| 2 | % |
| Life insurance and annuities | 1,551 |
| 22 |
| 1,082 |
| 2,611 |
| 41 | % |
| Accident and health insurance | 2,064 |
| 39 |
| 962 |
| 2,987 |
| 32 | % |
| Total insurance revenues | $ | 14,439 |
| $ | 660 |
| $ | 2,265 |
| $ | 16,044 |
| 14 | % |
| For the year ended December 31, 2017 | |
| |
| |
| |
| |
|
| Life insurance in-force | $ | 700,860 |
| $ | 9,493 |
| $ | 301,573 |
| $ | 992,940 |
| 30 | % |
| Insurance revenues | | | | | |
| Property and casualty insurance | $ | 10,923 |
| $ | 600 |
| $ | 232 |
| $ | 10,555 |
| 2 | % |
| Life insurance and annuities | 1,526 |
| 14 |
| 232 |
| 1,744 |
| 13 | % |
| Accident and health insurance | 1,755 |
| 36 |
| 214 |
| 1,933 |
| 11 | % |
| Total insurance revenues | $ | 14,204 |
| $ | 650 |
| $ | 678 |
| $ | 14,232 |
| 5 | % |
| For the year ended December 31, 2016 | |
| |
| |
| |
| |
|
| Life insurance in-force | $ | 657,197 |
| $ | 7,919 |
| $ | 22,239 |
| $ | 671,517 |
| 3 | % |
| Insurance revenues | | | | | |
| Property and casualty insurance | $ | 10,871 |
| $ | 583 |
| $ | 261 |
| $ | 10,549 |
| 2 | % |
| Life insurance and annuities | 1,471 |
| 11 |
| 52 |
| 1,512 |
| 3 | % |
| Accident and health insurance | 1,689 |
| 33 |
| 55 |
| 1,711 |
| 3 | % |
| Total insurance revenues | $ | 14,031 |
| $ | 627 |
| $ | 368 |
| $ | 13,772 |
| 3 | % |
|
| | | | | | | | | | | | | | |
| | Gross Amount | Ceded Amount | Assumed From Other Companies | Net Amount | Percentage of Amount Assumed to Net |
| For the year ended December 31, 2017 | | | | | |
| Life insurance in-force | $ | 700,860 |
| $ | 9,493 |
| $ | 301,573 |
| $ | 992,940 |
| 30 | % |
| Insurance revenues | | | | | |
| Property and casualty insurance | $ | 10,923 |
| $ | 600 |
| $ | 232 |
| $ | 10,555 |
| 2 | % |
| Life insurance and annuities | 1,526 |
| 14 |
| 232 |
| 1,744 |
| 13 | % |
| Accident and health insurance | 1,755 |
| 36 |
| 214 |
| 1,933 |
| 11 | % |
| Total insurance revenues | $ | 14,204 |
| $ | 650 |
| $ | 678 |
| $ | 14,232 |
| 5 | % |
| For the year ended December 31, 2016 | |
| |
| |
| |
| |
|
| Life insurance in-force | $ | 657,197 |
| $ | 7,919 |
| $ | 22,239 |
| $ | 671,517 |
| 3 | % |
| Insurance revenues | | | | | |
| Property and casualty insurance | $ | 10,871 |
| $ | 583 |
| $ | 261 |
| $ | 10,549 |
| 2 | % |
| Life insurance and annuities | 1,471 |
| 11 |
| 52 |
| 1,512 |
| 3 | % |
| Accident and health insurance | 1,689 |
| 33 |
| 55 |
| 1,711 |
| 3 | % |
| Total insurance revenues | $ | 14,031 |
| $ | 627 |
| $ | 368 |
| $ | 13,772 |
| 3 | % |
| For the year ended December 31, 2015 | |
| |
| |
| |
| |
|
| Life insurance in-force | $ | 619,490 |
| $ | 4,648 |
| $ | 21,406 |
| $ | 636,248 |
| 3 | % |
| Insurance revenues | | | | | |
| Property and casualty insurance | $ | 10,704 |
| $ | 586 |
| $ | 298 |
| $ | 10,416 |
| 3 | % |
| Life insurance and annuities | 1,439 |
| 10 |
| 49 |
| 1,478 |
| 3 | % |
| Accident and health insurance | 1,668 |
| 58 |
| 48 |
| 1,658 |
| 3 | % |
| Total insurance revenues | $ | 13,811 |
| $ | 654 |
| $ | 395 |
| $ | 13,552 |
| 3 | % |
Part IV - Schedule V. Valuation and Qualifying Accounts
THE HARTFORD FINANCIAL SERVICES GROUP, INC.
SCHEDULE V
VALUATION AND QUALIFYING ACCOUNTS
(In millions)
|
| | | | | | | | | | | | |
| | Balance January 1, | Increase (decrease) in Costs and Expenses | Write-offs/ Payments/ Other | Balance December 31, |
| 2018 | | | | |
| Allowance for doubtful accounts and other | $ | 132 |
| $ | 40 |
| $ | (37 | ) | $ | 135 |
|
| Allowance for uncollectible reinsurance | 104 |
| 3 |
| 19 |
| 126 |
|
| Valuation allowance on mortgage loans | 1 |
| — |
| — |
| 1 |
|
| Valuation allowance for deferred taxes | — |
| — |
| — |
| — |
|
| 2017 | | | | |
| Allowance for doubtful accounts and other | 137 |
| 42 |
| (47 | ) | 132 |
|
| Allowance for uncollectible reinsurance | 165 |
| 4 |
| (65 | ) | 104 |
|
| Valuation allowance on mortgage loans | — |
| 1 |
| — |
| 1 |
|
| Valuation allowance for deferred taxes | — |
| — |
| — |
| — |
|
| 2016 | | | | |
| Allowance for doubtful accounts and other | $ | 134 |
| $ | 39 |
| $ | (36 | ) | $ | 137 |
|
| Allowance for uncollectible reinsurance | 266 |
| 3 |
| (104 | ) | 165 |
|
| Valuation allowance on mortgage loans | 4 |
| — |
| (4 | ) | — |
|
| Valuation allowance for deferred taxes | 79 |
| (79 | ) | — |
| — |
|
|
| | | | | | | | | | | | |
| | Balance January 1, | Increase (decrease) in Costs and Expenses | Write-offs/ Payments/ Other | Balance December 31, |
| 2017 | | | | |
| Allowance for doubtful accounts and other | $ | 137 |
| $ | 42 |
| $ | (47 | ) | $ | 132 |
|
| Allowance for uncollectible reinsurance | 165 |
| 4 |
| (65 | ) | 104 |
|
| Valuation allowance on mortgage loans | — |
| 1 |
| — |
| 1 |
|
| Valuation allowance for deferred taxes | — |
| — |
| — |
| — |
|
| 2016 | | | | |
| Allowance for doubtful accounts and other | $ | 134 |
| $ | 39 |
| $ | (36 | ) | $ | 137 |
|
| Allowance for uncollectible reinsurance | 266 |
| 3 |
| (104 | ) | 165 |
|
| Valuation allowance on mortgage loans | 4 |
| — |
| (4 | ) | — |
|
| Valuation allowance for deferred taxes | 79 |
| (79 | ) | — |
| — |
|
| 2015 | | | | |
| Allowance for doubtful accounts and other | $ | 131 |
| $ | 44 |
| $ | (41 | ) | $ | 134 |
|
| Allowance for uncollectible reinsurance | 271 |
| 12 |
| (17 | ) | 266 |
|
| Valuation allowance on mortgage loans | 3 |
| 3 |
| (2 | ) | 4 |
|
| Valuation allowance for deferred taxes | 181 |
| (102 | ) | — |
| 79 |
|
Part IV - Schedule VI. Supplementary Information Concerning Property and Casualty Insurance Operations
THE HARTFORD FINANCIAL SERVICES GROUP, INC.
SCHEDULE VI
SUPPLEMENTAL INFORMATION CONCERNING
PROPERTY AND CASUALTY INSURANCE OPERATIONS
(In millions)
|
| | | | | | | | | | | | |
| | Discount Deducted From Liabilities [1] | Losses and Loss Adjustment Expenses Incurred Related to: | Paid Losses and Loss Adjustment Expenses |
| | Current Year | Prior Year |
| Years ended December 31, | | | | |
| 2018 | $ | 388 |
| $ | 7,107 |
| $ | (167 | ) | $ | 6,406 |
|
| 2017 | $ | 410 |
| $ | 7,381 |
| $ | (41 | ) | $ | 6,579 |
|
| 2016 | $ | 483 |
| $ | 6,990 |
| $ | 457 |
| $ | 6,968 |
|
|
| | | | | | | | | | | | |
| | Discount Deducted From Liabilities [1] | Losses and Loss Adjustment Expenses Incurred Related to: | Paid Losses and Loss Adjustment Expenses |
| | Current Year | Prior Year |
| Years ended December 31, | | | | |
| 2017 | $ | 410 |
| $ | 7,381 |
| $ | (41 | ) | $ | 6,579 |
|
| 2016 | $ | 483 |
| $ | 6,990 |
| $ | 457 |
| $ | 6,968 |
|
| 2015 | $ | 523 |
| $ | 6,647 |
| $ | 250 |
| $ | 6,719 |
|
| |
| [1] | Reserves for permanently disabled claimants have been discounted using the weighted average interest rates of 3.06%2.98%, 3.11%3.06%, and 3.24%3.11% for the years ended December 31, 20172018, 20162017, and 20152016, respectively. |
THE HARTFORD FINANCIAL SERVICES GROUP, INC.
FOR THE FISCAL YEAR ENDED DECEMBER 31, 20172018
FORM 10-K
EXHIBITS INDEX
The exhibits attached to this Form 10-K are those that are required by Item 601 of Regulation S-K.
| | | | | Incorporated by Reference | | Incorporated by Reference |
| Exhibit No. | Description | Form | File No. | Exhibit No. | Filing Date | Description | Form | File No. | Exhibit No. | Filing Date |
| 2.01 | | 10-Q | 001-13958 | 2.01 | 11/01/2012 | | 10-Q | 001-13958 | 2.01 | 11/01/2012 |
| 2.02 | | 8-K | 001-13958 | 2.01 | 12/04/2017 | | 10-Q | 001-13958 | 2.02 | 11/01/2012 |
| 2.03 | | 10-Q | 001-13958 | 2.02 | 11/01/2012 | | 8-K | 001-13958 | 2.01 | 12/04/2017 |
| 2.04 | | 10-Q | 001-13958 | 2.01 | 07/27/2017 | | 8-K | 001-13958 | 2.01 | 10/23/2017 |
| 2.05 | | 8-K | 001-13958 | 2.01 | 10/23/2017 | | 10-Q | 001-13958 | 2.01 | 07/27/2017 |
| 2.06 | | 8-K | 001-13958 | 2.01 | 04/28/2014 | | 8-K/A | 001-13958 | 2.1 | 08/22/2018 |
| 3.01 | | 8-K | 001-13958 | 3.01 | 10/20/2014 | | 8-K | 001-13958 | 3.01 | 10/20/2014 |
| 3.02 | | 8-K | 001-13958 | 3.01 | 7/21/2016 | | 8-K | 001-13958
| 3.01 | 07/21/2016 |
| 3.03 | | | 8-K | 001-13958 | 3.1 | 11/05/2018
|
| 4.01 | | 8-K | 001-13958 | 4.01 | 03/12/2004 | | 8-K | 001-13958 | 4.01 | 03/12/2004 |
| 4.02 | | 8-K | 001-13958 | 4.01 | 02/16/2007 | | 8-K | 001-13958 | 4.01 | 02/16/2007 |
| 4.03 | | S-3ASR | 333-142044 | 4.03 | 04/11/2007 | | S-3ASR | 333-142044 | 4.03 | 04/11/2007 |
| 4.04 | | 8-K | 001-13958 | 4.01 | 06/06/2008 | | 8-K | 001-13958 | 4.01 | 06/06/2008 |
| 4.05 | | 8-K | 001-13958 | 4.02 | 06/06/2008 | | 8-K | 001-13958 | 4.02 | 06/06/2008 |
| 4.06 | | 8-K/A | 001-13958 | 4.03 | 04/06/2012 | | 8-K/A | 001-13958 | 4.03 | 04/06/2012 |
| 4.07 | | | S-3ASR | 333-190506 | 4.07 | 08/09/2013 |
| 4.08 | | | 8-K | 001-13958 | 4.01 | 02/15/2017 |
| 4.09 | | | 8-K | 001-13958 | 4.01 | 06/26/2009 |
| 4.10 | | | 8-K | 001-13958 | 3.1 | 11/05/2018 |
| | | | | Incorporated by Reference | | Incorporated by Reference |
| Exhibit No. | Description | Form | File No. | Exhibit No. | Filing Date | Description | Form | File No. | Exhibit No. | Filing Date |
| 4.07 | | S-3ASR | 333-190506 | 4.07 | 08/09/2013 | |
| 4.08 | | 8-K | 001-13958 | 4.04 | 06/06/2008 | |
| 4.09 | | 8-K | 001-13958 | 4.02 | 02/08/2017 | |
| 4.10 | | 8-K | 001-13958 | 4.01 | 02/15/2017 | |
| 4.11 | | 8-K | 001-13958 | 4.01 | 06/26/2009 | | 8-K | 001-13958 | 4.2 | 11/06/2018
|
| 4.12 | | | 8-K | 001-13958 | 4.3 | 11/06/2018 |
| 4.13 | | | 8-K | 001-13958 | 4.3 | 03/15/2018 |
| 10.01 | Aggregate Excess of Loss Reinsurance Agreement by and between Hartford Fire Insurance Company, First State Insurance Company, New England Insurance Company, New England Reinsurance Corporation, Hartford Accident and Indemnity Company, Hartford Casualty Insurance Company, Hartford Fire Insurance Company, Hartford Insurance Company of Illinois, Hartford Insurance Company of the Midwest, Hartford Insurance Company of the Southeast, Hartford Lloyd’s Insurance Company, Hartford Underwriters Insurance Company, Nutmeg Insurance Company, Pacific Insurance Company, Limited, Property and Casualty Insurance Company of Hartford, Sentinel Insurance Company, Ltd., Trumbull Insurance Company, Twin City Fire Insurance Company (collectively, the "Reinsured") and National Indemnity Company (the "Reinsurer") dated as of December 30, 2016. ^ | 10-K | 001-13958 | 10.01 | 02/24/2017 | | 8-K | 001-13958 | 10.01 | 12/29/2014 |
| 10.02 | Five-Year Revolving Credit Facility Agreement dated October 31, 2014, among The Hartford Financial Services Group, Inc., Bank of America, N.A., as administrative agent, JPMorgan Chase Bank, N.A. Citibank, N.A., U.S. Bank National Association and Wells Fargo, National Association as syndication agents, and the lenders referred to therein. | 8-K | 001-13958 | 10.01 | 11/03/2014 | Aggregate Excess of Loss Reinsurance Agreement by and between Hartford Fire Insurance Company, First State Insurance Company, New England Insurance Company, New England Reinsurance Corporation, Hartford Accident and Indemnity Company, Hartford Casualty Insurance Company, Hartford Fire Insurance Company, Hartford Insurance Company of Illinois, Hartford Insurance Company of the Midwest, Hartford Insurance Company of the Southeast, Hartford Lloyd’s Insurance Company, Hartford Underwriters Insurance Company, Nutmeg Insurance Company, Pacific Insurance Company, Limited, Property and Casualty Insurance Company of Hartford, Sentinel Insurance Company, Ltd., Trumbull Insurance Company, Twin City Fire Insurance Company (collectively, the "Reinsured") and National Indemnity Company (the "Reinsurer") dated as of December 30, 2016. †† | 10-K | 001-13958 | 10.01 | 02/24/2017 |
| 10.03 |
| 8-K | 001-13958 | 10.01 | 12/29/2014 | | 8-K | 001-13958 | 10.01 | 03/30/2018 |
| *10.04 |
| 10-K | 001-13958 | 10.04 | 02/27/2015 | |
| 10.04 | | | 8-K | 001-13958 | 10.02 | 03/30/2018 |
| *10.05 | | 10-K | 001-13958 | 10.05 | 02/27/2015 | | 10-Q | 001-13958
| 10.07 | 07/30/2014 |
| *10.06 |
| 10-K | 001-13958 | 10.06 | 02/27/2015 | | 10-K | 001-13958 | 10.04 | 02/27/2015 |
| *10.07 | | 10-K | 001-13958 | 10.05 | 02/28/2014 | | 10-K | 001-13958 | 10.05 | 02/27/2015 |
| *10.08 | | S-8 | 333-197671 | 4.03 | 07/28/2014 | | 10-K | 001-13958 | 10.06 | 02/27/2015 |
| *10.09 | | 10-Q | 001-13958 | 10.03 | 07/30/2014 | | 10-K | 001-13958 | 10.05 | 02/28/2014 |
| *10.10 | | 10-Q | 001-13958 | 10.01 | 04/28/2016 | | S-8 | 333-197671 | 4.03 | 07/28/2014 |
| *10.11 | | | 10-Q | 001-13958 | 10.03 | 07/30/2014 |
| *10.12 | | | 10-Q | 001-13958 | 10.01 | 07/27/2015 |
| *10.13 | | | 10-K | 001-13958 | 10.10 | 02/25/2011 |
| *10.14 | | | 10-Q | 001-13958 | 10.04 | 08/04/2010 |
| *10.15 | | | 10-K | 001-13958 | 10.10 | 02/23/2010 |
| *10.16. | | | 8-K | 001-13958 | 10.02 | 05/24/2005 |
| *10.17 | | | 10-K | 001-13958 | 10.06 | 02/12/2009 |
| *10.18 | | | 10-K | 001-13958 | 10.12 | 02/24/2006 |
| *10.19 | | | 10-K | 001-13958 | 10.18 | 03/01/2013 |
|
| | | | | |
| | | Incorporated by Reference |
| Exhibit No. | Description | Form | File No. | Exhibit No. | Filing Date |
*10.11 | | 10-Q | 001-13958 | 10.01 | 03/31/2017 |
*10.12 | | 10-Q | 001-13958 | 10.01 | 07/27/2015 |
*10.13 | | 10-Q | 001-13958 | 10.07 | 07/30/2014 |
*10.14 | | 10-K | 001-13958 | 10.10 | 02/25/2011 |
*10.15 | | 10-Q | 001-13958 | 10.04 | 08/04/2010 |
*10.16 | | 10-K | 001-13958 | 10.10 | 02/23/2010 |
*10.17 | | 8-K | 001-13958 | 10.02 | 05/24/2005 |
*10.18 |
| 10-K | 001-13958 | 10.06 | 02/12/2009 |
*10.19 | | 10-K | 001-13958 | 10.12 | 02/24/2006 |
*10.20 | | 10-K | 001-13958 | 10.18 | 03/01/2013 |
*10.21 | | 10-K | 001-13958 | 10.19 | 03/01/2013 |
*10.2210.21 | | 10-Q | 001-13958 | 10.01 | 07/29/2013 |
12.01*10.22 | | 10-Q | 001-13958 | 10.02 | 04/26/2018 |
| *10.23 | | 8-K | 001-13958 | 10.01 | 02/21/2019 |
| 21.01 | | | | | |
| 23.01 | | | | | |
| 24.01 | | | | | |
| 31.01 | | | | | |
|
| | | | | |
| | Incorporated by Reference |
Exhibit No. | Description | Form | File No. | Exhibit No. | Filing Date |
| 31.02 | | | | | |
| 32.01 | | | | | |
| 32.02 | | | | | |
| 101.INS | XBRL Instance Document.Document - the instance document does not appear in the Interactive Data File because its XBRL tags are embedded within the Inline XBRL document. | | | | |
| 101.SCH | XBRL Taxonomy Extension Schema. | | | | |
| 101.CAL | XBRL Taxonomy Extension Calculation Linkbase. | | | | |
| 101.DEF | XBRL Taxonomy Extension Definition Linkbase. | | | | |
| 101.LAB | XBRL Taxonomy Extension Label Linkbase. | | | | |
| 101.PRE | XBRL Taxonomy Extension Presentation Linkbase. | | | | |
|
| | | | | |
| | Incorporated by Reference |
Exhibit No. | Description | Form | File No. | Exhibit No. | Filing Date |
|
| | |
| * | | Management contract, compensatory plan or arrangement. |
| | | |
| ** | | Filed with the Securities and Exchange Commission as an exhibit to this report. |
^†
| | Certain portions of this exhibit have been omitted pursuant to a request for confidential treatment and have been filed separately with the Securities and Exchange Commission.Commission Order Granting Confidential Treatment Under the Securities Exchange Act of 1934, dated August 7, 2017 |
††
| | Certain portions of this exhibit have been omitted pursuant to the Securities and Exchange Commission Order Granting Confidential Treatment Under the Securities Exchange Act of 1934, dated March 17, 2017 |
| | | |
SIGNATURES
Pursuant to the requirements of Section 13 or 15(d) of the Securities Exchange Act of 1934, the registrant has duly caused this report to be signed on its behalf by the undersigned, thereunto duly authorized.
|
| | | | |
| | THE HARTFORD FINANCIAL SERVICES GROUP, INC. | |
| | By: | /s/ Scott R. Lewis | |
| | | Scott R. Lewis | |
| | | Senior Vice President and Controller | |
| | | (Chief accounting officer and duly
authorized signatory) | |
Date: February 23, 201822, 2019
Pursuant to the requirements of the Securities Exchange Act of 1934, this report has been signed below by the following persons on behalf of the registrant and in the capacities and on the dates indicated. |
| | | | | | |
| | | Signature | | Title | | Date |
| | | | | | | |
| | | /s/ Christopher J. Swift | | Chairman, Chief Executive Officer and Director | | February 23, 201822, 2019 |
| | | | | | |
| | | Christopher J. Swift | | (Principal Executive Officer) | | |
| | | | | | | |
| | | /s/ Beth A. BombaraCostello | | Executive Vice President and Chief Financial Officer | | February 23, 201822, 2019 |
| | | | | | |
| | | Beth A. BombaraCostello | | (Principal Financial Officer) | | |
| | | | | | | |
| | | /s/ Scott R. Lewis | | Senior Vice President and Controller | February 23, 201822, 2019 |
| | | | | | |
| | | Scott R. Lewis | | (Principal Accounting Officer) | | |
| | | | | | | |
| | | * | | Director | | February 23, 201822, 2019 |
| | | | | | |
| | | Robert B. Allardice III | | | | |
| �� | | | | | |
| | * | | Director | | February 22, 2019 |
| | | | | | |
| | Carols Dominguez | | | | |
| | | | | | | |
| | | * | | Director | | February 23, 201822, 2019 |
| | | | | | |
| | | Trevor Fetter | | | | |
| | | | | | | |
| | | * | | Director | | February 23, 2018 |
| | | | | 22, 2019 |
| | | Stephen P. McGill | | | | |
| | | | | | | |
| | | * | | Director | | February 23, 201822, 2019 |
| | | | | |
| | | Kathryn A. Mikells | | | | |
| | | | | | | |
| | | * | | Director | | February 23, 201822, 2019 |
| | | | | | |
| | | Michael G. Morris | | | | |
| | | | | | | |
| | | * | | Director | | February 23, 201822, 2019 |
| | | | | | |
| | | Thomas A. Renyi | | | | |
| | | | | | | |
| | | * | | Director | | February 23, 201822, 2019 |
| | | | | | |
| | | Julie G. Richardson | | | | |
| | | | | | | |
| | | * | | Director | | February 23, 201822, 2019 |
| | | | | | | |
| | | Teresa W. Roseborough | | | | |
| | | | | | | |
| | | * | | Director | | February 23, 201822, 2019 |
| | | | | | | |
| | | Virginia P. Ruesterholz | | | | |
| | | | | | | |
| | | * | | Director | | February 23, 201822, 2019 |
| | | | | | | |
| | | Charles B. StraussGreg Woodring | | | | |
| | | | | | | |
| | * | | Director | | February 23, 2018 |
| | | | | | |
| | H. Patrick Swygert | | | | |
| | | | | | |
| | * | | Director | | February 23, 2018 |
| | Greig Woodring | | | | |
| | | | | | | |
| *By: | | /s/ David C. Robinson | | | | |
| | | | | | |
| | | David C. Robinson | | | | |
| | | As Attorney-in-Fact | | | | |